Global Logistics New Directions in Supply Chain Management ...
465
FIFTH EDITION GLOBAL LOGISTICS Edited by Donald Waters New Directions in Supply Chain Management
-
Upload
khangminh22 -
Category
Documents
-
view
1 -
download
0
Transcript of Global Logistics New Directions in Supply Chain Management ...

FIFTH EDITION
GLOBALLOGISTICS
Edited by Donald Waters
New Directions in Supply Chain Management

i i
GLOBALLOGISTICS

ii
This page intentionally left blank

iii
FIFTH EDITION
GLOBALLOGISTICS
Edited by Donald Waters
New Directions in Supply Chain Management
London and Philadelphia

Publisher’s note
Every possible effort has been made to ensure that the information contained in this book is accurateat the time of going to press, and the publishers and authors cannot accept responsibility for any errorsor omissions, however caused. No responsibility for loss or damage occasioned to any person acting,or refraining from action, as a result of the material in this publication can be accepted by the editor,the publisher or the author.
First published in 1988Revised edition 1990Second edition 1994Paperback edition 1995Third edition 1999Fourth edition 2003Fifth edition 2007
First published in Great Britain in 2007 by Kogan Page Limited
Apart from any fair dealing for the purposes of research or private study, or criticism or review, aspermitted under the Copyright, Designs and Patents Act 1988, this publication may only be repro-duced, stored or transmitted, in any form or by any means, with the prior permission in writing of thepublishers, or in the case of reprographic reproduction in accordance with the terms and licencesissued by the CLA. Enquiries concerning reproduction outside these terms should be sent to thepublishers at the undermentioned addresses:
120 Pentonville Road 525 South 4th street #241London N1 9JN Philadelphia PA 19147United Kingdom USAwww.kogan-page.co.uk
© James Cooper, 1988, 1990, 1994© Donald Waters, 1999, 2003, 2007
The right of Donald Waters to be identified as the author of this work has been asserted by him inaccordance with the Copyright, Designs and Patents Act 1988.
ISBN-10 0 7494 4813 XISBN-13 978 0 7494 4813 4
British Library Cataloguing-in-Publication Data
A CIP record for this book is available from the British Library.
Library of Congress Cataloging-in-Publication Data
Global logistics : new directions in supply chain management / [edited by] Donald Waters. -- 5th ed.p. cm.
Title of 4th ed.: Global logistics and distribution planning.Includes bibliographical references and index.ISBN 0-7494-4813-X
1. Physical distribution of goods. 2. Business logistics--Management. I. Waters, C. D. J. (C. Donald J.), 1949-
HF5415.6.G55 2006658.7--dc22
2006017281
Typeset by Saxon Graphics Ltd, DerbyPrinted and bound inGreat Britain by MPG Books Ltd, Bodmin, Cornwall
iv

Contents
List of figures xiList of tables xvNotes on contributors xviiPreface xxvii
1 Trends in the supply chain 1Donald WatersDefinitions 1; Development of logistics 3; Logistics strategy 7;Improved communications and e-business 9; Globalization 10;Satisfying more-demanding customers 12; Responding to changesin the business environment 16; Conclusions 17; References 18
2 New directions in logistics 21Martin ChristopherThe emergence of the value-conscious customer 21; Logistics andsupply chain management 23; Procurement 24; Manufacturing 25;Distribution 26; The new competitive framework: the four Rs 27;The organizational challenge 30; Summary 32; References 32
3 Formulating logistics strategy 33Nathalie Fabbe-Costes and Jacques ColinWhy formulate logistics strategies? 33; A conceptual approach toformulating logistics strategy 36; Illustrated typology of possiblelogistics strategies 41; Strategic action itineraries in logistics 48;Summary 53; References 53
v

4 Agile supply chain operating environments – avoidingimplementation pitfalls 55Remko van HoekSummary 55; Introduction 55; Operating circumstances requiringagility 57; The categorization for operating environments 61;Mitigating the minefield of pitfalls 62; Conclusion and reflections 69;References 71
5 Time compression in the supply chain 72Adrian BeesleyTime compression 72; Time compression and competition 73; Whatis time compression? 75; The time compression approach –competitive advantage 77; The time compression approach – costadvantage 79; The time compression approach – quality advantage 80;The time compression approach – technology advantage 82; Thetime compression approach – customer focus 82; Benefits of timecompression 84; Examples of the application of time compression 85;Time compression of a global supply chain 86; Conclusion 88;References 89
6 Strategic supply chain management: the power of incentives 91Glyn Watson, Chris Lonsdale, Andrew Cox and Joe SandersonIncentivization and the process of exchange 92; Incentivization andthe outsourcing dilemma 97; Incentivization and suppliermanagement 100; Conclusion 106; References 106
7 The development of supply chain relationships: a multi-lensapproach 107Peter Hines and Donna SamuelIntroduction 107; A review of the existing literature 108;Methodology 113; Instrumental case: the Perfect Pineapple SupplyChain Programme 113; Explanation and discussion 118; Conclusion 123;References 125
8 Demand flow leadership and the evolution of management concepts 129Dag EricssonVisions and tools 130; The evolution of management concepts 130;The evolution of a new business model 137; A conceptual model forthe implementation of the DCM concept 141; Case in demand flowleadership – the Electrolux Way 142; Conclusion 146; References 146
vi � Contents

9 Using services marketing strategies for logistics customer service 147David GrantIntroduction 147; Logistics customer service today 150; Elements oflogistics customer service 153; Strategies for logistics customerservice 154; Summary 158; References 159
10 Supply chain management: the challenge of systems 161Philip ScharyThe setting 161; Networks 165; Complex adaptive systems 168;Conclusion 174; References 174
11 Information systems and information technologies for supplychain management 177Xinping Shi and Simon ChanIntroduction 177; Functionality of IS/IT in SCM 178; Strategic issuesof IS/IT in SCM 182; IS/IT adoption for SCM 184; IS/IT utilization inSCM 192; Summary 194; References 194
12 Outsourcing: the result of global supply chains? 197Stephen RinslerBackground 197; Definition 197; Reasons for outsourcing 198;How different is the public sector from the private sector withregard to outsourcing? 201; The pitfalls in outsourcing 202; Globalsupply chains and the outsourcing risks 205; Summary 209
13 Risk in the supply chain 210Lars StemmlerIntroduction 210; Risk management and the supply chain – a newperception! 210; Objective and process of risk management 213;From an enterprise perspective to the supply chain perspective 214;Risk assessment and control along the supply chain 216;Implementation in practice 219; Conclusions 221; References 222
14 Supply chain vulnerability, risk and resilience 223Helen PeckIntroduction 223; Supply chain vulnerability: an idea whose timehad come 224; Supply chain risk management: a recipe forconfusion 226; Risk: the great divide 228; Supply chain resilience:a holistic view 230; Supply chains and wicked problems 235;References 236
Contents � vii

15 Delivering sustainability through supply chain management 238Kirstie McIntyreBackground 238; Purchasing or procurement 240; Production ormanufacturing 243; Distribution and warehousing 244; Use andmaintenance 246; Dispose or reuse and recycle? 247; Managerialand financial sustainability 248; Conclusion 250; References 251
16 Performance measurement and management in the supply chain 253Alan BraithwaiteIntroduction 253; Keeping score – a basic management principle 254;The balanced scorecard – the standard for goal setting andmeasurement 255; Fundamental concepts of supply chainmanagement and measurement 257; Mastering the complexity ofsupply chain and logistics performance management 259; Theprinciple of input and output measures 260; Setting goals across thechain through service level agreements 261; The delivery, recoveryand stewardship model 263; Defining specific metrics across thechain 265; Future directions in performance measurement 268;Conclusion 271; References 272
17 Road transport optimization 273Alan McKinnonAssessing the utilization of vehicle fleets 273; Factors constrainingvehicle utilization 276; Measures to improve vehicle utilization 280;Conclusion 287; References 288
18 Retail logistics 290John FernieThe evolution of the logistics concept 290; Logistics and competitivestrategy in retailing 294; Differences in logistics ‘culture’ ininternational markets 304; The internationalization of logisticspractices 307; The future 309; References 311
19 Internet traders can increase profitability by reshaping theirsupply chains 315Robert DuncanInternet trading is forecast to account for a quarter of all purchasesin 2006 315; Customer satisfaction is less than satisfactory 316;Integration of business processes has not always received enoughattention 317; Moving away from traditional supply chains addscomplexity but provides an opportunity for profit 317; How caninternet traders take advantage of opportunities? 323; Opportunitywaiting to be exploited 328; References 329
viii � Contents

20 Global sourcing and supply 330Alan BraithwaiteBackground 330; Growth in global trade 331; References 342
21 The changing supply of logistics services – a UK perspective 343Colin BamfordUK market trends 344; Market structure – continuing consolidationand globalization 346; The EU25 – new market opportunities andthreats 350; Transport policy issues 351; Conclusions 352;References 352
22 Developments in Western European logistics strategies 353Michael Browne, Julian Allen and Allan WoodburnIntroduction 353; Changes in the demand for logistics services 354;Market structure of logistics service providers 358; Transportation inEurope 361; Policy measures affecting logistics and transport inEurope 363; Opportunities and pressures for logistics providers in anew Europe 368; Concluding remarks 370; References 371
23 Logistics strategies for Central and Eastern Europe 374Grzegorz AugustyniakIntroduction 374; Conditions of economic development of CEEcountries before 1990 376; Development of logistics in the period oftransition and after joining the EU 379; Logistics strategies in CEEcountries 387; Conclusions 389; References 390
24 Logistics in China 391James WangIntroduction 391; Major areas of improvement 393; Challenges todeveloping modern logistics 397; Concluding remarks 402;References 402
25 Logistics in North America 403Garland Chow and Trevor HeaverIntroduction 403; Special features of North America for logistics 404; Trends, opportunities and challenges for logistics inNorth America 409; Supply chain integration through collaboration,strategic alliances and partnerships 414; Evolving supply chain process design – from push to pull 418; Growing challenges tothe logistics system 422; Concluding comments 424; References 425
Index 429
Contents � ix

x
This page intentionally left blank

Figures
1.1 Estimates of the value of global electronic trade 101.2 Value of global trade 122.1 The competitive options 222.2 Critical linkages in the supply chain 242.3 The vertical/functional organization 302.4 The horizontal/process organization 313.1 Corporate responses to environmental pressures including
logistics dimensions 343.2 Evolution of the field of action of logistics 353.3 From logistics Strategy to strategic Logistics 373.4 Interrelationship between the three dimensions of competence 383.5 Possible spin-offs from a strategic move 493.6 Possible combinations of articulated strategic moves 503.7 Rebounding with new strategic moves 514.1 Theoretical framework for creating the agile supply chain 564.2 Leanness and agility under demand and supply conditions 574.3 Demand contingencies impacting the viability of an agile supply
chain 594.4 Supply contingencies impacting the feasibility of an agile supply
chain 614.5 Categorization of operating environments 624.6 The minefield of creating the agile supply chain 634.7 Enhanced agile supply chain theoretical framework 705.1 Complexity factors relative change 745.2 Time-based process mapping – value-add analysis 805.3 Time-based process map of an entire supply chain 815.4 Generic supply strategies 83
xi

6.1 The allocation of value in an exchange 936.2 The generation of value-add in an exchange 947.1 The key transition from open-market negotiations to collaboration 1097.2 The power matrix 1127.3 The Perfect Pineapple Supply Chain membership 1147.4 The seven-step Perfect Pineapple Supply Chain Programme 1157.5 The Perfect Pineapple Supply Chain plan 1177.6 An explanatory model of the Perfect Pineapple Supply Chain
Programme 1187.7 Power regimes within the Perfect Pineapple Supply Chain 1217.8 Involvement and influences in the Perfect Pineapple Supply
Chain Programme 1238.1 The development of four major management concepts over
time 1318.2 The MA concept with coordination of internal and external
flows and processes 1348.3 The development of the MA concept 1358.4 The business model of the future 1389.1 Marketing and logistics customer service costs trade-off model 1489.2 Pitfalls in logistics customer service 1529.3 Elements of logistics customer service quality 1539.4 Elements of logistics customer service and relationships 1549.5 Customer service strategy process 1559.6 Service quality or 'gaps' model 15811.1 Strategic framework of IS/IT adoption in the SCM context 18912.1 Risk analysis 20813.1 Risk management in the supply chain - a new perception 21213.2 The process of risk management 21313.3 Supply chain integration to be supported by risk management 21513.4 Risk categories' identification into supply chain-specific risks 21613.5 Supply chain risk assessment 21713.6 Risk controlling between avoidance and acceptance 21813.7 Random walks with 'at-risk' models 22114.1 A supply chain as an interactive system 23115.1 Common supply chain functions 24016.1 Kaplan and Norton's balanced scorecard framework 25616.2 Balancing the supply chain 25816.3 The complexity of supply chain and logistics, viewed through
determinants 25916.4 Input and output measures in a performance improvement
case 26116.5 The conventional sequential supply chain relationship and
the SLA matrix 26216.6 The delivery, recovery and stewardship model 264
xii � Figures

16.7 Viewing supply chain metrics across the chain 26516.8 Sample level 1 and 2 metrics containing both input and output
measures 26716.9 A sample logistical balanced scorecard 26816.10 The strategic supply chain crystal 26916.11 The supply chain risk honeycomb 27017.1 Increase in truck productivity in the UK 1953-2003 27417.2 Variations in daily demand for trucks from a major steel
distributor 27617.3 Fivefold classification of the constraints on vehicle utilization 27918.1 The extended value chain 29418.2 The structure of the Japanese fashion industry 29818.3 ECR improvement concepts 30018.4 Changing relationships between manufacturers and their
suppliers 30118.5 ECR concepts 30218.6 Transformation of the interface between manufacturer and
retailer 30319.1 A typical pharmaceutical manufacturer's distribution network 31919.2 A possible pharmaceutical manufacturer's distribution network 32119.3 A traditional industrial supplier's distribution network 32219.4 A route to success 32420.1 Growth in global trade in manufactures 33120.2 Correlation of import and export growth showing the country
scale of activity 33220.3 Global trade growth by product category 33320.4 The layers and pillars of global sourcing best practice 33420.5 Maturity development of global sourcing 34122.1 Logistics costs as a proportion of sales 35622.2 Growth in freight transport in Western Europe (EU15)
(billion tonne-kilometres) 36122.3 Strategy options for providers of logistics services 37024.1 China's logistics industry - composition of total fixed asset
investment in 2004 394
Development and trends � xiii

xiv
This page intentionally left blank
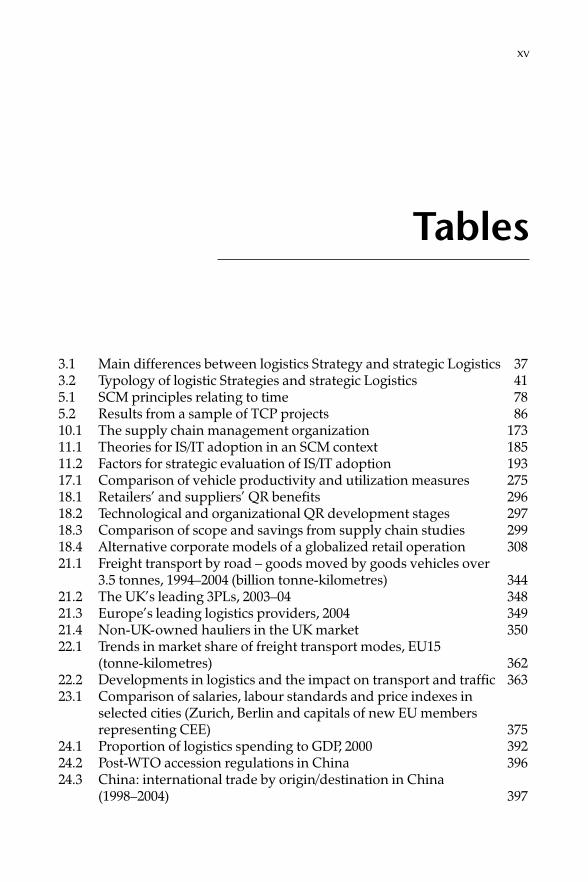
Tables
3.1 Main differences between logistics Strategy and strategic Logistics 373.2 Typology of logistic Strategies and strategic Logistics 415.1 SCM principles relating to time 785.2 Results from a sample of TCP projects 8610.1 The supply chain management organization 17311.1 Theories for IS/IT adoption in an SCM context 18511.2 Factors for strategic evaluation of IS/IT adoption 19317.1 Comparison of vehicle productivity and utilization measures 27518.1 Retailers’ and suppliers’ QR benefits 29618.2 Technological and organizational QR development stages 29718.3 Comparison of scope and savings from supply chain studies 29918.4 Alternative corporate models of a globalized retail operation 30821.1 Freight transport by road – goods moved by goods vehicles over
3.5 tonnes, 1994–2004 (billion tonne-kilometres) 34421.2 The UK’s leading 3PLs, 2003–04 34821.3 Europe’s leading logistics providers, 2004 34921.4 Non-UK-owned hauliers in the UK market 35022.1 Trends in market share of freight transport modes, EU15
(tonne-kilometres) 36222.2 Developments in logistics and the impact on transport and traffic 36323.1 Comparison of salaries, labour standards and price indexes in
selected cities (Zurich, Berlin and capitals of new EU membersrepresenting CEE) 375
24.1 Proportion of logistics spending to GDP, 2000 39224.2 Post-WTO accession regulations in China 39624.3 China: international trade by origin/destination in China
(1998–2004) 397
xv

25.1 Estimated logistics costs as a percentage of GDP, 1997 and 2002,by region 404
25.2 The scale of North America 40525.3 US trade in goods for selected countries, 1994 and 2004 40825.4 US business logistics costs in 2004 40925.5 Revenues and profitability by segment, 2005 412
xvi � Tables

Contributors
Julian Allen is a research fellow at the Transport Studies Group, University ofWestminster, where his major research interests are urban freight transportand logistics, and the impact of manufacturing and retailing techniques onlogistics and transportation systems. He lectures and conducts research onfreight transport and logistics and has published a number of papers, reportsand chapters in books.
Grzegorz Augustyniak has an MA from the Warsaw School of Economics(SGH), where he is currently an assistant professor in the Department ofManagement Theory. He is coordinator of a student exchange programmewithin the Community of European Management Schools, and is deputydirector of the Polish–Japanese Management Centre.
Until 1998 he was a faculty member of the Department of Logistics at SGHand held visiting positions at Carleton University, the University of Calgary,the University of Minnesota and the University of British Columbia. He hasbeen a consultant to many companies in manufacturing and distribution, andis currently working on improving productivity and quality in Poland.
Colin Bamford is professor of transport and logistics at the University ofHuddersfield. His interest in transport issues originated in the early 1970swhen he was one of Ken Gwilliam’s researchers at the University of Leeds. AtHuddersfield he has been responsible for the development of a pioneeringsuite of undergraduate courses in transport and logistics management. Morerecently he has been involved in setting up a new distance-learning trainingprogramme for logistics managers in Hungary. He has written many articlesand supervised research on a variety of supply chain management topics andpublished textbooks in the field of transport economics.
xvii

Adrian Beesley is the head of product development for DHL Exel Supply Chainwithin its consumer sector. Before this he was director of the Academy ofLogistics and director of client operations at BAX Global, covering EMEA solu-tions and business development. He has been a senior research fellow with theUniversity of Warwick’s Manufacturing Group, where he worked on a numberof projects for leading companies in the area of time compression. During thistime he developed time-based process mapping for supply chain re-engineering.Adrian started his career as a management trainee for Unilever, and his otherexperiences include director of DLR Consulting in the Far East, senior consultantat Price Waterhouse, and company logistics manager for B&Q.
Alan Braithwaite is a visiting lecturer in supply chain management atCranfield School of Management, and chairman of LCP Consulting, aspecialist supply chain and logistics consultancy. He has a first degree inchemical engineering from the University of Birmingham and a Master’s inbusiness studies from the London Business School. His early career was spentas a production manager and industrial engineer in the food industry withLyons and Heinz. He then worked in the furniture industry as managingdirector of a subsidiary of Christie-Tyler plc before moving to consulting. Overthe last 30 years he has consulted with more than 300 companies around theworld and developed and implemented innovative supply chain solutions.He is a recognized educator and author in his specialization.
Michael Browne is the Exel professor of logistics at the University ofWestminster. During the past five years he has been the head of the TransportDepartment and the course leader for the Master’s programme in Europeanlogistics. He is the director of research activities in freight transport and logistics,where recent projects include research on distribution in European cities,potential energy savings from sustainable logistics strategies and forecastingfuture trend in logistics. Michael works on studies for the EuropeanCommission, Department for Transport, the Research Councils and commercialorganizations, and represents the university on many external committees andboards. He is assistant editor of the journal Transport Reviews and is a member ofthe editorial boards of the Journal of International Logistics and Supply Chain Forum.
Simon Chan is a research member of the Logistics Management ResearchCentre, Hong Kong Baptist University, and is a PhD candidate at theDepartment of Finance and Decision Sciences. He earned his Bachelor degreein business administration (information systems management) from the sameuniversity. His research interests are enterprise resource planning systems,information systems and technologies application, logistics and supply chainmanagement. He has published research papers in a number of internationalconferences, journals and book chapters, and is active in several academic andprofessional bodies.
xviii � Contributors

Garland Chow is an associate professor in the Faculty of Commerce andBusiness Administration at the University of British Columbia (UBC). Hisinterests span transport economics, logistics, supply chain management andservices management, and current research includes work on the logisticsservices industry, prediction of bankruptcies in transport firms and a book onmotor carriers. His paper (co-authored with Trevor Heaver) ‘Logistics perfor-mance, definition and measurement’ won the International Journal of PhysicalDistribution and Logistics Management’s best paper prize. Garland is coordi-nator of the UBC supply chain specialization and a national director of theCanadian Association of Logistics Management.
Martin Christopher is professor of marketing and logistics at Cranfield School ofManagement, UK. His work in the field of logistics and supply chainmanagement has gained international recognition. He has published widely, andhis recent books include Logistics and Supply Chain Management and MarketingLogistics. Martin is also co-editor of the International Journal of Logistics Managementand is a regular contributor to conferences and workshops around the world.
At Cranfield, Martin chairs the Centre for Logistics and Transportation, andis an emeritus fellow of the Institute of Logistics, on whose council he sits. In1988 he was awarded the Sir Robert Lawrence Gold Medal for his contri-bution to logistics education.
Jacques Colin is professor of management science at the Université de laMéditerranée, Aix–Marseille, France. At the Faculty of Economic Sciences andBusiness Administration, he is director of the CRET-LOG (Centre deRecherche sur le Transport et la Logistique), which is the main Frenchresearch and teaching centre devoted to logistics. He is a specialist in logistics,and more specifically his interests lie in the study of logistics and supply chainmanagement strategies developed by major companies (in industry, distri-bution and third-party logistics sectors), and in the effects of logistics growthon land planning and sustainable development. He has carried out manyresearch projects for government bodies. He is also a consultant forcompanies such as IBM, SNCF, OTIS, SAGA and ELF. He has publishedwidely, with more than 160 publications since 1980.
Andrew Cox is professor and director of the Centre for Business Strategy andProcurement at Birmingham University’s Business School. This centreundertakes research in all aspects of business strategy, supply chainmanagement and procurement competence.
Andrew has a major grant from the EPSRC to undertake a research projectinto critical assets in supply chain management. This involves working closelywith a number of major UK companies on the development of audit tools forstrategic and operational alignment. He has also worked as a consultant for theEU, HM Treasury and DTI, and for a range of multinational firms based in
Contributors � xix

Europe and the United States, emphasizing the evaluation of existing strategy,operational practice, procurement and supply competence. Andrew haswritten on a wide range of topics related to procurement and business strategy.
Robert Duncan is a director of B & C Business Services Limited and operatesas an independent consultant in the field of supply chain management. Hehas over 35 years of global supply chain management experience as both anexecutive and a consultant in many industry sectors. Robert has particularexpertise in the area of outsourced supply chain resources. His recent workhas been in the areas of supply chain process improvement and the use of ITto support those process changes within both outsourced and in-housesupply chain environments. Robert has contributed to a number of publica-tions and conferences relating to supply chain management.
Dag Ericsson was formerly professor of e-logistics at the University ofSkovde, Sweden, and is now a professor at the University of Boras, where hespecializes in the implementation of integrated logistics in manufacturingindustry.
He was the pioneer and developer of the Swedish concept of materialsadministration and supply chain management, and has written several booksincluding Purchasing: Concepts and tools, Materials Administration/Logistics,Supply Chain Management and Virtual Integration with IT as an Enabler.
In his recent research and consulting, Dag focuses on the interface betweentechnology, management, organizational effectiveness and efficiency. He isespecially concerned with renewal processes and organizational restruc-turing enabled by technological development. He works with most of theglobal Swedish companies – and several international companies – bridgingthe gaps between business, technology and executive education.
Nathalie Fabbe-Costes is professor of management science at the Universitéde la Méditerranée, Aix–Marseille, France, and a senior researcher at theCRET-LOG (Centre de Recherche sur le Transport et la Logistique), teachingstrategy, logistics, supply chain management and management informationsystems. She is also director of their Master ’s and PhD programmes inmanagement logistics and strategy. Her major fields of interest include: 1)logistics as a global and complex intra- and inter-organizational managementconcept, a structured function within companies, and an increasingcomponent of firms’ strategy; and 2) logistics information and communi-cation systems as part of supply chain management and company strategy.She has written more than 120 publications since 1984 and has been the co-author or coordinator of more than 15 books.
John Fernie is professor of retail marketing and head of the School ofManagement and Languages at Heriot-Watt University, Edinburgh. He has
xx � Contributors

written and contributed to numerous textbooks and papers on retailmanagement, especially in the field of retail logistics and the international-ization of retail formats. He is editor of the International Journal of Retail andDistribution Management, and received the award of Editor of the Year in 1997,in addition to Leading Editor awards in 1994, 1998 and 2000. He is on theeditorial board of several marketing and logistics journals. He is an activemember of the Institute of Logistics and Transport and the Chartered Instituteof Marketing in the UK as well as holding office in the American CollegiateRetail Association. He is a member of the Logistics Directors Forum, a group ofleading professionals in supply chain management and logistics in the UK.
David Grant is a lecturer in logistics at Heriot-Watt University, Edinburgh,where his research interests focus on customer service and satisfaction,service quality, relationships, integration of logistics and marketing, andlogistics in SMEs. He obtained his PhD at the University of Edinburgh, and hisdoctoral thesis received the James Cooper Memorial Cup from the CharteredInstitute of Logistics and Transport (UK). He has over 35 publications invarious refereed journals, books and conference proceedings, and is amember of the Council of Supply Chain Management Professionals, the UKLogistics Research Network, the NOFOMA Nordic logistics researchersgroup, and the UK Higher Education Academy.
Trevor Heaver is professor emeritus at the Faculty of Commerce and BusinessAdministration at the University of British Columbia (UBC). He is a pastchairman of the World Conference on Transport Research and immediate pastpresident of the International Association of Maritime Economists. Hespecializes in transport policy, maritime economics, logistics and supply chainmanagement. He still lectures at UBC, but has recently been a visitingprofessor at the University of Antwerp – UFSIA, the University of Sydney,Australia and the University of Stellenbosch, South Africa. His currentresearch and publications deal with issues of corporate strategy and serviceintegration in international transport and logistics.
Peter Hines is professor of supply chain management and director of theLean Enterprise Research Centre at Cardiff Business School. He holds an MAin geography from Cambridge University and an MBA and PhD from theUniversity of Cardiff. Peter followed a successful career in distribution andmanufacturing industry before joining Cardiff Business School in 1992. Heinitially led the Materials Management Unit and now leads the interdepart-mental Innovative Manufacturing Research Centre and the Lean EnterpriseResearch Centre. He has undertaken extensive research into the supplychain and has pioneered a number of key concepts, methods and applica-tions in Europe, including: supplier associations (now involving over 800European firms), value stream mapping and network sourcing. He has
Contributors � xxi

written or co-written several leading books. Peter is also chairman of S APartners.
Chris Lonsdale first taught at the University of Hull in 1992. In 1993, hemoved to the University of Birmingham, Department of Political Science andInternational Studies and the Institute for Local Government Studies. Hemoved to Birmingham University’s Business School in 1994 and is a seniorlecturer in the Centre for Business Strategy and Procurement, the school’ssupply chain management group. He received his PhD in 1995, and from 1997to 2001 was the programme director of the MBA (strategy and procurementmanagement). In 2000, he was awarded honorary membership of theChartered Institute of Purchasing and Supply.
Kirstie McIntyre is the waste electronics and electrical equipment (WEEE)programme manager for HP in the UK. Her responsibilities cover all issuesconcerning the implementation of the European WEEE directive into UK law.She liaises with government, industry partners and peers, and supply chainmembers, as well as business customers and consumers on implementation ofend-of-life directives and the take-back and recycling of HP’s products.Kirstie has worked for a number of years in the strategic development of end-of-life programmes for various companies in the electronics sector . She has anengineering doctorate in environmental technology and has publishedwidely on sustainability and supply chain issues.
Alan McKinnon is professor of logistics in the School of Management atHeriot-Watt University, Edinburgh. A graduate of the universities ofAberdeen, British Columbia and London, he has been researching andteaching in the fields of freight transport and logistics management for over20 years and has published extensively on these subjects. He has been anadviser to several government departments and committees, and consultantto numerous public and private sector organizations on a range of logistics-related topics. He is a fellow of the Institute of Logistics and Transport.
Helen Peck is a senior lecturer at the Resilience Centre, Cranfield University.She joined Cranfield in 1983, from a major UK clearing bank. Initiallyemployed in the university’s library and information service, she transferredto the academic staff of Cranfield School of Management in 1989, where shecompleted her PhD. From early 2001 she has been at the forefront of CranfieldUniversity’s government-funded programme of research into all aspects ofsupply chain-related risk and resilience. Her publications include the UKDepartment for Transport-sponsored report Creating Resilient Supply Chains:A practical guide and numerous academic papers and practitioner journalarticles. She is also co-editor and author of several books and an award-winning writer of management case studies.
xxii � Contributors

Stephen Rinsler is a director of Bisham Consulting, focusing on the strategicand operational supply chain audits, procurement, inventory andoutsourcing consultancy practices. He is chairman of the Chartered Instituteof Logistics and Transport, honorary professor of engineering and logistics atthe Nanjing University, China, and a visiting fellow in supply chains andprocurement at Cranfield University. He is commissioned as a major in theEngineer and Logistics Staff Corps, and is a liveryman of the WorshipfulCompany of Carman and a freeman of the City of London. He activelylectures and writes on logistics and supply chain management.
Stephen started his management career in Unilever in factory planning.After roles in distribution and procurement, he worked in Van den BerghFoods Ltd as chief buyer and company supply chain manager. After a spell atNFC Europe Ltd as services director he became a consultant, and an interimprocurement director with his main client, Storehouse. Then he joined VoltEurope Ltd as managing director of the temporary recruitment adminis-tration and procurement outsourcing division.
Stephen was educated at Bristol University, has attended the AdvancedManagement Programme at Wharton Business School, Pennsylvania, and iscurrently studying mathematics with the Open University.
Donna Samuel is a senior research associate who lectures in purchasing andsupply chain management in the Cardiff Business School. As a member of theLean Enterprise Research Centre, Donna has undertaken a series of researchprojects on supply chain integration and lean supply. She has published inbooks and academic journals such as the Journal for Retail DistributionManagement. She is a qualified member of the Chartered Institute ofPurchasing and Supply (CIPS) and a member of the Institute of Learning andTeaching in Higher Education (ILTHE).
Joe Sanderson is a research fellow at the Centre for Business Strategy andProcurement at the University of Birmingham. He is currently working on aproject to map the structural characteristics of supply and value chains in arange of service and industrial sectors. He has a BA in politics from theUniversity of Hull and is writing his doctoral thesis on the regulatory andorganizational drivers of procurement efficiency in the UK utilities afterprivatization. His principal research interests are in international businessand supply management, power in supply chains, and the impact of national,regional and international regulation on procurement practices.
Philip Schary is professor emeritus at the College of Business at Oregon StateUniversity, where he taught marketing and business logistics. He has been avisiting professor at Cranfield School of Management, Copenhagen andAarhus Schools of Business in Denmark, and the University of New SouthWales in Australia. He has also lectured in Chile and China. He holds an MBA
Contributors � xxiii

from UC Berkeley and a PhD from UCLA in business economics. He haswritten widely in professional journals and serves as editorial reviewer forjournals in logistics management. He has authored or co-authored severalbooks in the area.
Xinping Shi is the director of the Logistics Management Research Centre, andassociate professor in the Department of Finance and Decision Sciences,Hong Kong Baptist University. He has taught widely on businessmanagement subjects to BBA, MBA and EMBA students, and has supervisedPhD graduates in information system and logistics and supply chainmanagement. His research interests include logistics and supply chainmanagement, decision making in organizations, enterprise resourceplanning, knowledge management, and international business negotiations.He has published widely, is the guest professor of logistics management at theCollege of Logistics, Beijing Normal University (Zhuhai), consults, and is anindependent director of logistics firms in Hong Kong and China.
Lars Stemmler is a senior project manager with BLG Consult GmbH, and amember of the BLG Logistics Group, Bremen, Germany. Prior to joining BLGhe worked in various functions for Deutsche Schiffsbank AG, a leading shipfinancier, and for the Oldenburg Chamber of Industry and Commerce. Heteaches as guest professor at postgraduate level at a number of universities. Inthis function he is about to join the World Maritime University at Malmo. Larsholds a PhD in economics and received an MSc in logistics from CranfieldUniversity.
Remko van Hoek is a professor in supply chain management at the CranfieldSchool of Management, and is also managing director of the OperationsManagement Roundtable at the Corporate Executive Board, based inWashington, DC. He has worked at the University of Ghent, Belgium, theErasmus University, Rotterdam, the Netherlands (where he headed a supplychain management research institute), and the Rotterdam School ofManagement. He is the European editor of the International Journal of PhysicalDistribution and Logistics Management, and is on the editorial board of severalleading journals. He has published widely, and has won awards for hisresearch into logistics. He has worked with companies such as Dow, Johnsonand Johnson, Schenker BTL and Nedlloyd, and is an adviser to variousgovernment bodies and organizations.
James Wang is an associate professor in the Department of Geography,University of Hong Kong. He received his Bachelor in Economics from thePeople’s University of China, MPhil from the University of Hong Kong, andPhD from the University of Toronto. Currently he is a council member andchairman of the China Development Committee and the Transport and
xxiv � Contributors

Logistics Policy Committee, the Chartered Institute of Logistics and Transport(HK). His research area is transport geography, with special interests in portdevelopment and transportation in China. He has published widely and is onthe editorial board of the Journal of Transport Geography.
Donald Waters is a graduate of the universities of Sussex, London (ImperialCollege) and Strathclyde. He worked in the UK as a systems analyst, opera-tional researcher and consultant before joining the University of Strathclyde.In 1986 he moved to Canada to become professor of finance and operationsmanagement at the University of Calgary. Since returning to Europe, he hascontinued to use his specialized knowledge of operations and supply chainmanagement, combining work with international companies and visitingappointments at universities. He runs Richmond, Parkes and Wright, aprivate group whose interests are in management research, analysis andeducation. He has written a number of successful books, focusing on aspectsof logistics and operations management.
Glyn Watson is a research fellow at the Centre for Business Strategy andProcurement at the University of Birmingham. His research interests includethe supply chain, supply chain typologies and supply chain management.Prior to joining the centre he did research in the broad area of integration andon European business issues.
Allan Woodburn is a senior lecturer in freight and logistics in the TransportStudies Group at the University of Westminster. He is involved in a range ofteaching and research activities, and his specific areas of interest includefreight transport planning and operations (particularly rail freight), andtransport policy. Allan was previously a lecturer at Napier University, where,in 2000, he completed his doctorate, examining the role for rail freight withinthe supply chain. He has also worked for Colin Buchanan and Partners, doingconsultancy in freight transport, logistics and strategy.
Contributors � xxv

xxvi
This page intentionally left blank

Preface
The first edition of Global Logistics and Distribution Planning: Strategies formanagement appeared in 1988. Since then the whole field of logistics haschanged. Even since the last edition in 2003, the subject has continued todevelop at a remarkable pace. Not long ago, logistics would hardly bementioned in the long-term plans of even major companies; now its strategicrole is recognized in almost every organization. There are many reasons forthis change. Communications and information technology are offering newopportunities; world trade is growing; new markets and sources of materialsare developing; relative costs of services and materials are changing; andthere is increasing concern for the environment.
Logistics has responded to these changes – and played a major role inaccomplishing some of them. As a result it has evolved into a single, inte-grated function that is responsible for all aspects of material movement. Withthis broad view, logistics includes all the activities that are needed to ensure asmooth journey of materials from original suppliers, through supply chainsand on to final customers.
This fifth edition of the book builds on the success of earlier editions andfollows the same general format. It is not an encyclopedia of logistics thatgives an exhaustive review of every aspect of this broad subject. Instead it isa forum in which a number of key issues are addressed. It focuses on areasthat are of particular current interest, and emphasizes changes that haveoccurred in recent years. These areas include the wider integration oflogistics, the growing importance of logistics strategies, improving commu-nications and technology, risk, customer satisfaction and the importance ofglobal operations.
The contributors are acknowledged experts in their fields, and they giveauthoritative views of current thinking. This does not, of course, mean that
xxvii

they present the only view, and we hope that the material will encourageinformed discussion.
This new edition has been completely rewritten. To keep the book’scontemporary focus we have removed some of the previous chapters andreplaced them by new ones. The remaining chapters have all been rewrittenand updated to maintain their relevance to an international readership. Inthis way, the book continues to evolve, discussing a broad range of currenttopics and views, but keeping within a reasonable length.
The book will appeal to everyone with an interest in the broader aspects oflogistics. This includes academics and students doing a variety of courses withsome logistics content. It also includes logistics professionals, consultants andmanagers from different backgrounds who want an appreciation of currentthinking on the supply chain. It is especially important for these non-specialists to realize the growing importance of logistics, and the way that itcrosses organizational and disciplinary boundaries. The long-term success ofevery organization depends on its ability to deliver products to customers –and this is precisely the role of logistics.
James Cooper edited the first two editions of this book – and I must agreewith his summary of the pleasures of editing the contents:
In my role as editor, I have already had the opportunity to read the thoughts and ideasexpressed in each of the chapters. Indeed, one of the greatest pleasures of beingeditor was to be the first to enjoy the riches of the chapters as they converged into thisbook. I now leave it to new readers to explore the chapters that follow, in the antici-pation that they too will benefit, both professionally and personally, from the wealthof knowledge and expertise that they contain.
Donald Waters
xxviii � Preface

Trends in the supplychain
Donald Waters, Richmond, Parkes and Wright
Definitions
Every organization delivers products to its customers. These products aretraditionally described as either goods or services, but this distinction ismisleading and it is fairer to view every product as a complex package – oroffer – that includes both goods and services. For example, Toyota manu-facture cars, but they also give services through warranties, after-salesservice, repairs and finance packages; McDonald’s supply a combination ofgoods (burgers, cutlery, packaging, etc) and services (when they sell foodand look after the restaurant); Vodafone offer telephone services, but theyalso provide equipment, documents and other hardware. A better view ofproducts has a spectrum, at one end of which are products that are predomi-nantly goods (such as cars and washing machines) and at the other end areproducts that are predominantly services (such as insurance and education).In the middle are products with a more even balance, such as restaurants andhospitals.
At the heart of an organization are the operations that create and deliver itsproducts. So we can view an organization as taking a variety of inputs (theraw materials, people, equipment, information, money and other resources),doing operations (the manufacture, serving, transport, selling, training, etc)and creating outputs (especially the products that it passes to customers)(Waters, 2002). This view highlights the flow of materials from suppliers,
1
1

2 � Global logistics
through operations and on to customers. The materials are everything thatthe organization uses – both tangible (raw materials, work in progress,finished goods, spare parts, etc) and intangible (information, money,knowledge, etc).
Materials generally move through several tiers of suppliers on their journeyfrom initial suppliers into an organization; and they move through severaltiers of customer on their journey out of the organization and on to finalcustomers. All the organizations from the initial supplier to the final customerform a supply chain. In practice, there are complex relationships betweenorganizations, so a supply chain is likely to appear as a network of interactingentities.
Logistics is the function responsible for all movements of materials throughthe supply chain. To summarize two key definitions (Waters, 2003):
� A supply chain is the series of activities and organizations that materials –both tangible and intangible – move through on their journeys frominitial suppliers to final customers.
� Logistics is the function responsible for moving materials through theirsupply chains.
Not surprisingly, there are variations on these definitions. Some people saythat there are differences between ‘logistics’ and ‘supply chain management’– typically arguing that logistics is concerned with an individual organizationwhile supply chain management (SCM) considers the whole chain. But this isnot a meaningful distinction, and we will use the terms interchangeably. Thisview is supported by the Council of Supply Chain Management Professionals(2006), who describe logistics as the function that ‘plans, implements andcontrols the efficient, effective forward and reverse flow and storage of goods,services and related information between the point of origin and the point ofconsumption in order to meet customers’ requirements’. In a similar vein, theChartered Institute of Logistics and Transport (1998) says that:
� ‘Logistics is the time related positioning of resources or the strategicmanagement of the total supply-chain.’
� ‘The supply-chain is a sequence of events intended to satisfy a customer. Itcan include procurement, manufacture, distribution and waste disposal,together with associated transport, storage and information technology.’
Logistics costsThe broad function of logistics embraces a series of related activities, includingprocurement, transport, receiving, warehousing, inventory management,

materials handling, order processing, distribution, recycling, location deci-sions, information processing, and other related functions. These activitiesexist – at least to some extent – in every organization. Christopher (1986)emphasizes their importance, saying that ‘Logistics has always been a centraland essential feature of all economic activity.’ Shapiro and Heskett (1985)confirm that ‘There are few aspects of human activity that do not ultimatelydepend on the flow of goods from point of origin to point of consumption.’ Asurvey by Deloitte & Touche in Canada (Factor, 1996) showed that 98 per centof companies considered supply chain management to be either ‘critical’ or‘very important’.
Despite its importance, it took a long time for logistics to get the attention itdeserves. Traditionally organizations put all their effort into making products– and then considered the movement and storage of materials as anunavoidable overhead or clerical chore. In 1962 Drucker described physicaldistribution as ‘the economy’s dark continent’ and said that this formed ‘themost sadly neglected, most promising area of… business’.
By the 1970s it was clear that logistics was expensive – but few organizationscould say precisely how expensive. Ray (1976) noted that ‘The whole area [oflogistics costing] is clouded with ad hoc approaches and untidy accountingprocedures, to which there appears little underlying systematic ideology.’Little (1977) agreed, saying that ‘Identifying logistics costs through acceptedaccounting statements in the firm is very misleading.’ Managers started toidentify the ‘total cost’ of logistics, and by the 1980s surveys – for example,Ray, Gattorna and Allen (1980), Firth et al (1980), McKibbin (1982) and Delaney(1986) – suggested that logistics generally account for 15–20 per cent of costs.However, in 1994 Hill could still say that ‘many distributors are unaware ofthe costs of the distribution service they provide’.
At a national level, the gross domestic product of the United States is $12trillion a year, so $2.4 trillion might be spent on logistics, with half of this fortransport (US Census Bureau, 2006). The UK government says that wholesaleand retail trades contribute more than 12 per cent of the GDP, with transportand storage contributing another 4.5 per cent (Office of National Statistics,2006). This suggests that overall logistics costs might be considerably higherthan survey estimates – supporting an earlier estimate by Childerley (1980)that logistics accounted for 32.5 per cent of the UK GDP.
Development of logistics
When managers started to recognize its importance, logistics developed veryquickly. By 1996, Deloitte & Touche found that over 90 per cent of organiza-tions were currently improving their supply chain or planning improvementswithin the next two years (Factor, 1996). This pace continues, with pressuresfor change including:
Trends in the supply chain � 3

� recognition that logistics is an essential function that must be managedproperly;
� realization that decisions about the supply chain have a strategic impacton performance;
� appreciation of the high cost of logistics and the opportunity for majorsavings;
� growing emphasis on customer satisfaction – and recognition that thisdepends on logistics;
� increasing competition for both users and providers of logistics;� new types of operations – such as just-in-time, total quality management,
flexible operations, mass customization, lean operations, timecompression, virtual organizations, etc;
� sustained growth of international trade – and free trade areas such as theEuropean Union and North American Free Trade Agreement;
� improved communications allowing electronic data interchange (EDI),B2B, B2C and e-commerce;
� more technology with vehicle telematics, intermodal systems, identifi-cation and tracking systems, improved vehicle design, etc;
� integration of operations and organizations through strategic alliances,partnerships and collaboration;
� changing patterns of power in the supply chain with large organizationsdominating certain areas and setting industry standards;
� organizations concentrating on their core operations and outsourcinglogistics to third parties;
� organizations focusing on the whole process of satisfying customerdemand, rather than simply making products;
� increasing concerns over risks to supply chains and their ability to respond;� growing concern about environmental damage and changing attitudes
towards pollution, waste, traffic congestion, road building, etc;� changing government policies on the ownership, regulation, use, respon-
sibilities and cost of transport.
Approach to integrationInitially, organizations responded to these pressures by looking for improve-ments to the separate activities of logistics – procurement, inventory control,transport, warehousing, materials handling, packaging, and so on. But it soonbecomes clear that these are not separate activities that can be handled inisolation – and any change to one activity inevitably affects the others.Planned improvements to procurement have consequences for inventorymanagement; changes in packaging affect material handling; changes totransport affect warehousing, and so on. This means that organizations canonly get the best results by considering all aspects of material movement in asingle, coordinated flow through the supply chain. This leads to a broad and
4 � Global logistics

inclusive view of logistics, with all related activities combined into a singleintegrated function.
In practice, it is difficult to achieve this integration. The usual approachdevelops over time, with one department slowly taking over all aspects ofordering and receiving raw materials, and another department taking over allaspects of delivering finished products to customers. Many organizationsstop when they reach this stage, so they have two functions: 1) materialsmanagement, aligned with production and concerned with the inward flow ofraw materials and their movement through operations; and 2) physical distri-bution, aligned with marketing and concerned with the outward flow offinished goods. But this still leaves an artificial break in an essentiallycontinuous function. The obvious next step is to complete the internal inte-gration of logistics by combining the two into a single function responsible forall material movement into, through and out of the organization.
If each organization only looks at its own logistics, there are still unneces-sary boundaries between them, disrupting the flow of materials andincreasing costs. So the next step has external integration to merge logisticsalong the supply chain and remove these boundaries. This recognizes that allorganizations along a particular supply chain share the same objective –which is satisfied final customers – and they should cooperate to achieve thisaim. Competitors are not other organizations within the same supply chain,but are organizations in other supply chains. As Christopher (1996) says,‘supply chains compete, not companies’, and he adds that ‘Most opportu-nities for cost reduction and/or value enhancement lie at the interfacebetween supply chain partners’ (1999). So the aim of an integrated supplychain is to improve overall efficiency and reduce overall costs – rather thanhave each organization working independently and pushing costs and ineffi-ciencies to other parts of the chain.
The benefits from integrating logistics along the supply chain include:
� common objectives for all parts of the supply chain;� genuine cooperation to achieve these objectives;� sharing information and highlighting important features;� faster and more flexible responses to customer demands;� replenishment and movements triggered by actual demands;� lower stocks;� less duplication of effort, information, planning, stocks, etc;� improved efficiency and productivity;� easier planning;� less uncertainty, errors and delays;� elimination of activities that add no value for customers.
Trends in the supply chain � 5

Levels of integrationNow we have three levels of integration. The first has logistics as separateactivities within an organization; the second has internal integration to bringthem together into a single function; the third has external integration, whereorganizations look beyond their own operations and integrate more of thesupply chain. Decker and van Goor (1998) give a different view, with fourlevels of physical integration, information integration, control integration andinfrastructure integration.
Higher levels of integration allow a supply chain to work together, with‘quick response’ or ‘efficient customer response’ (ECR) allowing finalcustomer purchases automatically to send a message back through the chainand trigger a response from upstream suppliers. When a customer buys a pairof jeans in a clothes shop, the EPOS (electronic point of sales) system sends amessage back to the wholesaler to say that the stock needs replenishing, thenback to the manufacturer to say that it is time to make another pair of jeans,then back to suppliers to say that they should deliver materials to the manu-facturer, and so on. The result is ‘a focus on the consumer, the development ofpartnership relationships between retailers and their suppliers, and anincreased integration of the components of the supply-chain’(Szymankiewicz, 1997). Hutchinson describes ECR as ‘meeting consumerwishes better, faster and at less cost’, and he adds, ‘Is there anybody, wishingto remain in business, who believes that his or her company should not bestriving to meet the wishes of the customer of their products and servicesbetter, faster and at less cost?’ (quoted in O’Sullivan, 1997).
By 1997 a survey by P-E Consulting found that 57 per cent of companies hadmoved to some form of integrated supply chain. Significantly, more than 90per cent of companies expected an increase in integration over the next threeyears, with a quarter of companies moving to ‘fully integrated’ systems(although it was not clear what this actually meant). At the same time, though,Szymankiewicz (1997) noted that ‘In the grocery sector ECR is often regardedas an established way of doing business… [but] overall there is more talk thanaction.’ This note of caution is well founded, as in 2003 Poirier and Quinnnoted that most organizations were still working on internal integration andwere moving towards external integration – but only 10 per cent had madesignificant progress. They concluded that ‘Only a comparatively smallpercentage of companies have evolved to the more advanced stages of supplychain management.’ For a variety of reasons – ranging from an unwillingnessto share information to a lack of appropriate technology – most organizationsare still missing this opportunity both to raise customer service and to lowercosts.
6 � Global logistics

Logistics strategy
With logistics as a single integrated function, it is clear that some of its deci-sions have a strategic importance – such as the design of supply chains,sourcing policies, alliances with suppliers, methods of procurement, relationswith customers, modes of transport, location of facilities, size of operations,use of technology, recycling policies, and so on. These decisions form a part ofthe logistics strategy – which consists of all the long-term goals, plans, policies,culture, resources, decisions and actions that relate to the supply chain.
To design a successful logistics strategy, managers need to understand andbalance the competing demands of:
1. Higher strategies, including the mission, corporate and business strategiesthat set the context for logistics.
2. Business environment, which includes all external factors that affectlogistics, but which managers cannot control. These include customers,market conditions, available technology, economic conditions, legalrestraints, competitors, shareholders, interest groups, social conditions,political conditions, and so on.
3. Internal features, which are factors within the organization that managerscan control. These include customer relations, employee skills, finances,products, facilities, technology used, suppliers, resources available, etc.
By definition, managers have virtually no control over the external envi-ronment, so they adjust the internal features of logistics to work within thisfixed environment. When they do this well, there is said to be good ‘strategic fit’between logistics and their environment. Stacey (2002) says that ‘organizationsare successful when they intentionally achieve internal harmony and externaladaptation to their environment’. In practice, this means that organizationsbuild on their strengths to develop distinctive features that give a sustainablecompetitive advantage. Prahalad and Hamel (1990) describe the activities thatan organization does particularly well as its ‘strategic competencies’.
Selznick (1957) established the principle that an organization can onlysucceed by doing key activities better than competitors – or maybe doingcompletely different activities (which Porter (1996) summarizes as ‘choosingto perform activities differently or to perform different activities than rivals’).So logistics managers must run their supply chains more efficiently thancompetitors, or else they must find some service that competitors are notoffering. This is in line with Porter’s (1985) two generic strategies of cost lead-ership (giving the same, or comparable, products at a lower price) and productdifferentiation (giving products that customers cannot find anywhere else).
In logistics, these two generic strategies are phrased as ‘lean’ and ‘agile’.Essentially, a lean strategy aims for the lowest possible costs with efficientflows of materials that eliminate waste, minimize stocks, reduce lead times,
Trends in the supply chain � 7

use fewer resources, employ fewer people, remove duplicated effort, elim-inate non-value-adding operations, and so on. This brings benefits to thewhole supply chain. For example, lower transport costs allow organizations towork over a wide geographical area, and manufacturers in the Pacific Rim candeliver goods anywhere in the world at prices that compare with domesticcompanies. Although this seems a sensible approach, lean logistics can put toomuch emphasis on costs, and not have the flexibility to deal with rapidlychanging conditions. An alternative agile strategy stresses customer satis-faction by responding quickly to changing conditions – perhaps triggered byincreasing competition, more sophisticated customers, changing customerrequirements, variable demand, unforeseen conditions, natural disasters, ormany other factors. Agility often appears as a short lead time, so thatcustomers do not have to wait for products, and suppliers do not haveproducts hanging around and clogging the supply chain.
At first sight it seems difficult to reconcile the aims of lean and agile logistics.One minimizes costs, and sees customer service as a constraint; the othermaximizes customer service, and sees costs as a constraint. In practice, the twopolicies are not necessarily distinct. For example, when a supplier improves itsEDI links with customers, it can both reduce costs and increase customerservice – becoming both leaner and more agile. Evans and Powell (2000)conclude that ‘lean and agile are not mutually exclusive, they both have theirmerits, but also limitations, especially if an individual aspect is taken, inisolation, to the extreme’.
There are other, more specific strategies for logistics – including time-basedstrategies (which deliver products quickly to customers), high-productivitystrategies (which use resources fully), value-added strategies (whichmaximize added customer value), diversification or specialization strategies(which define the width of product ranges), growth strategies (which aim foreconomies of scale), globalization strategies (which buy, store and move ma-terials in a single, worldwide market), environmental protection strategies(which focus on sustainable operations, renewable resources, recycling, etc),and a whole range of others.
Logistics managers often face similar pressures, and they respond byadopting similar strategies. The results appear as identifiable trends in theindustry. We have already mentioned one of these, where logistics managershave responded to pressures for better efficiency by increasing integration oftheir supply chains. There are several other trends in the industry, which wecan demonstrate by examples related to:
� improved communications and e-business;� globalization;� satisfying more demanding customers;� responding to changes in the business environment.
8 � Global logistics

Improved communications and e-business
When a company buys something, it typically has to generate a description ofthe product, search for suppliers, request a price and conditions, issue apurchase order, negotiate details, organize transport, discuss special condi-tions, organize finance, arrange payment, and so on. In the past, this needed alot of paperwork, which made even the simplest transaction complicated,expensive and time-consuming. More recently, technology has revolu-tionized these communications, replacing onerous manual operations byautomated electronic ones. EDI appeared in the 1990s, and by 1997 around2,000 companies in the UK routinely used it for procurement (Stafford-Jones,1997). Electronic purchasing – moving through intranet, extranet and internetmodels – brought instant access to any supplier irrespective of location,available at any time, with a transparent market, low entry costs and lowtransaction costs.
Electronic trading mushroomed, with e-mail followed by e-business,e-commerce, e-trading, e-retail, e-logistics – and soon ‘e-anything’. This hasdeveloped in two main directions – B2B (business-to-business), where onebusiness buys materials from another business, and B2C (business-to-customer), where a business sells directly to a final customer. By 2002 around83 per cent of UK suppliers used B2B (MRO Software, 2001), with worldwideB2B trade valued at over US $2 trillion (Gartner Group, 2006). A typical indexof e-retail value had risen from 100 in July 2000 to 1,357 by 2004 (IMRI, 2004).However, it is difficult to put a reliable value on electronic trade as there aremany variations of ‘e-business’. Is it a transaction where every stage iscompleted through the internet, one that is initiated by a website, or onewhere even a single activity is done over the internet? Figure 1.1 shows twoviews of the value of global electronic trade (Forrester, 2006; Gartner Group,2006).
The benefit of e-business is its standard formats for instant communicationbetween systems. This does not just improve purchasing, but it allowscompletely new types of logistics, with the emphasis moved from physicalmaterials to information. For example, organizations traditionally held safetystock to allow for uncertain demand – but an alternative is to replace fore-casts by instant information about actual demand, and replace stocks byinformation of where to find products with short lead times. The ultimateaim – which remains a theoretical target – is to pass information tocompletely flexible operations, which have production batches of one, andzero lead time.
Improved communications are the enablers of supply chain integration.They are the means by which organizations can exchange information – bothinternally and externally. Internally, they track individual packages using barcodes, magnetic stripes and radio frequency identification (RFID); they monitorvehicles through telematics; they control warehouses through automatically
Trends in the supply chain � 9

guided vehicles; they monitor transactions and plan operations – and a host ofother functions. Externally, they allow vendor-managed inventory (VMI),collaborative planning, forecasting and replenishment (CPFR), synchronizedmaterial movement through the whole supply chain, payments by electronicfund transfer (EFT), roadside detectors to monitor traffic conditions and routevehicles around congestion – and so on. Realistically, it is difficult to find an areaof logistics that is not affected by improved communications.
Globalization
E-business allows organizations around the world to communicate as if theyare physically close – so physical distances become less significant, and orga-nizations can become global in outlook. They can broaden their supplier andcustomer bases to buy, transport, store, manufacture, sell and distributeproducts in a single worldwide market.
Many factors encourage global operations, including:
� Cost differences. Organizations can reduce their overall costs by movingoperations to the regions where they can be done least expensively. Thenmanufacturing is moved to China, call centres to India, R&D to Europe,and so on.
� Growing demand in new markets. As developing regions become more pros-perous, foreign companies recognize the opportunities in these newmarkets.
10 � Global logistics
Figure 1.1 Estimates of the value of global electronic trade
0
1000
2000
3000
4000
5000
6000
7000
8000
1998 1999 2000 2001 2002 2003 2004Year
Forrester Research The Gartner Group
Val
ue
($b
illio
n)

� Economies of scale. Many manufacturing operations depend on – or workbest with – stable, large-scale production. The best size for this is oftenlarger than demand from a single market.
� Greater demands from customers. As customers become more demanding,local suppliers may not be able to meet their requirements, so they lookfurther afield to find the best sources.
� Convergence of market demands. Different markets are increasingly acceptingthe same products – or at least products with minor differences infinishing. This effect (which Ohmae (1985) calls ‘Californianization’)allows companies to sell the same products in virtually any country.
� Removal of trade barriers. Free trade areas – such as the European Union andNorth American Free Trade Agreement – specifically encourage interna-tional trade.
� Changing logistics. Better logistics makes international trade easier. Forexample, containerization and intermodal transport make the movementof goods easier, faster and cheaper.
� Specialized support services. Many organizations concentrate on their corecompetencies and outsource logistics to third-party specialists. Theoutsourced operations are in locations determined by other organizations,and may not be in the host country.
� Improved communications among consumers. Satellite television, the web andother communication channels have made customers more aware ofproducts from outside their local regions.
� Improved communications in business. As we have seen, developments ininformation systems make it as easy to do business on the other side of theworld as in the next town.
Leontiades (1985) says that ‘One of the most important phenomena of the20th century has been the international expansion of industry. Today,virtually all major firms have a significant and growing presence in businessoutside their country of origin.’ Perhaps half of the trade between industri-alized countries is accounted for by transfers between subsidiaries of the samecompany (Julius, 1990). In the United States a third of exports are sent by UScompanies to their overseas subsidiaries, and another third are sent by foreignmanufacturers back to their home market.
By 2004 around $9 trillion of merchandise was moved around the worldeach year, with $21 trillion of commercial services (see Figure 1.2) (WTO,2005).
Because the rationalized operations and supply chains of global operationsbring such obvious benefits, it is easy to imagine that this is an automaticmovement. In practice, of course, there can be serious barriers. Sometimesthere are simply problems with product design – with different regionsdemanding different types of product, products not lending themselves toglobal operations, or customers simply not viewing them favourably.
Trends in the supply chain � 11

Sometimes there is demand, but practical difficulties make it impossible todeliver – such as protectionist government policies, problems at national fron-tiers, inadequate infrastructure, missing technical skills, or other cultural andeconomic differences. Companies adopt various structures to minimize theseproblems, with the main choices of working nationally, internationally, multi-nationally or globally. Essentially, a national company only works within itshome market and exports to other organizations in foreign countries; an inter-national company has a centre in one country, from which it controls theactivities of subsidiary divisions in other countries; a multinational consists ofconnected, but largely independent, companies in different countries; aglobal company sees the world as a single market and works in the locationsthat are most effective and efficient. These descriptions are really too rigid,and many organizations respond to local conditions, practices and demands.This gives a looser ‘transnational’ structure that includes many different typesof operation – and still gives a unified culture for the whole organization.
Satisfying more-demanding customers
The internet allows customers to access suppliers all around the world in atransparent market where they can compare deals and conditions. So theyinevitably become more demanding – looking for more choice, lower prices,shorter lead times, accurate fulfilment, better value, and a generally betterexperience. Logistics managers have to respond by designing the best servicesthey can – and this means knowing what their customers want, building on
12 � Global logistics
Figure 1.2 Value of global trade
0
5000
10000
15000
20000
25000
30000
35000
1992 1994 1996 1998 2000 2002 2004 2006
Year
Val
ue
($b
illio
n)
Merchandise Commercial services Total

their capabilities to design operations that satisfy customers, monitoringperformance to see that they are achieving their aims, and continually lookingfor improvements.
Central to the idea of monitoring and improving performance is some kindof measurement – and there are a huge number of possible measures forlogistics. Rushton (1994) lists measures commonly used by grocery retailers,ranging from cost as a percentage of company sales to overtime hours as apercentage of total hours. Lennox (1995) lists measures of customer service,starting with the proportion of items supplied at first demand, the number oforder-pick errors, availability of back orders, proportion of orders satisfied infull, amount of damage – and continuing down to lead time, courtesy of staff,ease of ordering, etc.
Managers have to choose measures of performance that relate to significantfactors in their operations. So there would be no point in, say, an insurancecompany monitoring the cost of rail freight. Another problem is separatingthe performance of logistics from both other internal operations and externalinfluences. For example, late deliveries at customers might be caused by poorlogistics – but they might also be caused by poor demand forecasts, orproduction problems, roadworks, traffic congestion, ferry operators on strike,or a whole range of other factors that logistics managers cannot control oreven influence. Logistics provides the final link between suppliers andcustomers, so it often gets blamed for faults in other parts of the system.
The point of measuring performance is to see if predefined targets are beingmet. Some of these targets are absolute values – such as no accidents orcustomer complaints – but most are arbitrary values that managers decide aredemanding but achievable. The most widely used sources for targets areperformance actually achieved in the past, performance achieved by com-parable operations within the organization, performance achieved bycompetitors or other organizations, benchmarks from the industry’s bestperformers, negotiated and agreed targets, industry standards, and absolutestandards such as zero defects.
Normally, these targets are continually made more demanding toencourage the improvements that are essential if a business is to remaincompetitive. But where should logistics managers look for improvements?In practice, there is no shortage of suggestions. All managers face a constantstream of ‘new ideas’ for improving operations, and the main difficulty issifting through these to see which might bring real benefit, which are oldideas disguised in new words, and which are – at best – a waste of time.Most of the suggestions are supported by anecdotal evidence to show howthey have improved the performance of particular companies.Unfortunately, this evidence is presented to support a specific viewpointand is not based on objective analyses – so it can be difficult for managers toidentify ideas that will work in their own organization. There is no doubtthat total quality management (TQM), for example, has brought huge
Trends in the supply chain � 13

benefits to many organizations (Deming, 1986) – but it might not work in aparticular company. Re-engineering has been hugely influential, butHammer (1996) says that 75 per cent of organizations using it do not get theexpected benefits. Even well-established methods can be questioned, withBraithwaite (1996) describing material requirements planning (MRP) as ‘Toobig, too slow and too inflexible… it is essentially obsolete and waiting to die.’
The best advice is to take a rational approach to improvement, such as thefollowing steps:
1. Make everyone aware that to remain competitive changes are contin-ually needed to the supply chain.
2. Examine current operations, identify their aims, see how well theyachieve these and identify problem areas and weaknesses.
3. Use benchmarking and other comparisons to identify potentialimprovements.
4. Design better procedures using the knowledge, skills and experience ofeveryone concerned.
5. Discuss the proposals widely, make adjustments, negotiate agreements,and get people committed to the new methods.
6. Design a detailed plan for implementing the improvements.7. Prepare for the new methods – making necessary changes to the organi-
zation’s structure, systems, facilities, etc; establishing milestones; givingappropriate training; setting challenging but achievable goals; making itclear how goals can be achieved.
8. Have a specific event to start the new methods.9. Monitor and control progress, checking that milestones are achieved,
giving support and encouragement, updating plans, and continuingdiscussions about progress, problems, adjustments, etc.
10. Accept that the new methods are only temporary, and continually lookfor further improvements.
The search for improvements has led to many changes in logistics practices.There are far too many of these to list, but we can illustrate the scope by somewidely used methods:
� Postponement. Traditionally, manufacturers moved finished goods out ofproduction and stored them in the supply chain until needed. When thereare many variations on a basic product, this gives high stocks of similarproducts. Postponement moves almost-finished products into the chain,and delays completion, final adjustment or customization until the lastpossible moment. You can imagine this with a manufacturer of electricalequipment that keeps stocks of standard products and only adds the trans-formers, cables and instructions needed for a particular market when theyare about to be shipped, or ‘package-to-order’, where a company keeps a
14 � Global logistics

product in stock, but only puts it in a box written in the appropriatelanguage when it is about to ship an order.
� Factory gate pricing. One way to coordinate the flow of materials in a supplychain is for a key player to take over management of logistics. As retailersare increasing their power, they want more control of logistics. Withfactory gate pricing, a single organization – often a retailer – takes respon-sibility of delivery from the factory gate through to the final customer.
� Cross-docking. Traditional warehouses move materials into storage, keepthem until needed, and then move them out to meet demand. Cross-docking coordinates the supply and delivery, so that goods arrive at thereceiving area and are immediately transferred to the loading area and puton to delivery vehicles. There may be some sorting, breaking bulk,merging and consolidation of materials at the warehouse – but no storage.These activities can be done at a simple transfer point, so the aim is toremove the warehouse completely and have ‘stock on wheels’. A relatedarrangement uses ‘drop-shipping’, where warehouses do not keep stockthemselves, but coordinate the movement of materials directly fromupstream suppliers to downstream customers.
� Direct delivery. More customers are buying through the web or findingother ways – such as mail order or catalogues – of buying directly frommanufacturers or earlier tiers of the supply chain. This ‘disintermediation’has the benefits of reducing lead times, reducing costs to customers,having manufacturers talking directly to their final customers, allowingcustomers access to a wider range of products, and so on.
� Small deliveries. Some methods – such as just-in-time and agile and directdeliveries – inevitably lead to smaller, more frequent deliveries. Thissuggests some movement away from large trucks and into smallerdelivery vehicles – which are inherently less efficient. However, it hasspurred the growth of parcel delivery services such as FedEx, UPS andDHL – and it has encouraged operators to look for efficiencies, such asround-the-clock deliveries to unattended destinations, better planning ofdeliveries, and higher vehicle utilization.
� Increasing vehicle utilization. For a variety of reasons – such as unbalanceddemand, composition of the vehicle fleet, characteristics of the vehiclesand loads, poor coordination, etc – vehicles spend a proportion of theirtime travelling empty or with partial loads. Methods for reducing thisinclude backhauls (where delivery vehicles find loads for their returnjourneys), reverse logistics (returning goods for repair, reuse or recycling),freight forwarding (where loads from several companies are combined),and more efficient schedules (perhaps with regular routes). To some extentthese measures counteract the move to smaller loads, but after continuousimprovements for almost half a century the overall productivity of theUK’s transport fleet peaked in 1999 and is now stable or even falling(Department for Transport, 2005).
Trends in the supply chain � 15

Responding to changes in the business environment
The above examples – along with many others – show how managers aremaking direct improvements to logistic operations. But they also have torespond to more general business trends, such as the outsourcing of non-coreactivities and the growing power of retailers. Again, we cannot list even afraction of these responses, but can give some examples:
� Outsourcing. Organizations often benefit from concentrating on theircore operations and outsourcing peripheral activities to specialists. Theseperipheral activities might be anything from cleaning and cateringthrough to accounting, legal services and information processing.Logistics is a particularly popular function for outsourcing, withspecialist service providers taking over part, or all, of the materialmovement and storage. This use of third-party logistics (3PL) has theusual benefits of lower fixed costs, expert services, combined work togive economies of scale, flexible capacity, lower exposure to risk,increased geographical coverage and guaranteed service levels.Sometimes the administration of several 3PL contracts gets so compli-cated that another company is used to manage it – giving fourth-partylogistics (4PL). Almost 60 per cent of Fortune 500 firms outsource somelogistics (Eye for Transport, 2005). In the EU the outsourced logisticsmarket was valued at R176 billion by 2004, and this was forecast to rise to45 per cent of all logistics expenditure by 2008 (Datamonitor, 2004).Unfortunately, outsourcing does not inevitably give the level of servicethat companies would like (Richards, 2006).
� Fewer suppliers. Traditionally, organizations have used a large number ofsuppliers, to encourage competition, ensure that they get the best deal,and guarantee continuing deliveries if one supplier runs into difficulties.However, increasing cooperation within a supply chain – particularlystrategic alliances – encourages organizations to look for a small number ofthe best suppliers and work exclusively with them. This inevitably reducesthe number of suppliers used, as illustrated by Rank Xerox, which reducedits suppliers from 5,000 to 300, while Ford moved from 4,000 to 350(Lamming, 1993).
� Concentration of ownership. Large companies can get economies of scale andefficient operations, so a few large companies often dominate industries(with examples like supermarket chains and transport companies).Continuing benefits mean that these large companies tend to grow at theexpense of smaller rivals. The result is a continuing concentration ofownership, with the largest organizations setting standards that othersstrive to match.
� Movement of power to retailers. Historically, most power in the supply chainwas with manufacturers – in the way that Toyota is still the focal
16 � Global logistics

organization in its supply of cars. Several trends – including theoutsourcing of manufacturing to low-cost regions and global sourcing –have moved the power in many supply chains. In particular, the retailer isoften the key player, being the company that makes the link to the finalcustomer.
� Mass customization. Many trends in manufacturing have direct links tologistics, with obvious examples of just-in-time operations and shorter lifecycles. Some of these effects are brought together into the general headingof ‘mass customization’, which is the ability to personalize products tomeet individual customer demands. The aim is to combine the benefits ofmass production with the flexibility of customized products – with B2Cgiving direct communications between a final customer and a manufac-turer, and supply chains that can move materials reliably and quickly. Dellis a pioneer of mass customization, collecting customer orders through itswebsite, building a computer for each specific order, and working soclosely with suppliers that ‘virtual integration’ gives the impression thatthey are all part of the same company. Similar movements towards a‘3DayCar Programme’ suggest ‘that 80% of cars in the UK could be built toorder by 2010’ (Holweg, Judge and Williams, 2001).
� Increasing environmental concerns. There is growing concern about air andwater pollution, energy consumption, urban development, wastedisposal and other aspects of environmental damage. It is fair to say thatlogistics does not have a good reputation for environmental protection –demonstrated by the emissions from heavy lorries, noisy and inefficientvehicles, use of green-field sites for warehouses, calls for new roadbuilding, use of extensive packaging, oil spillage from tankers, ineffi-cient operations wasting energy, and so on. But logistics is clearlymoving towards greener practices. One aspect of this is reverse logistics,which includes the collection and recovery of end-of-life products, andreturn and reuse of packaging. There is a growing recognition thatcareful management can bring both environmental protection andlower costs.
� Risk management. Managers are increasingly aware that they have to assessrisk – both natural and artificial – and plan their actions either to avoid riskor to mitigate the effects. As supply chains become longer, there isinevitably more chance of disruption, and logistics managers have to takea proactive approach.
Conclusions
� Logistics is the function responsible for moving materials through supplychains – where a supply chain is the series of activities and organizations
Trends in the supply chain � 17

that materials move through on their journeys from initial suppliers tofinal customers.
� In recent years organizations have begun to appreciate the importance oflogistics – and recognize it as an essential function, with a clear impact onstrategic performance.
� There are many pressures on logistics, and managers respond by continualchange. A key result is that logistics has developed into a single integratedfunction, first within organizations and then along the broader supply chain.
� The long-term direction of logistics is defined by a logistics strategy. Twocommon themes refer to lean and agile strategies – but there are manyother aspects of strategy. These can be illustrated by:– improved communications and e-business, which change the way that
logistics work, putting the emphasis on information flows, and creatingnew opportunities for e-business;
– globalization, with growing international trade – encouraged by manyfactors – and more organizations working internationally throughextended supply chains;
– satisfying more-demanding customers, which means that logisticsmanagers must continually monitor and improve their operations toremain competitive;
– responding to changes in the business environment, as there are manybroad trends that affect logistics.
References
Braithwaite, A (1996) MRP – partially discredited solution in decline, LogisticsFocus, 4 (4), pp 5–6
Chartered Institute of Logistics and Transport in the UK (CILT) (1998)Members’ Directory, CILT, Corby, www.ciltuk.org.uk
Childerley, A (1980) The importance of logistics in the UK economy,International Journal of Physical Distribution and Materials Management, 10 (8)
Christopher, M (1986) The Strategy of Distribution Management, Heinemann,Oxford
Christopher, M (1996) Emerging issues in supply chain management,Proceedings of the Logistics Academic Network Inaugural Workshop,Warwick University
Christopher, M (1999) Global logistics: the role of agility, Logistics and TransportFocus, 1 (1)
Council of Supply Chain Management Professionals (CSCMP) (2006)Publicity material from CSCMP, Oak Brook, IL, www.cscmp.org
Datamonitor (2004) European logistics market maps 2004, Datamonitor,London
18 � Global logistics

Decker, H and van Goor, A (1998) Applying activity-based costing to supplychain management, Proceedings of the 1998 Logistics Research NetworkConference, Cranfield University
Delaney, RV (1986) Managerial and financial challenges facing transportleaders, Transportation Quarterly, 40 (1), p 35
Deming, WE (1986) Out of the Crisis, MIT Centre for Advanced Engineering,Cambridge, MA
Department for Transport (2005) Transport Statistics Great Britain, StationeryOffice, London
Drucker, P (1962) The economy’s dark continent, Fortune, April, p 103Evans, B and Powell, M (2000) Synergistic thinking: a pragmatic view of ‘lean’
and ‘agile’, Logistics and Transport Focus, 2 (10), pp 26–32Eye for Transport (2005) Survey of outsourcing: the latest trends in using 3PL
providers, www.eyefortransport.comFactor, R (1996) Logistics trends, Materials Management and Distribution, June,
pp 17–21Firth, D et al (eds) (1980) Distribution Management Handbook, McGraw-Hill,
LondonForrester (2006) Report on eBusiness, Forrester Research Paper, Cambridge, MAGartner Group (2006) Worldwide B2B Internet Commerce, Gartner Group,
Stamford, CTHammer, M (1996) Beyond Reengineering, Harper Collins, New YorkHolweg, M, Judge, B and Williams, G (2001) The 3DayCar challenge: cars to
customer orders, Logistics and Transport Focus, 3 (9), pp 36–44IMRI (2004) E-retail Sales Index, Interactive Media in Retail Group, LondonJulius, DA (1990) Global Companies and Public Policy, Royal Institute of
International Affairs, LondonLamming, R (1993) Beyond Partnership: Strategies for innovation and lean supply,
Prentice Hall, LondonLennox, RB (1995) Customer service reigns supreme, Materials Management
and Distribution, January, pp 17–22Leontiades, JE (1985) Multinational Business Strategy, DC Heath, Lexington,
MALittle, WI (1977) The cellular flow logistics costing system, International Journal
of Physical Distribution and Materials Management, 7 (6), pp 305–29McKibbin, BN (1982) Centre for Physical Distribution Management national
survey of distribution costs, Focus on Physical Distribution, 1 (1), pp 16–18MRO Software (2001) Supplying the Goods, MRO Software, LondonOffice of National Statistics (2006) UK National Accounts, Stationery Office,
London, www.statistics.gov.ukOhmae, K (1985) Triad Power: The coming shape of global competition, Free Press,
New YorkO’Sullivan, D (1997) ECR – will it end in tears?, Logistics Focus, 5 (7), pp 2–5
Trends in the supply chain � 19

P-E Consulting (1997) Efficient Customer Response: Supply chain management forthe new millennium?, P-E Consulting, Surrey
Poirier, CC and Quinn, FJ (2003) A survey of supply chain progress, SupplyChain Management Review, September/October
Porter, ME (1985) Competitive Advantage, Free Press, New YorkPorter, ME (1996) What is strategy?, Harvard Business Review, November–
December, pp 61–79Prahalad, CK and Hamel, G (1990) The core competencies of the corporation,
Harvard Business Review, May–June, pp 79–91Ray, D (1976) Distribution costing, International Journal of Physical Distribution
and Materials Management, 6 (2), pp 73–107Ray, D, Gattorna, J and Allen, M (1980) Handbook of distribution costing and
control, International Journal of Physical Distribution and Materials Management,10 (5), pp 211–429
Richards, G (2006) Client Satisfaction with 3PL Suppliers, Burman Group,London
Rushton, A (1994) Monitoring logistics and distribution operations, in Logisticsand Distribution Planning, 2nd edn, ed J Cooper, Kogan Page, Londonpp 280–298
Selznick, P (1957) Leadership in Administration, Harper & Row, New YorkShapiro, RD and Heskett, JL (1985) Logistics Strategy, West Publishing, St Paul,
MNStacey, RD (2002) Strategic Management and Organizational Dynamics, 4th edn,
Financial Times Prentice Hall, LondonStafford-Jones, A (1997) Electronic commerce: the future with EDI, Logistics
Focus, 5 (9), pp 9–10Szymankiewicz, J (1997) Efficient customer response: supply chain
management for the new millennium?, Logistics Focus, 5 (9), pp 16–22US Census Bureau (2006) Statistical Abstract of the US, US Census Bureau,
Washington, DC, www.census.govWaters, D (2002) Operations Management, Financial Times Prentice Hall,
HarlowWaters, D (2003) Logistics: An introduction to supply chain management, Palgrave
Macmillan, BasingstokeWorld Trade Organization (WTO) (2005) International Trade Statistics, World
Trade Organization, Geneva
20 � Global logistics

New directions inlogistics
Martin Christopher, Cranfield School of Management
In recent years there has been a growing recognition that the processeswhereby we satisfy customer demands are of critical importance to any orga-nization. These processes are the means by which products are developed,manufactured and delivered to customers and through which the continuingservice needs of those customers are met. The logistics concept is the threadthat connects these crucial processes and provides the basis for the design ofsystems that will cost-effectively deliver value to customers.
Accompanying this recognition of the importance of process has been afundamental shift in the focus of the business towards the marketplace andaway from the more inwardly oriented production and sales mentality thatpreviously dominated most industries. This change in orientation has necessi-tated a review of the means by which customer demand is satisfied – hencethe dramatic upsurge of interest in logistics as a core business activity.
The emergence of the value-conscious customer
Recession in many markets, combined with new sources of competition, hasraised the consciousness of customers towards value. ‘Value’ in today’scontext does not just mean value for money – although that is certainly acritical determinant of the purchase decision for many buyers – but it alsomeans perceived benefits. Customers increasingly are demanding products
21
2

22 � Global logistics
with added value, but at lower cost, and hence the new competitive imper-ative is to seek out ways to achieve precisely that.
Michael Porter (1980, 1985) was one of the first commentators to highlightthe need for organizations to understand that competitive success could onlycome through cost leadership or through offering clearly differentiatedproducts or services. The basic model is illustrated in Figure 2.1. Porter ’sargument was that a company with higher costs and no differentialadvantage in the eyes of the customer was in effect a commodity supplierwith little hope of long-term success unless it could find a way out of the box.His prescription was that the organization should seek to become either a low-cost producer or a differentiated supplier.
However, in reality it is not sufficient to compete only on the basis of beingthe lowest-cost supplier. The implication of this is that a competitor in thebottom right-hand corner has to compete on price – if a company is only a costleader, how else can it compete? Competing solely in terms of price willmerely reinforce the customer’s view that the product is a commodity – thevery thing the company wishes to avoid. On the other hand, a strategy basedupon differentiation will make it possible to compete on grounds other thanprice. Whilst value for money will always be an issue, the aim is to increasecustomers’ perception of the value they are receiving and hence their will-ingness to pay a higher price.
Organizations create value for their customers either by increasing the levelof ‘benefit’ they deliver or by reducing the customers’ costs. In fact customervalue can be defined as follows:
Figure 2.1 The competitive options
High
Low
HighLow
Value added
Cost and value leader
Commodity Cost leader
Increasing differentiation
Increasing cost advantage

Customer value =Perceived benefits
Total cost of ownership
Perceived benefits include the tangible, product-related aspects as well as theless tangible, service-related elements of the relationship.
The key point to note is that these benefits are essentially perceptual andthat they will differ by customer. The ‘total cost of ownership’ reflects all thecosts associated with the relationship, not just the price of the product. Hencethe customer’s cost of carrying inventory, ordering costs and other transac-tions costs all form part of this total cost concept.
Because logistics management, perhaps uniquely, can impact upon boththe numerator and the denominator of the customer value equation, it canprovide a powerful means of enhancing customer value.
An argument that is being heard more frequently is that logistics is a corecapability that enables the firm to gain and maintain competitive advantage.More and more the view is expressed (Stalk, Evans and Shulman, 1992) that itis through capabilities that organizations compete. These capabilities includesuch processes as new product development, order fulfilment, marketingplanning and information systems. There can be little doubt that companiesthat in the past were able to rely upon product superiority to attain marketleadership can no longer do so, as competitive pressure brings increasingtechnological convergence. Instead these companies must seek to developsystems that enable them to respond more rapidly to customer requirementsat ever lower costs.
Logistics and supply chain management
Logistics management is essentially an integrative process that seeks tooptimize the flows of materials and supplies through the organization and itsoperations to the customer. It is essentially a planning process and an infor-mation-based activity. Requirements from the marketplace are translated intoproduction requirements and then into materials requirements through thisplanning process.
It is now being recognized that, for the real benefits of the logistics conceptto be realized, there is a need to extend the logic of logistics upstream tosuppliers and downstream to final customers. This is the concept of supplychain management.
Supply chain management is a fundamentally different philosophy ofbusiness organization and is based upon the idea of partnership in themarketing channel and a high degree of linkage between entities in thatchannel. Traditional models of business organization were based upon thenotion that the interests of individual firms are best served by maximizingtheir revenues and minimizing their costs. If these goals were achieved by
New directions in logistics � 23

disadvantaging another entity in the channel, then that was the way it was.Under the supply chain management model the goal is to maximize profitthrough enhanced competitiveness in the final market – a competitivenessthat is achieved by a lower cost to serve, achieved in the shortest time-framepossible. Such goals are only attainable if the supply chain as a whole is closelycoordinated in order that total channel inventory is minimized, bottlenecksare eliminated, time-frames compressed and quality problems eliminated.
This new model of competition suggests that individual companiescompete not as company against company, but rather as supply chain againstsupply chain. Thus the successful companies will be those whose supplychains are more cost-effective than those of their competitors.
What are the basic requirements for successful supply chain management?Figure 2.2 outlines the critical linkages that connect the marketplace to thesupply chain.
The key linkages are between procurement and manufacturing, andbetween manufacturing and distribution. Each of these three activities, whilepart of a continuous process, has a number of critical elements.
Procurement
Typically in the past, supply management has been paid scant attention inmany companies. Even though the costs of purchases for most businesses arethe largest single cost, procurement has not been seen as a strategic task. Thatview is now changing, as the realization grows that not only are costs dramat-ically impacted by procurement decisions and procedures but also that inno-vation and response-to-market capability are profoundly affected by supplierrelationships.
The philosophy of co-makership is based upon the idea of a mutually bene-ficial relationship between supplier and buyer, instead of the more traditionaladversarial stance that is so often encountered. With this partnership
24 � Global logistics
Figure 2.2 Critical linkages in the supply chain
PROCUREMENT
MANUFACTURING
DISTRIBUTION
Co-makership Requirements planning Schedule coordination
Master scheduling JIT management Flexibility
Demand management Quick response Postponement

approach, companies will identify opportunities for taking costs out of thesupply chain instead of simply pushing them upstream or downstream.Paperwork can be eliminated, problems jointly solved, quality improved andinformation shared. By its very nature, co-makership will often involvelonger-term relationships, but with fewer suppliers.
A fundamental feature of this integrated approach to supply chainmanagement is the adoption of some form of alignment and synchronizationof the customer’s and the supplier’s processes.
The aim should be to view your suppliers’ operations as merely anextension of your own. Companies like Nissan, in their UK manufacturingfacility, have developed closely linked systems with all of their suppliers sothat those suppliers have full visibility not only of the production schedule atNissan’s Washington plant, but also of the real-time sequence in which carsare moving down the assembly line. By the use of electronic data interchange(EDI) and open communications, Nissan has been able to reduce lead times,eliminate inventories and take costs out of the supply chain. Other companiesmay have introduced similar JIT systems, but often, in so doing, have addedto their suppliers’ costs, not reduced them.
Manufacturing
There has been much talk of ‘lean’ manufacturing over the last decade(Womack, Jones and Roos, 1990). The idea of leanness in this sense is thatwasteful activities are reduced or eliminated and that value-creatingprocesses are performed more quickly. However, just as important as leannessis agility. Agility is a wider supply chain concept that is more concerned withhow the firm responds to changes in marketplace requirements – particularlyrequirements for volume and variety. Leanness is undoubtedly a desirablefeature of a supply chain unless it leads to a misplaced emphasis on manufac-turing costs. It may be preferable, for example, to incur a cost penalty in theunit cost of manufacture if it enables the company to achieve higher levels ofcustomer responsiveness at less overall cost to the supply chain.
The key word in manufacturing in today’s environment is flexibility – flexi-bility in terms of the ability to produce any variant in any quantity, withoutsignificant cost penalty, has to be the goal of all manufacturing strategies. Inthe past, and even still today, much of the thinking in manufacturing wasdominated by the search for economies of scale. This type of thinking led tolarge mega-plants, capable of producing vast quantities of a standardizedproduct at incredibly low unit costs of production. It also has led manycompanies to go for so-called ‘focused factories’, which produce a limitedrange of products for global consumption.
The downside of this is in effect the possibility of hitting the ‘diseconomies’of scale: in other words, the build-up of large inventories of finished product
New directions in logistics � 25

ahead of demand, the inability to respond rapidly to changed customerrequirements and the limited variety that can be offered to the customer.Instead of economies of scale, the search is now on for strategies thatwill reduce total supply chain costs, not just manufacturing costs, andthat will offer maximum flexibility against customer requirements. The goalmust be ‘the economic batch quantity of one’, meaning that in the ideal worldwe would make things one at a time against known customer demands.
One of the lessons that the Japanese have taught us is that the route to flex-ibility in manufacturing does not necessarily lie through new technology, egrobotics, although that can help. A lot can be achieved instead throughfocusing upon the time it takes to plan, to schedule, to set up, to change overand to document. These are the classic barriers to flexibility and if they can beremoved then manufacturing can respond far more rapidly to customerrequirements. In a factory with zero lead times, total flexibility is achievedwith no forecasts and no inventory! Whilst zero lead times are clearly animpossibility, the Japanese have shown that impressive reductions in suchlead times can be achieved by questioning everything we do and the way inwhich we do it.
Distribution
The role of distribution in the supply chain management model has extendedconsiderably from the conventional view of the activity as being concernedsolely with transport and warehousing. The critical task that underliessuccessful distribution today is demand management.
Demand management is the process of anticipating and fulfilling ordersagainst defined customer service goals. Information is the key to demandmanagement: information from the marketplace in the form of medium-termforecasts; information from customers, preferably based upon actual usageand consumption; information on production schedules and inventorystatus; and information on marketing activities such as promotions that maycause demand to fluctuate away from the norm.
Clearly, while forecasting accuracy has always to be sought, it must berecognized that it will only rarely be achieved. Instead the aim should be toreduce our dependence upon the forecast by improved information ondemand and by creating systems capable of more rapid response to thatdemand. This is the principle that underlies the idea of quick response logistics.
Quick response logistics has become the aim for many organizations,enabling them to achieve the twin strategic goals of cost reduction and serviceenhancement. In essence, the idea of quick response is based upon a replen-ishment-driven model of demand management. In other words, as items areconsumed or purchased, this information is transmitted to the supplier andthis immediately triggers a response. Often more rapid, smaller consignment
26 � Global logistics

quantity deliveries will be made, the trade-off being that any higher transportcosts will be more than covered by reduced inventory in the pipeline and ateither end of it, yet with improved service in terms of responsiveness. Clearlyinformation technology has been a major enabling factor in quick responselogistics, linking the point of sale or consumption with the point of supply.
A further trend that is visible in distribution is the search for postponementopportunities. The principle of postponement is that the final configurationor form of the product should be delayed until the last possible moment. Inthis way maximum flexibility is maintained, but inventory minimized. Thedistribution function takes on a wider role as the provider of the final addedvalue. For example, at Xerox the aim is not to hold any inventory as finishedproduct but only as semi-finished, modular work in progress, awaiting finalconfiguration once orders are received. Similarly, at Hewlett Packard,products are now designed with ‘localization’ in mind. In other wordsproducts will be designed for modular manufacture but with local assemblyand customization to meet the needs of specific markets. In this wayeconomies of scale in manufacturing can be achieved by producing genericproducts for global markets whilst enabling local needs to be met throughpostponed configuration.
What is apparent is that distribution in the integrated supply chain has nowbecome an information-based, value-added activity, providing a critical linkbetween the marketplace and the factory.
The new competitive framework: the four Rs
We began this chapter with a brief review of how today’s customer is increas-ingly seeking added value and how logistics management can provide thatvalue. In the past, the primary means of achieving competitive advantagewere often summarized as the ‘four Ps’ – product, price, promotion and place.These should now be augmented with the ‘four Rs’ – reliability, respon-siveness, resilience and relationships – and logistics strategies need to beformulated with these as the objectives. Let us briefly examine each in turn.
ReliabilityIn most markets and commercial environments today, customers are seekingto reduce their inventory holdings. Just-in-time practices can be found inindustries as diverse as car assembly and retailing. In such situations it isessential that suppliers can guarantee complete order-fill delivered at agreedtimes. Hence a prime objective of any logistics strategy must be reliability.
Making logistics systems more reliable means that greater emphasis mustbe placed upon process design and process control. The processes that areparticularly germane to logistics are those to do with order fulfilment and
New directions in logistics � 27

supply chain management. Because traditionally these processes have beenmanaged on a fragmented, functional basis they tend to have a higher suscep-tibility to variability. These processes are typified by multiple ‘hand-offs’ fromone area of functional responsibility to another and by bottlenecks at theinterfaces between stages in the chain. One of the benefits of taking a processview of the business is that it often reveals opportunities for simplificationand the elimination of non-value-adding activities so that reliability inevitablyimproves.
One of the main causes of unreliability in supply chain processes is perfor-mance variability. Recently, the use of so-called ‘Six Sigma’ methodologies hasbeen adopted to reduce that variability. Six Sigma is the umbrella termapplied to a range of tools that are designed to identify the sources of vari-ability in processes and to reduce and control that variability.
ResponsivenessVery closely linked to the customers’ demands for reliability is the need forresponsiveness. Essentially this means the ability to respond in ever-shorterlead times with the greatest possible flexibility. Quick response, as we haveseen, is a concept and a technology that is spreading rapidly across industries.For the foreseeable future, speed will be a prime competitive variable in mostmarkets. The emphasis in logistics strategy will be upon developing themeans to ship smaller quantities, more rapidly, direct to the point of use orconsumption.
The key to time compression in the logistics pipeline is through the elimi-nation or reduction of time spent on non-value-adding activities. Hence,contrary to a common misconception, time compression is not aboutperforming activities faster, but rather performing fewer of them. The oldcliché ‘Work smarter, not harder’ is particularly relevant in this context.
As Hammer and Champy (Hammer, 1990; Hammer and Champy, 1993)have pointed out, many of the processes used in our organizations weredesigned for a different era. They tend to be paper-based, with many – oftenredundant – manual stages. They are sequential and batch-oriented ratherthan parallel and capable of changing quickly from one task to another. Eventhough eliminating or reducing such activities may increase cost, the endresult will often be more cost-effective. For example, shipping direct fromfactories to end customers may be more expensive in terms of the unit cost oftransport compared to shipping via a regional distribution centre, but timespent in the distribution centre is usually non-value-adding time.
ResilienceToday’s supply chains are more complex and vulnerable to disruption thanever before. In many cases, as a result of outsourcing and the increasingly
28 � Global logistics

global nature of supply chains, the likelihood of interruption to product andinformation flows has increased significantly.
Identifying, mitigating and managing supply chain risk is now a criticalrequirement to ensure business continuity. The idea of resilience in the contextof supply chain management is that supply chains need to be able to absorbshocks and to continue to function even in the face of unexpected disruption.
The paradox is that in many cases because companies have adopted ‘lean’strategies and reduced inventories and, often, capacity there is little ‘slack’ leftin their systems. Resilient supply chains will typically incorporate strategicbuffers at the critical nodes and links in their networks. These buffers could bein the form of inventory or capacity, possibly shared with competitors.
As uncertainty in the business environment continues to increase, organiza-tions need to adopt a more systematic and structured approach to supply chainrisk management. One way in which this can be achieved is by creating a supplychain continuity team whose job is to audit risk across the supply chain and todevelop and implement strategies for the mitigation of any identified risk.
RelationshipsThe trend towards customers seeking to reduce their supplier base hasalready been commented upon. The concept of ‘strategic sourcing’ is nowreceiving widespread support. Strategic sourcing is based on the carefulselection of suppliers whom the customer wishes to partner. The benefits ofsuch an approach include improved quality, innovation sharing, reducedcosts and the integrated scheduling of production and deliveries. Underlyingall of this is the idea that buyer–supplier relationships should be based uponpartnership. More and more companies are discovering the advantages thatcan be gained by seeking out mutually beneficial, long-term relationshipswith suppliers. From the suppliers’ point of view, such partnerships can proveformidable barriers to entry to competitors. Once again, companies arefinding that logistics provides a powerful route to the creation of partnershipsin the marketing channel. Logistics management should be viewed as thethread that connects the inbound and outbound flows of channel partners.
A good example of logistics partnership is the growing use of ‘vendor-managed inventory’ (VMI). The underlying principle of VMI is that thesupplier rather then the customer assumes responsibility for the flow ofproduct into the customer’s operations. Thus instead of the customer placingorders on the vendor – often at short notice – the vendor can directly accessinformation relating to the rate of usage or sale of the product by thecustomer. With this information the supplier can better plan the replen-ishment of the product with less need to carry safety stock. In effect, VMIenables the substitution of information for inventory in the supply chain.
The challenge to marketing and strategic planning in any business is toconstruct a corporate strategy that specifically builds upon logistics as a
New directions in logistics � 29

means to achieving competitive advantage through a much stronger focus onthe four Rs. It is still the case that many organizations have not fully under-stood the strategic importance of logistics and hence have not explicitlytailored logistics into their corporate strategies and their marketing plans.
The organizational challenge
One of the most significant changes in recent years has been the way in whichwe think of organization structures. Conventionally, organizations have been‘vertical’ in their design. In other words, businesses have organized aroundfunctions such as production, marketing, sales and distribution. Eachfunction has had clearly identified tasks and within these functional ‘silos’ or‘stovepipes’ (as they have been called) there is a recognized hierarchy upwhich employees might hope to progress. Figure 2.3 illustrates this func-tionally oriented business.
The problem with this approach is that it is inwardly focused and concentratesprimarily on the use of resources rather than upon the creation of outputs. Theoutputs of any business can only be measured in terms of customer satisfactionachieved at a profit. Paradoxically, these outputs can only be realized throughcoordination and cooperation horizontally across the organization. These hori-zontal linkages mirror the materials and information flows that link thecustomer with the business and its suppliers. They are in fact the core processes ofthe business. Figure 2.4 highlights the fundamental essence of the horizontalorganization.
30 � Global logistics
Figure 2.3 The vertical/functional organization
PURCHASING PRODUCTION DISTRIBUTION
Functional ‘silos’ or ‘stovepipes’
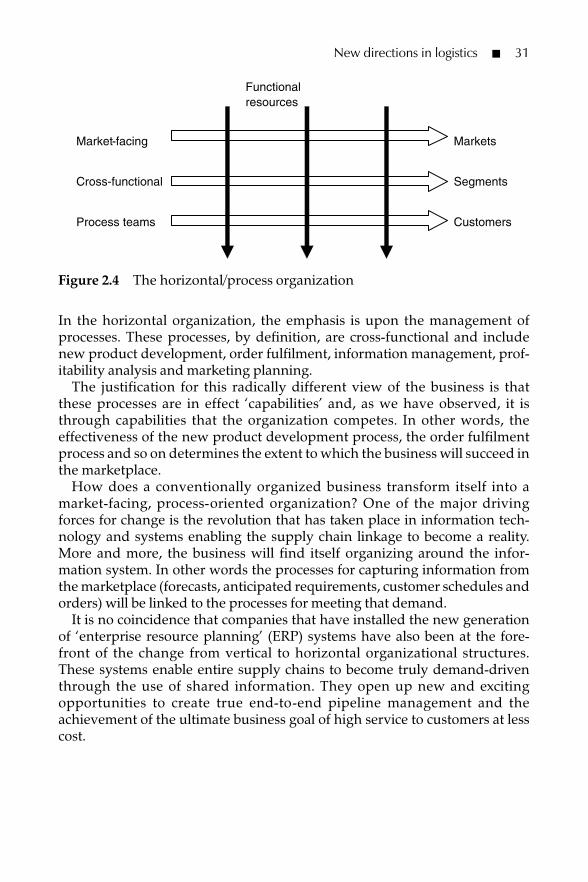
In the horizontal organization, the emphasis is upon the management ofprocesses. These processes, by definition, are cross-functional and includenew product development, order fulfilment, information management, prof-itability analysis and marketing planning.
The justification for this radically different view of the business is thatthese processes are in effect ‘capabilities’ and, as we have observed, it isthrough capabilities that the organization competes. In other words, theeffectiveness of the new product development process, the order fulfilmentprocess and so on determines the extent to which the business will succeed inthe marketplace.
How does a conventionally organized business transform itself into amarket-facing, process-oriented organization? One of the major drivingforces for change is the revolution that has taken place in information tech-nology and systems enabling the supply chain linkage to become a reality.More and more, the business will find itself organizing around the infor-mation system. In other words the processes for capturing information fromthe marketplace (forecasts, anticipated requirements, customer schedules andorders) will be linked to the processes for meeting that demand.
It is no coincidence that companies that have installed the new generationof ‘enterprise resource planning’ (ERP) systems have also been at the fore-front of the change from vertical to horizontal organizational structures.These systems enable entire supply chains to become truly demand-driventhrough the use of shared information. They open up new and excitingopportunities to create true end-to-end pipeline management and theachievement of the ultimate business goal of high service to customers at lesscost.
New directions in logistics � 31
Figure 2.4 The horizontal/process organization
Functional resources
Market-facing
Cross-functional
Process teams
Markets
Segments
Customers

Summary
� Businesses in all types of industries are placing far greater emphasis on thedesign and management of logistics processes and the integration of thoseprocesses upstream and downstream with those of suppliers and customers.
� The business of the future will undoubtedly be market-driven, withlogistics processes providing a critical means for achieving corporate goals.
� It will be a highly coordinated network of outsourced flows of materialsand supplies, integrated through an information system that reaches fromthe ultimate consumer to the far end of the supply chain.
� The era of logistics and supply chain management, which many havepredicted for some time, seems finally to have arrived.
References
Hammer, M (1990) Re-engineering work: don’t automate, obliterate, HarvardBusiness Review, July/August pp 104–12
Hammer, M and Champy, J (1993) Reengineering the Corporation, HarperCollins,New York
Porter, M (1980) Competitive Strategy, Free Press, New YorkPorter, M (1985) Competitive Advantage, Free Press, New YorkStalk, G, Evans, P and Shulman, LE (1992) Competing on capabilities: the new
rules of corporate strategy, Harvard Business Review, March/April pp 56–68Womack, J, Jones, D and Roos, D (1990) The Machine that Changed the World,
Macmillan, London
32 � Global logistics

Formulating logisticsstrategy
Nathalie Fabbe-Costes and Jacques Colin,Université de la Méditerranée, Aix–Marseille
Why formulate logistics strategies?
Commercial and industrial organizations can be thought of as systems ofoperational processes structured and regulated by a set of functions that canbecome strategic. They are currently the object of intense environmental pres-sures. Never have these been so diverse, disrupting previous equilibriumsand calling for rapid and coherent responses (as shown in Figure 3.1).
The multiplicity of corporate responses implies coordination and inte-gration in a clearly defined strategy. Indeed, only through the use of strategycan this ‘art of using information obtained in operating, integrating it, quicklyformulating plans of action and having the ability to gather a maximum ofcertainties in order to confront the uncertain’ (Morin, 1990) overcome theextreme environmental instability that appears to be characterizing the newmillennium. Strategy enables companies to formulate and achieve their objec-tives, allowing them to take advantage of opportunities as they arise, whileremaining in tune with their environment.
An essential priority today is an understanding of logistics and supplychain management (SCM). Logistics – defined as the control of the physicalflow of materials and goods by the related virtual information flow that a firmsends, transfers and receives – is an organizational function that can conserveand improve the flexibility and reactivity of the firm to its environment.
33
3

34 � Global logistics
Logistics also leads companies to think about the whole supply chains theyare involved in, and to try to improve both their own performance and theperformance of the broader process. Firms now try to develop a collaborativeapproach within supply chain management, defined as ‘a network of firmsinteracting to deliver product or service to the end consumer, linking flowsfrom raw material supply to final delivery’ (Ellram, 1991). More precisely,‘supply chain management is the integration of key business processes fromend user through original suppliers that provide products, services, and infor-mation that add value for customers and other stakeholders’ (Lambert,Cooper and Pagh, 1998).
To satisfy its ideal objectives of continuity (preventing stock-out) andfluidity (limiting overcapacity), logistics has progressively left behind its
Figure 3.1 Corporate responses to environmental pressures includinglogistics dimensions
Marketing
Finance
Logistics
Human
resources
Research and development
Information system and IT management
Conception Purchasing Production Distribution
After-sales service Salvage
Globalization of markets and broadening of competition
Growth and/or uncertainty of the costs of energy, labour and money
Deregulation, opening of borders
Breaking up of uncertain, volatile and demanding markets that become saturated
Environmental and consumer lobbies, shareholder and stakeholder pressures
Spreading of electronic and information technologies, power of the media
Cost control Creation of value added
Elevation of services levels by integrating functions and
processes
Concentration of firms, consolidation of know-how,
internally and/or by developing coordination and/or alliances
through supply chainmanagement
Downstream piloting and development of an
agile just-in-time model with individual responses for the
market and reduction of inventories
Reliability of sustainable networks that become both efficient and vulnerable (hazards, risks,
uncertainty…)
Spatial distribution of activities on a continental or global scale and dynamic
resources management
Development of electronic data interchange between and with all the
firm’s partners (internal and external)
Environmental pressures
Corporate responses
Corporate system
Operational processes
Function that coordinates operational processes within their own field and that could become strategic
LEGEND

original operational role, which was a combination of transport, handling andwarehousing operations. The concept of a supply chain enables firms tocontrol the information flow from downstream to upstream, and to optimize(in terms of cost and level of service) the whole physical movement that isinitiated by demand pull. The field of logistics has, therefore, considerablybroadened (as illustrated in Figure 3.2) and it has become one of the mostsignificant driving forces for organizational change.
The process-oriented perspective of logistics – that cuts across the tradi-tional vertical functions of the organization – has been a powerful stimulatorfor change. This movement began early in the 1990s, contributing to a broadapproach of process-based management (Davenport and Short, 1990;Hammer, 1990) that was often combined with ideas such as lean management(Womack, Jones and Roos, 1990), total quality management (Shiba, Grahamand Walden, 1993) and time-based competition (Stalk and Hout, 1990). In themid-1990s firms took a re-engineering perspective and considered that mostprocesses had to be completely redesigned – thinking differently about thedesign/manufacturing/distribution/after-sales service/recycling process, witha complete redefinition of partners’ role as well as a reconfiguration of infor-mation systems. For many companies, logistics became a key process and astrategic capability (Stalk, Evans and Shulman, 1992). Logistics was not just atool for the global strategy of a company, but also the source of innovativenew strategies.
Logistics has now become a far-reaching ‘total’ intra- and inter-organiza-tional approach, which is both transverse and very ambitious, and where
Formulating logistics strategy � 35
Figure 3.2 Evolution of the field of action of logistics
Adapted from Mathe, Colin and Tixier,1983; Tixier, Mathe and Colin, 1996
Level of logistics integration
+
Conception Purchasing Production Distribution After-sales Salvage service
Distributionlogistics
Integratedlogistics
Integratedlogisticssupport
Totallogistics
Operational processes

skills are applied at the interfaces between the various operational processes(see Figure 3.2). Its main role is to synchronize physical flows, and it is inpermanent interaction with all the classic functions of a firm, forming anactive interface between the firm and its environment. In practice, the aim oflogistics and supply chain management is to optimize the three flowsinvolved in supply chains: ‘the flow of goods from sources to end-consumers,the flow of funds to satisfy the market needs at minimum costs, the flow ofinformation to respond to customer requirements efficiently and effectively’(European Commission, 1999).
It is paradoxical that, while the environmental pressures shown in Figure3.1 are not specific to logistics, the same cannot be said about the responsesthat firms in most sectors must make. The design of their responses concealsoptions that imply a logistics approach. For challenges that are not specificallylogistic, the firm designs solutions and strategies that are, or that become,based on logistics (see Cohen and Roussel (2005) for examples).
The profound transformations that have taken place in the structure offirms, as well as the extension of their activities, have confirmed the need fora strategic approach to logistics. Its aim is to give a better response toconsumers and to control the areas where the firm operates, the timing ofthese operations, their value creation and, finally, the inherent risksinvolved in the firm’s choices.
How can we identify the strategic projects in which logistics can play a keyrole? To answer this question in a creative way, we have to propose an inno-vative approach to strategy formulation.
A conceptual approach to formulating logisticsstrategy
From logistics Strategy to strategic LogisticsThe classic approach to formulating a logistics strategy begins with the firm’soverall strategy and then defines the logistics strategy that will enable it toreach its objectives. Logistics is thus conceived as a functional support systemand a tool for achieving the global strategy; logistics strategy appears as asubset of the overall strategy. The control of the flow of materials and goodsalong the supply chain constitutes a key factor for success in numerousdomains, which justifies this top-down approach.
However, logistics also opens new strategic lines of action. To formulatethese new lines, we have to reverse the classic approach, to think strategicLogistics (sL) rather than logistics Strategy (lS).
strategic Logistics consists of imagining and developing strategic actionsthat would be impossible without strong logistics competence. From being akey factor for success, logistics is becoming a fully competitive advantage –
36 � Global logistics
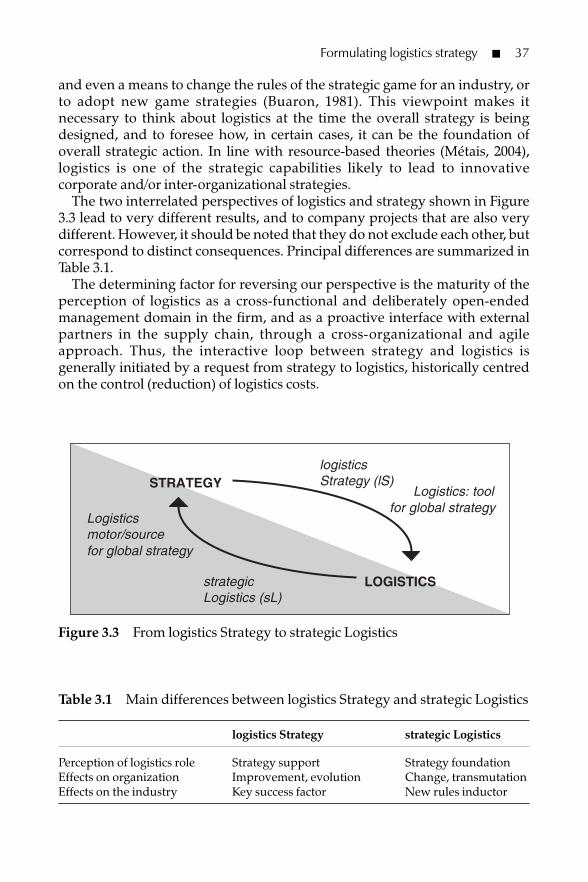
and even a means to change the rules of the strategic game for an industry, orto adopt new game strategies (Buaron, 1981). This viewpoint makes itnecessary to think about logistics at the time the overall strategy is beingdesigned, and to foresee how, in certain cases, it can be the foundation ofoverall strategic action. In line with resource-based theories (Métais, 2004),logistics is one of the strategic capabilities likely to lead to innovativecorporate and/or inter-organizational strategies.
The two interrelated perspectives of logistics and strategy shown in Figure3.3 lead to very different results, and to company projects that are also verydifferent. However, it should be noted that they do not exclude each other, butcorrespond to distinct consequences. Principal differences are summarized inTable 3.1.
The determining factor for reversing our perspective is the maturity of theperception of logistics as a cross-functional and deliberately open-endedmanagement domain in the firm, and as a proactive interface with externalpartners in the supply chain, through a cross-organizational and agileapproach. Thus, the interactive loop between strategy and logistics isgenerally initiated by a request from strategy to logistics, historically centredon the control (reduction) of logistics costs.
Formulating logistics strategy � 37
logistics Strategy (lS)
strategic Logistics (sL)
Logistics motor/source for global strategy
Logistics: tool for global strategy
STRATEGY
LOGISTICS
Figure 3.3 From logistics Strategy to strategic Logistics
Table 3.1 Main differences between logistics Strategy and strategic Logistics
logistics Strategy strategic Logistics
Perception of logistics role Strategy support Strategy foundationEffects on organization Improvement, evolution Change, transmutationEffects on the industry Key success factor New rules inductor

The experience, know-how and systems developed in logistics then retro-act on the strategy, becoming the instigator of its (re)formulation, enabling thefirm to differentiate itself by logistics services, or even diversifying in logisticsactivities. It also increases the flexibility and agility of companies to redesigntheir network within a supply chain management (SCM) process.
Finally, strategic Logistics formulations emerge from this iterative strategy/logistics loop, which becomes a ‘progress spiral’ (Martinet, 1983) for the firm.The purpose of this loop is to have a logistics organization that is adapted tothe firm’s objectives (lS – with logistics fitting strategy) and to be able toidentify, exploit or even create opportunities for the firm (sL – where strategyis intentionally built on logistics). This loop also encourages learning in bothstrategic and logistics domains. In particular, it encourages the developmentof strategic Logistics competencies that are necessary for strategic Logistics.
Logistics competence: a strategic resource and capabilityLogistics depends on three interrelated dimensions of competence: action,expertise and knowledge (Fabbe-Costes, 1997). Figure 3.4 illustrates the inter-relationship between the three dimensions of competence. An upward arrow
38 � Global logistics
From Fabbe-Costes, 1997
Figure 3.4 Interrelationship between the three dimensions of competence
EXPERTISE
KNOWLEDGE
ACTION
Demand and/or effect between two dimensions of competence
The logistical operating process and physical flow
The cross-dimension of information management
Emergence/ demand
Development/change
Information management
Logistics flow/external demands

signifies a demand from a lower dimension, while a downward arrow repre-sents the effect of higher-level knowledge on expertise and, in turn, operatingprocedures and processes.
Action relates to the way in which logistics processes are actuallyperformed. Expertise relates to all the resources directly associated with theaction, including methods, procedures, organizational routines, technologiesand engineering. They strongly influence the quality, efficiency, durabilityand reliability of the logistics process and are a major source of competitiveadvantage. Knowledge represents the highest level of abstraction in logisticsmanagement. It is high-level information that must be collected, assessed andassimilated while formulating strategy. It incorporates the experience ofsenior managers, and the general management culture of the business.Knowledge is a key factor to survival, evolution and adaptation; it compelscompanies to invest in high-level management skills and in research anddevelopment – and to try to convert everything that is experienced andperceived by people in the company and in the logistics network intoknowledge. Intrinsic to the development of logistics competence is infor-mation management. The need for effective collection, communication andprocessing of information exists at each level. The information collected,created and memorized at each tier enriches strategic decision making andcan encourage new strategic directions.
Towards logistics Strategy formulationThe strategic formulation of logistics can be expressed by three classicconcepts of strategy: the profession, the mission and the objectives. Inconcrete terms, to formulate a logistics Strategy, managers define:
� the ranges of movement that it produces and how it produces them (tech-nologies, know-how, organization);
� to whom they are directed (internal or external clients) and the needs thatthey satisfy;
� the kind of performance it aims at and the targeted level of that performance.
Consequently, this formulation can identify several sectors of logistics activity,or ‘logistics business units’, which are more or less synergistic. Among them,some can be considered as supports for the firm’s overall strategy (lSperspective), while others can be drivers of its strategy (sL perspective).
Formulation is then oriented to the choice of logistics business units and theassociated organizational solutions to adopt in order to reach defined objec-tives. As a transversal function of coordination for all stages of movement andfor the management of both internal and external interfaces, logistics can onlybe efficient if it is linked internally with the other functions and if it coordi-nates externally with the other companies of the supply chain. The options
Formulating logistics strategy � 39

chosen for logistics must be congruent with those in the domains ofmarketing, finance, information systems, manufacturing and humanresources. Ideally, logistics Strategy should be combined with the otherstrategies, and strategic Logistics should use the levers that other functionspresent.
At present, information-system management is certainly the domain that hasthe strongest synergy with logistics. The coincidence of the emergence ofstrategic Logistics and strategic informatics is certainly not accidental. It can beexplained by the overlapping of physical and informational flows (the pilotingand monitoring concept), to which we can associate financial flows. It could alsobe explained by the transversality and the outward view of logistics and infor-mation communication systems, as well as by the dynamic character of themanagement processes that they support. In addition, the control and trace-ability of physical and informational flow develops and supports the flexibilityand adaptability that is now indispensable. Information and communicationsystems, supported by new technologies, become a cornerstone of logisticsmanagement, and each firm looks for a better integration of informationsystems (Fabbe-Costes, 2002). Most companies try to develop inter-organiza-tional information systems ‘supporting cooperative, intraorganizational andinterorganizational, functional teams’ (Konsynski, 1993).
The formulation of logistics Strategy also deals with make-or-buy deci-sions. The decision to subcontract or, on the contrary, to (re)integrate logisticsactivities is contingent on several factors. First, it depends on the situation ofthe logistics supply industry at the time the question arises. It also dependson the shipper ’s perception of the relative risks and benefits of the twooptions. Moreover, this dilemma usually only arises when a shipper isconducting a strategic review of its logistical system. Discussions withEuropean shippers have revealed that some logistics operations are morelikely to be kept in-house, or reintegrated, than others (Fabbe-Costes andColin, 1995). The choice is a burning issue for shippers when they consideroperations that:
� directly concern customer services – the more an operation affects theshipper’s customer, the more it is seen to be sensitive, confirming thatlogistics has become a strategic marketing element for many manufac-turing and retailing companies;
� require the handling of information thought to be ‘strategic’ – usuallypertaining to customers and/or cost structure and/or core expertise;
� can be considered ‘critical’ in the shipper’s logistics process (in terms oftheir service and/or logistics costs) or, more precisely, operations in whichsecurity is more important than flexibility;
� do not require a large amount of new investment, particularly those forwhich physical or information systems have already been set up withinthe company;
40 � Global logistics

� offer a rapid rate of return on investment in logistics assets;� require highly specific investment and that logistics service providers –
especially those providing mainly shared-user services – find difficult torun profitably;
� do not require staff with a different culture from that already prevailing inthe company;
� require highly specific skills, not available from a logistics supplier.
The strategic (or non-strategic) character of a logistics organization providesinformation on the originality and confidentiality required for the necessaryknow-how, the expected reliability and agility of the processes, and thesignificance of the planned organization. In the cases of delegated operationsor organizations, it defines the means required to ensure control and toimprove relationships. It, therefore, creates networks of complementary skillsand ensures their consistency.
Illustrated typology of possible logistics strategies
To illustrate the conceptual approach to strategy formulation for logistics, wehave selected case studies of distributors, manufacturers and logistics firms(also called logistics service providers or third-party logistics companies).They represent a variety of strategies. Our typology (presented in Table 3.2)contains seven classic, generic strategies and considers strategic formulationsfrom both perspectives described in Figure 3.3. The generic strategies are in
Formulating logistics strategy � 41
Table 3.2 Typology of logistic Strategies and strategic Logistics
Generic strategy logistics Strategy strategic Logistics
Cost leadership Reduce logistics costs Reduce overall costswith logistics
Differentiation Quality of logistics service Logistics factor ofdifferentiation
Innovation Logistics support for innovation Logistics as a source/motor for innovation
Alliance Logistics as a means of alliance Logistics as a source/motor for alliance
Profession expansion Logistics as a support for new Logistics as a newprofession integration profession
Mission expansion Logistics as a support for Logistics in order toextension win new clients
Diversification Use of logistics synergies Diversifying throughor in logistics
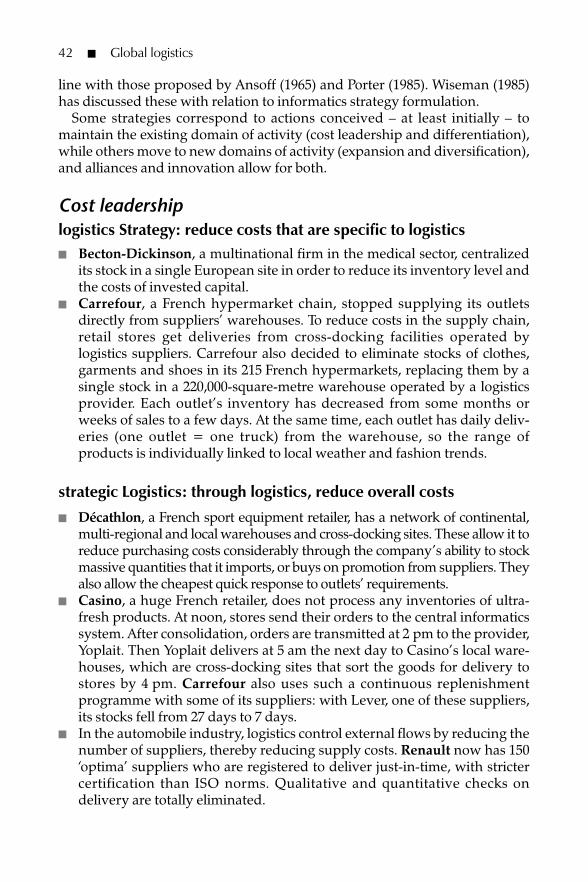
line with those proposed by Ansoff (1965) and Porter (1985). Wiseman (1985)has discussed these with relation to informatics strategy formulation.
Some strategies correspond to actions conceived – at least initially – tomaintain the existing domain of activity (cost leadership and differentiation),while others move to new domains of activity (expansion and diversification),and alliances and innovation allow for both.
Cost leadershiplogistics Strategy: reduce costs that are specific to logistics� Becton-Dickinson, a multinational firm in the medical sector, centralized
its stock in a single European site in order to reduce its inventory level andthe costs of invested capital.
� Carrefour, a French hypermarket chain, stopped supplying its outletsdirectly from suppliers’ warehouses. To reduce costs in the supply chain,retail stores get deliveries from cross-docking facilities operated bylogistics suppliers. Carrefour also decided to eliminate stocks of clothes,garments and shoes in its 215 French hypermarkets, replacing them by asingle stock in a 220,000-square-metre warehouse operated by a logisticsprovider. Each outlet’s inventory has decreased from some months orweeks of sales to a few days. At the same time, each outlet has daily deliv-eries (one outlet = one truck) from the warehouse, so the range ofproducts is individually linked to local weather and fashion trends.
strategic Logistics: through logistics, reduce overall costs� Décathlon, a French sport equipment retailer, has a network of continental,
multi-regional and local warehouses and cross-docking sites. These allow it toreduce purchasing costs considerably through the company’s ability to stockmassive quantities that it imports, or buys on promotion from suppliers. Theyalso allow the cheapest quick response to outlets’ requirements.
� Casino, a huge French retailer, does not process any inventories of ultra-fresh products. At noon, stores send their orders to the central informaticssystem. After consolidation, orders are transmitted at 2 pm to the provider,Yoplait. Then Yoplait delivers at 5 am the next day to Casino’s local ware-houses, which are cross-docking sites that sort the goods for delivery tostores by 4 pm. Carrefour also uses such a continuous replenishmentprogramme with some of its suppliers: with Lever, one of these suppliers,its stocks fell from 27 days to 7 days.
� In the automobile industry, logistics control external flows by reducing thenumber of suppliers, thereby reducing supply costs. Renault now has 150‘optima’ suppliers who are registered to deliver just-in-time, with strictercertification than ISO norms. Qualitative and quantitative checks ondelivery are totally eliminated.
42 � Global logistics

Differentiationlogistics Strategy: improve the quality of the logistics service� By rationalizing their logistics, Becton-Dickinson, Hewlett-Packard and
many others have improved their performance in terms of quality ofservice, availability of products, complete deliveries, guaranteed deliverytimes and their ability to customize products.
� Philips-Eclairage has a highly automated central warehouse in Paris thatallows it to deliver to clients every day. As wholesalers no longer have tohold more stock than they need between deliveries, they choose to be pref-erentially supplied by Philips.
� Radiall, a supplier of cables and connectors for many industries, had aproblem giving an efficient service to some strategic customers. To survive ina very competitive industry, they decided to differentiate their logisticsprocess to give an appropriate response to strategic customers. Now they runtwo logistics processes and offer a high-standard service to strategic clients.
strategic Logistics: permit an increased differentiation� PSA and Renault have developed just-in-time logistics to feed very
flexible production lines that are capable of assembling vehicles thatconform exactly to client specifications. The Renault Clio, for instance, canbe delivered with options for air-conditioning, power steering, 80 differentmotors, 20 different gearboxes and five different bodies – a total of 32,000combinations, without taking into account the range of paintwork andother options. In 2001, PSA sold 3.1 million cars representing 2.1 milliondifferent ‘references’ – a reference being a model that is assembled in afactory according to the options required by an end customer.
� Since November 1994 Federal Express has been offering customers atracking/tracing service. Shippers can know the location of their parcelsupon request to the website (http://www.fedex.com). The number ofenquiries increased tremendously, reaching 10,000 a day in 1998.
� Hewlett-Packard uses its strong logistics competencies to survive anddevelop in the competitive European PC industry. It completely restruc-tured its logistics processes and can provide customers with a multi-channel distribution system with different levels of logistics service andproduct customization.
Innovationlogistics Strategy: logistics as a support for innovation, logisticsinnovation� La Redoute is a French mail-order firm whose promise of a two-day
delivery service has enlarged its market. This commercial innovation
Formulating logistics strategy � 43

(which has since been widely copied) depends on strong integration ofphysical and information flows – and on automation of the sorting centrecreated by the French postal service.
� To exchange logistics information with its suppliers, the European auto-mobile sector has set up an electronic data interchange (EDI) network –Galia/Odette – which genuinely supports the just-in-time model ofproduction planning. Thanks to EDI, the different actors of the automotiveindustry (car manufacturers, suppliers and logistics providers) share infor-mation related to the whole design, planning, production and deliveryprocess – and can dynamically monitor the supply chain. This integrationis now developing upstream to better link second and third tiers to the firstone, with the Alpha project launched by Galia in October 2004.
� Providing any US customer with highly customized trousers within 48hours was the innovation foreseen by Levi’s USA. To achieve thisobjective, it based a new service on an order-collecting website where youcan design your own product, a flexible and computerized cutting andassembly service that produces every unit upon request, and alliance withan express parcel delivery service. To ensure success, it had to redesign itsoverall supply chain, including the management of stocks, close linkbetween physical and information flows, and use of new technology.
strategic Logistics: logistics as a source or motor for innovation� In the early 2000s, Geodis – a French third-party logistics company with
six business lines related to transport and logistics – wanted to innovate,and in particular to design ‘packaged logistics solutions’. By identifying,mapping and sharing logistics expertise and knowledge among the group,they could build innovative multi-business offers that exploit transfers andsynergies. Thanks to their knowledge from this logistics project (launchedmid-2002) they could also improve their consulting offer.
� Most assembly manufacturers (such as electronic equipment industries)use their logistics competencies, combined with powerful inter-organiza-tional information systems, to develop postponement (to differentiateproducts as late as possible in the supply chain) and to minimize stockswith vendor-managed inventory (VMI) and collaborative planning, fore-casting and replenishment (CPFR). This use of demand pull is more likelyto initiate product innovations that satisfy customers.
� As a major organizational and logistics innovation, efficient consumerresponse (ECR) is now being jointly developed by both industrial andretailer partners in the same supply chain. It enables the two partners tosave as much as 5 per cent of the value of the goods. The systematicsharing of logistics information reduces the average inventories held byeach partner. This joint work becomes a driving force for the two partnersto enhance their cooperation far beyond the field of logistics.
44 � Global logistics

Alliancelogistics Strategy: logistics as a means of alliance� By negotiating a ‘logistics charter’ with its suppliers (signed in 1986), the
PSA Automobile Group sought to stabilize and perpetuate its client–supplier relationships. This logistics charter identifies the rights and dutiesof suppliers in terms of delivery requirements transmitted by PSAfactories. Members of this network become very interdependent, to thepoint where the car maker transfers its skills to the suppliers (concepts fornew parts, quality control at the source, etc). Some suppliers are no longer‘part suppliers’ but have become ‘function suppliers’ (for example,tightness supplier as opposed to rubber joint supplier) and are genuinemembers of the external supply chain of PSA.
� Logistics is a powerful factor for integration in Renault and Nissan sincetheir alliance in 1999. Many logistics synergies (related to supply, cross-manufacturing and international transport, as well as to best practiceexchanges) reinforce the alliance between the two companies.
strategic Logistics: logistics as a source/motor for alliance� By developing its own powerful, centralized logistics system, dedicated to
the stores operated by independent members, the French distributiongroup Intermarché has placed them in a position of total dependence onthe group.
� A branch of Geodis designs and operates advanced warehouses and isspecialized in the synchronized delivery of parts to factories using just-in-time. It is associated with transport partners (inside and outside the GeodisGroup), allowing it to respond to all invitations to tender made by auto-mobile and aeronautical manufacturers. Its expertise in logistics gives acompetitive advantage to maintain sustainable partnerships with carmakers and first-tier suppliers.
� Geodis and SITA have created a joint venture – Valogistic – that specializesin waste electrical and electronic equipment (WEEE) and products from theautomotive repair and maintenance business. This operates at a Europeanlevel and pools logistics skills and networks of the two companies.
Expansion by professionlogistics Strategy: logistics as a support for integration� Integrators (formerly messenger services) have become express delivery
services by integrating various activities – air transport, sorting, and pre-and post-routeing, all of which are coordinated and controlled by verypowerful communication and information systems.
Formulating logistics strategy � 45

� André, a French shoe distributor (a chain of both urban shops andspecialized supermarkets), strengthened by its logistics organization, hastaken over the ready-to-wear clothing chains of Kookai and Caroll.Renamed the Vivarte Group, it manages 15 trade names in the shoe andclothes sector in Europe. Logistics is a core business of the group, deliv-ering to the group’s 2,566 outlets.
strategic Logistics: logistics as a new profession� The integrators (Fedex, DHL, etc) are developing a service in the
management of spare parts and/or high-value items for e-commerce thatare located near to their hubs and are ready to be delivered through theirglobal networks. They can deliver their customers’ goods globally, withorders received late in the evening delivered early the next morning.
� For Otis, Dassault, Eurocopter and others, after-sales logistics has nowbecome a source of revenue – sometimes with profits higher than theoriginal product sales.
� Reverse logistics is growing and logistics companies like Geodis developspecific offers for many sectors (automotive, electronic, etc).
� Tesco uses its outlets to prepare home deliveries of orders collected fromits websites, giving its customers two channels to buy products. Orderpreparing and delivering are new logistics competences for Tesco.
Expansion by missionlogistics Strategy: logistics as a support for extension� SKF, Aventis, IBM, etc can only ensure their internationalization by
entrusting European subsidiaries with specialized factories, and byincluding them in a complex logistics network composed of central andnational warehouses that are in constant contact.
� To succeed in its global strategy, and to promote the international distri-bution of its many products, Danone International Brands built an inter-national information system to link its commercial subsidiaries spreadaround the world, and logistics units that supply the products when andwhere required. Since 2001, a B2B site with a customer relationshipmanagement (CRM) application links with Danone’s enterprise resourceplanning (ERP), strengthening relations with the network of importers/distributors and giving information about the status of orders.
strategic Logistics: logistics in order to win new clients/customers� Continent, a French hypermarket chain that now belongs to Carrefour,
supplies its new Greek stores in Salonika and Athens with the samelogistics tool it uses for its stores in the south of France.
46 � Global logistics

� The organization of the Philips-Eclairage central warehouse in Franceenables it to serve neighbouring customers in Luxembourg, Italy andSpain.
� Informatics printer manufacturers such as Lexmark – which gets highermargins from consumables than from the machines themselves – areencouraged to collect empty ink cartridges to avoid competition fromcompanies specializing in refilling the cartridges. They are quickly devel-oping alliances with third-party logistics specialized in gathering scrapand salvaging end-of-life items.
� Thanks to its logistics differentiation, Radiall can develop rapidly in thecar industry it defines as a new strategic client.
Diversificationlogistics Strategy: the use of logistics synergies
� Numerous road haulage firms have specialized in particular traffic orgoods that present homogeneous logistics characteristics: TFE (TransportFrigorifiques Européens) for fresh products; Salvesen for frozen products;DHL and UPS (Germany) for deliveries in dense urban zones; ACR/Kuehne & Nagel, Norbert Dentressangle Logistics and DHL Exel forsupplying large distribution chains.
� To support its diversification strategy and benefit from synergies, Geodisdevelops competence mapping in the group and encourages cross-exchanges of logistics experience and knowledge.
� Automobile makers, with their great capacity to mobilize the resources oftheir suppliers, are becoming vehicle designers (imagining more attractivecombinations of components for the client) and assemblers (by just-in-time converging of everything needed to assemble the specific vehicleordered by a customer).
strategic Logistics: diversifying through or in logistics� By exploiting its automated warehouse, Philips-Eclairage diversified into
a parcel delivery service with daily deliveries to all clients, anywhere inFrance – to the point where it now sells more logistics services than electricequipment. The company delivers articles made by other manufacturers,provided they are not in direct competition with its own products.
� Laphal, a medium-size French pharmaceutical laboratory, has developedits logistics skills and assets, and recently decided to offer its logisticsservices to other pharmaceutical SMEs. They can manage internationaldistribution to wholesalers, hospitals and community pharmacies. Laphalalso has a logistics joint venture in Singapore, is expanding in Asia – and isnow considered a third-party operator.
Formulating logistics strategy � 47

� Telemarket, a subsidiary of the Monoprix–Galeries Lafayette distributiongroup with strong logistics know-how, has offered a home-deliveryservice since 1987, with appointments made with Parisian customers whoorder by phone or over their web shop (www.telemarket.fr). Thesecustomers are obviously different from those who shop in the Monoprixstores in city centres.
Strategic action itineraries in logistics
The above examples provide evidence that, on the one hand, firms do notcentre their strategy on logistics alone (informatics and marketing, inparticular, are always implicitly if not explicitly associated), while, on theother hand, they do not strictly aim for a single result (differentiation, forexample). In reality, the generic strategies illustrated separately in theprevious section are not only dependent, but are also more generallycombined. Hence, three strategic action ‘itineraries’ can be detected:
1. The firm aims at a principal strategy and obtains other advantages from‘spin-offs’. The firm discovers in retrospect that other strategies arepossible thanks to the first strategic move. The resulting itinerary is anemergent one that was not foreseen.
2. The firm deliberately aims at several strategies that may be spread out intime but are conceived as being interdependent. The resulting itinerary isa deliberate one that was designed before the first strategic move.
3. Once the firm has aimed at one or several strategies and has built a newlogistics system, it discovers that it can ‘rebound’ and, from that point on,build a new strategy with different aims. In this case, the firm designs itsstrategic itinerary by steps (Avenier, 1997), combining emergent and delib-erate moves. This kind of itinerary needs special attention to the learningprocesses and a strategic mobility in the whole company and its partners.Sometimes, the ‘rebound path’ can be foreseen, but there is too muchuncertainty to risk a combined strategic itinerary from the beginning. Thefirst strategy is then an intermediary one that will reveal (or not) the feasi-bility of the overall strategy.
For each of these itineraries, we present various options, followed by severalexamples. Here we have used the abbreviations lS (logistics Strategy) and sL(strategic Logistics) to identify the perspectives adopted by the firm.
The possible spin-offs from a strategic move (see Figure 3.5)� André (now Vivarte), by expanding through professions (with lS) that
were in large part founded on logistics and commercial abilities, found
48 � Global logistics

logistics synergies in its distribution networks in order to reinforce its costdomination (lS).
� Tracking and tracing services – a logistics innovation (lS) developed by agrowing number of express delivery services – at first constituted a differ-entiation approach (sL), attempting to obtain a modern image withoutgreat cost. By making transfers more reliable (increased control of risks),such technologies make it possible to reduce the level of the consignee’sinventory and therefore its costs (sL), while at the same time reducingproduction cycles (as in IBM). The most dynamic express delivery servicesnow integrate such technologies into their commercial approach and thusrebound by expanding their mission (sL).
� Diversifying in logistics as a new profession (sL) permits Laphal to look forlogistics cost reduction (sL) that will benefit its own products.
It should be noted that spin-offs are always in the direction of decreasing organi-zational complexity and towards a lower level of change. Because spin-offs arenot foreseen, they are not automatic and, in any case, are of less intensity thanwhen strategic moves are deliberately played in a combined manner. To succeedin such an opportunistic approach, firms need to develop their vigilance andreactivity to catch any opportunity induced from the first strategic move.
Combination of articulated strategic moves (see Figure 3.6)� In distribution, the intention of a firm to equip itself with its own and/or
subcontracted logistics corresponds to a combination of deliberate logistics
Formulating logistics strategy � 49
Cost domination
Innovation
Differentiation
Alliance
+Complexity of organization
+
Profession
Expansion Mission
Diversification
Lev
el o
f ch
ang
e co
ntr
ol
Figure 3.5 Possible spin-offs from a strategic move

moves – reduction of direct logistics costs (lS) (Carrefour) and overallsupply costs (sL) (Auchan and Intermarché); the will to differentiate(Auchan); the desire to make alliances (sL) (Intermarché) or to permitgeographic expansion (sL) (Continent), or even to open up to diversifi-cation (sL) (Telemarket). Monoprix-Telemarket is an example of a firm thathas more or less implemented all of these strategic dimensions, and otherswill follow the same path.
� The development of continuous replenishment programmes shared bymanufacturers and retailers (Casino and Yoplait, Carrefour and Lever) andthe development of ECR give a combination of cost domination (sL), inno-vation (sL) in the domain of information management, and verticalalliance (sL).
� Integrators, with their knowledge of complementarities and alliances (sL)(UPS), have sought to integrate operations (lS). Certain firms (DHL, TNT)offer their networks to dispatch parts between industrial sites workingwith just-in-time. This corresponds to a strategy of diversification (sL)from their original trade.
� For companies such as Hewlett-Packard, differentiation (lS) is alwayscombined with a powerful cost reduction objective (lS) that was generallythe first step of the combined itinerary.
� Hewlett-Packard’s logistics strategy for PCs (sL) is efficient because theyaccepted the ‘channel assembly’ business model to transfer part of theassembly to selected resellers (lS). Then multi-channel differentiation (sL)had to be combined with alliances (lS) with channel partners.
50 � Global logistics
Cost domination
Innovation
Differentiation
Alliance
+
Profession
Expansion Mission
Diversification
Leve
l of
chan
ge
con
tro
l
+Complexity of organization
Figure 3.6 Possible combinations of articulated strategic moves

� Levi’s express customized service was a combination of innovation (lS)both on the offer and on the process, differentiation (sL) through theservice, and expansion by mission (sL).
� The Tesco web offer based on outlets as logistics assets looks like Levi’sstrategic combination but with profession expansion (the web customersare the same as classic outlet customers).
� When Geodis launched its knowledge management project, the objectivewas to innovate (sL) but also to differentiate from competitors (lS), and tosupport its mission expansion (lS).
The combination itinerary deliberately aims at several strategies that areconceived as being interdependent. In certain cases, the implementation issynchronized, and in other cases it may be spread out in time – but theresulting itinerary is always designed before the first strategic move. Thislevel of strategic maturity is not yet widespread, which explains why mostfirms rebound by making iterative improvements based on experiencesduring the strategic process.
Rebounding with new strategic moves (see Figure 3.7)� At the end of the 1980s, with a major investment of R100 million (lS) in an
automated distribution warehouse, Philips-Eclairage initially sought todifferentiate itself from its competitors (lS). With its acquired experience,it then took over the distribution of materials complementary to, ordifferent from, its range and made by other manufacturers. Can it be saidthat this diversification (sL) has transformed Philips-Eclairage into a
Formulating logistics strategy � 51
Figure 3.7 Rebounding with new strategic moves
Cost domination
Innovation
Differentiation
Alliance
+Complexity of organization
+
Leve
l of
chan
ge
con
tro
l
Profession
Expansion Mission
Diversification

logistics distribution firm? Where are the margins – in the sale ofproducts, or the sale of logistics services? In fact, a second rebound has ledthe firm to geographic expansion (sL) by delivering to customers inregions beyond France.
� The automobile industry (PSA, Renault) has operated a complex combi-nation of logistics approaches – overall cost reduction through logistics(sL), differentiation (sL), innovation in logistics EDI (lS), alliances withlogistics suppliers and parts suppliers (sL) and expansion by international-ization (lS). On the strategic level, starting with logistics synergies (lS), adiversification phase can lead the firm to make a radical change inparadigm. With their strong logistics skills, the car makers are becomingconceivers and assemblers, able to offer either very differentiated rangesof cars or, on the contrary, very standardized vehicles.
� The logistics supplier Geodis developed know-how for advanced ware-houses and just-in-time deliveries by first following an innovationapproach (lS) and then by alliances founded on logistics (sL). Then itrebounded on diversification (sL) by proposing to its customers – carmakers – that it perform assembly operations in its advanced ware-houses for parts that it already managed. It assembles certain parts (egbumper, lights and electric system) and delivers them directly to theproduction lines as required. It was a logistics supplier, and became aparts supplier.
� Thanks to its differentiated logistics service (lS), Radiall could expand intothe car industry (sL) and compensate for decreasing activity in thetelecommunications sector.
� For Geodis, the Valogistics joint venture with SITA (sL) is probably a firststep towards expansion into European-wide operations (lS) and expansionof profession (sL) into reverse logistics and associated activities.
It should be noted that the possibilities illustrated in Figure 3.7 are not asnumerous as those given in Figure 3.6, as the moves are not intended to belinked together from the beginning. It should also be noted that there is astrong difference between this kind of itinerary and the one illustrated byFigure 3.5. Here, firms capitalize on the experience acquired when ‘acting’their first move, and they reformulate their strategy, exploiting new infor-mation, experience and competence. This explains why the first kind ofitinerary (Figure 3.5) goes from complex strategies to simple ones, and thethird one (Figure 3.7) gives an opportunity to increase complexity.
ConclusionsThe formulation of logistics strategies is almost always complex. First, consid-ering the relationship between logistics and strategy, there are two types ofapproach: reactive fit (logistics Strategy, lS) and active intent (strategic
52 � Global logistics

Logistics, sL). Second, there is strong overlap with strategies formulated byother functions in the firm. Third, it is expressed by simple or multiplestrategic moves. The way firms build strategic itineraries is another factorexplaining the variety of logistics strategies: firms can either deliberatelycombine strategic moves, or rebound iteratively in new directions and takeadvantage of spin-offs that were unexpected. There can, therefore, be no a-priori rules for the formulation of logistics strategies.
The analysis in this chapter shows this complexity, and seems to be a goodtool for the formulation of strategies – supported by or founded on logistics– that can develop on several levels. From this point of view, we can say thatlogistics and supply chain management now constitute a privileged area instrategic management, a point of view also developed by Cohen andRoussel (2005). At the least, logistics offers new ways of thinking aboutstrategy. Because it motivates and supports organizational change, it alsooffers new frames for piloting managerial action in a strategic way. That iswhy logistics and supply chain management are now such an importantstrategic issue.
Summary
� Firms formulate their strategies in response to intense environmentalpressures.
� Logistics is an essential element of that strategy.� The field of logistics has become progressively broader and is now very
far-reaching.� A trend from the perspective of logistics Strategy to that of strategic
Logistics is apparent, representing a source of competitive advantage and/or new strategies.
� A variety of generic strategies can be identified.� Formulation of logistics strategies must also take into account the way of
linking strategic moves, the so-called itineraries.
References
Ansoff, I (1965) Corporate Strategy, McGraw-Hill, New YorkAvenier, MJ (ed) (1997) La stratégie ‘chemin faisant’, Economica, ParisBuaron, R (1981) New-game strategies, McKinsey Quarterly, Spring, pp 24–40Cohen, S and Roussel, J (2005) Strategic Supply Chain Management: The 5 disci-
plines for top performance, McGraw-Hill, New YorkDavenport, T and Short, J (1990) The new industrial engineering: information
technology and business process redesign, Sloan Management Review, 31 (4),Summer, pp 11–27
Formulating logistics strategy � 53

Ellram, LM (1991) Supply chain management: the industrial organisationperspective, International Journal of Physical Distribution and LogisticsManagement, 21 (1), pp 13–22
European Commission (1999) Transport and Logistics in Europe, EuropeanCommission and PricewaterhouseCoopers, Belgium
Fabbe-Costes, N (1997) Information management in the logistics serviceindustry: a strategic response to the reintegration of logistical activities,Transport Logistics, 1 (2), pp 115–27
Fabbe-Costes, N (2002) Le pilotage des supply chains: un défi pour lessystèmes d’information et de communication logistiques, Gestion 2000,Jan–Feb, pp 75–92
Fabbe-Costes, N and Colin, J (1995) Strategies developed by logistics suppliersfacing the temptation for shippers to reintegrate logistics operations, 7thWorld Conference on Transport Research, 16–21 July 1995, Sydney, Australia
Galia website, www.galia.comHammer, M (1990) Reengineering work: don’t automate, obliterate, Harvard
Business Review, 68 (4), July–Aug, pp 104–12Konsynski, BR (1993) Strategic control in the extended enterprise, IBM
Systems Journal, 32 (1), pp 111–42Lambert, DM, Cooper, MC and Pagh, JD (1998) Supply chain management:
implementing issues and research opportunities, International Journal ofLogistics Management, 9 (2), pp 1–18
Martinet, A C (1983) Stratégie, Vuibert Gestion, ParisMathe, H, Colin, J and Tixier, D (1983) La logistique, Dunod, ParisMétais, E (2004) Stratégie et ressources de l’entreprise: théorie et pratiques, Economica,
ParisMorin, E (1990) Science avec conscience, new edn, Le Seuil-Points, ParisPorter, M (1985) Competitive Advantage, Free Press/Macmillan, New YorkShiba, S, Graham, A and Walden, D (1993) A New American TQM: Four practical
revolutions in management, Productivity Press/Center for Quality Management,Cambridge, MA
Stalk, G and Hout, T (1990) Competing against Time: How time-based competitionis reshaping global markets, Free Press, New York
Stalk, G, Evans, P and Shulman, L (1992) Competing on capabilities: the newrules of corporate strategy, Harvard Business Review, Mar–Apr, pp 57–69
Tixier, D, Mathe, H and Colin, J (1996) La logistique d’entreprise: vers unmanagement plus compétitif, Dunod, Paris
Wiseman, C (1985) Strategy and Computers, Dow Jones/Irwin, New YorkWomack, J, Jones, D and Roos, D (1990) The Machine that Changed the World,
Harper Perennial, New York
54 � Global logistics

Agile supply chainoperating environments
– avoidingimplementation pitfalls
Remko van Hoek, Cranfield School of Management
Summary
Agile capabilities in the supply chain are needed now more than ever before –but not everywhere. This chapter develops a categorization for operatingenvironments, and shows how this can be used to assess the viability of anagile supply chain for meeting contingencies in supply and demand. Furtherto that, this chapter offers ways to avoid pitfalls in implementing agile cap-abilities in the supply chain.
Introduction
There is no shortage of strategic opportunities for using supply chains andsupply chain capabilities to achieve competitiveness and to achieve faster,more profitable company growth. There is a shortage of companies thatachieve full potential and develop and leverage all needed supply chain
55
4

56 � Global logistics
capabilities. For almost a decade now the benefit of creating a more agile andresponsive supply chain has been widely accepted. Recently, however, thehead of the supply chain of a major European manufacturer told me: ‘Wehave realized the need to become more agile for years and have tried severalthings but do you have any suggestions for how we can actually accomplishhigher levels of agility?’
The point is clear: there has been a more-or-less clear vision of the benefitsof creating an agile supply chain going back to Harrison, Christopher and vanHoek (1999) defining it in terms of responsiveness to markets based upon thedimensions of market sensitivity, virtual integration, process integration andnetwork integration (as shown in Figure 4.1). This vision has been widelycited and reinforced since as a key competitive ambition and supply chainbest practice aspiration (for example, Christopher (2004) and Lee (2004)).However, there has been a shortage of studies and cases of companies actuallyturning the vision or ambition into reality, let alone tools that they use to do so– and the theoretical argument in the references mentioned above is not suffi-ciently helpful in that respect.
So we now know that the market turbulence of the 1990s was only a start,and that continuing uncertainty makes the responsiveness that comes fromagile supply chains a more valuable consideration than ever before. The keyword here is ‘consideration’. If there is one rule in supply chain management,it is that ‘There is no universal solution to all operating circumstances.’ So thekey questions for this chapter become: 1) where to implement agile capabil-ities, or ‘Which operating environments most favour an agile supply chain?’;and 2) how to approach implementation of agile capabilities.
The first part of this chapter introduces contingencies or operating factorsthat help answer the first question. It incorporates these factors into a morecomprehensive description that shows when a supply chain should focus on
Figure 4.1 Theoretical framework for creating the agile supply chain
The agile supply chain
Virtual integration
Process integration
Network integration
Market sensitivity

agility, leanness and other options. The second part of this chapter willintroduce four pitfalls that companies commonly find themselves in andthrough which – despite good intentions and efforts to improve agility andresponsiveness – they achieve anything but that. Instead they underperformby driving practice away from the agile vision and generating cost ofcomplexity with little value return.
Operating circumstances requiring agility
Factors previously introduced include demand volatility, product variety, fore-castability and ‘fashion-type’ short life cycles and fast delivery. Van Hoek andHarrison (2001) introduced demand and supply characteristics as dimensionsimpacting the relevance of agile versus alternative approaches (see Figure 4.2).
The relevance of factoring in demand and supply characteristics lies in thenotion that creating the agile supply chain is about linking supply capabilitiesto demand requirements. In this respect, demand and supply ‘characteristics’may be too general a term. There is an underlying dynamic between the twodimensions: supply abilities are to be created in response to demand require-ments. Then one may think of the two dimensions as ‘demand’ indicating theviability of agility, and ‘supply’ indicating the feasibility of agility.
Responding to demand with a short lead time is a relevant feature ofresponsiveness to demand – but it also is a relatively basic one. It certainlydoes not capture a comprehensive set of responsiveness enhancers. Whenconsidering relevant agile capabilities, additional operating contingenciesshould be included. The remainder of this section will discuss demand and
Agile supply chain operating environments � 57
Figure 4.2 Leanness and agility under demand and supply conditions
Demand characteristics
Supply characteristics
Long lead time
Short lead time
Predictable Unpredictable
markets markets
JIT
Plan and execute
Lean
React and execute
Agile
Hedge and deploy
Hold inventory

supply contingencies to be included in the categorization for operatingenvironments.
Demand contingenciesReturning to lead times, the length of response time is predominantly arelative measure. When developing a cross-industry categorization for oper-ating environments, the absolute length in weeks, days or hours may be lessrelevant than the relative length. Lead-time tolerance is often the mostrelevant factor, as it captures leeway that supply chains have in responding todemand. It also incorporates the fact that reliability of delivery may be moreimportant than absolute lead time. A lead-time tolerance, therefore, containsboth a speed and a reliability element.
‘Forecastability’ of demand is a better measure than predictions of marketconditions because it is more closely linked to supply chain managementcapabilities. Market conditions are generally very difficult to predict at thedetailed level (of individual SKUs, for example), but that does not mean thatcompanies cannot forecast demand relatively accurately. More importantfrom the contingency point of view is the fact that forecastability includes asupply chain management requirement of aligning mid- to longer-termcapacity decisions to demand, rather than the hard-to-predict market condi-tions. Of course, one might argue that an ultimately responsive systemremoves the need to forecast, but this is more of a theoretical perspective thana realistic one. Irrespective of the supply chain’s responsiveness to actualorders, companies still have to forecast for mid- to longer-term factors,including advance orders to suppliers, long-cycle-time production processesand capacity-building plans.
Demand for a product is rarely stable, but contains peaks and troughs. It istraditionally difficult to accommodate this variance in demand across a giventime period, because every supply chain has a limited capacity and otherconstraints, such as maximum order volumes or limits on the availability ofexpensive slack capacity. However, there are two underlying features here: 1)the difference between the peaks and troughs of demand; and 2) thefrequency with which up- and downswings occur.
For the latter, a standard seasonal pattern may have just one peak (in thesummer for garden furniture, for example), whereas the fashion industry mayhave a minimum of six or eight seasons. Retail promotions may have peaksevery other week. These seasonal swings in demand may be significant, withpeak demands often accounting for 60 to 70 per cent of total demand.
Figure 4.3 shows an operationalization of the above three demand contin-gencies – lead-time tolerance, forecastability and variance in volume.
58 � Global logistics

Supply contingenciesWhat are key supply contingencies that impact the feasibility of creating anagile supply chain? It is in this area that most gaps in current knowledgeexist, as most of the publications on agile supply chains focus on the rele-vance of the approach itself in modern markets. Given the strength of thisargument in favour of agility, and its importance in the current uncertaineconomic landscape, it is time to move beyond this basic view and considerthe four layers (at least) of supply contingencies – or requirements for anagile supply chain.
‘Postponement’ has been widely identified as a mechanism that cansupport the creation of responsive supply. Delaying inventory allocation inthe supply chain creates hedging options for responding to demand. Thislogistics postponement (delaying time and place functionality decisions) ishelpful in the distribution segment of the supply chain but ultimately onlyoffers partial responsiveness. It still assumes that stocks of finished goodsbuild in anticipation of unknown demand, with all the risks of stock-outs stilllargely in place. Stock-outs generally have a very high cost in agile environ-ments. It is for this reason that ‘form postponement’ is used – to delay thespecification of final form and function of products until the last moment.Many companies do this by delaying packaging, labelling, adding documen-tation or product peripherals. Extending postponement into manufacturing,assembly, module manufacturing, etc may help create the greater flexibilityrequired for agility.
Agile supply chain operating environments � 59
Lead-time toleranceHigh Low Weeks Days Hours
ForecastabilityHigh Low
90% forecasting accuracy 50% forecasting accuracy
Variance in volumeLow High
Low peaks/ High peaks/limited occurrence frequent occurrence
Figure 4.3 Demand contingencies impacting the viability of an agile supplychain

Associated with the need for form and function customization is the manu-facturing and engineering principle of ‘design variance’ across products andproduct lines. In order to achieve levels of customization beyond theappearance of products, designs may have to vary beyond packaging – evenbeyond modules and into components and more basic features of design. Thiscreates obvious design, manufacturing, sourcing and inventory complexitiesthat have to be dealt with in agile operating environments. This contingencyalso shows how creating an agile supply chain requires more than revisinglogistics and distribution management – but it can have an impact all the wayback to product design. The impact on suppliers and trading partners isdiscussed as part of the next contingency.
‘Supply chain partner modularity’ specifies the extent to which individualcompanies participating in the creation of an agile supply chain will have toalign operations through the redesign of management practices and inter-faces for the flow of goods and information. Some examples may help clarifythis. Traditional sourcing and contract logistics has a buy–sell approach thatsuggests interfaces limited to a transactional level. JIT sourcing has moreextensive interfaces with the sharing of demand data and alignment of opera-tions. Integrated contract manufacturing, in which a third party controls themajority of build and make operations, extends the interface beyond alignedsupply into integrated form and functionality creation. Fourth-party logisticsis similar to this, with a third party taking over the organization and coordi-nation of the entire flow of goods, information and management for the entirelogistics function, based around tightly structured interfaces. Theseapproaches lead to a modular supply chain in which boundaries betweenpartners are blurred and players are all orchestrated around real demand andservice to the end customer.
It is important to note here that this contingency is not limited to upstreamsuppliers, but also involves the downstream trading partners between thecompany and the end customer. This is traditionally a hard set of interfaces –compared with upstream suppliers who are paid for their supply efforts,giving companies an obvious lever in the structuring of these interfaces. Theimplication of agile reasoning, however, is that downstream partners anddirect customers can also encourage alignment around this approach. Thenchannel interfaces should be structured around end-customer demandcontingencies. Service to the end customer gives the key to this; it is anobjective that all supply chain players share and where there is significantunification in purpose and objectives.
This brings us a final contingency, which is the ‘supply chain scope’. Inorder completely to meet the standards demanded for customization, modu-larity and partner integration, the scale or scope of supply chain involvementmay be significant. It goes far beyond traditional views, and develops one-to-one interfaces that extend into a ‘value chain’. A value chain is a sequence ofone-to-one interfaces leading up to a customer, while a supply chain has
60 � Global logistics

many-to-many interfaces and interconnections, which must be dynamicallyrearranged around key processes and players in response to real demand.A network approach is far more appropriate here.
Figure 4.4 shows an operationalization of the above four supply contin-gencies – postponement, design variance, partner modularity and supplychain scope.
The categorization for operating environments
Figure 4.5 shows a categorization for operating environments based on thecontingency factors introduced in the previous section. In the categorization anumber of alternative approaches to agility are mentioned. The first consider-ation is to distinguish A, B, C products – based on Pareto analysis. HereA products (accounting for 80 per cent of volume and 20 per cent of orders)are more standardized, and the greater forecastability, lower volume varianceand lower customization make them more suited to lean approaches.B products are more variable and more suited to agility.
Efficient consumer response (ECR) and quick response (QR) are generallybetter in environments where demand requirements particularly impactdelivery and distribution, but have less effect on upstream operations. Masscustomization is generally better in environments with modest to significantly
Agile supply chain operating environments � 61
PostponementLimited Comprehensive
Packaging Configuration Assembly Sourcing
Design varianceLimited Extensive
Packages Modules Components
Partner modularityLimited Extensive
3PL JIT Contract manufacturing 4PL Modular supply chain
Supply chain scopeLimited Extensive
One to one Value chain Network
Figure 4.4 Supply contingencies impacting the feasibility of an agile supplychain

challenging demand, which can be met with medium postponement andcustomization.
Agility is positioned near project environments. This is the right place froma supply contingency point of view, but is not so good from a demand contin-gency point of view. For example, in environments of innovation and singleprojects, lead-time leeway is often significantly bigger.
With contingencies and operating environments considered, the questionthat remains is: how to avoid pitfalls in implementing agility? This is the focusof the next section.
Mitigating the minefield of pitfalls
Figure 4.6 conceptualizes the ‘minefield’ of creating the agile supply chain. Ifall goes well companies accomplish the four central dimensions of the agilesupply chain as introduced in the previous section. However, lacking practical
62 � Global logistics
High
High
Low
Low Forecastability
Low Lead time
High
Ext
ensi
ve
Ext
ensi
ve E
xten
sive
Ext
ensi
ve
Lim
ited
Lim
ited
Lim
ited
Lim
ited
Sup
ply
chai
n sc
ope
Sup
ply
chai
n pa
rtne
r m
odul
arity
Pos
tpon
emen
t
Des
ign
varia
nce
B productC product
A product
Innovation/ projects
Agile
Lean
Volume variance
ECR/QR
Mass customization
Figure 4.5 Categorization of operating environments

guidance and experience there are pitfalls at every step of the way andcompanies can be found to be:
� not actually responding to the customer as opposed to creating marketsensitivity;
� not coordinating governance, which allows for too much or too littleresponsiveness as opposed to virtual integration;
� proliferating product in meaningless and valueless areas because offailures in process integration; and
� despite a coming focus on service, not actually measuring that, leading tofailed network integration.
Agile supply chain operating environments � 63
Marketsensitivity
Virtual integration
Networkintegration
Agile supply chain
Processintegration
Companies arenot respondingto customers
Companies arenot coordinatinggovernance
Companies areproliferating products
Companies arenot measuringcustomer service
Figure 4.6 The minefield of creating the agile supply chain

Poor response to customersIt is common practice for companies to measure customer service in multipleways. Customer satisfaction is the most widely used measure. However,there are several challenges with customer satisfaction measurement andsurveys:
� Average scores hide extremes at the end (problems and excellence).� What opinions and strategies are behind subjective measures?� Who is speaking? There are many different voices within the customer
organization.� What is the value of individual responses averaged out (innovators, key
accounts, marginal accounts)?� There may be a lack of clear implications for service (what does a 3.75
mean in comparison to a 3.95 score?)
In response to these challenges, companies like GE, Honeywell and the FordMotor Company have developed voice of the customer (VOC) processes.These aim to go beyond customer satisfaction measurement by crafting amore comprehensive exchange with selected customers.
Typical features of this exchange include:
� senior-manager-to-senior-manager meetings to avoid leaving theexchange to revenue-pressured situations, to signify commitment and toelevate the conversation;
� expansion of the interaction to an ongoing exchange to drive beyondmeasurement at specific points in time only and to establish sustainedimprovement and alignment;
� involving additional functions including logistics and engineering andmultiple contacts on the customer side in order to broaden the exchangeinto a bi-directional learning and alignment opportunity;
� establishing joint improvement initiatives to turn the exchange into morethan a listening exercise, including so-called ‘At the customer, for thecustomer’ teams.
The key distinctions between voice of the customer processes and customersatisfaction measurement are:
� It is based upon conversations, not surveys, which helps capture the storybehind the survey scores and teach more about what actually drivesscores.
� It is not the task of the customer service department but often starts with asenior executive sponsor talking to a customer peer and is followed bycross-functional work groups at a management and executive level
64 � Global logistics

working together on improving responsiveness and process alignmentwhere that matters to the customer.
� It is ongoing, not a point measurement, as initial conversations arefollowed up with reviews of process improvements.
� It is customer-centric as opposed to measuring average market perfor-mance scores.
� It captures multiple inputs from the customer not just a single respondent;this is important because there are many voices of the customer and itmatters who is talking.
� It is linked to action, with project teams deployed ‘at the customer, for thecustomer’; hence the outcomes of the review are not internalized but usedas a basis for customer-focused action.
� It actually improves customer relations through improved learning aboutthe customer, relationship development and resource investments toaddress service issues, and improvement opportunities.
Overall, voice of the customer leads to much better market sensitivity asopposed to running the risk of misguided interpretation of limited channels forcapturing market input with no tie to actual customer-centric improvements.
Governance not supporting virtual integrationAgility requires the ability to be able to respond to local market requirementsand opportunities. But this does not mean that companies should not aim atleveraging skills and capabilities across the regions in which they operate –let alone avoiding reinventing the wheel across parts of the organization. Inthe terminology of Bartlett and Goshal (1989), local responsiveness andglobal efficiency need to be integrated into a network organization that is avirtually integrated entity, despite operating in multiple locations andregions.
Most often, however, companies tend towards either local responsivenessor strong global standardization and organization. Hewlett-Packard used tobe in the former camp. At one point, for example, they found that there weredozens of similar B2B efforts under way across the company with – at best –informal coordination between teams. Rightfully, HP did not respond with(what would have been intuitive to many) a centralization of efforts andcontrol. Instead, they developed a distributed governance approach thatallowed for local responsiveness but leveraged lessons learned for thecompany and avoided duplication of effort.
In order to find a way to balance proliferation of businesses and divisions,high divisional autonomy and complexity in organization, operations(including redundant operations) and key support processes such asprocurement and customer support, HP launched a supply chain govern-ance council. The charter that its executive committee set was to implement
Agile supply chain operating environments � 65

pan-company efficiency initiatives and uncover supply chain-based revenueopportunities. Specific goals included: to establish and drive a coordinatedapproach to investments pertaining to opportunities that have a pan-enter-prise scope and impact and supporting executive awareness of key initiativesto avoid reinventing the wheel.
This means that the council explicitly does not get involved with initiativesthat are specific to an individual business or region; it does not centrallycontrol supply chain governance but it does support larger initiatives fromwhich many parts of the organization can and should benefit. It also providessenior management with a method for supporting and steering direction onmost important opportunities and directions.
Four key operating rules at the council are:
� mandated senior participation;� focus on enterprise-wide initiatives;� driving initiative development through divisional sponsorship;� funding initiatives from divisional budgets.
The latter two are particularly interesting, as they help avoid creating acorporate-centre approach that can dictate without the businesses caring orpaying for it.
Keys to success in a governance approach like this one include:
� Avoiding layering a governance council on top of existing structures. If itgenerates more governance, this not only could conflict with existingstructures but might enhance bureaucracy rather than agility.
� Keeping it simple and crisp. The governance council serves the purpose ofensuring more agility for the company as opposed to just agility locally. Inorder to accomplish that, there should be minimal procedures and rules.
� Ensuring that what is purely local should remain local. If there is no benefitto leveraging a particular initiative to the global or corporate level, keep itlocal.
Meaningless product proliferationA particular area of concern when it comes to process integration is productproliferation. Because of process misalignment between several parts of thesupply chain, companies often end up proliferating products driven byinternal misalignment rather than the market. How this often happens is:R&D want to innovate and expand product ranges, and sales want to createmore opportunities to sell, while the supply chain and operations want toavoid margin reductions from cost of complexity in operations. A lack ofprocess integration leads to uncontrolled efforts disconnected from marketopportunity.
66 � Global logistics

New products are created hoping that this will aid in growing the businessby offering more revenue opportunities. In theory this improves the ability torespond to customer demand. In reality, however, companies typically get alot of product proliferation wrong and end up creating too many productsthat do not sell, adding cost and needless complexity into their supply chain.
One company found that the bottom 25 per cent of products generated lessthan 1 per cent of revenue and were actually unprofitable, reducing thecompany’s overall profit. Another company saw its SKU count double in twoyears, with SKU growth far outpacing revenue growth, resulting in a reductionof volumes per product, and return on investment in designing and marketingproducts – while mushrooming the cost of warehousing. While all of this washappening, the supply chain was left to cope with the consequences, with thebusiness not really owning any responsibility for SKU management. One ware-house manager of this company said: ‘When I meet people from the business Iask them how many SKUs they have in the warehouse. They never get it rightand always underestimate.’
To summarize, common flags for product proliferation include:
1. growth of SKU count outpacing revenue growth;2. SKUs that do not meet revenue and volume thresholds for generating
return on design, marketing and shipping;3. SKU management not being distributed across the business, and no
accountability for or even transparency of SKU proliferation in thebusiness.
Additional complexity flags can be found in warehouse and sales including:
� warehouse flags:– ongoing order and shipment size reduction;– a constant need for more stock locations in the warehouse;– night shifts and rush shipments outside seasonal peaks;
� sales flags:– a catalogue that is as thick as the Yellow Pages, running the risk of
confusing customers;– more products than any salesperson could every carry;– special SKUs being added based upon special (key-)customer requests,
events or market opportunities but perhaps not being removed afterthe event.
Faced with a lot of the unwelcome consequences of SKU proliferationoutlined above, Company A, a consumer products company, reduced its SKUcount by 30 per cent over three years while growing the company and addingnew products, breaking away from flag 1. It did so by actively managing toavoid flags 2 and 3. The company initiated an SKU management effort – intro-duced by the CEO – with a mandate that 50 per cent of SKUs that did not meet
Agile supply chain operating environments � 67

revenue thresholds would be cut each quarter. The reason for the target being50 per cent and not 100 per cent was that new products were being developedin the market that might not have been completely successful, there wereproducts that did not perform steadily every quarter (because of seasonality,for example), and it left the business some autonomy in making cut decisions.Key to this approach was that it established SKU management as an ongoingdiscipline. A lot of companies do one-off efforts, but, as a manager fromCompany A says: ‘Without sustaining the management focus, SKU count islikely to creep back up in no time. You cannot expect behaviour to just changewithout ongoing focus and accountability.’
In order to accomplish this accountability, SKU count was elevated to one ofthe measures on the global dashboard that was reviewed monthly by thesenior executive team. Additionally, a so-called ‘glide-path’ was established.This was a set of SKU reduction targets on a time line. In addition to sustainingthe focus on – and accountability for – SKU reduction, incorporating the SKUcount on the dashboard also removed decisions from the executive level. Thesupply chain team dedicated a person to the SKU effort and this personcreated transparency to the business about the SKU count, flagged SKU levelswhen they were not on the glide-path and offered help in reducing the SKUcount. Because senior management owned the outcomes of the effort at thedashboard level, the supply chain team was positioned as aiding the businessrather than being seen negatively. Furthermore, it removed discussion aboutthe effort from the executive level. According to the senior supply chain execu-tive, this is important because otherwise ‘You end up with emotion involved atthis level, resulting in endless discussion instead of focused action.’
Incorrect measurement that focuses responsivenesswronglyAll companies include customer service in some form in their performancemeasurement system. However, almost all operationalize this measurementinternally, leading to responsiveness that is misguided and focused wrongly –not being directly and fully on customers. In particular, most companiesmeasure delivery service in one or multiple ways based upon their internaldefinition of success. Typically the measures focus on how reliably and fast thecompany delivered against the timetable it put forward. This misses the point,as this timetable might not be aligned with the customers’ needs. So companiesare not tracking responsiveness to customer need at all. The better way is to askcustomers for their desired delivery window and measure execution againstthat customer-defined measure of success. General Electric realized this whenit presented high delivery-reliability scores from its own measurement tocustomers and received a negative reaction. In short, customers reacted thatperformance was not at all good by their measurement, which considered thetime when they needed deliveries to take place.
68 � Global logistics

GE changed its measurement set towards what it calls span measurement.Span stands for the range of delivery around customer-requested due dates.Essentially, the company now measures, across all deliveries globally, howclose it was to the delivery date the customer requested when ordering. In itsplastics business the company brought span down from 30 days to just a fewdays – meaning that every customer can depend upon GE delivering anyproduct, anywhere in the world, when the customer asks for it, with amaximum variation of a few days.
Experience from GE suggests the value of several actions to improve themeasurement for agility:
� Share measurement dashboards with customers, and aim to measure yourperformance using the measures customers use to measure yourcompany.
� Do not measure against your own measures of success, but ask thecustomer what defines success.
� Hold all parts of the supply chain accountable against the customer-definedmeasure of success, so that there is no escape from market sensitivity.
Enhancing the vision of agilityThis chapter has offered practical findings from aspiring practitioners, severalyears of research and dozens of case studies. As valuable a starting point asthe theory surrounding the vision of creating an agile supply chain is, it is stillonly vision-centred. The experiences and cases presented in this chaptershow where the vision can be supplemented, thereby enhancing the theo-retical framework presented in Figure 4.1. Figure 4.7 captures the particularaxioms identified and visually displays the enhanced agile supply chain theo-retical framework.
Conclusion and reflections
This chapter has attempted to offer additional insight into the questions ofwhere and how to consider developing agile capabilities in the supply chain.The identification of operating environments that favour – or disfavour – theagile supply chain gives a more realistic chance of successful implementation.Avoiding the implementation pitfalls will further increase the likelihood ofsuccess.
As one of the authors of the original agile supply chain vision I would like toapologize to the head of the supply chain mentioned at the start of thischapter. I hope that this contribution will be more helpful and make up for theshortcomings of the original vision.
Agile supply chain operating environments � 69

The agilesupply chain
Virtual integration
Processintegration
Network integration
Marketsensitivity
Do not measure customerservice against internally defined measures
Ensure voice of the customerexchanges to allow the customer to set an agenda for customer collaboration efforts
Establish a governance structure that leverages key initiatives across business units
Do not grow the product range faster than revenue and in such away that it drives down productivity
Manage product proliferation with checks and balances to avoid meaningless, loss-makingproliferation
Let the customer define measures of success
Do not second-guess the-market and limit customer interaction to selling and buying only
Do not structure governance as strictly centralized or decentralizedand without coordination
70
Figure 4.7 Enhanced agile supply chain theoretical framework

References
Bartlett, CA and Goshal, S (1989) Managing Across Borders, Harvard BusinessSchool Press, Boston, MA
Christopher, MC (2004) Supply chains: a marketing perspective, inUnderstanding Supply Chains, ed S New and R Westbrook, pp 69–108, OxfordUniversity Press, Oxford
Harrison, A, Christopher, MC and van Hoek, RI (1999) Creating the Agile SupplyChain, Institute of Transport and Logistics, Corby
Lee, H (2004) The Triple-A supply chain, Harvard Business Review, Octvan Hoek, R and Harrison, A (2001) Editorial, Special issue: Creating the Agile
Supply Chain, International Journal of Physical Distribution and LogisticsManagement, 31 (4), pp 231–34
Agile supply chain operating environments � 71

Time compression in thesupply chain
Adrian Beesley, DHL Exel Supply Chain
This chapter explores the ‘time compression’ approach to business processimprovement in the supply chain. The concept and strategic relevance of thisapproach was first published in the West in the early 1990s, and it still offersgood potential and a fresh approach to achieving competitiveness through re-engineering. The rate of adoption of time compression (TC) has been slow andthis is partly because the approach requires the total commitment of the wholebusiness from the top downwards. Coupled with this is the fact that changewithin any organization is always challenging, particularly when it involvesdifficult decisions in one department or function to benefit another, for thegood of the whole company and even the broader supply chain. Supply chainobjectives and their relation to time compression implementation strategies aretouched on, coupled with explanations of achievable benefits and case studies.
Time compression
Over 200 years ago Benjamin Franklin stated that ‘Time is money’ and thiswas reiterated in 1990 by Stalk and Hout claiming that ‘time is the lastexploitable resource’. Today time is still largely ignored by many companiesbecause of enduring approaches that create inertia in organizational struc-tures and associated business processes. Managers have always used time tomanage their operations, but control has usually been limited to a segment or
72
5

business function within the supply chain. For example, in the past, time wasused for work study and human performance measurement, but it is usuallyassociated with long-established and outdated business processes. Moreoverthis approach – and even some modern approaches – focuses purely on thevalue-adding elements of business processes, which often account only for5 per cent (sometimes referred to as the business process velocity) of totalprocess time. This emphasis on just the value-add time tends to focus onmaking people work faster – often with a risk to quality, safety and ultimatelylivelihoods as competitiveness starts to become an issue.
There is another problematical dimension to these approaches in that thetime-based implications of individual actions only recognize one side of a‘trade-off ’ that may have holistic implications for the broader supply chain.Examples include companies that manage capacity and cost through applica-tions and frameworks such as traditional accounting, functional budgeting,manufacturing resource planning (MRPII) and even enterprise resourceplanning (ERP). The resultant scope of thinking is usually constrained by notrecognizing how time, stock, resource and service interrelate with each otheralong the supply chain. Using time as a measure creates a deeper under-standing of a total holistic business process, thereby providing scope for opti-mization and a pragmatic approach to change. The use of time in this context isdirectly linked with competitiveness – and this is the meaning of the ‘timecompression’ (TC) approach.
Time compression and competition
Womack, Jones and Roos’s landmark work within the automotive sector in 1990pointed out that competition had become more aggressive and customers weremore demanding, so there is a constant need for a new source of competi-tiveness. In 1991, Reich went further and demonstrated the general applicabilityof this statement in a global context across many industrial sectors. Globalcompetitive forces are placing increasing pressures on markets and supplychains. Demand for increasing service, product performance and variety acrosssupply chains that extend across the globe creates new demands and challenges.
The TC approach is one route to addressing these demands and improvingthe design, balance and flexibility of the supply chain. If this approach iscombined with a focus on customers who operate in markets that are time-sensitive, then a further dimension is added to TC. Stalk and Hout in 1990make the comment that ‘the world is moving to increased variety with betterlevels of service and faster levels of innovation. For suppliers that operate andservice these sectors, time based competition is of significant advantage.’
A survey conducted by the European Logistics Association in 2004 identifiedfactors that are increasing the complexity of supply chains (see Figure 5.1). Thishighlights the continuing trend to source products from outside traditional
Time compression in the supply chain � 73

74
199820032008 expected
Larger share of purchaserealized outside Western Europe
Complexity factors relative change (2003 = 100)
Shorter product lifecycle
Shorter lead timeHigher number
of finished goods SKUs
Higher numberof production facilities
Shorter product lifecycle
Higher % of mistake-freedeliveries expected by
customers
Figure 5.1 Complexity factors relative change

supply markets and this is coupled with the concerns and demands formistake-free deliveries. Despite the presence of these two significant factors,the increase in SKUs will continue, as will demand for shorter lead times.
As a result, cycle times are a key consideration for most companies in theWest. However, it is interesting that the more holistic approach offered by TCremains an opportunity for many companies. This is borne out by the contentof numerous requests for quotations directed to third-party logisticsproviders over the past decade. The majority of these tend to focus on costreduction, often with little or no consideration for the attainment of holisticsupply chain benefits.
The question is why some major corporations seem to ignore, or do notdirectly engage with, this approach. The answer may lie in the fact that the useof TC to some extent relies on viewing the supply chain as a business processthat can be designed and managed, ie the original concept of supply chainmanagement (SCM). Some commentators such as Lamming (2002) consider theidea of managing the supply chain as a holistic entity to be totally impractical.He considers SCM to be a flawed concept because it has been around since 1982and industry is still having difficulty with implementing and mastering thisarea of potential competitiveness. This may explain the reason why some of themore insular approaches to business improvement still dominate company keyobjectives. This debate will no doubt continue irrespective of whether SCM or,say, network management is the approach for the future.
What is time compression?
The key aspect for the use of time is that it is not necessarily about being fasteror the fastest. Quality is paramount to competitiveness and compromising,say, quality for speed is not the primary objective. A TC approach focuses onhow companies use time to deliver a sustainable fast response to customerneeds, through business processes that are organized around a strategic time-based focus. The concept is about strengthening the holistic supply chainstructure to achieve time-based objectives with tactical decisions made at thecorrect level to enable the speed of response.
The term ‘time compression’ was originally introduced by New in 1992, andin its most basic form relates to the reduction of the time consumed bybusiness processes through the elimination of non-value-adding processtime. Value-add processes are defined as entities that transform inputs intooutputs that are of value to the customer, that they are willing to pay for (ornegate their costs) and that involve no correction or rework (ie they are rightfirst time). Some processes may be identified as producing very little addedvalue and this may highlight the need to totally re-engineer them.
One of the reasons why the approach is important relates to the levels oftime compression that can be achieved across business processes. Within,
Time compression in the supply chain � 75

76 � Global logistics
for example, a typical UK manufacturing company, at least 95 per cent of theprocess time is accounted as non-value-adding. This well-establishedstatistic is supported in the UK by the University of Warwick’s TimeCompression Programme (1995) and in the USA by Barker (1994).Consultants (SUCCESS, 2004) confirm that these sorts of value-add statisticsstill hold true, making the approach powerful as well as relevant in today’sbusiness environment.
If this statistic is viewed in the context of a typical supply chain, as little as0.01 per cent of time adds value. However, New (1992) demonstrated that allthese percentages require qualification on two counts. First, a largeproportion of the non-value-adding time is due to product queuing, so thevalue-adding percentage is a function of how much is being pushed throughthe supply chain at a particular time. Even if a particular supply chain isgrossly inefficient, but has only one order during a particular period, theactual value-adding time is high because of minimal queuing. A secondconsideration is that inventory should add value and is, therefore, usuallyincluded in the overall value-adding percentage. Consequently a view has tobe taken on how much of the inventory element of the pipeline – usuallymeasured in days or hours of throughput cover – is actually adding value. Theamount of value added by inventory is intrinsically linked to the process cycletimes, as well as demand throughput levels and predictability.
The statistics do, however, show the immensity of the opportunities forcompanies and their associated supply chains – and they differ significantlyfrom any perceived opportunity that might be available from, say, a cost-based approach.
Time compression can be achieved using any one or a combination of sevenstrategies identified by Carter, Melnyk and Handfield (1994) and these can beapplied from company level through to the total supply chain. They aresummarized as:
� simplification: removing process complexity that has accumulated overtime;
� integration: improving information flows and linkages to create integratedinformation flows and operations;
� standardization: using generic best-practice processes – and standardizedcomponents, modules and information protocols;
� concurrent working: moving from sequential to parallel working;� variance control: monitoring processes and detecting problems at an early stage
so that corrective action can be taken to avoid quality- and time-related waste;� automation: applied to improve the effectiveness and efficiency of entities
and activities within the supply chain;� resource planning: allocating resources in line with SCM best practice, for
example planning by investigating bottleneck activities and consideringuse of multi-skilled workforces to provide resource flexibility.

Time compression in the supply chain � 77
These strategies should ideally be utilized in the sequence in which theyappear. However, depending on a particular supply chain or company situ-ation, various stages and combinations may be more pragmatically deployedto account for changes that are already – or about to be – in place. Through theuse of these strategies TC can directly achieve increases in value-add time andhelp to contribute to objectives associated with fundamental principles ofSCM and best practice.
Putting aside the debate surrounding the merits of SCM, a brief descriptionof the nature of the key SCM principles and how they relate to time is given inTable 5.1. It can be argued that these principles hold true irrespective ofwhether a company is using a holistic approach to SCM, or a more focusedapproach.
The time compression approach – competitiveadvantage
The time compression approach can be applied at two levels – firstly, as aholistic approach in the context of the above principles, and secondly, as acompetitive market focus. The former can be regarded as an internal timefocus of the key supply chain processes that lie on, or close to, the critical pathof the business process. The latter is the supply chain’s external time that is ofdirect value to the customer. Both are interdependent and have outcomes thatare strategically significant.
Referring to business strategy, Ohmae (1965) states that competitivenessrelates to three basic elements: the customer, the competition and thecompany. There must be differentiation between the elements of value andcost if competitiveness is to emerge. A TC approach addresses these twosources of differentiation in a specific way. The first objective must be theelimination of non-value activities, ie waste, thereby maximizing the valuecreated in the supply chain. The removal of non-value activities in turn givesrise to a cost advantage, hence forming the basis of cost differentiation.Tersine and Hummingbird (1995) state that ‘managing time is the mirrorimage of managing quality, cost, innovation and productivity. Reducingwasted time automatically improves the other measures of performance in amultiplier fashion.’ If, however, companies go for the reverse and apply costreduction initiatives without a reference to the time-based implications, addi-tional costs may be incurred elsewhere in the supply chain. An examplerelating to inventory positioning demonstrates this point. At the outset of acost-reduction initiative it might be argued that upgrading a warehousemanagement system (WMS) will deliver cost advantages. It may, for example,reduce product storage and retrieval times, and drive cost reductions asso-ciated with resource utilization. However, a time-based examination of the

78 � Global logistics
Table 5.1 SCM principles relating to time
Nature of the principle Useful attributes of a timecompression approach
The principle Long-term supply chain Time compression requires thatof end-user profitability is dependent on the the end user is identified as thefocus end (ultimate) user being satisfied. principal anchor point. This
This acts as the focus for all supply provides the focus for all time-chain design, development and based parameter measurementprocess engineering. across the supply chain.
The principle of Different end-user needs are Time defines the principalhorizontal more competitively satisfied by characteristics of the logisticallyboundary channels (horizontally defined distinct channels and servicedefinition routes or workflow) designed needs. The time compression
and engineered ideally across approach provides a goodthe supply chain from a logistics diagnostic and basis for redesign.service perspective.
The principle of Boundaries of ownership and The consumption of non-valuevertical control (dividing the chain time highlights where ownershipboundary vertically) should be positioned and general boundary issues definition to suit the needs of the end user exist and require adjustment.
according to best practice andmake–buy theory.
The principle of The positioning, levels and Time and cost provide a goodinventory characteristics of inventory are deterministic framework withpositioning best determined in a total supply cycle time as a fundamental
chain context to suit end-user driver of stock positioning, levelsneeds in line with stock and and service. ‘Value-add stock’ is apostponement theory. time-based diagnostic.
The principle of Understanding and levels of Time measures the problem andcontrol over control over demand dynamics time compression tackles the rootdemand are best achieved by having a causes of demand dynamics.dynamics holistic supply chain perspective.
The principal basis is throughinformation integration and theuse of best-practice relationshipmanagement.
The principle of The attainment of the above Time provides a common andcooperation and principles requires cooperation trustworthy metric across thecoordination and coordination between supply supply chain that highlights the
chain participants. For this to opportunities and issues.work effectively each supplychain participant must haveself-defined and motivatingobjectives based on trust andsome common business aspirations.

Time compression in the supply chain � 79
holistic business process asks whether the particular segment of the supplychain could operate on a just-in-time or a make-to-order basis. This totalsupply chain perspective may remove or displace the stock point – and hencethe requirement for a WMS. In addition, if process times are compressed inother parts of the supply chain, the economic structure of the supply systemmay change the appropriate locations for inventory stock points, and theshort-term cost savings associated with the proposed warehouse systemcould be negated by a new inventory regime. If the new WMS is still installed,the associated payback demands may impose an inappropriate constraintpreventing future supply chain optimization – with ramifications in terms ofcost, service levels, flexibility and agility.
The time compression approach – cost advantage
Cost reduction generally occurs as a direct result of the removal orcompression of non-value-added time. This time compression can result in anumber of cost savings associated with the removal of fixed and variable over-heads (such as rent and management), direct costs (such as labour and mat-erials) and working capital. Other cost savings depend on the nature of thecompression, perhaps minimizing risk in the decision process by makingrelevant information available earlier in the process. The reduction – or evenremoval – of a rework activity can result from process change such ascompression of information queues. These improvements can also have rami-fications downstream and upstream in the chain, by reducing or removingexpediting activities that are in place to deal with ongoing inadequacies.
The cost implications of compressing time are extensive and complex – butrarely absent. This is why the prescribed approach is to focus on time thatdirectly affects the service a supply chain can offer, without the complicationsof identifying every cost ‘trade-off ’. In the past, this cost-based focus has beenencouraged by the use of performance measures linking profit margins withcost. With the TC approach there may be a requirement to determine costvalues associated with the processes, to assist with evaluation and projectprioritization. Generally, the time-based implications of any proposal are easyto comprehend and quantify, because the length of time consumed by theprocess is proportional to the costs (New, 1992).
The SUCCESS programme, a joint university and industry initiative,developed a toolkit called supply chain time and cost mapping (SCTCM) tocombine time-based process mapping with process cost analysis. The formerhighlights opportunities using value-add analysis (see Figure 5.2) and thelatter translates and attributes functional costs to processes. SCTCM has thebenefit of showing how time, value-add and cost interrelate along the supplychain. This can be useful for prioritizing projects, analysis and gaining buy-into the TC approach. However, the benefits have to be weighed against the

need to collect vast quantities of cost data and the risk of prolonging totalproject duration. It may also be an issue when the cooperation of processowners and operators is required, because it can then be perceived as a cost-cutting exercise. As a consequence, using these individuals to help with datacollection, analysis and solution design may be challenging. However, SCTCMis a positive recent development that keeps TC on the re-engineering agenda.
The time compression approach – quality advantage
The achievement of time compression requires a quality-based approach. Thiscan be viewed from two perspectives of quality. First, TC demands that productquality matches customer needs. Anything less obviously has strategic marketimplications, such as a loss of customers and goodwill. This adds unnecessarytime in the sales, marketing and manufacturing, which have to rectify or replacethe product or customers. An investigation of these time-wasting activities can,therefore, highlight possible root causes of problems that may be founded inquality issues. Time, therefore, provides the focus for quality improvement.
The above complements the second dimension of quality, where it isimportant not just for the customer but also for the company. This is the totalquality management (TQM) approach, which also focuses on waste elimination.One key issue with TQM programmes is that they have been known to loseimpetus because of a lack of focus. A lot of evidence demonstrates the need for aholistic approach to provide a focus for TQM to operate effectively (Mallinger,
80 � Global logistics
Time ScaleB
usin
ess
proc
esse
sConsumer
delivery
Goods in
Management
indecision
Value
adding
Queue
time
Re
time
Production
Direction
of process
Time scale
Rework
Figure 5.2 Time-based process mapping – value-add analysis

1993). A TC approach provides this because it uses a simple measure that isvisible to the total supply chain and not just a small isolated segment. It can thuslink and integrate all of the elements of a TQM approach using the key metric oftime. An example of this might be a focus on the time taken to make critical deci-sions that constrain an order or product batch being processed. Typically salesand operations meetings to match demand and production may represent thisprocess constraint, as illustrated in Figure 5.3. By implication the lapse time ofthese meetings sits on the critical path of any supply chain process. The majorityof this time is non-value-add and therefore provides a focus for addressing thetotal quality of all activities that interplay with the process. Examples include themajor quality-related aspects such as having systems to produce accurate andtimely information, through to more routine but easily underestimated aspects
Time compression in the supply chain � 81
1 2 3 4 5 6 7 8 9 10 11 12 13 14 15 16 17 18 19 20 21 22 23 24 25 26 27 28 29 30 31 32 33 34 35 36 37 38 39 40 41 42 43 44Retail Wholesale Warehouse Assembly Ends Ingredient/Component Production Ends Process 1 starts < Process 2 starts
110 11 12 13 14
1
1
1
1
6 7 8 9 10 11 12 13 14 13 14
1
1
1
2 1
1
28 29 30 31 32 33 34 35 36 37 38 39 41 42 43 44 45 46 47 48 49 50 51 52 53 54 55
7 6 5 4 3 2 1
7 6 5 4 3 2 1
1
7
1
24
1 2 3 4 5
3 2 1
6 5 4 3 2 1
1
1 2 3 4 5 6 7
1
1 2 3 4 5 6 7 8 9 10 11 12 13 14 15 16 17 18 19 20 21 22 23 24 25
1
1
1
1 2 3 4 5 6 7
1
1
1
1 2 3 4 5
1 2 3 4
1 2 3 4
1
1
1 2 3 4 5 6 7
1
1 2 3 4 5 6 7 8 9 10 11 12 13 14
1
Retail stock
Wholesaler stock
Finished goods
Semi-finished
Raw materials
Decisions
Total supply chain process time
Grey bars = Stock
Non-shaded = Process
Duplicate stocks
Disintermediation
End customer
Production
1
1 2 3 4 5 6
1
1 2 3 4 5 6 7 8 9 10 11 12 13 14 15 16 17 18 19 20 21 22 23 25 26 27
3 2 1
1
1 2 3 4 5 6 7 8 9 10 11 12 13 14 15 16 17 18 19 20 21 22
5 4 3 2
Figure 5.3 Time-based process map of an entire supply chain

82 � Global logistics
such as people attending meetings on time, effective communications andproper prioritization of tasks and activities.
Figure 5.3 shows the key processes in a supply chain, with value analysisrevealing that the parts shown in bold (duplicate stocks, decisions and disin-termediation) are key issues. The longest process time in this example was thedecision-making process, which takes 14 days and is the largest element of thefinished goods lead time.
The time compression approach – technologyadvantage
Technology should not be applied purely for reasons associated with what ison offer or mimicking the competition. Its application must take account ofthe individual circumstances of the business and its customer needs – andthen ensure a competitive differentiation. A focus on the time-based impactof the application of technology will help steer a company to this goal.Examples of technologies that can achieve TC are numerous, and some of themore notable developments (Barker and Helms, 1992) include computernumerically controlled (CNC) machines, robotics, computers in manufac-turing (CIM) – and logistics-related examples such as the WMS applicationmentioned earlier. All of these reduce time for individual activities, but thetime-based impact must be considered holistically in order to check that thetechnology is appropriate for the supply chain. A key point is that manyautomated systems cannot cope with high levels of demand variation,largely because the technology is designed to exacting functional specifica-tions. A TC approach provides a focus for the application of technologywhen the seven strategies identified by Carter, Melnyk and Handfield (1994)are addressed in a carefully considered sequence. This usually considers thelow- or non-technology strategy before moving to state-of-the-art automatedsolutions, such as computerized material handling and control, or thevarious forms of ERP. This approach ensures that the application of tech-nology is strategically significant as well as delivering tactical productivitygains.
The time compression approach – customer focus
Different product and market sectors have different service needs. The mostappropriate way to meet these needs is through channels that are specificallydesigned to have distinct logistical capabilities. The alternative is to pusheverything through the same channel – with the result that some customersare overserved while others are underserved. This has an adverse effect oncosts, customer goodwill and ultimately sustainable profitability.

Figure 5.4 illustrates four generic supply categories for relating logisticschannels to different product and market segments (adapted from FhG ISI,1993). This shows that products with a volatile demand pattern and lowcomplexity require flexible supply operations to minimize risk. An agileapproach is required so that the business process can respond rapidly to newcustomer requirements in a market that is populated by ‘fast follower ’competitors enabled by low product complexity. Conversely, products thathave more stable and predictable demand are usually in more cost-focusedsupply situations demanding lower unit costs through tighter managementcontrol and probable large economies of scale.
There are, therefore, two basic supply approaches – one where a businessmust be agile (for example, a high-fashion garment supply chain) and asecond one lean (for example, commodity products such as industrial chem-icals). A range of products lie between these extremes and may require a mixof both approaches. Quadrant 1 represents super-value goods such asaircraft. These are highly complex items sold into markets with some uncer-tainty and influenced by fluctuating business cycles – and, therefore,requiring process agility. However, some lean approaches will be required to
Time compression in the supply chain � 83
Figure 5.4 Generic supply strategies
Agile
Agile
Lean
Lean
1 23 4
High
High
Low
Co
mp
lexi
ty
Certainty
Unstable, volatile,short life cycles,flexible supply,risk reduction
Stable,high volumelow unit cost,long lead time/high finishedgoods stocks,minimal waste,variety controlled

underpin the longer-term investments in a supply market that has the time toevolve and apply competitive pressure. Quadrant 2 is the converse ofquadrant 1, as it is characterized by FMCG products, which generally sell tomore consistent market conditions, giving high competition – and the needfor a lean cost focus. This, however, is mixed with some need for agility inareas linked with product development and innovation.
Benefits of time compression
There are two categories of TC benefit. The first is internal time consumedwithin the organization, which has an indirect impact on the customer. Thesecond is external time, which relates to all aspects of time that have directimpact upon the customer, such as lead time from a stock. The net effect ofinternal time improvements has ramifications on external time-based benefitsthrough cost and service interrelationships.
Internal time benefits in most manufacturing facilities, such as cycle-timereductions, give work-in-progress reductions and productivity increases.Stalk and Hout (1990) claim empirically that, for every halving of cycle timesand doubling of work in process turns, productivity increases 20 to 70 percent. A halving of manufacturing lead time using the same number of peoplereduces costs by 50 per cent. These changes are reflected in the return onassets where increases of 80 per cent are possible, with 45 per cent less cashrequired to grow the company at an equivalent rate.
Generally, the longer the elapsed time in the supply chain, the greater therisk of under- or over-forecasting demand. This results in the use of specu-lation stock for future customer needs (Mather, 1992). If, for example, afashion-associated product has to be ordered from the Far East nine months inadvance, then the risk of forecasting error is high. Consequently, the potentialcosts of markdowns are high where large stocks of inventory are held; andconversely, where minimal stocking or understocking occurs, the opportunitycost of lost sales and goodwill is substantial. The key point for TC is that, iflead times are compressed, not only is cycle stock reduced, but the period overwhich forecasting has to be performed reduces – and the shorter the period,the better the forecast accuracy. The better the forecast accuracy, the lessdemand variance will exist and the less buffer or safety stock is required. Lessoverall demand for inventory means that less has to be produced and supplyprocesses can respond more promptly.
The internal benefits provide scope to assist the external benefits of TC.The primary aspect to consider is the consequence of compressing customerlead times and the opportunity to increase business turnover and possiblyprices. Stalk and Hout (1990) infer that customers of time-based suppliers arewilling to pay more for their products for both subjective and economicreasons:
84 � Global logistics

Time compression in the supply chain � 85
� The customer needs less stock (cycle and buffer).� The customer makes decisions to purchase nearer the time of need,
thereby reducing risk.� There is a reduction of cancelled/changed orders, with less time available
and less need to change.� There is an increase in the velocity of cash flow.
The factors influencing risk have an implication on market share. By beingfaster and more reliable than the competition, market share can be increased.A time-compressed supplier can use its flexible delivery system to supplyincreased variety to the customer in the form of increased style and/or techno-logical sophistication. If this is delivered with a response advantage, the time-compressed supplier will attract the most profitable customers. Conversely,competitors will be forced to service the customers who are prepared to waitand, as a consequence, be prepared to pay less for the product. Generally,time-compressed suppliers appear to grow at three or four times the rate oftheir competitors, three times faster than overall demand, with twice the levelof profitability. When the slower competitors decide to become time-basedthey must do so from the disadvantaged position of having to incur the costsof regaining market share.
Experience from the University of Warwick’s Time CompressionProgramme (TCP) has shown that the general price and market shareadvantage must be considered in the context of the local market and the logis-tical characteristics of the product being supplied. For example, in the UKduring the 1990s the spectre of cheap overseas sources became a reality, andTC enabled companies such as H&R Johnson to optimize their businessprocesses and retain market share for ceramic tile products, rather than gain aspecific price advantage. However, some price advantage can be achieved intime-sensitive market segments such as high-fashion products, where processtime from design to full-volume production gives a sustainable strategicdifferentiation over competitors.
Demand acquisition methods such as customer relationship managementhelp predict, define and place new customer demands at suppliers with shorttimes. The need to respond to this level of rapidly communicated customertransparency has become the new competitive frontier. Companies that donot adjust their business processes fast enough will quickly lose ground tocompetitors. Agility coupled with lean is the key, with a focus on the use of TCas an enabler of process delivery and reinvention.
Examples of the application of time compression
Many companies in the United States, Japan and Europe use a TC approach,either as an open policy or as something philosophically buried within the

strategic mix (Stalk and Webber, 1993). Table 5.2 illustrates results from anumber of TCP projects.
Time compression of a global supply chain
The following case study has been compiled from a number of projects todemonstrate a diverse range of applications within one example. The hybridexample demonstrates a combination of TC strategies, focused on a number ofthe supply chain principles. The principles addressed are in bold and thestrategies are denoted in italics.
The example considers a major Western retailer sourcing from a low-costmanufacturing nation. Two categories of product are considered. The first is aproduct group that has stable demand but a low margin, owing in part tointense competition. This might be, for example, wall fixings such as screwsand nails, and requires a lean supply chain to capitalize on the stable demandand underpin a low-cost solution. In contrast, a fashion product such aswomen’s skirts has less stable demand, with more scope for higher margins as
86 � Global logistics
Table 5.2 Results from a sample of TCP projects
Company Scope of the Compression Strategic significanceproject achieved of the improvement
H&R Customer lead Two weeks to To counter competitive importJohnson times. two days. products and retain a
strategic segment of the market.
Massey Process Reduced by To reduce cost of inventory byFerguson time. 20 per cent/ compressing cycle times via a
manufacturing cell.
British Warehouse link Two days’ To maximize on aircraft flyingAirways removed. compression. hours, reduce inventory costs
and increase asset utilization bymoving into a contract market.
Fairey Component 50 per cent Retain market share and reduceHydraulics arrears. reduction. inventory costs.
GKN Hardy Inbound Reduced by Reduce raw material and Spicer logistics. 85 per cent. operating costs to maintain
competitiveness.
CV Knitwear Time to develop Reduced by To meet the customer’s time-product. 50 per cent based requirement for an
increased number of ranges eachyear. Customer retained.

there is – in the short term – limited competition from product replicas orsubstitutes. To cope with the higher demand variability, the fashion productsupply chain must have the ability to react to change by fast product replen-ishment or product reinvention. The supply chain has to be agile rather thanlean, with emphasis on risk mitigation rather than cost minimization.
This form of product categorization enables supply chain design (or re-engineering) based on the end-user focus, which is highlighted by the needfor different levels of flexibility and costs. These end-user demands translateinto logistical requirements that can be met by specific logistic (horizontal)channels design. A key aspect in the design of any channel is the inventorypositioning, and this depends on supply and demand variability, coupledwith lead times. These factors suggest appropriate types of inventory, held inspecific quantities at strategic locations within a channel. An example of anagile channel has inventory held close to the retailer, but in semi-finishedform – thereby postponing final assembly at a location with a short lead time,and low risk exposure. Products designed using standardized components andmodules lend themselves to postponement.
The majority of supply chains are owned by different legal entities (such ascompanies) and also under the influence of different organizations (such asdepartments and employees). These entities interact with each other andcreate areas of focus and specialization along the supply chain, as well asconstraints and check points (eg for quality or variance control) at the variousinterfaces (vertical boundaries). The operation of any channel is stronglyinfluenced by the position of these vertical boundaries and the influence thatthey exert on the supply chain. The boundaries must, therefore, be designedand negotiated into the channel after considering the make–buy decision, andbest-practice outsourcing and process design. In our two-channel example, akey question is who should own the inventory. Often the weakest channelpartner is left with the cost of ownership, but in an agile or lean supply chainthe suppliers may own inventory in the retail store. This might be for good,logical reasons of control and focus in a retailer that has to consider thousandsof other product lines.
Ownership of the inventory, the process or the company entity is a majorconcern, and hence the focus on conflict resolution in supply chains, withaspirations to partnership. At a more generic level, some form of cooperationand coordination is always required between various interfaces along thesupply chain. System-based exchange of information and data has trans-formed the way supply chains can operate. For example, systems (genericallya form of automation) allow rapid transfer of data globally along supply chains.For practical purposes this is usually instantaneous (concurrent working) andintegrated with interconnecting process links. In our agile channel example,retail sales information can be made available to the supplier on the other sideof the world. The supplier can respond accordingly and authorize any replen-ishment orders on behalf of the retailer. This form of linkage alleviates the
Time compression in the supply chain � 87

effects of demand dynamics where time delays in the supply of informationalong the chain create uncertainty, causing suppliers to perform non-value-adding tasks and incur unnecessary costs.
The final aspect of this example considers the inbound flow of materials tosupport manufacturing operations. There is a tendency to focus on parts ofthe supply chain that directly affect customers, to the exclusion of theinbound supply chain. However, there is often scope to investigate and mapthe entire inbound supply chain and consolidate it into horizontal channels,and to simplify the flows using a unified approach to handling raw materials.In the example of fixings, the metal rods, chemicals and other materials allarrived at the factory through a range of different channels, some with directdelivery through a carrier network, some supplied in bulk to the factory ware-house, some supplied from a vendor’s regional warehouse – or a combinationof all three through a range of providers. An equal level of complexity andvariety existed to support the range of information flows and communi-cations. Typically these supply arrangements and associated communicationcomplexities arise for historical reasons and establish themselves over aperiod of time.
The inbound supply chain sustains manufacturing, but often no one canidentify the logistical cost, as this is hidden within the procurement cost. Andthe complexity of the channels makes service level agreements difficult tomanage, giving rise to safety stocks and non-value-add cost. The inboundsupply chain can be mapped from a time, cost and value-add perspective.Horizontal channels of supply are identified, and possibly a neutral third-party logistics provider is given responsibility for delivery. This consolidatesflows and gives a new focus on the factory as a customer of logistics servicesand not just a product manufacturer. Resource allocation in terms ofinventory, transport, warehouse and IT capacity is designed into the solutionon the basis of balanced service and cost.
Conclusion
Time, as a measure, is strategically significant for business. The potential fortime compression in most businesses is very significant – with non-value-addtime in most processes of at least 95 per cent. The commercial benefits arewide and include increased market share, price, productivity and innovation,together with reduced levels of commercial risk.
TC gives a mechanism for addressing most aspects of business strategy, andoverarches the key objectives associated with in-company logistics andmanaging the broader supply chain. Six principles aligned with the latter havebeen identified and linked to a time-based approach. To identify and achieveTC objectives, tools such as time-based process mapping have been developedand coupled with a strategic re-engineering framework.
88 � Global logistics

The approach supports a new source of competitiveness for time-sensitivemarkets and, as a focusing criterion, it enables one company or supply chain tobe compared with another in terms of the internal and external benefits of time.This can provide the impetus for change and improvement. Even in marketsthat are not time-sensitive, it is difficult to argue that benefits cannot be acquiredfrom TC. The approach does, however, require a top-down commitment – andfor full impact a lead organization within a supply chain needs to drive theinitiative. This becomes a challenge where trust is an issue, and there is the needfor an unbiased hand to guide, arbitrate and have a stake in the process.
Looking towards the future, companies must blend leanness with agility inorder to respond to at least two key challenges. The first is to ensure thatsupply chains are designed, operated and evolved to meet and drive end-userneeds. The second is to manage the supply chain in a dynamic commercialenvironment that is making network management – rather than supply chainmanagement – a challenging reality. The TC approach’s simplicity and trans-parency across company and functional boundaries provides a good platformfor meeting these challenges.
References
Barker, B and Helms, MM (1992) Production and operations restructuring:using time based strategies, Industrial Management and Data Systems, 92 (6),pp 3–7
Barker, RC (1994) The design of lean manufacturing systems using time-basedanalysis, International Journal of Operations and Production Management, 14(11), pp 86–96
Carter, CR, Melnyk, PL and Handfield, SA (1994) Identifying Sources of CycleTime Reduction, Quorum, Westport, CT
European Logistics Association (ELA)/AT Kearney (2004) Excellence in Logistics,ELA, Brussels
Fraunhofer Institut fur Systemtechnik und Innovationsforschung (FhG ISI)(1993) Factory for the Future, FhG ISI, Karlsruhe
Lamming, R (2002) Lecture to Thames Valley Supply Chain Network GroupMallinger, M (1993) Ambush along the TQM trail, Journal of Organisational
Change Management, 6 (4)Mather, H (1992) Design for logistics, Production and Inventory Management
Journal, 33 (3)New, CN (1992) The use of throughput efficiency as a key performance
measure for the new manufacturing era, Cranfield School of Management,BPICS Conference
Ohmae, K (1965) The Mind of the Strategist, Penguin, HarmondsworthReich, RB (1991) The Work of Nations, Simon & Schuster, New YorkStalk, G and Hout, TM (1990) Competing against Time, Free Press, New York
Time compression in the supply chain � 89
Stalk, G and Webber, AM (1993) Japan’s dark side of time, Harvard BusinessReview, July–Aug
SUCCESS (2004) The route to success, Project Manager’s Handbook, CranfieldUniversity, Cranfield
Tersine, RJ and Hummingbird, EA (1995) Lead-time reduction: the search forcompetitive advantage, International Journal of Operations and ProductionManagement, 15 (2), pp 36–53
University of Warwick (1995) Time Compression Programme conference: Profitfrom Time Compression, Birmingham International Convention Centre
Womack, J, Jones, D and Roos, D (1990) The Machine that Changed the World,Harper Perennial, New York
90 � Global logistics
Strategic supply chainmanagement: the power
of incentives
Glyn Watson, Chris Lonsdale, Andrew Cox and Joe Sanderson,University of Birmingham
The study of supply chain management is the study of incentives. Supplychain managers and their vendors are competitors as well as collaborators.The mutual gains from trade bring the parties together in the first place.Additional benefits accruing from closer collaboration can keep them workingtogether thereafter. However, the value generated from the exchange processmust be distributed and this is what makes buyers and sellers competitors aswell as collaborators. Consequently, the function of the supply chain manageris to ensure that the interaction between the buying and the selling organi-zation generates as much value-add as possible – but that the value-addpasses to his or her organization, rather than being retained within the organ-ization of the vendor. In order to achieve this, the supply manager must beskilled at crafting the incentive structures that will modify the behaviour ofthe vendor in ways that are consistent with the interests of the buying organ-ization. It is for this reason that the study of supply chain management is thestudy of incentives.
This chapter divides into three sections. The first section deals with theincentive issue itself by establishing its central importance to supply
91
6

92 � Global logistics
managers. The second section focuses on the topic of outsourcing. Undercertain circumstances it will be impossible for the supply manager to incen-tivize its vendor effectively. Having such activities outside the boundary ofthe organization, therefore, not only threatens to inflate the costs of the buyerbut may also undermine the firm’s revenue streams. Knowing where to drawthe boundary of the firm is integral to the development of supply chaincompetence. Once the boundary has been drawn the supplier has to bemanaged. Supplier management is the subject of the third and final section.Here it is suggested that effective supplier management has as much to dowith the management of demand as it does the management of supply.Therefore, the third section divides into three parts. It begins with somegeneralized comments before turning to the topic of demand managementand the consolidation of spend. In the final part of the final section, the subjectof the suppliers themselves receives attention. Here, questions both of gover-nance and of contractual management are covered.
Incentivization and the process of exchange
All exchange involves elements both of cooperation and of competition.Assuming that the concerned parties have voluntarily agreed to the deal, thevery act of signing a contract is a cooperative activity. The vendor (or seller) isgetting something that he or she wants – cash – while the buyer is gettingsomething that he or she wants – the products and services supplied by thevendor. However, the cooperative aspects of an exchange can (and frequentlydo) go beyond this. Buyers and sellers can actively work together tostreamline the contracting process and/or adapt or develop the vendor ’sproducts and services so that they more closely match the requirements of thebuyer. The creation of such value-adding relationships has today become astaple of supply chain management.
Buyers and sellers are also in competition, however. While both sides gainfrom a trade (else why trade in the first instance?), it is not necessary forboth sides to gain equally for a trade to take place. For the buyer, the aim is toget value for money from a deal. If the buyer is a rational agent this meansmaximum value for money. Every time he or she is able to negotiate theprice down a notch, the value for money that is obtained increases. Ofcourse, for the vendor, passing value to its customers means smaller profits.Economists refer to the contested ground that exists between the two partiesto a trade as the surplus value. Surplus value is the difference between thevalue that the customer places on the vendor’s products (ie the customer’sutility function) and the supplier ’s costs of production. That portion of thecontested ground that passes to the customer is said to be the consumersurplus, while that which is retained by the vendor is the producer surplus(see Figure 6.1).

Even when buyers and sellers increase the cooperative element of anexchange by actively working together to add value to the relationship, thecompetitive element remains – so cooperative relationships can be adver-sarial or non-adversarial. This is because the fruits of the cooperation (in theform of either lower production costs for the vendor or a higher valuation ofthe vendor’s products on the part of the customer) have to be divided up (seeFigure 6.2). If, for example, the effect of collaboration is to reduce thesupplier ’s costs by £100 a unit, there would be an issue about whether thevendor should pass all of the savings on to the customer or whether it shouldretain some of them in the form of higher profits. Alternatively, if thesupplier invests £100 in developing its products and as a result increased thevalue to the customer by £200, should the vendor raise its prices by £100 tocover just the cost of the investment, or by the full £200?
What determines who wins out in this competitive process is the incentivestructures that underpin the exchange relationship. Take, for example, thevendor that finds itself in a highly competitive market where its manycustomers are free to pick and choose where they buy their goods and services.Such a context forces the vendor into a Dutch auction in which it is forced
Strategic supply chain management � 93
Producersurplus
Consumersurplus
£ sterling
200 250 300 350 400 450 500 550 600 650
PRICE
Cost of producing the vendor ’s
product
Value of the product to the
buyer
Surplus value
Final contract
Buyer wants to move price Seller wants to move price
Figure 6.1 The allocation of value in an exchange

constantly to drop its prices to buy its customer’s business. In such a situation,the surplus value is bound to pass to the consumer. Compare that to a situationin which a particular customer has invested heavily in the vendor’s tech-nologies, even building the value proposition that it offers its own customersaround the technologies of a particular supplier. This happened in the case ofthe PC market, where PC manufacturers fell over themselves to advertise thefact that their machines had an ‘Intel inside’. In the end, it became impossiblefor PC manufacturers to compete unless they were able to make this boast.Unfortunately, this had the effect of handing enormous leverage over to Inteland as a result the surplus value passed from the consumer to the producer.
94 � Global logistics
Figure 6.2 The generation of value-add in an exchange
Surplus value
200 250 300 350 400 450 500 550 600 650
Cost of producingthe vendor ’s
product
Value of the product to the
buyer
The vendor can add value by
cutting costs
The vendor can add value by improving its
products
How much of the additional value goes to
the vendor and how
much goes to the buyer?
How much of the additional value goes to
the vendor and how
much goes to the buyer?

Consequently, much of supply management is reduced to a game betweenpoachers and gamekeepers in which the vendor assumes the role of thepoacher (trying to ‘steal’ its customers’ scarce financial resources), while theprocurement manager assumes the role of the gamekeeper, in trying to stopthem. What follows is a cat-and-mouse game in which through a combinationof guile and the development of distinctive capabilities the vendor attempts toclose markets, while the procurement manager responds in kind with a rangeof counter-strategies, designed to stop its vendors by keeping its supplymarkets contested. To the victor go the spoils. Power (formally defined as theability of one party adversely to affect the interests of another) and the pursuitof power are at the heart of the exchange process (Lukes, 1974; Cox, Sandersonand Watson, 2000; Cox et al, 2002).
To some it might appear that the competitive elements of an exchange havebeen overstated. While it is true that some people in life are maximizers (iethey are always looking for the highest possible return from a deal), criticswould argue that most people are in fact happy just to satisfice (ie obtain asettlement that provides them with a deal that they can live with). If twopeople cooperate on a venture, then generally speaking those people arehappy to split the proceeds. This may or may not be true: it is hard to say.What is true, however, is that such an approach is sub-optimal andimprudent. That satisficing is sub-optimal should be self-evident. The factthat it is also imprudent needs further elaboration.
The issue of prudence arises in a number of contexts. Firstly, it puts the prof-itability and even the survival of a firm at risk. The reason that firms come intobusiness in the first instance is to make a return for shareholders. While it is true,as a number of resource-based writers have observed, that markets are oftenheterogeneous (ie they are capable of supporting laggards as well as world-beaters), it is not true that markets are infinitely forgiving of the weak (Peteraf,1993). Firms that fall too far behind the competitive frontier are on borrowedtime. Firms that forget about the competitive elements of an exchange, however,risk seeing their costs rise and falling behind the competitive frontier.
The second problem with cooperation and trust is that it demonstrates anunwarranted confidence in the capacity and willingness of others to recip-rocate. Many firms that acquire leverage are happy to use it. Even those thatdo not possess a structural advantage may attempt to use guile instead, wherethey think it will pay off for them. Furthermore, denials that this is not truecannot be taken at face value (Williamson, 1985). The thing about people isthat very few of them are honest all of the time. One only has to reflect onone’s own experience to see that this is true.
According to business economists, economic agents are not simply self-inter-ested but they pursue this self-interest with guile – not all of the time, but suffi-ciently often that opportunism is a fact of commercial life. What permits theexistence of opportunism is two things: 1) a lack of honesty (obviously); and2) a lack of transparency between buyers and sellers. Economists distinguish
Strategic supply chain management � 95
between public and private information (Molhow, 1997). Information isregarded as public if it involves something that is widely known. Informationis regarded as private when access to it is restricted. When ‘restriction’ meansthat one side in an exchange knows something that the other side does not,then an information asymmetry is said to exist. It is information asymmetrythat permits dishonesty to pay.
Business opportunism exists in a number of forms, but for buyers the threeguises in which it is most common are adverse selection, moral hazard and hold-up. Adverse selection is ex ante opportunism or misrepresentation that arisesprior to the signing of a contract. Shorthand definitions of the concept mightrevolve around buying a ‘lemon’ or being sold a ‘turkey’. The scope for adverseselection varies but is more common under some circumstances than others.Commentators often distinguish between search, experience and credencegoods. Search goods are products that allow buyers to make systematic compar-isons prior to a purchase. They are normally tangible products like chairs, pensor iron ingots. Experience goods, by contrast, are products that can only beevaluated subsequent to purchase. Typically, they include services like cinemasor restaurants. However, the category can also include tangible products likecars or records. The final category of good is the credence good. Credence goodsdefy easy evaluation, even after consumption. They include intangible servicessuch as advertising, consultancy or medical services. What makes evaluation sohard usually comes down to a difficulty with attributing blame or success. Forexample, a piece of professional advice might have been responsible for acommercial disaster. However, the blame might lie with some otherconcomitant factor. The point is, where pre-contractual evaluation of a productis difficult – either because evaluation is inherently difficult or because the buyerlacks the resources or expertise to undertake it – the buyer is open to the risk ofadverse selection. Experience goods and credence goods, by definition, aredifficult to evaluate prior to purchase.
If adverse selection involves being suckered before a contract is signed,moral hazard and hold-up involve being suckered once a party has signed onthe dotted line. Moral hazard is concerned with shortfalls in effort. Forexample, prior to an agreement, a consultancy company might promise todedicate its best staff to the task of servicing the client and set its costs accord-ingly. Unbeknown to the client, however, once the contract has been secured,the work is passed down to junior colleagues whose time is charged out atinflated rates. Alternatively, moral hazard may involve charging a client formaterials that were never used or that were used but came from another joband had been paid for by another client.
Hold-up occurs as a result of an extended association with a supplier, wherethe terms of the association cannot be fully specified in advance and wherethe association requires one of the parties to incur significant sunk and/orswitching costs. Over time the full requirements of the relationship arerevealed, and this combination of factors allows the non-dependent party to
96 � Global logistics

Strategic supply chain management � 97
renegotiate the terms of the deal in ways that are most favourable to it. Theexistence of high sunk and switching costs may also support blatantly oppor-tunistic behaviour in which the non-dependent party even reneges on itspromises that are covered by legal agreement. The calculation here is that anybenefit that can be obtained through legal redress will be insufficient tocompensate for the damage to, or loss of, the relationship.
Regardless of the form that opportunism takes, the potential for it means thatfirms must always be aware of the competitive nature of any trade. Even if acustomer is honest and believes in giving the other party a fair break, thecustomer cannot be sure that the other side is operating according to the samecode. Because a trade always involves some private information, we just don’tknow what we don’t know – and what we don’t know might turn out to bequite important. One of the essential elements of procurement and supplychain competence, therefore, centres on the capacity of buyers to ensure thattheir vendors offer a good deal (or at least keep to the terms of the deal that hasbeen agreed).
Incentivization and the outsourcing dilemma
Nowhere are the issues of competition between buyers and sellers more acutethan in respect to outsourcing. This is evidenced by the fact that so manyoutsourced contracts go wrong. One survey found that in only 5 per cent ofcases did outsourcing prove to be an unqualified success (Lonsdale and Cox,1998). Most respondents indicated that it was something of a curate’s egg –that is, good in parts. Thirty-nine per cent of respondents in the survey saidthat their outsourced contracts were simultaneously moderately successfuland moderately unsuccessful. Of course, this may have something to do withthe way in which the contracts were managed. Such is the scale of disap-pointment, however, that it suggests that something deeper than simply poorcontracting is at work.
On the face of it the decision to outsource should not be particularly prob-lematic. It should involve a simple cost comparison between the expensesassociated with undertaking the activity in-house as opposed to the expensesassociated with contracting it out. For example, the size of the firm’srequirement might be insufficient to cover the fixed costs associated withproduction in an efficient fashion. Under these conditions, sourcing exter-nally, from a firm that can amortize its fixed costs more efficiently, might makeeminent sense. Alternatively, a particular activity might suffer from a lack ofeffective managerial oversight. Managerial time within the firm is a scarceresource and most of it tends to be devoted to the firm’s key activities.Residual activities tend to get overlooked and production suffers as a result. Itis this thinking that underpins much of the core competence writing. If yourfirm can’t do something well, find another firm that can.

Outsourcing tends to go wrong, however, because it exposes the firm toeither a strategic or a contractual risk. Strategic risk arises if the firmoutsources its competitive differentiator. Within strategy, there are three typesof differentiation: cost leadership, product differentiation and nicheproduction (Porter, 1980). In each case the firm is attempting to break the rela-tionship between cost, price and profit in order that it might earn a sustainedproducer surplus. In a competitive marketplace, the consumer’s ability to pickand choose between alternative vendors drives the firm’s prices downtowards the marginal cost of production. This is the last thing that a firmwants.
With cost leadership the firm is attempting to profit by developing auniquely efficient production process that is difficult for its competitors toimitate, through the creation of ex post barriers to entry. So long as the firm isable to stave off competitive imitation it can afford to drop its prices belowthose of its competitors and still make a higher return. With product differen-tiation, the firm is attempting to develop a superior utility proposition for thecustomer. The idea here is that, when people comparison-shop and realizethat the firm’s products are better than those of its competitors, they will beprepared to pay a premium for the product that offers the higher utility. Againits ability to sustain its producer surplus and turn it into a rent is contingentupon its capacity to hinder or retard competitive imitation. Finally, nicheproduction also seeks to target the customer ’s utility. This it achieves,however, not by creating relatively superior products but by servicingsegments of a marketplace that nobody else is particularly interested in.
Being able to differentiate competitively is so valuable to the firm – andindeed is what strategy is all about – that firms must be able to protect thoseresources and capabilities that generate the differentiation in the first place.However, if the firm outsources such a resource or capability, then the oddsare that it will end up paying the rent to its supplier that it should be earningfor itself.
Outsourcing can also expose the firm to significant contractual risk. Again,this involves surplus value passing to the vendor, rather than being retainedby the consumer. Sustaining the performance of a vendor depends upon afirm’s ability to monitor or motivate the vendor. Monitoring becomes moredifficult after a competence has been outsourced because either the staff whoused to manage the activity move on to the supplier’s payroll, or else they arelost from the equation altogether. Once the organization lacks the resource, orat least a resource that is sufficiently qualified to exercise proper oversight, thesupplier starts to renege on its commitments.
Avoiding the risks of hold-up in an outsourced relationship involves main-taining motivational incentive. Such motivation might take the form of a carrot(bonuses for good performance) or a stick (the cancellation of the contract if theperformance is poor). But in order for the incentive structure to work, the threatof sanctions as a last resort must be credible. This means being able to monitor the
98 � Global logistics

supplier to see if it is complying with the terms of the deal, and having the abilityto punish the supplier (by invoking penalties or by threatening exit) if it is not.
The tasks that the firm has to perform, therefore, concern being able to spotthose transactions for which there is significant scope for opportunism andbeing able to craft safeguards against the risk. Where contractual safeguardscannot properly be introduced, then the firm would probably be better toretain the competence within the organization, rather than to outsource it.
Hold-up is always a problem with outsourced contracts because effectivemonitoring is always an issue. However, sometimes the risks are particularlyacute. Contracting that takes place in a highly volatile or uncertain envi-ronment is difficult because it raises the issue of renegotiation. Buyers attemptto draft contracts in as complete a fashion as possible, but when an envi-ronment is particularly volatile, specifying all the terms of an agreement inadvance is likely to prove next to impossible. This in itself need not present adifficulty unless the firm becomes locked in to its outsourced provider. If thishappens the supplier may choose to renegotiate on terms that benefit it,rather than its customer (Williamson, 1985).
As indicated in the preceding section, contractual lock-in occurs if thecontract requires the buyer to make some form of highly specializedinvestment in the relationship. The investment might take the form of time.An organization that has spent months negotiating and implementing anoutsourced relationship might be reluctant to write off all this hard work –especially if re-sourcing means repeating the effort with no greater chance ofsuccess next time around. Alternatively, firms might have made substantialand non-fungible investments in specialized training or equipment,otherwise known as asset-specific investments (Williamson, 1985). Less cred-itably, though, firms are often reluctant to call time on a poorly performingsupplier if the managers who negotiated the contract have a significantinvestment of reputation in the deal. Calling a halt to the affair meansadmitting that they got it wrong and nobody likes doing that. Whatever theform of the lock-in, the effect is the same: the firm loses its capacity to imposecosts on the vendor and thus its ability to impose discipline.
Of course, just because an outsourced contract presents the firm with a risk,it does not follow that the risk cannot be managed and that outsourcingshould not take place. One strategy often pursued by firms involvesunbundling a contract. This means separating out those elements that pose arisk from those that do not. The highly risky elements are retained in-houseand only the less risky elements are outsourced. The supplier may even beasked to post a bond or share the costs of the dedicated investments, as a signof its good faith (ie to show that its word of honour and commitment to therelationship are credible).
Strategic supply chain management � 99

Incentivization and supplier management
Outsourcing requires the firm to understand what it is that allows it toleverage its customers (in the case of strategic outsourcing) and what it is thatallows its ‘potential’ suppliers to exploit it (in the case of both strategic andtactical outsourcing). Effective relationship management is about reversingthings by understanding what it is that allows the firm to control and leverageits suppliers. The question is to what end? This is where we are required toreintroduce the subject of surplus value.
The first question that the firm must ask itself is whether the relationshipshould include a value-added element. Many commentators would argueyes, citing the benefits that often flow from extending the cooperativeelements of a trade. Lean thinking, for example, highlights the seven supplychain wastes that often plague buyer–supplier relationships. These relate tooverproduction, unnecessary inventory, waiting, motion, transportation,defects and inappropriate processing (Hines et al, 2000). Yet, just becauseextended cooperation might potentially generate additional value, it does notmean that it will, or that the buyer will be the main beneficiary if it does. Fourfactors play a part in determining the buyer ’s calculation about whethercooperation is worthwhile: the upfront investment, the potential pay-off,power and risk. Creating a value-adding relationship requires an investment,even if only in terms of the time and managerial effort that it involves. Thefirst thing that the firm must ensure is that the expected payback matches theupfront investment. No firm is going to spend a lot of time developing itssupplier of toilet rolls. The improvement for the buyer is likely to beminuscule compared with the effort.
What complicates the calculation is that both the investment and return maybe hard to determine ex ante. Take defence contractors. Suppliers of defenceequipment work closely with their customers (governments) to ensure that theweapons that they develop are the ones that the customer wants and needs.The industry, however, is notorious for the delays in introducing newequipment and the cost overruns. In a number of instances the additional costthat the customer ends up committing itself to runs into billions of pounds.When the equipment finally arrives, it may be too late to be useful. It may noteven work properly. Consequently, there is the issue of which party takes therisk and which party obtains the reward. This is a question of power. A simpleexample will illustrate the nature of the calculation that the buyer faces.
Take two firms: a buyer (A) and its supplier (B). B proposes to A that anupfront investment of £50 is capable of yielding cost savings of £200. In otherwords, the additional surplus value that has been created through the cooper-ation comes to £150. If A exercises leverage over B it will probably think thatcooperating is a good idea. As it has the power it will probably insist that Btakes all of the upfront risk, agreeing to cover B’s costs only if the initiative paysoff. This is a no-lose situation for A. If, however, A and B are interdependent,
100 � Global logistics

then the calculation becomes more complex. B will probably insist that Ashares both the investment and the reward. This means that A must invest £25(half the £50 cost) to get a payback of £100 (half the £200 cost savings). Thisleaves it with a net gain of £75 (£100 savings less the £25 costs). Once againcooperating makes sense – although the pay-off for the buyer is smaller than inthe first example. What if the costs are fixed but the gains are far from certain?Say, for example, there was only a 25 per cent chance of a successful outcome.Under these circumstances the firm would be investing £25 to get a 25 per centof £100 return. The cost–benefit calculation here is finely balanced (£25 cost less£25 return equals zero). Change the parameters again (eg increase the upfrontinvestment by £1) and the initiative may cease to make commercial sense. Thisis why power is so important to all relationships: it affects the pay-off struc-tures of buyers and sellers and thus over-determines the management of therelationship. It decides which side takes most of the risks and which sideextracts most of the rewards. Furthermore, the same calculation pertainswhether the firm is thinking in a dyadic or a wider supply chain context.
The second set of operational issues confronting organizations, therefore,relates to how they acquire or maintain a power advantage over suppliers.Buyers are aware that vendors segment their customer base. One simplesegmentation (which nonetheless is still widely used) involves the vendor cat-egorizing customers on the basis of the size of the customer’s business and thedifficulties associated with servicing it. The attempt here is to determine theoverall profitability of a specific contract to the vendor’s business. Obviously,what the buyer is looking for is large contracts that are easy (ie cheap) to service.What they are not looking for is low-value, costly and therefore nuisancebusiness. This is why the procurement functions within many organizationshave created commodity councils aimed at rationalizing specific items of spendso as to maximize their attractiveness, value or leverage to supply markets ingeneral and to specific vendors in particular. The hope here is that, if the buyercan select a supplier that is competent and whose interests dovetail with thebuyer’s objectives, then the buyer will get a better deal.
Incentives and the consolidation of demandHowever, creating this congruence is easier said than done. Operationally, thekey to effective supply management is usually effective demandmanagement, but as often as not a supply manager will experience consid-erable difficulty in getting the managers in other functions to recognize thispoint. In order to source effectively it is essential that buying organizationsdevelop appropriate specifications, avoid unnecessary, last-minute changesto specification, create regular patterns of demand, and ensure that as littlebuying as possible takes place outside of the organization’s commercial rules.Most importantly, however, it is essential that organizations do not unneces-sarily fragment spend, thereby spreading their demand across an artificially
Strategic supply chain management � 101

large number of suppliers. The reason for this is twofold. First, it raises trans-action costs – substantially in some instances. Second, it reduces the potentialleverage that the organization has over its suppliers. And, as has already beenindicated, generally speaking the weaker the leverage, the poorer the deals.
Of course, a certain level of fragmentation will always arise. For one thing,different business units within an organization often have very differentmissions and as a consequence have very different supply requirements.Additionally, when attempting to consolidate demand, organizations areoften confronted by legacy issues. Standardizing demand may offer only afalse economy if it is accompanied by significant write-off costs. Finally,organizations have to balance the short-term gains that may arise fromobtaining volume deals with the long-term risk that they may become overlydependent on a particular supplier. Over time, this dependence may translateinto higher prices and poorer service. Together, these factors combine tocreate what we can describe as a ‘natural level of fragmentation’ (Lonsdaleand Watson, 2005). This natural level can be defined as the point at which anyfurther consolidation results in a ‘net reduction in organizational perform-ance/welfare, notwithstanding any commercial gains that might haveaccrued from the consolidation initiative’. Where exactly this point lies willvary by commodity, organization and time.
Furthermore, where that point lies will often be one of the major areas ofdispute between supply managers and their internal clients. This is becauseissues of consolidation are as much political issues as they are technical ones.There are a number of reasons why an internal client may not recognize thatthere are benefits to be obtained from consolidation. First, there is the issue offunctional culture. Managers from different departments are usually func-tional specialists. Their specialisms may be largely commercial (as in the caseof sales or purchasing) or largely operational (as in the case of HRM orproduction). Alongside the specialized knowledge that resides in adepartment there is often also a strong functional culture. This culture reflectsthe training of staff but it also reflects the management priorities of particulardepartments. For example, because a production manager’s performance ismeasured in terms of faults or downtime, he or she is likely to be particularlysensitive to anything that might spoil or interrupt output. Such sensitivitymay be justified, if what is being proposed poses a real threat to operationalsustainability. For example, it would be ridiculous for an oil company toattempt to save a couple of thousand pounds on industrial valves if thedownside risk was several hundred thousand pounds in lost production if avalve fails. However, a natural sensitivity can easily become an unnaturaloversensitivity. The same production manager may refuse to participate in aninitiative that will save £60,000 because there is an infinitesimal chance thatthe new product might fail.
Second, there is the principal–agent problem. Principal–agent problemsarise because managers – and indeed all employees – have divided loyalties.
102 � Global logistics

For example, managers have a loyalty to the organization that pays theirwages. For many commentators, this loyalty constitutes (or should constitute)the manager’s primary loyalty. In practice, however, managers also develoployalties for those around them, and particularly departmental colleagues.And, less creditably, managers also have loyalties to their own interests(Milgrom and Roberts, 1992). Where firm or department and personal prior-ities conflict, it is often the firm’s priorities that are sacrificed.
This is significant from the perspective of a consolidation programmebecause, although such a programme is intended to benefit the organizationas a whole, it does not necessarily follow that consolidation will benefit alldepartments equally (or at all), or that the initiative will be without cost (orindeed that these costs will be evenly distributed). It is relatively easy formanagers to sign up to a consolidation programme if the supplier that will getmost of the business is the one they are already using, and the price beingoffered represents an improvement. It is less clear, however, that managerswould be enthusiastic if the new deal is more expensive, or if it involves thetermination of a relationship that is particularly valued.
Regardless of whether the dissent arises because mangers have failed tounderstand the advantages of the initiative or because they understand theadvantages for the organization but are anxious to avoid the costs to theirdepartment (or them personally), such dissent is likely to make implemen-tation problematic. Faced with such opposition, organizations have one offour options. Option one involves taking the path of least resistance anddoing nothing. Options two, three and four all require the organization toconfront the problem. Option two involves persuasion, demonstrating to themanager concerned that any fears are exaggerated or unfounded and settingthem against the very obvious benefits. This may or may not work. However,it is most likely to work where a hostile manager has misunderstood theissues involved. It is less likely to work when a manager understands theissues and realizes that the initiative is not in his or her particular interest.Under these circumstances, the supply manager may pursue option three –coercion. Coercion involves the threat of sanctions or the use of the organ-ization’s authority structures to override the opposition of the hostile party.The limitation of this strategy, however, is that the procurement functionoften sits towards the bottom of the organization’s hierarchy, and theprocurement manager lacks the clout to make credible threats. Furthermore,more senior colleagues may prove reluctant to intercede on the procurementmanager’s behalf if it involves confronting one of the organization’s morepowerful constituencies. Option four, therefore, is bribery. Bribery involvescompensating a manager for the costs of participation. It is perhaps notsurprising if a manager does not want to get involved in a consolidationprogramme if all of the benefits flow to the centre. However, if some of thebenefits can be passed back to the manager, then the initiative may appear tobe more worthwhile.
Strategic supply chain management � 103
Incentives and the management of suppliersThe final set of operational issues facing supply managers concerns themanagement of the chosen vendor itself. Supply management involves twoissues: relationship management and contracting. Relationship managementconcerns how the buyer and seller are going to interact on a day-to-day basis. Isthe association between the two essentially going to be an arm’s length one, or issomething closer going to be called for? If the firm has opted to pursue a value-adding relationship then presumably close interaction is required. Thecontracting parties will need to trade information, mutually adapt theirprocesses, etc, so the maximum value-adding potential is achieved. At the sametime, relationship management will also involve managing the tensions thatexist between the two. Some forms of cooperation, for example, might bedeemed neutral in the sense that they add value to the relationship withoutdisturbing the commercial balance within it. Other forms of cooperation,however, are far from neutral. For example, if the buyer calls for the supplier toopen its books, then the buyer is acquiring a considerable advantage over itssupplier in that it now knows just how much money the supplier is making fromthe deal. Bother buyers and sellers, therefore, want to manage the relationshipso that it adds value but does not tip the balance of power the wrong way.
In contrast to relationship management that tends to contain a value-addingelement as well as a controlling element, contracts are primarily about control.They are about specifying in a legally binding way the manner in which buyersand suppliers are to work together, ie who is responsible for doing what. Theyare also about specifying (again in a legally binding way) the outputs of therelationship – what the supplier is expected to deliver, what the buyer isexpected to pay and which party owns the rights to any exploitable tech-nologies or processes should they emerge from the association.
Conventional contracts take two main forms: tight and flexible (Williamson,1985). The shift from tight to flexible contracts tends to occur as the risk withinthe relationship increases. Risk, in this context, has a very specific meaning. Itrefers to events that can be foreseen but that have a probability of occurring ofless than one but greater than zero. Where the probability is one or zero (ie theoutcome is certain), this means that an element of a deal can be specified (orignored) with total confidence. This allows the parties to use a tight contract.For example, if an organization requires laptops for a hundred employees, it isrelatively easy for it to specify when it wants the machines, what it will payand what level of after-sales support it will need.
By contrast, where there is a lack of clarity surrounding particular aspects ofthe deal, but where the lack of clarity falls within clearly defined limits (ie wherethe probability is between one and zero), the parties may seek to include aflexible element to the contract to take account of this ambiguity. This allows therequirement/reward relationship to be adjusted in a predictable way. Forexample, an organization requiring the development of a new piece of software
104 � Global logistics

may know what is needed but may not know how long it will take to developthe new product. Because the organization is aware, however, that the mainvariable driving cost will be the labour hours required to develop the software,the terms of the contract are set out to reflect the range of potential effort levels.
However, some events are genuinely uncertain in the sense that they werenot or could not have been anticipated prior to reaching the originalagreement. Such events may range from occasional but devastating acts ofGod (or people) to the more mundane. For example, many IT agreements areentered into before the requirement has been properly worked out. Undersuch circumstances it is simply not possible to draft a contract flexible enoughto take account of all future possibilities. In the place of contracts, therefore,firms must use relational agreements. The purpose of such agreements is toprovide a structured framework within which the terms of a deal can be re-negotiated as the future becomes clear.
Although a buyer–supplier relationship may largely consist of one of thesecontrol mechanisms, on occasion it can contain elements of all three. Forexample, short-term, arm’s length relationships tend to call for tight contractsbut may include a subsidiary element. Longer-term arm’s length relationshipstend to require the flexible element to increase. Long-term cooperative relation-ships (whether they are adversarial or non-adversarial) tend to call for all three.
Of course, while contracts aim to serve as instruments of control, whetherin fact they succeed in this function depends on the ex post power balance. Aswe saw in our discussions on outsourcing and contractual risk, if the buyerloses his or her power then the contract may not be worth the paper that it iswritten on. As the political philosopher Thomas Hobbes once put it, ‘contractswithout the sword are but empty breath’. In the case of a tight or flexiblecontract the threat of the courts is only credible if they can be accessed at rela-tively low cost and if plaintiffs believe that they have a good chance ofwinning. Where fault is ambiguous or where an agreement has been poorlydrafted, then the use of a contract as an incentive mechanism will start tobreak down. The reluctance to use this mechanism may then be furthereroded by the fear that, if a plaintiff fails to make an effective case, the plaintiffwill also be saddled with the costs. In addition, the party may also have tomanage a disintegrating relationship while a replacement is found –assuming that one can be found in a timely manner.
In the case of relational agreements, where there may be no contract or atleast where the terms of the contract do not cover the issues in question, thecourts may not be an option at all. Neither might be the termination of theagreement. This is because the incidence of significant sunk and switchingcosts in arrangements that are likely to require a relational agreement tends tobe quite high. Observers like Williamson (1985) generally recommend thatparties look to mechanisms like the posting of hostages, which can beforfeited should the relationship collapse, as a way of maintaining somecontrol. And, if such arrangements cannot be agreed upon, they would advise
Strategic supply chain management � 105

106 � Global logistics
that either the organization look for a different vendor or else they shouldconsider the possibility of vertical integration.
Conclusion
Exchange takes place in the first instance because it is mutually profitable. Closerforms of cooperation occur because they can increase this level of profitability.However, mutually profitable exchange is not the same as equally profitableexchange. Buyers and sellers are competitors as well as collaborators.Consequently it is important for supply chain managers to understand thefollowing things. First, they must understand when it is not sensible to exchange(that is, when exchange imposes unacceptable levels of strategic and contractualrisk). Second, they must also understand (when it is sensible to exchange) how tocraft the incentive structures that will maximize the return to their organizations.Obviously, such structures need to cover relationships between buyer andsupplier. However, they are also needed to regulate relationships within theorganization. This is because poor demand management can have significantknock-on effects. Consequently, managers within an organization need to beencouraged (through the threat of sanction or the promise of reward) to engagein activities designed to maintain the organization’s control over its externalenvironment. At root, therefore, the study and practice of supply chainmanagement is the study of managerial and contractual incentives.
References
Cox, A, Sanderson, J and Watson, G (2000) Power Regimes, Earlsgate Press,Boston, UK
Cox, A et al (2002) Supply Chains, Markets and Power, Routledge, London andNew York
Hines, P et al (2000) Value Stream Management, Pearson, HarlowLonsdale, C and Cox, A (1998) Outsourcing: A business guide to risk management
tools and techniques, Earlsgate Press, Boston, UKLonsdale, C and Watson, G (2005) The internal client relationship, demand
management and value for money: a conceptual model, Journal ofPurchasing and Supply Management, 11, pp 159–71
Lukes, S (1974) Power: A radical view, Macmillan, LondonMilgrom, P and Roberts, J (1992) Economics, Organization and Management,
Prentice-Hall, New JerseyMolhow, I (1997) The Economics of Information, Blackwell, OxfordPeteraf, M (1993) The cornerstones of competitive advantage: a resource-
based view, Strategic Management Journal, 14, pp 179–91Porter, M (1980) Competitive Strategy, Free Press, New YorkWilliamson, O (1985) The Economic Institutions of Capitalism, Free Press, New York

The development ofsupply chain
relationships:a multi-lens approach
Peter Hines and Donna Samuel, Cardiff Business School
The last few decades have witnessed the rise of research into supply chainmanagement and relationships within it. However, in many cases previousresearch has taken a single-lens approach to understanding and explaining whatis happening as well as in subsequently developing solutions. The researchreported here seeks to take a multi-lens approach to relationships in the supplychain using a complete farm to retail food supply chain as an instrumental case.
Introduction
Several authors have recently argued that, although supply chainmanagement (SCM) has received a good deal of attention in the literaturesince the early 1980s, the concept is still not particularly well understood(Croom, Romano and Giannakis, 2000; Cigolini, Cozzi and Perona, 2004;Dubois, Hulthen and Pedersen, 2004). A case in point is integration throughbuyer–supplier or supply chain relationships (for instance, van Donk and van
107
7

108 � Global logistics
der Vaart, 2004). Specifically, the majority of current approaches tend toaddress the subject from a single perspective or lens.
A number of different perspectives have been taken in the literature,including power (Cox, 2001c; Christiansen and Maltz, 2002), trust (Sako, 1992;Simons et al, 2004) and risk (Rousseau et al, 1998; Zsidisin, 2003). Each of thesevariables has merit, but they are, on an individual basis, rarely the onlyvariable that is at play. A few authors have attempted to link two of thesethree variables together, for example power and trust (Ramsay, 1996) or riskand trust (Das and Teng, 2001).
Building on this perspective, we propose a more pluralist multi-lensresearch view where a single instrumental case is viewed from a range ofexplanatory perspectives (Stake, 1998). In addition, it is our belief that, in somecases, there may be other variables at play that have not yet been sufficientlyexplored in the supply chain literature.
Our first research aim is, therefore, to understand how these different vari-ables impinge and to explain the actions of actors within a supply chain.Linked to this, our second aim is to explore which of these might be moreimportant in shaping the actions of each actor. Our third question seeks tounderstand whether there are any other important variables in addition topower, trust and risk. If indeed there is a more complex set of explanatoryvariables at play, our fourth research aim will investigate how such a level ofunderstanding might be used to help the actors to improve their supply chainthrough better relationships.
The vehicle for exploring these aims is a longitudinal case centred on anAustralian food processing firm.
A review of the existing literature
The idea of forming cooperative rather than adversarial relationships withsuppliers made an appearance in the literature several decades ago (Farmerand Macmillan, 1978). Since then the idea has re-emerged under a variety ofnames including: co-makership (Merli, 1991); reverse marketing (Leendersand Blenkhorn, 1988); supplier alliances (Burdett, 1992) and partnershipsourcing (DTI/CBI/PS, 1998). Variations have also appeared within themarketing domain under the title of relational or relationship marketing(Evans and Laskin, 1994) as well as within the strategic management field asstrategic alliances. At the same time, the idea of cooperative relationships hasbeen extended from immediate suppliers to encompass the wider supplychain (Macbeth, Baxter and Neil, 1989) and coupled with ideas borrowedfrom Japanese automotive and lean production literature (Womack, Jonesand Roos, 1990; Lamming, 1993; Hines, 1994; Womack and Jones, 1996).
Ramsay (1996) argues that the majority of the academic literature emergedfrom an outright attack on the traditional, adversarial approach to supplier

relationships with the assumption that collaboration and partnerships arethe sine qua non of successful supplier relationship management. This latterview of relationship management has been supported by influential bodiesin the UK such as the Confederation of British Industry (CBI) and theDepartment of Trade and Industry, which provided the initial supportfunding for Partnership Sourcing Ltd (PSL). However, evidence from manypractitioners is that the term ‘partnership’ has been somewhat overused,often inappropriately where little real change has occurred (McIvor,Humphreys and McAleer, 1998).
The traditional purchasing-based view of SCM was to leverage the supplychain to achieve the lowest initial purchase prices whilst assuring supply, andwas characterized by: multiple suppliers; supplier selection based primarilyon purchase price; arm’s length negotiations; formal short-term contracts;and centralized purchasing. A more contemporary view of SCM, heralded bysome as the ‘new paradigm’ (Speckman, Kamauff and Myhr, 1998), redefinesSCM as a process for designing, developing, optimizing and managing theinternal and external components of the supply system, including materialsupply, transforming materials and distributing finished products or servicesto customers, that is consistent with overall objectives and strategies. Theessence of SCM is as a strategic weapon to develop a sustainable competitiveadvantage by reducing investment without sacrificing customer satisfaction(Lee and Billington, 1992). While managers have long acknowledged theimportance of getting closer to their key customers, the logic has now beenextended to the upstream supply chain so that close ties with key suppliersare also seen as important (Helper, 1991). Speckman, Kamauff and Myhr(1998) conceptualize the transition from traditional open-market negotiationsto collaboration as a continuum (see Figure 7.1), noting that the cooperation
Development of supply chain relationships � 109
CollaborationCoordinationCooperationOpen marketnegotiations
•
•
• Fewer suppliers• Longer-termcontracts
•
••
•
••
CollaborationCoordinationCooperationOpen marketnegotiations
CollaborationCoordinationCooperationOpen-marketnegotiations
Price-based discussionsAdversarial
Information linkagesWIP linkagesEDI exchange
Supply chain integrationJoint planningTechnology
sharing
Source: Speckman, Kamauff and Myhr, 1998
Figure 7.1 The key transition from open-market negotiations to collaboration

and coordination stages are necessary but not sufficient to reap the benefits ofeffective collaboration.
Collaboration, then, is seen by many as an integral facet of an SCM strategy(Bhote, 1987; Kapoor, 1988; Anderson and Narus, 1990; Ellram, 1990;Speckman and Sawhney, 1995). This popular view is not without its critics,and a balanced approach to collaboration gives a picture of the determinantsof successful SCM. Speckman, Kamauff and Myhr (1998) note that the roadfrom open-market negotiations to collaboration is a long one and should notby travelled by every buyer–seller relationship.
Many authors have advocated a portfolio approach to supplier relation-ships management (Kraljic, 1983; Cox, 1996; Olsen and Ellram, 1997; Bensaou,1999). Whilst the arm’s length approach is now subject to criticism because ofits focus on short-term cost reduction, it is often proposed under certainconditions: in commodity markets, with multiple suppliers, low asset speci-ficity and little market uncertainty where the market serves as a control mech-anism to ensure competitive prices (Schary and Skjøtt-Larsen, 2001).
However, much industrial purchasing does not meet these market charac-teristics, and here collaboration is usually presented as the obvious alter-native. SCM demands a business transformation in which managers attemptto mitigate uncertainty and exploit opportunity through the creative use ofboth suppliers and customers by evaluating who best supplies value and thenleveraging that expertise or capability through the entire supply chain.Speckman, Kamauff and Myhr (1998) note that this requires sharing whatonce might have been considered proprietary information, relinquishingcontrol to others in the supply chain and trusting that your supply chainpartners will act in your best interest. Trust clearly emerges throughout theliterature as a key issue determining the success or otherwise of supply chaincollaboration efforts.
However, trust is an ambiguous and complex phenomenon. Depending ontheir discipline and the problems they have been studying, many researchershave concentrated on the diverse aspects of trust and the process of trustdevelopment. Rousseau et al (1998) define it in this way: ‘Trust is a psycho-logical state comprising the intention to accept vulnerability based uponpositive expectations of the intentions or behaviour of another.’ Thereforetrust is a psychological state, not a behaviour.
Economists have also recognized the nebulous nature of trust:
Trust and similar values, loyalty or truth telling are examples of what an economistwould call ‘externalities’. They are goods; they are commodities; they have real prac-tical value; they increase the efficiency of the system, enable you to produce moregoods or more of whatever values you hold in high esteem. But they are notcommodities for which trade on the open market is technically possible or evenmeaningful.
(Arrow, 1974, cited in Smeltzer, 1997)
110 � Global logistics

In recent years a number of authors have suggested classifications of trust(Mollering, 1998), but Bachmann (2001) comments that it is doubtful whetherthese classification schemes lead very far in coming to grips with thephenomenon. Sako (1992), for example, distinguishes between arm’s lengthcontractual relations (dominant in the West) and obligational contractual rela-tions (dominant in the East) and conceptualizes three forms of trust:contractual trust (the mutual expectation that promises of a written or verbalnature will be kept), competence trust (the confidence that a trading partner iscompetent to carry out a specific task) and goodwill trust (commitments fromboth parties that they will do more than is formally required). He observesthat goodwill trust is far more prevalent in Japanese buyer–supplier relation-ships and that it cannot be achieved without the presence of the other twotypes first. Simons et al (2004) identify the absence of trust as a key inhibitor tosupply chain collaboration in the food industry. Stjernstrom and Bengtsson(2004) and Johnston et al (2004) suggest that relationships benefit fromincreasing trust. Hines (1996) argues that trust is an outcome (rather than acause) of successful supply chain collaboration in Japan and that it is a set ofother variables that lead to high-trust supplier relations. Similarly, Rousseauet al (1998) state that both risk and interdependence are necessary conditionsfor trust.
Many authors have identified that the primary role of trust in inter-organiza-tional relationships is to mitigate risk. Das and Teng (2001) contend that trust andcontrol are two principal antecedents of risk. Ring and Van de Ven (1992) arguethat varying levels of risk and reliance on trust will explain the governance struc-tures of transactions. Zsidisin (2003) highlights the lack of grounded definitionsof risk within the context of supply. Kraljik (1983) discusses risk in terms ofsupply market complexity and incorporates supply scarcity, the pace of tech-nology and/or materials substitution, entry barriers, logistics cost or complexityand monopoly or oligopoly conditions. Harland, Brenchley and Walker (2003)define supply risk as one of 11 risk types and adopt Meulbrook’s (2000) defi-nition of supply risk as being something that ‘adversely affects inward flow ofany type of resource to enable operations to take place’.
Zsidisin (2003), in accordance with other studies investigating risk defini-tions (Pablo, 1999), finds that supply risk is a multifaceted concept that differsaccording to industry (aerospace firms, for example, are more likely to under-stand risk in terms of threats to customer life and safety) but that the mostwidely held definition of supply risk focuses on understanding how riskaffects a purchasing firm’s ability to meet its customer requirements. Criticalof previous efforts to address risk management in the absence of a groundeddefinition of risk, Zsidisin (2003) offers the definition, ‘Supply risk is definedas the probability of an incident associated with inbound supply from indi-vidual supplier failures of the supply market occurring, in which its outcomesresult in the inability of the purchasing firm to meet customer demand orcause threats to customer life and safety.’
Development of supply chain relationships � 111

Other authors argue that trust within buyer–supplier relations can beexplained by another underlying factor, specifically power. Ramsay (1996) saysthat partnership formation involves a process of give and take. The suppliermay expect increased order security, improved forward order cover andreduced uncertainty, whilst the buyer hopes to achieve improved supply conti-nuity and a better match between the supplier’s sale specification and thebuyer’s own specification, as well as reduced long-term costs. Ramsay (1996)says that ‘In a genuine partnership, each party makes a commitment to theother and modifies its behaviour to more closely match the other’s require-ments. Each also becomes more dependent on the other – and thus both losesand gains power.’ He also adds that for the majority of smaller companies theeffort to form partnerships will frequently be met by supplier indifference orresistance – and the strategy itself is high-risk, high-cost and necessarilyinvolves purchasers in an undesirable net loss of power. Cox (2001c) also arguesthat there will be only some power conditions that will be conducive to collab-oration and that they will be in situations of buyer dominance or where poweris equally distributed between buyer and seller to create interdependence.
Cox (2001a, 2001b) suggests that practitioners map the dominant powerregimes in which they are located in order to formulate an understanding ofwhich strategy – either proactive supplier selection (or traditional arm’slength approaches) or proactive supplier development (more contemporarycollaborative approaches) – is most suitable. However, any attempt to do sowill reveal that power is itself a multifaceted concept and therefore subject tovarious interpretations. Power, most commonly viewed as market leverage,forms another determinant factor to effective supply chain collaboration.
112 � Global logistics
Source: Cox, 2001c
Figure 7.2 The power matrix
Power buyer Buyer dominance Interdependence
Independence Supplier dominance
High
High
Low
Low
attributes relative to supplier
Supplier power attributes relative to buyer

Development of supply chain relationships � 113
Methodology
The choice of research methodology is dependent upon the set of researchquestions under consideration and the state of knowledge (Pettigrew, 1990).Following Ahlstrom and Karlsson (2000) in deciding the most appropriateapproach, consideration was made of:
� The focus, which was the process of improving a given supply chain andthe relationships within it, particularly between a food processor andseven single or group entities. The study of processes is best served usinglongitudinal research (Kimberly, 1976).
� The fact that the study concerned change and adoption of new rela-tionship sets. It was best to study this as it happened in their natural fieldsettings (Van de Ven and Poole, 1995), as it is hard to establish cause andeffect from retrospective research (Leonard-Barton, 1992).
� The fact that longitudinal cases of change are rare and as such the researchwas of an exploratory character.
It was necessary to spend a significant amount of time in field research toprovide the depth of understanding necessary for subsequent theorybuilding (Sofer, 1961). As such it was only possible to study a single supplychain – and this choice does limit the ability to generalize from this research.
The study began with the focal company’s commitment to a lean supplychain initiative. The case study was undertaken from August 2003 (before thestart of the initiative) until May 2005 (when the initiative developed past itsoriginal scope).
Instrumental case: the Perfect Pineapple Supply ChainProgramme
BackgroundThe Perfect Pineapple Supply Chain Programme was initiated in late 2003 andinvolved an Australian canned pineapple supply chain stretching fromgrowers, through transport links and a processing plant, to a major retailer(see Figure 7.3). The supply chain also involved three key suppliers of cans,cartons and pallets.
The programme centred on a company processing 110,000 tonnes of freshpineapple every year through a single facility. The majority of processed fruitis canned either in slices (or rings), pieces, cut (small pieces), crush, or pulp forjuice.
The company was set up as a cooperative in 1946, and is owned by about700 fruit and vegetable growers – with the majority of shares held by 171

pineapple growers. The company is Australia’s largest grower-owned fruitand vegetable processor, with pineapple products representing 20 per cent ofturnover. The market for these products is largely domestic and is dominatedby Australia’s two major supermarkets, who control 80 per cent of the market– one of whom took part in this study. The recent history of Australian super-markets has been one of consolidation and emulation of overseas best practiceand, in common with other markets, power in the Australian food industryseems to reside at the retailer, with relationships in the supply chain generallyexhibiting low levels of trust (Sadler and Hines, 2002; Simons et al, 2004).
The retailer involved in the work was in the process of establishing a newsupply chain strategy including:
� the development of a primary freight system, which is an Australianversion of factory gate pricing (IGD, 2002; Potter et al, 2003) involvingretailer-controlled collection, cross-docking and revised distributioncentre configuration;
� store-friendly one-touch replenishment involving a streamlined materialand information flow in the supply chain with the ideal of touchingproduct only once between point of manufacture and checkout (Jones andSimons, 2000);
� vendor to store shelf end-to-end process efficiency and integration;� the development of supplier relationships;� delivery of cultural change and breakdown of functional silos.
At the start of the programme, there was limited evidence that the retailer hadsucceeded in implementing this new strategy.
114 � Global logistics
Cartonsupplier
CannerGrowers
Can supplier
Inbound
transporter
Pallet supplier
Outboundtransporter RetailerCanner Store
Figure 7.3 The Perfect Pineapple Supply Chain membership

The programmeIn late 2002 the processor started a programme of manufacturing changeunder the a newly appointed general manager. The first year (step 1 of Figure7.4) involved a series of improvement initiatives at the main manufacturingsite. This included value stream mapping and a series of smaller improve-ments to internal and external information flows.
During this period it became apparent that many of the issues andproblems faced by the company were the result either of actions taken byother organizations or of a lack of complete supply chain coordination. Inaddition, the company was suffering rapidly declining profits, reporting itsfirst ever loss in 2003. At the same time, its major customers were increasingshelf space to imported product, including canned pineapple from thePhilippines. As a result it was decided to widen the scope of the programme toencompass the wider supply chain. Focusing on canned pineapples, theprogramme was christened the Perfect Pineapple Supply Chain Programme.
Step 2 of the programme brought together senior executives from thedifferent firms involved to establish what the supply chain looked like andwhat the programme could achieve, and to gain a commitment from thecompanies to take part in the programme. During this meeting the majorissues facing the supply chain became clear. The managing director of theprocessor commented on the pressure exerted by retailers, particularly interms of costs. This was particularly relevant as the company was losingmarket share to overseas competitors whose product retailed at 30 per centlower prices. It would be difficult for the company to absorb these reducedmargins – so they put pressure on growers, who had not received an increase
Development of supply chain relationships � 115
Internal improvement activity at canner
Supply chain workshop for executive staff
Supply chain workshop for process owners
Value stream mapping in supply chain loops
Supply chain process owner improvement plan
Agreed supply chain improvement plan
Improvement programme and ongoing reviews
Plan
Plan
Do
Do
Check
Act
ActStep 1
Step 7
Step 6
Step 5
Step 4
Step 3
Step 2
Figure 7.4 The seven-step Perfect Pineapple Supply Chain Programme

in price for their pineapples for nearly 10 years. The managing directorconcluded with the view that the only way forward was to work together as ateam for everyone’s mutual benefit. This view was generally accepted, butthere was concern that some – primarily the retailer – would gain more thanothers, or even at the expense of the other participants.
The meeting included an exercise to map the whole supply chain. Thisshowed that no one had a good picture of the complete supply chain, and fewcould describe the operations within their own business in great detail. Themeeting also developed an ideal future state – as well as the barriers to gettingthere. These barriers included capital shortages, problems in changingculture, skilled people to make the change, the older age of growers, the lackof integrated IT, and the processor’s lack of an explicit strategy.
Step 3 was to bring together the supply chain’s process owners, or opera-tional staff. This was done shortly after step 2, with meetings following asimilar path to those of the executive group, except that less time was spentdiscussing what was required and more on how it might be done. A far moredetailed map of the supply chain was developed, and with it the realproblems began to emerge. Agreement was reached to undertake a moredetailed analysis of the supply chain in five loops involving cross-companygroups. The loops were a downstream loop (post-manufacture), a canningloop, an upstream fruit loop (up to delivery of pineapples) and two loops forthe cans and cartons respectively. The result of this step was an agreed outlineplan for each loop. These plans were presented back to the executive group.
Step 5 had discussions among the executive group of the findings andrecommended projects – and how these could be developed into a workableplan. The view of the retailer was that they were keen to develop a new, closerrelationship with suppliers – but would do so only in a step-by-step approachand only with like-minded firms.
The discussions quickly identified short-term gains of A$3–4 million,although further analysis showed that the true benefits could be of the orderof A$20 million. However, two areas of concern emerged. The first was that itwas difficult to plan a supply chain transition, as a new strategic plan for theprocessor was being finalized over the next three months. The second was thefact that all the firms were actively taking part, but not all seemed to be fullycommitted. In particular, concerns were raised about the can and cartonmakers who were only able to identify savings of less than A$100,000 each.However, they soon changed their stance and agreed a strategic reviewinvolving an analysis of the type of packaging used and how this might bechanged – for example, from cardboard boxes to plastic bins.
As a result of these discussions, various uncomfortable issues were broughtto the surface, and hidden and unspoken concerns were shared. The resultwas that the atmosphere changed from being unsure to very positive. Thispositive feeling was reinforced by a strong plan involving all the respectivefirms in its delivery. The top level of this plan is shown in Figure 7.5.
116 � Global logistics

Development of supply chain relationships � 117
Since this point the group has continued implementing the plan and hasalready gained benefit of several million dollars. As a result, the processorhas decided to extend the scope of the work to include a further loop –namely a beetroot loop, which represents a further 15 per cent of turnover.This step is a prelude to the development of further loops (for example, forbaby food raw material ingredients, and fruit or fruit concentrate for fruitjuice). It was also decided that once these further loops were in place (inlate 2005) the extended group of companies (ie members of the PerfectPineapple group and members of the new loops) would come together
Ease Timing
RetailerTransp Out Canner Transp
In Growers Pallet Supply Carton
Supply Can Supply
Customer Integration ST/LT ✓ ✓ ✓
✓
✓
✓
✓
✓
✓
✓
✓
✓
✓
✓
✓
✓
✓
✓
✓
✓
✓
✓
✓
✓
✓
✓
✓
✓✓
✓
✓
✓
✓
✓
✓ ✓
✓
✓
✓
✓
✓
✓
Align consumer demand project 10 to 8 days SOH @ Retailers DCs 2 ST ✓ ✓ Smoothing material flow (all product) transport / primary freight / packaging 5 LT ✓
Consumer trends (alignment Canner/retailer) 2 ST ✓
Internal Integration JDI/LT ✓
Avoid shift work with supply modification / analysis 3 JDI Cost benefit of unsweetened from concentrate 2 JDI
Nitrate management 2 JDI SKU rationalisation 4 JDI/ST ✓
Align fruit intake to sales demand 4 LT Remove nightshift requirement / asset utilisation 3 LT Rationalise of process lines 5 LT Reduction of on-the-job training of seasonal staff 3 LT Reducing premium paid for casual labour 3 LT Remove inefficiency in low-volume period 3 MT Grower Integration JDI/LT Increase sugar levels through quality based payment system (QBPS) 4 JDI/LT ✓
Review grower rationalisation 5 LT ✓ ✓Feasibility study of sourcing supply options aligned to customer requirements 4 LT ✓
Packaging Integration JDI/LT ✓ ✓ ✓ Five-day carton inventory project 2 JDI/ST ✓
Electronic Receipting 3 JDI/ST ✓PLI (Product, leadership & Innovation) Generic carton cost feasibility project: reduce SKUs 3 MT/LT ✓ ✓
Can guage project (all products) 2 ST
Tin Coating 2 MT
PLI - Product, Leadership & Innovation 3 MT/LT ✓
- Receipting 3 JDI/ST ✓
Forecast Accuracy 4 LT ✓
Enablers JDI/STDevelop & Communicate Short - Long Term Strategy for Pineapples 3 JDI/ST
Continued costing and profit potential 3 ST
Confirm targets & current state 2 JDI/ST
Team
JDI = Up to 3 monthsST = Up to 6 monthsMT = Up to 18 monthsLT = Up to 5 years
Transp Canner
JDI
- - 3
-
4
4
2 3
, i 3 2 ✓
2 ✓
3 ✓
EDI 3 4
3 3 2
Figure 7.5 The Perfect Pineapple Supply Chain plan

periodically and take on the shape and dynamics of a true supplier associ-ation (Hines, 1994).
Explanation and discussion
To explain what was happening within this case, a simple two-phase devel-opment model is presented, primarily in terms of changes at a macro level tothe risk and trust that the food processor had developed with (but also to somedegree between) members of the Perfect Pineapple Supply Chain Programme.
Phase 1 explanationDuring the early stages of the work the processor was attempting to gaincommitment by increased knowledge transparency, starting to increasecompetence levels and attempting to set up a common-destiny relationshipset. In the process they were seeking to move away from historical contractualrelationships (or what Sako (1992) terms a contractual trust relationship) thatcarried a varied but generally low level of trust and resulted in a high level ofrisk for all involved (phase 1 in Figure 7.6).
118 � Global logistics
Figure 7.6 An explanatory model of the Perfect Pineapple Supply ChainProgramme
Trust
Risk
Low
Low
High
High
Contractual trust
Competence trust
Goodwill trust
Reduce bounded rationality,
increase competence and develop
common destiny 1
Develop learn
ing curve effect, w
ithhold power
rem
ove opportunism and
develop asset specificity
2
1
2

Development of supply chain relationships � 119
Specifically, they were creating an open forum for exchange of views andinformation. This process involved identifying common (or not common)issues, concerns and visions for the supply chain, as well as the mapping ofthe complete chain by cross-company groups. This mapping also increasedthe individual and collective competence of the group, both in their own areaand in the remainder of the supply chain. As a result, various individualscould see the bigger picture and the roles of others in improvement projects.In addition, this increase in individual and collective competence was likely toincrease costs for new supply chain entrants, increasing barriers to entry andreducing risk for the present firms.
In this phase, senior staff from the processor went out of their way todevelop a sense of common destiny, both by working to develop commonmeasures across the supply chain and by creating an environment wheremutually beneficial plans could be developed by teams from across the supplychain. Further commitment was sought with the full involvement of theretailer, but it was not yet possible to achieve the full commitment of all –particularly the packaging firms.
Phase 2 explanationDuring the second phase of activity (steps 6 and 7), the processor wasattempting to increase trust, having gone a significant way to reducing risk forall those involved. This second phase involved the development of learningeffects, withholding power, and the removal of opportunistic behaviour – andultimately was leading towards increased asset specificity. In terms of theexplanatory model, the processor was seeking to move beyond competencetrust to achieve goodwill trust, with firms doing more than their explicitlystated commitments (phase 2 in Figure 7.6).
Staff at the processor worked hard to ensure that a place in theimprovement work could be found for all of the firms. In addition, theydeveloped an approach that was sustainable, as it was not focused on quickwins, but a longer approach of at least three years’ duration. Even at the earlystages of the work they held informal discussions about developing theprogramme into a supplier association programme.
The second phase also involved the development of withheld power with acommon set of metrics and attention paid to the fact that all the firms involvedneeded to see some benefit from the work. An example of the withheld powerwas the ‘quiet word’ to packaging firms when they appeared not to be givingtheir full commitment. They got reassurance that their involvement wouldbenefit their firms and lead to a longer-term relationship with greater profitpotential to all involved.
The second phase of activity moved the relationship set from a competence-based trust to the start of a goodwill trust where individual actors are startingto do things for the common good of the group rather than their individual

benefit. This type of two-phase development has proved to be beneficial to thefirms involved, but it may not be suitable in all other environments. It wasappropriate here because the environment involved:
� regular repeated transactions (with daily or weekly orders);� the willingness to hold back from explicit power relationships and the use
of ‘withheld power’;� an agreed common benefit in working together;� a specific non-commodity product;� appropriate outside facilitation to make concerns explicit.
Discussion: adding two more variablesIn this case all the firms to a greater or lesser degree took an active andpositive role in improvement. In addition, the relationship between the focalfood processor and all the other firms improved – as did many of the relation-ships between the firms. And there are clear explanations for some of theactivities and relationships when we view the case through the three differentlenses of trust, risk and power.
However, we also concluded that, although each of these lenses isimportant, even together they are insufficient to explain the behaviour set. Asa result of these observations, we would like to suggest two further inter-linked factors that determined the success of collaboration in this case andmay well have an importance in other instances. These are the type ofownership and corporate governance (and resultant governance structure),and the individual employee commitment or engagement.
Corporate governance is concerned with the decision made by senior exec-utives of a firm and the impact of their decision on various stakeholder groupsand therefore refers to the relationship between the board and the firm.Bradley (2004) comments that the search for the link between returns andgovernance is the Holy Grail for many practitioners and academics in the fieldof corporate governance, and that an ever-growing amount of evidence nowexists to suggest that these links do not exist. Nonetheless we would arguethat the corporate governance does influence management’s approach tocontrol versus commitment in the workplace.
Walton (1985) identifies these two opposing approaches to a company’shuman capital and points out the key challenges in moving from one toanother. We would suggest that the firm’s progress in this regard is likely toimpact the individual’s predisposition to supply chain collaboration’s success.Lucy, Bateman and Hines (2004) coin the term ‘employee engagement’, high-lighting its importance to the success of any change initiative. Indeed, theirresearch suggests that people’s degree of engagement is likely to be influ-enced by a range of personal and corporate objectives that may not be at allobvious at first sight to the casual observer. Supply collaboration invariably
120 � Global logistics

involves the reshaping of supply chain partners’ patterns of behaviour andtherefore demands a high commitment – a function of corporate governance– initially from the leading partner and subsequently from all partiesinvolved.
Applying five lenses to the caseIn order to understand the dynamics and relationships within the case study,it is useful to review the five determinant factors discussed earlier (power, riskand trust) and in the last section (ownership and governance structures, andcommitment) and see how these have impacted on each of the participatingfirms. Before doing this, it is useful to explore how a single-lens perspectivemay give a misleading or incomplete impression of reality. In order to illus-trate the point, we will take the example of a single power lens as advocatedby Cox (2001a, 2001b, 2001c).
Using a development of Cox’s power regime approach we can develop apower map for the physical movement of product (Figure 7.7), with the widthof the arrows proportional to the cash flows, and the figures in circles repre-senting the total business turnover of each firm. Following Cox (2001a), thesymbols represent:
< buyer having power over supplier> supplier having power over buyer= interdependence0 independence
Development of supply chain relationships � 121
Figure 7.7 Power regimes within the Perfect Pineapple Supply Chain
$7.2bn
$20.7bn
$2.5bn
$10.7bn
<
<
< 0
=
=/>
Outbound transporterInbound transporter<$5m
Pineapplegrowers
$20m
(171 farms)
Can/Cartonsupplier
Pallet supplier
Retailer
Canner$400m
All figures in Australian dollars
A$1 = approx UK£0.4

The retailer holds power over the processor, primarily owing to size andability to switch to cheaper imported product. The processor holds powerover the can and carton maker as well as its inbound transporter. Theprocessor has a relatively interdependent relationship with the outboundtransporter and, owing to their low reliance on each other, a relatively inde-pendent relationship with the pallet supplier. The processor appears to holdpower over the growers, but the governance structures between the twomean that the processor is owned largely by the pineapple growers.
It should be possible to interpret where successful supply chain relation-ships and development are possible, and where existing power regimeswould preclude their effectiveness. According to Cox, a supply chainapproach will only work where there is buyer dominance or buyer–supplierinterdependence. So we can predict that the processor will be able toencourage the transport firms and packaging suppliers actively to take part,but find it very hard to engage the other firms. However, a different pictureemerged. In gaining agreement and commitment to the programme, variousdifficulties appeared, which could not completely, or even largely, beexplained by existing power regimes.
As the programme of activities aligned closely with the retailer’s strategicobjective, the retailer was enthusiastic about the programme. In addition, thegrowers were enthusiastic because it was ultimately to their benefit for theprocessor to produce a better financial result. The other company thatshowed the greatest enthusiasm was the outbound transporter. However, thisowed little to the interdependence it enjoyed with the processor, and more tothe perceived threat and risk that it felt in potentially losing business.
In addition, the inbound freight firm was not brought fully into the initiativein the early stages – but this was more to do with the commitment levels of theindividuals involved, and once the discussions became more operational therewas a much higher level of personal engagement. The pallet firm similarly didnot take a very active part – but the reason appeared to be that improvements tothe supply chain would probably reduce the number of pallets required. It alsoseemed that the packaging suppliers were only paying lip service to the workand were offering only marginal benefits. Their lack of involvement can beexplained in two ways: firstly, the individuals involved saw little in the work interms of career development; secondly, and more importantly, they did nottrust the processor because of a history of adversarial price reduction demands.
The reactions and involvement of the different companies were sensibleand indeed logical from their perspective. However, their responses cannotadequately be explained simply through a power lens. By viewing eachcompany through each of the five lenses – power and dependency, risk, trust,ownership and governance structures, commitment – their behaviour can beboth understood and explained (see Figure 7.8).
In reality, each of the five variables had some influence on individual firms’behaviours and how engaged they were (highly engaged firms are shown in
122 � Global logistics

Figure 7.8 with a ✓) but in each case one variable was pre-eminent in shapingthe behaviour. The pre-eminent variable for each firm is shown by a black boxagainst the relevant variable. During the study it was possible to: 1) see howeach less engaged firm could be brought on-side more readily and quickly; and2) understand what was motivating the highly engaged firms and try toensure that this factor was built upon to sustain the firm’s positive role. Inaddition, it should be possible to repeat the multi-lens assessment periodically,as inevitably some of the variables will change in importance and weighting.
Conclusion
Returning to the research questionsWe have attempted to address four questions. The first sought to understandhow three well-established variables (power and dependency, trust and risk)impinge and explain the actions of actors within a supply chain. It has beenshown that each of these lenses has proved helpful in understanding themotivation of behaviour. However, we have demonstrated that none of them,on their own, can adequately explain the behaviour of any one of the actors.
Linked to this first question, the second question was to explore which ofthe three variables might be more important in shaping the actions of eachactor. The analysis presented in Figure 7.8 shows that each of these variables
Development of supply chain relationships � 123
Figure 7.8 Involvement and influences in the Perfect Pineapple SupplyChain Programme
Initially lowPublicly quotedPlaying the negotiating game
Risk of losing businessDependent on cannerCarton supplier
Initially lowPublicly quotedPlaying the negotiating game
Risk of losing businessDependent on cannerCan supplier
MediumPublicly quotedGood relationshipsRisk of new technology in one-touch replenishment
Independence from canner
Pallet supplier
High at both levelsOwn / direct canner but historically kept in the dark operationally
Love–hate relationship with canner
Risk of canner losing market share
Strategically over cannerGrowers
Low at first as strategic discussion at too high a level to engage
Family ownedClose relationship to canner
Risk of reduced pineapple business
Dependent on cannerInbound transporter
High at each level, skills gaps at process level
Historically keeps grower directors in the dark
Good relationship with all players, sometimes arm’s length with growers
Losing market share to imported product
Power over packaging suppliers and inbound transport
Canner
High at each levelPublicly quotedGood relationship with retailer and canner
Risk of losing distribution contract in retailer’s primary freight initiative
Interdependence with canner
Outbound transporter
High at senior levels, medium at process owner level
Publicly quotedTraditional arm’s length, starting to use new close relationship language
Little riskPower over canner and outbound transporter
Retailer
CommitmentOwnership and governance structures
TrustRiskPower and dependency
���
�

124 � Global logistics
was the single most important factor in explaining some behaviour. Powerand dependency was most important for the pallet supplier, risk was mostimportant for the outbound transporter and the canner, and trust (or lack of it)was most important for both can and carton suppliers.
Our third question sought to understand whether there are any otherimportant variables in addition to power, trust and risk. It was clearly estab-lished that it was not possible – in this particular case – to explain the behaviourof the firms using the three variables. We found two additional factors thatwere pre-eminent in explaining behaviour in at least one of the firms involved.These were the ownership and governance structures (most important for thegrowers) and personal commitment (most important for the retailer).
The last research question was contingent on there being a complex set ofexplanatory variables at play – which there did indeed prove to be. Gaining amore detailed understanding of the different variables at play might improvesupply chain management through better relationships and more effectiveimprovement activities. This was achieved in two ways. First, an explanatorymodel was developed (Figure 7.6) to supplement our description of what washappening within the case; second, a framework was constructed (Figure 7.8)that summarizes the impact of the different variables on each of the actors,and shows which was most important in influencing behaviour. We foundthat only a deep understanding of the actors would yield a full picture of allthe different causes and effects.
Managerial lessonsThis research has perhaps three important managerial lessons. The first is thattaking a simple ‘everything can be explained by one variable’ approach wasnot appropriate in this study. This was highlighted by showing how using asingle lens – power – led to a poor understanding of what might be occurring.Although this may be appropriate in rare examples, we believe that such asingle-lens approach is very limited – and quite dangerous, as inappropriatesolutions may be generated.
The second managerial lesson is that a multi-lens approach helps ensurethat a better understanding is developed, which can lead to further stages ofanalysis and solution development. In this case the most appropriate fivelenses were power and dependency, risk, trust, ownership and governancestructures, and commitment. As a result an explanatory model was presented,which may prove a useful framework for establishing closer long-term rela-tions within a supply chain setting, particularly where:
� there are regularly repeated transactions;� there are (or could be) common goals;� stronger actors are willing to withhold power for the good of the whole
supply chain;

Development of supply chain relationships � 125
� products or services are in some way bespoke or unique;� there is appropriate outside facilitation to make concerns explicit.
However, a caveat is that the five variables used here may not be the mostimportant variables in all other cases – although they may provide a usefulstarting place for a discussion.
The final managerial lesson is that, either on a one-off occasion or better stillon a periodic basis, using a framework such as Figure 7.8 to help understandand explain the behaviour of actors is likely to be the first step in developing abetter and more sustainable set of relationships, which will result in a moreeffective supply chain.
References
Ahlstrom, P and Karlsson, K (2000) Sequences of manufacturing improvementinitiatives: the case of delayering, International Journal of Operations andProduction Management, 20, pp 1259–77
Anderson, J and Narus, J (1990) A model of distributor firm and manufacturerfirm working partnerships, Journal of Marketing, 54, January, pp 42–58
Bachmann, R (2001) Trust, power and control in trans-organisation relations,Organisation Studies, 22 (2), pp 337–67
Bensaou, M (1999) Portfolios of buyer–supplier relationships, SloanManagement Review, 40 (4), pp 35–44
Bhote, RK (1987) Supply Management: How to make US suppliers competitive,American Management Association Membership Publications Division,New York
Bradley, N (2004) Corporate governance scoring and the link betweencorporate governance and performance indicators: in search of the HolyGrail, Corporate Governance, 12 (1), pp 8–10
Burdett, JO (1992) A model for customer–supplier alliances, Logistics andInformation Management, 5 (1), pp 25–31
Christiansen, PE and Maltz, A (2002) Becoming an interesting customer:procurement strategies for buyers without leverage, International Journal ofLogistics, 5 (2), pp 177–95
Cigolini, R, Cozzi, M and Perona, M (2004) A new framework for supply chainmanagement, International Journal of Operations and Production Management,24 (1), pp 7–41
Cox, A (1996) Relational competence and strategic procurementmanagement, European Journal of Purchasing and Supply Management, 2 (1),pp 57–70
Cox, A (2001a) Managing with power: strategies for improving value appro-priation from supply relationships, Journal of Supply Chain Management, 37(2), Spring, pp 42–47

Cox, A (2001b) Supply chain and power regimes: toward an analyticalframework for managing extended networks of buyer and supplier rela-tionships, Journal of Supply Chain Management, 37 (2), Spring, pp 28–35
Cox, A (2001c) Understanding buyer and supplier power: a framework forprocurement and supply competence, Journal of Supply Chain Management,37 (2), Spring, pp 8–15
Croom, S, Romano, P and Giannakis, M (2000) Supply chain management: ananalytical framework for critical literature review, European Journal ofPurchasing and Supply Chain Management, 6, pp 67–83
Das, TK and Teng, BS (2001) Trust, control and risk in strategic alliances: anintegrated framework, Organisation Studies, 22 (2), pp 251–84
Department of Trade and Industry (DTI)/Confederation of British Industry(CBI)/Partnership Sourcing (PS) (1998) Partnering for Profit, Profile Pursuit,London
Dubois, A, Hulthen, K and Pedersen, A (2004) Supply chains andinterdependence: a theoretical analysis, Journal of Purchasing and SupplyManagement, 10, pp 3–9
Ellram, L (1990) The supplier selection decision in strategic partnerships,Journal of Purchasing and Materials Management, Fall, pp 8–14
Evans, JR and Laskin, RL (1994) The relationship marketing process: aconceptualisation and application, Industrial Marketing Management, 23, pp439–52
Farmer, D and Macmillan, K (1978) The benefits of reducing opportunism inbuyer–supplier relationships, Purchasing and Supply Management, May, pp10–13
Harland, C, Brenchley, R and Walker, H (2003) Risk in supply networks,Journal of Purchasing and Supply Management, 9 (2), pp 51–62
Helper, S (1991) How much has really changed between US auto makers andtheir suppliers?, Sloan Management Review, 32 (4), Summer, pp 15–29
Hines, P (1994) Creating World-Class Suppliers: Unlocking mutual competitiveadvantage, FT Publishing, London
Hines, P (1996) Network sourcing: a discussion of causality within thebuyer–supplier relationship, European Journal of Purchasing and SupplyManagement, 2 (1), pp 7–20
Institute of Grocery Distribution (IGD) (2002) Backhauling and Factory GatePricing: Evolution or revolution?, IGD Business Publications, Watford
Johnston, D et al (2004) Effects of supplier trust on performance of cooperativesupplier relationships, Journal of Operations Management, 22, pp 23–38
Jones, D and Simons, D (2000) Towards perfect customer fulfilment, LogisticsFocus, October, pp 45–50
Kapoor, V (1988) Becoming a just in time vendor, Quality Progress, 21 (6), June,pp 56–59
Kimberly, J (1976) Issues in the design of longitudinal organizational research,Sociological Methods and Research, 4 (3), pp 321–47
126 � Global logistics

Kraljic, P (1983) Purchasing must become supply management, HarvardBusiness Review, 61 (5), pp 109–17
Lamming, R (1993) Beyond Partnership: Strategies for innovation and lean supply,Prentice Hall, London
Lee, H and Billington, C (1992) Managing supply chain inventory: pitfalls andopportunities, Sloan Management Review, 33 (3), Spring, pp 65–73
Leenders, MR and Blenkhorn, DL (1988) Reverse Marketing: The newbuyer–supplier relationship, Free Press, New York
Leonard-Barton, D (1992) The factory as a learning laboratory, SloanManagement Review, 34 (1), pp 23–28
Lucy, J, Bateman, N and Hines, P (2004) Achieving Pace and Sustainability in aMajor Lean Transition, 11th European Manufacturing and OperationsAssociation (EUROMA) Conference Proceedings, Brussels, pp 815–24
Macbeth, D, Baxter, L and Neil, G (1989) Not purchasing but supply chainmanagement, Purchasing and Supply Management, November, pp 30–32
McIvor, R, Humphreys, P and McAleer, W (1998) European car makers andtheir suppliers: changes at the interface, European Business Review, 98 (2), pp87–99
Merli, G (1991) Co-makership: The new supply strategy for manufacturers,Productivity Press, Cambridge
Meulbrook, L (2000) Total strategies for company-wide risk control, FinancialTimes, 9 May, p 308
Mollering, G (1998) Trust across borders: relative rationality and relative speci-ficity in the context of international cooperation and emerging markets,Paper presented at the Academy of International Business AnnualConference, London, 3–4 April
Olsen, RF and Ellram, LM (1997) A portfolio approach to supplier relation-ships, Industrial Marketing Management, 26 (2), pp 101–13
Pablo, AL (1999) Managerial risk interpretations: does industry make adifference?, Journal of Managerial Psychology, 14 (2), pp 92–107
Pettigrew, A (1990) Longitudinal field research on change: theory andpractice, Organization Science, 1 (3), pp 267–92
Potter, A et al (2003) Modelling the impact of factory gate pricing on transportand logistics, Proceedings of the 8th International Symposium of Logistics,Seville, Spain
Ramsay, J (1996) The case against purchasing partnerships, InternationalJournal of Purchasing and Materials Management, 3 (4), Fall, pp 13–19
Ring, PS and Van de Ven, AH (1992) Structuring cooperative relationshipsbetween organisations, Strategic Management Journal, 13, pp 483–98
Rousseau, DM et al (1998) Not so different after all: a cross discipline view oftrust, Academy of Management Review, 23 (3), pp 393–405
Sadler, I and Hines, P (2002) Strategic operations planning process for manu-facturers with a supply chain focus: concepts and a meat processing appli-cation, Supply Chain Management: An international journal, 7 (4), pp 225–41
Development of supply chain relationships � 127

Sako, M (1992) Prices, Quality and Trust: Inter-firm relations in Britain and Japan,Cambridge University Press, Cambridge
Schary, PB and Skjøtt-Larsen, T (2001) Managing the Global Supply Chain, 2ndedn, p 185, Copenhagen Business School Press, Copenhagen
Simons, D et al (2004) Making Lean Supply Work in the Food Industry, Conferenceproceedings, Sixth International Conference on Chain and NetworkManagement in Agribusiness and the Food Industry, The Netherlands, pp111–17
Smeltzer, L (1997) The meaning and origin of trust in buyer–supplier relation-ships, International Journal of Purchasing and Materials Management, 33 (1),Winter, pp 40–49
Sofer, C (1961) The Organization from Within: A contemporary study of social insti-tutions based on a sociotherapeutic approach, Tavistock Publications, London
Speckman, R and Sawhney, K (1995) Towards a conceptual understanding ofthe antecedents of strategic alliances, in Business Marketing: An interaction andnetwork perspective, ed D Wilson and C Mollen, pp 157–92, Kent Publishing,Boston, MA
Speckman, R, Kamauff, J and Myhr, N (1998) An empirical investigation intosupply chain management: a perspective on partnerships, Supply ChainManagement, 3 (2), pp 53–67
Stake, R (1998) Case studies, in Strategies of Qualitative Inquiry, ed N Denzinand Y Lincoln, pp 88–90, Sage, California
Stjernstrom, S and Bengtsson, L (2004) Supplier perspectives on business rela-tionships: experiences from six small suppliers, Journal of Purchasing andSupply Management, 10, pp 137–46
Van de Ven, A and Poole, M (1995) Explaining development and change inorganizations, Academy of Management Review, 20 (3), pp 510–40
van Donk, DP and van der Vaart, T (2004) Business conditions, sharedresources and integrative practices in the supply chain, Journal of Purchasingand Supply Management, 10, pp 107–16
Walton, R (1985) From control to commitment in the workplace, HarvardBusiness Review, March/April, pp 77–84
Womack, J and Jones, D (1996) Lean Thinking, Simon & Schuster, New YorkWomack, J, Jones, D and Roos, D (1990) The Machine that Changed the World,
Maxwell Macmillan, New YorkZsidisin, G (2003) A grounded definition of supply risk, Journal of Purchasing
and Supply Management, 9, pp 217–24
128 � Global logistics

Demand flow leadershipand the evolution of
management concepts
Dag Ericsson, University of Skovde
Management concepts come and go. Some rise, explode and fall back like fire-works. Some remain like the North Star brightly shining and serving as guide-lines for navigation on the stormy seas of management. The first major issue,then, is to learn how to distinguish between fads and lasting, innovativeconcepts. The next issue is to find out how to implement concepts; what kindof methods and tools we need; how to educate to change mindsets; and whatthe best way is to design the transformation process.
One way to distinguish between concepts and the rest is to use a holisticapproach and see how the bits fit together to create a new pattern. WhenTaylor wrote about scientific management, he observed and summarizedthings that were happening in research and practice. He established a theory– or a frame of reference – for the emerging industrial society. One reason forthe success of scientific management was the obvious need for a newparadigm to guide the transition from handicraft to industrial manufacturing.
Today there is a need for a new paradigm for the shift from the industrial tothe digital society. It is obvious that ‘something is trying to happen’. There areislands of rethinking and new frames of reference popping up in the ocean ofbusiness strategy and management. What is needed is a holistic frame ofreference that can help bridge the troubled waters separating those islands.
129
8

130 � Global logistics
Demand chain management (DCM) is an important new business model tohelp with this. Electrolux, one of the world’s leading appliance companies,has created its own version of DCM, called demand flow leadership – andthese words are carefully chosen. Demand means consumer-centric, with allactivities based on consumer insight. Flow suggests an even, steady, uninter-rupted and quality-assured value stream – as opposed to a chain of sequential,connected links. Leadership refers to the fact that the demand flows are notorganizational units that have to be managed. Demand flows are processeswhere leaders can emerge anywhere in the value network. Their efforts haveto be supported by executives with a vision of what can be achieved.
Visions and tools
Man is limited not so much by his tools as by his visions.(Christopher Columbus)
The evolution of management concepts is influenced by several things. Oneof the most important is executive vision, which is important for identificationand application of relevant methods and tools. Another is new tools, whichcreate new possibilities. Information and communication technology (ICT) isa major trigger for renewal – and also a major enabler in the transition fromthe old industrial to the new digital world. The availability of new ICT tools isincreasing rapidly, and the trick is to know which ones to use and for whatpurpose – with implementation driven by business needs and not by tech-nology availability.
External developments also have to be analysed and classified in order ofimportance. External opportunities and threats should be transformed intoaction and internal adaptation – triggering internal rethinking and restruc-turing. Increasing global competition puts heavy stress on proaction rather thanreaction – and it is important to identify trends early and benefit from them. Forexample, identification of emerging consumer needs, and efforts to turn marketvolatility from a threat to an opportunity are two of the major goals of DCM.
A lot of today’s thinking has its roots far back in history, but visions thatearlier could not be reached because of lack of efficient tools can now berealized. The next issue, then, asks how new concepts should be implementedto create lasting change. To get a better understanding of this it is worthlooking back in history, to learn from experience and see how lastingmanagement concepts have developed over time.
The evolution of management concepts
In order to look forward we have to look back.(Winston Churchill)

The diffusion of a concept like DCM follows the usual S-shaped curve, with earlyadopters and laggards. It is also clear that there will never be complete implemen-tation in any sample of companies, as the concept simply does not fit all condi-tions (Towill, 1997). We can see this in the development of other managementconcepts. In 1981, I described the development of production, sales andmarketing orientation to provide a background to the evolving materials flowconcepts (Ericsson, 1981) (see Figure 8.1). I wanted to show how concepts buildon each other and develop partly in response to problems created by an oldconcept. The best parts of the old concept remain and are refined, while the flawsare removed. There is a considerable overlap in time, with laggards still intro-ducing a new concept while early adopters are leaving for an even newerconcept. Intense, global competition makes it more and more dangerous to lagbehind, as concept life cycles – like product life cycles – get shorter over time.
Production orientationIn the early 1900s, production orientation developed as a natural response toincreasing demand for industrial goods. Scientific management focused onthe production process and the possibility of increasing productivity throughrationalization. Taylor ’s frame of reference and the availability of newmethods and tools hastened development and accelerating growth.
Demand flow leadership � 131
1900 1910 1920 1930 1940 1950 1960 1970 1980 1990
Productionorientation
Salesorientation
Marketingorientation
Material floworientation
Source: Ericsson, 1981
Figure 8.1 The development of four major management concepts over time

Keith (1959) summarized the management philosophy of Pillsbury for theyears 1891 to 1930, saying, ‘Our task is to grind flour of high quality and to sellit. However, it is important that the business idea is built on the availability ofwheat and water-power – not the availability and closeness of growingmarkets or the demand for better and cheaper flour.’ Such a narrow viewcauses problems when productivity increases and getting rid of the productbecomes a problem. Early writers observed this and pointed to the demandmarket as the major problem. In 1915 Shaw wrote, ‘Even if we are still on thethreshold to all the possibilities offered by increasing productivity, the devel-opment has already surpassed existing distribution systems. We have to findmarkets for the products we can manufacture. The most important issuetoday is to systematically study distribution in the same way as we have beenstudying manufacturing.’ Despite this, laggards still stuck to productionorientation until the 1950s and 1960s.
Sales orientationIn the 1920s, the view of sales orientation evolved, with Borsodi (1929)summarizing the change of focus by saying, ‘The days are gone when therecipe for big profit simply was manufacturing, more manufacturing – andeven more manufacturing! The distribution age is here.’ Then Pillsbury’sphilosophy changed to: ‘As a flour producing company with many differentproducts for the consumer market, we need a first class sales force to get rid ofall the products we can produce at a good price’ (Keith, 1959).
The sales orientation was sufficient in a seller’s market, when demand ishigher than supply. However, when the situation was reversed, a change ofmindset was needed. The sales orientation was successively replaced by amarketing orientation.
Marketing orientationA ‘new marketing concept’ was launched in the early 1950s – with authorsmaking a distinction between the old production and sales concepts and thenew marketing concept. It was stressed that marketing is consumer-centricand focuses on analysis, planning, product development and profitability –and not only sales volume.
Pillsbury’s philosophy changed again to: ‘Today marketing in our companyis seen as the function that plans and executes sales – the whole way from ideageneration, through development and sales to the customer. Marketing startsand ends with the consumer… the marketing department leads all companyresources in the transformation of the idea to a product and the product to asales agreement’ (Keith, 1959). This statement could have been written today,with the major difference that we now have the tools to carry it through. Thefocus had shifted from production to marketing, from the products we can
132 � Global logistics

manufacture to the products the consumer really wants and from thecompany to the market.
But the new marketing concept started to create its own problems, most ofwhich came from too far-reaching customer orientation with focus on serviceand delivery – without any deeper analysis of the concepts and the conse-quences. Scattered remedies were popping up, but most of these were fadsrather than cures. They generally demanded more flexibility and smallerbatch sizes in manufacturing, while focusing on delivery lead times – andgave higher inventory, transportation and handling costs. The lack of a theor-etical framework and a common language resulted in tension and conflictsbetween marketing and manufacturing – and increasing struggles for power.These problems initiated the development of the materials flow orientation,when it became clear that the problems could only be solved with a moreholistic approach.
Materials flow orientationIn the early 1960s the materials flow approach started to spread in Sweden. Itgrew rather slowly to the end of the 1960s, and then took off when theconcept of materials administration was developed through close collabor-ation between universities and major industrial companies such as Volvo,SKF, Atlas Copco, Sandvik and Astra. The approach was called materialsadministration because it was a much broader and more strategic conceptthan logistics at that time (see Ericsson, 2003). In particular, materials adminis-tration (MA) was defined as ‘Planning, development, coordination, organi-zation, control and review of the materials flow from raw materials supplier tothe ultimate user’ (Ericsson, 1969b).
The concept focused the need for integrated management of the inflow,throughput and outflow. From the start, MA stressed coordination and thestrategic aspects of effective materials flows, but it also emphasized thatimplementation had to start internally with synchronization of purchasing,production and physical distribution on an operational and tactical level (seeFigure 8.2). The internal structuring of the company must increase cooper-ation and synchronization of activities in different departments.
The focus on internal processes was the starting point for the implemen-tation, but it was clear that internal efficiency was not enough, and links withsuppliers and customers also had to be improved and coordinated. The firststep was to improve cooperation on the supply side. Supplier developmentand evaluation, stockless buying, systems contracting and co-makershipbecame key words in this development (Ericsson, 1969c).
The next step was to increase cooperation with first-tier customers. Earlywriters on marketing focused on consumer markets, but now the interest inindustrial marketing – and hence in industrial buying – increased (Ericsson,1969a).
Demand flow leadership � 133

134 � Global logistics
The term ‘control’ in the definition of MA refers to the use of developingcomputer tools for managing materials flows. Initial steps focused on opera-tional and tactical levels in the company, but soon the strategic aspects of MAcame into focus – not only for directly flow-related functions such aspurchasing, production and physical distribution, but also with marketingand R&D and engineering.
Phases in the development of the materials administration/logistics conceptThe early development of the concept shows a typical growth curve: a ratherslow start with acceleration in the early 1970s, as shown in Figure 8.3 (Ericsson1981, 2003; Green, 1989).
The first generation of logistics – the total-cost-oriented one – came as aresponse to increasing need for a holistic view on costs. The functional andsilo-oriented approach that had evolved as a consequence of the division oflabour had gone too far. By the 1950s this approach had started to showmajor weaknesses – trade-offs between functions and departments werehard to achieve and sub-optimization was a major threat. Luckily, somenew methods and tools were appearing to solve the problem, such as oper-ational research models and emerging computer technology. So the firstgeneration of materials administration/logistics was born in 1969 as aresponse to problems and needs – and the increasing availability ofeffective tools.
The vision is ‘to create an even, steady, uninterrupted and quality assuredflow from raw materials supplier to the ultimate user’ (Ericsson, 1969b). Thiswas a guiding statement of the ideal situation when all members of the flow
R&D andEngineering
Supplier Customer
Marketing
Purchasing Production Distribution
Strategic level
Tactical level
Operationallevel
Coordination
Stocks Stocks
Conversion
Figure 8.2 The MA concept with coordination of internal and externalflows and processes

think and act as one. This vision is very close to Towill’s (1997) concept of the‘seamless supply chain’.
External conditions changed again with rapid growth in the 1960s replacedby zero growth of the 1970s. The problem was then to gain a bigger share of anon-growing cake. The solution was the second generation of logistics – therevenue-oriented one – based on logistics as a means of competition. One ofthe ways of increasing sales was to increase the local presence with salesoutlets and warehouses close to the customer. The number of warehouses andnumber of items exploded – with the capital tied up in inventory creating newchallenges. This triggered the third generation of logistics – the profitability-oriented one – that was born in the 1980s.
During the late 1980s and the early 1990s the need for more and better inte-gration both internally and externally increased – but communication andintegration tools were developing fast. Business process re-engineering andtime-based management caught on and, if properly applied, could serve as abasis for effective and efficient use of new ICT tools.
The fourth and fifth generations of logistics – respectively the time andprocess one and the IT-based one – were born. They served as the launching
Demand flow leadership � 135
2
1960 61 62 63 64 65 66 67 68 69 70 71 72 73 74 75 76 77 78 Year
4
6
8
10
12
14
16
18
20
22
24
26
28
30
32
34
36%
Number of companies
Figure 8.3 The development of the MA concept

pad for increased and improved integration in supply chains. They alsopointed to the need to focus on inter-organizational processes, rather thanon institutions in the chain. Different definitions of SCM illustrate thischange of focus (Cooper, Lambert and Pagh, 1998). The implementation ofSCM was enabled and facilitated by two important toolboxes that weredeveloped in the 1990s – business resource management and e-logistics.
Business resource managementIn the 1980s, the need for deeper integration and synchronization of processesacross functional areas became urgent. In order not to get stuck in traditionalfunctional or departmental silos, the focus was on interdepartmentalresources and processes. This holistic view was called business resourcemanagement (BRM) (Ericsson, 1990). It had its roots in classical managementliterature, where the four main resources were ‘men, materials, machines andmoney’ – with information as a major new resource. The aim was to create aframework for integration of resources, flows and processes.
BRM is a broad, holistic management approach, and soon it became evidentthat it also could be used as a basis for inter-organizational processmanagement. The focus on resources, flows and processes was an excellentstarting point for process-oriented SCM and DCM.
E-logisticsBRM is a forerunner of the broadening of the logistics concept into e-logistics– which is a toolbox for improving inter-organizational relations. It was aresponse to the increasing interdependence between logistics and ICT.
The evolution of the logistics concept illustrates the interplay betweenvisions and tools. In the early history of logistics development, tools werelagging behind visions and we were asking for more tools – in the mid-1990s,however, the tools surpassed the visions and the next issue was to renew thevision and create ways of using the new tools (Ericsson, 1996, 2003). E-logisticswas launched to provide a framework for using the new tools of logistics,process management and ICT – and the opportunities created by the interplaybetween them. E-logistics is the enabler of increased collaboration in thesupply chain and it also creates opportunities for true consumer orientation.
New tools are continuously developing, while old ones change focus anduse. For example, the concept of quick response is not new, but it has a newand deeper meaning when used to give customer orientation in fast-movingindustries. New ICT tools – especially customer databases – improve relationswith customers and enable point-of-sale and point-of-demand techniques.New tools for linking enterprise databases, applications and business systemsare also developing fast.
136 � Global logistics

Supply chain managementThe concept of supply chain management evolved as a response to thenecessity of improving and extending cooperation. The relationships insupply chains moved from arm’s length, often adversarial, transactions todifferent levels of integration – ranging from coordination, through cooper-ation to collaboration. Then e-logistics, with its focus on process management,is a major enabler of both SCM and DCM.
There are several ways of defining processes in business (Cooper, Lambertand Pagh, 1998). I have chosen to distinguish between three core businessprocesses: time-to-cash, time-to-market, and customer creation and retention.The time-to-cash process includes the total materials, information and paymentflows. Time-to-market is the total process for creation, development andimprovement of products and services. The customer creation and retentionprocess creates and retains customer relations all the way from the first contact,via after-sales, follow-up and continuous improvement (Ericsson, 2003).
The difference between logistics and SCM becomes clear if we take theseprocesses as the starting point. Both concepts focus on the flow from rawmaterials to ultimate user. MA/logistics has its main focus on the materialsflow and its connected information flows. In other words, it is focused on thetime-to-cash process. The SCM concept also considers the other two coreprocesses – time-to-market and customer creation and retention. Hence, theSCM concept is broader than the MA/logistics concept. It focuses on the inte-gration and synchronization of inter-organizational relations and processes.This explicitly changes the focus from the individual company to the supplychain as a whole. SCM developed as a remedy for reoccurring problems at theinterfaces between entities in the chain. It was important to ‘get the entities toact as one’, which was apparent when the fact that competition takes placemore between supply chains than between individual companies started tobe recognized and accepted (Christopher, 1992).
However, in practice, it still was very much ‘us’ against ‘them’ both insidesupply chains and in relation to outside customers. Everyone talked aboutconsumer-centric approaches, but they were not being implemented. Thiscreates increasingly severe problems when the locus of power shifts down thesupply chain to the final customer. Global competition, increased volatilityand decreasing product life cycles accentuated the problems. It became clearthat there was a need for a new business model.
The evolution of a new business model
We need a completely new way of thinking in order to solve the problems we havecreated by using the old way of thinking.
(Albert Einstein)
Demand flow leadership � 137

The evolution of the DCM concept is, maybe, the first step towards a majorrethinking. The transition from yesterday’s business model into tomorrow’sis shown in Figure 8.4, which illustrates that we are moving from a push to apull approach – from an SCM to a DCM. We are moving from yesterday’smodel based on independent, inventory-based entities aiming for low-costproduction to tomorrow’s model with information-based virtual networksaiming for creation of perceived consumer value. Supplier-driven massproduction and mass marketing are replaced by market-driven masscustomization and one-to-one marketing.
If we believe in this description it is quite clear where we are and where weare heading. The question is how to get there. The first step is to make someinternal as well as external adaptations and alignments.
Internal alignmentsThere is clearly a need for closer integration of logistics/SCM and relationshipmarketing (Ericsson, 2003). The concept of relationship marketing has evolvedinto customer relationship management (CRM), which allows a business totarget customers more closely and implement one-to-one marketing strategieswhere appropriate, and which makes the alignment with SCM even moreimportant. The key is to knit together the knowledge and expertise from SCMwith the knowledge of marketing/sales and buyer behaviour. Internally, this isa question of getting a common demand chain strategy that is based on both
138 � Global logistics
Figure 8.4 The business model of the future
Yesterday’s model
• independent entities• inventory-based• low-cost production
Market driven
Supplier driven
Mass customization/one-to-one marketing
Mass production/mass marketing
perceived customer valueoriented
information-basedvirtual networks
Tomorrow’s model
•••

the marketing/sales and logistics/SCM strategies. Demand creation has to besynchronized with demand fulfilment. In theory, this is obvious, but there stillis a long way to go before this is implemented in practice.
External alignmentsExternally, processes and systems must also be aligned and synchronized:
1. Perceived customer values and the market segments have to be defined toanswer the question, ‘What are the explicit and implicit demands andrequirements of the customer?’
2. Value chain processes are defined to answer the question, ‘What processesshould be synchronized in order to fulfil the needs and demands in thevalue segments?’
3. The network structure of the customized supply chain (the value chain)must be defined, answering the question, ‘Who are the key value chainmembers with whom to link processes?’
4. Value chain management components are defined based on the question,‘What level of integration and management should be applied for eachprocess link?’ (Cooper, Lambert and Pagh, 1998).
Most contemporary DCM research focuses on interfaces in the commercialchannel, ie on B2B relations, but the interface between the commercialchannel and the consumer is the most important one. Because of the directdemand, the consumer’s wants, desires and needs are of a different nature.The focus on consumer insight and deep knowledge of consumer needs andwishes is the major difference between demand-driven SCM and DCM.
Demand chain managementIn recent years, there has been intense discussion of SCM and DCM. Is there achoice of either one or the other? Should DCM replace SCM? Is DCM justanother name for demand-driven supply chain or is it completely new? Myconclusion is that DCM is a natural next step in the evolution of the SCMconcept based on the necessity for adaptation to changing external andinternal conditions and the availability of new tools. It is a matter of adaptingto changing circumstances and creating and using the right tools.
Responsiveness is the key to the new global economy – and also to the DCMapproach. ‘Customer ecstasy – at a profit’ is the battle-cry of the new globaleconomy (Ericsson, 2003). The key is to create value to the consumer, but in acost-effective and efficient way. This is, in a nutshell, the mission of the DCMapproach.
From a theoretical point of view, DCM is a logical way of refocusing andcreating a new business model for the digital and global society. Intensified
Demand flow leadership � 139

competition and the availability of new tools push for a change of focus. Thequestion is can we see any sign of a new model in practical applications – or isthe concept just another academic fad?
Practical applicationsThere is some evidence of DCM emerging in business. Over the years, powerin the distribution channel has moved from the manufacturer to the whole-saler and retailer. Today, the power rests with the consumer. This makes directcontact between the manufacturer and the consumer a vital ingredient increating competitive strength. Dell has solved this problem with close collab-oration with suppliers and customers. However, most companies cannotbypass intermediaries, so relationships with retailers are crucial, as they formthe main interface with consumers.
The car industry has been trying to handle this problem for some time andhas used all types of electronic tools. However, in 2001, an industry analyststated that ‘The business model for the car industry is broken’ (USA Today,2001). GM had already started to create a new model for the car industry, andthey launched a project for ‘Building a digital loyalty network throughdemand and supply chain integration’ – with the purpose of benefiting fromcloser integration of purchasing/SCM, marketing and ICT.
On the retail side, Wal-Mart is often cited for its intelligent use of infor-mation and for running the entire organization on the basis of consumerdemand. This allows it automatically to delist products from a group of storesafter only two days of performing badly. IKEA’s ability to move goods quicklyfrom its suppliers, through warehouses and on to stores is impressive.Products are packaged and sold to consumers in a way that facilitates speedthrough the chain. IKEA measures total logistics costs for products in terms oftransportation, storage and investment in inventory. The capital cost is espe-cially important, and the company often works with double sourcing – oneregional supplier and a low-cost supplier in Asia – with the control systemmaking it possible to switch source quickly depending on sales.
Today, the fashion industry is an archetype of the new business model, andthe Spanish company Zara is maybe the best example. In the volatile world offashion, where trends go in and out of style very quickly, Zara is efficient atminimizing obsolescent stock and bringing new products to shops very quickly.
ConclusionsWhat, then, can we learn about the development of management concepts?We can certainly see that history repeats itself – as concepts come and go andreappear in a slightly modified and refined shape. For example, consumerorientation was stressed in the 1950s as the key to success in ‘the newmarketing concept’. Today, it is the key to success in the DCM approach – with
140 � Global logistics

consumer insight going deeper and having more tools available than the oldcustomer orientation. However, it is evident that implementation will be justas bothersome as it was with the marketing concept, and it still takes time.
Unlearning is more difficult than learning – so a change of tools is easierand swifter than a transition of mindsets. The change process has to be basedon a vision and a consistent frame of reference, which is based on earlier ex-perience. Implementation has to be well planned and systematic, and acommon language must be established within the change network. Trainingand education are the key!
A conceptual model for the implementation of theDCM concept
By trying to do the impossible, you will reach the highest degree of what is possible.(August Strindberg)
If we summarize lessons from the development of major managementconcepts and add recent thinking regarding DCM, we come up with somecornerstones and recommendations for the transition from SCM to DCM.
Consumer insightThe first cornerstone is that we have to focus on the consumer and define notonly explicit but also implicit needs, wishes and desires. So consumer insightgets more and more important. For example, Zara has fashion scouts who tryto identify emerging fashion trends. Ericsson has a ‘consumer and enterpriselab’, which carries out several thousand interviews a year all over the world,with results reported directly to top management. Electrolux has ‘the sparkprocess’ (which we discuss below).
Consumer insight is the starting point for product creation, shorter-termactions in marketing/sales and logistics, and the creation of effective and effi-cient demand flows. So processes in the whole chain are based on directknowledge of consumer needs and wishes.
Value segmentsThe definition of value segments, based on knowledge deriving fromconsumer insight, is the second cornerstone. The segments reflect differentperceived consumer values. Consumers are identified and classified intosegments, which are used as targets for product innovation and developmentof value chains. Value streams are designed to fit specific segments.
Demand flow leadership � 141

142 � Global logistics
Product innovationThe third cornerstone is product innovation, which grows more and moreimportant with increasing competition. There are three strategies a companycan choose to avoid being trapped in the commodity corner – to be the opera-tional leader with the lowest costs in the industry, to be the product leaderwith the most innovative products, or to be the leader in terms of customercare (Treacy and Wiersema, 1995). Each of those strategies requires a differentsupply chain solution.
Internal alignmentsThe fourth cornerstone has internal alignment to create a holistic view ofproduct flows. Perceived customer values form the starting point for focusinginternal resources. Marketing and sales departments are supposed to havethe best knowledge of customers, and it is important to integrate theirknowledge of demand creation with logistics knowledge about demandfulfilment. One of the most important issues is to improve internal cooper-ation between these two.
External alignmentsWhen the internal value-adding system is in order, the next step is to structurethe value chains and the network and continuously improve relationships.This is a normative description of what to do to move a company from abusiness model based on traditional SCM to a business model based on DCM.How does this fit a practical situation? Swedish industry has always been anearly adopter of new business concepts, and today Electrolux is one of thepioneers of the DCM concept. So we can look at Electrolux to see howmanagement concepts can be implemented.
Case in demand flow leadership – the Electrolux Way
BackgroundThe Electrolux Group is the world’s largest producer of appliances. Thelogistics complexity is illustrated by the fact that around the world two peoplea second buy a product from the group – and in Europe a railway wagon isloaded with Electrolux products every four minutes.
Electrolux is working in an increasingly competitive industry characterized by:
� intense competition, increased global product standardization, andshorter product life cycles;
� manufacturing and sourcing being moved to low-cost countries;

Demand flow leadership � 143
� consolidation and globalization of the retail industry, leading to pricedecline, with cost savings passed on to retailers and consumers.
Electrolux – in common with most other companies – notices that:
� Customers have different wants and expectations, so they need differentcustomer offers in terms of physical products, services and communi-cation. This, in turn, requires customized logistics solutions.
� Customer perceptions of the Electrolux brand are influenced by thelogistics performance.
� Electrolux has to find out more about customers and the whole demandchain.
In this situation Electrolux has chosen to ‘sell products the consumers arewilling to pay for, to build a strong brand image, and to put a lot of effort intothe innovation process’.
Consumer insightA DCM approach starts with the consumer, but the traditional type ofcustomer orientation is not sufficient. A lot of companies do consumerresearch and use consumer panels – so this level of consumer service is arequired minimum. Consumer insight has to go deeper. It has to identifywants and requirements and also the latent needs of the consumer – demandsthat consumers cannot really express.
Electrolux takes consumer insight as the starting point for product inno-vation and its ‘demand flow process’. The purpose is to find out where andwhat the real needs and requirements are, and how consumers perceiveproblems. The Electrolux vision states that it should be consumer insightdriven, ie focusing on consumer needs, wants and desires when settingstrategies, developing products and launching them. To achieve this, thou-sands of scouts from Electrolux visit people’s homes around the world toanalyse how washing, cleaning and vacuuming are actually performed.
One observation was that a lot of people have the vacuum cleaner in thesitting room – because, when children come home dirty, it is better to clean upright away before dirt is spread to the rest of the home. This observation trig-gered the ‘instant clean’ segment and a wireless vacuum cleaner that sellsvery well in 40 countries.
Electrolux calls this approach ‘the spark process’, which identifies needs,ensures that a sufficient number of consumers share the same problem (so thatthere is a market for a product) and develops a solution to solve an identified,specific need. Keys to the spark process are two evaluation stages whereconsumers are interviewed in depth about the ideas, and where prototypes ofthe suggestions are made and tested.

The CEO, Hans Stråberg, says:
From the 1960s on consumer durables were sold on technical specifications such as‘500 watt, 40 decibel, 50 litre’. Today, this does not appeal to consumers. That is whyElectrolux is positioned as a ‘life style brand’. We are back to consumer focus – that is,not to sell what we can produce, but produce what we can sell. It is a vital distinction.
(Forsman, 2005)
Value segmentsThe next step in the Electrolux process is to map and classify consumer needsand wishes, to create a number of consumer segments with differentperceived values. Matrices are developed where, for example, one dimensionis ‘type of consumers’ and the other dimension could be themes or trends.Every new product aims for a specific segment, with Electrolux almostdoubling the number of product introductions since 2002.
Product innovationThe increase of raw material costs and the price squeeze from low-cost coun-tries are reducing margins for Electrolux. By more focused product devel-opment, Electrolux is hoping to increase profitability – while sales areincreasing. ‘The strategy really delivers results’, says Stråberg. ‘Profit during thethird quarter of 2005 has increased by 20 per cent. All divisions show prof-itability, increasingly because of the launching of new and innovative products.’
Globalization and the opening up of new markets have caused seriouscompetition from low-cost countries. The Electrolux alternative is to sellproducts that consumers are willing to pay for, to strengthen the brand, and toput a lot of effort into innovation. They stress design, saying that ‘A companywithout good design is a company without a vision’ – and they use creativestudents from all over the world to spark ideas. The best ideas are presentedto top management and properly rewarded. This means that design is muchmore than stylistic changes – it is the process that transforms ideas intoproducts for consumers, and it has a strategic role that impacts the entirechain.
Internal and external alignmentsAt corporate level, a group of 15 people help the whole organization witheducation and training in consumer insight. The responsibility for implemen-tation, however, rests with the different product lines. Within the product lines,product flow managers have the mission to increase growth by, among otherthings, focusing innovation. One of the new managers, Christina Lindstedt,says, ‘My task is to take responsibility for the whole chain – from the cradle tothe grave. What is new is the focus on the entire chain. Earlier the responsibility
144 � Global logistics

was divided between functions. There has not been a clear allocation of respon-sibility for profitability within the product line’ (Hedelin, 2005).
On the external side, the key is the understanding that every retailer ’sdemand is different. Some retailers have warehouses, while others carryminimal stock. Some retailers sell upper-end products, while others deal inlow-end products. Understanding which retailers sell which products andhow their business model works sets the stage for defining the total demandpicture for the retailer. From there, a supply chain solution for satisfying theretailer’s need can be developed. A supply chain solution is a combination ofa supply method (reflecting the production system capabilities) and adelivery method (reflecting delivery system capabilities).
‘The Electrolux Way’To compete effectively, Electrolux has embarked upon a major change processcalled ‘The Electrolux Way’, which focuses six major processes: brand,product creation, demand flow, purchasing, people and business support.‘Demand flow leadership’ is part of this rethinking and consists of four steps:
1. Change the mindset and create an understanding of:– new possibilities in the digital economy, and the necessity and oppor-
tunities of a new business model;– the needs and wishes of consumers, retailers and suppliers;– the value segments based on consumer insight and perceived
consumer value.2. Define interfaces and relationships in the processes – and systems and
logistics solutions needed to satisfy consumer needs.3. Develop ICT systems and tools for data sharing and collaboration.4. Improve and strengthen relationships between partners continuously.
Changing the mindset may be the most important – and also most difficult –step. Most contemporary thinking is based on efforts to achieve efficiencythrough leanness. This implies a value stream that eliminates all waste – and thismeans a level schedule, stability, high volumes, low variability and low variety.The digital society, on the other hand, is based on agility to handle flexibility, lowvolumes, high variability and high variety. Agility is the key to consumer respon-siveness, based on a network that enables exploitation of profitable opportu-nities in a volatile market. This uses marketing and consumer knowledge ina proactive way – with a mindset change from one of solely focusing costefficiencies to one of also highlighting revenue and margin enhancement.
Electrolux establishes the link between logistics and value creation bysaying ‘There is no value in a refrigerator until it is in the hands of theconsumer.’ Torkel Elgh, head of Global Logistics, stated, ‘Our ability to servecustomers with excellent logistics is a competitive advantage in maturemarkets and this ability is built on competence.’
Demand flow leadership � 145

Conclusion
By focusing on the management of entire value chains, demand chainmanagement has gained increasing popularity both in management researchand in practical application – and also in the teaching of global businesses. The‘theory’ creates the background for implementation that can take companiesto great heights; lack of attention can draw companies close to peril.
References
Borsodi, R (1929) The Distribution Age, Appleton, New YorkChristopher, M (1992) Logistics and Supply Chain Management, Financial
Times/Pitman, LondonCooper, MC, Lambert, DM and Pagh, JD (1998) Supply chain management:
implementation issues and research opportunities, International Journal ofLogistics Management, 9 (2), pp 1–19
Ericsson, D (1969a) Industrial Marketing, Beckmans, StockholmEricsson, D (1969b) Material Administration/Logistik, Hermods, MalmoEricsson, D (1969c) The Purchasing Function: Goals and methods, Hermods,
MalmoEricsson, D (1981) Materials Administration: A top management responsibility,
Liber, New YorkEricsson, D (1990) Business resource management: a framework for strategic
management of the materials flow, in Handbook of Logistics and DistributionManagement, ed J Gattorna, Gower, London
Ericsson, D (1996) Virtual Integration, Unisource, Norcross, GAEricsson, D (2003) Supply/demand chain management: the next frontier for
competitiveness, in Global Logistics and Distribution Planning, 4th edn, edD Waters, Kogan Page, London, pp 117–36
Forsman, L (2005) Innovation as a driving force, Teknikforetagen, DecemberGreen, M (1989) The Evolution of the Swedish Concept of Materials Administration
from a Conceptual Perspective to an Established Discipline, CTH, StockholmHedelin, J (2005) New products are speeding up the white goods giant, Dagens
Industri, 15, NovemberKeith, RJ (1959) An Interpretation of the Marketing Concept, American Marketing
Association, Chicago, ILShaw, AW (1915) Some Problems in Market Distribution, Harvard University
Press, Cambridge, MATowill, DR (1997) Successful business systems engineering, IEEE Engineering
Management Journal, 7 (1), February, pp 55–64Treacy, M and Wiersema, F (1995) The Discipline of Market Leaders, Addison

148 � Global logistics
included activities still prevalent today such as assembling, storing, riskbearing, financing, rearrangement, selling and transporting. Such activitiesprovide place and time utility, ie products in the right place throughmovement and at the right time through availability. Conversely, manufac-turing provides for utility of goods through making tangible products fromraw materials while other marketing activities such as credit and quantitydiscounts provide possession utility. The operative instrument for suchmiddlemen is the channel of distribution (Grant et al, 2006).
A disintegration or segregation of physical distribution from the other threemarketing mix variables of product, price and promotion began in the 1950swith the introduction of the marketing concept. Physical distribution activ-ities were reduced to only physical supply and distribution functions and thenotion of physical distribution customer service was misplaced (Bartels, 1982).
However, a move to reintegrate physical distribution and marketing beganin the 1970s when writers argued they belonged together in terms of theor-
Product
Order-processingand information
costs
Place/customerservice levels
PromotionPrice
Inventorycarrying costs
Transportationcosts
Warehousingcosts
Lot quantitycosts
LOG
ISTI
CS
MA
RK
ETI
NG
Marketing objective: allocate resources to the marketing mix to maximize the long-runprofitability of the firm.Logistics objective: minimize total costs given the customer service objective where:Total costs = Transportation costs + Warehousing costs + Order-processing and information costs +Lot quantity costs + Inventory carrying costs.
Source: Grant et al, 2006
Figure 9.1 Marketing and logistics customer service costs trade-off model

etical progress and applications because of their strong historical linkages andconceptual developments. Such a rediscovery stemmed from the need tofocus on customers in a changing environment (Sharman, 1984) and the real-ization that firms that did so would obtain additional business and profitsfrom leveraging their distribution operations (Shapiro, 1984).
Further, customers have become more sophisticated and demandingduring the last 30 years and their expectations of suppliers’ abilities to meettheir needs have subsequently increased. Accordingly, many suppliers,retailers and service organizations have striven to improve logistics customerservice processes to establish or maintain a competitive advantage. Desiredoutcomes are satisfied customers, increased customer loyalty, repeat andincreased purchases, and improved corporate financial performance(Daugherty, Stank and Ellinger, 1998).
But what exactly is customer service, particularly in a logistics or supplychain context? Johns (1999) noted that there are 30 definitions for the word‘service’ in the dictionary; thus the concept of service in a business contextmay be elusive or confusing. Service can mean an industry or organization (eggovernment services), an outcome that has different perspectives to bothservice provider and customer (eg on-time delivery), product support (egafter-sales service), or an act or process (Johns, 1999).
La Londe and Zinszer (1976) initiated a refocus on logistics customerservice, which they defined as:
a process which takes place between buyer, seller and third party. The process resultsin a value added to the product or service exchanged… the value added is alsoshared, in that each of the parties to the transaction or contract is better off at thecompletion of the transaction than they were before the transaction took place. Thus,in a process view, customer service is a process for providing significant value-addedbenefits to the supply chain in a cost effective way.
The notion of process suggests that logistics activities are more like servicesthan goods. There are distinct differences between services and goodswithin the marketing mix category of product, and Hoffman and Bateson(1997) describe the four important characteristics that distinguish servicesas:
intangibility as services cannot be seen, smelt, felt, tasted or otherwise sensed similarto goods; inseparability of production and consumption as most services involve thecustomer in the production function; heterogeneity or inconsistency of the servicefrom the perspective of the service delivery and customer experience; and perish-ability of the service if it is not consumed at the moment in time it takes place, ie, theservice cannot be inventoried.
Primary logistics activities include transportation, warehousing, inventorymanagement and order processing, and usually do not physically transformor affect goods. Logistics activities can certainly be heterogeneous, eg order
Strategies for logistics customer service � 149

cycle time variability and consistency, and are also intangible, eg the storageor delivery of a good, and perishable, eg a lorry leaving on its delivery route.
What is less clear is how inseparable logistics activities are as regards thecustomer. The customer is involved in the ordering and receiving stages but isrelatively passive throughout the provision of the logistics activities, providedthe variability is within accepted bounds. Nevertheless, logistics activitiesgenerally encompass characteristics and classification of services, ie benefitsreceived by a customer such as time, place and possession utilities areprovided by way of a service or enhanced product offering from logisticsactivities rather than from attributes of a basic product.
Products and prices are relatively easy for competitors to duplicate.Promotional efforts also can be matched by competitors, with the possibleexception of a well-trained and motivated sales force. A satisfactory serviceencounter, or favourable complaint resolution, is one important way that afirm can really distinguish itself in the eyes of the customer. Logistics cantherefore play a key role in contributing to a firm’s competitive advantage byproviding excellent customer service.
Thus, logistics customer service would be well served by the use of evalu-ation and analysis and tools from the services marketing area. However,theories and techniques from marketing have been slow in finding appli-cation in logistics research – notwithstanding calls for reintegration withlogistics (Harris and Stock, 1985) and calls for other interdisciplinary applica-tions in logistics (Stock, 1997).
The foregoing raise practical questions regarding logistics customer serviceand its application within firms. For example, what is the state of play inlogistics customer service today? What are important elements of logisticscustomer service? And how can firms establish appropriate customer servicestrategies and policies? These issues are explored in the following sections.
Logistics customer service today
Logistics costs such as inventory, warehousing, transportation, and infor-mation/order processing can be considered as a firm’s expenditure oncustomer service. Figure 9.1 illustrates the cost trade-offs and considerationsrequired to implement an integrated business logistics system. The objectivefor the firm is to maximize profits and minimize total logistics costs over thelong term, while maintaining or increasing customer service levels.
Such an objective is difficult and firms must carefully choose among thevarious trade-offs to satisfy customers’ needs and maximize profits, whileminimizing total costs and not wasting scarce marketing mix resources.Thus, there is a necessity to evaluate trade-offs between the additionalcustomer service features sought by customers and the costs incurred toprovide them.
150 � Global logistics

However, customer service levels may be higher than customers would setthemselves, and firms should ‘banish the costly misconception that allcustomers seek or need improved service’ (Sabath, 1978). However, choosingwhen to meet and when to exceed customer expectations is a key factor. Notall service features are equally important to each customer, and mostcustomers will accept a relatively wide range of performance in any givenservice dimension (Markham and Aurik, 1993).
Further, most firms in the supply chain do not sell exclusively to end users.Instead, they sell to other intermediaries who in turn may or may not sell tothe final customer. For this reason, it is difficult for these firms to assess theimpact of customer service failures, such as stock-outs, on end users. Forexample, an out-of-stock situation at a manufacturer’s warehouse does notnecessarily mean an out-of-stock product at the retail level. However, theimpact of stock-outs on the customer’s behaviour is important.
Recent research has found that an average out-of-stock rate for fast-movingconsumer goods retailers across the world is 8.3 per cent, or an average on-shelf availability of 91.7 per cent. Consumer responses to stock-outs are: buythe item at another store (31 per cent), substitute a different brand (26 percent), substitute the same brand (19 per cent), delay the purchase until theitem becomes available (15 per cent) and do not purchase any item (9 percent). Thus, 55 per cent of consumers will not purchase an item at the retailstore, while 50 per cent of consumers will substitute or not purchase themanufacturer’s item (Corsten and Gruen, 2003).
One way to establish a desirable customer service level at the retail level isto take into account such consumer responses to stock-outs. When a manufac-turer is aware of the implications of stock-outs at the retail level, it can makeadjustments in order cycle times, fill rates, transportation options, and otherstrategies that will result in higher levels of product availability in retail stores.
These observations reinforce the notion that firms must adopt a customer-orientated view and seek out customer needs. Firms also have to askcustomers the right questions to ensure important and relevant criteria arecaptured. For example, one food manufacturer maintained a 98 per centservice level, which necessitated large inventories in many warehouse loca-tions. However, this practice often resulted in shipping dated merchandise,and customers, therefore, perceived this practice as evidence of low qualityand poor service (Sabath, 1978).
Quality in logistics means meeting agreed customer requirements andexpectations (Byrne, 1992). Suppliers need to develop and deliver serviceofferings more quickly in the light of the many changes to distribution thathave emerged, such as the technological advances of efficient consumerresponse and just-in-time delivery. However, the notion of pleasing thecustomer at every turn regardless of cost has undergone a re-evaluation suchthat suppliers or shippers are now attempting to accommodate customerswhile optimizing the supply chain.
Strategies for logistics customer service � 151

This tactic requires suppliers to negotiate with the customer and possiblyshare costs with other actors in the supply chain (Richardson, 1998). Suchnegotiations may be difficult to implement as there is little evidence that logis-ticians and suppliers have developed sufficient customer interest in logisticsactivities (Blanding, 1992). This may be indicative of suppliers not properlydetermining customer needs when they establish customer service policiesand trade-offs.
Despite 30 years of research and application of logistics customer service,this attitude still appears to be the case. Van Hoek (2005), in examining barriersto establishing an agile supply chain, argued that many firms are not consid-ering the customer’s point of view or are they measuring customer service ina non-meaningful way. Figure 9.2 presents these pitfalls relative to flows in anagile supply chain.
The foregoing suggests that a customer’s product and service needs, andsubsequent supplier selection criteria for logistics services, extend beyondusual business-to-business criteria such as product quality, technical compe-tence and competitive prices. Customer evaluation of logistics suppliers mayinclude a number of intangible factors related to the service being providedas the customer seeks added value or utility from it. An example is whethercustomer service representatives are on call 24 hours a day. A firm must,therefore, have the ability to recognize and respond to customer needs if it isto have any chance of satisfying them and achieving the benefits of loyaltyand profitability. But to do that it must initially determine what thecustomers’ needs are, both from its own perspective and from that of thecustomers.
152 � Global logistics
Source: van Hoek, 2005
Figure 9.2 Pitfalls in logistics customer service
Marketsensitivity
Companies arenot respondingto customers
Companies arenot coordinatinggovernance
Companies areproliferatingproducts
Companies arenot measuringcustomer service
Virtualintegration
Processintegration
Networkintegration
Agilesupplychain

Elements of logistics customer service
A first step in understanding a customer’s service requirements or needs is toaudit existing customer service policies (Christopher, 2005). This will allow thefirm to see what they presently offer and determine how importantemployees believe these logistics customer service elements are to customers.Different industrial sectors will of course have different emphases regardingsuch elements; however, the basic groupings should be similar.
La Londe and Zinszer (1976) proposed that logistics customer servicecontains three distinct dimensions: pre-transaction, transaction and post-trans-action, which reflect the temporal nature of a service experience. They alsoproposed various elements within these dimensions, as shown in Figure 9.3.
Although La Londe and Zinszer’s work was conducted 30 years ago, a morerecent study (Grant, 2004) from the customer’s perspective (as opposed to thesupplier ’s perspective) found similar elements and dimensions of logistics
Strategies for logistics customer service � 153
Source: Grant et al, 2006
Figure 9.3 Elements of logistics customer service quality
Pre-transactionelements
Transactionelements
Post-transactionelements
Customerservice
Advice on non-availabilityQuality of sales representativesRegular calls by sales repsMonitors customer stock levelsConsults on new product/package developmentReviews product depth and breadth regularlyCommunicates target delivery dates
Accuracy of invoicesReturns/adjustmentsDamage (concealed and visible)Well-stacked palletsEasy-to-read ‘use by dates’ on packagingQuality of packaging for in-store display
Ordering convenienceAcknowledgement of ordersCredit terms offeredHandling of queriesFrequency of deliveryOrder cycle timeOrder cycle time reliabilityOn-time deliveriesShipment delays (cycle variance)Ability to handle emergency ordersOrders filled completelyOrder status informationOrder tracing capabilityBack-order percentagesAvailability/fill-rate percentagesShipment shortagesProduct substitutes

customer service. The post-transaction dimension also includes elements ofrelationships, and the entire set is shown in Figure 9.4.
Both studies provide a list of elements that firms can use to develop theirown customer service features. These lists are by no means exhaustive butdo provide a starting point for firms to develop their logistics customerservice strategies. Firms will probably have to add or delete some elementsto service their own sectoral and local requirements.
These studies also confirm that firms should categorize customer serviceelements into dimensions related to pre-transaction, transaction and post-transaction events when facilitating operations design and customer serviceplanning. This categorization will enable firms to determine critical events intheir service and allow them to monitor and follow up on service failures.
Strategies for logistics customer service
The impetus to develop logistics customer service strategies can be eitherproactive or reactive or a combination of both. A proactive impetus followsfrom a firm’s desire to satisfy its customer’s needs, while a reactive impetusresults from a service failure. Figure 9.5 illustrates this dichotomy andpresents possible customer service techniques related to each impetus.
154 � Global logistics
Construct
Pre-order(Pre-transaction)
Order service and quality(Transaction)
Relationship service(Post-transaction)
Relationship quality(Post-transaction)
Global satisfaction(The outcome...)
Variable name
AvailabilityAppropriate OCTConsistent OCT
Accurate invoicesOn-time deliveryComplete ordersProducts arrive undamagedAccurate ordersConsistent product qualityProducts arrive to specification
After-sales supportDelivery timeHelpful CSRsCustomized services
TrustCommitmentIntegrity
Overall supplier qualityFeelings towards suppliersFuture purchase intentions
Figure 9.4 Elements of logistics customer service and relationships

Reactive techniquesUnderstanding and obtaining information about customer requirementsnecessitate an exchange of information between customers and firms.Complaint analysis is one such exchange concerning perceived customerdissatisfaction resulting from a customer service experience or criticalincident. Complaints derive from a ‘moment of truth’ between supplier andcustomer that is considered a critical incident. Critical incidents are definedas:
any observable human activity that is sufficiently complete in itself to permit infer-ences and predictions to be made about the person performing the act. To be critical,an incident must occur in a situation where the purpose or intent of the act seemsfairly clear to the observer and where its consequences are sufficiently definite toleave little doubt concerning the effects.
(Flanagan, 1954)
Thus, a critical incident is a moment of truth that becomes representative inthe mind of a customer (Lewis, 1993).
The critical incident technique (CIT) was developed as a process to inves-tigate human behaviour and facilitate its usefulness for solving practicalproblems. CIT procedures consist of collecting and analysing qualitative data to
Strategies for logistics customer service � 155
Figure 9.5 Customer service strategy process
Proactive
... to satisfy acustomer’s needs
Reactive
... to a servicefailure
Impetus to performcustomer service
Possibletechniques
Firm
Service qualityor
‘gaps’ model
SCOR modelor
benchmarking
Criticalincident
technique
Complaintanalysis

investigate and understand facts behind an incident or series of incidents. Someuses of CIT applicable to business include training, equipment design, oper-ating procedures, and measurement of performance criteria or proficiency.
Complaint handling is significantly associated with both trust andcommitment (Tax, Brown and Chandrashekaran, 1998). These concepts areimportant for supplier–customer relationship development. Complaintanalysis thus has a role as part of a post-transaction process but is not acomplete form of information for firms when used in isolation.
Such information does not provide an understanding about what customerservice features actually provide customer satisfaction. Thus, whilst it ‘mightbe an effective way to fix yesterday’s problems’, it is ‘a poor way to determinetoday’s (or tomorrow’s) customer requirements’ (Markham and Aurik, 1993).
Complaint analysis has also been called a defensive strategy since its focusis directed at aggressively protecting existing customers rather than searchingfor new ones (Lapidus and Schibrowsky, 1994). Therefore, firms using onlycomplaint analysis or CIT techniques might find it difficult to determinecurrent and future success factors and establish a competitive advantage.
Proactive techniquesIt is important that a firm establish customer service policies based oncustomer requirements and that they are supportive of the overall marketingstrategy. What is the point of manufacturing a great product, pricing itcompetitively and promoting it well if it is not readily available to theconsumer? At the same time, customer service policies should be cost-efficient, contributing favourably to the firm’s overall profitability. A proactivecustomer service strategy allows a firm to consider all these factors.
One popular method for setting customer service levels is to benchmark acompetitor’s customer service performance. One major question is what tobenchmark, and the Supply Chain Council’s supply chain operationsreference (SCOR) model provides a framework to analyse internal processes –plan, source, make, deliver and return (Christopher, 2005).
There are several issues about the effectiveness of benchmarking. Forexample, it might promote imitation rather than innovation; best-practiceoperators might refuse to participate in any benchmarking exercise; it focuseson particular activities and thus there is a failure to allow for interactivitytrade-offs; and there is difficulty in finding well-matched comparators(Santhouse, 1999).
Further, while it may be interesting to see what the competition is doing, thisinformation has limited usefulness. In terms of what the customer requires,how does the firm know if the competition is focusing on the right customerservice elements? Therefore, competitive benchmarking alone is insufficient.Competitive benchmarking should be performed in conjunction with customersurveys that measure the importance of various customer service elements.
156 � Global logistics

Opportunities to close differences between customer requirements and thefirm’s performance can be identified and the firm can then target primarycustomers of competitors and protect its own key accounts from potentialcompetitor inroads. The service quality model developed from the servicesmarketing discipline and presented in the next section enables a firm toidentify such differences and follows the call to use more interdisciplinarytechniques in logistics customer service.
The service quality modelCustomers evaluate services differently from goods owing to their differentcharacteristics. One popular method of investigating such evaluations is theservice quality or gaps model (Parasuraman, Zeithaml and Berry, 1985).Customers develop a-priori expectations of a service based on several criteriasuch as previous experience, word-of-mouth recommendations, or adver-tising and communication by the service provider. Once customers exper-ience a service they compare their perceptions of that experience to theirexpectations. If their perceptions meet or exceed their expectations they aresatisfied; conversely, if perceptions do not meet expectations they are dissat-isfied. The difference between expectations and perceptions forms the majorgaps to be investigated.
Figure 9.6 presents this model and includes the customer’s and firm’s posi-tions. The expectations and perceptions gap is affected by four other gapsrelated to the firm’s customer service and service quality activities that are forthe most part invisible to the customer.
Firstly, the firm must understand the customer ’s expectations forthe service. Gap 1 is the discrepancy between consumer expectations and thefirm’s perception of these expectations. Secondly, the firm must then turn thecustomer ’s expectations into tangible service specifications. Gap 2 isthe discrepancy between the firm’s perceptions of consumer expectations andthe firm’s establishment of service quality specifications. Thirdly, the firmmust actually provide the service according to those specifications. Gap 3 isthe discrepancy between the firm’s establishment of service quality specifica-tions and its actual service provision. Lastly, the firm must communicate itsintentions and actions to the customer. Gap 4 is the discrepancy between thefirm’s actual service provision and external communications about the serviceto customers.
Gap 5 is associated with a customer’s expectations for a service experiencecompared with the customer’s perceptions of the actual event, and is the sumof the four gaps. The firm must minimize or eliminate each discrepancy or gapthat it has control over in order to minimize or eliminate the customer’sdiscrepancy or gap related to the service experience. Using the service qualitymodel forces a firm to examine what customer service and service quality itprovides to customers in a customer-centric framework.
Strategies for logistics customer service � 157

Summary
Customer service is a necessary requirement in logistics activities and isaffected by various environmental factors shaping today’s marketplace.Logistics customer service has its roots in the marketing discipline, and logis-ticians can use and learn from marketing techniques and methodologies toinvestigate customer service.
A strategy for logistics customer service requires a basic trade-off betweencosts incurred and enhanced profit received. Each industrial sector will alsohave its own unique needs and issues that further complicate such considera-tions. However, while the importance of individual customer serviceelements varies among firms, there is a common set of elements presentedabove that should provide a useful starting point for most firms.
A global perspective focuses on seeking common market demands worldwiderather than cutting up world markets and treating them as separate entities withvery different product needs. However, different parts of the world havedifferent customer service needs such as information availability, ordercompleteness, and expected lead times. Local infrastructure, communications
158 � Global logistics
Source: Grant et al, 2006
Figure 9.6 Service quality or ‘gaps’ model
Word of mouthcommunication
Personalneeds
Transaction of perceptions intoservice quality specifications
Management perceptions ofcustomer expectations
Expected service
Perceived service
Service provision
Pastexperience
External communicationsto customers
Customer
‘Line of visibility’Firm
Gap 1
Gap 2
Gap 3Gap 4
Gap 5

and time differences may make it impossible to achieve high levels of customerservice. Also, management styles in different global markets may be differentthan those prevalent in the firm’s home environment.
Although customer service may represent the best opportunity for a firm toachieve a sustainable competitive advantage, many firms still do notimplement logistics customer service strategies or do so by simply duplicatingthose implemented by competitors. The service quality framework discussedabove can be used by firms to collect and analyse customer information,determine what is really important to customers and thus enhance theircustomer service initiatives. Globally, customer services provided by the firmshould match local customer needs and expectations to the greatest degreepossible. The successful output of such customer service considerations willbe a satisfied customer, which then should lead to increased profitability forthe firm.
References
Bartels, R (1982) Marketing and distribution are not separate, InternationalJournal of Physical Distribution and Materials Management, 12 (3), pp 3–10
Blanding, W (1992) Customer service logistics, in Logistics: The strategic issues,ed M Christopher, pp 179–93, Chapman & Hall, London
Byrne, PM (1992) Global logistics: improve the customer service cycle,Transportation and Distribution, 33, June, pp 66–67
Christopher, M (2005) Logistics and Supply Chain Management: Creating value-adding networks, 3rd edn, FT Prentice Hall, London
Corsten, D and Gruen, T (2003) Desperately seeking shelf availability: anexamination of the extent, the causes, and the efforts to address retail out-of-stocks, International Journal of Retail and Distribution Management, 31 (12),pp 605–17
Daugherty, PJ, Stank, TP and Ellinger, AE (1998) Leveraging logistics/distri-bution capabilities: the effect of logistics service on market share, Journal ofBusiness Logistics, 19 (2), pp 35–51
Flanagan, JC (1954) The critical incident technique, Psychological Bulletin, 51,July, pp 327–58
Grant, DB (2004) UK and US management styles in logistics: different strokesfor different folks?, International Journal of Logistics: Research and applications,7 (3), pp 181–97
Grant, DB et al (2006) Fundamentals of Logistics Management, European edn,McGraw-Hill, Maidenhead
Harris, WD and Stock, JR (1985) Marketing and distribution: coming backtogether at last!, in Distribution Research and Education: Today and tomorrow,ed MC Cooper and JR Grabner, pp 48–67, Ohio State University,Columbus, OH
Strategies for logistics customer service � 159

Hoffman, KD and Bateson, JEG (1997) Essentials of Services Marketing, Dryden,Orlando, FL
Johns, N (1999) What is this thing called service?, European Journal of Marketing,33 (9/10), pp 958–73
La Londe, BJ and Zinszer, PH (1976) Customer Service: Meaning andmeasurement, National Council of Physical Distribution Management,Chicago, IL
Lapidus, RS and Schibrowsky, JA (1994) Aggregate complaint analysis: aprocedure for developing customer service satisfaction, Journal of ServicesMarketing, 8 (4), pp 50–60
Lewis, BR (1993) Service quality measurement, Marketing Intelligence andPlanning, 11 (4), pp 4–12
Markham, WJ and Aurik, JC (1993) Shape up and ship out, Journal of EuropeanBusiness, 4 (5), pp 54–57
Parasuraman, A, Zeithaml, VA and Berry, LL (1985) A conceptual model ofservice quality and its implications for future research, Journal of Marketing,49, Fall, pp 41–50
Pisharodi, RM and Langley, CJ (1990) A perceptual process model of customerservice based on cybernetic/control theory, Journal of Business Logistics, 11(1), pp 26–48
Richardson, HR (1998) Must you meet all customer demands?, Transportationand Distribution, 39, June, pp 55–59
Sabath, RE (1978) How much service do customers really want?, BusinessHorizons, 21 (2), pp 26–32
Santhouse, D (1999) Benchmarking, in Global Logistics and DistributionPlanning: Strategies for management, 3rd edn, ed D Waters, pp 193–202, KoganPage, London
Shapiro, RD (1984) Get leverage from logistics, Harvard Business Review, 62,May–June, pp 119–27
Sharman, G (1984) The rediscovery of logistics, Harvard Business Review, 62,September–October, pp 71–79
Stock, JR (1997) Applying theories from other disciplines to logistics,International Journal of Physical Distribution and Logistics Management, 27(9/10), pp 515–39
Tax, SS, Brown, SW and Chandrashekaran, M (1998) Customer evaluations ofservice complaint experiences: implications for relationship marketing,Journal of Marketing, 62, April, pp 60–76
van Hoek, R (2005) Mitigating the minefield of pitfalls in creating the agilesupply chain, in International Logistics and Supply Chain Management:Proceedings of the Logistics Research Network Conference, ed J Dinwoodie et al,pp 473–78, University of Plymouth, Plymouth, UK
Weld, LDH (1915) Market distribution, American Economic Review, 5 (1), pp125–39
160 � Global logistics

Supply chainmanagement:
the challenge of systems
Philip Schary, Oregon State University
Supply chain management has become a primary business process (Hammer,quoted in Quinn, 1999). It introduced the concept of product flow through aseries of hitherto autonomous organizations – from originating suppliers tofinal customers. As it developed, it introduced inter-functional coordinationwithin the firm and later extending across suppliers and customers. Thesupply chain reduces organizational boundaries through collaboration,linking the process of material and product movement with information forcontrol. The central task of supply chain management is the control of thisprocess, across organizational boundaries, utilizing communication andcomputers, with automated procedures supplemented by selected humaninterventions. It serves as a prototype for business operations in the 21stcentury, combining human and computer-based decision making andexecution.
The setting
The management task is daunting. The span of activities far exceeds the spanof direct management control (Gereffi, Humphrey and Sturgeon, 2005).
161
10
162 � Global logistics
Their nature exposes the supply chain to multiple decision points, as well asturbulence at many different levels and with multiple dimensions. Further,the nature of the supply chain is systemic; decisions in one area have ramifi-cations in other areas, often requiring trade-offs balancing the local objec-tives of one organization with those of another. The sheer complexity of thesupply chain as a system adds problems.
Any system will fail because of ‘normal accidents’ (Perrow, 1984). Thecombination of increasing pressures to meet volatile customer demands andsimultaneously reducing costs brings consequences that may be unantici-pated. A sense of direction, however, may reduce their impact – or more opti-mistically lead to new opportunities.
The vision of product flow by itself is, however, not enough. Fine (1998)describes it in terms of capabilities: ‘A company is its chain of continuouslyevolving capabilities – this is its own capabilities, plus the capabilities ofeveryone it does business with.’ Beyond the present task and system perfor-mance, he asks what this organization can do to contribute to its future. Forthe supply chain, this shifts the focus from the immediate task to a largerperspective – with the implied question ‘Where is the supply chain going?’But future direction becomes submerged when immediate problems requireso much attention; a focus on operations neglects a higher role formanagement, in anticipating structure, organization and strategy.
The task aheadIn this chapter, I consider supply chain management organization issues. Thediscussion focuses on two promising concepts: networks and complex adaptivesystems (CAS). This treatment is qualitative (with a mathematical perspectiveavailable in Surana et al, 2005). Networks provide guidance for managementstructure and connections – saying where organizations and managers fitwithin the supply chain as a system. CAS provides a strategic perspective bydescribing the dynamics of responding to a continuously changing envi-ronment. The relationship between the two involves the complexity ofmanagement, connecting links between decision makers, and their responseto environmental issues. The argument is speculative; the questions have noimmediate answers, but it is important to begin the discussion.
The problemThe supply chain is a meta-organization, a system of connections tran-scending organizational boundaries and recognizing interdependenceamong individual enterprises. The immediate objective is to deliver productsand services matched to identified customer requirements, following specificparameters of time and product characteristics, and accompanied byrelentless pressures for lower cost. The supply chain at an operational level is

a directed system, where management strives for increased performance andreduction in cost through hierarchical control over operations. Improvementcomes not only from within organizations but through balancing the trade-offs between functional and organizational centres. The objective becomeswhole-system – rather than organizational – optimization.
Management specifies objectives, tasks and assignments – but how is itpossible to manage a supply chain spanning many tiers of suppliers? Currenttools rely heavily on information systems and automated processes for opera-tional coordination. Higher decisions use teams, matrix management,supplier associations and informal contact. None of these provide completeanswers, but they work for local issues involving parts of the chain. There is aquestion, however, about how far hierarchical management can go indirecting a system as complex as a supply chain with multiple tiers and amultitude of environmental conditions.
One solution has been to establish matrix organizations, organized arounda process but with members reporting to both a task manager and a specificfunctional area. This forms a basis for managing process-oriented organiza-tions – and supply chains (Hammer, quoted in Quinn, 1999). This can beextended to give three-dimensional matrices as a management solution toglobal corporations, with geographic location providing the extra dimension(Hedlund, 1986). However, matrix organizations are unsatisfactory becausethey automatically incorporate potential conflict between process and func-tional areas – with divided loyalties and time commitments. And they oftenproduce poor decisions.
Teams probably offer the most successful approach to date – with task unitmembers consisting of those immediately involved in a specific task orproblem area. They can be flexible, task-oriented and often informal – with alife extending only to the duration of the task. The absence of permanenceassumes an underlying organizational guidance – otherwise, their role is tosolve short-term problems. But the missing element in teams is leadership.
Leadership derives from access to knowledge, resources and positionwithin the network. In a supply chain, however, there are limits to controlbecause of organizational boundaries. Supply chain members may resistchange when it interferes with their own domains of authority. Concepts suchas lean processes take away management authority in favour of higher effi-ciency, reducing managers’ ability to respond individually to changes outsideof their immediate domains. Lean operations take resources away frominventory and capacity that could otherwise provide a buffer against adversecircumstances.
The fundamental problem of supply chain management is the conflictbetween hierarchy to control a processing system, and flexibility to respond tochange, both internal and external. Decisions come originally from the top.These may be modified by local managers to meet specific local requirements.In turn, the collective weight of these local decisions causes the system to drift
The challenge of systems � 163

and take on new characteristics. There is little protection against error – or catas-trophe. Traditional hierarchical organizations can be successful when externalconditions change slowly, functional tasks are well defined, there is little inter-functional coordination, and local responsibility can be delegated. They areinsufficient when task units must coordinate with each other to accomplish theobjectives of the organization in a context of change and volatility. They are alsoinadequate to deal with problems in new settings, requiring new rules.
The product initially defines the task of the supply chain. But it must bondto operations capabilities, and determine whether suppliers, distributors andservice providers have the capability and capacity to deliver to the finalcustomer. Fine (1998) argues for a three-dimensional approach built aroundthe capabilities of the supply chain. And while products initially define thesupply chain, processing and operations in the supply chain should in turninfluence the product configuration.
At higher levels, the supply chain is exposed to environmental factors, somefavourable, others detrimental. There are many examples of high-levelcorporate intervention for supplier failures, interruption of sources, ordisruption of transportation routes (Sheffi, 2005). A catalogue would includenatural disasters, changes in products and markets, infrastructure, globalpolitical issues such as monetary exchange, and technology. The question ishow to respond? Technological change, for example, manifested in infor-mation systems, offers frequent opportunities for competitive advantage.Early adoption can, however, be disruptive, requiring substantial organiza-tional changes and new investment. Specific applications may take time tobecome established, reducing performance. Delays in realization may resultin the loss of dominant positions, translatable into losses of markets andprofits. Further, the advent of this new technology may change not only thesystem but supplier relationships, competitive positions and even thestructure of an industry. Seemingly small events may unleash strong forcesfor change that can spin out of control.
Further, the supply chain is embedded in a larger marketplace network ofglobal supply chains in competition with each other, but with suppliers andcustomers in common (described as ‘co-opetition’ by Brandenburger andNalebuff, 1996). This introduces pressures at the least to standardize datacodes and interfaces, and possibly convert products and components intomodules that can be sold in a commodity marketplace.
Some supply chains encourage suppliers to seek outside business toremove them from complete dependency on the buyer, provide assurancethat the supplier ’s product is competitive and introduce new innovativestimulus. Changeable products and markets force the supply chain toupgrade suppliers – or even to reconstruct itself by changing members andprocesses. Changes in technology also force new buyer–seller relationships.
If there is a common theme for management, it is that it must adapt to acontinuously changing environment. A supply chain that becomes too
164 � Global logistics
ordered and insulated from change will find it difficult to respond to newenvironments and requirements. At the same time, new requirements from asupply chain conflict with an extended hierarchically managed process. Sowe must ask how a supply chain can balance a process orientation with thenew requirements for organizational agility.
Networks
The new dynamism requires re-examination of the whole supply process. Soit is worth examining networks from a theoretical view – recognizing that asupply chain is a network of organizations and relationships. There are twodistinct perspectives on networks. One considers networks from an abstract,sometimes mathematical, perspective. The other is sociological in orientation,dealing with networks within organizations.
Network theory as a distinct body stems originally from mathematicaltopology, but is now emerging as a separate field of investigation (Buchanan,2003a, 2003b). The field focuses on networks as distinct but pervasivephenomena with often randomly formed structures. Abstract networks havelimited direct relevance to the supply chain – because network theory describesrandomly formed networks, while supply chain networks are formed by inten-tional design. Some properties, however, suggest potential application.
Supply chains have an approximate metaphor in abstract networks ofnodes and connectors. Nodes can be individuals or organizations – suppliers,customers, carriers, information providers or any point where decisions takeplace that affect other nodes. Links between nodes involve communication aswell as physical movement. There is a tendency for nodes that attract the mostconnectors to become still larger. This is the Power Law that describes theconcentration of power in a few nodes, with this concentration increasingover time. Centrality, as a property of networks, becomes a source of power.The parallel in the supply chain is the lead or dominant firm, or the e-hub thatprovides portals for internet transactions. Competing centres may exhibit arivalry such as a dominant supplier challenging the supply chain leader forcontrol.
The other basis for networks is rooted in communication and organiza-tional behaviour, summarized by Monge and Contractor (2001). Their def-inition is straightforward: ‘Communications networks are the patterns ofcontact between communication partners that are created by transmittingand exchanging messages through time and space.’ Networks can includeindividuals, organizations, sources of influence or even types of institutions,depending on specific contexts. Most research is intra-organizational, butthere is some limited reference to systems of organizations. The emphasis ison relations to create communications among entities – either people or orga-nizations – as knowledge, guidance or command.
The challenge of systems � 165

Networks as organizations use ‘flexible, dynamic communication links toconnect multiple organizations into new entities that can create products orservices’ (Monge and Contractor, 2001). Their connections become theirstrength. The denser the connections, the more potentially effective thenetwork can become. However, it becomes more difficult to manage withincreasing information available to network members, which encouragesmembers to make more independent decisions. On the other hand, memberscan become overloaded with excess information, limiting their productivity.
Networks and organizationNetworks offer a different form of organization from hierarchy. As Mongeand Contractor (2001) describe them, ‘network organizations are created outof complex webs of exchange and dependency among multiple organizations.In a sense, the network organization becomes a supra-organization whoseprimary function is linking many organizations together and coordinatingtheir activities.’ Their connections permeate the entire organization, estab-lishing relationships and communication among firms, contributing value tothe whole. Their characteristics include information sharing and cooperationto produce and distribute the final product to the customer. They can operatein stable structures, flat and devoid of hierarchy, or with modules in virtualorganizations. There is also an increasing reliance on information technology.
They hold a balance between the opposing forces of hierarchical structureand markets (Powell, 1990). Structure establishes the position of each indi-vidual node in relationship to other nodes, ie its expected role in the network,such as a distribution centre in relation to a manufacturing plant.
Supply chain networks use management information networks to coord-inate and direct the physical operations of delivering products, although thenetworks may take different paths (Bovet and Martha, 2000). Informationnetworks provide control, but operating networks provide feedback on feasi-bility and capacity. Further, networks are not necessarily static structures, butcan be dynamic and respond to specific needs.
Networks in the supply chain can take several forms. Supply chains can belinear, where material and products flow through successive tiers ofsuppliers, processors and distributors. They incorporate specialized comple-mentary networks for transport, information technology, supply links andsocial relationships, utilizing forward loops for anticipating the future suchas forecasting, and backward feedback loops for control. They can becentralized into star configurations, with information flows on the internetbetween a lead firm e-hub and satellites, or a buyer and multiple suppliers.Networks can also be dense clusters with high degrees of interconnectionamong nodes.
166 � Global logistics

Relevant characteristicsOne relevant feature in discussing network organization is the tendency ofnetworks to cluster – sometimes referred to as a small world network. Inclusters, information is restricted to small groups of decision makers, to thepoint of becoming insular, as in management groups. Influence extends onlyto nearby nodes, with a dense set of internal connections. External infor-mation becomes essential to the cluster’s survival, but it requires continuouseffort to acquire. The solution lies in links outside the cluster to other relevantnodes, to provide information about the industry and its environment. Theseare described in social networks as strong ties (clusters) and weak ties (outsidelinks). The role of weak ties lies in supplying new information and perspec-tives to the cluster (Granovetter, 1982). Close collaboration between a supplierand lead firm, leading to joint product development, would be consideredstrong ties. However, a set of strong ties might also limit awareness of otherdevelopments. A solution would maintain ties to other organizations, such asalternative suppliers. This also reinforces procurement practices of secondsourcing for critical components, or maintaining lines of communication tofinal customers, beyond immediate distribution partners.
Networks also tend to concentrate linkages around key nodes, enhancingpositions as centres of power – ultimately to single, central nodes as a base ofpower. Centralization, however, is vulnerable to failure, as eliminatingdominant nodes from a network will ultimately make it collapse. As nodes areremoved, additional loads are placed on the remaining nodes, leading tocascading failures. Networks with distributed centres, on the other hand, haveredundant paths between nodes and are less prone to failure. But too manycentres creates complexity. And connectivity places upper and lower boundson the numbers of links between nodes. Too few leads to isolation and a loss ofinternal energy; too many leads to excessive information and instability.Thompson (2004) argues that network structure should be managed and thatmost connections should be loosely coupled to local hubs, so that informationcoordinating the system would flow from only a limited number of sources.
One solution describes a hierarchical organization with limited lines ofcommunication between system management and operating units. While theorganization can manage under stable conditions, it would soon becomeoverloaded under abnormal circumstances. To relieve this communicationcongestion, operating units with mutual interdependence would coordinatethrough lateral networks. By controlling communication to upper levels,managers are then freer to deal with strategic issues.
Network evolutionHistorically, discussion of supply chain management organization has reliedon organization within the firm, such as hierarchy. The classic Toyota keiretsu
The challenge of systems � 167

model followed this pattern by establishing dyadic relationships through achain of supplier associations extending toward initial sources of supply.Later, Sabel (2005) observed a different form of flexible specialization by indi-vidual firms in a closely coordinated, but informal, group passing productionand distribution of products in an organized sequence of stages. Later, a thirdway reflected the intensification of knowledge work, with small groupswithin an organization connecting as needed for collaboration to otherproblem-solving groups within an organization.
Sabel (2005) further extends this idea more directly to inter-firm relations inthe supply chain, with a form of federalism among independent but cooperatingfirms. Firms collaborate, with both internal and external partners and organiza-tional units, modifying the original goals and direction through internalizeddebate. There must be overall direction, but the direction of effort comes throughnegotiation at operating levels. Federalist networks differ from hierarchy in thatthe major flows of information and decision making are between and acrossorganizational units and organizational boundaries. Hierarchy in contrastoperates vertically, controls information and defines tasks.
Complex adaptive systems
Supply chains are systems, but there has been a profound change in how weunderstand the idea of systems. Cybernetic systems and system thinking arewell established in the management literature, and they involve managementin setting goals and developing tools to achieve them. They are basically rule-based with varying degrees of organizational learning to give feedback andguide the system toward its objectives. However, they are limited in scope tothe defined boundaries of the system and by the perspectives ofmanagement. Cybernetic systems operate at the level of basic processes thatare relatively undisturbed. Systems thinking comes into play through organi-zational learning when there is substantial change in processes. However,neither can deal with major environmental turbulence, even though they areeminently useful in dealing with routine processes and actions. Real dynamicsystems are too complex to manage in a traditional manner.
Complex adaptive systems (CAS) deal with potential disruption and adap-tation by the system to an environment that is necessarily turbulent. Newconnections to the environment may suddenly appear as emergent systems,influencing the behaviour of the established system. The unpredictableresults are often expressed in the expression ‘It just happens’ (Marion, 1999). Itis non-linear, meaning that cause cannot be directly identified with results;events are beyond the ability to predict. It can only be understood in terms ofa larger context.
The roots of CAS are based on chaos theory, dissipative theory and physicalsystems. Chaos theory is oriented to discover complex patterns from random
168 � Global logistics

data. Parker and Stacey (1994) say that ‘Clearly chaos is more than simply amathematical or scientific curiosity. A common feature of its application is thatit reveals the essentially unknowable future of creative systems.’
Chaos itself is a misnomer. It is an intricate mixture of order and disorder,regularity and irregularity, with patterns of behaviour that are recognized asbroadly repetitive. It can be a source both of disruption and of creation.Dissipative structures are derived from fluid mechanics, and deal withpositive feedback, meaning that they can evolve suddenly without warning –a process known as bifurcation.
CAS as a field of study evolved through discussion of physical systems –particularly in the biological sciences – describing how they evolve inresponse to environmental changes. More recently, discussion has taken onsocial systems and management (Dooley, Johnson and Bush, 1995; Dooley,1997, 2002; Brown and Eisenhardt, 1998; Marion, 1999; Choi, Dooley andRuntusanatham, 2001; Choi and Krause, 2006). The direct fit is tenuous, butthe message is clear: management control is limited in the face of a shiftingenvironment. Further, while the short term is knowable and can be controlled(to a point), the long term is unknowable in advance because of the parallelevolution of systems and their environments, which both influence eachother.
CAS characteristics relevant to this discussion include:
� Order within seemingly random data comes through self-organization.� Non-linear results, ie a lack of predictability.� Effects are not additive as in linear systems, but combine in ways that
cannot be predicted in advance.� Small events can trigger major changes.� When systems pass a critical point of disturbance, they may be pushed far
from equilibrium to create new structures.
Self-organization means that new systemic relationships can arise sponta-neously without management direction. They can be either creative, in thesense of innovation, or potentially destructive by disturbing the presentsystem. The introduction of new technologies, for example, can lead tochanges in organization, relationships and other forms of orientation. Thesebecome systems that are ultimately not under control but establish a newstability. Non-linearity means that the ability to control results is limited, andthat there can be more than one result from a single input – that seeminglysmall differences may provoke major changes in the state of the system.Finally, systems may appear to be stable but suddenly change to establish newsystem structures.
The result of self-organization is to create systems with effects that extendbeyond visible connections and proportional response to outside stimuli,becoming unpredictable and non-linear in their effect. Systems evolve in
The challenge of systems � 169

parallel with their environments, adapting and creating response, as incompetitive markets. Thompson (2004) notes: ‘Its [CAS] distinctive feature is aworld as a system in construction, a dynamic formulation encouraging thenotion of a continual process of spontaneous emergence.’ In effect, we cannotknow our future, except in the short term. A seemingly minor change in infor-mation technology – such as RFID or web-based data processing – may shiftthe entire orientation of the supply chain. A corresponding adaptation toeither internal operating changes or pressures external to the supply chainmay induce a further shift in the environment. The point to emphasize is thatCAS describes a parallel evolution changing both the supply chain and itsenvironment interactively, without direction or control.
CAS and the supply chainThe foundation of CAS in the supply chain lies in organizational complexity:‘the amount of differentiation within different elements constituting the orga-nization’ (Dooley, 2002). The theme of complexity characterizes both organi-zations and their environments. Supply chains have a high density ofconnections, containing information and signals to coordinate operations.Environments have complexity stemming from technologies, economicturbulence and other influences. Organizations are complex not only becauseof their own technologies, but also because individual decision makers withinthe supply chain acting on simple information create a system with complexbehaviour. CAS also adds the dimension of time to system discussion becauseit portrays a dynamic system able to respond to a new stimulus. It incorpo-rates negative feedback loops that seek to stabilize systems, and positivefeedback loops that tend to unstabilize them and drive them into disorder.
Organizations react and adapt to contingencies stemming from their envi-ronment. One rule of system behaviour, the Law of Requisite Variety (Ashby,1952), emphasizes that organizations must match the variety in their envi-ronment (originating from volatility in demand, customers, suppliers,competitors, the economy and institutional settings) with equal variety. Simplesupply chains would change only slowly over time, and operate by rule andformalized procedures. Complex supply chains deal with rapid change andhigh degrees of connection, and incorporate complex subsystems. It is neces-sarily complex because it deals with multiple environments.
Adaptation defines the requirements for organizational learning. Simplesystems under stable conditions do not require learning; complex systemsfacing complex environments do. Organizations undergo three stages oflearning (Argyris and Schön, 1978; Senge, 1990). First-order learning is basic-ally fine-tuning of an ongoing system, a limited adjustment to change.Second-order learning requires reordering, recognizing a need to change theassumptions for operation. Third-order learning is the most challenging,essentially learning how to learn. This complex scenario suggests a radically
170 � Global logistics

changing set of circumstances, in which identifying knowledge itself becomesuncertain. Small changes with only incremental improvements over standardpractice may be less successful than major changes because they force thesupply chain to re-examine its previously held positions as a form of second-order learning.
Management with CAS is a delicate balance between preserving opera-tional stability and responding to environmental forces. It requires extremesensitivity to the unknowable. It may include both competition and cooper-ation between nodes. There is no consistent pattern of change resulting fromCAS. It may be slow or rapid, linear (proportional to inputs) or non-linear(disproportionate), exhibit stable or abrupt change, consume few or manyresources, and produce no effects on the system or a need for radicaladjustment (Dooley, 1997).
The link between CAS and networksThe relationship between networks and CAS comes from two concepts thatwe have discussed – small world networks and weak ties. Small worldnetworks describe closely coordinated management groups that normallyhave limited access to outside information. Weak ties provide this access byreaching new sources outside normal group awareness. The organizationalarrangements to make this happen appear to be informal, reaching outsidethe established structure.
The inherent conflict within management is a struggle between order, asexemplified in the hierarchical structure of directing the supply chain as asequential series of tasks oriented to process flow, and disorder within aturbulent environment with its need to respond. Houchin and MacLean(2005) describe this problem: ‘Complexity theory makes it difficult to avoidconfronting the fundamentally paradoxical nature of management in whichmanagers must employ a rational loop within a shared mental process whenthey are close to certainty, and use other processes that generate instability ifthey are to bring about organizational transformation.’
Management has choices, whether to respond, or to protect the systemagainst change. Thompson (1967) suggests buffering to enhance efficiency, butbuffering also brings insularity. Galbraith (1977) divides response strategiesinto two camps: those reducing the need for information, and those increasingcapacity for information processing. Reducing the need for information takesthe form of either controlling the immediate task environment or bufferingwith slack resources such as inventory or processing capacity. The alternativerequires increasing investment in information systems and collaboration. Forsupply chains, more intensive use of information technology and emphasis oncollaboration point to increasing connections. It also suggests that there will bean increasing number of points for decision, with increasing complexity inorder to achieve collective movement for the system as a whole.
The challenge of systems � 171

Collaboration is becoming more important, developing customizedproducts in conjunction with suppliers. Much current product developmentappears to follow this path. Communication is intensified, making the systemmore complex, and ultimately less predictable. Sabel and Zeitlin (2004) arguefor a balance, utilizing relational contracting. Benchmarking, simultaneousdesign, concurrent engineering and collaboration broaden the scope of inno-vation, while still managing to divide development into task modules ofeffort.
Management structureChoi, Dooley and Runtusanatham (2001) have linked the application of CASto supply chain management. Supply chains that share processes amongmembers, that are able to adapt rapidly to change and that are more aware ofactivities across the supply chain will be more effective than those that do not.Control – however it is enforced – comes at a price: less freedom for membersto pursue innovation independently. A combination of control and adap-tation is preferable for survival to the use of either alone.
CAS fits into an evolutionary conceptual chain proceeding from internaloperations to dyads to external relationships to networks (Mills, Schmitz andFrizelle, 2004). In a dynamic perspective, managers can either seek to preservecurrent relationships or establish new configurations (Chandrashekar andSchary, 1999; Franke, 2002). The future appears to demand flexibility to meetrapid changes in markets, supply and technologies.
The concept of management in CAS is simple; the practice is difficult.Visualize an organization as an island of stability surrounded by chaos.Recognizing that stable organizations will stagnate and become vulnerable tocompetition and other changes, management must encourage and respond tochange. To move away from stability is to move toward chaos. The imperativein the metaphor of Brown and Eisenhardt (1998) is to ‘manage at the edge ofchaos’, balancing between stability and chaos, where the emergent systemfinds a new point of equilibrium. There are pressures for continuous changein supply chains, and this needs continuous experimentation to probe thefuture, to connect present practice to future options.
The current approaches to supply chain management organization havelimits. When management has to span boundaries – typically withbuyer–seller relationships – a number of arrangements have proved useful,including formal contracts, partnerships, supplier associations, jointownership, and shared employees. But none of these can see beyond theimmediate relationship to encompass the whole chain.
Information systems provide that ability. At the operating level, enterpriseresource planning (ERP) and customer relationship management (CRM) passthe flow of orders from customer to supplier through the system. However,even ERP has limitations of ties to single firms – although forecasting can
172 � Global logistics

extend a signal to other members. Product life cycle management offers morevisibility, extending product material requirements to suppliers. Nevertheless,even here, limited vision presents a problem that must be overcome.Information systems also require conformity – if not in procedure andsoftware, then in data coding and assumptions. At the moment, informationsystems limit flexibility in changing partners within the system, unless theindustry agrees in advance on protocols and data definitions.
Management must also deal with flexibility. At an operating level, strategiesfor agility – including product modularity, postponement, and inventorypositioning – provide some degree of manoeuvrability. Their success,however, depends on confining adjustment within prescribed boundaries.Major strategic changes depend on the flexibility of the information system.We have become used to thinking of supplier relationships in terms ofmarkets and hierarchies (Malone, Yates and Benjamin, 1987). White, Danieland Mohdzain (2005) say that changes in technology point toward a thirdway. In their view, information and communication standards permit modu-larization of processes, making it easier to switch connections and thus reor-ganize the supply structure to meet new requirements. This informationflexibility is further enhanced by web-based application service providers tomanage computational and information processing over the web.
In Table 10.1, I have endeavoured to capture the elements of this discussion.Six levels of management start with reviews of the broad environment and endwith narrow transactions. For each, there are five categories of system cognition:decision action, management emphasis, system direction, connection levels andopenness. Descending through the management hierarchy, openness to newenvironmental pressures declines as decision choice becomes narrower. The
The challenge of systems � 173
Table 10.1 The supply chain management organization
Management Decision Management System System Systemlevel action emphasis direction connection openness
Environment Adapt Recognition Complex Loosely Yesadaptive connectedsystems
Strategy Objectives Direction Vision, tasks Loose Yes
Partnering Selection Capabilities Definition Loose Yes
Coordination/ Inter- Partnerships, Relationships, Loose Yes,collaboration organization linkage communication within
limits
Planning Optimization Trade-offs Limited control Tight links Tight
Transaction Operations Process Data and Tight links Tightphysical links

management emphasis also becomes more constrained. The key to outsideinfluence is the number of connections that also become more limited, resultingultimately in limited access to external influences.
Management in a CAS becomes a balance between open response andbuffering to protect the system from outside disturbance (Choi, Dooley andRuntusanatham, 2001). Buffering establishes the boundaries, protects effi-ciency and protects against potentially disruptive influences. At the sametime, emergent properties, the creation of new configurations and processes,are not limited to the upper reaches of management. Open organizationsbecome strong sources for internal innovation. This raises a question of howmuch change to allow within a system. Further, if there is to be change, howdo we manage it – given the inherent characteristics of the supply chain, withoperations crossing organizational boundaries, at least quasi-independentorganizations, and a need for precise coordination?
Conclusion
In this discussion, we have linked supply management to networks andcomplex adaptive systems. We emphasize that process is only the beginning.The supply chain itself becomes an organization that plays a crucial role in thecorporation and in the economy at large. Yet we have little sense of howstrategic decisions are made for the supply chain as a whole.
At this point, discussion becomes conjecture. The obvious statement is thatwe need to examine supply chains as they undergo transitions, to see howemergent systems exert change within the chain. We become concerned notnecessarily with extension of theory, but with how supply chain managementcan direct a complex system as a form of meta-organization. The guidelines fororganizational discussion so far have come from study of individual organiza-tions. The contemporary reality of the supply chain lies in inter-organizationalrelationships. How it will evolve in the future will depend on its response to achanging environment.
References
Argyris, C and Schön, D (1978) Organizational Learning: A theory of actionperspective, Addison-Wesley, Reading, MA
Ashby, WR (1952) Design for a Brain, Wiley, New YorkBovet, D and Martha, J (2000) Value Nets, Wiley, New YorkBrandenburger, AM and Nalebuff, BJ (1996) Co-opetition, Harvard Business
School Press, Boston, MABrown, S and Eisenhardt, K (1998) Managing at the Edge of Chaos, Harvard
Business School Press, Boston, MA
174 � Global logistics

Buchanan, M (2003a) Nexus: Small world and the groundbreaking theory ofnetworks, WW Norton, New York
Buchanan, M (2003b) Small World: Uncovering nature’s hidden networks, Orion,London
Chandrashekar, A and Schary, P (1999) Toward the virtual supply chain,International Journal of Logistics Management, 10 (2), pp 27–39
Choi, F and Krause, DR (2006) The supply base and its complexity: implica-tions for transaction costs, risks, responsiveness and innovation, Journal ofOperations Management, in press
Choi, TY, Dooley, KJ and Runtusanatham, M (2001) Supply networks andcomplex adaptive systems: control versus emergence, Journal of OperationsManagement, 19, pp 351–66
Dooley K (1997) A complex adaptive systems model of organization change,Non-Linear Dynamics, Psychology and Life Sciences, 1 (1), pp 69–97
Dooley, K (2002) Organizational complexity, in International Encyclopedia ofBusiness and Management, ed M Warner, pp 5013–22, Thomson Learning,London
Dooley, K, Johnson, T and Bush, D (1995) TQM, chaos and complexity, HumanSystems Management, 14 (4), pp 1–16
Fine, C (1998) Clockspeed, Perseus Books, Reading, MAFranke, U (ed) (2002) Managing Virtual Web Organizations in the 21st Century,
Idea Group Publishing, Hershey, PAGalbraith, JR (1977) Organizational Design, Addison-Wesley, Reading, MAGereffi, G, Humphrey, J and Sturgeon, T (2005) The governance of global
value chains, International Review of Political Economy, 12 (1), February, pp78–104
Granovetter, AM (1982) The strength of weak ties, American Journal of Sociology,91, pp 485–510
Hedlund, G (1986) A hypermodern MNC, Human Resources Management, 25,Spring, pp 9–35
Houchin, K and MacLean, D (2005) Complexity theory and strategic change,British Journal of Management, 16, pp 149–66
Malone, TW, Yates, J and Benjamin, RI (1987) Electronic markets and elec-tronic hierarchies, Communications of the ACM, 30 (6), June, pp 484–97
Marion, R (1999) The Edge of Organization, Sage, Thousand Oaks, CAMills, J, Schmitz, J and Frizelle, G (2004) A strategic review of ‘supply
networks’, International Journal of Production and Operations Management, 24(10), pp 1012–36
Monge, PR and Contractor, NS (2001) Emergence of communicationnetworks, in The New Handbook of Organizational Communication, ed FMJablin and LI Putnam, Sage, Thousand Oaks, CA, pp 440–502
Parker, D and Stacey, R (1994) Chaos, Management and Economics, Institute forEconomic Affairs, London
Perrow, C (1984) Normal Accidents, Basic Books, New York
The challenge of systems � 175

Powell, WW (1990) Neither market nor hierarchy: network forms of organi-zation, in Research in Organizational Behavior, 12, ed LL Cummings andB Straw, pp 295–336, JAI, Greenwich, CT
Quinn, FJ (1999) Reengineering the supply chain: an interview with MichaelHammer, Supply Chain Management Review, Spring, pp 20–26
Sabel, CF (2005) Firm collaboration in the new economy, Enterprise and Society,5 (3), September
Sabel, CF and Zeitlin, J (2004) Neither modularity nor relational contracting:inter-firm collaboration in the new economy, Enterprise and Society, 5 (3), pp388–403
Senge, B (1990) The Fifth Dimension, Currency Doubleday, New YorkSheffi, Y (2005) The Resilient Enterprise: Overcoming vulnerability for competitive
advantage, MIT Press, Cambridge, MASurana, A et al (2005) Supply-chain networks: a complex adaptive systems
perspective, International Journal of Production Research, 43 (20), October, pp4235–65
Thompson, GF (2004) Is all the world a complex network?, Economy andSociety, 13 (3), August, pp 411–24
Thompson, JD (1967) Organizations in Action, McGraw-Hill, New YorkWhite, A, Daniel, EM and Mohdzain, M (2005) The role of emergent infor-
mation technologies, International Journal of Information Management, 25, pp396–410
176 � Global logistics

Information systems andinformation
technologies for supplychain management
Xinping Shi and Simon Chan, Hong Kong Baptist University
Introduction
Data, information and knowledge are critical assets to the performance oflogistics and supply chain management (SCM), because they provide thebasis upon which management can plan logistics operations, organizelogistics and supply chain (SC) processes, coordinate and communicate withbusiness partners, conduct functional logistics activities, and performmanagerial control of physical flow of goods, information exchange andsharing among SC partners.
Information systems (IS) are the effective and efficient means to managethose critical assets, and to provide sustainable competitive advantages. As faras SCM is concerned, information technology (IT) consists of telecommuni-cation, networking and data-processing technologies – and is narrowlyregarded here as the technological tools used to develop IS, capture or collectdata, perform data analysis for generating meaningful information, andexchange and share this information with SC partners. Therefore, IT is an
177
11
178 � Global logistics
important enabler for the achievement of SCM effectiveness and efficiency(Simchi-Levi, Kaminsky and Simchi-Levi, 2003; Bowersox, Closs and Cooper,2006). Effective IS/IT adoption is now thought to be an essential SCM resource.
In this chapter, we explore the functionality of IS/IT in SCM, as well as IS/ITcontributions to SCM, and then describe the IS/IT development for SCMwithin a framework of IS/IT evolution. Finally, we discuss the theories relatedto IS/IT adoption, and a strategic framework and strategies for IS/IT adoptionin SCM are provided.
Functionality of IS/IT in SCM
Efficiency-oriented IS/ITFrom an information management perspective, IS/IT is conventionallyutilized in the applications of efficiency-oriented SCM to increase produc-tivity and reduce operational costs. Specifically, IS/IT is used to:
� capture and collect data on each product and service at a specific logisticsactivity, such as purchasing, to provide accurate, reliable and real-time rawfacts;
� store collected data in a specific IS in predetermined categories andformats, such as a customer database management system;
� analyse stored data to generate meaningful information for managementdecision making in response to SCM events, and to evaluate SCM perfor-mance for cost reduction and productivity enhancement;
� collaborate and communicate with SC partners, to reduce informationtime lag and misunderstanding, and make the data resources availableand visible to all SC partners;
� standardize logistics operations and data retrieval procedure, and developgeneralized and rigorous information management policies, regulationsand control measures; and
� apply transaction cost theory to SCM to gain economies of scale andimplement low-cost strategies.
Effectiveness-oriented IS/ITNowadays, IS/IT is widely applied in the areas of effectiveness-oriented SCMto enhance SC competitive advantages, value-added SCM and globalizedoperations. In particular, IS/IT is deployed to:
� enhance core competence and positioning of a focal SC organizationthrough designing and controlling the information sharing and flows;
� re-engineer SC operations and eliminate duplicated facilities or activities –such as vendor-managed inventory (VMI) instead of physical warehouses;

� manage marketing, customer, product and service knowledge or expertisedeveloped (accumulated) in SCM, and share this with suppliers and partners– such as collaborative planning, forecasting and replenishment (CPFR);
� manage partner and customer relationships through resource-based andrelational views, to stabilize SC structure and enhance relations withadjacent upstream and downstream partners; and
� deploy SC resources and capabilities to compete with other SCs at worldwidelevel, and through international sourcing and offshore manufacturing.
There are two main driving forces for organizations to invest in IS/IT, developtechnological advantages in SCM and push the development of IS/IT applica-tions in SCM. These are business environmental change and technologicaladvancement. Business environmental change demands a growing capacityfor data and information management in SCM; thus it continuously pullsorganizational IS/IT investment. Technological evolution supplies the toolsand systems to facilitate and satisfy the demands of data and informationprocessing and transmission, and delivers innovative technology, such aswireless technology and radio frequency identification (RFID).
IS/IT development for SCMThe development and applications of IS/IT in SCM can be divided into fourmain levels: the first level is IS/IT in logistics functional areas – a transactionsupport system. Here typical IS/IT is bar-coding technology in a point-of-sale(POS) system, order process and inventory management, a warehousemanagement system (WMS), a transportation management system (TMS),etc. The second level is IS/IT for controlling information flows in integratedlogistics operations’ cross-functional areas in an organization – an intranetsystem, such as enterprise resources planning (ERP), a groupware system, anddistribution requirement planning (DRP). The third level is IS/IT used forinformation exchange and sharing between organizations – an extranet system.The system is a structured and standard communication system, and it is usedto exchange logistics information among SC partners in certain transactions,such as ordering and trading information. Two of the most widely adoptedextranet systems are electronic data interchange (EDI) and CPFR. The fourthlevel is an SCM system, or inter-organizational information system (IOS) – aninternet or network system for SC partners to exchange information and co-ordinate SC and logistics activities. Compared with an extranet system, aninternet system is much more flexible and powerful in information distri-bution and conducting logistics transactions. Typical applications are elec-tronic banking, electronic portals, electronic procurement, and customerrelationship management (CRM).
The differences between intranet, extranet and internet lie in who isallowed to access and use the IS/IT. An intranet is authorized only to internal
IS and IT for supply chain management � 179

members in an organization to use; an extranet system is specified to thoseusers who perform predefined logistics activities and transactions among twoor more organizations; and internet systems allow unlimited users to accessand use the system functions available and facilitate SCM informationsharing.
Level one: transaction support IS/ITAt this level, IS/IT is mainly used as an efficient tool for supporting logisticsoperations, and the main concerns are whether IS/IT can provide reliable,accurate and real-time operation data and information to support corelogistics activities. From an IS perspective, a database management system isthe core technique. From an IT perspective, bar-coding and scanner tech-nology is the core technology to capture real-time sales data and convert theminto information through the POS and then produce receipts for customers –and to track storekeeping units to provide accurate inventory status infor-mation and facilitate inventory replenishment. A WMS helps to maximize theturnover of warehouse space, utilization of equipment, and productivity oflabour, and to minimize the movement of goods, store time, and the lead timein responding to shipment and distribution scheduling.
Through data and information processing, a TMS provides transportationplanning, freight payment auditing, carrier selection and performance moni-toring. It also performs administrative tasks, reviewing transportation billsand management carrier relationships. Together, these transaction supportsystems support SCM to execute low-cost strategies and provide bettercustomer services. However, although they provide regional optimal solu-tions in processing logistics data and information, they are often not inte-grated with other IS in the organization, may not be aligned with overallorganizational objectives and may be inconsistent with SC partners’ IS/ITwhen information exchange is required.
Level two: integrated organizational IS/ITIntegrated organizational IS/IT gives intranet systems that facilitate data,information and communication within an organization, among widelydispersed logistics departments and locations. For example, an intranetsystem is used to share order processing, inventory and shipping status, andcustomer credit and accounting information within a firm. The characteristicsof intranet systems are that they standardize organization-wide data andinformation structure and format, integrate isolated transactional supportsystems and allow data and information sharing.
ERP is the most widely deployed intranet system. It integrates logisticstransaction modules with a common, standard and consistent database or datawarehouse – and provides multiple interfaces to logistics functional users. It
180 � Global logistics

digitalizes logistics operational procedures, regulations, organizationalpolicies and industrial standards into an integrated system, and also containssome advanced managerial support functions like data mining, decisionsupport and executive report functions. Essentially, ERP uses the local areanetwork and client-server technologies to implement an organization-wideinformation and communication framework, and to integrate functionallogistics IS such as WMS and POS.
Level three: information sharing and exchange IS/ITAn extranet system is designed to control and coordinate the flow of logisticsdata and information for sharing with SC partners. The system creates aneffective and formal communication channel between the SC focal organi-zation and its upstream suppliers and downstream customers, and the infor-mation flow is structured in standard business documents with standardformats. With a resource-based view, organizations in an SC become moreinterdependent when one organization accesses information owned by otherorganizations and when uncertainty affects the supply of resources. Whenthe business environment changes and shifts power downstream in the SC,those organizations with richer information of markets and customers gain anadvantage over other SC partners.
EDI is the most widely deployed extranet system for inter-firm informationexchange. La Londe and Cooper (1989) have addressed EDI as one of the mostimportant changes to affect SCM, and ‘it is the glue that binds long-term rela-tionship, and plays an important coordinating role in managing the interfacesbetween firms as business processes go beyond the boundaries of the firm’(Mentzer, 2001). The main benefits from using EDI are: upstream SC partnerscan access timely and accurate information from markets and customers, andincorporate this into planning and scheduling; downstream SC partners canprovide better customer services, responding to market changes andcustomer demands; all SC partners can reduce paperwork and enjoy qualitycommunication. Other derived benefits from deployment of EDI areincreased productivity, cost saving, accurate billing and improved tracing andexpenditure.
CPFR is also an extranet system developed for sharing logistics managementprocesses with suppliers, and it enhances VMI and continuous replenishmentby incorporating joint forecasting. SC partners exchange information aboutpast sales, promotions, forecasts and customer behaviour – and even less struc-tured opinions and suggestions. The system contributes to SC partners byfocusing on their core business values and allowing them to benefit from eachother. Like EDI, CPFR can also improve SC efficiency, increase sales and timelyresponsiveness to markets and customers, and reduce fixed asset investmentand inventory costs.
IS and IT for supply chain management � 181

Level four: internet-based SCM systemsThe internet is increasingly becoming the most useful business communicationand information exchange system. The system will eventually replace EDIbecause all information flows performed by EDI can be carried out through theinternet, with low access costs and consistent transfer standards. Further, it cansynchronize information from all SC participants – including worldwidecustomers. Perhaps the most outstanding feature of the internet is that it changesthe information exchange from one to one, to one to many, and many to many.Then traditional business partnerships can be changed into an SC organizationwith many alternative SC partners simultaneously, and the stability and trust ofconventional SC relationships become unstable, and the development of virtualrelationships challenges all existing theories and empirical findings.
Organizations increasingly use advanced IS/IT for manipulating infor-mation flows in SCM. However, current IS/IT may not reflect organizationalreal needs for timely information control, information quality and visibility,reduced information costs and excellent service. The roles of IS/IT in SCM havechanged dramatically in the past few decades – and will continue to changewith IT advancement in the future. This raises a series of strategic issues.
Strategic issues of IS/IT in SCM
SCM and IS/IT address information flow from different perspectives. SCMfocuses on developing tightly integrated SC linkages or relationships with anorganization’s suppliers and customers; IS/IT focuses on the technology fordeveloping a comprehensive system or sophisticated platform, oftenregardless of the context. Users, organizations and IS managers are over-whelmed with the media hype and are unsure about how – if at all – tomigrate from their existing real SCM processes to digitalized or virtual SCMoperations. We discuss this movement from the perspective of three stake-holders – SC users, the SC focal organization and IS/IT managers.
Users’ perspectiveUsers are the digitalized SCM operators, who are concerned about theprocesses, relationships with SC partners, and costs of using IS/IT for dailyoperations. Some strategic issues are:
� Does IS/IT fit organizational SCM strategies and core competence?� Is IS/IT adoption compatible with current philosophies and practices?� What business process and SC structure change will take place?� How will existing suppliers and relationships be affected by the new IS/IT?� What costs will be incurred during and after IS/IT adoption?
182 � Global logistics

Just-in-time manufacturing and efficient consumer response in retailing havebrought significant changes to SC practices. SCM attempts to achieve cycletime reduction and faster inventory turnover by establishing tight linkageswith suppliers – and to move from pure efficiency orientation to greater co-ordination and integration of business processes in functional areas includingproduct design and development, market research, production planning, etc.A high level of trust and extensive information sharing are required forsuccessful implementation of these initiatives. But a focus on individual trans-actions and price reduction by IS/IT may be inconsistent with the SC philoso-phies of trust and long-term relationships. So IS/IT may jeopardize anorganization’s existing relationships with its long-term suppliers. Since theadoption of new IS/IT takes significant effort and time, organizations shouldcheck that there is alignment with current SCM strategies. The worst scenariois that the introduction of IS/IT will be inconsistent and create confusionamong suppliers. Change management, both internal and external, is critical,as there are many instances of good IS/IT not producing the desired resultsowing to faulty implementation. For example, Nike had a major problem withproduction and distribution after introducing an advanced productionplanning system. They found later that their problem was not the software,but the quality of data input to the system.
Focal organization perspectiveSome strategic issues concerning the SC focal organization are:
� Shall we build our own IS/IT or jointly develop IS/IT with SC partners?� What strategic approach shall we take to develop IS/IT for all SC partners?� How does the developed IS/IT impact on our current SC operations?� What will happen to existing long-term and arm’s-length relationships
with key customers?� Will the IS/IT adoption consolidate our leading SC position and enhance
the competitiveness of our products?
A critical SCM decision is how to develop and introduce IS/IT, and stillmaintain trustworthy, long-term relationships with key SC partners. Whilelong-term relationships and contracts provide stability, they reduce the flexi-bility of exploring alternative markets and the possibility of faster growth orincreasing profits in some markets. The focal organization needs clear objec-tives and strategic planning, collaboration with other SC partners to share therisks and benefits, and a careful analysis of the impacts of new IS/IT.
IS/IT managers’ perspectiveSome strategic issues confronting IS/IT managers are:
IS and IT for supply chain management � 183

� How do we migrate from dyadic EDI platforms to the advanced SCMsystems?
� How do we integrate our ERP or other functional systems with SCM systems?� What internal and external IT infrastructure has to be developed with our
suppliers/users?� What are the system and data compatibility issues in interacting with non-
standardized systems?
Naturally, IS/IT managers pay more attention than others to technologicalissues in the development of new IS/IT, because there are usually internallegacy systems that work with EDI middleware to communicate with theirtrading partners. EDI provides a standardized data format for two computersto communicate automatically without any manual intervention. This brings ahigh level of transaction efficiency, but it is not very useful for communicationof unstructured information, evaluation, and negotiation processes. Migrationto new IS/IT may require interacting with different web applications and non-standardized data formats that may create problems with organizationalintranet systems. For example, getting demand forecast information frommultiple customers and incorporating it into intranet systems would requireindividually visiting customers’ websites, retrieving information, checkingtheir data formats and re-entering them in internal systems. This may be a stepbackward in technology for retailers unless interfaces are developed to retrievethe information automatically from the websites into intranet systems.
An integrated SCM system that links all the SC partners may be the ultimatesolution for IS/IT managers. While communication incompatibilities are rela-tively easy to overcome through XML and related technologies, data incom-patibilities are harder to handle. Unless there is a significant benefit in movingfrom existing EDI-based systems to an SCM system, IS/IT managers will bereluctant to make the migration.
IS/IT adoption for SCM
The strategic importance of IS/IT in SCM means that its introduction needscareful planning with SC partners to guarantee a successful implementation.In this section, we present the theories underpinning IS/IT adoption in anSCM context; then we discuss likely strategies for guiding an SC organizationto implement an SCM system.
Theories for IS/IT adoptionFour theories – resource-based view, relational view, transaction cost theoryand resource dependence theory – provide theoretical foundations for IS/ITadoption in SCM. Table 11.1 presents a review of the theoretical foundation of
184 � Global logistics

IS and IT for supply chain management � 185
Table 11.1 Theories for IS/IT adoption in an SCM context
Resource- Relational Transaction Resourcebased view view cost theory dependence
theory
Unit of analysis Individual Pair/network Hierarchical Dyadic parnters/firm firms; and market firms
electronic transactiondyads
IS/IT nature Functional or Value/SCM Monopolies, Pooledcorporate- system dyads, and information;wide systems multilateral resources of
SCM system SCM system
Core theoretical Scarce Partnerships; Cost of SC linkage;concepts tangible and relational transaction socio-political
intangible specific assets; for the choice influences;resources; knowledge, of an optimal political andcapabilities information governance behaviouraland activities exchange; structure; partner
complementary costs of relationships;scarce setting up, socialresources and operating and exchangecapabilities; maintainingrelationship SC relationshipsmechanisms
Managing SC Controlling SC strategy; Cost structure Resourcerelationships and exploiting joint creation and distribution; dependence;
organizational of unique transaction securing accessstrategic products, efficiency; to strategicresources services, cost resources;manifested in know-how and minimization; controllingassets and technologies; vertical necessarycapabilities joint learning; integration external
lower resources;transaction using politicalcosts and social
pressures
Normative Control Network Economic Holisticconsequence resource barriers to aspects and approach;
scarcity; imitation; time market knowledge andresource compression; transactions; skills in usingvalues; SC assets stock; static analysis; externalinimitable; partner scarcity; existence of mechanismsnon- resource optimalsubstitutable indivisibility structureasset stock

inter-organizational relationships (IOR) and SCM related to IS/IT adoption.Adoption is defined as the development of the ‘first’ successful IS/IT using anew information-process technology in an organizational process orproducts. In Table 11.1, five theoretical attributes are defined as follows: unit ofanalysis refers to the level of theory application to a specific social unit foranalytic interpretation; the core theoretical concepts specify the conceptualcontributions of a theory; managing SC relationships identifies the functionsand influences of the core concepts on the IOR (eg partner relationships inSCM); the normative consequence refers to the anticipated outcomes of thetheory when applied to IOR; and the role of IS/IT articulates the functionalitiesof adopted IS/IT in manifesting IOR and partnerships.
Resource-based view and transaction cost theoryAn organization is a bundle of assets (resources) and capabilities, and thefirm’s competitive advantage is derived from the possession of unique
186 � Global logistics
Table 11.1 continued
Resource- Relational Transaction Resourcebased view view cost theory dependence
theory
Role of IS/IT Resource Establishing Transaction Leveragingcontrol; and keeping costs control; organizationalmanipulating electronic improving informationinformation; partnership; data and resources;organizational leveraging SC information connecting withIS/IT and knowledge and utilization; external operations; information virtual standard;functional sharing, integration; responding to/system exchange and operations in putting pressuremanagement, creation; SCM functional areas, on competitorseg bar code, system with eg inventoryPOS, MRP, organizational managementERP, intranet systems, eg and quality
EDI, SCM, CRM, controle-businesssystems
Key references Wernerfelt Oliver (1990); Williamson Thompson(1984); Hamel (1991); (1975, 1985, 1991) (1967); BensonBarney (1991); Dyer (1997); (1975); PfefferEisenhardt Dyer and Singh and Salancikand (1998) (1978)Schoonhoven(1996)

strategic resources and capabilities. These resources are: value, rareness,imperfect imitability and lack of substitutability (Wernerfelt, 1984; Barney,1991). In this vein, IS/IT adoption is a strategic investment in the organiza-tional capability of utilizing information resources – and leverages the valueof information to increase the firm’s competitive advantages. Studies showthat IT is deployed to develop organizational IS, to manipulate organizationalinformation and operational effectiveness (Mata, Fuerst and Barney, 1995;Santhanam and Hartono, 2003).
Transaction cost theory mainly focuses on the market governance struc-tures of supplying relationships (Williamson, 1985, 1991). The core concept isthat, in a perfect market, a firm will optimize its supply of materials fromspecialized suppliers (or make its own). Firms engage in repeated andcontract-based transactions with suppliers.
In cases where the resources or products are highly supplier-specific, time-specific and complex in nature, this is an appropriate approach. The transactioncosts of managing the relationships and interactions with the suppliers –including searching, negotiating and monitoring execution of the transactions– are high. By reducing the transaction costs, IS/IT – especially SCM systems –allows a high level of coordination and increases the value of coordinatedresources through economies of scale, vertical integration or virtual hierarchies(Johnston and Lawrence, 1988; Clemons and Row, 1991; Holland, 1995).
Resource-based view and transaction cost theory provide sound founda-tions for an SCM system. According to these theories, it can be predicted thatadoption and diffusion of IS/IT can optimize a firm’s internal and arm’s-length market resources, and integrate vertical business operations with thefirm’s suppliers at lower transaction costs and higher efficiency. However,the theories focus on organizational resource utilization rather than IOR, andmore inter-firm coordination rather than SC partners’ cooperation andresource sharing. Thus, the vertical integration or virtual hierarchy is a focalfirm-specific, economic-oriented and contract-based relationship; and therelationship may suffer from long-term instability when economic andmarket mechanisms change (Premkumar and Ramamurthy, 1995; Dyer,1997).
Relational view and resource dependence theoryA relational view offers a theoretical understanding of the sources of inter-organizational competitive advantage from inter-organizational alliances –SC partnerships or IOR (Oliver, 1990; Dyer and Singh, 1998). Relational viewasserts that SC competitive advantage comes from: 1) the relation-specificassets of IOR; 2) substantial knowledge-exchange routines, joint learning andpartner-specific absorptive capabilities; 3) the synergistic effect of the endow-ments of complementary and distinctive resources and capabilities among SCpartners; and 4) the ability to employ an informal self-enforcement
IS and IT for supply chain management � 187

relationship governance mechanism (Dyer and Singh, 1998; Kanter, 1994;Zhara and George, 2002).
In line with social exchange theory authors (Emerson, 1962; Blau, 1964;Benson, 1975), Pfeffer and Salancik (1978) postulated a resource dependencetheory, where resource dependence is based on an organization’s ability 1) tocontrol resources needed by other firms, and 2) to reduce their dependenceon others for resources. That is, an organization must gain control overresources that are critical to its operations, and must reduce uncertainty in theacquisition of these resources.
Much research has been conducted into the perspective of resource depen-dence (Gaski and Nevin, 1985; Provan and Skinner, 1989; Oliver, 1990).Organizational power – a firm’s capacity to control, the actual act of control,and the impact of an organization’s perception of dependence on its partners –has been intensively studied to reveal its influence on IOR. In addition,analysis of four dimensions – goal compatibility, domain consensus, evaluationof accomplishment, and norms of exchange – has made significant contribu-tions to the understanding of the environmental influence of IOR. It is foundthat a favourable transaction climate gives more cooperation and better infor-mation flows and decision making (Williamson, 1975; Reve and Stern, 1986).
Compared with resource-based view and transaction cost theory, relationalview and resource dependence theory give much attention to externalresources and collaboration. Relational view focuses on a fair investment ofrelation-specific assets, and development and governance of routines forcollaboration, while resource dependence theory puts emphasis on asym-metric resource distributions in social and political settings, and how apowerful organization can employ the dependency of others to accomplishits objectives. Therefore, relational view is trust-based, and resource depen-dence theory is power-based.
Using the power, positions and role differences, a focal organization in SCmay exercise its coercive influence to control scarce and strategic resources,such as privileged information, knowledge and expertise, technology compe-tence, etc. The organization may force its dependent SC partners to adoptinnovative IS/IT, such as an SCM system, that serve mainly its own interests(Pfeffer and Salancik, 1978). Evidence of coercive behaviour has beensuggested when adopting EDI (Webster, 1995; Hart and Saunders, 1997). Wal-Mart is a typical example of resource dependence theory, in the way itmandates its top 100 suppliers to use RFID labels. Suppliers that cannot satisfythis mandatory requirement endanger their business transactions and rela-tions with Wal-Mart.
Strategic framework of IS/IT adoption in SCMBased on these theoretical foundations for IS/IT adoption, we have developeda strategic framework (Figure 11.1) to specify strategies for IS/IT adoption.
188 � Global logistics

Within the framework, the horizontal dimension – technology orientation –refers to organizational and inter-organizational technology capabilities, andability to develop products, services and operation processes that contributeto SC competitiveness. Facing an innovative IS/IT, the focal SC organizationhas two broad options: proactive and reactive. With a proactive approach anorganization holds positive attitudes toward IS/IT, is motivated by IS/ITadoption opportunities, devotes resources to understand and evaluate, and iswilling to initiate IS/IT adoption. On the other hand, with a reactive approachan organization shows less interest in new IS/IT, holds back from the system ortechnology, carefully investigates implications and impacts of a new systemor technology, does tentative trials of IS/IT, closely monitors trends of IS/ITamong SC partners and industries, and controls the timing of IS/IT adoption.
The vertical dimension – supply chain interdependence – refers to the IORin the SC context, and it reflects the relational view of mutual influence,exchange, interactions, knowledge and information sharing, coordination,cooperation, and integration (Oliver, 1990; Hart and Estrin, 1991; Dyer and
IS and IT for supply chain management � 189
Second move
Technology investment Knowledge barriers Sustainability of advance Potential power Value orientation
First move
Technology competency Resource-based Dominant position Exercising power Champion orientation
Follow-up
Technology fundamental Resource deficiency Sustainability of survival Collective power Profit orientation
Reactive ProactiveIn
dep
end
ent
Sup
ply
ch
ain
inte
rdep
end
ence
Technologyopportunism
Technology orientation Environmental awareness Industrial pressure Response capability Flexibility
Dep
end
ent
Technology orientation
Figure 11.1 Strategic framework of IS/IT adoption in SCM context

Singh, 1998). The interdependence has positions. One is independent,suggesting that an organization has a powerful position in an SC network andhas more decision-making discretion and a strong influence on other SCpartners, that the firm’s resources and operations are independent of its SCpartners and that SC partners are heavily dependent upon the organization.The other is dependent, suggesting that an organization in an SC network haslimited resources, influence, ability to change the SC structure and process,decision making, bargaining for privileged information, and favourabletreatment. And there are potential substitute firms in the marketplace,competing to join the SC network with the dominant firm and replacedependent organizations.
The framework shows that there are four strategies for focal organizationsto adopt:
1. First move strategy. This is an aggressive and self-motivated strategy drivenby intrinsic organizational demand for advancement, privilege andadvantages over SC partners. A firm using this strategy clearly recognizesthe benefits of IS/IT, and initiates changes for the firm and SC as a whole.Through adopting IS/IT, the firm can further consolidate its SC positionand enhance its influence. However, this strategy is expensive, and needshigh technology competence and resources; it also presents a higher riskand lower measurable return of investment than other strategies. Further,deployment of this strategy may require the firm to exercise its power toforce any unwilling SC partners to accept and use IS/IT accordingly.(Otherwise, IS/IT is only adopted in the focal organization, with substan-tially reduced benefits.)
Dos Santos and Peffers (1995) found that banks that took the first movestrategy with ATM machines were able to increase market share andincome – with the gains remaining over the long term. This empiricallyjustifies a first move strategy for those capable firms that can lead techno-logical change. Another attractive feature of this strategy for the SCdominant firm is that successful IS/IT adoption will build competitivebarriers and define the rules and norms of the game in its own SC.
2. Second move strategy. This is a conservative strategy, and is driven by thefocal organization’s management style and policies – and stakeholders’interests – rather than potential opportunities from the IS/IT adoption. Afirm deploying this strategy has organizational resources, technologycapability, SC position and influence – but it may regard IS/IT adoption asan investment, with evaluation focusing on the return on investment andrisk management. The firm may strive to be a competent technology user,but not a pioneer of IS/IT or SCM systems, because its core values andassets may not be derived from technological innovation. When facinginnovative IS/IT change, the firm may have knowledge barriers, and willhold back and take a ‘wait and see’ attitude.
190 � Global logistics

The advantages of this strategy lie in its value orientation – and itsrationale is in transaction cost theory. A firm does not invest resources inuncertain projects without obviously added value. Only when theinvestment environment is favourable, the IS/IT is approaching maturityand the value-add from investment in IS/IT is achievable and accountablewill the firm take a positive view towards IS/IT adoption. So it mainly usesIS/IT to enhance operational efficiency and cost-effectiveness – but cannotfully utilize the strategic benefits of IS/IT. The disadvantage of the strategyis obvious, as delayed adoption of IS/IT cannot give technology leadershipand it cannot establish competitiveness based on an SCM system.
3. Follow-up strategy. This is a passive strategy for those SC partners that donot have an initiative for active IS/IT adoption. It is adopted by organiza-tions that have limited resources, small-scale operations and littleinfluence on their SC partners. For firms taking this strategy, the theor-etical foundations are transaction cost theory and resource dependencetheory – and their business transactions are largely dependent upon thedominant organization in the SC network. These firms generally adoptsome nearly outdated IS/IT to support their business operations, toconnect with the dominant firm and to process essential business infor-mation – with EDI adoption in small businesses being a typical example.These firms may regard investment in new IS/IT as a waste, or at least aluxury, and they hardly achieve technology competency, using tech-nology to satisfy leading business partners’ requirements and businessprocedure.
4. Technology opportunism strategy. This is defined as a sense-and-respondcapability for proactive IS/IT adoption, responding to new opportunitiesin ways that do not violate the principle of fairness (Srinivasan, Lilien andRangaswamy, 2002). There are two components of technology oppor-tunism: technology sensing and technology response. Sensing is a firm’sability to scan internal and external innovations, acquire knowledge aboutand understand new technology and then provide innovative productsand services derived from, utilizing or deploying the technology.Response is an organizational willingness and ability to respond to newtechnologies, re-engineer business strategy and explore opportunities(Miles and Snow, 1978).
A firm using a technology opportunism strategy strongly believes thatnew IS/IT can create a substantial opportunity, so it proactively scanstechnological opportunities and seeks to capitalize on them. The firm isnot restricted to traditional principles and experience, but understands,analyses and utilizes new IS/IT technology for developing innovativeproducts and services. It is a strategy for ambitious and strongly self-motivated firms. The firm may be small or dependent on the dominantfirm in the SC context, but it wants to be powerful by using IS/IT. It mayactively cooperate with the dominant SC firm to adopt IS/IT and create
IS and IT for supply chain management � 191

unique value for the firm itself and its SC partners. Microsoft’s growthexperience in the 1980s is an excellent example of a firm taking a tech-nology opportunism strategy and successfully changing its position inthe operating systems and software industry.
This strategy is particularly useful for small firms, and requires flexibilityin managerial mindset and operations, and technological competence. Topmanagement direct the firm, while operational flexibility and efficiencyspeed up organizational change. Of course, this strategy needs a risk-takermentality, but the benefits of success are far great than failure costs.
Table 11.2 summaries the four strategies in 12 strategy evaluation scales thatmeasure an organization’s strategic readiness for IS/IT adoption. The scalescover organizational, inter-organizational and technological issues, andsuggest the theory deployment in strategy selection for IS/IT. The scales canalso be used as a checklist to help an organization make a strategy choice andevaluate whether it is ready to take a proactive strategy.
IS/IT utilization in SCM
The utilization of IS/IT in SCM can have an effect on performance, but how canan organization make sure that IS/IT is fully utilized? We suggest the followingconsiderations for fulfilling organizational and SC performance requirements:
1. It is reasonable to have a detailed understanding of customer and supplierrequirements, as well as all SC partners’ concerns. IS/IT adoption shouldbe flexible and adaptable, depending on specific needs and how the needsare satisfied. Performance criteria for IS/IT adoption and utilizationinclude regular reviews of the usage of SC partners.
2. IS/IT advancement has been moving away from logistics functional areastowards a process and SC orientation. Emphasis on the latter ensures amore meaningful measurement of relevant processes and ensures moretimely and accurate process feedback and coordination.
3. To grasp IS/IT adoption opportunities it is vital to integrate the knowledgeof logistics managers, IS/IT managers and knowledgeable SC partners.Logistics managers need to know more IS/IT – and information specialistsmust develop greater insight into SCM.
4. Financial resources are needed to ensure a smooth IS/IT implementation.Employees’ cooperation and use of systems are also critical.
5. Managerial experience and expertise in managing SC relationships and IS/ITadoption also play a critical role in the implementation of the SCM system –and if management keeps a proactive attitude, encourages organizationallearning and works together with SC partners, then SCM system adoptionamong all partners is close to success.
192 � Global logistics

IS and IT for supply chain management � 193
Table 11.2 Factors for strategic evaluation of IS/IT adoption
First move Second Follow-up Technologymove opportunism
Organization size Large Large Medium/small Small
Strategic Very high Unclear Not necessary Ultimateimportance ofIS/IT adoption
Leadership High Moderate Low Very highmotivation ofIS/IT adoption
Organization High Hold back No Highreadiness forIS/IT adoption
Pressure of SC Medium Medium Low Highcompetition forIS/IT adoption
Pressure of SC Low Low High Mediumpartners forIS/IT adoption
Perceived SC Strongest Strong Neutral Strongestneeds of IS/ITadoption
Relation of IS/IT High Medium Unclear Highadoption to SCcore business
Firm’s mandatory Strong Moderate None Occasionalpower overSC partners
Perceived Acceptable High Hardly Appreciatedtechnology acceptableradicalness of IS/IT
Propensity to Risk taking Avoiding Risk averting AggressiveIS/IT adoption risk takingrisks
Technological Sufficient Adequate Lack Specializing inslack for IS/IT RFIDinitiation

Summary
In this chapter, we show how IS/IT can make significant contributions to effi-cient and effective SCM. We discuss the development of IS/IT at four levels,reflecting the advancement of IT and the involvement of IS/IT in SCM. IS/ITdevelopment and adoption in SCM are complicated, and organizations haveto take many strategic factors into account. For those facing such a tough chal-lenge, we provide a literature review of IS/IT adoption, and reveal the theoriesunderpinning IS/IT adoption. We provide theoretical guidance – a frameworkof strategy adoption – and identity the conditions and resources for organiza-tions to initiate IS/IT adoption.
Effective SCM requires SC partners collaboratively to develop a plan forcoordinating the flows of goods and services, with timely information toensure these are delivered at the right time, to the right place and at the rightprice. IS/IT plays an important role in achieving SCM objectives. To utilizeIS/IT potential fully, organizations need an effective strategy that fits theorganizational resources and relationships with SC partners – and they needto work together with SC partners to share the risk and costs of IS/IT devel-opment and to enjoy the benefits derived from SCM systems.
References
Barney, J (1991) Firm resources and sustained competitive advantage, Journalof Management, 17 (1), pp 99–120
Benson, JK (1975) The interorganizational network as a political economy,Administrative Science Quarterly, 20 (2), pp 229–49
Blau, PM (1964) Exchange and Power in Social Life, Wiley, New YorkBowersox, D, Closs, DJ and Cooper, MB (2006) Supply Chain Logistics
Management, 2nd edn, McGraw-Hill International, New YorkClemons, E and Row, M (1991) Sustainable IT advantage: the role of structural
differences, MIS Quarterly, 15 (3), pp 275–92Dos Santos, BL and Peffers, K (1995) Rewards to investors in innovative infor-
mation technology applications: first movers and early followers in ATMs,Organization Sciences, 6 (3), pp 241–59
Dyer, JH (1997) Effective interfirm collaboration: how firms minimize trans-action costs and maximize transaction value, Strategic Management Journal,18 (7), pp 535–56
Dyer, JH and Singh, H (1998) The relational view: cooperative strategy andsources of interorganizational competitive advantage, Academy ofManagement Review, 23 (4), pp 660–79
Eisenhardt, K and Schoonhoven, CB (1996) Resource-based view of strategicalliance formation: strategic and social effects in entrepreneurial firms,Organization Science, 7 (2), pp 136–50
194 � Global logistics

Emerson, RM (1962) Power dependence relations, American SociologicalReview, 27 (1), pp 31–41
Gaski, JF and Nevin, JR (1985) The differential effects of exercised and unexer-cised power source in a marketing channel, Journal of Marketing, 22 (2), pp130–42
Hamel, G (1991) Competition for competence and inter-partner learningwithin international strategic alliance, Strategic Management Journal, 12,Winter Special Issue, pp 83–104
Hart, P and Estrin, D (1991) Interorganizational networks, computer inte-gration, and shifts in interdependence: the case of the semiconductorindustry, ACM Transactions on Information Systems, 9 (4), pp 370–417
Hart, P and Saunders, C (1997) Power and trust: critical factors in the adoptionand use of electronic data interchange, Organizational Science, 8 (1), pp 83–103
Holland, CP (1995) Cooperative supply chain management: the impact ofinterorganizational information systems, Journal of Strategic InformationSystems, 4 (2), pp 117–33
Johnston, R and Lawrence, PR (1988) Beyond vertical integration: rise of thevalue-adding partnership, Harvard Business Review, 66 (4), July–August, pp94–101
Kanter, RM (1994) Collaborative advantage: the art of alliance, HarvardBusiness Review, 72 (4), pp 96–108
La Londe, BJ and Cooper, MC (1989) Partnerships in Providing Customer Service,Council for Logistics Management, Oak Brook, IL
Mata, FJ, Fuerst, WL and Barney, JB (1995) Information technology andsustained competitive advantage: a resource-based analysis, MIS Quarterly,19 (4), pp 487–506
Mentzer, JT (2001) Supply Chain Management, Sage, Thousand Oaks, CAMiles, RE and Snow, CC (1978) Organizational Strategy, Structure and Process,
McGraw-Hill, New YorkOliver, C (1990) Determinants of interorganizational relationships: inte-
gration and future directions, Academy of Management Review, 15 (2), pp241–65
Pfeffer, J and Salancik, G (1978) External Control of Organizations: A resourcedependence perspective, Harper & Row, New York
Premkumar, GP and Ramamurthy, K (1995) The role of interorganizationaland organizational factors on the decision mode for adoption of interorgan-izational systems, Decision Sciences, 26 (3), pp 303–36
Provan, KG and Skinner, S (1989) Interorganizational dependence and controlas predictors of opportunism in dealer–supplier relations, Academy ofManagement Journal, 32 (1), pp 202–12
Reve, T and Stern, LW (1986) The relationship between interorganizationalform, transaction climate, and economic performance in vertical interfirmdyads, in Marketing Channels: Relationships and performance, ed L Pellgriniand S Raddy, Lexington Books, Lexington, MA
IS and IT for supply chain management � 195

Santhanam, R and Hartono, E (2003) Issues in linking information technologycapability to firm performance, MIS Quarterly, 27 (1), pp 125–53
Simchi-Levi, D, Kaminsky, P and Simchi-Levi, E (2003) Design and Managingthe Supply Chain: Concepts, strategies and case studies, 2nd edn, McGraw-Hill,New York
Srinivasan, R, Lilien, GL and Rangaswamy, A (2002) Technological oppor-tunism and radical technology adoption: an application to e-business,Journal of Marketing, 66 (3), pp 47–60
Thompson, JD (1967) Organizations in Action, McGraw-Hill, New YorkWebster, J (1995) Networks of collaboration or conflict? Electronic data inter-
change and power in the supply chain, Journal of Strategic InformationSystems, 4 (1), pp 31–42
Wernerfelt, B (1984) A resource based view of the firm, Strategic ManagementJournal, 5 (2), pp 171–80
Williamson, OE (1975) Markets and Hierarchies: Analysis and antitrust implica-tions: a study in the economics of internal organization, Free Press, New York
Williamson, OE (1985) The Economic Institutions of Capitalism, Free Press, NewYork
Williamson, OE (1991) Comparative economic organization: the analysis ofdiscrete structural alternatives, Administrative Science Quarterly, 36 (2), pp269–96
Zhara, S and George, G (2002) Absorptive capability: a review, reconceptual-ization and extension, Academy of Management Review, 27 (2), pp 185–203
196 � Global logistics

Outsourcing: the resultof global supply chains?
Stephen Rinsler, Bisham Consulting
Background
There can be no doubt that outsourcing has become big business. From earlybeginnings in the mid- to late 1970s, many companies have travelled theoutsourcing road, and as technology and accessibility to shared electronic datahave increased so has the range of services offered by outsourcing companies.
In the past few years the UK government has openly encouraged outsourcing,which the Private Finance Initiative (PFI) and other deals have spawned. Not allthe outsourcing arrangements in the private or the public sector have beensuccessful. There is a steady but small stream of processes being taken back in-house, and there have been some high-profile failures in the press.
We will explore why outsourcing takes place and how to avoid some of thepitfalls that undoubtedly can occur. We have tried to place outsourcing in thecontext of the more recent moves to source manufacture from overseas,particularly the Far East.
Definition
Outsourcing describes the deliberate movement of a series of connectedbusiness processes to a third party, which manages them on behalf of thecompany. The classic processes were IT, warehousing and distribution, facilities
197
12
198 � Global logistics
management, and payroll – and to these can now be added call centres, manu-facturing, web development, home shopping, credit cards, and even merchan-dising and design. In these movements the commercial risk and assets areusually passed to the outsourcing company.
However, not all companies refer to the process of business processmanagement transfer as outsourcing – for some they are just buying a serviceor a series of products. In this case the transfer of assets is unlikely.
The definition of outsourcing does not imply abdication of responsibility.
ExamplesSome retailers over the years became very vertically integrated. They wouldmanufacture their own goods, own and run their stores, own and run theirwarehousing and distribution to stores – and some even ran their own storeloyalty schemes, including the Co-op’s stamps. Now many retailers outsourceall their manufacturing, they do not own and run their stores, they haveoutsourced their warehousing and distribution, a bank runs their store cards,and some have outsourced their design, packaging design and merchan-dising by franchising their floor space to design or cosmetic houses and nichelabels.
For others, including manufacturing companies and distribution companies,the accounts function is outsourced.
Reasons for outsourcing
You may have heard these reasons:
� ‘We do not have the management expertise.’� ‘We need to jump the learning curve.’� ‘We want to move fast.’� ‘The area requires major re-engineering.’� ‘We do not have the management resources.’� ‘We pay too much to do it ourselves.’� ‘It is not core.’� ‘The business is going through major change and needs to make more
areas variable cost.’� ‘We need to focus our resources for training, investment, time, etc.’
However, some of the strategic reasons above are overshadowed by thepersonal objectives of the management involved. Some like to follow a trendand, therefore, encourage outsourcing; some, when joining a company wherethat department has been outsourced, start the process of reintegration toenlarge their role.

The reasons for outsourcing can be structured into five groups:
� financial;� technology;� resource management;� managerial;� personal.
Financial reasons for outsourcingCompanies have to declare in their statutory accounts – and to many stockexchanges – the value of assets leased and the methodology used by theirbusinesses to access their markets, but it is still the case that some companieshave limited access to investment funds and see the need to leave the raisingof cash to their outsourcing partners. Sometimes the outsourcing provider canborrow at a better rate than the company since the provider’s operation has alower risk through better focus; sometimes the additional borrowing costs areworth the flexibility.
Flexibility of use of resources is also an important factor. If the company’suse of resources can be pooled with that of others – creating better scale andbetter marginal costs – then using an outsourcer ensures some independenceof management of those resources, and releases the company from having tomanage the other users of the facilities.
Another facet of outsourcing in the past five years has been the pensionsfactor. Whilst many larger companies have seen their pension deficits soar, thecompanies to which they outsource often do not have final salary benefitschemes. Thus outsourcing crystallizes the deficit at the point of transfer, butit only does so for those people who transfer under TUPE arrangements(Transfer of Undertakings (Protection of Employment) Regulations). There isconstant churn and, while those people who did transfer can freeze theirpensions, new people do not create the same pension deficit, as they joindefined benefit schemes based on personal pensions. Thus the deficit willdecline with time and the actuaries can take that into account at the point ofthe company sale or merger.
TechnologyTechnology half-lives have fallen dramatically over the last 20 years, and thepredictions are that they will fall faster still. Competitive edge comes from therapid integration of new technologies into the company (if they are relevant).Consider the board looking at the choice of investing in the skills necessary tosell to its clients, or the skills needed to operate the latest technology in itsdelivery vans or the warehouse. If resources need to be rationed, better toconcentrate on the sales skills and the sales systems!
Outsourcing � 199

Many manufacturers maintain their own machinery completely. Currenttechnology comes often in black boxes that are replaced on failure and theskills of the supplier used to renew them. The UK utility companies haveagreed the outsourcing of maintenance, since engineering companies havebetter skills, the latest training and the latest diagnostics. The company acts asthe voice of the consumer in this instance.
Health and safety legislation and the tighter requirements of the insuranceindustry are leading to some companies outsourcing operations, sincespecialization of knowledge and service leads to lower risk and costs.
In addition, the role of IT and the necessity for robust, integrated systemshave moved business in two directions. First, they purchase integratedsystems and outsource the systems analysis and implementation to IT consul-tancies; second, they supplement their IT support staff with analysts andprogrammers often through a consultancy to which they delegate theresource provision to create the company’s own software.
Resource managementOne facet of the management of a company never changes: managers forecastresource requirements – and the forecasts are never right. Their allowance forrisk and resource investment is, therefore, either too high or too low.
By focusing on core resource business areas you can probably matchinvestment and requirements more closely than in other business areas. Thenin periphery areas either you have to apply the same focus as to the core areasto manage your resources, or you will not optimize those areas. Given thatmany of these areas are likely not to use your core skills, the likelihood of opti-mizing them and achieving good service levels and costs is lower thanoutsourcing to a specialist. Furthermore, the outsourcing company can act asan independent manager for your resources should you wish, to pool yourresources with others and spread the fixed costs.
Management skillsThe point has been made that businesses are better to concentrate theirmanagement and training skills in those areas in which they can make a realdifference – or they should find partners to help them.
Remember, you own the vision and strategy that are part of themanagement and entrepreneurial skills you need to run a successful business.Maximizing your selling and procurement skills, ensuring you have the rightproducts and services to sell to your clients, and ensuring pricing provides thecash return you need for investment and paying for services bought shouldbe the management skills you provide.
However if outsourcing is the answer, then there are important new skills todevelop, namely the skills of choosing your partners and managing them.
200 � Global logistics

PersonalIt is rare for managers to have totally altruistic motives when deciding to in-source (take back an outsourcing contract) or to outsource a series of businessprocesses. Unless there are clear strategic reasons for a change to be made,bringing back processes can often be to enlarge their role, just as pushing foroutsourcing can be to ensure a job move.
In the past, strange decisions have been made. For example, a major retailerstarted to backload goods that were delivered by manufacturers to reducecosts by raising the utilization of its fleet. But ex-works prices were required,which under EU laws had to be offered to its competitors. Then it was foundthat the primary movements from regional distribution centre to store werebeing delayed, as the fleet was not returning at regular times, as both the extrarunning and the pick-ups compounded to increase the round trip time vari-ability. The fleet was enlarged to cope with that. It is probably not knownwhether the final cost model was more or less expensive than the originalmodel. The question that was not asked was whether the fleet was required inthe first place.
Current relevanceGiven the pace of globalization, it is inevitable that outsourcing will takeplace. It is not usually sensible for manufacturers to set up their own manufac-turing plants in the Far East. Some have, particularly if the products can besold for internal consumption as well as for exports. But, in the main, retailersand manufacturers are taking only part of the output of a Far East plant and,therefore, the manufacture, the distribution to the port and the customsclearance tend to be outsourced. It is not always economic to have one’s ownmanagement in place in China or Taiwan or Indonesia, etc. There arespecialist skills in arranging consolidated shipments from a port, and the useof freight forwarders to ensure the shipping is booked and the goods arecustoms-cleared in the UK is normal.
These extended supply chains have risks like any other supply chain, butwe will discuss the amplification of the risks later.
How different is the public sector from the privatesector with regard to outsourcing?
There are some fundamental differences between the public and privatesectors – as public businesses are about cost containment rather than long-term profit sustainability. And public finances do not differentiate betweencapital expenditure and costs and, therefore, the driver is often to remove allexpenditure from the public borrowing figures. Investments to reduce costs
Outsourcing � 201

are far easier in the private sector where a return over time can be bench-marked against the internal rate of return for the company.
Now the pensions factor is the same for the public and private sectors, with theadditional facet that in the UK the civil service retire at 60, whilst most in theprivate sector retire later. If the new owning company does not have a final salaryscheme, then the pensions cost declines with time as the people who replace theoriginal transferees who leave or retire join the new pension arrangements.
It is probably the experience of government trying to build its own systemsthat has led to the level of IT and business process outsourcing that iscurrently being progressed. Government wishes to distance itself from theday-to-day management of projects and it is trying to move the risk ofoverrun expenditure to its contractors. Politically that is understandable, butas we will see later it is crucial that organizations outsourcing businessprocesses continue to keep a close eye on the efficiency of any interfaces andthe delivery of the strategy.
The other major difference is that of the stakeholder community. Theprivate sector includes customers, employees, shareholders, regulatorybodies and suppliers (and for many the local community and press shouldalso be included). The public sector has customers, employees, regulatorybodies and suppliers, but also Parliament, ministers, voters, the civil serviceand a much closer media scrutiny.
The pitfalls in outsourcing
Given that outsourcing arrangements are about two companies joining togetherto provide a service or a range of products, then the pitfalls become fairly easy tolist when viewed dispassionately by a third party. They are, in the main, causedby differences in strategy, objectives, culture and – at a basic level – how the twosets of management work together on a daily basis, trust and respect each other.
From the start, managers need to look at how well any tender document isdetailed, how well the tasks are described and how open the clientmanagement are about their ongoing strategy and their reasons foroutsourcing. Any hiding of real facts at this stage, and the contract is likely toend in considerable difficulties.
Similarly, any over-expectations raised by the outsourcing company –particularly in terms of timing, complexity and the level of cost savings theclient might enjoy – will also ensure the contract flounders quite early in its life.
Major initial questions that must be addressedThe board – and it must be at that level for major outsourcing arrangements –must review the following questions with care. They are designed to high-light the strategic changes needed to accept outsourcing:
202 � Global logistics

� What are the company’s current strengths, weaknesses, opportunities andthreats?
� Does outsourcing resolve some of the weaknesses and threats and openup opportunities to build ‘new’ – or consolidate current – strengths?
� What should the partner look like?� What will the company be depending on the partner for?� Who should drive the outsourcing project at board level? Who should be
the ‘project manager’?
With these questions answered honestly, the job of writing the tenders andevaluating the outsourcing companies’ responses will be much easier.
Once outsourcing has been agreed as part of the strategy, the major ques-tions to be answered by the client company to avert the outsourcing pitfallsare:
� What is our current strategy and what strategic changes are we lookingfor?
� What are the boundaries to our outsourcing?� How will we evaluate the tenders?� How will success and failure be judged in the contract itself?� How will we remunerate and reward the other company?� How will we link the organizations?� How can we reduce internal frictions and the feelings that the other
company is just another supplier?
Strategy and the changes neededOutsourcing is about dovetailing other companies’ expertise and focus intoyour company to improve competitiveness and customer service. You mustkeep control of the strategy: you cannot outsource that. However, youroutsourcing partner will also have a strategy, and the marrying of the twostrategies is an important part of the early meetings between the companiesand should form part of the selection process.
Partners with diverging strategies cannot work together for long – andoutsourcing can never be a two-minute wonder. The time period for anoutsourcing contract should reflect the life of the underlying assetssupporting the contract and the time and effort required to tender, renego-tiate and implement a new contract.
The outputs from the strategy that your stakeholders can see need to bedefined (for example, customer service levels, return on investment, etc).These should be discussed with your outsourcing partner only if its input toyour business processes has an effect on these outputs.
Outsourcing � 203

What are the boundaries to outsourcing?There needs to be a board process that challenges the added value that in-house processes contribute to the overall success of the company. This is partof the input into the company SWOT analysis. The in-house picture thenneeds to be compared with that provided by outsourcing some of the businessprocesses. The changes to the SWOT analysis need to be tracked. Of impor-tance are the threats or risks that change between the two pictures – and thesemust be analysed carefully. Risks in global supply chains are discussed a littlelater.
How will success and failure be judged?Many outsourcing arrangements start without clarity to this question – thekey performance indicators (KPIs) have not been agreed, the measurementmethodology is not clear and reporting arrangements have not been agreed.This does not allow the two partners to have the same vision of the operation,and the lack of clarity will inhibit either side learning how to improve theservice, etc. In many ways, if the first question on strategy has not beenanswered, then it is likely that this one will remain cloudy.
The indicators of success and failure – and the rewards and redress required– need to be fully laid out in the contract before the operation starts. The KPIscan include customer service measured in customer terms, budget perfor-mance, savings, damages, stock losses, accident rates, productivity measures,etc. So when looking at the remuneration of the partner, bonuses for beatingcustomer service targets and a sharing of the budget savings are good ways ofincentivizing the partnership. Sharing the losses and penalties for poorcustomer service are other powerful ways of ensuring the correct behaviours.
Tender processThe tender process deserves a chapter in its own right – but what is importantstrategically for successful outsourcing is that there is sufficient detail in thetender about the current operations, a clear statement of the key performancerequirements, and a strategic vision that is shared with the prospectivepartners. Without the detail, without a clear pro forma of the responserequired, it will be difficult to evaluate the various replies. Honesty willprovide better answers and build better relationships – both of which areneeded if the operation is to be successful over time.
Company linkage and reducing internal frictionThe outsourcing of a number of business processes implies that the processesoutsourced need to communicate, and to link with the rest of the company’s
204 � Global logistics
business processes. Thus not only are there data linkages that need to beforged, but the management and administration of the two companies needto be joined as well.
A lot of time and care must be taken to ensure a high degree of efficiencyabout the interfaces. Slow, inefficient interfaces will cost money, increasefriction between the two groups and, in the end, result in poorer customerservice and lost sales.
Thus, a good strategic board will ensure that teams are built across theinterface. The outsourcing company must not be treated at complete arm’slength, with face-to-face meetings not accepted as part of the contract’s life. Themanagers working the interfaces must be compatible; they must work togetherand respect each other. Attempts must be made to ease any cultural differences.
This does not mean that both sides should not challenge each other. Whenthere is no challenge, there is no creativity and an operation will slowlyfossilize – but challenge must be constructive. Any internal assassins to theprocess of outsourcing must be dealt with.
SummaryMost of the pitfalls experienced by companies outsourcing are down tomanagement issues – and down to not being open about strategy or othermarket or business factors that are germane to the evaluation of the activitiesthe outsourcer will perform.
Additional problems can be caused by a failure to gain the buy-in of thecompany management during the tender process.
Outsourcing can only work with the active cooperation of both sides.
Global supply chains and the outsourcing risks
Global supply chains, somehow, have brought the promise of better margins,and both retailers and manufacturers have rushed to move the source ofmanufacture and some services to Eastern Europe, India and the Pacific Rim,including China.
Whilst manufacturing costs have undoubtedly fallen, not all commoditycosts have fallen as well – and shipping costs, for example, have risen as thelaws of supply and demand have remained true.
It should be noted that the new extended supply chain hides a number ofpotential risks that, if not properly accounted for, could have a severe effect onprofits. Boards need to have identified and evaluated the costs of these risks inorder to judge the real business case for overseas sourcing. The fact that somecompanies are now considering sourcing from countries that are geographi-cally closer to the UK means that the balance may be shifting away from veryextended supply chains.
Outsourcing � 205

What are these important risks? They fall into the following four groups:
� supply chain risks;� management risks;� financial risks;� political risks.
Supply chain risksThese arise through the new geography that is a backdrop to the outsourcingarrangements. The factory is no longer in the UK or nearby in Europe. Manyof the problems are the same as in the original supply chain, but the risk of notresolving the issues increases with distance and the language and culturedivide. Good examples are problems with quality, specifying exactly what youwant after the first proofing runs, and tying the supplier into your business.
You now have lower costs because you have agreed a single long-runproduction slot with your supplier – but the slot is usually not very flexible.Thus changes to quantity and timing are much harder to arrange. Under-order stock and ask for a smaller, more expensive additional run to be slottedinto the production schedule, and you may have to have products sent by air-freight for them to be on the shop floor in time for the sales period. Realizingthis additional cost, you may feel forced deliberately to over-order stock at thestart. Many retailers now have higher stocks than they used to have – and thisrequires larger warehouses and results in lower warehouse productivity.Then the sales forecasts are not met, and clearing unnecessary stock throughthe sales channel generally requires heavy discounting – which means areduction in profits.
Then there is the quality of goods on arrival. As they have been packaged,often badly, in the container, you now have an extensive new operation ofrepairing, improving, finishing and sometimes pricing, which has to be donein the UK to make the merchandise look shop-ready. Who pays for the stockas it sits in customs awaiting clearance?
Your extended supply chain is forcing you to make decisions on fabrics,design and colours earlier and earlier in the process. Because the productrange needs to be specified so far in advance, there is the real risk of getting itwrong.
Many of the above are judgemental risks that supply chain or merchan-dising managers have to take – but there are also the physical, environmentalrisks in the supply chain. Hurricanes, earthquakes and typhoons all play apart in the equatorial climate and geography; they are risks that must bequantified, and sourcing strategies and contingencies should take the resultsinto account.
206 � Global logistics

Management risksThe longer the supply chain, the greater the number of nodes, the greatermanagement time that is required to achieve a smooth result. This resourcewill be more than the company currently has, and even if functions areoutsourced there will be the need to coordinate the outsourcing partnerships.
The greatest concern in this area for most retailers is quality. It can bedifficult to oversee the accreditation and auditing of suppliers and manageproofing runs over a long distance. Once product is agreed, productionschedules have to be monitored – and this requires time, personnel andparticular skill sets.
Outsourcing requires regular contact between the various parties to make itwork. The question to bear in mind is: has the cost of the additional merchan-dising and quality management been taken into account?
Outsourcing is not about abdication: you still need to control the strategy,and you need to spend time integrating the outsourced service. The morecentral the activity is to the heart of the company, the more time that isrequired to really ensure the outsourced operation is integrated. How theorganizations are linked is one of the keys to the success of outsourcing.
The other management risks are that you did not define what the strategicchanges that you are looking for are, and you may not have shared them withthe prospective partner. You may not have decided how success and failurewill be judged and therefore have not decided whether any form of gainshare is appropriate to the contract.
Another risk that needs to be dealt with is the risk of poor internal commu-nication about the potential to outsource and once the contract is imple-mented communicating the successes.
Financial risksYour suppliers like hard currency, quite often US dollars, and thus a signifi-cant proportion of your costs will be exposed to the fluctuations of thatcurrency. If the dollar strengthens and your margins decrease as you areconnected to UK price competition, you are forced to try to reduce thepurchase price, which may result in reduced product quality and greaterfinishing costs.
It is possible to hedge the dollars by buying in advance, of course, but thereis a cost to these transactions. You might buy stock in pounds sterling, but ifthere is currency movement against the supplier it must in the long runrecover lost margin or refuse to do business with you, resulting in time andexpenditure accrediting a new supplier.
Shipping costs increase markedly as routes become more popular, resultingin a reduction of your margins. If the price of oil increases, so will your shippingsurcharges. Were these potential costs taken into account in the budget?
Outsourcing � 207

Your extended supply chain requires you to offset the supply risk byreceiving the stock earlier and because the stock is produced in one run,shipping costs can be minimized by shipping the whole quantity together. Butthis will result in extra warehousing and financing costs. What must also betaken into account is the cost of the additional write-down of unsold stock.Financial information systems will be required that allow all the various coststo be posted against each product in the range so the real margin can bereviewed.
Political risksThese are very hard to assess but we have had some examples recently,including EU trade quotas, instability in some countries, and suppliers havingvery different working conditions to those in European plants. These riskscan directly affect your ability to trade, and can become consumer relationsissues that affect your brand.
Risk analysisThe risk analysis required is a detailed review of each step in the extendedsupply chain, starting with ranging and supplier selection and following thecourse of the product and information flows through the supply chain. At eachstage the possible failures (the risks) to the process need to be understood andassessed. The classic quadrant (see Figure 12.1) needs to be populated. Oncedone, contingency plans need to be detailed and agreed. These could includesourcing alternative suppliers and additional stocks, starting the next seasonearly, putting in place better systems and management controls, etc.
208 � Global logistics
High value: Low impact High value: High impact
Low value: Low impact High value: Low impact
Figure 12.1 Risk analysis

Risk analysis should also cover the contingency requirement, should it bedecided or necessary, to take the outsourcing back in-house or move themanagement of the processes to a new company.
Summary
The benefits from overseas, global sourcing need careful analysis both beforestarting the transfer and at regular intervals thereafter. The analysis requiresthe whole cost of acquisition of each product to be determined to allowcomparison with cost in other countries, including the UK. What is mostimportant is that the analysis must be conducted dispassionately and that theinterests of consumers and the shareholders remain the most importantconsideration.
‘Getting it wrong’ is not hard; losing control of the strategy is all too easy.Outsourcing requires continual effort to harness the outsourcer – but suchmanagement resource is at a very different level from running the wholeoperation internally. A company that harnesses the skills and resources of anoutsourcing company – and provides products and services at a lower costand higher added value than its competitors as a result of letting experts runsome of its operations – will be more profitable than its competitors and quitepossibly more flexible.
Outsourcing � 209

210
Risk in the supply chain
Lars Stemmler, BLG Consult GmbH
Introduction
Risk management is an established tool in the financial environment of thebusiness world. The same holds true for logistics and the concept of supplychain management. The increased level of integration and cooperation alongsupply chains leads to new risk categories. Risk management might help inthe understanding of the key risk drivers of supply chains and enable thepartners to optimize their internal risk management system – at least devel-oping an understanding of supply chain risks.
This chapter suggests an expansion of risk management into the scope ofthe supply chain. The objective is to provide arguments to actively pursue riskmanagement as a planning tool. The chapter is written from the perspectiveof a non-financial firm such as a logistics service provider. This will highlightalso the practical perspective of risk management.
Risk management and the supply chain – a newperception!
The identification, assessment and control of risks are inherent to managingcommercial undertakings. Risk management was developed in the financialservices industry before it spread to other sectors. However, in manycompanies risk management is just considered a legal obligation followingthe introduction of the Sarbanes–Oxley Act in the United States. The statutoryrequirement to establish a formal risk management system also took hold in
13

Europe. For example, the German commercial code stipulates the devel-opment of a reconnaissance system in order to identify risks that threaten theexistence of the company at an early stage.
The perspective of such a system is principally financial. Concerned share-holders and an equally anxious public domain drove the introduction of riskmanagement. Owing to the perceived character of risk management as astatutory obligation for companies, it is in many cases associated with additionalnon-value-adding costs to the enterprise. The task of managing risks constitutedjust another source of costs – an opportunity for planning was clearly missed.
However, a number of companies have realized the potential of riskmanagement to improve planning processes and help to mitigate potentialand actual sources of risk. It is not just banks that actively pursue riskmanagement. Companies of other sectors are increasingly becoming aware ofthe potential added value of an integrated risk management. The fate ofEricsson is just one example:
The effect on Ericsson, a Swedish mobile-phone company, of a fire in a New Mexicochip-making plant belonging to the Dutch firm Philips, has become a legend. The fire,in March 2000, started by a bolt of lightning, lasted less than 10 minutes but it causedhavoc to the super-clean environment that chip-making requires. Ericsson, unable tofind an alternative source of supply, went on to report a loss of over USD 2 billion inits mobile-phone division that year, a loss that left it as an also-ran in an industrywhere it had once been a leader.
(Economist, 2005)
The Ericsson example highlights a necessary shift in perception regarding riskmanagement. This shift is driven by logistics; the case comfortably sets out theframework for this new perception of risk management:
� The logistics function provides a clear competitive advantage to acompany regardless of which strategy it pursues. With either of Porter’s(1980) strategies of cost leadership or differentiation, logistics helps to fulfilthe company’s objectives and to deliver added value to the customer. Theexample of Ericsson of a disrupted supply chain is clearly the tip of theiceberg, and quality problems of Robert Bosch AG, a major supplier to aGerman car manufacturer, in 2004 are just another example.
� Supply chain management aims at integrating partners along the supplychain, reducing interfaces and smoothing the flow of material, infor-mation and finance. However, the higher the level of integration, thehigher the probability of dependency on single partners. In addition,global sourcing adds a further dimension of uncertainty in terms of longtransport legs, unstable political environments and different levels ofcommitment to quality and reliability.
� A closely knit international supply chain results in complex processes ofcoordinating and administering the partners along the chain. Different
Risk in the supply chain � 211

levels of accountability of staff and partners have to be taken into account.The focus of risk management necessarily shifts from an enterprise-only toa supply chain perspective.
These developments clearly have an impact on the scope and functionality ofa company-focused risk management system. However, the concept of riskmanagement can be actively employed along a supply chain. It enables allpartners contributing to a supply chain to limit adverse risks to the chain. Forthis objective to be achieved, risk management along the supply chain has toaddress the following issues:
• all three flows – material, information and finance – along a supply chainand its associated processes;
• the boundaries of the system, which have to be pushed beyond the organi-zation to cover the full length of the chain;
• the challenge to cover not only the strategic but also the operational level,turning the risk management system from a statutory reporting functioninto a planning function.
Figure 13.1 illustrates the scope of risk management in a supply chainmanagement context.
212 � Global logistics
Partner 3Partner 2
Risk management
Supply chain
Risk:
– Financial perspective– Corporate focus– Sarbanes–Oxley Act
– Chance of danger, loss or injury– Measurable uncertainty
Supply chain management– Integration of partners along the supply chain– Cooperation and coordination– Dependencies and risk of interruptions
Information
Material
Partner 1
Figure 13.1 Risk management in the supply chain – a new perception

Objective and process of risk management
What do we associate with the term ‘risk’? Risk denotes the chance of danger,loss or injury. In a commercial environment the chance of a good bargainmust also be summarized under the term. Risk is to be differentiated from theterm ‘uncertainty’. Whereas risk assumes that the probabilities of the possibleresults of an event are known, this is not the case with uncertainty. Hence, riskis measurable uncertainty.
Risk management includes activities to identify, analyse and assess, andcommunicate, as well as control, risks (Müller, 2003). In an ideal case, riskmanagement is directly assigned to the top management, providingcontinuous support to ensure the company’s ability to survive in the market-place (Burger and Buchhart, 2002). Risk management is governed by theinternal risk policy, making the enterprise in extreme cases either a risk takeror a risk avoider.
The risk management process describes systematically the framework andmethods from initially identifying the risks to finally controlling them(Holzbaur, 2001). The first activity is to identify and describe all actual andfuture sources of risk – at this stage of the argumentation – to the company(see Figure 13.2). In a second step the risks are assessed. When determiningthe exposure of a company, risks are characterized through the quantificationof the probability of the occurrence and the extent of the potential damage orgain. The risk exposure can be illustrated by means of a risk map or risk port-folio, leading to a segmentation of risks into commonly three categories.Category A risks represent risks that have a potentially disastrous impact onthe company, in terms of both high probability of occurrence and high
Risk in the supply chain � 213
Riskidentification
Riskassessment
Documentation Riskcontrolling
Risk policy
• Operations• Finance• Markets•Legal
• Risk map • Acceptance• Compensation• Transfer• Reduction• Avoidance
Figure 13.2 The process of risk management

damage potential (with only adverse risks normally included in the analysis).On the basis of this analysis, appropriate measures can be taken in order tocontrol risks. Measures are taken in accordance with the stipulations of therisk management policy. A feedback loop is obligatory to ensure the effec-tiveness of the measures.
In theory, the risk management process looks consistent and straight-forward. However, practical experience shows that not only does the quantifi-cation pose considerable problems to line managers but also the identificationof risks in the first place poses an almost insurmountable challenge for linemanagers. The quantification, estimating both probabilities of occurrence andthe monetary level of impact, is limited through the lack of data of past exper-iences of similar events in other companies. Further, the identification of risksis often subject to managers’ reluctance of not being prepared to admit theexistence of risks in their fields of responsibility: admitting to the presence ofrisks is considered a sign of weakness. But the effort should be made to comeup with a meaningful risk portfolio.
From an enterprise perspective to the supply chainperspective
Having outlined the risk management process, let us now focus on how toincorporate the requirements of a sophisticated supply chain managementinto risk management, and answer the question of what benefits areproduced for whom.
Ensuring supply chain integritySupply chain management can be described as a holistic managementapproach to integrating and coordinating the material, information andfinancial flows along a supply chain (Handfield and Nichols, 1999). Further,this includes the management of the interfaces between the partners involvedin this chain, particularly from an information management and technologypoint of view (Schary and Skjøtt-Larsen, 2001).
A supply chain is basically a sequence of processes – however, theprocesses are owned and managed by different legal entities. This requiresinter-organizational cooperation. Conflicting interests due to the legal andeconomic independence of the supply chain partners need to be aligned to asingle supply chain objective. If successful, the competitive advantage ofthese partners increases considerably.
There are a number of implications of supply chain management on riskmanagement. As already said, risk management is an important tool inensuring the economic integrity of an organization. This holds particularlytrue if the boundaries of the organization are clearly set, for example by means
214 � Global logistics

of arm’s-length transactions. In a supply chain management environmentthese boundaries become blurred, which does not mean that they no longerexist legally, but operations-wise it becomes very difficult to identify the separ-ating line between the two companies. Just consider employees of a logisticsprovider doing packaging work on the premises of the shipper. The implica-tions on the risk management system are obvious – the scope of traditional riskmanagement is to be extended to integrate a supply chain. At the same time,having to ensure process quality, risk management evolves into logistics.
Parallel to an expansion of the scope of managing a supply chain, riskmanagement has to grow in responsibility as well (see Figure 13.3). The higherthe degree of integration along a supply chain is, the larger the required scopeof risk management becomes. And the concept of supply chain riskmanagement is raised.
Martin Christopher (2002) suggests defining supply chain risk managementas ‘the integration and management of risks within the supply chain and risksexternal to it through a co-ordinated approach amongst supply chainmembers to reduce supply chain vulnerability as a whole’. The vulnerabilityof the chain stems from external and internal risks to it. The objectives ofsupply chain risk management are clearly laid out by Kajüter (2003). He seesrisk management in the supply chain as ‘a collaborative and structuredapproach to risk management, embedded in the planning and controlprocesses of the supply chain, to handle risks that might adversely affect theachievement of the supply chain goals’.
Risk in the supply chain � 215
High
High
Low
Low
Degree supply chaincooperation
Risk managementdegree of cooperation
Enabler for supply chain riskmanagement:
– Close cooperation between partners– Continuous process– Risks to be communicated openly– Risk controlling
Supply chainrisk
management
Supply chainrisk
analysis
Traditional riskmanagement
�
Source: Kajüter, 2003
Figure 13.3 Supply chain integration to be supported by risk management

Practitioners can agree to these definitions and clarifications, and they willclearly see the need for an inter-organizational management of risks. As withorganizational or company-specific risk management, identifying therelevant risks is the first task to master in the process of supply chain riskmanagement. It is here that the first challenges are encountered. Thefollowing section focuses on developing a framework for risk identificationand assessment along a supply chain.
Risk assessment and control along the supply chain
The process of supply chain risk management is similar in all respects to theprocess of company-specific risk management. A preparatory step is to definea risk management policy. Along a supply chain, companies with differentindustry backgrounds, sizes and ownership structures have to work togetherto achieve a common goal. Their differing interests have to be merged in aconsistent risk management policy.
Having clarified how much risk the partners are prepared to take, the iden-tification of supply chain risks is the next step. Figure 13.4 illustrates the twodifferent types of risks inherent to a supply chain: exogenous andendogenous risks. The former result from the interaction of the supply chainwith its environment, whereas the latter stem from the interaction of thesupply chain partners (Chapman et al, 2002).
The endogenous risks can be divided into the categories of organizationalrisks (those of individual partners) and specific risks from integrating, coordi-nating and cooperating along the supply chain. Company-specific risks are
216 � Global logistics
Risk categories in a supply chain
Endogenoussupply chain risks
Operational risks
Cycle times
Capacities
Volumes/stocks
Information flow
Planning/forecasting
Liability
Country risks
Legal risks
Force majeure
Markets
Quality
Cooperation risks
Exogenoussupply chain risks
Figure 13.4 Risk categories’ identification into supply chain-specific risks

adequately described in traditional risk management maps. Specific supplychain risks can now be identified, for example risks from the sharing of infor-mation on integrated platforms (integration), risks of a high level of inter-dependence amongst the partners (cooperation) and risks stemming frominterwoven processes (coordination).
The prime objective of supply chain risk management is to identify thoserisks posing a major threat to the supply chain. A measurement tool is neededhere to help transfer (existing) company-specific risk maps into a supply chainrisk map and to integrate the supply chain-specific plus the endogenous risks.How this can be done is illustrated in Figure 13.5. The company-specific riskportfolios form the basis for an ABC classification of these risks, ideally afteran inter-organizational risk-controlling process. The ABC classification leads atwo-dimensional matrix showing the probability of the risk-relevant eventand the net impact (after company-specific risk management) of this event(level of damage in monetary terms). The product of the two gives theexpected value of the risk.
Following this step, managers have to decide which of these risks havewhat implication on the supply chain. Each risk in the ABC classification isassigned a high-, medium- or low-impact category, leading to the supplychain risk map. Into this map the supply chain-specific risks as well as theendogenous risks are integrated. The latter two categories are evaluated usingan expected value. Regarding the impact on the partners along the supplychain an aggregated figure for possible damages has to be found.
Risk in the supply chain � 217
�
�
Corporate risk portfolio controlscompany-specific risksSupply chain risk portfolio assessesimpact of net company risks (aftercontrolling on corporate level) onsupply chain
Impact on supply chain
Resulting importance
Impact on corporate level
Probability ofoccurrence
High
Middle
Low
C risks
High Middle LowC risks
Exemplified risk
B risks
A risks
B risks A risks
1
1
1
1
Figure 13.5 Supply chain risk assessment

As with traditional risk management, the phase of risk controllingconcludes the overall process of risk management. Accepting the risk oravoiding it are the poles between which risk controlling takes place. Avoidingthe risk might mean doing no business at all (see Figure 13.6). Accepting therisk means in the last instance simply living with it. In between there is anarray of measures to control risks. These measures can be summarized underthe categories of risk compensation, risk transfer and risk reduction.
The ability to reduce business risks is to be preferred over other measures.On a supply chain level, risk reduction includes a particular focus on inter-faces. Risk transfer – although comparatively easy to achieve in traditionalrisk management, for example by means of buying insurance – is by definitiona difficult approach for a supply chain, as we are obliged to look not at indi-vidual companies but at the whole chain. Risk compensation along a supplychain – on a company level achieved through provisions or hedging – mani-fests itself in rules governing cooperation between the partners. One partneris obviously not prepared to compensate another one monetarily. However,compensation can be initiated through behaviour. Partners might agree ondefined actions to be taken on a mutual basis.
Risk compensation in terms of mutual rules is to be delimited from risktransfer measures, for example outsourcing or vendor-managed inventory(VMI). The latter measures feature a far more institutionalized contractualbasis. Whereas in rules-based risk compensation schemes each partner takes
218 � Global logistics
Source: Inderfurth, 2002
Figure 13.6 Risk controlling between avoidance and acceptance
Supply chain risk management (examples)
‘Traditional’ risk management
Acceptance
Acceptance
Provisions
Reserves
Hedging
VMI Standardization
Verticalintegration
ECR
Supplierselection
Process/product
development
Postponement
Interfaces
Outsourcing
Process/product
development
Disposalrules
Contractualstipulations
Personnelselection
Close ofbusiness
Avoidance ofhigh-risk projects
Dismantling ofparts of thebusiness
Safety/securityobligations
Monitoring
Insurance
Rules forcooperation
Acceptance Compensation Transfer Reduction Avoidance

risks (close to risk acceptance), transferring risks amongst the partners meansselecting those partners that are willing to take a risk from another. In a supplychain perspective this only contributes to an indirect reduction of risks, as therisk is transferred to the partner that can manage it better than the other.
What becomes apparent when discussing risk controlling is that riskmanagement does not mean simply reacting to emergencies along the supplychain but pursuing an active approach anticipating supply chain risks.Having looked into the toolbox of risk controlling it becomes further apparentthat deciding on suitable measures is a complex task in terms of decisionmaking and implementation amongst the partners – even assuming thatthere is a consistent risk policy in place.
The latter issue is worth exploring in some more detail, bearing in mind thatwe would like to pursue a practitioner’s view in this chapter. The followingsection sheds some light on obstacles to profound supply chain riskmanagement.
Implementation in practice
Obstacles to implementationThe necessity and the theoretical framework of supply chain riskmanagement sound convincing. Parallel to the development of supply chainmanagement, which introduces a high degree of integration, cooperation andcoordination amongst supply chain partners, the company-specific riskmanagement systems have to keep up, and need to expand from the tradi-tional financial perspective into logistics – as well as focusing on supply chainrisks. No doubt, there are specific supply chain risks to be addressed.However, implementing risk management that focuses on the supply chainmight end in a ‘prisoner ’s dilemma’. Let us look at the most commonlyobserved obstacles to implementing risk management on a company level:
� Risk identification. Risks are collated in a risk map and subsequentlyreported to top management. Hence, at middle management level or inoperating units of an organization, managers tend to hide risks by simplydenying their existence.
� Risk identification is not done through neutral eyes. External help is expensive,so that risk identification is carried out internally, resulting in a differentperception of certain risks. For example, if carried out by accounting staff,operational risks are either not understood or are considered more severecompared to financial risks (zur Horst and Leisten, 2002).
� Required quantification lacks understanding. A basic requirement of sound riskmanagement is to quantify the potential loss or damage and to estimate theprobability of occurrence. If a process fails, the company loses sales in the
Risk in the supply chain � 219
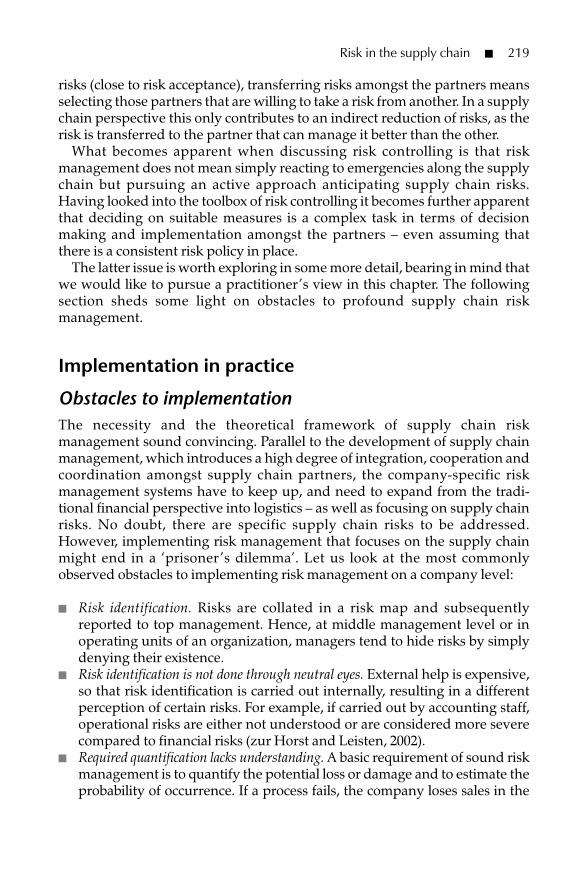
amount of the damaged lot size. What if a customer deems this company asno longer reliable and holds back future orders? Regarding the probabil-ities, estimating the failure rate seems simple, but what about political risks?
Assuredly, any risk management system should be implemented under theauspices of the company’s auditors. However, obstacles multiply with asupply chain perspective:
� Admitting the risks. Drawing a supply chain risk map implies that any riskwith a potential impact on the complete chain needs to be disclosed by its‘owner’. You run into a problem here if there is a dominant player alongthe chain, for example a manufacturer in the automobile industry. Asupplier or logistics provider cannot simply admit that there is a risk. Onthe contrary, there is a strong tendency towards risk transfer from themanufacturer to the partner up and down the chain (Kendall, 1998).
� Putting effort into risk management. How much effort are companiesprepared to put into a concept that potentially is a risk in itself, ie the risk ofbeing blacklisted as a result of disclosing risks?
� Relying on the risk map. Bearing in mind the hidden risks as discussed here,can each partner rely on the input of other partners, or does riskcontrolling become mere ‘risk engineering’?
An option for avoiding these issues is to use a ‘bottom-up’ approach, ratherthan the traditional ‘top-down’.
Bottom-up instead of top-downRisk management must provide tangible benefits to managers, particularly onan operational level. Coming back to our initial example of Ericsson, simplyinsisting on an answer to the question of what ensures business contingencyis too broad an approach. Unfortunately, risk management – in the traditionalsense – is a ‘top-down’ management tool imposed by regulation and law.Trying the opposite way and going ‘bottom-up’ might be part of a solution.
Admittedly it is far more cumbersome, as a bottom-up approach starts witha process model of the supply chain. This is where the supply chain opera-tions reference (SCOR) model might be useful. Alternatively, manycompanies already have quality managers in place and process charts tohand, which include detailed descriptions that are amended by the stochasticinformation (see Figure 13.7). Simulating the processes under different, risk-oriented parameters and putting the know-how of security managers into thesimulation results in a robust picture of a risk map. The focus is first of all oper-ational: how well do our processes and those of the supply chain work?
More strategic issues come in when looking at the materials flows and thestock levels at the links and nodes of the supply chain. These links and nodes
220 � Global logistics

can also be modelled as processes and subsequently simulated, bearing inmind different performance and cost levels. By aggregating those processes, acompany – and then a supply chain – risk map emerges.
Conclusions
The concept of supply chain management brings additional risks to thesupply chain, which – in accordance with the objective of SCM of increasingthe level of integration and coordination amongst the supply chain partners –should be addressed jointly. Those risks include the endogenous risks of asupply chain, such as operational and cooperation risks. A supply chain riskportfolio is suggested to initiate the risk management process along thesupply chain, leading to a toolbox of risk-controlling measures on a strategicand operational level.
This is the opportunity for risk management to expand from the financialand corporate perspectives respectively into the field of logistics and inter-organizational cooperation. However, easy as it sounds, problems that have tobe addressed include:
� the challenge of turning risk management from a mere statutory obligationinto a planning tool;
� the identification of hidden risks and overcoming dominant players in thesupply chain;
� the quantification of probabilities and damage levels;
Risk in the supply chain � 221
Using value/cash flow at risk models from the financial sectorSimulation of a value corridor of a variable whose thresholds are not crossed with a givenprobability
�
�
Input variable 1 Input variable 2 Input variable 3
Value
Time
Value
Time
Value
TimeSymmetricconfidence
level
Resulting distributionof variable with x%confidence level
Process-related dependencies
Exposure – mapping
Source: Wiedemann and Hager, 2003
Figure 13.7 Random walks with ‘at-risk’ models

� the pursuance of a bottom-up approach for supply chain risk managementto avoid the overload of top management as in the case of a top-downapproach.
An elegant, but complex, task might be to simulate (parts of) the supply chainby means of stochastic modelling in order to support the risk mapping and toevaluate the influence of variations in different risk parameters.
Despite the efforts needed, supply chain partners should develop a soundunderstanding of how well the processes along their chain work and what thekey risk drivers in the structure are.
References
Burger, A and Buchhart, H (2002) Risiko-Controlling [Risk controlling],Oldenbourg, Munich
Chapman, P et al (2002) Identifying and managing supply chain vulnerability,Journal of the Institute of Logistics and Transport, 4 (4), May, pp 59–64
Christopher, M (2002) Supply chain vulnerability, Executive Report, CranfieldUniversity, Cranfield
Economist (2005) 29 October, p. 71Handfield, RB and Nichols, EL (1999) Introduction to Supply Chain Management,
Pearson, Upper Saddle River, NJHolzbaur, U-D (2001) Management, Kiehl, LudwigshafenInderfurth, K (2002) Risikomanagement in der Supply Chain [Risk management
in the supply chain], in Wissenschaftssymposium Logistik der BVL, edBundesvereinigung Logistik, Tagungsband, Munich
Kajüter, P (2003) Risk management in supply chains, in Strategy and Organizationin Supply Chains, ed SA Seuring et al, Springer-Verlag, Heidelberg
Kendall, R (1998) Risk Management for Executives, FT Prentice Hall, LondonMüller, S (2003) Management-Rechnungswesen: Ausgestaltung des externen und
internen Rechnungswesens unter Konvergenzgesichtspunkten [Managementaccounting: developing a convergent management accounting system],Gabler, Wiesbaden
Porter, ME (1980) Competitive Strategy, Free Press, New YorkSchary, PB and Skjøtt-Larsen, T (2001) Managing the Global Supply Chain, 2nd
edn, Copenhagen Business School Press, CopenhagenWiedemann, A and Hager, P (2003) Messung finanzieller risiken mit cash-
flow-at-risk/earnings-at-risk-verfahren, ccfb, Eitorfzur Horst, A-D and Leisten, R (2002) Supply Chain Controlling: Vertrauen ist
gut – Controlling ist noch besser! [Supply chain controlling], in ForumForschung 2002/2003, GMU Duisburg, Duisburg
222 � Global logistics

Supply chainvulnerability,
risk and resilience
Helen Peck, Cranfield University
Introduction
Few areas of management interest have risen to prominence in recent years asrapidly as supply chain vulnerability. In only a handful of years the subjecthas been transformed from a truth that dare not speak its name to one of themost fashionable disciplines of the decade. This chapter looks first at thefactors and events behind the rise of the field. Next it tackles the thorny issuesof supply chain definitions and dissonance within supply chain management,before moving on to see how they pan out when competing concepts of riskand risk management come into play. How, when and why the differentconcepts from risk management fit with some elements of the supply chainsbut not others are explained, positioning each within a multi-levelframework, based on a simple exploded model of a supply chain. It provides aholistic overview of supply chain vulnerability, and explains why supplychain resilience is perhaps a more appropriate concept in this context. Inconclusion the chapter draws on earlier writings in open systems theory toexplain why supply chains should be viewed as open societal systems as wellas engineered processes.
223
14

224 � Global logistics
Supply chain vulnerability: an idea whose time hadcome
At the dawn of the new century, industry and policy makers waited to seewhether efforts to contain the Y2K ‘millennium bug’ had been successful.Happily for most organizations, the year 2000 arrived without a hitch. Y2Kmade everyone aware of how IT-dependent our societies had become, but itslegacy was to leave managers sceptical about the need to spend scarce timeand resources warding off supply chain disruptions that might never occur. Ingovernment the event was viewed differently. Business continuity planning(BCP) had successfully averted an economic meltdown.
The UK fared less well the following September when a small number ofprotestors managed to blockade oil refineries, causing chaos at the petrolpumps and serious economic disruption. The outbreak of foot-and-mouthdisease in the national livestock herd only months later sent governmentsearching for ways to improve the national resilience to all manner ofdisruptive challenges. Few realize that it was these events – together with BSE(mad cow disease) in the 1990s – and not terrorism that prompted a majorreview of UK emergency planning doctrine and sowed the seeds of the CivilContingencies Act (2004). It was because these events were so different fromthe ‘sudden onset’ emergencies – bombing accidents or natural disasters – thatnational emergency planners had hitherto focused upon that such a revisionwas deemed necessary. For a start, these were not site-specific as a bombingmight be. They had many sites or none at all. Moreover these crises tended tobuild slowly at first (often almost unnoticed at a national level) and thenescalate quickly, causing enormous economic damage and social disquiet. Ineach instance it was industry and government, not the emergency services,that found themselves in the unfamiliar role of first responders. Thesecreeping crises were remarkable in one other respect – they representedsystemic supply chain disruptions, hinting that there might be a dark side to theever increasing efficiency of contemporary supply chains. Nevertheless, thewhole notion of supply chain vulnerability remained deeply unfashionableuntil 11 September 2001.
The international terrorist attacks on New York and Washington markedthe beginning of a change in attitude towards the whole notion of supplychain vulnerability. In general terms the attacks put a supercharger behindthe business continuity industry, and all aspects of security management. It isnow widely recognized that the terrorist attacks did not themselves cause anysignificant disruption to global supply chains or even North Americanindustry. But the reaction of the US authorities did. The closure of US bordersand grounding of transatlantic flights caused massive disruptions followingan outpouring of press articles (mainly in the United States) highlighting theterrorist threat and the frailty of international supply chains.

Post-9/11, new security measures were hurriedly introduced at US borders,ports and airports, affecting inbound cargos to the United States. The newmeasures – including the Container Security Initiative (CSI) andCustoms–Trade Partnership (C–TPAT) – employed principles and approachesborrowed from the application of total quality management in manufacturingsupply chains. They demanded much more rigorous and earlier electronicpresentation of manifests, as well as documentation and validation of securitypolicies and procedures from the companies involved. Compliant companiescould then, it was suggested, become approved ‘known shippers’, therebyensuring speedier customs clearance. Inevitably, the measures slowed down‘abnormal’ shipments or those coming in from non-approved shippers.Moreover the programme required all inbound shipments to the UnitedStates to be vetted at designated approved overseas ports, thereby displacingmuch of the cost of compliance and subsequent congestion to the ports andairports of departure. Around the world, national or supranational customsauthorities adopted similar mindsets and soon tabled rafts of similarmeasures.
Meanwhile, back in the ‘business as usual’ world of corporate profitability,the Enron Corporation, once held up as a model of best-practice corporate riskmanagement, wobbled and collapsed, taking international auditors ArthurAndersen with it. Another North American giant, WorldCom, quicklyfollowed. In Europe, Dutch retailer Royal Ahold and Italian dairy conglom-erate Parmalat Finanziara did the same.
Financial markets, like supply chains, rely on confidence. In a bid to protectshareholders – and ultimately the well-being of the financial markets – regu-lators hurried to bring in their own more rigorous reporting requirements. Theinternational banking community had faced the same stark realities only a fewyears earlier, when the unchecked activities of ‘rogue trader’ Nick Leeson ledto the collapse of London-based Barings Bank, threatening irreparable damageto Singapore’s reputation as a financial centre. These scandals highlighted theneed for more diligent corporate governance in general and the appetite formeasures to monitor, manage and control operational risk (ie internal threatsto organizational well-being) in particular. The Basel Accords in InternationalBanking (1998, 2004) and the introduction in the United States of theSarbanes–Oxley Act (2002) formalized the requirements.
Sarbanes–Oxley (SOX), mentioned in the previous chapter, has been aparticularly potent force in raising the profile of all aspects of corporate riskmanagement. It focused the minds more directly than ever before by makingjail sentences a realistic possibility for negligent chief executives. It did so byremoving the opportunity to claim ignorance of wrongdoing as a defence.SOX demanded disclosure of all potential risks to corporate well-being,including those that might once have been considered beyond the legalboundaries of the firm. Section 401 demands that organizations declare all‘material off-balance sheet transactions’ including ‘contingent obligations’
Supply chain vulnerability � 225
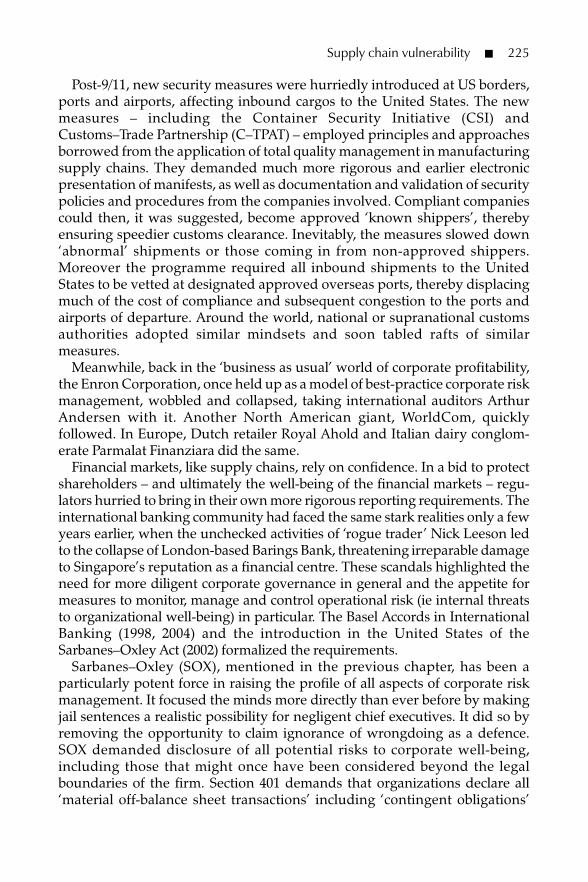
and ‘interests transferred to an unconsolidated entity’. These clausesencompass some inter-organizational risk sharing and risk transfer activities.For example, fixed-volume shipping service contracts are guarantee contracts;VMI and outsourcing agreements – sometimes used to hedge risk and placeretained assets off-balance sheet – must also be declared. SOX also requiresthat providers of outsourced services (including logistics service suppliers)must be able to demonstrate the existence of appropriate internal processcontrols. Finally, it demands that consideration be given to other possibleexternally induced disruptions. Externally induced disruptions includedisruptions to transport and communications. SOX was rolled out insuccessive waves, beginning with US quoted companies, but later extendingto their US-based suppliers, and then to those in other countries in 2003.
All of the factors described so far have raised the profile of supply chain-related risk and vulnerabilities, and attitudes have changed dramatically in justa handful of years. Being concerned with matters of supply chain vulnerabilityhas become the epitome of good corporate governance and the socially respon-sible thing to do. Clearly, supply chain managers should be part of those discus-sions, but it is also important to recognize that managers from many disciplinesnow need to have a clear understanding of what supply chains are and howthey fit in with their own responsibilities and risk management concerns.
Supply chain risk management: a recipe for confusion
The term ‘supply chain’ lingers on despite the near-universal recognition thatsupply chains are not simply linear processes. They are in fact complexsystems of interlocking networks. Beyond that there is no commonly agreeddefinition of ‘supply chain’. Several different definitions are given within thisbook, and for the purpose of this chapter two are included here. Bothemerged in the late 1990s. Aitken (1998) proposed: ‘a network of connectedand interdependent organizations, mutually and co-operatively workingtogether to control, manage and improve the flow of material and infor-mation from suppliers to end users’. Shortly afterwards, Christopher (1998)adopted a value-based variation on the theme, defining a supply chain as ‘thenetwork of organisations that are linked through upstream and downstreamrelationships in the different processes and activities that produce value in theform of products and services in the hands of the ultimate customer’.
Thus supply chains comprise flows of materials, goods and information(including money), which pass within and between organizations, linked by arange of tangible and intangible facilitators, including relationships,processes, activities, and integrated information systems. They are also linkedby physical distribution networks, and the national/international communi-cations and transport infrastructures. In their totality, supply chains link orga-nizations, industries and economies.
226 � Global logistics

Notwithstanding the different interpretations of what constitutes a supplychain, understanding supply chain vulnerability is complicated by two otherdistinct problems. The first is confusion over the scope of supply chainmanagement. The second (which deserves a volume in its own right) is thenature of ‘risk’.
The confusion surrounding the scope of supply chain management is welldocumented, not least its ambivalent relationship with logistics (Larson andHalldorsson, 2004). The term ‘supply chain management’ (SCM) firstappeared in the early 1980s when Oliver and Webber (1992) used it to describean amalgamation and relabelling of established functions – notably ‘logistics’(integrated transport, warehousing and distribution) and manufacturing-based ‘operations management’ (elements of purchasing, order andinventory management, production planning and control as well as customerservice). Though the title was new, many of the fundamental assumptions,such as the sharing of information – to allow the substitution of informationfor inventory – and systems integration across organizational boundaries, hadbeen around for decades (Forrester 1958, 1969; La Londe, 1984).
The SCM agenda has unquestionably broadened in recent times to includeaspects of marketing, new product development, order management andpayment (Cooper et al, 1997). According to Stock and Lambert (2001) it hadbecome ‘the integration of key business processes, from end user throughoriginal suppliers that provides products, services and information that addvalue for customers’. Christopher (1998) adopts a more relational value-adding perspective, when he describes SCM as ‘the management of upstreamand downstream relationships with suppliers and customers to deliversuperior customer value at less cost to the supply chain as a whole’. However,closer examination shows that these and other writers are actually conceptu-alizing SCM in several different ways, eg as a management philosophy, theimplementation of a management philosophy, or a set of managementprocesses (Mentzner et al, 2001). In short, SCM is used to describe at least twoquite different concepts. One is the functional scope of SCM, encompassingthe tactical management of those elements of logistics and the many othersupply chain processes, across functions and between businesses. The other isa philosophy demanding strategic-level recognition of the need for coordi-nation and collaboration throughout the supply chain, which must be presentacross three or more adjacent firms.
For the practitioner, academic arguments about the nature of supply chainsor scope of supply chain management are probably viewed as just that –academic. In the real world, functional legacies and assumptions remain andresurface regularly in writings on the subject. In much of that literature, ‘risk’is simply the commercial consequence of failure to implement functional bestpractice, be it in purchasing, materials management or manufacturing processcontrols. However, if supply chain management is indeed the interdiscip-linary, inter-organizational, globe-spanning concern it purports to be, then
Supply chain vulnerability � 227

these characteristics should be recognized and reflected in both our under-standing of supply chain vulnerability and our approaches to riskmanagement.
Given that supply chains comprise many different elements, and supplychain management embraces many different functions, it is perhaps usefulfirst to ask the question ‘What is it that is vulnerable, ie at risk?’ Is it the perfor-mance of a process or specific activities, or the well-being of an organization, atrading relationship or the wider networks as a whole? Or is it the vulner-ability of one or more of these to some external malevolent force that shouldbe the focus of our consideration? In fact, supply chain vulnerability takes inall of these. What seems to muddy the water is when concepts of risk and riskmanagement come into the equation.
Risk: the great divide
The starting point for many discussions of risk is in classical decision theory(Borge, 2001). Here risk is a measure of the possible upside and downside of asingle rational and quantifiable (financial) decision. In a seminal paper onmanagerial perceptions of risk and risk taking, March and Shapira (1987)define risk – from a decision theory perspective – as ‘variation in the distri-bution of possible outcomes, their likelihoods and their subjective values’.However, they go on to observe that this interpretation has been under attackfor many years, particularly by those studying financial markets. The problemis that research has shown that it does not reflect how managers see risk, nordoes it reflect their behaviours or the social norms that influence them(MacCrimmon and Wehrung, 1986; Shapira, 1986). Studies show thatmanagers adopt and apply only selected elements of the total risk equation.They pay little attention to uncertainty surrounding positive outcomes,viewing risk in terms of dangers or hazards with potentially negativeoutcomes. Moreover, it is the scale of the likely losses associated with plausibleoutcomes, rather than the range of possible outcomes, that focusesmanagerial minds. Underlying March and Shapira’s (1987) observationsabout dissonance between how people are supposed to behave and how theydo behave is a wider debate on the nature of risk that has been gatheringmomentum for over 20 years.
In 1983, scientists and engineers of the Royal Society in London produced areport that presented risk as ‘the probability that a particular adverse eventoccurs during a stated period of time, or results from a particular challenge. Asa probability in the sense of statistical theory, risk obeys all formal laws ofcombining probabilities’. The report reflected the prevailing internationalorthodoxy of the time and was widely accepted as a definitive document inthe field. It made a clear distinction between ‘objective risk’, as determined byexperts applying quantitative scientific means, and ‘perceived risk’ – the
228 � Global logistics

imprecise and unreliable perceptions of the laity. This ‘objective’ position,combined with the Society’s definition of ‘detriment’ as ‘the numericalmeasure of harm or loss associated with an adverse event’, reflects thecompound measure of risk widely encountered within the engineering,health and safety literature.
In 1992, the Royal Society revisited the subject of risk, this time inviting agroup of social scientists – psychologists, anthropologists, sociologists, geog-raphers and economists – to add their expert opinions. Only the economistssupported the earlier stance of their colleagues from the physical sciences.The other social scientists took an opposing position, arguing that objectiveand perceived risk are in practice inseparable, particularly where people areinvolved. They argued that risk is not a discrete or objective phenomenon, butan interactive culturally determined one that is inherently resistant toobjective measurement. The essential problem is that people modify theirbehaviour and thereby their likely exposure to risk in response to subjectiveperceptions of that risk, subtly balancing perceived costs and benefits. Writerssuch as Adams (1996), therefore, contend that these unquantified or unquan-tifiable changes in exposure invariably defeat all attempts to measure riskoutside the casino, where odds can be mechanically controlled. The outcomeof the Royal Society’s 1992 study was discord within the Society and a descentinto ‘uncertainty’ within the risk management discipline.
Risk and uncertainty are terms that in practice are often used inter-changeably, but back in the 1920s Knight (1921) made a helpful distinction: ‘Ifyou don’t know for sure what will happen, but you know the odds, that’s riskand if you don’t even know the odds, that’s uncertainty.’ Uncertainty is,according the Knight, ‘the realm of judgement’. Nevertheless, as Adams(1996) points out, ‘Virtually all the formal treatments of risk and uncertainty ingame theory, operations research, economics and management sciencerequire that the odds be known, that numbers be attachable to the probabil-ities and magnitudes of possible outcomes’. In these disciplines, riskmanagement still strives to identify, quantify, control and where possibleeliminate specific narrowly defined risks. Similarly, most of the tools, tech-niques and concepts used for identifying, evaluating and estimating riskremain rooted in the thinking of scientific management. Consequently theyfail to consider that failures and accidents may be emergent properties arisingfrom the wider system as a whole (White, 1995). Even in enterprise riskmanagement, it is clear to some that risk management models have failed tokeep pace with the realities of our networked world. They have failed toaccount for operational interdependencies between firms brought about bythe trend to outsource and the reality of supply chain networks, therebyunderestimating the range and severity of risks faced by a company (Starr,Newfrock and Delurey, 2003).
Why this all matters from a practical supply chain risk managementperspective is that, if supply chains are seen only from a business process
Supply chain vulnerability � 229

engineering and control perspective, then a selective (downside only) versionof a variance-based view of risk sits quite well. However, if we also accept thatsupply chains involve relationships that link organizations sharing a commonphilosophy and purpose, then there is an equally persuasive argument thatsupply chains should be viewed as open interactive societal systems.Organizations are, whether we like it or not, socially constructed, managedand populated by people, imbued with all the fallibility of human nature andits good common sense. Moreover, if we also accept that these may be globalsupply chains, then those culturally determined perceptions of risk couldvary greatly from one country to another. Along the way the forces of naturecan easily demonstrate just how far removed from the controlled envir-onment of the casino this all might be.
Supply chain resilience: a holistic view
Mindful of the need for more holistic approaches to risk management, thissection looks not only at risks in terms of specific vulnerabilities and hazards,but at what that means for the resilience of the supply chain as an integratedsystem. In this context, the term ‘resilience’ refers to the ability of the system toreturn to its original (or desired) state after being disturbed. However,keeping our feet in the real world, it is important to remember that no oneperson manages a whole supply chain. Many people are responsible for themanagement of activities, functions, processes or other aspects of thesecomplex dynamic networks. Each will be viewing supply chain risk throughthe lens of his or her own performance measures. The upshot is that, inpractice, supply chain risk management is likely to be a patchwork of some-times complementary, but often conflicting or competing, efforts. Figure 14.1shows a supply chain broken down into its component parts, hopefullywithout losing the sense of dynamic interaction. Looking at supply chains inthis way enables the inclusion of many different functional and hierarchicalperspectives and their respective interpretations of risk, as well as an oppor-tunity to position some of the management tools and techniques currentlyavailable.
Process engineering and inventory managementLevel 1 in Figure 14.1 concentrates on a process engineering or inventorymanagement perspective. It focuses on what is being carried – work andinformation flows – and process design within and between organizations.This perspective underlies lean operations and the ‘end-to-end’ perspectiverequired for the ‘agile’ supply chain, where reliable, responsive processes andinventory management concerns remain central themes. Risk management islargely about improved visibility (of demand and inventory), velocity (to
230 � Global logistics

reduce the likelihood of obsolescence and optimize asset utilization) andcontrol. If processes are tightly monitored and controlled, then non-confor-mance to plan can be quickly detected. Risk reduction tools are oftenborrowed from total quality management. Related process improvement andcontrol methodologies such as Six Sigma are also favoured by some, as areautomated event management systems, which readily alert managers to devi-ations from plan and minimize human intervention.
In the ideal world of scientific management, mastery of process controlmethodologies would facilitate the identification, management and elimi-nation of risk. Unfortunately, we do not live in an ideal world, so Levels 2, 3and 4 of the model bring in a host of other factors that regularly intervene.
Assets and infrastructure dependenciesLevel 2 considers the fixed and mobile assets used to source, produce or carrythe goods and information flows addressed at Level 1. When viewed at thislevel, nodes in the networks may be farms, factories, distribution centres,commercial retail outlets, or public service delivery points such as schools orhospitals. Alternatively, they may be facilities housing IT servers and callcentres. Links in the network are the transport and communications infra-structure, ie roads, railways, flight paths and sea lanes, pipelines and grids,plus mobile assets – boat, trains, trucks and planes. The transport andcommunications networks have their own nodes too – ports, airports, satel-lites, etc.
Supply chain vulnerability � 231
Level 1Value stream/product/processes
Level 2 Asset andinfrastructuredependencies
Level 3 Organi-zations and inter- organizationalnetwork
Level 4Macro envornment
Flow of work,material,information,money
Fixed and mobileassets
Commercial well-being, contractualand stakeholderrelationships
Society and the forcesof nature
???
Figure 14.1 A supply chain as an interactive system

Well-known asset-based approaches to risk management, developed ininsurance, are appropriate and commonly used in this context. They tend todefine risk as the probability of a given event multiplied by the severity(negative impact) should it occur. They draw on plentiful historical data toprovide some indication of the likelihood of fire, flood and many other eventu-alities affecting the insured asset. In a wider vein it is helpful to explore theimpact on operations of the loss of links or nodes in the production/distributionand infrastructure networks, through network modelling.
Mitigating the impacts of potential disruptions to nodes and links is wherebusiness continuity planning (BCP) has a place. As a discipline, BCP is grad-ually moving beyond asset-based approaches to risk management, to a widerremit of maintaining ‘mission critical activities’. In practice, though, efforts arestill first and foremost concerned with safeguarding against the loss of ITsystems, or loss of a particular facility, whether that be due to accident, attackor natural disasters. However, more often than not, disruptions at this levelare not the result of catastrophic failures caused by the phenomena that haveexercised generations of actuaries. The disruptions are just as likely to be theresults of poorly managed IT upgrades or physical network reconfigurations(Peck et al, 2003). Planned site closures, relocations or indiscriminateoutsourcing of activities are often to blame. Nevertheless, it is worth notingthat cross-sector surveys undertaken in recent years suggest that loss of keyskills is actually a more frequent problem than either loss of site or loss of ITsystems (Peck and Jüttner, 2002).
Level 2 is the territory of unglamorous ‘trucks and sheds’ logistics – an earlycandidate for outsourcing in most manufacturing and retail organizations.Within Europe, manufacturing has migrated eastwards. Globally, it hasheaded for China, which means that for much of the world the transportelement of supply chain management and the associated resource require-ments are increasing. HGV driver shortages are a familiar problem tocompanies in the UK, while shortages of shipping capacity from the Far Eastat certain times of the year have been causing problems for some retailers inWestern Europe.
In terms of monitoring mobile assets, we see radio frequency identification(RFID) used in consignment tracking systems. Of course, technological solu-tions need appropriately trained people, though this simple fact is often over-looked. RFID was used to some extent during the 2003 invasion of Iraq – butnobody informed front-line troops, who had no idea what the tags were orwhat should be done with them when they reached their destination. As aresult many were simply unclipped and thrown into buckets. The people partof the equation was also overlooked in the C–TPAT and CSI anti-terrorisminitiatives. Automated solutions seemed to offer a way forward, but insuffi-cient customs personnel were available to undertake the necessary validationchecks to admit those applying to be ‘known shippers’ on to the programme.Thus the measures are regarded by many as increasing the difficulties faced
232 � Global logistics

by organizations already struggling to keep pace with a dramatic increase involumes of global shipments.
Organizations and inter-organizational networksLevel 3 looks at supply chain risk at the strategic level of organizations and theinter-organizational network. These are the organizations that own ormanage the assets and infrastructure that make or carry the goods and infor-mation flows. At this level, risk is likely to be perceived as the financial conse-quences of an event or decision for an organization – particularly its impact onbudget or shareholders. This is where strategic management concerns andcorporate governance requirements really kick in. It is also where conflicts ofinterest in risk management become most evident.
From a purely supply chain management perspective, risk at this level is thedownside financial consequences of a specific event. The loss of a solesupplier or customer is the most obvious danger here. The trading relation-ships that link organizations and power dependencies between them shouldalso be watched carefully. Low margins are likely to encourage consolidationwithin the industry, changing power balances and reversing dependencies.They also herald network reconfigurations and the associated disruptionsdescribed at Level 2. Partnering, dual sourcing and outsourcing are likely tobe put forward as risk management solutions, backed up by contractual obli-gations. However, anecdotal evidence abounds to suggest that in times ofshortage contractual guarantees become unreliable, with suppliers divertingscarce resources to their largest customers, regardless of contractual require-ments. Indeed software is now available that allows companies to divertsupplies automatically to service their most valuable accounts.
Best-practice strategic management and corporate governance tend to seethings a little differently. Here risk retains the upside as well as the downsideconnotations of decision theory. Strategic management is likely to encourage‘big bets’ to maintain competitive advantage. High-risk big bets are likely to beoffset by a requirement for lower risk taking in non-core activities. This line oflogic encourages strategists and corporate risk managers (few of whom haveoperational supply chain management experience) to attempt to transfer risksassociated with non-core activities off-balance sheet to suppliers. One pitfallassociated with this reasoning is that the definition of what is, and is not, acore capability may be too narrowly drawn, with key elements of supplychain management falling by the wayside. Outsourcing and contractualmeans are nevertheless seen as legitimate methods employed to reduceexposure to financial risk. The option is even more tempting if short-term costsaving can be realized. However, when liability for risk management is trans-ferred in this way, the operational consequences of failure remain.
The industrial relations battle between the Swiss-based, North American-owned airline catering company Gate Gourmet and its UK workforce in the
Supply chain vulnerability � 233

summer of 2005 illustrated the point. The Gate Gourmet dispute was alandmark case in that it marked the return of secondary industrial action, notseen in the UK for decades. It also illustrates why supply chains should also beviewed as interactive social systems. Gate Gourmet was sole supplier of in-flight catering services to British Airways (BA). The staff had been BA workersuntil a cost reduction programme prompted the airline to outsource theactivity. The move had been financially beneficial to BA, which, in a compet-itive environment, had continued to pursue further cost reductions throughits supply chain. A dispute involving catering staff did not, on the face of it,represent a significant threat to BA, as the airline could operate its corebusiness without in-flight meals. However, when around 670 BA ground staff– many with family ties to sacked catering workers – decided to walk out insympathy, the consequences for BA were unavoidable. The four-day strikehalted BA flights out of Heathrow, costing an estimated £40 million incancelled flights, and additional costs of food and accommodation for 70,000stranded passengers.
The macro environmentThe fourth and final level of analysis is the macro environment, within whichthe assets and infrastructure are positioned and organizations do business.The PEST (political, economic, social and technological) analysis of environ-mental changes, used in strategic management, is useful here. Sometimesenvironmental and legal/regulatory changes are included in the basic analysisor given separate treatment. Socio-political factors – such as action bypressure groups (eg environmentalists or fuel protestors) or supposedly unre-lated industrial disputes – should be picked up by routine ‘horizon scanning’using specialist or general media sources, allowing measures to be put in placeto mitigate the impact. Geo-political factors (eg war) should not come as asurprise, but the extent to which they can influence demand for all manner ofgoods and services should not be underestimated. The 2003 invasion of Iraqcoincided with a drop in business confidence, leading to a drop in advertisingand a marked reduction in demand for high-quality paper – with the reverseimpact on oil prices.
Far from our controlled casino environment, there are also the forces ofnature – metrological, geological and pathological – to contend with. Most arelikely to be far beyond the control of supply chain managers, so risk avoidanceand contingency planning are appropriate courses of action. However, onecategory of pathogens – ie contaminants and diseases – is worth particularattention here. Whether it is BSE, foot-and-mouth, avian flu, or the computerviruses that mimic them, what makes pathological factors so dangerous is thatthey are mobile. They have the ability to hitch a ride with the flows of goodsand information that supply chain managers speed around the globe. Onceinside the system, they have the potential to bring it down from within. The
234 � Global logistics

creeping crises referred to at the beginning of this chapter are all Level 4disruptions – but it would be wrong to regard them only as external threats tothe supply chain. Their potency as disruptive challenges is a reflection of ourinterconnected, interdependent societies and the efficiency of our supplychains.
Supply chains and wicked problems
Having run through the levels of the model, examining the perspectives andrisk management methods prevalent at each, it is important to reiterate thefact that managers at every level see risk first and foremost through the lens oftheir own performance measures. The snag here is that efforts to optimizeperformance (and thereby reduce risk) in one dimension will often haveunexpected and undesirable consequences for others. Whilst this notion maysit uncomfortably with objective approaches to risk management andprevailing wisdom in supply chain management, it comes as no surprise tosome complex systems thinkers. That is because supply chain risk is techni-cally a ‘wicked problem’.
The term was coined in the early 1970s by Rittel and Webber (1973), whosepaper on ‘Dilemmas in a general theory of planning’ is not an obvious sourceof enlightenment for those charged with the management of supply chainrisk. Nevertheless, their contribution was to produce a lucid explanation ofwhy societal problems are inherently different from the problems that scien-tists and some engineers tackle. Scientists and engineers tend to deal withdiscrete, identifiable problems, where the desired outcome is known,providing clarity of mission and an easily recognizable desired end state. ButRittel and Webber (1973) argued that the assumption of discrete problems didnot reflect the reality of societal dilemmas – including most public policyissues. These are complex ‘wicked problems’. Societal problems invariablyencompass the interests of multiple stakeholders who rarely share a singledefinitive common goal. The absence of a definitive common interest meansthat the clarity of mission is also absent, and there is unlikely to be a definitiveuniversal solution. Personal interests and value sets invariably come into play.Moreover, once implemented, any solution will probably generate conse-quences elsewhere in the system, often over an extended period of time. Theterm ‘wicked’ is not used in the sense that something is ethically deplorable,but in the sense that it is vicious, displaying the characteristics of a viciouscircle. Moreover, attempts to solve wicked problems are quite likely to resultin malignant side-effects.
It is clear that some threats to supply chains (eg Y2K) do fall into the discreteproblem category, but there are many other problems facing managers ofsupply chain risk that do not – including creeping crises and counter-terrorism. Given the nature of wicked problems, searching for a one-time
Supply chain vulnerability � 235

definitive optimal solution is not the way forward. Instead Rittel and Webber(1973) observed it is better to ask the right questions about the consequencesof actions, within the context of multiple frameworks, recognizing socialprocesses as the links tying open systems into larger interconnected networksof systems. This chapter concurs with that advice, and has put forward justsuch a framework, addressing supply chain vulnerability at many levels andrisk from multiple perspectives – but all within the context of an integratedsupply chain system.
Engineering perspectives do have a well-deserved place in that framework,as does lean thinking and least-cost efficiency, but the notion that everyonecan minimize risk (however that is construed) and optimize performancesimultaneously is far from realistic. Compromises do have to be made.Resilience requires redundancy or slack in terms of time, capacity and cap-ability within and preferably throughout the system, which means that sub-optimal efficiency for someone is inevitable. In the ideal world of collaborativesupply chain management, all parties should be willing and able to share therisks – benefits and cost burdens – for the greater good of all. In practice,human nature and short-term financial pressures give a distinct possibilitythat, instead of everyone carrying slack, no one will carry it. All will be hopingthat just over their network horizon someone else will be doing the rightthing or that market forces can be relied upon to ensure that resources willalways be there, ready and waiting, just in case they are needed. They mightbe but, in an emergency, would you be willing to bet on it?
References
Adams, J (1996) Risk, Routledge, LondonAitken, J (1998) Supply chain integration within the context of a supplier asso-
ciation, PhD thesis, Cranfield University, CranfieldBorge, D (2001) The Book of Risk, John Wiley & Sons, New YorkChristopher, M (1998) Logistics and Supply Chain Management: Strategies for
reducing costs and improving services, Pitman Publishing, LondonCooper, MC et al (1997) Supply chain management: more than a new name for
logistics, International Journal of Logistics Management, 8 (1), pp 1–13Forrester, JW (1958) Industrial dynamics: a major breakthrough for decision
makers, Harvard Business Review, 38, July–August, pp 37–66Forrester, JW (1969) Principles of Systems, Wright Allen Press, Cambridge, MAKnight, F (1921) Risk, Uncertainty and Profit, Harper & Row, New YorkLa Londe, BJ (1984) A recognition of logistics systems in the 80’s: strategies
and challenges, Journal of Business Logistics, 4 (1), pp 1–11Larson, PD and Halldorsson, A (2004) Logistics versus supply chain
management: an international survey, International Journal of Logistics:Research and applications, 7 (1), pp 17–31
236 � Global logistics

MacCrimmon, KR and Wehrung, DA (1986) Taking Risks: The management ofuncertainty, Free Press, New York
March, JG and Shapira, Z (1987) Managerial perspectives on risk and risktaking, Management Science, 33 (11), pp 1404–18
Mentzner, JT et al (2001) Supply Chain Management, Sage, Thousand Oaks, CAOliver, RK and Webber, MD (1992) Supply chain management: logistics
catches up with strategy, in Logistics: The strategic issues, ed M Christopher,Chapman & Hall, London
Peck, H and Jüttner, U (2002) Risk management in the supply chain, Logisticsand Transport Focus, 4 (11), December, pp 17–22
Peck, H et al (2003) Supply chain resilience, Final report on behalf of theDepartment for Transport, Cranfield University, Cranfield
Rittel, HWJ and Webber, MM (1973) Dilemmas in a general theory ofplanning, Policy Sciences, 4, pp 155–69
Royal Society (1983) Risk Assessment: A study group report, Royal Society,London
Royal Society (1992) Risk: Analysis, perception and management, 2nd edn, RoyalSociety, London
Shapira, Z (1986) Risk in managerial decision making, Unpublishedmanuscript, Hebrew University, cited in JG March and Z Shapira (1987)Managerial perspectives on risk and risk taking, Management Science, 33 (11),pp 1404–18
Starr, R, Newfrock, J and Delurey, M (2003) Enterprise resilience: managingrisk in the networked economy, Booz, Allen and Hamilton, McLean, VA
Stock, JR and Lambert, DM (2001) Strategic Logistics Management, 4th edn,McGraw-Hill, Boston, MA
White, D (1995) Applications of systems thinking to risk management:a review of the literature, Management Decision, 33 (10), pp 35–45
Supply chain vulnerability � 237

238
Delivering sustainabilitythrough supply chain
management
Kirstie McIntyre, Hewlett-Packard
Supply chains span industry groups, cross industry boundaries, have a widegeographical spread and are an excellent vehicle for improving the environ-mental, social and economic performance of companies and industry sectorsover the long term. Supply chain management functions are analysed fortheir potential impacts on the performance of a company. Practical examplesfrom many industry sectors show the steps that can be taken to improvesustainability for the environment, for society and for the business.Specifically, the European Waste Electrical and Electronic Equipment (WEEE)Directive will have a significant and long-reaching effect on the supply chain.From purchasing decisions to reverse logistics, the whole supply chain will bereshaped by this new environmental law.
Background
Sustainability has traditionally been a concept that is difficult to sell to seniormanagement because it describes a state in the future that has never beenexperienced, rather than a specific process or methodology of how to getthere. Theoretically, the concept makes sense, but translating it into actionable
15

steps has proved a significant stumbling block for a organizations (Preston,2001). The concept of sustainability or sustainable development has beenaround for a while, but is a very recent customer requirement and one thatmany companies are trying to grapple with. Sustainability is a difficultconcept to grasp in an industrial context, as shown by the definition (DETR,2000):
Sustainable development is:
� social progress which recognizes the needs of everyone;� effective protection of the environment;� prudent use of natural resources; and� maintenance of high and stable levels of economic growth and employment.
When a company considers what the above elements mean, it seems impossibleto continue to do business and be sustainable. But sustainability is not just aboutbeing altruistic about the environment and workers’ rights. It is also aboutensuring the long-term viability of a business model and company. Shareholders,customers, suppliers and employees all want to see a future in their businesses.The functions that the supply chain organization manages are an ideal place for acompany to begin putting together the actionable steps and investments that willdemonstrate positive progress towards sustainable development.
Waste electrical and electronic equipment is one of the priority wastestreams identified by the European Commission alongside batteries, tyres,vehicles and packaging. The directive has been written as part of the‘producer responsibility’ set of laws, which demonstrates a shift in focus fromprocess- to product-oriented environmental legislation. In the past, environ-mental legislation has focused on industrial emissions and air and waterquality – but, owing to increasing waste generation and reducing disposalcapacity, waste is now one of the top environmental issues in Europe. EU andUK waste policies increasingly involve the private sector. Producer responsi-bility legislation aims to increase product recycling by making producersfinancially responsible for their products at end of life.
WEEE has been specifically chosen as a priority waste stream for a numberof reasons. There are perceived problems with the current state of wastemanagement. Growing quantities of WEEE mean a higher contribution ofWEEE to pollutants in municipal waste streams – and underdeveloped re-cycling technologies and infrastructure mean that there are limited ways ofdealing with this. Diverging national legislation does not support a singleEuropean market or the ease of doing business in Europe. Therefore thegeneral objectives of the WEEE legislation are to improve waste managementprocesses, eliminate hazardous substances, increase recycling capacity andintroduce harmonizing legislation.
Supply chain management has risen high on the corporate agenda ascompanies recognize the potential that it offers for creating sustainable
Delivering sustainability � 239

competitive advantage in an increasingly turbulent business environment(Christopher and Lambert, 2001). Customers’ requirements are becomingmore stringent and companies aim to be increasingly customer-focused – andit is often the supply chain that is able to provide the added value thatcustomers are looking for. The 6th Business in the Environment Index ofCorporate Environmental Engagement (BiE, 2002) identified the integrationof environmental risk into supply chain management as a real challenge formany companies. Supply chain aspects of sustainable development resultedin the lowest management score, with 17 out of 38 industry sectors scoringbelow 50 per cent. There is a need to look strategically beyond the immediateenvironmentally driven aspects of supply chain management. With all stake-holders giving attention to the quality of management and corporate gover-nance – demonstrated through supply chains and sustainability – this is anideal time to look at combining the best of both disciplines. This chapter takeseach of the major supply chain functions (shown in Figure 15.1) and discussestheir ability to improve sustainability in terms of environmental, social andeconomic impacts.
Purchasing or procurement
Purchasing is often the first place that companies start to integrate environ-mental issues into their management processes. This is especially true for
240 � Global logistics
UseDistribution/warehousing
Production/manufacturing
Maintenance
Reuse/recycle
Disposal andwaste
management
Purchasing/procurement
Figure 15.1 Common supply chain functions

service companies. Such companies often do not have large environmentalimpacts themselves – but the operations that use their services are frequentlythe area where there is a significant scope for improvement. Environmentalperformance is certainly now integrated into the procurement function ofmany large companies, whether for services or for raw materials. These largecompanies affect whole supply chains and cross many industries with theirrequirements for improved environmental performance. Some of this is beingdriven by environmental management systems (ISO 14000 or EMAS) andsome is being driven by consumer pressure or even market differentiation.Toyota first laid out its goal of becoming an industry leader in environmentalperformance in 1992 with its Earth Charter. It is now imposing the samestandards on its suppliers in its Green Supplier Guidelines – which are not somuch guidelines as mandates. Toyota in North America demanded that allsuppliers implement an environmental management system that conforms toISO 14001 by the end of 2003. Suppliers must also obey a ban on 450 chemicalsas well as comply with hazardous materials transport rules. Many of Toyota’ssuppliers welcome the tough standards as it brings them to the forefront ofenvironmental performance in their own industries. Toyota has further envir-onmental aspirations with long-term energy reduction and greenhouse gasand zero landfill targets (Zachary, 2001). Such strictures can apply a lot ofpressure on suppliers, but Toyota’s suppliers appear to have embraced thechallenge and feel that they have gained from doing so. Toyota itself hasimproved its environmental performance by leveraging the effort of itssuppliers. This seems an increasingly popular way of improving environ-mental and social performance, particularly by customer-facing organizationssuch as car manufacturers and retailers.
A growing number of European retail chains are developing their ownsafety initiatives by banning chemicals in their products. Many retailers areasking suppliers of own-label products to withdraw or phase out chemicalsthat have been put on priority lists for further research by the EuropeanCommission, national governments or environmental monitoring organiza-tions. Fewer organizations have been successful at incorporating social issuesinto their procurement processes. However, with recent media attention onNike and Gap over child-labour issues in their supply chains, the clothingretailers have taken a much more proactive approach to supplier assurance.Nike and Gap both have corporate compliance and monitoring teams whoaudit contract factories for fulfilment of stated aims and objectives. ManyBritish retailers have joined the Ethical Trading Initiative (ETI), which iden-tifies and promotes good practice in the implementation of codes of labourpractice (see the ETI website, www.ethicaltrade.org). It is reasonable to expectmore retailers to take these approaches to managing social impacts in theirsupply chain.
B&Q has been in the forefront of action in this area since the early 1990swhen it realized that – as a DIY retailer – the majority of its environmental and
Delivering sustainability � 241

social impacts came from its products and suppliers. The company uses bothquestionnaires and auditors to track environmental and social issues in itssupplier base, and has decided that this approach is preferable to requiring anenvironment management system (B&Q, 1995). It submitted to suppliers,chemical companies and environmental groups a list of chemicals it wanted toban in its products so that it could declare itself toxic-free by 2005. Some of thechemicals are among the 15 hazardous substances pinpointed for priorityaction by the Ospar convention, responsible for protecting the marine envir-onment of the north-east Atlantic. Homebase, another DIY retailer, is goingeven further by planning to ban all the chemicals on the Ospar list – eventhough the governments that defined the list set a deadline of 2020 for endingthese emissions.
The pressure to green the procurement function does not come only fromcompanies; governments are also leveraging their purchasing power. TheUK government has for some time produced a Green Government Handbook,which advises central and local departments on environmentally soundgoods and services. The European Commission (2001) has recently issuedguidelines that clarify the extent to which environmental criteria may beused in the public procurement process and still remain in line withprocurement directives that regulate freedom of movement, competitionand best value. A Green Public Procurement Handbook is being developed. Thedrivers for this are that the achievement of sustainable development requiresthat economic growth supports social progress and respects the envir-onment, that social policy underpins economic performance, and that envir-onmental policy is cost-effective. Public purchasing represents 14 per cent ofEU GDP, and member states should consider how to make better use ofpublic procurement to favour environmentally friendly products andservices. The guidance goes beyond differentiating between products andservices, and suggests that there are other possibilities for integrating envir-onmental considerations into public purchases, notably when defining thetechnical specifications, the selection criteria and the award criteria of acontract. This means that public procurement departments may have theability to change the way that goods are produced or manufactured or thesupplies that service providers use.
Changing methods of public procurement are also being used to drivesustainability into goods and services purchased from the private sector.The construction sector in the UK has discovered that new procurementmethods such as private finance initiatives (PFIs) and Prime Contracting (anMOD initiative) have long-term outlooks and responsibilities (25 years inthe case of PFI), which means that designing, building and maintainingsustainable facilities become key to the successful tendering and managingof contracts.
242 � Global logistics
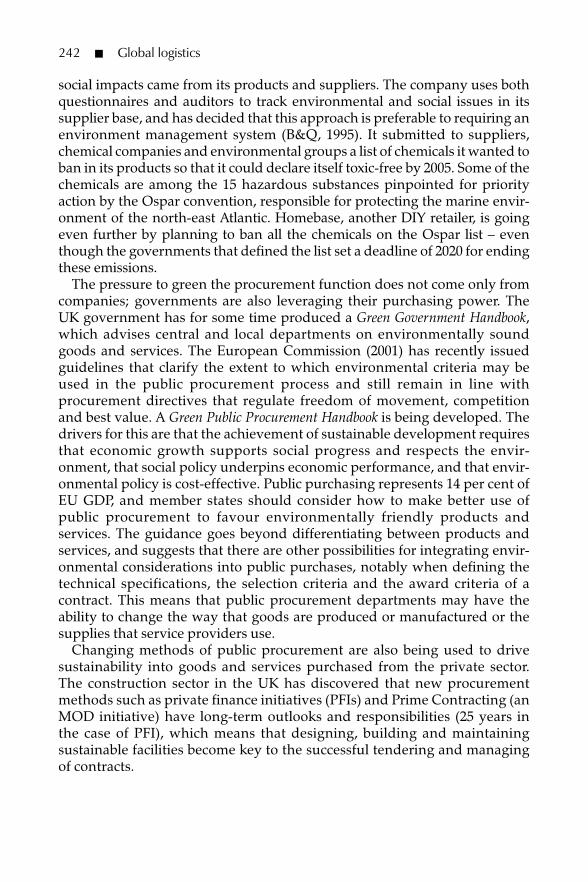
Production or manufacturing
The primary output of today’s production processes is waste. Across allindustries, less than 10 per cent of everything that is extracted from the earth(by weight) becomes usable products. The remaining 90 per cent becomeswaste from production (Senge, Carstedt and Porter, 2001). Resource efficiency– or doing more with less – is the first place to start in improving sustainabilityperformances. Through its ‘waste-free factories’ programme, Xerox hasreduced landfill by over 75 per cent since 1993. Cornwell Parker Furniture’stimber minimization programme has saved £250,000 per year and reducedwaste by 20 per cent. Cornwell has also overhauled coating procedures,saving a further £180,000 per year, and cut solvent use by 21 tonnes per year.Instead of sending wood waste to landfill, a wood-fired incinerator withenergy recovery has been installed. Although this cost £480,000, the reductionin landfill tax and heating fuel gives a payback period of four to five years(Envirowise, 2002). British Airways and its waste management contractor,Grundon, have created a strategic partnership to deal with waste arising fromaircraft, engineering facilities and offices. The partnership means that, insteadof being presented with an opaque final bill for services, BA receives a detailedbreakdown of Grundon’s waste handling costs. This has enabled both partiesto identify opportunities for cost savings and then share in those savings(ENDS, 2002a).
Many argue that what we need is a different way of looking at products.Firms such as Dow Chemical, Carrier and IKEA believe that higher profitswill come from providing better solutions, rather than selling more units.This creates a potential alignment between what is sound economically andwhat is sound environmentally. A company’s business model no longerrequires designed-in obsolescence to push customers into buying newproducts. Instead, producers have an incentive to design for longevity, effi-cient servicing, improved functioning and product take-back. Such designmaintains relationships with customers by continually ensuring thatproducts are providing the services that people desire, at the lowest cost tothe producer.
The shift from valuing ‘stuff ’ to valuing the service that the ‘stuff ’ providesleads to a radical change in the concept of ownership. In the future, producersmay own their products for ever and, therefore, will have strong incentives todesign products to be disassembled and remanufactured or recycled,whichever is more economical. Owning products for ever would represent apowerful step toward changing companies’ attitudes about product discard.When the production function is considered to be a part of the supply chain,there is obviously much that can be done to improve environmental andsocial performance at this stage. The environmental performance of manufac-turing activities has been improving now for many years, much of it driven byeasy cost savings.
Delivering sustainability � 243

Social impact assessments are common for large infrastructure projects(roads, pipelines, etc) but are not yet a common part of manufacturing activ-ities. However, many companies forget that social impacts include the healthand safety of employees and neighbours, community relations or noise andcongestion abatement processes. Many of these impacts are already part ofenvironmental management systems. Human resource managementprocesses also play a role in identifying and improving social performance –training, fair pay, equality and diversity activities all contribute to acompany’s sustainability performance.
The case of Scandic Hotels shows, firstly, that sustainable strategies and prac-tices can be just as useful in service operations as in manufacturing and,secondly, that such strategies and practices can support a corporateturnaround. In the early 1990s, Scandic Hotels was turned from collapse by anew value system, embodied in the concept of sustainable development, whichlinked customers and employees. Through employee training programmes,environmental information systems and innovative collaborations withsuppliers, Scandic was revived as a profitable corporation (Goodman, 2000).
Distribution and warehousing
Cooper, Browne and Peters (1991) maintain that the transport and storage ofgoods are at the centre of any logistics activity, and these are areas where acompany should concentrate its efforts to reduce its environmental impacts.The authors claim that 24-hour transport is less environmentally damaging, asfuel consumption is more efficient with less congestion, and that just-in-timeoperations raise fuel consumption, as smaller lorries consume more fuel pertonne of goods moved than larger vehicles. This is an important point withthe exponential growth of e-commerce and home deliveries. The use ofcombined transport options such as containers using road and rail links isadvocated for environmental improvement. To begin the improvementprocess, the authors suggest a three-stage approach: an environmental auditof the logistics operation, a listing of actions to reduce impacts and a priorityranking of these actions. The problem with these recommendations is thatthey are not stakeholder-focused, but look only at fuel consumption andeconomic cost. Improving the efficiency of fuel consumption will indeedreduce environmental impact, but local community issues may become moreimportant when using large lorries in a 24-hour operation.
Supermarkets are only just beginning to take into account the miles travelledby food from its country of origin to our plates. Consumer demand for freshfruit and vegetables all year round and the falling costs of freight transporthave not provided retailers with an economic incentive to reduce the transportassociated with their products. However, climate change levies may changethis as transport emissions are counted as part of a company’s carbon dioxide
244 � Global logistics

burden. Drinks manufacturer HP Bulmer has identified that the second-biggest source of carbon dioxide and other air pollutants is transport – withoutbound goods accounting for some 85 per cent of its total transport emis-sions. Currently 100 per cent of the company’s transport is by road, but it hasbeen testing ways of putting some back on the railway. A partial switch to railappears to be cost-neutral and results in environmental benefits, with carbondioxide emissions per tonne-kilometre reduced by 80 per cent. Such initiativesallowed Bulmer to set a target of reducing the environmental impacts of itstransport operations by 75 per cent in 2004 (ENDS, 2002b).
Transport is often viewed as an activity with a negative environmentalimpact, yet the transport sector represents 7 per cent of the GDP of WesternEurope and employs 7 per cent of the workforce. On the other hand, the costto society in terms of congestion, pollution and accidents has been estimatedto be 5 per cent of the GDP. The energy consumption of the transport sector isone-third of all the energy consumed by EU industry, and 85 per cent of this isused by road transport. Unfortunately, the recent troubles of Railtrack in theUK have done nothing to encourage goods to move from road to rail. And thesector is fragmented, very competitive and disinclined to act in concert to findsolutions to its problems (Howie, 1994). Congestion is inflationary anddecreases productivity through delays, stock-outs or over-stocking. So, thereis a dilemma between reducing environmental impact and increasingfinancial cost. To some extent, this can be overcome by intermediaries likeconsolidators (organizations that ship many companies’ products together tomaximize loading efficiencies).
Warehouse management is another key social and environmental factor indistribution. The siting of warehousing and distribution centres can be amajor issue for local communities because of noise and congestion. Theenergy consumption or health and safety record in a poorly managed,temperature-controlled warehouse can eclipse all the other efforts that acompany may make, yet it is often an overlooked function of the supplychain. Packaging and waste management are also important processes, oftenbased at warehouse locations, which can have far-reaching impacts on theenvironment. The Packaging Waste Directive (94/62/EC) and national pack-aging laws now include all types of packaging in aggressive recovery andrecycling targets for companies using over 50 tonnes of packaging a year.Anheuser-Busch, the US food processor, is looking at both in- and outboundmaterials to see how suppliers can improve the company’s environmentalperformance as well as its bottom line. Suppliers have played a major role inits packaging programme, which has resulted in a reduction of aluminiumuse, saving $250 million per year. The company has also worked withmaterials-recovery suppliers to increase recycling rates as well as the qualityof collected aluminium beverage containers. It is now the world’s largestrecycler of used aluminium drinks containers, currently recycling 130 per centof the amounts it ships in the USA. Overall, the company has reduced the
Delivering sustainability � 245

amount of solid waste to landfill by 68 per cent since 1991, saving $19 million.Such efforts take several years, require collaboration with suppliers and needto be integrated into existing quality programmes and new business initia-tives (Purchasing, 2001).
Use and maintenance
As many life cycle analyses have proved, it is the ‘use’ phase of a product orservice that often creates the biggest environmental and social impact(McIntyre et al, 1998). It is also the use phase that many companies are recog-nizing as key to customer relationship management. As Volvo discoveredyears ago, when a company is selling cars its relationship with the customerends at the purchase; when the company is providing customer satisfaction,the relationship just begins with the purchase. By interacting with theproducer, the consumer can become a co-creator of value or, in some cases, adestroyer of value (Senge, Carstedt and Porter, 2001). Xerox found that it wasnot the electricity that its equipment consumed that caused the biggest envir-onmental impact, but the consumption of paper and toner and the visits fromthe service engineer in a van (McIntyre, 1999). This indicated to Xerox thatdesigning greater reliability into machines and then providing more trainingto customers would substantially mitigate the environmental impacts of itssupply chain. Cooperating with paper and toner suppliers to reduce energyconsumption at the production stage would result in greater cost savings andless environmental damage.
BASF’s premise is that its products will have commercial advantage ifthey deliver environmental benefits as well as performing at the same levelas the competition. The company examines all of its major products andprocesses every three years and assesses how they can be made more prof-itable or more environmentally friendly or, where necessary, replaced. Thecompany has now undertaken more than 100 eco-efficiency analyses. Oneexample introduced plastic fuel tanks for cars as being more eco-efficientthan metal ones (because they are lighter and will reduce energy use and,therefore, cost to customers). Collaborations between BASF and itscustomers have become increasingly important in making choices aboutmaterials (Scott, 2001).
The examples above show that product stewardship is the key issue in theuse phase of products and services. It is a key issue for a number of reasons,not only environmental and social impact, but also as added value to thecustomer. Corporate governance, ensuring that stated policies are adhered toand maintained, is also being extended by some companies into productstewardship. It is not enough for them to have products disappear on to thenext stage in the chain: they are concerned about how their products arebeing used.
246 � Global logistics
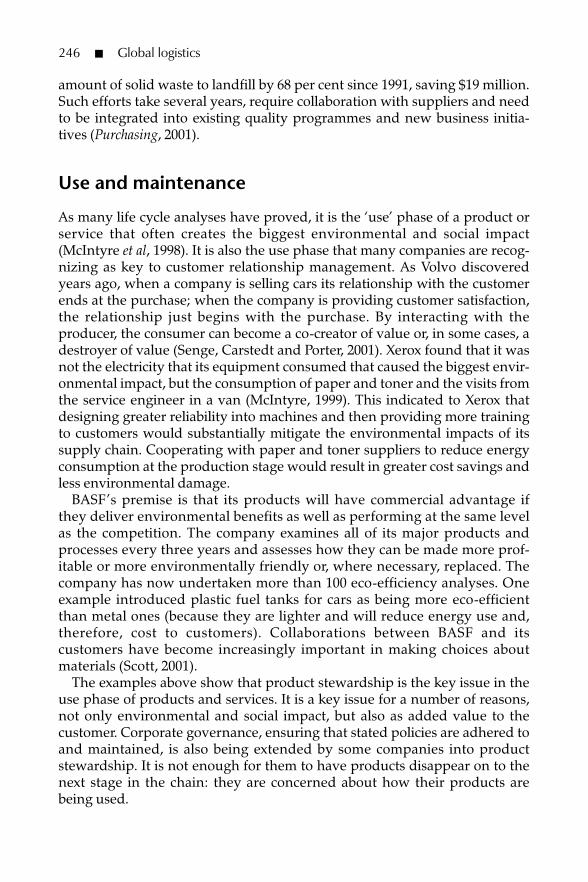
It may be difficult for service sectors to internalize product stewardship, butin practice ‘service stewardship’ can be applied equally. Understanding theenvironmental and social impacts that occur through the lifespan of a service isthe first step to a reduction of those impacts. The hotel industry, for example,has understood that laundering towels is one of its biggest impacts. Manyhotels now have a green hotel charter, which asks guests to consider whetherthey need clean towels on a daily basis. Although it is still the customer’schoice, the hotel is using its relationship with its customers to mitigate environ-mental impacts from detergent, water and energy consumption.
Dispose or reuse and recycle?
Other organizations have focused their environmental efforts on the otherend of the supply chain with recycling issues. Equipment is returned from thecustomers of companies such as IBM, Nokia, BMW and Xerox (Hopfenbeck,1993: 139–73). These companies either recondition the old equipment orreclaim the materials they are made from, reprocessing them into raw mate-rials. Logistics is well qualified to deal with cradle-to-grave issues because ofits focus on the control of materials from suppliers, through value-addedprocesses and on to the customer. The interface between logistics and theenvironment is embedded in the value-adding functions it performs (Wu andDunn, 1995). To minimize total environmental impact, it must be evaluatedfrom the total system perspective and reverse logistics may be the answer toimproving the environmental impact of the supply chain by improvingmaterial use (Giuntini, 1996).
The requirements of the WEEE Directive emphasize that industry andgovernments should be driving towards individual producer responsibility,away from the collective responsibility of dealing with historical WEEE waste.This means that each producer would be responsible for only its ownproducts, not a share of all WEEE within its market category. The aim of this isto achieve environmental benefits through encouraging innovative designand recycling technologies driven by producers. For example, Hewlett-Packard (2005) has been designing products for a number of years using theconcept of extended producer responsibility. It is equally concerned about thedesign impacts on the cost of recycling the product at the end of its life as it isabout the energy consumption and hazardous materials content. HPtherefore assumes that its products will be easier and cheaper to recycle thanits competitors’ products and that it will be able to pass on this cost advantageto its customers.
The challenge for the supply chain is clear in this scenario. In order for HPto realize its cost advantage, it needs to recover and recycle only its ownproducts. In these days of underdeveloped recycling infrastructure and tech-nologies, it is difficult to see how this can happen without large amounts of
Delivering sustainability � 247

manual handling to sort through piles of IT WEEE and select only HPbranded products. Studies in the UK and other countries have shown that asignificant proportion of WEEE returned by householders is unrecognizableor has no brand name left on it. This issue may be resolved with the advent ofradio frequency identity (RFID) tagging, but this would require significantinvestment by producers to incorporate it into products, and by the recyclingindustry to invest in the sorting machinery needed to make the system effi-cient. However, it is only through producers being able to realize the benefitsof eco-design at the end of life of products that the WEEE Directive willachieve one of its primary objectives – preventing so much electronic wastebeing generated in the first place.
The construction industry in the United Kingdom consumes around 6tonnes of material per person per year and about 10 per cent of nationalenergy consumption is used in the production and transport of constructionproducts and materials. Some 250–300 million tonnes of material are quarriedin the UK each year for use as aggregates, cement and bricks. Approximately13 million tonnes of construction materials are delivered to site and thrownaway unused every year (DETR, 2004). The construction industry producedan estimated 73 million tonnes of construction and demolition waste in 1999,representing 18 per cent of the total waste produced in the UK. Only 12–15million tonnes of materials (less than 20 per cent) are recycled per year, ashardcore and landscaping fill. Using these materials more effectively, throughreclamation and higher-grade recycling, would reduce the use of aggregates,save energy and reduce pressures on landfill sites (Vivian, 2001). For example,in 10 demonstration projects MACE, Laing Homes, AMEC Capital, Wren &Bell, Schal, Scottish Executive, Try Construction, the Environment Agencyand Carillion have all worked with CIRIA to minimize waste. Examples ofwaste minimization on these sites include (CIRIA, 2001):
� the recovery of 500,000 roof tiles for reuse in housing developments,saving £80,000;
� a house builder saving £600 waste disposal costs per housing unit built;� a reduction in over-ordering by using just-in-time deliveries;� the minimization of waste at the design stage of an office refurbishment;� the segregation of waste on-site, saving 20 per cent on disposal costs; and� better control of waste by the use of rigorous procurement and contractual
measures.
Managerial and financial sustainability
What about all the support structures around supply chains, such as financialdecisions, management systems and governance? Certain preconditions arenecessary before an environmentally oriented value chain can be created.
248 � Global logistics

These include an environmentally oriented system of corporate management,a culture that allows learning, and a top-down principle with bottom-upsupport. Development and change aimed at the target audience are morelikely to result in the environment (or sustainability) being considered fromthe beginning of the process (Steger, 1996).
Much of the influence on sustainability comes from outside the firm. Manyin the fund management community probably think that sustainable devel-opment has little relevance to their decision making – but what about theenergy company that is ignoring the rising tide of pollution legislation, or anautomotive stockist that has not considered the implications of forthcomingvehicle recycling directives (Belsom, 2001)? When the cost of emitting climate-change gases is incorporated into the tax regime through the UK climatechange levy, then the economics of doing business will change. The Society ofMotor Manufacturers and Traders estimate that the extra cost for each newUK car after the implementation of the End of Life Vehicle Directive will bebetween £115 and £300. These uncertainties reduce the earnings fromcompanies’ stock and so their performance on the stock market.
Socially responsible investment aims to influence companies to adoptpolicies that benefit the environment and society at large. As investors,socially responsible investment funds have a great deal of influence over theway in which a company conducts business (CIS, 2002). An EIRiS/NOP (1999)survey found that over 75 per cent of UK adults think their pension schemeshould operate an ethical policy, if it can do so without reducing the level offinancial return. Of these, 39 per cent said their pension should operate anethical policy even when it might reduce the size of their final pension. Thegrowing prominence of ethical issues is also reflected in the spectaculargrowth in numbers and size of available funds that apply ethical criteria.Research by the Social Investment Forum indicates that, in 1999, more than $2trillion was invested in ethical funds in the United States, up 82 per cent from1997 levels.
Socially responsible investment is a growing trend and there are a largenumber of rating organizations that assess and screen companies to provideinformation on their operations. These rating organizations scrutinize factorslike environmental impacts and solutions, sustainability issues, managementand external focus – and companies will need to consider the strategicresponses in these areas (Walker and Farnworth, 2001).
Reputation and governance of a company and its supply chain are also keyissues. Shell appeared very badly when it decided to sink an ageing oilplatform, Brent Spar, even though it transpired that its solution for disposalwas well researched and advised. Shell was unable to recover its corporatereputation and has since attracted more unwanted attention over its oper-ations in Nigeria. Public and pressure group perception of a product is alsoimportant in laundry detergents. Suppliers of phosphates and linear alkylbenzene sulfonate (LAS) for laundry detergents in Europe are having mixed
Delivering sustainability � 249

success in their fight to gain environmental support for their products.Denmark’s environmental authorities are taking such a determined stanceover LAS that Procter & Gamble has decided to stop marketing detergentswith the surfactant in that country. It is not good for the image of its brands forthe company to be seen to be opposing local authorities, even thoughresearch indicates that LAS is more biodegradable than the alternatives(Chemical Market Reporter, 2001).
BP looks at the challenge of sustainable development as a business oppor-tunity. ‘There are good commercial reasons for being ahead of the pack whenit comes to environmental issues’, says John Brown, BP’s chairman. Businesscan play a leadership role in changes, with change driven through marketinnovation being easiest for our society to understand. The challenge is todevelop sustainable business that is compatible with the current economicreality. Dell, Sun Microsystems and Cisco Systems have all identified supplychains as strategic differentiators, using them to forecast and plan futureproducts and services by building trusting relationships through collabo-ration. As supply chains evolve from linear supplier–customer links todynamic networking organizations, all members become involved in definingthe processes and contributing to the value of the finished product or service.Innovative business models and products must work financially, or it will notmatter how good they are ecologically or socially.
Conclusion
This chapter has shown that the pressures to be a more sustainable companyin terms of the environment, economics and social responsibility areincreasing. It has also shown that many companies have already started onthe long road to sustainable development, some with huge success.Sustainable development is here to stay as a customer requirement, and theprocesses of supply chain management are ideally placed to respond to thatrequirement. However, meeting customer and market expectations,improving market access and increasing cost savings represent baselineexpectations and are important simply to environmentally responsiblecompanies remaining competitive. Control of the social and environmentalaspects of supply chains will lead to better understanding of the supply chainas a whole. This in turn can lead to cost savings and better relationshipsbetween partners.
There are many challenges for the supply chain in the WEEE legislation inEurope. For some operators, little will change; for others, there will be acomplete sea change. There are opportunities in data management, trace-ability and assurance, and in the potential development of interim sortingcentres or platforms, for retailers and producers. The division of responsibilityand accurate reporting is a challenge for members of specific product supply
250 � Global logistics
chains. Those parts of the supply chain that can respond to sustainabilityissues such as WEEE will generally be more proactive and able to meetchanging customer requirements and market forces. By taking sustainabilityone step at a time – early in business planning – it is indeed possible to differ-entiate and innovate to create value. Supply chain management processes arean ideal place to start.
References
B&Q (1995), How Green Is My Front Door?, July, B&Q, EastleighBelsom, T (2001) Unsustainable investors, Global Investor, 142, May, p 142Business in the Environment (BiE) (2002) Sustaining Competitiveness, 6th Annual
Index of Corporate Environmental Engagement, 26 February, BiE, LondonChemical Market Reporter (2001) Phosphate and LAS eco profiles under siege in
Scandinavia, Chemical Market Reporter, 259, 11 June, p 259Christopher, M and Lambert, D (2001) The challenges of supply chain
management, Cranfield School of Management online conference,www.supplychainknowledge2001.com
CIRIA (2001) www.ciria.org.ukCooper, J, Browne, M and Peters, M (1991) European Logistics: Markets,
management and strategy, Blackwell, LondonCo-operative Insurance Society (CIS) (2002), Sustainability Pays, Report by
Co-operative Insurance and Forum for the Future, CIS, ManchesterDepartment of Environment, Transport and the Regions (DETR) (2000)
A Better Quality of Life: A strategy for sustainable development for the UnitedKingdom, CM4345, DETR, London
DETR (2004) UK Statistics, DETR, LondonEIRiS/NOP (1999) Survey of Pension Scheme Members, EIRiS/NOP Solutions,
LondonENDS (2002a) BA’s ‘shared savings’ scheme with waste firm, ENDS Report,
324, JanuaryENDS (2002b) HP Bulmer: a ferment of sustainability ideas, ENDS Report, 324,
JanuaryEnvirowise (2002) Furniture Workbook, GG308, DETR, LondonEuropean Commission (2001), Commission Interpretative Communication on the
Community Law Applicable to Public Procurement and the Possibilities forIntegrating Environmental Considerations into Public Procurement, COM(2001)274 final, 4 July, European Commission, Brussels
Giuntini, R (1996) An introduction to reverse logistics for environmentalmanagement: a new system to support sustainability and profitability, TotalQuality Environmental Management, Spring, pp 81–87
Goodman, A (2000) Implementing sustainability in service operations atScandic Hotels, Interfaces, 30 (3), May/June, pp 202–14
Delivering sustainability � 251

Hewlett-Packard (2005) Design for Environment Programme Description,www.hp.com
Hopfenbeck, W (1993) The Green Management Revolution: Lessons in excellence,Prentice Hall, London
Howie, B (1994) Environmental impacts on logistics, in An International Reviewof Logistics Practice and Issues, ed G Brace, pp 53–55, Logistics TechnologyInternational, London
McIntyre, K (1999) Integrated supply chains and the environment: estab-lishing performance measurement for strategic decision making appli-cation – the case of Xerox Ltd, Engineering doctorate thesis, University ofSurrey, January
McIntyre, K et al (1998) Environmental performance indicators for integratedsupply chains: the case of Xerox Ltd, Supply Chain Management, 3 (3), pp149–56
Preston, L (2001) Sustainability at Hewlett-Packard: from theory to practice,California Management Review, 43 (3), Spring, pp 26–37
Purchasing (2001) Anheuser-Busch ‘greens’ its supply chain for cost savings,Purchasing, 17 May
Scott, A (2001) BASF aligns R&D with sustainable development, ChemicalWeek, 163 (12), March, pp 39–40
Senge, P, Carstedt, G and Porter, P (2001) Innovating our way to the nextindustrial evolution, MIT Sloan Management Review, 42 (2), Winter, pp 24–38
Social Investment Forum (1999), Report on Socially Responsible Investing Trendsin the United States, www.socialinvest.org
Steger, U (1996) Managerial issues in closing the loop, Business Strategy and theEnvironment, 5 (4), December, pp 252–68
Vivian, S (2001) Opportunities from environmental management, Paper givenat the Institution of Highways and Transportation, June, Cambridge
Walker, J and Farnworth, E (2001) Rating organisations: what is their impacton corporate sustainable strategy?, Business Strategy and the Environmentconference, Sept, ERP Environment
Wu, H-J and Dunn, S (1995) Environmentally responsible logistics systems,International Journal of Physical Distribution and Logistics Management, 25 (2),pp 20–38
Zachary, K (2001) Toyota prods suppliers to be green, Ward’s Auto World, 37 (7),July
252 � Global logistics

253
Performancemeasurement
and management in thesupply chain
Alan Braithwaite, LCP Consulting
Introduction
If you cannot measure it, you cannot improve it.(Lord Kelvin, 1824–1907)
The measurement of business performance is deeply grounded in thebackward-looking accounting disciplines of recording profit. As a means toenhance future profits, management now measures and reports on a wide rangeof business performance from customer perception to strategy consistency andadherence. At the operational level of customer service, the supply chain is thekernel of the business. Indeed, the potential from supply chain thinking andpractice is founded in realigning operations through the chain to reduce totalcost and maximize service and return on assets. So measurement is a core disci-pline and capability to provide a framework for defining realignment andreporting progress as to its attainment.
The supply chain is a complex system with many interfaces and dynamicinteractions. It is a significant challenge to define the measures at each point
16

254 � Global logistics
in the chain that are appropriate and consistent with the overall desiredresults. In addition, the desired outcomes in terms of profit, service, stock,assets and costs cannot be managed directly; while there is a general expec-tation that sales growth will drive profits, the connections to stock, serviceand cost are less direct.
Performance management in the supply chain is about setting goals withinand between functions that will lead to the desired results with balance andwithout conflict. Ideally, these goals are then embedded in the fabric of themanagement measurement and reporting of the functions of the firm and itscustomers, suppliers and service providers. Each function is responsible fordelivering its part of the chain to the performance objectives; and whenthings do not work as planned, the requirement is for failures to be identifiedand recovery actions mounted. Learning organizations will take the lessons ofactual performance and the experience of failure and recovery to adjust thegoals across the chain, acting as ‘stewards’ of the supply chain. This stew-ardship role is a key responsibility for supply chain managers, since they oftendo not have functional responsibility for all the chain, albeit they are judgedand rewarded on its overall performance.
There are two requirements of performance measurement in the supplychain: 1) understanding and embedding the value and importance ofmeasurement in a strategic framework for supply chain management; and 2)creating a predictive framework of supply chain risk.
Keeping score – a basic management principle
Revenue is vanity, profit is sanity, and cash is reality.(Anon)
The essence of business is to generate profits and cash from satisfyingcustomers through its investment in assets and capabilities. Compared withinvesting deposits in a bank, investors seek a premium return on investmentthat reflects the additional risk of trading with the assets as compared with therelative safety of the bank. Investors can mitigate risk by holding a number ofinvestments in a portfolio – since some investments will go up while others maygo down. Investors generally cannot run the businesses in which they partici-pate so they appoint management to do this for them. They therefore wantinformation on the financial health – or otherwise – of the business so that theycan make judgements on the management and the prospects of the investment.Banks want the same information in order to assess the viability of makingloans, and governments want information so that they can exact the tax due.
The requirement for compilation and disclosure of performance, in terms offinancial health, is therefore vital for the stakeholders. For quoted companiesthere is an industry of financial analysis that picks over the reported resultsand attempts to forecast the prospects. Accounting standards bodies such as

the Securities and Exchange Commission in the United States and theAccounting Standards Authority in the UK regulate the preparation ofcompany information. The trend has been to require increasing disclosure –not just financially but also in respect of subjects such as equal opportunitiesand environmental compliance achievement.
The importance of trust and integrity in the preparation of financial state-ments has been brought into sharp focus with the exposures of corporatecatastrophe and financial deceit at Enron, WorldCom and Parmalat. The scaleof these cases was unprecedented, but there have always been such cases –with Maxwell Communications and Atlantic Computers being UK examplesfrom the last 20 years. Setting aside these high-profile scandals, there are twomajor difficulties with financial reporting. The first is that even financialreports prepared with absolute integrity can stretch the notion of ‘profit’ tomeet the aspirations of management and option holders, or to defer tax liabil-ities. The second is that reported performance is historical and has beenlikened to driving down a highway steering through the rear-view mirror.
Performance measurement, reporting and management, therefore, need tocome closer to the reality of serving customers and the operational demandsof day-to-day decision making. In the context of both business direction andthe detail of the supply chain, the task of measuring performance unpacksinto many layers of detail; it is a subject in its own right.
The balanced scorecard – the standard for goalsetting and measurement
Since neither historical performance nor company budgets can be assured tobear directly on a business’s long-term strategic objectives, a considerableeffort in the development of models and theories has been dedicated to thisproblem. Amongst these are the Deming Prize (Isixsigma, 2006a), the MalcolmBaldrige Award (Isixsigma, 2006b), the European Foundation of QualityManagement’s business excellence model (EFQM, 2006) and the balancedscorecard (Kaplan and Norton, 1996). In addition, theories such as thelearning organization (Senge, 1990) and knowledge management (Snowden,2000) devote much energy to similar issues. All these models have strengths,depending on the purpose for which they are being used. However, thebalanced scorecard offers a contained and comprehensive approach tostrategic direction and control issues; it is the reference for many corporationsand it fits especially well with supply chain thinking.
A balanced scorecard provides a picture of a business by combining financialmeasures with assessments for customer satisfaction, key internal processesand organizational learning and growth (see Figure 16.1). It requires specificgoals for customers in terms of time, quality, performance, service and cost as
Performance measurement and management � 255

well as relationship, brand and product leadership. The internal perspectiveprovides focus on the core competencies, processes, decisions, and actions thathave the greatest impact on attaining customer satisfaction. The learning andgrowth perspective measures continual improvements to people, systems andprocesses. Sitting above this framework are the financial measures, which areessential for showing whether executives have correctly identified andconstructed their measures in the three preceding areas.
Fundamentally a balanced scorecard should have a balance between outputmeasures (financial and customer) and input measures (performance drivers,such as value proposition, internal processes, learning and growth). Everymeasure selected for a scorecard should be part of a link of cause-and-effect rela-tionships, ending in financial objectives that represent a strategic theme for thebusiness. Kaplan and Norton (1992) outline four key processes that the balancedscorecard relies on to connect short-term activities to long-term objectives:
256 � Global logistics
The balanced scorecard strategy map
Financial perspective:the drivers of shareholder value
Customer perspective:the differentiatingvalue proposition
Internal perspective:how value is createdand sustained
Learning and growthperspective: role forintangible assets –people, systems,climate and culture
Improve shareholder value
Revenue growth strategy Productivity strategy
Value fromnew customersand products
New revenue generation
Increasecompany
value
Improvecost structure
Improveasset utilization
Customer acquisition
Customer satisfaction
Customer retention Market share
Customer profitability Cost per unit Asset utilization
Customer value proposition
Complete customer solutionProduct leadership
Product and service attributes Relationship Image
Price FunctionQuality Service BrandRetentionTime
‘Innovate’
(Processes thatcreate new
products andservices)
‘Increasecustomer
value’(Customer
managementprocesses)
‘Achieveoperationalexcellence’(Operationsand logisticsprocesses)
‘Be a goodneighbour’(Regulatory
andenvironmental
processes)
A motivated and prepared workforce
Strategiccompetencies
Strategictechnologies
Culture andclimate for action
Figure 16.1 Kaplan and Norton’s balanced scorecard framework

1. Translating the vision. Managers are required to translate their vision intoactual measurements linked directly to the people who will realize the vision.
2. Communicating and linking. The scorecard indicates what the organizationis trying to achieve for both shareholders and customers. The high-levelstrategy map is translated into business unit scorecards and eventuallypersonal scorecards so that individuals understand how their personalgoals and performance support the overall strategy.
3. Business planning. Once the performance measures for the four perspec-tives have been agreed, the company identifies the key drivers of thedesired outcome and defines the milestones that mark progress towardsachieving their strategic goal.
4. Feedback and learning. This allows for regular performance reviews toenable continuous improvement of the strategy and its execution.
In summary, the scorecard puts strategy and vision, not control, at the centre.The measures are designed to pull people toward the overall vision. Thismethodology is consistent with the approach of supply chain management byhelping managers overcome traditional functional barriers and ultimatelyleads to improved decision making and problem solving.
Fundamental concepts of supply chain managementand measurement
There are countless definitions of logistics and supply chain management incirculation, with the two terms broadly interchangeable – but there is not aconsistent view of what SCM really is or should be (Cooper, Lambert andPagh, 1997). Generally, SCM transcends firms, functions and business – with aworking definition of ‘A process orientation to managing business in an inte-grated way that transcends the boundaries of firms and functions, leading tocooperation, through-chain business process synchronization, effectiveranging and new product introduction, as well as managing the entirephysical logistics agenda’.
The mechanism by which the network of entities, which together make upthe supply chain, works is through shared information and closely alignedprocesses. The vision for these networks is that they are characterized by highlevels of communication and transparency supported by synchronous opera-tions and performance measurement and management. This brings us to:
� improved customer service experience;� reduced inventories;� lower operating costs; and� improved use of fixed assets.
Performance measurement and management � 257

The ultimate benefit is improvement in a mix of profitability, shareholdervalue and market share – depending on the strategic priorities of the firm. Theimplication is that the potential of supply chain management can transform acompany in terms of its performance; the leverage through the combinationof many small (albeit radical in their conception) improvements in theeconomic structure of a company can be remarkable.
The big idea that sits behind the supply chain concept is a move from functionto process; the principle is that effectiveness of the chain is enhanced dramaticallyby optimizing across functions and through the whole chain compared with theaccumulation of optimized functions. Striking a balance between functional andtotal business is a crucial dimension of SCM, although breaking down the barriersbetween functions to improve supply chain integration is not a substitute forfunctional excellence. Companies need to secure both dimensions – retaining andimproving their competence in all the functions in the supply chain.
Optimizing individual functional performance can prevent theachievement of the most cost- and service-effective supply chain (Braithwaiteand Wilding, 2004). Not only that, but it will also most likely insert furtherundesirable volatility and actually increase cost. Traditional functionalmethods of planning will never lead to breakthrough thinking in supplychain design and, indeed, are a cause of organizational problems. So therequirement is for the corporation to measure the end-to-end cost-to-serve –at least internally, but preferably looking inside both its customers’ and itssuppliers’ operations – to enable a fundamental rebalancing on a holistic basisthat will deliver the required service at the lowest total cost (see Figure 16.2).
Performance measurement and management are a critical component ofthis rebalancing effort and a fundamental part of the supply chain concept.They require balance and overall goal setting. Supply chain performancemeasurement and management are the operational microclimate of thebalanced scorecard of Kaplan and Norton.
258 � Global logistics
Change conditionsof supply
Change customerservice offer
Cost-to-serve®
SupplyManufact-
uringDistri-bution
InventoryLocal
service
Ordermanage-
ment
Source: LCP Consulting
Figure 16.2 Balancing the supply chain

Mastering the complexity of supply chain andlogistics performance management
Supply chain management at this microclimate level is complex in its detail.The biggest challenge in setting up measurement and managementprogrammes is mastering that complexity, to create an internally consistentframework of goals that reflect the true relationships of cause and effect.
Figure 16.3 shows a framework of cost and performance based on structuraldeterminants and management determinants. The idea of structural andmanagement determinants – and the distinction between them – is important.Structural determinants relate to the ‘business we are in’ expressed as productsand customers. Here the choices for management are limited; if you are in thefertilizer or seeds business you have farmers and merchants as customers anddeliver to farms. The characteristics of the product are well defined and the natureof demand is broadly local and national. In contrast, microchip manufacturersoperate on an international scale using airfreight and with billions of dollarsinvested in plant. The fundamental difference in the products is driven homeby the cost per tonne of microchips being more than $500,000, whereas thecost per tonne for fertilizer is typically less than $300.
Performance measurement and management � 259
Figure 16.3 The complexity of supply chain and logistics, viewed throughdeterminants
Logistics performance determinants
Structuraldeterminants
Cost-to-servecomponents
Managementdeterminants
Total costs
Customers
Buying volumeService requirements
Terms of tradeLocations
Delivery frequencySpecial needs
Manufacturing / supply
Location / sourcingFlexibility / unit cost
Marketing
Variety and pricingService commitment
Business process
PlanningExecutionIntegration
Effectiveness
Efficiency and effectivenessHow well it benchmarks
Vs > best in class
Supply chain
Location and numberof nodes
Networking routeingCapacity and investmentFixed and variable costs
Products
Volume and varietyCube / weight
Handling / storageconstraints
Standardmanufacturing cost
Inventory holding
Storage and handling
Transportation anddelivery
Ordering and admin
Systems and control
Inventoryobsolescence

Management determinants reflect the areas where management haschoices to make within the constraints of the nature of the business. There arebig strategy decisions to be made here in relation to sourcing, capacityinvestment and characteristics, marketing positioning and service levels,business process design and operational effectiveness. These choices interactwith each other and the structural determinants to drive the end-to-end costand performance. The scale and degree of interaction across the various areasof cost and performance are multivariate and complex. The challenge thatemerges for performance measurement and management in the supply chainis to define correctly the relationships and key drivers in the context of thechoices that the company has made in its markets. From the definition ofthese relationships arises the precise specification of the measures to be usedand the values to be set as goals for the individual functional managers.
The principle of input and output measures
The definition of cause and effect is important. The nature of the complexity illus-trated in Figure 16.3 is such that the measures of effect are driven by the structureof the business and the key choices and designs that management make.
The implications of this observation are that the ultimate performancemeasures on which the stakeholders judge the business are not open to directaction. For example, we cannot act directly on:
� sales revenue and the economies that go with scale without dealing withthe levels of customer satisfaction that are achieved in terms of inventoryavailability and service turnaround;
� inventory levels in the chain without dealing with processes such as fore-casting accuracy and forecasting frequency and horizon, and inventoryrecord accuracy;
� cost-to-serve by product and customer without having designed thenetwork for sourcing and fulfilment.
These points make the distinction between input and output measures. Ofcourse we need both to see if the actions taken have achieved the desiredresult. But there is limited value in just measuring the outputs without havingfirst identified the cause-and-effect relationships, and the input measures thatare likely to generate the desired change.
Figure 16.4 illustrates a simple example of input and output measures. Theinput measures reflect the major changes that were effected in a company, andthe output measures were the consequences of these actions, and illustrate theshareholder value that was created. The strategic nature of the input measuresis immediately clear, as is the improvement that was attained in this manufac-turing business. All of these improvements were achieved through a long-term
260 � Global logistics

commitment to measurement, stock policy adherence and stewardship,leading to the rebalancing of the company’s supply chain.
Setting goals across the chain through service levelagreements
The question most often asked in relation to performance measurement is‘How should functional goals be set in the chain to secure the potential?’ Andthere is a further series of sub-questions arising from this major question:
� How does a function see its role and contribution to improving the wholesupply chain?
� What levels of visibility should be given, between functions, of the goalsand attainment by others?
� How does a function influence the performance of other members in thechain that can impact its own performance but are out of its direct control?
� Who sets the measures of performance across the chain?
The idea of inter-functional service level agreements (SLAs) is designed toresolve the first three of these questions. SLAs create a framework in whichthe various functions within a company and between organizations – bothcustomers and suppliers – are measured against meaningful objectives thatwill generate overall performance improvement.
The first big idea embedded in such SLAs is that they are not just sequentialbetween players in the physical chain, but also recognize the obligations ofevery member of the team to the others, whether or not they are next in line.
Performance measurement and management � 261
Measure
Input measures
Forecast accuracy Poor
Manufacturing change time 8 hours
New product introduction Months
Logistics structure 3 depots
Sales
Customer service (OTIF) 96%
Stock 12 weeks
Obsolescence High
Distribution costs 14% of turnover
Manufacturing unit cost
Output measures
Start
Improved but less important
15 minutes
Weeks
Single national site
99%
+10%
2 weeks
Minimal
9% of turnover
Reduced by 20%
Finish
Figure 16.4 Input and output measures in a performance improvement case

The second big idea is that SLAs create a team environment; all players knowtheir places in the side, the contribution that they make and the dependenciesthey have with other positions.
Figure 16.5 shows the standard conceptual framework of a sequential chainthat, by this definition of SLAs, is incomplete; it also shows an example matrixof the SLAs that really need to exist. Each box in the SLA framework needs tobe populated with input measures as they reflect the relationship that thefunctions have with each other. The entries are not symmetrical, as the obliga-tions of the functions in the context of the overall goals are not mutual. So, forexample, the relationship between sales and marketing and productionplanning is that sales and marketing must produce a forecast on time and tothe agreed level of accuracy, while production planning’s commitment tosales and marketing is to turn that forecast into available product through thecreation of timely and economic schedules. Equally, manufacturing will havecommitments to the business, including sales and marketing, that relate toadherence to schedule, yield and quality performance; but in return manufac-turing is entitled to expect acceptable levels of demand volatility and schedulestability from sales and marketing and demand planning.
262 � Global logistics
Integrating the chain through SLAs
Supply
Supply Distribution Head office OutletsFrom To
Distribution
Head office
Outlets
� �
SLASLASLA
© Source: LCP Consulting 2005
• Forecast accuracy – orders inside tolerances
• Clear supply contracts with lead times specified
• Collect / receive to schedule with no delays
• Bar-code compliance • Reduced lead times for supply• 99% accuracy on supply within tolerances• Faster promos and new product intros
• Subject to the linked dependencies, head office must invest and deliver to outlets >95% OTIFNIE at a declining cost / case
• Subject to the linked dependencies, distribution must invest and deliver to head office and outlets >95% OTIFNIE at a declining cost / case
• Stream of promotions and new products – launched without failures• Auditable performance management of distribution with visible action on issues
• Stock on hand accuracy
• Order schedule compliance
• Agree cut-off on order changes and delivery schedules
• Product 99+% available on time to quality within forecast tolerance and reduced order lead time• Load collection or deliver in specified time window
• Plus 1 to max plus 2 day outlet order lead time• Actively sponsor delivery schedule changes• Actively collaborate on forecasting and replenishment through GW implant
• Receive deliveries in a prompt manner• Operate to cut-off time on order changes• Support in developing efficient and sustainable schedules
• Contract framework with accurate demand forecasts and tolerances• Visibility and collaboration on promotions and new products
• Bar-code specifications
Figure 16.5 The conventional sequential supply chain relationship and theSLA matrix

It is important to note that the SLAs are entirely about input measures suchas adherence to schedule, quality and lead time. It is changes to thesemeasures and improvements in performance that drive value through thecompany’s supply chain and its output measures of profit and value.
The creation of this matrix, even in the most rudimentary form, and makingit available to the entire business – together with published current perfor-mance and future targets – answer the first two of the sub-questions.
The process of setting up the SLA matrix and populating the targets and theperformance actually achieved is the way that the functions can start toresolve the tensions relating to the impact they may have on each other. Thisis a crucial organizational process – correctly represented at board level – andit is this person (or small team) that sets the matrix in conjunction with thefunctional heads, and then monitors attainment and institutes correctiveaction where necessary. This is the idea of supply chain stewardship. Thesteward holds the total vision for supply chain improvement for the firm andthe individual functional performances that will deliver the result.
The SLA matrix needs to be maintained as a living framework that respondsto external forces, actual performance and continuous learning. This is a full-time organizational role. If supply chain management also has direct func-tional reports, then it will need to isolate the stewardship role within its ownorganization to ensure that balance and impartiality are achieved.
The delivery, recovery and stewardship model
Putting the SLA matrix into action is the process and activity of trackingperformance against targets and identifying opportunities for improvement,not just looking back at past performance. The focus of performancemanagement should be the future: what do you need to be able to do andhow can you do things better?
The delivery, recovery and stewardship (DRS) model is a way of institution-alizing measurement across the business. Figure 16.6 is a simple represen-tation of the DRS model designed to illustrate the cycle of each function,measuring its delivery against its SLA in the matrix and including the costperformance goals. Reports including the identification of failures and theimpact of recovery actions are produced at the functional level and thenconsolidated by the supply chain steward. Recovery is an important activitywith the learning that comes with it. It is critically important for organizationsto recognize and plan for things that go wrong. The stewardship role is to feedback to the functions the impact of overall performance and propose changesto the SLAs, delivery performance and the means of recovery.
The model is consistent with the so-called Shewhart or plan–do–check–act(PDCA) cycle, based on continuous improvement:
Performance measurement and management � 263

1. Business understanding and strategic directions: plan the process.2. Running the operation to try to deliver in line with the plan: do the oper-
ation and record the results.3. Performance reporting against plan and interpretation of results: check by
analysis and reporting of performance according to key business drivers.4. Tactical and strategic realignment: act to initiate improvement efforts
based on the lessons learned from experience. These experiences feed intothe new plan, since PDCA is a cyclical process.
In summary, the DRS model is a way to capture the supply chainimprovement vision for the firm and to record and manage progress to itsattainment. It may seem daunting and potentially complex – and if this is thecase, the key is to start with the simplest possible framework and build from itas the organization learns. In other words, adopt the same principles ofplan–do–check–act to the process of planning and measurement across thechain as are being applied to the chain itself.
The stewardship role as a functionally independent agent in the organi-zation is crucial to the DRS model, and this is a difficult position to define andmaintain in the organization. The person who holds the role will requirevision, interpersonal skills and tenacity. The role needs the highest level ofboard sponsorship, and the results of DRS need to be a standard part of theboard agenda. It is at this point that supply chain management and corporatestrategy meet.
264 � Global logistics
ManufacturerSuppliers
R E T AI L E R
Distribution Retailers
Delivery
Recovery
Delivery
Recovery
Delivery
Recovery
Delivery
Recovery
© Logistics Consulting Partners Ltd 2001 - all rights reserved
SLA SLA SLA
R E T AI L E RR E T AI L E RR E T AI L E R
© Logistics Consulting Partners Ltd 2001 - all rights reserved
Stewardship
Figure 16.6 The delivery, recovery and stewardship (DRS) model

Defining specific metrics across the chain
The input and output measures described earlier are the high-level corporatecause-and-effect metrics for the supply chain. The measures in the SLAs areprimarily about quality, compliance and time. The stewardship role requiresthese measures and adds cost measures to the portfolio. In this section, thespecifics of the measures that can be applied across the supply chain areunpacked and described.
The supply chain and logistics professional and the corporate steward ofthe chain will want to develop an overview of the chain; a useful way to thinkabout this is as a ‘dashboard’ or control panel for the business. This idea isillustrated in Figure 16.7, and many executives find the preparation of suchdiagrams valuable in identifying the performance issues in the chain anddescribing them to their colleagues. Measures may need to reflect bothchanges over time and performance across the product range of bothcustomers and suppliers.
A further important point in relation to this overview is that, while supplychain rebalancing via SLAs will be one of the key drivers for competitiveadvantage, firms must also recognize that an equal and parallel emphasisshould remain on attaining functional excellence. The goals of functionalexcellence, however, will be tempered at the margin through an under-standing that such aims can lead to supply chain sub-optimization; the SLAsare developed over time to eliminate potential conflicts.
Although the measures themselves are generic for most businesses, the precisesituation and issues for each firm will vary based on its competitive situation,
Performance measurement and management � 265
Supplier deliveryperformance
Material stockavailability
On-time delivery
Customer-specificservice levels
Production planvs actual
Finished goodsstock availability
Order fill
Consumeravailability
Supplier FactoryMaterialsinventory
level
Finishedgoods
inventory
Customereg stockist
Enduser
Figure 16.7 Viewing supply chain metrics across the chain

technology and product-market characteristics. It is helpful to think of a hierarchyof measures across the chain in terms of both input and output measures:
� Level 1 measures should provide headline measures for the supply chain,such as orders on time in full with no invoice errors (OTIFNIE) and stockcover set in a balanced way that supports the vision for change.
� Level 2 measures should be used to provide further insight into the resultsof level 1, such as quantity fill percentage, line fill percentage and invoiceaccuracy.
� Finally, level 3 measures should provide diagnostics for use in problemresolution and improvement processes, such as requests for credit, clear-up rate and number of days out of stock by SKU.
Figure 16.8 provides examples of level 1 and 2 performance metrics across atypical retail supply chain.
Figure 16.8 starts to provide insight into the levels of detail that are involvedand can be used to challenge the connections between functions and the realdrivers. So, for example, the figure shows both ‘On time in full’ (OTIF) and‘Order to delivery turnaround time’ (TAT). It is immediately obvious that thelonger the TAT, the higher should be the OTIF – since there is more time to get itright. But at the same time the longer the TAT, the lower should be the inventory,as the more time manufacturing has to respond to actual demand. TAT istherefore an input measure, and it is also one that management may want tochange, as faster service is likely to be more competitive and create increaseddemand. In the same vein, measures of plant, distribution centre and trans-portation efficiency will be influenced by customer order turnaround time,forecast accuracy and plant changeover time – all of which are input measures.
Having decided on the appropriate metrics of performance, it is necessaryto ensure that these individual measures are set in a balanced way to providean overall picture of supply chain performance and support the business inmoving to its goals. Figure 16.9 shows an example of a balanced set ofobjective measures for a fast-moving consumer goods company.
Very high service performance with low levels of stock is secured by quitehigh levels of forecast accuracy, very short manufacturing schedule horizonsand exceptional supplier performance. High levels of accuracy are alsoessential, and the area sacrificed is that of distribution and freight utilization.Setting these measures consistently – having understood the relationships – isthe key to avoiding functional conflicts that can cause sub-optimal perform-ance. Examples of this are:
� Stockholding targets that are set too low will disable customer serviceattainment and reduce the number of orders fulfilled on time in full.
� Freight utilization and cost targets may delay shipments, leading toincreased stock and a negative impact on customer service.
266 � Global logistics

� Manufacturing unit cost goals may drive up stocks and downstream distri-bution costs because of long production runs and infrequent line changes.
With performance metrics established, greater focus can be put on supplychain issues. This also aids in benchmarking by identifying current and bestpractice in companies and their supply chains before using some of the level 3diagnostic metrics to develop an improvement programme.
Performance measurement and management � 267
Figure 16.8 Sample level 1 and 2 metrics containing both input and outputmeasures
Unit costOTIFNIE %Spread of failureLead time ofsupplyFixed and firmschedule horizonFlexibility insidefixed horizon
Suppliers
Suppliers
Manufacturer Distribution Retail distribution Retailers
Plant utilizationOutput vsstandardCost / unit ofmanufacturingOverheadrecovery to plan% time used inchangeoversConformance toplanFixed and firmschedule horizons
Manufacturing
Manufacturer
Forecastaccuracy at +1week, +2 weeks,+ 1 month, +2months +3 monthsBy SKU and familyDemand volatilitycoefficient ofvariationWith and withoutpromotions
Forecasting
Truck utilization %tonnes or cubecarried vs capacity% working timeusedCost / deliveryCost / cu m ortonneDispatch todelivery time
Inbound freight
Full cost per caseFull cost per palletFixed cost / sq mFull cost / labour hrPicks / labour hrLabour utilization%Space utilization %Throughpututilization %Order-to-dispatchtime
Distribution centre
Weeks of coverDays of saleStock turnsOOS lines & %Stock > 26 wksObsolescence /write-offs %Stock accuracy(SKU, quantity andlocation)
Stock
Truck utilization %tonnes or cubecarried vs capacityDeliveries per day% working timeusedCost / deliveryCost / cu m or tonne
Freight
OTIFNIE %Order-to-deliveryTAT daysLine fill %Quantity fill %Order fill accuracy%Invoice errors /credit notes %% to schedule /commitment
Service
?

Two of the biggest barriers to a successful performance measurement andmanagement programme are the compilation of data, and its analysis andinterpretation. Typically this involves hundreds of thousands of transactions,many hundreds of general ledger codes, some thousands of stock-keepingunits, and hundreds of customers and suppliers. All these can be linkedthrough a number of plants and distribution centres.
Measurement and reporting used to be labour-intensive, but developmentsin mass data storage – often referred to as data warehousing – have provideda new platform. Changes in recent years have been revolutionary in terms oflow-cost data storage, easy-to-program queries, and graphical programs torepresent the outputs. Skills and experience in data warehousing are beingaccumulated, and new software environments are being launched to bringdata together from different sources to give an end-to-end picture.
Future directions in performance measurement
The major challenges for performance measurement in the supply chain for thefuture rest in: 1) integrating performance management into the fabric of theorganization to drive supply chain strategy development and implementation;and 2) creating predictive measurement frameworks through which the corpo-ration can identify the levels of risk that are inherent in its supply chains. Both ofthese areas are ‘work in progress’ in terms of the development of a completeunderstanding and operational frameworks through which they can be applied.
The word ‘integration’ is overused in supply chain management, withoutgreat clarity as to its meaning and implications. The LCP strategic crystal hasbeen used successfully to address this question by describing the elements ofan integrated supply chain strategy and showing how they interact to deliverbusiness value in terms of customer satisfaction and economic value-add.Figure 16.10 shows the crystal, with the key elements:
268 � Global logistics
Manufacture95% to plan< 2 weeks’schedulehorizon
Supply99.9% reliableSubstantialflexibility vsforecast
Forecast80% at SKU95% at rangeAt 1 month
Distribution99.9%accuracy85% utilization
Freight75% to 85%utilizationExternalizefixed costs
Inbound100% on time85%utilization
Stock2 weeks or25 turns forwhole chain
Service andaccuracy
99.9%+against perfectorder
Figure 16.9 A sample logistical balanced scorecard

� Business processes – the processes of generating planning and executioninstructions through the chain that, if correctly designed, will increasecustomer service and reduce inventories and capital applied. Business processredesign in supply chain management is focused on the principles of timecompression and simplification. Business processes are crucially dependenton systems, organization and KPIs, three other points in the crystal. Businessprocesses are key input measures and a major part of the SLAs.
� Business systems – the computer information systems that are appliedmust serve the business processes and the organization, support thenetwork and inform the performance measurement environment.
� Network infrastucture – the supply chain network is the key to the costperformance in the chain and is enabled by the processes and systems. Theorganization design must align to the network to enable the lowest-costoperation.
� Performance management framework through consistent and appropriateKPIs is central to an effective supply chain strategy, as we have seen in thischapter. The process of performance management enables the organizationand is dependent on the systems and the processes.
� Organization design is a most under-represented area of supply chainstrategy. An organization that is aligned to the strategy and is served by thesystems, processes and KPIs is central to realizing supply chain value. Asbusinesses move from a functional to a process orientation, the boundariesof traditional functional power are challenged and tensions are exposed.The SLA approach can help resolve these tensions since functional control
Performance measurement and management � 269
customersatisfaction
economicvalue added
businessprocesses
businesssystems
performancemanagementframework (KPIs)
networkinfrastructure
organizationdesign
skills andways of working
Figure 16.10 The strategic supply chain crystal

is not required under that model. However, the stewardship role ismandatory and, as discussed earlier, it must be positioned in the organi-zation with both power and independence.
� Skills and ways of working are the final facet of the crystal and, like organi-zation, are under-represented. The skills and behaviours to move to asupply chain ethic, from function to process, are profoundly differentfrom those that have been trained into management over many years.
Another major challenge in performance management is for boards torecognize the risk that is endemic in their supply chains. Singhal and Hendricks(2000) have shown that supply chain catastrophes are common and that theydestroy shareholder value by an average 20 per cent. With companies’ supplychains being run ever more leanly, there is less room for unexpected errors. Therequirement exists to evaluate the risk in a corporation’s supply; Figure 16.11shows a conceptual model (Braithwaite, 2003).
The underlying principle is that there are external determinants of risk thatrelate to the business environment, and there are internal determinants thatrelate to how the organization is aligned to its external environment. As anexample of how this model works, it should be immediately clear that acompany with a volatile market and supplies on long lead times with extendedplanning, scheduling and manufacturing processes and a poor record ofperformance management is riding for a fall. In contrast, a company operatingin a market where demand is stable and competition well defined can accom-modate longer lead times from suppliers and more rigid internal processes.
270 � Global logistics
Control
Supply
Environmental
Vulnerability
Demand
Mitigation /contingency
Process
Ext
erna
lIn
tern
al
Supply chain vulnerability – understanding the ‘drivers’
Figure 16.11 The supply chain risk honeycomb

Risks external to the corporation can be summarized as follows:
� Demand risk relates to disturbances to the flow of product, information andcash emanating from within the network, between the focal firm and itsmarket. In particular, it relates to the processes, controls, asset and infra-structure dependencies of the organizations downstream.
�� Supply risk is the upstream equivalent of demand risk; it relates to distur-bances to the flow of product or information emanating within thenetwork upstream of the focal firm.
� Environmental risk is the risk associated with external and, from the firm’sperspective, uncontrollable events.
Risks internal to the corporation relate both to how the firm addresses theexternal risks and to its competences to plan and execute its own business:
� Processes are the sequences of value-adding activities undertaken by thefirm. The execution of these processes is dependent on internally ownedor managed assets and on a functioning infrastructure. Process risk relatesto disruptions to these processes.
� Controls are the assumptions, rules, systems and procedures that governhow an organization exerts control over the processes – and in the supplychain they may be order quantities, batch sizes, safety stock policies, etc.Control risk is the risk arising from the application or misapplication ofthese rules.
� Mitigation is a hedge against risk built into the operations and, therefore,the lack of mitigating tactics is a risk in itself. Contingency is the existence ofa prepared plan in the event of a risk being identified.
Conclusion
The potential for improvement through the development of performancemanagement metrics across the supply chain is a key differentiator of changecapability and organizational agility. Firms that develop supply chainmeasurement, as a core business competence associated with strategic objec-tives, will have a strong foundation for defining realignment internally andwith both customers and suppliers.
The combined use of supply chain performance metrics, balanced score-cards, and the delivery, recovery and stewardship framework provides thecapability to report on improvement, understand the factors that are drivenby the change and identify supply chain management best practice.
There are six key points to hold in focus when developing a supply chainperformance management framework:
Performance measurement and management � 271

� No single measure defines supply chain performance – there are manydimensions to measure.
� Measures can be in conflict – accentuating rather than breaking functionaldifferences.
� The need is to obtain balance throughout the supply chain and beprepared to change.
� Measuring the overall performance at input and output levels is a key firststep to making improvements.
� This requires considerable investment of time and commitment.� Measurement and its interpretation are valuable and difficult skills that
organizations should develop and nurture.
Organizations that have persevered with supply chain measurement andmanagement have experienced sustained improvements in businessperformance.
References
Braithwaite, A (2003) Supply chain vulnerability self-assessment workbook,Cranfield School of Management on behalf of the Department for Transport,March, pp 249–59
Braithwaite, A and Wilding, R (2004) Laws of logistics and supply chainmanagement, in The Financial Times Handbook of Management, 3rd edn, edE Crainer and D Dearlove, Pearson, London
Cooper, MC, Lambert, DM and Pagh, JD (1997) Supply chain management:more than a new name for logistics, International Journal of LogisticsManagement, 8 (1), pp 1–4
European Foundation of Quality Management (EFQM) (2006) EuropeanQuality Awards, EFQM, wwwefqm.org
Isixsigma (2006a) The Deming Prize Check List, www.isixsigma.comIsixsigma (2006b) Malcolm Baldrige National Quality Award, www.isixsigma.comKaplan, RS and Norton, DP (1992) The balanced scorecard: measures that
drive performance, Harvard Business Review, January–February 70(1), pp71–79
Kaplan, RS and Norton, DP (1996) Translating Strategy into Action: The balancedscorecard, Harvard Business School Press, Cambridge, MA
Senge, PM (1990) The Fifth Discipline, Doubleday, New YorkSinghal, VR and Hendricks, K (2000) Report on Supply Chain Glitches and
Shareholder Value Destruction, December, Dupree College of Management,Georgia Institute of Technology
Snowden, D (2000) Liberating Knowledge, Institute of Knowledge Management,Toronto
272 � Global logistics
273
Road transportoptimization
Alan McKinnon, Heriot-Watt University
In an ideal world all trucks would run fully laden on every kilometre trav-elled. If this could be achieved the economic and environmental costs of roadfreight movement would be substantially reduced. Large potential benefitscan therefore accrue to individual companies and the wider community frominitiatives that improve the utilization of vehicle capacity.
In this chapter we will examine the various ways in which vehicle utilizationcan be assessed, consider the reasons why so many trucks run empty or onlypartially loaded and outline a series of measures that companies can take toattain higher levels of vehicle fill.
Assessing the utilization of vehicle fleets
Different indices can be used to measure the utilization of vehicle fleets, eachgiving a different impression of transport efficiency.
Tonne-kilometres per vehicle per annumThis index generally presents the trucking industry in a positive light. It isessentially a productivity indicator, measuring the average amount of workdone annually by trucks. In the UK, for instance, it increased fivefold betweenthe early 1950s and late 1990s, mainly as a result of companies taking
17

274 � Global logistics
advantage of increases in maximum truck weight and running their vehiclesfor more hours of the day (see Figure 17.1). This productivity measure,however, takes no account of the proportion of the available carrying capacityactually used during the year. A vehicle with greater capacity could recordhigher productivity despite having inferior utilization (see Table 17.1). Thisimportant difference between productivity and utilization is discussed indetail by Caplice and Sheffi (1994).
Weight-based loading factorThis is generally expressed as the ratio of the actual weight of goods carried tothe maximum weight that could have been carried on a laden trip. When thisratio is plotted through time, a less rosy picture emerges of transport effi-ciency. In the UK, for example, average load factors (for trucks with grossweights over 3.5 tonnes) declined from 63 per cent in 1990 to 57 per cent in2004. This load factor is only a partial measure of vehicle utilization, however.As it is an exclusively weight-based measure it takes no account of the use ofvehicle space/deck area or the proportion of vehicle-kilometres run empty.
Space utilizationMany low-density products fill the available vehicle space (or ‘cube out’) longbefore the maximum permitted weight is reached. In sectors characterized by
Tonn
e-km
s pe
r ve
hicl
e pe
r ye
ar
0
50
100
150
200
250
300
350
400
450
1953 56 59 62 65 68 71 74 77 80 83 86 89 92 95 98 01
Source: Department for Transport, 2005b
Figure 17.1 Increase in truck productivity in the UK 1953–2003

low-density products, weight-based load factors tend to underestimate thetrue level of utilization. Where there are tight limits on the stacking height ofthe product, loading is usually constrained much more by the available deckarea than by the cubic capacity. This deck area, for example, can be coveredwith pallets stacked to a height of 1.5 metres, leaving a metre or more ofwasted space above them.
Very little research has been done on the space utilization of vehicles, andfew attempts made to collect volumetric data on road freight flows. In a studyconducted in the Netherlands and Sweden, Samuelsson and Tilanus (1997)asked a panel of industry experts to estimate the average utilization of trucks,engaged in less-than-truckload deliveries, with reference to a series of space-related indices. This revealed that cube utilization was typically very low ataround 28 per cent. On average, however, just over 80 per cent of deck areawas occupied and 70 per cent of the available pallet positions filled. It wastherefore mainly in the vertical dimension that space was being wasted, withaverage load heights reaching only 47 per cent of the maximum. A survey of53 fleets, comprising roughly 3,500 vehicles, in the UK food supply chain in2002 found that, on loaded trips, an average of 69 per cent of the deck area and76 per cent of the available height was utilized, corresponding to a mean cubeutilization of 52 per cent (McKinnon and Ge, 2004).
Empty runningThe most obvious form of vehicle underutilization is empty running.Typically around a third of vehicle-kilometres are run empty, though thisproportion varies with length of haul, type of vehicle, industrial sector andthe nature of the delivery operation (McKinnon, 1996). Empty runninggenerally occurs when operators are unable to find a return load. Unlikepassengers, who usually return to their starting point, most freight onlytravels in one direction. In some countries, such as the UK, the proportion oftruck-kilometres travelled empty has been declining. In Britain, for example,it fell from 33 per cent in 1980 to 27 per cent in 2004, yielding significanteconomic and environmental benefits. Other things being equal, if the empty
Road transport optimization � 275
Table 17.1 Comparison of vehicle productivity and utilization measures
Gross Max Annual Average Productivity Capacityweight payload distance load (tonne-kms/ kms/utilization
(tonnes) travelled (tonnes) vehicle/year) (actual tonne-km/max tonne-km
32 tonnes 20 100,000 16 1,600,000 80%40 tonnes 26 100,000 18 1,800,000 69%

running percentage had remained at its 1980 level, road haulage costs in 2004would have been £1.2 billion higher and an extra 1 million tonnes of carbondioxide would have been emitted by trucks (McKinnon, 2005).
Factors constraining vehicle utilization
The dominant constraints on vehicle utilization are as follows:
� Demand fluctuations. Variability of demand over daily, weekly, monthly andseasonal cycles is one of the main causes of the underutilization of vehiclecapacity. Vehicles that are acquired with sufficient space or weight toaccommodate peak loads inevitably spend much of their time runningwith excess capacity. Companies subject mainly to seasonal fluctuationscan hire additional vehicles or outsource more of their transport at peakperiods, allowing them to carry a regular base-load of traffic on their ownvehicles during the year. For those exposed to demand volatility on a dailybasis, the efficient management of transport capacity presents a muchgreater challenge. Figure 17.2, for example, shows fluctuations in the dailydemand for trucks imposed on a major distributor of steel products overthe period of a month. The average daily requirement was for 150 vehicles,but on particular days it varied between 96 and 190 vehicles. The companyin question was often only informed at 4 pm on day 1 how many vehicleswould be required for deliveries by noon on day 2. It is clearly very
276 � Global logisticsN
o of
truc
ks r
equi
red
Day of week
60
80
100
120
140
160
180
200
T W TH F M T W TH F M T W TH F M T W TH F M T W
Figure 17.2 Variations in daily demand for trucks from a major steeldistributor
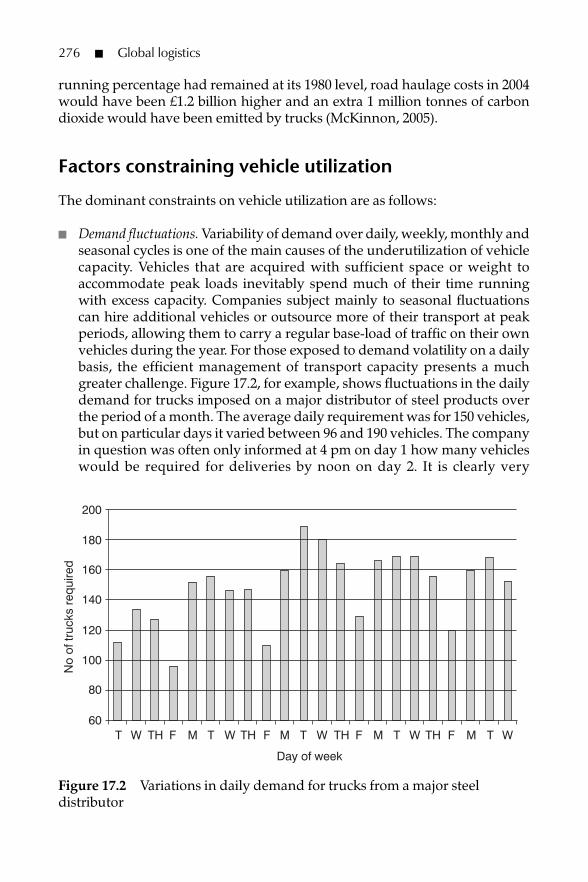
difficult to maintain high load factors across a vehicle fleet subject to thisdegree of demand variability. Such variability is common in industriescharacterized by just-in-time replenishment.
� Just-in-time (JIT) delivery. The replenishment of supplies in smaller quan-tities more frequently within shorter lead times has tended to depressvehicle load factors. Companies have often been prepared to accept lowervehicle utilization and higher transport costs in return for large reductionsin inventory and other productivity benefits resulting from JIT. There is,nevertheless, disagreement in the literature over the extent to which JIT hasimpaired transport efficiency. Simulation modelling work by Swenseth andBuffa (1990), for example, suggested that transport costs were inflated byJIT, whereas Ansari and Heckel (1987) claim that, in practice, they werereduced. By reconfiguring their inbound logistics, companies can mitigatethe adverse effects of JIT on transport efficiency as illustrated by the Nissancar company (Energy Efficiency Best Practice Programme, 1998a).
� Unreliability of delivery schedules. Where schedules are unreliable, transportmanagers are naturally reluctant to arrange backhauls or more complexcollection and delivery routes within which higher degrees of load consol-idation can be achieved. Companies understandably prioritize outbounddistribution to customers and fear that a vehicle engaged in backhaulingmay not be repositioned in time to handle the next delivery. Availablesurvey evidence suggests that the probability of a delivery being delayedcan be relatively high. The 2002 transport KPI survey in the UK foodsupply chain, for instance, found that roughly 29 per cent of the 15,600journey legs monitored were subject to a delay and that these delaysaveraged 45 minutes (McKinnon and Ge, 2004). Just under a third of thesedelays were caused mainly by traffic congestion on the road network.Most of the delays, however, occurred at the reception bays of factories,distribution centres (DCs) and shops, where ‘back-door congestion’increases the average length and variability of loading and off-loadingtimes. In other countries characterized by much longer journey length andtransit times, delays of this magnitude would be unlikely to deter back-loading and consolidation initiatives, particularly as the potential rewardswould be much greater.
� Vehicle size and weight restrictions. As noted above, some loads reach themaximum weight limit before all the space in the vehicle is occupied.Conversely, some low-density loads exhaust the available space before thelegal weight limit is reached. This results in underutilization of the vehiclein terms of either volume or weight.
� Handling requirements. Many companies sacrifice vehicle utilization forhandling efficiency. For example, by using roll-cages rather than woodenpallets supermarket chains can substantially reduce handling times andcosts but at the expense of around 15–20 per cent lower space utilization inshop delivery vehicles.
Road transport optimization � 277

• Incompatibility of vehicles and products. It is clearly not possible to transport areturn load of bulk liquids in a box van or to consolidate part-loads offertilizer and hanging garments. The need for specialist handling and/orrefrigeration and rules governing cross-contamination restrict theproportion of the truck fleet that can be used for particular loads.
• Health and safety regulations. The weight and dimensions of loads are partlyconstrained by health and safety regulations designed to ensure thewelfare of employees.
• Capacity constraints at company premises. Often the size of load isconstrained by the available storage capacity at either the origin or thedestination of the trip – more commonly the latter. Tanks and silos at farmsor factories, for example, may not be able to hold a full truckload, whilemany retailers have compressed back-storeroom areas to maximize thefront-of-shop sales floor. Warehouse racking systems, particularly in thefast-moving consumer goods (FMCG) sector, have a standard slot heightfor pallets of 1.6 metres. This limits pallets to a height significantly belowthe vertical clearance of at least 2.4 metres in most articulated trucks.
• Lack of knowledge of backloading and load consolidation opportunities. Many ofthese opportunities are missed because carriers are simply unaware ofthem. It is hardly surprising, therefore, that roughly half the return loadscarried by road in the UK are generated internally from within the samecompany (Lex Transfleet, 2002). Companies have traditionally relied oninformal methods of finding external backloads, most commonly word ofmouth.
• Poor coordination of the purchasing, sales and logistics functions. Opportunitiesfor backloading are seldom discussed in the context of trade negotiationsbetween companies. Purchasing departments typically regard inbounddelivery as the responsibility of the supplier and fail to explore withlogistics managers possible synergies with the transport operations ofvendor companies. Sales staff, on the other hand, have a habit of makingdelivery commitments to customers that entail transporting part-loadsoften at short notice.
These constraints relate to five general factors: regulatory, market-related,inter-functional, infrastructural and equipment-related. Figure 17.3 maps thelinks between the constraints and the five factors, recognizing that the samefactor can inhibit vehicle utilization in different ways. Physical infrastructure,for example, can affect reliability, the maximum size and weight of the vehicleand storage capacity at the delivery point. Figure 17.3’s network diagramillustrates the underlying complexity of the problem.
One of the most pervasive and influential factors is the inter-functional rela-tionship between transport and other activities such as production,procurement, inventory management, warehousing and sales. Companiesoften quite rationally give these other activities priority over transport
278 � Global logistics

efficiency. For example, inventory savings from JIT replenishment or reduc-tions in handling costs accruing from the use of roll-cages may exceed theadditional cost of running a truck only part-loaded. It can also be economi-cally justifiable to deliver small orders to important customers in an effort tosecure their longer-term loyalty.
Much underutilization of vehicle capacity, however, is not based on carefulanalysis of logistical cost trade-offs and explicit calculations of any relatedsales benefits. It is often unplanned and reflects the relatively low status givento transport within corporate hierarchies dominated by production,marketing and sales. The most that a logistics manager can do is to optimizetransport within the targets and constraints set by other departments(McKinnon, 2003). This may not be in the best interests of the company,however. It would be preferable if the cost of reduced vehicle utilization wereobjectively weighed against the benefits from the other activities that regu-larly impair transport efficiency.
Road transport optimization � 279
Market-related
Demand fluctuations
Lack of knowledge of loading opportunites
Health and safety regulations
Vehicle size and weight restrictions
Unreliable delivery schedules
Just-in-time delivery
Goods handling requirements
Limited capacity at facilities
Incompatibility of vehicles and products
Poor coordination of purchasing, salesand logistics
Regulatory
Inter-functional
Infrastructural
Equipment-related
Figure 17.3 Fivefold classification of the constraints on vehicle utilization

Measures to improve vehicle utilization
This section reviews a series of measures that companies can adopt, individu-ally and in combination, to make better use of vehicle capacity.
Increase return loadingThere are several ways in which companies can increase the level of back-loading:
� Logistical initiatives. There have been numerous examples in recent years ofcompanies introducing initiatives to increase backloading. For example,Britain’s largest supermarket chain, Tesco, has implemented ‘suppliercollection’ and ‘onward delivery’ schemes. In the case of suppliercollection, a returning shop delivery vehicle collects goods from asupplier ’s factory and carries them to the retailer ’s distribution centre.Onward delivery occurs where a supplier’s vehicle offloads goods at theretailer’s distribution centre and backloads with supplies destined for oneof the retailer’s shops. This is delivered on the way back to the factory,usually with minimal deviation from the direct route. Tesco estimated that,over a five-year period, these schemes saved around 4.8 million truck-kilo-metres (Energy Efficiency Best Practice Programme, 1998b). The companyhas since assumed control of most of the primary distribution of suppliesfrom factories to distribution centres by establishing ‘factory gate pricing’arrangements with suppliers. This has enabled it to increase the proportionof inbound supplies collected on a backload basis (Potter et al, 2004).
� Use of freight procurement services. Load matching agencies have existed forseveral decades, providing road hauliers with a ‘clearing house’ service forpotential backloads. They relied on market knowledge, personalnetworking and the telephone to broker deals between shippers andcarriers. With the advent of the internet, a new generation of freightexchanges has emerged, providing web-enabled tendering, online auctionsand bulletin boards for road haulage services (Lewis, 2002). This is makingit easier to match loads with available vehicle capacity across much larger‘communities’ of shippers and carriers on both a short- and a medium-termbasis. Freight exchange websites contain case studies of clients that haveachieved significant reductions in empty running (eg www.freight-traders.co.uk and www.teleroute.co.uk). To date, however, there has beenno systematic assessment of their net effect on empty running.
� Installation of vehicle tracking systems. Advances in IT and telematics arefacilitating the backloading of trucks (Department for Transport, 2003).They allow vehicle schedules and routes to be replanned in real time whilethe vehicle is on the road. Operators are then able to exploit backloadingand load consolidation opportunities that arise at short notice. Also, by
280 � Global logistics

making transport operations more ‘visible’, telematics can give bothshippers and carriers greater confidence in delivery schedules, helping toovercome one of the traditional obstacles to backloading.
� Reverse logistics. An increasing proportion of products is travelling backalong the supply chain for repair, reuse, recycling or remanufacture. Thegrowth in the recovery of waste packaging and life-expired product ispartly the result of government regulations and directives. This is creatingnew opportunities for backloading in some industrial and retail sectors(Anderson, Browne and Allen, 1999).
Statistical evidence that around 30 per cent of truck-kilometres are run emptycan give the impression that there is huge inefficiency in road haulage andenormous potential for increasing backloading. A retrospective analysis ofjust under 9,000 road deliveries in the British food supply chain over a periodof 48 hours, however, revealed relatively few opportunities for backloadingafter allowance was made for a series of operational constraints (McKinnonand Ge, 2006). It may not be possible to extrapolate this result to other sectorsand countries, though it does cast doubt on claims that empty running can bedrastically reduced.
Maximize the available carrying capacityVery few loads simultaneously reach vehicle weight and volume limits. Mostfill out the vehicle space before the weight limit is reached or vice versa.Increasing the weight limit or the physical dimensions of the vehicle can,therefore, result in greater consolidation of loads:
� Maximum vehicle weight. Within the EU, trucks engaged in cross-bordertransport have a weight limit of 40 tonnes. For domestic road haulagewithin member states, weight limits vary from 40 to 60 tonnes. In 2001, theUK government decided to increase the maximum weight of a six-axletruck from 41 to 44 tonnes, following a study that suggested that theresulting consolidation of loads in heavier vehicles could benefit both theeconomy and the environment. An impact study conducted three yearsafter the implementation of this measure confirmed that significantsavings in vehicle-kilometres, cost and emissions have been achieved,with the greatest benefits enjoyed by industrial sectors producing anddistributing dense products, such as coal, drinks, petroleum products andtimber (McKinnon, 2005). Over the past 25 years a series of major studies oftruck size and weight limits has been conducted in the United States(Transportation Research Board, 2002). These have tried to determine theoptimum size and weight, taking account of vehicle operating costs,infrastructural requirements, road safety issues, the effect on generaltraffic flow and a range of other factors.
Road transport optimization � 281

� Vehicle size and design. It is generally acknowledged that the averagedensity and ‘stackability’ of freight are declining. The box at the end of thissection lists the major reasons for these trends. This is partly reflected inthe increasing use of taller 9-foot 6-inch containers in deep-sea containeroperations and of drawbar-trailer combinations in European road haulage.Truck dimensions are constrained by the geometry of road layouts, bridgeheights and loading bays and by the height of bridges and tunnels. Wherethe transport infrastructure permits an increase in vehicle height, theinsertion of an extra deck can allow firms to make more effective use ofvehicle space. In the UK, where most roads have height clearances of 5metres (mainly to accommodate double-deck buses), there are severalthousand high-cube trailers, most of which have a second deck(McKinnon and Campbell, 1997). One major UK retailer demonstrated thebenefits of double-decking by comparing operating parameters for deliv-eries using a double-deck vehicle and two single-deck vehicles withsimilar capacity. Unit delivery costs, vehicle-kilometres and carbon dioxideemissions were all around 48 per cent lower (Department for Transport,2005a).
Vehicles can be redesigned in other ways to permit greater load consoli-dation. The compartmentalization of trucks has enabled grocery retailersand their contractors to combine the movement of products at differenttemperatures on a single journey. This form of ‘composite distribution’, forexample, enabled the UK retailer Safeway to reduce the average number ofvehicle trips required to deliver 1,000 cases from five in 1985 to one in 1995(FTA, 1995).
It is also possible to increase the maximum carrying capacity of a truckwithin legal restrictions on gross weight, by reducing the weight of the emptyvehicle (or ‘tare’ weight). Use of lighter materials and fittings can substantiallycut the tare weight. For example, a survey of trucking operations in Germanyrevealed that the average empty weight of trucks with a maximum 40-tonnegross weight was 14 tonnes, but the minimum only 11 tonnes (Leonardi andBaumgartner, 2004). The main performance indicator used in this study, the‘efficiency of vehicle usage’ (E), made allowance for differences in the vehicletare weights:
E = tonne-kilometres / (vehicle tare weight + load weight) × distance travelled
If the lightest truck were used and fully laden, a theoretically optimal E valueof 0.725 could be achieved. The best-practice operator in the survey had anaverage E value of 0.56, while across the entire sample the mean value wasonly 0.36. There was therefore considerable scope for efficiency improvement,with much of the potential gain coming from the use of lighter vehicles.
282 � Global logistics

Use more space-efficient handling systems and packagingThe efficiency with which the cubic capacity of a vehicle is used partlydepends on the nature of the packaging and handling equipment.Companies must reconcile the desire to maximize vehicle fill with the need toprotect products from damage in transit and to minimize handling costs. Thefollowing examples illustrate the effects that handling and packaging changescan have on the transport operation:
� Choice of loading method. A large mail-order company managed to improvevehicle cube utilization and cut vehicle-kilometres by 6 per cent by loadingparcels loose rather than in bags.
� Pallet dimensions. It has been estimated that standardizing on a more effi-cient size and shape of pallet in the European grocery supply chain couldcut transport costs by the equivalent of 0.25 per cent of sales revenue (ATKearney, 1997).
� Stacking height. It was estimated in 1997 that if pallet-loads made full use ofthe ‘vehicle inner heights’, the European grocery distribution system
Road transport optimization � 283
Reasons for the declining density and ‘stackability’ of roadfreight
• Change in the nature of the products. Many consumer products havebecome lighter through time, as plastic and other synthetic materialshave increasingly replaced metal, wood and leather.
• Increase in packaging. As packaging is relatively light, increases in theratio of packaging volume to product volume reduce the average densityof freight consignments.
• Greater use of unitized handling equipment. This handling equipmenttakes up space in the vehicle and reduces the average weight/volumeratio for the overall payload.
• Declining rigidity. In some sectors the increasing fragility of the productand weakening of packaging material are limiting the height to which itcan be stacked. In the food and drink industry, for instance, cans havebecome thinner, and rigid cardboard, plastic or even wooden boxesbeen replaced by cardboard trays, which offer little vertical support.
• Order picking of palletized loads at an earlier stage in the supply chain.The mixed pallet-loads that this produces tend to be lower, have anirregular profile and offer less opportunity for stacking.
• Tightening health and safety regulations. These regulations have restrictedthe height to which pallets can be stacked to minimize the risk of injuryto operatives during loading and unloading.

would have required 15 per cent fewer trucks (AT Kearney, 1997). Oftenthe maximum height of these loads, however, is constrained by the slotheight in warehouse racking systems (typically 1.7 metres), while articu-lated trailers commonly have internal heights of 2.4 metres.
� Modular loads. A French food manufacturer was able to improve vehicle fillby 35–41 per cent by packing orders into modules of varying heights(University of St Gallen, 2000).
� Shape and dimensions of product packaging. If cans of food were square, ratherthan round, space utilization in vehicles, warehouses and shop shelvescould be raised by 20 per cent (Buckley and Hoyle, 2005).
Employ computer-based planning toolsA wide range of software tools is available to help companies optimize theuse of vehicle capacity. Over the past quarter-century, computerized vehiclerouteing and scheduling (CVRS) software has vastly improved in terms offunctionality, flexibility, applicability, user-friendliness and the efficiency ofthe solutions it yields. While the quality of the product has dramaticallyimproved, the real cost of the software and associated hardware has sharplydeclined. CVRS helps companies to optimize the use of vehicle assets withrespect to various metrics, including distance travelled, driving time, vehicleloading and cost. It is difficult to estimate the average gain in transport effi-ciency from the use of CVRS, as this depends on the complexity and vari-ability of the delivery operation and the performance attained by theprevious system of manual route and load planning. Transport cost savingsof 10–15 per cent are not atypical, however (Department for Transport,2003).
Over the past six to eight years, a new generation of higher-level modellingtools has been developed to optimize freight transport networks (rather thanthe multiple-drop delivery rounds to which CVRS packages are normallyapplied). Particular demand for such packages has come from large retailersthat have integrated their systems of primary (factory to DC) and secondary(DC to shop) distribution and are trying to maximize truck utilization acrossthe entire network. This has presented a formidable analytical challenge.Currently available packages perform reasonably well, though the devel-opment of new software tools incorporating genetic algorithms should yieldeven more efficient solutions.
Adopt more transport-efficient order cyclesThe nature of the order-fulfilment process can have a significant impact onthe efficiency of the transport operation. There are ways in which this processcan be modified to allow firms to increase the degree of load consolidationand hence improve transport efficiency:
284 � Global logistics

� Nominated day delivery system (NDDS). Firms operating this system achievemuch higher levels of transport efficiency by encouraging customers toadhere to an ordering and delivery timetable. Customers are informedthat a vehicle will be visiting their area on a ‘nominated’ day and that, toreceive a delivery on that day, they must submit their order a certainperiod in advance. The advertised order lead time is thus conditional onthe customer complying with the order schedule. By concentrating deliv-eries in particular areas on particular days, suppliers can achieve higherlevels of load consolidation, drop density and vehicle utilization. Somesales managers oppose this system, however, on the grounds that it willweaken their company’s competitive position and probably result in saleslosses in excess of the transport cost savings. The experience of many of thebusinesses that have applied NDDS contradicts this view.
� Abandoning the monthly payment cycle. Many companies invoice theircustomers at the end of each month, giving them an incentive to order atthe start of the month and thereby obtain a longer period of interest-freecredit. This can induce wide monthly fluctuations in freight traffic levels,making it difficult for firms to manage their vehicle capacity efficiently. Byrelaxing the monthly payment cycle and moving to a system of ‘rollingcredit’, where customers are still granted the same payment terms butfrom the date of the order rather than the start of the month, supplierscould significantly improve the average utilization of logistics assets. This,however, ‘would require a fundamental change in corporate culture and arelaxation of long-established traditions in sales and finance departments’(McKinnon, 2004).
Collaborate with other users and providers of transportservicesThere is a limit to how much any individual company can do to improve theutilization of vehicle capacity. To reach high levels of utilization it is oftennecessary to collaborate with other companies. This collaboration can be intwo dimensions – horizontal and vertical.
Horizontal collaboration
This occurs where companies at the same level in a supply chain combinetheir freight transport demands to increase average consignment size orcreate additional backloading opportunities. The need for such collaborationis well illustrated by an analysis undertaken by a large British FMCG manu-facturer. It was concerned about the effects of JIT pressures in the retail supplychain on the efficiency of delivery operations. The company estimated that tobe able to provide daily delivery of full truckloads to a retailer’s distributioncentre it would need to supply the DC with approximately 750,000 cases
Road transport optimization � 285

annually. As Britain’s main supermarket and grocery wholesale chains have atotal of roughly 70 distribution centres, this would require an annual distri-bution throughput of approximately 50 million cases. Only a small group ofvery large FMCG manufacturers have annual sales volumes as large as this. Tomaintain full load deliveries on a daily basis, other manufacturers would haveto combine their loads.
Several mechanisms exist for integrating different companies’ deliveryoperations. Firms can merge their logistics operations at a shared distributionfacility. For example, Unilever and Kimberly-Clark channel products for theDutch retail market through a distribution centre in Raamsdonksveeroperated for them by a logistics service provider (LSP). As a result of thiscollaboration the companies have been able to cut their logistics costs by 12–15per cent while responding to retailers’ demands for faster and more frequentdelivery. Many LSPs now operate ‘primary consolidation centres’ at whichmanufacturers can consolidate their orders for onward delivery to retailers’distribution centres in full loads. It has been estimated that the number of‘shared supplier consolidation centres’ in the UK grocery supply chainincreased from 11 in 1998 to over 100 in 2003 (Potter et al, 2003). Multi-company load consolidation also occurs at the secondary distribution level(between distribution centre and shop). Exel, for instance, operates a retailconsolidation centre for shops located at Heathrow Airport. It was estimatedthat when fully implemented this retail consolidation scheme would cut thenumber of shop delivery vehicles visiting the terminal by 75 per cent and raisevehicle load factors 90 per cent (Energy Efficiency Best Practice Programme,2002).
To take advantage of horizontal collaboration, many companies mustchange the basis on which they outsource their transport. During the 1980sand 1990s, there was a sharp increase in the proportion of trucking servicesprovided on a dedicated basis for individual clients. Dedication denies carriersthe opportunity to perform their traditional ‘groupage’ role and, as a result,carries a vehicle utilization penalty. Many users of dedicated services havenow granted LSPs the freedom to carry other firms’ traffic in their vehicles.Several company-sponsored studies in the UK of the potential benefits ofshared-user services in the automotive, consumer electrical and clothingsectors, in each case replacing four or five separate dedicated services, haveindicated that this can reduce truck-kilometres by around 20 per cent.
Vertical collaboration
This involves collective action by trading partners at different levels in asupply chain, often with the assistance of LSPs. It can help to ease the firsttwo constraints on vehicle utilization listed earlier, namely demand fluctua-tions and JIT pressures. In the United States, the term ‘collaborative trans-portation management’ (CTM) has been used to describe a formal initiative
286 � Global logistics

to encourage collaboration and the sharing of information between manu-facturers, retailers and carriers to cut transport costs while improvingservice quality (Murphy, 2003). This is an extension of collaborativeplanning, forecasting and replenishment (CPFR), which has focused on themanagement of inventory across the supply chain. Key features of CTM arethe sharing of demand information with carriers and the closer involvementof carriers in the replenishment process. As Browning and White (2000)explain, ‘CTM… re-engineers the whole process so that the carrier is nowpart of the larger, more focused buyer/seller team.’ By giving carriers an‘extended planning horizon’ some have been able to increase the utilizationof their regional truck fleets in the United States by between 10 and 42 percent, mainly as a result of improved backloading (Esper and Williams, 2003).
Another initiative relating to the management of product flow through thevertical channel is vendor-managed inventory (VMI). This gives supplierscontrol over the replenishment process, enabling them to phase themovement of products in a way that makes more efficient use of vehiclecapacity. Simulation modelling has been used to demonstrate the potentialtransport benefits of VMI over a ‘traditional supply chain’ (Disney, Potter andGardner, 2003). Sometimes it is also necessary to increase storage capacity atthe customer ’s premises to accommodate the delivery of supplies in fulltruckloads. This applies particularly to the movement of bulk commodities inprocess industries.
Conclusion
‘Transport optimization’ is the term now being widely used in business circlesto describe efforts to maximize vehicle utilization. It is partly a reaction to theJIT trend that has swept through manufacturing and retailing over the pastquarter-century. In the headlong rush to cut inventory, many companies wereprepared to sacrifice transport efficiency. Now that low-inventory strategiesare firmly in place, attention is shifting to freight transport operations to seewhat can be done to improve their efficiency. This is being reinforced bymounting concern about fuel costs, driver shortages, traffic congestion andthe environmental impact of logistical activity, particularly on climate change.
Transport will inevitably be optimized within a range of constraints. Thischapter has examined these constraints and the series of measures thatcompanies can take to ease or overcome them. If properly implemented, thesemeasures can yield a combination of economic and environmental benefitsand help to make logistics more sustainable in the longer term.
Road transport optimization � 287

References
Anderson, S, Browne, M and Allen, J (1999) Logistical implications of the UKpackaging waste regulations, International Journal of Logistics: Research andapplications, 2 (2), pp 129–45
Ansari, A and Heckel, J (1987) JIT purchasing: impact on freight and inventorycosts, Journal of Purchasing and Materials Management, 23 (2), pp 24–28
AT Kearney (1997) The Efficient Unit Loads Report, ECR Europe, BrusselsBrowning, B and White, B (2000) Collaborative Transportation Management:
A proposal, White Paper, Logility, Atlanta, GABuckley, C and Hoyle, B (2005) Is this really the shape of tins to come?, Times,
30 MarchCaplice, C and Sheffi, Y (1994) A review and evaluation of logistics metrics,
International Journal of Logistics Management, 5 (2), pp 11–28Department for Transport (2003) Telematics Guide, Good Practice Guide 341,
Stationery Office, LondonDepartment for Transport (2005a) Focus on Double Decks, Transport Energy
Best Practice report, Stationery Office, LondonDepartment for Transport (2005b) Transport Statistics Great Britain, Stationery
Office, LondonDisney, S, Potter, A and Gardner, B (2003) The impact of VMI on transport
operations, Transportation Research, part E: Logistics and transportation, 39, pp363–80
Energy Efficiency Best Practice Programme (1998a) Efficient JIT Supply ChainManagement: Nissan Motor Manufacturing (UK) Ltd, Good Practice CaseStudy 374, AEA Technology Environment, Harwell
Energy Efficiency Best Practice Programme (1998b) Energy Savings fromIntegrated Logistics Management: Tesco plc, Good Practice Case Study 364,AEA Technology Environment, Harwell
Energy Efficiency Best Practice Programme (2002) Heathrow Airport RetailConsolidation Centre, Good Practice Case Study 402, AEA TechnologyEnvironment, Harwell
Esper, TL and Williams, LR (2003) ‘The value of collaborative transportationmanagement (CTM): its relationship to CPFR and information technology,Transportation Journal, 42 (4), Summer, pp 55–66
Freight Transport Association (FTA) (1995) JIT: time sensitive distribution,Freight Matters, 1/95, FTA, Tunbridge Wells
Leonardi, J and Baumgartner, M (2004) CO2 efficiency in road freight trans-portation: status quo, measures and potential, Transportation Research, partD, 9, pp 451–64
Lewis, CN (2002) Freight exchanges: how are the survivors faring?, e.logisticsmagazine, 16
Lex Transfleet (2002) The Lex Transfleet Report on Freight Transport 2002, LexTransfleet, Coventry
288 � Global logistics

McKinnon, AC (1996) The empty running and return loading of road goodsvehicles, Transport Logistics, 1 (1), pp 1–19
McKinnon, AC (2003) Influencing company logistics management, in Managingthe Fundamental Drivers of Transport Demand, European Conference of Ministersof Transport, pp 60–74, OECD, Paris
McKinnon, AC (2004) Supply Chain Excellence in the European Chemical Industry,European Petrochemical Association, Brussels
McKinnon, AC (2005) The economic and environmental benefits of increasingmaximum truck weight: the British experience, Transportation Research, partD, 10 (1), pp 77–95
McKinnon, AC and Campbell, J (1997) Opportunities for Consolidating Volume-Constrained Loads in Double-Deck and High-Cube Vehicles, Christian SalvesenLogistics Research Paper no 1, School of Management, Heriot-WattUniversity, available at http://www.sml.hw.ac.uk/logistics/s1.html
McKinnon, AC and Ge, Y (2004) Use of a synchronised vehicle audit todetermine opportunities for improving transport efficiency in a supply chain,International Journal of Logistics: Research and applications, 7 (3), pp 219–38
McKinnon, AC and Ge, Y (2006) The potential for reducing empty running bytrucks: a retrospective analysis, International Journal of Physical Distributionand Logistics Management, 36 (forthcoming)
Murphy, J (2003) CTM: collaborating to weed out transportation inefficiency,Global Logistics and Supply Chain Strategies, November
Potter, A et al (2004) Modelling the impact of factory gate pricing on transportand logistics, in Transport in Supply Chains, ed C Lalwani et al, Cardiff BusinessSchool, Cardiff
Potter, M et al (2003) ECR UK Transport Optimisation: Sharing best practices indistribution management, Institute of Grocery Distribution, Letchmore Heath
Samuelsson, A and Tilanus, B (1997) A framework efficiency model for goodstransportation, with an application to regional less-than-truckload distri-bution, Transport Logistics, 1 (2), pp 139–51
Swenseth, SR and Buffa, FP (1990) Just-in-time: some effects on the logisticsfunction, International Journal of Logistics Management, 1 (2), pp 25–34
Transportation Research Board (2002) Regulation of Weights, Lengths and Widthsof Commercial Motor Vehicles, Special Report 267, Transportation ResearchBoard, Washington, DC
University of St Gallen (2000) The Transport Optimisation Report, ECR Europe,Brussels
Road transport optimization � 289

290
Retail logistics
John Fernie, Heriot-Watt University
The principles behind logistics and supply chain management are not new,but it is only in the last 10 to 15 years that logistics has achieved prominence incompanies’ boardrooms. This is primarily because of the impact that theapplication of supply chain techniques can have on a company’s competitiveposition and profitability. Retailers have been in the forefront of applyingbest-practice principles to their businesses, with UK grocery retailers beingacknowledged as innovators in logistics management. This chapter discusses:
� the evolution of the logistics concept;� QR/ECR and managing supply chain relationships;� the application of supply chain concepts in different international
markets;� future trends, including the impact of e-commerce upon logistics networks.
The evolution of the logistics concept
The starting point for any discussion of logistics invariably centres aroundDrucker ’s (1962) description of ‘the economy’s dark continent’, whichsuggested that distribution was one of the last frontiers of business to be‘discovered’. He noted that distribution was viewed as a low-status activity bymanagers, yet major cost savings could be achieved by managing this functionmore effectively. His ideas stimulated much debate, and most of the earlyresearch emanated from the United States as techniques developed in thecontext of military logistics began to gain acceptance in the commercial sector.
18

By the 1970s and 1980s, the supply chain was still viewed as a series ofdisparate functions – with materials management dealing with the ‘back end’ ofthe supply chain and physical distribution management focusing upon theflow of product from manufacturers to their customers (retailers and whole-salers). As a result, the literature on the subject has developed along two distinctroutes: one pertaining to industrial and the other to consumer markets. Thematerials management literature has its roots in the management strategies ofthe Japanese and the application of total quality management, just-in-time (JIT)production and supplier associations. More recently, the ‘Europeanization’ ofthe concepts includes ‘lean supply’ and ‘network sourcing’.
The ‘front end’ of the supply chain achieved greater prominence from the1970s, initially as physical distribution management (PDM) but more recentlyas supply chain/logistics management. Initial work focused upon manufac-turers’ distribution systems, but as retailers centralized their distribution andbegan to exert control over the retail supply chain, most research focusedupon retailers’ logistics strategies. In both industrial and retail logisticsresearch, the emphasis since the 1990s has been on viewing the supply chainas an integrated whole rather than a series of disparate parts. There is no pointin taking cost out of one part of the supply chain, only to add costs some-where else in the chain!
In the context of retail logistics, several authors have sought to explain thetransformation of logistics practices since the 1970s. McKinnon (1996) iden-tified six trends to account for this:
� retailers increasing their control over secondary distribution (warehouseto shop) – in the UK this process is complete in most sectors;
� restructuring of retailers’ logistical systems through the development of‘composite distribution’ and centralization of certain commodities intoparticular supply chain streams;
� adoption of quick response techniques to reduce lead times through theimplementation of information technology, especially electronic datainterchange (EDI), electronic point of sales (EPOS) and sales-basedordering (SBO);
� rationalization of primary distribution (factory to warehouse) and attemptsto integrate this and secondary distribution into a single ‘network system’;
� introduction of supply chain management and efficient consumerresponse (ECR);
� increasing return flow of packaging material and handling equipment forrecycle or reuse.
Fernie, Pfab and Marchant (2000) have built upon the work of Whiteoak, whocharted the evolution of UK grocery distribution from the 1970s to the early1990s, and identify four stages:
Retail logistics � 291

1. supplier control (pre-1980);2. centralization (1981–89);3. just-in-time (1990–95);4. relationship (1995 onwards).
The first stage, supplier control, is widespread in many countries today, andwas the dominant method of distribution to UK stores in the 1960s and 1970s.Suppliers manufactured and stored products at the factory or numerouswarehouses throughout the country. Direct store deliveries (DSDs) weremade on an infrequent basis (7 to 10 days), often by third-party contractorsthat consolidated products from a range of factories. Store managers nego-tiated with suppliers and kept this stock in ‘the back room’.
The second stage, centralization, is now becoming a feature of retaillogistics in many countries and was prominent in the UK in the 1980s. Thegrocery retailers took the initiative at this time in constructing large, purpose-built regional distribution centres (RDCs) to consolidate products fromsuppliers for onward delivery to stores. This stage marked the beginning of ashift from supplier to retailer control of the supply chain, with clear advan-tages for retailers:
� reduced inventories;� lead times at stores reduced from weeks to days;� ‘back-room’ areas released for selling space;� greater product availability;� ‘bulk discounts’ from suppliers;� fewer invoices and lower administrative costs;� better utilization of staff in stores.
Centralization, however, required much capital investment in RDCs, vehicles,material handling equipment and human resources. Centralization of distri-bution also meant centralization of buying, with store managers losingautonomy as new headquarter functions were created to manage this change.This period also witnessed a boom in the third-party contract market, asretailers considered whether to invest in other parts of the retail businessrather than logistics. All of the UK’s ‘big four’ grocery retailers – Sainsbury,Tesco, Asda and Safeway – contracted out many RDCs to logistics serviceproviders in the mid- to late 1980s.
In stage 3, the just-in-time phase, major efficiency improvementswere achieved as refinements to the initial networks were implemented. Thelarger grocery chains focused upon product-specific RDCs, with mosttemperature-controlled products being channelled through a large number ofsmall warehouses operated by third-party contractors. By the early 1990s,temperature-controlled products were subsumed within a network ofcomposite distribution centres developed by superstore operators.
292 � Global logistics

Composites allowed products of all temperature ranges to be distributedthrough one system of multi-temperature warehouses and vehicles. Thisallowed retailers to reduce stock in store as delivery frequency increased.Furthermore, a more streamlined system not only improved efficiency butreduced waste in short-shelf-life products, giving a better-quality offer to thecustomer.
Initial projects were also established to integrate primary with secondarydistribution. When Safeway opened its composite in 1989 at Bellshill inStrathclyde, it included a resource recovery centre that washed returnabletrays and baled cardboard from its stores. It also established a suppliercollection programme, which saved the company millions of pounds duringthe 1990s. Most secondary networks were established to provide stores withhigh customer service levels; however, vehicle utilization on return trips tothe RDC were invariably poor, and it was efforts to reduce this empty runningthat led to initiatives such as return trips with suppliers’ products to the RDC,or equipment or recycling waste from stores.
Although improvements to the initial networks were being implemented,RDCs continued to carry two weeks or more of stock of non-perishableproducts. To improve inventory levels and move to a just-in-time system,retailers began to request more frequent deliveries from their suppliers insmaller order quantities. Whiteoak, who represented Mars and thereforesuppliers’ interests, wrote in 1993 that these initiatives gave clear benefits toretailers at the expense of increased costs to suppliers. In response to thesechanges, consolidation centres have been created upstream from RDCs toenable suppliers to improve vehicle utilization from the factory.
The final stage, the relationship stage, is ongoing but is crucial if furthercosts are going to be taken out of the supply chain. In the earlier, third, stage,Whiteoak had noted that the transition from a supplier- to a retail-controllednetwork had given cost savings to both suppliers and retailers until the just-in-time phase in the early 1990s. By the mid-1990s, retailers had begun toappreciate that there were no more ‘quick wins’ to improve margins. Ifanother step change in managing retail logistics was to occur, it had to berealized through supply chain cooperation.
ECR initiatives launched throughout the 1990s have done much to promotethe spirit of collaboration. Organizations are having to change to accom-modate and embrace ECR and to dispel inherent rivalries that have built upover decades of confrontation. The UK has been in the vanguard of imple-menting ECR, with Tesco and Sainsbury claiming to have saved hundreds ofmillions of pounds. The key to the relative success of UK companies has beentheir willingness to share EPOS data with their suppliers through internet-based information exchanges.
Retail logistics � 293

Logistics and competitive strategy in retailing
Many of the current ideas on supply chain management and competitiveadvantage have their roots in the work of Porter (1985), who introduced theconcept of the value chain in relation to competitive advantage. These ideashave been further developed by academics such as Christopher (1997). Nowwe have a supply chain model (Figure 18.1) where each stage of the chainadds value to the product through manufacturing, branding, packaging,display at the store and so on. At the same time, at each stage cost is added interms of production, branding and overall logistics costs. The trick forcompanies is to manage this chain to create value for the customer at anacceptable cost.
According to Christopher there are three dimensions to time-based compe-tition that must be managed effectively if an organization is going to beresponsive to market changes:
� time to market: the speed of bringing a business opportunity to market;� time to serve: the speed of meeting a customer’s order;� time to react: the speed of adjusting output to volatile responses in demand.
He uses these principles to develop strategies for lead-time management. Heargues that, if the lead times of the integrated web of suppliers necessaryto manufacture a product are understood, a ‘pipeline map’ can be drawn torepresent each stage in the supply chain process from raw materials tocustomer. In these maps it is useful to differentiate between value-addingtime (manufacture, assembly, in-transit, etc) and non-value-adding time(when nothing is happening, but products and materials are standing asinventory).
It was in fashion markets that time-based competition had most signifi-cance, because of the short time window for changing styles. In addition, theprominent trend in the last 20 years has been to source products offshore,
294 � Global logistics
Supplier’svalue chain
Inboundlogistics
Outboundlogistics
Customer’svalue chain
Operations Branding
Figure 18.1 The extended value chain

usually in low-cost Pacific Rim nations, which lengthened the physical supplychains. These factors combined to illustrate the trade-offs that have to bemade in supply chain management and the need to develop closer workingrelationships with supply chain partners. Christopher has used the exampleof The Limited in the United States to illustrate his accelerating ‘time tomarket’. The company revolutionized the apparel supply chain philosophy inthe United States by designing, ordering and receiving products from South-East Asia to stores in a matter of weeks rather than the months of itscompetitors. New lines were test-marketed in trial stores, and orders commu-nicated by EDI to suppliers, which used CAD/CAM technology in modifyingdesigns. The products, already labelled and priced, were consolidated inHong Kong, where chartered 747s air-freighted the goods to Columbus, Ohio,for onward dispatch to stores. The higher freight costs were easily compen-sated for by lower markdowns and higher inventory turns per annum.
Quick responseThe term ‘quick response’ (QR) was coined in the United States in 1985(Fernie, 1994; Hines, 2001) when Kurt Salmon Associates (KSA) recognizeddeficiencies in the fashion supply chain. According to KSA, only 11 weeks outof the 66-week lead time were spent on value-adding processes, and the restwere wasted in the form of WIP and finished inventories at various stages ofthe complex system (Christopher, 1997, 1998; KSA, 1997; Christopher andPeck, 2003). The resultant losses arising from this were estimated at $25 billion– due to stocking too large an inventory of unwanted items and too small aninventory of the fast movers.
In response to this situation, the US textiles, apparel and retail industriesformed the Voluntary Interindustry Commerce Standards Association (VICS)in 1986 as their joint effort to streamline the supply chain and make a signifi-cant contribution in getting the in-vogue style at the right time in the rightplace (Fernie, 1994, 1998) with increased variety (Lowson, 1998; Lowson, Kingand Hunter, 1999; Giunipero et al, 2001) and inexpensive prices. This is doneby applying an industry standard for information technologies (eg bar code,EDI, shipping container marking, roll ID, etc) and contractual proceduresamong the supply chain members (Ko, Kincade and Brown, 2000). QR adoptsan IT-driven systematic approach (Hunter, 1990; Forza and Vinelli, 1996, 1997,2000; Riddle et al, 1999) to achieve supply chain efficiency from raw materialsto retail stores – and each member of the supply chain shares the risks and thebenefits of the partnership on an equal basis to realize the philosophy of ‘thewhole is stronger than the parts’.
QR, in principle, requires the traditional buyer–supplier relationship,which is too often motivated by opportunism, to transform into a more collab-orative partnership. In this QR partnership, the objectives of the vendor are todevelop the customer’s business. The benefit to the vendor is the likelihood
Retail logistics � 295

that it will be treated as a preferred supplier. At the same time, the costs ofserving that customer should be lower as a result of a greater sharing of infor-mation, integrated logistics systems and so on (Christopher and Jüttner, 2000).
The last, and perhaps one of the most important, of the tenets of the originalproposition of the QR concept sees it as a survival strategy of the domesticmanufacturing sector in the advanced economies against competition fromlow-cost imports (Finnie, 1992; MITI, 1993, 1995, 1999; METI, 2002).
With the basic fashion category, relatively steady demand is a feature of themarket; therefore the US-born QR concept places much focus on the rela-tionship between retailers and the apparel manufacturers. The eventualbenefits to both parties are detailed in Table 18.1. Giunipero et al (2001)summarize the hierarchical process of QR adoption (Table 18.2). This model –most appropriate for the apparel–retail linkage in basic clothing – has becomea role model for QR programmes in other advanced economies.
Having achieved many of the QR goals, VICS implemented a collaborativeplanning, forecasting and replenishment (CPFR) programme, to synchronizemarket fluctuations and the supply chain in more real time. Through estab-lishing firm contracts among supply chain members and allowing them toshare key information, CPFR makes the forecasting, production and replen-ishment cycle ever closer to the actual demands in the marketplace (VICS,1998). While US practices have played a leading role in QR initiatives in theapparel industry, much of their success is in the basic fashion segment –where the manufacturing phase is normally the first to be transferredoffshore. In this sense, the philosophy of QR as the survival strategy offashion manufacturing in the industrial economies has not been realized.
QR in JapanThe US fashion industry essentially produces for the international marketthat is mostly controlled by the largest retailers – which are the real promotersand the first to profit from QR (Taplin and Ordovensky, 1995; Scarso, 1997).Japanese apparel firms have forged their success on flexible specialization in a
296 � Global logistics
Table 18.1 Retailers’ and suppliers’ QR benefits
Retailers’ QR benefits Suppliers’ QR benefits
Reduced costs Reduced costsReduced inventories Predictable production cyclesFaster merchandise flow Frequency of ordersCustomer satisfaction Closer ties to retailersIncreased sales Ability to monitor salesCompetitive advantage Competitive advantage
Source: Quick Response Services, 1995

subcontracting network of process specialists (Piore and Sabel, 1984; Azuma,2001). Harsh competition from offshore, and stagnant domestic consumptionhave come to highlight the costly structure and the lack of partnership in theJapanese fashion supply chain. This led to the formation of the QuickResponse Promotion Association (QRPA) in 1994, as a joint endeavour toregain competitiveness of the domestic industry, and effectively and effi-ciently serve ever-changing customer needs.
Since the introduction of the first QR initiative in the Japanese fashionindustry, a series of programmes have been implemented from 1) theretail–textiles, 2) the textiles–apparel, to 3) the apparel–sewing interfaces (seeFigure 18.2). With an increasing adoption of industry-standard platforms forEDI, department stores and apparel firms have achieved some of the expectedQR benefits. Elsewhere in the supply chain, however, there are fewer QRinitiatives – and QR initiatives have not necessarily worked throughout thedomestic apparel sector.
Benetton and ZaraThe importance of supply chain integration cannot be overstated; however,much depends on the degree of control a company has over the design,manufacture, marketing and distribution of its supply chain. Two of the most
Retail logistics � 297
Table 18.2 Technological and organizational QR development stages
Stage 1 Introduction of basic QR technologiesSKU level scanningJAN (standard) bar codeUse of EDIUse of standard EDI
Stage 2 Internal process re-engineering via technological and organizationalimprovementElectronic communication for replenishmentUse of cross-dockingSmall amounts of inventory in the systemSmall lot size order processingARP (automatic replenishment programme)JIT (just-in-time) deliverySCM (shipping container marking)ASN (advance shipping notice)
Stage 3 Realization of a collaborative supply chain and win–win relationshipReal-time sales data sharingStock-out data sharingQR team meets with partnershipsMRP (material resource planning)
Source: Giunipero et al, 2001; KSA, 1997

successful fashion retailers in Europe – Benetton and Zara – illustrate how anintegrated supply chain can enhance the retail offer. Both companies drawheavily on lean production techniques developed in Japan. Their manufac-turing operations are flexible, involving a network of subcontractors and, inthe case of Benetton, suppliers in close proximity to the factory. Benetton wasone of the first retail companies to apply the ‘principle of postponement’ to itsoperations, whereby semi-finished garments were dyed at the last possiblemoment when colour trends for a season became apparent from EPOS data atthe stores. So rather than manufacture stock to sell, Benetton could manu-facture stock to demand.
Zara’s operation has similarities with The Limited in the United States inthat the company scours the globe for new fashion trends prior to negotiatingwith suppliers to produce specific quantities of finished and semi-finishedproducts. Only 40 per cent of garments – those with the broadest appeal – areimported as finished goods from the Far East; the rest are produced in Zara’sautomated factories in Spain. The result of its supply chain initiatives is thatZara has reduced its lead-time gap for more than half of the garments it sellsto a level unmatched by any of its European or North American competitors.
Benetton, Zara and The Limited – as the latter’s name suggests – have narrowproduct assortments for specific target markets. This streamlines and simplifiesthe logistics network. For general fashion merchandisers, the supply chain ismore complex, with thousands of suppliers around the globe. Nevertheless,quick response concepts are being applied to these sectors in an effort tominimize markdowns due to out-of-season or unwanted stock in stores.
Although grocery retailers are more orientated to their national or super-regional markets – such as the EU – than their clothing counterparts are, theinternationalization of grocery retailers and their customers has led tochanging sourcing patterns. Furthermore, the increased competition in
298 � Global logistics
Yarnfinishing
Knittedgarmentsuppliers
Sewingroom
Weaving
Fibresuppliers
Departmentstores
GMS(general
merchandisestores)
Specialitystores
SPA(specialityretailer of
private labelapparel)
Accessoriesand sub-materials
Shosha(trading
companies)and
textileconverters
Textilessuppliers
Apparel firms
DyeingKnitting
HIGHLIGHTED – (Partial) participation in the industry-wide QR initiatives
(Retailers)* Consignmentsales – 80%
* Virtualintegration offashion supplychain
* Consignmentsales – 20%* Non-participantof QR initiatives
Figure 18.2 The structure of the Japanese fashion industry

grocery markets, with the resultant pressure on profit margins, has acted as aspur to companies to improve supply chain performance.
Efficient consumer responseECR emerged in the United States partly through the joint initiatives betweenWal-Mart and Procter & Gamble, in response to recession and increasedcompetition in the grocery industry in the early 1990s. Kurt Salmon Associateswere again commissioned to analyse the supply chain of a US industrialsector, and they found similar features to those identified in their earlier workin the apparel sector – excessive inventories, long uncoordinated supplychains and an estimated potential savings of $30 billion, 10.8 per cent of salesturnover (see Table 18.3).
ECR programmes commenced in Europe in 1993, and a series of projects andpilot studies were commissioned – for example, a Coopers & Lybrand (1996)survey of the grocery value chain estimated potential savings of 5.7 per cent ofturnover. Since then ECR has been adopted in countries around the world.
Retail logistics � 299
Table 18.3 Comparison of scope and savings from supply chain studies
Supply chain study Scope of study Estimated savings
Kurt Salmon Associates US dry grocery sector 10.8% of sales turnover(1993) (2.3% financial, 8.5% cost).
Total supply chain $30 billion;warehouse supplier dry sector$10 billion.Supply chain cut by 41% from104 days to 61 days.
Coca-Cola supply chain 127 European 2.3%–3.4% of sales turnovercollaboration (1994) companies. (60% to retailers,
Focused on cost 40% to manufacturer).reduction from endof manufacturer’sline.Small proportion ofcategory management.
ECR Europe 15 value chain analysis 5.7% of sales turnover (1996, ongoing) studies (10 European (4.8% operating costs,
manufacturers, 5 retailers). 0.9% inventory cost).15 product categories. Total supply chain saving of7 distribution channels. $21 billion.
UK savings £2 billion.
Source: Fiddis, 1997
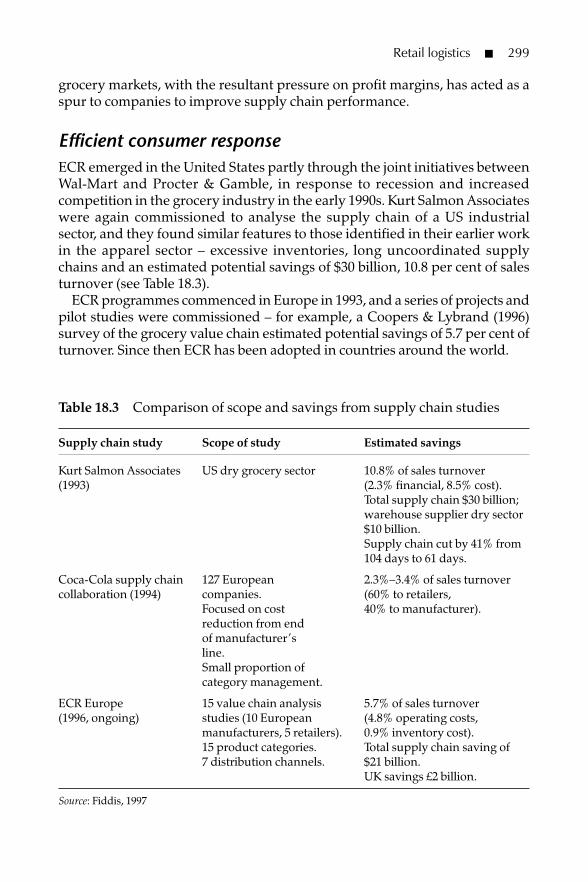
The European ECR initiative defines ECR as a ‘global movement in thegrocery industry focusing on the total supply chain – suppliers, manufac-turers, wholesalers and retailers, working closer together to fulfil thechanging demands of the grocery consumer better, faster and at least cost’(Fiddis, 1997). Despite the apparent emphasis on consumers, early studiesfocused on the supply side of ECR. Initially reports sought efficiencies inreplenishment and the standardization of material-handling equipment toeliminate unnecessary handling through the supply chain. The Coopers &Lybrand report in 1996 and subsequent reprioritizing towards demandmanagement – especially category management (McGrath, 1997) – have led toa more holistic view of the supply chain. Indeed, the greater cost savingsattributed to the Coopers study compared with that of Coca-Cola can beattributed to their broader perspective of the value chain.
The main focus areas addressed under ECR are category management,product replenishment and enabling technologies. Figure 18.3 breaks thesedown into 14 further areas where improvements can be made to enhanceefficiency.
300 � Global logistics
Category management
Product replenishment
Enabling technologies
Establishinfrastructure
Integratedsuppliers
Electronic datainterchange
(EDI)
Electronicfund transfer
(EFT)
Item codingand databasemaintenance
Activity-basedcosting(ABC)
Reliableoperations
Cross-docking
Synchronizedproduction
Continuousreplenishment
Automatedstore ordering
Optimizeintroductions
Optimizeassortments
Optimizepromotions
Source: Coopers & Lybrand, 1996
Figure 18.3 ECR improvement concepts
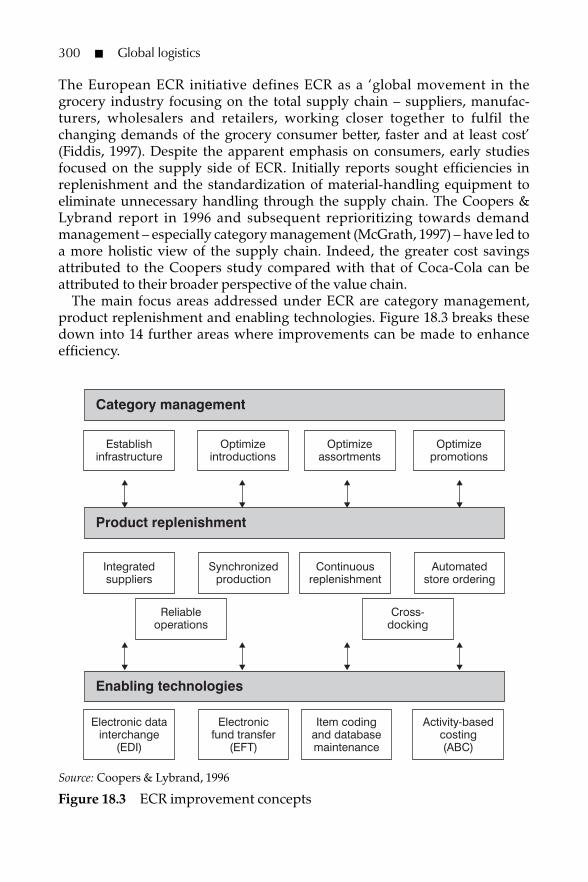
After the success of ECR Europe’s annual conferences from 1996, a series ofinitiatives encouraged much greater international collaboration. ECR move-ments began to share best-practice principles, most notably the bringingtogether of different versions of the ‘scorecard’ that was used to assess theperformance of trading relationships. These relationships were measuredunder four categories – demand management, supply management, enablersand integrators (see Figure 18.4). Comparing this with Figure 18.3 shows howECR has developed in recent years to accommodate changes in the marketenvironment. Retailers are becoming more sophisticated in their approach todemand and supply management, and there has been considerable progressin moving from traditional ‘bow tie’ relationships between retailers and theirsuppliers to a multi-functional team structure (see Figures 18.5 and 18.6).
Although logisticians would prefer a consistent flow of product through thesupply chain, tactical promotions remain a feature in many retailers’marketing strategies. Research by Hoch and Pomerantz (2002) on 19 foodproduct categories in 106 supermarket chains in the United States shows thatprice sensitivity and promotional responsiveness are much greater with high-frequency, staple purchases. These staple products benefited from rangereduction, compared with more specialist niche products where greatervariety and range built store traffic.
Retail logistics � 301
Demand managementDemand strategy and capabilities (D1)
Optimize assortments (D2)concept view criteria
Optimize new productintroductions (D4)
concept view criteria
concept view criteria
Enablers
Integrators
Common data andcommunicationstandards (E1)
Supply managementSupply strategy and capabilities (S1)
Responsivereplenishment
(S2)
concept view criteria
conceptview criteria
Operationalexcellence
(S3)
conceptview criteria
Integrateddemand-driven
supply (S4)
conceptview criteria
Consumer valuecreation (D5)
concept view criteria
Optimize promotions(D3)concept view criteria
concept view criteria
Cost / profit and valuemeasurement (E2)
concept view criteria
Collaborativeplanning (I1)
concept view criteria
E-businessbusiness to business
(I2)
concept view criteria
Source: www.ecr-sa.co.za
Figure 18.4 ECR concepts

In order to integrate this demand-side planning with continuous replen-ishment, collaborative planning is necessary. The main catalyst for this wasthe VICS initiative on CPFR, which drew its primary support from US non-food retailers and their suppliers until the late 1990s when the grocery sectorembraced the CPFR model. For example, Wal-Mart and Warner-Lambert areusually cited as key partners in sales forecast collaboration in the early to mid-1990s. The shift into grocery is hardly surprising in view of Wal-Mart’s moveinto food through its supercentres in the United States and its overseas acqui-sitions of grocery businesses such as Asda in the UK.
By the late 1990s, VICS had produced a nine-step generic model bringingtogether elements of ECR initiatives – the development of collaborativearrangements, joint business plans, shared sales forecasts and continuousreplenishment from orders generated. Although the tenets of CPFR havebeen established, the implementation of the model remains patchy and,
Source: Coopers & Lybrand, 1996
Figure 18.5 Changing relationships between manufacturers and theirsuppliers
Current relationship Target relationship
• Adversarial relationship
• Price
• Many suppliers
• Functional silos
• Short-term buying
• High levels of just-in-case inventory
• Expediting due to problems
• Historical information
• Short shipments
• Inefficient use of capacity
• Collaborative relationships
• Total cost management
• Few ‘alliance’ suppliers
• Cross-functional
• Long-term buying
• Compressed cycle times and improved demand visibility
• Anticipating due to continuous improvement
• ‘Real-time’ information (EDI)
• Reliability focus
• Run strategy and synchronization
302 � Global logistics

Retail logistics � 303
Multi-functional
Marketing
Manufacturer Retailer
Manufacturer Retailer
Logistics
Operations
Finance
Marketing
Logistics
Operations
FinanceKey
accountmanager
Keyaccountmanager
Supplierdevelopment
Buyer
Operationsfocus team
Financefocus team
R&Dfocus team
Environmentfocus team
Market researchfocus team
Jointboard meetings
Source: Fiddis, 1997
Figure 18.6 Transformation of the interface between manufacturer andretailer

like ECR initiatives, tends to focus on ‘quick wins’ where measurable profitenhancement or cost savings can be achieved. Most pilot schemes haveinvolved a handful of partners dealing with specific categories. Companiescome from a variety of technical platforms and cultures of collaboration.Indeed, the likes of Wal-Mart, Tesco and Sainsbury with their own intranetexchanges could actually impede more universal adoption of commonstandards!
To implement CPFR, it is a prerequisite that a close working relationship hasbeen fostered between trading partners, in order to invest the necessary humanresources to develop joint plans to generate real-time forecasts. There is clearlymore volatility of demand with price promotions and seasonal and eventplanning. CPFR generates greater benefits in these heavily promoted channelswhere over-stocks or out-of-stocks are more evident than in high-volume,staple, frequently purchased items where demand is more predictable.
Differences in logistics ‘culture’ in internationalmarkets
ECR principles have been adopted at different stages by different companiesin international markets – and new entrants to a market can change the distri-bution culture of that market. Differences in such markets are more likely toexist in the context of fast-moving consumer goods, especially groceries,because of the greater variations in tastes that occur in both national andregional markets. The catalyst for much of the interest in these internationalcomparisons was the revealing statistic from Kurt Salmon Associates (1997)that it took 104 days for dry grocery products to pass through the US supplychain from the suppliers’ picking line to the checkout. With the advent ofECR, it was hoped to reduce this to 61 days – a figure that was still behind thelead times encountered in Europe, especially in the UK, where inventory inthe supply chain averaged around 25 days (GEA, 1994).
Mitchell (1997) explains the differences between the United States andEurope in terms of trading conditions, stating that:
� The US grocery retail trade is fragmented and not as concentrated as inparts of Europe.
� US private-label development is primitive compared with that in manyEuropean countries.
� The balance of power in the manufacturer–retailer relationship is verydifferent.
� The trade structure is different, with wholesalers playing a moreimportant role in the United States.
� Trade practices such as forward buying are more deeply rooted in theUnited States than in Europe.
304 � Global logistics

� Trade promotional deals and the use of coupons in consumer promotionsare unique to the United States.
� Legislation, especially anti-trust legislation, can inhibit supply chaincollaboration.
Fernie (1994, 1995) cites the following factors to explain these differences intrading conditions:
� the extent of retail power;� the penetration of store brands in the market;� the degree of supply chain control;� types of trading format;� geographical spread of stores;� relative logistics costs;� level of IT development;� relative sophistication of the distribution industry.
Of these eight factors, the first three can be classified as relationship factorsand the remainder as operational factors. Clearly there has been a significantshift in the balance of power between manufacturer and retailer during thelast 20 to 30 years, as retailers increasingly take over responsibility for productdevelopment, branding, packaging and marketing. As mergers continue inEurope, retailers have grown in economic power to dominate their inter-national branded manufacturer suppliers. While there are different levels ofretail concentration at the country level, the trend is for increased concen-tration – especially as Southern and Eastern European markets are targetedby the major Western European retail chains.
By contrast, Ohbora, Parsons and Riesenbeck (1992) maintain that thispower struggle is more evenly poised in the United States, where the grocerymarket is more regional in character, enabling manufacturers to wield theirpower. This, however, is changing as Wal-Mart develops its supercentres andacts as a catalyst for the ‘consolidation wave’ throughout the 1990s and early21st century (Wrigley, 2001). Nevertheless, the immense size of the UnitedStates has meant that there has never been a true national grocery retailer.
Commensurate with the growth of these powerful retailers has been thedevelopment of distributor labels. This is particularly relevant in the UKwhere supermarket chains have followed the Marks & Spencer strategy ofstrong value-added brands that can compete with manufacturers’ brands.British retailers dominate the list of top 25 own-label retailers in Europe.
The net result of this shift to retail power and own-label development hasmeant that manufacturers have been either abdicating or losing their respon-sibility for controlling the supply chain. In the UK the transition from asupplier-driven system to one of retail control is complete compared withsome parts of Europe and the United States.
Retail logistics � 305

Of the operational factors identified by Fernie (1994), the nature of tradingformat has been a key driver in shaping the type of logistics support to stores.For example, in the UK the predominant trading format has been the super-store in both food and specialist household products and appliances. This hasled to the development of large RDCs for the centralization of stock fromsuppliers. In the grocery sector, supermarket operations have introducedcomposite warehousing and trucking whereby products of various temper-ature ranges can be stored in one warehouse and transported in one vehicle.This has been possible because of the scale of the logistics operation – namelylarge RDCs supplying large superstores. Further upstream, primary consoli-dation centres have been created to minimize inventory held between factoryand store. The size and spread of stores will, therefore, determine the form oflogistical support to retail outlets. Geography also is an important consider-ation in terms of the physical distances products have to be moved in coun-tries such as the UK, the Netherlands and Belgium compared with the UnitedStates and, to a lesser extent, France and Spain. Centralization of distributioninto RDCs was more appropriate to urbanized environments, where storescould be replenished regularly. By contrast, in France and Spain some hyper-market operators have widely dispersed stores, often making it more cost-effective to hold stock in store rather than at an RDC.
The question of a trade-off of costs within the logistics mix is, therefore,appropriate at a country level. Labour costs permeate most aspects oflogistics – and not surprisingly dependence on automation and mecha-nization increases as labour costs rise. Scandinavian countries have been inthe vanguard of innovation here because of high labour costs – and similarlyit can be argued that UK retailers have been innovators in ECR because ofhigh inventory costs, caused by high interest rates, in the 1970s and 1980s.This also is true of land and property costs. In Japan, the United Kingdomand the Benelux countries, the high cost of retail property acts as an incentiveto maximize sales space and minimize the carrying of stock in store. In Franceand the United States, the relatively lower land costs lead to the devel-opment of rudimentary warehousing to house forward-buy and promo-tional stock.
In order to implement ECR, there are ‘enabling technologies’ (Coopers &Lybrand, 1996) but their implementation is patchy both within and betweenorganizations. For example, McLaughlin, Perosio and Park (1997) commentthat 40 per cent of order fulfilment problems in US retailers are a result ofmiscommunications between retail buyers and their own distribution centrepersonnel. In Europe, Walker (1994) showed that EDI usage was much greaterin the UK than in other European countries – notably Italy with its high cost oftelecommunications, lack of management commitment and insufficientcritical mass of participants. Since then, widespread ECR initiatives have ledto greater use of ‘enabling technologies’, including web-based technologies,to enhance collaboration.
306 � Global logistics

One area of collaboration that is often overlooked is that between retailerand logistics contractors. The provision of third-party services to retailersvaries markedly by country according to the regulatory environment, thecompetitiveness of the sector and other logistics culture factors. For example,in the UK the deregulation of transport occurred in 1968, and many of thecompanies that provide dedicated distribution to RDCs today are the samecompanies that acted for suppliers when they controlled the supply chain 20years ago. Retailers contracted out because of the opportunity cost of openingstores rather than RDCs, the cost was ‘off-balance sheet’, and there was acluster of well-established professional companies available to offer theservice. The situation is different in other markets. In the United States, third-party logistics is much less developed, warehousing is primarily run by theretailer, and transport is invariably contracted out to local hauliers.Deregulation of transport markets has been relatively late in the UnitedStates, leading to more competitive pricing. Similarly, the progressive deregu-lation of EU markets is breaking down some nationally protected markets.
The internationalization of logistics practices
The transfer of ‘know-how’ proposed by Kacker (1988) can be applied tologistics practices. Alternatively, companies can pursue an organic growthstrategy by building up a retail presence in target markets before rolling outan RDC support function. For example, Marks & Spencer’s European retailstrategy initially was supported from distribution centres in southern Britain.As French and Spanish markets were developed, warehouses were built tosupport these stores in Paris and Madrid respectively. Another dimension tothe internationalization of retail logistics is the internationalization of logisticsservice providers, many of whom were commissioned to operate sites on thebasis of their relationship with retailers in the UK. With Marks & Spencer, Exelwas the contractor operating the RDCs in France and Spain.
The expansion of the retail giants into new geographical markets is leadingto internationalization of logistics. The approach to knowledge transfer islargely dependent upon the different models of globalized retail operationsutilized by these mega-groups. Wrigley (2002) classified these retailers intotwo groups: one following the ‘aggressively industrial’ model, the other the‘intelligently federal’ model (see Table 18.4). In the former model, to whichWal-Mart and to a lesser extent Tesco can be classified, the focus is uponeconomies of scale in purchasing and strong implementation of the corporateculture and management practices.
In the UK, Wal-Mart’s impact on Asda’s logistics has been mainly inenhancing IT infrastructure and reconfiguring its distribution network tosupply the increase in non-food lines. By 2005, 20 supercentres had beenopened, with 50 per cent of their space devoted to non-food items – and
Retail logistics � 307

existing stores will release more space for these with the release of space fromenhanced IT systems. Project Breakthrough introduced new EPOS and stockdata systems from 2000, and their retail link system has allowed greater co-ordination of information from till to supplier, reducing costs and enhancingproduct availability.
Ahold, by contrast, adheres to the intelligently federal model. It has trans-formed logistics practices through retail alliances, and through synergiesdeveloped with its web of subsidiaries. In the United States, for example, ithas retained the local store names post-acquisition and adopted best practiceacross subsidiaries.
Another method of transferring ‘know-how’ is through retail alliances, alarge number of which exist throughout Europe, most of which are buyinggroups (Robinson and Clarke-Hill, 1995). However, some of these allianceshave been promoting a cross-fertilization of logistics ideas and practices. Inthe case of the European Retail Alliance, Safeway in the UK has partneredwith Ahold of the Netherlands and Casino in France. Not surprisingly, theexploitation of UK retail logistics expertise has enabled distributioncontractors to penetrate foreign retail markets, not only in support of Britishretail companies’ entry strategies but also for other international retailers.Harvey (1997), chairman of Tibbett and Britten, argued that the success of hiscompany – and other UK logistics specialists – is derived from the success offast-moving consumer goods, but, as with UK retailers, success for the futurelies with global opportunities.
308 � Global logistics
Table 18.4 Alternative corporate models of a globalized retail operation
‘Aggressively industrial’ ‘Intelligently federal’
Low format adaptation Multiple/flexible formatsLack of partnerships/alliances in Parnerships/alliances in emerging marketsemerging markets
Focus on economies of scale in Focus on back-end integration, accessingpurchasing, marketing and logistics economies of skills as much as scale, and
best-practice knowledge transfer
Centralized bureaucracy, export of Absorb, utilize/transfer, best localkey management and corporate management acquiredculture from core
The global ‘category killer’ model The umbrella organization/corporate parentmanagement acquired model
Source: Wrigley, 2002

The future
Clearly there has been a transformation of logistics within retailing during thelast 25 years. Centralization, new technologies, ECR, QR and CPFR, and theimplementation of best-practice principles have resulted in logistics becominga key management function within retailing. But what of the future? With theexception of e-tail logistics, there is a feeling of déjà vu about the concernsexpressed by senior logistics managers on the key issues to be addressed.Product availability – or the ‘last 50 yards’ issue – is of prime concern. It issomewhat alarming that on-shelf availability for some of our major groceryretailers is no better than it was 30 to 40 years ago for many key value items(KVIs). In the 1960s and 1970s, customers could easily go to the nearest store topick up a manufacturer’s brand unavailable at their preferred store. In thedays of car-orientated supermarkets it would seem that store switching is lesslikely than in the days when a greater number of outlets and companiesprevailed. Continual non-availability of key items can be a major factor indiminishing store loyalty. It is not surprising, therefore, that much of the focusof CPFR initiatives is not only on promotional items but also on KVIs toenhance on-shelf availability. In order to sell in-store, replenishment timesneed to be reduced so that the overall supply chain is more flexible to meetchanging consumer demands.
In many ways this is a rerun of issues originally raised in the 1970s and1980s. The main difference now is that retailers have a range of tools thatallow massive supply chain savings to be realized. The problem is that theinfrastructure changes required and the systems enhancement neededinvolve massive capital investment at a time when competition is fierce andachieving sales growth is difficult. All of these initiatives are also resource-hungry in terms of management time, and have considerable implications forthe relationships amongst people, processes and technology. In retailing,competitive advantage is invariably achieved on the successful implemen-tation of initiatives that are available to all – but only realized by companieswith the quality of management to achieve results.
Tesco has been particularly innovative in seeking new solutions to improveon-shelf availability and reduce stockholding levels. Shock stock-outs in the1970s emphasized the importance of supply chain management to thecompany and drove recognition that the supply chain was an integral part ofcompany strategy. In the 1980s Tesco was in the forefront in creatingcomposite distribution centres, and in the 1990s it implemented ECR andCPFR. Since the late 1990s much of Tesco’s management philosophy has beenlinked to ‘lean thinking’, and further improvements are ongoing. Oneinitiative that has created a high degree of controversy has been the advent offactory gate pricing. Although backhauling and consolidation of loads was afeature of the previous decades, this was organized on a fairly ad hoc mannerwith a series of bilateral transport contracts between logistics service
Retail logistics � 309

providers and retailers and manufacturers. Now the larger grocery retailersare sourcing products ‘ex-works’, thereby managing the entire transportoperation from factory to consumer.
The concept of factory gate pricing is not just being applied to the grocerysector. Similar principles are being adopted in non-food, and especially thefashion sector. Instead of FOB, retailers are seeking to source ex-works,liaising with LSPs to consolidate loads and prepare floor-ready merchandiseto minimize handling at the downstream part of the supply chain. Thefashion sector has a longer and more complex supply chain than groceries,but lead times to the EU can be reduced (relative to Pacific Rim sources) bysourcing from the Middle East and Eastern Europe. As Marks & Spencer hasacknowledged, however, the quest for low-cost sourcing is only one solutionto competing in highly competitive pricing markets. Other developments infashion have seen time-based competition become more critical, with retailerssuch as Zara emerging and competing successfully, in part on supply chainspeed and excellence.
Advances in information systems over the last two decades have acted asenablers facilitating supply chain efficiency. Bar codes, EDI, ERP systems andinternet-based exchanges have all reduced the administrative costs ofcommunication amongst supply chain partners. The next potential majortechnological breakthrough that will have a significant impact upon supplychain costs is RFID technology. Potential benefits to retailers are claimed to beimmense. RFID could lead to the effective tracking of goods from factory tothe home. Issues of cost and concerns over consumer privacy threaten theimplementation of RFID, but it may also be that proponents have minimizedsome of the management and data use implications.
It is probable that the technology will be rolled out in stages, focusing onobvious issues and bottlenecks in supply chains. Initially the focus will be ontracking pallets, dollies and bins as they move from picking to the back roomof the store. This will give cost savings in labour through greater automationof tracking and more visibility. Shrinkage (which costs retailers 1–2 per centof sales a year) and stockholding levels should be reduced. As the costs oftags reduce – and if fears over consumer privacy are addressed – RFID tagswill be used at the item level and implemented at store level. For retailersseeking to maximize on-shelf availability, this should give up-to-date infor-mation on sales and in-store inventory, with consequent supply chainbenefits.
E-tail logistics is one area where activity is considerable – though perhapsnot yet at the level anticipated by most commentators. Major changes maystill occur, particularly when the e-tailing sector achieves greater stability. Inthe last few years a shake-out of the dot.com sector has occurred. In the non-food sector, a well-established delivery system is now in place and this systemis being refined to accommodate the multi-channel strategy that is beingadopted by most successful retailers. Traditional catalogue retailing incurred a
310 � Global logistics

high rate of ‘returns’ through the logistical network. This is being reinforcedby online retailing, where around one-third of non-food products deliveredto the home are returned. The reverse logistics task of retrieval, repackagingand returning or re-routeing merchandise is complex enough from home towarehouse, but web shoppers are also returning merchandise to their neareststore. ‘Bricks and clicks’ may increase customer spend and enhance loyaltybut it also adds to costs. The need to invest in systems and infrastructure toaccommodate such changes is leading to the formation of alliances amongstretailers to share these costs and build upon their relative expertise in supplychain functions.
E-grocery logistics has posed more formidable challenges. The initial‘hype’ associated with the dot.com boom led to much investment into dedi-cated picking centres. In retrospect this was a flawed strategy based on un-realistic demand projections. Store-based fulfilment offered a morerisk-averse approach to e-grocery, with demand met from existing assets andthe e-grocer able to refine its systems and customer service as it gained exper-ience. Nevertheless, there are questions about the long-term sustainability ofsuch a model if online grocery sales continue to grow at current rates. Thesharing of the same inventory between store and online shopper couldaggravate the on-shelf availability problem and ultimately lead to poorcustomer service levels for both. As the market matures, investment in‘stand-alone’ picking centres will be necessary in specific geographicalmarkets, and the market leader, Tesco, intends to open such a centre inCroydon, near London, in 2006.
Regardless of the fulfilment model used, the ‘last mile’ problem is far frombeing resolved. Customers prefer narrow time slots for attended delivery;retailers prefer to utilize their transport assets around the clock. Ideally, theunattended delivery option is best for most parties, as customers are notconstrained by delivery times, retailers can reduce their transport costs, andlocal authorities can reduce van congestion with 24-hour deliveries. But willcustomers invest in home reception facilities or be willing to pick up groceriesin communal reception boxes? Initial reactions to such proposals have beenlukewarm to say the least, leaving key problems to be overcome.
References
Azuma, N (2001) The reality of quick response (QR) in the Japanese fashionsector and the strategy ahead for the domestic SME apparel manufacturers,Logistics Research Network 2001 Conference Proceedings, pp 11–20, Heriot-WattUniversity, Edinburgh
Christopher, M (1997) Marketing Logistics, Butterworth-Heinemann, OxfordChristopher, M (1998) Logistics and Supply Chain Management, 2nd edn,
Financial Times, London
Retail logistics � 311

Christopher, M and Jüttner, U (2000) Achieving supply chain excellence: therole of relationship management, International Journal of Logistics: Researchand application, 3 (1), pp 5–23
Christopher, M and Peck, H (2003) Marketing Logistics, Butterworth-Heinemann,London
Coopers & Lybrand (1996) European Value Chain Analysis Study: Final report,ECR Europe, Utrecht
Drucker, P (1962) The economy’s dark continent, Fortune, April, pp 265–70Fernie, J (1994) Quick response: an international perspective, International
Journal of Physical Distribution and Logistics Management, 24 (6), pp 38–46Fernie, J (1995) International comparisons of supply chain management in
grocery retailing, Service Industries Journal, 15 (4), pp 134–47Fernie, J (1998) Relationships in the supply chain, in Logistics and Retail
Management, ed J Fernie and L Sparks (eds), Kogan Page, LondonFernie, J, Pfab, F and Marchant, C (2000) Retail logistics in the UK: planning
for the medium term, International Journal of Logistics Management, 11 (2), pp83–90
Fiddis, C (1997) Manufacturer–Retailer Relationships in the Food and DrinkIndustry: Strategies and tactics in the battle for power, FT Retail and ConsumerPublishing, Pearson Professional, London
Finnie, TA (1992) Textiles and Apparel in the U.S.A.: Restructuring for the 1990s,Special Report 2632, Economist Intelligence Unit, London
Forza, C and Vinelli, A (1996) An analytical scheme for the change of theapparel design process towards quick response, International Journal ofClothing Science and Technology, 8 (4), pp 28–43
Forza, C and Vinelli, A (1997) Quick response in the textile-apparel industryand the support of information technologies, Integrated ManufacturingSystems, 8 (3), pp 125–36
Forza, C, and Vinelli, A (2000) Time compression in production and distri-bution within the textile-apparel chain, Integrated Manufacturing Systems, 11(2), pp 138–46
GEA Consultia (1994), Supplier–Retailer Collaboration in Supply ChainManagement, Coca-Cola Retailing Research Group Europe, London
Giunipero, LC et al (2001) The impact of vendor incentives on quick response,International Review of Retail, Distribution and Consumer Research, 11 (4), pp359–76
Harvey, J (1997) International contract logistics, Logistics Focus, April, pp 2–6Hines, T (2001) From analogue to digital supply chain: implications for
fashion marketing, in Fashion Marketing: Contemporary issues, ed P Hines andM Bruce, Butterworth-Heinemann, Oxford
Hoch, SJ and Pomerantz, JJ (2002) How effective is category management?,ECR Journal, 2 (1), pp 26–32
Hunter, A (1990) Quick Response in Apparel Manufacturing: A survey of theAmerican scene, Textile Institute, Manchester
312 � Global logistics

Kacker, M (1988) International flows of retail know-how: bridging the tech-nology gap in distributions, Journal of Retailing, 64 (1), pp 41–67
Ko, E, Kincade, D and Brown, JR (2000) Impact of business type upon theadoption of quick response technologies: the apparel industry experience,International Journal of Operations and Production Management, 20 (9), pp1093–111
Kurt Salmon Associates (KSA) (1997) Quick Response: Meeting customer needs,KSA, Atlanta, GA
Lowson, B (1998) Quick Response for Small and Medium-Sized Enterprises: A feasi-bility study, Textile Institute, Manchester
Lowson, B, King, R and Hunter, A (1999) Quick Response: Managing the supplychain to meet consumer demand, John Wiley & Sons, New York
McGrath, M (1997) A Guide to Category Management, Institute of GroceryDistribution, Letchmore Heath
McKinnon, AC (1996) The development of retail logistics in the UK: a positionpaper, Technology Foresight’s Retail and Distribution Panel, Heriot-WattUniversity, Edinburgh
McLaughlin, EW, Perosio, DJ and Park, JL (1997) Retail Logistics andMerchandising: Requirements in the year 2000, Cornell University Press,Ithaca, NY
Ministry of Economy, Trade and Industry (METI) (2002) Seni Sangyo no Genjo toSeisaku Taiou [The current status of the Japanese textile industry and thepolitical responses], METI, Tokyo
Mitchell, A (1997), Efficient Consumer Response: A new paradigm for the EuropeanFMCG sector, FT Retail and Consumer Publishing, Pearson Professional,London
Ministry of International Trades and Industries (MITI) (1993) Seni Vision[Textile vision], MITI, Tokyo
MITI (1995) Sekai Seni Sangyo Jijo [MITI world textile report], MITI, TokyoMITI (1999) Seni Vision [Textile vision], MITI, TokyoOhbora, T, Parsons, A and Riesenbeck, H (1992) Alternative routes to global
marketing, McKinsey Quarterly, 3, pp 52–74Piore, MJ and Sabel, CF (1984) The Second Industrial Divide: Possibilities for pros-
perity, Basic Books, New YorkPorter, ME (1985) Competitive Advantage, Free Press, New YorkQuick Response Services (1995) Quick Response Services for Retailers and
Manufacturers, Quick Response Services, Richmond, CARiddle, EJ et al (1999) The role of electronic data interchange in quick response,
Journal of Fashion Marketing and Management, 3 (2), pp 133–46Robinson, T and Clarke-Hill, CM (1995) International alliances in European
retailing, in International Retailing Trade and Strategies, ed PJ McGoldrick andG Davies, Pitman, Harlow
Scarso, E (1997) Beyond fashion: emerging strategies in the Italian clothingindustry, Journal of Fashion Marketing and Management, 1 (4), pp 359–71
Retail logistics � 313

Taplin, IM and Ordovensky, JF (1995) Changes in buyer–supplier relation-ships and labor market structure: evidence from the United States, Journal ofClothing Technology and Management, 12, pp 1–18
Voluntary Interindustry Commerce Standards Association (VICS) (1998)Collaborative Planning, Forecasting, and Replenishment Voluntary Guidelines,VICS, Lawrenceville, NJ
Walker, M (1994) Supplier–retailer collaboration in European grocery distri-bution, Paper presented at the IGD Conference on Profitable Collaborationin Supply Chain Management, London
Whiteoak, P (1993) The realities of quick response in the grocery sector:a supply viewpoint, International Journal of Retail and Distribution Management,21 (8), pp 3–10
Wrigley, N (2001) The consolidation wave in US food retailing: a Europeanperspective, Agribusiness, 17, pp 489–513
Wrigley, N (2002) The landscape of pan-European food retail consolidation,International Journal of Retail and Distribution Management, 30 (2), pp 81–91
314 � Global logistics

315
Internet traders canincrease profitability byreshaping their supply
chains
Robert Duncan, B & C Business Services
Internet trading is forecast to account for a quarter ofall purchases in 2006
The volume of internet trading grew significantly in the final years of the lastcentury. It continued to grow in the early years of this century and is forecast togrow even further in the next few years. Forrester (2001a) forecast that globalonline trade, a combination of both business-to-business (B2B) and business-to-consumer (B2C) sales, will account for 18 per cent of all sales by 2006.Furthermore (Forrester, 2001b), two-thirds of the $12.8 trillion expenditure willbe accounted for by purchases in the United States, representing 27 per cent ofall their goods and services purchased. It is estimated that this increase will add1.7 per cent to US transport service revenues. The US Department ofCommerce reported continuing growth in 2004 with e-commerce sales up21 per cent for the year. The growth is forecast to continue. US internet retailsales are predicted to grow at a compound annual rate of 14 per cent a year
19

316 � Global logistics
until 2010 (Forrester, 2005b). It is recognized that the United States leads theway in most e-commerce-driven initiatives and, therefore, the scale ofincreases in the United States is likely to be seen in other developed countriesshortly – followed by less developed countries. The UK reported a 30 per centincrease in year-on-year e-retail sales in the third quarter of 2004 (GVA, 2004).The level of sales during the first half of 2004 reflected a fivefold increase in thelevel experienced in 2001. The route to market, particularly with the intro-duction of broadband, is seen as so important that in the United States it isforecast that, by 2010, 8 per cent of all advertising spend will be directed atinternet advertising in various forms (Forrester, 2005c). This sum will rival thatbeing spent on cable and satellite TV and radio.
Customer satisfaction is less than satisfactory
Such growth predictions lie against a background of dissatisfied customers,press reports that many internet traders do not fully understand their orderfulfilment costs, and transport service providers complaining that theircustomers tend to be cost- rather than service-driven. This leads them tosuggest that their customers do not fully understand the complexity of homedelivery – or B2C operations – and consequently the added value that theyprovide. This background has been created by internet traders trying tooperate effectively utilizing traditional distribution methods and networks.There has been a tendency to concentrate too much effort on websites, andnot pay enough attention to the business processes needed to integrate ordercapture with other business systems and order fulfilment.
Dissatisfaction in the mind of the customer can be created in a number ofways. Late delivery, damaged goods, poorly handled financial transactionsand bad-tempered delivery people are just a few. It is generally accepted thatbecause the placing of an order via the internet is extremely quick, simple andin many cases pleasurable, the expectation in the mind of the customer is thatall aspects of the transaction will be of a similar nature. Customer expectationhas been heightened. The ordering process was slick and customers, notunreasonably, expect the rest of the process to be undertaken with the sameefficiency. Under these circumstances, it is more likely that the customer willnot be fully satisfied unless particular steps are taken to ensure that the levelof service provided meets the heightened level of expectations. It is all tooeasy to undo the excellent work done by the website in winning the customer– and the order – by inadequate business processes and order fulfilmentprocedures.

Integration of business processes has not alwaysreceived enough attention
Many organizations are now realizing – often too late – that they should havepaid as much attention to their internal business processes, their orderfulfilment resources and systems, and the integration of these processes andsystems with those of their suppliers and order fulfilment services as they didto their customer-facing website. The need is for a seamless, end-to-end‘order-to-cash’ process incorporating the website, the business’s accountingsystems and the delivery mechanism. The accounting needs should embrace,as a minimum, accounts payable, accounts receivable, inventory, purchaseorders, invoicing and credit control.
In many organizations, when internet trading is added to the traditionalmarket offering the delivery mechanisms cannot cope with the requirement fora large number of small orders that require, to all intents and purposes, instantshipping. They may historically have been shipping relatively large orders to afew intermediate supply chain points with a two- to three-day lead time. Thebusiness processes – and perhaps more importantly the business systems thatare required to manage a large number of small orders – are different from thoserequired to manage the traditional business. The potential for making mistakes ishigh when an organization attempts to manage the internet business in thesame way as the traditional business. And all the effort and resources that wentinto winning the business are wasted by losing that business due to the inade-quate processes and systems to support order fulfilment.
Moving away from traditional supply chains addscomplexity but provides an opportunity for profit
The situation is made even more complex by the fact that the rise in internettrading has provided the potential to restructure traditional distributionnetworks, supply chains and product flows. Much of the thinking to daterelates to the traditional ways of moving products from manufacturers tocustomers. In the B2C area this has reflected traditional mail-orderingconcepts as typified by those organizations selling products such as books andmusic CDs. In simple terms, rather than ordering from a catalogue received inthe mail and posting their order back to their suppliers, customers are placingtheir order via the internet. Their products are delivered to them in much thesame way as they were with traditional mail order. The key differences arethat the ordering process has been shortened and the manufacturers’ ordercapture and processing costs have been reduced. Food retailers offeringhome-delivery services typically rely on the order that has been received viathe internet being printed in the branch nearest to the customer, picked from
Internet traders can increase profitability � 317

the shelves in that branch and delivered, by a branch-based vehicle, to thehome of the customer.
Internet trading has enabled improved supply chainsRecent supply chain trends have reflected changes made possible by theinternet as a means of communicating between buyers and sellers. When thesimple scenario described above is related to books, it no longer requires asupply chain involving the printer and publisher, an intermediate stock-holding location and an organization to promote the offer, capture the orderand execute the delivery. Potential customers can place their orders usingeither their own PC at home or a terminal in the branch of a high-street bookretailer specifically provided for browsing and order capture. The order isthen transmitted to the relevant publisher – not an intermediate stockholdingpoint – for picking, packing and shipping directly to the customer.
Books and CDs lend themselves ideally to this type of trade as, apart fromsome minor exceptions, they can easily be shipped across borders and they donot require particular shipping conditions in terms of temperature control. Thesituation for foodstuffs is very different. A single customer order may be rela-tively heavy, consist of a number of different-size cartons and bottles, require arange of temperature regimes and need to be delivered within a tightly definedtime-frame. As volumes increase, the industry is beginning to introduce home-delivery picking and delivery depots located away from the prime retail sites.Such facilities enable the use of sophisticated warehouse techniques, madepossible by the automatic entry of customer orders into the warehouse system.The advantages created by customers ordering over the internet include moreeffective picking operations in a depot rather than a branch, improved productavailability through monitoring the particular purchasing patterns of internetshoppers, lower delivery costs as the increased volumes allow sophisticatedrouteing and scheduling techniques, and less congestion in the branches.
The monitoring of individuals’ consumption patterns – and the retailers’websites both prompting and reminding their regular customers of thosepatterns as they go through the ordering process – could further extend theconcept.
Such changes could be introduced into other marketsectorsThe two examples above – books and CDs – suggest modifications of currentpractices and adjustment to supply chains that result from the ability to placeorders over the internet. The concepts could be used by other manufacturers notcurrently fully embracing the potential of electronically capturing orders andshipping customer orders directly to them. Figure 19.1 shows a general supplychain for the distribution of prescription drugs from a manufacturer to a patient.
318 � Global logistics

The main characteristic is the use of wholesalers and retailers to make thedelivery to the patient once a doctor has prescribed the particular drug. In thecase of hospitalized patients, there is usually another stockholding point inthe hospital’s pharmacy, between the manufacturer and the patient. Largehospitals using large amounts of particular drugs receive deliveries directlyfrom the manufacturers, but these are the exception rather than the rule.
The level of service provided is extremely high, with wholesalers makingmultiple deliveries a day to retailers to ensure that particular drugs – from theplethora potentially available – are delivered to the patients as soon aspossible. However, patients often have to return to the pharmacy for either allor part of their requirements once they have presented their prescription.Owing to the nature of the products, the flows are highly regulated, and someform of control is obviously necessary. However, a more streamlinedapproach could be envisaged using the internet as the means of communi-cation. Figure 19.2 illustrates a possible use of the internet to facilitate theorder fulfilment of prescription drugs.
The scenario starts with the doctor prescribing the drugs in an electronicformat and sending details via the internet to the manufacturer once theconsultation with the patient has finished. The manufacturer simply picks,packs and ships the products to the patient’s home. The shipping processwould utilize the best means available to suit the characteristics of theproduct. Small and light packets of tablets, for example, could be shipped
Internet traders can increase profitability � 319
Manufacturing plant
Pharmaceutical wholesaler
Retail pharmacy
Patient’s home
Prescription andpossibly multiple visits
Figure 19.1 A typical pharmaceutical manufacturer’s distribution network

using conventional postal services; more sophisticated products requiringcareful handling may use specialist express parcels services. A less radicalversion of the concept may result in the wholesalers providing the home-delivery service on a regional basis. In each case, the distribution supply chainis simplified and the patient does not have to go to the retail outlet, sometimesmore than once, to obtain his or her medication. This is particularly advanta-geous for elderly and infirm patients.
Many retail pharmacists have introduced a prescription collection anddelivery service, but their aim is not to simplify the supply chain, but tomaintain the status quo. The supply chain change outlined not onlyprovides an improved service to customers and a reduction in thecomplexity of the manufacturers’ supply chains, but also helps overcomesome of the issues associated with the parallel importing of pharmaceu-ticals. Pharmaceuticals are sold at varying prices around the world, sotraders can buy cheaply in some areas, ship the products to areas of highselling prices and make a profit. Pharmaceutical companies experiencelower sales in those areas with high selling prices, reduced profit levels –and, therefore, potentially lower research budgets. The proposed supplychain change gives pharmaceutical companies greater control throughdisintermediation, with less buying and selling of product by third parties,and less cross-border movements. The use of RFID technology, effectivelyelectronically ‘tagging’ products, will also assist with the control of pharma-ceuticals from the manufacturing plant to the point of use by the patient.This will increase service levels, reduce costs and sustain pharmaceuticalresearch and development in the future.
320 � Global logistics
Manufacturer’s plantor distribution centre
Internet transmissionof prescription andpatient’s details
Patient’s homeDoctor’s surgery
Figure 19.2 A possible pharmaceutical manufacturer’s distribution network

The concept can also be applied in the B2B contextThe B2B area also provides opportunities to restructure traditional supplychains. For many years, supply chain organizations have exchanged infor-mation electronically regarding production schedules, raw material andcomponent stock levels and forecast levels of demand and productioncapacity. Suppliers and buyers, particularly in the automotive sector, havepractised just-in-time techniques relying on electronic communication. Theyhave developed and introduced order fulfilment techniques reshaping thestructure of the distribution supply chains, enabling minimal inventories tobe maintained through line-side delivery and rapid communication.
Other organizations have centralized their storage operations as a result ofbeing able to communicate rapidly and fulfil orders using efficient transportservices. The emergence of cost-effective and reliable, high-speed transportservices has played an important role in achieving the ambitions of thoseplayers embarking upon an internet trading journey. The systems used bysuch organizations enable their customers to track their own shipments. Thisis essential in the early stages of using a changed network to give customers –both internal and external to the organization – the confidence that theremote operation will provide the required levels of service. More impor-tantly, the systems enable carriers themselves to be proactive on the rareoccasion that some corrective action is needed.
The impact will not be as large in all industry sectorsThe reshaping of the supply chain as a result of internet trading and the emer-gence of reliable and cost-effective rapid-transport service providers will notaffect all industry sectors to the same extent. While communications mayimprove – a worthwhile end in itself – it is difficult to envisage the network forbulk building supplies (such as sand, ballast and cement) changing signifi-cantly. The biggest impact is likely to be in the order fulfilment of thoseproducts that are relatively high in value and easily transported. The B2Benvironment is more stable than B2C, with a more defined customer base anda better understanding of demand patterns. The traditional distributionsupply chain of an industrial company is shown in Figure 19.3. It is charac-terized by the direct delivery of large orders from factory to customer and theuse of distributors, agents or wholesalers for the delivery of small orders tocustomers on a geographic basis.
The internet can capture and process orders more cheaply and quickly, somanufacturers are beginning to consider reducing the number of middlementhat they use to fulfil customers’ orders. Companies that supply consumablesto other companies for use in their manufacturing can provide monitoringdevices that send material usage statistics to them, via the internet, triggeringautomatic replenishment orders. Once a history of usage has been established,
Internet traders can increase profitability � 321

order fulfilment can be achieved more cost-effectively, with better planning tominimize the effects of peaks in demand. The customer does not need tomaintain a purchasing function to place orders, and the supplier does not needto incur the costs of an order processing department – a ‘win–win’ scenario.
There is likely to be an increase in centralized operationsThe biggest changes in order fulfilment infrastructure as a result of internettrading are likely to be in the area of centralized operations. Establishing asmall number of order fulfilment centres – with associated software to inte-grate the website ordering process with the organization’s business systems –is likely to be more cost-effective than the establishment of a larger number oflocal operations. Although transport costs are likely to increase as a result,they will be more than offset by lower order processing costs, inventory-related costs and warehouse facility costs. At constant volume, increasedmargins will be attainable or lower prices can be charged to increase marketshare and enhance profitability.
In Europe, organizations that typically operated on a national basis areestablishing more regionalized operations. Products that are of relatively highvalue and easily transported tend to support larger regions than those thathave low value and require specific transport resources. For example,
322 � Global logistics
Manufacturing plant
Bulk deliveries frommanufacturing plantto stockholdingpoints
Localized deliveryoperations
Direct deliveries frommanufacturing plant tocustomer’s premises
Geographicstockholding points
Customers orderingin small quantities
Customers orderingin large quantities
Order processing
Figure 19.3 A traditional industrial supplier’s distribution network

companies with spare-part operations tend to centralize activities, as fieldengineers and customers can communicate with a central point via theinternet, and inventory control is much simpler with a central stock thanseveral stockholding locations. The enlarged membership of the EU hasresulted in many organizations revisiting their infrastructure and designingregionalized structures.
As the infrastructures change and the traditional role of intermediariesdeclines, a new group of internet traders is emerging offering purchasingfunction services. In general terms, they negotiate prices with a range ofsuppliers and offer, over the internet, a one-stop service for the products ofthose suppliers to their customers. Once they have taken an order from acustomer it is converted to an order with a supplier. That supplier then fulfilsthe order in the conventional manner. The benefits of this scenario are that thecustomers obtain better prices, the suppliers do not have the costs of thecustomer-facing activities and the internet trader makes money by providingan added-value service to both customer and supplier without stocking andhandling the products.
The challenge is becoming greaterThe growth in internet trading has not been accompanied by tales ofdelighted customers or order fulfilment processes to match the heightenedcustomer expectation. Early experience suggested that organizations werenot particularly good at integrating their website order capturing activitieswith their internal business systems and those of their order fulfilmentservice provider. And many organizations did not realize the potential of theinternet for streamlining their supply chains. Changing business processesand introducing the necessary systems to trade over the internet provided achallenge within existing business relationships and infrastructures. Thechallenge is being made all the more difficult as business relationships andthe physical infrastructure within which those relationships operate arechanging.
How can internet traders take advantage ofopportunities?
In this ever-changing world not all of the potential internet-driven supplychain changes will be appropriate for all internet traders. Even within anindustry sector, patterns will emerge, but the same solution may not besuitable for all of the players in that sector. There are, however, four activitiesthat all internet traders can complete as a starting point for optimizing theirbenefits:
Internet traders can increase profitability � 323

1. The establishment of a vision of the future: ‘Where are we going and what is itgoing to be like when we get there?’
2. The definition of the partnering arrangements needed for success: ‘Who is going tohelp us get to where we are going and how are we going to manage them?’
3. The reviewing of their business processes and electronic systems: ‘Can ourprocesses and systems enable us to achieve our long-term objectives?’
4. The undertaking of trade-off calculations: ‘What options are open to us andhow much will they cost?’
These four activities form the key steps of an overall route to success outlinedin Figure 19.4.
The establishment of a vision of the futureIt is perhaps a little obvious to say that an organization must be able to definethe direction in which it intends to go. This vision of the future is not a loose
324 � Global logistics
Understanding the starting point
Establishing the ‘vision of the future’
Defining partnering arrangements
Revisit the‘vision ofthe future’
Undertaking trade-off calculations
Monitoring results
Reviewing business processesand
Implementing electronic systems
Figure 19.4 A route to success

collection of statements amounting to little more than a wish list. It is,however, several statements describing – in quantifiable terms – the nature ofthe business at some point in the future. That point will vary depending uponthe nature of the marketplace in which the organization is operating. In thehigh-tech sector, the foreseeable future may be only a few months, or a year atthe most. In traditional industry sectors that do not expect a significantpercentage of their business ever to be undertaken over the internet, thevision may take several years to come to fruition.
The statements should cover the total volume of business both in terms ofvalue and in physical terms, the share that is undertaken over the internet, thesize of both the customer and the supplier bases, the profitability of theinternet business, the costs associated with order fulfilment, and the deliveryprofile in terms of order numbers and the amount in each order size bandappropriate to the business. Any individual organization will have manyother metrics particular to its industry sector and product range. The key issueis that they should be measurable. They will be used to establish key perfor-mance indicators (KPIs) for the business. These KPIs will be monitored, andthe organization can establish the extent to which it is achieving its vision andreaping the rewards from the changes it has made.
The definition of the partnering arrangements needed forsuccessOrganizations wanting to trade over the internet, with a few exceptions, areunlikely to have all of the required skills in-house to establish the websiteeffectively, integrate it with their business systems, and manage the orderfulfilment activities. Partners are, therefore, essential for the vast majority oforganizations. A number of options are available to potential electronictraders:
� A single ‘one-stop shop’ able to deliver the website, integration with a commerceplatform, and order fulfilment. This gives the advantages of a single point ofcontact for the management team, and an organization that manages all ofthe difficult interfaces. Until recently, such organizations have been fewand far between. This made selecting partners and a successful outcomesomething of a lottery – with service providers often developing a formulathat worked for their original customer, and being reluctant to change it tomeet the needs of new entrants. Such is the pace of change that this doesnot provide as large a barrier to progress as it did a few years ago. Theinvestment in IT by a number of major value-adding order fulfilmentcontractors is now beginning to manifest itself, and they have the skills,resources, hardware and software that allow them to offer a single end-to-end service. The second wave of internet commerce in 2004 saw anincrease in the demand for hosted or outsourced e-commerce solutions
Internet traders can increase profitability � 325

(Forrester, 2005a). Vendors, including internet service providers, haveresponded with a range of offerings addressing the supply chain in eitherits entirety or its component parts.
� Partnerships with a number of specialist service providers to source all of the servicesthat they require. To achieve this successfully, project management andoutsourcing management skills need to be in abundance in the organization.While the individual elements of website design, systems integration andorder fulfilment may be readily available in the market, the required in-houseskills of project and outsourcing management may not. With a trend tomore outsourced resources, this issue will gain in significance for manyorganizations.
� An organization that has already done all the hard work, but is not in competitionwith the market entrant. It is likely that potential partners are traditional‘bricks and mortar’ traders that have extended their offering to include anelectronic commerce element. Perhaps niche players could partner withmajor players in their own industry to provide a wider offering to themajor players’ customers. In the past, small niche players would not haveattempted to partner the major industry players, as they would haveregarded them as competitors – and unequal partners. For example, theonline market for books is dominated by mega-sites such as Amazon andBarnes & Noble. Alibris, a small organization specializing in used andhard-to-find books, now works with the major organizations as a supplierof titles that are not their mainstream business – to the mutual benefit of allof the supply chain partners (Internet.com, 2003).
Thus, there are many ways of developing a partnership. An organization thatexpects a rapid growth in volume over a short period may favour an added-value service provider, as it could overwhelm a traditional business thatcurrently has only a small part of its business handled by the internet.Organizations that are hoping to move into new markets and/or geographiesare likely to favour the added-value service provider. Organizations that see arelatively slow but steady growth may favour managing the situation them-selves or partnering with an organization that has already made the leap tointernet trading.
The reviewing of their business processes and electronicsystemsWhen reviewing in-house systems, internet traders should include both elec-tronic software systems and the business processes. In terms of the electronicsoftware, the simplest questions include:
� ‘Can our systems cope with a significant increase in transactional volume?’� ‘Can our systems interface with modern websites?’
326 � Global logistics

� ‘Can our systems interface with those of our suppliers of both goods andservices?’
� ‘Can our systems enable us to deliver the required level of customerservice?’
A few years ago, some of these questions would have sent shivers down thespines of would-be internet traders. Thankfully, modern systems do notgenerally present significant difficulties with interfacing, and extra capacity isno longer the hugely expensive item that it was in the past. However, the criticalarea for most organizations is not the software systems and supportinghardware networks, but their business processes. Will any of the orderprocessing, credit checking, inventory allocation, manufacturing, warehousing,shipping, invoicing and cash collection processes within the overall order-to-cash process negatively affect the requirements of the internet business?
If an organization is a true middleman and does not expect to hold stock,but converts a sales order from a customer into a purchase order for a supplier,its internal processes will need to be able to cope with this. It may be necessaryto have a different process for internet trade from that used for conventionalbusiness in organizations handling both routes to market. The questionsneeding to be answered under these circumstances include:
� ‘Who will design the required processes to ensure that all customers’requirements are met?’
� ‘What will be the impact of those new processes on existing processes andthe consequent risk to our traditional business?’
� ‘Will we achieve the predicted levels of economies of scale employing twoor more order-to-cash processes?’
These questions will be easier to answer if a clear understanding of thebusiness direction has been established. When the internet business is seen togrow steadily but will never be a significant part of the business, the dupli-cated process route may be the easiest way of dealing with matters.Alternatively, if the internet business is expected to grow rapidly and both theconventional and the internet trades become significant elements of the totalbusiness, a single process route would have merit.
Trade-off calculationsAnalyses of the overall network and the options available to achieve the requiredlevels of customer service are essential. To undertake the trade-off calculationsassociated with changing supply chains and distribution networks in order toselect the best route to market for any individual internet entrepreneur, a fullknowledge of the current and potential operating costs is needed. Again, theimportance of a vision of the future can readily be appreciated. While having
Internet traders can increase profitability � 327

that vision is important, understanding the starting point is also extremelyimportant. Key questions to be answered include:
� ‘What volumes are being dispatched?’� ‘What levels of service are being achieved?’� ‘What costs are being incurred?’� ‘Do we feel that we are obtaining value for money from the resources
being employed?’
The vision will be able to provide answers to the questions about futurevolumes and expected margins. The internet trader must then define anumber of options for delivering the future volumes within the requiredcustomer service level constraints. They are likely to be network models withdecentralized or centralized, direct delivery or delivery via distributors, andstockless or inventory-holding themes. A number of evaluation criteria – inaddition to those that are strictly cost-related – will be required to establish themost appropriate solution for each particular trader. While industry sectorsmay find similar solutions, an individual organization in that sector will bedriven by its vision of the future and its culture in achieving that goal.
Opportunity waiting to be exploited
Internet trading is here to stay and, if recent experience is any guide, volumesare set to grow significantly in the very near future. Given the growth predic-tions, suppliers to both the consumer and the business markets have atremendous opportunity. They are setting out on the journey against a back-ground of heightened customer expectation and a history of failure to meetthose expectations. The winners will be those organizations that take theopportunity afforded by the internet to change the manner in which theycapture and fulfil their customers’ orders.
To date, many traders have implemented an internet ‘front end’ to theirexisting business processes. Consequently, the initial limited volumes havebeen treated in the same way as their mainstream volumes. Those customersordering via the internet have different customer service level needs andexpectations from most traditional customers – hence the levels of disap-pointment expressed.
The internet allows for different trading relationships and physicalnetworks to be established. Those traders that develop a vision of the futureincorporating the available potential, enter into partnering arrangements toenhance their internal skill base, review their business processes to meet theircustomers’ needs, implement electronic systems to support those newbusiness processes, and undertake the trade-off calculations to identify themost appropriate ways of meeting all of their customers’ needs will reap the
328 � Global logistics

benefits. Newcomers can learn from those organizations that are acknow-ledged industry leaders and advance quickly up the learning curve.
The opportunity is real. The winners will be those that grasp the oppor-tunity by using the internet as a means of gaining competitive advantage,rather than continue to use it as a bolt-on extra to existing traditional oper-ating methods.
References
Department of Commerce (2004) Ecommerce-guide.com: E-commerce business isbooming, November, US Department of Commerce, Washington, DC
Forrester (2001a) Techstrategy Brief, December, Forrester Research, Cambridge,MA
Forrester (2001b) Techstrategy Report: eBusiness propels productivity, November,Forrester Research, Cambridge, MA
Forrester (2005a) A Buyer’s Guide to Hosted eCommerce Solutions, January,Forrester Research Paper, Cambridge, MA
Forrester (2005b) US eCommerce, 2005 to 2010, September, Forrester ResearchPaper, Cambridge, MA
Forrester (2005c) US Online Marketing Forecast, 2005 to 2010, May, ForresterResearch Paper, Cambridge, MA
GVA (2004) Retail Trends, Third Quarter, Grimley Research, LondonInternet.com (2003) Case Study: Alibris, August
Internet traders can increase profitability � 329

330
Global sourcing andsupply
Alan Braithwaite, LCP Consulting Ltd
Background
Global sourcing and supply is now a central part of many companies’business strategies. It has proved essential to sustaining marketplace competi-tiveness and maintaining net margins. Indeed, global sourcing and supply isprobably both the biggest economic trend of the last 20 years and a key ingre-dient for corporate survival; it takes advantage of low-cost and availablelabour, cheap international logistics, and less regulated operating environ-ments than in mature economies.
The adoption of low-cost sourcing and supply areas has displayed an expo-nential trend, which is forecast to continue. However, the dynamics of thisnew way of operating are only just being understood and have not beendocumented extensively. Global sourcing implies long-distance supplychains, multiple hand-offs and extended lead times. As companies move toincrease their share of global sourcing beyond the current entry levels, therewill be major implications for how these extended chains are managed;security of supply, demand responsiveness and product life cyclemanagement all take on greater significance.
This chapter describes the landscape of global sourcing and supply and thedimensions that companies need to address to ensure a stable operational andbusiness base. Global sourcing is an established geopolitical and economic factof life. It is now a market-driven trend. But the challenge for every individual
20

corporation is to implement it in a way that secures a sustainable advantage.This means organizing to manage risk alongside commercial and competitiveadvantage. All of the principles of supply chain management still apply; thespecifics of global sustainability have many additional dimensions that arenot experienced in more conventional local chains.
Growth in global trade
The expansion of global trade in manufactured goods has been one of themost pronounced and remarkable economic trends of the last 40 years. It hasboth fuelled and enabled the growth in the GDP of most developed countries,exporting jobs to countries with large pools of increasingly skilled and low-cost labour. The capacity of the labour pool in developed countries is beingreleased to higher-value or essentially local activities and the service sector.The scale of this shift is shown in Figure 20.1.
This growth shows no sign of abating. It has been reinforced by thereduction in tariff barriers and the expansion of low-cost internationallogistics in the form of container freight. The importance of global trade isillustrated in Figure 20.2, which shows the strong correlation between import
Global sourcing and supply � 331
0
1000
2000
3000
4000
5000
6000
7000
8000
0
1000
2000
3000
4000
5000
6000
7000
80001950=100 1950=100
1950 1960 1970 1980 1990 2000 2010
World trade and GDP
World trade inmanufactures
Forecast
WorldGDP
Source: WTO/OEF
Figure 20.1 Growth in global trade in manufactures

and export growth. This also demonstrates that there is no correlation withgrowth and the absolute scale of imports and exports. This means that theopportunity of global trade is an economic benefit to both mature andemerging economies. If we set aside the natural tensions of self-interest thathave been evident in recent world trade negotiations, it is clear that there areenormous benefits for buyers and sellers alike.
China has been posting GDP growth of 8 to 9 per cent a year and this hasrecently been described as an underestimate. It refers to itself with pride asthe ‘factory to the world’. No one can ignore this trade potential, and globalsourcing is now a matter of board strategy for all businesses in developedeconomies.
Statements in relation to planned increases in this trend are a regularfeature of annual reports and analyst briefings. Wal-Mart, the world’s largestretailer, made the trend to direct international sourcing a key feature of its2002 annual report, saying:
We also are making exciting strides in… global procurement. Last year we assumedresponsibility of global procurement from a third party. This allowed us to better co-ordinate the entire global supply chain from product development to delivery. Inaddition, our global procurement program allows us to share our buying power andmerchandise network with all our operations throughout the world.
332 � Global logisticsE
xpor
ts a
nd im
port
s $
billi
on
Exp
orts
and
impo
rts
% c
hang
e
0 0%
5%
10%
15%
20%
25%
30%
35%
40%
45%
200
400
600
800
1,000
1,200
1,400
China
Poland
Turk
ey Iran
Ukrain
eUAE
Russia
Sweden
Hungar
y
Saudi A
rabia
South
Afric
a
Vietna
m
Austria
Germ
anyBra
zil
Spain
Nether
lands
Korea
Belgium
Portu
gal
Finlan
d
Denm
ark
Thail
and
Fran
ceChil
e
Singap
ore
Italy
India
Hong K
ong
Japan
Switzer
land
Norway
Taiw
an
Austra
lia
United
King
dom
Canad
aIsr
ael
Indon
esia
Malays
ia
Irelan
d
United
Stat
es
Mexico
Philippine
s
ImportsExporters % changeImporters % change
Exports
Exports and imports ranked by export growth 2002–03
There is a strong correlationbetween growth in imports andgrowth in exports.
Figure 20.2 Correlation of import and export growth showing the countryscale of activity
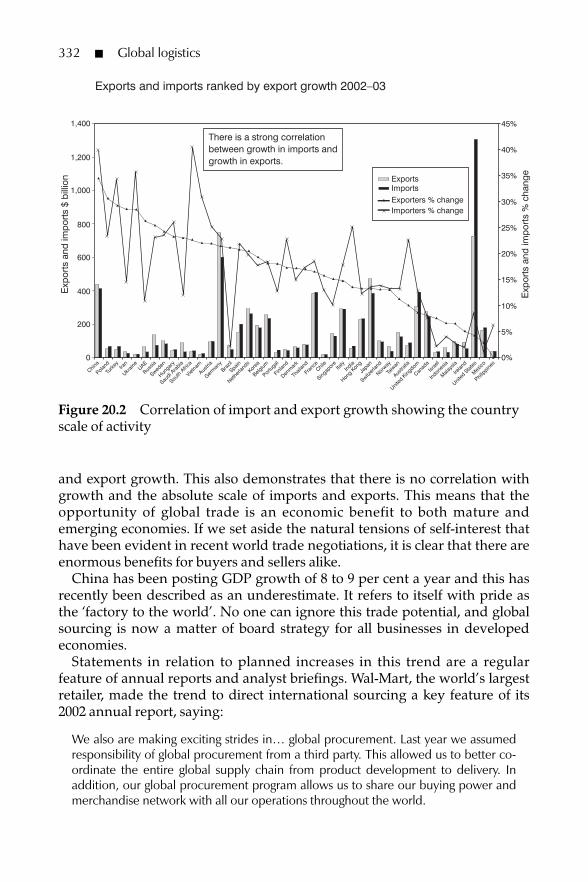
Dyson closed its entire manufacturing in the UK and moved to Asia as a keyelement of its entry strategy for the US market. New origins for the garmenttrade are Turkey and Morocco, where companies can still leverage low-costlabour, but without full Far East sacrifices on lead time and flexibility.
Figure 20.3 shows the critical contribution of the automotive industry, engi-neering and electronics to globalization. In reality, companies like Wal-Martare only catching up and this will probably be at the expense of bothimporters and local manufacturers.
The WTO (2005) predicts that global supply is the future. Indeed, it is anirreversible trend, since capacity is leaving developed markets because itcannot compete with low-cost imports. This global sourcing dimension ofstrategy is now a cornerstone of companies’ plans to generate value forcustomers and shareholders alike. Few can envisage a sustainable futurewithout an increasing level of global supply.
Given this landscape of major change, this chapter brings together somekey dimensions of the practice of global sourcing. It reviews the ‘layer andpillar’ model (Figure 20.4), which proved useful as a means to describe themultifaceted nature of global supply chain management (Liang, 2005). Supplychain management in global sourcing must address all of the layers. Bestpractice is bound together by a requirement to understand and managethrough a structured approach to risk and through the total Cost-to-Serve®.
Global sourcing and supply � 333
World trade – selected industries by value
$bn
02001 2002 2003
200
400
600
800
1,000
1,200
1,400Relative size by value of selected industries
ClothingTextilesConsumer goodsAutomotive productsOffice and telecom equipmentMachinery and transport equipmentFoodAgriculture raw materials
Source: WTO, 2005
Figure 20.3 Global trade growth by product category

Cost-to-Serve, which is a registered mark of LCP Consulting, is a supply chaincosting methodology that can quickly capture the true logistics cost drivers,and identify activities that are intrinsically uneconomic.
Global sourcing as a way to change business strategyThe central role of global sourcing in transforming business strategies can beunderstood by comparing the relative wage rates in regions of the world.Because of difficulties with exact comparisons, these figures are indicativerather than definitive. For skilled labour per hour in Germany the cost is $18to $25; in the Czech Republic it is $3 to $5; in the United States it is $9 to $15; inAsia and India it is often less than $1. The cost of support services,construction, capital investment and management are in proportion, whichmeans that the cost of an equivalent article made in an emerging economy canbe as little as half of that sourced locally.
Traders have been taking advantage of this arbitrage potential for manyyears and have used their local relationships, buying skills and logistics know-how to make a margin. That margin was their return for taking risk, includingquality, financing and marketing. The ultimate price differentials werereduced to 10 to 20 per cent to the end customer.
The surge in growth of global trade is the result of more companies goinginto markets to deal direct – cutting out the middleman. The effect of this hasbeen to increase margins and also to increase the buyer’s risk. The businessstrategy has been to plough back the margin benefit into lower prices, which
334 � Global logistics
Cost-to-Serve®
Riskmanagement
Commercial andcontractual
Logisticsnetwork
Supply chainprocesses
Informationsystems
Skills, capabilitiesand relationships
© LCP Consulting 2005
Figure 20.4 The layers and pillars of global sourcing best practice

in turn has increased volumes and market share. The trick has been – and willbe – to exploit the elasticity of demand by just enough to get more volumethan the margin that has been conceded. Getting this right makes both salesand profits grow.
Across industry as a whole, the trend has been for lower real prices as valueis passed on to customers. The open question is the extent to which this trendis now played out. The next step in global sourcing will involve anotherdoubling of activity levels and this will require improved levels of control andintegration. The skills of supply chain management will become increasinglycentral.
Identifying and selecting sourcesThe practice of sourcing depends on the commodity and product. Forexample, chemicals display different supply characteristics from clothing,which in turn is different from microelectronics. Entering a new sourcingarrangement is a moment of risk and there are many factors to be considered.These include the following:
� Quality is a key issue. Vendors are increasingly able to deliver to quality – butthis ability cannot be taken for granted. The implications of a long-distancequality failure are much greater than a local one, as the problem may not bediscovered soon enough to avoid serious disruption. Increasingly,companies are insisting on more comprehensive quality control at vendors,alongside detailed specification and engineering integration.
� Ethical supply. The marketing and PR impacts of the use of child labour andthe environmental conditions surrounding production are now importantfor consumers. Media disclosures can damage a brand with consumersand shake investor confidence. Increasingly, companies are conductingregular audits and inspections of their sources to make sure that they donot get surprises that damage their reputation.
� Patent protection. The leaking of design and technology advantage hasbecome a common experience. Companies have outsourced to placeswhere respect for patents and know-how is rather less than the standardthey would expect. Often designs, ideas and products reappear throughdifferent channels and can erode markets and price levels. This riskrequires a very careful approach to ensure that key differentiators areprotected and that contractual guarantees are obtained that can beenforced.
� Operational excellence. Vendors’ capabilities can vary widely and it is crucialto understand the extent to which they will be able to perform to expec-tation. For example, late new product introductions can significantly affectthe buying and marketing organization, and there is evidence of shareprice erosion when international chains fail.
Global sourcing and supply � 335

These points require a higher level of due diligence and ongoingmanagement than many might expect. Dealing across cultural boundaries is amajor part of this challenge – and the word ‘yes’ in many languages cannot betaken as an unequivocal agreement.
Commercial modelsGlobal trade is by definition more remote than buying locally. A problem withlocal supply can prompt a whole range of quite simple actions, includingrefusing to pay and taking legal action. With global sourcing and supply theseactions are more difficult, since the goods may already have been paid for, andlegal action is less likely to be successful. Commercial models are, therefore, akey part of supply chain design. These are about the point of payment for thevarious activities along the chain, where the risk is taken, and the margin that istaken or conceded for that risk and credit period. These terms can vary enor-mously by both sector and companies’ preferences. Traditionally traders tooktitle to the goods at the side of the ship and paid with a currency instrument(letter of credit) that was guaranteed by a bank and cross-guaranteed by thebuyer. Then they organized their own freight and paid any duties and tariffs atthe destination. This model is often called FOB (free on board) and has beenadopted by retailers, which are progressively replacing their traders and agents.
Another common option is CIF (cost of goods plus insurance and freight),where the vendor charges for the cost of goods plus the insurance and freightto get them to the final destination. Any duties and taxes in this model are forthe buyer to arrange to pay when the goods arrive in the country. DDP is themost equivalent option to local supply. It stands for delivered duty paid and itis where the vendor takes total responsibility for all costs until the product isdelivered. Financing is invariably part of this package.
These are the most common of many models that are referred to asIncoTerms. The precise selection of the right Incoterm is a critical decision forthe specific trade on extended supply chains with many hidden risks and therequirement for extended financing. It will be influenced by a whole range offactors, including the buyer’s balance sheet, the vendor’s financial capacity,the risk in the trade, and the relative cost of financing and operating the chainunder the different models.
International logisticsThe importance of international logistics cannot be overemphasized. Theflexibility of container freight to make efficient, shared capacity available tomany users has been a huge driver of global trade. But with scale in globaltrade have come new issues that require new approaches.
Even with container freight, traditional methods of managing inter-national logistics can involve as many as 10 to 12 hand-offs in movement and
336 � Global logistics

documents. If just one or two of these fail, with no effective way of puttingthem right, the unreliability of global logistics becomes the reality that isoften a subject of comment and complaint.
With scale and growth, inbound management at the destination nowrequires central coordination. Correspondingly, management at the originalso needs to be controlled to ensure the right flow at the destination and toenable the buyer to take advantage of the scale of its activities. Themanagement of documentation, customs clearance and compliance can alsobenefit from a single centralized administrative and forwarding set-up.
Finally, the question of security against terrorism is now a major concern ininternational trade. There are onerous requirements for certification ofcargoes, especially into the United States, under the C–TPAT (Customs–TradePartnership against Terrorism) scheme. Failure to comply can lead to cargoesbeing refused carriage or blocked for lengthy inspection and clearance.
The result of these factors is that major buyers are tending to appoint aglobal ‘lead logistics service provider’ (LLP). These are often offshoots of thecontainer shipping lines or international freight forwarders that haveextended their services, and are especially appropriate where a buyer is main-taining many trading relationships. In companies where there are a smallernumber of very large trading relationships, the tendency is to adopt an in-house forwarder.
In all circumstances, the operational need is for integrated management ofmany remote origins, providing information visibility, certification, and thecapability to respond to factors in the supply chain.
Flow managementFlow management and control is often executed, but seldom planned, by theLLP. Someone, generally the buyer, has to make the planning, forecasting andordering decisions. The key feature of global sourcing is that chains becomeextended, with longer lead times and less agility to respond to changes in theactual marketplace. This needs improved forecast accuracy and more inte-grated supply chain planning. The consequences of poor planning are acombination of service failures and increased cost from emergency deliveriesand associated expediting.
Global best practice is to introduce a sales and operations planning process,part of which is to identify the products whose demand characteristics makethem particularly vulnerable during extended lead times. With theseproducts there is generally the potential to implement supply chain strategyoptions such as postponement, capacity booking or switch sourcing:
� Postponement is where the product is made and shipped in a generic formso that it can go into a number of different final products. The generic partsare then localized in the final market to meet real customer orders (HP and
Global sourcing and supply � 337

Dell are renowned for using this approach).� Capacity booking is where a vendor is ‘booked’ to provide capacity on a
fixed cycle; the exact mix of product to be made is decided at the lastminute. This reduces lead times and ensures that the product made is theone that is most needed.
� Switch sourcing is where the initial quantity is made in the lowest-costsource and, if demand forecasts are exceeded, any patterns or moulds aretransferred to higher-cost sources where the product can be made andshipped with a much shorter lead time.
Organization designThe organization of global sourcing is a major issue, with companies that useglobal sourcing creating organizations in their main origins that now seemdisconnected from the core organization at the destination. The dilemmaseems to be whether the offices in the origins are buying functions, logisticsfunctions, technical functions – or some combination of these. Each of theserelates to different functions in the parent organization – and ownership andcontrol appear to become an issue. Furthermore, the relationship of the originoffices and capabilities with the main organization is inevitably challenged bydistance, communications, systems issues and – most of all – goals and KPIs.
It is clear that the next stage of maturity in global sourcing and supply willrequire a greater definition of the organizational lines and responsibilitiesthan exists in many businesses today. This will most likely be based on team-based structures working on categories, technologies and product life cycleprojects as appropriate; it will be fully integrated with the core business at theright points and work actively to overcome the barriers of geography andculture.
Information technologyExtended chains require information technology that can manage the long-distance ‘purchase-to-pay’ cycle and all the steps along the way. The key is tomake available a single version of the order and its status to every point alongthe chain. It must allow the appropriate people and organizations to makeamendments, update status and provide a history of events. This is beyondERP, as the various players along the chain (such as vendors, service providersand Customs and Excise) all have many relationships with other parties. Theyalso have particular information needs that will not fit with the customers’ERP systems – and the attributes of the data are rather different from those inconventional ERP systems. The data architecture needs to be able to handleconsignments, waybills, containers, tariffs, providers, VAT and duty as well asorders, SKUs, vendors and locations.
338 � Global logistics
Data interchange between systems is essential to provide the visibilityneeded for flow control. Internet technology has provided the ideal platformon which many-to-many relationships can be maintained. It is low-cost andprovides widely based connectivity. However, every major shipper thenneeds a single reference point for its international trade, and this is unlikely tobe the main ERP system. Some of the major shippers and forwarders haveinvested heavily in such event management systems and the associatedconnectivity. The early versions of these systems have added considerablevalue, and the new generation is expected to provide another step change.
However, the systems world is full of tensions as providers compete topromote their systems and lock in their clients. It is unwise to expect that theIT world of global trade is an open and transparent one. There are manybarriers, including the operational excellence (or lack of it) with which thetechnology is fed.
Operational excellenceWith as many as 12 operational hand-offs in the extended internationalsupply chain, there is much that can go wrong – so operational excellence iscritical to a smooth supply chain. Typical issues that must be done with excel-lence are:
� product labelling and bar-coding – right code, right box, right quantity;� invoicing – right product, right cost, right consignee;� customs – right classifications;� advanced shipping notices for right product;� schedule and date required compliance;� container packing accuracy;� handling quality.
Surveys have shown very high levels of non-compliance and operational vari-ability in global supply. Quite simply, the origin participants do not under-stand the requirements for supply chain management by their customers and,therefore, often do not comply. The use of an LLP can be combined with moreproactive vendor management to make sure that due dates and data qualityare achieved – and to impose charges when standards are missed. Casematerial has demonstrated the downstream value of upstream excellence. Thecost is tiny in relation to the value, and the barriers to excellence are more aboutculture and understanding than deliberate obstruction.
Risk managementRisk management should be continuous for buyers. There is much to beconcerned about, for example:
Global sourcing and supply � 339

� the basics of vendor viability;� sudden and unadvised changes in priorities by vendors and service providers;� quality and timeliness issues;� introduction of unauthorized materials or child labour;� loss/leakage of technical know-how and patents;� sudden and unexpected duty and quota constraints as a result of political
and economic pressures;� currency variations;� sudden and unforecast changes in customer demand.
A lot of these would apply to local supply as well, but their scale and impactswould generally be less. The combination of culture, language, distance andcomplexity conspire to make a formal risk management process with regularchecks essential. This requirement will expand further as global sourcingmoves into its next phase of growth.
Critical success factorsThe measures to manage global chains and mitigate risk require six capabil-ities. These capabilities form the critical success factors:
1. Total acquisition cost management: the ability to analyse and predict the totalcost-to-serve from the source of supply to its final point of sale. The cap-ability in this analysis is not simply to build up the logistics costs fromfreight, inventory holding, duty, applicable customs regimes and so on. Itis more important to analyse and build into the costing the risk ofmarkdown and lost sales through a market–risk–cost profile. This analysisidentifies products that should never be traded on a long lead time or thatshould be the subject of a postponement strategy. It is also likely to showthat there are some products where actions to reduce lead time andincrease flexibility will justify a higher initial purchasing cost.
2. One-touch information flow: to avoid double entry, duplication, mistakesand inconsistency as the same transaction moves through the many pointsof contact in the chain. Accuracy of information is a precondition ofproactive management. This capability is systems-enabled – and it iscritical to have the widest view of the total chain on one informationplatform with the ability to recognize inconsistencies.
3. Total product identification and compliance: to ensure fast, accurate productand handling unit identification that feeds the ‘one-touch information’requirement. The use of bar codes and RFID to the correct standards is theenabling technology.
4. Real-time routeing through dynamic visibility: the capability to see throughthe chain, know what is coming and test for events that have nothappened as planned, and to interpret the implications of failures in a
340 � Global logistics

proactive way and make decisions to minimize their impact. This is the‘traffic control’ of a global supply chain, and it must be managed transpar-ently and with the cooperation of all the parties in the chain.
5. Vendor development: the capability to understand and improve the long-term performance of vendors in terms of cycle times, timeliness, qualityand accuracy. Based on the historical performance of the chain, it ispossible to identify improvement programmes to develop supplier reli-ability. The ultimate goal is to issue orders and schedules on shorter leadtimes, reflecting real demand or more accurate forecasts. Understandingthe underlying performance of vendors and their category of products inthe marketplace is the starting point for this.
6. Information platform to provide consistent and timely information: the cap-ability to put in place, operate and maintain a full supply chain visibilitysolution. All of the above capabilities are anchored by the operational skillto secure and maintain the information backbone, with the diverse datastructures that are needed by each supply chain function.
Global sourcing – sustaining the trendIt is clear that first movers to global sourcing have gained a competitiveadvantage. Often these were traders that had an intimate knowledge of asupply market in terms of the vendors and their capabilities – as well as thelogistics to get the product to the market. They committed to stock risk andknew where to dispose of product if the original channel did not work. Forthis they earned a respectable margin for the risks they took.
In the context of the explosion of global sourcing and the further potential,the conclusion is that the ‘land grab’ is over. Figure 20.5 suggests that we are
Global sourcing and supply � 341
Maturityof GS
Time
Globalsourcing entry
Initialexploitation
Establishingstable
structure
Moving from risk to security
Deeperpenetration
Companies are heretoday, the land
grab is over, and governanceis now important as
the next surge is under way
Figure 20.5 Maturity development of global sourcing

moving from initial exploitation to putting in place stable structures that canhandle the next phase of growth. This will be essential as companies becomemore dependent on long-distance supply chains with all the risks and issuesthat we have identified.
The increased penetration of global sourcing will make its management acore skill and capability. This chapter has attempted to provide an initial viewof the emerging landscape and issues.
References
Liang, JX (2005) Best practice in global sourcing, Unpublished MSc thesis,Cranfield School of Management, Cranfield
World Trade Organization (WTO) (2005) International Trade Statistics, WTO,Geneva
342 � Global logistics

343
The changing supply oflogistics services – a UK
perspective
Colin Bamford, University of Huddersfield
In the four years since the publication of the 4th edition of this book, there hasbeen substantial change to the supply of logistics services in the UK. Thischange has in part been internal to the business through a significant consoli-dation of provision amongst the largest companies. This has included Exel’sacquisition of the Tibbett and Britten Group (2004), closely followed byDeutsche Post’s takeover of the greatly expanded Exel (2005) and furtherconsolidation with Wincanton’s takeover of P and O Trans European (2003).At the same time all companies have experienced difficult trading conditionsas a result of:
� uncertainties over the price of fuel and the climbdown on lorry road usercharging;
� lower operating profits in many cases despite an increase in turnover;� driver shortages and concerns over the short- and longer-term effects of
the EU’s Working Time Directive on logistics providers.
External change and challenges have come about through the further global-ization of supply chains and the demands for a high level of customerperformance from the retail and manufacturing customers of logistics
21

344 � Global logistics
providers, as well as through the long-awaited geographical expansion of theEU in May 2004 to include eight new members in Central and Eastern Europeplus Cyprus and Malta.
In short, much has happened to change the way in which logistics servicesare supplied to customers in the UK.
UK market trends
Table 21.1 shows general trends in the overall market since 1994 (ONS, 2005).As this indicates, in terms of goods moved, the market has been relativelystatic since 1998. This is slightly surprising given the unprecedented andconsistent growth in real GDP over the period. It is also in contrast to theperiod before 1998 when the total goods moved was broadly in line with thestate of the economy.
The causes of this changing pattern are not easy to explain. An obvious oneis the continued de-industrialization of the British economy. The manufac-turing sector has experienced continued decline over the period shown inTable 21.1. Given the derived demand for freight transport, it is clear thatthere is now less demand from customers in those sectors of manufacturingthat have experienced structural changes due to increased competition fromthe rest of the world. By 2004, the manufacturing sector was responsible forless than one-fifth of GDP.
Table 21.1 Freight transport by road – goods moved by goods vehicles over3.5 tonnes, 1994–2004 (billion tonne-kilometres)
Year Mainly Mainly own Total Percentagepublic account2 mainly publichaulage1 haulage
1994 100.8 37.0 137.8 73.01995 106.5 37.2 143.7 74.11996 109.1 37.7 146.8 74.31997 112.2 37.4 149.6 75.01998 114.3 37.6 151.9 75.21999 110.9 38.3 149.2 74.32000 113.0 37.5 150.5 75.12001 114.7 34.7 149.4 76.82002 110.6 39.2 149.8 73.82003 114.3 37.4 151.7 75.320043 110.8 41.4 152.2 72.8
Notes:1 Relates to carriage of goods owned by people other than the operator.2 Relates to goods carried by operators in the course of their own business.3 A minor reclassification means that data for 2004 are not strictly comparable with earlier years.

A second reason for change though is the improvement in logistical efficiencyas a result of better road vehicle utilization. This has been evidenced in a recentstudy by the Department for Transport that indicated that, since 1998, theintensity of road freight activity had increased by just 2 per cent whilst theeconomy had grown by almost 17 per cent (DfT, 2005). The increase since 2002reflects the increased use of 44-tonne vehicles; the average length of haul incontrast has fallen slightly. Transport efficiency has also improved through asteady fall in empty running. This decreased from around 29 per cent in 1998to 26.5 per cent in 2004. In part this can be explained through more suppliercollections and factory gate pricing contracts from major retailers especially. Incontrast, lading factors (the ratio of goods carried in relation to the maximumcarrying capacity of the vehicle) have fallen. This is best explained by theincreased use of less dense unitized loads through the greater use of roll-cages,tote boxes and so on, again mainly by the major retailers.
Table 21.1 also shows that, although there are minor annual variations, the‘mainly public haulage’ sector, which includes third-party logistics providers(3PLs), has remained more or less static at around three-quarters of the totalmarket. A tentative conclusion could be that this sector has more or lessreached saturation level relative to the ‘mainly own account’ sector. If this isthe case, it supports the view that the supply of logistics services through 3PLshas become even more competitive.
The arguments in favour of businesses using a 3PL are well documented(see Chapter 17, for example). This sector in the past has seen most of thegrowth of activity in goods moved. Although the data are not strictly compa-rable, in total terms, the own account sector would appear to be holding itsown. This should not in any way undermine the importance of 3PLs (and insome cases advice from a fourth-party logistics provider, or 4PL) in offering afull range of supply chain management services to clients. As well as offeringthe usual transport and warehouse management services, 3PLs can providefor the assembly and management of inventory and the integration ofbusiness IT systems.
With a relatively static market, there are clear signs of increasing segmen-tation, particularly on the part of middle-sized operators, which are increas-ingly vulnerable to competition from the top tier of providers in the market.Typical segments are automatic parts, food services and home deliveries, toadd to the more traditional ones of fuel oils and chemicals. The top-tier oper-ators tend to have interests in most segments: primary and secondary distri-bution, temperature-controlled as well as ambient.
The annual round of contracts awarded attracts considerable attention in thetrade press (see, for example, Motor Transport magazine). As market growth hasslowed, the market has become even more competitive. The uncertainty overfuel prices, given their importance in contract terms, and the need to be price-competitive have meant that most providers have had a difficult time in main-taining margins. In 2005, for example, Analytica reported that around half of
A UK perspective � 345

the main European providers in 2004 had experienced a small decline in oper-ating margins (Analytica, 2005). This list included Exel, Wincanton, ChristianSalvesen, TDG and GIST.
A crucial issue in any contract renegotiations is whether service levels arebeing met. It has been clear for some time that businesses invariably competeon the efficiency of their supply chains – getting it right is vital for businesssuccess, in the retail sector more than ever.
In a difficult marketplace, the challenge for the top logistics providers hasbeen to meet the needs of supply chain globalization, whilst integrating theservices that they are able to provide. As the Analytica study stated, ‘Thisenables logistics providers to benefit from scale, creating competitiveadvantage and a greater breadth of expertise, both of which results in benefitsto their customers… customer service must come first. This is the only truebase upon which a fully integrated service can be built.’
A further insight into outsourcing and globalization has questionedwhether the former really is a magical solution in cases where businesses havesought to benefit from lower unit labour costs in Eastern Europe and Asia(Sweeney, 2005). It is argued that this has resulted in a shift away fromcontrolling the supply chain through ownership to one based onmanagement and control through effective supply chain relationshipmanagement. In some cases, the outcome has been a disaster. In other cases,particularly in clothing, textiles and hi-tech manufacturing, many companieshave gained significant benefits from outsourcing various supply chainservices. The key to success is to see outsourcing as part of an integratedapproach to managing the supply chain, a task that increasingly is best carriedout by one of the top tier of global logistics providers.
The need for customers to have strategies to exploit the global market is onethat is increasingly being carried out by 3PLs. In some cases, this might be a4PL, an outside organization that has the task of assembling and integratingsupply chain capabilities for clients. Our largest 3PLs now see themselves as4PLs, usually ensuring that much of the supply chain management functionfor clients produces an appropriate amount of business for themselves.
Market structure – continuing consolidation andglobalization
The term ‘market structure’ is one that is used by economists to describe theway in which a market is organized. In distinguishing market structures,there are two key variables, namely the number of firms and the extent ofbarriers to entry for new firms seeking to join the market. The significance ofthese is that they determine the degree of competition in a market. Thesmaller the number of firms and the higher the barriers to entry, then intheory the less competitive the market will be.
346 � Global logistics

In some markets such as grocery retailing, vehicle production and certainbranches of food processing, the level of industrial concentration has beenhigh. In others, such as road freight and distribution, the existence of thou-sands of small firms has meant that historically this has been a very compet-itive, low-concentration market. The continuing consolidation amongst thebig players, particularly since 2000, has resulted in this market showingincreasing signs of being an oligopoly (see Sloman, 2003).
What has happened over the past six years or so is that the 3PL market espe-cially has become increasingly concentrated in the hands of a small number ofvery powerful providers. The experience of Exel and to a lesser extentWincanton is typical of the behaviour of firms in an oligopolistic market. Exel,for example, merged with MSAS Global Logistics in 2000, took over theTibbett and Britten Group in 2004 and was itself acquired by Deutsche PostWorld Net (DPWN) in 2005. In theory, an oligopolistic market has some or allof the following characteristics:
� a market leader that often takes the lead in pricing decisions;� interdependence in so far as the actions of one firm can often determine
the reactions of others;� a strong brand image;� although illegal, the possibility of collusion, for example to squeeze out
would-be competition.
So, to what extent is the 3PL an oligopolistic market? Table 21.2 shows the top10 providers in the UK market in 2003–04 (Motor Transport, 2004). As indicated,Table 21.2 incorporates Exel’s acquisition of Tibbett and Britten; it alsoincludes Wincanton’s purchase of P and O Trans European. Exel had an esti-mated turnover of over four times that of its leading rival and was substan-tially greater than any of the remaining 3PLs shown in the table. This formerstate-owned business has more than maintained its pole position following itsprivatization in 1981.
Tibbett and Britten was perceived as the rising star of the 1990s. Prior to theExel takeover, its turnover had increased tenfold since 1990. It had also led theway amongst 3PLs in establishing a strong foothold in intermodal distri-bution, both for international and for domestic movements, and in the way ithad tackled the challenge of providing 3PL services to clients in the emergingCentral and Eastern European markets.
Wincanton, unlike Exel and Tibbett and Britten, has traditionally concen-trated its growth in the domestic market. Its acquisition of P and O TransEuropean was its first successful venture into the wider European market.Equally, there have been casualties. TDG, for example, has lost market shareas the market has grown and, in late 2005, TNT announced that its logisticsbusiness was to be sold in order to allow it to concentrate its business activitieson its mail and courier/express services. Although the reasons behind these
A UK perspective � 347

changes must be complex, a simple conclusion is that both companies havebeen victims of the increasingly competitive market.
At a European level, as Table 21.3 indicates, in 2004 Exel became the largestsingle provider of logistics services (Analytica, 2005). As with all of the majorplayers, its business is truly global. The acquisition of Tibbett and Britten gaveExel additional business in 13 countries, including Austria, Poland, Romaniaand Slovakia, where it had previously no involvement. The growth in itscontracts logistics business has been particularly strong in Europe, the MiddleEast, Africa and the Americas. In the Asia Pacific region, the provision of airand sea freight services accounted for 75 per cent of its turnover. Growthprospects for contract logistics in this region remain healthy. As in Europe,though, operating margins remain subject to external pressures such as therising price of fuel (Exel, 2005).
The consolidation and integration of the logistics sector has broughtsubstantial business benefits to global European players. These benefits include:
� Economies of sale. As a business increases in scale, it can put pressure on itssupply partners to reduce longer-term average costs when purchasingfuel, vehicles, shipping capacity and so on. There are also financial andrisk-bearing economies.
� Gaining competitive advantage through not only offering a wider range ofservices but also concentrating activities in key market segments such asclothing and textiles, automotive, retail, electronics and so on.
348 � Global logistics
Table 21.2 The UK’s leading 3PLs, 2003–04
Company Financial Turnover1 Percentage Employeesyear end (£m) change on
previous year
Exel2 Dec 03 6,749 +44.2 104,200Wincanton Mar 04 1,681 +68.4 25,000Hays Logistics3 Dec 03 ,854 ,–3.0 n/a4
Christian Salvesen Apr 03 ,846 ,–3.6 n/a4
Autologic Holdings Dec 03 ,701 +4.8 4,380TDG Dec 03 ,541 ,–4.5 7,990TNT Logistics UK5 Dec 03 ,500 +32.5 8,000GIST Sept 03 ,292 +10.2 5,750Kuehne & Nagel Dec 03 ,276 +32.8 , 832Securicor Omega Logistics Sept 03 ,215 n/a 1,700
Notes:1 Total turnover from UK market and elsewhere for UK companies only.2 Includes recently acquired Tibbett and Britten Group.3 Now ARC Logistics.4 Data not available for the logistics side of these companies.5 Estimates.

� Providing a fully integrated supply chain management service for globalclients.
Analytica’s recent research, though, adds a clear warning with respect to thelast point in stating that ‘Integration is not a licence to win new customers… a“one size fits all” solution may not be acceptable to all global manufacturers.This sends out a clear message that customer service must come first.’
Finally, in September 2005, it was announced that Exel’s shareholders hadagreed a massive £3.6 billion takeover bid from DPWN. The logistics arm ofExel would be DHL, with Exel as a sub-brand (Daily Telegraph, 2005). At thetime it was estimated that the combined Deutsche Post and Exel group wouldhave between 6 and 7 per cent of the European logistics market.
The only concern about the takeover was whether it would be blocked bythe European Commission on the grounds that it would impede effectivecompetition in the European logistics market. Although total market share issmall compared to other sectors of business, a dominant firm like DPWN/Exelcould be against the interests of customers of logistics services. After only abrief period of investigation, the Commission approved the merger.
On the face of it, this deal is about logistics. Underneath, though, therewould seem to be a very serious threat to the UK’s Royal Mail, which inJanuary 2006 saw its traditional postal business opened up to full competition.Deutsche Post is already a competitor to the Royal Mail in the bulk mailmarket. Its marriage with Exel’s logistics expertise must surely enhance itsopportunities to make further inroads into the UK postal market.
A UK perspective � 349
Table 21.3 Europe’s leading logistics providers, 2004
Company Turnover in Change in turnover2004 (£m) in 2003 %
Exel 8,961 25.2Schenker 8,042 17.3NYK 7,976 7.1Kuehne & Nagel 7,432 21.2Deutsche Post World Net 6,786 15.4Logista 4,406 8.0TNT Logistics 4,082 9.3Panalpina 3,965 14.1Ryder 3,776 7.2Geodis 3,371 4.8Wincanton 2,438 2.7

The EU25 – new market opportunities and threats
Given the nature of the degree of change analysed in the last section, onemight conclude that UK 3PLs have a strong hold over the domestic marketand that they have little to fear from operators based elsewhere in the EU.This conclusion might also naively be made from the conclusions of researchby the Institute of Grocery Distribution (IGD), which once again recognizedthat UK 3PL operators are the most efficient within the whole of the EU (IGD,2005). This may well be the case, in particular for the retail grocery market, butin other sectors 3PLs from the rest of the EU and elsewhere are having anincreasing share of the UK market.
Table 21.4 shows some such operators (Motor Transport, 2004). Most haveparticular strengths in the automotive and clothing sectors. In addition, thestrength of companies such as DHL and UPS, both of which are major playersin the express parcels and document sectors, should be recognized.
The geographical enlargement of the EU in May 2004 has presentedincreased market opportunities for 3PL operators, including those based inthe UK. Prior to the formal accession of the eight countries in Central andEastern Europe (CEE) plus Cyprus and Malta, various UK operators such asExel (including in particular Tibbett and Britten) and P and O Trans European(now part of Wincanton) had penetrated the market in Central and EasternEurope. All have recognized the considerable market opportunities in Poland,the Czech Republic and Hungary.
In these countries there are two main types of opportunity for UK 3PLs.These are
1. Non-food. Unit labour costs in the joining countries are substantially lowerthan elsewhere in the EU. Consequently, automotive manufacturers suchas VW Audi and Suzuki have established assembly plants in these countries
350 � Global logistics
Table 21.4 Non-UK-owned hauliers in the UK market
Company Turnover 2003–04 Change from previous year(£m) %
Autologic Holdings1 701.7 +4.8Kuehne & Nagel 275.7 +32.8DFDS Transport 157.0 +12.1
UK subsidiaries:TNT Logistics (UK) 500 +32.5NYK Logistics (UK) MIR 135 +23.5Gefco UK 110 +0.5
Note:1 Includes Walon, Ansa and Acumen.

and ship finished vehicles into the rest of the EU. Other typical manufac-turers are those involved in chemicals, electronics and textiles. As well asproducing for export, the domestic market in these countries is growing aslocal consumers become more affluent.
2. Retail distribution. This has been an obvious area of development. EUretailers such as Tesco, Metro, Carrefour and so on now have a strongpresence in Poland, Hungary and the Czech Republic. It seems logical forthem to follow the same logistics practices as in their domestic markets. Insome cases, their 3PLs have moved into the market with them.
Getting a foothold in the CEE market is a risky and uncertain business. Some3PLs have bought transport and warehousing companies in these countries,Tibbett and Britten being a particularly good example. An alternative meansof entry is to go it alone and set up a brand new operation. This outcome, ofcourse, is much less certain to succeed.
Realistically, UK companies may have the logistical expertise to makesubstantial inroads into the expanding CEE market. Geographically, though,German operators are far better placed to know the market and the opportu-nities that may be available. This is a major threat to UK operators.
Transport policy issues
Businesses supplying logistics services are required to operate within a policyand regulatory framework that is increasingly laid down by the EU. It isbeyond the scope of this chapter to look at recent issues in depth. It is, though,useful to indicate those that have been and remain of particular concern to UK3PLs, for example:
� The Working Time Directive. From April 2005, all operators governed bydrivers’ hours regulations (excluding self-employed) must comply withthese new rules (European Commission, 2002). Driver working time isnow limited to an average 48-hour week over a reference period. No morethan 60 hours can be spent working in any single week. Complying hasraised fundamental problems of driver shortages, although last-minuteconcessions on ‘periods of availability’ have helped some operators.
� Drivers from new EU countries. The accession of eight new CEE memberstates to the EU has opened up the opportunity for drivers and warehouseoperatives from these countries to work in the UK. This may help companiesin places where there is a labour shortage, although there are concerns overthe rates of pay that are being offered. Whether the current wave of activityby recruitment consultants becomes a flood remains to be seen.
� The comparative price of diesel fuel between the UK and the rest of the EUremains a major concern to all UK operators, not only those involved in
A UK perspective � 351

international work. Given the importance of fuel costs in relation to totaloperating costs, any marked variation in fuel prices between the UK andthe rest of the EU must damage the competitiveness of UK operators.
Conclusions
It should be clear from this chapter that the market for 3PL logistics services issubject to ongoing change. Demand-side influences – a highly competitivedomestic market and opportunities in the CEE – require UK companies tobecome increasingly efficient to maintain pole position in the European market.
Simultaneously, supply-side factors have seen major changes in ownership,with increasing concentration in the top tier of operators. This has coincidedwith concerns over the impact of EU regulations on UK operators, although incontext these are unlikely to halt the process of market consolidation andglobalization.
References
Analytica (2005) Profitability in European Logistics, Analytica, LondonDaily Telegraph (2005) Exel snapped up in £3.6bn takeover, 19 SeptemberDepartment for Transport (DfT) (2005) Continuing Survey of Road Goods Transport,
DfT, LondonEuropean Commission (2002) Working Time Directive, 2002/15/ECExel (2005) Delivering value across the supply chain, Annual Report, ExelInstitute of Grocery Distribution (2005) Retail Logistics, IGD, Watford.Motor Transport (2004), 30 SeptemberOffice for National Statistics (ONS) (2005) Transport Statistics, Great Britain,
ONS, LondonSloman, J (2003), Economics, Prentice Hall, New YorkSweeney, E (2005) Outsourcing – a managerial solution?, Logistics Solutions,
8 (1)
352 � Global logistics

353
Developments inWestern Europeanlogistics strategies
Michael Browne, Julian Allen and Allan Woodburn,University of Westminster
Introduction
Several political initiatives have taken place since 1990 that have had majorimplications for logistics services throughout Western Europe:
� Border controls and customs arrangements within the EU were liftedfollowing the creation of the Single European Market (SEM) under theTreaty of Maastricht in January 1993.
� In 1999, the euro was launched as an electronic currency and became legaltender in 2002. It was implemented in 12 EU states, which represent the‘eurozone’ (Austria, Belgium, Finland, France, Germany, Greece, Ireland,Italy, Luxembourg, the Netherlands, Portugal and Spain). The EuropeanCentral Bank is responsible for the monetary policy within the eurozone.
� Ten more countries (Cyprus, the Czech Republic, Estonia, Hungary,Latvia, Lithuania, Malta, Poland, Slovakia and Slovenia) joined the EU in2004, bringing the total to 25. These 10 members increased the surface areaof the EU by a quarter, and its population to 450 million. Bulgaria, Romaniaand Croatia are expected to join the EU in the next few years.
22

354 � Global logistics
Central to the logic of creating the European Union free from unnecessarytrading restrictions has been the desire to encourage the development ofEuropean companies able to compete on a global basis. It is often claimed thatfragmented national economies within Europe have resulted in too manysmall companies in certain key industrial sectors. Dismantling barriers totrade and opening up new market opportunities allow companies to growand become more competitive. Inevitably this is also likely to result in therelocation of certain economic activities as some companies become largerand others fail. The collapse of communism in the former Soviet Union andthe countries of Central and Eastern Europe, and the subsequent reorien-tation of these countries towards the free market, has also opened up newavenues of trade that extend beyond the borders of the EU.
This chapter addresses the ways in which company business strategies andoperations have been developing within Europe during this time of politicaland economic change, and the effect that this is having on the demand forlogistics services, and the corresponding supply.
Changes in the demand for logistics services
An enlarged and more integrated Europe has influenced the demand forlogistics services. Indeed, markets for goods and services in Europe havebecome much less fragmented over the past 10 years and at the same time, formany companies, there has been a discernible shift away from a mainlynational approach to a more unified European strategy. In general, companiesincreasingly regard the EU as their home market rather than having theirtrading horizons restricted to a single country. This in turn has importantimplications for logistics services. For example, increased trade betweenmember states creates new demands for logistics services such as transportand warehousing. However, the transition to a European pattern of operationhas not been as smooth as many commentators expected and in some casesthe benefits have been slow to emerge.
Market developments and retailer/manufacturerstrategiesIncreasing market integration enables large companies to pursue a number ofstrategies designed to take advantage of their size. The scope to concentrateproduction at a small number of carefully selected locations is one that has aspecial importance within Europe. Until recently the strategy followed bymany companies was based on production for separate national markets. Therequirement to produce product variants for different markets, thecomplexity of border crossing formalities and the added costs of internationaltrade transactions led, typically, to a rather fragmented approach to

production. Although for many companies the changes in strategy have beenpart of a broader response to growing global opportunities and increasedinternational competition, the abolition of border controls and the simplifi-cation of trading procedures have undoubtedly encouraged plant and ware-house rationalization.
Since the business ambitions of many companies are not confined to theexisting EU, the scope for inventory rationalization has grown as Europebecomes more commercially integrated. Dismantling trade barriers hasallowed firms to reduce the number of warehouses within their logisticssystems, which in turn has important longer-term implications for transportpatterns. Instead of looking at Europe on a country-by-country basis, firmshave been able to consider more natural market demand patterns and adapttheir warehousing accordingly. Significantly, these developments are notconfined to the EU – many firms have already adopted a very wide definitionof Europe in developing their logistics strategies. For example, Bosch-Siemens(manufacturers of domestic appliances with a head office in Munich) took itsfirst steps in cross-market distribution by rationalizing its Scandinavian ware-housing operations and consolidating stocks for Finland, Norway andSweden in one regional centre located between Stockholm and Malmo,distributing to other Scandinavian countries from that single location(O’Laughlin, Cooper and Cabocel, 1993). There are many examples of thistype of initiative as companies have changed their traditional views about thebest way to serve markets. The sports equipment firm Nike has adopted acompletely centralized strategy for storage within its European supply chaindespite increasing diversity of sourcing and continued demands for fastresponse to customer requirements (Kemp, 1997). Geest, the prepared foodcompany, announced plans to consolidate production in 2001, with dressedsalads being produced at one rather than two sites (European LogisticsManagement, 2001b). The French food group Danone also announced arestructuring plan for its biscuit production business in 2001, in which six of its36 factories in Europe would be closed, with production levels increasing atthe remaining factories (European Logistics Management, 2001a). The trend tocentralization has taken a firm hold on management thinking and there arestill many companies seeking further opportunities to reduce the number ofstockholding points. Whether these initiatives can be justified against a back-ground of pressure to develop more sustainable logistics strategies remains tobe seen.
Many large companies now take a supply chain view when consideringnew ways 1) to integrate their own operations and then 2) to seek to extendthis integration to their supply chain partners. Growing integration hasprofound implications for the role of external service providers since in manycases the physical flow of materials is one of the first areas of change when asupply chain view becomes more clearly developed. When companies startthe process of considering the supply chain as a whole it often becomes
Developments in Western European logistics ❚ 355

evident that there is scope to rationalize the number of service providers, inmuch the same way as it may become possible to reduce the number of stock-holding points.
A survey of logistics costs has been carried out by the European LogisticsAssociation (ELA) and AT Kearney Logistics five times during the past 20 yearsand indicates that costs as a proportion of sales fell by approximately 50 percent for Western European companies between 1987 and 2003 (see Figure 22.1).This has been achieved at the same time that customer service has been rising.However, the survey results indicate that cost reductions were limitedbetween 1998 and 2003, and respondents’ forecasts about likely logistics costsin 2008 suggest that they will remain at approximately 6 per cent of salesrevenue. More than 100 companies in 14 European countries responded to thesurvey, which indicates that transportation is the single largest component oflogistics cost, representing 43 per cent of total logistics costs in 2003.
Market concentration has been occurring in the vast majority of Europeanretail and manufacturing markets in recent years. In grocery retailing, forexample, the market share of the top five national retailers in severalEuropean countries including the UK, the Netherlands, Belgium, Germanyand France is between 50 per cent and 70 per cent (Mintel, 2002). However, itis important to recognize that the degree of market concentration variessignificantly between industries in any one country, and that the generaldegree of market concentration varies from one country to another.
356 � Global logisticsC
osts
as
a %
of s
ales
0
0
0 0.5 0.5
5.9
3.9 2.8
2.6 2.7
2.4
1.8
1.6 1.5 1.1
2.5
1.7
1 0.8 0.8
1.3
1.2
1 0.8 0.9
0
2
4
6
8
10
12
14
1987 1993 1998 2003 2008
Administration
Inventory
Warehousing
Transportation
Transportation packaging
Source: ELA and AT Kearney, 2004
Figure 22.1 Logistics costs as a proportion of sales

Limitations on European integrationDespite growing similarities, there are still many differences betweenEuropean countries; retailing is a case in point. The retail format used indifferent European markets varies significantly between countries, with verylarge stores playing the biggest role in some countries (eg hypermarkets sellingfood and non-food in France and out-of-town supermarkets in the UK) andsmall food stores and traditional grocers far more common in others (such asSpain and Italy). As a result of these different retail formats, the numbers ofstores operated by retailers varies between European countries; for example,there are approximately 120,000 grocery stores in Italy compared with only33,000 in the UK (WARC, 2002). In addition, patterns of consumption also varywidely between European countries for a range of cultural, demographic andeconomic reasons. If one argues that we are now operating within an inte-grated European marketplace, this ignores the special distinguishing featuresof Europe and, in particular, the complexity, size and maturity of the market,the density of population spread, the number of separate nation-states, andthe many languages. It must be acknowledged that in many cases these factorshave acted as a brake on the introduction of European-wide supply chains andlogistics systems to serve them.
However, many companies will continue to strengthen their Europeaninitiatives, resulting in further examples of corporations making dramaticchanges to their European logistics networks – which in turn places newdemands on logistics managers and logistics services. We need to be awarethat there are often conflicting tensions within large organizations and, insome instances, initiatives to implement changes on a European scale will beovertaken by the desire to have in place a framework allowing global coordi-nation of supply chains. Changing priorities can make it difficult to determinethe most appropriate way to develop logistics management structures andthis in turn has implications for the relationship with service providers(Hindson, 1998).
Eastern Europe and distribution centre locationsAlongside the move towards centralization noted earlier has been a moveeastwards within European manufacturing and distribution. As Lenders(2005) notes, an increasing number of manufacturers are relocating fromWestern Europe towards Eastern Europe. Since most raw material shipmentsare arriving at ports in Western Europe, the logistics flows that follow fromthis change in strategy are potentially important. In turn there is a strongexpectation that European distribution functions will also move eastwardsfrom their present concentration in the Netherlands. This has led some topredict a new location for distribution ‘hot spots’ within Central and EasternEurope (Lloyd, 2004). While it would be wrong to exaggerate the speed of this
Developments in Western European logistics ❚ 357

trend, it is nevertheless clear that this type of development reinforces theneed for a more Europe-wide approach to the selection of European logisticsservices. In addition, from a policy perspective it poses some major challengesfor existing European transport infrastructure.
Market structure of logistics service providers
Recent changes in the demand for logistics services in Europe pose a problemfor logistics service providers (LSPs), as they are working with a range ofcompanies all moving at different speeds towards what may well be rathervaried objectives. Out of this challenge comes the advantage for the biggerorganization that can match these requirements across and within differentmarkets.
Company size and response to international opportunitiesEuropean deregulation, the abolition of internal frontiers, harmonization offiscal and technical standards and the introduction of the euro have all helpedto boost trade within an enlarged EU – and made it simpler for all LSPs toparticipate in that activity. Many factors influence the response of logisticscompanies to these opportunities. Among the most important are:
� company culture and background (for example, the size of the companyand its ability to absorb the financial and management consequences ofrapid change);
� customer profile (industry, and speed of reaction to European opportunities);� customer culture (for example, the customers of the LSP could purchase
services either at the European level or purely on a national basis).
Company size is likely to have a special significance in determining theresponse to the opportunities created by an enlarged EU. Larger logisticsproviders can continue internationalizing their activities to provide fullnational distribution services in more than one country. For smallercompanies the impact of an enlarged EU are far more limited. There are, forexample, many small road freight companies that operate at a local level andexpect to go on working in this way. Although these smaller companiespredominate in terms of numbers, it is the larger companies that dominate themarket in terms of the total vehicle fleet and capacity. In the United Kingdom,for example, 7 per cent of hire or reward companies operate 56 per cent of thevehicles, and this is a trend that can be identified right across the EU (ReedBusiness Information, 2002).
358 � Global logistics

Internationalization among larger carriersOne way in which LSPs can enter into foreign markets is through the estab-lishment of operating centres in other countries and gradually increasingtheir networks. However, rather than follow this evolutionary and somewhatslow route to growth, some firms prefer the prospect of mergers, takeovers orstrategic trading alliances with operators based in other European countriesas a means of becoming more international.
The growing internationalization of business has forced companiesproviding logistics services to consider their own strategies to meet these newneeds. Service providers need to determine the extent to which they can meetall the service requirements of a European business or whether they can real-istically only meet part of those needs. In many cases there remains a potentialmismatch between the logistics demands of European companies and theability of any single service provider to meet these demands. This often resultsin disappointment when a manufacturer decides to rationalize its logisticsnetwork and reduce the number of service providers it deals with – only tofind that there is no LSP that wishes to take on the commitment of handlingall its European activities (Distribution, 2002).
Providers of logistics services need to be concerned with two dimensions totheir activities in the first instance: geographical scope and range of services.A consideration of these two dimensions highlights how challenging it reallyis for the logistics service company to be able to provide ‘one-stop shopping’for a European company. Some companies already provide what can bedescribed as European services in the sense that they are the long-distancelinks in a network used by manufacturing companies. This provision ofservices is evident in the case of airlines, shipping lines, freight forwardersand integrators. It is clearly at the level of local and national distribution thatEuropeanization of service provision has been slowest to develop.
Freight transport and warehousing services have been widely available formany decades, together with associated documentation services, but in recentyears LSPs have begun to offer an ever expanding range of services, such asfinal assembly of products, inventory management, product and packagelabelling, product tracking and tracing along the supply chain, orderplanning and processing, and reverse logistics systems (which tackle thecollection and recovery of end-of-life products and used packaging in thesupply chain).
Despite a period of uncertainty about the benefits of scale for LSPs, therehave been some important developments in the last few years. Larger LSPshave grown mainly through merger and acquisition and appear to becommitted to developing more European and global capabilities:
� Deutsche Post World Net (DPWN) is the former state department respon-sible for German postal services. In 1995 it became a private company
Developments in Western European logistics ❚ 359

owned by government, and it was partly privatized in 2000. It has pursueda strategy of extending its geographical coverage in the mail and expresssectors as well as expanding the range of logistics services offered. The aimof the company is to become an international player capable of offering anextensive range of mail, express and logistics services, and therebyproviding one-stop shopping for national and international customers.Most of its growth has been achieved through acquisitions (Harnischfeger,2002), including express companies (DHL, Securicor Distribution, andDucros) and distribution companies (such as Danzas, ASG, AEI andNedlloyd ETD). The most recent major acquisition is Exel plc, whichDeutsche Post acquired in 2005, making it the largest logistics provider inthe world, with 500,000 employees and R55 billion in annual sales(Deutsche Post, 2005).
� Exel had itself been involved in a major merger with Ocean Group in 2000,creating the largest logistics service provider in the UK and one of thelargest in the world. The merger was viewed as highly appropriate,bringing together the contract logistics capabilities of Exel Logistics with thefreight-forwarding strengths of Ocean Group. Both of these companieshad been active in the acquisition market over recent years, which had ledto Exel Logistics’ presence in several European countries and to Ocean’sservices in both Europe and the United States (Datamonitor, 2002).
� Kuehne & Nagel has 40,000 employees based at approximately 600 loca-tions in more than 100 countries. Traditionally the company was a signifi-cant presence in the sea- and airfreight markets, and recently it has beenexpanding its contract logistics expertise through acquisition. An alliancewith SembCorp Logistics of Singapore increased Kuehne & Nagel’spresence in Asia. The acquisition in 2001 of USCO, a large logistics serviceprovider in the United States, increased the company’s strengths, withwarehousing and distribution becoming part of its service offering (King,2002). The acquisition of the overseas logistics division of French groupCAT in 2004 facilitated the expansion of forwarding activities in France aswell as in Mexico and Belgium (Kuehne & Nagel, 2004). In 2005, thecompany acquired the contract logistics group ACR Logistics, a majorcontract logistics provider in Europe. This acquisition increases thenumber of employees to 40,000 – and the logistics services offered nowinclude supply chain management, distribution and transportmanagement, factory support, and value-added services (eg call centremanagement and repair management), as well as managing approxi-mately 3 million square metres of warehouse space (Kuehne & Nagel,2005).
� TNT NV is a global provider of mail, express and logistics services,employing over 161,000 people in 63 countries, with sales of R12.6 billion(TNT, 2006). The company announced in 2005 that it was going to changeits strategic focus to its core competency of providing mail and express
360 � Global logistics

network services. As a result, TNT decided to sell its logistics business,which was producing R3.4 billion in annual revenues. This focus on itsdelivery networks would allow simplified operations, with the companyretaining only a limited amount of the logistics activities that clearly fittedits core network strategy (TNT, 2005). TNT achieved much of its growththrough acquisition – but it is itself now subject to a possible takeover bid(10 per cent of shares in TNT are still owned by the Dutch government)(Manners Bell, 2005).
Transportation in Europe
European freight activityThe changing demand for logistics services in Europe has had a significantimpact on transportation patterns and activity. Europe’s economic growthhas gone hand in hand with a growing flow of goods. The growth in freighttransport in Western European countries between 1970 and 2002 is shown inFigure 22.2. During this same period there has been an ongoing shift towardsroad transport and, to a slightly lesser extent, short-sea shipping within andbetween Western European countries (see Table 22.1). These data relate to the
Developments in Western European logistics ❚ 361B
illio
n to
nne-
kilo
met
res
01970 1980 1990 2000 2002
500
1000
1500
2000
2500
3000
3500
Road Rail Inland waterways Pipelines Sea
Figure 22.2 Growth in freight transport in Western Europe (EU15) (billiontonne-kilometres)

15 member states of the European Union prior to its enlargement in 2004.Although there are some important differences between individual countries,it is evident that road freight dominates the inland movement of goods withinEurope and that road freight has increased in recent years. Short-sea shippingservices have also grown in importance and account for almost as muchfreight activity as road. Rail, inland waterways and pipeline have all lostmarket share, though the decline has slowed in more recent years.
There is also an integration effect – for example, the EU countries trade fourtimes more foodstuffs than other countries with identical production andconsumption levels – and this has important implications for logisticsdemands. As already discussed, the prospect of a Europe free from internalborders spurred many companies to review and then reconfigure theirlogistics systems (Cooper, Browne and Peters, 1994). This has resulted in arationalization of both production and stockholding sites among some largecompanies, thereby increasing the demand for national and, especially, inter-national transport services. At the same time there has been a trend to reducestock levels by managing production more carefully and implementing just-in-time operations. Both of these have led to an increase in the consumptionof transport services within the supply chain – as a result of either increasingtrip length (with concentration of production and storage) or greaterfrequency of deliveries (with just-in-time systems). In addition, there isgreater pressure on transport services to achieve high levels of reliability.
Many developments in modern logistics tend to increase road transport(see Table 22.2). The growth in international trade and sourcing as well as therelevance of new business strategies will make policies aimed at reducingroad transport difficult to implement. It is still not clear whether the concen-tration of production and warehousing will in fact open up new opportu-nities for rail and inland shipping – although in theory this should happen.
At the same time as this growth in road freight activity across Europe, mostcountries have also experienced significant growth in car traffic, resulting in
362 � Global logistics
Table 22.1 Trends in market share of freight transport modes, EU15(tonne-kilometres)
1970 1980 1990 2000 2002% % % % %
Road 35 36 42 43 45Rail 20 15 11 8 8Inland waterways 7 5 5 4 4Pipeline 5 4 3 3 3Sea 33 39 40 42 41Total 100 100 100 100 100
Source: European Commission, 2004

increasingly congested urban and inter-urban road networks. Freight transportcosts and operational efficiency are ever more affected by this road congestion.
Policy measures affecting logistics and transport inEurope
European Commission White Paper on TransportThe European Commission White Paper on Transport published in 2001 has iden-tified many potential policies that if introduced, would have significant effects onfreight transport and logistics services. It identified the lack of fiscal and socialharmonization in the transport market as leading to several key problems:
Developments in Western European logistics ❚ 363
Table 22.2 Developments in logistics and the impact on transport andtraffic
Main development Impact on transport and traffic
Modal shift towards road More road vehicle trips
Spatial concentration of Longer distances; increase in transport volumesproduction and warehousing on key routes
Adoption of JIT in manufacturing Smaller shipments; faster transport (road);decrease in load factors
Adoption of quick response and Smaller shipments; faster transport (road);ECR in retail distribution decrease in load factors
Wider geographical sourcing of Raw materials and components transported oversupplies greater distances
Wider geographical distribution Finished products transported over greaterof finished product distances
Supply chain integration Decrease in number of suppliers and transportproviders; increased road transport in the case ofmore outsourcing
Decrease in order cycle time Demand-driven flows leading to increased numberof trips; decrease in transport efficiency
Increase in assortments Smaller shipments; increased number of trips
Reverse logistics Additional transport of waste materials and end-of-life products
Retail market concentration Fewer, larger out-of-town stores, encouraging theuse of car journeys for shopping
Source: Adapted from NEA, quoted in Dutch National Spatial Planning Agency, 1997; and TechnicalUniversity of Berlin et al, 2001

� Unequal growth in different modes of transport. This reflects that not allexternal costs have been included in the cost of transport as well as the factthat some modes have adapted better to the needs of a modern economythan others.
� Congestion on the main road and rail routes, in urban areas and atairports. Growth in the demand for goods transport is due to the shift froma ‘stock’ economy to a ‘flow’ economy.
� Harmful effects on the environment and public health.
In the view of the European Commission, ‘sustainable development offers anopportunity, not to say lever, for adapting common transport policy. Thisobjective, as introduced by the Treaty of Amsterdam, has to be achieved by inte-grating environmental considerations into Community policies’ (EuropeanCommission, 2001: 14). The White Paper proposes 60 specific measures to betaken at Community level as part of the transport policy, grouped under fourmain objectives. The measures that are likely to have the greatest impact onfreight movement are incorporated into the following themes:
� Shifting the balance between modes of transport, addressing a wide rangeof issues such as: infrastructure charging; capacity utilization; regulationsand enforcement; inter- and intramodal competition; taxation; and inte-gration of the different modes to achieve the best outcome in economic,social and environmental terms.
� Eliminating bottlenecks, particularly through the development of thetrans-European network and its corridors, with priority for freighttogether with traffic management plans for major roads.
� Managing the effects of transport globalization, particularly theimprovement of access to remote areas and the incorporation of the newEuropean Union member states into the existing transport networks andoperations.
Policies encouraging the use of rail, inland waterwaysand short-sea shippingThe European Union anticipates considerable further growth in freighttransport, but is developing policies to ensure that as much of this growth aspossible is by non-road modes. It hopes to achieve higher shares for thesemodes through a combination of measures to achieve two key objectives:regulated competition between modes, and the integration of modes forsuccessful intermodality. The policies essentially seek to ensure that thedifferent modes of transport account for their true costs and compete on anequal basis, while investment is made in the infrastructure to support rail andwaterborne traffic to ensure that the capacity exists to increase their share ofthe freight transport market.
364 � Global logistics

At the international level, the European Union is implementing its Trans-European Network (TEN-T) programme (European Commission, 2005). Thisoriginated in the 1990s and by 2005 a total of 30 key projects were eithercompleted, under way or being developed. By 2020, the Network shouldinclude 89,500 kilometres of roads and 94,000 kilometres of railways, 11,250kilometres of inland waterways (including 210 inland ports), 294 seaports and366 airports. The majority of new or enhanced infrastructure will be formodes other than road. A number of the TEN-T key projects are wholly orsignificantly focused upon rail and inland waterway freight transport,including:
� international intermodal (rail) corridors (eg the Iberian peninsula toFrance);
� the Betuwe railway line from Rotterdam to the German border;� the Rhine/Meuse–Main–Danube inland waterway axis;� the Seine–Scheldt inland waterway.
Significant capacity exists in the seas around Europe, and this can be exploitedsubject to sufficient port capacity being available. The European Union is,therefore, promoting the concept of ‘motorways of the sea’ (EuropeanCommission, 2006). Four corridors have been identified for projects to:
� develop more efficient, more cost-effective and less polluting freighttransport;
� reduce road congestion at major bottlenecks across Europe;� provide better-quality, more reliable connections for Europe’s peripheral
regions;� assist in making Europe’s economy stronger and more sustainable.
The four corridors are the Baltic Sea, Western Europe (Atlantic Ocean–North Sea/Irish Sea), South-Western Europe (western Mediterranean Sea) and South-Eastern Europe (Adriatic, Ionian and eastern Mediterranean seas). It is intendedthat these sea corridors link with other modes of transport – particularly non-roadones – to encourage intermodal flows.
The European Union is also concerned with the charging of access to thetransport infrastructure for different modes, since freight users do not alwayspay for the costs that they impose on others. Policies are being developed tointegrate external costs into the charging regimes and to harmonize fueltaxation. It is widely expected that these policies will favour rail and water-borne modes, with their rates becoming more competitive relative to roadhaulage.
Particular issues exist for rail freight operations, which have been slow toadapt to the Single European Market. As a result, policies have beendeveloped to encourage rail freight to become more competitive. These
Developments in Western European logistics ❚ 365

include open and non-discriminatory access to infrastructure for rail freightservice providers to stimulate competition, transparent pricing, interoper-ability between national transport networks, the development of priority railfreight corridors, and quality assurance standards for freight services. Sincerailway privatization in Great Britain in the mid-1990s, rail freight’s modeshare of the total road and rail market has increased from 9 per cent to 12 percent, representing an absolute increase in rail volumes of 45 per cent. Manyfactors have led to this increase, though the development of competitionbetween an increasing number of operators is an important contributoryfactor. This British experience contrasts sharply with that in many otherWestern European countries, where liberalization of the rail network hastended to be much slower.
Policies concerning goods vehicles in urban areasGoods vehicles operating in urban areas are subject to a growing number ofpolicy measures. These measures are being implemented by policy makers inresponse to congestion, pollution and safety issues, and include:
� time-of-day access and loading restrictions (including night deliveries);� vehicle size and weight restrictions for urban logistics work;� congestion charging systems;� the development of urban freight consolidation centres;� the use of alternative vehicle fuels and quieter vehicles (through the
promotion of appropriate technologies and compulsory restrictions);� the promotion of information systems and telematic applications with
scope to improve logistics efficiency in urban areas;� establishing partnerships between different retailers, transport and
logistics operators, and local government to put in place measures toachieve greater efficiency and reduce negative impacts in freight activityin urban areas.
Time and vehicle weight and size restrictions have been used for manydecades to control the use of goods vehicles in urban areas. However, theserestrictions are being applied in more urban areas in Western Europe, espe-cially in central business districts and retailing areas – and often accompanypedestrianization schemes. There have also been trials to see if night deliv-eries are feasible, with delivery and collection at times when urban areas arequieter and pedestrians are not present (Browne et al, 2005a).
Congestion charges were introduced in central London in 2003 to addressroad congestion. This is an area-based scheme – approximately 5 kilometresfrom east to west and 4 kilometres from north to south – for vehicles that arein the area between 7 am and 6.30 pm on weekdays. All vehicles entering thezone (except alternatively fuelled and electrically powered goods vehicles
366 � Global logistics

that attain very strict emission standards) are subject to the charge of £8 (R12).Since the introduction of charges, the total volume of traffic entering the zoneduring charging hours has fallen by 18 per cent and there has been a 30 percent reduction in delays. Transport for London research suggests thatcongestion charging has had a broadly neutral impact on business perfor-mance in the charging zone. However, some retailers believe they have beenadversely affected. Other urban authorities have shown interest in theLondon congestion charging scheme but none have implemented a similarscheme so far.
The aim of urban consolidation centres (UCCs) is to avoid the need forgoods vehicles to deliver part-loads into busy urban areas. This can beachieved by providing facilities for consolidating deliveries into the urbanarea in an appropriate vehicle with a high load utilization. UCCs have beenstudied, trialled, and established in urban areas in several Western Europeancountries including France, Germany, Italy, the Netherlands, Spain, Swedenand the UK. The approach has differed between these countries in terms ofthe organization of the UCC (ie the extent of private and public sectorinvolvement), whether it is a compulsory or voluntary scheme, and the typesof logistics operators it is aimed at (either small or large logistics operators).Many early UCCs have since closed, especially in Germany. However, newschemes in Italy, Sweden and the UK suggest that UCCs are likely to continueand may well become more popular (Browne et al, 2005b).
Greater use of alternative vehicle fuels and quieter vehicles is beingachieved by national and urban authorities through a combination ofresearch and promotion, as well as through compulsory vehicle operatingschemes. In the Netherlands, the PIEK research programme has studied anddisseminated information about vehicle and associated delivery noise (PIEK,2003). In the UK, the Freight Best Practice Programme produces guidance foroperators about a wide range of vehicle design and fuel issues, as well asinformation systems and telematic applications to improve logistics efficiencyin urban areas. Meanwhile, in some urban areas, low-emission zones (LEZs)have been introduced. The LEZ concept reduces emission levels by restrictinggoods vehicle (and potentially other vehicle) access to those vehicles thatmeet certain emission criteria. Such zones already exist in some Dutch andSwedish cities and are planned for London (Browne, Allen and Anderson,2005).
Partnerships have been established between retailers, transport andlogistics operators, and local government to agree measures for greater effi-ciency and reduce negative impacts in freight activity in urban areas.Examples of such schemes are the work carried out by Platform StedelijkeDistributie (PSD, or the Forum for Physical Distribution in Urban Areas) in theNetherlands, and freight quality partnerships (FQPs) in the UK (Browne et al,2004).
Developments in Western European logistics ❚ 367

Other policy measures affecting road freight transportThere are two other policy measures that are having a significant impact onroad-based freight and logistics services in the EU, and may also affect thelocation of logistics and other industrial activities. These are 1) the EUWorking Time Directive and 2) road user charging for goods vehicles.
The EU Working Time Directive (WTD) was applied to the freight transportsector in all EU states in 2005. These regulations introduce limits on weeklyworking time, and the amount of work that can be done at night. Under thenew regulations, working time for goods vehicle drivers must not exceed:1) an average 48-hour week, 2) 60 hours in any single week, and 3) 10 hours inany 24-hour period, if working at night (DfT, 2005). This represents areduction in the total number of hours that goods vehicle drivers can work ina week, with an overall reduction from 55 hours to 48 hours in the UK (Pott,2001). This creates a need for companies to employ more drivers to maintainthe same level of distribution activity.
Time- or distance-based road user charging for goods vehicles relates thecharge to the usage of the vehicle, and better reflects the costs that usersimpose when using roads. Time-based road user charges already exist inBelgium, Luxembourg, the Netherlands, Denmark and Sweden. Switzerlandcurrently uses a distance-based road user charge. In 2005, a new toll systemwas introduced on the 12,000 kilometres of German autobahn for all trucksweighing 12 tonnes and more. This toll taxes trucks on the basis of thedistance driven, the number of axles and the emission category of the truck –with an average charge of R0.12 per kilometre (roadtraffic-technology.com,2005). An extension to this scheme will allow the government to add otherroads to the toll network (m.logistics, 2005). The British government planneda distance-based lorry road user charge by 2008, which would have ensuredthat truck operators from overseas paid their fair share towards the cost ofusing UK roads (HM Treasury, 2002). However, the government announcedin 2005 that it would not proceed with the scheme, and national road pricingfor cars and goods vehicles is unlikely to be introduced before 2015.
Opportunities and pressures for logistics providers ina new Europe
It is evident that many multinationals are rationalizing the number of LSPsthey deal with across Europe – in much the same way as they have ration-alized their production and warehousing operations (there is, of course, a linkbetween these developments). This, together with the growth in intra-European trade, is leading to greater demand for transport and logisticsservices. Political changes have opened up new geographical markets, bothfor production and for consumption. Devising and implementing the right
368 � Global logistics

logistics strategies lie at the heart of successfully capitalizing on thesecommercial opportunities. Many of these changes are of significance to LSPs,especially those concerned with international markets.
The very different nature of European markets means that logisticsproviders wishing to provide for this growing demand for services adoptsuitable and appropriate approaches for different markets. Internationaltransport companies engaged in cross-border work already understand thatstrategies need to be tailored to the particular country of operation.
Naturally, what is right for one company will not be right for all. Inparticular there are important differences between the sort of strategies andinitiatives that need to be devised by larger companies and by smaller ones.
Strategies for larger LSPsIn deciding how to take advantage of the new European opportunities, LSPsneed to be clear about which of the following strategies they wish to adopt(shown in Figure 22.3):
� a pan-European strategy: providing a Europe-wide service offering distri-bution both within and between a number of European countries;
� a multi-domestic strategy: providing national services that are in severalEuropean countries;
� Eurolinkers: providing a network (or part of a network) of mainly inter-national services between major European markets.
Clearly the most ambitious strategy is to provide a truly pan-Europeanservice. Several major LSPs are working towards achieving this – but it is achallenging goal. The foundations for the multi-domestic strategy lie in thesuccessful duplication of domestic services – adapted as required – in othercountries.
Strategies for small- and medium-sized service providersThe smallest LSPs tend either to operate at a local level or to work for a fewcompanies. The scope for these companies to develop strategies to takeadvantage of European opportunities is rather limited. For medium-sizedcompanies – and especially those already operating in the internationalmarketplace – there are undoubtedly ways in which they could takeadvantage of the growing opportunities in the EU. However, many multina-tionals are seeking to rationalize the number of logistics providers that theydeal with and, therefore, medium-sized providers should find ways to tietheir operations into those of their customers so that they become a vital partof their customers’ distribution operation.
Developments in Western European logistics ❚ 369

Concluding remarks
Cost-effective systems of goods distribution are often argued to be anessential prerequisite for competing in international markets and for deliv-ering a good standard of living at a national level. Efficient distribution ofgoods and services influences market diversity, consumer choice, jobs andprosperity. So logistics becomes as critical to economic success as manufac-turing, retailing and service industries, contributing to economic growth by:1) extending market reach, thereby giving firms access to a wider range of rawmaterials and supplies and providing access to a wider market; and 2)reducing waste – concepts such as just-in-time have a significant impact onreducing stock held within supply chains.
370 � Global logistics
Pan-Europeans
Multi-domestics
Eurolinkers
Country A
Country B Country C Country D
Source: Browne and Allen, 1994
Figure 22.3 Strategy options for providers of logistics services

Logistics management and supply chain strategies play a critical role in thecompetitiveness of firms. Indeed, it has been argued that competition is increas-ingly between supply chains rather than between individual enterprises.Within logistics, the role of transport is an important one and is frequently theaspect of logistics most affected by policy interventions (for example, deregu-lation of transport markets or decisions about infrastructure expenditure).
A number of logistics developments have tended to increase theconsumption of transport services within the supply chain. This can eitherincrease trip length (with the concentration of production and storage loca-tions) or give greater frequency of deliveries (with JIT).
However, there are also many positive logistics initiatives that combineboth environmental and commercial benefits. Clearly, companies at theleading edge already enjoy the benefits of this and contribute to sustainability.There is much to be gained by improving the efficiency of companies that arenot at the forefront of these initiatives. Therefore, ways must be found toencourage more companies operating in Europe to improve logistics andensure that those approaches that contribute to sustainability become morewidely disseminated.
References
Browne, M and Allen, J (1994) Logistics strategies for Europe, in Logistics andDistribution Planning: Strategies for management, ed J Cooper, Kogan Page,London, pp 122–134
Browne, M, Allen, J and Anderson, S (2005) Low emission zones: the likelyeffects on the freight transport sector, International Journal of Logistics:Research and applications, 8 (4), pp 269–81
Browne, M et al (2004) Urban freight movements and public–private partner-ships, in Logistics Systems for Sustainable Cities, ed E Taniguchi andR Thompson, pp 17–35, Elsevier, Oxford
Browne, M et al (2005a) Night-time delivery restrictions: a review, Paperpresented at the third International Conference on City Logistics, 25–27June, Madeira, Portugal
Browne, M et al (2005b) Urban Freight Consolidation Centres, Report to the UKDepartment for Transport, University of Westminster, London
Cooper, J, Browne, M and Peters, M (1994) European Logistics: Markets,management and strategy, 2nd edn, Blackwell Publishers, Oxford
Datamonitor (2002) Consolidation in the European Logistics Industry, June,Datamonitor, London
Department for Transport (DfT) (2005) Road Transport (Working Time) Guidance,March, DfT, London
Deutsche Post (2005) Deutsche Post World Net completes acquisition of Exel,Press release, 14 December, Bonn/London
Developments in Western European logistics ❚ 371

Distribution (2002) Europe yet to become a single entity, interview with SteveAllen, managing director of Securicor Omega Logistics, Distribution, 15 (3),June, p 17
Dutch National Spatial Planning Agency (1997) Spatial Patterns ofTransportation: Atlas of freight transport in Europe, Dutch National SpatialPlanning Agency, The Hague
European Commission (2001) European Transport Policy for 2010: Time to decide,White Paper, Office for Official Publications of the European Communities,Luxembourg
European Commission (2004) European Union: Energy and transport in figures2004, Directorate-General for Energy and Transport, Brussels
European Commission (2005) Trans-European Transport Network: TEN-T priorityaxes and projects 2005, Directorate-General for Energy and Transport,Brussels
European Commission (2006) Motorways of the Sea: Shifting freight off Europe’sroads, Directorate-General for Energy and Transport, Brussels
European Logistics Association (ELA) and AT Kearney (2004) Excellence inLogistics, ELA, Brussels
European Logistics Management (2001a) Danone’s plan to revamp biscuitbusiness includes closure of six manufacturing sites, 17 April, p 9
European Logistics Management (2001b) Geest accelerates French acquisition,19 February, pp 9–10
Harnischfeger, U (2002) Deutsche Post out to prove its gusto, Financial Times,20 September, p 30
Hindson, D (1998) The pressure for pan-European logistics, Pan-EuropeanLogistics Conference, 20–21 January, London
HM Treasury (2002) Modernising the Taxation of the Haulage Industry, ProgressReport One, April, HM Treasury, London
Kemp, D (1997) Competitive supply chain structure: Nike – a case study,World Logistics Conference, December, London
King, M (2002) We can be king of the jungle, International Freighting Weekly,1 April, p 7
Kuehne & Nagel (2004) Expanding integrated logistics in France, WorldMagazine, 1, p 21
Kuehne & Nagel (2005) The quantum leap: the acquisition of ACR Logistics marksa new era in contract logistics for Kuehne & Nagel, World Magazine, 2, p 22
Lenders, R (2005) European DCs on the move, Capgemini Supply Chain andProcurement Newsletter, November
Lloyd, S (2004) Europe’s DC hot spots, Logistics Europe, April, pp 38–42Manners Bell, J (2005) Market monitor November 2005, Logistics Europe,
November, p 16Mintel (2002) Food Retailing in Europe, Mintel, Junem.logistics (2005) Telematics – they work if you let them, m.logistics, 17,
May/June
372 � Global logistics

O’Laughlin, K, Cooper, J and Cabocel, E (1993) Reconfiguring European LogisticsSystems, Council of Logistics Management, Oak Brook, IL
PIEK (2003) Technical final assessment PEAK multi-annual programme, PIEKproject, Utrecht
Pott, R (2001) Working time: part one, Croner’s Road Transport OperationBulletin, 53, May
Reed Business Information (2002) Road Transport Market Survey 2001, ReedBusiness Information, prepared by NOP Research Group, London
roadtraffic-technology.com (2005) LKW-MAUT Electronic Toll Collection Systemfor Heavy Goods Vehicles, Germany, http://www.roadtraffic-technology.com/projects/lkw-maut/
Technical University of Berlin et al (2001) SULOGTRA: analysis of trends insupply chain management and logistics, SULOGTRA Deliverable ReportD1, Workpackage 1
TNT (2005) TNT announces initiatives to sharpen strategic focus, TNT pressrelease, 6 December
TNT (2006) TNT and Malherbe conclude deal for the sale of the remainingactivities of Logistiques Nicolas, TNT press release, 27 January
World Advertising Research Centre (WARC) (2002) The Retail Pocket Book 2002,WARC, Henley
Developments in Western European logistics ❚ 373

374
Logistics strategies forCentral and Eastern
Europe
Grzegorz Augustyniak, Warsaw School of Economics
Introduction
The fall of communism in Central and Eastern Europe (CEE) at the turn of the1990s began a fascinating period of systemic transition. This period of trans-formation has coincided with unprecedented economic integration in Europethat, on the one hand, creates enormous opportunities and advantages, but,on the other, needs great – often painful – changes. Since 2004, eight formerSoviet-bloc countries have joined the European Union (the Czech Republic,Estonia, Hungary, Latvia, Lithuania, Poland, Slovakia and Slovenia), anothertwo (Bulgaria and Romania) may join the EU in 2007 and most of theremaining ones strive to do so in the future. Both the new members of theCommunity and the candidates must follow or adapt quickly to EU standardsat a time of slow economic growth in Western Europe, and intense compe-tition resulting from globalization and the lifting of trade barriers within WTOmember countries. The scale of changes in CEE countries, inherited gaps ininfrastructure and limited access to financial resources make the implemen-tation of logistics strategy – or any strategy – in this region very difficult.
When analysing the situation in CEE countries we should not forget thatdespite their numerous similarities – resulting from their common fate as
23

Soviet satellites – each is significantly distinct. The most often quoted differ-ences between them include:
� the size of the respective markets (measured by population and per capitaincome);
� the size of territories and their geographical configuration (determiningtheir logistics systems);
� different starting positions for reforms (determined, for example, byownership and industry structures, foreign indebtedness, etc);
� cultural and historical differences;� different ways, degrees and effectiveness of reforms implemented (from a
shock-therapy approach, through evolutionary progress, to almost givingup);
� different levels of salaries, productivity and price indexes (which in turndifferentiate them from their richer partners in the West, as indicated inTable 23.1);
� degree of integration with NATO and the EU, with new EU members fromCEE in a favourable position because of EU financial support for lessdeveloped regions and structural funds.
For these reasons, this description of logistics strategies for CEE is focused onthose countries that are the most advanced in the transition process, andwhose logistics strategies are the most similar. This primarily refers to theCzech Republic, Hungary and Poland. Just recently, Slovakia joined the team,with a high increase in investments due to favourable conditions for foreigninvestors and a flat, transparent tax system. These four countries share similar
Logistics for Central and Eastern Europe � 375
Table 23.1 Comparison of salaries, labour standards and price indexes inselected cities (Zurich, Berlin and capitals of new EU members representingCEE)
City (country) Salary index Working hours Vacations Priceper year (days per year) index
Zurich (Switzerland) 100 1,872 23 100.0Berlin (Germany) 64 1,666 28 75.0Lubljana (Slovenia) 21.2 1,830 22 55.0Budapest (Hungary) 16.6 2,012 23 56.0Warsaw (Poland 13.0 1,901 26 50.7Riga (Latvia) 12.6 1,862 20 43.0Tallin (Estonia) 12.4 1,826 21 50.0Prague (Czech Republic) 11.8 1,943 22 40.3Vilnius (Lithuania) 11.2 1,833 26 49.0Bratislava (Slovakia) 9.7 1,881 19 38.3
Source: Eurostat, 2005; Dudzik, 2004

political strategies that are based on integration with NATO (as new membersaccepted in 1999), development within the European Union (since 2004), andjoining the eurozone no later than 2011.
While focusing on those three, we should not forget that EU membershipalso affects other CEE and Baltic states that have recently joined theCommunity. All of these are similar in size but differ in per capita GDP, withSlovenia being the richest of all CEE countries. When talking of NATOenlargement we should mention states that are less advanced in reforms, butbecoming strongly Western-oriented, such as Bulgaria and Romania, whichaspire to join the EU in 2007. Such aspirations are also expressed by otherBalkan states and Ukraine.
In other words, the CEE region constitutes a mosaic that is struggling withinternal logistics problems, while aiming at integration of its logistics systemswith both the EU and within CEE.
It would be hard to overestimate the impact of this integration on the coun-tries’ logistics strategies. However, the current conditions determining thedevelopment of logistics in CEE are to a large extent the result of thecommunist legacy, so it is necessary to take a brief overview of the ‘old’ systemof working practices.
Conditions of economic development of CEEcountries before 1990
After the Second World War, the economic development of CEE countriesfocused on their reconstruction. This was accompanied by rapid industrial-ization based on heavy industry and mining. However, this industrialstructure did not reflect the real needs of the economies but was ratherdictated by the prevailing ‘Cold War’ doctrine. As a result, in the 1960s, whilethe West was experiencing its first consumer revolution, Comecon countrieswere still developing enormous industrial potential, with almost completedisregard for actual consumer needs. The problems were exacerbated by themeasures of organizational effectiveness. The most common was based on themaximization of assets employed. In other words, the more you use resources(ideally, the entire amount assigned by the relevant central plan) the better.When economies were faced by shortages of supplies, the focus was shiftedtowards maximization of output – but abandoning any measures of quality.Other measures of performance were meaningless, since permanentshortages of consumer products – sold at fixed prices – gave producersabsolute powers in the market. The ways of doing business in CEE countriesstimulated waste and corrupted workers, whose intuitive efforts at rational-ization were not only ignored but were, in many ways, punished (Kisperska-Moron, Kapcia and Piniecki, 1996).
376 � Global logistics

Paradoxically, the wave of Western credit in the l970s, when East–West rela-tions were relaxed, deepened the economic crisis in CEE countries. Moneywas wrongly spent or consumed, and this resulted in huge indebtedness.Moreover, industrial plants built on Western technology made countriesdependent on imports of spare parts, and when these became too expensivethey could only be replaced by low-quality substitutes produced locally.Consequently, the efficiency and life span of production lines were signifi-cantly reduced. Further attempts at reform in the 1980s brought nothing buteconomic slump. Soon, the political system collapsed, and since 1989 CEEcountries, one after another, have moved towards market economies.
The logistics system of CEE before 1989In centrally planned economies, knowledge of logistics and other modernmanagement concepts and techniques was practically useless. The onlyexceptions were found in those companies whose export orientation exposedthem to operations in the West. In other companies, monopolistic producers,whose distribution was also in the hands of monopolies, dominated the quasi-market. The government set prices for products and services (with few excep-tions where higher prices were allowed) and fixed the currency exchangerates. In these circumstances, the only business goal was to exist – at theexpense of the state, which covered any loss.
The only concern of logistics was to obtain scarce resources from suppliers tosecure the execution of centrally set plans (which meant that the logistics in CEEhad a very strong supply orientation) and to deliver goods produced tocustomers. This sounds similar to the tasks of logistics in the West, but with thesignificant difference that the logistics system was not focused on quality. Noneof the logistics systems objectives (well known from the ‘7 Rs’ definition) had tobe fulfilled, and both effectiveness and customer satisfaction could be ignoredwithout penalty. Ineffectiveness was officially explained by ‘objective reasons’ –or sometimes by firing or imprisoning selected managers, employees or ‘specu-lators’. This approach led to enormous waste and technological obsolescence ofcompanies, which treated investments and customer service as costs to beavoided rather than sources of potential improvement and revenue.
These facts indicate that the logistics system of CEE countries was extremelyexpensive, especially because of high transportation and inventory carryingcosts. The transportation system consisted of a relatively dense, but low-quality,infrastructure serviced by obsolete and inefficient fleets. Another major factorcontributing to the high cost of transportation was the commercially ridiculous(but politically motivated) location of production plants and other logistics facil-ities. The criteria for location were based on a theory of balanced developmentfor all regions in a country. This meant that a factory could be erectedanywhere, regardless of its proximity to suppliers or consumers, existing trans-portation, telecommunication infrastructure and the profile of the labour force
Logistics for Central and Eastern Europe � 377

available. In practice, every investment of this kind required huge investmentsin new roads and social infrastructure, eg workers’ hotels, heating plants,sewage systems, etc. This was rarely shared with any other local facilities. Tomake matters worse, the lack of money often meant that new infrastructure wasincapable of serving the needs of the facility. The result of these poor locations –and supporting infrastructure – decisions was that distances travelled bytransport were far greater than necessary, for both supply and distribution. Thisoften had an impact on the quality of goods carried – while the fixed cost ofinvestment was very high, the system generated a lot of pollution, and otherenvironmental threats were totally ignored. Another major drawback for CEEcountries lay in the poor telecommunication infrastructure, which came with alack of incentive to improve information flows.
Shortages of supplies, combined with inefficient transportation, forced allcompanies in CEE to carry huge amounts of inventory to secure smoothproduction. This meant that inventory was treated more like an investmentthan a necessary evil. The quality aspect again had no impact on the system,since eventual waste was added into the cost of production. Final productdefects did not harm the producers, since chronic shortages meant thatcustomers were forced to accept any products they could find.
Overall, the 1990s found CEE countries with inefficient, fragmented and out-of-date logistics systems that did not meet their requirements as they movedtowards market economies. The system was generally characterized by:
� a lack of customer focus;� the underdevelopment of a transportation and telecommunication
infrastructure;� poorly located, ineffective and obsolete industrial plants and related
logistics infrastructure (especially low-standard warehouses);� a lack of specialized, integrated logistics services;� inadequate and poor management education, especially in logistics and
quality management across all levels;� a lack of reverse logistics systems – as there were no environmental policies
for, say, the reuse and recycling of packaging and hazardous waste;� low employee morale and job satisfaction.
The clear conclusion is that the logistics system inherited from communismwas a fundamental barrier to the transformation of these economies and theirsubsequent competitiveness. This is supported by an analysis of the cost oflogistics of these countries – which is estimated at up to 30 per cent of GDP,perhaps twice as high as typical values in the West. Thus, poor logistics is amajor counterbalance for the few advantages of the region, such as:
� a low-cost and technically well-educated workforce;� incentives for investment in selected regions;
378 � Global logistics

� the relatively low cost of land acquisition;� favourable geographical conditions (part of the EU market and its transit
location);� the size of the market and its potential, accompanied by rapid economic
growth.
Logistics has a huge potential for significant improvements and savings, andsuccessful transformation in this area might be a key to success for CEE coun-tries (especially those that have recently joined the EU) and investors.
Development of logistics in the period of transitionand after joining the EU
At the beginning of reforms, all CEE countries suffered from similar problems– though on different scales. Their major effort in the early 1990s concentratedon stabilizing the macroeconomic condition, focusing on curbing inflation (orhyperinflation, as it was in Poland), high unemployment (a term that neverexisted in centrally planned economies) and social security. Simultaneouslyremoving most barriers and curbs on entrepreneurship – accompanied byprivatization of government-run industries – led to the rapid, but also chaotic,development of market economies. Government efforts to gain some sort ofcontrol over these changes were made on a trial-and-error basis. In general –regardless of the many limitations, mistakes and high social costs – those CEEcountries that followed more radical approaches to reforms have becomeleaders in the transition to market economies.
Soon, the development of market economies and the need to competeglobally raised new challenges for politicians and entrepreneurs, whorealized that:
� the transition into market economies means that CEE markets will grad-ually adopt Western patterns;
� the relaxation or abandonment of trade barriers forces these countriesradically to improve their productivity;
� the major impediments to the transition will be the underdevelopedbanking, telecommunication and transportation systems that are heavilydependent on the state or are hard to privatize.
Unfortunately, the shaky political situation in CEE countries (both during thecreation of democratic institutions and habits, and caused by changinggovernments) coupled with the need to pursue tough financial policies(based on IMF guidelines) was a major obstacle in implementing reforms.These problems were magnified by the sudden fall of production andreplacement of local products by imports. This created an unfavourable trade
Logistics for Central and Eastern Europe � 379

balance with the West that could not be compensated for by trade with theEast, since the Comecon system no longer existed and internal ties had beenbroken. Lower incomes for governments and inherited indebtedness (despitesubstantial reductions) limited their scope for investment in logistics infra-structure. While it was not a major problem at the beginning of transition,after a few years of rapid development the state of the deteriorating – or atbest very slowly improving – transport and logistics infrastructure became themajor obstacle for future development. To understand better the reasons forthis, it is worth considering the major factors that stimulated the rapid growthin logistics and related areas, which include:
� the rapid growth of trade;� productivity improvements, especially in inventory management;� deregulation and liberalization in some modes of transportation;� development of telecommunication and information infrastructure;� development of management education;� accession to the EU.
Developing tradeThe general area of ‘trade’ was the first to adapt itself fully to the marketeconomy, the main reason being that the consumer market was the weakestelement of the previous system and attempts to deregulate it were imple-mented before the systemic changes of the 1990s. Trade was also the first areain which private capital was invested and entrepreneurship appeared.Growth of the sector was especially high in the retail industry. In Poland, thenumber of retail outlets (mostly small shops) tripled between 1989 and 1995,excluding the number of pedlars and market stalls that covered the streets ofcities and villages. Of course, this growth reflected the great underdevel-opment of these services during communist times.
Along with retail trade, wholesaling companies were reorganized andmany new ones entered the market. At the beginning these were local firms orfamily business units. But they were soon confronted with aggressive compe-tition from large wholesaling and retailing companies from the West(including large supermarket chains like Casino, Carrefour, Tesco and Metro),which also brought new technology. For these companies CEE is now one ofthe major markets (with hundreds of hyper- and supermarkets), with furtherexpansion planned into Ukraine and Russia.
These new entrants had an inherent advantage, since the collapse of the oldsystem caused paralysis in the former centralized and state-ownedcompanies, but there is still some space for expansion.
Another sign of the gradual unification of CEE markets with the West is abehavioural change among consumers, who now prefer shopping at largesupermarkets and department stores at the weekend (Rutkowski, 1996). This,
380 � Global logistics

in turn, has forced small shops to search for consolidation opportunities toenable them to compete with the large hyper- and supermarket chains.Another strategy, implemented by local grocery shops, is to make a transitioninto convenience stores that operate longer hours, offer wider ranges ofproducts and improve customer service and shop layout.
Significant improvements in customer service, along with better consumerlegal protection (increasingly matching EU standards), encourage moresophisticated systems of delivery, often aimed at achieving just-in-time, quickresponse (QR) and efficient consumer response (ECR). Joining the EUremoved another significant obstacle that ruined many logistics strategiesand lowered the attractiveness of the region: this was congestion at borders,which reduced vehicle performance by 15 per cent or more.
Among other positive changes in CEE logistics systems is the rationalizationof costs, with significant improvements to stock levels and turnover, whichhave reduced the average costs of inventory by more than 20 per cent. Thebiggest improvement is in food products and other perishable items. This wasachieved despite – as is typical in an emerging market – shifts of inventoryfrom distributors and retailers to producers. Now, the producers are adoptinginnovative approaches to production and distribution, including flexiblemanufacturing and advanced management concepts.
Warehousing is also a dynamically developing area. There was an initial fallin numbers resulting from the bankruptcy of old, multi-storey and small ware-houses. But then many companies, both local and foreign, started to developmodern and well-equipped warehouses, and provide services that go beyondthe standard stockholding. The first state-of-the-art logistics platforms werecreated at the end of the 1990s, with many new logistics production centresalready completed. In 2005, total modern warehousing and logistics spacereached 1.2 million square metres, and the capacity of the recently plannedlogistics centre in Piotrków Trybunalski in central Poland is 500,000 squaremetres. In the Czech Republic, 110,000 square metres of new space is addedannually (mostly around Prague and seven other major cities). In Hungarythere are already around 200 industrial parks providing logistics services tomanufacturing and service companies. Most of these centres are run by large,well-known companies, which start to consider them not only as centres forfurther expansion to the East (into Ukraine, Belarus and Russia) but also aslogistics centres for Central Europe including some ‘old 15’ EU member states.Such platforms not only improve services, but also create new employmentopportunities. Logistics becomes a vital element of the whole economy, andthe demand for logistics specialists – as a new profession in CEE – is very high.
As in the West, logistics centres have added activities, including finalproduction activities outsourced by large manufacturers. These develop-ments – along with a growing inflow of foreign investments, growth of localmarkets and exports – have created a basis for rapid growth in advancedlogistics services. Third-party logistics services became a reality in CEE, and
Logistics for Central and Eastern Europe � 381

the introduction of fourth-party logistics is only a question of time. Anotherpositive sign of change into more sophisticated contracts is the rising numberof companies integrating their whole supply chains.
It is also worth mentioning that there has also been a rapid development ofmanagement and logistics education, both at university level and as a part ofin-company training. This is also reflected in the growing number of profes-sional logistics associations and clubs, and the many professional magazinespopularizing logistics theory and practice.
Road transportAll these developments in logistics require parallel development of thetransport network and services. After decades of state monopoly, trans-portation became a hot topic during liberalization, with road transport beingthe first mode to be substantially deregulated.
Domestic services were offered by almost anybody who held a driver’slicence and registered the activity. In terms of international transport, somerestrictions applied, but after joining the EU the market reopened, givingtransport companies new opportunities of offering services between EUstates. The liberalization of road transport led to the establishment of thou-sands of small, private carriers – and the prices for these services decreasedsignificantly, taking most business away from the railways. However, thiscreated some negative impact on safety, environmental protection and theprofitability of the sector. The rush to attract more and more orders fortransport services and the maximization of loads resulted in widespreadviolation of transport procedures – especially for the rest time of drivers andoverloading trucks. The dynamically developing and deregulated roadtransport industry left government agencies unable to control safety stan-dards. This gap, especially in Poland, forced the authorities to take radicalmeasures to reorganize the system by investing in more truck weigh stations(including mobile ones) and the creation of a specialized agency – RoadTransport Inspection – empowered to penalize any deviation from technical,legal and humanitarian (such as the movement of livestock) standards.
After joining the EU the regulations got stricter and forced many transportcompanies to reorganize and modernize their fleet and management systems.Of course, opening new markets created new opportunities for transportcompanies in CEE, but they also faced new and fierce competition fromcompanies in other EU countries. This again resulted in a drastic reduction inprofitability, and eventually the lowering of service standards. But nowcompanies had begun to quit the ‘cheapest-and-nearest’ approach to carrierselection and looked for more integrated, dedicated services offered byrespected and well-established logistics companies. Some of these are stillindependent and local – but the leading ones are country-wide, with longexperience of international transport, or have emerged from forwardingagencies that are part of global companies like Schenker, P&O, etc.
382 � Global logistics

Despite concentration, small, private transport companies can stillmodernize themselves and succeed in market niches. They are obviouslymore vulnerable to competition, but prospects are good, since road transportremains the dominant mode (except in Estonia and Latvia, where seatransport is dominant) and there is no strong competition from other modes.
These changes are associated with a programme of construction of newroads and motorways supported by the EU. Unfortunately, progress still lagsbehind the growing transport needs, and the density of motorways is farbehind that in former EU15 states (3 metres per square kilometre in CEEagainst 17 metres in EU15). Motorway construction in Poland attempts to useprivate–public partnership, but this appears to be ineffective, slow and verycostly – both in construction and in use by motorists (because of high tolls).This in turn means that new motorways do not attract enough traffic to give areturn on investment. More progress in this area has been made in the CzechRepublic, Slovakia and Hungary, but it does not change the overall picture ofa growing infrastructure gap between EU15 and new members. For example,the planned density of motorways in the Czech Republic in 2008 (12.8 kilo-metres per 1,000 square kilometres) is still below the EU15 average in 1999(15.8 kilometres per 1,000 square kilometres). The situation requires moreaction both at the EU and at the local levels, since further deepening of thisgap may adversely affect the investment attractiveness of CEE countries – andultimately the development of Eastern markets.
Rail transportRailways in CEE countries are still run by the state, and the restructuringprocess is not as advanced as other modes. Each country is searching for thebest route to eventual privatization, but owing to large numbers of employeesand the high cost of modernization the transformation changes are only grad-ually being implemented. In Poland, for example, the first step was to separateall services (such as maintenance facilities, construction companies, etc) fromthe railways. This has already allowed a few non-state-run railway companiesto act as carriers, paying for the use of the track – and hopefully fosteringcompetition and allowing better allocation of resources for modernization andupgrades. But substantial modernization to allow heavier loads and higherspeeds of transport will require enormous additional financial resources.
More progress has been made in separating cargo and passenger opera-tions. At the moment, some local connecting passenger services are beingclosed, while vital commuter lines in cities are managed by local authoritiesalone, or in cooperation with the former monopoly. Fully owned staterailways usually focus on intercity connections.
The major obstacle to restructuring comes from the trade unions, whichrealize that applying market principles will mean track closures and furtherreductions in employment (at a time when unemployment is high, reaching18 per cent in Poland). The need for such a reduction paradoxically reflects the
Logistics for Central and Eastern Europe � 383
relatively high density of rail track (with the majority of the network elec-trified – 60 per cent in Poland, 45 per cent in Hungary, but only 30 per cent inthe Czech Republic, compared to a 52 per cent average for EU15). But much ofthis is used exclusively for commuter passenger services, or has minimal usebecause of competition from road transport. It is also important to note that,to comply with AGC and AGTC European agreements, most of the existingtracks need to be upgraded for high-speed transport, higher axle load, andclearance profile of cargo movement.
Most CEE railways offer limited intermodal services – so there is a majoropportunity for them to compete with road transportation (or to support itstransit traffic) provided there are financial resources to finance suchprogrammes. A good example is in Hungary, where intermodal carriagesaccount for 7 per cent of all operations done by MAV (Hungarian state railways).Another initiative is to put more commuter carriages on to tracks by limiting oreliminating competition on such routes. And the European Commission’s inves-tigation of the true cost of transport and its strategy of supporting ‘greener’modes of transport may encourage more cargo and passengers on to rail.
We should also note that the climate around railway privatization – influ-enced by the poor results from the UK – is not encouraging. We should expectmore efforts towards the commercialization of state-owned railways, ratherthan their privatization, especially in larger CEE countries.
Air transportOwnership changes in the turbulent air transport industry are also slow, but themodernization process is well advanced. Former flag carriers are still majorplayers in this slowly deregulating market, but their share is substantially lowerthan a few years ago – largely because of the arrival of low-cost airlines. Theresponse of full-service airlines is further restructuring of fleet and services,deeper cooperation with alliances (LOT Polish Airlines with Star Alliance, andCSA Czech Airlines with SkyTeam) and the creation of low-cost carriers (likeCentralwings, which is a joint venture between LOT and Germanwings). Allmajor CEE carriers started to replace Soviet-built aircraft with Western productsin the 1980s, and when this process was completed it brought dramaticincreases in passenger service quality and cargo capacity. CEE airlines continueto keep among the most modern and newest of aircraft fleets.
After 9/11 all CEE airlines have been exposed to enormous turbulence but,fortunately, few disappeared. Financial reports from 2005 show profits, butthe situation – as in the whole airline industry – is still shaky. Uncertaineconomic conditions in the region and the threat of terrorism have slowed therate of privatization – but not the investments and improvements in CEEairline operations. These actions are essential, so – despite higher productivityand an increased number of passengers – extra revenues are largely spent ontighter security in the airports and on planes.
384 � Global logistics

Along with airline modernization, the air traffic control infrastructure isundergoing radical changes. New passenger and cargo terminals have beenbuilt, and air traffic control systems have been upgraded to improve safetyand services in the increasingly crowded skies of the region. Some of theseprojects are supported by EU structural financial aid and the European Bankfor Reconstruction and Development.
Other modesThe pipeline system is also expanding to deal with new sources of natural gasand crude oil. Conversely, there is a general decline in sea and inland watertransportation because it is not being used to its full potential. This is largelydue to the lack of proper terminals and underdevelopment of waterways,especially in Poland. However, in the Baltic States modern container terminalsare being built, and the increase in operations exceeds 20 per cent a year. Therising costs of fuel revitalize many projects to integrate European waterways,especially on the River Danube.
Some progress has taken place in the development of telecommunicationand information networks. In Hungary, the Czech Republic and Poland, themonopolistic service providers have already been privatized, but in other coun-tries the networks are still under the control of the state. Economic recessionand over-optimism about the uptake of the latest technology have slowed therate of privatization, but recent changes in ownership (for example, HungarianMatav sold to Deutsche Telecom) may indicate a return to previous policy.
Large investments in the latest communications technology – along withcustomer relationship management (CRM) strategies – have dramaticallyincreased service levels. Increasing competition and anti-monopoly measureshave resulted in lower tariffs, so prices may soon be at the same level as thosein EU15. Unfortunately, consumer perception of telecoms is still of low qualityat a high price (compared with salary levels), so access to the internet is stillmuch lower than in EU15. There is a different situation in the mobile phonemarket, where there is more competition. The underdevelopment of land-lines, along with the greater availability and lower prices of mobile services,make CEE one of the most dynamically developing regions. But even here,there are signs of saturation that are forcing mobile network companies tofocus on effectiveness and more diversified services. To some extent (but notas obviously as in some Western companies), the financial position of mobileservice providers has worsened due to investment in UMTS technologyconcessions. These were, however, relatively cheap, and government regu-latory agencies were flexible about its introduction. Another clear trend in themobile industry is the replacement of local brands by global logos – leading tothe unification of marketing and service strategies across Europe.
The use of information networks – particularly fibre optics – is alsoincreasing, and the first applications of electronic data interchange (EDI) in
Logistics for Central and Eastern Europe � 385

accordance with UN/EDIFACT standards are being introduced. In addition,more companies are using integrated management information systems – butwith mixed results. This is not unique to CEE – but value for money seems tobe lower here, and it requires more advanced management systems to use thetechnology as a support tool and not a solution in itself.
SummarizingRegardless of the economic transformation and improvements in logisticsinfrastructure, statistical data – supported by everyday experience – showthat logistics in CEE still requires rapid modernization. The gap with the Westin the case of road infrastructure is still 10–20 years, but the accession to theEU should help gradually to close this. There are both advantages and disad-vantages of the current situation. The advantages include:
� increasing recognition and application of modern logistics solutions inboth manufacturing and services;
� increasing efficiency and effectiveness of logistics systems in companies;� more investment in modern logistics infrastructure;� the advent of logistics services providers (mainly from the West)
promoting state-of-the-art logistics solutions; and� significant progress in customer service and rapid development of the
service sector.
A separate group of advantages results from the recent accession of some CEEcountries to the EU:
� lifted border and customs barriers (accompanied by dynamic devel-opment of border infrastructure with non-EU neighbours);
� adoption of EU regulations and even greater access to the commonEuropean market;
� higher logistics productivity due to increasing competition andmodernization;
� greater access to capital and financial support for logistics investment.
The disadvantages include:
� too slow development of a new transport infrastructure (especially roads)to upgrade the existing, and often very poor, system;
� financial instability and organizational weakness of companies (especiallySMEs);
� the too-high cost of logistics activities (a result of the conditions describedearlier), which lowers the attractiveness of CEE for potential foreigninvestors in industries requiring effective logistics;
386 � Global logistics

� low demand for integrated logistics services (despite quite impressivesupply of such operations); and
� fragmentation of logistics activities (resulting in constant sub-optimizationof decisions) and not fostering a holistic approach to supply chains as theresult of a complex and slow process of implementation of modernmanagement concepts.
A full understanding of the problems and their causes is a key requirement forthe design and successful implementation of logistics strategies in these coun-tries. Despite the continuing process of assimilation of EU standards, thisawareness is especially important to potential investors in the region, forwhom the experience and challenges of CEE countries may still be new.
Logistics strategies in CEE countries
The description of the existing logistics system in selected CEE countries indi-cates that it is affected by:
� the dynamics of their economic growth and the inflow of foreign invest-ments (slowed down because of the recent global economic downturn andthe threat of terrorism);
� development of the economic and political situation, mostly within the EU– the major trade partner of all CEE countries;
� the progress of CEE countries in utilizing their membership of the EU, andthe process of opening up other EU markets to the new members;
� global trends;� a focus on environment protection.
Obviously, all these factors are dependent on one another but the aim is clear:the logistics system of CEE has to adapt and be close to EU15 standards. It willbe a long process – but inevitable for the creation of an integrated and pan-European logistics system that is ready to compete globally.
CEE countries enjoy higher economic growth than EU15 – partiallyboosted by accession – and the defective infrastructure and social conditionsinherited from the communist system will be removed. Further inflows ofmodern technology and management methods give improving productivityand competitiveness – supported by the advantages of low-cost labour,which should continue for the next decade. But the high cost of logistics is amajor constraint on the development of CEE economies. So investment inlogistics – improving infrastructure and developing the logistics servicesmarket and logistics education – should be one of the major priorities ofeconomic policies. The key objectives for developing logistics strategies aredetermined by the major challenges that exist in the region at the beginningof the 21st century, namely:
Logistics for Central and Eastern Europe � 387

� further development of integrated supply chains;� implementation of modern tools for forecasting and designing logistics
systems in companies;� a focus on achieving further synergy between cost reduction and customer
service levels, especially in delivery times, reliability and flexibility;� development of agile logistics systems based on transformation of
companies’ management systems to give process orientation andadoption of relevant information technology;
� acceleration of the development of transport, information, banking andcustoms infrastructure;
� integration of CEE logistics systems with those of other EU countries;� recognition and development of logistics in service industries, especially
in health care, banking, telecommunications and tourism – which all havepotential for growth and expansion.
Successfully meeting these challenges will be a major test for CEE members’ability to capitalize on EU membership. The reality is that the willingness ofEU15 to support the integration of the new members is lower than it was at thetime of the accession of Spain, Greece or Ireland. Another fact is that logisticsinvestments have to compete with other important reforms of administration,education, health care and pension schemes – as well as restructuring heavyindustry, agriculture and so on. The economic growth that CEE enjoys at themoment is also too slow for a satisfactory rate of progress. In such complexsituations, the logistics strategy implemented by the state should:
� focus on key investments that the private sector is unable to make;� create a favourable climate for other investments to improve the logistics
system;� work out a joint strategy with NATO and the EU aimed at directing more
structural aid for the development and integration of CEE logisticssystems with the rest of Europe;
� limit or eliminate monopolistic practices, unfair treatment, corruption andbad practices in the logistics sector – which is the major threat expressed bySMEs in CEE.
This is why the logistics strategy at the macroeconomic level should focus on:
� expanding the liberalization and deregulation processes in logistics inaccordance with EU regulations;
� finishing the privatization processes in the banking and telecommuni-cation sectors, complementary to the proper organization of material andservices flows;
� more active involvement of CEE governments in the construction ofmotorways and bypasses, along with modernization of border infrastructure;
388 � Global logistics

� actively supporting environmental solutions in logistics by enacting therelevant legislation and incentives for companies dealing with reverselogistics and intermodal transport systems.
At the micro level, logistics strategies should reflect global trends and focus on:
� orientation towards, development of and participation in supply chains –aimed at continuously improving performance and similar to those thatmeet customer needs in the West;
� investment in modern management education that emphasizes the devel-opment of human resources and knowledge-based management;
� implementation of outsourcing strategies for logistics, as the developmentof owned operations is too expensive and risky;
� development of agile logistics in manufacturing and services;� further investments in information technology linked with radical
changes in managing the company towards process-oriented structures.
All these strategies have to be implemented simultaneously to bringmaximum effect and significantly improve the ability of these countries tobecome strong and attractive partners in a united Europe. Any further delayin this sphere may destroy the whole effort and waste the sacrifices madeduring the transition process, especially in those countries that will stillremain for some time outside the EU.
Conclusions
CEE countries are at different stages in their move towards marketeconomies, but they are all still a long way from their desired targets. Logisticsand the related infrastructure were the most neglected elements of theprevious system. To upgrade and develop modern logistics systems, CEEcountries must use a significant part of their financial and human resources.They must realize that, after fixing the financial system, the second step issignificantly to improve logistics. This would give enormous savings to helpthe economies of CEE gain further momentum in their development. Suchreforms seem to be gaining support from countries already experiencing thenegative aspects of underdeveloped logistics infrastructures.
Another important element of successful reforms concerns the devel-opment of human resources – and the change of ‘inherited’ thinking. Theemerging market economies inspired individualism and entrepreneurship,but the simplest ways of improving productivity in the region have beenalmost exhausted. Further development requires more teamwork, a holisticview of enterprise and better education. Changes must be implemented in asmart way, so that capital will be acquired and used in the most efficient and
Logistics for Central and Eastern Europe � 389

effective way. Modern logistics, along with developed management concepts,offers a variety of solutions.
These challenges have now been recognized in CEE countries. Logisticsassociations have reached maturity – and more universities and companiesoffer logistics training and consultation. In technology, state-of-the-art solu-tions are becoming available, and companies are making better use of them.These initiatives are a prerequisite for the rapid development of both theinternal markets and the external environment. Only effective implemen-tation of the presented strategies will ensure that this region becomes anattractive platform linking the West with the East.
Finally, it is worth emphasizing that – regardless of some criticisms and realproblems faced by the region on its path to joining the EU – enormousprogress has already been made. Even when politicians prefer short cuts andfocus on the elimination of symptoms rather than causes, effort and resourceshave shifted towards the future – towards better infrastructure andmanagement of resources.
Not all the countries have used their time of transition equally well, andnew EU members fall below some standards (as was the case with Spain,Greece, Portugal and Ireland), but they are attractive places for investment,with most of the market rules and institutions already functioning. It is astable region that more companies should discover. And, in turn, majorcompanies from CEE can expand into the established markets of the West.
We hope that progress in CEE logistics systems and their unification into apan-European logistics network will allow us to stop discussing the legacy ofcommunism and focus on the discovery of Central and Eastern Europe as agood place to develop business.
References
Dudzik, M (2004) Magiczna data 1 maja 2004? [1 May 2004 – a magic date?],Gospodarka Materialowa i Logistyka, 5
Eurostat (2005) Euro-Indicators, Statistical Office of the European Communities,Brussels
Kisperska-Moron, D, Kapcia, B and Piniecki, R (1996) Badanie kwalifikacjikadry logistycznej w polskich firmach [Evaluation of logistics staff qualifi-cations in Polish enterprises], Zeszyty Naukowe, 5, TNOiK Poznan, pp 117–24
Rutkowski, K (1996) Tendencje rozwojowe logistyki w Polsce – od dezinte-gracji do integracji [Logistics development trends in Poland – from frag-mentation to integration], 3rd International Conference, Logistics 96, onLogistics Systems as Key to Economic Development, Polish LogisticsAssociation, Poznan
390 � Global logistics

391
Logistics in China
James Wang, University of Hong Kong
Introduction
China started its transition in 1978 from a centrally planned economy to amarket economy. Since then, the country has witnessed a fast and relativelyconsistent growth: an average of 10 per cent growth in GDP, and 18 per cent intrade from 1980 to 2005. The growth in fact has accelerated since 2001 whenChina became a member of the World Trade Organization (WTO). By the endof 2005, China was ranked as the fourth-largest economy in terms of totalGDP, following the United States, Japan and Germany. With such a back-ground, China’s logistics sector has been experiencing a significant expansionnever seen before.
Wuliu, the word for ‘logistics’ in Chinese, has become very popular,although it was very confusing when it began to appear in the 1990s. Literally,wuliu means ‘material [wu] flow [liu]’. Many, including some officials incharge of the sector, took the term as being similar to ‘transportation’.Suddenly, large numbers of companies such as home movers renamed them-selves as wuliu firms, in order to take advantage of any government policies orincentives aimed at encouraging the sector.
Indeed, government policies have been critical in nurturing the devel-opment of the logistics sector in China, as the state machine, including alllevels of government, is still the most influential power in driving andshaping changes in the economy, and the logistics sector is not an exception.Two recent developments show this power. First, central government decidedto promote producer service industries and logistics activities in China’s 10thFive-Year Plan commencing in 2001. Because of that, each level of government
24

392 � Global logistics
– from county and city to province – needed to work out schemes and plans toboost the logistics sector. Second, China committed at the time of joining theWTO in November 2001 to open its logistics market fully to the world withinthree years (see Table 24.2), indicating the strong willingness of the state toaccelerate the reforms of its logistics sector by introducing pressure fromoutside.
China has been left behind the most developed countries in logistics, whichcan be seen by examining the efficiency of logistics activities as revealed by theratio of logistics spending to GDP. A report by the State Development andPlanning Commission (SDPC) (2006) shows that, in 2000, the logistics sectorspending, including transportation, inventory storage, and loss and breakage,amounted to about 20 per cent of China’s total GDP. Such a proportion wasmuch higher than those of the United States (10 per cent) and Japan (14 percent) (see Table 24.1). The three major cost components, transportation,inventory storage and management cost, contribute roughly 57 per cent,29 per cent and 14 per cent respectively of the total.
Despite the target of the central government to increase the efficiency of itslogistics sector and reduce its proportion of the national GDP, the reality hasbeen the opposite. China’s logistics industry grew at an annual rate of 15–30per cent during 2000–04 – much faster than the national economic growth of8–9 per cent annually for the same period of time. The total logistics costaccounted for 21.4 per cent of GDP in 2003 and 21.3 per cent in 2004, both infact higher than that of 2000 (20 per cent). Interestingly, specialist third-partysuppliers handled only 18 per cent of raw material logistics, 16 per cent ofsemi-finished product distribution and 17.6 per cent of final product distri-bution in 2000. In other words, more than 80 per cent of the logistics activitieswere conducted by producers themselves. This indicates that China is in anearly stage of industrialization. At this stage, there is a huge potential marketfor logistics. Therefore, market expansion, rather than raising efficiency, is –and will continue to be – the focus of most logistics firms.
Logistics operators in China come from five different backgrounds. Thefirst group comprises former subsidiaries of relevant ministries, for exampleSinotrans from the Ministry of Foreign Trade. These firms are generally large
Table 24.1 Proportion of logistics spending to GDP, 2000
Country/region Logistics spending as percentage of GDP %
China 20Japan 14European Union 10–13United States 10.3
Source: SDPC, 2006

in size and have some ‘natural’ connections or guanxi advantages stemmingfrom their previous freight-forwarding or distribution networks. The secondgroup comprises the foreign logistics firms or freight forwarders such asDHL and APL Logistics. With the power and reputation of their brandnames, they entered the China market earlier than many others. They enjoyan advantageous position owing to regulations that favour foreign investorswith a large registered capital. The third group consists of the logisticsdepartments of certain large conglomerates that expand their logistics opera-tions to serve both their parent companies and some others in the same or asimilar industrial sector. Annto Logistics from the Midea Group is anexample. It was once the logistics department of the Midea Group, respon-sible for national distribution of Midea air conditioners, and now extends itsservices to many other producers of home appliances. The fourth groupbasically consists of the transportation firms that have developed verticallyto have their own agents doing freight forwarding and warehousing, such asChina Railway Express Co. The last group consists of many private firms.Unlike firms from the other four groups, firms in this group tend to be smallin size and usually have their special coverage or focus of business. Thesesmall, private firms make a very important contribution in fitting into marketniches and helping avoid monopoly. For example, Hercules Logistics inShenzhen provides special logistics services between the fast-growingSpecial Economic Zone next to Hong Kong and Siberian cities in the far eastof Russia.
Major areas of improvement
Infrastructure developmentDevelopment of the market for logistics in China has two prominent features– infrastructure development and the prevalence of outsourcing activitieswith international players.
Regarding the infrastructural development, a total of 728.3 billion yuan(about US $88 billion) was invested in fixed assets for the logistics industry in2004, a growth of 24 per cent from the previous year (CFLP, 2004). Of this,transport amounted to 604 billion yuan (US $73 billion), or 82 per cent of thetotal (see Figure 24.1). This shows that the Chinese government has beenplacing huge emphasis on developing the transport sector. Most of theseinvestments have gone to projects of new railways, highways, deep-waterberths and civilian airports. However, the country still lacks a fully integratedtransport network for intermodal transportation. For example, all the majorports such as Shanghai and Shenzhen – ranking third and fourth respectivelyin the world in container throughput – move less than 1 per cent of theircontainers from or to the railways. This compares with 7–15 per cent in major
Logistics in China � 393

European and US ports – keeping in mind that China is a huge country and itsrailway network plays a much bigger role than that of other modes oftransport in its economy.
Another major area of investment has been the construction of logisticsparks. As the sector has been largely pushed by government policies, buildinglogistics parks is regarded as an important measure to promote and upgradethe sector. Starting from Shenzhen, the Special Economic Zone next to HongKong, every major city in China has several logistics parks, which wereplanned and quickly constructed in the past few years through special incen-tives such as land rent exemption or deduction. These newly built logisticsparks can be categorized into three types by their expected roles: 1) servinggateway facilities such as airports and ports for international and nationaltrade; 2) regional distribution centres, which are normally located nearrailway stations or highway junctions; and 3) local services centres for citylogistics. From an operational perspective, not many of these parks arerunning as well as expected for the following reasons:
� Positioning their role wrongly. Some cities set up their logistics parks aimingat high-value-added logistics activities for regional or international distri-bution, but the reality is that, for cities with an export-oriented processingindustry, there is little need for regional or domestic distribution. The real
394 � Global logistics
Transportation 82%
Postal services 1%
Distribution, processingand packaging 1%
Wholesale 11%Warehouse
and storage 5%
Source: Li & Fung Centre for Supply Chain Management and Logistics, ChineseUniversity of Hong Kong, 2004
Figure 24.1 China’s logistics industry – composition of total fixed assetinvestment in 2004

logistics activities surrounding their ports, for example, are things such asempty container depots and truck parks.
� Lack of a proper regulatory environment for borderless logistics. In a transitionalperiod from a centrally controlled economy, customs is a key body ofcentral government that monitors imports and exports at all the localgateways where international logistics occur. When local governments tryto reform their systems, with deregulation to create a true internationalenvironment such as a real free trade zone, they need not only thepermission of the State Council, but also local cooperation from customs.This often requires much longer to achieve than constructing a logisticspark.
� Abuse of the concept of logistics parks. As China is the country with theworld’s largest population, urban land in cities with large logistics activitypotential is definitely scarce. Some companies have taken advantage ofgovernment incentives for logistics parks by packaging commercial or resi-dential property development into a ‘logistics development project’ tooccupy the logistics parks.
� Misinterpretation and poor location of logistics parks. In some cities, it wasexpected that, when a logistics park was set up somewhere in the city,other logistics firms would also come and work together to achieve somesort of economies of scale. The reality, however, is that, because of thedifferent needs of their own supply chains, firms behave differently anddo not move to the same location, even when some incentives areprovided.
Prevalence of outsourcing and foreign logistics operatorsentering ChinaThe economic reforms and open-door policy since the 1980s have made Chinaa world factory for both domestic and foreign enterprises. The growingmarketization and internationalization have led to huge demands foroutsourcing activities and third-party logistics (3PL), particularly after China’sentry to the WTO. Many foreign logistics service providers have establishedjoint ventures with domestic enterprises or wholly foreign-owned enterprises– such as APL Logistics, Exel, Kerry Logistics and SembCorp Logistics, whichformed joint ventures with Legend Group Holdings, Sinotrans, BeijingHoldings and St-Anda respectively. These ventures offer 3PL services to mostmajor cities in China.
China’s accession to the WTO in 2001 created many deadlines for openingits logistics markets (see Table 24.2). This further opening of markets is verytempting to foreign logistics enterprises, since the country is now in a stage offast economic development and urbanization. On one hand, the GDP growthrate was 10.3 per cent on average from 1979 to 2004 and is expected to
Logistics in China � 395

continue at a rate of at least 6 per cent for another decade or two, and itsforeign trade volume grows even faster (35.7 per cent in 2004) as the economydepends more on the global market. This means that more global supplychains have their first links or production bases inside China. On the otherhand, as there will be about half a billion of the population moving from coun-tryside to urban regions to work in the next 10 years – and 10 million peoplebecoming ‘middle-income class’ by world standards every year from 2005 to2010 – a huge market for domestic consumption is in the making. This isleading to a rapid expansion of China’s retail sector and ample room forfurther development of its logistics industry – and 3PL in particular. Major
396 � Global logistics
Table 24.2 Post-WTO accession regulations in China
By 2002 By 2003 By 2004 By 2005 By 2006 By 2007
Shipping – Majority – – Whollyand freight ownership ownedforwarding by foreign subsidiaries.
firms No limiton foreignfirms tointernationalfreightbusiness
Maritime – Majority – – – –cargohandling,customsclearance
Rail Foreign– – Majority – – Whollytransport PRC joint ownership owned
venture subsidiariespermitted
Road Minority Majority – Wholly – –transport ownerships/ ownership owned
joint subsidiariesventures
Warehousing Minority Majority – Wholly – –and storage ownerships/ ownership owned
joint subsidiariesventures
Courier Minority Majority – – Wholly –ownerships/ ownership ownedjoint subsidiariesventures
Source: Accenture, 2002

transnational retail chains such as Wal-Mart, Carrefour, KFC, McDonald’s andStarbucks are already setting up more retail stores – and major 3PLs and inte-grators such as FedEx, UPS, DHL and AT&T are opening offices and cargo-collecting points in as many cities as possible. Some are even moving orestablishing their Asian distribution centres in China as well.
Challenges to developing modern logistics
Huge geographical variationsThe first and probably most challenging reality is the enormous variationswithin China. When talking about China as a world factory, often people arethinking of the entire China – a country of 96 million square kilometres of landand 1.3 billion people. In fact, it is not really true. Geographically speaking,the real world factory is just the coastal part of China, consisting of 332 citiesand counties. Statistics in Table 24.3 show that the coastal provinces, mainlytheir port cities, have become more and more important in the global market,as their contribution to China’s external trade keeps increasing. Up to 2004,94 per cent of the total value of Chinese foreign trade was made in the coastalregion of 11 provinces. More than 83 per cent of foreign direct investment toChina has concentrated in these cities as well. The country is thus dividedclearly by the level of international trade and transport connectivity with theoutside world. Production in the coastal area is highly associated with theglobal economy, while that of the inland is still largely for the domesticmarket. As this trend has been reinforced rather than weakened in the pasttwo decades (as shown in Table 24.3), one can see that logistics development
Logistics in China � 397
Table 24.3 China: international trade by origin/destination in China(1998–2004)
1998 1999 2000 2001 2002 2003 2004US$’000 US$’000 US$’000 US$’000 US$’000 US$’000 US$’000
National 324,033,642 360,649,443 474,308,185 509,768,127 620,768,077 851,207,294 1,154,791,620total
Coastal 287,290,620 321,688,892 430,176,402 463,222,811 567,871,428 778,312,733 1,069,529,407provinces
Inland 36,743,022 38,960,551 44,131,783 46,545,316 52,896,649 72,894,561 85,262,213
Proportion % % ³% ³% ³% ³% ³%
Coastal 88.7 89.2 90.7 90.9 91.5 91.4 92.6Inland 11.3 10.8 9.3 9.1 8.5 8.6 7.4
Source: China Customs, 1998–2004
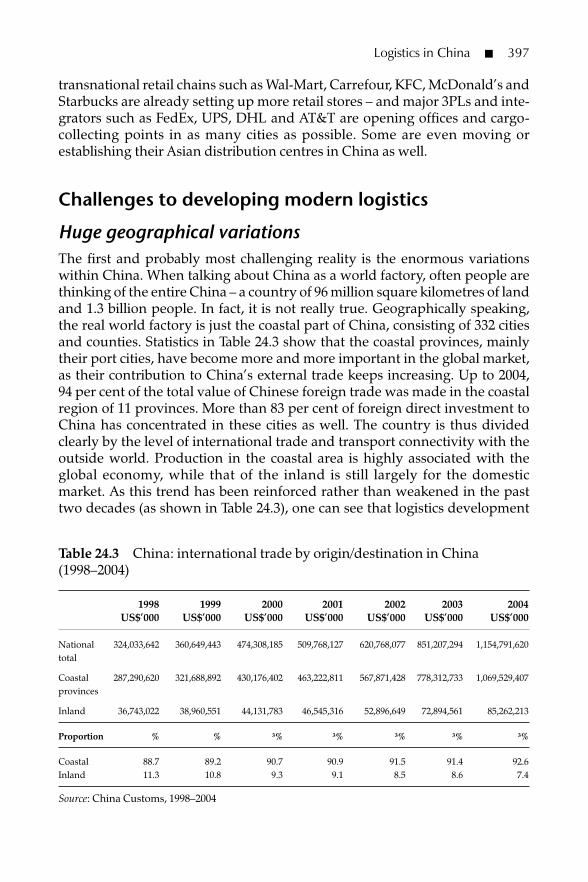
in China is currently a dual-track system. On one hand, there is a fast track inits coastal region, where ports are equipped with the most up-to-dateequipment and operate with the highest efficiency of any world top-classcontainer terminal operators. On the other hand, one rarely sees a containertruck driving in an inland province, and competition in transport and logisticsoften comes by overloading trucks or vessels for unit-cost saving. Thedomestic markets of most products are still largely production-driven ratherthan buyer-driven.
As a result of such huge unbalanced development, either domestic or inter-national logistics enterprises may need to have local strategies to deal with thesituation. For example, Wal-Mart has decided not to have regional distributioncentres in China, considering that inland transportation, including railwaysand highways, is not reliable enough for time-definite delivery. Haier, the topbrand name and largest producer of electric home appliances in China (andprobably in the world by 2006), has been doing logistics on its own rather thancontracting out, as it sees that none of the 3PLs can do a better job than itself.
Absence of a fully integrated national transport networkDespite the fact that some efforts have been made by the Chinesegovernment in developing the logistics infrastructure for the entire nation,bottlenecks in transport hamper logistics efficiency. Among major transportmodes, railways are the key links between the inland cities and the gatewayport cities, and they started to operate unit-trains for containers in the late1990s. But by 2005, less than 1 per cent of container throughputs at majorChinese ports were associated with railway services. Upgrading railwaysystems for containerized transport is not easy, since the double-deck trainsthat are commonly used in the United States are not feasible for most routes inChina, which is a mountainous country. Waterborne transport is not asfeasible as in some European countries, as only in a very few places are thererivers that are navigable by barges. As a result, highways have become thebackbone of land surface containerization. The economic distance of truckingis thus forming an invisible division between container-accessible coastalregions and the rest of China – the former being served by modern transportand logistics that match international standards, while the latter is served byconventional means. The gap in transport and logistics provision iscontributing to social inequity in the country, so the question of how toimprove it becomes a critical issue not only for the logistics firms, but also forthe various levels of government.
Multiple jurisdictions and local protectionismThe third challenge in developing modern logistics systems in China is fromthe local governments. The essence of logistics services is the efficiency of
398 � Global logistics

getting things and information through supply/demand chains and overspace. Strong intervention from governments for local interests has becomeprobably the most difficult obstacle to overcome. Often improvement oflogistics is regarded by many local governments as an instrument to helpgenerate more GDP within their own jurisdictions, rather than a way toimprove the efficient flow of cargo across them. Individual municipal govern-ments are motivated to compete for logistics hubs regardless of theirgeographical locations – and none of them is willing to see firms with homebases in their cities set up distribution centres in other jurisdictions.Consequently, there is duplicated construction of regional logistics parks anddistribution centres – and even airports in neighbouring cities are common.One scheme by logistics firms serving the nationwide market is to register thefirm at a city that charges the lowest tax – but locate the operations whereverbest fits the network needs. This may mislead, statistically, the governments ofboth jurisdictions and cause more duplication of investment in infrastructure.
Absence of trust for the domestic 3PLAlthough most regulatory regimes have changed to facilitate the growth of3PL, it is still very tough for 3PLs to be successful in the real world, or even tosurvive. Many enterprises that say they use 3PL are really transport operatorsthemselves with their own fleets of trucks, vessels or both. They operate moreas transport firms; for example, China Merchants Logistics in Shenzhen relieson its transport business – including a fleet of taxis. The major reason, asstated by Mr Chan, the director of Hercules Logistics, a leading privatedomestic logistics firm in China, is that ‘If we do not have our own transportmeans, people will never trust us and we will not get any good deals.’ Headds: ‘People consider a real 3PL user [ie without its own fleet of trans-portation] as “tae kwon do” [a Japanese martial art: fighting without anyother weapon than one’s own bare hands].’ Such an absence of trust is partlydue to the lack of any established brand names in the field, which may taketime to build. At the current stage, the challenge to those that are workinghard to be one of the brand names in the future is how to keep their transportoperations running on a less than economic scale, while surviving and devel-oping their core business. Alternatively, they may seek help or support frominternational investors – particularly those with brand names in the field –which will eventually result in merging or buying out.
Old-fashioned wholesale marketplaces remain competitiveAssociated with the trust problem discussed above is the prosperity ofconventional wholesale marketplaces in many cities and city regions wherethe low-end products are traded, and transport and logistics are often takencare of by the buyer. For example, in Foshan, a city near Guangzhou, Canton,
Logistics in China � 399

there is a huge wholesale market for furniture that is 9.5 kilometres long and150 metres wide along each side of Highway 305. Each day, thousands of indi-vidual consumers – such as new home owners in the nearby cities – or groupscome to the Le Cong Furniture Market to do a day’s shopping. Most of thembuy their furniture and truck it back home using their own means oftransport. Le Cong has contributed to the local economy for more than 10years and employed significant numbers of people, and many local govern-ments wonder if the same success could be achieved in their own town. As aresult, many wholesale marketplaces (or ‘professional markets’ as they arecalled in China) have been set up to boost the competitiveness of the localeconomy by enhancing the logistics and distribution systems. However, sincelogistics services in China have been developed to different stages of maturityfor different types of products, some of these marketplaces have had veryshort lives before fading away.
New government policies and future prospectsThe Ministry of Commerce – together with other related ministries andcommissions – released a communiqué on 5 August 2004, ‘Notice onpromoting the development of China’s modern logistics’. This covers variousareas such as administration, management, taxation, financing and marketopening, etc. Major policy initiatives suggested in the document include:
� standardizing registration and approval procedures of logistics enterprises;� promoting the opening up of the logistics market and adjusting adminis-
trative procedures – reducing to a minimum the entry requirements fordomestic railway freight-forwarding agencies, marine freight-forwardingagencies and other intermodal transport agencies;
� simplifying the taxation on all logistics enterprises;� improving the current practices in regulations to establish a competitive,
fair and regulated market environment.
All the above initiatives aim at encouraging more foreign participation andmore consolidation of the logistics industry in China. Although the economicgrowth of this country is expected to slow down from an average of 8.1 percent for the 25 years from 1980 to 2004, the momentum of growth is still highand will probably continue for another decade or two. In this period, it isexpected that the following trends in development will appear:
� More penetration by foreign logistics enterprises. DHL, FedEx Express, Maersk,and Exel Logistics are investing more in China. The penetration of thesetransnationals takes different forms. FedEx, for example, has committeditself to move its Asian hub from Subic Bay in the Philippines toGuangzhou by 2008. Exel Logistics has invested in Sinotrans, in order to
400 � Global logistics

take advantage of its partnership with this leading Chinese logistics firm.Foreign firms may also follow APL Logistics and set up wholly foreign-owned enterprises. For example, FedEx Express announced in 2006 that itwould acquire all the shares of its partner DT Logistics in Tianjin to turntheir joint venture into a wholly foreign-owned enterprise.
� Consolidation and upgrading of domestic logistics firms. Except for Sinotrans,most leading domestic logistics firms are currently more or less dependenton their parent firms. For example, Annto Logistics (a leading logistics firmestablished in 2000) was originally a subsidiary of the Midea Group (one ofChina’s largest conglomerates, with a focus on household appliances).Annto Logistics still considers Midea as its most important client, and itshome base is in Shunde, where the headquarters of Midea is located. Thisis going to change in the near future when Annto’s network expandsnationwide and its status is recognized by more clients. This will even-tually lead the firm – and others of this kind – towards real 3PL operations.
� Highly efficient intermodal logistics/transport corridors. To narrow the devel-opment gap in logistics services between the coastal and the inlandregions, intermodal corridors linking major inland cities should be the firstrequirement. According to the State Council, such initiatives shouldencourage more inland cities to open their airports to internationalconnections, with the Ministry of Railways forced to operate fixed-schedule trains for container shipments along major national corridors,even if such operations are not profitable in the short term.
� More free trade zones opened at major ports and airports. An important newpolicy initiative from the State Council is called ‘zone port interaction’.From the beginning of 2005, eight major port cities in China started a trial ofthis. The policy aims at establishing an integrated space within which thereis a free trade zone together with some terminals for international transac-tions. Within these spaces, cargo can be handled as if it is outside customs,although it is physically present within the territory of China. This policyintends to set up several ‘mini Hong Kongs’ to facilitate internationallogistics – including trans-shipment, consolidation and even exhibitions.
� More advanced e-platforms and technologies. The late 1990s was an embar-rassing period for China when it started to introduce new technologiessuch as electronic data interchange to potential users. After spending a lotof time and resources in human resource training and installation ofequipment, most of the EDI systems did not work. Eventually, by the timeeverything was ready, the systems were out of date and not compatiblewith the newer systems employed by major international organizationsand government departments. Recognizing this problem of compatibility,China is now putting more effort into standardizing and upgrading e-plat-forms among government departments – such as the General Customsand their local offices – in order to improve the efficiency of logisticsservices, including documentation handled at all international gateways.
Logistics in China � 401

Web-based platforms for freight forwarding and cargo monitoring arebecoming popular. The country is also trying to catch up with thedeveloped world by designing and introducing the most advanced tech-nologies in logistics, such as radio frequency identity (RFID).
Concluding remarks
Being a fast-growing economic giant, China is at a stage where advancedtechnologies and management in logistics coexist with backward and conven-tional ones – the former being employed in its global trading sector, while thelatter are largely for its domestic market. A bifurcation is also found betweenthe transnational logistics companies and local firms: the former are pene-trating from individual major coastal cities to regional or inland markets,while the latter are upgrading themselves from transport provider to true 3PLor even 4PL.
Governments at all levels are keen to develop modern logistics, since it iswidely believed in China that the logistics sector is one of the key sectors forthe country and for the competitiveness of individual provinces or cities intoday’s globalizing economy. Interestingly enough, however, the majorobstacles for better provision of logistics services in China also come largelyfrom governments of various levels. They are putting too much effort intomanipulating the sector, with over-investment in logistics parks, andprotection of local interests through discriminatory regulations against non-local firms.
The injection of high-quality logistics services by international providersafter China’s accession to the WTO seems to be regarded as an effectivemeans of raising the quality of logistics services. But this strategy becomesproblematic when tensions grow between Chinese firms and transnationalcompanies. After all, perhaps, a more fundamental and long-term solution isto nurture a better market environment, with fair play between domestic andforeign firms, and between the inland and coastal regions. For such a solution,improvements in infrastructure and governance are equally important.
References
Accenture (2002) On the Edge: The changing pace of supply chain management inChina, Accenture, New York
China Customs (1998–2004) China Trade Statistics, China Customs, BeijingChina Federation of Logistics and Purchasing (CFLP) (2004) Circular released
by CFLPState Development and Planning Commission (SDPC) (2006) National
Statistics, China SDPC, Beijing
402 � Global logistics

403
Logistics in NorthAmerica
Garland Chow and Trevor Heaver,University of British Columbia
Introduction
There is increasing similarity in logistics strategies and practices among thedeveloped industrial regions of the world. The geographical spread of manu-facturing by global companies and the development of global supply chainsare bringing competitive pressures and global competencies to bear onlogistics systems. The rapid growth of sourcing products in Asia, EasternEurope and Mexico has been associated with comparable issues for buyers inall developed regions. The increasing application of communication andinformation systems across supply chain members is also facilitating the rapidevolution of similar practices and standards. Nevertheless, important differ-ences in logistics conditions exist among regions.
Table 25.1 shows estimates of logistics costs as a percentage of GDP for 1997and 2002. These estimates suggest that outside of North Americaimprovement in logistics performance since 1997 has at best been patchy. Ithas generally not improved in developing countries, where logistics costs alsotend to be highest because of the average of lower-valued and denserproducts. Performance in North America has continued to improve. Ingeneral, logistics costs are affected by the contrasted geographic, economicand institutional circumstances of countries and regions.
25

404 � Global logistics
This chapter deals first with the distinctive characteristics of North Americathat affect logistics, followed by the trends, challenges and opportunities forlogistics in the region. Dominant logistics strategies in the region are describedprior to some concluding comments.
Special features of North America for logistics
Three aspects of North America warrant highlighting as background to thelogistics conditions. These are: the size of the region and the characteristics ofits transport system, the North American Free Trade Agreement; and the rolesof international trade and globalization.
The size of the region and the characteristics of itstransport systemThe geographic size of the region and the size of the economy have implica-tions for the structure and growth of transport and logistics services. Majorfeatures of scale are shown in Table 25.2.
Table 25.1 Estimated logistics costs as a percentage of GDP, 1997 and 2002,by region
Region 1997 2002% %
Europe 12.2 13.3France 12.0 11.6Germany 13.1 16.7UK 10.1 11.3Pacific Rim 14.5 15.7China 16.9 17.9India 15.4 17.4Japan 11.4 11.4South America 14.3 15.7Brazil 15.0 15.0North America 11.0 9.9Canada 12.1 11.9Mexico 15.3 15.0United States 10.5 9.3
Source: Rodrigues, Bowersox and Calantone, 2005

The United States is not only the largest national economy in the world, but itis also a large country from which have flowed two characteristics relevant tologistics. First, the country has enjoyed a high level of economic self-suffi-ciency, which has resulted in a limited role for freight forwarding incomparison with Europe. On the other hand, the size of the economy gives riseto large national corporations – for example, Wal-Mart – that have beenimportant in the evolution of global supply chain management. Second, thesize of the United States and Canada necessitated efficient rail freighttransport, which has facilitated the development of intermodal transportservices. The ownership of the Class I railways in North America is in ninecompanies; in 2004, they had a combined operating revenue of US $47.4billion, of which US $8.0 billion was from Canadian railways and US $1.3billion from Mexican (Association of American Railroads, 2005). Major revenuetraffic is in bulk commodities, especially coal, but intermodal traffic has hadsustained growth over the last decade. Overseas traffic has been the majorcontributor to this growth. Intermodal traffic accounts for approximately 20per cent of the revenue of US Class I railroads. However, in spite of thesubstantial role of rail freight about 80 per cent of transportation freightrevenue in the United States is earned by trucking. As elsewhere, this is theresult of the convenience and reliability of truck service and its lower cost forshort-haul and low-volume movements.
North American Free Trade AgreementCanada, Mexico and the United States entered into the North American FreeTrade Agreement (NAFTA) in 1993. The adoption of NAFTA reflects the priorsuccess of trade liberalization between Canada and the United States under theAuto Pact of 1965 and the Canada–US Free Trade Agreement (FTA) of 1989.When Mexico and the United States were to enter free trade discussions, it wasin Canada’s interest to participate, to ensure that its interests were protected andthat improvements might be made relative to the FTA. The interest of Mexicowas part of a changing policy to integrate more fully into the global economy.
NAFTA effects were most significant for Mexico because of the previousrelative isolation of its economy. The only closely integrated businesses
Logistics in North America � 405
Table 25.2 The scale of North America
Canada Mexico United States
Population estimate (millions) for July 2005 32.8 106.2 295.7Gross domestic product (purchasing power 1.08 1.07 12.37parity) (trillion US$)Area (millions of square kilometres) 9.9 2.0 9.6
Source: US Central Intelligence Agency, 2006
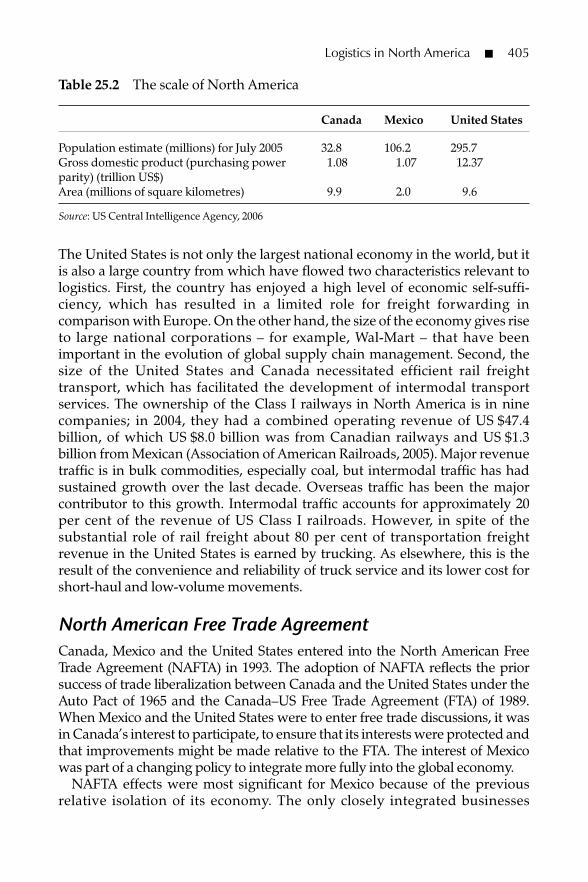
between Mexico and the United States were the maquiladora, established inborder communities after the agreement with the United States in 1989, thatimported goods duty-free for processing and exported them without tariffs.
NAFTA is a rules-based agreement that facilitates trade. It does not seek toimpose the harmonization of industrial and government practices requiredfor a single market. Similar transport regulation policies have been followedin Canada and the United States and later were adopted by Mexico.Encouraging open and competitive markets in transport (and generally) haverequired and enabled more efficient and, therefore, better-integrated serviceswithin and between countries. At the insistence of the United States, NAFTAdoes not apply to water transport. Only specialized air services came underNAFTA. Other air services fell under bilateral agreements that have beengradually liberalized separately. Under NAFTA, foreign-owned trucking andrail companies may be established in the United States to provide transportand logistics services domestically, employing persons with the right to liveand work in the country. Cabotage is reserved for national companies.
Because of the numerous simultaneous factors affecting the North Americaneconomy since 1994, quantification of the effects of NAFTA with aggregatedata is difficult. While in aggregate NAFTA merely accelerated the integrationof the three economies – particularly the US and Mexican – its effects weredifferentiated among commodities. Romalis (2005) shows a significant sensi-tivity of trade on a commodity basis to differences in tariff levels betweenNAFTA partners and other countries. There has been a diversion of trade towithin NAFTA for certain sectors of the economy. The growth in trade waslargely in commodities groups in the trade mix prior to NAFTA (Hillberry andMcDaniel, 2002). NAFTA encouraged businesses to pursue North Americanstrategies that led to the promotion of north–south commerce, thereby shiftingthe pattern of demands for transport and logistics services. The efficiency ofborder crossings as stricture points in the flow of traffic has become animportant issue, especially with the escalated concern for security fromterrorism. (Significant congestion at seaports is a more recent phenomenon.)
The effects of NAFTA on logistics have been felt mainly through the encour-agement to the rationalization of industrial location and the greater – but notfree and complete – integration of transport and logistics services. NAFTAadvances three strategies in the redesign of continental supply chains. Thefirst is strategy to close certain plants. This strategy applies especially tocompanies with branch plants – for example, in Canada – to avoid duties.Companies that closed plants for this reason included Bilt-Rite Upholstery,Florsheim Shoes and Gillette. The second strategy is to have plants thatspecialize in products for continental or global markets, as had been done inthe automotive industry between Canada and the United States for a numberof years. For example, prior to NAFTA, Upjohn operated a multi-productpharmaceutical plant in Ontario to serve the Canadian market. After NAFTA,that plant specialized in medium-volume sterile products for the Canadian
406 � Global logistics

and US markets. US plants specialized in high-volume sterile products, andPuerto Rican plants specialized in non-sterile products destined for bothCanadian and US markets. Campbell’s Soup, General Electric, Whirlpool,Avon and Dupont followed an almost identical strategy. The third strategy isto consolidate manufacturing or distribution, often close to the border. Theproduct will now flow from one central stocking or manufacturing pointinstead of from two, and cross-border traffic increases (Taylor and Closs,1993). The balance of cost and service considerations affects location deci-sions. Industries in which customer service is important are likely to maintaina local market presence. The low value of the Canadian dollar favouredCanadian locations, but this advantage is now diminishing.
The roles of international trade and globalizationForeign trade has always been important to Canada, as a relatively smalleconomy. In 1971, foreign trade and services accounted for just over 40 percent of gross domestic product. It exceeded 80 per cent for the years 1998–2001and was over 70 per cent in 2004. However, a high proportion of this trade iswith the United States: in 2004, over 80 per cent of exports went to, and justunder 70 per cent of imports came from, the United States (Antweiler, 2006).
Foreign trade has played a much lesser role in the US economy. The rapidgrowth of trade is now one of the important pressures on logistics in theUnited States. In the period 1970–2004, the average annual growth in US tradewas nearly double the pace of GDP growth, 6.2 per cent versus 3.2 per cent(Office of the US Trade Representative, 2005). The value of goods and servicesas a percentage of GDP has increased from 11 per cent in 1970 to 22 per cent in1994 and to 25 per cent in 2004.
Table 25.3 shows the faster growth of US imports over exports. This hasimportant consequences not only for the balance of payments but also for thebalance of freight in international transport. Canada is still the major nationaltrading partner of the United States, leading in imports and exports. Mexicohas increased to second place in US exports but, after rising to second place inUS imports, it has slipped to third place because of the rapid growth of importsfrom China. Trade with China grew rapidly in anticipation of, and then subse-quent to, China’s accession to the World Trade Organization in 2001. The sizeof the trade imbalance with China and the presence of imbalances with otherAsian countries are reflected strongly in the freight imbalance faced by trans-Pacific container services. There has also been more than a doubling of USimports from the EU. The small change in the trade with Japan is remarkable, areflection of the stalled Japanese economy and the manufacture of Japanese-brand cars in North America. The NAFTA countries accounted for 29 per centof the increase in US imports between 1994 and 2004. China accounted for20 per cent (but much of it since 2000) and the EU 19 per cent.
Logistics in North America � 407

Thirteen per cent of total US imports were sourced from China in 2004, upfrom 6 per cent in 1994. However, when imports from China, Japan and theother Asian–Pacific Rim countries are considered together, the region’s shareof US imports has actually declined from 39 per cent in 1994 to 33 per cent in2004. Much of the US imports from China are low-value-added consumergoods; they made up 54 per cent of the imports in 2004 (Office of the US TradeRepresentative, 2005). The potential continued high rate of growth of imports,particularly from China, is a major concern for the adequacy of transportinfrastructure and, therefore, the functioning of the logistics system in thefuture.
The increased role of foreign trade in a country’s economy is just one aspectof the international nature of the economy. The growth in the size and in thenumber of multinational corporations and the extent of foreign directinvestment (FDI) are also significant. In transport and logistics (and someother businesses), the global expansion of companies is linked to the desire ofshippers to deal with fewer companies in their logistics network. Transportand logistics firms often see international growth as a means to achievesystem-wide cost reductions and to participate more fully in the growth ofinternational transport and logistics.
408 � Global logistics
Table 25.3 US trade in goods for selected countries, 1994 and 2004
1994 2004 Change$ billion $ billion %
US exports toTotal 502.9 818.8 62.8Canada 114.4 189.9 66.0European Union (EU15) 107.8 168.6 56.4Japan 53.5 54.2 1.3Mexico 50.8 110.8 118.1China 9.3 34.7 273.1Asia Pacific, excluding Japan and China 85.0 121.0 42.3
US imports from:Total 668.7 1,469.7 119.8Canada 128.4 ,256.4 99.6European Union (EU15) 119.5 ,272.4 127.9Japan 119.2 ,129.8 8.9Mexico 49.5 ,155.9 214.9China 38.8 ,196.7 407.0Asia Pacific, excluding Japan and China 103.2 ,166.7 61.6
Sources: Office of the US Trade Representative, 2005; US Census Bureau, 2004

Trends, opportunities and challenges for logistics inNorth America
Logistics performance in North America has continued to improve, althoughaffected annually by specific factors such as the effects of interest rates oninventory costs. Table 25.4 shows the latest estimate of logistics costs in theUnited States. The evolution of logistics practices accounts for the excellentperformance, with important trends – and associated challenges and oppor-tunities – discussed in the following sections.
Supply chain management visionThe supply chain management vision has led to improved strategic coordi-nation across traditional business functions within companies and acrossbusinesses that share the goal of meeting consumer expectations. Supplychain management is thus a corporate philosophy that has considerableimplications for logistics (Mentzer, 2001).
Logistics in North America � 409
Table 25.4 US business logistics costs in 2004
Carrying costs $1.493 trillion $ billion %
Interest 23 2Taxes, obsolescence, depreciation, insurance 227 22Warehousing 82 8
Subtotal 332 33
Transportation costsMotor carriers:Intercity 335 33Local 174 17
Subtotal 509 50
Other carriers:Railroads 42 4Water (international 22, domestic 5) 27 3Oil pipelines 9 1Air (international 9, domestic 22) 31 3Forwarders 18 2
Subtotal 127 12Shipper-related costs 8 1Logistics administration 39 4
Total logistics costs 1015 100
Source: Wilson, 2005

The management of a supply chain has moved from relationships that areseparate, sequential and transaction-based to ones that emphasize collaboration-based strategies that link cross-enterprise business operations under a sharedvision (Bowersox, 1997). The efficient management of a supply chain does notpreclude the existence of certain transaction-based relationships as conditionswarrant – but, in general, the management of supply chains has resulted ingreater reliance on long-term relationships among fewer participants.
At the same time, global sourcing has become more important, driven initiallyby opportunities for cost reduction. US firms were faster to adopt globalsourcing strategies in Asia than Japanese firms (McCann, 1998; McKendrick,Doner and Haggard, 2000). However, firms must follow flexible global supplychain strategies. As the skill and wage levels of workers in locations change andas the logistics needs of products change as they move through their devel-opment cycle, so shifts occur in supply chains. Proximity and short lead timesare important during periods of product innovation, but reliable, low-costlogistics is appropriate during a mass-production phase. The need to save timeto reduce costs is important in industries such as fashion clothing (Abernathy,2001) and fad toys (Johnson, 2001) that are characterized by highly uncertaindemands and high product seasonality. Abernathy finds strong evidence thatthe growth of Mexican and Caribbean apparel exports to the United States canbe attributed to the increasing importance of shorter and more reliable times forlogistics functions. This accounted for the greatest growth being in apparelitems requiring frequent replenishment. (The same phenomenon works to thebenefit of ex-communist Europe serving Western Europe (Economist, 2005)).
Logistics outsourcing and third-party logistics
Fuelled by pressures to decrease cost and maximize return on assets, manyfirms have reduced their activities to those processes that they regard asstrategic and as giving them a competitive advantage. This focus on coreprocesses or strengths has resulted in increased outsourcing of non-corelogistics processes. However, the characteristics of outsourcing logistics havechanged over time. Up to the deregulation era in transportation, mostoutsourcing involved a single logistics service, such as transportation or ware-housing, and was primarily for the physical performance of the service.Today, third-party logistics companies (TPLs, 3PLs) offer an array of bundledlogistics services, including operational and strategic planning as well asmonitoring and control of the logistics processes.
The attractiveness of outsourcing is evidenced by the rapid growth of thethird-party logistics industry. This sector was a $10 billion industry in 1992,more than doubling to $25 billion by 1996. Since 2000, the North AmericanTPL sector has grown 83 per cent, with a 16 per cent increase to $103.7 billionin 2005 (Armstrong & Associates, 2005). Total logistics expenditures increased
410 � Global logistics

much less, for example only 1 per cent from 2000 to 2004 in the United States(Wilson, 2005). By 2004, the North American TPL market was earning $89.4billion or 7 per cent of total logistics expenditures in North America.
Armstrong & Associates (2005) report that 64 per cent of domestic Fortune500 companies use 3PLs for logistics and supply chain functions. Lieb andBentz’s (2005: 5–15) survey of manufacturers shows that at least 80 per centused 3PL services and it was the eighth consecutive year that two-thirds ormore of the respondents were 3PL users. The 2005 Third-Party LogisticsAnnual Study (Langley et al, 2005) found that 78, 79 and 80 per cent of theNorth American respondents reported using 3PL services in 2003, 2004 and2005 respectively. The largest 3PL expenditures by industry are for auto-motive, retailing and technology (Armstrong & Associates, 2005).
Recent surveys continue to find transportation and warehousing as themost frequently outsourced logistics processes (Armstrong & Associates, 2005;Langley et al, 2005; Lieb and Bentz, 2005: 5–15). Other logistics processes thatare frequently outsourced or for which outsourcing is growing are value-added services, international 3PL services, customs clearance and brokerage,freight forwarding, cross-docking and shipment consolidation, orderfulfilment and distribution.
In spite of only marginal increases in the percentage of firms outsourcinglogistics, logistics outsourcing expenditures have risen significantly as firmsoutsourcing logistics increased their expenditures significantly. For example,BMW Manufacturing initially outsourced the basic delivery of parts to theproduction line. In 2002, it used TNT to provide inbound supply chainmanagement, including inbound material control and transportation fromsuppliers to plant. In 2004, the management of finished parts from its suppliernetwork to its parts distribution centres was also turned over to TNT (Harps,2004). Similarly, what began as a basic pallet-in/pallet-out warehousingarrangement between the Robert Bosch Corporation and StandardCorporation grew into a full-service logistics outsourcing relationship.
Companies that have outsourced successfully have gained more confi-dence in their relationships with third-party providers. Their experience hasled them to expand the scope of the logistics services outsourced and shiftfrom tactical to strategic relationships with more value-added managerial andinformation technology services provided. Langley et al (2005) note that,although users are generally satisfied with their 3PL providers, the providersare continually pressured to expand their service offerings. Finally, as firmsexpanded into global markets, a market was created for comprehensive,global TPL services, which further fuelled the growth of the TPL sector.
Shippers traditionally outsourced transportation because of economies ofscale, utilization and specialization. However, the value of a knowledge base isseen as increasingly important as information technology plays an ever greaterrole in supply chain integration. Langley et al (2005) find that 89 per cent ofNorth American respondents agreed that IT capabilities are necessary for 3PL
Logistics in North America � 411

providers, 80 per cent indicate that having the right software is a majorcompetitive advantage and 34 per cent of the North American respondentsrely on 3PL providers for IT leadership. This is particularly true in theprovision of transportation management systems (TMS) and warehousemanagement systems (WMS) information technology. The 3PL can leverage itsexpertise and spread out fixed costs of utilizing such technology over multipleclients. However, the Langley et al (2005) survey reveals that only 53 per cent ofNorth American companies use TPL-provided transportation managementsystems, compared with 80 per cent in Europe.
Flexibility and responsiveness are another reason why North Americanfirms have increased their outsourcing of logistics. In 2002, Canadian apparelmanufacturer and retailer Roots was handling licensed USA-logo Olympicwear during the Winter Games in Salt Lake City. With patriotism in thosepost-11 September days spurring on demand for Team USA apparel, expecta-tions of 100 calls per day into the Roots customer service centre were wellbelow the actual 1,500 per day peak. The company was forced to open aseparate web-based ordering channel and revamp its entire distributionstrategy on the fly. With the help of a third-party call centre and fulfilmentprovider, it added two US-based call centres, moved distribution to Memphisand changed delivery carriers (Logistics Today, 2004).
During the initial development of third-party services, successful NorthAmerican firms developed the business from an asset base, such as truckingfleets and warehousing facilities. Non-asset third-party logistics servicesdominate the market today. Armstrong & Associates (2005) segment the TPLsector into four main groups, as shown in Table 25.5.
412 � Global logistics
Table 25.5 Revenues and profitability by segment, 2005
3PL segment Gross revenue Net revenue Net revenue Net income$ billion $ billion % growth % margin
Domestic transportation 30.3 4.8 18.3 12.1managementInternational transportation 38.2 14.0 13.6 6.3managementDedicated contract carriage 9.9 9.9 10.2 4.6Value-added warehouse/ 22.3 18.6 9.5 4.0distributionTotal 100.7 47.3 11.7 5.6
Note:Total gross revenue for the 3PL industry in the United States is estimated at $103.7 billion; $3 billion isincluded for the logistics software segment.
Source: Armstrong & Associates, 2005

The largest segment by gross revenues is international transportationmanagement, composed of North American firms that have expanded intointernational 3PL services and international firms, some of which were tradi-tional freight forwarders. This business and that of the domestic trans-portation management sector are largely no-asset-based. They pass on thecosts incurred for purchasing and managing transport and logistics serviceson behalf of their clients. Large firms with significant transportation volumesmay have 3PLs manage their transportation at a tactical level but may directlyidentify, select and negotiate their own transportation contracts with carriers.This is the dominant pattern for international shipping. The dedicatedcontract carriage sector supplies tractors, drivers and management as a directalternative to the client operating its own fleet. Value-added warehouse/distribution is provided by 3PLs normally providing long-term contract ware-housing or distribution centre operations with a host of value-added services.
Of course, not all outsourced service arrangements work out as hoped.However, the growth of outsourced logistics services will continue, as 3PLsprovide the expertise and responsiveness needed for firms to compete inrapidly shifting and increasingly competitive markets. As the 3PL industrymatures and more experience is gained, and existing relationships grow intotrue partnerships, outsourcing will become an even more viable and less riskyoption to more firms.
Large firms can afford to diversify their base of logistics services. Armstrong& Associates (2005) report that General Motors, Daimler Chrysler and Wal-Marteach use 30 or more 3PLs, and at least 30 other firms were found to use eight ormore TPLs. Langley et al (2005) report that 64 to 82 per cent of the respondentsto their survey use one to five 3PL providers, and smaller percentages usedlarger numbers, in some instances over 50 providers. However, there has been atrend to reduce the number of 3PLs used. Langley et al observe that approxi-mately half of their respondents agreed that they were ‘moving to rationalize orreduce the number of third parties we use’. Lead logistics providers (LLPs) andfourth-party logistics providers (4PLs) are another alternative. They have broadsupply chain expertise with deep industry and consultative skills, advancedtechnology capability and integration, and are recognized for innovation andcontinual improvement. For example, Nortel Networks selected Kuehne &Nagel to be its 4PL in 2002 to manage its global logistics operations including3PLs, carriers and parcel movers (Inbound Logistics, 2003). In 2001, GeneralMotors and Menlo Logistics formed Vector SCM to act as the LLP managingand coordinating the activities of approximately 20 core 3PLs in North Americaas well as redesigning GM’s global supply chain (Armstrong, 2004). Despitethese high-profile examples, there are very few true LLP or 4PL partnerships, asthe concept still needs to be proven and only the largest firms have thecomplexity problem of multiple 3PLs.
Foreign-owned freight forwarders once dominated international logisticsservices in North America. Foreign 3PLs such as Tibbett and Britten, and Exel
Logistics in North America � 413

have also been significant. This has changed slowly with the expansion ofdomestic firms. Some of the best-known examples have been carriers thathave developed logistics services.
US shipping companies were among the leaders of carriers developing logisticsservices. They commenced by providing freight consolidation services to meetthe needs of US retail stores buying in Asia. Sea-Land and APL developed separ-ately branded and run consolidation services in Asia: American ConsolidationServices of APL, and Buyers of Sea-Land. Subsequently, these services havegrown and been rebranded to the names of the shipping lines, APL Logistics andMaersk Logistics, of which they are now a part (see Heaver, 2002.)
UPS is another example. UPS started out as a company specializing in smallshipment services in the United States. Geographic growth was inhibited byregulations: UPS only obtained authority to serve the contiguous 48 states in1975. It started limited services in Canada in 1975 and in Germany in 1976.International air service with Europe was not commenced until 1985. UPSthen expanded rapidly internationally. UPS branched out into relatedlogistics services with the formation in 1995 of the UPS Logistics Group. Aneven wider range of services is provided by the formation of UPS SupplyChain Solutions in 2002. Acquisitions of firms in the logistics sector have beena vital part of the service expansion strategy. UPS now has courier services toover 200 countries. In 2004, 26 per cent of package revenue came from inter-national services, up from 17 per cent in 2000 (UPS, 2006).
The management of global logistics has become a much greater part oflogistics management. This is reflected in the orientation of the logisticsservice industry. A survey in 2005 of 3PL executives shows that in NorthAmerica the increased pressure to internationalize service offerings wasperceived as the most important industry dynamic. In Europe, this pressurewas ranked behind downward pressure on pricing and the recent expansionof EU membership (Lieb and Bentz, 2005, 2006).
Supply chain integration through collaboration,strategic alliances and partnerships
To realize a supply chain’s full competitive and market potential, companiesneed to link their organization with other participants in the supply chain,creating an extended team or ‘interprise’. These ‘partners’ include suppliers,vendors, distributors and customers, where suppliers can be suppliers oflogistics services as well as products.
Sharing of risks and gains, long-term commitments, and co-mingling ofoperations and information characterize cooperative relationships. Theseactions can result in customer service enhancement and cost reduction fromredesigning processes across the whole supply chain instead of one part of it,
414 � Global logistics

from specialization building on each partner ’s strengths, and from betterplanning resulting from increased information flow among the partners.Communication and information sharing characterize successful partner-ships, allowing all participants to plan and coordinate their operations moreeffectively.
A number of collaborative strategies and tactics have been developed andapplied, including information sharing, vendor-managed inventory, just-in-time II, collaborative production and forecasting replenishment, and collab-orative transportation management to name a few. Many of these techniqueswere pioneered in the 1990s, but their use has continued to accelerate. In 2002,Capital Consulting & Management concluded that only 1 to 5 per cent of USmanufacturing companies had reached the stage of optimized planningwhere the most substantial supply chain benefits existed (CCMI, 2002).Similarly, a survey of 150 senior executives of Fortune 1000 companies byAccenture indicated that many companies are lagging in terms of true collab-oration – despite a compelling business case for achieving it (Bowman, 2002).The 2002 Ohio State University Survey of Career Patterns in Logistics studyfound substantial increases in the percentage of the respondents usingstrategic partnerships with key suppliers and key consumers. This findingwas confirmed by a 2005 Accenture survey, which found that ‘Collaborationlevels have increased dramatically in the past three years’ (Matchette andSeikel, 2004).
Vendor-managed inventory (VMI) is a tactic where the supplier rather thanthe customer generates orders based on stocking information, typicallyaccessed using EDI. It is often considered a first step towards more advancedsupply chain collaboration, and has been used for many years in NorthAmerica in a variety of industry sectors, but it rose to prominence in the effi-cient consumer response (ECR) era because it achieved results. Labelledcontinuous replenishment, it enjoyed one of its most successful applicationswith Campbell’s Soup, where 31 participating grocery chains obtained signifi-cant improvement in inventory turns and a reduction in stock-outs (Lee,Clark and Tam, 1999). Similar successes across North America are reported ina variety of industry sectors. VMI Projects at Dillard Department Stores, JCPenney and Wal-Mart have shown sales increases of 20 to 25 per cent, and 30per cent inventory turnover improvements.
Of course, there have been failures. After 12 months of their VMIprogramme, Spartan Stores decided to halt the programme. Inventories didfall, but it was because small orders were being placed at more frequentintervals. A root problem was that Spartan and their VMI vendors did notcome up with an effective way to deal with promotions planning and pricing.As a result, the vendor’s decision makers could not all do as effective a job asSpartan’s own buyers.
One mechanism for communication is just-in-time II. JIT II has vendor-managed operations taking place within a customer’s facility, and was popu-
Logistics in North America � 415

larized by the Bose Corporation. Supplier representatives – called ‘in-plants’ –place orders to their own companies, relieving the customer’s buyers of thistask. Many also become involved at a deeper level, such as participating innew product development projects and manufacturing planning.
Collaborative production and forecasting replenishment (CPFR) usesavailable internet and EDI-based technologies to collaborate from operationalplanning through to execution. CPFR is recognized as a breakthroughbusiness model for planning, forecasting and replenishment, and was origi-nally developed by Wal-Mart and Warner-Lambert in 1995. It has beenformalized into a nine-step process that is adjusted to fit specific tradingpartner relationships and capabilities. Numerous pilot and full implementa-tions have proven the benefits, but this has been generally confined to theretail and consumer package goods industry (Suleski, 2001). In 1998,Wegmans Food Markets and Nabisco, Inc began a CPFR project on PlantersNuts items and gained service level increases and an 18 per cent inventoryreduction. In 1999, Canadian Tire shared with 10 suppliers information suchas statistical forecasts, promotional life forecasts, dealer order holdings,purchase orders, planned orders and on-hand inventory levels, resulting inservice increases, DC stock reduction, increased stock turnover and reducedsupplier delivery cycle. A CPFR survey conducted in 2000 found that 70 percent of the respondents were actively researching, undergoing pilots orpreparing to roll out CPFR programmes (Saha, undated), but ‘its adoptionhowever remains sluggish’. To date, most CPFR implementations have beenlimited to near-exclusive relationships between a single large manufacturerand a single retailer for a specific set of products (Fraser, 2003).
Collaborative transportation management (CTM) is an extension of CPFRthat involves converting order forecasts developed via CPFR into shipmentforecasts and collaboratively ensuring their accurate fulfilment (Esper andWilliams, 2003). For example, the dense network efficiency model of Transplaceimproves vehicle utilization through the development of continuousmovement routeings that minimize empty miles, circuitry and dwell time fortruckers. Similarly, the NISTEVO alliance illustrates collaboration acrosscompetitors. Under the NISTEVO programme, the transportation needs ofeach participant are sent in advance to a neutral third party (NISTEVO), whichutilizes advanced routeing software to optimize routeing and vehicle utilizationacross the shippers and the carriers. The matching process improves assetutilization. Its effectiveness is increased by the large volume of traffic aggre-gated from high-volume shippers and because the matching process beginsbefore vehicles are dispatched rather than after they have been put on the road.Dollar savings are estimated to be in the range of 5 to 18 per cent.
The 3PLs are often enablers for collaboration. For example, in Ontario,Canada, Excel Logistics operates distribution centres for a cereal manufac-turer and a soup manufacturer delivering products to the same or closelylocated grocery stores. As canned soup products have a high density and
416 � Global logistics

cereal products have low density, Excel is able to fully utilize vehicles’ weightand cubic capacity by combining the freight of both clients, reducing the totalnumber of vehicle trips that would have been required if the products hadbeen shipped separately. Lieb and Bentz observe that increasingly the 3PLusers in their surveys report that their major vendors and customers are alsoserved by their primary 3PL provider (Lieb and Bentz, 2004). ‘Clearly, onewould expect this development to facilitate further supply chain integration.’
While many success stories can be cited, there are also many failures. Nixet al (2004) found that approximately 29 per cent of 477 respondents indicatedtheir collaboration was unsuccessful. Collaboration requires a relationshipoften characterized as a partnership or alliance to be successfully imple-mented. While many surveys may indicate that firms are participating in part-nerships, deeper inquiry often finds that ‘truly synergistic relationships arevery rare’. These relationships ‘represent only a small fraction of supply chainmanagement relationships – typically 5 per cent or less’ (Fawcett, Magnanand McCarter, 2005). Fawcett, Magnan and McCarter (2005) sum up the situ-ation in North America well when they conclude:
Companies today are much more aware of opportunities to improve organizationalcompetitiveness through closer, partnership relationships and have moved away fromthe adversarial model that dominated buy/seller relations for much of the 1900s.However few managers have completely abandoned the notion that channel powercan and should be used to advance their companies’ positions. The result is that morecollaboration is taking place in modern supply-chain relationships but is taking placein a very selective basis.
By remaining opportunistic, most managers are ‘limiting their ability to buildtruly cohesive, mutually advantageous supply chain teams’.
In summary, the supply chain concept recognizes that, for optimum effi-ciency, logistics needs to be designed and managed in the context of the wholesupply chain, including internal and external aspects. Collaborative decisionmaking among partners in a supply chain is a new business model charac-terized by the building of relationships, shared knowledge, more certainty,less guessing and ultimately better planning. The 3PLs are facilitating collabo-ration and integration among their clients, and information technology isimproving communication linkages. However, to collaborate effectively,supply chain management requires partnerships and alliances. NorthAmerican firms recognize the benefits of collaboration and have selectivelyembraced the concept, but there is a long way to go with respect to devel-oping the relationships that make collaboration successful.
Logistics in North America � 417

Evolving supply chain process design – from push topull
Reducing inventory investment and associated costs through cycle timereduction has become a primary thrust for many firms. This has led to amovement from ‘push’ to ‘pull’ systems where the ultimate objective is to‘make what the company has sold’ rather than ‘sell what the company hasmade’. ‘Demand driven’, ‘just-in-time’, ‘quick response’, ‘build or assemble toorder’ and ‘continuous replenishment’ are some of the labels used to describevarious applications and types of pull systems. Suppliers and logistics serviceproviders are required to be more responsive as demand drives logistics trans-actions and products can bypass traditional storage and holding processesand go directly to the retail store or customer. These products are often mixedwith other freight for immediate delivery in cross-dock facilities by truck. Dellis considered the defining demand-driven business and is well described else-where (Magretta, 1998). However, there are numerous examples of firms andsupply chains successfully re-engineering their processes from push to pull inNorth America. Pilot implementation is usually not an option as the transfor-mation required is both systems-wide and strategic.
Pull systems are desirable for goods with high inventory costs. This appliesnot only to high-value and high-obsolescence products but also to high-cubicitems, such as beds. Bedford Furniture Industries and Sears Canadadeveloped a quick response partnership after Bedford re-engineered itsproduction process from make to stock to assemble beds within days (Chow,1995). The result was a virtual elimination of inventory and subsequentreduction in warehouse space required the substitution of substantially lesscross-docking space for the storage space, reduced handling and more effi-cient transportation delivery patterns. Similar pull systems have been estab-lished for bed supply chains in the United States and for appliancemanufacturers. Arntzen and Shumway (2002) describe the changes indemand planning, material supply, manufacturing scheduling and ordermanagement introduced by NMS Communications and its manufacturingsubcontractor, STMC Manufacturing, to create a high-speed, demand-drivensupply chain. Despite the many high-profile examples of successful pullsupply chain strategies, most observers still view the migration from manu-facturing-based ‘push’ logistics systems to ‘pull’ networks as an emergingtrend. Ross, Holcomb and Mandrodt (2004) indicate that much work remainsto be done to develop adaptive supply chains. Much of the current logisticsenvironment appears to be a ‘blended model’: one that incorporates elementsof both push and pull systems. Industries where the economics of largeproduction batches is overwhelming, such as in the chemical industry, haveseen only limited application of pull logistics systems for their line of indus-trial and consumer products. For example, in Dupont’s industrial chemicals
418 � Global logistics

and compounds supply chain, the overwhelming economics of largeproduction batches has led the company to forward-place product inven-tories (generally in multiple railcar quantities) at customer sites. Similar batcheconomies exist for many of Dupont’s industrial chemical customers. Thisfield inventory allows Dupont to provide its customers with consistent andtimely replenishment.
The development of pull systems has increased the utilization of a numberof best practices, including vendor-managed inventory (discussed above),cross-docking, just-in-time supply, supplier hubs and merge in transit.Strategies to reduce inventory have also encouraged the location of supplierfactories close to manufacturing facilities. This is not new, particularly in theautomobile and other mass-production industries. In industries where re-location of production is not possible, vendor or supplier hubs have beendeveloped to improve the efficiency of local just-in-time delivery. Supplierhubs are quite common in the PC and electronics manufacturing sector (Dellcalls them ‘logistics supply centres’). In 2003, about 30 suppliers provided 75per cent of Dell’s direct material purchase spend, and most of them main-tained 8 to 10 days of inventory in the nearby logistics supply centre(Blanchard, 2003). The supplier hub operation maximizes vehicle load factorsby consolidating components for delivery, which also reduces dockcongestion at plants by reducing the number of vehicles making daily deliv-eries. Toyota has consolidated the majority of inventory in the Toyota supplychain into regional parts distribution centres, reducing inventory across thesystem. However, frequent small deliveries of parts to the dealers andovernight courier deliveries are increased. The cost trade-off is judged tofavour this inventory centralization.
The JIT concept has been adapted to serve the retail, grocery and healthcare sectors in the form of quick response, continuous replenishment andstockless inventory respectively. The tools used to implement theseapproaches include bar-coding of product, point-of-sale capture of sales infor-mation, electronic data interchange and vendor-managed inventory. Pioneerslike Procter & Gamble (P&G) and Wal-Mart lead the way with systems gearedto quick response and continuous replenishment. The firms use real-timesales data available through robust information systems to take time and,therefore, inventory out of the supply chain. Quick response emphasizes thespeed of delivery while continuous replenishment focuses on the small butfrequent lot size dimension. Most of these inbound logistics networks stillutilize the retailer’s distribution centre, and the impact on inbound truck tripsis typically minimal. For example, P&G supplies multiple products at a timeinstead of sending large batches of single commodities infrequently. Suppliersand customers alike benefit from levelled production and delivery of product,which reduces inventory requirements at both ends of the supply chain.
The next step involves bypassing the retailer ’s distribution centre (DC)either by direct store delivery or by cross-docking. Direct delivery to retail
Logistics in North America � 419

stores from manufacturers is frequently uneconomical for major suppliersunless full loads can be built. One way to build full loads is to use cross-docking. Cross-docking is a process that prevents products from coming torest as static inventory at the retailer’s DC. The manufacturer makes up indi-vidual store orders and delivers this store-ready merchandise to the retailer,which simply offloads it at the DC and cross-docks it to awaiting deliverytrucks already scheduled for delivery to stores. Retailers like Wal-Mart, whichare able to ‘pull’ their products, are able to cross-dock a larger percentage oftheir product directly to their stores. However, few retailers have been able toachieve anything close to true cross-docking, as it requires incredibly complexplanning and coordination. Perhaps its greatest weakness is that few manu-facturers are equipped to create store order quantities efficiently. Dell andCisco utilize a variation of cross-docking, merge in transit, where the cross-docked components from different suppliers are merged with stored goods.Blanchard (2003) reports that Maytag maintained 41 cross-dock facilities,which store no inventory. Maytag covers 70 per cent of the US populationfrom a cross-dock facility no more than 125 miles away, enabling high fill ratesand short lead times.
In summary, many North American firms seek to become more demand-driven and move towards pull supply chains, but this is still an emergingpractice despite the high-profile examples. To be sure, there are manyindustry sectors and specific businesses where supply lead times andproduction economies will more than justify the traditional forecast-drivensupply chain, but just as certain is the need to be responsive to decliningproduct life cycles and customer order lead times. The trend by many NorthAmerican retailers and manufacturers to source offshore makes it moredifficult to develop fast and reliable supply chains necessary for a pullstrategy. This requires mixed strategies with a combination of the two systemsand, often, a relocation of distribution centres.
Information technology and visibilityInformation technology is a key enabler in the North American logistics andsupply chain management practices highlighted in this chapter. It is crucial tothe upstream visibility of supply and the downstream visibility of demandessential to effective logistics and supply chain management. Informationtechnology plays an ever greater role in supply chain integration because it isthe availability of the right information at the right place at the right time atthe right level of granularity and detail that enables decisions across supplychain partners to be coordinated and integrated.
The need to achieve visibility has been spurred by many factors, someunique to the United States, others relevant worldwide (Abbot, Mandrodtand Moore, 2005). The terrorist attack of 11 September 2001 has made infor-mation systems an important tool in security initiatives. Measures have been
420 � Global logistics

led by the United States and have global consequences. The US CustomsService introduced the Container Security Initiative to screen for high-riskcontainers at overseas ports, and the Customs–Trade Partnership againstTerrorism (C–TPAT) under which companies can reduce the likelihood oftheir containers being inspected by participating in the C–TPAT programme.Advance notice requirements for goods being shipped to the United Stateshave advanced the application of information processes to facilitate security,but to the benefit of logistics, as it requires collecting information farther back(upstream) in the supply chain. There are some benefits to offset the costs thatsecurity measures impose. To facilitate trade within NAFTA, the three coun-tries have an interest in compatibility of security measures.
The United States has introduced new requirements in business practicesas a result of the fraud scandals of Enron, WorldCom and others. TheSarbanes–Oxley Act (SOA) was passed to make sure that there are internalcontrols in businesses that govern the information related to financial state-ments. This has implications for contractual relationships includingoutsourced supplies and logistics services. The need to report the financialimplications of contracts, including the consequences of breaches of contracts,adds new dimensions to the logistics manager’s tasks and further links withthe financial processes of companies. The logistics job is more complicated.
Installing an enterprise resource planning (ERP) system is an importantdriver for companies of a centralized data repository to collect, store, organizeand cross-reference data across applications, processes and functions. This is amajor corporate undertaking, so that for logistics many firms utilize the infor-mation system capabilities of 3PLs. Shippers and carriers are now looking toadopt new technologies to track assets and products, such as radio frequencyidentification devices (RFID) and mobile or satellite communications.
Abbot, Mandrodt and Moore (2005) found that RFID was the mostfrequently added software capability in 2004. RFID has the potential not onlyto automate manual processes but to provide cost-effective visibility in thesupply chain down to the item level. Wal-Mart, which drove the adoption ofbar codes throughout retail nearly 20 years ago, is the leader in adopting RFIDby requiring its suppliers, numbering into the tens of thousands, toimplement RFID tagging on all pallets and cases. It also required the 100biggest suppliers to have implementation plans in place by February 2004.Only a few years earlier, the retail giant endorsed the EDI-INT AS2 standardand directed 10,000 mid-size suppliers to adopt those communicationprotocols as a way of sending and receiving transactional data. Its adoption ofthe UCCnet standard in 2001 provided much-needed momentumthroughout the consumer packaged goods industry to embrace datasynchronization. This has spurred other sectors in the supply chaincommunity to act as well. Suppliers to Wal-Mart will have the same RFIDcapabilities to offer to their other customers. Lieb and Bentz found that two-thirds of the manufacturing companies identified as 3PL users in their 2004
Logistics in North America � 421

survey are either currently committed to the use of RFID technology in theirlogistics operations or are actively considering its use (Lieb and Bentz, 2005:5–15). The 3PLs and other logistics service providers will have to respond withtheir own ability to read and utilize RFID tags, which could eventuallysupplant many bar-coding applications.
Growing challenges to the logistics system
The growth and globalization of commerce rely on efficient transport andlogistics services – and this poses two substantial challenges for the future.The first is to ensure that sufficient capacity exists in the infrastructure system,and the second is to develop and operate with a greater consideration forenvironmental consequences.
Capacity constraintsThe rapid growth of international trade means that congestion pressures arisebecause this traffic moves through a limited number of gateways at bordercrossings, airports and seaports. However, two conditions have pushedcapacities to their limits. The first is the need for heightened security measuresthat effectively reduce capacity, especially at trans-border locations. In spite ofincreased spending on staff and facilities, including information technology,major congestion exists at busy crossings such as the crossing of the DetroitRiver, which sees heavy traffic serving the integrated auto industry. Delays inborder crossing and uncertainties about the continuity of reliable service nowmake trans-border logistics a less attractive strategy than previously.
The second condition has been the unexpectedly high rates of growth intrade, especially with China. The efficiency of the overseas container logisticssystem has been of concern for some time; in the United States, the ability ofports to serve larger vessels, the adequacy of terminal capacity, and thequality of the land-side access have been of concern. In 2000, shippers andcarriers on the West Coast formed a West Coast Waterfront Coalition to helpaddress challenges there. In February 2003, the group became a nationalorganization and dropped ‘West Coast’ from its name. Its existence could notprevent the severe congestion of 2004. The congestion threatened the abilityof firms to meet their business plans and brought home the importance ofseaports in the North American economy.
In 2005, the Waterfront Coalition (2005b) issued a call to action, whichreflected that the level of congestion experienced in 2004 was the result ofmany factors, including the failures of shippers and carriers ‘collaboratively toshare information concerning expected cargo volumes’ and the inadequacy ofmany operating practices. (See also Damas, 2005; Damas and Kulisch, 2005.)The problems for shippers and expectations of continuing high rates of trade
422 � Global logistics

growth have resulted in revisions to perceptions and strategies, some of whichwere evident during 2005. They include immediate and long-term initiatives:
� Spreading the peak by shipping earlier and using more ports, includingshipping from South Asia to the Atlantic coast.
� The development of more inland terminals to receive goods directly fromports by rail, for example in Kansas City (KC Smartport, 2005).
� Increased efforts to improve the integration of port terminals and inlandcarriers, for example the launch of PierPass in Los Angeles and Long Beachas a means to reduce the congestion of drayage trucks (WaterfrontCoalition, 2005a; PierPass Inc, 2006). The working of PierPass may alsohave contributed to the 25 per cent increase in rail moves off the terminalsin Los Angeles in 2005 (Seaports Press Review, 2006).
� The interest of major shippers and major terminal management companiesin the development of new container terminals, including those in Mexico,for example at Lazaro Cardenas and, possibly, Punto Colonet, and inCanada at Prince Rupert.
Two important dimensions of the transport capacity problem in NorthAmerica are the need for more infrastructure capacity and the need for bettermethods of integration among all participants in supply chains. The ability ofinfrastructure to serve the growth of international traffic is tight. The railindustry, in particular, has progressed through 25 years of capacity rational-ization and service improvement under the pressures of market competition.It is faced with more urgent needs for capacity expansion than formerly. Portsand highways serving international trade require expansion to meet tradegrowth. However, a part of the capacity problem arises from the ways inwhich logistics has been managed. Capacity has been assumed to be available.Strategies to reduce peak demands have been given too little attention inlogistics and supply chain decisions. The port–inland interface provided bydrayage services has not been managed effectively as a part of the logisticssystem. It has too often been ignored or fallen through the gap at the transferof responsibility between shipping lines and shippers or their representatives.The result is that the Waterfront Coalition now recognizes the need to ensurea system that provides drayage services with adequate financial returns.
Unfortunately, ideas on paper take a long time in their acceptance for actionand then their implementation. Traffic forecasts based on expected rates ofgrowth in China (and then India, Brazil and other developing countries) and therate of expansion of Chinese (and other) port facilities cast serious doubts on theadequacy of the North American infrastructure. The capacities of port terminals,of city highways and of the rail system are all potential real bottlenecks. The rateat which capacities may be expanded are constrained by many factors: institu-tional factors when public and private participation is necessary or appropriate;the availability of resources; and the environmental considerations.
Logistics in North America � 423

Environmental considerationsThere is now heightened awareness of the consequences of economic growthfor the environment. Transport and, therefore, logistics services are affectedbecause of the effects of fuel consumption on air quality and economic growthgenerally on land uses. Recognition of the need to address environmentalconcerns has led to environmental approval processes that can be lengthyand are often large parts of critical paths for new facilities, such as portterminals. Ports face particular problems because of sensitivity of the marineas well as the land environments and because ships, generally an energy-efficient way to move goods, are a major source of urban air pollution.Further, the concentration of trucks on routes to and from terminals, oftenalready heavy with urban traffic, can be problematic. In general, congestion isa major source of environmental damage.
Providing increased logistics capacity to meet the growing needs ofcommerce and, particularly, of international trade faces new challengesbecause of the need for greater attention to the environmental consequencesof economic growth. Proactive approaches are increasingly common,welcomed by many environmentalists but treated cynically by others.
Concluding comments
The development of logistics strategies in North America over the last decadehas followed well-established paths. Logistics has become a more importantand better-integrated part of corporate strategy, and supply chainmanagement has been associated with increased outsourcing globally. Thesuccess of North American enterprises in improving logistics performance isevident in the low level of logistics costs compared with other regions.
Developments in information technology have played an important role inimproved performance in the past and hold new opportunities for improve-ments in the future. However, success brings challenges. Traffic growth isputting pressure on the capacity of transport infrastructure. Transport andlogistics services face new challenges in the design and operation of theirsystems in the light of capacity conditions. Security requirements place newdemands on procedures and facilities. Greater awareness of the effects ofeconomic activities on the environment is placing new constraints andrequirements on transport and logistics infrastructure and services.
The success of logistics in North America in the past has been its ability tofacilitate domestic and international trade with improved service levels andlower costs. To achieve these results in the future will require further inno-vation in technologies and strategies.
424 � Global logistics

References
Abbot, J, Mandrodt, KB and Moore, P (2005) From Visibility to Action: Year 2004report on trends and issues in logistics and transportation, Capgemini, Paris
Abernathy, FH (2001) Globalization in the apparel and textile industries: whatis new and what is not, Harvard University, Center for Textile and ApparelResearch, mimeo
Antweiler, Werner (2006) Canada’s International Trade and Investment Profile,http://strategy.sauder.ubc.ca/antweiler/ [accessed 14 February 2006]
Armstrong & Associates (2005) 5th Annual Analysis of Third-Party Logistics Provider(3PL) Customers Trends and Market Segments, www.3plogistics.com/news.htm
Armstrong, E (2004) Site visit – Vector SCM and Menlo Worldwide, 16November
Arntzen, BC and Shumway, HM (2002) Driven by demand: a case study,Supply Chain Management Review, Jan/Feb, pp 34–41
Association of American Railroads (2005) www.aar.org/PubCommon/Documents/AboutTheIndustry/Statistics.pdf
Blanchard, D (2003) 10 best supply chains, Logistics Today, DecemberBowersox, DJ (1997) Integrated supply chain management: a strategic impera-
tive, Council of Logistics Management Annual Conference Proceedings, pp 181–90Bowman, RJ (2002) Collaboration: desired by most, practiced by a precious
few, Global Logistics and Supply Chain Strategies, NovemberCapital Consulting & Management (CCMI) (2002) CCMI outlines current
state of supply chain collaboration, Press release, 8 JulyChow, G (1995) Logistics trends and strategies: implications for carrier
strategies, in TPW Policy Perspectives ‘94, ed M Nyathi and J Schmitzer, pp143–61, March, Institute of Transport Studies, University of Sydney, Sydney
Damas, P (2005) Too many cooks in part capacity decisions, American Shipper,May, pp 88–90
Damas, P and Kulisch, E (2005) Shippers, politicians sound off on transportbottlenecks, American Shipper, August, pp 66–69
Economist (2005) The rise of nearshoring, 3 December, pp 65–67Esper, TL and Williams, LR (2003) The value of collaborative transportation
management (CTM): its relationship to CPFR and information technology,Transportation Journal, Spring, pp 55–65
Fawcett, S, Magnan, GM and McCarter, MW (2005) Supply chain alliances andreality, Working paper, www.business.uiue.edu/Working_Papers/papers/05-0116.pdf
Fraser, J (2003) CPFR – status and perspectives: key results of a CPFR survey inthe consumer goods sector and updates, in Collaborative Forecasting andReplenishment: How to create a supply chain advantage, ed D Seifert, pp 70–93,American Management Association, New York
Harps, LH (2004) From tactical to strategic: the 3PL continuum, InboundLogistics, July
Logistics in North America � 425

Heaver, TD (2002) Supply chain and logistics management: implications forliner shipping, in Maritime Economics and Business, ed Costas Grammenos,pp 375–96, Lloyds of London Press, London
Hillberry, R and McDaniel, C (2002) A Decomposition of North American TradeGrowth since NAFTA, USITC Working Paper 2002-12-A, US InternationalTrade Commission, Washington, DC
Inbound Logistics (2003) Outsourcing globally from the inside out, JanuaryJohnson, E (2001) Learning from toys: Lessons in managing supply chain risk
from the toy industry, California Management Review, 43 (3), pp 106–24KC SmartPort (2005) America’s Inland Port Solution, http://www.kcsmartport.
com/sec_about/section/StrategicPlan.htm [accessed 3 March 2006]Langley, JC et al (2005) 2005 Third-Party Logistics: Results and findings of the 10th
annual study, Capgemini, ParisLee, HG, Clark, T and Tam, KY (1999) Can EDI benefit adopters?, Information
Systems Research, 10 (2), pp 186–95Lieb, R and Bentz, BA (2004) 3PL CEO perspectives, North America, American
Shipper, December, pp 46–54Lieb, R and Bentz, BA (2005) Third Party Logistics Services by Large American
Manufacturers: The 2004 survey, Spring, Capgemini, ParisLieb, R and Bentz, BA (2006) European 3PL CEO perspectives, American
Shipper, January, pp 58–64Logistics Today (2004) 10 best supply chains of 2004, www.logisticstoday.comMcCann, Philip (1998) The Economics of Industrial Location: A logistics-costs
approach, Springer, Berlin, p 228McKendrick, DG, Doner, RF and Haggard, S (2000) From Silicon Valley to
Singapore, Stanford University Press, Stanford, CAMagretta, J (1998) The power of virtual integration: an interview with Dell
Computer’s Michael Dell, Harvard Business Review, March–April, pp 72–84Matchette, J and Seikel, A (2004) How to win friends and influence supply
chain collaboration, Logistics Today, DecemberMentzer, JT (2001) Defining supply chain management, Journal of Business
Logistics, 22 (2), pp 1–26Nix, N et al (2004) Keys to effective supply chain collaboration, Special report
from the Collaborative Practices Research Program, Executive summary,15 November, The Neeley School of Business, Fort Worth, Texas
Office of the US Trade Representative (2005) Trade Policy Agenda, www.ustr.gov/assets/Document_Library/Reports_Publications/2005 [accessed 17February 2006]
Ohio State University (2002) Ohio State Survey of Career Patterns in Logistics,Ohio State University, Ohio
PierPass Inc (2006) PierPASS Offpeak Program Diverts a Million Truck Trips fromDaytime Los Angeles Traffic, 6 January, http://www.pierpass.org/files/million_trucks_jan_6_06_final.pdf [accessed 3 March 2006]
426 � Global logistics
Rodrigues, AM, Bowersox, DJ and Calantone, RJ (2005) Estimation of globaland national logistics expenditures: 2002 data update, Journal of BusinessLogistics, 26 (2), pp 1–15
Romalis, John (2005) NAFTA’s and CUSFTA’s Impact on International Trade,National Bureau of Economic Research, Working Paper 11059, January 2005
Ross, T, Holcomb, MC and Mandrodt, KB (2004) Operations Excellence: The tran-sition from tactical to adaptive supply chains – Year 2003 report on trends andissues in logistics and transportation, Capgemini, Paris
Saha, P (undated) Factors Influencing Broad Based CPFR Adoption,www.vics.org/committees/cpfr/academic_papers/Factors_Impacting_CPFR_Adoption_(VICS).pdf
Seaports Press Review (2006) Port of Los Angeles Reports Record 25% Increase inOn-Dock Rail Usage for 2005, http://www.seaportspr.com/viewportnews.cgi?newsletter_id=45&article_id=2087 [accessed 13 February 2006]
Suleski, J (2001) Beyond CPFR: retail collaboration comes of age, AMR ResearchReport, 1 November, www.cpfr.org
Taylor, JC and Closs, DJ (1993) Logistics implications of an integratedUS–Canada market, International Journal of Physical Distribution and LogisticsManagement, 23 (1), pp 3–11
UPS (2006) http://www.ups.com [accessed 21 February 2006]US Census Bureau, US International Trade in Goods and Services, Annual
revision for 2004, http://www.census.gov/foreign-trade/Press-Release/2004pr/final_revisions/index.html#goods [accessed 20 February2006]
US Central Intelligence Agency (2006) The World Fact Book, www.cia.gov/cia/publications/factbook/index.html [accessed 13 February 2006]
Waterfront Coalition (2005a) Marine Terminals in So Cal Launch PierPass,http://portmod.org/HOT%20TOPICS/hot%20topics.htm [accessed 3 March2006]
Waterfront Coalition (2005b) The National Marine Container TransportationSystem: A call to action, www.portmod.org/news/press/White%20Paper.htm[accessed 3 March 2006]
Wilson, R (2005) 16th annual state of logistics report: security report card – notmaking the grade, Council of Supply Chain Management ProfessionalsConference, 27 June, Washington, DC
Logistics in North America � 427

This page intentionally left blank
428

3PL 16, 97–99, 197–209, 344–51, 358–61,395–7, 399, 410–14
4PL 16, 97–99, 197–209, 344–51, 358–61,395–97, 399, 410–14
4Rs 27–30
ABC analysis 61action itineraries for strategies 48–53adoption of information systems 184–92agility 8, 25–26, 55–71
operating environments requiring57–61
definition 8implementation 55–71pitfalls 62–69
air transport 384–85alliance 41, 45
B2B 9, 315, 321–22B2C 9, 315–20balanced scorecard 253–57business environment 7, 16–17business resource management 136
Central and Eastern Europe 374–90advantage and disadvantages 386–87air transport 384–85CEE countries 374–76
development of logistics since 1990379–86
developing trade 380–82economic conditions before 1990
376–77logistics before 1989 377–79logistics strategies 387–89other modes 385–86rail transport 383–84road transport 382–83
challenges to logistics in China 397–402geographical variation 397–408government policies 400–02lack of third party suppliers 399lack of transport network 398multiple jurisdictions 398–99old-fashioned wholesalers 399–400
challenges to logistics in North America422–24
capacity constraints 422–23environmental considerations 424
changeinformation systems 179–80pressures in logistics 3–4, 73, 162–64
chaos 168–69China 391–402
areas for improvement 393–97challenges for logistics 397–402
429
Index

economic growth 391–92foreign operators 395–97infrastructure development 393–95outsourcing 395–97, 399spending on logistics 392–93
cluster in networks 167collaboration 29–30, 107–28, 172–74,
285–87governance structures 121, 123in North America 414–17internet 325–26ownership 120, 123power 112, 121–23risk 111–12, 118–20transport 285–87trust 110–12, 118–20
collaborative planning, forecasting andreplenishment 44, 181, 416
commercial models 336competence 38–39complex adaptive system 162, 168–71
and supply chains 170–71links to networks 171–72management structure 172–74
concentration of ownership 16concepts, management 129–49consumer value 92–94constraints on vehicle utilization 276–79contingencies 58–61co-operation see integrationcorporate governance 120, 123cost
in China 392–93in North America 403–04logistics 2–3, 356, 403–04reduction with time compression
79–80sustainability 248–50
cost leadership 22, 41–42, 98CPFR see collaborative planning,
forecasting and replenishmentcross docking 15customer
focus 82–84poor response to 64–65satisfaction 12–15, 64–65, 147–60,
268–70, 316service 147–60value 21–23, 92
customization 16, 60
definitionagility 8customer value 22–23logistics 2outsourcing 197–98risk 228–29supply chain 2supply chain management 2, 23, 34,
227, 257time compression 75
delivery, recovery and stewardship model263–64
demandcontingency 58–59logistics services 354–56management 26, 101
demand chain management 130–31,137–40
evolution 137–40flow leadership 129–46implementation 141–42
demand flow leadership 129–46design of strategy 33–54development
customer service 147–52demand chain management 137–40global trade 331–34information systems 179–82logistics 1–20, 33–36, 130–36, 147–50,
226–27, 290–93logistics in CEE 379–86management concepts 130–36new directions 21–32retail logistics 290–93supply chain management 130–36supply chain relationships 107–28sustainable 238–40trade in CEE 380–82
differentiation, product 22, 41, 43, 98direct delivery 15disposal or reuse and recycle 247–48distribution 24, 26–67, 244–46diversification 41, 47–48
Eastern Europe see Central and EasternEurope
e-business 9–10, 136, 182, 315–22customer satisfaction 316effects on supply chains 321–23improving supply chains 318–21
430 ❚ Index

integrating operations 317opportunities 323–25, 328–29partnering 325–26rising 315–16systems 326–27vision 324–25
economic conditions in CEE 376–77economic growth in China 391–92ECR see efficient customer responseEDI see electronic data interchange efficient customer response 44, 61, 293,
299–304savings 299
e-logistics see e-businessElectrolux 142–45electronic data interchange 9, 25, 181empty running 275–76enterprise resource planning 31, 180–81environmental concern 17, 238–52, 424ERP see enterprise resource planningEuropean
Central and Eastern Europe logistics374–90
integration of logistics 357–58logistics service providers 348–51,
358–61market for logistics services 350–51opportunities 368–70policies affecting logistics 351–52,
363–68Western European logistics 353–73
evolution demand chain management 137–40logistics 1–20, 33–36, 130–36, 147–50,
290–93management concepts 129–26retail logistics 290–93
exchange 92–106expand
mission 41, 46–47profession 41, 45–46
external integration 5–6, 139extranet 181
factory gate pricing 15flow leadership 129–46 formulating logistics strategy 33–54
action itineraries 48–53alliances 456differentiation 43
diversification 41, 47–48expansion by mission 41, 46–47expansion by profession 41, 45–46innovation 43–44logistics competence 38–39from logistics strategy to strategic
logistics 36–38need 33–36typology 41
four Rs 27–30fourth party logistics 16, 97–99, 197–209,
344–51, 358–61, 395–97, 399, 410–44freight transport
Central and Eastern Europe 382–85Western Europe 361–63optimization 273–89
future internet 323–29performance measures 268–71retail logistics 309–11
gaps in service 157–58global logistics
China 391–402Central and Eastern Europe 374–90cost comparisons 403–04culture 304–07North America 403–27Western European 353–73
global sourcing and supply 330–42changing business strategy 334–35commercial models 336critical success factors 340–41growth in trade 331–34identifying sources 335–36outsourcing risk 205–09, 339–40trade 331–34
globalization 10–12growth in global trade 331–34
goals 253–54setting 261–63
governance 120, 123‘green’ logistics see sustainabilitygrowth in global trade 331–34
horizontal organization structure 30–31,35
implementingagility 55–71
Index ❚ 431

demand chain management 141–42information system 184–92internet trading 323–28risk management 219–21strategies 48–53
improvement logistics 12–14, 25–26through internet 318–20vehicle utilization 280–87
incentives 91–106exchange 92–97outsourcing dilemma 97–99supplier management 100–06
incorrect measures of performance68–99
information systems 161–76, 177–96,338–99
adoption 184–92change 179–80development 179–82extranet 181implementing 184–92in North America 420–22internet 182, 326–27intranet 180–81functions 178–79strategic issues 182–84, 189–92transaction support 180use in supply chain 192–93
innovation 41, 43–44integration 4–6, 23–24, 34–36, 63, 65–61,
33–34, 172, 268–69, 317, 354–56alliances 41, 45approach to 4–6CPFR 44, 181collaboration 108–123, 172–74, 285–87European 357–58for internet 317levels 6logistics function 4–6, 23–25, 34–36North America 414–17relationships 29, 107–28service level agreements 261–63virtual 63, 65–66West European 357
international logistics 336–38China 391–402Central and Eastern Europe 374–90cost comparisons 403–04culture 304–07
North America 403–27Western European 353–73
internal integration 5–6, 138–39internationalization 307–08, 359–61internet 9–10, 136, 182, 315–29
customer satisfaction 316e-business 9, 315–22effects on supply chains 321–23improving supply chains 318–21integrating operations 317opportunities 323–25, 328–29partnering 325–26rising 315–16systems 326–27vision 324–25intranet 180–81
IS/IT see information systems
leadership, cost 22, 41–42, 98lean 7–8, 25–26levels of integration 6logistics
concepts 129–46cost 2–3definition 2development 3–4, 33–36, 130–36,
147–50, 290–93integration of function 4–6, 23–25,
34–36retail 290–314strategy 7–8, 25–26, 33–54, 91–106trends 1–20
logistics services 16, 97–99, 197–209,344–51, 358–61, 395–97, 399, 410–14
changing European demand 354–56European market 350–51European providers 348–49, 358–61opportunities in Europe 368–70transport policy 351–52UK market structure 346–50UK market trends 344–46Western Europe 353–61
management concepts 129–46of demand 26, 101relationship 100risk 207, 210–12, 219–21structure 172–74tasks 161–62
432 ❚ Index

manufacturing 25–26, 243–44market developments 354–56mass customisation 16materials 2materials administration 133–37measures of performance 12–13, 64–65,
68–69, 253–72balanced scorecard 253–57complexity 259–60concepts 257–58delivery, recovery and stewardship
model 263–64future directions 268–71incorrect 68–69input and output 260–61metrics 265–68purpose 258requirements 254service level 261–63vehicle utilization 273–89
metrics 265–68mission expansion 41, 46–47
NAFTA 405–07networks 165–68
and complex adaptive systems 171–72clusters 167definition 165–66evaluation 167–68extranet 181internet 182, 326–27intranet 180–81risk 230–35theory 165
new directions in logistics 21–32niche products 98North America 403–27
challenges 422–24collaboration 414–17information technology 420–22integration 414–17international trade 407–09NAFTA 405–07outsourcing 410–14pull systems 418–20special features 404–09trends 409–14
operating environments requiring agility57–61
categorization 61–62demand contingencies 58–59supply contingencies 59–61
operations 1optimization, road transport 273–89organisational structure 30–31, 35, 166,
172–74, 338complex adaptive systems 172–74horizontal 30–31, 35network 166vertical 30–31
outsourcing 16, 97–99, 197–209, 344–51,358–61, 395–97, 399, 410–14
definition 197–98in China 395–97, 399in North America 410–14in public sector 201–02in UK 344–50in Western Europe 348–51, 358–61pitfalls 202–05reasons for 198–201risks 205–09
ownership 16, 120, 123
Pareto analysis 61partnering see collaborationPerfect Pineapple Supply Chain
Programme 113–23performance measures 12–13, 64–65,
68–69, 253–72balanced scorecard 253–57complexity 259–60delivery, recovery and stewardship
model 263–64future directions 268–71improving with internet 318–21incorrect 68–69input and output 260–61metrics 265–68purpose 258requirements 254service level 261–63vehicle utilization 273–89
policies affecting European logistics363–68
encouraging use of rail and shipping364–66
European Commission White Paper363–64
goods vehicles in urban areas 366–67
Index ❚ 433

road transport 368postponement 14, 27, 59power 16–17, 112, 121–23pressures for change in logistics 3–4, 73,
162–64procurement 24, 240–42producer value 92–94product 1
customization 60differentiation 22, 41, 43, 98innovation 142niche 98proliferation 66–68
profession expansion 41, 45–46proliferation of products 66–68public sector outsourcing 201–02pull systems 418–20purchasing 24, 240–42
QR see quick responsequick response 26–67, 61, 295–99
in Japan 296–99
rail transport 364–66, 383–84recycle 247–48relational view 187–88relationship management 100relationships 29–30, 107–128, 172–74,
285–87governance structures 121, 123
ownership 120,123power 112, 121–23risk 111–12, 118–20trust 110–12, 118–20
reliability 27–78resilience 28–29, 223–37resource-based view 186–87resource-dependence theory 187–88responsiveness 28retail logistics 290–314
competitive strategy 294–95efficient customer response 299–304evolution 290–93future 309–11international differences 304–07internationalization 307–09quick response 26–27, 61, 295–09strategies 294–95
return loads 280–81reuse 247–48
risk 17, 111–12, 118–23, 205–09, 210–22,223–37, 270–71, 339–40
analysis 208–09assessment 213, 216–18collaboration 110–12confusion 226–28control 218–19definition 228–29financial 207–08management 207, 210–12, 219–21outsourcing 205–09supply chain 206, 210–22, 226–28uncertainty 229–30vulnerability 223–37
risk management 210–12implementation 219–21objectives 213–14stages in 213, 216–19supply chain perspective 214–16,
224–28road transport 273–89, 368, 382–83
assessing utilization 273–76Central and Eastern Europe 382–83empty running 275–76factors constraining 276–79improving 280–87Western Europe 361–63
satisfaction, customer 12–15, 64–65,147–60, 268–70, 316
servicecustomer 147–60gaps 157–58level agreements 261–63marketing 147–60quality model 157–58
sourcing globally 330–42special features of North American
logistics 404–09international trade 407–09NAFTA 405–07size of the region 404–05
systems, IS/IT 161–76, 177–96, 338–39stock-out 151strategic logistics 36–48strategy 7–8, 25–26, 36–48, 91–106
agile 8, 25–26, 55–71alternatives 41–48, 76Central and Eastern Europe 374–90cost leadership 22, 41–42, 98
434 ❚ Index

customer service 154–58design 7–8, 33–54diversification 41, 47–48first move 190follow-up 191global sourcing 334–33information systems 182–84, 189–92lean 7–8, 25–26logistics 7–8, 25–26, 33–54, 91–106options 41–48, 76product differentiation 22, 41, 43, 98retail 294–95second move 190–91services marketing 147–60technology opportunism 191–92time compression 72–90Western Europe 353–73
structure, organizational 30–1, 35, 166,172–74, 338
supplier management 100–06consolidation of demand 101–03incentives 100–01management of suppliers 104–06
supply chaindefinition 2evolution 1–20, 33–36, 130–36, 147–50,
290–93features 162–63incentives 91–106information system 177–96integration 4–6, 23–24, 34–36, 133–34,
172, 226–27performance measurement 253–72power 112, 121–23relationships 107–28resilience 230–35risk 206, 210–22, 223–37 systems 161–176
supply chain managementdefinition 2, 23, 34, 227, 257
supply contingency 59–61surplus value 92–97sustainability 238–52
background 238–40costs 248–50disposal or reuse and recycle 247–48distribution 244–46procurement 240–42production 243–44use and maintenance 246–47
systems 161–76and the supply chain 161–65complex adaptive systems 168–72networks 165–8, 171–72
techology advantage with time compression
82opportunism 191–92
theorychaosinformation system adoption 184–92network 165resource dependence 187–88transaction cost 186–87
third party logistics 16, 97–99, 197–209,344–51, 358–61, 395–97, 399, 410–14
time compression 72–90benefits 84–85competitive advantage 77–78cost advantage 79–80customer focus 82–84definition 75examples 85–88quality advantage 80–82strategies for 76–77technology advantage 82value added 73, 75–77
transaction support 180transport
Central and Eastern Europe 382–85optimization 273–89Western European 361–68
trends in logistics 1–20customer satisfaction 12–15, 64–65,
147–60, 268–70, 316e-business 9–10, 136, 315–22 globalization 10–12, 330–42integration 4–6, 23–5, 34–36, 133–34,
172, 268–69, 317, 354–56North America 409–14strategic importance 7–8trust 110–12, 118–23
UK logistics services 344–50market structure 346–49market trends 344–46
uncertainty 229–30urban areas, freight 366–67utilization, vehicle fleets 273–89
Index ❚ 435

valueadded 73, 75–77chain 60–61, 294conscious customer 21–23, 92consumer 92–94customer 21–23producer 92–94surplus 92–97
vehicle utilization 15, 273–289assessing 273–76constraints 276–79empty running 275–76improving 280–87
vendor managed inventory 29, 44vertical organization structure 30–31virtual integration 63, 65–66vision 130, 324–25, 409–10VMI see vendor managed inventory
voice of the customer 64–65vulnerability 223–37
current concerns 224–26
waste 238–40Waste Electrical and Electronic Equipment
Directive 238–51water transport 364–68Western Europe 353–73
changes in demand for logistics services354–56
limitations of integration 357logistics services 358–61market structure for service providers
358–61transport 361–63
wicked problems 235–56world trade 330–34
436 ❚ Index