Value at Risk (VaR) in uncertainty: Analysis with parametric method and Black \u0026 Scholes...
14
Value at Risk & Uncertainty InnOvaciOnes de NegOciOs 11(22): 177 - 190 © 2014 UANL, Impreso en México (ISSN 2007-1191) Fecha de recepción: 11 de agosto de 2014. Fecha de aceptación: 10 de noviembre de 2014. Value at Risk (VaR) in uncertainty: Analysis with parametric method and Black & Scholes simulations (Valor en Riesgo (VaR) en incertidumbre: Análisis con el método paramétrico y simulaciones con Black & Scholes) Humberto Banda-Ortiz, Felipe A. Pérez-Sosa, Denise Gómez-Hernández Universidad Autónoma de Querétaro, Centro Universitario, Cerro de las Campanas s/n C.P. 76010, Santiago de Querétaro, Qro. México Email: [email protected] Keywords: portfolio, uncertainty analysis, Value at Risk Abstract: VaR is the most accepted risk measure worldwide and the leading reference in any risk management assessment. However, its methodology has important limitations which makes it unreliable in contexts of crisis or high uncertainty. For this reason, the aim of this work is to test the VaR accuracy when is employed in contexts of volatility, for which we compare the VaR outcomes in scenarios of both stability and uncertainty, using the parametric method and a historical simulation based on data generated with the Black & Scholes model. VaR main objective is the prediction of the highest expected loss for any given portfolio, but even when it is considered a useful tool for risk management under conditions of markets stability, we found that it is substantially inaccurate in contexts of crisis or high uncertainty. In addition, we found that the Black & Scholes simulations lead to underestimate the expected losses, in comparison with the parametric method and we also found that those disparities increase substantially in times of crisis. In the first section of this work we present a brief context of risk management in finance. In section II we present the existent literature relative to the VaR concept, its methods and applications. In section III we describe the methodology and assumptions used in this work. Section IV is dedicated to expose the findings. And finally, in Section V we present our conclusions. Palabras clave: análisis de incertidumbre, portafolio, Valor en Riesgo Resumen: El VaR es la medida de riesgo más aceptada a nivel mundial y la principal referencia en cualquier valuación de riesgo. Sin embargo, su metodología tiene importantes limitantes que la hace poco fiable en contextos de crisis o de alta incertidumbre. Por esta
Transcript of Value at Risk (VaR) in uncertainty: Analysis with parametric method and Black \u0026 Scholes...

Value at Risk & Uncertainty
InnOvaciOnes de NegOciOs 11(22): 177 - 190 © 2014 UANL, Impreso en México (ISSN 2007-1191) Fecha de recepción: 11 de agosto de 2014. Fecha de aceptación: 10 de noviembre de 2014.
Value at Risk (VaR) in uncertainty: Analysis with parametric
method and Black & Scholes simulations (Valor en Riesgo (VaR) en incertidumbre: Análisis con el
método paramétrico y simulaciones con Black & Scholes)
Humberto Banda-Ortiz, Felipe A. Pérez-Sosa, Denise Gómez-Hernández
Universidad Autónoma de Querétaro, Centro Universitario, Cerro de las Campanas s/n C.P. 76010, Santiago de Querétaro, Qro. México
Email: [email protected]
Keywords: portfolio, uncertainty analysis, Value at Risk Abstract: VaR is the most accepted risk measure worldwide and the leading reference in any risk management assessment. However, its methodology has important limitations which makes it unreliable in contexts of crisis or high uncertainty. For this reason, the aim of this work is to test the VaR accuracy when is employed in contexts of volatility, for which we compare the VaR outcomes in scenarios of both stability and uncertainty, using the parametric method and a historical simulation based on data generated with the Black & Scholes model. VaR main objective is the prediction of the highest expected loss for any given portfolio, but even when it is considered a useful tool for risk management under conditions of markets stability, we found that it is substantially inaccurate in contexts of crisis or high uncertainty. In addition, we found that the Black & Scholes simulations lead to underestimate the expected losses, in comparison with the parametric method and we also found that those disparities increase substantially in times of crisis. In the first section of this work we present a brief context of risk management in finance. In section II we present the existent literature relative to the VaR concept, its methods and applications. In section III we describe the methodology and assumptions used in this work. Section IV is dedicated to expose the findings. And finally, in Section V we present our conclusions. Palabras clave: análisis de incertidumbre, portafolio, Valor en Riesgo
Resumen: El VaR es la medida de riesgo más aceptada a nivel mundial y la principal referencia en cualquier valuación de riesgo. Sin embargo, su metodología tiene importantes limitantes que la hace poco fiable en contextos de crisis o de alta incertidumbre. Por esta

H. Banda-Ortiz, F. A. Pérez-Sosa & D. Gómez-Hernández
178 razón, el objetivo de este trabajo es poner a prueba la precisión del VaR cuando se emplea en contextos de volatilidad, por lo que se comparan los resultados del VaR en los escenarios de estabilidad e incertidumbre, utilizando el método paramétrico y una simulación histórica basada en datos generados con el modelo Black & Scholes. El objetivo principal del VaR es la predicción de la pérdida esperada más alta para cualquier cartera determinada, pero incluso cuando se considera una herramienta útil para la gestión de riesgos en condiciones de mercados estables, encontramos que es sustancialmente inexacta en contextos de crisis o de alta incertidumbre. Además, se encontró que las simulaciones de Black & Scholes conducen a subestimar las pérdidas esperadas, en comparación con el método paramétrico y también encontramos que esas disparidades aumentan sustancialmente en tiempos de crisis. En la primera sección de este trabajo se presenta un breve contexto de la gestión de riesgos en las finanzas. En la sección II se presenta la literatura existente en relación con el concepto del VaR, sus métodos y aplicaciones. En la sección III se describe la metodología y los supuestos utilizados en este trabajo. Sección IV está dedicado a exponer los hallazgos. Y, por último, en la Sección V se presentan las conclusiones. I. Introduction
The word risk has its origin in the Latin word risicare, which means to dare. In finance, this concept is associated with the possibility of an adverse event that could cause a loss to the participants of the markets. Financial risk is a consequence of the uncertainty in the future value of the financial assets, due to changes in the factors that have an impact in their valuation. Therefore, a higher uncertainty also means higher financial risks (Banco de México, 2005).
To measure financial risks is a fundamental matter in the asset management field and in any financial operation that involves a degree of uncertainty (Benavides, 2007; Lima, 2004); particularly for financial institutions, for whom risk management is essential to ensure their viability, profitability and reputation (Harmantzis, Miao & Chien, 2006). For this reason, the development of risk management techniques has become a major topic in finance (Lechner & Ovaert, 2010).
The first attempt to study the relation between risks and returns was developed by Markowitz (1952), who propose the use of the variance of the financial assets returns as the main risk measure, arguing that the portfolio with maximum expected return is not necessarily the one with minimum variance; which means that investors can gain higher expected returns by

Value at Risk & Uncertainty
179
accepting higher variances, or to reduce their portfolios variance by giving up to expected return.
Since the publication of Markowitz's work, the variance of the assets returns has been the main risk measure until the decade of 1990, when the international crisis evidenced the need of risk parameters that could be expressed in terms of losses (Banco de México, 2005). In consequence, in that decade JP Morgan introduced the concept of Value at Risk (VaR), which consists in quantifying the amount or percentage of loss that an asset or portfolio could face in a defined period, with a statistical level of significance (Best, 1998; Jorion, 2000; Johnson, 2001; Penza & Bansal, 2001; Odening & Hinrichs, 2003; Benavides, 2007; Harmantzis, et al., 2006; Huang & Tseng, 2009).
Nowadays, VaR is the most accepted risk measure worldwide and the leading reference in any risk management assessment, as well as fundamental for any asset allocation decision (Odening & Hinrichs, 2003; Ardia, 2008; Huang & Tseng, 2009; Lechner & Oavert, 2010). However, a major challenge for any methodology for computing the financial risk is that the measure of volatility vary with each method, data samples, periods of analysis and other assumptions (Miles, 2002).
In this sense, VaR is not an exception. As a risk management tool it has important limitations, as its strong dependency on historic data, which makes it unreliable in contexts of crisis or high uncertainty (Banco de México, 2005; Lechner & Oavert, 2010); as well as its imprecision when the distribution is fat-tailed or when long-term forecasts are desired (Odening & Hinrichs, 2003). These limitations are particularly relevant in emerging markets, which are well known for their high volatility due their considerable economic shocks (Aggarwal, Inclan & Leal,1999; Huang & Tseng, 2009).
For this reason, the aim of this work is to test the VaR accuracy when is employed in contexts of volatility, for which we compare the VaR outcomes in scenarios of both stability and uncertainty, using the parametric method and a historical simulation based on data generated with the Black & Scholes model. This latter was originally proposed to estimate European call options, and extensive empirical researches have proved that there is not relevant differences between the values estimated with this method and the observed ones (Macbeth & Merville, 1979; Saavedra, 2005).

H. Banda-Ortiz, F. A. Pérez-Sosa & D. Gómez-Hernández
180
For this purpose, the layout of this work is as follows. Section II shows the existent literature relative to the VaR concept, its methods and applications. Section III describes the methodology and assumptions used in this work to undertake the comparisons of the VaR proficiency in scenarios of stability, as well as uncertainty. Section IV is dedicated to expose the findings. And finally, in section V we present our conclusions. II. Literature review
VaR as a risk management tool has received a great deal of attention
from both industry regulators and academia (Odening & Hinrichs, 2003; Bao, Lee & Saltoglu, 2006; Lechner & Oavert, 2010). This increasing popularity is explained by many factors, like the pressure of financial regulating officers to improve risk controls in financial institutions; the globalization of financial markets, which increases risk exposures of his participants; and the development of technologies of information, that has facilitated risk management in all kind of organizations (Menichini, 2004; Lechner & Oavert, 2010).
In addition, is important to highlight that the use of VaR has been encouraged by high profile organisms as the Basel Committee on Banking and Supervision of Banks for Internal Settlement, as well as US bank regulators, which gave a great impulse to the worldwide adoption of this methodology (Ardia, 2008; Huang & Tseng, 2009; Lechner & Oavert, 2010).
Indeed, VaR is an attractive tool, due its easy implementation and its simple conceptual understanding. However, even when this method is generally accepted by academics and is widely implemented in practice, it has important limitations (Odening & Hinrichs, 2003; Huang & Tseng, 2009; Lechner & Oavert, 2010). For instance, Jorion (1996) specifies that VaR outputs shall not be taken at face value, and that if those estimations are based on historical data they surely have a degree of distort.
On other hand, Artzner, et al. (1998) point that VaR ignores the time value of money, so its use may be acceptable only for small time periods. As well, Jorion (1996), Artzner, et al., (1998) and Harmantzis, et al., 2006, highlight that VaR does not reflect the addition of risks accurately, neither encourages diversification.

Value at Risk & Uncertainty
181
In addition, Ardia (2008) notices that VaR has not been studied enough considering the effects of uncertainty, and authors as Aggarwal, et al., (1999), Bao, et al. (2006), Maghyereh & Al-Zoubim (2008) and Huang & Tseng (2009), emphasize that the financial markets of the emerging economies are characterized by high volatility, which is not appropriately assessed by the traditional VaR computations.
For a better understanding of VaR scope, it is defined as a given percentile of the profits and losses distribution over a determined horizon (Odening & Hinrichs, 2003; Ardia, 2008; Huang & Tseng, 2009; Lechner & Oavert, 2010). In other words, VaR shows the level of loss of the assets, in which the probability of the loss surpass that amount in a period of time, due an accepted confidence level. So, to find an asset's VaR, is required to set previously the desired confidence level, as well as the time period in which could occur the losses of the analyzed assets (Banco de México, 2005; Huang & Tseng, 2009; Lechner & Oavert, 2010).
Regulators use to require to financial institutions VaR's with 99% of confidence level (Ardia, 2008; Lechner & Oavert, 2010), and holding periods of two weeks, in order to prevent insolvency in financial institutions. Nevertheless, this parameters are often considered inadequate, so many analysts ask for VaR's with 95% of confidence level and one day holding period (Ardia, 2008).
There are several methods to estimate VaR, two of the most popular are the parametric method and the historical approach. The parametric method is a simple and intuitive approach based in the statistical hypothesis of normality (Banco de México, 2005; Bao, et al., 2006; Lamothe & Vásquez, 2012). Thus, the distribution of the expected returns is a fundamental matter for this method and is commonly assumed as normal; nevertheless, recent empirical literature suggests that this assumption is inaccurate as a general theoretical framework of finance economics (Maghyereh & Al-Zoubi, 2008).
The popularity of this method is based on its simplicity and its straightforward intuition (Odening & Hinrichs, 2003; Bao, et al., 2006), however, it has failed in capturing the actual volatility of the emerging markets (Bao, et al., 2006); due the assumption of normality, which as foresaid, tends to underestimate the probability of extreme losses or gains (Odening & Hinrichs, 2003; Harmantzis, et al. 2006; Lechner & Oavert, 2010). The steps for its estimation proposed by Lamothe & Vásquez (2012), are as follow:

H. Banda-Ortiz, F. A. Pérez-Sosa & D. Gómez-Hernández
182 1. To find the daily logarithmic returns of the analyzed assets. 2. To estimate the historical volatilities corresponding to each logarithmic
return series. 3. To estimate the daily relative VaR, as in (1):
𝑉𝑎𝑅 = −𝑊!𝑍∗𝜎 𝑡 (1) Where: 𝑊! = Initial value of the position. 𝑍∗ = Z value corresponding to confidence level, in normality tables. 𝜎 = Daily asset's volatility. 𝑡 = Adjustment factor. When working on a daily basis, 𝑡 = 1.
4. To estimate the gross VaR, which is the sum of individual VaRs of all assets of the portfolio.
5. To estimate the net VaR, for which is required to consider the correlations among the returns of the assets of the portfolio.
On the other hand, VaR estimation based in a historical simulation consists in analyzing the possible future values of the assets of a portfolio from their current value, assuming that historical scenarios could be repeated in the future (Odening & Hinrichs, 2003; Banco de México, 2005; Bao, et al., 2006; Huang & Tseng, 2009). The method that we use to predict the data for this simulation is the adaptation of the Black & Scholes model shown in (2), proposed by Merton (1985) in Saavedra (2005) to estimate the prices of common stocks:
ln 𝑆!~𝜙 ln 𝑆! + 𝜇 − !!
!𝑡;𝜎 𝑡 (2)
Where: 𝑆! = Simulated price of the asset 𝑆! = Last available historical price of the asset 𝜇 = Mean of asset's returns 𝜎! = Variance of asset's returns 𝜎 = Standard deviation of asset's returns 𝑡 = Running time from 𝑆! to 𝑆!
We use the Black & Scholes model to simulate the distribution of the
future values of the assets, because this method is consistent with the

Value at Risk & Uncertainty
183
popular approach to calibrate the stochastic processes of the prices dynamics. Commonly, this calibration is set on the basis of a geometric Brownian motion, as pointed by Bao, et al. (2006). In the following section we explain the methodology and assumptions used in this work to apply these methods in order to test the VaR accuracy under uncertainty. III. Methodology and assumptions
The purpose of this work is to test the VaR accuracy when is used in contexts of high uncertainty. Specifically, we focus on the Mexican market during the period corresponding from October of 2008 to February of 2009, when according to Aguirre, et al. (2013), the Mexican markets experimented the stronger impacts of the subprime crisis.
For that, we first estimate the VaR of two portfolios of Mexican stocks for different months using the parametric method, which is one of the methods proposed by McNeil and Frey (2000) in Ardia (2008), Odening & Hinrichs (2003), Bao, et al. (2006), Harmantzis, et al. (2006), Lechner & Oavert (2010) and Lamothe & Vásquez (2012); and using the historical approach based on data generated with the Black & Scholes model shown in the previous section. The analyzed portfolios are built with the stocks shown in Table 1:
Table 1. Analyzed portfolios Industry Services / Retail
GMEXICO.B AMX.L CEMEX.CPO WALMEX.V FEMSA.UBD ELEKTRA
We chose those assets for the analysis because that they had the highest capitalization value of the Mexican Stock Exchange during 2009 (Bolsa Mexicana de Valores, 2010), and they are still part of the Mexican Index of Prices and Quotations until 2013 (Grupo BMV). Our interest in analyzing the main Mexican companies of 2009, is that during the first semester of that year the subprime crisis had its worst effects on Mexican stock market; but the second semester was the opposite, due that actually it was very favorable for Mexican businesses in general.

H. Banda-Ortiz, F. A. Pérez-Sosa & D. Gómez-Hernández
184
Therefore, that was an atypical uncertain year when Mexican businesses faced both severe crisis and high profitability, and these companies had a relevant dynamism then (Bolsa Mexicana de Valores, 2010). In the same sense, the periods for which we estimate each portfolio's VaR for comparison purposes, are: a) Pre crisis: April of 2008. b) Crisis period: Monthly VaRs from October of 2008 to February of 2009. c) Post crisis: February of 2010. d) Present: February of 2013.
Once we simulate the prices of the analyzed assets with Black & Scholes model, we use those values to estimate the VaR of both portfolios for the same months from a historical approach, as previously done with the parametric method. Afterwards, we compare both sets of VaR outcomes to test the consistency of this indicator as a risk measure in uncertain contexts.
For the Black & Scholes estimations, we consider the values corresponding to the upper limit of the estimated distribution range, which are determined as in (3):
𝑆! = 𝑒 !" !!!!" ! (3) In all our estimations we start with the same wealth level, that is
$3,000,000 per portfolio; and we suppose that initially, all assets have similar weights in their corresponding portfolios, hence $1,000,000 each. Also, in all cases we assume a confidence level of 99%.
According to Aggarwal, et al. (1999), is expected to find sudden changes in variance during the periods of volatility. However, this study differs in the assumption that the volatility of emerging markets is originated from events occurred within each country. In opposite, the specific scenario analyzed in this work brings up an unprecedented context, where the source of the crisis is identified outside Mexico, that is, in the United States of America indeed. IV. Findings Parametric method
VaR estimations using the parametric method show that the industrial sector is more sensitive to crisis than services, because from April to October

Value at Risk & Uncertainty
185
of 2008, the industry's stocks increases it expected losses by 15%, while the services stock by only 1%. Even so, both portfolios faced their highest losses on February of 2009 and have been declining since then (Figure 1):
Figure 1. VaR variations in different periods
In addition, industry stocks are having a greater recovery since the peak of the crisis, but this is still insufficient to reach the stability of the pre crisis period; in opposite to the services sector, which since 2010 has been improving its losses expectations. The detailed estimations made with the parametric method are shown in Table 2:
Table 2. VaR estimations with parametric method
Period Industry Services April, 2008 $ 166,726.14 $ 138,603.20
October, 2008 $ 191,411.24 $ 140,052.34 November, 2008 $ 194,661.01 $ 141,807.73 December, 2008 $ 196,673.10 $ 141,540.23 January, 2009 $ 197,622.68 $ 142,095.14 February, 2009 $ 197,769.25 $ 142,133.69 February, 2010 $ 193,643.77 $ 138,273.73 February, 2013 $ 170,214.08 $ 133,865.76
Crisis period

H. Banda-Ortiz, F. A. Pérez-Sosa & D. Gómez-Hernández
186 Historical simulation based on data generated with Black & Scholes model
We compare the outcomes of the previous section with the results of the historical approach based on the data estimated using the Black & Scholes model, with which we predict the stocks prices during each analyzed month. Is important to notice that the generated data have an acceptable goodness of fit in relation with the observed values, for both portfolios. This statistic was measured with the square of the Pearson correlations (R2) of the VaR outcomes, which have a value of 0.92 for the industrial portfolio and 0.72 for the services portfolio.
Nevertheless, we find that the historical approach based on the Black & Scholes simulations underestimate the expected losses of the industrial portfolio in an average of 1.57%, and the expected losses of the services portfolio in an average of 1.16%. Even when these differences seem irrelevant, is important to notice that those disparities increase substantially in times of crisis. In Figure 2 can be seen that for the industrial portfolio, both VaR methods have a slight difference of 0.13% in the non-crisis months; however, during the crisis period those disparities increase up to 2.43%. It is noteworthy that the month with the higher differences is the first of the crisis period; but as long as the crisis become the normal scenario, both methods converge.
Figure 2. VaR variations in industrial portfolio
Crisis period

Value at Risk & Uncertainty
187
Regarding the services portfolio, in Figure 3 is possible to see that overall, both VaR methods achieve more similar results than for the industrial stocks. Nevertheless, the disparities in non-crisis months are almost three times higher than for the industrial portfolio, with an average of 0.36%; and the disparities to estimate expected losses during the crisis period is 1.64%, which is still a relevant difference in comparison with the non-crisis months. It is noteworthy that the historical approach based on the Black & Scholes model predicts that the potential losses for October of 2008 would be lower than for April of the same year, while actually, the parametric method shows the opposite.
Figure 3. VaR variations in services portfolio
The VaR outcomes estimated with the historical approach based on the
Black & Scholes predictions are shown in Table 3. The differences observed when comparing both methods to estimate the VaR for the two selected industries of the Mexican capital market, are consistent with the results of Bao, et al. (2006), who analyzed the accuracy of VaR as a risk measure of Asian markets. In that study, the authors concluded that several VaR approaches are quite satisfactory during stability periods, but poorly effective to compute the actual risk in times of crisis.
Crisis period

H. Banda-Ortiz, F. A. Pérez-Sosa & D. Gómez-Hernández
188
Table 3. VaR estimations with the historical approach based on Black & Scholes predicted data
Period Industry Services
April, 2008 $ 166,395.72 $ 137,839.91 October, 2008 $ 180,483.59 $ 135,159.38
November, 2008 $ 189,914.19 $ 138,957.82 December, 2008 $ 192,939.34 $ 140,555.07 January, 2009 $ 195,034.43 $ 140,362.35 February, 2009 $ 196,151.83 $ 141,038.19 February, 2010 $ 193,405.34 $ 138,018.75 February, 2013 $ 170,076.17 $ 133,394.40
Odening & Hinrichs (2003) and Maghyereh & Al-Zoubi (2008) notice that
VaR methods do not model appropriately the tail of the returns distribution, since they rely on incorrect assessments of the probability of extreme events. Therefore, VaR estimations should be used only to predict events under scenarios of certainty. This is especially relevant when analyzing emerging markets, due the evidence that suggests that the distributions of returns in those markets have heavy tails (Maghyereh & Al-Zoubim 2008).
In this sense, Harmantzis, et al. (2006) point that the historical approach is more accurate than parametric models based on the normality assumption; whilst Lechner & Oavert (2010) state that models based on historical returns are inaccurate due their incapability to predict shifts in the market environment. That is, that both methods fail to model the actual volatility of the financial markets, particularly in emerging economies (Huang & Tseng, 2009). Thus, the tendency in this field is to develop predictive models which don't assume normal distributions, but heavy tails or the extreme values approach. These methods are expected to provide more reliable measures of risk in times of uncertainty. V. Summary and conclusions
There are various methods of VaR computation, in order to measure the worst portfolio loss over some time horizon within some confidence level.
Value at Risk & Uncertainty
189
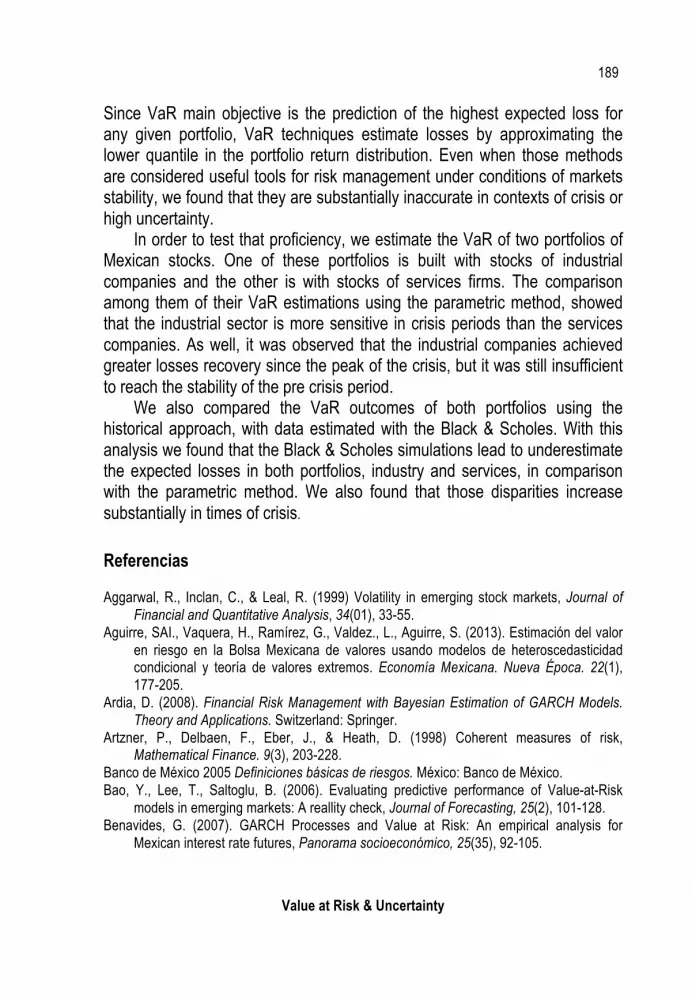
Since VaR main objective is the prediction of the highest expected loss for any given portfolio, VaR techniques estimate losses by approximating the lower quantile in the portfolio return distribution. Even when those methods are considered useful tools for risk management under conditions of markets stability, we found that they are substantially inaccurate in contexts of crisis or high uncertainty.
In order to test that proficiency, we estimate the VaR of two portfolios of Mexican stocks. One of these portfolios is built with stocks of industrial companies and the other is with stocks of services firms. The comparison among them of their VaR estimations using the parametric method, showed that the industrial sector is more sensitive in crisis periods than the services companies. As well, it was observed that the industrial companies achieved greater losses recovery since the peak of the crisis, but it was still insufficient to reach the stability of the pre crisis period.
We also compared the VaR outcomes of both portfolios using the historical approach, with data estimated with the Black & Scholes. With this analysis we found that the Black & Scholes simulations lead to underestimate the expected losses in both portfolios, industry and services, in comparison with the parametric method. We also found that those disparities increase substantially in times of crisis.
Referencias Aggarwal, R., Inclan, C., & Leal, R. (1999) Volatility in emerging stock markets, Journal of
Financial and Quantitative Analysis, 34(01), 33-55. Aguirre, SAI., Vaquera, H., Ramírez, G., Valdez., L., Aguirre, S. (2013). Estimación del valor
en riesgo en la Bolsa Mexicana de valores usando modelos de heteroscedasticidad condicional y teoría de valores extremos. Economía Mexicana. Nueva Época. 22(1), 177-205.
Ardia, D. (2008). Financial Risk Management with Bayesian Estimation of GARCH Models. Theory and Applications. Switzerland: Springer.
Artzner, P., Delbaen, F., Eber, J., & Heath, D. (1998) Coherent measures of risk, Mathematical Finance. 9(3), 203-228.
Banco de México 2005 Definiciones básicas de riesgos. México: Banco de México. Bao, Y., Lee, T., Saltoglu, B. (2006). Evaluating predictive performance of Value-at-Risk
models in emerging markets: A reallity check, Journal of Forecasting, 25(2), 101-128. Benavides, G. (2007). GARCH Processes and Value at Risk: An empirical analysis for
Mexican interest rate futures, Panorama socioeconómico, 25(35), 92-105.

H. Banda-Ortiz, F. A. Pérez-Sosa & D. Gómez-Hernández
190 Bolsa Mexicana de Valores (2010). Informe anual 2009. México: Grupo BMV. Grupo BMV (2013) Resumen de índices. Consulted on June 5th, 2013 from:
http://www.bmv.com.mx/ Harmantzis, FC., Miao, L., Chien, Y. (2006). Empirical study of value at risk and expected
shortfall models with heavy tails, The Journal of Risk Finance, 7(2), 117-135. Huang, A & Tseng, T. (2009). Forecast of Value at Risk for equity indices: an analysis from
developed and emerging markets, The Journal of Risk Finance, 10(4), 393-409. Johnson, C. (2001). Value at Risk: Teoría y aplicaciones. Estudios de Economía, 28(002),
217-247. Jorion, P. (1996). Risk2: Measuring the risk in Value at Risk, Financial Analysts Journal,
52(6), 47-56. Lamothe, F. & Vásquez, T. (2012) Valor en Riesgo Ajustado por Riesgo de Liquidez,
propuesta de aplicación a cartera de acciones chilenas, Análisis Financiero, 118, 66-81. Lechner, L. & Ovaert, T. (2010). Value-at-risk: Techniques to account for leptokurtosis and
asymmetric behavior in returns distributions, The Journal of Risk Finance, 11(5), 464-480.
Lima, P. (2004) Cuantificación del riesgo en la teoría de carteras. Gestao & Tecnologia, 3(1), 1-19, consulted on September 21th from http://www.fpl.edu.br/periodicos/index.php/get /article/viewFile/94/92
Macbeth, J. & Merville L. (1979) An empirical examination of the Black & Scholes call option pricing model, Journal of Finance, 34(5), 1173-1186.
Maghyereh, A & Al-Zoubi, H. (2008) The tail behavior of extreme stock returns in the Gulf emerging markets. An implication for financial risk management, Studies in Economics and Finance, 25(1), 21-37.
Markowitz, H. (1952) Portfolio selection, The Journal of Finance, 7(1), 77-91. Menichini, A. (2004) Value at Risk: Metodología de Administración del Riesgo Financiero,
Invenio, 7(13), 127-138. Miles, W. (2002) Financial deregulation and volatility in emerging equity markets, Journal of
economic development, 27(2), 113-126. Odening, M. & Hinrichs, J. (2003). Using extreme value theory to estimate value-at-risk,
Agricultural Finance Review, 63(1), 55-73. Saavedra, M. (2005) Aplicación empírica del modelo de Black y Scholes en México: 1991-
2000, Contaduría y Administración, 217, 65-95.