Value Added Tax and Consumption Expenditure Behaviour of Households in Nigeria: An Empirical...
13
ISSN 2309-0081 Tochukwu, Jerry & Andy (2015) 236 I www.irss.academyirmbr.com June 2015 International Review of Social Sciences Vol. 3 Issue.6 R S S Value Added Tax and Consumption Expenditure Behaviour of Households in Nigeria: An Empirical Investigation OBIAKOR ROWLAND TOCHUKWU Department of Economics, Banking & Finance, Babcock University, Nigeria. Email: [email protected] KWARBAI JERRY Department of Accounting, Babcock University, Nigeria. Email: [email protected] OKWU ANDY TITUS Post-Doctoral Fellow College of Economic & Management Sciences University of South Africa, Pretoria, South Africa. Email: [email protected], [email protected] Abstract In one way or the other, value added tax has been perceived to influence consumption expenditure behaviour of households as well as consumer price index. This study employed ex-post facto research design to investigate the effects of value added tax on consumption expenditure pattern and consumer price index in Nigeria. The study considered value added tax revenue, house hold consumption expenditure on durable and non-durable goods as well as consumer price index for the period 1994 - 2014. Data used for analysis were extracted from National Abstract of Statistics of the National Bureau of Statistics and the Statistical Bulletin of the Central Bank of Nigeria. The tools of analysis were multiple regression models on households’ durable and non-durable goods consumption expenditures and consumer price index with lagged valued variants. Results showed that value added tax and one-period lagged consumption expenditure on durable goods significantly affected households’ consumption expenditure on durable goods. Further, positive significant effects were established for value added tax in relation to household s’ consumption expenditures on non-durable goods; and VAT, its variants and previous spending levels did not discourage households’ consumption expenditures; and value added tax did not bear significant relevance on consumer price index. Consequently, the study recommended that the current 5% value added tax rate should be maintained, since any increase would most likely affect the households negatively and escalate consumer price index to undesired levels. Key Words: Value Added Tax, Households’ Consumption Expenditures, Durable And Non-Durable Goods, Consumer Price Index, Empirical Investigation. JEL Classifications: D2, E2, F38, H21, P24, R2. Introduction The world over, a significant attention has been given to value added tax (VAT) in terms of reforms and restructuring. Perhaps, this has been owing to its sizeable contributions to government revenue, growth and development of many economies (Owolabi & Okwu, 2011). As a veritable source of government revenue, many countries have shifted and a few others are considering a shift toward a higher indirect taxation. Since VAT increases consumption expenditure, it is expected to influence the behavioural pattern of consumers.
-
Upload
unisouthafr -
Category
Documents
-
view
2 -
download
0
Transcript of Value Added Tax and Consumption Expenditure Behaviour of Households in Nigeria: An Empirical...

ISSN 2309-0081 Tochukwu, Jerry & Andy (2015)
236
I
www.irss.academyirmbr.com June 2015
International Review of Social Sciences Vol. 3 Issue.6
R S S
Value Added Tax and Consumption Expenditure Behaviour of
Households in Nigeria: An Empirical Investigation
OBIAKOR ROWLAND TOCHUKWU Department of Economics, Banking & Finance, Babcock University, Nigeria.
Email: [email protected]
KWARBAI JERRY
Department of Accounting, Babcock University, Nigeria.
Email: [email protected]
OKWU ANDY TITUS
Post-Doctoral Fellow
College of Economic & Management Sciences
University of South Africa, Pretoria, South Africa.
Email: [email protected], [email protected]
Abstract
In one way or the other, value added tax has been perceived to influence consumption expenditure
behaviour of households as well as consumer price index. This study employed ex-post facto research
design to investigate the effects of value added tax on consumption expenditure pattern and consumer price
index in Nigeria. The study considered value added tax revenue, house hold consumption expenditure on
durable and non-durable goods as well as consumer price index for the period 1994 - 2014. Data used for
analysis were extracted from National Abstract of Statistics of the National Bureau of Statistics and the
Statistical Bulletin of the Central Bank of Nigeria. The tools of analysis were multiple regression models on
households’ durable and non-durable goods consumption expenditures and consumer price index with
lagged valued variants. Results showed that value added tax and one-period lagged consumption
expenditure on durable goods significantly affected households’ consumption expenditure on durable
goods. Further, positive significant effects were established for value added tax in relation to households’
consumption expenditures on non-durable goods; and VAT, its variants and previous spending levels did
not discourage households’ consumption expenditures; and value added tax did not bear significant
relevance on consumer price index. Consequently, the study recommended that the current 5% value added
tax rate should be maintained, since any increase would most likely affect the households negatively and
escalate consumer price index to undesired levels.
Key Words: Value Added Tax, Households’ Consumption Expenditures, Durable And Non-Durable Goods,
Consumer Price Index, Empirical Investigation.
JEL Classifications: D2, E2, F38, H21, P24, R2.
Introduction
The world over, a significant attention has been given to value added tax (VAT) in terms of reforms and
restructuring. Perhaps, this has been owing to its sizeable contributions to government revenue, growth and
development of many economies (Owolabi & Okwu, 2011). As a veritable source of government revenue,
many countries have shifted and a few others are considering a shift toward a higher indirect taxation. Since
VAT increases consumption expenditure, it is expected to influence the behavioural pattern of consumers.
ISSN 2309-0081 Tochukwu, Jerry & Andy (2015)
237
I
www.irss.academyirmbr.com June 2015
International Review of Social Sciences Vol. 3 Issue.6
R S S
This implies that VAT changes price and consumption behaviour of the consumer. Thus, price effects of
VAT and the attendant consumers‟ consumption behaviour is an issue of relevance to countries and their
VAT policy.
Although most theoretical considerations and the experience of countries that already apply value added tax
may suggest that VAT rate brings about a one-time change in prices and nothing else, the attendant
uncertainty to the economy and ripple effects are of significant study interest. Ajakaiye (1995) notes that
relevant VAT law in Nigeria stipulates a refund to manufacturing firms in situations where VAT input
exceeds output. Moreover, Ajakaiye (2000) opines that VAT should not have a cascading or cumulating
affect whatsoever, and identified the need for government to know the macroeconomic impact of VAT on
prices, output, income and consumption. However, Tomety (2009) observes that most often no refund is
made and such costs often increases running costs for firms, which ultimately are passed to the customer by
higher price or they are borne by the firms if they are afraid of losing market share. Concern over the
economy-wide effect of value added tax is of importance because of the possibility that tax may cause
consumer to cut consumption of certain commodities, hence affecting productivity. In this regard, Ajakaiye
(2000) argues that value added tax has impact on consumer price, causes production cost to increase,
complicates problem of unemployment, inflation and increases the growth of the informal sector. However,
James and Asaama (2012) argue that one of the rationale for taxing consumption rather than income is that
consumption taxes discourage consumption, encourage savings, and thus generate higher economic growth.
Some studies have focused on the contribution of VAT to economic growth and development with little
empirical evidence on the effect on consumption behaviour (Ebiringa &Yadirichukwu, 2012; Unegbu &
Irefin, 2011; Adereti, Sanni & Adesina, 2011; Williams & Benjamin, 2010). Further, Bird (2005) and
Diamond and Zodrow (2007, 2008) explain that VAT the effect of VAT on consumption is an important
but unresolved issue. Owolabi and Okwu (2011) investigate the contribution of VAT to the development of
Lagos State economy, and emphasise the need to plough VAT revenue back to various sectors for
development. James and Asaama (2012) investigated the impact of VAT on the aggregate consumption of
fifteen European Union countries over the period 1961-2005 and found that a one percentage point increase
in the VAT rate leads approximately to a one percent reduction in the level of aggregate consumption in the
short run and to a somewhat larger reduction in the long run.
The need to examine the effects of VAT on prices and consumption expenditure behaviour in Nigeria,
especially in the face of persistent inflationary situation and paucity of empirical evidence provoked this
research interest. Specifically, the study examined VAT in relation to household consumption expenditure
behaviour for non-durable goods and durable goods as well as consumer price index.
Conceptual/Theoretical Issues, Brief History of Tax in Nigeria and Empirical
Evidence
Conceptual/Theoretical Issues
The act of taxing can be traced to the time of existence of man. The Romans were collecting taxes
throughout their vast empire at the time of the birth of Jesus more than two thousand years ago. Even
before then, the Egyptians recorded information about taxes in their hieroglyphics. More so, in the early
days of Western Europe, a tax was a voluntary contribution towards the cost of running the government
(Barbara, 1986). However, in modern times, taxation has gone beyond voluntary contribution as it
constitutes sizeable sources of revenues of government. While Odoh (2010) conceptualises taxation as
compulsory levy imposed by government, Okoye and Gbegi (2013) explain that it must be for the common
good and benefit of the citizens. To Odoh (2010), VAT is a replacement of the existing sales tax, which has
been in operation under Federal Government Legislated Decree Number 7 of 1986 but is operated on the

ISSN 2309-0081 Tochukwu, Jerry & Andy (2015)
238
I
www.irss.academyirmbr.com June 2015
International Review of Social Sciences Vol. 3 Issue.6
R S S
basis of residence. According to Warren (2008) notes that final consumers of products and services cannot
recover VAT on purchases, but businesses are able to recover VAT (input tax) on the products and services
that they buy in order to produce further goods or services that will be sold to yet another business in the
supply chain or directly to a final consumer. In this way, the total tax levied at each stage in the economic
chain of supply is a constant fraction of the value added by a business to its products, and most of the cost
of collecting the tax is borne by business, rather than by the government. Owolabi and Okwu (2011)
explain that the yield from VAT is a fairly accurate measurement of the growth of an economy since
purchasing power (which determines yield) increases with economic growth.
Consumption, on the other hand, may be viewed as the total demand for all consumer goods and services.
While Tim (1996) conceptualises it as the total quantity of goods and services that people in the economy
wish to purchase for the purpose of immediate consumption, Anyanwu (1995) sees consumption as the
spending by households on goods and services such as clothing, food items, entertainment, health services
and acquisition of assets among others. Arising from this definition is the concept of consumption function
which shows the relationship between consumption and disposable income. In this regard, Fasoranti (2009)
links the term “consumption” to the Lord Maynard Keynes‟ psychological law which says that men are
disposed as a rule and on the average, to increase consumption as income increases but not by as much as
the increase in their income. Following from this are investigations into determinants of consumption
behaviour. Ajakiaye (2002), Colander (2001), Jhinhjan (2003), and Iyoha (2001) have identified interest
rate, relative prices, capital gains, value added tax, wealth, liquid assets, attitude and expectation and
availability of consumer credit among others as determinants of consumption expenditure. Consumption
therefore is a major component of aggregate demand. A little disturbance in this component will have a far
reaching effect on the nation‟s aggregate demand.
To measure living standards, income and consumption are the most popular approaches. Income refers to
earnings from productive activities and current transfers. Measuring consumption over a week or month
provides an indication of a household‟s consumption habits over a year. Hence, consumption is a better
indicator of living standards. In this regard, the Harmonized Nigeria Living Standard Survey (2009, 2010)
explains that the consumption pattern of a country depicts the aggregate demand of goods and services in
the country, and in most cases it constitutes about 60 percent of the country‟s total GDP. It further explains
that the consumption pattern also depicts the level of welfare and poverty that a nation is experiencing. It is
worth noting that when a country is experiencing a downturn, aggregate consumption declines; poverty
incidence increases, unemployment rate rises, investment falls and prices of goods and services will most
likely rise. On the other hand, when the aggregate consumption is high, firms will invest and be ready to
employ idle resources; prices will fall as the firms supply more goods and services. Other economies of
scale will accrued to the nation as a result of the large size of its aggregate demand. It can therefore be
inferred that, since VAT is added cost to the consumer, it is expected that the consumption pattern of the
individual or household will change in the opposite direction with VAT rate.
From the above, it is obvious that for any payment to be tax it must be a compulsory levy; not a voluntary
contribution or donation to the government and the revenue from tax is to enable the government finance
public sector expenditures without reverting to excessive public sector borrowing. Such revenue is used for
administrative running cost, provision for internal security and defense, provision for social amenities as
well as regulating the economy. It is also obvious that there is a link between tax and consumption
expenditure behaviour of consumers.
Adam (1776), in the Wealth of the Nations, outlined some cannons of taxation to include Equity, which
requires an equal tax charged for people in the same circumstance; Economy, which is the principle that
requires the cost of administering tax to be less than the associated tax revenue; Convenience, which
requires that tax payment should not inconvenient the taxpayer; Certainty, which requires that the amount
to be paid as tax should clearly defined and made known to the taxpayer, and that the associated revenue be

ISSN 2309-0081 Tochukwu, Jerry & Andy (2015)
239
I
www.irss.academyirmbr.com June 2015
International Review of Social Sciences Vol. 3 Issue.6
R S S
predictable with high degree of certainty; Neutrality, which requires that tax not to distort economic
activities. It its purview, VAT satisfies these and other cannons of taxation.
Further on the theoretical front, Kanyip (2002) as cited in Nwobia (2013) presents two models of taxation,
which are the Classical Model and the Imputation Model. The classical model postulates that it is important
to separate completely the incorporation incidence between the company and its shareholders where tax is
levied on the profits of the company, any distribution made to shareholders and capital gains realized are
treated as separate income in the hand of the recipient and are charged to tax at the appropriate rates
although at this level Value added tax must have been remitted since it is outside the power the company
agents. Kanyip (2002) as cited Nwaobia (2013) argue that it is a strong incentive for companies to plough
back more of their earnings for expansion purposes. The model also encourages companies to raise capital
by loan issue, through debentures rather than by share issue. Interest payments are tax deductible and thus
provide the needed tax shield as opposed to dividends. On the other hand, the imputation model posits that
at least part of the tax paid by a company on its profits is “imputed” or credited against the tax liability of
shareholders in receipt of income distributions paid by the company out of those profits, thereby
eliminating or reducing double taxation of distributed profits. Thus, unlike the classical model, the
imputation model insists on integration with the corporate-source earnings taxed at the shareholder level
only (Kanyip, 2002). By comparison, imputation theory best fit the concept of value added tax since
company is credited the proportion where the input VAT is higher than the output VAT.
Economists have attempted to explain consumption behaviour of households within four competing
theories. These are Keynes‟ (1936) Absolute Income Hypothesis (AIH), Duisenberg‟s (1948, 1949)
Relative Income Hypothesis (RIH), Modigliani and Brumberg‟s (1954) Life Cycle Hypothesis (LCH) and
Friedman‟s (1957) Permanent Income Hypothesis (PIH).
The AIH explains that consumption will rise as income rises, but not necessarily at the same rate. Keynes
(1936) identified the relationship between income and consumption as a key macroeconomic relationship,
and argued that the average propensity to consume (APC) out of current income would exceed the marginal
propensity to consume so that the income elasticity of consumption pattern would be less that unity. Hence,
in the long run one would expect income elasticity to be unity. The Hypothesis emphasizes short run rather
than long run. The implication of the theory is that an increase in aggregate income (after tax) will yield an
increase in consumption, nothing else affect consumption expenditure.
On the other hand, the RIH developed by Duesenberry (1948, 1949) postulates that an individual‟s attitude
to consumption and saving is dictated more by his income in relation to others in the same general vicinity
than by abstract standard of living. That is, the percentage of income consumed by an individual depends
on his percentile position within the income distribution. It further hypothesises that the present
consumption is not influenced merely by present levels of absolute and relative income, but also by levels
of consumption attained in previous period. Thus, it is difficult for a household to reduce a level of
consumption once attained. It assumes that aggregate ratio of consumption to income depend on the level of
present income relative to past peak income. Thus, it emphasises long run rather than short run
consumption behaviour.
The LCH pertains to the spending and saving habits of people over the course of a life time. The theory
presumes that individuals base consumption on a constant percentage of their anticipated lifetime income. It
postulates that people save for retirement while they are earning a regular income rather spending it all
when it is earned. The theory segments life time into early stage when consumption exceeds income and the
individual augments consumption by „borrowing‟, middle stage when income exceeds consumption and the
individual offsets „borrowing‟ and also save for retirement, and late stage when consumption once again
falls short of income. But at this stage, the individual desaves and depend more on investment (savings)
income. Thus, the LCH concludes that the average propensity to consume is greater in both early and late

ISSN 2309-0081 Tochukwu, Jerry & Andy (2015)
240
I
www.irss.academyirmbr.com June 2015
International Review of Social Sciences Vol. 3 Issue.6
R S S
stages since they are „borrowing‟ against future income or using up savings (investment income). During
the middle stage, the individuals have greater propensity to save and lower propensity to consume,
enhanced by a typically higher income. Thus, the LCH also emphasises long run rather than short
consumption behaviour.
The PIH states that people will spend money at a level consistent with their expected long run average
income. It considers the level of expected long run income as the level of „permanent‟ income that can be
spent with depleting the individual‟s wealth. The theory explains that the consumption spending choices
made by consumers are largely determined by a change in permanent income rather than change in
temporary income. Specifically, the main determinant of consumption is the individual‟s real wealth not the
current real disposable income. The hypothesis implies that changes in consumption behaviour are not
predictable because they are based on individual expectations. Another implication is that even if economic
policies such as reduction in VAT rate, succeeds in increasing income in the economy, it may not kick off a
multiplier effect from increased consumer spending. Rather, the theory predicts that there will not be an
increase in consumer spending until individuals reform expectations about their future incomes. Thus, the
PIH also emphasises long run rather than short run consumption behaviour.
Brief History of VAT in Nigeria
In 1991, the Federal Government of Nigeria set up a Study Group to review the existing tax system in the
country. Report of the Group formed the basis for the introduction of VAT in Nigeria. VAT was proposed
and a committee was set up to carry out a feasibility study on the implementation. In January 1993, Federal
Government decided to introduce VAT by the middle of the year, but the actual implementation came into
effect on 1st January 1994. In this regard, registered entities were allowed up to the last quarter of 1993 to
adjust their accounts, particularly the incorporation of VAT information in their general ledgers, in order to
comply with the requirements of the tax. At present, the tax is charged at 5% value added.
Review of Empirical Studies
While several studies have examined the determinants of consumption, a few have studied tax, particularly
value added tax, in relation to consumption expenditure behaviour of households. In their respective
studies, Deaton (2001), Hall (2001), Flavin (2003), Zeldes (2005), Eswaran and Kotwal (2006) identified
interest rate, investment, savings, unanticipated shocks, attitude of consumers, and presence of liquidity
constraints as important determinations of consumption behaviour. Eric and Joseph (2010) studied the
effects of value added tax, as a substitute for payroll or corporate taxes, in the United States and found that
VAT could be regressive, raising tax burdens proportionately more on lower income than on higher income
taxpayers. Sekwati & Malema (2011) investigated the potential impact of VAT increase from 10% to 12%
in Botswana on households‟ consumption expenditure behaviour, and found that the increase in VAT rate
increased prices of goods and services, and that the poor households were more adversely affected owing
mainly to their higher marginal propensity to consume. The impact was negligible on the middle and upper
income classes because these income groups have relatively degrees of freedom to adjust their consumption
patterns in response to the increase in VAT.
There are few studies on the effect of VAT on consumer retail spending behaviour or consumption pattern.
Barrel and Weale (2009) employed quarterly data to investigate the impact of VAT rate reduction on retail
price in Europe. They established a weak evidence of changes in consumer expenditure behaviour with the
reduction in VAT rate in the European countries. Keen and Syed (2006) studied the ways in which the tax
structure affects exports and, after defining a theoretical model, estimated a panel model using 27 OECD
countries over the 1967-2003 period. They addressed directly the issue of the tax mix, and estimated the
relationship between net exports and both VAT and corporate taxes. The results generally confirm the view
that VAT is inherently trade neutral, whereas corporate taxes affect net exports. Alexander and Gelardi
ISSN 2309-0081 Tochukwu, Jerry & Andy (2015)
241
I
www.irss.academyirmbr.com June 2015
International Review of Social Sciences Vol. 3 Issue.6
R S S
(2012), expecting a behavioural change by consumer after the introduction, investigated whether consumer
in UK and Canada altered their consumption expenditure behaviour when those countries introduced their
VAT. Both retail volume and the percentage change from the prior year were used in the graphical
depiction. Their analysis showed consumer adaptation behaviour to take advantage of changes in VAT via
arbitrage behaviour. Khan (2014) investigated consumption function under relative income hypothesis
among households in Northern Pakistan. The study found that household current level of income, family
size, education of household head and social status were the significant determinants contributing positively
to household consumption. The study confirmed that households follow Duesenberry‟s relative income
hypothesis, and that household consumption is not only affected by household current level of income but
by the highest level of income previously attained as well as the consumption patterns of other households.
In a study of determinants of consumption pattern among rural dwellers in Ondo State, Nigeria, Fasoranti
(2009) showed current income, expected pension fund, shares and durable assets to be positively related to
consumption while expected future income and deposits in banks exhibited negative relationship. By means
of regression analysis techniques, the study showed expected future income, deposits at banks and shares to
be significant determinants of consumption among households in the study area. Adedotun (1978) as cited
by Fasoranti (2009) in Nigeria showed positive correlation between consumption expenditure and per
capita income. On the other hand, Uwujaren (1977) related consumption in Nigeria to Friedman‟s
permanent income Hypothesis and his findings showed that consumption to be a function of current and
permanent income. Similarly, Fasoranti (2009) showed a positive correlation between consumption
expenditure and per capita income. Uwujaren (1977) related consumption in Nigeria to Friedman‟s
permanent income hypothesis.
PriceWaterhouse Coopers (2006) as cited in European Commssion (2011) Studied 22 financial services
firms and finds that between 0% and 74% of VAT on inputs is recovered, depending on the location of the
firm, the nature of the customer base, etc. On average, according to PWC, financial firms recover about
20% of the VAT paid on inputs, so the amount of really irrecoverable VAT is 80%. In comparing the effect
of VAT based on the input-output mechanism, the study found out that the largest effect on output prices
arises for France. This result does not seem to depend only on the statutory VAT rates but also on a higher
burden of irrecoverable VAT on output. Tait, Gratz & Eichengreen (1979) found that in 22 out of 35 cases
evaluated, the introduction of the VAT had little or no effect on the consumer price index. In 8 cases the
introduction of VAT was associated with a once-and-for-all upward shift in the consumer price index. In
only one of these cases could this shift be said to contribute to acceleration in the rate of increase of the
consumer price index (Tanzi & Zee, 2000).
However, Randall (2010) argued that there are number of variables influencing price changes, and therefore
it is difficult to empirically assess the effect of VAT on prices. He further explained that the net effect of
VAT would be nil if it is an equal-yield tax. Hence, there would not be any effect on the overall price
change although there may be changes in relative price.
From the foregoing, it is important to note here that what affects prices, will affect demand and supply, and
consequentially affect consumption. Since VAT rate is an added cost to the consumer, we can imply that
the consumption will reduce, hence the intended revenue accruing from the consumption of such goods and
services will also reduce.
Methodology
This study adopted ex-post facto research design to investigate the effects of value added tax on
consumption expenditure pattern in Nigeria. This is premised on the presumed suitability of the design to
show the effect of the predictor variables on each of the response variables.

ISSN 2309-0081 Tochukwu, Jerry & Andy (2015)
242
I
www.irss.academyirmbr.com June 2015
International Review of Social Sciences Vol. 3 Issue.6
R S S
Data and Sources
The data are value added tax revenue (VATR), house hold consumption expenditure on durable goods
(HHCEDG), household consumption expenditure on non-durable goods (HHCENDG) and consumer price
index (CPI). The data were extracted from National Abstract of Statistics by the National Bureau of
Statistics (NBS) and the Statistical Bulletin by the Central Bank of Nigeria (CBN) for the period 1994 –
2014 (see Appendix A).
The Analytical Models
For data analysis, we adapted the model specified by Obiakor and Okwu (2011) in their study of the impact
of capital market development in relation to the growth of the Nigerian economy for the period 1981 –
2008. From the perspective of a functional relationship, we disaggregated and specified multiple regression
models to suit the peculiarities of our analysis in this study. To render the models dynamic, we analysed
household consumption expenditures on durable and non-durable goods as well as consumer price index in
relation to VAT, lagged values of VAT and HHCE since the household do not respond to variations in
VAT rates spontaneously. That is, any variation in VAT rate reflects in the consumption behaviour of the
households as well as the price index after some time lag. Thus, the functional relationships are:
HHCEDGt = f(VATt, VATt-1, HHCEDGt-1)
HHCENDGt = f(VATt, VATt-1, HHCENDGt-1)
CPIt = f(VATt, VATt-1, CPIt-1,)
where,
HHCEDGt and HHCENDGt are house consumption expenditures on durable and non-durable goods
respectively in year t, CPIt is consumer price index in year t, VATRt is the VAT revenue in year t, VATt-1,
HHCEDGt-1, HHCENDGt-1, and CPIt-1 are the values of value added tax, household consumption expenditure
on durable and non-durable goods and consumer price index in the immediate preceding years. That is,
each is a one period lagged value. f denotes functional or dependency relationship.
We considered these variables relevant in determining the effects of VAT on consumption expenditure
behaviour of households in Nigeria. Therefore, the associated regression models are:
HHCEDGt = α0+ α1VATt + α2VATt-1 + α3HHCEDG t-1 + µ1
HHCENDGt = β0+ β1VATt + β2VATt-1 + β3HHCENDG t-1 + µ2
CPIt = λ0+ λ1VATt + λ2VATt-1 + λ3CPIt-1+ µ3 where,
α0, and β0 are fixed household consumption levels irrespective of changes in VAT and spending on durable
and non-durable goods, λ0 is the component of CPI that does not respond to VAT and CPI changes. They
express the constant terms in the regression equations. α1, α2, α3, β1, β2 and β3 respectively are the measures
of responses of household consumption expenditure behaviours to changes in VAT and consumption
expenditures. Each measures how a change in the associated variable affects the consumption expenditure
pattern of the household. Similarly, for λ1, λ2 and λ3. µi (i = 1,2,3) are stochastic terms introduced in the
models to accommodate the influence of other determinants of household consumption expenditures
behaviours of the household and consumer price index that may have been left out in the regression models.
Increases in preceding year‟s VAT rates and consumption expenditures are expected to dampen current
household expenditure, and vice versa. Similarly for current consumer price index.

ISSN 2309-0081 Tochukwu, Jerry & Andy (2015)
243
I
www.irss.academyirmbr.com June 2015
International Review of Social Sciences Vol. 3 Issue.6
R S S
Analysis, Results and Discussion
Regression Results and Estimated Models 1, 2 & 3
Method: Least Squares
Sample (adjusted): 1995 2014
Included observations: 19 after adjustments
Source: EViews8-Enhanced Regression Output (See the Appendix)
Discussion
Estimated regression Model 1 shows that consumption expenditure of the households increases in the same
year with VAT revenue resulting probably from VAT rate increase or more spending on durable goods by
the households. The effect of VATRt is significant at 0.05 as indicated by the p-value of 0.0000 of the t-
statistic associated with the coefficient. Levek. However, this increase is not sustained in the succeeding
period as indicated by the negative coefficient of VATRt-1(-1.5372), which shows that households respond
by reducing consumption expenditure on durable goods as a result of the VAT. But the reduction in
consumption spending of the households on durable goods is not significant at the 0.05 level as shown by
the relevant p-value which is 0.1248. A possible explanation for declining consumption expenditure of
household in the succeeding periods is that as the households acquire more and more of the durables
goods, they need for such goods are met and hence the demand for them decline. This will, in turn exert
negative effect on associated the VAT revenue. Thus, the effect is declining durable goods VAT revenue as
the years progress. However, this depends also on the population dynamics. The previous period‟s
consumption expenditure of the household shows marginal positive effect (0.05944) on the current
consumption expenditure on durable goods, which is statistically significant at the 0.05 level as indicated
by the p-value of 0.0012. We infer from these that while value added tax in the current period (VATRt) and
one-period lagged consumption expenditure on durable goods (HHCEDGt-1) significantly affect households‟
consumption expenditure on durable goods, one-period lagged value added tax reduces the consumption
expenditure, though insignificantly. ,
Estimates of regression Model 2 shows positive significant effects for the current value added tax (VATRt)
with p-value of 0.0000, which is less than the conventional 0.05 level, and positive but not significant
effects of VATRt-1 and HHCENDGt-1 for the consumption expenditures of the households on non-durable
goods during the study period as shown by p-values of 0.5533 and 0.4945 respectively. These shows that
while the households‟ spending on non-during goods changed in same direction with VAT, its one-period
lagged value and that of the consumption expenditure on non-durable goods, it is significant only for VAT.
This suggests that the goods must be necessities such that price changes occasioned by VAT did not deter
consumption spending. From these, we infer that VAT, its variants and previous spending levels did not
discourage consumption expenditure of the households in the succeeding years during the study period.
For regression Model 3, the estimates exhibited similar behaviour as in Model 1. However, Model 3 shows
very marginal positive effects of VATRt with coefficient of 0.0002 and CPIt-1 with coefficient of 0.0821 on
consumer price index (CPIt), and VATt-1 with negligible coefficient of -1.05E-05. Interestingly, the
negligible positive coefficient of VATRt was of significant effect on consumer price index during the
Dependent Variable: HHCEDG Dependent Variable: HHCENDG Dependent Variable: CPI
Regression Model 1 Regression Model 2 Regression Model 3
Determinants
of HHCEDG Effect
(αi)
Std.
Error
t-stat Prob Determinants
of HHCENDG
Effect
(βi)
Std.
Error
t-stat Prob Determina
nts of CPI
Effect (λi) Std.
Error
t-stat Prob
VATRt
VATRt-1
HHCEDGt-1
5.4870
-1.5372
0.5944
0.2487
0.9455
0.1489
22.0570
-1.6257
3.9903
0.0000
0.1248
0.0012
VATRt
VATRt-1
HHCENDGt-1
2.0409
0.3717
0.0676
0.1612
0.6129
0.0965
12.6560
0.6064
0.7002
0.0000
0.5533
0.4945
VATRt
VATRt-1
CPIt-1
0.0002
-1.05E-05
0.0821
1.10E-05
6.11E-05
0.3337
16.0883
-0.1719
0.2460
0.0000
0.8656
0.8088
R-squared 0.9708 F-stat 166.3004
Adjstd R-sqrd 0.9649 Prob(F-stat) 0.0000
R-squared 0.9172 F-stat 55.4116
Adjstd R-sqrd 0.9006 Prob(F-stat) 0.0000
R-sqrd 0.9494 F-stat 100.1027
Adjstd R-sqrd 0.9399 Prob(F-Stat) 0.0000
ISSN 2309-0081 Tochukwu, Jerry & Andy (2015)
244
I
www.irss.academyirmbr.com June 2015
International Review of Social Sciences Vol. 3 Issue.6
R S S
period under consideration. The negative effect of the one-period lagged value added tax on consumer
price index, though negligible also, was not statistically significant as indicated by the p-value of 0.8656.
Further, the one-period lagged valued of consumer price index, exhibited positive but not significant effect
on current year consumer price index as shown by the associated p-value of 0.8088. These suggest that
value added tax did not bear significant relevance on consumer price index during the study period.
Interestingly, the regressors in each of the models jointly exerted significant effects and explained very high
proportions of the variations in the response variables. In models 1, 2 and 3, the determinants showed
significant aggregate effects on consumption expenditure behaviour of the households on durable and non-
durable goods and consumer price index as indicated by the p-value of 0.0000 associated with the F-
statistic in each model. They also explained about 96%, 90% and 94% variations in the households‟
consumption expenditure behaviours and consumer price index, respectively during the study period. From
these, we infer that each of the models is a good fit.
Summary, Conclusion and Recommendations
This study employed expo-facto design to investigate the effects of value added tax on households‟
consumption expenditure behaviour as well as consumer price index in Nigeria. The study considered
households‟ expenditure on durable and non-durable goods as well as consumer price index vis-à-vis value
added tax revenue and its one-period lagged values with those of consumption expenditures on the goods.
A survey of available literature supported the purpose of the study in terms of currency and to fill
knowledge gap. With the tools of multiple regression analysis, the study established the effects of value
added tax, its one-period lagged values as well as those of households‟ consumption expenditures on goods
and consumer price index on households‟ consumption expenditure behaviours towards durable and non-
durable goods as well the consumer price index in Nigeria during 1994-2014 period.
From the analysis and discussion, the study concluded that while value added tax and one-period lagged
consumption expenditure on durable goods significantly shaped households‟ consumption expenditure on
durable goods, one-period lagged value added tax reduces the consumption expenditure, though
insignificantly. Further, value added tax, its variants and previous spending levels did not discourage
consumption expenditure of the households in the succeeding years during the study period, and value
added tax did not bear significant relevance on consumer price index during the study period. The study
recommended that the current 5% value added tax rate in Nigeria be maintained owing mainly to the
significant effects on households‟ consumption expenditure on durable and non-durable goods, and the not
significant relevance on consumer price index in Nigeria. Any increase in the rate will most likely affect the
households negatively and escalate consumer price index to undesired levels.
References
Adam, S, (1776). The Wealth of Nations quoted by Blaug Mark (1999). Economic Theory in Retrospective,
Cambridge University Press, Cambridge.
Adereti, S. A., Sani, M. R., Adesina, J. A. (2011). Value Added Tax and Economic Growth of Nigeria.
European Journal of Humanities and Social Sciences, 10(1), 456-471.
Adetotun, P. (1978), Nigeria‟s Public Consumption Expenditure, The Journal of Economics and social
Studies 20 (3), 13 – 15
Ajakaiye, D. O. (1995). Incidence Analysis of Value Added Tax in Nigeria: A Computable General
Equilibrium Approach. African Journal of Economic Policy, 2(2), 1-16.
Ajakaiye, D. O. (2000). Macroeconomic Effects of VAT in Nigeria: A Computable General Equilibrium
Analysis. African Economic Research Consortium.
ISSN 2309-0081 Tochukwu, Jerry & Andy (2015)
245
I
www.irss.academyirmbr.com June 2015
International Review of Social Sciences Vol. 3 Issue.6
R S S
Ajakaiye, D. O. (2002). Banking Sector Reforms and Economic Performance in Nigeria. In Howard Stein,
Olu Ajakaiye and Peter Lewis (eds.) (2002) Deregulation and Banking Crisis in Nigeria: A
Comparative Study. Palgrave, New York, Ch. 5.
Alexander, M and Gelardi, G. (2012). Value Added Tax and Consumer Spending: A Graphical Descriptive
Analysis. Asian Journal of Finance & Accounting, 5(1), 1-20.
Anyanwu, C. (1995). Revenue Allocation and stable Fiscal Federalism in Nigeria, Journal of Economic
Management, 2(2), 1-28.
Barbara, S. (1986). Taxes: Library of Congress Cataloging in Publication Data, USA.
Barrell, R, Weale, M. (2009). The Economics of a Reduction in VAT. National Institute of Economic and
Social Research, Discussion Paper No. 325, 1-12.
Bird, R. M. (2005). Value-Added Taxes in Developing and Transitional Countries: Lesson and Questions.
International Studies Program, Andrew Young School of Policy Studies, Georgia State University,
Working Paper No. 05-05. Atlanta, GA.
Colander, D.C (2001). Economics McGraw – Hill publishers, 4th Editio
Deaton, A (2001). Understanding Consumption, Clarendo Press, London. Pg 40 – 45
Diamond, J. & Zodrow, G. (2007). Economics Effects of a Personal Capital Income Tax Add- on to a
Consumption Tax. FinanzArchiv, 63 (3), 374-395.
Diamond, J. and Zodrow, G. (2008). Consumption Tax Reform: Issues, Choices, and Implications, 226-
237. Cambridge, MA: The MIT Press.
Duesenberry, J. S. (1948). Income - Consumption Relations and Their Implications. In Lloyd Metzler et al.,
Income, Employment and Public Policy, New York: W.W.Norton & Company, Inc.
Duesenberry, J.S., (1949). Income, Saving and the Theory of Consumption Behavior, Cambridge, Mass.:
Harvard University Press.
Ebiringa, O. T. and Yadirichukwu, E. (2012). Analysis of tax Formation and Impact on Economic Growth
in Nigeria. International Journal of Accounting and Finance Reporting, 2(2),367-385.
Eswaran, M. & Kotwal, A. (2006). Credit as Insurance in Agrarian Economies, Journal of Development
Economics, 2(1),11-17.
Eric, T. and Joseph, R. (2010). Effects of Imposing a Value-Added Tax to Replace Payroll Taxes or
Corporate Taxes. The Tax Policy Center, Urban Institute and Brookings Institution, New American
Foundation, United States of America.
European Commission (2011). A retrospective evaluation of elements of the EU VAT system
Fasoranti, M. (2009). The Determinants of Consumption Pattern Among Rural Dwellers of Ondo State
(Case Study Of Akoko North West Local Government) European Scientific Journal March edition vol. 8,
No.6 ISSN: 1857 – 7881.
Flavin (2003), Excess Sensitivity of Consumption of current Income: Liquidity Constraint or Myopia,
Canadian Journal of Economics.
Friedman, M. (1957). A Theory of the Consumption Function. National Bureau of Economic Research,
General Series, No. 63. Princeton Univ. Press.
Hall, P, (2001). Stochastic Implications of the Life-cycle permanent. Income Hypothesis Theory and
Evidence”. Journal of Political Economy. 2(3), 10– 4.
Harmonised Nigeria Living Standard Survey (2009/2010). Collaboration between National Bureau of
Statistics/World Bank/United Nations Development Programme, Part A (CWIQ) Draft Report, July,
2010.
Iyoha, M.A. (2001). Policy simulation with Macro Econometric models of the Nigerian Economy”
Economic and Financial Review 2 (1), 21 – 25.
James, A. and Asaama, E. (2012). Value Added Tax and Consumption. Tulane Economics Working Paper
Series, Working Paper 1203, Tulane University.
Jhingan, M.L (2003). Macroeconomics Theory. New Delhi, 12
Keen, M. and M. Syed (2006). Domestic Taxes and International Trade: some Evidence, IMF Working
Paper 06/47.

ISSN 2309-0081 Tochukwu, Jerry & Andy (2015)
246
I
www.irss.academyirmbr.com June 2015
International Review of Social Sciences Vol. 3 Issue.6
R S S
Keynes, J.M. 1936. The General Theory of Employment, Interest, and Money, Harcourt Brace Jovanovich,
Inc., New York, p. 96.
Khan, H. (2014). An Empirical Investigation of Consumption Function under Relative Income Hypothesis:
Evidence from Farm Households in Northern Pakistan. International Journal of Economic Sciences,
III(2), 43-52.
Modigliani, F. and Brumberg, R. 1954. Utility Analysis and the Consumption Function: An Interpretation
of Cross-Section Data. In Post-Keynesian Economics, edited by K. K. Kurihara. New Brunswick, N.J.:
Rutgers University Press.
Nwaobia, A. N. (2013). Tax Planning and Corporate Financial Performance: A Study of Listed
Manufacturing Companies in Nigeria. Unpublished PhD Thesis, Department of Accounting, Babcock
University, Nigeria.
Obiakor, R. T. and Okwu, A. T. (2011). Empirical Analysis of the Impact of Capital Market Development
on Nigeria‟s Economic Growth (1981 – 2008). DLSU Business & Economic Review, 20(2), 79-96.
Odoh, C. (2010). The Effectiveness and Desirability of Value Added Tax, Nigerian Taxation, Official
Journal of the Charted Institute of taxation of Nigeria.
Okoye, E.I & Gbegi, D.O. (2013). Effective Value Added Tax: An Imperative for Wealth Creation in
Nigeria. Global Journal of Management and Business Research Volume 13 Issue 1. Double Blind Peer
Reviewed International Research Journal Publisher: Global Journals Inc. (USA) Online ISSN: 2249-
4588 & Print ISSN: 0975-5853
Owolabi, S. A. and Okwu, A. T. (2011). Empirical Evaluation of Contribution of Value Added Tax to
Development of Lagos State Economy. Middle Eastern Finance and Economics, Euro Journals
Publishing Inc, Issue 9, 24-34.
Randall G. H. (2010). The value Added Tax: Too costly for the United State, Working paper N0 10-32,
Mercatus Center George Mason University
Sekwati, L. & Malema, B. W. (2011). Potential impact of the increase in VAT on poor households in
Botswana” International. Journal. Economic. Resources vol 2 (1)
Tait, A., Gratz, W. L. M. and Eichengreen, B. J. (1979). “International Comparisons of Taxation for
Selected Developing Countries 1972-1976”. IMF Staff Papers, No. 26.
Tanzi, V. and Zee H. H. (2000). Tax Policy for Emerging Markets: Developing Countries.National Tax
Journal, 53(2), 299-322.
Tim, M. (1996). Explanning Keynes theory of consumption and assessing it strength and weakness.
www.economic-truth.co.uk/content-essays/bsckynesconsumption.pdf.
Tomety, E. (2009). Are You Tax Healthy? Akintola Williams Delloitte, Tax Newsletter, Issue 2, 15-23.
Unegbu, A. O. and Irefin, D. (2011). Impact of VAT on Economic Development of Emerging Nations.
Journal of Economics and International Finance, 3(8)492-503.
Uwujaren, G. (1977). Specification and estimation of an economy-wide macro econometric model of
Nigeria. Nigerian Journal of Economic and Social Studies, 19 (2) 23 – 25
William, G. G. and Benjamin, H. H. (2010). A value-Added Tax for the United States: Part of the Solution.
Brookings Institute and Tax Policy Center.
Zeldes, (2005). Consumption and Liquidity Constraints: An empirical investigation. Journal of Political
Economy, 2(3) ,15-20.
ISSN 2309-0081 Tochukwu, Jerry & Andy (2015)
247
I
www.irss.academyirmbr.com June 2015
International Review of Social Sciences Vol. 3 Issue.6
R S S
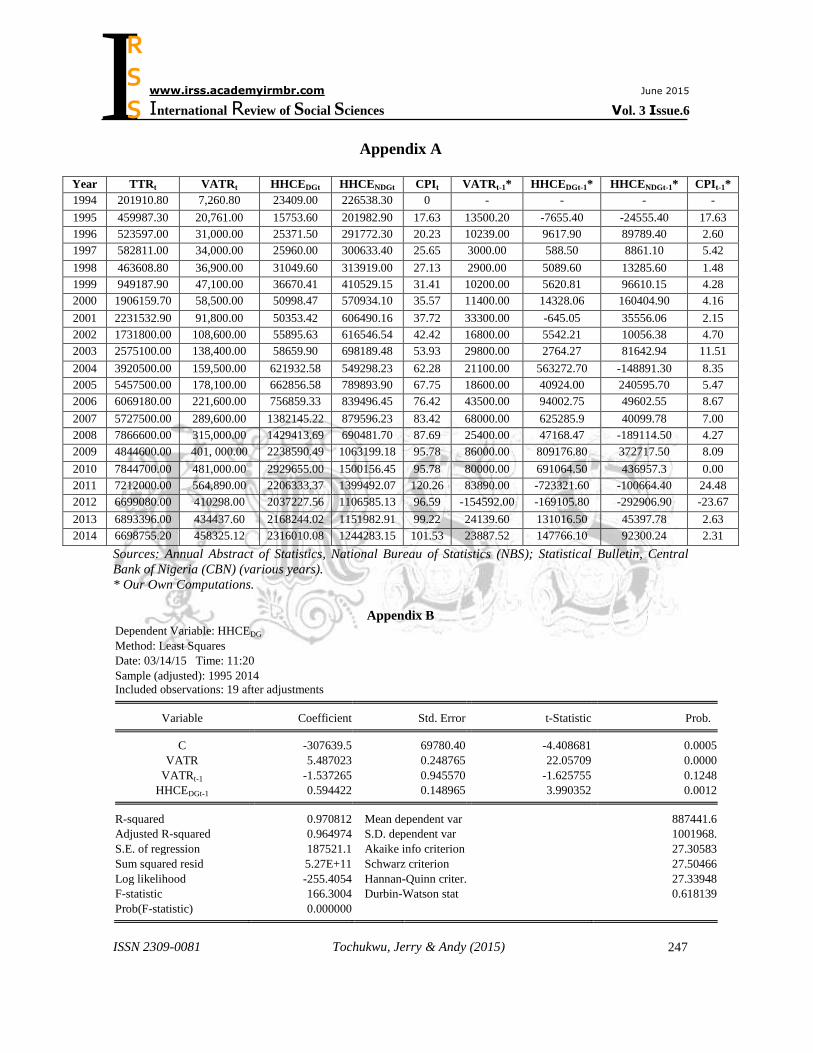
Appendix A
Year TTRt VATRt HHCEDGt HHCENDGt CPIt VATRt-1* HHCEDGt-1* HHCENDGt-1* CPIt-1*
1994 201910.80 7,260.80 23409.00 226538.30 0 - - - -
1995 459987.30 20,761.00 15753.60 201982.90 17.63 13500.20 -7655.40 -24555.40 17.63
1996 523597.00 31,000.00 25371.50 291772.30 20.23 10239.00 9617.90 89789.40 2.60
1997 582811.00 34,000.00 25960.00 300633.40 25.65 3000.00 588.50 8861.10 5.42
1998 463608.80 36,900.00 31049.60 313919.00 27.13 2900.00 5089.60 13285.60 1.48
1999 949187.90 47,100.00 36670.41 410529.15 31.41 10200.00 5620.81 96610.15 4.28
2000 1906159.70 58,500.00 50998.47 570934.10 35.57 11400.00 14328.06 160404.90 4.16
2001 2231532.90 91,800.00 50353.42 606490.16 37.72 33300.00 -645.05 35556.06 2.15
2002 1731800.00 108,600.00 55895.63 616546.54 42.42 16800.00 5542.21 10056.38 4.70
2003 2575100.00 138,400.00 58659.90 698189.48 53.93 29800.00 2764.27 81642.94 11.51
2004 3920500.00 159,500.00 621932.58 549298.23 62.28 21100.00 563272.70 -148891.30 8.35
2005 5457500.00 178,100.00 662856.58 789893.90 67.75 18600.00 40924.00 240595.70 5.47
2006 6069180.00 221,600.00 756859.33 839496.45 76.42 43500.00 94002.75 49602.55 8.67
2007 5727500.00 289,600.00 1382145.22 879596.23 83.42 68000.00 625285.9 40099.78 7.00
2008 7866600.00 315,000.00 1429413.69 690481.70 87.69 25400.00 47168.47 -189114.50 4.27
2009 4844600.00 401, 000.00 2238590.49 1063199.18 95.78 86000.00 809176.80 372717.50 8.09
2010 7844700.00 481,000.00 2929655.00 1500156.45 95.78 80000.00 691064.50 436957.3 0.00
2011 7212000.00 564,890.00 2206333.37 1399492.07 120.26 83890.00 -723321.60 -100664.40 24.48
2012 6699080.00 410298.00 2037227.56 1106585.13 96.59 -154592.00 -169105.80 -292906.90 -23.67
2013 6893396.00 434437.60 2168244.02 1151982.91 99.22 24139.60 131016.50 45397.78 2.63
2014 6698755.20 458325.12 2316010.08 1244283.15 101.53 23887.52 147766.10 92300.24 2.31
Sources: Annual Abstract of Statistics, National Bureau of Statistics (NBS); Statistical Bulletin, Central
Bank of Nigeria (CBN) (various years).
* Our Own Computations.
Appendix B
Dependent Variable: HHCEDG
Method: Least Squares
Date: 03/14/15 Time: 11:20
Sample (adjusted): 1995 2014
Included observations: 19 after adjustments
Variable Coefficient Std. Error t-Statistic Prob.
C -307639.5 69780.40 -4.408681 0.0005
VATR 5.487023 0.248765 22.05709 0.0000
VATRt-1 -1.537265 0.945570 -1.625755 0.1248
HHCEDGt-1 0.594422 0.148965 3.990352 0.0012
R-squared 0.970812 Mean dependent var 887441.6
Adjusted R-squared 0.964974 S.D. dependent var 1001968.
S.E. of regression 187521.1 Akaike info criterion 27.30583
Sum squared resid 5.27E+11 Schwarz criterion 27.50466
Log likelihood -255.4054 Hannan-Quinn criter. 27.33948
F-statistic 166.3004 Durbin-Watson stat 0.618139
Prob(F-statistic) 0.000000

ISSN 2309-0081 Tochukwu, Jerry & Andy (2015)
248
I
www.irss.academyirmbr.com June 2015
International Review of Social Sciences Vol. 3 Issue.6
R S S
Dependent Variable: HHCENDG
Method: Least Squares
Date: 03/14/15 Time: 11:31
Sample (adjusted): 1995 2014
Included observations: 19 after adjustments
Variable Coefficient Std. Error t-Statistic Prob.
C 294705.1 45236.26 6.514799 0.0000
VATR 2.040991 0.161266 12.65609 0.0000
VTRt-1 0.371727 0.612981 0.606425 0.5533
HHCENDGt-1 0.067619 0.096569 0.700217 0.4945
R-squared 0.917234 Mean dependent var 745382.3
Adjusted R-squared 0.900681 S.D. dependent var 385734.2
S.E. of regression 121563.6 Akaike info criterion 26.43893
Sum squared resid 2.22E+11 Schwarz criterion 26.63776
Log likelihood -247.1698 Hannan-Quinn criter. 26.47258
F-statistic 55.41164 Durbin-Watson stat 1.163303
Prob(F-statistic) 0.000000
Dependent Variable: CPI
Method: Least Squares
Date: 03/14/15 Time: 11:34
Sample (adjusted): 1995 2014
Included observations: 20 after adjustments
Variable Coefficient Std. Error t-Statistic Prob.
C 24.08908 3.254054 7.402790 0.0000
VATR 0.000177 1.10E-05 16.08834 0.0000
VTRt-1 -1.05E-05 6.11E-05 -0.171978 0.8656
CPIt-1 0.082129 0.333795 0.246047 0.8088
R-squared 0.949416 Mean dependent var 63.92050
Adjusted R-squared 0.939932 S.D. dependent var 32.46853
S.E. of regression 7.957640 Akaike info criterion 7.162998
Sum squared resid 1013.185 Schwarz criterion 7.362145
Log likelihood -67.62998 Hannan-Quinn criter. 7.201874
F-statistic 100.1027 Durbin-Watson stat 0.451371
Prob(F-statistic) 0.000000
Source: EViews8-Enhanced Regression Output.