Validity of the rapid buffering approximation near a point source of calcium ions
13
Biophysical Journal Volume 70 June 1996 2527-2539 Validity of the Rapid Buffering Approximation Near a Point Source of Calcium Ions Gregory D. Smith,*§ John Wagner,*`l and Joel Keizer**§" *Institute of Theoretical Dynamics; tSection of Neurobiology, Physiology, and Behavior; §Biophysics Graduate Group; and '9Graduate Group in Applied Mathematics, University of California, Davis, California 95616 USA ABSTRACT In the presence of rapid buffers the full reaction-diffusion equations describing Ca2+ transport can be reduced using the rapid buffering approximation to a single transport equation for [Ca2+]. Here we simulate the full and reduced equations, exploring the conditions necessary for the validity of the rapid buffering approximation for an isolated Ca2+ channel or a cluster of channels. Using a point source and performing numerical simulations of different durations, we quantify the error of the rapid buffering approximation as a function of buffer and source parameters as well as the time and spatial scale set by the resolution of confocal microscopic measurements. We carry out simulations of Ca2+ "sparks" and "puffs," both with and without the indicator dye Ca2+ Green-1, and find that the rapid buffering approximation is excellent. These calculations also show that the traditional calculation of [Ca2+] from a fluorescence signal may grossly underestimate the true value of [Ca2+] near a source. Finally, we use the full model to simulate the transient Ca2+ domain near the pore of an open Ca2+ channel in a cell dialyzed with millimolar concentrations of 1,2-bis(2-aminophenoxy)ethane-N, N, N, N-tetraacetic acid or EGTA. In this regime, where the rapid buffering approximation is poor, Neher's equation for the steady-state Ca2+ profile is shown to be a reliable approximation adjacent to the pore. INTRODUCTION Cytosolic calcium concentrations, [Ca2+], are buffered to low levels in cells by endogenous Ca2+-binding proteins. Indeed, recent experiments in a variety of cell types (All- britton et al., 1992; Neher and Augustine, 1992; Zhou and Neher, 1993; Tse et al., 1994) suggest that only 1-5% of Ca2+ ions in the cytoplasm are free, i.e., not bound to buffers. Whereas the identity and roles of cytosolic buffers are not yet fully understood, the existence of high-affinity buffers has important implications for Ca2+ signaling mech- anisms (Falke et al., 1994), granule exocytosis (Heinemann et al., 1994), excitation-contraction coupling (Berlin et al., 1994; Cannell et al., 1994, 1995), and a variety of other mechanisms in which changes in [Ca2+] are important. The buffered diffusion of Ca2+ is also relevant in a number of experimental protocols, including fluorescence techniques for measuring Ca2+ concentrations in situ (Tsien, 1980; Grynkiewicz et al., 1985) and for the examination and manipulation of Ca2+ concentrations near open Ca2+ chan- nels (Neher, 1986). In these protocols exogenous buffers that possess a wide range of affinities for Ca2+ are intro- duced into cells or organelles, either via membrane soluble modifications of the buffer or via pipette. The affinity of the exogenous buffer for Ca2 , its rate of equilibration, and its diffusion constant can be relevant in these experiments, especially when spatial gradients of Ca2+ are significant. Table 1 lists a number of representative endogenous and Receivedfor publication 13 November 1995 and in final form 15 February 1996. Address reprint requests to Joel E. Keizer, Institute of Theoretical Dynam- ics, University of California, Davis, CA 95616-8618. Tel.: 916-752-0938; Fax: 916-752-7297; E-mail: [email protected]. C 1996 by the Biophysical Society 0006-3495/96/06/2527/13 $2.00 exogenous cytosolic buffers with approximate values of their physical properties. We have recently developed a simplified mathematical description of Ca2' diffusion that is valid in the presence of buffers that bind Ca2+ rapidly (Wagner and Keizer, 1994), the so-called rapid buffering approximation. Experimental estimates of binding rate constants for endogenous Ca2+ buffers in the cytoplasm give equilibration times on the order of a few milliseconds (Neher and Augustine, 1992; Zhou and Neher, 1993). For relatively small gradients, like those seen in Ca2+ waves, we have estimated that the rapid buffering approximation should be valid for equilibration times less than about 10 ms (Wagner and Keizer, 1994). Generally speaking, the validity of the rapid buffering ap- proximation requires that the equilibration time of the buff- ers be much smaller than the time required for Ca2+ to diffuse across a region of the size of a typical gradient. Recently it has been possible to resolve very small domains of Ca2+ associated with the opening of one or, perhaps, small clusters of Ca2+ channels. Because fluorescence imaging of these Ca2+ "domains" (Sherman et al., 1990; Llinas et al., 1992), "puffs" (Parker and Yao, 1991; Yao et al., 1995), or "sparks" (Cheng et al., 1993; Tsugorka et al., 1995), as they have been variously called, has limited spatial resolution, one cannot measure the true Ca2+ gradients in these regions. Thus it has been of interest to estimate the spatial Ca2+ profile near open Ca2+ channels using calculations. This is of particular significance when Ca2+ channels are themselves Ca2+ sensi- tive (Fogelson and Zucker, 1985; Simon and Llinas, 1985; Blumenfeld et al., 1992; Stem, 1992; Nowycky and Pinter, 1993), for example, in the case of voltage-gated L-type Ca2+ channels (Eckert and Chad, 1984; de Leon et al., 1995), the inositol-1,4,5-trisphosphate (JP3) receptor (Bezprozvanny and Ehrlich, 1994), and depletion-activated Ca2+ currents (Zwei- 2527
-
Upload
independent -
Category
Documents
-
view
1 -
download
0
Transcript of Validity of the rapid buffering approximation near a point source of calcium ions

Biophysical Journal Volume 70 June 1996 2527-2539
Validity of the Rapid Buffering Approximation Near a Point Source ofCalcium Ions
Gregory D. Smith,*§ John Wagner,*`l and Joel Keizer**§"*Institute of Theoretical Dynamics; tSection of Neurobiology, Physiology, and Behavior; §Biophysics Graduate Group; and '9GraduateGroup in Applied Mathematics, University of California, Davis, California 95616 USA
ABSTRACT In the presence of rapid buffers the full reaction-diffusion equations describing Ca2+ transport can be reducedusing the rapid buffering approximation to a single transport equation for [Ca2+]. Here we simulate the full and reducedequations, exploring the conditions necessary for the validity of the rapid buffering approximation for an isolated Ca2+channel or a cluster of channels. Using a point source and performing numerical simulations of different durations, we quantifythe error of the rapid buffering approximation as a function of buffer and source parameters as well as the time and spatialscale set by the resolution of confocal microscopic measurements. We carry out simulations of Ca2+ "sparks" and "puffs,"both with and without the indicator dye Ca2+ Green-1, and find that the rapid buffering approximation is excellent. Thesecalculations also show that the traditional calculation of [Ca2+] from a fluorescence signal may grossly underestimate the truevalue of [Ca2+] near a source. Finally, we use the full model to simulate the transient Ca2+ domain near the pore of an openCa2+ channel in a cell dialyzed with millimolar concentrations of 1,2-bis(2-aminophenoxy)ethane-N, N, N, N-tetraacetic acidor EGTA. In this regime, where the rapid buffering approximation is poor, Neher's equation for the steady-state Ca2+ profileis shown to be a reliable approximation adjacent to the pore.
INTRODUCTION
Cytosolic calcium concentrations, [Ca2+], are buffered tolow levels in cells by endogenous Ca2+-binding proteins.Indeed, recent experiments in a variety of cell types (All-britton et al., 1992; Neher and Augustine, 1992; Zhou andNeher, 1993; Tse et al., 1994) suggest that only 1-5% ofCa2+ ions in the cytoplasm are free, i.e., not bound tobuffers. Whereas the identity and roles of cytosolic buffersare not yet fully understood, the existence of high-affinitybuffers has important implications for Ca2+ signaling mech-anisms (Falke et al., 1994), granule exocytosis (Heinemannet al., 1994), excitation-contraction coupling (Berlin et al.,1994; Cannell et al., 1994, 1995), and a variety of othermechanisms in which changes in [Ca2+] are important. Thebuffered diffusion of Ca2+ is also relevant in a number ofexperimental protocols, including fluorescence techniquesfor measuring Ca2+ concentrations in situ (Tsien, 1980;Grynkiewicz et al., 1985) and for the examination andmanipulation of Ca2+ concentrations near open Ca2+ chan-nels (Neher, 1986). In these protocols exogenous buffersthat possess a wide range of affinities for Ca2+ are intro-duced into cells or organelles, either via membrane solublemodifications of the buffer or via pipette. The affinity of theexogenous buffer for Ca2 , its rate of equilibration, and itsdiffusion constant can be relevant in these experiments,especially when spatial gradients of Ca2+ are significant.Table 1 lists a number of representative endogenous and
Receivedfor publication 13 November 1995 and in finalform 15 February1996.Address reprint requests to Joel E. Keizer, Institute of Theoretical Dynam-ics, University of California, Davis, CA 95616-8618. Tel.: 916-752-0938;Fax: 916-752-7297; E-mail: [email protected] 1996 by the Biophysical Society0006-3495/96/06/2527/13 $2.00
exogenous cytosolic buffers with approximate values oftheir physical properties.We have recently developed a simplified mathematical
description of Ca2' diffusion that is valid in the presence ofbuffers that bind Ca2+ rapidly (Wagner and Keizer, 1994),the so-called rapid buffering approximation. Experimentalestimates of binding rate constants for endogenous Ca2+buffers in the cytoplasm give equilibration times on theorder of a few milliseconds (Neher and Augustine, 1992;Zhou and Neher, 1993). For relatively small gradients, likethose seen in Ca2+ waves, we have estimated that the rapidbuffering approximation should be valid for equilibrationtimes less than about 10 ms (Wagner and Keizer, 1994).Generally speaking, the validity of the rapid buffering ap-proximation requires that the equilibration time of the buff-ers be much smaller than the time required for Ca2+ todiffuse across a region of the size of a typical gradient.
Recently it has been possible to resolve very small domainsof Ca2+ associated with the opening of one or, perhaps, smallclusters of Ca2+ channels. Because fluorescence imaging ofthese Ca2+ "domains" (Sherman et al., 1990; Llinas et al.,1992), "puffs" (Parker and Yao, 1991; Yao et al., 1995), or"sparks" (Cheng et al., 1993; Tsugorka et al., 1995), as theyhave been variously called, has limited spatial resolution, onecannot measure the true Ca2+ gradients in these regions. Thusit has been of interest to estimate the spatial Ca2+ profile nearopen Ca2+ channels using calculations. This is of particularsignificance when Ca2+ channels are themselves Ca2+ sensi-tive (Fogelson and Zucker, 1985; Simon and Llinas, 1985;Blumenfeld et al., 1992; Stem, 1992; Nowycky and Pinter,1993), for example, in the case of voltage-gated L-type Ca2+channels (Eckert and Chad, 1984; de Leon et al., 1995), theinositol-1,4,5-trisphosphate (JP3) receptor (Bezprozvanny andEhrlich, 1994), and depletion-activated Ca2+ currents (Zwei-
2527

Volume 70 June 1996
TABLE I Representative cytosolic Ca2+ buffers
k+ k- Kd Mol. wt. DName (,uM-' s-') (s-') (RM)$ (kD) (pm2 s-Y)5 References*
EndogenousStationary
Troponin-C 90, 100 300,7 3,0.05-0.07 - Falke et al., 1994Sarcolemmal phospholipids 1100, 13 Post and Langer, 1992
MobileCalmodulin 500, 100 470,37 0.9-2.0,0.2-0.4 17 32 Falke et al., 1994Calbindin-D28K 20 8.6 0.4-1.0 28 27 Koster et al., 1995Parvalbumin 611 1 0.00037 12 36 Falke et al., 1994
ExogenousEGTA 1.5 0.3 -0.2** 0.38 113 Tsien, 1980BAPTA 600 100 0.1-0.7 0.63 95 Pethig et al., 1989Fura-2 600 80-100 0.13-0.60 0.64 95$ Pethig et al., 1989Ca2+ Green-i 700 170 0.19-0.25 0.91 84 Eberhard and Eme, 1991Ca2+ Green-I dextran -700 -170 0.24-0.35 -70 20 Kao, 1994
For review see Baimbridge et al. (1992), Heizmann and Hunziker (1991), and Kao (1994).* A range indicates that measurements were made under different experimental conditions; values for distinct binding sites are separated by a comma.§ Estimated using D = kBT16wqR, and Rm = (3M/4rdL)113, i.e., the Stokes-Einstein relation assuming a spherical molecule of density, d = 1.33 glcm3,and molecular weight, M. The viscosity (Tj) used is four times that of water at room temperature.The troponin complex is immobile because of the its association with actin.Even slower physiologically because Mg2+ must dissociate (with a time constant of approximately 1 s) before Ca21 can bind (Falke et al., 1994).EGTA is strongly dependent on pH variation near 7.0 (Kao, 1994).
t Blatter and Wier (1990) report 31 ILm2 s-1 and suggest that 65-70% of fura-2 is immobilized.
fach and Lewis, 1995), or when voltage-gated Ca2' channelsare associated with other Ca2+-sensitive ion channels, as theyare in smooth muscle cells (ryanodine receptors; Cannell et al.,1994, 1995) and in hair cells (Ca2 -activated potassium chan-nels; Roberts et al., 1990; Roberts 1993, 1994).
Here we explore the range of validity of the rapid buff-ering approximation for the calculation of Ca2+ domains.This is of interest not only because this approximationspeeds up calculations significantly, but because it simpli-fies the interpretation of calculations. A simplified interpre-tation is especially important in the presence of mobilebuffers, which not only buffer Ca2+ but assist in Ca2+transport (Roberts, 1993, 1994; Wagner and Keizer, 1994).These advantages become particularly important when com-plex phenomena such as calcium waves (Jafri and Keizer,1995) or multiple release sites are considered. Here weaddress the time and distance scales on which the rapidbuffering approximation is valid for a single source andshow when it can be used to estimate Ca2+ gradients and thedynamics of Ca2+ domains.
EQUATIONS AND NUMERICAL METHODS
Following our previous work (Wagner and Keizer, 1994),we assume buffering reactions
k+
Bi+Ca2+ = CaBi, (1)
buffer binding sites, respectively; and CaB , CaBn, andCaBe represent Ca2' bound to these buffer sites. Assumingmass action kinetics, Fickian diffusion, and a single pointsource for free Ca2' at the origin (r = 0) of a sphericalcoordinate system, we can write
a = DcV2[Ca2+] - k[Ca2+][B.] + ks-[CaBs]at(2)
- J k+[Ca2+][Bj +E k7-[CaBjI + oro(r),
a[CaB,] = ks+[Ca2+][Bs] - k-[CaB,],at
aCaB]=DjV2[CaBj +kj+[C2+[Bj]-kj-[CaBj],
ati =DjV2[Bj]-kj+ [Ca2+][Bj]+kj-[CaBj]-
(3)
(4)
(5)
where j = m or e; D, is the diffusion constant of Ca2+; Djis the diffusion constant of Bj and CaBj (assumed equal); aois the current amplitude of the source (in units of ,umol s- 1);the Dirac delta function, 8(r), is a sharply peaked function atthe origin; and B, is everywhere given by the conservationcondition
[Bs] = [BS]T- [CaBs] (6)where i = s, m, or e; BS, BM, and Be represent endogenousstationary, endogenous mobile, and exogenous mobile
where [BSIT is the total concentration of endogenous sta-tionary buffer binding sites. We call this the full model.
2528 Biophysical Joumal
J i

Validity of Rapid Buffering Approximation
If the buffer reactions are fast with respect to the diffu-sion, and initially the mobile buffers are distributed uni-formly, the full model can be reduced to a single transportequation for Ca2+ (Wagner and Keizer, 1994),
a[Ca = 13[V2(D[Ca2+] + EDj[CaBj])+cro08(r)], (7)
where
Ks[Bs]T Kj[Bj]T
J3-+ 2+~T- 2+ (K(8)(Ks + [Ca ]) (K+[Ca2+])2 (
and
aH=[BjIT[Ca2"]j[ Kj]+[Ca2+] (9)
In these equations, which we call the reduced model, Ki =k,-Iki+ are the dissociation constants of the buffer reactionsand [BS]T, [Bm]T, and [Be]T are the total concentrations ofthe buffer binding sites. Although Eqs. 7-9 are most usefulfor numerical calculations, Eqs. 7 and 9 can be combined toyield an even simpler equation (Wagner and Keizer, 1994),
a[Cad2] = 3 Dc + E yjD. V2[Ca2+]at
jy D V2[Ca?+]. V[Ca2j + o06(r)
(10)
wher
- 2 Kj+[Ca2+]jV[Ca2] *V[Ca2+]+(ros(r)
re
Kj[Bj]T'Yj (Kj+ [Ca2+])2 - (1 1)
The assumption of rapid equilibrium used in deriving theseequations requires that the equilibration time scales for thebuffers (T) be rapid with respect to the diffusive time scale.This requirement can be written as (Wagner and Keizer,1994).
1 L2
i ki-+ki+([Ca2+] + [Bi]) DC
models have hemispherical symmetry and the flux of eachmobile species lacks a 0 or a 4 component. This implies thatsolutions to Eqs. 2-5 and Eq. 7 in a sphere of radius Rma,but with no boundary at 0 = rr/2 and twice the sourcestrength, are also solutions to these equations in the hemi-sphere in the presence of the boundary (Carslaw and Jaeger,1959; Crank, 1975; Stem, 1992). Our calculations utilizethis fact. The initial condition for Ca2' in both the full andreduced calculations is [Ca2+] = co, a uniform backgroundconcentration. In the full model calculations, all buffers areassumed initially to be in equilibrium with Ca2+, and theseconcentrations are also used in a Dirichlet (absorbing)boundary condition for each variable at r = Rm,. In allcalculations, Rm was chosen large enough that it did notinfluence the numerical results. The methods used in solv-ing these equations are described in the Appendix.
CONVERGENCE OF THE REDUCED MODEL TOTHE FULL MODEL
Fig. 1 shows calculated concentration profiles of free Ca21and buffer species 1 ms after turning on a 5-pA source.
Simulations with the full model (Fig. 1 A) are based on Eqs.2-5. Physiologically realistic parameters (see legend to Fig.
104
' 103
10o 10
C.)0 10'w
c)
I 1030 10(12) 01i 10 1
where L is a length characteristic of the spatial profile ofCa2+.
In this paper we investigate buffered Ca2' diffusion neara point source releasing free Ca2+ into a three-dimensionalhemispherical space using standard spherical coordinates (0< r < Rma, 0< < 21r, and 0 < 0 <T/2) with a no-fluxboundary condition at 0 = ir/2. This boundary representsthe biological membrane in which the source or channelresides and is assumed to have no curvature and to beimpermeable to Ca2+ everywhere, except at the location ofthe channel (r = 0). Because we consider only one sourcefor free Ca2 , solutions to both the full and the reduced
w
0 0u 10
0.0 0.2 0.4 0.6 0.8 1.0r (gm)
0.0 0.2 0.4 0.6 0.8 1.0r (gm)
FIGURE 1 (A) Representative full model calculation of [Ca2+] profilenear a point source for free Ca2'. Source amplitude (oro) and elapsed time(to) are 5 pA and 1 ms, respectively. Other parameters: [BS]T = 250 JIM;[Bm]T= 50 ,uM; ks- = km = 103 s-1; k.+ = km = 102 ,M-' s-';D-=250 Um2 s-'; Dm = 75 pm2 s-; At = 0.1 p.s; Ar = 0.01 ,m; Rma = 8lim. (B) Corresponding reduced model calculation with K. = Km = 10p.M.
Smith et al. 2529
4
3
2
3

Volume 70 June 1996
1 A) were chosen to represent the cytosolic milieu. Forexample, the diffusion constant for free Ca2+ used in thissimulation (D, = 250 ,um2 s-1) is based on experimentaldata (Allbritton et al., 1992). We have assumed dissociationconstants for endogenous buffers to be in the range of 1-10,uM (see Table 1) and chosen concentrations for total sta-tionary ([BSIT) and total mobile ([Bm]T) buffer that areconsistent with the effective diffusion constant for Ca2+measured in Xenopus cytoplasm (Allbritton et al., 1992).The association and dissociation rates of the buffers (ks =km = 103 s-, ks+ = km = 102 ,uM-I s-1) are compatiblewith measurements of relaxation times for endogenousCa2+ buffers in chromaffm cells (Zhou and Neher, 1993). Inagreement with theoretical arguments, we find micromolarconcentrations of Ca2+ adjacent to the open channel (Neher,1986) with [Ca2+] greater than 100 ,M at distances lessthan 100 nm from the 5-pA source. On the other hand, at 1ms these elevated Ca2+ concentrations are restricted to aregion approximately 0.5-1.0 ,um in radius, beyond which[Ca2+] approaches the background concentration of 0.1,uM. The evolution of the Ca2+ profile through time de-pends heavily on the current amplitude of the source as wellas on the concentration, kinetics, and mobility of the en-dogenous Ca2+ buffers used in the full model calculation.The effect of mobile Ca2+ buffers near an open Ca2+
channel can be observed in Fig. 1 A by comparing the freestationary buffer concentration ([Bs], dotted line) with thefree mobile buffer concentration ([Bm], long-dashed line).At large distances from the source, the concentrations ofboth stationary and mobile buffers are in equilibrium withthe background Ca2+ concentration ([B5] = 247.5 ,uM,[CaBs] = 2.5 ,uM, [Bm] = 49.5 ,uM, and [CaBm] = 0.5AM). Near the channel the concentrations of both freestationary and free mobile buffers decrease. But whereas thefree stationary buffer concentration near the source ap-proaches zero, the free mobile buffer concentration is ap-proximately 6.0 ,uM. Even at a distance of 10 nm, where thestationary buffer is more than 99% saturated, the mobilebuffer is only 83% saturated. This difference in degree ofsaturation is due to the ability of free mobile buffer (Bm) andmobile buffer with Ca2+ bound (CaBm) to diffuse towardand away from the channel (Roberts, 1993, 1994). Althoughlocally the sum of [Bm] and [CaBm] stays constant whentheir diffusion constants are equal, the net effect of thediffusion of mobile buffer in these two different forms is toreplace the mobile buffer with Ca2+ bound (CaBm) near thesource with free mobile buffer (Bm). Regardless of concen-tration, stationary buffer cannot influence the steady-stateCa2+ profile near an open channel, but only the approach tothis dynamic steady state. Mobile buffer, on the other hand,can have a dramatic effect on both the time course of theCa2+ profile and its steady state (Roberts, 1993, 1994).
Fig. 1 B shows the reduced model calculation corre-sponding to the full model calculation in Fig. 1 A. Thiscalculation assumes instantaneous equilibration of Ca2+with stationary and mobile buffer, but uses the same diffu-
A. One practical advantage of the rapid buffering approxi-mation is that only the Ca2+ concentration need be explic-itly calculated; for comparison, however, in Fig. 1 B we
present the concentrations of the buffers calculated from theequilibrium assumption. Qualitatively and semiquantita-tively, the full and reduced model calculations are remark-ably similar. For example, at a distance of 0.1 ,tm from thesource, the Ca2+ concentration is elevated to approximately110 AM, and stationary buffer is 92% saturated in both thefull and reduced model calculations. However, closer in-spection reveals some disagreement between the two calcu-lations. The Ca2+ profile has a decreased extent in thereduced model calculation, approaching the backgroundCa2+ concentration of 0.1 ,uM at a distance of 0.7 ,um,rather than 1.0 ,um, from the origin. A shift in the CaBs andBs profiles can be observed by noting the distance at whichthese two traces cross each other, i.e., the radius at whichstationary buffer sites are 50% saturated. This radius is 0.27,um in the full model and 0.29 ,um in the reduced modelcalculation. In the case of mobile buffer, this shift is greater(0.19 ,tm versus 0.29 ,um). In addition, near the source thefree mobile buffer concentration is much lower in Fig. 1 Bthan in Fig. 1 A. These observations suggest that the quan-
titative accuracy of the rapid buffering approximation de-pends on the mobility of the Ca2+ buffers being considered.
Fig. 2 compares the reduced model calculation (solid linein Fig. 2 and Fig. 1 B) to the Ca2+ profiles of full modelcalculations in which the association and dissociation rateconstants (ks+, k+, ks-, and km) are increased while main-taining the same dissociation constants (K. = Km = 10AM). As in Fig. 1, the Ca2+ profiles are shown at an elapsedtime of 1 ms. The uppermost Ca2+ profile in Fig. 2 (dottedline) was calculated using the full model with relativelyslow association and dissociation rate constants (ks = km =
10 s-1, k+ = k+ = 1 uM-' s-1). This profile differssignificantly from the corresponding reduced model calcu-lation (solid line). For example, at a distance of 0.6 ,um from
104
FU3 Reducedk+ k 100pMvi soa
km=10,uM;othrparametersreasinFig. 101 PMrc1~~~ ~~~~~~k 12 pis1s'
1l01 .......... k,0~P.M100k,1 m
0.0 0.2 0.4 0.6 0.8 1.0
r (gm)
FIGURE 2 Reduced model calculation of [Ca21] profile (solid line) in
Fig. B is compared to [Ca?'] profiles (broken lines) calculated using the
full model with a range of association and dissocialtion rate constants (k,+= k+ 100o_103 ,AM s-'; k- = km~= l0-104 s'- ), varied so that K,,
=Km =10 iLM; other parameters are as in Fig. 1. The reduced model
sion (D.) and dissociation (K. and Kn) constants as Fig. 1
2530 Biophysical Joumal
result approaches the full model as buffer kinetic constants are increased.

Validity of Rapid Buffering Approximation
the source, there is a difference of nearly two orders ofmagnitude in the Ca2+ concentration predicted by the fulland reduced models. However, as the association and dis-sociation rate constants used in the full model are increased,the difference between the calculated Ca2+ profiles dimin-ishes. The lowermost broken trace (dot-dashed line) is a fullmodel calculation (ks== = 104 s- and k+ = k+ = 103tkM'1 s-1) that is nearly identical to the reduced model.Comparison of these Ca2+ profiles verifies that as thebuffering rate constants in the full model are increased, thefull model Ca2+ profile approaches that of the reducedmodel. This convergence is guaranteed by the fact that thereduced equation is derived from the full equations assum-ing that Ca2+ is always locally in equilibrium with thebuffers, a condition that is satisfied when the rate constantsin the full model are large. Taken together, Figs. 1 and 2show the validity of the rapid buffering approximation neara point source for free Ca2+ when Ca2+ buffers are suffi-ciently fast, and that the adequacy of this approximationdepends on the kinetic constants of the Ca2+ buffers (Wag-ner and Keizer, 1994).
Because the rapid buffering approximation assumes thatCa2+ instantaneously equilibrates with the buffers, it istempting to conclude that the Ca2+ profile calculated withthe reduced equation will always lie below that calculatedwith the full equations. For example, in Figs. 1 and 2 thereduced model underestimates the concentration of Ca2+throughout the Ca2+ domain. This is often observed insimulations near a channel that has been open continuously(see also Fig. 3). However, we have found conditions inwhich the local Ca2+ concentration in the reduced modelexceeds that in the corresponding full model calculation (cf.Fig. 7). In the case of a periodically switching source (notshown), the reduced model calculation can transiently ex-ceed the full model calculation when the source turns off.
Although the reduced model result is always the limit ofthe full model calculations as buffer rates are increased, the
utility of the reduced model depends on its convergence tothe full model, where buffer rate constants are plausiblephysiologically. Using such realistic parameters (or = 5 pA,Ki = 10 AM, k+ = 102 M-I s-', and ki = 103 s-), Fig.3 directly compares full and reduced model calculationswhile varying both the fraction of mobile to stationarybuffer and the elapsed time. In all cases, total Ca2+ buffer([BS]T + [Bm]T) is 300 ,uM. Fig. 3 A presents full andreduced model calculations for the case of 100% stationarybuffer at 1 ms. Here the difference between the Ca2+profiles predicted by the reduced and full models variesgreatly as a function of distance from the source. Forexample, there is nearly an order of magnitude differencebetween the Ca2+ concentration predicted by the reducedand full models at r = 0.6 ,im, whereas the difference at theorigin and at r = 1.0 ,um is negligible. However, thisdifference between the full and reduced calculation de-creases with time (cf. Fig. 3, A and B). Although at 1 mselapsed time the difference between the two calculations ispronounced (see 0.4 ,um < r < 0.8 ,um), by 10 ms the fulland reduced models are predicting nearly identical Ca21profiles. The mobility, concentration, and kinetic rate con-stants of the Ca2' buffers determine the time at which thisconvergence occurs. The 1-ms time constant of relaxationfor the stationary buffers used in this simulation is a roughlower bound to the time it takes for the reduced model toconverge to the full model.The effect of endogenous mobile Ca2+ buffer on the
validity of the rapid buffering approximation is shown inFig. 3, C and D, which are identical to Fig. 3, A and B,except for the replacement of 50 AM stationary buffer by 50,uM mobile buffer ([BS]T = 250 AM, [Bm]T = 50 ,uM, andDm = 75 ,um2 s-1). At 1 ms, the reduced model calculationhas not yet converged to the full model (Fig. 3 C), but by 10ms the two models are giving nearly identical results (Fig.3 D). Although in these simulations only 17% of the Ca2+buffer is mobile, the manner in which the reduced model
104
FIGURE 3 Direct comparison of full(solid line) and reduced (dotted line)model calculations of [Ca21] profile near
a 5-pA source. (A) [BS]T = 300 pM; tO =1 ms. (B) [BS]T = 300 pM; to = 10 ms.(C) [BS]T = 250 gM; [Bm]T = 50 ,uM; tO= 1 ms. (D) [BSIT = 250 MM; [Bm]T =50 MtM; tO = 10 ms. (E) [Bm]T = 300
,M; to = 1 ms. (F) [Bm]T = 300 MM; to= 10 ms. In all cases, ksA =km = 103s-' and k+ = km = 102 uM-I s-'. Allother parameters are the same as Fig. 1.In each panel, coarse-grained results (AR= I ,m; see text) for the full (0) andreduced (A) model are shown at r = 0,um and r = 1 ,um.
103
s1 102I--
101 2° 0
2 0lo
104
03
%-.
+ 10
10
[BS]T = 300 jiME
Ims A
IE Ia
lOims B I
\
. ,0.0 0.5 1.0 0.0
[B,]T = 250 jIM, [Bm]T 50 pMi
Ilms r
lOms DaS\ 1~~~~I
0.5 1.0 0.0r (gm) r (gm)
[B.]T= 300 M
lms E
.
lOims F
0.5 1.0r(gm)
Smith et al. 2531
I
.^
-1
Volume 70 June 1996
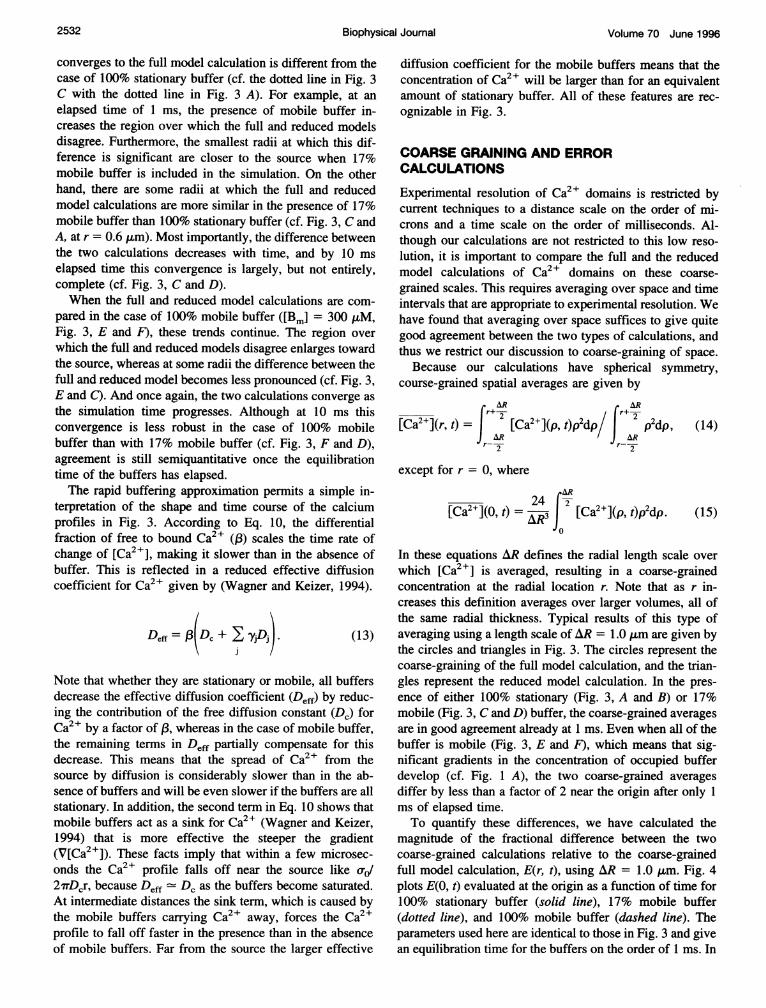
converges to the full model calculation is different from thecase of 100% stationary buffer (cf. the dotted line in Fig. 3C with the dotted line in Fig. 3 A). For example, at anelapsed time of 1 ms, the presence of mobile buffer in-creases the region over which the full and reduced modelsdisagree. Furthermore, the smallest radii at which this dif-ference is significant are closer to the source when 17%mobile buffer is included in the simulation. On the otherhand, there are some radii at which the full and reducedmodel calculations are more similar in the presence of 17%mobile buffer than 100% stationary buffer (cf. Fig. 3, C andA, at r = 0.6 ,um). Most importantly, the difference betweenthe two calculations decreases with time, and by 10 mselapsed time this convergence is largely, but not entirely,complete (cf. Fig. 3, C and D).When the full and reduced model calculations are com-
pared in the case of 100% mobile buffer ([Bin] = 300 ,uM,Fig. 3, E and F), these trends continue. The region overwhich the full and reduced models disagree enlarges towardthe source, whereas at some radii the difference between thefull and reduced model becomes less pronounced (cf. Fig. 3,E and C). And once again, the two calculations converge asthe simulation time progresses. Although at 10 ms thisconvergence is less robust in the case of 100% mobilebuffer than with 17% mobile buffer (cf. Fig. 3, F and D),agreement is still semiquantitative once the equilibrationtime of the buffers has elapsed.The rapid buffering approximation permits a simple in-
terpretation of the shape and time course of the calciumprofiles in Fig. 3. According to Eq. 10, the differentialfraction of free to bound Ca21 (/3) scales the time rate ofchange of [Ca2+], making it slower than in the absence ofbuffer. This is reflected in a reduced effective diffusioncoefficient for Ca2+ given by (Wagner and Keizer, 1994).
Deff = (3(Dc + yjDj) (13)
Note that whether they are stationary or mobile, all buffersdecrease the effective diffusion coefficient (Deff) by reduc-ing the contribution of the free diffusion constant (Dc) forCa2+ by a factor of ,B, whereas in the case of mobile buffer,the remaining terms in Deff partially compensate for thisdecrease. This means that the spread of Ca2+ from thesource by diffusion is considerably slower than in the ab-sence of buffers and will be even slower if the buffers are allstationary. In addition, the second term in Eq. 10 shows thatmobile buffers act as a sink for Ca2+ (Wagner and Keizer,1994) that is more effective the steeper the gradient(V[Ca2+]). These facts imply that within a few microsec-onds the Ca2+ profile falls off near the source like Gb/2'nDcr, because Deff - Dc as the buffers become saturated.At intermediate distances the sink term, which is caused bythe mobile buffers carrying Ca2+ away, forces the Ca2+profile to fall off faster in the presence than in the absenceof mobile buffers. Far from the source the larger effective
diffusion coefficient for the mobile buffers means that theconcentration of Ca21 will be larger than for an equivalentamount of stationary buffer. All of these features are rec-ognizable in Fig. 3.
COARSE GRAINING AND ERRORCALCULATIONS
Experimental resolution of Ca2+ domains is restricted bycurrent techniques to a distance scale on the order of mi-crons and a time scale on the order of milliseconds. Al-though our calculations are not restricted to this low reso-lution, it is important to compare the full and the reducedmodel calculations of Ca2' domains on these coarse-grained scales. This requires averaging over space and timeintervals that are appropriate to experimental resolution. Wehave found that averaging over space suffices to give quitegood agreement between the two types of calculations, andthus we restrict our discussion to coarse-graining of space.
Because our calculations have spherical symmetry,course-grained spatial averages are given by
[Ca"](r, t) = 2 [Ca2+](p, t)p2dp Jr+ p2dp,r-2 r-2
except for r = 0, where)R
[Ca2+](0, t)24
2 [Ca2+](p, t)p2dp.-ij
(14)
(15)
In these equations AR defines the radial length scale overwhich [Ca2+] is averaged, resulting in a coarse-grainedconcentration at the radial location r. Note that as r in-creases this definition averages over larger volumes, all ofthe same radial thickness. Typical results of this type ofaveraging using a length scale ofAR = 1.0 ,um are given bythe circles and triangles in Fig. 3. The circles represent thecoarse-graining of the full model calculation, and the trian-gles represent the reduced model calculation. In the pres-ence of either 100% stationary (Fig. 3, A and B) or 17%mobile (Fig. 3, C and D) buffer, the coarse-grained averagesare in good agreement already at 1 ms. Even when all of thebuffer is mobile (Fig. 3, E and F), which means that sig-nificant gradients in the concentration of occupied bufferdevelop (cf. Fig. 1 A), the two coarse-grained averagesdiffer by less than a factor of 2 near the origin after only 1ms of elapsed time.To quantify these differences, we have calculated the
magnitude of the fractional difference between the twocoarse-grained calculations relative to the coarse-grainedfull model calculation, E(r, t), using AR = 1.0 ,um. Fig. 4plots E(O, t) evaluated at the origin as a function of time for100% stationary buffer (solid line), 17% mobile buffer(dotted line), and 100% mobile buffer (dashed line). Theparameters used here are identical to those in Fig. 3 and givean equilibration time for the buffers on the order of 1 ms. In
2532 Biophysical Journal

Validity of Rapid Buffering Approximation
0.8
dz5
Time (ms)
FIGURE 4 E(0, t), the coarse-grained (AR = 1 ,um) error of the rapidbuffering approximation evaluated at r = 0, is shown as a function of timefor the case of stationary buffer only ([BS]T = 300 ,uM; solid line), a mixof stationary and mobile buffer ([BSIT = 250 ,uM; [Bm]T = 50 ,AM; dottedline), and 100% mobile buffer ([Bm]T = 300 ,uM; dashed line). Otherparameters are the same as in Fig. 1.
all three cases, the error in the rapid buffering approxima-tion is large shortly after the channel opens, but decreasesconsiderably after several milliseconds. In the case of 100%stationary buffer, the error falls below 0.1 after 1 ms and isvanishingly small after 10 ms. In the case of 17% mobilebuffer, these numbers are 0.2 and 0.05, respectively. Thisdifference is due to the sink for Ca2+ produced by mobilebuffers (i.e., the second term in Eq. 10) as they move in toreplace buffer that is bound to Ca2+. This process results insteeper Ca2+ gradients (compare Fig. 3, F and B), and,consequently, more time must pass before the condition ofvalidity of the rapid buffering approximation given in Eq.12 is satisfied. Although 100% mobile buffer is not realisticphysiologically, the top trace in Fig. 4 emphasizes that thelength of time required for the coarse-grained error to van-ish depends on the quantity of mobile buffer and suggests
0.8
0.6
E 0.4
FIGURE 5 E(0, 1 ms) and E(0, 10 ms) for AR = 1,um calculated as a function of buffer parameters. Ineach graph the error decreases as the association (k+)and dissociation (k7-) rate constants are increased pro-portionately. The solid line represents Ki = 10 .LM, andthe dashed line represents Ki = 1 u.M. (A) [BS]T = 300p,M; to = 1 ms. (B) [BSJT = 300 ,uM; to = 10 ms. (C)[BSIT = 250 ,uM; [Bm]T = 50 p.M; to = 1 ms. (D) [BJT= 250 ,uM; [Bm]T = 50 ,uM; to = 10 ms.
0.2
0.011
0.8
0.6
E 0.4
0.2
0.0
that the rapid buffering approximation is better when onlymoderate concentrations of mobile buffer are present.
Fig. 5 quantifies the validity of the rapid buffering ap-proximation over a wide range of buffer rate constants. Fig.5, A and B, presents E(0, t) at 1.0 and 10 ms, respectively,for stationary buffer dissociation constants (Ks) of 1 ,uM(dotted line) and 10 ,uM (solid line) and a variety of asso-ciation rate constants (k+). Fig. 5, C and D, gives similarresults for a mixture of stationary and mobile buffers withidentical kinetics (k+ = k+, k- = km). To interpret theseresults, recall that for a given dissociation constant (K,),increasing the association rate constant (k+) implies a pro-portional increase in ki, which together result in a greaterequilibration rate for the buffers. Thus each panel in Fig. 5shows that error greatly decreases as the equilibration rateof the buffers increases. Although over time error decreasesmore slowly in the case of a mixture of stationary andmobile buffer than in the case of 100% stationary buffer(compare Fig. 5, D and B), in both cases the coarse-grainederror decreases as a function of time, regardless of bufferparameters (compare Fig. 5 B to S A and 5 D to 5 C). Within10 ms after the source activates, the error is less than 0.1 forstationary buffers with association rates greater than 10jiM-1 s-1, and in this regime error is approaching 0.1 forthe mixture of stationary and mobile buffers.
Fig. 5 also shows that error is generally greater in the caseof high-affinity buffers (dotted lines) than low-affinity buff-ers (solid lines). To understand this recall that the dissoci-ation rate constant for Ca2+ from the buffers is given by ki-= k+ Ki. Thus, in each panel, the dissociation constant (k7)of the solid curve is a factor of 10 larger than that of thecorresponding dotted curve. As the equality in Eq. 12shows, this increased dissociation constant considerablylengthens the equilibration time of the buffers unless theassociation rate constant is comparatively large. In Fig. 5 D,
10' 10 103 1()4 ° ) 10 1 0 103 1(0k,+ (gM- s ) k,+ (gM- s )
0.8
0.6 B
E0.
ks+& km, (gM-'s-)
Smith et al. 2533

Volume 70 June 1996
for example, for an association rate constant of k+ = 102,AM1 s- l, the dotted curve represents a dissociation rate ofk- = 102 S-1, whereas the solid curve represents kJ- = 103s-1. These values of k+ and k- result in an equilibrationtime on the order of a millisecond for both curves, with thedotted curve (Ki = 1 ,AM) being about a factor of 2 slowerthan the solid curve (Ki = 10 ,AM).The validity of the rapid buffering approximation also
depends on the current amplitude of the source. This isshown in Fig. 6, where E(0, t) is plotted as a function of theunitary current at 1 ms (solid line) and 10 ms (dotted line).Both stationary and mobile buffers are included in thecalculation with parameters identical to Figs. 1, 3 C, and 3D. E(O, 10 ms) is lower than E(0, 1 ms) for all sourceamplitudes greater than 0.1 pA. In addition, at both timesthe error is greatest at intermediate source amplitudes (near0.5 or 0.9 pA). At low source amplitudes, the coarse-grainedCa21 concentration of both the full and reduced models isnear background and the error is consequently low. Whenthe current is high, error is minimized because buffers nearthe source are saturated.
EFFECT OF EXOGENOUS BUFFERS
Because the rapid buffering approximation is a good onenear a 5-pA source, it makes sense to use the reduced modelto describe the IP3-mediated Ca2+ release events known asCa2+ "puffs" (Yao et al., 1995). In the simulations shown inFig. 7, the source corresponds to a cluster of 10 open IP3receptors, each with a unitary current amplitude of 0,5 pA(Bezprozvanny and Ehrlich, 1994). This Ca2+ "release site"is instantaneously activated at t = 0 and remains active for50 ms, the duration of an average Ca2+ puff event observedin the immature Xenopus oocyte (Yao et al., 1995), at whichtime it is instantaneously inactivated. In Fig. 7 A, a simu-lated Ca2+ puff is shown while the source is active at 1, 10,and 50 ms. Fig. 7 B shows the Ca2+ profile again at 50 msas well as the profile 1, 10, and 50 ms after the sourceinactivates. Beginning with the 10-ms Ca2+ profile, calcu-
0.4
0.3 t Ms
j. 0.2
0.1
10-i 10° 10I 102o0 (pA)
FIGURE 6 E(R, 1 ms) and E(0, 10 ms) for AR = 1 am calculated asa function of source amplitude (0.01-100 pA); other parameters are as
lations using the full and reduced model are nearly identical,even after the source inactivates.We have also used the full and reduced models to exam-
ine the effect of Ca2+ indicator dye on the spatiotemporalprofile of a simulated puff. The "puff' in Fig. 7, C and D,is identical with that in Fig. 7, A and B, except for theaddition of 50 ,M exogenous mobile Ca2+ buffer withparameters (ke = 200 ,uM- 1 s- l, and kej = 600 s- 1, Ke of0.3 ,uM) chosen to approximate Ca2+ Green-I (see Table1), a high-affinity Ca2+ indicator dye that has been used toimage Ca2+ puffs (Yao et al., 1995). Comparison of thesesimulations shows that Ca2+ Green-1 restricts the maximumsize of the Ca2+ domain formed during the puff event. Forexample, in the absence of exogenous buffer, the radius ofthe region above 1 ,M at 50 ms is 1.8 ,um (Fig. 7 A), butin the presence of Ca2+ Green-i, this radius decreases to 1.0,um. Another effect of the indicator dye is apparent after thesource has been inactivated. Comparison of the bottommosttraces of Fig. 7, B and D, reveals that the presence ofhigh-affinity exogenous mobile buffer facilitates clearanceof Ca2+. Indeed, 50 ms after the puff has inactivated (bot-tommost trace in Fig. 7, D and F), there is an order ofmagnitude difference between the Ca2+ concentration pre-dicted in the presence and absence of Ca2+ indicator dye.Note that although the effect of the Ca2+ indicator dye islarge, the consequence of its addition is predicted by thereduced model as well as the full model. In spite of the lowdissociation constant for Ca2+ Green-i (Ke = 0.3 ,uM), therapid buffering approximation is excellent, given the mod-erate concentration of exogenous mobile buffer present inthe simulation.A reduced model calculation is a theoretical approxima-
tion to the "correct result," i.e., the full model calculation.The rapid buffering approximation, however, is differentfrom applying the assumption of equilibrium to "back-calculate" [Ca2+] from an experimentally obtained fluores-cence signal (Grynkiewicz et al., 1985). The inadequacy of"back-calculation" can be seen in Fig. 7, E and F, where thefull model calculation (same as Fig. 7, C and D) is com-pared to the "back-calculated" Ca2+ profiles derived fromthe exogenous, bound Ca2+ indicator (CaBe) profile of thefull model, assuming that Ca2+ is in equilibrium with dye ateach point in space. As can be seen in Fig. 7, E and F, theseback-calculated Ca2+ profiles underestimate the actual[Ca2+], especially when the source is on. This discrepancycan be attributed to the fact that the indicator dye remainsout of equilibrium with Ca2+ throughout the duration of thepuff. Although the rapid buffering approximation and back-calculation utilize the assumption of equilibrium, the rapidbuffering approximation gives results closer to the fullmodel than the back-calculated Ca2+ profile. It is interestingto note that back-calculation from the concentration ofbound dye improves considerably when the dye is immo-bilized (not shown), suggesting that fluorescent dyes con-jugated to macromolecules such as dextran should providemore accurate estimates of punctate [Ca2+]. These obser-vations imply that when calculations of localized Ca2?
2534 Biophysical Joumal
in Fig. 1.

Validity of Rapid Buffering Approximation
FIGURE 7 Full model (solid lines),reduced model (dotted lines), and back-calculated (dot-dashed lines) simulationsof Ca21 puffs in the absence (A, B) orpresence (C-F) of exogenous Ca2' indi-cator dye. A 5-pA source representing asingle Ca2+ release site is turned on at t= 0 and turned off at t = 50 ms. (A, C,and E) Ca21 profiles at 1, 10, and 50 ms.(B, D, and F) Ca21 profiles at 50, 51, 60,and 100 ms. (A, B) [BS]T = 250 ,uM;[Bm]T = 50 ,uM; ks = km = 103 s-'; k's
k+ = 102 ,M-I s-'. (C, D)SameasA and B, with exogenous dye parame-ters: [BelT = 50 ,uM; ke = 200 s; ke=600 ,uM-l S-1; De =75 gMm2 S-1. (E,F) Dot-dashed lines are the [Ca2+] pro-file back-calculated from the full modelcalculation of Ca2' bound to indicatordye, i.e., the [Ca21] that would be inequilibrium with the [CaBe] profile (notshown) of C and D. For comparison, the[Ca2+] profile as calculated by the fullmodel (solid lines) is shown again.
104
103
2 102I--
eF 101cu2 0°
104
1 030 102
F 101°1V"10
[Be]T = °
full & reduced
0.0 0.5r (gm)
[Be]T = 50 jiMfull & reduced
1.0 0.0 0.5r (gm)
[BJT = 50 ,uMfull & back-calculated
1.0 0.0 0.5r (gm)
domains are related to experimental results, iito compare the theoretical CaBe profile direcfluorescence measurement.
Fig. 8 shows a time series of coarse-grareduced model calculations, both with and wdicator dye Ca2' Green-i. This figure iscalculations like those in Fig. 7 and includes a
the coarse-grained, back-calculated Ca2+ pro
ison of the full model calculations (solid linethe indicator dye decreases the coarse-graine(mentally observable) Ca2+ concentration thduration of the puff event, especially whenactive. In addition, this figure shows that givition of current Ca21 measurements (AR =
maximum error of the rapid buffering approxi]the time course of the puff is approximately
40
30
20
10
0
0 20 40 60Time (ms)
FIGURE 8 [Ca21](0, t) coarse grained with AR = 1Ilations presented in Fig. 7. The uppermost reduced (dot,(solid line) model calculations do not include Ca2+ ircorrespond to Fig. 7, A and B. The middle two traces inCa2+ dye and correspond to Fig. 7, C and D. The lowertrace is the back-calculated Ca2+ profile corresponding tc
t is preferable the attenuation of the Ca21 profile caused by the indicatortly to the raw dye itself (23%), and quite small compared to the error
accrued through back-calculation of Ca2+ concentrationslned full and from fluorescence data (67%).iithout the in- We have also investigated the validity of the rapid buff-derived from ering approximation in simulations of the Ca2+ domain near
time series of an open channel with a unitary current of 0.1 pA. Thisofile. Compar- 50-fold reduction in source strength compared to Fig. 1 is?s) shows that meant to simulate an isolated L-type Ca2+ channel, whereasI (i.e., experi- the other parameters used here are identical to those of Fig.iroughout the 1. The top two traces in Fig. 9 A show the full and reducedthe source is model calculation of the Ca2+ domain at high spatial reso-
en the resolu- lution. Even on this finer spatial scale, the reduced and full=1 ,um), the model calculations are in qualitative agreement (for quan-
mation during titative comparison of the coarse-grained error, see Fig. 6).6%, less than Although the rapid buffering approximation works well
at physiologically realistic concentrations of buffers, it isnot a good approximation when extremely high concentra-tions of exogenous buffers are present. This is shown in thebottom two traces in Fig. 9 A, which are identical to the toptwo traces, except that 1 mM exogenous buffer (ke = 90-I and k+ = 600 pkM-1 s-1), chosen to approximateBAPTA (Stem, 1992; Zweifach and Lewis, 1995; see Table1), is included in the simulation. Whereas the full modelcalculation correctly predicts the restricted Ca2+ domainformed in the presence of 1 mM BAPTA, the reduced modelseverely underestimates the Ca2+ concentration throughout
80 100 the region of interest. Millimolar concentrations of exoge-nous mobile buffer dramatically increase the Ca2+ gradientnear the source; consequently, the rapid buffering approxi-
fm for the simu- mation fails in spite of the fact that BAPTA is a relatively'ted line) and full fast Ca2+ buffer (cf. Eq. 12).
ndicator dye and
The reason for this can be seen by comparing the rapidclude exogenous
most, dot-dashed buffering approximation with an analytical expression pre-D Fig. 7, E and F. sented by Neher (1986) for the steady-state free Ca2+ con-
1.0
Smith et al. 2535

Volume 70 June 1996
The conditions for the validity of Eq. 16 are precisely thosefor which the rapid buffering approximation is least valid.Indeed, at high concentrations the condition for the validityof the rapid buffering approximation in Eq. 12, as applied tothe exogenous buffer, becomes
0.25 0.50r (nm)
)3 [B.], = ° (Full)
2 B 10 mM EGTA (Full)--- 10mM EGTA (Neher)--10 mM BAPTA (Full)
)I - 10 mMBAPTA(Neher
0.00 0.25 0.50r (nm)
0.025 0.050
r (pm)
FIGURE 9 Full model calculations of the microscopic Ca2' domainhypothesized to form near an open Ca2e channel with a conductance of 0.1pA. Parameters are the same as in Fig. 1 A, except At = 2.5 X 10⁻⁸ s, Ar= 5 nm, and R, = 4 Am. (A) Full (solid line) and reduced (dashed line)model calculations of the Ca2e domain in the presence (bottom two traces)and absence (top two traces) of 1 mM BAPTA. Parameters used forBAPTA are k, = 90 s-', ke+ = 600 ,gM-' s-', K, = 0.15 ,M, and to =1 ms. All other parameters are the same as in Fig. 1. (B) Ca2' domainpredicted in the presence of 10 mM EGTA (dotted line), 10 mM BAPTA(long-dashed line), and no exogenous buffer (solid line). Parameters usedfor EGTA are kj- = 0.225 s-', k.+ = 1.5 pM-' s-', K,, = 0.15 ,uM, andto = 10 ms. Other parameters are as in A, except that endogenous bufferswere not included in the BAPTA and EGTA simulations, so that they maybe directly compared to the corresponding steady-state approximations(short-dashed and dot-dashed lines) given by Eq. 16. (C) The Ca2+ domainin the case of 10 mM BAPTA at to = 0.001, 0.01, 0.1, 1, and 10 ,;s. Otherparameters are as in A.
centration ([Ca2+],,) near a single channel. That expression,which is valid for small source amplitude and unsaturatable(high concentrations of) mobile buffer, is
C_r_ -rr/A,[Ca2+]ss(r) 27rDcre (16)
where
(17)A[BeIT
1 L2
ke+[Be]T Dc'
which is not satisfied when A = L, the length characteristicof the spatial profile of Ca2+. Thus the rapid bufferingapproximation breaks down because of the steep gradientsthat occur at high concentrations of exogenous mobile buff-er-making it necessary to use the full equations.
Fig. 9 B presents full model calculations of the Ca2+domain formed near a 0.1-pA source in the presence of 10mM EGTA (short dashed line), 10 mM BAPTA (longdashed line), and no exogenous buffer (solid line). Param-eters were chosen to approximate a slow, EGTA-like buffer(kej = 0.225 s-1 and ke+ = 1.5 AM-' s-1; Stem, 1992;Zweifach and Lewis, 1995; see Table 1) with the samedissociation constant as BAPTA (Ke = 0.15 ,uM). Compar-ison between the calculations in Fig. 9 B shows that theCa2+ domain is greatly restricted in the presence of 10 mMBAPTA, but only slightly restricted by 10 mM EGTA(Stem, 1992). In addition, for both EGTA (A = 129 am) andBAPTA (A = 6.5 nm), Neher's approximation of thesteady-state Ca2+ profile (dotted lines) only slightly under-estimates the extent of the Ca2+ domain. Our calculationsalso agree with previous calculations showing that Ca2+domains form extremely rapidly (Fogelson and Zucker,1985). Fig. 9 C shows a Ca2+ domain in the presence of 10mM BAPTA at 0.001, 0.01, 0.1, 1, and 10 ,us, with evengreater spatial resolution than Fig. 9 A. The fact that the10-,us profile is barely distinguishable from the 1-,us profileshows that a dynamic steady state in Ca2+ concentration isachieved 1 ,us after the channel activates.
DISCUSSION
Our simulations show that the rapid buffering approxima-tion provides reasonable estimates of Ca2+ concentrationsnear open Ca2+ channels on time scales that are comparableto the equilibration times for Ca2+ buffers. For endogenousbuffers with representative equilibration times of a fewmilliseconds, this means that Ca2+ domains calculated withthe rapid buffering approximation are correct semiquantita-tively, even on a distance scale of a micron within a milli-second or so after a release site or channel has activated,whereas after 10 ms the rapid buffering approximation isnearly exact on this distance scale. We have verified this formoderate total buffer concentrations (300 jM) that appearto be representative of the cytosol in a number of cell types.According to the results in Figs. 3 and 4, the rapid bufferingapproximation is better for stationary buffers or stationarybuffers in combination with modest concentrations of mo-bile buffers, in which case the errors in the space-averaged
103.102 F2
" 10
0.00(18)
ic
o.lC
~lO
10
i10+10
10
)4)3)2
)0
0.000
2536 Biophysical Journal

Validity of Rapid Buffering Approximation
(coarse-grained) [Ca2+] nearest the channel fall below 10%when the equilibration time of the buffers is exceeded.
These coarse-grained errors in reduced model calcula-tions adjacent to an open channel depend significantly onthe single-channel current. For a fixed concentration of totalbuffer, the rapid buffering approximation is better at eitherlow or high values of unitary current, the latter because thebuffer quickly saturates near the channel. Fig. 6 illustrates,however, that even for coarse-grained measurements onemust wait for the order of the equilibration times of thebuffer to reach errors of less than 10%. Our simulations ofthe disappearance of Ca2+ domains after a channel closesshow that the rapid buffering approximation is quite good,as long as the channel stays open longer than the equilibra-tion time. This remains true even in the presence of smallamounts of exogenous buffer, typical of those used in flu-orescence measurements.
It is not necessarily true, however, that one can "back-calculate" accurate instantaneous Ca2+ profiles from aknowledge of the fluorescence of exogenous dyes using thebuffer dissociation constant. Indeed, Figs. 7 E, 7 F, and 8show for both open and closed channels that the Ca21concentrations calculated in this fashion for a mobile dyefall well below those calculated via the full differentialequations. Although the accuracy of this procedure im-proves for immobile dyes, in the presence of large, nonsta-tionary Ca2+ gradients the equilibrium condition generallydoes not provide an accurate instantaneous relationship be-tween measured dye-bound Ca2+ and Ca21 concentrations.Indeed, the condition of equilibrium is strictly consistentonly when applied within the context of the kinetic equa-tions, i.e., as done in the rapid buffering approximation.This is an important caveat, because back-calculation iscustomarily used to estimate Ca2+ concentrations in fluo-rescence experiments.
At high concentrations of exogenous mobile buffers (10mM), whether fast equilibrating like BAPTA or slow likeEGTA, we have found that the rapid buffering approxima-tion does not yield accurate Ca2+ profiles. These high bufferconcentrations have been employed experimentally to ma-nipulate the size of Ca2+ domains hypothesized to formnear open Ca2+ channels (Zweifach and Lewis, 1995). Inthis parameter regime, the rapid buffering approximation isno longer valid. However, we have shown using the fullmodel that Neher's equation (Eq. 16), which has been usedto interpret such measurements, is a good approximation tothe steady-state Ca21 profile under these conditions.When can the rapid buffering approximation be used
for calculating time-dependent Ca2+ domains? The in-equality in Eq. 12 provides the basic criterion for assess-ing the validity of this approximation. Whether this in-equality holds depends on buffer equilibration times, theunitary current of the Ca2+ channel, the amount of mo-bile buffers, and the resolution required. Table 1, whichlists properties of several known mobile and stationaryendogenous buffers, can be used to estimate buffer prop-
hair cells, for example, calbindin-D28K is thought to existin millimolar concentrations (Roberts, 1993, 1994), andusing Eq. 12 we estimate an equilibration time of 0.5 ms.However, because calbindin-D28K is mobile (D = 30tLm2 s-1; see Table 1) and is present at such high con-centrations, the rapid buffering approximation breaksdown near a point source for the same reason that it doesfor millimolar concentrations of BAPTA (cf. Eq. 18).Even for equilibration times on the order of milliseconds,moderate concentrations of mobile buffer produce Ca21gradients that are too large for the rapid buffering ap-proximation on the millisecond time scale, whereas ifless time resolution is required, then the approximationmay be satisfactory. Similarly, larger unitary currentsproduce larger gradients, and one must wait longer forthe rapid buffering approximation to be valid. On theother hand, the rapid buffering approximation producesgood semiquantitative agreement for what are thought tobe typical cytosolic buffer concentrations in Xenopusoocytes (Allbritton et al., 1992; Wagner and Keizer,1994), cardiac myocytes (Berlin et al., 1994), gonado-trophs (Tse et al., 1994), and chromaffin cells (Zhou andNeher, 1993). Thus the rapid buffering approximationshould prove useful for understanding time-dependentCa2+ profiles in the cytosol and for estimating the prop-erties of Ca2+ "puffs" (Parker and Yao, 1991; Yao et al.,1995) and "sparks" (Cheng et al., 1993). Work alongthese lines is currently in progress.
APPENDIX: NUMERICAL SCHEME
The Laplacian operator simplifies in the case of spherical symmetry to
1(Ia1a a2 2 a
2 art ar -ar2 r ar'
the limit of which as r approaches zero can be shown by L'Hopital's ruleto be 3a2/0r2 (Smith, 1985; Crank, 1975). Thus we can write
3
(Ar)2 I
and
(20)
L(i) = rl( i1r)2[i+112([Ui+ [Ui) - f12(Uin Li-)]
(21)
for i > 0, where is an approximation to the function u(ri, t,), u
represents any of the species in Eqs. 2-5, ri = iAr, t,, = nAt, L(U ) is theapproximation to the Laplacian at the point (r,, t,) and we have used theboundary condition (cular)Ir,o = 0 in its discretized form, i17 = I17
(Smith, 1985). Using Eqs. 20 and 21, an explicit numerical scheme for thefull model that is second-order accurate in space and first-order accurate intime is given by
[P.+I - Er.t '= DUL(UE) + RXN(UV1),
At(22)
where D. is the diffusion constant for species u; RXN(U') denotes thecontribution of the appropriate reaction terms in Eqs. 2-5; L([CaBj]i) iserties when buffer concentrations are known. In saccular
Smith et al. 2537
(19)

2538 Biophysical Journal Volume 70 June 1996
always zero; and [BJ] is given by Eq. 6. Writing C(2 for the approximationto [Ca2+] at the point (ri, t,) an explicit numerical scheme for the reducedmodel that is second-order accurate in space and first-order accurate intime is given by
1 = 1(L(P )+ aio), (23)
where
Ks[Bs]T ___j_T_24_= (1 + 2 (Kj + Co '(4)
[BJ]TCOiPI=DcC EDjK i+ C (25)jKj + iO
j = m or e; and Sio, the Kronecker delta, is zero except at the origin. Therate of change in Ca2+ concentration at the origin due to the presence of thesource (o-), which appears explicitly in Eq. 23 and implicitly in Eq. 22,depends, of course, on the source strength, i.e.,
'ca= 2F' (26)
where ica is the current amplitude of the source (adjusted by a factor of 2),and F is Faraday's constant (F = 9.648 X 10⁴ coul mol- '). Using Eq. 26it can be seen that ica = 1 pA corresponds to o-, - 5.182 X 10⁻¹⁸ mol s-'.Because [Ca2+] represents the average Ca2+ concentration over a spherewith radius Ar/2 and a volume (V) of irAr3/6, the rate of change in [Ca2+]at the origin due to the presence of the source is
o 6i* (5.182 X 103pM s1) (7= V= sT(5r*~~~)3 (27)
where i* is the source strength measured in picoamps, and Ar* is thespatial step measured in micrometers.
Calculations were performed on a 100-MHz Silicon Graphics Indigoworkstation. Run time for the 1-ms simulation of the full model in Fig. 1A was 38 min (800 spatial mesh points, 105 time steps). The computationallabor per time step for the reduced model is 65% that of the full model. Inaddition, the explicit numerical scheme for the reduced model allows timesteps that are an order of magnitude or more greater than those possiblewith the full model. This efficiency of the reduced model compared to thefull model becomes even more significant in multidimensional calculationsand when implicit numerical schemes are employed.
This work was supported in part by funds from NSF grants BIR 9214381and BIR 9300799 and the Agricultural Experiment Station of UC Davis.GDS gratefully acknowledges fellowship support from the BiophysicsGraduate Group and from the Jastro Shields Foundation, and conversationswith M. D. White.
REFERENCES
Allbritton, N. L., T. Meyer, and L. Stryer. 1992. Range of messenger actionof Ca21 ion and inositol 1,4,5-trisphosphate. Science. 258:1812-1815.
Baimbridge, K. G., M. R. Celio, and J. H. Rogers. 1992. Ca2+-bindingproteins in the nervous system. Trends Neurosci. 15:303-308.
Berlin, J. R., J. W. M. Bassani, and D. M. Bers. 1994. Intrinsic cytosolicCa2' buffering properties of single rat cardiac myocytes. Biophys. J.67:1775-1787.
Bezprozvanny, I., and B. E. Ehrlich. 1994. 1P3-gated Ca21 channels fromcerebellum-conduction properties for divalent cations and regulationby intraluminal Ca2+. J. Gen. Physiol. 104:821-856.
Blatter, L. A., and W. G. Wier. 1990. Intracellular diffusion, binding, andcompartmentalization of fluorescent Ca21 indicators indo-I and fura-2.Biophys. J. 58:1491-1499.
Blumenfeld, H., L. Zablow, and B. Sabatini. 1992. Evaluation of cellularmechanisms for modulation of Ca21 transients using a mathematicalmodel of fura-2 Ca21 imaging in Aplysia sensory neurons. Biophys. J.63:1146-1164.
Cannell, M. B., H. Cheng, and W. J. Lederer. 1994. Spatial non-uniformities in [Ca2+]i during excitation-contraction coupling in cardiacmyocytes. Biophys. J. 67:1942-1956.
Cannell, M. B., H. Cheng, and W. J. Lederer. 1995. The control of Ca21release in heart muscle. Science. 268:1045-1049.
Carslaw, H. S., and J. C. Jaeger. 1959. Conduction of Heat in Solids, 2nded. Clarendon Press, Oxford.
Cheng, H., W. J. Lederer, and M. B. Cannell. 1993. Calcium sparks:elementary events underlying excitation-contraction coupling in heartmuscle. Science. 262:740-744.
Crank, J. 1975. The Mathematics of Diffusion, 2nd ed. Clarendon Press,Oxford.
de Leon, M., Y. Wang, L. Jones, E. Perez-Reyes, X. Wei, T. W. Soong,T. P. Snutch, and D. T. Yue. 1995. Essential Ca2e-binding motif forCa2+-sensitive inactivation of L-type Ca2+ channels. Science. 270:1502-1506.
Eberhard, M., and P. Eme. 1991. Calcium binding to fluorescent calciumindicators: calcium green, calcium orange and calcium crimson. Bio-chem. Biophys. Res. Commun. 180:209-215.
Eckert, R., and J. E. Chad. 1984. Inactivation of Ca21 channels. Biophys.MoL Bio. 44:215-267.
Falke, J. J., S. K. Drake, A. L. Hazard, and 0. B. Peersen. 1994. Moleculartuning of ion binding to Ca21 signaling proteins. Q. Rev. Biophys.27:219-290.
Fogelson, A., and R. Zucker. 1985. Presynaptic Ca2+ diffusion fromvarious arrays of single channels. Biophys. J. 48:1003-1017.
Grynkiewicz, G., M. Poenie, and R. Y. Tsien. 1985. A new generation ofCa21 indicators with greatly improved fluorescence properties. J. Bio.Chem. 260:3440-3450.
Heinemann, C., R. H. Chow, E. Neher, and R. Zucker. 1994. Kinetics ofthe secretory response in bovine chromaffin cells following flash pho-tolysis of caged Ca2+. Biophys. J. 67:2546-2557.
Heizmann, C. W., and W. Hunziker. 1991. Intracellular Ca2+-bindingproteins: more sites than insights. Trends Biochem. Sci. 16:98-103.
Jafri, M. S., and J. Keizer. 1995. On the roles of Ca2+ diffusion, Ca2+buffers, and the endoplasmic reticulum in IP3-induced Ca2+ waves.Biophys. J. 69:2139-2153.
Kao, J. P. Y. 1994. Practical aspects of measuring [Ca21] with fluorescentindicators. Methods Cell Bio. 40:155-181.
Koster, H. P. G., A. Hartog, C. H. Van Os, and R. J. M. Bindels. 1995.Calbindin-D28K facilitates cytosolic Ca2' diffusion without interferingwith Ca2+ signalling. Cell Calcium. 18:187-196.
Llinds, R., M. Sugimori, and R. B. Silver. 1992. Microdomains of highCa2+ concentration in a presynaptic terminal. Science. 256:677-679.
Neher, E. 1986. Concentration profiles of intracellular Ca2+ in the presenceof diffusible chelator. Exp. Brain Res. Ser. 14:80-96.
Neher, E., and G. Augustine. 1992. Calcium gradients and buffers inbovine chromaffin cells. J. Physiol. (Lond.). 450:273-301.
Nowycky, M. C., and M. J. Pinter. 1993. Time courses of Ca2+ andCa2+-bound buffers following Ca2+ influx in a model cell. Biophys. J.64:77-91.
Parker, I., and Y. Yao. 1991. Regenerative release of Ca21 from function-ally discrete subcellular stores by inositol trisphosphate. Proc. R. Soc.Lond. B Biol. 246:269-274.
Pethig, R., M. Kuhn, R. Payne, E. Adler, T.-H. Chen, and L. F. Jaffe. 1989.On the dissociation constants of BAPTA-type Ca2+ buffers. Cell Cal-cium. 10:491-498.
Post, J. A., and G. A. Langer. 1992. Sarcolemnmal Ca2' binding sites inheart. I. Molecular origin in "gas-dissected" sarcolemma. J. Membr.Biol. 129:49-57.
Roberts, W. M. 1993. Spatial Ca2+ buffering in saccular hair cells. Nature.363:74-76.

Smith et al. Validity of Rapid Buffering Approximation 2539
Roberts, W. M. 1994. Localization of Ca21 signals by a mobile Ca21buffer in frog saccular hair cells. J. Neurosci. 14:3246-3262.
Roberts, W. M., R. A. Jacobs, and A. J. Hudspeth. 1990. Colocalization ofion channels involved in frequency selectivity and synaptic transmissionat presynaptic active zones of hair cells. J. Neurosci. 10:3664-3684.
Sherman, A., J. Keizer, and J. Rinzel. 1990. Domain theory for Ca21inactivation of open Ca21 channels. Biophys. J. 58:985-995.
Simon, S. M., and R. Llinas. 1985. Compartmentalization of the submem-brane Ca2' activity during Ca2+ influx and its significance in transmitterrelease. Biophys. J. 48:485-498.
Smith, G. D. 1985. Numerical Solution of Partial Differential Equations:Finite Difference Methods. Oxford Applied Mathematics and Comput-ing Science Series, 3rd edition. Clarendon Press, Oxford.
Stem, M. D. 1992. Buffering of Ca21 in the vicinity of a channel pore. CellCalcium. 13:183-192.
Tse, A., F. W. Tse, and B. Hille. 1994. Calcium homeostasis in identifiedpituitary gonadotrophs. J. Physiol. (Lond.). 477:511-525.
Tsien, R. Y. 1980. New Ca21 indicators and buffers with high selectivityagainst magnesium and protons: design, synthesis, and properties ofprototype structures. Biochemistry. 19:2396-2404.
Tsien, R. Y. 1989. Intracellular measurements of ion activities. Annu. Rev.Biophys. Bioeng. 12:227-253.
Tsugorka, A., E. Rfos, and L. A. Blatter. 1995. Imaging elementary eventsof Ca2' release in skeletal muscle cells. Science. 269:1723-1726.
Wagner, J., and J. Keizer. 1994. Effects of rapid buffers on Ca2' diffusionand Ca21 oscillations. Biophys. J. 67:447-456.
Yao, Y., J. Choi, and I. Parker. 1995. Quantal puffs of intracellular Ca21evoked by IP3 in Xenopus oocytes. J. Physiol. (Lond.). 482:533-553.
Zhou, Z. A., and E. Neher. 1993. Mobile and immobile Ca2+ buffers inbovine adrenal chromaffin cells. J. Physiol. (Lond.). 469:245-273.
Zweifach, A. Z., and R. S. Lewis. 1995. Rapid inactivation of depletion-activated Ca21 current (ICRAC) due to local Ca21 feedback. J. Gen.Physiol. 105:209-206.