VALIDITY OF THE IUPUI PLACEMENT TEST SCORES FOR COURSE PLACEMENT: 1997-1998
50
Placement Validity Report: 1997/98 VALIDITY OF THE IUPUI PLACEMENT TEST SCORES FOR COURSE PLACEMENT: 1997-1998 Howard R. Mzumara, Ph.D. Testing Center and School of Education Mark D. Shermis, Ph.D. Testing Center and Department of Psychology Marc H. Fogel, BA Testing Center and Department of Psychology Indiana University Purdue University Indianapolis 620 Union Drive, Suite G003 Indianapolis, IN 46202-5167 317-274-2620 November 1998
Transcript of VALIDITY OF THE IUPUI PLACEMENT TEST SCORES FOR COURSE PLACEMENT: 1997-1998
Placement Validity Report: 1997/98
VALIDITY OF THE IUPUI PLACEMENT TEST SCORES
FOR COURSE PLACEMENT: 1997-1998
Howard R. Mzumara, Ph.D.
Testing Center and School of Education
Mark D. Shermis, Ph.D.
Testing Center and Department of Psychology
Marc H. Fogel, BA
Testing Center and Department of Psychology
Indiana University Purdue University Indianapolis
620 Union Drive, Suite G003
Indianapolis, IN 46202-5167
317-274-2620
November 1998

Placement Validity Report: 1997/98 2
Executive Summary
This annual report addresses a variety of issues regarding the
undergraduate placement tests that are mandated for all entering
students at IUPUI. Several improvements to the placement testing
process were implemented by the academic departments recently, cutoff
score modifications to the computerized adaptive math placement test and
an experimental procedure for the computerized assessment of writing
samples to be used with the high school testing activities (Shermis,
Mzumara, Harrington, & Olson, 1998). Moreover, beginning with last
year's report, new graphs have been incorporated that indicate the
probability of success for a student who achieves a given placement test
score (Noble & Sawyer, 1997). Our hope is that these new
interpretational aids will provide some additional help to counselors
and other academic advisors looking to use the placement tests as one
source of information in guiding the student to an appropriate course.
The evaluation of the computerized adaptive math test involved
samples drawn from fall of 1997. An adaptive test is one that conforms
to the ability level of the examinee. Several studies have shown this
type of test to be just as reliable as the older non-adaptive test, even
though it averages to be 30-50% shorter. Our own exit surveys also
suggest that students like the adaptive tests because they are neither
too difficult or too easy. Moreover, the computerized adaptive test,
which consists of an item bank of 168 items, addresses security concerns
in that each student essentially takes a different form of the test.
The placement validity coefficients for this test, calculated on the
relationship between the placement test results and a score on a common
final, averaged r = .38 which makes it a very useful predictor and a

Placement Validity Report: 1997/98 3
significant improvement over the last several years. The Department of
Mathematical Sciences, working with the Testing Center, recently made
recommendations to improve the predictive validity of the test,
especially for higher level courses. Implementation of these
recommendations began in mid-fall 1997 and this work is currently
underway. Placement graphs for mathematics are included in this report.
The Indiana-Purdue Computerized Reading Test is modeled after the
Nelson-Denny Reading Test, a nationally recognized assessment that is
used for placement purposes. This test has been evaluated on a number
of psychometric dimensions and has been demonstrated to have good
reliability and validity (Shermis, Wolting, & Lombard, 1996). The
advantage of the computerized test is that it can be easily scored and
interpreted. Because only those who score low on the test are required
to take a reading course higher scorers are “exempt” from a reading
requirement, the sample drawn from Fall 1997 is homogeneous and tends to
underestimate the predictive validity coefficient. In spite of this
statistical anomaly, the predictive validity coefficient, based on the
placement test and score on the Nelson-Denny Form H), averaged about r =
.25 and is considered to be useful. Plans are currently underway to
make this test computerized adaptive as well. Placement graphs for
reading are included in this report.
The English written assessment is a writing sample of
approximately 500 words generated in response to a prompt. The response
not only asks the examinee to address a topic, but also to defend the
answer in a thoughtful way. The essay is scored by one or two raters
from the English Department, and a placement recommendation is made.
While the rating scale used by the department has sufficient variance
Placement Validity Report: 1997/98 4
for a good validity assessment, the fact that the outcome measure is
based on grades tends to underestimate the true relationship between the
two variables. The placement validity coefficient for a sample drawn
from Fall of 1997 averaged in the mid-teens, but still useful for
placement purposes. The department is currently investigating
alternative measures that might be used as predictor variables. For
instance, the department is evaluating the possibility of using
portfolios as an alternative for one writing sample. In the interim,
the English department has approved the use of typing (rather than
writing) exam responses as a way to accommodate students’ preferences
and writing habits (Harrington, Shermis, & Rollins, 1997).
A few other developments are worth mentioning. In the spring of
1998, the Registrar’s Office implemented a new “barring” system that
will permit departments to enforce course and placement testing pre-
requisites. That is, students are not permitted to enroll in courses
for which they lack the minimum requirements without authorization. The
creation of this new technology is an outgrowth of compliance problems
which began a few years ago when a counselor’s signature was no longer
required for registration.
Shermis and Mzumara (1996) obtained an SDC grant to implement the
IUPUI placement tests at designated local area high schools, IUPUI
distance learning locations, and Ivy Tech. The pilot work for the grant
was completed during summer of 1996 in Pike Township. The main
technological development has been the implementation of the tests over
the world wide web (Shermis, Mzumara, Lillig, & Brown, 1997; Shermis,
Mzumara, Olson, & Harrington, 1998). Currently, the Web-based placement
testing project has been expanded to include about seven area high
Placement Validity Report: 1997/98 5
schools. One outgrowth of this program has been a large-scale
assessment of Project Essay Grade (PEG) – an automated grading system
for written work (Page & Peterson, 1996). The assessment, which
included samples drawn from both college and high school populations,
resulted in agreement coefficients that were as good as those obtained
by human raters alone. Remarkably, scores on the written work can be
obtained in a matter of seconds. Interested readers can try out this
new technology at the PEG Demo site: http://134.68.49.185/pegdemo/.
Also, it is interesting to note that preliminary results of the
correlation analysis between PEG scores and English course grades (for
IUPUI students) are statistically significant ( r = .25, n = 237, p <
.01), indicating an improvement in validity coefficients over those for
the conventional English placement test scores.

Placement Validity Report: 1997/98 6
Introduction
The present study was designed to assess the validity of placement
test scores in making placement decisions at Indiana University Purdue
University Indianapolis (IUPUI) for the Fall 1997 semester. Placing new
students into appropriate first year courses has become an increasingly
challenging task for colleges and universities. Also, the percentage of
postsecondary institutions with some form of placement and developmental
instruction has steadily increased in the past decade and is now about
90% (Sawyer, 1996). In a recent survey on Remedial Education in Higher
Education Institutions, conducted by the National Center for Education
Statistics (NCES), about three-quarters (78 percent) of higher education
institutions that enrolled freshmen offered at least one developmental
reading, writing, or mathematics course in Fall 1995 (NCES, October
1996).
A cursory review of the literature (Sawyer, 1996, and the
references cited therein) offers two potential explanations for the
increase in placement and developmental instruction. “One suggested
explanation is that American high schools have become less effective in
preparing students for college” (Carnegie Foundation for the Advancement
of Teaching, 1988; National Commission on Excellence in Education, 1983;
Singal, 1991, as cited in Sawyer, 1996, p. 271). A second explanation
is that more students from disadvantaged backgrounds are attending
higher education institutions (College Entrance Examination Board, 1977;
Munday, 1976, as cited in Sawyer, 1996).
In placement decisions, the concern of the institution is to
create learning environments in which all students will learn. Hills,

Placement Validity Report: 1997/98 7
Hirsch, and Subhiyah (1990) define placement as a process by which
students are assigned to courses commensurate with their past
achievements in order to facilitate expeditious further learning. “The
underlying idea is that students differ. They may differ in their level
of preparation, in their adeptness at learning, in their interests, in
their ability to organize for themselves, and so on. As a result, for
efficient instruction, one arranges for different approaches for the
different students or groups of students. Ideally, a student is placed
in the learning situation which is best for him” (Hills, Hirsch, &
Subhiyah, 1990, p.5). Accordingly, IUPUI has implemented a mandatory
placement testing program for all undergraduate students in order to
facilitate the academic success of students at the University.
The IUPUI placement tests were developed for the purpose of course
placement (i.e., matching students with instruction appropriate to their
academic preparation) in English (writing), mathematics, and reading.
Thus, like most other higher education institutions (NCES, October
1996), IUPUI provides developmental courses in reading, writing, and
mathematics. Generally speaking, developmental courses are provided to
those college students lacking in academic skills necessary to perform
college-level work at the level required by the institution (NCES,
October 1996). Although what constitutes developmental courses varies
from institution to institution, often developmental courses do not
carry credit toward satisfying degree requirements.
In general, the rationale for placement testing is threefold:
First, students who enroll in appropriate university courses should have
a more positive experience than those who enroll in courses that are
either too difficult or too easy. They should be more satisfied with

Placement Validity Report: 1997/98 8
their university experience, and thus more likely to be retained.
Second, because students are more likely to be retained in classes that
are appropriate to their ability level, departmental administrators can
more carefully plan how best to allocate faculty resources to respective
class sections. Finally, the placement tests might serve as a basis for
assessing the contributions of the University to the development of
general educational skills. If placement tests perform the three vital
functions well, then University funds spent on these assessments are
wisely expended. A brief description of the major IUPUI placement tests
follows.
Mathematics Placement Exam. The mathematics placement
examination was designed to assess students’ college-level mathematics
readiness skills upon admission into IUPUI. The mathematics exam used
in the present study was a computerized adaptive test which consists of
168 objective items that assess skills ranging from pre-algebra to
introductory calculus. The total placement score on the mathematics
test ranged from 6 (lowest score) to 40 (highest possible score), and
represents a student’s ability level in mathematics. For placement
purposes, students who scored 6 on the test were advised to take
Mathematics M010 (Pre-Algebra), a developmental mathematics course.
Students who scored between 7 and 14 on the mathematics placement test
were advised to take Mathematics 001 (Introduction to Algebra).
Students who scored between 15 and 23 on the mathematics test received a
placement recommendation of Mathematics 111 (Algebra). Students with
scores between 24 and 40 were advised into a variety of mathematics
course offerings, depending on their academic major. Based on this
assessment, therefore, placement is made into an appropriate mathematics
Placement Validity Report: 1997/98 9
class1. Mathematics placement test scores are valid for one year from
the test date.
Reading Placement Exam. The computerized reading placement
exam used in the present study is an objective reading assessment
consisting of five parts: reading rate, comprehension, and three
different types of vocabulary tests (Word Attack, Words in Context, and
Words in Isolation). The purpose of this test was to assess students’
vocabulary and reading comprehension skills upon entry into IUPUI.
Based on this test, a student’s eligibility for university reading
requirements or the need for reading improvement was determined. The
total reading score ranged from 0 to 170, and indicates a weighted raw
score composite. Students who scored between 0 and 52 were asked to
contact the Office of Admissions for counseling and placement. Students
who scored between 53 and 68 were advised to enroll in Education X150,
and a score of 68 to 79 resulted in a placement recommendation for
Education X152. Students who obtained a score equal to or greater than
80 were exempt from further requirements in reading skill development.
Thus, students who read at college level were exempt from taking the
developmental reading classes. Reading placement test scores are valid
for one year from the test date.
English Placement Exam. The English placement exam is a one-
hour exam that asks students to write an essay that explains and
supports their opinion on a current social issue. The test provides a
brief explanation of the issue or the context in which the issue is
posed. Students are also asked to evaluate their answer and explain
what changes they might make, had they the time to do so. When readers
1 Effective October 1, 1998, new math cutoff scores were implemented.

Placement Validity Report: 1997/98 10
assess the English placement tests, they look for presence or absence of
organization, support, development, and the student’s position on the
issue presented. Students who need extra help focusing their essays
around a major theme, or students who need extra help understanding the
relationship between assertion and support, are placed into an
appropriate developmental course.
The purpose of the English placement exam is to assess students’
ability to write an essay that explains and supports one’s viewpoint or
opinion on a given issue. Examinees have a choice of two questions,
each of which allows the students to use their personal experiences
and/or observations in writing the essay. It is important that the test
conveys not only the examinee’s viewpoint on the selected topic, but
also the reasons for taking a particular position. The test, however,
does not require any specialized knowledge or research, only an ability
to discuss an individual’s opinion and reasons. Within the one hour
time allotted to the English placement test, students are expected to
(a) think seriously about the topic selected, (b) state an opinion
clearly, (c) present examples or details that support an opinion, and
(d) organize the essay clearly. The English test score is valid for two
years from the test date. Students are required to register for the
respective courses into which they are placed [i.e., W001 - Fundamentals
of English; W131 - Elementary Composition; or W140 - an honors version
of W131].
Changes Made in the Past Year
This section provides a brief description of the on-going efforts
in daily and quality improvements made in the placement testing program.
Placement Validity Report: 1997/98 11
The changes are based on the recommendations outlined in the previous
placement validity reports (cf. Mzumara, Shermis, Dossinger, & Olson,
1997; Mzumara, Shermis, & Wimer, 1996). For the correlation approach,
both mathematics and reading courses continue to use alternate outcome
variables (i.e., final exam scores) as opposed to the traditional
variable of “grade”, which was problematical because of the truncated
scale. Partly due to the restricted range, correlation coefficients in
mathematics using course grades as the outcome were in the low .20s; and
reading correlations were close to zero when course grades of
“pass/fail” were employed as outcome measures. As the mathematics
department faculty continue to use a common final exam, this criterion
has provided an appropriate supplement to course grades. Similarly,
since reading instructors administer the Nelson-Denny Reading Test Form
H (RD004) as a post-test at the end of each semester, the total reading
score has provided a convenient outcome replacement.
The second recommendation was that the Testing Center (in
conjuction with the Mathematics Department) consider revising the
adaptive mathematics test to closely match the department’s curriculum
and improve course placement, particularly in upper level mathematics
courses. Efforts to make quality improvements in the mathematics
placement test have been on-going since the full implementation of the
test took place in late October 1995. Recent developments in the CAT
mathematics placement test have focused on increasing test items and/or
revising the current item bank, development of testlets , improved
reporting of mathematics test scores including sub-scores (for
testlets), and revision of cutoff scores for course placement.
Placement Validity Report: 1997/98 12
We hope the current efforts will improve the predictive validity
of the mathematics test, particularly for higher level courses.
Preliminary results from the work done to date indicate that the
adaptive mathematics test is quite promising as a placement instrument.
In particular, our own placement test exit surveys suggest that students
like the computerized adaptive tests because they are neither too
difficult nor too easy. Detailed results of the exit surveys are
summarized in the Testing Center’s 1997 annual report (which is
available on-line at the Testing Center’s Web site:
http://assessment.iupui.edu/report/report.html ). The results of the
present study, therefore, should indicate how well the current adaptive
mathematics test is working, particularly with respect to efficiency and
precision of forecasts on student performance on the mathematics outcome
measures.
The third recommendation was that the reading faculty consider
developing an in-house computerized test that would eventually
incorporate both adaptive and diagnostic features. While there was no
widespread dissatisfaction among counselors with the Nelson-Denny
Reading Test, the near zero predictive validity coefficients coupled
with the cumbersome test administration suggested that an assessment
more closely linked to the curriculum was appropriate. Development of
the adaptive reading placement test is currently underway, and it is
expected that this work will be completed early next year. The vision
for the reading test is that the adaptive version would perform as a
placement test for all students, but would transform into a diagnostic
procedure for those who were recommended for developmental coursework.

Placement Validity Report: 1997/98 13
Detailed information about the reading placement test is reported in
Shermis, Wolting, & Lombard, 1996.
Method
Sample
The target population comprised all students who took either an
English, mathematics, or reading placement test from January, 1997,
through August, 1997, and enrolled in an English writing, mathematics
or reading course during the Fall 1997 semester at IUPU’s Indianapolis
campus. (Note that students with incomplete and/or missing course
grades were excluded from the present study.)
Procedure for Obtaining the Data
Students’ raw data were obtained through a FOCUS query (and/or
from students’ academic records provided by the respective course
coordinators) from the Fall 1997 cohort of students who took the
placement tests and subsequently enrolled in a mathematics, reading or
English course during Fall 1997 or Spring 1998 semester. Because the
IUPUI placement tests are seen as advisory2 rather than prescriptive, in
some cases a student enrolled in a course that was not recommended by
the placement test score. Consequently, for the purpose of statistical
analyses, students were divided into two categories, namely, “compliant”
and “non-compliant.” The compliant group comprised students who took
the recommended courses based on the placement test scores. The non-
compliant group consisted of students who chose (sometimes in
consultation with their advisors) not to take the recommended course.

Placement Validity Report: 1997/98 14
The current extract resulted in a pool of 2507 students for mathematics,
464 students for reading3, and 1344 students for the English (written)
essay. With respect to compliance, there were 2038 students who took
the mathematics placement exam and then enrolled in a recommended
mathematics M010, Math 001, Math 111 or a higher class during the Fall
of 1997. Likewise, 438 students took the computerized reading test and
then enrolled appropriately in either Education X150 or Education X152.
(Note that the sample for reading excluded students who took the Nelson-
Denny Reading Test Form G.) With respect to English, there were 1289
students who took the English placement exam and then enrolled in one of
the following recommended courses of interest: W001, W131, or W140.
Overall, the total compliance rates (based on the available data) were
81% for mathematics, 94% for reading, and 95% for English. Though
slightly lower than the 1996/97 rates, the current compliance rates are
still much higher than those obtained for the 1994/95 and 1995/96
academic years.
Research Design and Data Analysis
The present study employed some aspects of decision theory models
(Sawyer, 1996; Noble & Sawyer, 1997) and logistic regression techniques
(Hosmer & Lemeshow; 1989; Norusis/SPSS Inc., 1992) to provide validity
evidence for course placement criteria. Also, simple correlation and
regression analyses were used to demonstrate the relationship between
predictor scores and outcome variables. It is noteworthy that most
2The English Department views the placement test results as prescriptive rather than advisory, although it doesoffer an appeal process for students who wish to challenge their placements.3Students whose total reading score was equal to or less than 52 or 80 and above onthe computerized reading test, were excluded from the present study.

Placement Validity Report: 1997/98 15
college placement exams have correlations that run between .20 to .40
(cf. Hills, Hirsch, & Subhiyah, 1990).
The predictor variables consisted of students’ placement exam
scores on mathematics, reading, and English, respectively. The outcome
measures were the corresponding exam scores and/or course grades in the
respective content areas. The rationale for the validation/research
design was as follows. To the extent that the usefulness of a placement
test depends on the existence of statistical relationships, such
evidence is clearly essential to validation. Thus, by measuring the
strength of this statistical relationship, we obtained evidence on the
validity of the placement test scores for making course placement
recommendations. (Note that the present study employed the logistic
regression model in validating the IUPUI course placement tests.)
The primary criterion measure for mathematics comprised final
examination scores and/or grades based on a common final exam. The
secondary outcome variable for mathematics consisted of the course grade
obtained by the student at the end of the Fall semester. The
mathematics grades ranged from “A+” to “F”. For purposes of correlation
analyses, the letter grades were converted to a numeric scale ranging
from 4.33 for an “A+” to 0.33 for an “F”.
The primary outcome variable for reading consisted of the total
reading score received by a student on Form H of the Nelson-Denny
Reading Test. The predictor variable for reading comprised students’
placement test scores based on the IUPUI computerized reading test. For
reading courses, letter grades ranging from “A+” to “F” were obtained.
For purposes of conducting correlation analyses, however, the letter
grades were converted to numeric scores ranging from 4.33 for “A+” to

Placement Validity Report: 1997/98 16
0.33 for “F”. (Note that instructors do not give a grade of “D” in the
EDUC X150 or X152 courses, thereby restricting the range of the
secondary outcome measures. Furthermore, students who withdrew from
either Education X150 or X152 course were excluded from the correlation
analyses.)
The outcome variable for English was the course grade obtained at
the end of the fall semester. English grades ranged from “A+” to “F”.
For purposes of calculating correlation coefficients, the letter grades
were converted to a numeric scale ranging from 4.33 for “A+” to 0.33 for
“F”. Students who withdrew from courses of interest were excluded only
from the correlation analyses.
The present study attempted to provide two major types of validity
information. First, probabilities of success were estimated from
logistic regression and frequency distributions of scores on the
placement measures to determine the effectiveness of the course
placement criteria. Probability graphs were then developed to provide
graphical illustrations of the relationship between placement test
scores and predicted first-year college performance in English,
mathematics, and reading, respectively. Second, simple correlation
analyses were conducted to obtain coefficients among all the variables
studied (i.e., predictor and outcome measures). The intercorrelations
(validity coefficients) between the predictors and each outcome measure
indicated how the predictors were working, but did not provide a means
of making specific predictions for individuals. This was accomplished
with the prediction equations, which were essentially the product of
logistic regression analyses. In essence, the prediction equations used
one variable (i.e., the respective placement test scores) to predict an

Placement Validity Report: 1997/98 17
outcome. This information, however, did not indicate how effective the
predictions were. Thus, estimates of measurement error in prediction
(i.e., standard errors of estimate) were computed. The results of
fitting logistic regression models to the respective data are reported
in subsequent tables (see Tables B.1 – B.7 in Appendix B).
Probability of Success
The statistical relationship between students’ outcomes (i.e., a
course grade of, say, “C” or higher) and their placement test scores was
estimated using logistic regression. (Details regarding logistic
regression are presented in Appendix A.) The relationship was estimated
from the data of students who actually took a placement test and
subsequently enrolled and completed the respective course(s) during Fall
1997 semester. For each placement test score, a corresponding
probability of success was estimated. The outcome variable used a 0/1
(unsuccessful/successful) criterion measure. (Note that for logistic
regression purposes, “FX” grades and withdrawals (“Ws”) were considered
as unsuccessful outcomes, without necessarily converting them to “F”
grades). For purposes of this study, the criterion variable was
generally defined as a grade of “C” or higher (2.0 or higher). However,
probabilities of success were also estimated for grades of “B” or higher
and “A-” or higher, respectively.
Results
The basic course placement procedure applied at IUPUI is mostly
dependent upon students’ academic achievement, as measured by the
Placement Validity Report: 1997/98 18
placement tests in English, mathematics, and reading, respectively. The
manner in which placement decisions are made has been described in the
Introduction section. Thus, it is imperative that the effectiveness of
the existing placement procedures be known. To provide some
information, the probability of success estimated what would happen if a
specific cutoff on a particular criterion measure was applied to a
particular reference group. (In the context of course placement, the
reference group may be thought to as the student pool that took
placement tests.) Note that using correlations as the basis of
comparing potential placement measures can be misleading, as the
“compliant” group of students may differ substantially from the
reference group. Also, the restriction of range problem in the outcome
measures lowers the utility of correlation coefficients in validating
placement criteria. Alternative methods for validating course placement
criteria were warranted as correlation evidence per se has severe
limitations (see Mzumara, Shermis, & Wimer, 1996; Noble & Sawyer, 1997).
Table 1 provides a summary of the descriptive statistics for the
compliant and non-compliant groups based on the respective placement
test scores. The results of logistic regression analyses including
graphs showing the probability of success for the respective groups by
course are provided subsequently as Tables B.1 to B.7 in Appendix B.
Based on the tables and graphs, a summary of the results per course is
presented in turn.
Mathematics
The following is a summary of the descriptive statistics based on
compliant and non-compliant groups for mathematics (see Table 1). The
Placement Validity Report: 1997/98 19
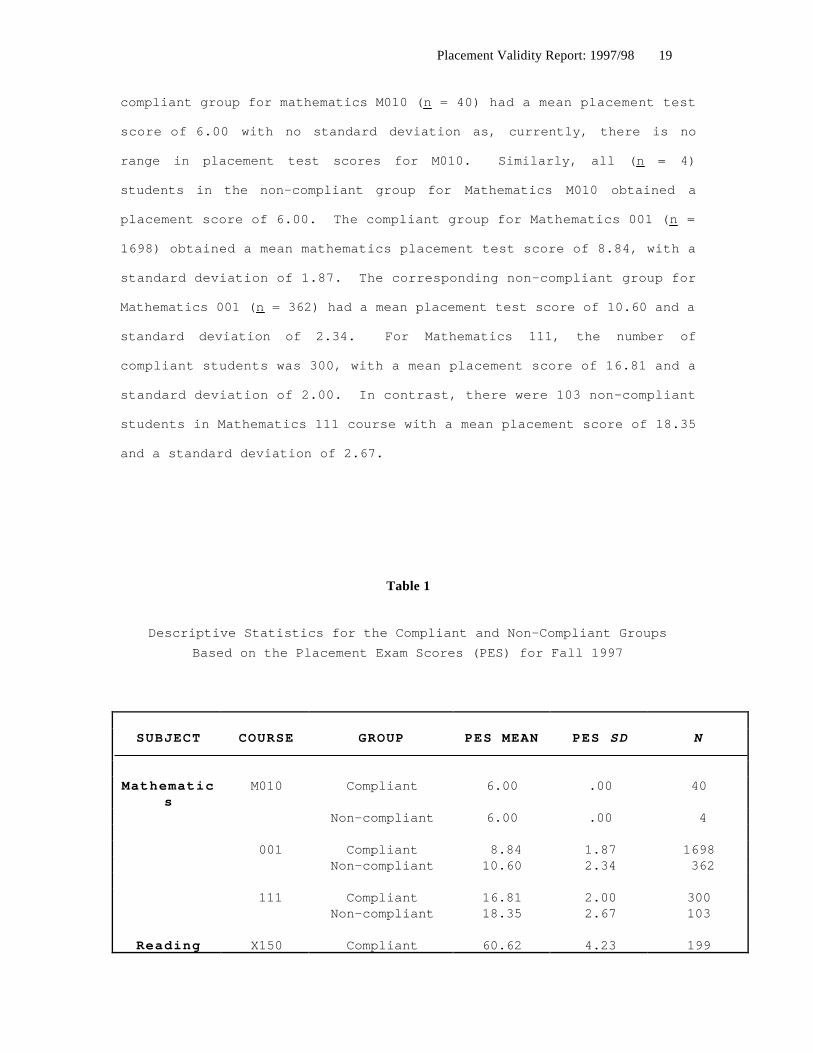
compliant group for mathematics M010 ( n = 40) had a mean placement test
score of 6.00 with no standard deviation as, currently, there is no
range in placement test scores for M010. Similarly, all ( n = 4)
students in the non-compliant group for Mathematics M010 obtained a
placement score of 6.00. The compliant group for Mathematics 001 ( n =
1698) obtained a mean mathematics placement test score of 8.84, with a
standard deviation of 1.87. The corresponding non-compliant group for
Mathematics 001 ( n = 362) had a mean placement test score of 10.60 and a
standard deviation of 2.34. For Mathematics 111, the number of
compliant students was 300, with a mean placement score of 16.81 and a
standard deviation of 2.00. In contrast, there were 103 non-compliant
students in Mathematics 111 course with a mean placement score of 18.35
and a standard deviation of 2.67.
Table 1
Descriptive Statistics for the Compliant and Non-Compliant Groups
Based on the Placement Exam Scores (PES) for Fall 1997
SUBJECT COURSE GROUP PES MEAN PES SD N
Mathematics
M010 Compliant 6.00 .00 40
Non-compliant 6.00 .00 4
001 Compliant 8.84 1.87 1698Non-compliant 10.60 2.34 362
111 Compliant 16.81 2.00 300Non-compliant 18.35 2.67 103
Reading X150 Compliant 60.62 4.23 199

Placement Validity Report: 1997/98 20
Non-compliant 61.58 5.20 12
X152 Compliant 74.01 3.46 239Non-compliant 74.86 3.13 14
English E0104 Compliant 1.00 .00 2Non-compliant n/a n/a 0
W001 Compliant 8.98 .94 330Non-compliant 7.83 2.71 18
W131 Compliant 14.42 1.10 925Non-compliant 14.00 .98 22
W140 Compliant 20.62 1.33 34Non-compliant 20.53 1.30 15
*Note: n/a = not applicable
4The English Department no longer offers E010.

Placement Validity Report: 1997/98 21
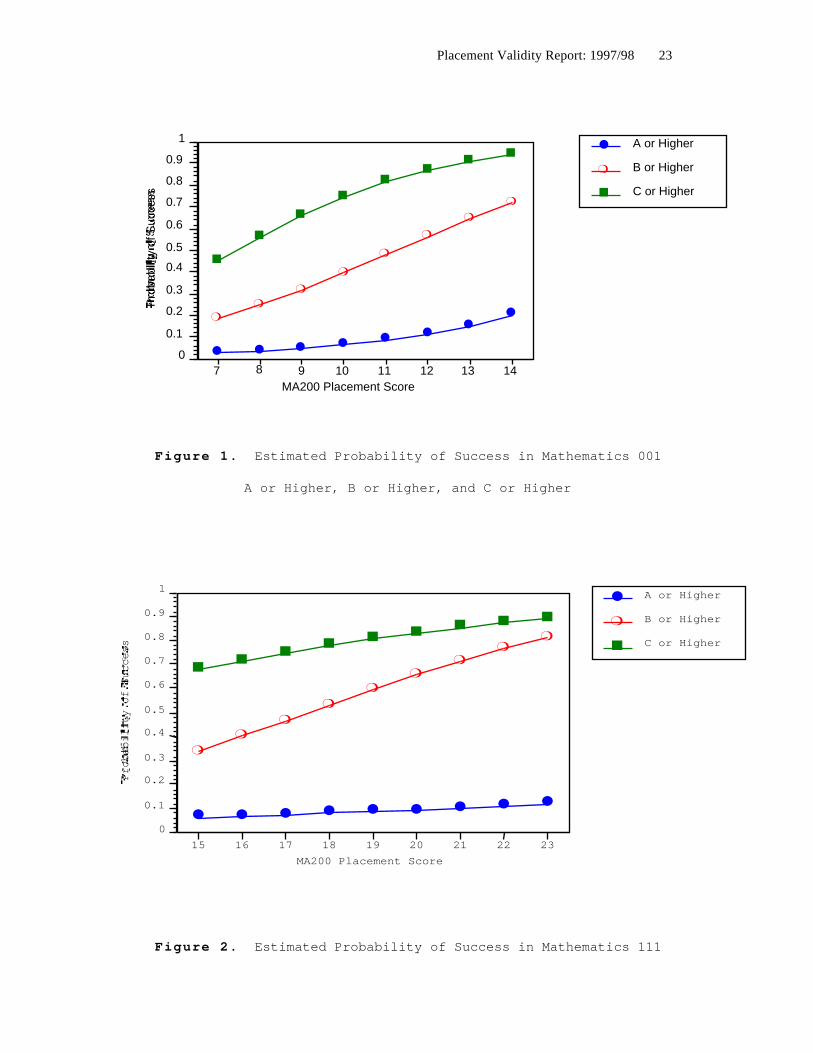
Figures 1 and 2 present probability estimates based on specific cutoffs on the outcome measures
when applied to particular mathematics compliant groups. (Tables B.1 and B.2 in Appendix B show the
results of logistic regression analyses for mathematics data.) For instance, as Figure 1 shows, a student
with a mathematics placement test score of 14 is associated with an estimated probability of a B or higher
grade of about .72. The corresponding C or higher cutoff score is 10 (probability of success is about .74).
(Note, however, when a grade of A- or higher is employed, scores between 7 and 14 are associated with
estimated probabilities of success of less than .25.). Overall, Figure 1 shows that the estimated probability
of success increases as placement test scores increase. In other words, the higher the placement score, the
greater the probability of success in mathematics.
It is worthwhile to mention that the advantages of using a
logistic regression approach, rather than traditional correlation
methods, are that we can observe curvilinear relationships and the
approach does not require strong distributional assumptions. “When the
outcome measure is considered as a dichotomy (pass/fail), rather than as
a continuous variable, the focus is placed on addressing the appropriate
question, that being whether a student will be successful or
unsuccessful, and less so whether a student will receive an A average
vs. a B average” (Noble & Sawyer, 1997, p. 3). Thus, the logistic
regression approach helps to reduce the problem of restriction of range
in course grades.
The placement validity coefficients for the computerized adaptive
mathematics test, calculated on the relationship between the placement
test scores and scores on a common final mathematics exam, averaged .38,
which reflects a very useful predictor and a significant improvement
over last year. Using course grades as the outcome measures, the
correlation coefficient for compliant students was approximately .34 for
Math 001 ( n = 1696). A slight drop in the validity coefficient for

Placement Validity Report: 1997/98 22
course grades was expected because of the adverse effect of range
restriction.
Placement Validity Report: 1997/98 23
Figure 1. Estimated Probability of Success in Mathematics 001
A or Higher, B or Higher, and C or Higher
Figure 2. Estimated Probability of Success in Mathematics 111
l l l l l l l l l
mm
mm
mm
mm
m
nn
nn n n n n n
15 16 17 18 19 20 21 22 23
0
0.1
0.2
0.3
0.4
0.5
0.6
0.7
0.8
0.9
1
Probability of Success
MA200 Placement Score
l A or Higher
m B or Higher
n C or Higher
l l l l l ll
lmm
m
m
m
m
m
m
n
n
n
n
nn
nn
7 8 9 10 11 12 13 140
0.1
0.2
0.3
0.4
0.5
0.6
0.7
0.8
0.9
1P
roba
bilit
y of
Suc
cess
MA200 Placement Score
l A or Higher
m B or Higher
n C or Higher
Placement Validity Report: 1997/98 24
A or Higher, B or Higher, and C or Higher
Reading
Descriptive statistics for reading courses are shown in Table 1.
Tables B.3 and B.4 (see Appendix B) show the results of fitting a
logistic regression model to data for the reading X150 and X152
compliant groups, respectively. The estimated probabilities of success
in reading courses X150 and X152 are presented in Figures 3 and 4,
respectively. As Figure 3 shows, a reading placement score of 61 is
associated with a probability of a B or higher grade of approximately
.52. The probability estimates for a grade of C or higher for the EDUC
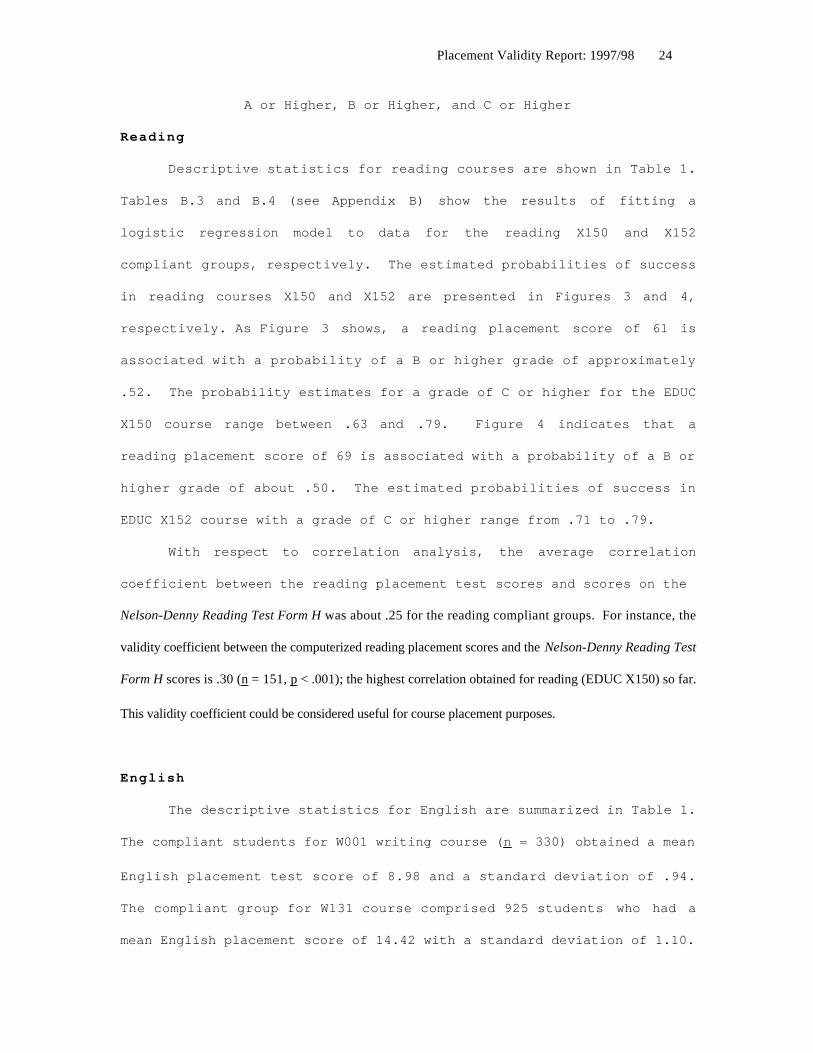
X150 course range between .63 and .79. Figure 4 indicates that a
reading placement score of 69 is associated with a probability of a B or
higher grade of about .50. The estimated probabilities of success in
EDUC X152 course with a grade of C or higher range from .71 to .79.
With respect to correlation analysis, the average correlation
coefficient between the reading placement test scores and scores on the
Nelson-Denny Reading Test Form H was about .25 for the reading compliant groups. For instance, the
validity coefficient between the computerized reading placement scores and the Nelson-Denny Reading Test
Form H scores is .30 ( n = 151, p < .001); the highest correlation obtained for reading (EDUC X150) so far.
This validity coefficient could be considered useful for course placement purposes.
English
The descriptive statistics for English are summarized in Table 1.
The compliant students for W001 writing course ( n = 330) obtained a mean
English placement test score of 8.98 and a standard deviation of .94.
The compliant group for W131 course comprised 925 students who had a
mean English placement score of 14.42 with a standard deviation of 1.10.

Placement Validity Report: 1997/98 25
For the W140 compliant group ( n = 34), the mean placement test score was
20.62 with a standard deviation of 1.33. In most cases, there were so
few non-compliant students for writing courses to warrant separate
statistical analyses.
Figure 3. Estimated Probability of Success in EDUC X150
A or Higher, B or Higher, and C or Higher
l l l l l l l l l l l l l l lm m m m m m m m m m m m m m mn n n n n n n n n n n n n n n
53 54 55 56 57 58 59 60 61 62 63 64 65 66 67
0
0.1
0.2
0.3
0.4
0.5
0.6
0.7
0.8
0.9
1
Probability of Success
RD100 Placement Score
l A or Higher
m B or Higher
n C or Higher
Placement Validity Report: 1997/98 26
Figure 4. Estimated Probability of Success in EDUC X152
A or Higher, B or Higher, and C or Higher
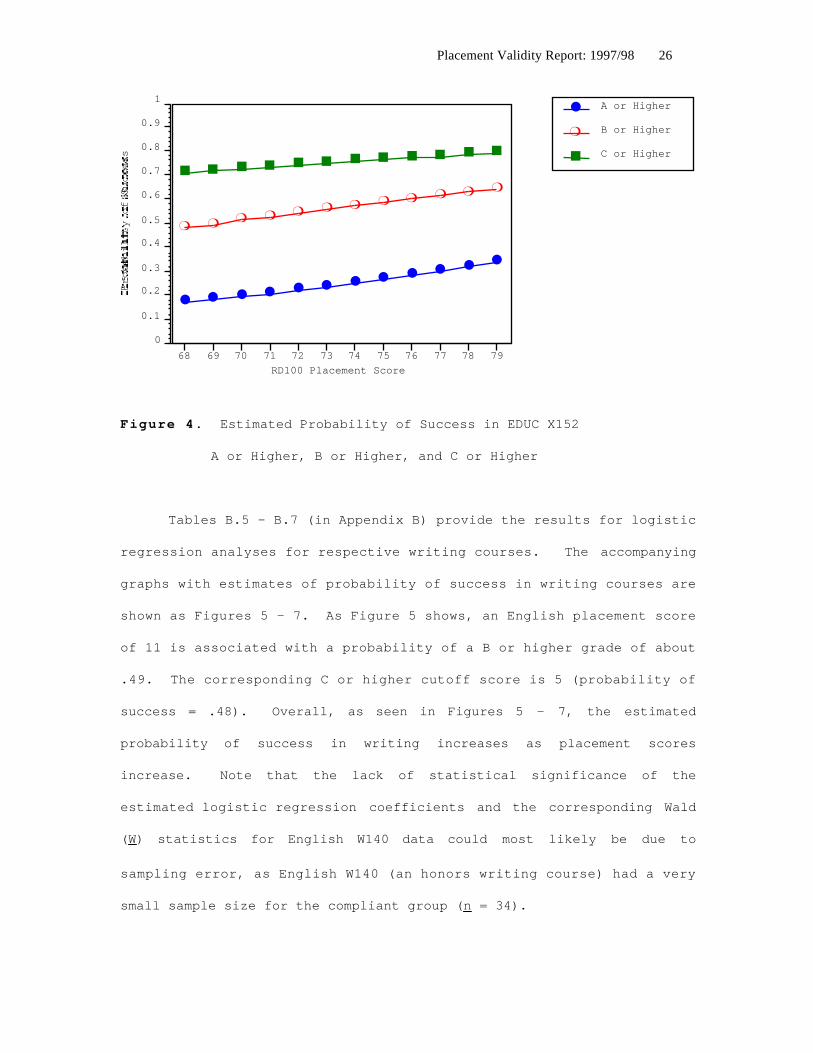
Tables B.5 - B.7 (in Appendix B) provide the results for logistic
regression analyses for respective writing courses. The accompanying
graphs with estimates of probability of success in writing courses are
shown as Figures 5 - 7. As Figure 5 shows, an English placement score
of 11 is associated with a probability of a B or higher grade of about
.49. The corresponding C or higher cutoff score is 5 (probability of
success = .48). Overall, as seen in Figures 5 - 7, the estimated
probability of success in writing increases as placement scores
increase. Note that the lack of statistical significance of the
estimated logistic regression coefficients and the corresponding Wald
( W ) statistics for English W140 data could most likely be due to
sampling error, as English W140 (an honors writing course) had a very
small sample size for the compliant group ( n = 34).
l l l l l l l l l l l l
m m m m m m m m m m m mn n n n n n n n n n n n
68 69 70 71 72 73 74 75 76 77 78 79
0
0.1
0.2
0.3
0.4
0.5
0.6
0.7
0.8
0.9
1
Probability of Success
RD100 Placement Score
l A or Higher
m B or Higher
n C or Higher

Placement Validity Report: 1997/98 27
Figure 5. Estimated Probability of Success in English W001
A or Higher, B or Higher, and C or Higher
l l l l l l l l l ll
l
m m m m mm
mm
mm
m
m
nn
nn
nn
nn
nn
nn
0 1 2 3 4 5 6 7 8 9 10 11
0
0.1
0.2
0.3
0.4
0.5
0.6
0.7
0.8
0.9
1
Probability of Success
EN100 Placement Score
l A or Higher
m B or Higher
n C or Higher

Placement Validity Report: 1997/98 28
Figure 6. Estimated Probability of Success in English W131
A or Higher, B or Higher, and C or Higher
Figure 7. Estimated Probability of Success in English W140
A or Higher, B or Higher, and C or Higher
l l ll
l
l
lm
m
m
m
m
mm
nn
nn
nn
n
12 13 14 15 16 17 18
0
0.1
0.2
0.3
0.4
0.5
0.6
0.7
0.8
0.9
1
Probability of Success
EN100 Placement Score
l A or Higher
m B or Higher
n C or Higher
ll
l
lm
mm
mn
n
n
n
19 20 21 220
0.1
0.2
0.3
0.4
0.5
0.6
0.7
0.8
0.9
1
Probability of Success
EN100 Placement Score
l A or Higher
m B or Higher
n C or Higher
Placement Validity Report: 1997/98 29
For exploratory purposes, a correlation analysis was conducted
between PEG scores and English course grades for IUPUI students. The
preliminary results are quite promising. In particular, it is
interesting to note that the correlation results are statistically
significant ( r = .25, n = 237, p < .01), indicating an improvement in
validity coefficients over those for the conventional English placement
test scores. Perhaps subsequent work in this area will yield
significant findings that would also be useful in the improvement of the
IUPUI placement testing program.
Results of Gender and Ethnic Analyses
The issue of gender differences in academic achievement was
explored using the Student t-test for independent samples. Preliminary
results based on gender analysis indicated some statistically
significant gender differences in achievement as reflected in
performance on the respective placement tests and/or outcome measures.
Specifically, statistically significant differences were obtained on CAT
mathematics placement test scores [M(males) = 11.53, M(females) = 10.35;
t(2643) = 7.08, p < .001] with males scoring higher. However, no
gender-related differences were observed for the final course grades in
mathematics [M(males) = 2.24, M(females) = 2.33); t(1906) = -1.78, ns].
With respect to performance on the English placement test, female
students performed significant better than [M(males) = 13.27, M(females)
= 13.62; t(2471) = -3.17, p < .001]. Similarly, a statistically
significant gender-related difference was obtained for the English
course grades [M(males) = 2.20, M(females) = 2.43; t(1693) = -3.49, p <
Placement Validity Report: 1997/98 30
.001], with female students performing significantly better than male
students. In accordance with last year’s observation, there was a
statistically significant gender difference in reading placement test
scores [M(males) = 97.07, M(females) = 91.26; t(2631) = 7.22, p <
.001]; but not on the reading post-test (N-D Reading Test Form H) scores
[M(males) = 91.29, M(females) = 94.77; t(332) = -1.61, ns]. Note,
however, statistically significant gender-related differences were
observed for the EDUC X150 course [M(males) = 1.83, M(females) = 2.38;
t(235) = -2.81, p < .01], but not for EDUC X152 [M(males) = 2.47,
M(females) = 2.64; t(282) = -.98, ns]. Perhaps the statistical
significant result for EDUC X150 can be attributed to the disparate
sample sizes for the gender groups.
The aforementioned results indicate a need to conduct a thorough
investigation on gender-related differences in academic performance, as
reflected in placement test scores and/or course grades at IUPUI. The
issue on gender research is, therefore, left for further study.
The analyses based on the ethnic status of students did not yield
statistically significant results, when sampling error due to
disproportionate sample sizes was taken into account. This finding is
similar to those obtained in previous validity studies at IUPUI.
However, given the exploratory nature of the present investigations on
gender and ethnic bias, it is important to investigate further the link
between ethnicity and academic achievement at IUPUI.
Discussion and Conclusion

Placement Validity Report: 1997/98 31
The primary purpose of the present study was to investigate the
validity of the IUPUI placement exam scores for course placement in
mathematics, reading, and English. In comparison with the last two
years’ findings, the overall validity coefficients for mathematics were
higher, and the same for reading and English. The logistic regression
approach, however, offered a more appropriate means of determining the
effectiveness of the placement criteria. Therefore, graphs indicating
estimates of probabilities of success were constructed for each
placement test score. We hope that the new probability graphs will
provide some additional help to counselors and other academic advisors
seeking to use the placement tests as one source of information in
guiding the student to an appropriate course.
Of course, the logistic regression techniques have limitations
too, such as the influence of range restriction in extreme cases. For
instance, if very few or no students are unsuccessful (e.g., below a
grade of B) or, for course placement, the course is either very easy or
very hard, it is difficult to estimate probabilities of success (Noble &
Sawyer, 1997). Similarly, estimated probabilities of success are also
influenced by sample size. Generally speaking, the sample sizes
required to estimate the logistic regression weights are larger than
those needed for linear regression. Thus, we can expect relatively
large sampling error whenever small sample sizes (say, n < 100) are
employed in logistic regression analyses (see Noble & Sawyer, 1997).
Some of the general factors for explaining the results of
placement validity studies are outlined in the 1996 annual placement
validity report (cf. Mzumara, Shermis, & Wimer, 1996). As noted
earlier, a modest increase in the validity coefficients is observed when

Placement Validity Report: 1997/98 32
the Nelson-Denny Reading Test Form H scores are employed as a primary
criterion. A similar situation was observed this year. Probably due to
the influence of score range restriction and small sample size on
validity coefficients, the correlations obtained for English were low
and mostly not statistically significant. Another important factor to
consider for English is that a majority of high school graduates are
poorly prepared in writing. Specifically, previous research indicates
that most high school students neither write well nor write much in
school or outside of school [see the Education Research Report titled
What’s Wrong with Writing and What Can We Do Right Now? by the Office of
Educational Research and Improvement (OERI), April 1993].
Notwithstanding the methodological limitations of placement
validity studies, several recommendations are outlined in the next
section.
Recommendations
Based on this study and our experience, the following advice
should be helpful for course placement and test construction.
Recommendations are presented separately for each content domain under
investigation.
Mathematics

Placement Validity Report: 1997/98 33
To improve the validity coefficients for mathematics, the IUPUI
Testing Center and Department of Mathematical Sciences should continue
the current work on the adaptive math placement test. To date,
development has been focused in the following areas: (1) improvement of
item bank characteristics via item revision and/or new item development
and calibration, (2) fine-tuning of the cutoff scores on the basis of
empirical evidence, (3) improvement in reporting of placement test
results to include screening information (cf. Mzumara, Shermis, & Wimer,
1998), and (4) development and implementation of testlets or minitests
as a way to improve course placement plus content and predictive
validity of the computerized adaptive mathematics placement test. Note
that work based on these recommendations is currently underway.
Since the switch-over to CAT, the Testing Center has been
collecting information to evaluate the effectiveness of computerized
adaptive testing in mathematics, and the findings have been very
encouraging. For instance, we have obtained a positive validity
coefficient as high as .38 ( n = 1220, p < .001,) between the
computerized adaptive mathematics test scores and the final exam scores
for the Math 001 compliant group.
Most recently, the mathematics placement cutoff scores have been
modified and the changes were implemented in Fall 1998. These cutoff
points represent the standards upon which placement recommendations are
made. Based on empirical research, the new cutoff scores were chosen
judiciously to ensure that a student enters only those courses for which
he/she is prepared. However, it is beyond the scope of this report to
discuss methods for determining cutoff scores. Various methods for

Placement Validity Report: 1997/98 34
setting cutoff scores are discussed elsewhere in the literature (e.g.,
see Hills, Hirsch, & Subhiyah, 1990; Nitko, 1983).
In addition to modifying the mathematics cutoff scores, the
Testing Center staff (in conjunction with the mathematics faculty)
should continue the ongoing efforts in adding appropriate items to the
current item bank and/or periodically revise the local mathematics
placement test to improve its content validity or curricular relevance.
Reading
The recent implementation of the new Indiana-Purdue Computerized
Reading Placement Test, as a replacement for the Nelson-Denny Reading
Test Form E, has yielded favorable findings so far (Shermis, Wolting, &
Lombard, 1996). This test has been evaluated on several psychometric
dimensions, and has been demonstrated to have good reliability and
validity (Shermis, Wolting, & Banta, 1996). As stated in the previous
placement validity reports, the non-adaptive version of the reading test
was implemented in late June 1996. This linearly computerized reading
test will soon be converted to an adaptive format. Previous pilot
information on the reading test designed to work in a CAT environment
has yielded promising results. Thus, we encourage all efforts to
convert to a computerized adaptive reading test.
English
With respect to English, we recommend and/or encourage the English
Department faculty to seek or adopt alternative methods of assessment
(e.g., portfolios), in conjunction with traditional forms of assessment,
to obtain a wider range of scores. Also, it should be worthwhile to

Placement Validity Report: 1997/98 35
consider expanding the current score range for the current English
placement test so as to minimize the influence of range restriction.
Overall recommendation. One of the continuing problems had to
do with enforcing compliance in course placement. Although the current
compliance rates in English, mathematics, and reading have remained high
for the past two years, overall compliance rates will most likely
increase following the recent implementation of an enforcement
(prerequisite check) mechanism for class enrollment, in addition to the
continued use of post-registration audits. Generally speaking, the “bar
procedure” prevents a student from enrolling in a class that is
inappropriate for him/her based on placement test scores unless special
consideration is granted by the respective academic departments. We
urge the academic departments to make use of the Registrar's
prerequisite check routine and thereby facilitate its enforcement as
needed.
General Remarks
It might be worthwhile for future placement validity studies to
include an analysis of the nature and content of the outcome measures.
It is likely that any one year’s examination is different in its content
coverage of the curriculum, standards or difficulty. Such year-to-year
differences in skills tested may account for a considerable amount of
any change in performance on the examinations. A content validity
analysis would provide some useful and/or supplementary information that
would help explain some of the observed inconsistency in the
relationships between predictor and outcome scores.

Placement Validity Report: 1997/98 36
It is noteworthy that placement tests are designed to be used in
conjunction with counselors’ recommendations, and provide one source of
information about the student’s current ability level. Decisions
regarding course placement ought to include a student’s previous
academic record and not be made on the basis of placement test scores
alone. Because the IUPUI placement decisions are advisory, the
placement tests are designed for use in conjunction with counselors’
recommendations. Thus, the use of multiple predictors for course
placement is desirable (see Sawyer, 1996). Rather than use placement
test scores alone, additional predictors may include one or more of the
following variables: high school (HS) overall grade point average (GPA),
HS subject GPA, HS (percentile) rank, and HS courses completed. It
seems likely that the more information counselors have about a student,
the better the chance of their making an appropriate placement decision.
(Note that data collection and management for research purposes will be
facilitated with an improved Indiana University Test Reporting System
(IUTS), which is currently in beta testing.)
After several years of placement testing in English, mathematics
and reading, the respective stakeholders should be fairly convinced that
the IUPUI placement testing program provides an efficient, practical,
and workable method of placing students in appropriate courses which
give them the best chance for academic success. The IUPUI placement
tests, however, are a guide, based on the past performances of other
similar students, of potential success in specific sets of courses in
English, mathematics, and reading. Although the placement tests cannot
measure motivation or other affective variables in academic learning,
they are quite useful in providing our students with a healthier and

Placement Validity Report: 1997/98 37
more valid learning experience in the respective courses. Placement
testing, therefore, offers the University a practical way to accommodate
the more diverse academic needs and talents of the entering students.
Placement Validity Report: 1997/98 38
References
Akst, G., & Hirsch, L. (1991). Selected studies on mathematics
placement. Review of Research in Developmental Education, 8(4), 1-3.
Allen, M. J., & Yen, W. M. (1979). Introduction to measurement
theory. Monterey, California: Brooks/Cole.
Brown, J. I., Bennett, J. M., & Hanna, G. (1981). The Nelson-
Denny Reading Test: Examiner’s Manual Forms E and F. Chicago, IL:
Riverside.
Coladarci, T. (1986). Accuracy of teacher judgments of student
responses to standardized test items. Journal of Educational
Psychology, 78, 141-146.
College Entrance Examination Board (1982). Guide to the College
Board Validity Study Service. New York: Author.
Cronbach, L. J. (1970) Essentials of psychological testing (3rd
ed.). New York: Harper & Row.
Cronbach, L .J. (1971). Test validation. In R. L. Thorndike
(Ed.), Educational measurement (2nd ed.). Washington, DC: American
Council on Education.

Placement Validity Report: 1997/98 39
Ebel R. L. (1972). Essentials of educational measurement (2nd
ed.). New Jersey: Prentice-Hall.
Glass, G. V., & Hopkins, K. D. (1984). Statistical methods in
education and psychology (2nd ed.). Englewood Cliffs, NJ: Prentice-
Hall.
Harrington, S., Shermis, M. D., & Rollins, A. (1997). The
influence of word processing on English placement test results.
Indianapolis, IN: IUPUI Department of English.
Hills, J. R., Hirsch, T. M., & Subhiyah, R. G. (1990). Issues in
placement. Washington, DC: ERIC Clearinghouse on Tests, Measurement and
Evaluation/American Institutes for Research.
Hosmer, D. W., & Lemeshow, S. (1989). Applied logistic regression.
New York: John Wiley & Sons.
Kerlinger, F. N., & Pedhazur, E. J. (1973). Multiple regression
in behavioral research. New York: Holt, Rinehart & Winston.
Kirk, R. E. (1990). Statistics: An introduction (3rd ed.). Fort
Worth: Holt, Rinehart & Winston.
Mzumara, H. R., Shermis, M. D., Dossinger, K., & Olson, J. J.
(October, 1997). Validity of the IUPUI placement test scores for course
placement: 1996-1997. Indianapolis, IN: IUPUI Testing Center.
Placement Validity Report: 1997/98 40
Mzumara, H. R., Shermis, M. D., & Wimer, D. (1998, September).
Use of examinee's previous mathematics background in computerized
adaptive testing and mathematics placement. Paper presented at the
Professional Affiliates in College Testing conference, Atlanta, GA.
Mzumara, H. R., Shermis, M. D., & Wimer, D. (1996). Validity of
the IUPUI placement test scores for course placement: 1995-96.
Indianapolis, IN: IUPUI Testing Center.
National Center for Education Statistics (October 1996).
Developmental education at higher education institutions in fall 1995.
Statistical Analysis Report (NCES 97-584).
(http://www.ed.gov/NCES/pubs/97584.html)
Nitko, A. J. (1983). Educational tests and measurement: An
introduction. New York: Harcourt Brace Jovanovich.
Noble, J. & Sawyer, R. (1997, spring). Alternative methods for
validating admissions and course placement criteria. The Association
for Institutional Research for Management Research, Policy Analysis, and
Planning (No. 63), 1-12.
Norusis, M. J. & SPSS Inc. (1992). SPSS for Windows: Advanced
statistics, Release 5. Chicago, IL: SPSS Inc.

Placement Validity Report: 1997/98 41
Office of Educational Research and Improvement (April 1993).
What’s wrong with writing and what can we do right now? OERI Research
Report. Washington, DC: Author.
(http://www.ed.gov/pubs/OR/ResearchRpts/writing.html)
Page, E. B., & Petersen, N. S. (1995). The computer moves into
essay grading: Updating the ancient test. Phi Delta Kappan, 76(7), 561-
565.
Sawyer, R. (1996). Decision theory models for validating course
placement tests. Journal of Educational Measurement, 33, 271-290.
Shermis, M. D., & Chang, S. H. (1997). The use of IRT to
investigate the hierarchical nature of a college mathematics curriculum.
Unpublished manuscript, IUPUI Testing Center, Indianapolis, IN.
Shermis, M. D., & Mzumara, H. R. (1996). College placement
testing through the World Wide Web: Preparing students for post-
secondary education. Indianapolis, IN: IUPUI Testing Center.
Shermis, M. D., Mzumara, H. R., Lillig, C., & Brown, M. (1997).
Computerized adaptive testing through the World Wide Web. Paper
presented at the annual meeting of the American Psychological
Association, Chicago, IL.
Shermis, M. D., Mzumara, H. R., Olson, J., & Harrington, S. (1998,
April). On-line grading of student essays: PEG goes on the Web at

Placement Validity Report: 1997/98 42
IUPUI. Paper presented at the Annual Meeting of the American
Educational Research Association, San Diego, CA.
Shermis, M. D., Wolting, M., & Lombard, D. (1996). Computerized
adaptive testing for reading placement and diagnostic assessment.
Journal of Developmental Education, 20(2), 18-24.
Stiggins, R. J., & Bridgeford, N. J. (1985). The ecology of
classroom assessment. Journal of Educational Measurement, 22, 271-286.
Wainer, H. (1993). Some practical considerations when converting
a linearly administered test to an adaptive format. Educational
Measurement: Issues and Practice, 12, 15-20.
Wiseman, S. (1967). The effect of restriction of range upon
correlation coefficient. British Journal of Educational Psychology, 37,
248-252.

Placement Validity Report: 1997/98 43
APPENDIX A
Logistic Regression and Probability of Success
Ordinarily, logistic regression estimates the relationship between
a dichotomous outcome (i.e., a university course grade of “C” or higher)
and one or more predictors (Hosmer & Lemeshow, 1989). In most respects,
logistic regression employs same general principles as linear
regression, but fits a non-linear model with a predicted outcome bounded
by 0 and 1. The advantages and utility of logistic regression approach,
compared to traditional correlation methods, in validating placement
criteria are discussed elsewhere in the literature (e.g., see Noble &
Sawyer, 1997; Sawyer, 1996; and Hosmer & Lemeshow, 1989).
Logistic regression produced a student’s estimated probability of
success, using the following formula:
P[success |K = x] = e(a+b*X) /[1 + e (a+b*x)]
where a and b are regression coefficients estimated on the data,
x is the score the placement test,
K is the cutoff score on the placement test, and
e is the base of the natural logarithms, approximately 2.718
(Hosmer & Lemeshow, 1989; Noble & Sawyer, 1997).
Placement Validity Report: 1997/98 44
APPENDIX B
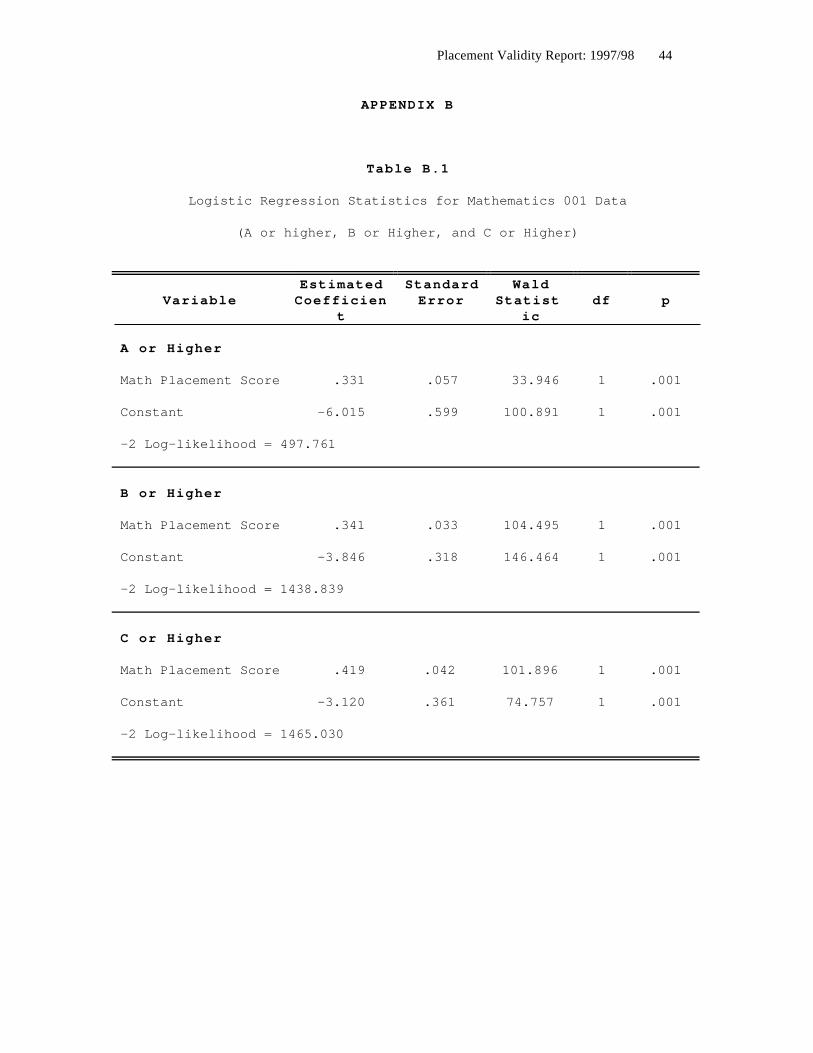
Table B.1
Logistic Regression Statistics for Mathematics 001 Data
(A or higher, B or Higher, and C or Higher)
VariableEstimatedCoefficien
t
StandardError
WaldStatist
icdf p
A or Higher
Math Placement Score .331 .057 33.946 1 .001
Constant -6.015 .599 100.891 1 .001
-2 Log-likelihood = 497.761
B or Higher
Math Placement Score .341 .033 104.495 1 .001
Constant -3.846 .318 146.464 1 .001
-2 Log-likelihood = 1438.839
C or Higher
Math Placement Score .419 .042 101.896 1 .001
Constant -3.120 .361 74.757 1 .001
-2 Log-likelihood = 1465.030
Placement Validity Report: 1997/98 45
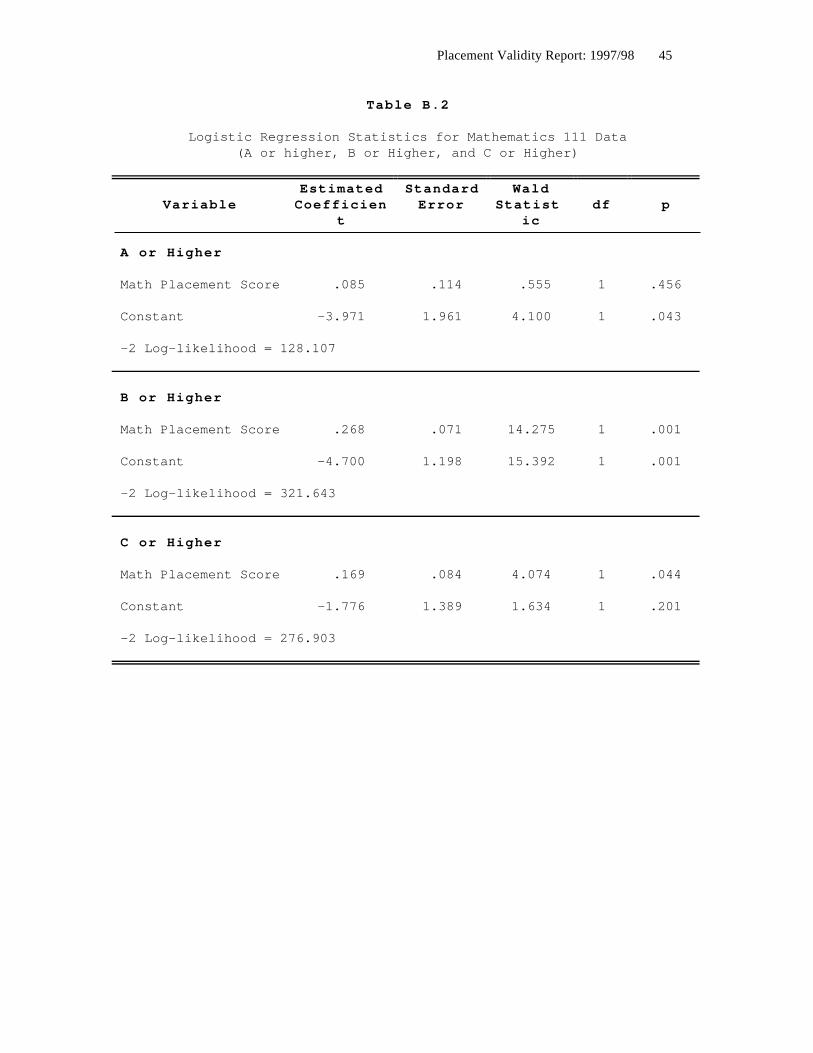
Table B.2
Logistic Regression Statistics for Mathematics 111 Data(A or higher, B or Higher, and C or Higher)
VariableEstimatedCoefficien
t
StandardError
WaldStatist
icdf p
A or Higher
Math Placement Score .085 .114 .555 1 .456
Constant -3.971 1.961 4.100 1 .043
-2 Log-likelihood = 128.107
B or Higher
Math Placement Score .268 .071 14.275 1 .001
Constant -4.700 1.198 15.392 1 .001
-2 Log-likelihood = 321.643
C or Higher
Math Placement Score .169 .084 4.074 1 .044
Constant -1.776 1.389 1.634 1 .201
-2 Log-likelihood = 276.903

Placement Validity Report: 1997/98 46
Table B.3
Logistic Regression Statistics for Educ X150 Data (A or higher, B or Higher, and C or Higher)
VariableEstimated
CoefficientStandardError
WaldStatistic df p
A or Higher
Reading Placement Score .110 .046 5.657 1 .017
Constant -8.213 2.873 8.171 1 .004
-2 Log-likelihood = 183.854
B or Higher
Reading Placement Score .110 .035 9.598 1 .002
Constant -6.619 2.148 9.492 1 .002
-2 Log-likelihood = 261.632
C or Higher
Reading Placement Score .056 .038 2.161 1 .142
Constant -2.412 2.278 1.120 1 .290
-2 Log-likelihood = 230.484

Placement Validity Report: 1997/98 47
Table B.4
Logistic Regression Statistics for Educ X152 Data (A or higher, B or Higher, and C or Higher)
VariableEstimated
CoefficientStandardError
WaldStatistic df p
A or Higher
Reading Placement Score .081 .045 3.312 1 .069
Constant -7.105 3.324 4.570 1 .032
-2 Log-likelihood = 264.785
B or Higher
Reading Placement Score .061 .038 2.519 1 .112
Constant -4.220 2.836 2.213 1 .137
-2 Log-likelihood = 321.401
C or Higher
Reading Placement Score .042 .044 .908 1 .341
Constant -1.956 3.234 .366 1 .545
-2 Log-likelihood = 262.856

Placement Validity Report: 1997/98 48
Table B.5
Logistic Regression Statistics for the English W001 Data(A or higher, B or Higher, and C or Higher)
VariableEstimated
CoefficientStandardError
WaldStatistic df p
A or Higher
English Placement Score -.036 .233 .024 1 .877
Constant -2.303 2.097 1.205 1 .272
-2 Log-likelihood = 161.074
B or Higher
English Placement Score .290 .127 5.226 1 .022
Constant -3.220 1.153 .788 1 .005
-2 Log-likelihood = 417.863
C or Higher
English Placement Score .209 .126 2.778 1 .096
Constant -1.145 1.127 1.031 1 .310
-2 Log-likelihood = 408.415
Placement Validity Report: 1997/98 49
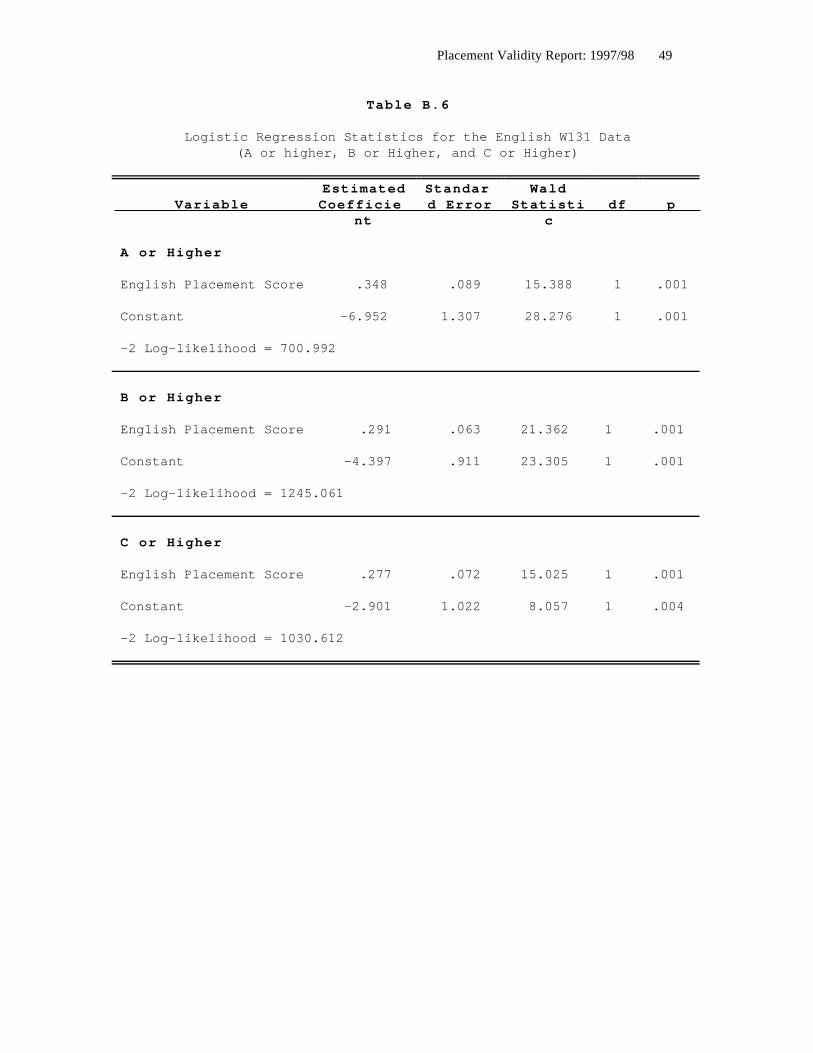
Table B.6
Logistic Regression Statistics for the English W131 Data(A or higher, B or Higher, and C or Higher)
VariableEstimatedCoefficie
nt
Standard Error
WaldStatisti
cdf p
A or Higher
English Placement Score .348 .089 15.388 1 .001
Constant -6.952 1.307 28.276 1 .001
-2 Log-likelihood = 700.992
B or Higher
English Placement Score .291 .063 21.362 1 .001
Constant -4.397 .911 23.305 1 .001
-2 Log-likelihood = 1245.061
C or Higher
English Placement Score .277 .072 15.025 1 .001
Constant -2.901 1.022 8.057 1 .004
-2 Log-likelihood = 1030.612

Placement Validity Report: 1997/98 50
Table B.7
Logistic Regression Statistics for the English W140 Data(A- or higher, B or Higher, and C or Higher)
VariableEstimatedCoefficien
t
Standard Error
WaldStatist
icdf p
A or Higher
English Placement Score .947 .503 3.545 1 .060
Constant -21.290 10.791 3.892 1 .048
-2 Log-likelihood = 29.143
B or Higher
English Placement Score .046 .267 .030 1 .863
Constant -.591 5.504 .012 1 .914
-2 Log-likelihood = 46.040
C or Higher
English Placement Score -.176 .286 .380 1 .537
Constant -6.155 5.941 .545 1 .460
-2 Log-likelihood = 42.419