EF-P dependent pauses integrate proximal and distal signals during translation
Note: this is a draft of the journal article:
Worsley P.R., Kitsell, F., Samuel, D., Stokes, M. (2014) “Validity of measuring distal vastus
medialis muscle using rehabilitative ultrasound imaging versus magnetic resonance
imaging”.
Manual Therapy, 19(3) pp259-263
The final, fully proofed and peer-reviewed journal article is available from the publisher online, via
the following link: http://www.sciencedirect.com/science/article/pii/S1356689X14000137

Validity of measuring distal vastus medialis muscle using rehabilitative ultrasound
imaging versus magnetic resonance imaging
Peter R Worsley* (PhD), Fleur Kitsell (PhD), , Dinesh Samuel (PhD), Maria. Stokes (PhD)
.Faculty of Health Sciences, University of Southampton, UK
*Corresponding author:
Peter Worsley MCSP PhD
Faculty of Health Sciences, Building 45
Highfield Campus, University of Southampton, Southampton
SO17 1BJUK
Tel. +44(0)2380 798287.
Email: [email protected]
Key Words: Ultrasound Imaging, Vastus Medialis, Reliability, Validity
Abstract
Objective quantification of muscle size can aid clinical assessment when treating musculoskeletal
conditions. To date the gold standard of measuring muscle morphology is magnetic resonance
imaging (MRI). However, there's a growing body of evidence validating rehabilitative ultrasound
imaging (RUSI) against MRI.
Objective: This study aimed to validate RUSI against MRI for the linear measurements of the distal
fibres of vastus medialis muscle in the thigh.
Twelve healthy male participants were recruited from a local university population. The distal
portion of their right vastus medialis was imaged with the participant in long-sitting, using MRI and
RUSI whilst the leg was in extension and neutral hip rotation. Cross sectional area (CSA) and three
linear measures were taken from the MRI and compared with the same linear measures from RUSI.
Statistical analysis included comparison of MRI and RUSI measures using the paired t-test and
correlation using intra-class correlation coefficients (ICC 3,1).
Mean differences between the linear measures taken from the MRI and RUSI were -0.5mm to
2.9mm (95% confidence intervals -0.6 to 8.3mm), which were not statistically different (p>0.05) and
were highly correlated (ICCs3,1 0.84-0.94). Correlations between the three linear measurements and
muscle CSA ranged from r=0.23 to 0.87, the greatest being muscle thickness. Multiplying the linear
measures did not improve the correlation of 0.87 found for muscle thickness.
Linear measures of vastus medialis depth made using RUSI were shown to be as valid as using MRI.
Muscle thickness measures using RUSI could be used within an objective assessment of this muscle.
1. Introduction
The current gold-standard for measuring the size of soft-tissues in humans is magnetic
resonance imaging (MRI) (Reeves et al. , 2004). However, MRI scans can be difficult to
access, is expensive and requires skilled clinicians to interpret the images. Alternative valid,
accurate and reliable techniques are needed to measure muscle size for research and
clinical purposes. Rehabilitative ultrasound imaging (RUSI) can offer a safe, objective and
relatively inexpensive means of evaluating muscle and related soft tissue morphology, and
can provide visual feedback to aid interventions in research and clinical practice (Whittaker
et al. , 2007, Whittaker and Stokes, 2011).
Several studies have reported RUSI as a valid method for measuring the size of muscles
when compared to MRI, including; the lumbar multifidus (Hides et al. , 1995), cervical
multifidus (Lee et al. , 2007), abdominals (Hides et al. , 2006), trapezius (O'Sullivan et al. ,
2009), quadriceps (Walton et al. , 1997, Reeves, Maganaris, 2004, Thomaes et al. , 2012)
and anterior hip muscles (Mendis et al. , 2010). A systematic review of 13 studies on the
validity of using RUSI compared with MRI or computed tomography (CT) concluded that
RUSI can provide valid measurements of skeletal muscles (Pretorius and Keating, 2008).
They hypothesised that, due to the varied nature of the populations in the reviewed studies,
it was possible to generalise this statement, rather than restrict it to a particular muscle.
Several muscles have yet to be evaluated for validity using RUSI. An example is vastus
medialis, where substantial alterations in fibre alignment are seen between proximal and
distal muscle portions (Smith et al. , 2009). The distal oblique fibres are thought to play a
pivotal role in the kinematics and alignment at the patellofemoral joint (Berry et al. , 2008,
Fagan and Delahunt, 2008, Lin et al. , 2008) and physiological or biomechanical dysfunction
of this muscle are reported to contribute to patellofemoral pain (PFP) (Lankhorst et al. ,
2012). Recent research has used RUSI to assess the pennation angle of these oblique
muscle fibres in cadaveric specimens (Engelina et al. , 2012) and assess muscle volume in
individuals with PFP (Lin, Lin, 2008, Jan et al. , 2009). There is, however, a need to assess
the validity of RUSI measurements of vastus medialis (VM). Therefore, the present study
aimed to assess the distal portion of vastus medialis using both MRI and RUSI.
2. Methods
2.1 Participants
Twelve healthy, recreationally active adult males, aged 18 - 30 years, were recruited from
the local community. Participant had no history of neurological or musculoskeletal disease,
lower limb pathology or injury requiring treatment and were recreationally active.
2.2 Magnetic Resonance Imaging
The MRI system used was an extremity open Esaote MR scanner (MRE) with a 0.2 Tesla
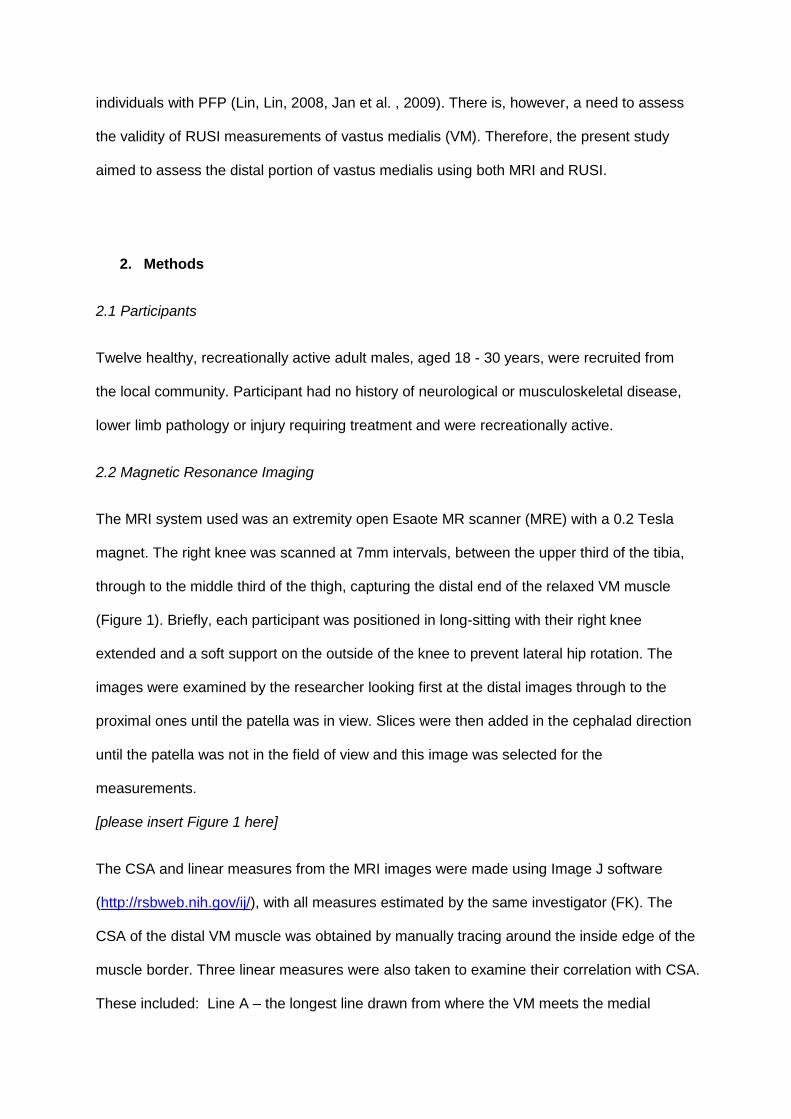
magnet. The right knee was scanned at 7mm intervals, between the upper third of the tibia,
through to the middle third of the thigh, capturing the distal end of the relaxed VM muscle
(Figure 1). Briefly, each participant was positioned in long-sitting with their right knee
extended and a soft support on the outside of the knee to prevent lateral hip rotation. The
images were examined by the researcher looking first at the distal images through to the
proximal ones until the patella was in view. Slices were then added in the cephalad direction
until the patella was not in the field of view and this image was selected for the
measurements.
[please insert Figure 1 here]
The CSA and linear measures from the MRI images were made using Image J software
(http://rsbweb.nih.gov/ij/), with all measures estimated by the same investigator (FK). The
CSA of the distal VM muscle was obtained by manually tracing around the inside edge of the
muscle border. Three linear measures were also taken to examine their correlation with CSA.
These included: Line A – the longest line drawn from where the VM meets the medial
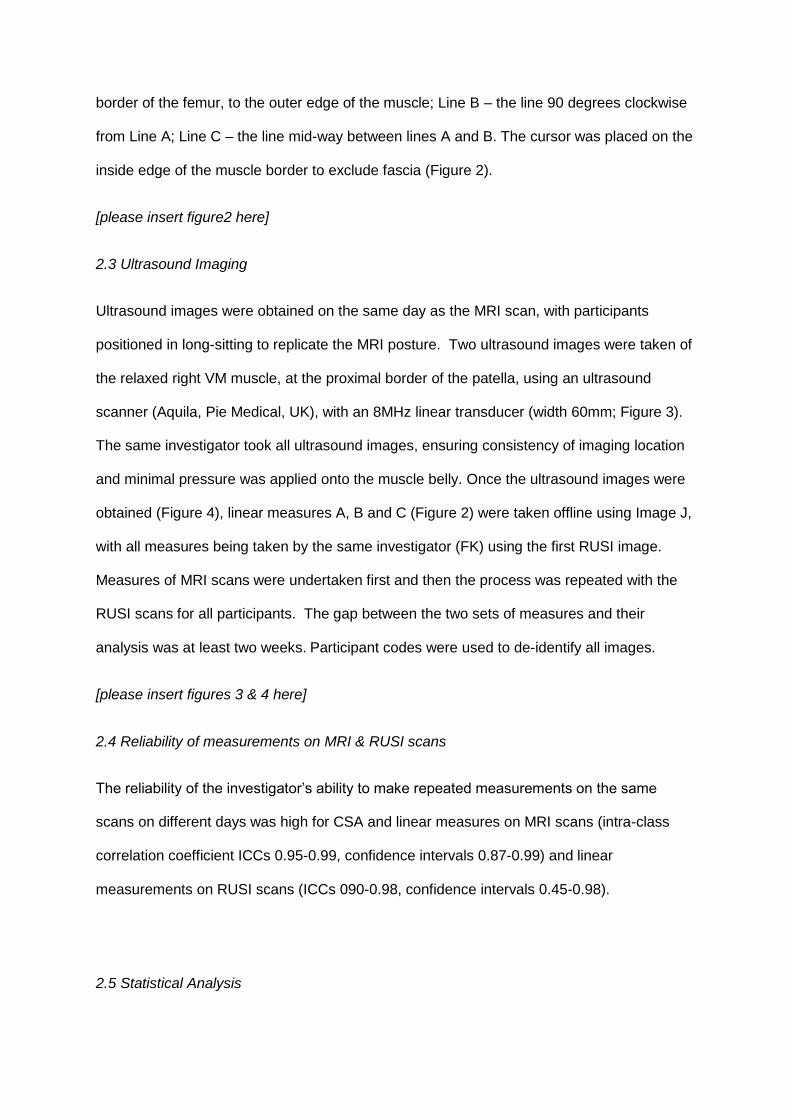
border of the femur, to the outer edge of the muscle; Line B – the line 90 degrees clockwise
from Line A; Line C – the line mid-way between lines A and B. The cursor was placed on the
inside edge of the muscle border to exclude fascia (Figure 2).
[please insert figure2 here]
2.3 Ultrasound Imaging
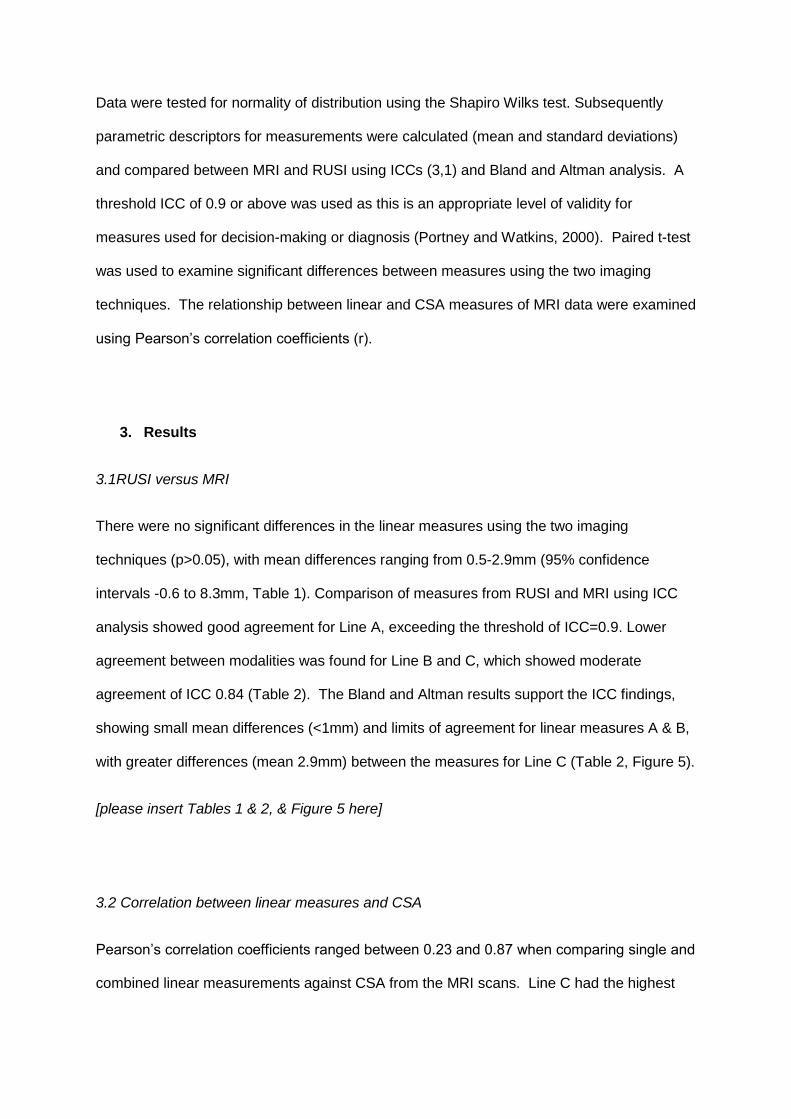
Ultrasound images were obtained on the same day as the MRI scan, with participants
positioned in long-sitting to replicate the MRI posture. Two ultrasound images were taken of
the relaxed right VM muscle, at the proximal border of the patella, using an ultrasound
scanner (Aquila, Pie Medical, UK), with an 8MHz linear transducer (width 60mm; Figure 3).
The same investigator took all ultrasound images, ensuring consistency of imaging location
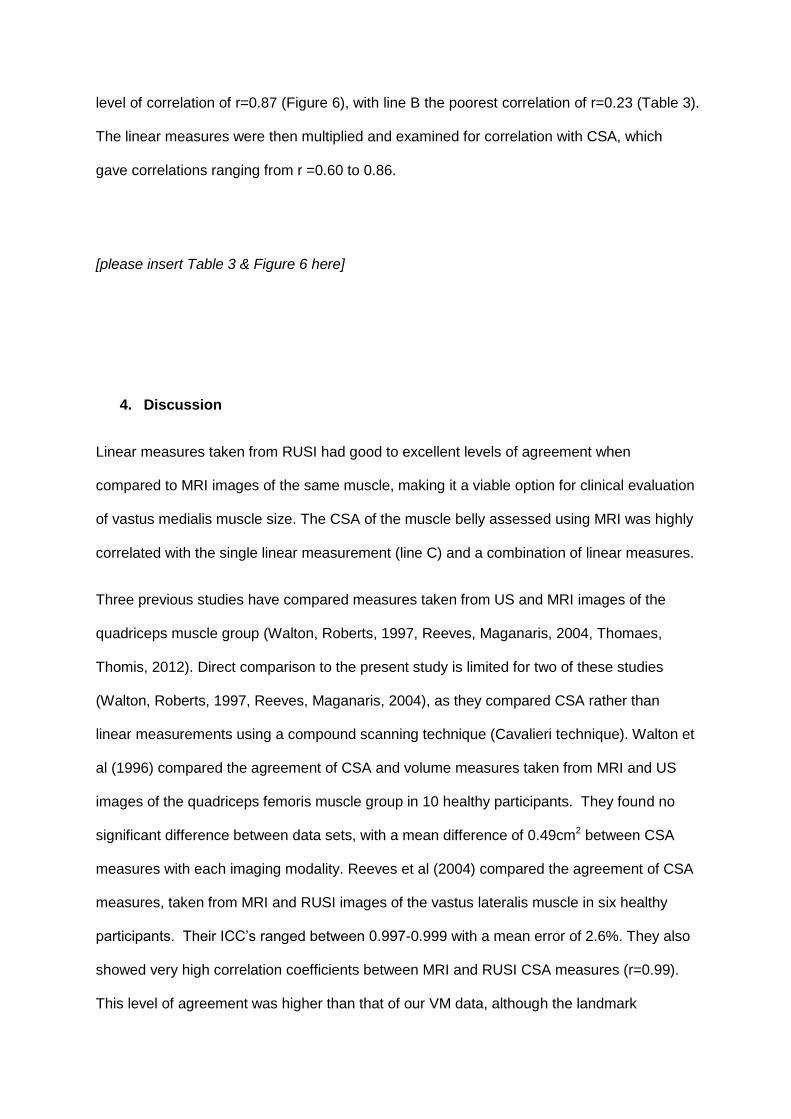
and minimal pressure was applied onto the muscle belly. Once the ultrasound images were
obtained (Figure 4), linear measures A, B and C (Figure 2) were taken offline using Image J,
with all measures being taken by the same investigator (FK) using the first RUSI image.
Measures of MRI scans were undertaken first and then the process was repeated with the
RUSI scans for all participants. The gap between the two sets of measures and their
analysis was at least two weeks. Participant codes were used to de-identify all images.
[please insert figures 3 & 4 here]
2.4 Reliability of measurements on MRI & RUSI scans
The reliability of the investigator’s ability to make repeated measurements on the same
scans on different days was high for CSA and linear measures on MRI scans (intra-class
correlation coefficient ICCs 0.95-0.99, confidence intervals 0.87-0.99) and linear
measurements on RUSI scans (ICCs 090-0.98, confidence intervals 0.45-0.98).
2.5 Statistical Analysis
Data were tested for normality of distribution using the Shapiro Wilks test. Subsequently
parametric descriptors for measurements were calculated (mean and standard deviations)
and compared between MRI and RUSI using ICCs (3,1) and Bland and Altman analysis. A
threshold ICC of 0.9 or above was used as this is an appropriate level of validity for
measures used for decision-making or diagnosis (Portney and Watkins, 2000). Paired t-test
was used to examine significant differences between measures using the two imaging
techniques. The relationship between linear and CSA measures of MRI data were examined
using Pearson’s correlation coefficients (r).
3. Results
3.1RUSI versus MRI
There were no significant differences in the linear measures using the two imaging
techniques (p>0.05), with mean differences ranging from 0.5-2.9mm (95% confidence
intervals -0.6 to 8.3mm, Table 1). Comparison of measures from RUSI and MRI using ICC
analysis showed good agreement for Line A, exceeding the threshold of ICC=0.9. Lower
agreement between modalities was found for Line B and C, which showed moderate
agreement of ICC 0.84 (Table 2). The Bland and Altman results support the ICC findings,
showing small mean differences (<1mm) and limits of agreement for linear measures A & B,
with greater differences (mean 2.9mm) between the measures for Line C (Table 2, Figure 5).
[please insert Tables 1 & 2, & Figure 5 here]
3.2 Correlation between linear measures and CSA
Pearson’s correlation coefficients ranged between 0.23 and 0.87 when comparing single and
combined linear measurements against CSA from the MRI scans. Line C had the highest
level of correlation of r=0.87 (Figure 6), with line B the poorest correlation of r=0.23 (Table 3).
The linear measures were then multiplied and examined for correlation with CSA, which
gave correlations ranging from r =0.60 to 0.86.
[please insert Table 3 & Figure 6 here]
4. Discussion
Linear measures taken from RUSI had good to excellent levels of agreement when
compared to MRI images of the same muscle, making it a viable option for clinical evaluation
of vastus medialis muscle size. The CSA of the muscle belly assessed using MRI was highly
correlated with the single linear measurement (line C) and a combination of linear measures.
Three previous studies have compared measures taken from US and MRI images of the
quadriceps muscle group (Walton, Roberts, 1997, Reeves, Maganaris, 2004, Thomaes,
Thomis, 2012). Direct comparison to the present study is limited for two of these studies
(Walton, Roberts, 1997, Reeves, Maganaris, 2004), as they compared CSA rather than
linear measurements using a compound scanning technique (Cavalieri technique). Walton et
al (1996) compared the agreement of CSA and volume measures taken from MRI and US
images of the quadriceps femoris muscle group in 10 healthy participants. They found no
significant difference between data sets, with a mean difference of 0.49cm2 between CSA
measures with each imaging modality. Reeves et al (2004) compared the agreement of CSA
measures, taken from MRI and RUSI images of the vastus lateralis muscle in six healthy
participants. Their ICC’s ranged between 0.997-0.999 with a mean error of 2.6%. They also
showed very high correlation coefficients between MRI and RUSI CSA measures (r=0.99).
This level of agreement was higher than that of our VM data, although the landmark
identification for vastus lateralis may have offered a better opportunity for more accurate and
repeatable measures. Finally, Thomaes et al (2012) assessed rectus femoris CSA using
RUSI and CT in a cohort of patients with coronary artery disease. Reliability of measures
was achieved (ICCs of 0.97) and the ICC computed between US and CT was 0.92 (95%CL:
0.81 - 0.97). The absolute difference between both techniques was 0.01 ± 0.12 cm (p = 0.66)
resulting in a typical percentage error of 4.4%.
Other studies comparing MRI and RUSI measures of different muscles have shown good
results but differing analytical techniques limits the comparison to the present study. The
CSA of lumbar multifidus was compared using MRI and RUSI at vertebral levels from L2 to
S1 and no significant differences were found, despite differences in position for imaging
(Hides, Richardson, 1995). Measures of cervical multifidus muscle from C4 to C6 was also
shown to be valid for thickness (R2 = 0.42 to 0.64) but not for CSA (R2 = 0.11 to 0.39) or
width (R2 = 0.16-0.69) (Lee, Tseng, 2007). The small CSA of the muscle (approximately 1
cm2) may have amplified errors, thus influence the accuracy of measurements. Finally, the
abdominal muscles were examined at rest and contraction with good agreement found
between RUSI and MRI for transversus abdominis and internal oblique muscles (ICC=0.84-
0.95) (Hides, Wilson, 2006).
The present study showed Line C was most highly correlated with VM CSA. However, this
was the measurement that showed the lowest agreement between MRI and RUSI (ICC 0.84).
Correlation values for lines A (r=0.66) and B (r=0.23) were too low to be of use clinically
(Kline, 1986) and their combinations with line C did not increase the predictive value. The
opposite was shown in lumbar multifidus, where the greatest correlations with CSA were for
combined linear measures (r<0.9) rather than any single measure (r=0.7 to 0.8) (Hides et al. ,
1992). This difference between studies may be explained by the contrasting shape between
the muscles. Linear measures of muscle size could be a clinically useful dimension when
CSA is unobtainable. Although CSA of vastus medialis can be estimated from a single linear
measure, Line C, it requires line A to be drawn (but not measured) in order to locate it. It
would be worth exploring other ways to measure VM muscle thickness, so that only one line
needs to be drawn, thus saving time.
4.1 Limitations
Only a small sample size was used for this validation study, which limited the statistical
power of the results and ability for conclusion to be generalised across differing populations.
However, it included more participants than most previous studies. A formal reliability study
was not conducted to test the investigator’s RUSI technique and obtaining measurements on
different days. The ability to measure the same scans on different days was, however,
shown to be highly reliable for both MRI and RUSI (all ICCs above 0.90). Further
examination of between-day and between observer (inter-rater) reliability is needed for VM,
as has been demonstrated for several other muscles (Whittaker et al 2007). Finally, since
the largest difference between modalities was found for line C, which was also found to have
the best correlation with CSA, a more clinically meaningful measurement of vastus medialis
size could be sought in future studies.
4.2 Recommendations
Linear measures of distal vastus medialis muscle can be measured using both MRI and
RUSI techniques. A single linear measurement of VM thickness, line C, was highly
correlated with CSA in the MRI images.
5. Conclusions
Linear measures made on RUSI scans were comparable to those on MRI scans, with small
mean differences, indicating that RUSI is a valid technique for measuring vastus medialis
muscle depth. The strong correlations found between a muscle thickness measure and CSA
using MRI images, indicated that the linear measure have potential to estimate CSA. The

validity of measuring muscle thickness might be improved by further research to find an even
more robust linear measurement of vastus medialis in cross section. (Walton, Roberts, 1997)
References
Berry PA, Teichtahl AJ, Galevska-Dimitrovska A, Hanna F, Wluka AE, Wang YC, et al. Vastus medialis
cross-sectional area is positively associated with patella cartilage and bone volumes in a pain-free
community-based population. Arthritis Research & Therapy. 2008;10:R143.
Engelina S, Robertson C, Moggridge J, Killingback A, Adds P. Using ultrasound to measure the fibre
angle of vastus medialis oblique: A cardaveric validation study. The Knee. 2012;in press.
Fagan V, Delahunt E. Patellofemoral pain syndrome: a review on the associated neuromuscular
deficits and current treatment options. Br J Sports Med. 2008;42:489-95.
Hides J, Wilson SJ, Stanton WR, McMahon S, Keto H, McMahon K, et al. An MRI investigation into the
function of the transversus abdominis muscle during "drawing-in" of the abdominal wall. Spine.
2006;31:E175-8.
Hides JA, Cooper DH, Stokes MJ. Diagnostic Ultrasound Imaging for Measurement of the Lumbar
Multifidus Muscle in Normal Young Adults. Physiotherapy Theory and Practice. 1992;8:19 - 26.
Hides JA, Richardson C, Jull G. Magnetic Resonance Imaging and Ultrasonography of the Lumbar
Multifidus Muscle: Comparison of Two Different Modalities. Spine. 1995;20:54-8.
Jan M-H, Lin D-H, Lin J-J, Lin C-HJ, Cheng C-K, Lin Y-F. Differences in Sonographic Characteristics of
the Vastus Medialis Obliquus Between Patients With Patellofemoral Pain Syndrome and Healthy
Adults. The American Journal of Sports Medicine. 2009;37:1743-9.
Kline P. A Handbook of Test Construction. London, UK: Methuen &Co Ltd; 1986.
Lankhorst NE, Bierm-Zeinstra SMA, van Middelkoop M. Risk Factors for Patellofemoral Pain
Syndrome: A Systematic Review. J Orthop Sports Phys Ther. 2012;42:81-A12.
Lee J-P, Tseng W-YI, Shau Y-W, Wang C-L, Wang H-K, Wang S-F. Measurement of segmental cervical
multifidus contraction by ultrasonography in asymptomatic adults. Manual Therapy. 2007;12:286-94.
Lin Y-F, Lin J-J, Cheng C-K, Lin D-H, Jan M-H. Association Between Sonographic Morphology of Vastus
Medialis Obliquus and Patellar Alignment in Patients With Patellofemoral Pain Syndrome. J Orthop
Sports Phys Ther. 2008;38:196-202.
Mendis MD, Wilson SJ, Stanton WR, Hides J. Validity of real-time ultrasound imaging to measure
anterior hip muscle size: a comparison with magnetic resonance imaging. . J Orthop Sports Phys Ther.
2010;40:577-81.
O'Sullivan C, Meaney J, Boyle G, Gormley J, Stokes M. The validity of Rehabilitative Ultrasound
Imaging for measurement of trapezius muscle thickness. Manual Therapy. 2009;14:572-8.
Portney L, Watkins M. Statistical measures of reliability. Foundations of Clinicial Research:
applications to practice. 2nd ed. New Jersey: Prentice Hall; 2000. p. 557-84.
Pretorius A, Keating JL. Validity of real time ultrasound for measuring skeletal muscle size. Physical
Therapy Reviews. 2008;13:415-26.
Reeves N, Maganaris C, Narici M. Ultrasonographic assessment of human skeletal muscle size.
European Journal of Applied Physiology. 2004;91:116-8.
Smith TO, Nichols R, Harle D, Donell ST. Do the vastus medialis obliquus and vastus medialis longus
really exist? A systematic review. Clin Anat. 2009;22:183-99.
Thomaes T, Thomis M, Onkelinx S, Coudyzer W, Cornelissen V, Vanhees L. Reliability and validity of
the ultrasound technique to measure the rectus femoris muscle diameter in older CAD-patients.
BMC Medical Imaging. 2012;12.
Walton JM, Roberts N, Whitehouse GH. Measurement of the quadriceps femoris muscle using
magnetic resonance and ultrasound imaging. Br J Sports Med. 1997;31:59-64.
Whittaker JL, Stokes M. Ultrasound imaging and muscle function (Review). J Orthop Sports Phys Ther.
2011;41:572-80.
Whittaker VJ, Teyhen D, Elliot J, Cook K, Langevin H, Dahl H, et al. Rehabilitative Ultrasound Imaging:
Understanding the Technology and Its Applications. J Orthop Sports Phys Ther. 2007;37:434-49.
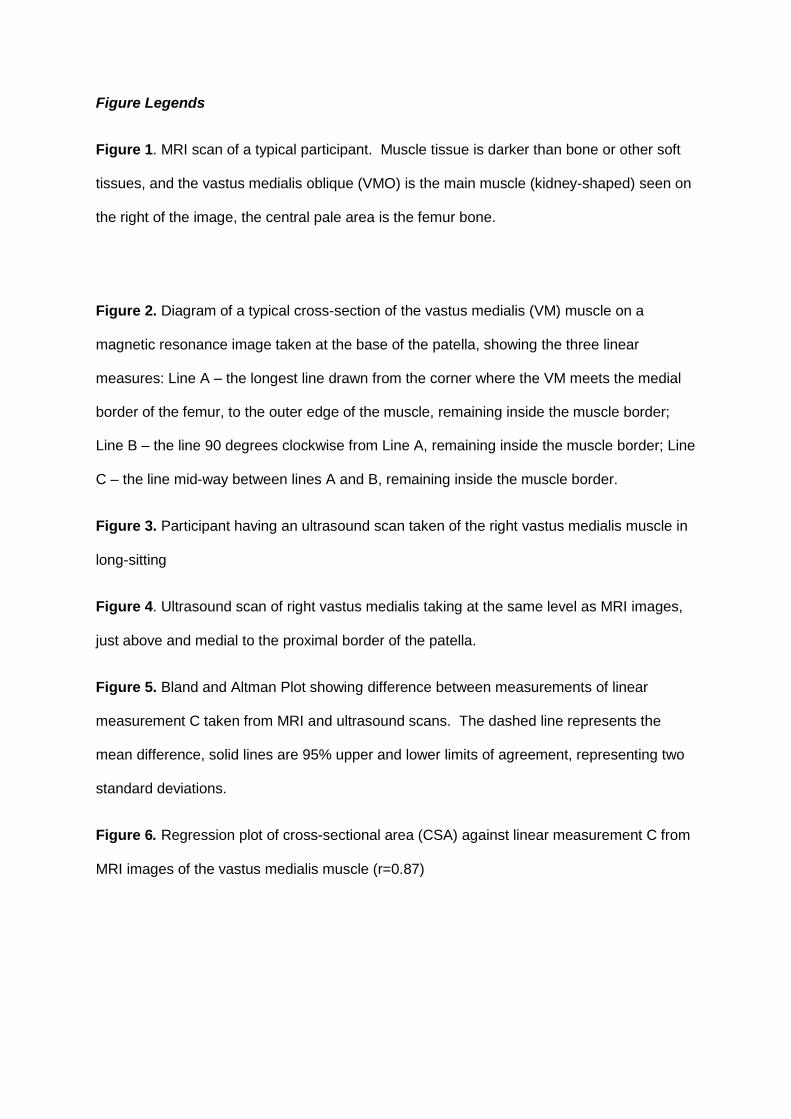
Figure Legends
Figure 1. MRI scan of a typical participant. Muscle tissue is darker than bone or other soft
tissues, and the vastus medialis oblique (VMO) is the main muscle (kidney-shaped) seen on
the right of the image, the central pale area is the femur bone.
Figure 2. Diagram of a typical cross-section of the vastus medialis (VM) muscle on a
magnetic resonance image taken at the base of the patella, showing the three linear
measures: Line A – the longest line drawn from the corner where the VM meets the medial
border of the femur, to the outer edge of the muscle, remaining inside the muscle border;
Line B – the line 90 degrees clockwise from Line A, remaining inside the muscle border; Line
C – the line mid-way between lines A and B, remaining inside the muscle border.
Figure 3. Participant having an ultrasound scan taken of the right vastus medialis muscle in
long-sitting
Figure 4. Ultrasound scan of right vastus medialis taking at the same level as MRI images,
just above and medial to the proximal border of the patella.
Figure 5. Bland and Altman Plot showing difference between measurements of linear
measurement C taken from MRI and ultrasound scans. The dashed line represents the
mean difference, solid lines are 95% upper and lower limits of agreement, representing two
standard deviations.
Figure 6. Regression plot of cross-sectional area (CSA) against linear measurement C from
MRI images of the vastus medialis muscle (r=0.87)
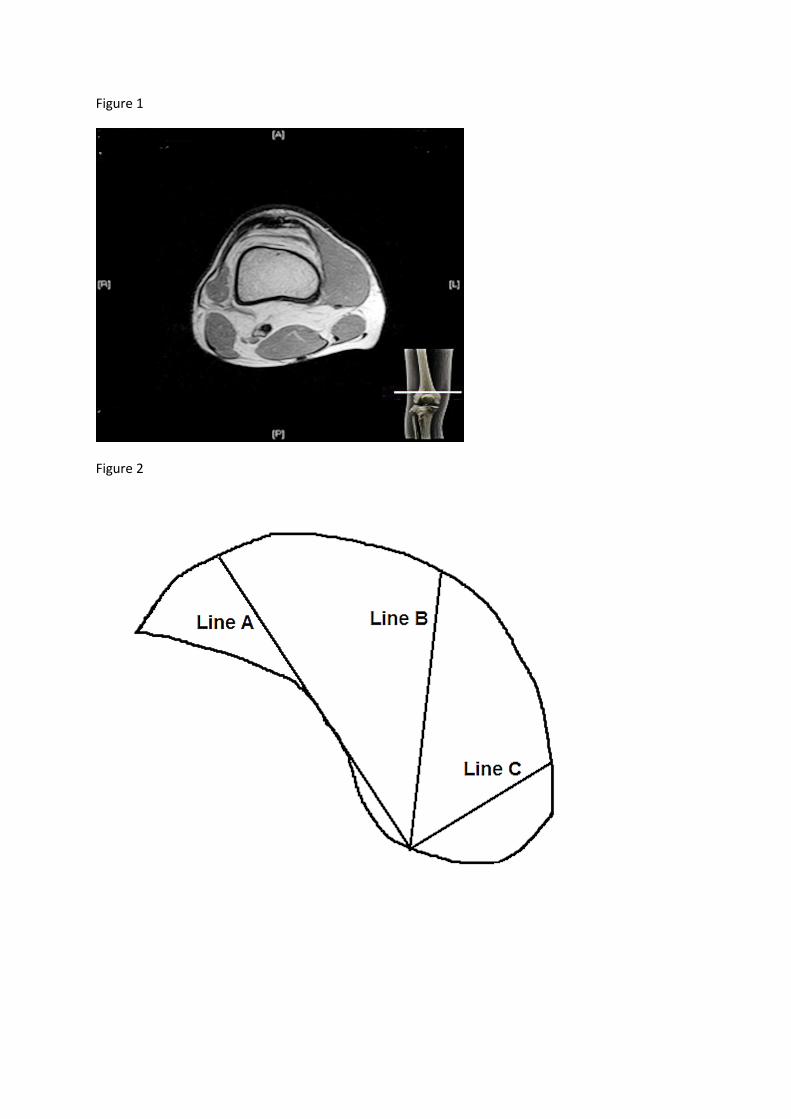
Figure 1
Figure 2
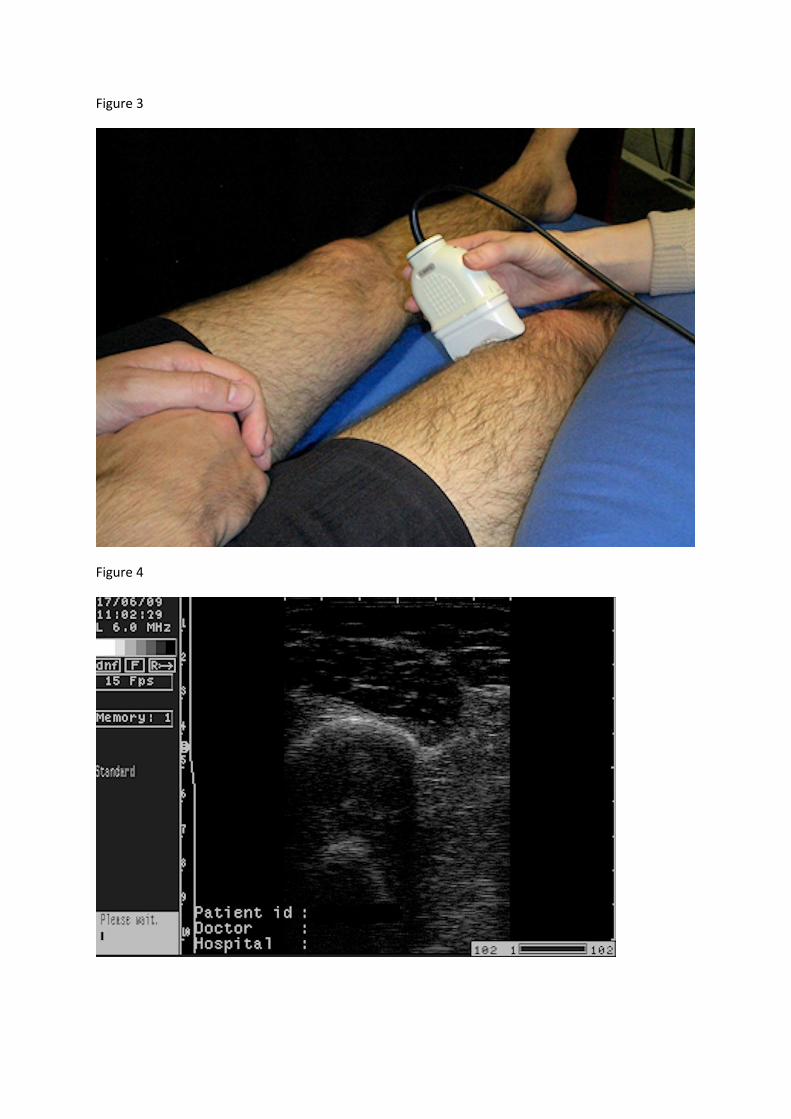
Figure 3
Figure 4
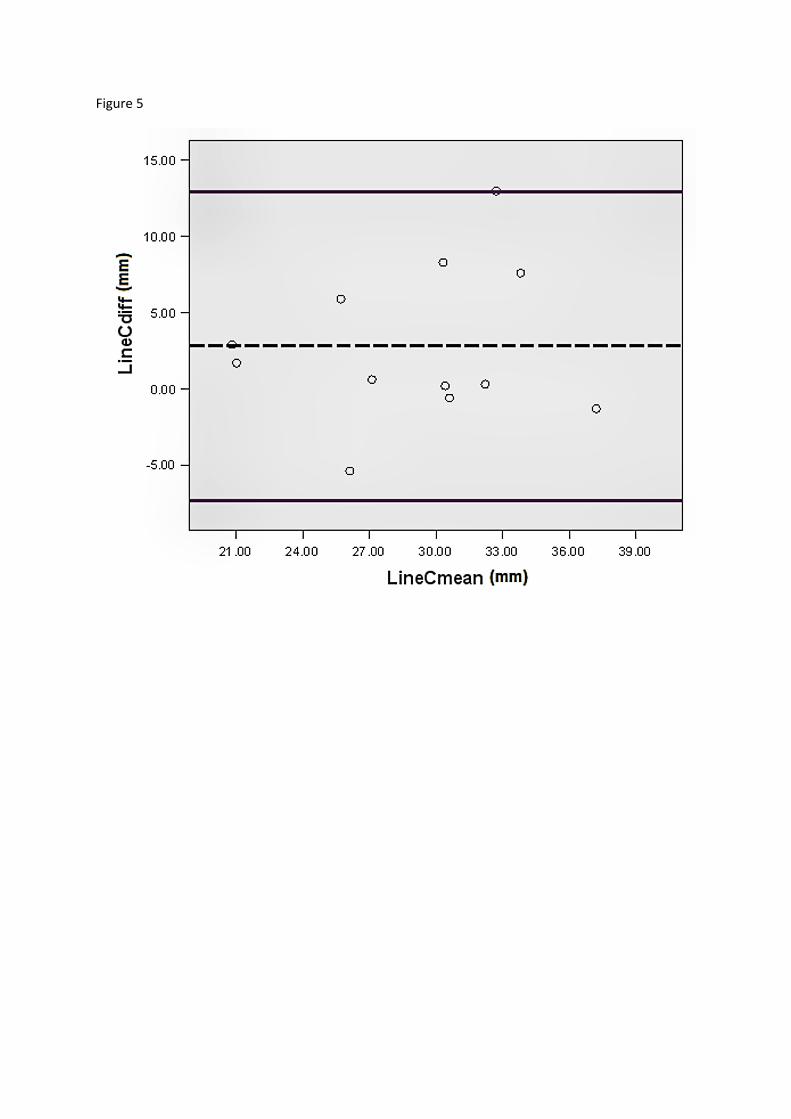
Figure 5
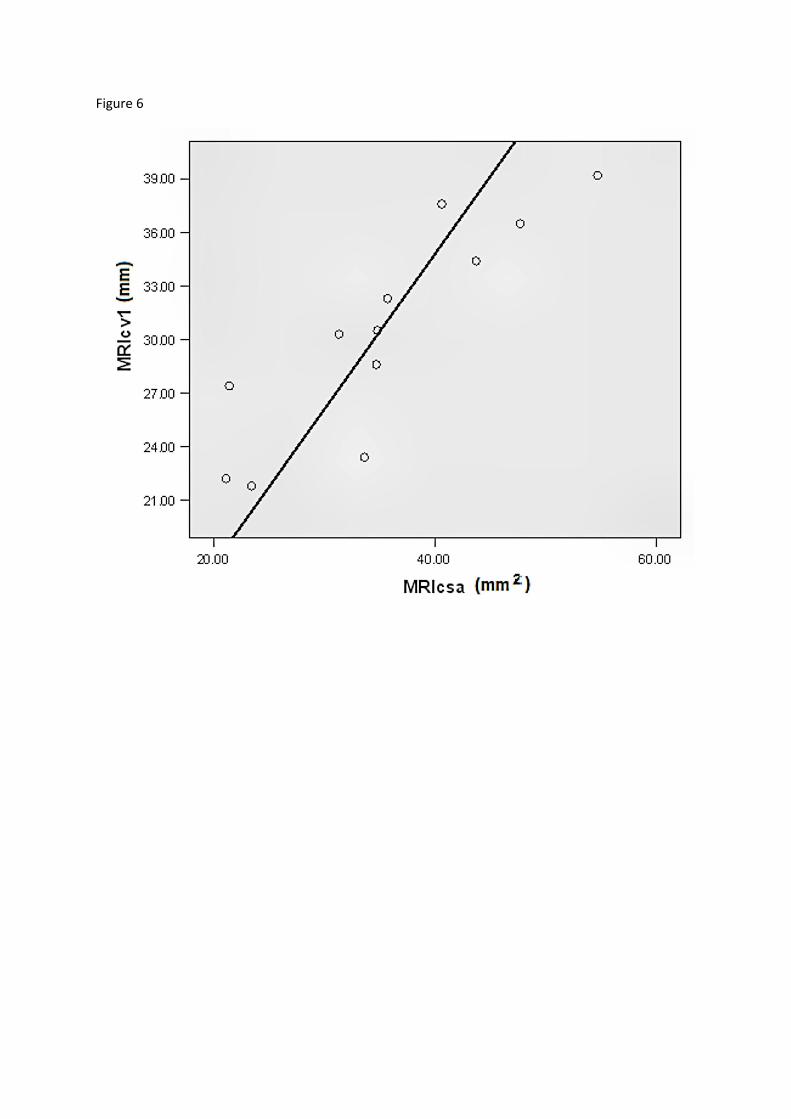
Figure 6
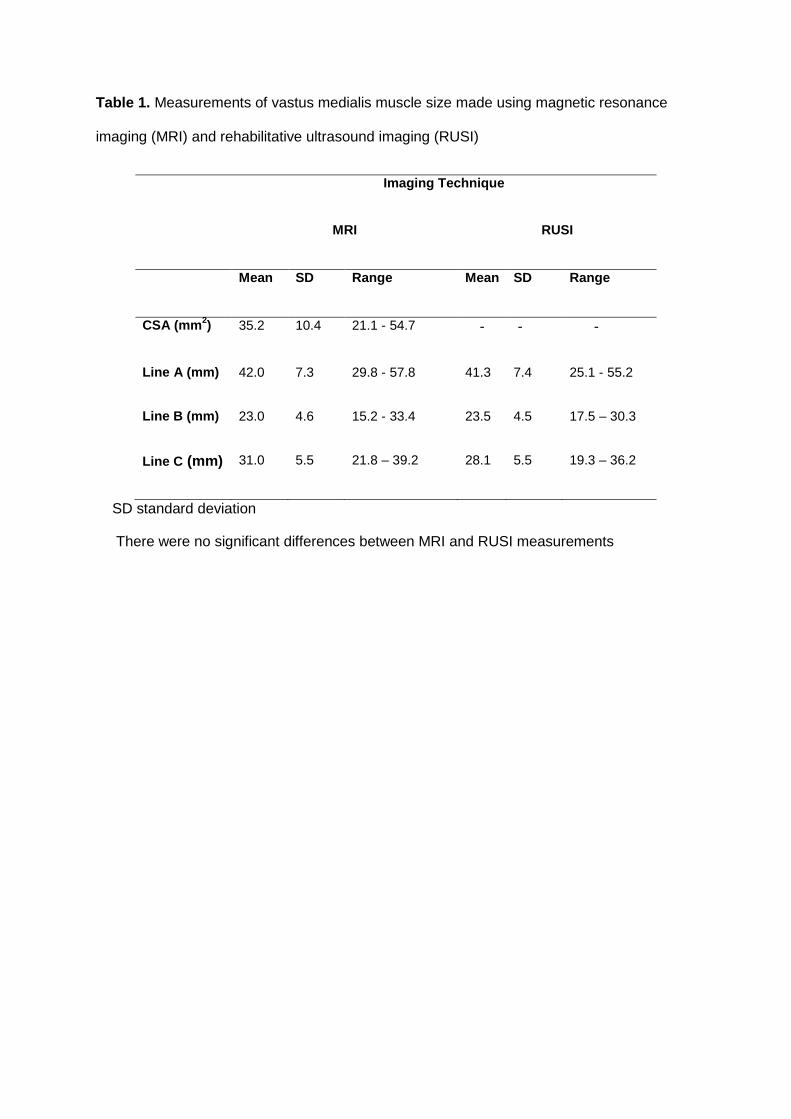
Table 1. Measurements of vastus medialis muscle size made using magnetic resonance
imaging (MRI) and rehabilitative ultrasound imaging (RUSI)
Imaging Technique
MRI RUSI
Mean SD Range Mean SD Range
CSA (mm2) 35.2 10.4 21.1 - 54.7 - - -
Line A (mm) 42.0 7.3 29.8 - 57.8 41.3 7.4 25.1 - 55.2
Line B (mm) 23.0 4.6 15.2 - 33.4 23.5 4.5 17.5 – 30.3
Line C (mm) 31.0 5.5 21.8 – 39.2 28.1 5.5 19.3 – 36.2
SD standard deviation
There were no significant differences between MRI and RUSI measurements
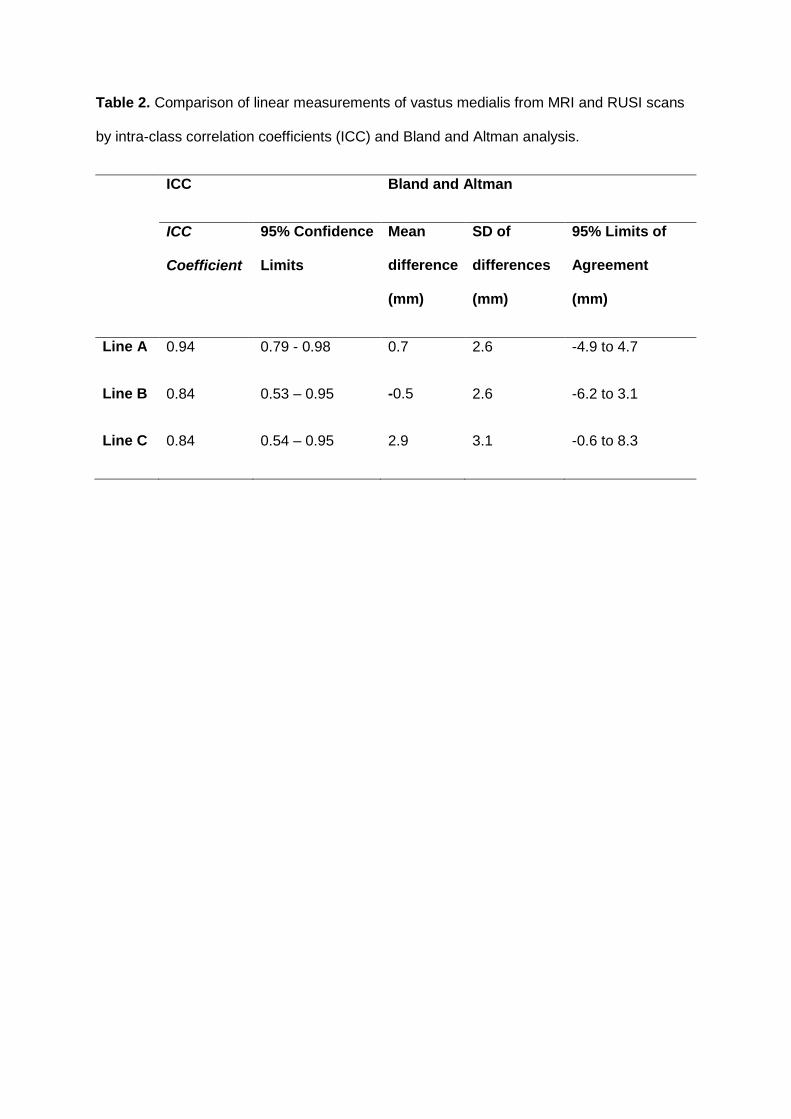
Table 2. Comparison of linear measurements of vastus medialis from MRI and RUSI scans
by intra-class correlation coefficients (ICC) and Bland and Altman analysis.
ICC Bland and Altman
ICC
Coefficient
95% Confidence
Limits
Mean
difference
(mm)
SD of
differences
(mm)
95% Limits of
Agreement
(mm)
Line A 0.94 0.79 - 0.98 0.7 2.6 -4.9 to 4.7
Line B 0.84 0.53 – 0.95 -0.5 2.6 -6.2 to 3.1
Line C 0.84 0.54 – 0.95 2.9 3.1 -0.6 to 8.3
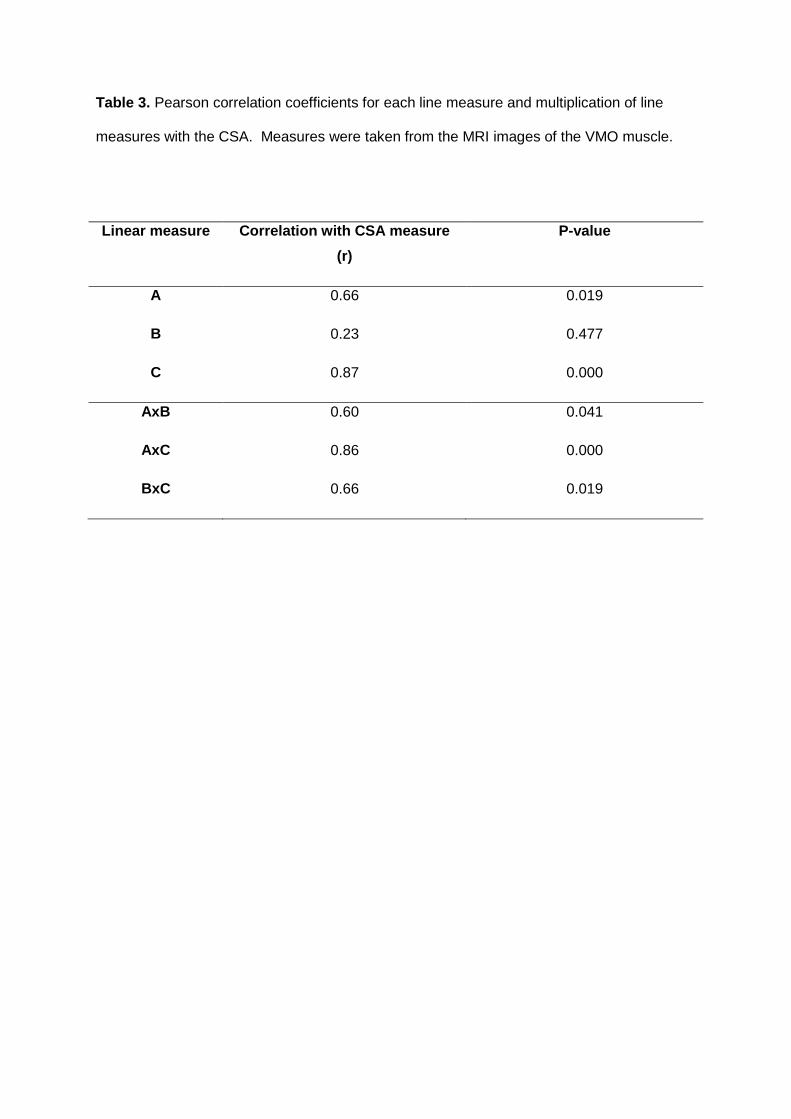
Table 3. Pearson correlation coefficients for each line measure and multiplication of line
measures with the CSA. Measures were taken from the MRI images of the VMO muscle.
Linear measure Correlation with CSA measure
(r)
P-value
A 0.66 0.019
B 0.23 0.477
C 0.87 0.000
AxB 0.60 0.041
AxC 0.86 0.000
BxC 0.66 0.019
Copyright © 2022 FDOKUMEN