Validation of shear wave elastography in skeletal muscle
17
Validation of Shear Wave Elastography in Skeletal Muscle Sarah F. Eby 1,5 , Pengfei Song 2,3 , Shigao Chen 3 , Qingshan Chen 3 , James F. Greenleaf 3,4 , and Kai-Nan An 5 1 Medical Scientist Training Program, Mayo Clinic College of Medicine, Rochester, MN 2 Mayo Graduate School, Mayo Clinic College of Medicine, Rochester, MN 3 Physiology and Biomedical Engineering, Mayo Clinic College of Medicine, Rochester, MN 4 Cardiovascular Diseases, Mayo Clinic College of Medicine, Rochester, MN 5 Biomechanics Laboratory, Division of Orthopedic Research, Mayo Clinic, Rochester, MN Abstract Skeletal muscle is a very dynamic tissue, thus accurate quantification of skeletal muscle stiffness throughout its functional range is crucial to improve the physical functioning and independence following pathology. Shear wave elastography (SWE) is an ultrasound-based technique that characterizes tissue mechanical properties based on the propagation of remotely induced shear waves. The objective of this study is to validate SWE throughout the functional range of motion of skeletal muscle for three ultrasound transducer orientations. We hypothesized that combining traditional materials testing (MTS) techniques with SWE measurements will show increased stiffness measures with increasing tensile load, and will correlate well with each other for trials in which the transducer is parallel to underlying muscle fibers. To evaluate this hypothesis, we monitored the deformation throughout tensile loading of four porcine brachialis whole-muscle tissue specimens, while simultaneously making SWE measurements of the same specimen. We used regression to examine the correlation between Young's modulus from MTS and shear modulus from SWE for each of the transducer orientations. We applied a generalized linear model to account for repeated testing. Model parameters were estimated via generalized estimating equations. The regression coefficient was 0.1944, with a 95% confidence interval of (0.1463 – 0.2425) for parallel transducer trials. Shear waves did not propagate well for both the 45° and perpendicular transducer orientations. Both parallel SWE and MTS showed increased stiffness with increasing tensile load. This study provides the necessary first step for additional studies that can evaluate the distribution of stiffness throughout muscle. Keywords Ultrasonography; passive stiffness; materials testing; elastic moduli; shear wave elastography © 2013 Elsevier Ltd. All rights reserved. Corresponding Author: Kai-Nan An, 200 First St. SW, Rochester, MN 55905, Voice: (507)538-1717, Fax: (507)284-5392, [email protected]. Conflict of interest statement: The authors do not have any financial or personal relationships to disclose that could have inappropriately biased this work. Publisher's Disclaimer: This is a PDF file of an unedited manuscript that has been accepted for publication. As a service to our customers we are providing this early version of the manuscript. The manuscript will undergo copyediting, typesetting, and review of the resulting proof before it is published in its final citable form. Please note that during the production process errors may be discovered which could affect the content, and all legal disclaimers that apply to the journal pertain. NIH Public Access Author Manuscript J Biomech. Author manuscript; available in PMC 2014 September 27. Published in final edited form as: J Biomech. 2013 September 27; 46(14): . doi:10.1016/j.jbiomech.2013.07.033. NIH-PA Author Manuscript NIH-PA Author Manuscript NIH-PA Author Manuscript
-
Upload
mayoclinic -
Category
Documents
-
view
0 -
download
0
Transcript of Validation of shear wave elastography in skeletal muscle
Validation of Shear Wave Elastography in Skeletal Muscle
Sarah F. Eby1,5, Pengfei Song2,3, Shigao Chen3, Qingshan Chen3, James F. Greenleaf3,4,and Kai-Nan An5
1Medical Scientist Training Program, Mayo Clinic College of Medicine, Rochester, MN2Mayo Graduate School, Mayo Clinic College of Medicine, Rochester, MN3Physiology and Biomedical Engineering, Mayo Clinic College of Medicine, Rochester, MN4Cardiovascular Diseases, Mayo Clinic College of Medicine, Rochester, MN5Biomechanics Laboratory, Division of Orthopedic Research, Mayo Clinic, Rochester, MN
AbstractSkeletal muscle is a very dynamic tissue, thus accurate quantification of skeletal muscle stiffnessthroughout its functional range is crucial to improve the physical functioning and independencefollowing pathology. Shear wave elastography (SWE) is an ultrasound-based technique thatcharacterizes tissue mechanical properties based on the propagation of remotely induced shearwaves. The objective of this study is to validate SWE throughout the functional range of motion ofskeletal muscle for three ultrasound transducer orientations. We hypothesized that combiningtraditional materials testing (MTS) techniques with SWE measurements will show increasedstiffness measures with increasing tensile load, and will correlate well with each other for trials inwhich the transducer is parallel to underlying muscle fibers. To evaluate this hypothesis, wemonitored the deformation throughout tensile loading of four porcine brachialis whole-muscletissue specimens, while simultaneously making SWE measurements of the same specimen. Weused regression to examine the correlation between Young's modulus from MTS and shearmodulus from SWE for each of the transducer orientations. We applied a generalized linear modelto account for repeated testing. Model parameters were estimated via generalized estimatingequations. The regression coefficient was 0.1944, with a 95% confidence interval of (0.1463 –0.2425) for parallel transducer trials. Shear waves did not propagate well for both the 45° andperpendicular transducer orientations. Both parallel SWE and MTS showed increased stiffnesswith increasing tensile load. This study provides the necessary first step for additional studies thatcan evaluate the distribution of stiffness throughout muscle.
KeywordsUltrasonography; passive stiffness; materials testing; elastic moduli; shear wave elastography
© 2013 Elsevier Ltd. All rights reserved.
Corresponding Author: Kai-Nan An, 200 First St. SW, Rochester, MN 55905, Voice: (507)538-1717, Fax: (507)284-5392,[email protected].
Conflict of interest statement: The authors do not have any financial or personal relationships to disclose that could haveinappropriately biased this work.
Publisher's Disclaimer: This is a PDF file of an unedited manuscript that has been accepted for publication. As a service to ourcustomers we are providing this early version of the manuscript. The manuscript will undergo copyediting, typesetting, and review ofthe resulting proof before it is published in its final citable form. Please note that during the production process errors may bediscovered which could affect the content, and all legal disclaimers that apply to the journal pertain.
NIH Public AccessAuthor ManuscriptJ Biomech. Author manuscript; available in PMC 2014 September 27.
Published in final edited form as:J Biomech. 2013 September 27; 46(14): . doi:10.1016/j.jbiomech.2013.07.033.
NIH
-PA Author Manuscript
NIH
-PA Author Manuscript
NIH
-PA Author Manuscript

1. IntroductionNormal skeletal muscle stiffness results from active tension produced by muscle contractionand passive tension produced largely by connective tissue (Hill, 1938; Huxley, 1957). Whilethe manifestations of deficits in the active component are readily diagnosed andunmistakably detrimental to daily function (NIMSD Consortium, 1996; Fried et al, 2001),analogous alterations in the passive component are less understood. This apparent lack ofinformation should not imply that passive skeletal muscle stiffness does not play a key rolein skeletal muscle growth, metabolism, or function – as it is integral for all three (Jaspers etal, 1999; Kjaer, 2004; Tatsumi et al, 2006; Werle, 2008). Numerous in vitro studies haveidentified the connective tissue network of collagen within the extracellular matrix (ECM)as a key contributor to passive stiffness in a variety of skeletal muscles (Bensamoun et al,2006; Borg and Caulfield, 1980; S. H. Brown et al, 2012; Rowe et al, 2010). It is becomingincreasingly apparent that the ECM is vital for mechanotransduction, as well as musclegrowth and adaptation (Jaspers et al., 1999; Kjaer, 2004; Tatsumi et al, 2006; Werle, 2008).Later research indicates that passive stiffness may also play a role in muscle performanceand adaptation to exercise (Fouré et al, 2011). Increased collagen content and stiffness areseen in numerous musculoskeletal pathologies, including spasticity (M. Brown et al, 1999;Damiano et al, 2001; Gracies, 2005; Vaz et al., 2006), as well as typical aging (Alnaqeeb etal, 1984; Botelho et al, 1954; Larsson et al, 1979; Tomonaga, 1977). It is clear that musclestiffness is closely related to joint constraint – increased muscle stiffness is associated withpoor range of motion, while reductions in muscle stiffness may predispose to jointsubluxation (Johns and Wright, 1962; Vandervoort, 1999). Unfortunately, in vivo passivestiffness measures historically focused primarily on either qualitative measures (Park andKwon, 2012) or the stiffness of entire joints and muscle groups (Sinkjaer and Magnussen,1994), thus limiting the advancement of our clinical and scientific understanding. Reliable,noninvasive, quantitative techniques for measuring and monitoring skeletal muscle stiffnessare necessary not only to advance our understanding of the mechanism and effects of alteredskeletal muscle stiffness but also to improve diagnosis and treatment following injury.
A number of techniques are currently available for monitoring muscle stiffness in vivo.Myotonometry is quick and inexpensive, but tends to be superficial or merely qualitative(Bizzini and Mannion, 2003; Park and Kwon, 2012). Stretch-release techniques elegantlydistinguish the stretch reflex stiffness from intrinsic joint stiffness (Sinkjaer et al., 1988), butare unable to quantify the mechanical properties of individual skeletal muscles. Similarly,range of motion measures can quantify resistance to movement, but also evaluates theproperties of entire joints and are unable to target individual muscles for assessment (Rabitaet al., 2005). Magnetic resonance elastography shows great promise for quantifying thestiffness of whole muscles and muscle groups across a range of ages and contraction levels(Debernard et al, 2011a; 2011b), but is costly and lacks real-time application (Jenkyn et al,2003). Ultrasound shows great utility in evaluating underlying architecture of moresuperficial muscles (Rutherford and Jones, 1992), and a variety of techniques have beenused to evaluate muscle stiffness (Park and Kwon, 2012), even in concert with magneticresonance elastography (Debernard et al, 2013), but, until recently, ultrasound has beenpurely qualitative. As skeletal muscle is a very dynamic tissue, an ideal technique would becapable of real-time measurement to quantify skeletal muscle stiffness throughout itsfunctional range. Such a technique should be sensitive to small changes in stiffness andcapable of determining material properties in light of the functionally relevant and oftencomplex skeletal muscle architecture.
Quantitative ultrasound elastography is beginning to emerge as a promising diagnostic toolfor evaluating the mechanical properties of skeletal muscle. Unlike earlier qualitativeultrasound elastography techniques, Shear wave elastography (SWE) is an ultrasound-based
Eby et al. Page 2
J Biomech. Author manuscript; available in PMC 2014 September 27.
NIH
-PA Author Manuscript
NIH
-PA Author Manuscript
NIH
-PA Author Manuscript

technique that can characterize tissue mechanical properties based on the propagation ofremotely induced shear waves (Bercoff et al, 2004; Chen et al., 2009; Palmeri et al., 2008;Sarvazyan et al, 1998). Shear modulus can be readily calculated from the measured shearwave propagation velocity and tissue density (Yamakoshi et al., 1990). A variety ofultrasound-based elastography techniques have been compared with magnetic resonanceelastography, with good agreement in a variety of tissues and phantoms (Bensamoun et al,2008; Dutt et al, 2000; Oudry et al., 2009). Several investigators have begun to apply similarultrasound techniques and it is clear that increased skeletal muscle force production isassociated with increased stiffness (Gennisson et al, 2005; 2010; Shinohara et al, 2010; Zhaoet al, 2009). While these experiments are of great value, up until now no study has comparedultrasound elastography results with traditional materials testing for skeletal muscle. Toensure investigators are obtaining robust and meaningful results, baseline reliability andvalidity information must be obtained for the application of such novel techniques toanisotropic and inhomogeneous skeletal muscle tissue. Gennisson and colleagues found thatshear waves propagate much more readily along beef muscle fibers longitudinally, ascompared to perpendicularly or any interval of rotation therein (Gennisson et al, 2003).Later investigations support these initial findings, as parallel transducer orientationsobtained the most reliable measures of muscle elasticity (Gennisson et al, 2010). Despite therecent advances applying ultrasound elasticity imaging to skeletal muscle, these techniquesare yet to be validated taking into account the mobility and dynamic properties of skeletalmuscle. The purpose of this study was to validate SWE throughout the functional range ofmotion of skeletal muscle. We hypothesized that combining traditional materials testingtechniques with SWE measurements will show increased stiffness measures with increasingtensile load, and will correlate well with each other throughout the tensile range when theultrasound transducer is oriented parallel to the muscle fibers.
2. MethodsSpecimen Preparation
We obtained four right brachialis whole-muscle samples immediately post-mortem from 6-to 9-month old female swine. All animal care was in accordance with the Mayo ClinicInstitutional Animal Care and Use Committee guidelines. We completed all muscle testingwithin five hours of sacrifice, so rigor mortis was not expected to play a significant role inthe mechanical testing (van Ee et al, 2000). At the time of sacrifice, all animals wereeuthanized with injections of telazol (2.5 cc, 100 mg/ml), heparin (10 cc, 1000 units/ml), andFatal Plus (Vortech Pharmaceuticals, Dearborn, MI; 15 cc, pentobarbital sodium: 390 mg/ml, propylene glycol: 0.01 mg/ml, ethyl alcohol: 0.26 mg/ml, benzyl alcohol 0.2 mg/ml).Following dissection and visualization of the intact brachialis, we flexed the forelimb in situto 90° and fully extended to 180° at the elbow to establish the muscle's initial (L0) and final(L1) lengths, respectively. Both lengths were obtained by measuring from origin, just underthe humeral head, to insertion, on the fused radius and ulna. We then harvested the intactbrachialis from origin to insertion, preserving and harvesting both bony attachments tofacilitate later mechanical testing. In the interest of facilitating material testing and to controlfor individual variability between swine, we did not retain surrounding soft tissues (adjacentmusculature, overlying adipose tissue and skin, etc.) Following harvest, we kept the muscletissue cool and moist with chilled saline. Prior to testing, both the proximal humeralattachment and distal radioulnar attachment were placed in collars and fixed with bonecement (polymethylmethacrylate).
Materials TestingWe mounted the specimen on a materials testing machine (model 312; MTS, Minneapolis,MN) for simultaneous tensile testing and SWE ultrasound evaluation, as indicated in Figure
Eby et al. Page 3
J Biomech. Author manuscript; available in PMC 2014 September 27.
NIH
-PA Author Manuscript
NIH
-PA Author Manuscript
NIH
-PA Author Manuscript

1. The collars holding the humeral and radioulnar bone segments were fixed vertically onthe actuator using custom-designed attachments, replicating the normal anatomicrelationship between the two bones. We used the materials testing system (MTS) to stretchthe tissue specimen to its initial length, as previously measured in situ at 90° flexion. Wemanually measured the thickness and width of the muscle at mid-belly, assuming an ellipse,to estimate cross-sectional area (CSA) in the location where SWE measurements would betaken. The same individual obtained all measurements throughout the study to reducevariability. Each specimen underwent displacement-controlled tensile testing from initiallength to final length, at ~1.15% L0 per second, with simultaneous ultrasoundmeasurements. A load cell (model 3397; Lebow Products, Troy, MI; Accuracy: 0.05%)measured force throughout the testing procedure. We collected all MTS force anddisplacement data at 20 Hz. The specimen was preconditioned for 6 cycles prior to tensiletesting using the same loading protocol. We conducted all testing at room temperature (22°C) and kept the specimen moist with saline and held at L0 between each tensile test, aspreviously documented for similar studies (Gottsauner-Wolf et al, 1995). A digital outputsignal sent from the MTS to the Verasonics ultrasound system (Verasonics Inc., Redmond,WA) triggered and synchronized ultrasound SWE measures with MTS data acquisition. Thedigital output signal began with the start of MTS displacement and immediately triggeredthe first Verasonics acquisition, which we programmed to automatically acquire additionalmeasures every 1.5 – 2.0 seconds, depending on the loading rate and overall displacement.We obtained ten ultrasound measures at regular, prescribed intervals throughout eachcontinuous tensile test.
From the collected MTS data, we calculated strain by dividing the displacement data byinitial length, and plotted the stress-strain curve, using CSA calculated from the initialmeasurements. We defined Young's modulus as the slope between ten consecutive MTSdata points from the stress-strain curve. Using this approach, Young's modulus wascalculated for each of the ten SWE time points.
Shear Wave ElastographyPrior to tensile testing, we fixed a linear-array ultrasound transducer (L7-4, center frequency= 5 MHz, Philips Healthcare, Andover, MA) over the middle third of the muscle specimen.We attached the transducer to a custom-built device that maintained constant, minimalpressure between the ultrasound transducer and the underlying muscle tissue throughouteach tensile test. Since all mechanical testing was well-within the submaximal range, wetested multiple transducer orientations for each muscle specimen. By gross inspection andbrief B-mode ultrasound examination, we determined that the majority of fibers in the swinebrachialis were aligned parallel with the long axis of the muscle. We manipulated thealignment of the transducer with respect to the long axis of the muscle, testing threeorientations: ultrasound transducer aligned 1) parallel, 2) at a 45° angle, and 3)perpendicularly, as indicated in Figure 2, along with sample B-mode images to demonstrateunderlying muscle structure. We made all ultrasound measures at the midsection of themuscle belly to limit the effects of regional alterations in structure or stiffness. We repeatedmeasures five times for each transducer orientation, for a total of 15 trials with each musclesample. A focused ultrasound “push” beam (fixed focal depth at mid-depth of the musclesample, push duration = 600 μs, center frequency = 4.1 MHz) transmitted by 40 elements ofthe transducer generated shear waves in the muscle tissue specimen as shown in Figure 3.After the push, the Verasonics system immediately switched to flash imaging mode andused the same transducer to detect propagation of the shear waves for about 20 ms at a framerate of 7.6 kHz. Shear wave particle velocity signal at the focal depth of the push beam wasaveraged over 10 wavelengths (corresponding to an axial range of 3 mm along the beam axisto improve signal-to-noise ratio. Shear wave speed was then estimated using a time-to-peak
Eby et al. Page 4
J Biomech. Author manuscript; available in PMC 2014 September 27.
NIH
-PA Author Manuscript
NIH
-PA Author Manuscript
NIH
-PA Author Manuscript

method at different lateral distance (lateral range of shear wave data analysis is about 15mm) from the push beam center through linear regression (Palmeri et al, 2008). Finally,shear modulus throughout the tensile range of each muscle specimen was converted from theshear wave speed measurements using Equation (1):
(1)
where μ is shear modulus, cs is shear wave propagation velocity, and ρ is density, which canbe assumed to be 1000 kg/m3 for all soft tissues.
Sample B-mode images are included in Figure 2. We acquired these via the Aixplorer(SuperSonic Imagine, Aix-en-Provence, France) ultrasound system, using the SL15-4transducer in the MSK/Superficial MSK mode (center frequency = 8.5 MHz). We used thisadditional imaging system to obtain B-mode images that clearly demonstrate the underlyingtissue organization. It was necessary to use the Verasonics equipment to ensure propersynchronization between the SWE measures and the MTS force and displacement data,which is not available on the Aixplorer machine. Furthermore, the Verasonics equipmentenabled us to control the focal depth of the push beam so that strong shear waves could begenerated at the region of interest from which the most robust shear wave speedmeasurements could be achieved using a 1D time-to-peak fitting technique. For thesereasons, we used the Verasonics system for SWE measurements in this study.
Data AnalysisWe used regression to examine the correlation between Young's modulus from MTS andshear modulus from SWE for each of the transducer orientations. However, as we testedevery muscle specimen multiple times for each axial loading trial, individual data pointswere not independent of each other and thus conducting a simple linear regression was notpossible. To account for repeated testing of each muscle specimen, we used a generalizedlinear model to run the regression. We estimated the parameters for the model usinggeneralized estimating equations (GEE) via the GENMOD procedure in Statistical AnalysisSoftware version 9.3 (SAS Institute Inc., Cary, NC). GEE are designed to optimally weightobservations from repeated-measures data sets to accurately estimate regression parameters,and thus were well-suited for this analysis (Liang and Zeger, 1986; Zeger and Liang, 1986).The GENMOD procedure, using the “repeated” statement, properly accounts for therepeated testing of this study, though does not output a typical coefficient of determination.For this reason, we manually calculated the goodness-of-fit R2 statistic using Equation 2:
(2)
where ŷi are the values predicted by the GENMOD procedure, ȳ is the mean of allobservations, and yi are the observations (Moore et al, 2012).
3. ResultsAll four brachialis specimens displayed similar trends throughout tensile testing and werethus grouped together for subsequent analysis. The descriptive statistics for the four swinebrachialis specimens are included in Table 1. Young's moduli increased with increasingdisplacement throughout the tensile test for all specimens, as demonstrated by the
Eby et al. Page 5
J Biomech. Author manuscript; available in PMC 2014 September 27.
NIH
-PA Author Manuscript
NIH
-PA Author Manuscript
NIH
-PA Author Manuscript

representative set of elastic moduli-displacement curves are included in Figure 4. All otherspecimens displayed similar behavior. Shear moduli also increased with increasing strain fortrials utilizing parallel ultrasound transducer orientation. Only slight increases were seenwith either 45° or perpendicular transducer orientations.
GEE analyses of all observations from all four specimens are included in Table 2. Theseresults indicate a significant correlation between Young's modulus and shear modulus forparallel transducer orientation (p < 0.0001). The regression coefficient was 0.1944, with a95% confidence interval of (0.1463 – 0.2425). Scatterplots of all Young's moduli and shearmoduli from the parallel transducer trials, with associated generalized linear modelregression lines, are included in Figure 5. The parameters for 45° and perpendiculartransducer orientations were near zero and nonsignificant (0.0061; p = 0.1077, and 0.0043; p= 0.2435, respectively).
4. DiscussionAs hypothesized, both parallel SWE and MTS showed increased stiffness measures withincreasing tensile load. These techniques also correlated well with each other throughout thetensile range, as indicated by the GEE parameter estimate for shear modulus obtained withparallel transducer orientation. The notable discrepancy between shear modulus (via SWE)and Young's modulus (via MTS) for 45° and perpendicular ultrasound transducerorientations was well-anticipated, as it is understood that shear waves propagate much morereadily along fibers rather than across them (Gennisson et al, 2003). These findings illustratethe necessity to closely consider muscle architecture when making ultrasound elastographymeasures.
Numerous structural aspects of the swine brachialis made it very well-suited for thisinvestigation. As tendon compliance may contribute significantly to increases in length formuscle-tendon units under tension (Herbert et al, 2011; 2002), it was important to minimizethe opportunities for tendon strain in this investigation. The swine brachialis has negligibletendon at both the origin and insertion, which allowed us to reasonably assume minimaltendon strain. As seen in Figure 1, the swine brachialis originated on the humerus just distalto the humeral head, and had only one head of origin, unlike the two often seen in humans(Leonello et al, 2007). The fibers converged distally to a very short aponeurosis where thebrachialis inserted into the ulna, which is fused with the radius in swine. By both grossinspection and ultrasound evaluation, we found the brachialis to have largely parallel fiberorientation, similar to other quadruped mammals such as the canine, as well as humans(Hulse et al, 2010; Leonello et al, 2007; Lieber et al, 1992).
The findings from this study compare well with those from earlier work by Gennisson andcolleagues evaluating skeletal muscle throughout normal range of motion. Their studyapplied similar technologies to human biceps muscle for elbow angles ranging from 90° to165°, reporting shear moduli values ranging from 5.40 kPa at 90° to 29.54 kPa at 165° forparallel transducer trials. The present study evaluating swine brachialis found a mean shearmodulus 5.81 kPa at L0, which corresponds to an elbow angle of 90°. The relationshipbetween shear modulus (reported as elasticity in Gennisson's paper) and elbow angle is verysimilar to that of the present study, between shear modulus and strain, demonstrated inFigure 4c (Gennisson et al., 2010).
More detailed interpretation of shear modulus results from SWE is difficult. It is clear thatthe shear moduli values obtained from off-axis ultrasound trials are only minimally relatedto Young's modulus during physiologically-relevant axial loading. As skeletal muscle maybe considered transversely isotropic (Morrow et al, 2010), it is perhaps only accurate toreport shear modulus, as calculated from shear wave speed, when the ultrasound transducer
Eby et al. Page 6
J Biomech. Author manuscript; available in PMC 2014 September 27.
NIH
-PA Author Manuscript
NIH
-PA Author Manuscript
NIH
-PA Author Manuscript

and subsequent shear wave propagation are aligned longitudinally with the underlyingmuscle fibers. In an ultrasound study where the transducer is not aligned with the musclefibers, it may be more accurate to report only shear wave speed, rather than converting toshear modulus, as Equation (1) no longer holds in these cases (Royer et al, 2011).Furthermore, from a physiologic standpoint, the shear wave speed and associated shearmodulus are perhaps most relevant when aligned longitudinally with muscle fibers, as thismay represent the mechanism by which mechanical forces are transmitted throughout tissue,allowing skeletal muscles to perform work (Huijing, 1999; Purslow, 2002; Sharafi andBlemker, 2010).
This study makes several assumptions, some of which may be considered technicallimitations in the study design. Young's moduli estimations are based on CSA measures thatwere assumed to be constant throughout the tensile test. Additionally, Young's moduliestimations are based on global strain measures, throughout the entire muscle tissue – ratherthan local strain measures, obtained in the area corresponding to that where ultrasoundmeasures were obtained. While these assumptions are incorrect, we expect the changes instrain measure would be minimal and determined it to be an acceptable limitation givencurrent practices. The ultrasound transducer orientation trials assumed a majority of themuscle fibers were parallel to the muscle line of action. Gross evaluation of each musclesample using B-mode ultrasound imaging indicate this is a reasonable assumption, thoughno previous investigations have established the precise pennation and architecture of theswine brachialis. This study also assume near-constant material properties throughoutskeletal muscle, as it compares whole-muscle Young's modulus to local shear modulusvalues. It is possible that intramuscular stiffness values differ with proximity to origin andinsertion tendons, surrounding tissues, or intramuscular fascia. We chose to make ultrasoundmeasures at the midsection of the muscle belly to limit the effects of regional alterations instiffness, though inherent variations may still be present. Additionally, using dissected pre-rigor swine muscle tissue as an analog for living human muscle may be considered flawed.However, the benefits gained from these in vitro experiments directly comparing Young'smodulus and shear modulus far outweigh any limitations that may arise when applying thesefindings to designing and evaluating a study that involves human muscle. Furthermore, thestrong correlation between shear modulus and Young's modulus throughout the entireloading curve indicate that local SWE measures at mid-belly are as meaningful as whole-muscle measures.
The present investigation provides the first step for additional studies that can evaluate thedistribution of both passive and active stiffness throughout a muscle. Evaluating a variety ofmuscles and loading profiles would further elucidate the nature of the relationship betweenYoung's modulus and shear modulus; More complex muscle architecture should bethoroughly evaluated to further outline the relationship between muscle structure and ECMand passive stiffness assessed via SWE. Finally, materials testing results should becompared with in vivo measurements to elucidate the potential attenuation effects ofoverlying tissues.
In conclusion, this study demonstrates valid SWE shear modulus results may be obtainedthroughout the normal range of tension for appendicular skeletal muscle. The orientation ofthe ultrasound transducer plays a key role in obtaining meaningful results.
AcknowledgmentsThe authors thank Lawrence Berglund for technical assistance. This work was supported in part by NIH grantnumber TR000136 and T32 GM065841 - Medical Scientist Training Program at Mayo Clinic.
Eby et al. Page 7
J Biomech. Author manuscript; available in PMC 2014 September 27.
NIH
-PA Author Manuscript
NIH
-PA Author Manuscript
NIH
-PA Author Manuscript

References1. Alnaqeeb MA, Zaid al NS, Goldspink G. Connective tissue changes and physical properties of
developing and ageing skeletal muscle. Journal of Anatomy. 1984; 139(Pt 4):677–89. [PubMed:6526719]
2. Bensamoun SF, Stevens L, Fleury M, Goubel F, Tho MH. Macroscopic-microscopiccharacterization of the passive mechanical properties in rat soleus muscle. Journal of Biomechanics.2006; 39:568–578. [PubMed: 16389097]
3. Bensamoun SF, Wang L, Robert L, Charleux F, Latrive J, Tho MH. Measurement of liver stiffnesswith two imaging techniques: magnetic resonance elastography and ultrasound elastometry. Journalof Magnetic Resonance Imaging : JMRI. 2008; 28:1287–92. [PubMed: 18972339]
4. Bercoff J, Tanter M, Fink M. Supersonic shear imaging: a new technique for soft tissue elasticitymapping. IEEE Transactions on Ultrasonics, Ferroelectrics, and Frequency Control. 2004; 51:396–409.
5. Bizzini M, Mannion AF. Reliability of a new, hand-held device for assessing skeletal musclestiffness. Clinical Biomechanics. 2003; 18:459–61. [PubMed: 12763442]
6. Borg TK, Caulfield JB. Morphology of connective tissue in skeletal muscle. Tissue & Cell. 1980;12:197–207. [PubMed: 7361300]
7. Botelho SY, Cander L, Guiti N. Passive and active tension-length diagrams of intact skeletal musclein normal women of different ages. Journal of Applied Physiology. 1954; 7:93–8. [PubMed:13174478]
8. Brown M, Fisher JS, Salsich G. Stiffness and muscle function with age and reduced muscle use.Journal of Orthopaedic Research. 1999; 17:409–14. [PubMed: 10376731]
9. Brown SH, Carr JA, Ward SR, Lieber RL. Passive mechanical properties of rat abdominal wallmuscles suggest an important role of the extracellular connective tissue matrix. Journal ofOrthopaedic Research. 2012; 30:1321–1326. [PubMed: 22267257]
10. Chen S, Urban MW, Pislaru C, Kinnick R, Zheng Y, Yao A, Greenleaf JF. Shearwave dispersionultrasound vibrometry (SDUV) for measuring tissue elasticity and viscosity. IEEE Transactions onUltrasonics, Ferroelectrics, and Frequency Control. 2009; 56:55–62.
11. Damiano DL, Quinlivan J, Owen BF, Shaffrey M, Abel MF. Spasticity versus strength in cerebralpalsy: relationships among involuntary resistance, voluntary torque, and motor function. EuropeanJournal of Neurology. 2001; 8(5):40–9. [PubMed: 11851733]
12. Debernard L, Robert L, Charleux F, Bensamoun SF. Analysis of thigh muscle stiffness fromchildhood to adulthood using magnetic resonance elastography (MRE) technique. ClinicalBiomechanics. 2011a; 26:836–40. [PubMed: 21571411]
13. Debernard L, Robert L, Charleux F, Bensamoun SF. Characterization of muscle architecture inchildren and adults using magnetic resonance elastography and ultrasound techniques. Journal ofBiomechanics. 2011b; 44:397–401. [PubMed: 21074773]
14. Debernard L, Robert L, Charleux F, Bensamoun SF. A possible clinical tool to depict muscleelasticity mapping using magnetic resonance elastography. Muscle & Nerve. 2013; 47:903–8.[PubMed: 23512304]
15. Dutt V, Kinnick RR, Muthupillai R, Oliphant TE, Ehman RL, Greenleaf JF. Acoustic shear-waveimaging using echo ultrasound compared to magnetic resonance elastography. Ultrasound inMedicine & Biology. 2000; 26:397–403. [PubMed: 10773369]
16. Fouré A, Nordez A, McNair P, Cornu C. Effects of plyometric training on both active and passiveparts of the plantarflexors series elastic component stiffness of muscle-tendon complex. EuropeanJournal of Applied Physiology. 2011; 111:539–548. [PubMed: 20931220]
17. Fried LP, Tangen CM, Walston J, Newman AB, Hirsch C, Gottdiener J, Seeman T, Tracy R, KopWJ, Burke G, McBurnie MA. Frailty in older adults: evidence for a phenotype. The Journals ofGerontology Series A, Biological Sciences and Medical Sciences. 2001; 56:M146–56.
18. Gennisson J, Catheline S, Chaffaï S, Fink M. Transient elastography in anisotropic medium:application to the measurement of slow and fast shear wave speeds in muscles. The Journal of theAcoustical Society of America. 2003; 114:536–41. [PubMed: 12880065]
Eby et al. Page 8
J Biomech. Author manuscript; available in PMC 2014 September 27.
NIH
-PA Author Manuscript
NIH
-PA Author Manuscript
NIH
-PA Author Manuscript

19. Gennisson J, Cornu C, Catheline S, Fink M, Portero P. Human muscle hardness assessment duringincremental isometric contraction using transient elastography. Journal of Biomechanics. 2005;38:1543–50. [PubMed: 15922766]
20. Viscoelastic and anisotropic mechanical properties of in vivo muscle tissue assessed by supersonicshear imaging. Ultrasound in Medicine & Biology. 36:789–801.
21. Gottsauner-Wolf F, Grabowski JJ, Chao EY, An KN. Effects of freeze/thaw conditioning on thetensile properties and failure mode of bone-muscle-bone units: a biomechanical and histologicalstudy in dogs. Journal of Orthopaedic Research. 1995; 13:90–5. [PubMed: 7853109]
22. Gracies J. Pathophysiology of spastic paresis. I: Paresis and soft tissue changes. Muscle & Nerve.2005; 31:535–51. [PubMed: 15714510]
23. Herbert RD, Clarke J, Kwah LK, Diong J, Martin J, Clark EC, Bilston LE, Gandevia SC. In vivopassive mechanical behaviour of muscle fascicles and tendons in human gastrocnemius muscle-tendon units. The Journal of Physiology. 2011; 589:5257–67. [PubMed: 21825027]
24. Herbert RD, Clarke J, Kwah LK, Diong J, Martin J, Clark EC, Bilston LE, Gandevia SC. Changein length of relaxed muscle fascicles and tendons with knee and ankle movement in humans. TheJournal of Physiology. 2002; 539:637–45. [PubMed: 11882694]
25. Hill A. The heat of shortening and the dynamic constants of muscle. Proceedings of the RoyalSociety of London Series B. 1938; 126:136–95.
26. Huijing PA. Muscle as a collagen fiber reinforced composite: a review of force transmission inmuscle and whole limb. Journal of Biomechanics. 1999; 32:329–45. [PubMed: 10213024]
27. Hulse D, Young B, Beale B, Kowaleski M, Vannini R. Relationship of the biceps- brachialiscomplex to the medial coronoid process of the canine ulna. Veterinary and ComparativeOrthopaedics and Traumatology. 2010; 23:173–6. [PubMed: 20422120]
28. Huxley AF. Muscle structure and theories of contraction. Progress in Biophysics and BiophysicalChemistry. 1957; 7:255–318. [PubMed: 13485191]
29. Jaspers RT, Brunner R, Pel JJ, Huijing PA. Acute effects of intramuscular aponeurotomy on ratgastrocnemius medialis: force transmission, muscle force and sarcomere length. Journal ofBiomechanics. 1999; 32:71–9. [PubMed: 10050953]
30. Jenkyn TR, Ehman RL, An K. Noninvasive muscle tension measurement using the novel techniqueof magnetic resonance elastography (MRE). Journal of Biomechanics. 2003; 36:1917–21.[PubMed: 14614945]
31. Johns R, Wright V. Relative importance of various tissues in joint stiffness. Journal of AppliedPhysiology. 1962
32. Kjaer M. Role of extracellular matrix in adaptation of tendon and skeletal muscle to mechanicalloading. Physiological Reviews. 2004; 84:649–98. [PubMed: 15044685]
33. Larsson L, Grimby G, Karlsson J. Muscle strength and speed of movement in relation to age andmuscle morphology. Journal of applied physiology: respiratory, environmental and exercisephysiology. 1979; 46:451–6.
34. Leonello DT, Galley IJ, Bain GI, Carter CD. Brachialis muscle anatomy. A study in cadavers. TheJournal of Bone and Joint Surgery. 2007; 89:1293–7. [PubMed: 17545433]
35. Liang K, Zeger SL. Longitudinal data analysis using generalized linear models. Biometrika. 1986;73:13–22.
36. Lieber RL, Jacobson MD, Fazeli BM, Abrams RA, Botte MJ. Architecture of selected muscles ofthe arm and forearm: anatomy and implications for tendon transfer. The Journal of Hand Surgery.1992; 17:787–98. [PubMed: 1401782]
37. Moore, DS.; McCabe, GP.; Craig, BP. Introduction to the Practice of Statistics. 7. W.H. Freemanand Company; New York: 2012.
38. Morrow DA, Donahue TL, Odegard GM, Kaufman KR. Transversely isotropic tensile materialproperties of skeletal muscle tissue. Journal of the Mechanical Behavior of Biomedical Materials.2010; 3:124–9. [PubMed: 19878911]
39. NIMSD Consortium; The National Isometric Muscle Strength (NIMS) Database Consortium.Muscular weakness assessment: use of normal isometric strength data. Archives of PhysicalMedicine and Rehabilitation. 1996; 77:1251–5. [PubMed: 8976307]
Eby et al. Page 9
J Biomech. Author manuscript; available in PMC 2014 September 27.
NIH
-PA Author Manuscript
NIH
-PA Author Manuscript
NIH
-PA Author Manuscript

40. Oudry J, Chen J, Glaser KJ, Miette V, Sandrin L, Ehman RL. Cross-validation of magneticresonance elastography and ultrasound-based transient elastography: A preliminary phantomstudy. Journal of Magnetic Resonance Imaging. 2009; 30:1145–1150. [PubMed: 19856447]
41. Palmeri ML, Wang MH, Dahl JJ, Frinkley KD, Nightingale KR. Quantifying hepatic shearmodulus in vivo using acoustic radiation force. Ultrasound in Medicine & Biology. 2008; 34:546–58. [PubMed: 18222031]
42. Park G, Kwon DR. Sonoelastographic evaluation of medial gastrocnemius muscles intrinsicstiffness after rehabilitation therapy with botulinum toxin a injection in spastic cerebral palsy.Archives of Physical Medicine and Rehabilitation. 2012; 93:2085–9. [PubMed: 22776155]
43. Purslow PP. The structure and functional significance of variations in the connective tissue withinmuscle. Comparative Biochemistry and Physiology Part A, Molecular & Integrative Physiology.2002; 133:947–66.
44. Rabita G, Dupont L, Thevenon A, Lensel-Corbeil G, Pérot C, Vanvelcenaher J. Quantitativeassessment of the velocity-dependent increase in resistance to passive stretch in spasticplantarflexors. Clinical Biomechanics. 2005; 20:745–53. [PubMed: 15964114]
45. Rowe J, Chen Q, Domire ZJ, McCullough MB, Sieck G, Zhan W, An K. Effect of collagendigestion on the passive elastic properties of diaphragm muscle in rat. Medical Engineering &Physics. 2010; 32:90–94. [PubMed: 19945332]
46. Royer D, Gennisson J, Deffieux T, Tanter M. On the elasticity of transverse isotropic soft tissues(L). The Journal of the Acoustical Society of America. 2011; 129:2757–60. [PubMed: 21568379]
47. Rutherford OM, Jones DA. Measurement of fibre pennation using ultrasound in the humanquadriceps in vivo. European Journal of Applied Physiology and Occupational Physiology. 1992;65:433–7. [PubMed: 1425649]
48. Sarvazyan AP, Rudenko OV, Swanson SD, Fowlkes JB, Emelianov SY. Shear wave elasticityimaging: a new ultrasonic technology of medical diagnostics. Ultrasound in Medicine & Biology.1998; 24:1419–35. [PubMed: 10385964]
49. Sharafi B, Blemker SS. A micromechanical model of skeletal muscle to explore the effects of fiberand fascicle geometry. Journal of Biomechanics. 2010; 43:3207–13. [PubMed: 20846654]
50. Shinohara M, Sabra K, Gennisson J, Fink M, Tanter M. Real-time visualization of muscle stiffnessdistribution with ultrasound shear wave imaging during muscle contraction. Muscle & Nerve.2010; 42:438–441. [PubMed: 20665510]
51. Sinkjaer T, Magnussen I. Passive, intrinsic and reflex-mediated stiffness in the ankle extensors ofhemiparetic patients. Brain. 1994; 117(Pt 2):355–63. [PubMed: 8186961]
52. Sinkjaer T, Toft E, Andreassen S, Hornemann BC. Muscle stiffness in human ankle dorsiflexors:intrinsic and reflex components. Journal of Neurophysiology. 1988; 60:1110–21. [PubMed:3171659]
53. Tatsumi R, Liu X, Pulido A, Morales M, Sakata T, Dial S, Hattori A, Ikeuchi Y, Allen RE.Satellite cell activation in stretched skeletal muscle and the role of nitric oxide and hepatocytegrowth factor. American journal of physiology Cell Physiology. 2006; 290:C1487–94. [PubMed:16684931]
54. Tomonaga M. Histochemical and ultrastructural changes in senile human skeletal muscle. Journalof the American Geriatrics Society. 1977; 25:125–31. [PubMed: 839043]
55. Vandervoort A. Ankle mobility and postural stability. Physiotherapy Theory and Practice. 1999;15:91–103.
56. Vaz DV, Mancini MC, Fonseca ST, Vieira DS, de Pertence AE. Muscle stiffness and strength andtheir relation to hand function in children with hemiplegic cerebral palsy. DevelopmentalMedicine and Child Neurology. 2006; 48:728–33. [PubMed: 16904018]
57. Werle MJ. Cell-to-cell signaling at the neuromuscular junction: the dynamic role of theextracellular matrix. Annals of the New York Academy of Sciences. 2008; 1132:13–8. [PubMed:18567849]
58. Yamakoshi Y, Sato J, Sato T. Ultrasonic imaging of internal vibration of soft tissue under forcedvibration. IEEE Transactions on Ultrasonics, Ferroelectrics, and Frequency Control. 1990; 37:45–53.
Eby et al. Page 10
J Biomech. Author manuscript; available in PMC 2014 September 27.
NIH
-PA Author Manuscript
NIH
-PA Author Manuscript
NIH
-PA Author Manuscript

59. Zeger SL, Liang K. Longitudinal data analysis for discrete and continuous outcomes. Biometrics.1986; 42:121–30. [PubMed: 3719049]
60. Zhao H, Ren Y, Wu Y, Liu SQ, Zhang L. Ultrasonic evaluations of Achilles tendon mechanicalproperties poststroke. Journal of Applied Physiology. 2009; 106:843–9. [PubMed: 19118156]
61. van Ee CA, Chasse AL, Myers BS. Quantifying skeletal muscle properties in cadaveric testspecimens: effects of mechanical loading, postmortem time, and freezer storage. Journal ofBiomechanical Engineering. 2000; 122:9–14. [PubMed: 10790824]
Eby et al. Page 11
J Biomech. Author manuscript; available in PMC 2014 September 27.
NIH
-PA Author Manuscript
NIH
-PA Author Manuscript
NIH
-PA Author Manuscript
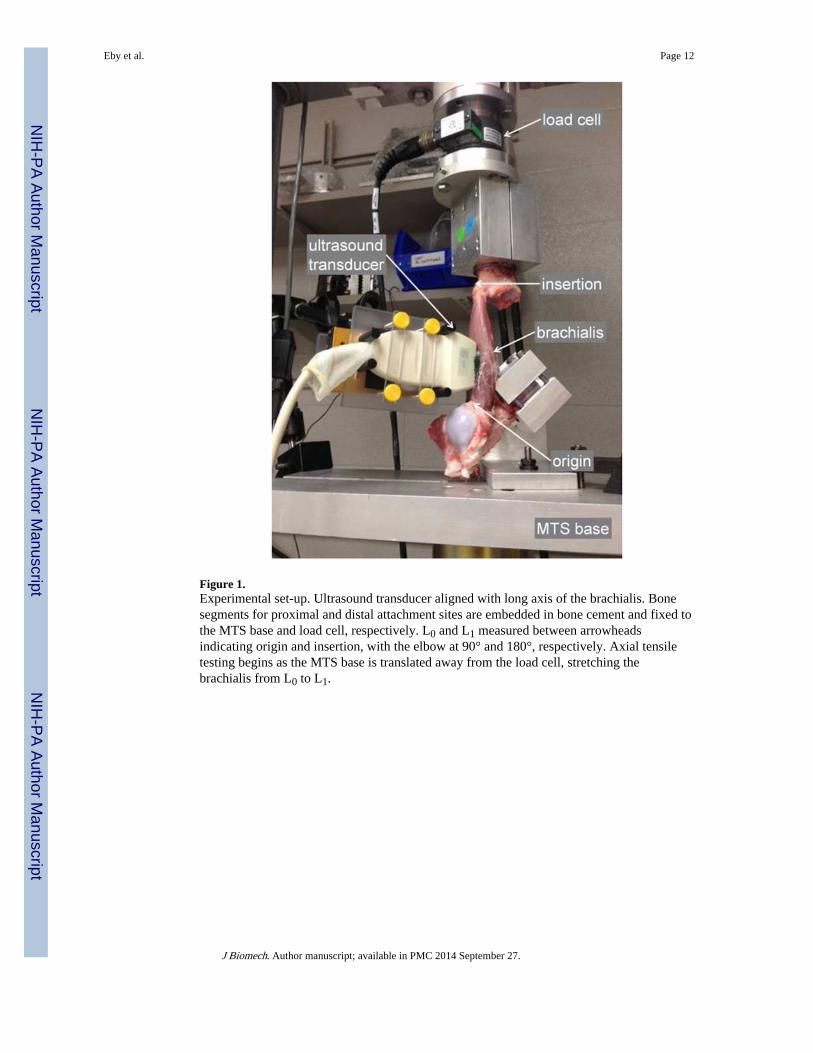
Figure 1.Experimental set-up. Ultrasound transducer aligned with long axis of the brachialis. Bonesegments for proximal and distal attachment sites are embedded in bone cement and fixed tothe MTS base and load cell, respectively. L0 and L1 measured between arrowheadsindicating origin and insertion, with the elbow at 90° and 180°, respectively. Axial tensiletesting begins as the MTS base is translated away from the load cell, stretching thebrachialis from L0 to L1.
Eby et al. Page 12
J Biomech. Author manuscript; available in PMC 2014 September 27.
NIH
-PA Author Manuscript
NIH
-PA Author Manuscript
NIH
-PA Author Manuscript

Figure 2.Ultrasound transducer orientations over brachialis muscle, with sample B-mode imagesacquired using the Aixplorer ultrasound system in the MSK/Superficial MSK mode todemonstrate underlying muscle structure. Ultrasound transducer coming out of the page,white box indicates ultrasound transducer footprint, black dashed line indicates imagingplane. (A) parallel, demonstrating muscle fibers running right-to-left. (B) 45°, (C)perpendicular, demonstrating muscle fibers visible in cross-section. Solid bars indicatefocusing range. Scale (on right) in cm.
Eby et al. Page 13
J Biomech. Author manuscript; available in PMC 2014 September 27.
NIH
-PA Author Manuscript
NIH
-PA Author Manuscript
NIH
-PA Author Manuscript

Figure 3.Shear wave elastography and time-to-peak fitting. A) Focused ultrasound “push” beamgenerates shear waves in the muscle tissue specimen. The same transducer monitors thetime-to-peak of shear wave displacements at different lateral distances, indicated by verticalbars. B) Example of shear waveform propagation across a lateral range of approximately 6mm. (Slow time indicates time-direction of shear wave propagation; x represents lateraldistance to the initial “push” beam.) C) Example of time-to-peak fitting of waveforms,obtained via linear regression.
Eby et al. Page 14
J Biomech. Author manuscript; available in PMC 2014 September 27.
NIH
-PA Author Manuscript
NIH
-PA Author Manuscript
NIH
-PA Author Manuscript

Figure 4.Moduli data from a representative sample for specimen #3. A) Stress-strain curve obtainedfrom MTS test. B) Mean Young's moduli data, measured based on the stress-strain curve in(A) throughout tensile test from all 15 loading trials. Error bars indicate ±SD. C) Mean shearmoduli data throughout tensile test for each of the three transducer orientations. Error barsindicate ±SD.
Eby et al. Page 15
J Biomech. Author manuscript; available in PMC 2014 September 27.
NIH
-PA Author Manuscript
NIH
-PA Author Manuscript
NIH
-PA Author Manuscript

Figure 5.Scatterplots of elastic moduli (Shear modulus, G; Young's modulus, E) for parallelultrasound transducer trials. Generalized linear model regression line obtained fromgeneralized estimating equations analysis. A) Specimen #1. G = 0.2602 E – 9.1963; R2=0.9651. B) Specimen #2. G = 0.1539 E +0.1928; R2= 0.9884. C) Specimen #3. G = 0.1750 E– 5.4259; R2= 0.9577. D) Specimen #4. G = 0.2044 E – 1.0085; R2= 0.9160. E) All trialsfrom all 4 specimens combined. G = 0.1944 E – 3.6760.
Eby et al. Page 16
J Biomech. Author manuscript; available in PMC 2014 September 27.
NIH
-PA Author Manuscript
NIH
-PA Author Manuscript
NIH
-PA Author Manuscript

NIH
-PA Author Manuscript
NIH
-PA Author Manuscript
NIH
-PA Author Manuscript
Eby et al. Page 17
Table 1
Descriptive statistics for four swine specimen. Swine mass taken immediately prior to sacrifice; brachialismuscle lengths obtained at time of harvest; CSA obtained during mechanical testing.
Specimen ID Animal mass (kg) Initial length (mm) Final length (mm) Muscle CSA (mm2)
1 90 130 160 981.75
2 95 130 160 1040.65
3 50 110 130 706.86
4 60 115 135 725.71
J Biomech. Author manuscript; available in PMC 2014 September 27.