Thinking locally, acting locally? Conscious consumers and farmers’ markets

FromUV
AuthRepSiPA
Thetom
0741Cophttp
Validation of semiautomated and locally resolvedaortic wall thickness measurements from computedtomographyEric K. Shang, MD,a Eric Lai, BS,a,b Alison M. Pouch, PhD,c Robin Hinmon, MS,a,b
Robert C. Gorman, MD,a,b Joseph H. Gorman III, MD,a,b Chandra M. Sehgal, PhD,c
Giovanni Ferrari, PhD,a,b Joseph E. Bavaria, MD,a,b and Benjamin M. Jackson, MD,a,d Philadelphia, Pa
Objective: Aortic wall thickness (AWT) is important for anatomic description and biomechanical modeling of aneurysmaldisease. However, no validated, noninvasive method for measuring AWT exists. We hypothesized that semiautomatedimage segmentation algorithms applied to computed tomography angiography (CTA) can accurately measure AWT.Methods: Aortic samples from 10 patients undergoing open thoracoabdominal aneurysm repair were taken from sites ofthe proximal or distal anastomosis, or both, yielding 13 samples. Aortic specimens were fixed in formalin, embedded inparaffin, and sectioned. After staining with hematoxylin and eosin and Masson’s trichrome, sections were digitallyscanned and measured. Patients’ preoperative CTA Digital Imaging and Communications in Medicine (DICOM; Na-tional Electrical Manufacturers Association, Rosslyn, Va) images were segmented into luminal, inner arterial, and outerarterial surfaces with custom algorithms using active contours, isoline contour detection, and texture analysis. AWTvalues derived from image data were compared with measurements of corresponding pathologic specimens.Results: AWT determined by CTA averaged 2.33 6 0.66 mm (range, 1.52-3.55 mm), and the AWT of pathologicspecimens averaged 2.36 6 0.75 mm (range, 1.51-4.16 mm). The percentage difference between pathologic specimensand CTA-determined AWT was 9.5% 6 4.1% (range, 1.8%-16.7%). The correlation between image-based measurementsand pathologic measurements was high (R [ 0.935). The 95% limits of agreement computed by Bland-Altman analysisfell within the range of L0.42 and 0.42 mm.Conclusions: Semiautomated analysis of CTA images can be used to accurately measure regional and patient-specific AWT,as validated using pathologic ex vivo human aortic specimens. Descriptions and reconstructions of aortic aneurysms thatincorporate locally resolved wall thickness are feasible and may improve future attempts at biomechanical analyses. (J VascSurg 2013;-:1-7.)
Aortic aneurysms, including abdominal aortic aneu-rysms (AAAs) and thoracic aortic aneurysms, are responsibleforw10,000 to 15,000 deaths yearly in theUnited States.1,2
In large screening studies, AAAs were found in w5% of allmen and in 1% of all women aged >70 years,3 and the inci-dence of thoracic aortic aneurysms has been estimated at10.4/100,000 patient-years.4 Aneurysm rupture is a majorsource of morbidity and mortality, with mortality rates>50% even in modern series.5,6
Surgerydeither the traditional open aneurysm repairor newer endovascular stent graft repairdis the treatmentof choice to prevent or treat rupture. Preoperative plan-ning, including the selection of the open or endovascularapproach, is critically dependent on aneurysm geometryand, therefore, on radiologic imaging. The gold standard
the Department of Surgery,a Division of Cardiac Surgery,b Division ofltrasound Research, Department of Radiology,c and Division ofascular Surgery and Endovascular Therapy,d University of Pennsylvania.or conflict of interest: none.rint requests: Benjamin M. Jackson, MD, Department of Surgery, 4lverstein Bldg, Hospital of the University of Pennsylvania, Philadelphia,19104 (e-mail: [email protected]).
editors and reviewers of this article have no relevant financial relationshipsdisclose per the JVS policy that requires reviewers to decline review of anyanuscript for which they may have a conflict of interest.-5214/$36.00yright � 2013 by the Society for Vascular Surgery.://dx.doi.org/10.1016/j.jvs.2013.11.065
for preoperative imaging is computed tomography angiog-raphy (CTA), which has the capability of detecting the sizeand extent of the aneurysm, locations of critical branch ves-sels, and the presence and distribution of thrombus.
Patient-specific aneurysm geometries have been incor-porated in improved models of aneurysm rupture risk strat-ification based on structural analysis. Biomechanicalmodeling of vascular structures is highly dependent on ac-curate geometric reconstructions of the vessel in question.Aortic wall stress analyses using finite element methodshave shown to be significantly correlated to rupture status7
and expansion rate.8,9 Peak wall stress in AAAs has beenfound to be a better predictor of rupture than diameteralone.10
Surprisingly, even studies demonstrating the relevanceof biomechanical computational modeling to clinical sce-narios do not incorporate patient-specific and regionallyvariable aortic wall thickness (AWT) measurements,because reliable AWT measurements have previouslybeen difficult to obtain. Studies using excised specimensof ruptured and unruptured AAAs have shown significantvariations in AWT, which are correlated with areas ofdegeneration and weakness.11,12 The lack of locallyresolved wall thickness in computational models has beenemphasized as a significant barrier in the accurate com-putation of wall stress using current finite elementmethods.13,14
1

Fig 1. A, An ex vivo aortic specimen, stained with hematoxylin and eosin, shows the wall thickness measurement(arrow). B, Result of axial image segmentation shows outer adventitial (red), inner arterial (blue), and luminal (green)boundaries.
JOURNAL OF VASCULAR SURGERY2 Shang et al --- 2013
Previous studies have reported attempts to quantifyAWT. Arko et al15 used intravascular ultrasound to studythe dynamic geometry and wall thickness in the neck re-gion of infrarenal AAAs; however, that technique is inva-sive. Current surface ultrasound techniques are unable toprovide the necessary resolution to discern AWT. Adameet al16 developed an algorithm for the determinationof AWT in high-resolution magnetic resonance imaging(MRI) of the healthy descending aorta. Compared withMRI, CTA is more readily available, requires shorter scan-ning times, is better tolerated by patients, and is less subjectto respiratory artifacts yielding images of poor imagequality.
Unlike other vessels, such as the carotid artery, whereduplex measurements of arterial wall thickness have beenrigorously validated, no universally accepted noninvasivemethod of measuring AWT exists. Shum et al17 presenteda segmentation package capable of semiautomatic vesselwall detection for AAAs based on CTA data. Althoughtheir AWT measurements show good correlation of 10%to 15% with manual segmentation, neither the automaticnor the manual segmentations were validated against mea-surements from pathologic specimens.
This study presents a series of algorithms to segmentaxial slices of the thoracic and abdominal aortas. These al-gorithms use multiple image segmentation techniques,including level set methods, intensity-based and gradient-based segmentation, and texture analysis. AWT measure-ments derived from these image analysis techniques arevalidated against pathologic specimens from the abdominaland thoracic aortas.
METHODS
This study was approved by the Institutional ReviewBoard, and patients provided informed consent.
Subjects and image data
Ten patients undergoing open thoracoabdominalaneurysm repair for aneurysms of atherosclerotic etiologywere considered. Each patient’s most recent preoperative
CTA examination was used for image segmentation.CTA examinations were performed using multidetectorCT scanners ($64 slice) with arterial-phase intravenous in-jection of 80 to 120 mL of nonionic iodinated contrast.Digital Imaging and Communications in Medicine(DICOM; National Electrical Manufacturers Association,Rosslyn, Va) images had a scan matrix size of 512 �512, pixel size of 0.65 to 0.82 mm, and slice thickness of1.2 to 1.5 mm.
Pathologic specimens
Full-thickness aortic wall specimens of w15 mm(axial) � 15 mm (longitudinal) were taken from grosslynormal-appearing aorta at the proximal or distal, or both,anastomotic sites. The excised aortic tissue was immediatelyplaced in Krebs-Ringer bicarbonate buffer (Sigma-Aldrich,St. Louis, Mo). Orientation and specific location, includingthe level of the aortic specimen and its clock position, wasnoted. Aortic specimens were fixed overnight in a solutionof 10% formalin and dehydrated in 70% ethanol solution.Subsequently, specimens were embedded in paraffin,sectioned, and stained with hematoxylin and eosin andMasson’s trichrome. The sections were digitally scannedand measured using ImageScope (Aperio Inc, Vista, Calif).Wall thickness measurements were taken in a 10-mm �10-mm central area of the specimen in portions thatcontained intact adventitial, medial, and intimal layers(Fig 1, A). A mean wall thickness was then calculated forthis area of the aortic wall and compared with wall thicknessderived from aortic segmentation. Mean wall thicknesseswere measured by two observers to assess interobservervariability.
Segmentation overview
The image segmentation required to determine wallthickness involves the delineation of three separate surfaces:the lumen, the adventitial (outer) wall, and the inner arte-rial wall. By generating these surfaces, the arterial wall andany intraluminal thrombus (ILT) can be identified. Thesegmentation process involves a series of routines written

JOURNAL OF VASCULAR SURGERYVolume -, Number - Shang et al 3
in MATLAB software (MathWorks, Natick, Mass) and iscapable of semiautomated as well as manual segmentationof axial CTA slices.
Lumen segmentation. Accurate luminal segmenta-tion requires the administration of intravenous contrastto maximize the image intensity gradient between thelumen and arterial or ILT structures. Automatic window-ing is initially applied to the stack of DICOM images toenhance the contrast between the aorta and other sur-rounding structures. The windowing procedure can bedone automatically, or user-specified thresholds can beselected. Subsequently, an anisotropic diffusion filter isused to further sharpen edges.18
The user is asked to identify a single point inside thelumen for the first slice, and a small circle is generatedaround this point. A two-dimensional level-set methoddescribed by Chan and Vese19 uses this curve to automat-ically detect the luminal border in each slice. The series ofluminal curves is finally presented to the user. Infrequently,the segmentation will encroach on surrounding high-intensity structures, such as the spine, and will requiremanual adjustment.
Outer wall segmentation. The adventitial wall issegmented by analyzing isointensity contours. The stackof windowed and filtered images is cropped to an areaimmediately surrounding the lumen. A contour functionis then applied that generates a series of isolines of imageintensity. Isolines that do not fully enclose the luminalboundary are eliminated.
For the initial slice, the appropriate isoline representingthe adventitial border can be manually selected by the useror an automatic algorithm can be used. In the manual op-tion, the remaining isolines are presented to the user as atopographic map, and the user selects an isoline corre-sponding to his or her interpretation of the outer adventi-tial border. The automatic method initially selects theisoline with minimal area that encloses the luminal bound-ary. Subsequent isolines of decreasing intensity are itera-tively compared by area and curvature. Large changes inarea and curvature were found to likely reflect the transi-tion from aortic structures to surrounding tissues.
For subsequent slices, manual segmentation proceedsin a manner similar to the initial slice. The automaticmethod uses the same technique described above, butthe candidate contour is compared with the previous sliceby curvature and area as well. In the event of large differ-ences in either of these features, a new contour is selected.Through iterative comparison, the contour that minimizesthese differences while still fulfilling the criteria of enclosingthe luminal boundary is selected. In the event that such acontour cannot be generated or the contour generatedwas deemed unacceptable by visual inspection, manual seg-mentation is used. Manual segmentation was most oftennecessary in areas where soft tissues of very similar pixel in-tensity to the arterial wall (eg, abdominal viscera) wereimmediately adjacent to the aorta.
Inner arterial wall segmentation. Our methods forthe detection of the inner arterial surface are based on
texture feature differences between the ILT and the arterialwall. Areas that were outside the luminal surface and insidethe adventitial surface were considered as candidates forILT. The user then selects regions of both thrombus andbackground at varying locations within the image set toserve as a reference for feature based discrimination.
Numerous image texture features were subsequentlycalculated for the candidate ILT area. A candidate ILTborder was generated using common histogram featuressuch as mean and standard deviations of image intensity,image entropy, and image intensity ranges. Preliminaryevaluation showed that histogram-based texture analysisalone was insufficient for generating reasonable ILTboundary curves because they tended to conservatively es-timate the ILT area. Therefore, a second approach wasselected based on the calculation of the gray level co-occurrence matrix (GLCM). Before the application ofour GLCM method, the windowed and cropped CTA im-ages were coarsened to 256 gray levels. The GLCM is anestimation of a second-order joint conditional probabilitydensity function that seeks to characterize the spatial inter-relationships of the gray values in an image.20 Textural fea-tures of energy, variance, and entropy were used by ouralgorithm.
Using this series of texture-based features, we formu-lated a nearest neighbor decision rule using the user-selected regions of thrombus as the training set to determineif a region was classified as thrombus or background. Anaveraged curve combining the outer border of this regionand the border generated using this histogram-basedmethod was generated as the inner arterial border. A samplesegmentation is shown in Fig 1, B.
Postprocessing and AWT calculation. The luminal,inner arterial, and outer arterial surfaces underwentGaussian curvature based-smoothing to produce smoothboundaries. AWT was calculated at 72 points along thecircumference of the aorta in each axial slice by deter-mining the minimal distance from the inner arterial surfaceto the outer adventitial surface. Because AWT was calcu-lated (and not measured) from the difference between twomathematical constructs, it was reported as two significantfigures, matching that of the pathologic specimens. Asample wall thickness map is shown in Fig 2. An averagewall thickness was calculated for the area of the aorta cor-responding to the one from which the pathologic specimenwas taken.
RESULTS
Sixteen aortic samples were taken from 10 patients (sixmen and 4 women) undergoing open thoracoabdominalaneurysm repair. The patients were an average age of71.2 6 5.4 years. After tissue fixation, staining, andsectioning, 13 specimens were used for comparison withresults from image-based AWT calculations. Three speci-mens were excluded for excessive architectural distortionarising as an artifact from the sectioning of highly calcifiedaortic tissue that rendered wall thickness measurementsinfeasible. Six (46.1%) of the remaining 13 samples were

Fig 2. Wall thickness map generated from the segmentation of aproximal descending thoracic aneurysm.
JOURNAL OF VASCULAR SURGERY4 Shang et al --- 2013
from locations in the thoracic aorta, and seven (53.9%)originated in the abdominal aorta. Further detailsregarding the location of specimens are given in theTable. Small amounts of thrombus were found in four ofthe 13 specimens; the rest were free of thrombus.
AWT determined by CTA was an average of 2.33 60.66 mm (range, 1.52-3.55 mm), and the average wallthickness of pathologic specimens was 2.36 6 0.75 mm(range, 1.51-4.16 mm). Because the pathologic specimenswere taken from proximal and distal anastomotic sites,there was relatively little ILT. In addition, the aorta inthese locations was relatively free from adjacent organs.In these areas, the image segmentation routines were runfree of user intervention so the calculation of interobserverreproducibility was unnecessary. The average difference be-tween observers for pathologic measurements was small(mean, 2.5% 6 1.33%; range, 0.3%-5.2%), and the correla-tion coefficient was excellent (R ¼ 0.998; Fig 3, A).
The percentage difference between pathologic speci-mens was 9.5%6 4.1% (range, 1.8%-16.7%), and the corre-lation between image-based measurements and pathologicmeasurements was favorable (R ¼ 0.935; Fig 3, B). Thehighest percentage differences between the two wall thick-ness measurement methods (patients 3 and 6) were foundin scans of the coarsest pixel density (0.80 and 0.82 mm,respectively).
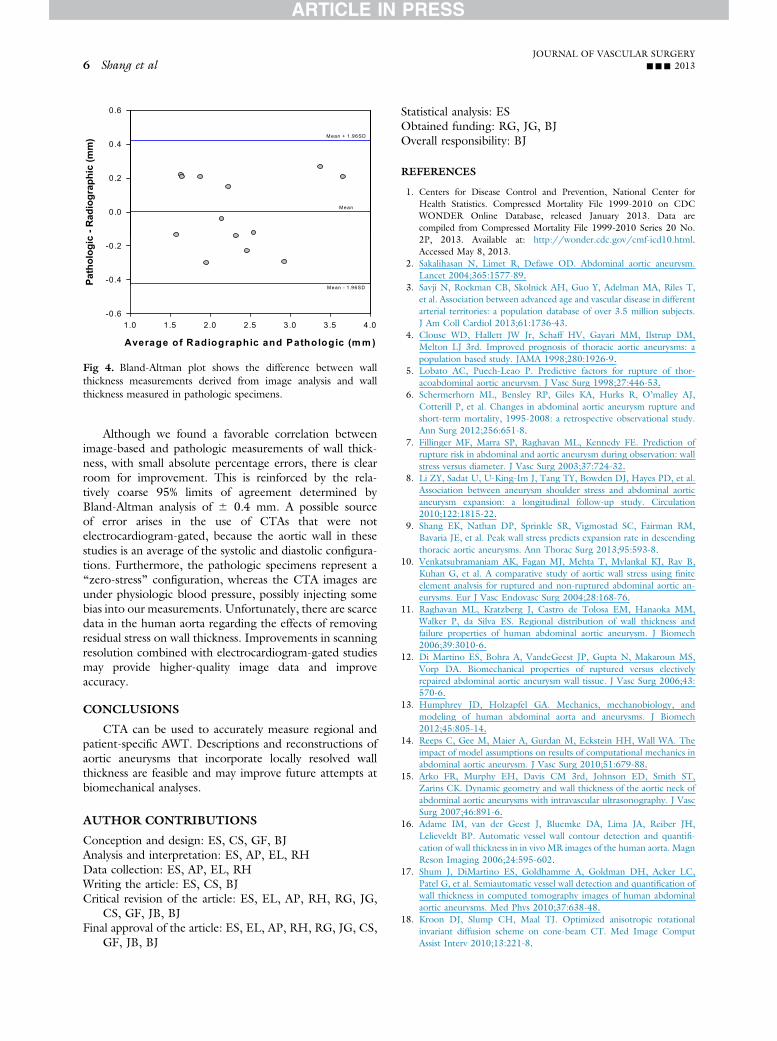
Bland-Altman analysis revealed some variability be-tween the two methods, but no systematic bias wasdetected (Fig 4), although most of the wall thickness mea-surements were between 1.5 and 2.5 mm. Although the
sample size was small, no significant difference was notedwhen comparing absolute errors of samples with thrombusand those without (7.3% 6 5.4% vs 10.4% 6 3.3%; P ¼.22). The 95% limits of agreement, which indicate howfar apart measurements by the two methods are likely tofall for each comparison, fell in the range of �0.42 to0.42 mm.
DISCUSSION
In this study, we describe a method by which AWT canbe measured from CTA DICOM data in the abdominaland descending thoracic aorta. This was accomplishedthrough a series of semiautomated image-processing rou-tines that are capable of detecting luminal, inner arterial,and outer arterial boundaries. Wall thickness measurementsderived from image segmentation were then comparedwith thickness measurements derived from pathologicspecimens excised during open aortic repair, and good cor-relation (R ¼ 0.935) was obtained. Although previousstudies have reported techniques to measure AWT in CT,MRI, and ultrasound data,13-15 none have validated thesemeasurements against ex vivo pathologic specimens.
Arterial wall thickness plays a critical role in computa-tional vascular biomechanics, because structural analysis de-pends on high-fidelity geometric representations. Variablewall thicknesses have not routinely been used in the calcu-lation of biomechanical stresses in arterial structures. Infact, prior studies of the influence of assumptions andmodeling sophistication on the accuracy and results ofAAA computational stress prediction have sometimesignored AWT altogether.21 Noninvasive techniques forthe determination of AWT may improve the prognostic ca-pabilities of finite element models of aortic aneurysms.
Although our motivation for this research concerns ef-forts to model the biomechanics of aortic aneurysms withoptimum fidelity, other clinical and research uses for thetechniques we have described can be imagined. AWTmay itself be correlated with aneurysm rupture, becausethe yield or failure strength of the aortic wall is likely inti-mately related to the thickness of the aorta. However, priorefforts at quantifying the wall strength of the aorta haveignored AWT.22,23 Di Martino et al,12 in fact, showedgreater AWT in ex vivo pathologic specimens fromruptured AAAs than from electively repaired AAAs. Finally,AWT may be indicative of certain disease processes orreflective of their severity, in analogy to carotid intima-medial thickness being a marker for peripheral and coro-nary arterial diseases.24
This study used formalin-fixed aortic specimens as thereference standard to which our image segmentation re-sults were compared. Other studies examining the localproperties of aortic tissue have used laser micrometry tomeasure fresh samples from the operating room.12
Although formalin fixation significantly alters the mechan-ical properties of aortic tissue, the process does not signif-icantly alter tissue thickness.25 We therefore felt that thepotential error introduced by the tissue fixation processwas minimal.

nt (m
m)
5
m)
5BA
en M
easu
rem
en
3
4
asur
emen
t (m
m
3
4
holo
gic
Spec
ime
2
Obs
erve
r 2 m
e
2
Image Segmentation Measurement (mm)
1 2 3 4 5
Path
1
Observer 1 measurement (mm)
1 2 3 4 51
Observer 1 measurement (mm)
Fig 3. A, Plot shows interobserver reliability of wall thickness measurements derived from excised aortic specimens.B, Plot shows correlation between pathologic specimen wall thickness measurements and image segmentationmeasurements.
Table. Specific locations of pathologic specimens with corresponding wall thickness measurements
Patient Specimen locationImage segmentationwall thickness, mm
Pathologic specimenwall thickness, mm Difference, %a
1 2 cm distal to LSCA 2.16 2.12 þ1.82 3 cm distal to LSCA 1.64 1.51 þ9.33 1 cm proximal to celiac 3.07 2.78 þ10.44 2 cm proximal to celiac 2.15 2.30 �6.55 5 cm distal to LSCA 1.52 1.74 �12.65 1 cm proximal to celiac 2.60 2.48 þ4.86 4 cm proximal to left renal 2.10 1.80 þ16.76 Aortic bifurcation 1.54 1.75 �12.07 2 cm distal to LSCA 2.39 2.25 þ6.27 2 cm above celiac 1.77 1.98 �10.68 4 cm distal to LSCA 3.55 3.76 �5.69 1 cm above to celiac 3.24 3.51 �7.710 Level of pulmonary trunk 2.57 2.34 9.8
LSCA, Left subclavian artery.aCalculated as the percentage difference from the pathologically determined wall thickness.
JOURNAL OF VASCULAR SURGERYVolume -, Number - Shang et al 5
Nevertheless, the current work is subject to someimportant limitations. The algorithm presented is sensitiveto the quality of CTA image data. In particular, preopera-tive scans used for image segmentation were of relativelyhigh in-plane resolution (range, 0.65-0.82 mm). As pixelsize increases, wall thickness measurements became moreuniform in distribution and less accurate.
Although there were small amounts of thrombus infour of 13 specimens, most of the sections used for wallthickness validation were thrombus-free. This was becausespecimens were harvested from anastomotic margins tofacilitate spatial correlation between CTA images and theanatomic location of the specimen and to avoid fractureand disintegration of the specimen in areas of severelydegenerated aneurysmal and atherosclerotic aortic wall.The described segmentation procedures are capable of
detecting the inner arterial wall in areas with large amountsof ILT, but the accuracy of the wall thickness measure-ments in these regions is still largely unproven.
From a biomechanics standpoint, this is unlikely to beof significance because previous aneurysm stress analyseshave shown that there is little wall stress on thrombus-laden sections of the aorta.14,26 Regional maxima in wallstress have been localized to abrupt changes in aneurysmmorphology, such as in aneurysm necks, which oftenhave minimal thrombus burden.7-9 However, the evolutionof wall thickness in regions of thrombus may play animportant role in the understanding of the pathophysi-ology and natural history of aneurysmal disease. Furtherwork in validating wall thickness maps over entire aortic an-eurysms, including areas with significant thrombus, will benecessary to address this issue.
mr
mc
r
Mean
Pa
th
olo
gic
-0.4
-0.2
1.0 1.5 2.0 2.5 3.0 3.5 4.0-0.6
Average of Radiographic and Pathologic (m m )
Fig 4. Bland-Altman plot shows the difference between wallthickness measurements derived from image analysis and wallthickness measured in pathologic specimens.
JOURNAL OF VASCULAR SURGERY6 Shang et al --- 2013
Although we found a favorable correlation betweenimage-based and pathologic measurements of wall thick-ness, with small absolute percentage errors, there is clearroom for improvement. This is reinforced by the rela-tively coarse 95% limits of agreement determined byBland-Altman analysis of 6 0.4 mm. A possible sourceof error arises in the use of CTAs that were notelectrocardiogram-gated, because the aortic wall in thesestudies is an average of the systolic and diastolic configura-tions. Furthermore, the pathologic specimens represent a“zero-stress” configuration, whereas the CTA images areunder physiologic blood pressure, possibly injecting somebias into our measurements. Unfortunately, there are scarcedata in the human aorta regarding the effects of removingresidual stress on wall thickness. Improvements in scanningresolution combined with electrocardiogram-gated studiesmay provide higher-quality image data and improveaccuracy.
CONCLUSIONS
CTA can be used to accurately measure regional andpatient-specific AWT. Descriptions and reconstructions ofaortic aneurysms that incorporate locally resolved wallthickness are feasible and may improve future attempts atbiomechanical analyses.
AUTHOR CONTRIBUTIONS
Conception and design: ES, CS, GF, BJAnalysis and interpretation: ES, AP, EL, RHData collection: ES, AP, EL, RHWriting the article: ES, CS, BJCritical revision of the article: ES, EL, AP, RH, RG, JG,
CS, GF, JB, BJFinal approval of the article: ES, EL, AP, RH, RG, JG, CS,
GF, JB, BJ
Statistical analysis: ESObtained funding: RG, JG, BJOverall responsibility: BJ
REFERENCES
1. Centers for Disease Control and Prevention, National Center forHealth Statistics. Compressed Mortality File 1999-2010 on CDCWONDER Online Database, released January 2013. Data arecompiled from Compressed Mortality File 1999-2010 Series 20 No.2P, 2013. Available at: http://wonder.cdc.gov/cmf-icd10.html.Accessed May 8, 2013.
2. Sakalihasan N, Limet R, Defawe OD. Abdominal aortic aneurysm.Lancet 2004;365:1577-89.
3. Savji N, Rockman CB, Skolnick AH, Guo Y, Adelman MA, Riles T,et al. Association between advanced age and vascular disease in differentarterial territories: a population database of over 3.5 million subjects.J Am Coll Cardiol 2013;61:1736-43.
4. Clouse WD, Hallett JW Jr, Schaff HV, Gayari MM, Ilstrup DM,Melton LJ 3rd. Improved prognosis of thoracic aortic aneurysms: apopulation based study. JAMA 1998;280:1926-9.
5. Lobato AC, Puech-Leao P. Predictive factors for rupture of thor-acoabdominal aortic aneurysm. J Vasc Surg 1998;27:446-53.
6. Schermerhorn ML, Bensley RP, Giles KA, Hurks R, O’malley AJ,Cotterill P, et al. Changes in abdominal aortic aneurysm rupture andshort-term mortality, 1995-2008: a retrospective observational study.Ann Surg 2012;256:651-8.
7. Fillinger MF, Marra SP, Raghavan ML, Kennedy FE. Prediction ofrupture risk in abdominal and aortic aneurysm during observation: wallstress versus diameter. J Vasc Surg 2003;37:724-32.
8. Li ZY, Sadat U, U-King-Im J, Tang TY, Bowden DJ, Hayes PD, et al.Association between aneurysm shoulder stress and abdominal aorticaneurysm expansion: a longitudinal follow-up study. Circulation2010;122:1815-22.
9. Shang EK, Nathan DP, Sprinkle SR, Vigmostad SC, Fairman RM,Bavaria JE, et al. Peak wall stress predicts expansion rate in descendingthoracic aortic aneurysms. Ann Thorac Surg 2013;95:593-8.
10. Venkatsubramaniam AK, Fagan MJ, Mehta T, Mylankal KJ, Ray B,Kuhan G, et al. A comparative study of aortic wall stress using finiteelement analysis for ruptured and non-ruptured abdominal aortic an-eurysms. Eur J Vasc Endovasc Surg 2004;28:168-76.
11. Raghavan ML, Kratzberg J, Castro de Tolosa EM, Hanaoka MM,Walker P, da Silva ES. Regional distribution of wall thickness andfailure properties of human abdominal aortic aneurysm. J Biomech2006;39:3010-6.
12. Di Martino ES, Bohra A, VandeGeest JP, Gupta N, Makaroun MS,Vorp DA. Biomechanical properties of ruptured versus electivelyrepaired abdominal aortic aneurysm wall tissue. J Vasc Surg 2006;43:570-6.
13. Humphrey JD, Holzapfel GA. Mechanics, mechanobiology, andmodeling of human abdominal aorta and aneurysms. J Biomech2012;45:805-14.
14. Reeps C, Gee M, Maier A, Gurdan M, Eckstein HH, Wall WA. Theimpact of model assumptions on results of computational mechanics inabdominal aortic aneurysm. J Vasc Surg 2010;51:679-88.
15. Arko FR, Murphy EH, Davis CM 3rd, Johnson ED, Smith ST,Zarins CK. Dynamic geometry and wall thickness of the aortic neck ofabdominal aortic aneurysms with intravascular ultrasonography. J VascSurg 2007;46:891-6.
16. Adame IM, van der Geest J, Bluemke DA, Lima JA, Reiber JH,Lelieveldt BP. Automatic vessel wall contour detection and quantifi-cation of wall thickness in in vivo MR images of the human aorta. MagnReson Imaging 2006;24:595-602.
17. Shum J, DiMartino ES, Goldhamme A, Goldman DH, Acker LC,Patel G, et al. Semiautomatic vessel wall detection and quantification ofwall thickness in computed tomography images of human abdominalaortic aneurysms. Med Phys 2010;37:638-48.
18. Kroon DJ, Slump CH, Maal TJ. Optimized anisotropic rotationalinvariant diffusion scheme on cone-beam CT. Med Image ComputAssist Interv 2010;13:221-8.

JOURNAL OF VASCULAR SURGERYVolume -, Number - Shang et al 7
19. Chan TF, Vese LA. Active contours without edges. IEEE Trans ImageProcess 2001;10:266-77.
20. Haralick RM, Shanmugam K, Dinstein I. Textural features for imageclassification. IEEE Trans Syst Man Cyb 1973;3:610-21.
21. Beller CJ, Gebhard MM, Karck M, Labrosse MR. Usefulness andlimitations of computational models in aortic disease risk stratification.J Vasc Surg 2010;52:1572-9.
22. Maier A, Gee MW, Reeps C, Pongratz J, Eckstein H, Wall WA.A comparison of diameter, wall stress, and rupture potential index forabdominal aortic aneurysm rupture risk prediction. Ann Biomed Eng2010;38:3124-34.
23. VandeGeest JP, Wang DHJ, Wisniewski S, Makaroun M, Vorp D.Towards a noninvasive method for determination of patient-specific
wall strength distribution in abdominal aortic aneurysms. Ann Bio-med Eng 2006;34:1098-106.
24. Lorenz MW, Markus HS, Bots ML, Rosvall M, Sitzer M. Prediction ofclinical cardiovascular events with carotid intima-media thickness: asystematic review and meta-analysis. Circulation 2007;115:459-67.
25. Rouleau L, Tremblay D, Cartier R, Mongrain R, Leask RL. Regionalvariations in canine descending aortic tissue mechanical propertieschange with formalin fixation. Cardiovasc Path 2012;21:390-7.
26. Maier A, Gee MW, Reeps C, Eckstein HH, Wall WA. Impact of cal-cifications on patient-specific wall stress analysis of abdominal aorticaneursyms. Biomech Model Mechanbiol 2010;9:511-21.
Submitted Jun 17, 2013; accepted Nov 19, 2013.
Copyright © 2022 FDOKUMEN