Validation of different versions of microtiter plate agglutination for rapid quantitative serologic...
12
79 Animal Health Research Journal Vol. 2 No. 4, December 2014 pp. 79-90 Validation of different versions of microtiter plate agglutination for rapid quanti- tative serologic diagnosis of Brucella melitensis infection in ruminants Essam M. Elbauomy*, Ashraf E. Sayour, Nour H. Abdel-Hamid, Mohammad K. El-Kholi, and Nadia A. Shalaby Department of Brucellosis Research, Animal Health Research Institute, Nadi El-Seid Street, Dokki, Giza 12618, Egypt Abstract For supplemental serologic diagnosis to suit the Egyptian brucellosis status quo, a bunch of standard agglutination formats were validated in domestic ruminants. Sera of 100 cows, 40 buffalo cows, 100 ewes, 30 female goats and 45 she-camels from the Nile Delta and Giza were tested with the Ameri- can buffered acidified plate antigen (BAPA) and standard plate (PAT) tests, plus the old (locally adopted) and current British microplate agglutination test (MAT) versions with complement fixation test (CFT) as the gold standard. The significance and interaction of animal species, test categories and test versions as factors affecting results were assessed using a three-way nested analysis of vari- ance, and the results were discussed. Kappa agreement with CFT was moderate for most methods, but fair for PAT, old MAT 24 hr, new MAT-ME 24 hr and old MAT-ME 24 hr. The BAPA had the highest relative sensitivity at the expense of specificity. ROC curves revealed fair accuracy for al- most all tests, poor for old MAT24 hr, and maximum values for the BAPA and the new MAT-EDTA 6 hr. The estimated cutoffs for almost all tests were close to their original ones. The new MAT 6 hr and MAT-EDTA 6 hr had higher thresholds of 77 and 56.5 IU/ml respectively. In conclusion, it is high time to substitute all the old local MAT versions for the recent 6-hour safranin-O stained MAT- EDTA interpreted as positive at 60 IU/ml rather than 30 IU/ml to avoid oversensitivity unfitting the native epizootological and economic conditions. Key words: Brucella, microplate agglutination, MAT, EDTA, MET, BAPA, SPT, CFT, ruminant, ROC curves, accuracy, AUC, cutoff, sensitivity, specificity, kappa agreement, 3-way nested ANOVA. Received in 9/ 11 /2014 Accepted in 25/ 11 /2014 ISSN: 2356-7767 Introduction Brucellosis is a harassing zoonosis that affects a variety of mammals especially ruminants forming a serious health hazard for being un- feasibly treatable in animals and hard-to-cure in humans (Madkour, 2001). The disease con- stitutes an economic burden due to the urge for condemnation of infected animals with com- pensations paid to the owners, late abortion mostly with breeding troubles, and remarkable reduction of milk yield. The causative agents, brucellae, are facultative intracellular fastidi- ous slow-growing group of bacteria that render extensive disease diagnosis mostly handy by serologic means (OIE, 2012). The serologic tests routinely used for the diag- nosis of livestock brucellosis include three main categories according to their function, viz. screening, supplemental / complementary and confirmatory as indicated in the OIE Man- ual of Diagnostic Tests and Vaccines for Ter- restrial Animals (OIE, 2012). The standard tube agglutination for brucellosis is an ancient classic supplemental test that, regardless of its limitations, still has some usefulness as a quan- titative assessment for total agglutinins mainly comprising IgM and IgG 2 (Nielsen, 2002). Being slow is one of the major disadvantages of the test, where the British tube method re- quires overnight incubation and the American
-
Upload
egyptfishportal -
Category
Documents
-
view
2 -
download
0
Transcript of Validation of different versions of microtiter plate agglutination for rapid quantitative serologic...
79
Animal Health Research Journal Vol. 2 No. 4, December 2014 pp. 79-90
Validation of different versions of microtiter plate agglutination for rapid quanti-tative serologic diagnosis of Brucella melitensis infection in ruminants
Essam M. Elbauomy*, Ashraf E. Sayour, Nour H. Abdel-Hamid, Mohammad K.El-Kholi, and Nadia A. Shalaby
Department of Brucellosis Research, Animal Health Research Institute, Nadi El-SeidStreet, Dokki, Giza 12618, Egypt
AbstractFor supplemental serologic diagnosis to suit the Egyptian brucellosis status quo, a bunch of standardagglutination formats were validated in domestic ruminants. Sera of 100 cows, 40 buffalo cows, 100ewes, 30 female goats and 45 she-camels from the Nile Delta and Giza were tested with the Ameri-can buffered acidified plate antigen (BAPA) and standard plate (PAT) tests, plus the old (locallyadopted) and current British microplate agglutination test (MAT) versions with complement fixationtest (CFT) as the gold standard. The significance and interaction of animal species, test categoriesand test versions as factors affecting results were assessed using a three-way nested analysis of vari-ance, and the results were discussed. Kappa agreement with CFT was moderate for most methods,but fair for PAT, old MAT 24 hr, new MAT-ME 24 hr and old MAT-ME 24 hr. The BAPA had thehighest relative sensitivity at the expense of specificity. ROC curves revealed fair accuracy for al-most all tests, poor for old MAT 24 hr, and maximum values for the BAPA and the new MAT-EDTA6 hr. The estimated cutoffs for almost all tests were close to their original ones. The new MAT 6 hrand MAT-EDTA 6 hr had higher thresholds of 77 and 56.5 IU/ml respectively. In conclusion, it ishigh time to substitute all the old local MAT versions for the recent 6-hour safranin-O stained MAT-EDTA interpreted as positive at 60 IU/ml rather than 30 IU/ml to avoid oversensitivity unfitting thenative epizootological and economic conditions.
Key words: Brucella, microplate agglutination, MAT, EDTA, MET, BAPA, SPT, CFT, ruminant,ROC curves, accuracy, AUC, cutoff, sensitivity, specificity, kappa agreement, 3-waynested ANOVA.
Received in 9/ 11 /2014Accepted in 25/ 11 /2014
ISSN: 2356-7767
IntroductionBrucellosis is a harassing zoonosis that affectsa variety of mammals especially ruminantsforming a serious health hazard for being un-feasibly treatable in animals and hard-to-curein humans (Madkour, 2001). The disease con-stitutes an economic burden due to the urge forcondemnation of infected animals with com-pensations paid to the owners, late abortionmostly with breeding troubles, and remarkablereduction of milk yield. The causative agents,brucellae, are facultative intracellular fastidi-ous slow-growing group of bacteria that renderextensive disease diagnosis mostly handy byserologic means (OIE, 2012).
The serologic tests routinely used for the diag-nosis of livestock brucellosis include threemain categories according to their function,viz. screening, supplemental / complementaryand confirmatory as indicated in the OIE Man-ual of Diagnostic Tests and Vaccines for Ter-restrial Animals (OIE, 2012). The standardtube agglutination for brucellosis is an ancientclassic supplemental test that, regardless of itslimitations, still has some usefulness as a quan-titative assessment for total agglutinins mainlycomprising IgM and IgG2 (Nielsen, 2002).Being slow is one of the major disadvantagesof the test, where the British tube method re-quires overnight incubation and the American
80
Animal Health Research Journal Vol. 2 No. 4, December 2014 Elbauomy et al.
version requires 2-day incubation (Alton et al.,1988). To keep up with the growing demandon rapid tests, some microplate versions of thetest that give same-day results were introduced.This included the British microtiter plate ag-glutination using white antigen with resultsafter 6 hours (Poppy Lowe, Personal commu-nication, January 14, 2011) and the Americanstandard semi-quantitative plate agglutinationusing crystal violet and malachite green stainedantigen with results after 12 minutes only(Alton et al., 1988) in addition to a safranin-Ostained microagglutination with results after 18hours (Baum et al., 1995).The old British version of the tube agglutina-tion (SAT) according to Alton et al. (1975) hasbeen adopted in Egypt as a supplemental quan-titative test. The antigen for that test has beenstandardized against the 2nd ISAbS (currentlythe OIEISS) to give 50% agglutination at1/500. Now that the epizootologic situation hasbeen changed lately in terms of increasing dis-ease prevalence especially in small ruminantsinfected entirely with Brucella melitensis(Abdel-Hamid et al., 2012), it seems appropri-ate to check the suitability of the old SAT per-formance characteristics to meet the status quo.An international standard serum (ISaBmS) hasbeen recently produce by McGiven et al.(2011) for small ruminants infected withBrucella melitensis to mainly standardize spe-cies-specific tests, viz. the indirect and com-petitive ELISA, fluorescence polarization andRose-Bengal. Still, quantitative agglutination
tests are almost entirely standardized to diag-nose Brucella abortus infected bovines usingthe OIEISS. The OIE (2012) pointed out thatit was ok to use any of the serologic tests ofcattle in other ruminant species after propervalidation in that particular species.The aim of this investigation was to examinethe fitness for purpose of different plate andmicroplate agglutination formats with andwithout acidified pH, EDTA or mercaptoetha-nol for the diagnosis of Brucella melitensis in-fection in ruminant animal species, and to se-lect the positive cutoff points that achieve opti-mal accuracy and the best combination of sen-sitivity and specificity to suit the Egyptian epi-zootologic status quo.
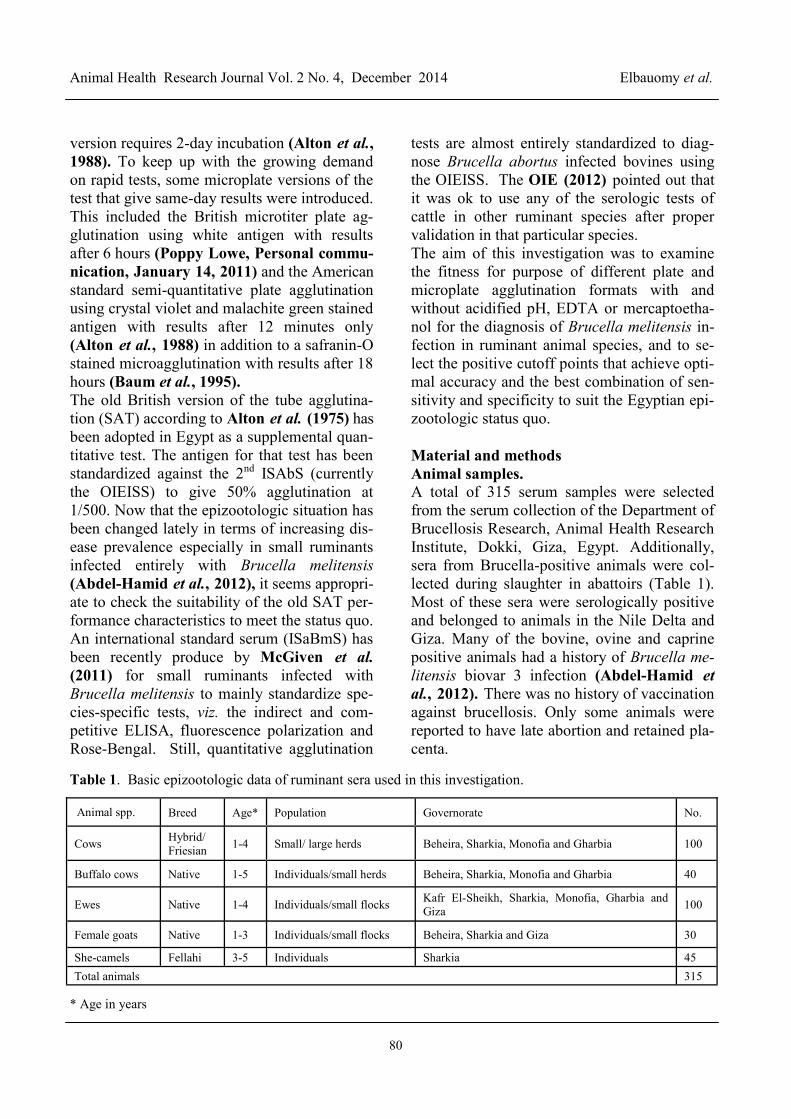
Material and methodsAnimal samples.A total of 315 serum samples were selectedfrom the serum collection of the Department ofBrucellosis Research, Animal Health ResearchInstitute, Dokki, Giza, Egypt. Additionally,sera from Brucella-positive animals were col-lected during slaughter in abattoirs (Table 1).Most of these sera were serologically positiveand belonged to animals in the Nile Delta andGiza. Many of the bovine, ovine and caprinepositive animals had a history of Brucella me-litensis biovar 3 infection (Abdel-Hamid etal., 2012). There was no history of vaccinationagainst brucellosis. Only some animals werereported to have late abortion and retained pla-centa.
Table 1. Basic epizootologic data of ruminant sera used in this investigation.
Animal spp. Breed Age* Population Governorate No.
Cows Hybrid/Friesian 1-4 Small/ large herds Beheira, Sharkia, Monofia and Gharbia 100
Buffalo cows Native 1-5 Individuals/small herds Beheira, Sharkia, Monofia and Gharbia 40
Ewes Native 1-4 Individuals/small flocks Kafr El-Sheikh, Sharkia, Monofia, Gharbia andGiza 100
Female goats Native 1-3 Individuals/small flocks Beheira, Sharkia and Giza 30
She-camels Fellahi 3-5 Individuals Sharkia 45Total animals 315
* Age in years
81
Animal Health Research Journal Vol. 2 No. 4, December 2014 pp. 79-90
Serological tests.Buffered acidified plate antigen (BAPA) andstandard plate agglutination (PAT) tests:Antigens for the BAPA and PAT were pur-chased from NVSL/DBL, USDA, USA. Bothtests were performed according to Alton et al.,(1988). Although qualitative, the BAPA resultswere recorded as scores of 0 to 4+ according tothe degree of agglutination. The PAT resultswere reported as titers of 1/25, 1/50, 1/100 and1/200 similar to the titers of the American stan-dard tube test. Any degree of agglutination inthe BAPA was considered positive, while thePAT was interpreted at a positive cutoff of1/100 incomplete agglutination. PAT titerswere converted to international units per milli-liter of serum (IU/ml).Microplate agglutination in phenol saline(MAT), with EDTA (MAT-EDTA), and withmercaptoethanol (MAT-ME) test versions:Standardized to give 50% agglutination at1/650 of the OIEISS, antigen for the new Brit-ish MAT versions was obtained from AHVLA,New Haw, Addlestone, Surrey KT15 3NB,UK. The test was performed according toBrinley Morgan et al., (1981) and the currentBritish SOP (Poppy Lowe, Personal commu-nication, January 14, 2011). The results wererecorded after 6 hours (new MAT 6 hr) andagain at 24 hours (new MAT 24 hr). For thenew British MAT-EDTA, EDTA was added ata concentration of 10 mM in PBS and the re-sults recorded after 6 hours (new MAT-EDTA6 hr) and again at 24 hours (new MAT-EDTA24 hr). As to the MAT-ME, mercaptoethanolwas used at a concentration of 100 mM in nor-mal saline as described in Alton et al. (1975).The new British MAT, MAT-EDTA and MAT-ME versions were interpreted as positive at ≥30 IU/mlThe Egyptian antigen for old MAT 24 hr, oldMAT-EDTA 24 hr and old MAT-ME 24 hrwas locally produced by the Veterinary Serumand Vaccine Research Institute, Abbasseya,Cairo. It was standardized to give 50% aggluti-nation at 1/500 of the OIEISS. The old Britishmethod published in Alton et al., (1975) is the
currently adopted in Egypt for all MAT ver-sions. The EDTA and 2-mercaptoethanol con-centrations for the Egyptian MAT formatswere the same as for their new British counter-parts. The old MAT 24 hr was interpreted aspositive at ≥ 80 IU/ml, while the old MAT-EDTA and old MAT-ME parallels were re-garded positive at ≥ 40 IU/ml.All microplate agglutination formats were triedwith and without safranin O staining. This dyewas used according to Baum et al., (1995).Complement fixation test (CFT):Antigen for the American CFT was importedfrom NVSL/DBL, USDA, USA. Complementand hemolysin were prepared and preservedaccording to Alton et al., (1988) and were ti-trated after Hennager (2004) and Hennager(current version) (H. E. Stowell, personalcommunication, November 22, 2010). SheepRBCs were collected on Alsever’s solutionfrom an adult healthy ram serologically nega-tive to brucellosis. These were standardized to2% suspension in veronal buffer saline. Warmfixation of complement was adopted as coldfixation was unacceptably slow. Results ofCFT were converted to ICFTU/ml and inter-preted as positive at a cutoff point of ≥ 20ICFTU/ml.Statistical analyses.All the following analyses were performed us-ing IBM® SPSS® Statistics, Version 21, IBMCorporation, 2012, under the environment ofWindows® 8.1, Microsoft Corporation.1- Three-way nested analysis of variance(ANOVA):The titers of serologic tests were converted toIU/ml of serum, except for the BAPA whichwas recorded as scores of 0 to 4 according tothe degree of reaction. These raw data werestatistically tested for the normal distributionusing SPSS different parameters. Unfortu-nately, the assumption of normal distributionof data was rejected as indicated by the SPSS’Shapiro-Wilk test at p value < 0.05. Data werethen transformed using log base 10+1 to follownormal distribution. A 3-way nested ANOVAwas used to study the significance of 3 factors,
82
Animal Health Research Journal Vol. 2 No. 4, December 2014 Elbauomy et al.
namely the animal species (cows, buffalocows, ewes, female goats and she camels), testcategories (MAT, MAT-EDTA and MAT-ME), and test versions using different antigens(new British read after 6 and 24 hours, and oldBritish read after 24 hours) as independent fac-tors and the interaction between each factorand their effect on results (the dependent fac-tor).2- Kappa (κ) agreement and relative sensitiv-ity/ specificity:The kappa (κ) agreement of agglutination testswith CFT was used to assess the matching of
results at p < 0.05. Relative sensitivity/ speci-ficity pairs were also calculated.3- Receiver operating characteristics (ROC)curves:Considering the CFT as the serologic goldstandard, ROC curves expressing the sensitiv-ity (true positive rate) versus the false positiverate were plotted for all agglutination tests.Data were obtained from ROC curves includ-ing the area under the curve (AUC) represent-ing accuracy, the best positive cutoff point, andthe equivalent true positive/ false positiverates.
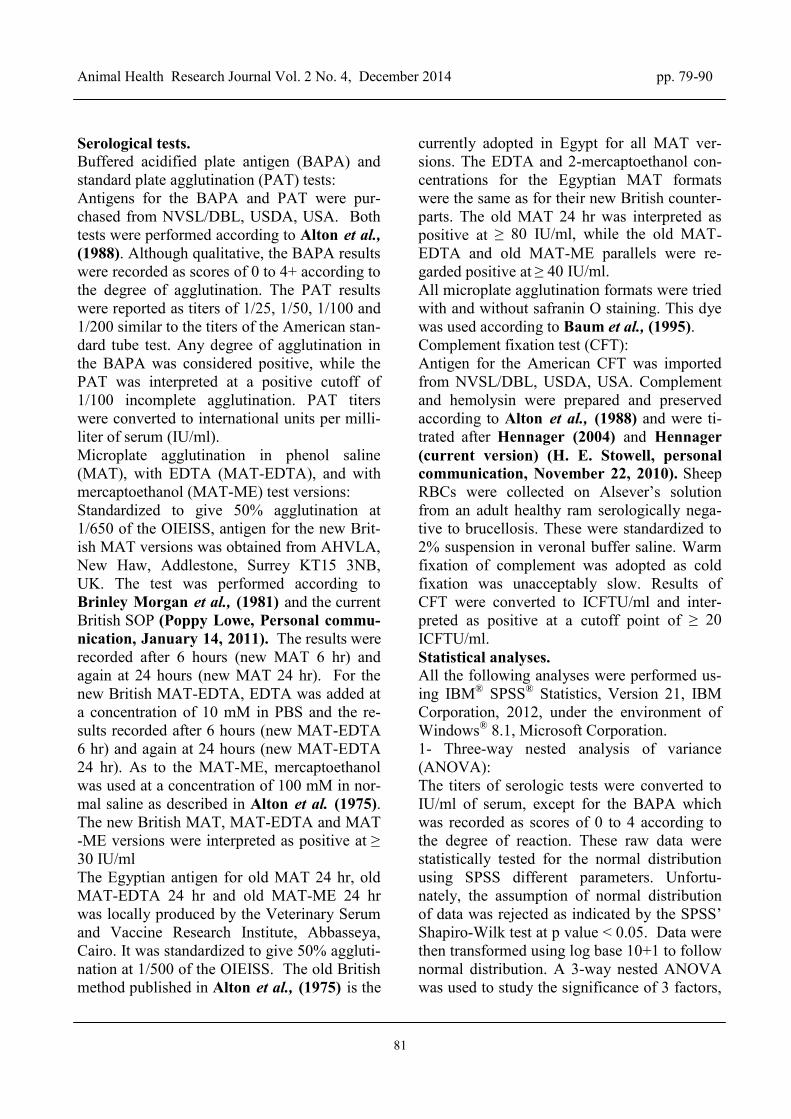
ResultsTable 2. Analysis of variance for factors affecting the results of agglutination tests.
Factor F score Significance (p value)Animal species 21.687 0.000000Agglutination test category 16.377 0.000000Within category test version 11.234 0.000014Species vs. test category 2.107 0.031977Species vs. test version 1.608 0.117256Test category vs. test version 1.892 0.109070Species vs. test category vs. test version 0.896 0.573504
*: significant at p < 0.05 with confidence interval of 95%
Table 3. Post hoc test using the least significant difference (LSD) to reveal variation in results among differ-ent animal species.
Animal species (I) Animal species (J) Mean difference (I-J) Standard error Significance (p value)
Cows
Buffalo cows 0.351* 0.052 0.000000Ewes 0.175* 0.039 0.000008Female goats 0.341* 0.058 0.000000She-camels 0.360* 0.050 0.000000
Buffalo cows
Cows -0.351* 0.052 0.000000Ewes -0.175* 0.052 0.000715Female goats -0.009 0.067 0.887705She-camels 0.009 0.060 0.879159
Ewes
Cows -0.175* 0.039 0.000008Buffalo cows 0.175* 0.052 0.000715Female goats 0.166* 0.058 0.003998She-camels 0.184* 0.050 0.000207
Female goats
Cows -0.341* 0.058 0.000000Buffalo cows 0.009 0.067 0.887705Ewes -0.166* 0.058 0.003998She-camels 0.019 0.065 0.775748
She-camels
Cows -0.360* 0.050 0.000000Buffalo cows -0.009 0.060 0.879159Ewes -0.184* 0.050 0.000207Female goats -0.019 0.065 0.775748
*: significant at p < 0.05 with confidence interval of 95%
83
Animal Health Research Journal Vol. 2 No. 4, December 2014 pp. 79-90
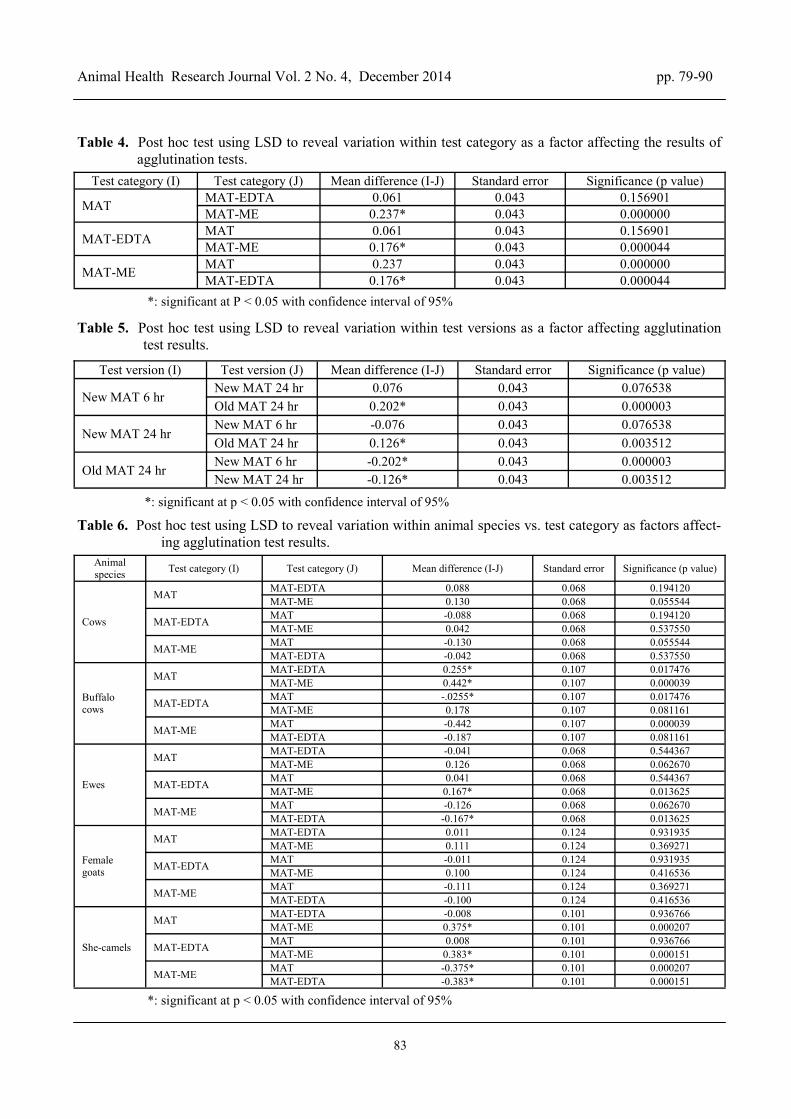
Table 4. Post hoc test using LSD to reveal variation within test category as a factor affecting the results ofagglutination tests.
Test category (I) Test category (J) Mean difference (I-J) Standard error Significance (p value)
MAT MAT-EDTA 0.061 0.043 0.156901MAT-ME 0.237* 0.043 0.000000
MAT-EDTA MAT 0.061 0.043 0.156901MAT-ME 0.176* 0.043 0.000044
MAT-ME MAT 0.237 0.043 0.000000MAT-EDTA 0.176* 0.043 0.000044
*: significant at P < 0.05 with confidence interval of 95%
Table 5. Post hoc test using LSD to reveal variation within test versions as a factor affecting agglutinationtest results.
Test version (I) Test version (J) Mean difference (I-J) Standard error Significance (p value)
New MAT 6 hrNew MAT 24 hr 0.076 0.043 0.076538Old MAT 24 hr 0.202* 0.043 0.000003
New MAT 24 hrNew MAT 6 hr -0.076 0.043 0.076538Old MAT 24 hr 0.126* 0.043 0.003512
Old MAT 24 hrNew MAT 6 hr -0.202* 0.043 0.000003New MAT 24 hr -0.126* 0.043 0.003512
*: significant at p < 0.05 with confidence interval of 95%
Table 6. Post hoc test using LSD to reveal variation within animal species vs. test category as factors affect-ing agglutination test results.
Animalspecies Test category (I) Test category (J) Mean difference (I-J) Standard error Significance (p value)
Cows
MAT MAT-EDTA 0.088 0.068 0.194120MAT-ME 0.130 0.068 0.055544
MAT-EDTA MAT -0.088 0.068 0.194120MAT-ME 0.042 0.068 0.537550
MAT-ME MAT -0.130 0.068 0.055544MAT-EDTA -0.042 0.068 0.537550
Buffalocows
MAT MAT-EDTA 0.255* 0.107 0.017476MAT-ME 0.442* 0.107 0.000039
MAT-EDTA MAT -.0255* 0.107 0.017476MAT-ME 0.178 0.107 0.081161
MAT-ME MAT -0.442 0.107 0.000039MAT-EDTA -0.187 0.107 0.081161
Ewes
MAT MAT-EDTA -0.041 0.068 0.544367MAT-ME 0.126 0.068 0.062670
MAT-EDTA MAT 0.041 0.068 0.544367MAT-ME 0.167* 0.068 0.013625
MAT-ME MAT -0.126 0.068 0.062670MAT-EDTA -0.167* 0.068 0.013625
Femalegoats
MAT MAT-EDTA 0.011 0.124 0.931935MAT-ME 0.111 0.124 0.369271
MAT-EDTA MAT -0.011 0.124 0.931935MAT-ME 0.100 0.124 0.416536
MAT-ME MAT -0.111 0.124 0.369271MAT-EDTA -0.100 0.124 0.416536
She-camels
MAT MAT-EDTA -0.008 0.101 0.936766MAT-ME 0.375* 0.101 0.000207
MAT-EDTA MAT 0.008 0.101 0.936766MAT-ME 0.383* 0.101 0.000151
MAT-ME MAT -0.375* 0.101 0.000207MAT-EDTA -0.383* 0.101 0.000151
*: significant at p < 0.05 with confidence interval of 95%
84
Animal Health Research Journal Vol. 2 No. 4, December 2014 Elbauomy et al.
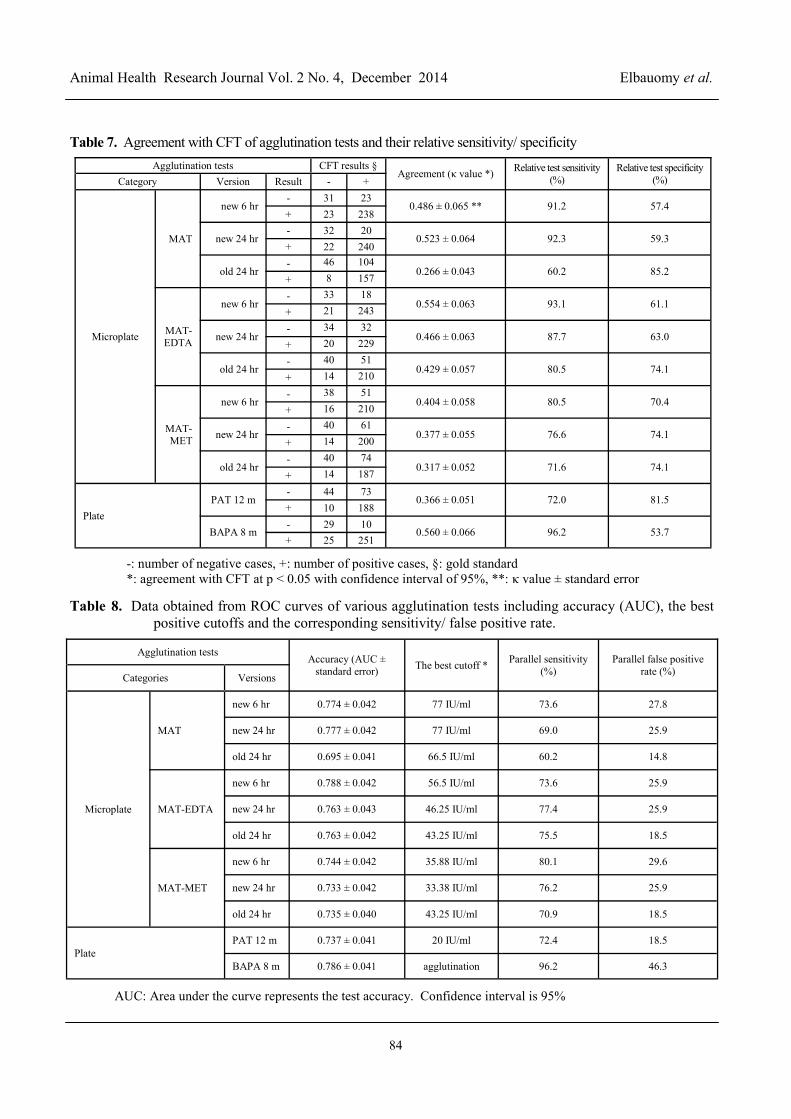
Table 7. Agreement with CFT of agglutination tests and their relative sensitivity/ specificityAgglutination tests CFT results §
Agreement (κ value *) Relative test sensitivity(%)
Relative test specificity(%)Category Version Result - +
Microplate
MAT
new 6 hr- 31 23
0.486 ± 0.065 ** 91.2 57.4+ 23 238
new 24 hr- 32 20
0.523 ± 0.064 92.3 59.3+ 22 240
old 24 hr- 46 104
0.266 ± 0.043 60.2 85.2+ 8 157
MAT-EDTA
new 6 hr- 33 18
0.554 ± 0.063 93.1 61.1+ 21 243
new 24 hr- 34 32
0.466 ± 0.063 87.7 63.0+ 20 229
old 24 hr- 40 51
0.429 ± 0.057 80.5 74.1+ 14 210
MAT-MET
new 6 hr- 38 51
0.404 ± 0.058 80.5 70.4+ 16 210
new 24 hr- 40 61
0.377 ± 0.055 76.6 74.1+ 14 200
old 24 hr- 40 74
0.317 ± 0.052 71.6 74.1+ 14 187
PlatePAT 12 m
- 44 730.366 ± 0.051 72.0 81.5
+ 10 188
BAPA 8 m- 29 10
0.560 ± 0.066 96.2 53.7+ 25 251
-: number of negative cases, +: number of positive cases, §: gold standard*: agreement with CFT at p < 0.05 with confidence interval of 95%, **: κ value ± standard error
Table 8. Data obtained from ROC curves of various agglutination tests including accuracy (AUC), the bestpositive cutoffs and the corresponding sensitivity/ false positive rate.
Agglutination testsAccuracy (AUC ±
standard error) The best cutoff * Parallel sensitivity(%)
Parallel false positiverate (%)Categories Versions
Microplate
MAT
new 6 hr 0.774 ± 0.042 77 IU/ml 73.6 27.8
new 24 hr 0.777 ± 0.042 77 IU/ml 69.0 25.9
old 24 hr 0.695 ± 0.041 66.5 IU/ml 60.2 14.8
MAT-EDTA
new 6 hr 0.788 ± 0.042 56.5 IU/ml 73.6 25.9
new 24 hr 0.763 ± 0.043 46.25 IU/ml 77.4 25.9
old 24 hr 0.763 ± 0.042 43.25 IU/ml 75.5 18.5
MAT-MET
new 6 hr 0.744 ± 0.042 35.88 IU/ml 80.1 29.6
new 24 hr 0.733 ± 0.042 33.38 IU/ml 76.2 25.9
old 24 hr 0.735 ± 0.040 43.25 IU/ml 70.9 18.5
PlatePAT 12 m 0.737 ± 0.041 20 IU/ml 72.4 18.5
BAPA 8 m 0.786 ± 0.041 agglutination 96.2 46.3
AUC: Area under the curve represents the test accuracy. Confidence interval is 95%
85
Animal Health Research Journal Vol. 2 No. 4, December 2014 pp. 79-90
0.1
0.15 0.2
0.3
0.4
0.5
0.6
0.7
0.8
0.9 1
0.1
0.2
0.3
0.4
0.5
0.6
0.7
0.8
0.9
1
Reference line (x = y)
New MAT 6 hr New MAT 24 hr Old MAT 24 hr New MAT-EDTA 6 hr New MAT-EDTA 24 hr Old MAT-EDTA 24 hr New MAT-MET 6 hr New MAT-MET 24 hr Old MAT-MET 24 hr PAT 12 m BAPA 8 m
Sens
itivi
ty
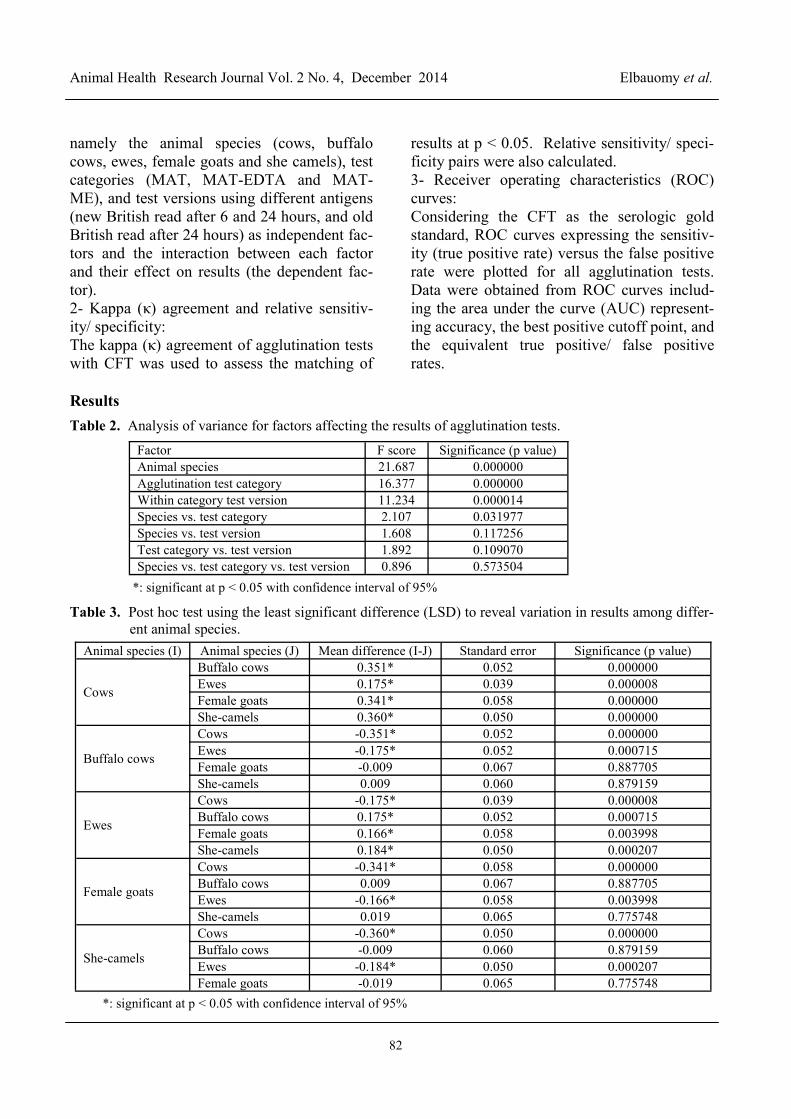
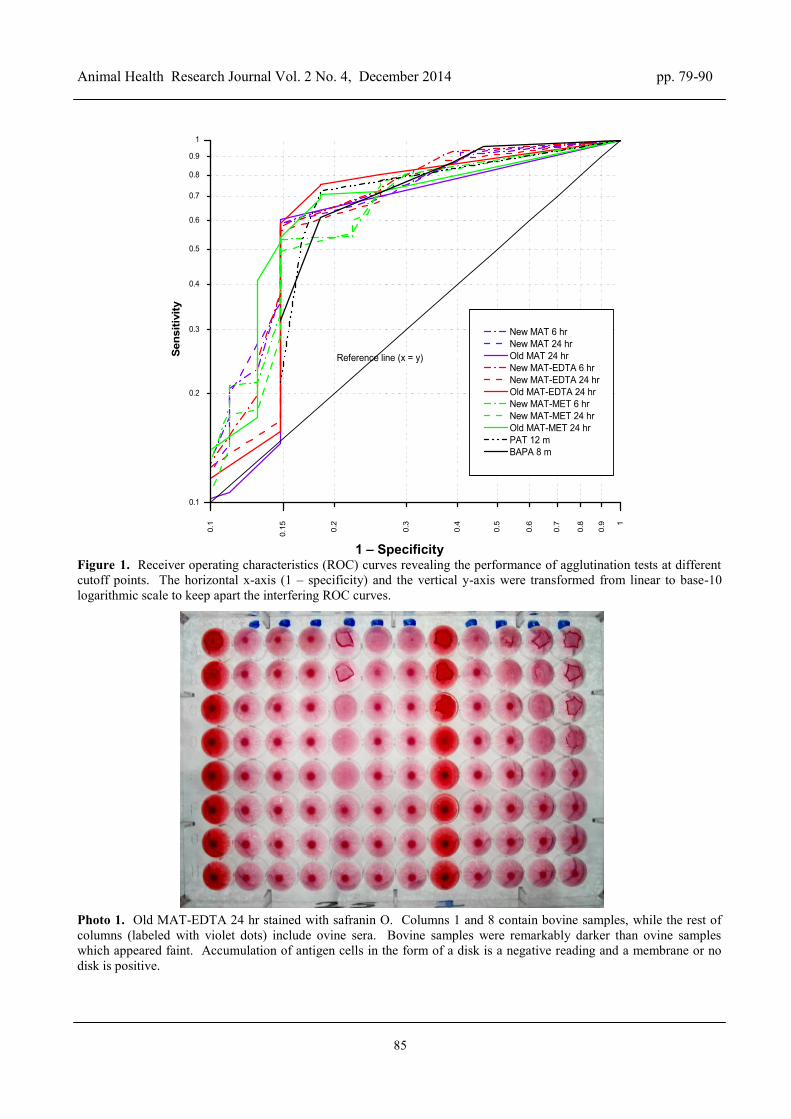
Specificity - 11 – SpecificityFigure 1. Receiver operating characteristics (ROC) curves revealing the performance of agglutination tests at differentcutoff points. The horizontal x-axis (1 – specificity) and the vertical y-axis were transformed from linear to base-10logarithmic scale to keep apart the interfering ROC curves.
Photo 1. Old MAT-EDTA 24 hr stained with safranin O. Columns 1 and 8 contain bovine samples, while the rest ofcolumns (labeled with violet dots) include ovine sera. Bovine samples were remarkably darker than ovine sampleswhich appeared faint. Accumulation of antigen cells in the form of a disk is a negative reading and a membrane or nodisk is positive.
86
Animal Health Research Journal Vol. 2 No. 4, December 2014 Elbauomy et al.
DiscussionIn a re-assessment of microplate agglutinationtest formats and their sphere of usefulness forthe diagnosis of Brucella melitensis infectedruminants, the current British versions werecompared against their previous British equalsstill adopted in Egypt with and without EDTAand mercaptoethanol other than with and with-out safranin-O staining. The American versionof microplate CFT with same-day warm fixa-tion was selected among other standard CFTtechniques for technical and epizootologic rea-sons (Sayour et al., 2013) to be the referencegold standard in place of the bacteriologic iso-lation and identification of Brucella, as therewas no easy access to all serologically positiveanimals on slaughter. However, many animals,except she-camels, under this investigation be-longed to localities proven infected withBrucella melitensis biovar 3 (Abdel-Hamid etal., 2012). To analyze the attained test results,a three-way nested ANOVA, kappa agreementwith relative sensitivity/ specificity and ROCcurves were resorted to as follows.A three-way nested ANOVA was used to studythe significance on the test results of 3 factors,namely the animal species, test category(MAT, MAT-EDTA and MAT-ME), and testversion (using British and Egyptian antigens)and their interactions. Levene’s test of equal-ity of error variances at p value ˂ 0.05 revealedthat the homogeneity of standard deviationamong variables had been violated. Prelimi-nary statistical F scores at p < 0.05 (Table 2)indicated highly significant statistical differ-ence within each of these three factors espe-cially the animal species and the agglutinationtest category. In other words, the results variedgreatly among different animal species, amongdifferent test categories and less greatly amongdifferent test versions. Inter-factorial investiga-tion for statistical variation included animalspecies vs. test category, species vs. test ver-sion and species vs. test category vs. test ver-sion. There was only slight statistical signifi-cant difference between animal species and testcategory. Unfortunately, there was no unique
combination or clear effect of animal speciesand test version, between test category and testversion, or among animal species, test categoryand test version to create significant effect onagglutination results.To further investigate the source of variationwithin the results of different animal species, apost hoc test using LSD at p < 0.05 and confi-dence interval of 95% was performed (Table3). Three levels of statistically significantvariation were noticed among the test results ofthe five animal species; very high (0.000000)between the results of cows on one side andbuffalo cows, female goats and she-camels onthe other and vice versa, high (0.000008) be-tween cows and ewes and vice versa, and mod-erate differences (0.000715, 0.003998 and0.000207) were respectively noticed betweenbuffalo cows and ewes, between ewes and fe-male goats and between ewes and she-camelsand vice versa.. Then again, insignificant sta-tistical differences (≥ 0.05) were observed be-tween buffalo cows on one side and femalegoats and she-camels on the other and viceversa. Simply speaking, the results of cowsand ewes differed greatly as opposed to each ofthe other three species of animals and viceversa, while the results of buffalo cows, femalegoats and she-camels were matching. Thismay, in part, be attributed to the fact that SAT,or its MAT versions, are primary standardizedto be used in cattle (OIE, 2012).To seek the source of statistical variationamong the agglutination test categories, a posthoc test using LSD at p < 0.05 and confidenceinterval of 95% was followed (Table 4). MATand MAT-ME results varied significantly (pvalue of 0.000000), while MAT-EDTA andMAT-ME varied a little bit less significantly(0.000044). Results of MAT and MAT-EDTAdid not differ significantly. This reflects thefact that MAT and MAT-EDTA detect almostthe same classes of antibodies includingmainly IgM and IgG2 (Nielsen et al., 1984),but with improved specificity and/ or sensitiv-ity in case of the latter (Table 4). The presenceof the chelating agent EDTA reduces false
87
Animal Health Research Journal Vol. 2 No. 4, December 2014 pp. 79-90
positive reactions due to non-specific IgMprobably by competition with IgM receptors onthe Brucella antigen cells (MacMillan, 1990).Being highly avid (Delves et al., 2011),Brucella-specific IgM seems to overcomeEDTA’s competing impact. The MAT-MEresults, on the other hand, are way different asthe test detects IgG2 almost entirely (Alton etal., 1975) splitting the disuphide bonds of thepentameric IgM (Delves et al., 2011) whetherspecific or not.Analyzing the statistical variation within theagglutination test versions, a post hoc test us-ing LSD at p < 0.05 and confidence interval of95% was adopted (Table 5). Statistical signifi-cant difference (0.000003) between the resultsof new MAT 6 hr and old MAT 24 hr washigher than that (0.003512) between the newMAT 24 hr and the old MAT 24 hr. This canbe explained by the fact that the new and oldBritish MAT versions do not differ only interms of antigen concentration (Alton et al.,1975; Brinley Morgan et al., 1981 and OIE,2012), but also in their incubation time wherethe new British MAT is read after 6 hours andadditionally at 24 hours in this investigation,and the old British MAT is only read after 24hours. There was no significant difference be-tween the new British MAT either read after 6or 24 hours.To detect combined statistical variation be-tween animal species and within agglutinationtest categories, a post hoc test using LSD at p <0.05 and confidence interval of 95% (Table 6)was performed. There were major statisticaldifferences (0.000039) among buffalo cows,MAT and MAT-ME, 0.000207 among she-camels, MAT and MAT-ME, and 0.000151among she-camels, MAT-EDTA and MAT-ME. Statistical differences of minor signifi-cance (0.013625) existed among ewes, MAT-EDTA and MAT-ME. This reflects significantamounts of IgM in sera of tested buffalo cowsand she-camels as compared to ewes with rela-tively lower IgM. The presence of IgM ismostly due to recent infection (MacMillan,1990) rather than a non-specific reaction,where most animals were selected from
Brucella melitensis infected areas (Abdel-Hamid et al., 2012).Taking the CFT as the reference gold standard,the kappa (κ) agreement with agglutinationtests was used to assess the matching of results(Table 7). Landis and Koch (1977) character-ized values < 0 as indicating no agreement and0- 0.20 as slight, 0.21- 0.40 as fair, 0.41- 0.60as moderate, 0.61- 0.80 as substantial, and 0.81- 1 as almost perfect agreement. All versions ofagglutination tests agreed significantly withCFT at p < 0.05. The estimated κ agreementvalues with the CFT indicated moderate agree-ment in case of most agglutination versionsincluding the BAPA, new MAT 6 hr, newMAT 24 hr, new MAT-EDTA 6 hr, new MAT-EDTA 24 hr, old MAT-EDTA 24 hr, and newMAT-ME 6 hr, where the values ranged from0.404 to 0.560. Then again, the estimated κagreement values indicated fair agreement incase of the PAT, old MAT 24 hr, new MAT-ME 24 hr and old MAT-ME 24 hr, where the κvalues ranged from 0.266 to 0.377. The reasonbehind this fair agreement may be due to therelatively low positive cutoff points of suchtests. The lower the decision level, the higherthe sensitivity and the lower the specificityand, hence, the lower the agreement.The highest relative sensitivity of agglutinationtests was that of the BAPA (96.2%) at the ex-pense of the relative specificity (53.7%) asseen in Table 7. Comparing the various MATversions, the MAT-EDTA versions were gen-erally more superior in terms of both their rela-tive sensitivity than the MAT and MAT-MErespectively. The new British MAT, MAT-EDTA and MAT-ME were way better thantheir old British counterparts regarding theirrelative sensitivity.As a means for test validation, ROC curveswere plotted (Fawcett, 2006) for all agglutina-tion tests (Figure 1). These aimed at re-evaluation of overall test performance, deter-mination of test accuracy and selection of themost reliable positive cutoffs with correspond-ing true and false positive rates (Table 8) underconditions of this investigation representing themost common Egyptian circumstances, i. e.
88
Animal Health Research Journal Vol. 2 No. 4, December 2014 Elbauomy et al.
Brucella melitensis infected ruminant species.To separate the overlapping curves, it was nec-essary to transform both the horizontal x-axisand the vertical y-axis scales from linear tobase-10 logarithmic (log). Plotting the ROCcurves on log-log scales widely stretched thebeginning of both axes to clearly reveal thelow x and y values.The closer the ROC curve to the vertical axis,the better the test performance (Fawcett,2006). By the same token, the closer the ROCcurve to the reference line, the worse the testperformance. The old MAT-EDTA 24 hr (redsolid curve), the PAT (black dash-double dot-dash curve) and the old MAT-ME 24 hr (greensolid curve) revealed the best performances asopposed to other agglutination formats (Figure1). The BAPA (black solid curve), in its sphereof usefulness as a presumptive test, achievedthe highest sensitivity (96.2%) of all with ahigh but acceptable fall-out of 46.3% to mini-mize the undesirable false negative rate.Comparing the ROC curve of the old MAT-EDTA 24 hr (Figure 1) with its new equiva-lents (red non-solid curves), the curves of boththe new MAT-EDTA especially the 6-hourversion showed superiority both at the begin-ning and the end, but concavity at the middleas opposed to the convexity hull of the oldMAT-EDTA. The old MAT-ME (green solid)curve behaved similarly compared to its newequals (green non-solid curves) with more ob-vious convexity and concavity in the middle.The middle convexity and concavity were alsonoticed but very slightly in case of MAT ver-sions (violet curves). Concavity indicated aregion where the test performance was sub-standard. The convexity-concavity issue musthave resulted from the differences between theold MAT versions and the new ones. Such dif-ferences reside mainly in the use of heavierantigenic suspensions and the interpretation ofresults at higher thresholds in the old MATversions not devotedly coping with the OIEguidelines (OIE, 2012) of standardizing theantigen to give 50% agglutination at 1/600 to1/1000 of the OIEISS and interpreting the testas positive at 30 IU/ml. The differences ac-
tively resulted in lower sensitivity of the oldMAT, old MAT-EDTA and old MAT-ME(60.2, 75.5 and 70.9 respectively) and, hence,passively reduced the corresponding false posi-tive rates to 14.8, 18.2 and 18.5 (Table 8).Determination of accuracy was achieved byestimation of the area under each of the ROCcurves (AUCs). The AUC measures how wellthe test separates the positive from negativeswithout reference to a particular decisionthreshold (Hanley and McNeil, 1982). AUCsof 0.9-1, 0.8-0.9, 0.7-0.8 and 0.6-0.7 indicateexcellent, good, fair, and poor test respectively,while an AUC of 0.5-0.6 designates an invalidtest (Hanley and McNeil, 1982). The accuracyof all agglutination tests was in the range of 0.7to 0.8 and slightly above (fair to good test).The highest accuracy was achieved by theBAPA (0.786± 0.041) and the new MAT-EDTA 6 hr (0.788± 0.042). The fair accuracyof different MAT formats is a resultant of thefailure to achieve good balance between sensi-tivity and specificity at a single positive cutoff.This reflects the hazy nature of MAT in gen-eral resulting from poor detection of IgG1 char-acteristic of active Brucella infection(MacMillan, 1990).Defining the best positive cutoff for every ag-glutination test format (Table 8 and Figure 1),the old MAT-EDTA and MAT-ME interpretedas positive at 1/20++ or higher (≥ 40 IU/ml)achieved reasonable balance of true and falsepositive rates (75.5, 18.5, 70.9 and 18.5 respec-tively) as revealed by positive cutoffs of 43.25IU/ml for both tests. The positive cutoff of ≥40 IU/ml is the one currently applicable by thecentral national lab in Dokki (AHRI) for thesetests. The old British MAT was better inter-preted as positive at 66.5 IU/ml matching atiter of 25% agglutination at 1/40 that isslightly lower than the currently acceptablecutoff of ≥ 80 IU/ml equivalent to a titer of50% agglutination at 1/40. On the other hand,the new British MAT and MAT-EDTA inter-preted better at higher positive cutoffs (46.25to 77 IU/ml) than the cutoff of 30 IU/ml cur-rently followed in the UK. The new BritishMAT-ME behaved similarly, but at cutoff
89
Animal Health Research Journal Vol. 2 No. 4, December 2014 pp. 79-90
point slightly above 30 IU/ml. The UK is usingthis low cutoff, where oversensitivity is pre-ferred to suit the Brucella-free status that hasbeen reached (Pappas et al., 2006) and to meetthe OIE recommendations. The American stan-dard plate test (SPT, or PAT to be distin-guished from microplate agglutination test,MAT, formats in this investigation) achieved areasonable sensitivity (72.4%) way above thatof the old MAT (60.2%) and below that of theold MAT-EDTA (75.5%) at an unacceptablylow cutoff of 20 IU/ml that is inferior to thealready low current British cutoff of 30 IU/ml.To boost PAT sensitivity and/ or specificity, anEDTA modification and validation is on trackhoping to be available soon for publication.All microplate agglutination formats were triedwith and without safranin-O staining. The dyeimproved visualization and allowed clearerpositive/ negative demarcation especially forthe hard-to-read new British test versions readafter 6 hours. It is noteworthy that all MAT,MAT-EDTA and MAT-ME versions for smallruminants including 5% saline rather than nor-mal saline revealed an obvious color reductionof safranin O (Photo 1). This can be attributedto the fact that the simple salt NaCl is highlyionized in solution. As the ionic strength of thesolution rises, aggregation of the charged sa-franin O increases and hence the dye absorb-ance decreases. This issue was minimized byfresh preparation of the antigen working dilu-tion in stained saline on the day of testing.
ConclusionUnder conditions of this investigation, it isconcluded that all MAT formats were indeci-sive by nature. As fairly accurate tests, theyshould be sequestered in the category of sup-plemental tests with the only advantage of be-ing quantitative. Accordingly, their results arenot recommended to interpret unaided by otherserologic test results. Considering test accuracy(AUC), the best cutoff, reaction kinetics andthe OIE guidelines altogether, it is high time toswitch from all the old British MAT formatslocally adopted to the current British MAT-EDTA 6 hr stained with safranin O for its
boosted performance provided that it is inter-preted at a positive threshold of 60 IU/ml(1/40++) rather than 30 IU/ml to avoid oversen-sitivity unfitting the native epizootologic andeconomic conditions. The American standard12- minute PAT is a very fast alternative to the6-hour MAT, but needs specificity boost. Todo that, an EDTA modification and validationof the standard PAT is currently in progress tobe published elsewhere.
ReferencesAbdel-Hamid, N.H.; Ebeid, M.H.; Arnaout,
F.K.; Elgarhy, M.M.; Elbauomy, E.M.; Ah-med, Hanaa A. and Sayour, A.E. (2012).Serological and bacteriological monitoring ofruminant brucellosis in seven governorateswith control program follow-up in three cat-tle farms. Benha Veterinary Medical Journal,23 (2): 254-263.
Alton, G.G.; Jones, L.M. and Pietz, D.E.(1975). Laboratory techniques in brucellosis.2nd Edition. WHO Monograph Series No.55, WHO, Geneva, Switzerland.
Alton, G.G.; Jones, L.M.; Angus, R.D. andVerger, J.M. (1988). Techniques for thebrucellosis laboratory. Institut National de laRecherche Agronomique, Paris, France.
Baum, M.; Zamir, O.; Bergman-Rios, R.;Katz, E.; Beider, Z.; Cohen, A. and Banai,M. (1995). Safranin O-stained antigen micro-agglutination test for detection of brucellaantibodies. J Clin Microbiol 13 (2): 398–400.
Brinley Morgan, W.J.; MacKinnon, D.J.;GilL, K.P.W.; Gower, S.G.M. and Norris,P.I.W. (1981). Brucellosis diagnosis - Stan-dard laboratory techniques (2nd Edition).Ministry of Agriculture, Fisheries and Food,London, UK.
Delves, P.J.; Martin, S.J.; Burton, D.R. andRoitt, I.M. (2011). Roitt's Essential Immu-nology (12th Edition). Wiley-Blackwell.
Fawcett, T. (2006). "An introduction to ROCanalysis". Pattern Recognition Letters, 27(8), 861–874.
Hanley, J.A. and McNeil, Barbara J. (1982)."The meaning and use of the area under areceiver operating characteristic (ROC)
90
Animal Health Research Journal Vol. 2 No. 4, December 2014 Elbauomy et al.
curve". Radiology, 143 (1), 29–36.Hennager, S.G. (2004). Reagent Production
Protocol - Guinea Pig Complement Prepara-tion for the Complement Fixation Test.USDA, APHIS, National Veterinary ServicesLaboratories (NVSL), Ames, IA, USA.
Hennager, S.G. (current version). SOP -Complement Fixation Test for Detection ofAntibodies to Brucella abortus and Brucellasuis. USDA, APHIS, National VeterinaryServices Laboratories (NVSL), Ames, IA,USA.
Landis, J.R. and Koch, G.G. (1977). Themeasurement of observer agreement for cate-gorical data. Biometrics, 33 (1): 159-174.
MacMillan, A. (1990). Conventional serologi-cal tests. In: Animal Brucellosis (K. Nielsen& J.R. Duncan, eds.), CRC Press, BocaRaton, Florida, USA, 153-197.
Madkour, M.M. (2001). Madkour’s Brucello-sis, 2nd ed. Springer, Berlin, ISBN 3-540-67272-9.
McGiven, J.; Taylor, A.; Duncombe, L.;Sayers, R.; Albert, D.; Banai, M.; Blasco,J.M.; Elena, S.; Fretin, D.; Garin-Bastuji,B.; Melzer, F.; Muñoz, P.M.; Nielsen, K.;Nicola, A.; Scacchia, M.; Tittarelli, M.;Dias, I.T.; Walravens, K. and Stack, J.(2011). The first international standard anti-Brucella melitensis serum. Rev. sci. tech.Off. int. Epiz., 30 (3), 809-819.
Nielsen, K. (2002). Diagnosis of brucellosis byserology. Veterinary Micobiology, 90: 447-459.
Nielsen, K.; Heck, F.C.; Wagner, G.G.;Stiller, J.; Rosenbaum, B.; Pugh, R. andFlores, E. (1984). Comparative assessmentof antibody isotypes to Brucella abortus byprimary and secondary binding assays. Prev.Vet. Med., 2: 197-204.
OIE Terrestrial Manual (2012). Manual ofDiagnostic Tests and Vaccines for TerrestrialAnimals 2012, Chapter 2.4.3. BovineBrucellosis (2009). OIE, Paris, France.http://www.oie.int/fileadmin/Home/eng/H e a l t h _ s t a n d a r d s / t a h m / 2 0 0 8 /pdf/2.04.03_BOVINE_BRUCELL.pdf(accessed August 19, 2014)
Pappas, G.; Papadimitriou, P.; Akritidis,N.; Christou, L. and Tsianos, E.V. (2006).The new global map of human brucellosis.Lancet Infect. Dis., 6, 91-99.
Poppy Lowe, Personal communication,January 14, (2011). Anonymous (currentversion): SOP - Brucella abortus/ melitensis- Antibody detection by Serum AgglutinationTest. Animal Health and Veterinary Labora-tories Agency (AHVLA), New Haw, Addle-stone, Surrey, UK.
Sayour, A.E.; Elbauomy, E.M.; Abdel-Hamid,N.H. and Abdel-Haleem, M.H. (2013). Se-lection of a unified standard complementfixation method for nation-wide applicationto restore inter-laboratory harmony to thediagnosis of ruminant brucellosis. The Mid-dle East and North African Journal of Ani-mal Science, 6: in press.