UvA-DARE (Digital Academic Repository) - Universiteit van ...
185
UvA-DARE is a service provided by the library of the University of Amsterdam (https://dare.uva.nl) UvA-DARE (Digital Academic Repository) Mass loss and dust formation around oxygen-rich evolved stars Kemper, F. Publication date 2002 Document Version Final published version Link to publication Citation for published version (APA): Kemper, F. (2002). Mass loss and dust formation around oxygen-rich evolved stars. General rights It is not permitted to download or to forward/distribute the text or part of it without the consent of the author(s) and/or copyright holder(s), other than for strictly personal, individual use, unless the work is under an open content license (like Creative Commons). Disclaimer/Complaints regulations If you believe that digital publication of certain material infringes any of your rights or (privacy) interests, please let the Library know, stating your reasons. In case of a legitimate complaint, the Library will make the material inaccessible and/or remove it from the website. Please Ask the Library: https://uba.uva.nl/en/contact, or a letter to: Library of the University of Amsterdam, Secretariat, Singel 425, 1012 WP Amsterdam, The Netherlands. You will be contacted as soon as possible. Download date:07 Feb 2022
-
Upload
khangminh22 -
Category
Documents
-
view
0 -
download
0
Transcript of UvA-DARE (Digital Academic Repository) - Universiteit van ...
UvA-DARE is a service provided by the library of the University of Amsterdam (https://dare.uva.nl)
UvA-DARE (Digital Academic Repository)
Mass loss and dust formation around oxygen-rich evolved stars
Kemper, F.
Publication date2002Document VersionFinal published version
Link to publication
Citation for published version (APA):Kemper, F. (2002). Mass loss and dust formation around oxygen-rich evolved stars.
General rightsIt is not permitted to download or to forward/distribute the text or part of it without the consent of the author(s)and/or copyright holder(s), other than for strictly personal, individual use, unless the work is under an opencontent license (like Creative Commons).
Disclaimer/Complaints regulationsIf you believe that digital publication of certain material infringes any of your rights or (privacy) interests, pleaselet the Library know, stating your reasons. In case of a legitimate complaint, the Library will make the materialinaccessible and/or remove it from the website. Please Ask the Library: https://uba.uva.nl/en/contact, or a letterto: Library of the University of Amsterdam, Secretariat, Singel 425, 1012 WP Amsterdam, The Netherlands. Youwill be contacted as soon as possible.
Download date:07 Feb 2022
Mass loss and dust formation around oxygen-rich
evolved stars


Mass loss and dust formation around oxygen-rich
evolved stars
Massaverlies en stofvorming rond zuurstofrijke geevolueerde sterren
Academisch Proefschrift
ter verkrijging van de graad van doctoraan de Universiteit van Amsterdam,
op gezag van de Rector Magnificus prof.mr. P.F. van der Heijden,ten overstaan van een door het college voor promoties ingestelde commissie,
in het openbaar te verdedigen in de Aula der Universiteit
op
woensdag 4 september 2002, te 12:00 uur
door
Francisca Kemper
geboren te Velsen

Promotiecommissie
Promotores prof.dr. L.B.F.M. Watersprof.dr. A.G.G.M. Tielens
Co-promotor dr. A. de KoterOverige leden prof.dr. M.J. Barlow
prof.dr. H.J. Habingprof.dr. D. Frenkelprof.dr. T. de Jongprof.dr. M. van der Klisprof.dr. V. Ickedr. C. Dominik
Sterrenkundig Instituut “Anton Pannekoek”Faculteit der NatuurwetenschappenUniversiteit van Amsterdam
ISBN 90-5776088-6
Omslagillustratie: Mandala – Nel Kemper. De mandala is een tibetaans symbool voorhet universum en de eeuwigheid, en de plaats van de mens daarin. Tibetaanse mon-niken maken de mandala’s van gekleurd zand, die ze vervolgens door de wind latenverwaaien als metafoor voor de vergankelijkheid van het bestaan.

Contents
1 An introduction to astromineralogy 1
1.1 Why study dust? . . . . . . . . . . . . . . . . . . . . . . . . . . . . . . 1
1.2 The life cycle of dust in the galaxy . . . . . . . . . . . . . . . . . . . . 2
1.2.1 Dust formation . . . . . . . . . . . . . . . . . . . . . . . . . . . 2
1.2.2 Dust in the ISM . . . . . . . . . . . . . . . . . . . . . . . . . . 3
1.2.3 Dust around young stars . . . . . . . . . . . . . . . . . . . . . . 4
1.3 Formation of dust around evolved stars . . . . . . . . . . . . . . . . . 4
1.3.1 Dying stars . . . . . . . . . . . . . . . . . . . . . . . . . . . . . 4
1.3.2 Mass loss and outflow properties . . . . . . . . . . . . . . . . . 6
1.3.3 Theoretical condensation sequences . . . . . . . . . . . . . . . . 8
1.3.4 Dust condensation and processing experiments . . . . . . . . . 9
1.4 Determining the dust composition . . . . . . . . . . . . . . . . . . . . 10
1.4.1 Amorphous and crystalline silicates . . . . . . . . . . . . . . . . 10
1.4.2 Mineralogy of evolved stars . . . . . . . . . . . . . . . . . . . . 11
1.5 Towards an understanding of dust formation around evolved stars . . 23
2 2.4 – 197 µm spectroscopy of OH/IR stars:The IR characteristics of circumstellar dust in O-rich environments 25
2.1 Introduction . . . . . . . . . . . . . . . . . . . . . . . . . . . . . . . . . 26
2.2 Observations . . . . . . . . . . . . . . . . . . . . . . . . . . . . . . . . 26
2.2.1 SWS . . . . . . . . . . . . . . . . . . . . . . . . . . . . . . . . . 27
2.2.2 LWS . . . . . . . . . . . . . . . . . . . . . . . . . . . . . . . . . 28
2.2.3 Joining the SWS and LWS spectra . . . . . . . . . . . . . . . . 29
2.3 Results . . . . . . . . . . . . . . . . . . . . . . . . . . . . . . . . . . . . 29
2.3.1 Determination of the continuum . . . . . . . . . . . . . . . . . 31
2.3.2 Description of the spectrum . . . . . . . . . . . . . . . . . . . . 32
2.3.3 Water Ice . . . . . . . . . . . . . . . . . . . . . . . . . . . . . . 36
2.3.4 Silicates . . . . . . . . . . . . . . . . . . . . . . . . . . . . . . . 42
2.4 Conclusions . . . . . . . . . . . . . . . . . . . . . . . . . . . . . . . . . 47
i

CONTENTS
3 Crystallinity versus mass-loss rate in Asymptotic Giant Branchstars 493.1 Introduction . . . . . . . . . . . . . . . . . . . . . . . . . . . . . . . . . 493.2 Modelling the circumstellar dust shell . . . . . . . . . . . . . . . . . . 51
3.2.1 Dust optical constants . . . . . . . . . . . . . . . . . . . . . . . 523.3 Model results . . . . . . . . . . . . . . . . . . . . . . . . . . . . . . . . 53
3.3.1 Varying the mass-loss rate . . . . . . . . . . . . . . . . . . . . . 533.3.2 Varying the degree of crystallinity . . . . . . . . . . . . . . . . 573.3.3 A trend in crystallinity? . . . . . . . . . . . . . . . . . . . . . . 58
3.4 Physical explanation and discussion . . . . . . . . . . . . . . . . . . . 623.4.1 How to search for crystalline silicates in Miras . . . . . . . . . 633.4.2 Implications for the dust formation and processing in the ISM 65
3.5 Summary . . . . . . . . . . . . . . . . . . . . . . . . . . . . . . . . . . 66
4 Dust and the spectral energy distribution of the OH/IR star OH127.8+0.0: Evidence for circumstellar metallic iron 694.1 Introduction . . . . . . . . . . . . . . . . . . . . . . . . . . . . . . . . . 694.2 Modelling the circumstellar environment . . . . . . . . . . . . . . . . . 71
4.2.1 Model assumptions and default grid . . . . . . . . . . . . . . . 714.2.2 Problems in fitting the SED of AGB stars . . . . . . . . . . . . 73
4.3 Improvements to the spectral fit . . . . . . . . . . . . . . . . . . . . . 734.3.1 Metallic iron as a source of NIR opacity . . . . . . . . . . . . . 734.3.2 Non-spherical grains . . . . . . . . . . . . . . . . . . . . . . . . 764.3.3 Water ice features in the far-infrared . . . . . . . . . . . . . . . 76
4.4 Results for OH 127.8+0.0 . . . . . . . . . . . . . . . . . . . . . . . . . 774.4.1 Stellar parameters and radiative transfer modelling . . . . . . . 774.4.2 Comparison with astronomical silicate . . . . . . . . . . . . . . 79
4.5 A consistency check . . . . . . . . . . . . . . . . . . . . . . . . . . . . 814.6 Discussion . . . . . . . . . . . . . . . . . . . . . . . . . . . . . . . . . . 83
5 Detection of carbonates in dust shells around evolved stars 85
6 The mineral composition and spatial distribution of the dust ejectaof NGC 6302 916.1 Introduction . . . . . . . . . . . . . . . . . . . . . . . . . . . . . . . . . 916.2 The TIMMI2 observations . . . . . . . . . . . . . . . . . . . . . . . . . 93
6.2.1 N- and Q-band imaging . . . . . . . . . . . . . . . . . . . . . . 936.2.2 N-band spectroscopy . . . . . . . . . . . . . . . . . . . . . . . . 95
6.3 Analysis of the ISO spectrum . . . . . . . . . . . . . . . . . . . . . . . 966.3.1 The identification of carbonates . . . . . . . . . . . . . . . . . . 986.3.2 Dust model fit . . . . . . . . . . . . . . . . . . . . . . . . . . . 100
6.4 Discussion . . . . . . . . . . . . . . . . . . . . . . . . . . . . . . . . . . 1056.4.1 Geometry and composition of the circumstellar dust shell . . . 1056.4.2 The astronomical relevance of carbonates . . . . . . . . . . . . 110
ii

CONTENTS
6.5 Summary . . . . . . . . . . . . . . . . . . . . . . . . . . . . . . . . . . 112
7 Mass loss and rotational CO emission from Asymptotic GiantBranch stars 1137.1 Introduction . . . . . . . . . . . . . . . . . . . . . . . . . . . . . . . . . 1137.2 Observations and data reduction . . . . . . . . . . . . . . . . . . . . . 115
7.2.1 Instrumental set-up . . . . . . . . . . . . . . . . . . . . . . . . 1157.2.2 The MPIfR/SRON 800 GHz receiver . . . . . . . . . . . . . . . 1167.2.3 Observations and data reduction . . . . . . . . . . . . . . . . . 116
7.3 Physical conditions in the outflow: a model . . . . . . . . . . . . . . . 1187.3.1 Description of the model . . . . . . . . . . . . . . . . . . . . . . 1187.3.2 Free parameters . . . . . . . . . . . . . . . . . . . . . . . . . . 119
7.4 Analysis of the results . . . . . . . . . . . . . . . . . . . . . . . . . . . 1217.4.1 A constant mass-loss rate? . . . . . . . . . . . . . . . . . . . . 1247.4.2 Exploring parameter space . . . . . . . . . . . . . . . . . . . . 1257.4.3 A representative case: WX Psc . . . . . . . . . . . . . . . . . . 1297.4.4 Possible explanations for the inconsistency . . . . . . . . . . . . 132
7.5 Concluding remarks . . . . . . . . . . . . . . . . . . . . . . . . . . . . 1367.5.1 CO rotational transitions as mass-loss indicators . . . . . . . . 1367.5.2 Future work . . . . . . . . . . . . . . . . . . . . . . . . . . . . . 137
8 Future prospects 1398.1 The life cycle of silicates . . . . . . . . . . . . . . . . . . . . . . . . . . 1398.2 The life cycle of carbonates . . . . . . . . . . . . . . . . . . . . . . . . 1408.3 The outflow properties of evolved stars . . . . . . . . . . . . . . . . . . 141
A JCMT observations 143
Nederlandse samenvatting 153
Nawoord 159
Bibliography 161
iii

CONTENTS
iv
Chapter 1
An introduction toastromineralogy
1.1 Why study dust?
The first hints that the vast distances between the stars were not empty came atthe beginning of the previous century, when stationary Ca ii absorption lines weredetected in the spectroscopic binary δ Ori (Hartmann 1904). It became apparentthat especially the dust present in interstellar space was obscuring the view towardsastronomical objects and that this dilution caused overestimates of the distances(Trumpler 1930). The interstellar absorption due to dust was thus considered anuisance. Consequently, studying the Interstellar Extinction Curve became important,just with the purpose to determine the extinction at visual and ultraviolet wavelengthsto correct for it when observing distant objects. Gradually, studying the propertiesof dust gained a right of existence on its own. Besides accounting for interstellarextinction, there appeared various other reasons to study dust in astrophysics. First,about 30% of the total luminosity of the galaxy is thermal emission in the infrared,provided by dust grains which make up only about 1% of the total mass of theinterstellar medium. Second, dust grains provide a surface on which molecules areformed. Especially the formation of H2 proceeds very efficiently on the surface ofgrains, when compared to gas phase reactions. Yet another reason to study dust isthat it is important for the thermal balance in astrophysical processes, such as starformation. On the one hand, heating is provided by photoelectric processes on dustgrains, and on the other hand, as said before, dust is an important catalytic agent forthe formation of molecules, which in turn dominate the gas cooling. In star formation,dust grains are not only important for the heat balance of the protostellar nebula, butthey are also the building blocks of planets, as they coagulate in the circumstellar diskpresent around young stars. Finally, dust dominates the opacity and hence the spectralappearance of dust-enshrouded objects, including evolved and young stars. Studyingthe composition of dust in various astrophysical environments provides informationon the physical conditions in these environments. The work presented here can beplaced in this last category of dust studies.
The dust in the diffuse interstellar medium can be studied by means of the Inter-stellar Extinction Curve in the visual and ultraviolet, although determining the dust
1

Chapter 1
composition is difficult due to the lack of spectral features besides the 2200 A fea-ture (e.g. Cardelli et al. 1989; Mathis 1990). Circumstellar dust can be studiedby its extinction properties in many cases as well, as the intrinsic spectrum of thestar is often well known. This is, however, not the case for AGB stars. Dust grainspresent in the vicinity of a star are heated by stellar radiation to temperatures in therange of 20 – 1800 K, depending on the exact circumstellar environment. The heateddust thermally radiates in the infrared, which is seen as an infrared excess on thestellar spectral energy distribution (SED). This infrared emission can also be usedto determine the composition of the dust around AGB stars, as will be explained inSect. 1.4.
In the following sections I will describe the life cycle of dust. The emphasis willbe on the formation and properties of dust and gas in the circumstellar environmentof evolved stars. For more general issues on astrophysical dust not addressed in thesesections, the reader is referred to reviews such as the work by Evans (1994) andBoulanger et al. (2000).
1.2 The life cycle of dust in the galaxy
1.2.1 Dust formation
Solid state material, although ubiquitous in the interstellar medium, is not likely tohave formed in this environment, as the density of gas in the space between the starsis simply too low. Dust is formed in more dense environments, predominantly in theoutflows of stars: in supernovae, in the winds of massive stars and of Asymptotic GiantBranch (AGB) stars, but also in dense molecular clouds. The main contribution, abouttwo thirds of the dust in the interstellar medium (ISM), is thought to originate fromAGB stars (e.g. Gehrz 1989; Boulanger et al. 2000, and references therein). Thisthesis work concerns the study of dust in the outflows of AGB stars, and thereforeI will start the discussion of the life cycle of dust with the production of solid statematerial in the circumstellar environment of these stars.
The AGB represents a late phase in the evolution of stars with initial masses1 . M . 8M� (see e.g. Iben Jr. and Renzini 1983). They are cool stars, witheffective temperatures of about Teff ≈ 2000 – 2500 K, exhibiting pulsations in theirphotospheres causing luminosity and stellar radius variations on time scales of a fewhundred days. The photosphere of AGB stars is very extended and tenuous and there-fore has a low gravitational potential. Through the pulsations, gas easily escapes fromthe stellar surface and starts to cool while it is slowly pushed away by new gas ejecta.In the regions close to the star and also in the coolest regions of the photospheremolecules are present. At lower temperatures (. 1500 K) dust formation occurs, bycondensation from the molecular gas. It was first reported by Woolf and Ney (1969)that solid particles must be present in the circumstellar environments of these coolstars, based on observations of emission bands between 10 and 14 µm. At the timeof this discovery, Gilman (1969) was the first to predict the composition of the dust
2

An introduction to astromineralogy
based on theoretical calculations of the condensation of dust grains. The presenceof dust leads to an acceleration of the stellar wind, which can be explained by thehigh opacity of the dust around the peak wavelengths of the stellar SED. Radiationpressure accelerates the dust grains, which then through dust-gas-coupling drag alongthe gaseous component (Gehrz and Woolf 1971; Gilman 1972). The thus createdstellar wind can reach velocities of ∼ 20 km s−1 in the outflow of AGB stars, and up to100 km s−1 around red supergiants, and leads to widely varying mass-loss rates, from10−7 – 10−4 M� yr−1 (van der Veen and Habing 1988). A good introduction tothe basic principles of dust-driven mass loss from cool stars is given by Jura (1986).
The composition of the material in the stellar wind depends on the stellar composi-tion. The composition of the gas initially reflects the interstellar composition, in whichthe C/O ratio is smaller than unity. AGB stars have already undergone a so-called firstdredge-up of material from the core, resulting in an enrichment of the photospherewith products of the CNO-cycle. This leads to an increase of the C/O ratio, althoughit will not exceed unity. The available carbon will be locked up in CO molecules, thusthe remaining oxygen is available to drive an oxygen-rich chemistry. This ultimatelyleads to the formation of oxygen-rich minerals, such as silicates. Only in more evolvedstars, the C/O ratio might be around or even slightly larger than unity, thus drivinga carbon-rich chemistry. In circumstellar outflows, some of the silicates can be grownat temperatures above the glass temperature. As the newly attached molecules arestill mobile at these temperatures, the energetically most favourable condition can beachieved. Due to these formation temperatures, some of the silicates can thus con-dense in crystalline form in the outflow of evolved stars, but still a large fraction ofthe silicates are formed at temperatures below the glass temperature and thus havean amorphous structure (see Sect. 1.4.1 for a more detailed discussion).
1.2.2 Dust in the ISM
The dust newly formed around AGB stars will eventually be ejected into the ISM,where it resides for ∼ 2.5 · 109 yr (e.g. Jones et al. 1994). In this time, the grainsare subject to various processes, including cosmic ray hits, interstellar shocks andthe consequent heating and grain-grain collisions, sputtering and evaporation (e.g.de Jong and Kamijo 1973; Biermann and Harwit 1980; Tielens et al. 1987,1994). These processes may partially or completely destroy the grains or alter thephysical structure of the grain material. The latter may occur when a cosmic rayenters the grain transferring part of its energy to the mineral lattice. This may causedisplacements, leading to local amorphous structures along the path of the cosmic ray.Grains, arriving at Earth, that have survived their residence in the interstellar mediumwith relatively little damage can be recognized from their isotopic ratios, as thesedeviate from the average solar composition. Studies of interplanetary dust particles(IDPs) collected in the upper atmosphere of the Earth indeed indicate that some areof interstellar origin. These show tracks caused by cosmic ray hits (Bradley 1994).Presolar grains with cosmic ray tracks are also identified as inclusions in meteorites(Anders and Zinner 1993, and references herein).
3

Chapter 1
Most processes however, are very violent and cause total destruction of the inter-stellar grains. Estimating the effect of the various destruction mechanisms, it is possi-ble to derive the average life time of a grain in the ISM to be around 4 − 6 · 108 years(Boulanger et al. 2000, and references herein), which is about one fifth of the av-erage residence time of the elements in the interstellar medium. The high depletionsof elements like O, C, N, Mg, Si, Fe and S into dust grains (Sofia et al. 1994) leavesno other conclusion than the that recondensation of grains in dense molecular cloudshas to occur, upon which the dust may be recycled into the diffuse ISM again. Theconditions are of course different from those in circumstellar outflows, leading to adifferent dust composition. Due to the low temperatures in molecular clouds, silicatesfor instance will condense in the amorphous form. The molecules freeze out on thesurface immediately, without being able to find an energetically favourable positionin the lattice. Good theoretical descriptions on the nucleation of dust in general as-trophysical environments are given by Draine and Salpeter (1977) and Draine(1979).
1.2.3 Dust around young stars
Eventually, dust grains will end their ramble in the fragmenting protostellar regionsin dense molecular clouds. In these contracting regions the coagulation rate starts toexceed the destruction rate, and the first grain growth occurs (e.g. Rossi et al. 1991;Dominik and Tielens 1997; Suttner et al. 1999). The dust plays an importantrole in the thermal balance of the contracting protostellar cloud, as it provides cooling.Meanwhile, the dust grains grow and end their lifes in various parent bodies, such ascomets or planetesimals, depending on their distance to the young star. The formationof planetesimals in the Solar System is a well studied subject, although still not com-pletely understood (e.g. Wetherill and Stewart 1989; Weidenschilling andCuzzi 1993). Comets are believed to contain mainly unprocessed material, i.e. grainsof interstellar composition, whereas the material in planetesimals and planets is heav-ily processed, mainly by heating through radioactivity in the core of these bodies.Recent studies of comet Hale-Bopp, however, showed that also comets can containhighly processed dust (Crovisier et al. 1997; Wooden et al. 1999, 2000; Bouw-man 2001).
1.3 Formation of dust around evolved stars
1.3.1 Dying stars
Intermediate mass stars (1 . M . 8M�) end their life on the Asymptotic GiantBranch (see Iben Jr. and Renzini 1983; Habing 1996, for reviews). These AGBstars are cool stars (Teff ≈ 2000 – 2500 K, spectral type M) with tenuous extendedatmospheres. In this phase, the star has exhausted both hydrogen and helium burningin the core, and gains its energy from hydrogen- and helium-shell burning. The star
4
An introduction to astromineralogy
H
Dust
Molecules
C/O
He
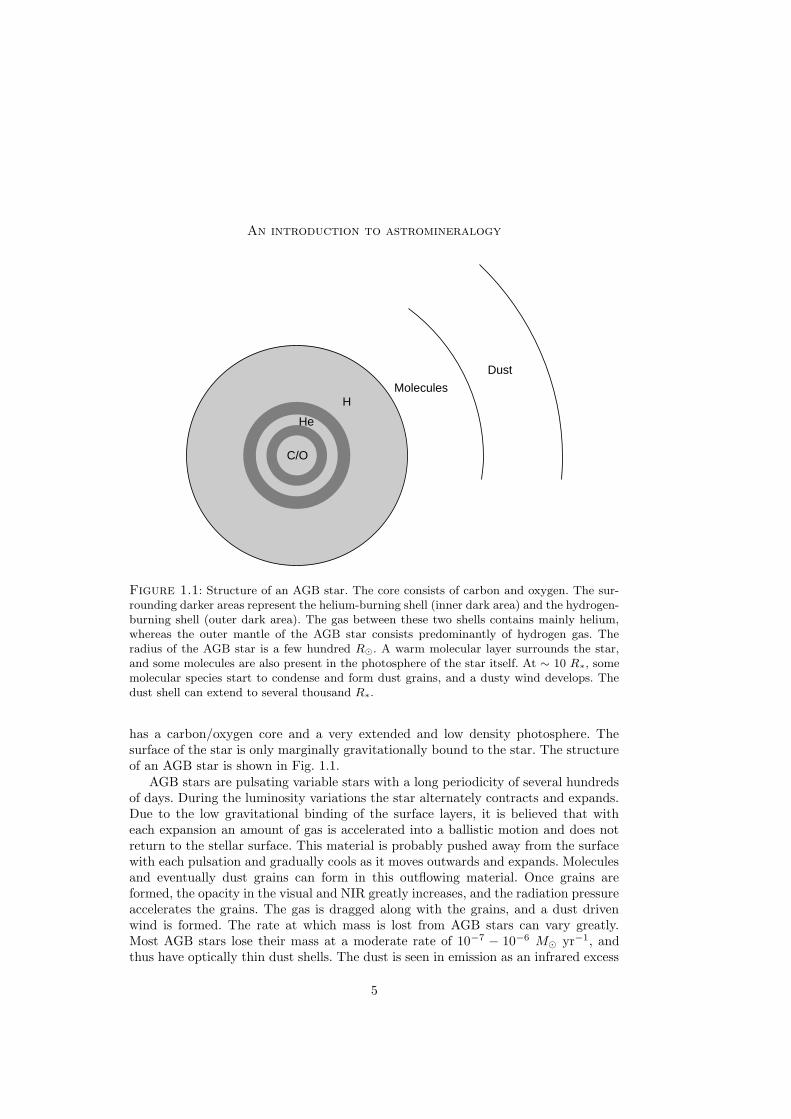
Figure 1.1: Structure of an AGB star. The core consists of carbon and oxygen. The sur-rounding darker areas represent the helium-burning shell (inner dark area) and the hydrogen-burning shell (outer dark area). The gas between these two shells contains mainly helium,whereas the outer mantle of the AGB star consists predominantly of hydrogen gas. Theradius of the AGB star is a few hundred R�. A warm molecular layer surrounds the star,and some molecules are also present in the photosphere of the star itself. At ∼ 10 R∗, somemolecular species start to condense and form dust grains, and a dusty wind develops. Thedust shell can extend to several thousand R∗.
has a carbon/oxygen core and a very extended and low density photosphere. Thesurface of the star is only marginally gravitationally bound to the star. The structureof an AGB star is shown in Fig. 1.1.
AGB stars are pulsating variable stars with a long periodicity of several hundredsof days. During the luminosity variations the star alternately contracts and expands.Due to the low gravitational binding of the surface layers, it is believed that witheach expansion an amount of gas is accelerated into a ballistic motion and does notreturn to the stellar surface. This material is probably pushed away from the surfacewith each pulsation and gradually cools as it moves outwards and expands. Moleculesand eventually dust grains can form in this outflowing material. Once grains areformed, the opacity in the visual and NIR greatly increases, and the radiation pressureaccelerates the grains. The gas is dragged along with the grains, and a dust drivenwind is formed. The rate at which mass is lost from AGB stars can vary greatly.Most AGB stars lose their mass at a moderate rate of 10−7 − 10−6 M� yr−1, andthus have optically thin dust shells. The dust is seen in emission as an infrared excess
5
Chapter 1
superposed on the stellar SED. These stars are referred to as Miras, named after thearchetypal Mira (o Cet). Some AGB stars, however, experience much higher mass-lossrates of 10−5 − 10−4 M� yr−1, in which so much dust is contained that the star iscompletely obscured in the visual and NIR. All stellar radiation is absorbed by thedust and re-radiated as thermal emission from dust in the cool outer layers of thecircumstellar shell. The peak of the SED thus moves to mid-infrared wavelengths.These stars are known as OH/IR stars, because they show strong OH maser emissionin addition to the infrared radiation.
It is generally believed that Miras eventually evolve into OH/IR stars (van derVeen and Habing 1988), with the onset of a superwind phase (Renzini 1981).Through this mass-loss process, AGB stars shake off their entire mantle, and the nakedcarbon/oxygen core remains behind. Once the mass-loss has stopped, the dust shellstill moves outward, and the optical depth towards the core decreases. Eventually, thehot carbon/oxygen core is no longer obscured and becomes visible as a white dwarf.Energetic radiation from the white dwarf ionizes the remainders of the circumstellarshell and thus a planetary nebula is born.
1.3.2 Mass loss and outflow properties
In order to understand the dust formation process, the physical conditions in the out-flow, in particular the density, temperature and outflow velocity should be understood.This is important because the formation speed of minerals is dependent on densityand temperature of the gas. The temperature profile of the gas is mainly determinedby the temperature of the central star and can be calculated from the thermal balance(e.g. Justtanont et al. 1994; Zubko and Elitzur 2000). The density of the gasfrom which the dust grains condense correlates with the mass-loss rate. There are anumber of different observational methods to determine the mass-loss rate, which willbe discussed here.
• A commonly used method to determine the mass-loss rate is based on infrared(IR) observations. Using the thermal emission from dust grains, it is possible toderive the optical depth through the circumstellar dust shell. For this purposethe wavelength dependent mass absorption coefficients κν (cm2 g−1) of the dustshould be known. Applying dust radiative transfer models, the dust mass andmass-loss rate can be determined (e.g. Bedijn 1987; Schutte and Tielens 1989;Justtanont and Tielens 1992; Le Sidaner and Le Bertre 1993; Wolfireand Churchwell 1994, see also Chapter 4). Estimating the dust-to-gas ratio –usually assumed to be around 1/100 (Boulanger et al. 2000) – the gas mass-loss rate and density can be easily inferred. One has to bear in mind that themass absorption coefficients are affected by grain shape and size effects, which inturn affects the dust mass determinations. This is for instance shown in Chapter 4where much less metallic iron is needed to fit the SED, if it is assumed to be insmall, non-spherical grains.
• In addition to the IR observations, the mass-loss rate and thus the gas density can
6

An introduction to astromineralogy
also be derived from molecular line profiles. For this purpose the carbon monox-ide molecule is most often used, for a variety of reasons. First, because it is themost abundant molecule after molecular hydrogen. Second, it is very stable, andtherefore present throughout the entire circumstellar outflow of cool stars. It dis-sociates only when it is irradiated with ultraviolet radiation, and this only plays arole in the photon-dominated regions irradiated by the interstellar radiation field,at the outer radius of the circumstellar envelope (Tielens and Hollenbach1985; Mamon et al. 1988). Finally, CO has a number of rotational transitionswhich are conveniently located in atmospheric windows. These transitions tracegas with temperatures ranging from ∼ 6 – 150 K. The populations of the rotationallevels depend strongly on the local temperature and density, whereas the outflowvelocity field causes a characteristic line profile. From the profiles and intensitiesthe mass-loss rate and temperature stratification of AGB star envelopes can bederived (e.g. Morris 1980; Knapp et al. 1982; Loup et al. 1993; Justtanontet al. 1994; Groenewegen 1994b).
• Maser emission, most notably arising from OH and H2O molecules can also beused to determine the mass-loss rate. The water molecules are found in the warmlayers, relatively close to the stars (T > 500 K), whereas the OH-molecules arelocated further out. Dissociation of H2O caused by UV radiation from the inter-stellar radiation field leads to the formation of the OH-molecules. In the remoteouter regions of the wind, the hydroxyl molecule loses its second H-atom by asecond dissociation step, thus confining the region where the OH maser emissionoriginates. Independent research groups have found that the luminosity of the pe-riodic OH maser emission depends on the mass-loss rate of the central star (Baudand Habing 1983; Bowers and Hagen 1984).
In most cases, mass-loss rates determined from the dust or gas assume a stationaryflow over the recent history of the AGB star. However, even before the discovery ofthe dense dust shells around OH/IR stars, it became clear that a superwind epochwas required, as a final mass-loss phase. This could explain the amount of mass seenin planetary nebulae, assuming they originate from Miras (Renzini 1981). Indeed,the high mass-loss rate currently observed in OH/IR stars, leading to a high dustopacity which completely obscured the central star in the visual, seemed to correspondto this superwind phase (van der Veen and Habing 1988). The effect of thissudden increase in mass-loss rate was also incorporated in some of the CO mass-lossdeterminations (Justtanont et al. 1996b; Delfosse et al. 1997).
In the mass-loss determinations based on the infrared emission, the SED is dom-inated by the warm dust located close to the star. Thus the sudden jump in densitycaused by the superwind can be ignored, as it is probably already outside this region.Moreover, the relics of the previous low mass-loss rate phase, located in the outerparts of the circumstellar environment, are cold and optically thin in the infrared,and do therefore not contribute significantly to the IR part of the SED.
As explained above, OH and H2O maser emission originates from relatively narrowregions, and is therefore not the best diagnostic for tracing a sudden increase in mass-
7
Chapter 1
loss. Still, the fact they probe only a narrow region can be an advantage for derivingthe mass-loss rate in this region, as it likely yields a well-defined instantaneous result.
Large differences in the determinations of the mass-loss rate can occur, as someof the inner regions (the dust shell) already have experienced the onset of the su-perwind, whereas mass-loss tracers located further out (CO) have not. Recently, itwas discovered that the mass-loss history is even more complicated. Observations ofpost-AGB stars have revealed the presence of circumstellar arcs, which seem to cor-respond to mass-loss modulations of an order of magnitude during the AGB phase(Kwok et al. 1998; Sahai et al. 1998; Mauron and Huggins 1999). Similarmass-loss modulations are predicted independently by hydrodynamical calculationsof the outflow of AGB stars (Simis et al. 2001). These complex density profiles makethe determination of the mass-loss rate a rather precarious exercise, as will be shownin Chapter 7 of this thesis.
1.3.3 Theoretical condensation sequences
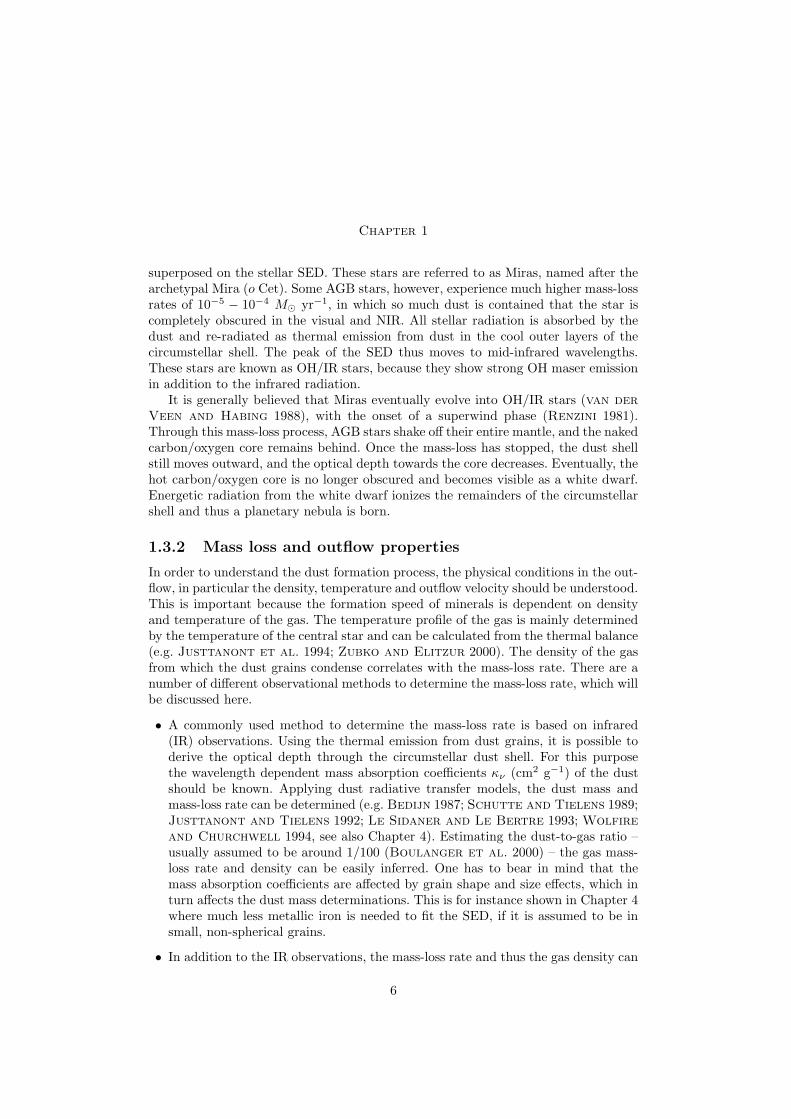
With the composition of the gas as a starting point, the dust condensation sequence asa function of physical conditions, i.e. for an outflowing gas, can be predicted. Thesepredictions usually assume thermodynamic equilibrium, although it is highly ques-tionable whether this assumption is valid in AGB outflows. Nevertheless, in the past30 years, many condensation calculations have been performed to explain the ob-served dust components and to predict the presence of not yet identified dust species.Gilman (1969) reports that refractory silicates, such as Mg2SiO4 and Al2SiO5 arevery likely to form in oxygen-rich outflows. This conclusion is based on equilibriumcalculations for a gas with a representative composition kept at a constant tempera-ture and pressure. Grossman (1972) calculated a condensation sequence in a coolinggas of solar composition, again assuming equilibrium chemistry. At 1758 K, corun-dum (Al2O3) is the first to condense, followed at lower temperatures by species likeperovskite (CaTiO3), melilite (Ca2Al2SiO7 – Ca2MgSi2O7), diopside (CaMgSi2O6),forsterite (Mg2SiO4) and enstatite (MgSiO3). This condensation sequence has beenreviewed and improved (see Fig. 1.2) by Tielens (1989), who later also compared theresults with the observations obtained with the Infrared Space Observatory (Tielenset al. 1998). In 1998, only a few of the species predicted by these condensationcalculations were indeed identified, but much progress has been made since, and inSect. 1.4.2 I will summarize the identifications to date.
Gail and Sedlmayr (1998, 1999) have derived the condensation sequence fora cooling gas with a composition representative of the outflow of AGB stars. Themain elements available were Mg, Fe and Si, which in an oxygen-rich chemistry areassumed to become depleted into dust components like olivine (Mg2xFe2(1−x)SiO4),quartz (SiO2), metallic iron and periclase (MgO).
8
An introduction to astromineralogy
Figure 1.2: The silicate thermodynamic condensation sequence for a gas of solar composi-tion (Grossman 1972; Grossman and Larimer 1974). The temperatures refer to the firstappearance of a mineral at a pressure of 10−3 (left) and 10−10 (right) atmosphere. Note thatseveral trace materials, such as perovskite, condense out at even higher temperatures. Figureadopted from Tielens et al. (1998).
1.3.4 Dust condensation and processing experiments
Condensation
Alternatively, an experimental approach can be taken to study the condensation ofdust in outflows around evolved stars. Experiments are of course not limited to equi-librium situations. The first experiments performed with the purpose to condensesolids from an astrophysically relevant vapour showed that most condensates wereamorphous and did not bear much resemblance to terrestrial silicates (Day andDonn 1978). The vapour was obtained by evaporating Mg and SiO solids, and thusthe condensates consisted of these building blocks. Silicates of stoichiometric com-position (Mg2SiO4, MgSiO3 and SiO2) were hardly formed, the bulk of the con-densates were amorphous and had widely varying non-stoichiometric compositions.Rietmeijer et al. (1999a) reported the results of condensation experiments using
9
Chapter 1
the astrophysically relevant Fe-Mg-SiO-H2-O2 vapour and observed that the conden-sates were either pure Fe-rich or pure Mg-rich silicate condensates, predominantly ofnon-stoichiometric composition. An amorphous silicate containing both Fe and Mg(comparable to the average composition of interplanetary dust particles) was notfound in the condensed solids. Additional experiments involved the condensation ofaluminium-containing silicates (Rietmeijer and Karner 1999) and iron-rich sili-cates (Rietmeijer et al. 1999b), from vapours of less relevance to the outflow ofAGB stars.
Crystallization
In addition, various research groups have studied the thermal annealing of amorphoussilicates into crystalline silicates (e.g. Hallenbeck et al. 1998; Brucato et al.1999; Fabian et al. 2000; Thompson and Tang 2001), predominantly to derivethe annealing time scale as a function of temperature. A very steep dependence onthe temperature is observed. This implies that the temperature range in the regionwhere dust formation occurs strongly determines the final degree of crystallinity ofthe silicates in the outflow.
1.4 Determining the dust composition
Besides theoretical and experimental studies on the dust condensates that will form inthese environments, observational studies can help to constrain the dust composition.Since dust will evaporate at temperatures higher than 1000–1800 K, depending onthe chemical composition, it can be concluded that thermal emission from the dust isradiated in the infrared. In addition, many of the lattice resonances of minerals occurat energies corresponding to infrared wavelengths, and thus infrared spectroscopy,either ground-based or space-based provides an excellent opportunity to study thecomposition and distribution of the dust.
Using optical properties of minerals, the properties of the grains and the physicalconditions in the circumstellar outflow as input for radiative transfer calculations,an SED can be calculated and compared to the astronomical spectra (e.g. Chapter2 of Bouwman 2001). The temperature profile is self-consistently derived assumingradiative equilibrium. A large fraction of this study is dedicated to the determinationof the dust composition in these environments, by means of this technique.
1.4.1 Amorphous and crystalline silicates
Before the launch of Infrared Space Observatory (ISO; Kessler et al. 1996) it wasbelieved that most of the silicates in the galaxy were amorphous. Various lines-of-sight,towards evolved stars, young stars and into the ISM showed the infrared resonancesat 9.7 and 18 µm characteristic for amorphous silicates. Using the spectrometers onboard of ISO, it became clear that in addition crystalline silicates were found in the
10
An introduction to astromineralogy
circumstellar environment of evolved stars (Waters et al. 1996) and young stars(Waelkens et al. 1996), but the silicates in the ISM are essentially amorphous(Demyk et al. 1999; Vriend 1999). The degree of crystallinity in the outflow ofevolved stars is usually of the order of 5–10% (e.g. Chapter 3), but values up to 60–80%are reported for the evolved star IRAS 09425−6040 (Molster et al. 2001b).
There are two possible mechanisms to form crystalline silicates. First, when thegas temperatures are higher than the glass temperature, direct condensation of crys-talline silicates occur. The amorphous silicates can be formed somewhat later, whenthe gas has moved outwards and has cooled to temperatures below the glass temper-ature. If condensation occurs at these low temperatures, the molecules immediatelyfreeze to the surface upon collision, since they do not have enough energy to find anenergetically more favourable position in the lattice.
The second mechanism to form crystalline silicates is annealing of amorphoussilicates. In this case, all silicates are formed at temperatures below the glass tem-perature, and are therefore amorphous. If, by some mechanism the grains are heated,the added energy may allow the atoms to re-arrange in a crystalline lattice. This an-nealing process is studied in the laboratory, as mentioned before. It should, however,be applied to only part of the grains. Temperature variations due to the pulsationalproperties of AGB stars is suggested as a mechanism for selective heating of the grains(Suh and Kim 2002). The issue regarding which of these two mechanisms is mostimportant is not yet investigated in detail.
1.4.2 Mineralogy of evolved stars
This section provides a list of all astrominerals that are predicted to be present accord-ing to the condensation sequence of Grossman (1972, Tab. 3). In the condensationsequence I focussed on the initial species and ignored species expected to form af-ter forsterite; except for enstatite and water ice, as those two species were indeeddetected. In addition, the species assumed to condense in the model calculations ofGail and Sedlmayr (1999) are included, as well as all minerals that have beendetected in oxygen-rich astrophysical environments.
The chemical formula and the lattice structure are given (e.g. Klein and Hurl-but Jr. 1993). The main spectral features are listed, as well as the most importantreferences for the optical properties. The Jena-St. Petersburg Database of OpticalConstants contains a more extended list of published spectroscopy of these minerals(Henning et al. 1999). Useful background information on the origin of infraredspectral features of minerals is provided by Farmer (1974). In addition, I have listedthe objects in which the minerals are detected.
Amorphous silicates
• Chemical formula: (Mg,Fe)SiO3 (pyroxene), (Mg,Fe)2SiO4 (olivine), or non-stoichiometric varieties, which have random ratios between the Fe/Mg, Si andO. Amorphous silicates are also known as glasses.
11
Chapter 1
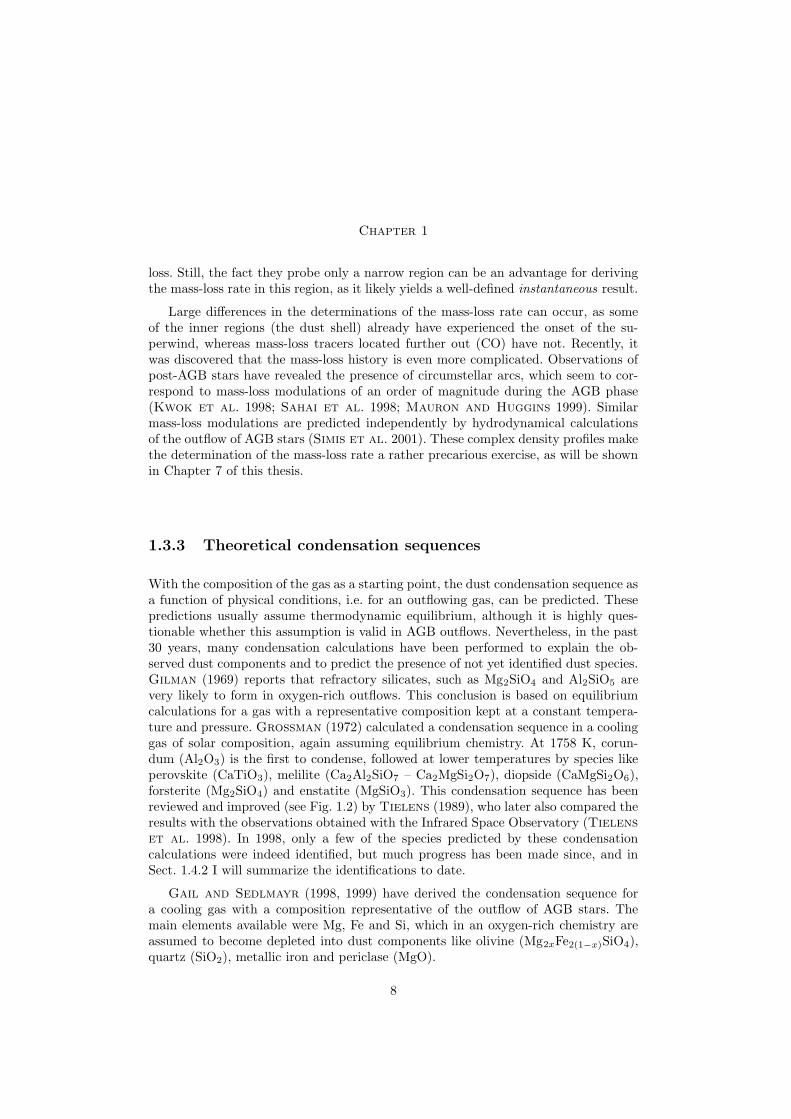
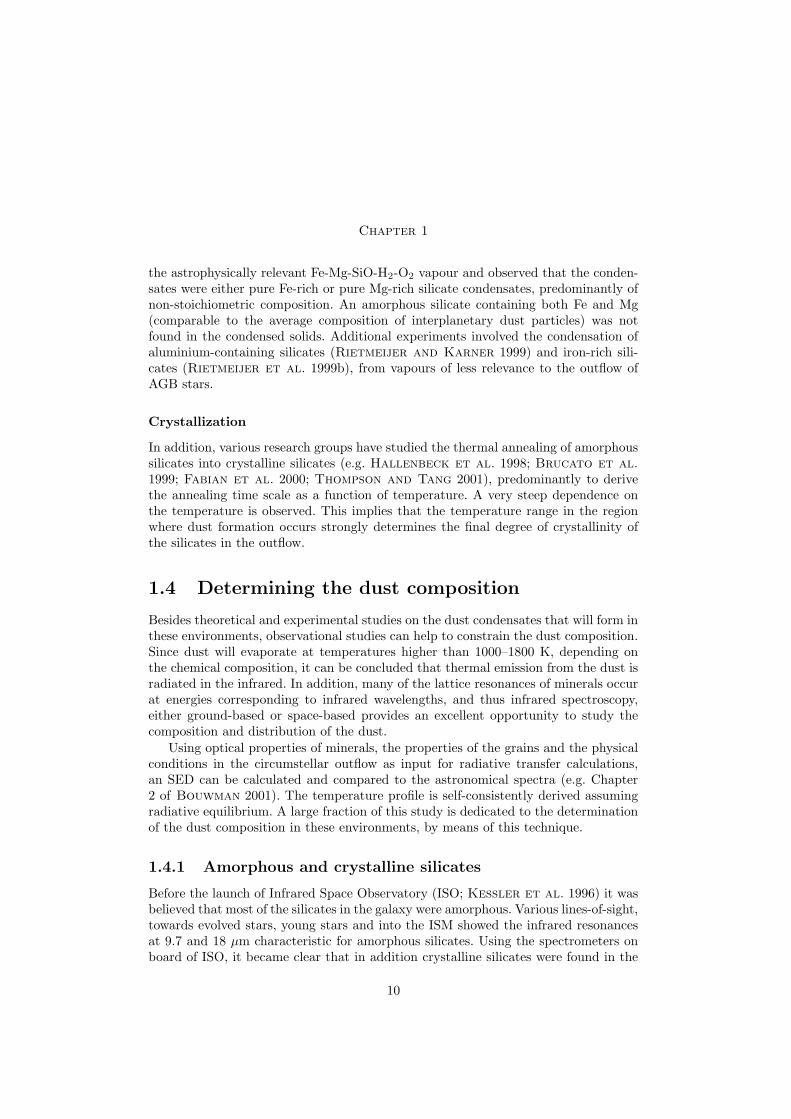
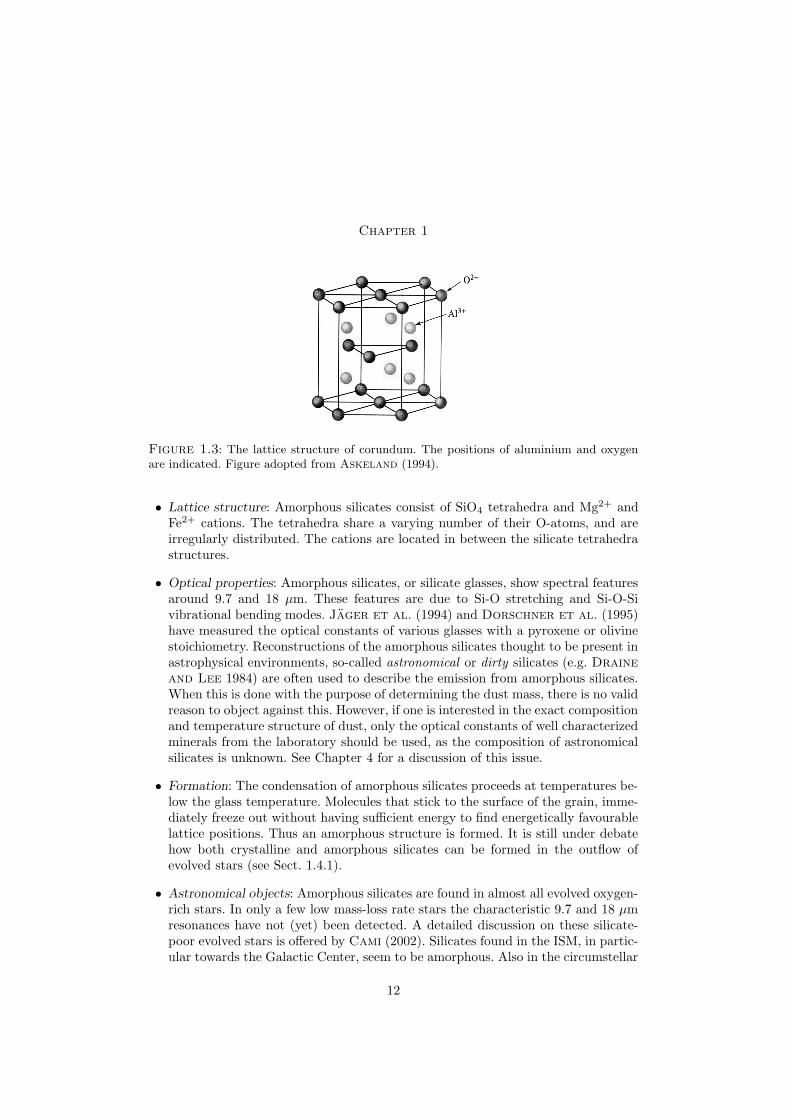
Figure 1.3: The lattice structure of corundum. The positions of aluminium and oxygenare indicated. Figure adopted from Askeland (1994).
• Lattice structure: Amorphous silicates consist of SiO4 tetrahedra and Mg2+ andFe2+ cations. The tetrahedra share a varying number of their O-atoms, and areirregularly distributed. The cations are located in between the silicate tetrahedrastructures.
• Optical properties: Amorphous silicates, or silicate glasses, show spectral featuresaround 9.7 and 18 µm. These features are due to Si-O stretching and Si-O-Sivibrational bending modes. Jager et al. (1994) and Dorschner et al. (1995)have measured the optical constants of various glasses with a pyroxene or olivinestoichiometry. Reconstructions of the amorphous silicates thought to be present inastrophysical environments, so-called astronomical or dirty silicates (e.g. Draineand Lee 1984) are often used to describe the emission from amorphous silicates.When this is done with the purpose of determining the dust mass, there is no validreason to object against this. However, if one is interested in the exact compositionand temperature structure of dust, only the optical constants of well characterizedminerals from the laboratory should be used, as the composition of astronomicalsilicates is unknown. See Chapter 4 for a discussion of this issue.
• Formation: The condensation of amorphous silicates proceeds at temperatures be-low the glass temperature. Molecules that stick to the surface of the grain, imme-diately freeze out without having sufficient energy to find energetically favourablelattice positions. Thus an amorphous structure is formed. It is still under debatehow both crystalline and amorphous silicates can be formed in the outflow ofevolved stars (see Sect. 1.4.1).
• Astronomical objects: Amorphous silicates are found in almost all evolved oxygen-rich stars. In only a few low mass-loss rate stars the characteristic 9.7 and 18 µmresonances have not (yet) been detected. A detailed discussion on these silicate-poor evolved stars is offered by Cami (2002). Silicates found in the ISM, in partic-ular towards the Galactic Center, seem to be amorphous. Also in the circumstellar
12
An introduction to astromineralogy
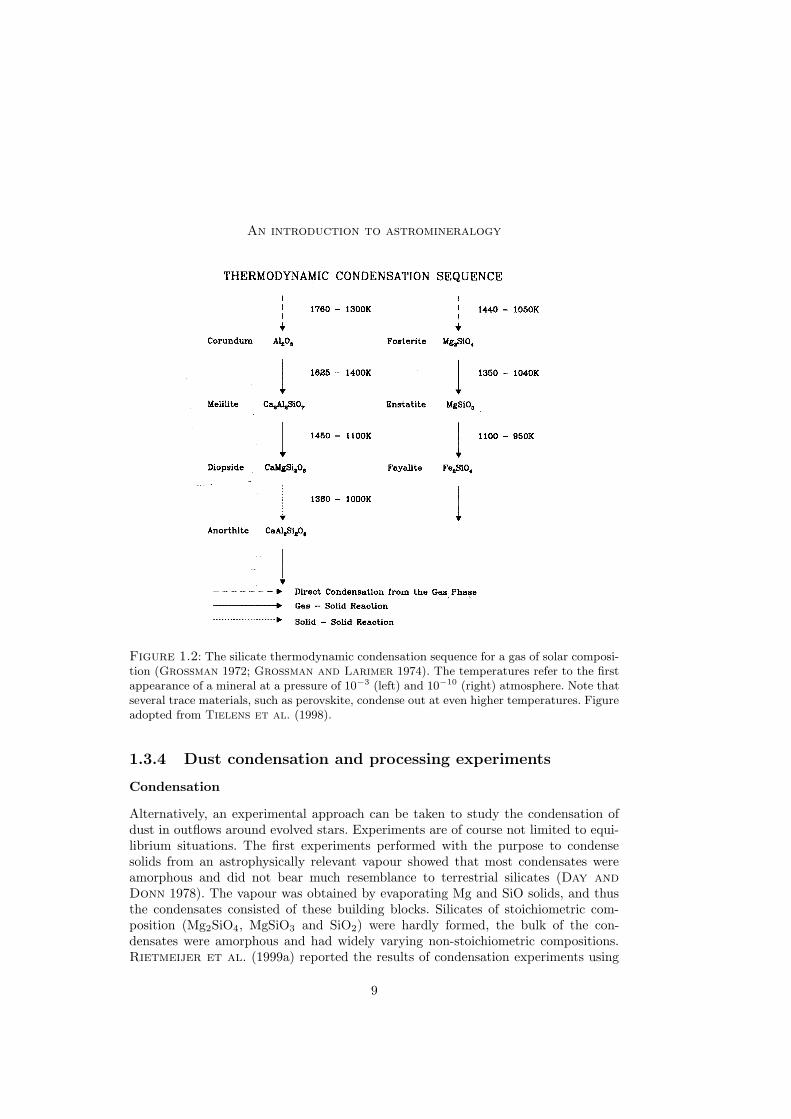
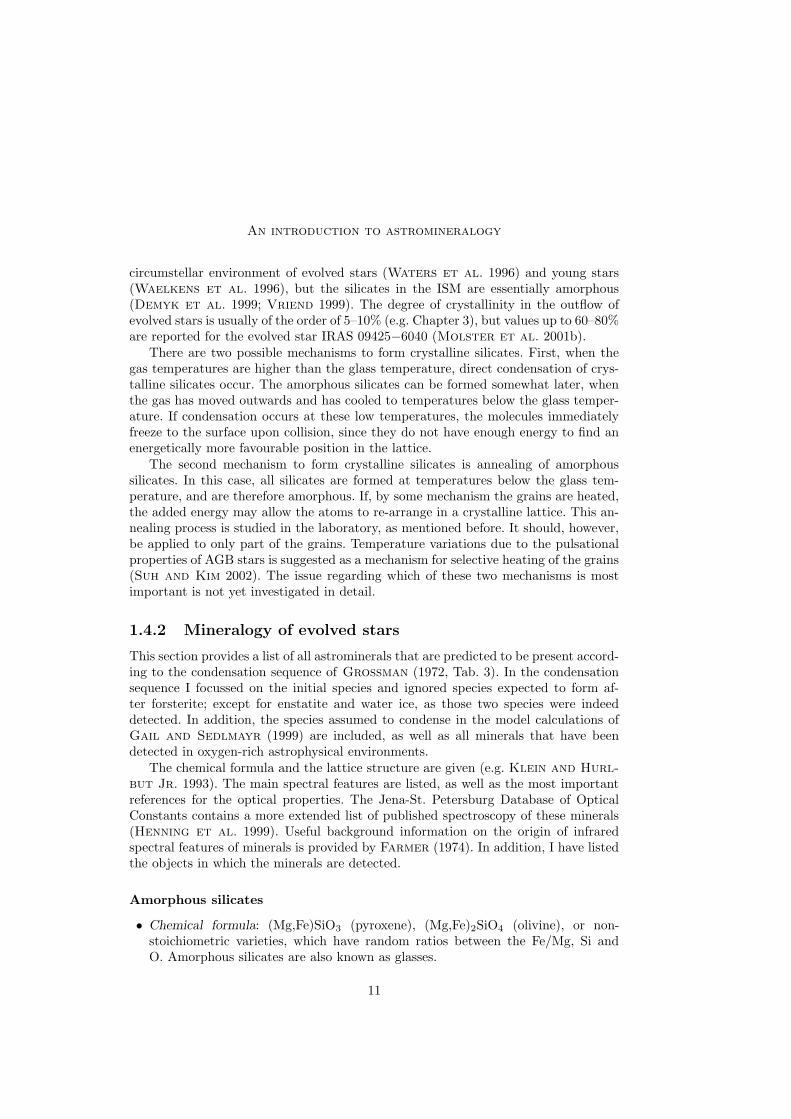
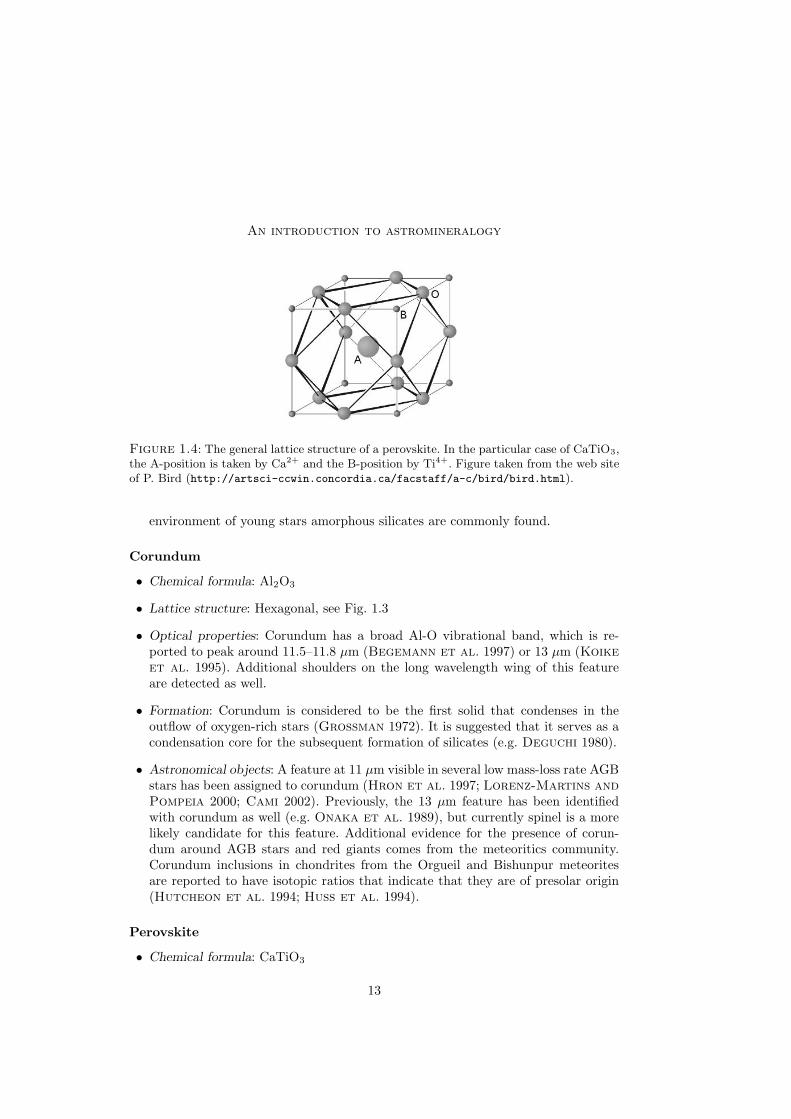
Figure 1.4: The general lattice structure of a perovskite. In the particular case of CaTiO3,the A-position is taken by Ca2+ and the B-position by Ti4+. Figure taken from the web siteof P. Bird (http://artsci-ccwin.concordia.ca/facstaff/a-c/bird/bird.html).
environment of young stars amorphous silicates are commonly found.
Corundum
• Chemical formula: Al2O3
• Lattice structure: Hexagonal, see Fig. 1.3
• Optical properties: Corundum has a broad Al-O vibrational band, which is re-ported to peak around 11.5–11.8 µm (Begemann et al. 1997) or 13 µm (Koikeet al. 1995). Additional shoulders on the long wavelength wing of this featureare detected as well.
• Formation: Corundum is considered to be the first solid that condenses in theoutflow of oxygen-rich stars (Grossman 1972). It is suggested that it serves as acondensation core for the subsequent formation of silicates (e.g. Deguchi 1980).
• Astronomical objects: A feature at 11 µm visible in several low mass-loss rate AGBstars has been assigned to corundum (Hron et al. 1997; Lorenz-Martins andPompeia 2000; Cami 2002). Previously, the 13 µm feature has been identifiedwith corundum as well (e.g. Onaka et al. 1989), but currently spinel is a morelikely candidate for this feature. Additional evidence for the presence of corun-dum around AGB stars and red giants comes from the meteoritics community.Corundum inclusions in chondrites from the Orgueil and Bishunpur meteoritesare reported to have isotopic ratios that indicate that they are of presolar origin(Hutcheon et al. 1994; Huss et al. 1994).
Perovskite
• Chemical formula: CaTiO3
13
Chapter 1
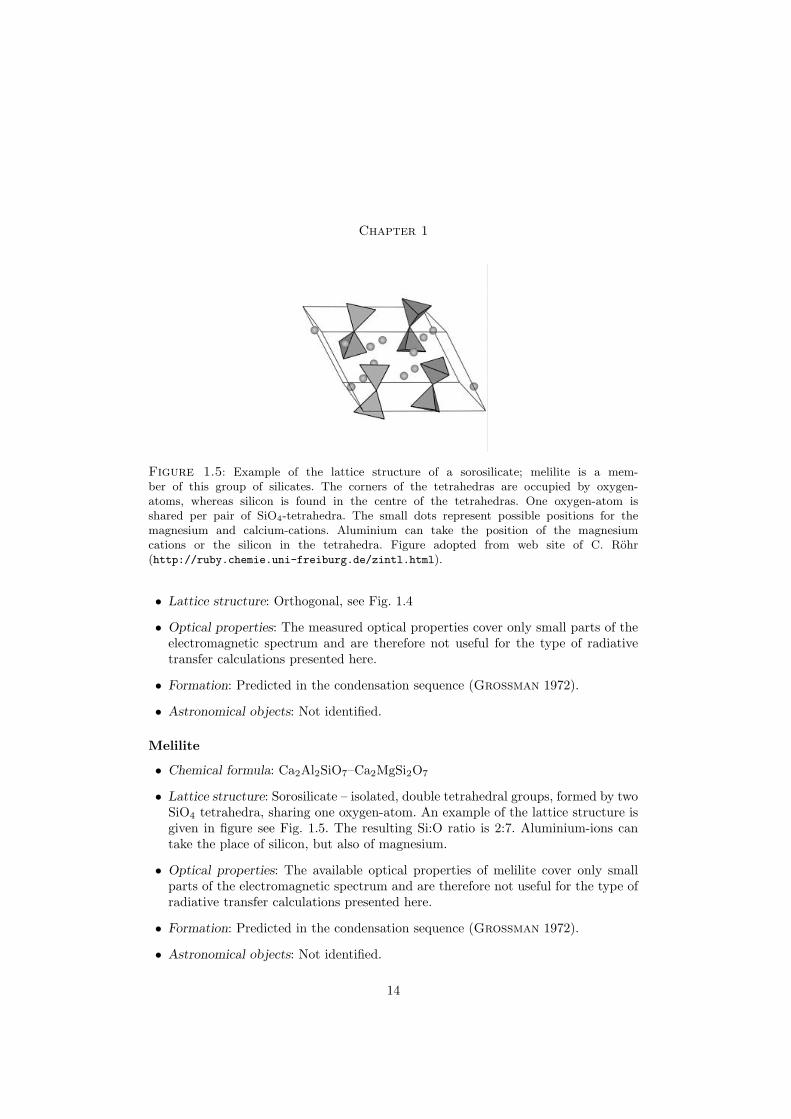
Figure 1.5: Example of the lattice structure of a sorosilicate; melilite is a mem-ber of this group of silicates. The corners of the tetrahedras are occupied by oxygen-atoms, whereas silicon is found in the centre of the tetrahedras. One oxygen-atom isshared per pair of SiO4-tetrahedra. The small dots represent possible positions for themagnesium and calcium-cations. Aluminium can take the position of the magnesiumcations or the silicon in the tetrahedra. Figure adopted from web site of C. Rohr(http://ruby.chemie.uni-freiburg.de/zintl.html).
• Lattice structure: Orthogonal, see Fig. 1.4
• Optical properties: The measured optical properties cover only small parts of theelectromagnetic spectrum and are therefore not useful for the type of radiativetransfer calculations presented here.
• Formation: Predicted in the condensation sequence (Grossman 1972).
• Astronomical objects: Not identified.
Melilite
• Chemical formula: Ca2Al2SiO7–Ca2MgSi2O7
• Lattice structure: Sorosilicate – isolated, double tetrahedral groups, formed by twoSiO4 tetrahedra, sharing one oxygen-atom. An example of the lattice structure isgiven in figure see Fig. 1.5. The resulting Si:O ratio is 2:7. Aluminium-ions cantake the place of silicon, but also of magnesium.
• Optical properties: The available optical properties of melilite cover only smallparts of the electromagnetic spectrum and are therefore not useful for the type ofradiative transfer calculations presented here.
• Formation: Predicted in the condensation sequence (Grossman 1972).
• Astronomical objects: Not identified.
14

An introduction to astromineralogy
Figure 1.6: Lattice structure of spinel, based on a closest packing arrangement for oxygensin two types of polyhedra. The magnesium and aluminium cations, on the X- and Y-positionsare contained in the centre of the polyhedra. Figure taken from a mineralogy web site main-tained by J.R. Smyth (http://ruby.colorado.edu/∼smyth/min/minerals.html).
Spinel
• Chemical formula: MgAl2O4
• Lattice structure: Isometric, see Fig. 1.6. Spinel is a member of the spinel groupXY2O4, where the X-positions can for instance be taken by Mg2+, Fe2+, Zn2+ orMn2+, and the Y-positions by Al3+, Fe3+ or Cr3+.
• Optical properties: Spinel has strong features around 13 and 17 µm, both due toAl-O vibration modes, and a weaker feature around 32 µm (see e.g. Fabian et al.2001). These features will shift in peak position when the Mg/Al ratio is changed.
• Formation: Spinel is one of the dust components predicted by the condensationsequence of Grossman (1972).
• Astronomical objects: Spinel is proposed to be the carrier of the 13 µm feature inlow mass-loss rate AGB stars (Posch et al. 1999; Cami 2002).
Metallic iron
• Chemical formula: Fe, can contain some Ni
• Lattice structure: Isometric, see Fig. 1.7.
• Optical properties: Metallic iron produces a smooth continuum (see e.g. Ordalet al. 1988, for optical constants). As a conducting material, iron has a highabsorptivity, in particular in the visible and the near-infrared. This makes deter-mination of the optical properties difficult.
15
Chapter 1
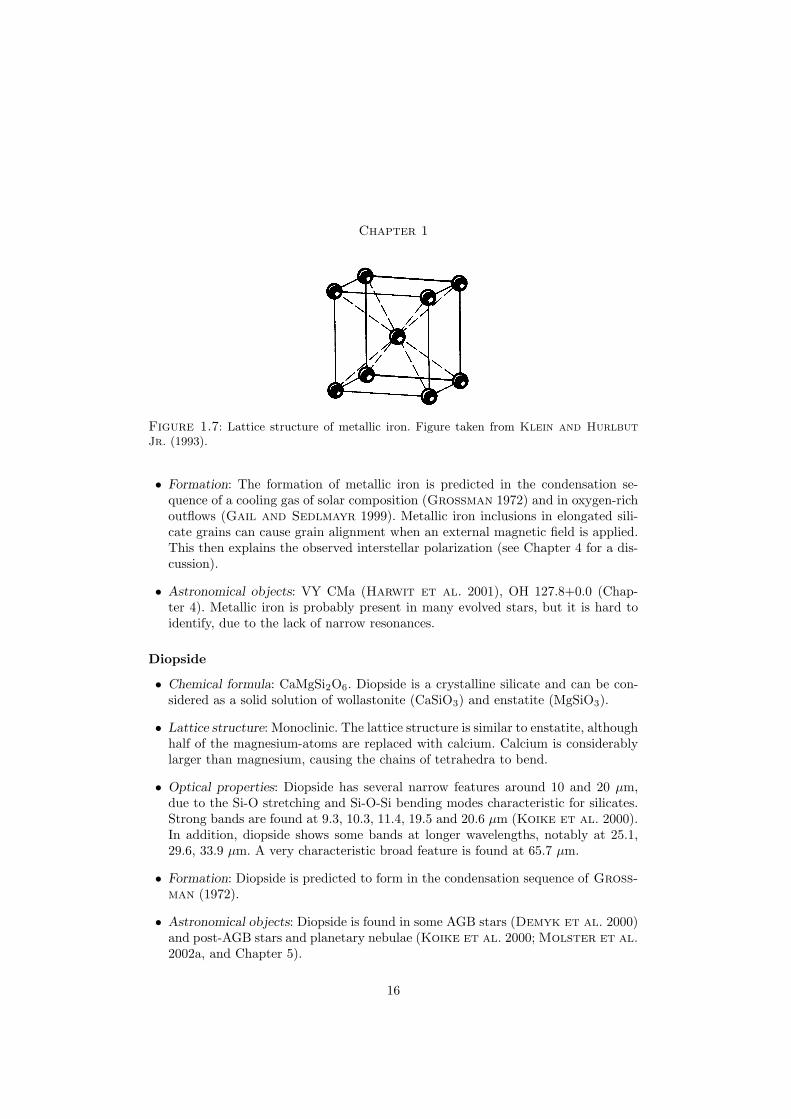
Figure 1.7: Lattice structure of metallic iron. Figure taken from Klein and HurlbutJr. (1993).
• Formation: The formation of metallic iron is predicted in the condensation se-quence of a cooling gas of solar composition (Grossman 1972) and in oxygen-richoutflows (Gail and Sedlmayr 1999). Metallic iron inclusions in elongated sili-cate grains can cause grain alignment when an external magnetic field is applied.This then explains the observed interstellar polarization (see Chapter 4 for a dis-cussion).
• Astronomical objects: VY CMa (Harwit et al. 2001), OH 127.8+0.0 (Chap-ter 4). Metallic iron is probably present in many evolved stars, but it is hard toidentify, due to the lack of narrow resonances.
Diopside
• Chemical formula: CaMgSi2O6. Diopside is a crystalline silicate and can be con-sidered as a solid solution of wollastonite (CaSiO3) and enstatite (MgSiO3).
• Lattice structure: Monoclinic. The lattice structure is similar to enstatite, althoughhalf of the magnesium-atoms are replaced with calcium. Calcium is considerablylarger than magnesium, causing the chains of tetrahedra to bend.
• Optical properties: Diopside has several narrow features around 10 and 20 µm,due to the Si-O stretching and Si-O-Si bending modes characteristic for silicates.Strong bands are found at 9.3, 10.3, 11.4, 19.5 and 20.6 µm (Koike et al. 2000).In addition, diopside shows some bands at longer wavelengths, notably at 25.1,29.6, 33.9 µm. A very characteristic broad feature is found at 65.7 µm.
• Formation: Diopside is predicted to form in the condensation sequence of Gross-man (1972).
• Astronomical objects: Diopside is found in some AGB stars (Demyk et al. 2000)and post-AGB stars and planetary nebulae (Koike et al. 2000; Molster et al.2002a, and Chapter 5).
16

An introduction to astromineralogy
Figure 1.8: Basic structural components of the olivine forsterite (left) and the pyroxeneenstatite (right). In case of forsterite, none of the oxygens contained in the SiO4 tetrahedraare shared with other tetrahedras, but in enstatite, the tetrahedra form long chains by sharingtwo of their oxygen-atoms each. Figure adopted from Klein and Hurlbut Jr. (1993).
Enstatite
• Chemical formula: MgSiO3. Enstatite can contain a small amount Fe (instead ofMg) and still be considered enstatite from a mineralogical point of view.
• Lattice structure: Orthorhombic. Enstatite consists of long chains of SiO4 tetra-hedra, sharing two oxygen atoms (see Fig. 1.8). The magnesium atoms are locatedbetween the chains.
• Optical properties: The optical constants of enstatite are measured by Jageret al. (1998). Pure Mg-rich enstatite has strong resonances at 9.9, 10.7, 11.1,11.6, 18.2, 19.3, 40.8 and 43.4 µm. The resonances around 10 and 20 µm can beexplained by stretching and bending modes within the SiO4 tetrahedra.
• Formation: Predicted to form in various condensation sequences (e.g. Grossman1972; Gail and Sedlmayr 1999), provided cooling proceeds slow enough to allowannealing or direct condensation of crystalline silicates.
• Astronomical objects: Enstatite is found in many high mass-loss rate AGB stars,post-AGB stars and planetary nebulae (e.g. Waters et al. 1996; Cami et al.1998; Molster et al. 2002a, and Chapter 2), but also towards young stars (e.g.Waelkens et al. 1996; Bouwman et al. 2001).
Forsterite
• Chemical formula: Mg2SiO4. Also in case of forsterite some of the Mg can bereplaced with Fe and still be considered forsterite from a mineralogical point ofview.
• Lattice structure: Orthorhombic. The SiO4 tetrahedra in forsterite do not shareoxygen atoms with each other (see Fig. 1.8).
17
Chapter 1
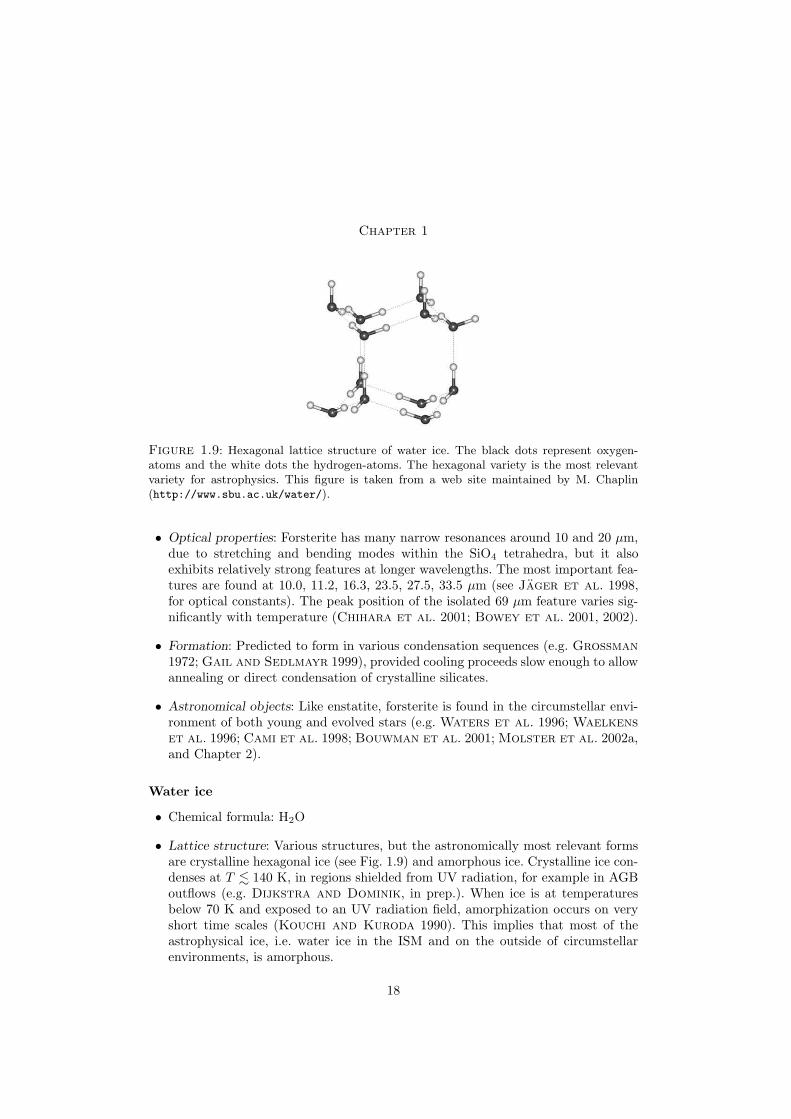
Figure 1.9: Hexagonal lattice structure of water ice. The black dots represent oxygen-atoms and the white dots the hydrogen-atoms. The hexagonal variety is the most relevantvariety for astrophysics. This figure is taken from a web site maintained by M. Chaplin(http://www.sbu.ac.uk/water/).
• Optical properties: Forsterite has many narrow resonances around 10 and 20 µm,due to stretching and bending modes within the SiO4 tetrahedra, but it alsoexhibits relatively strong features at longer wavelengths. The most important fea-tures are found at 10.0, 11.2, 16.3, 23.5, 27.5, 33.5 µm (see Jager et al. 1998,for optical constants). The peak position of the isolated 69 µm feature varies sig-nificantly with temperature (Chihara et al. 2001; Bowey et al. 2001, 2002).
• Formation: Predicted to form in various condensation sequences (e.g. Grossman1972; Gail and Sedlmayr 1999), provided cooling proceeds slow enough to allowannealing or direct condensation of crystalline silicates.
• Astronomical objects: Like enstatite, forsterite is found in the circumstellar envi-ronment of both young and evolved stars (e.g. Waters et al. 1996; Waelkenset al. 1996; Cami et al. 1998; Bouwman et al. 2001; Molster et al. 2002a,and Chapter 2).
Water ice
• Chemical formula: H2O
• Lattice structure: Various structures, but the astronomically most relevant formsare crystalline hexagonal ice (see Fig. 1.9) and amorphous ice. Crystalline ice con-denses at T . 140 K, in regions shielded from UV radiation, for example in AGBoutflows (e.g. Dijkstra and Dominik, in prep.). When ice is at temperaturesbelow 70 K and exposed to an UV radiation field, amorphization occurs on veryshort time scales (Kouchi and Kuroda 1990). This implies that most of theastrophysical ice, i.e. water ice in the ISM and on the outside of circumstellarenvironments, is amorphous.
18
An introduction to astromineralogy
• Optical properties: Crystalline water ice has spectral features around 3 (O-Hstretch), 6, 43 and 60 µm (e.g. Bertie and Whalley 1967; Bertie et al.1969). The 60 µm feature is a shoulder on the 43 micron feature, and disappearswhen the ice becomes amorphous (Moore and Hudson 1994). It is thereforevery hard to detect amorphous water ice from far-infrared spectra of astronomicalobjects, as the 43 µm feature can be easily confused with the emission feature ofenstatite. Hoogzaad (2001) compared the measurements of the optical propertiesin the infrared, obtained in different laboratories.
• Formation: Water ice is predicted in the condensation sequence of a cooling gasof solar composition (Grossman 1972). Jura and Morris (1985) predicted thecondensation of water ice on particles in the outflow of oxygen-rich evolved stars.A recent model explains why not all evolved stars develop grains with ice mantles(Dijkstra and Dominik, in prep.).
• Astronomical objects: In many AGB stars, post-AGB stars, and planetary neb-ulae bands around 3, 6, 43 and 60 µm are assigned to water ice (e.g. Soiferet al. 1981; Roche and Aitken 1984; Barlow 1998; Meixner et al. 2002;Hoogzaad et al. 2002, and Chapter 2)
Silica
• Chemical formula: SiO2
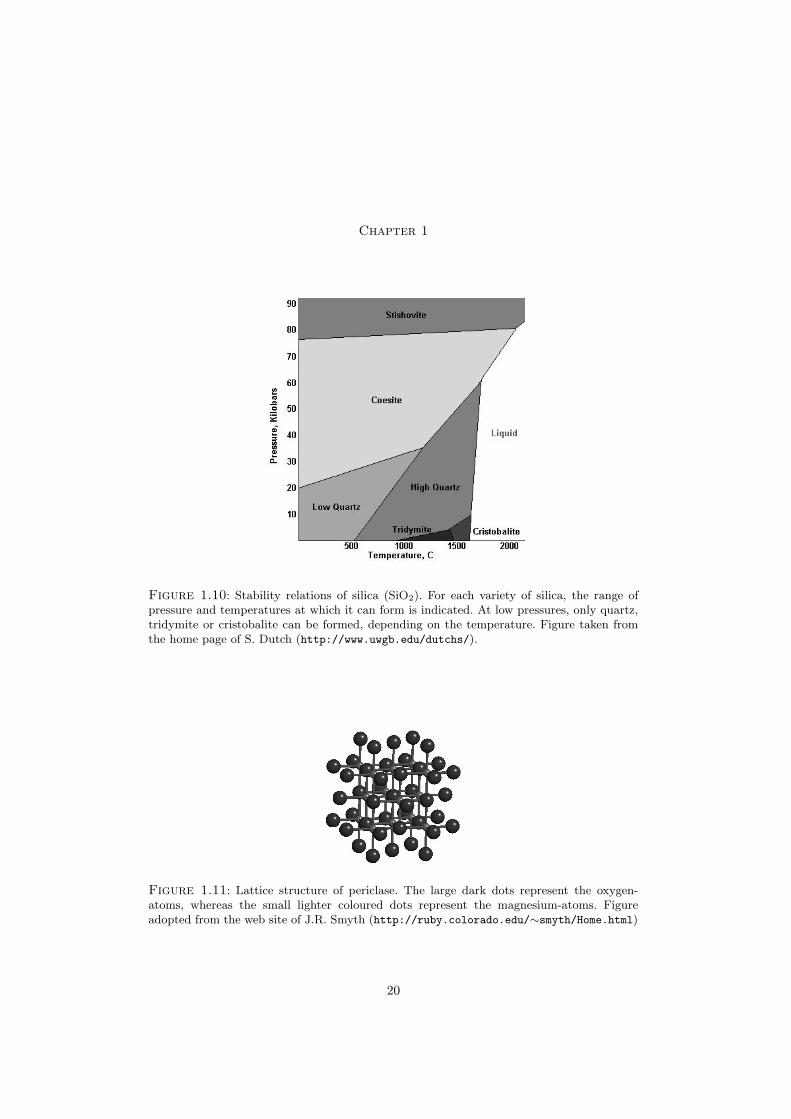
• Lattice structure: Various lattice structures, depending on pressure. Silica consistsof SiO4 tetrahedra which share all their oxygen atoms with other tetrahedra. Theastronomically most relevant silica varieties are quartz (high and low), tridymiteand cristobalite. Those varieties can exist at low pressures (see Fig. 1.10).
• Optical properties: Quartz, as a representative of the silica group, shows infraredspectral features around 9, 20 and 27 µm (Spitzer and Kleinman 1961).
• Formation: Gail and Sedlmayr (1999) assumed that quartz can condense di-rectly in the oxygen-rich outflow. Experiments showed that the annealing of sili-cates may indeed lead to the production of silica, but rather in the tridymite orcristobalite forms (Rietmeijer et al. 1986; Fabian et al. 2000).
• Astronomical objects: Silica is tentatively identified in some post-AGB stars(Molster et al. 2002a). A more firm identification, albeit not in evolved starsbut in Herbig Ae/Be systems, can be found in the work of Bouwman et al.(2001). Silica is also claimed to be the carrier of the 13 µm feature in low mass-loss rate AGB stars (Speck et al. 2000), but other studies argue that this featureis due to spinel.
19
Chapter 1
Figure 1.10: Stability relations of silica (SiO2). For each variety of silica, the range ofpressure and temperatures at which it can form is indicated. At low pressures, only quartz,tridymite or cristobalite can be formed, depending on the temperature. Figure taken fromthe home page of S. Dutch (http://www.uwgb.edu/dutchs/).
Figure 1.11: Lattice structure of periclase. The large dark dots represent the oxygen-atoms, whereas the small lighter coloured dots represent the magnesium-atoms. Figureadopted from the web site of J.R. Smyth (http://ruby.colorado.edu/∼smyth/Home.html)
20

An introduction to astromineralogy
Figure 1.12: Structure of calcite. The CO32−-groups and the Ca2+ ions can be easily
identified. In case of dolomite, some of the calcium is replaced with magnesium, which has adifferent size and thus leads to a different lattice structure. Figure adopted from Klein andHurlbut Jr. (1993).
Periclase
• Chemical formula: MgO
• Lattice structure: Cubic, like NaCl (see Fig. 1.11).
• Optical properties: Periclase has a broad resonance in the infrared at 15 µm(Henning et al. 1995; Begemann et al. 1995).
• Formation: In their condensation calculations Gail and Sedlmayr (1999) haveconsidered periclase as one of the possible condensates in oxygen-rich outflows.Kohler et al. (1997) predicted that periclase may indeed form in the outflowof M-type stars, but probably not in detectable amounts. The formation of MgOmight be an intermediate step in the formation of carbonates, as is discussed inChapter 5.
• Astronomical objects: MgO is not identified in evolved stars, but a related speciesMg0.1Fe0.9 is identified in several evolved stars with a low mass-loss rate (Cami2002). MgO has been proposed as the carrier of diffuse interstellar absorptionbands (Duley 1979), however this identification has later been rejected (Seaband Snow 1985).
Carbonates
• Chemical formula: e.g. CaCO3 (calcite), CaMg(CO3)2 (dolomite).
• Lattice structure: Hexagonal, see Fig. 1.12.
• Optical properties: The infrared spectra of carbonates show resonances around 7,11 and 14 µm. These resonances are found in all different types of carbonates and
21
Chapter 1
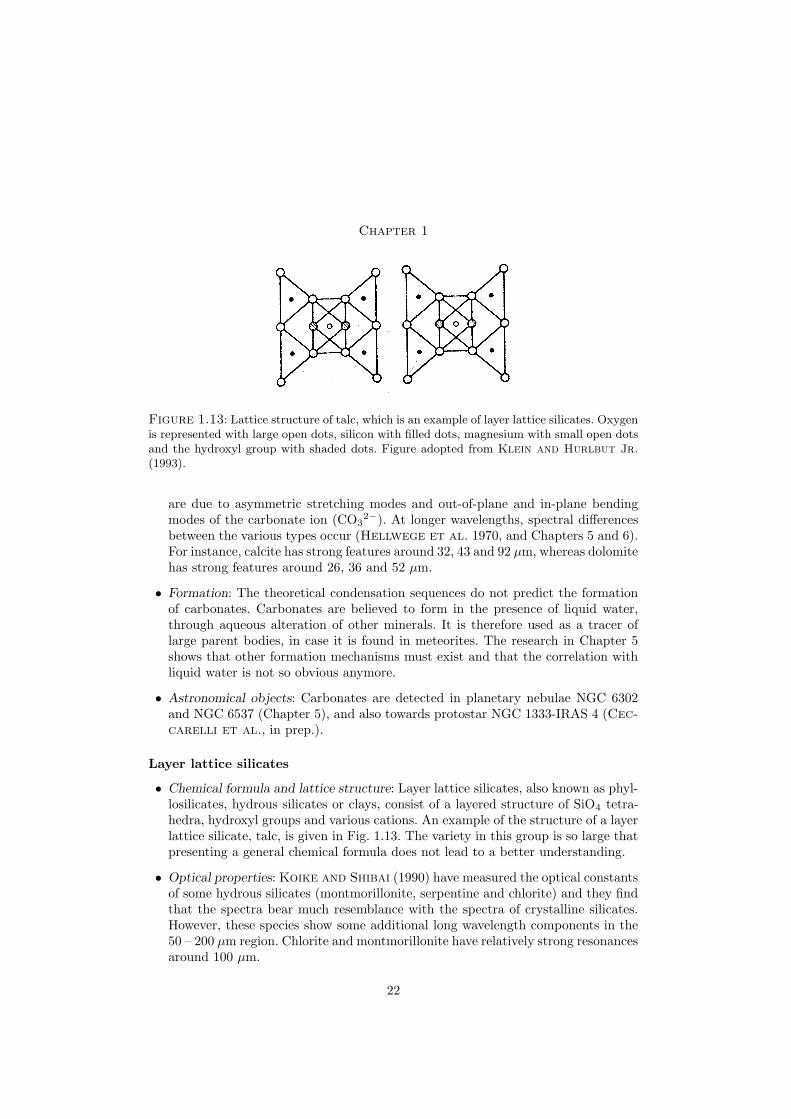
Figure 1.13: Lattice structure of talc, which is an example of layer lattice silicates. Oxygenis represented with large open dots, silicon with filled dots, magnesium with small open dotsand the hydroxyl group with shaded dots. Figure adopted from Klein and Hurlbut Jr.(1993).
are due to asymmetric stretching modes and out-of-plane and in-plane bendingmodes of the carbonate ion (CO3
2−). At longer wavelengths, spectral differencesbetween the various types occur (Hellwege et al. 1970, and Chapters 5 and 6).For instance, calcite has strong features around 32, 43 and 92 µm, whereas dolomitehas strong features around 26, 36 and 52 µm.
• Formation: The theoretical condensation sequences do not predict the formationof carbonates. Carbonates are believed to form in the presence of liquid water,through aqueous alteration of other minerals. It is therefore used as a tracer oflarge parent bodies, in case it is found in meteorites. The research in Chapter 5shows that other formation mechanisms must exist and that the correlation withliquid water is not so obvious anymore.
• Astronomical objects: Carbonates are detected in planetary nebulae NGC 6302and NGC 6537 (Chapter 5), and also towards protostar NGC 1333-IRAS 4 (Cec-carelli et al., in prep.).
Layer lattice silicates
• Chemical formula and lattice structure: Layer lattice silicates, also known as phyl-losilicates, hydrous silicates or clays, consist of a layered structure of SiO4 tetra-hedra, hydroxyl groups and various cations. An example of the structure of a layerlattice silicate, talc, is given in Fig. 1.13. The variety in this group is so large thatpresenting a general chemical formula does not lead to a better understanding.
• Optical properties: Koike and Shibai (1990) have measured the optical constantsof some hydrous silicates (montmorillonite, serpentine and chlorite) and they findthat the spectra bear much resemblance with the spectra of crystalline silicates.However, these species show some additional long wavelength components in the50 – 200 µm region. Chlorite and montmorillonite have relatively strong resonancesaround 100 µm.
22

An introduction to astromineralogy
• Formation: The theoretical condensation sequences do not predict the formationof layer lattice silicates. Nevertheless, these silicates could be the intermediate stepin the formation of carbonates, see Chapter 5.
• Astronomical objects: Not identified in evolved stars. A tentative detection ofthe layer lattice silicate montmorillonite in the young star HD 142527 is reported(Malfait et al. 1999).
1.5 Towards an understanding of dust formationaround evolved stars
The work presented here is aimed at obtaining a better understanding of dust forma-tion in the outflows of evolved stars. Many aspects of this process are still not fullyunderstood. The condensation sequence as a function of the physical properties in theoutflow is not studied in detail, and therefore it is difficult to predict the emergenceof dust species in various classes of AGB stars. For instance, it is unknown whichconditions affect the degree of crystallinity of the outflow, which dust componentsactually condense and how this affects the mass-loss rate. These are important openissues as the outflow of AGB stars replenishes the gas and dust in the ISM, and thusplays an important role in the life cycle of dust and gas. In addition, the geometry ofthe outflow determines the shape of the subsequent planetary nebula, but an inhomo-geneous outflow is not yet studied in great detail. Differences in the dust compositionof various parts of the outflow may provide a handle to a better understanding of theshaping of planetary nebulae.
In Chapter 2 infrared spectra from 2.4–197 µm of AGB stars, obtained with ISO,are presented. An inventory of the solid state and molecular features is made. Itis noticed that only high mass-loss rate AGB stars show the spectral signature ofcrystalline silicates.
In Chapter 3 the issue whether absence of evidence means that there is evidenceof absence of crystalline silicates, is addressed. Radiative transfer calculations appliedto the circumstellar dust shells around AGB stars show that low mass-loss rate AGBstars can have a large fraction of crystalline silicates present in their outflows withoutshowing the spectral features. In order to further study the dust composition, itis necessary to obtain a good fit on the SED with self-consistent radiative transfercalculations, using only well-characterized dust components. In Chapter 4 the firstaccurate fit of the SED of an OH/IR stars (OH 127.8+0.0) following this approach,is presented. The long standing NIR problem is solved by including a small amountof non-spherical metallic iron grains.
Besides metallic iron, another new dust component is identified in evolved stars,namely carbonates. In Chapter 5 the discovery of carbonates in the planetary nebulaeNGC 6302 and NGC 6537 is reported. Carbonates usually form through interactionof minerals with liquid water, and therefore trace the presence of planet-like bodies.However, this is a very unlikely scenario in planetary nebulae. Therefore, non-aqueous
23
Chapter 1
formation mechanisms are discussed. In addition, the discovery of carbonates is usedto further disentangle the mineralogy and physical properties of planetary nebulaNGC 6302 (Chapter 6).
Finally, in Chapter 7, attempts are made to determine the physical structure of theoutflow of AGB stars using submillimeter observations of the rotational transitions ofthe carbon monoxide molecule. State-of-the-art models to determine mass-loss rateshowever, prove to be not sufficiently sophisticated; mass-loss variations and a gradientin the turbulence are not included, but might be required to explain the observed lineintensities.
Combined with the mineralogy, the physical structure will provide useful informa-tion on the formation of dust. The studies described in this thesis are a few more stepson the road to the understanding of dust condensation in the outflow of oxygen-richevolved stars. Once the composition and evolution of dust as a function of the physicalconditions is known, the first steps in the life cycle of dust are understood; a life cyclewhich eventually leads to the formation of planets. The oxygen-rich environment inAGB outflows provides a unique laboratory to study important physical processes.These processes may also be important in more polluted environments, such as theISM and star forming regions.
24
Chapter 2
2.4 – 197 µm spectroscopy ofOH/IR stars:The IR characteristics ofcircumstellar dust in O-richenvironments
Astronomy & Astrophysics 352, 587–599 (1999)
R.J. Sylvester, F. Kemper, M.J. Barlow, T. de Jong, L.B.F.M. Waters,
A.G.G.M. Tielens and A. Omont
ABSTRACTInfrared spectra of a number of evolved O-rich stars have been obtained withthe Short and Long Wavelength spectrometers on board the Infrared SpaceObservatory. The very broad wavelength coverage (2.4–197µm) obtained bycombining observations made with the two spectrometers includes practicallyall of the flux emitted by the sources, and allows us to determine the emissionand absorption features of the dense circumstellar dust shells. Agreementbetween the fluxes obtained by the two instruments is generally very good;the largest discrepancies are probably due to source variability. Our sample ofoxygen-rich AGB stars exhibits a wealth of spectral features due to crystallinesilicates and crystalline water ice in emission and absorption. In this studya qualitative overview of all features due to crystalline silicates and waterice in these high mass loss rate objects is presented. A trend is discovered;the strength of the features is increasing with increasing mass loss rates.Moreover, crystalline silicate emission features have been detected for thefirst time at wavelengths where the amorphous silicates are still in absorption,implying different spatial distributions for the two materials. A sphericallysymmetric and an axi-symmetric geometry are proposed.
25
Chapter 2
2.1 Introduction
The post-main sequence evolution of stars of low or intermediate mass takes thesestars on to the Asymptotic Giant Branch (AGB), where they lose mass at rates of10−7–10−4 M� yr−1. In the circumstellar outflows molecules are formed and dustgrains condense. The relative abundances of carbon and oxygen in the star deter-mine the chemical composition of the gas and dust in the outflows. Oxygen-rich starsproduce silicate dust and molecules such as H2O and OH. If the mass-loss rate issufficiently high, the dust completely obscures the star at visible wavelengths, andthe object is known as an OH/IR star because of its strong emission in the infrared(IR), produced by the dust grains, and in radio OH lines, due to maser action by OHmolecules. See Habing (1996) for a detailed review of AGB and OH/IR stars. Theoptically-thick dust envelopes of OH/IR stars may be the result of a recent increasein mass-loss rate: the so-called ‘superwind’ phase (e.g. Justtanont et al. 1996b;Delfosse et al. 1997). Omont et al. (1990) detected the 43- and 60-µm emissionbands of water ice in the KAO spectra of a number of OH/IR stars, attributing thebands to the condensation of water molecules onto silicate grain cores in the denseoutflows.
An important result from the Infrared Space Observatory (ISO) mission is thedetection of emission from crystalline silicates in the far-IR spectra of many sources,including the circumstellar environments of young and evolved stars and solar-systemcomets (e.g. Waters et al. 1996, 1999). Crystalline silicate bands have been detectedin OH/IR star spectra (Cami et al. 1998) but are not seen in O-rich AGB starswith low mass-loss rates, suggesting that the abundance of the crystalline materialsis related to the density of the circumstellar matter at the dust condensation radius(Waters et al. 1996). ISO has also detected thermal emission and absorption bywater, in both the gaseous and solid (ice) phases (e.g. Barlow 1998), from O-richcircumstellar environments.
In this paper we present ISO spectra of seven well-known OH/IR stars coveringa range of mass-loss rates. The spectrum of the archetypal Mira variable, o Cet, ispresented for comparison. For most of our targets, the spectra cover the complete2.4–197µm spectral range of ISO. Sect. 2.2 describes the observations and data re-duction. In Sect. 2.3, the spectra are presented and analyzed, with emphasis on thedetermination of the continuum and the features due to ices and silicates. Concludingremarks are made in Sect. 2.4.
2.2 Observations
Seven of our eight sources were observed with both the SWS and LWS instruments,while of OH32.8−0.3 only the SWS data were useful. Tab. 2.1 lists the sources ob-served, and the JD dates of the observations (henceforth we abbreviate the OH/IR stardesignations to OH104.9, OH127.8 etc). Some of our sources (e.g. OH104.9, OH26.5)were observed nearly contemporaneously with the two instruments, while for others,
26

2.4 – 197 µm spectroscopy of OH/IR stars
Table 2.1: Observing details for our sources. Included are the revolution number and on-target time for the SWS and LWS observations, and the scale factor applied to the LWSobservations to bring the spectra into agreement (see text).
Star IRAS name Date SWS Obs Date LWS Obs fLWS tSWS tLWS
JD 2450000+ JD 2450000+ (s) (s)
Mira 02168−0312 489.47 633.83 1.5 3454 1928CRL 2199 18333+0553 749.17 746.42 0.97 1912 2228WX Psc 01037+1219 433.43 614.52 1.4 1912 4704OH104.9+2.4 21177+5936 321.29 321.28 1.0 1140 1268OH127.8+0.0 01304+6211 825.20 651.02 1.0 1912 1330OH26.5+0.6 18348−0526 368.16 368.13 1.15 1912 1268AFGL 5379 17411−3154 879.85 507.23 0.8 1912 1614OH32.8−0.3 18498−0017 358.42 – – 1912 –
the two spectra were taken more than 100 days apart. In the past, modelling work(e.g. Lorenz-Martins and de Araujo 1997) has been hindered to some extent bythe non-simultaneity of NIR photometry and 10-20 µm spectra (usually IRAS LRSdata). The fact that the SWS spectrum covers both these wavelength regions at asingle epoch will be useful for future modelling of these sources (see e.g. Chapter 4).
2.2.1 SWS
The 2.38–45.2 µm part of the spectrum was obtained using the ISO Short Wave-length Spectrometer (SWS). A detailed description of the instrument can be foundin de Graauw et al. (1996a). Our objects were observed in AOT 1 mode, speed 2,except for Mira (speed 3) and OH104.9 (speed 1). The spectrum scanned with SWScontains 12 subspectra, that each consist of two scans, one in the direction of decreas-ing wavelength (‘up’ scan) and one in the increasing wavelength direction (‘down’scan). There are small regions of overlap in wavelength between the subspectra. Eachsub-spectrum is recorded by 12 independent detectors.
The data reduction was performed using the ESA SWS Interactive Analysis pack-age (IA3), together with the calibration files available in January 1999, equivalentto pipe-line version 6.0. We started from the Standard Processed Data (SPD) todetermine the final spectrum, according to the steps described in this session.
The observations suffer from severe memory effects in the 4.08–12.0 µm and29.0–45.2 µm wavelength regions. It is possible to correct for the memory effectsfor the individual detectors, using a combined dark-current and memory-effect sub-traction method. This method was applied assuming that the flux levels in thesewavelength regions are very high, and treating the memory effect as giving an ad-ditive contribution to the observed signal. We also assumed that the spurious signal
27
Chapter 2
from the memory effect reaches a certain saturation value very quickly after the startof the up scan, and then remains constant throughout the rest of the up scan andthe entire down scan. This memory saturation value is measured immediately afterthe down scan is ended, and is subtracted from the up and down scan measurements.The spectral shape of the memory-corrected down scan is now correct; the error inthe spectral shape of the up scan is corrected by fitting a polynomial to the up scanand adjusting this fit to the down scan, without changing the detailed structure of thespectrum. The order of the applied polynomial fit differs per subband, but is chosento be in agreement with the spectral shape in that band. For band 1 and 4 we mostlyused polynomials of order 1 or 2, for band 2a, 2b and 3 we predominantly used order2 or 3, and for band 2c higher order polynomials (up to order 10) were required toadjust the up scan to the down scan.
The spectra of some of our objects showed fringes in the 12.0–29.0 µm wavelengthregion. This was corrected using the defringe procedures of IA3.
Glitches caused by particle hits on the detector were removed by hand. Glitchescan be easily recognized: they start with a sudden increase in flux level, followed by atail which decreases exponentially with time. Any given glitch affects only one of thetwo scans.
The data were further analyzed by shifting all spectra of the separate detectors toa mean value, followed by sigma clipping and rebinning to a resolution of λ/∆λ = 600,which is reasonable for AOT 1 speed 2 observations.
2.2.2 LWS
We obtained 43–197 µm grating spectra using the LWS instrument. Details of theinstrument and its performance can be found in Clegg et al. (1996) and Swin-yard et al. (1996) respectively. The resolution element was 0.3 µm for the short-wavelength detectors (λ ≤ 93 µm) and 0.6 µm for the long-wavelength detectors(λ ≥ 80 µm). Four samples were taken per resolution element. Between 6 and 26 fastgrating scans were made of each target, depending on source brightness and schedulingconstraints. Each scan consisted of a single 0.5-sec integration per sample.
The data were reduced using the LWS off-line processing software (version 7.0),and then averaging the scans after sigma-clipping to remove the discrepant pointscaused by cosmic-ray hits.
For all our LWS sources, apart from Mira and WX Psc, the Galactic backgroundFIR emission was strong, and off-source spectra were taken to enable the backgroundto be subtracted from the on-source spectrum. Galactic background flux levels wereonly significant for λ ≥ 100 µm. The Galactic background emission is extended com-pared to the LWS beam, and therefore gives rise to strong fringing in both the on-and off-source spectra. The background-subtracted spectra do not show fringing, in-dicating that the OH/IR stars are point-like to the LWS, as expected.
After averaging and background subtraction (if necessary), each observation con-sisted of ten subspectra (one per detector), which were rescaled by small factors togive the consistent fluxes in regions of overlap, and merged to give a final spectrum.
28
2.4 – 197 µm spectroscopy of OH/IR stars
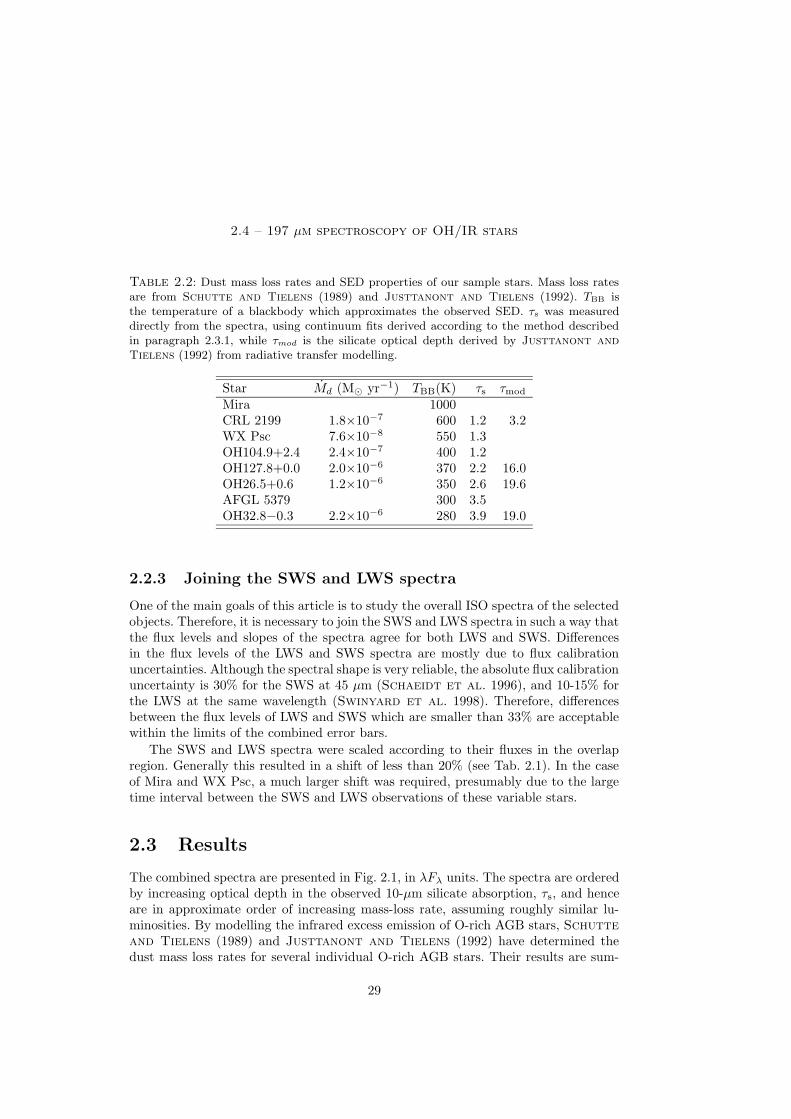
Table 2.2: Dust mass loss rates and SED properties of our sample stars. Mass loss ratesare from Schutte and Tielens (1989) and Justtanont and Tielens (1992). TBB isthe temperature of a blackbody which approximates the observed SED. τs was measureddirectly from the spectra, using continuum fits derived according to the method describedin paragraph 2.3.1, while τmod is the silicate optical depth derived by Justtanont andTielens (1992) from radiative transfer modelling.
Star Md (M� yr−1) TBB(K) τs τmod
Mira 1000CRL 2199 1.8×10⁻⁷ 600 1.2 3.2WX Psc 7.6×10⁻⁸ 550 1.3OH104.9+2.4 2.4×10⁻⁷ 400 1.2OH127.8+0.0 2.0×10⁻⁶ 370 2.2 16.0OH26.5+0.6 1.2×10⁻⁶ 350 2.6 19.6AFGL 5379 300 3.5OH32.8−0.3 2.2×10⁻⁶ 280 3.9 19.0
2.2.3 Joining the SWS and LWS spectra
One of the main goals of this article is to study the overall ISO spectra of the selectedobjects. Therefore, it is necessary to join the SWS and LWS spectra in such a way thatthe flux levels and slopes of the spectra agree for both LWS and SWS. Differencesin the flux levels of the LWS and SWS spectra are mostly due to flux calibrationuncertainties. Although the spectral shape is very reliable, the absolute flux calibrationuncertainty is 30% for the SWS at 45 µm (Schaeidt et al. 1996), and 10-15% forthe LWS at the same wavelength (Swinyard et al. 1998). Therefore, differencesbetween the flux levels of LWS and SWS which are smaller than 33% are acceptablewithin the limits of the combined error bars.
The SWS and LWS spectra were scaled according to their fluxes in the overlapregion. Generally this resulted in a shift of less than 20% (see Tab. 2.1). In the caseof Mira and WX Psc, a much larger shift was required, presumably due to the largetime interval between the SWS and LWS observations of these variable stars.
2.3 Results
The combined spectra are presented in Fig. 2.1, in λFλ units. The spectra are orderedby increasing optical depth in the observed 10-µm silicate absorption, τs, and henceare in approximate order of increasing mass-loss rate, assuming roughly similar lu-minosities. By modelling the infrared excess emission of O-rich AGB stars, Schutteand Tielens (1989) and Justtanont and Tielens (1992) have determined thedust mass loss rates for several individual O-rich AGB stars. Their results are sum-
29

Chapter 2
Figure 2.1: Combined SWS and LWS spectral energy distributions of our programmestars. Flux units are log(λFλ) in Wm−2. The spectra have been shifted along the ordinateto order them in terms of 10-µm optical depth, which correlates roughly with mass-loss rate.The amount by which the spectra were shifted is given in parentheses. The continuum fit toOH104.9 is also included in the figure (dashed line).
30

2.4 – 197 µm spectroscopy of OH/IR stars
marized in Tab. 2.2, where our sources are listed in the same order as in Fig. 2.1.According to Tab. 2.2, our sample is indeed ordered with increasing mass loss rate,excluding WX Psc. The values of τs measured from the spectra are the apparentoptical depth compared to our continuum fit to the overall SED, or to an assumedsilicate emission profile for CRL 2199 and WX Psc. They therefore represent onlya part of the total 10-µm silicate optical depth towards the sources. This is evidentfrom Tab. 2.2, where the measured τs are quoted, along with the 10-µm optical depthsderived for some of our sources by Justtanont and Tielens (1992), using radiativetransfer modelling. A description of the determination of our continuum fit can befound in paragraph 3.1.
All of our sources are dominated by continuum emission from cool dust. The moststriking feature in our spectra is the 10-µm silicate band, which appears in emissionfor Mira, partially self-absorbed for WX Psc and CRL 2199, and in strong absorptionfor the other sources. The overall shape of the observed spectral energy distribution(SED) varies with τs, the sources with high τs showing ‘redder’ SEDs. The SEDs canbe roughly approximated using blackbodies with temperatures ranging from 300 Kfor the most optically-thick sources, to 600 K for the partially self-absorbed sources(see Tab. 2.2).
The 20-µm silicate feature also passes from emission to absorption going downthe sequence in Fig. 2.1, but none of our sources show it as a self-absorbed emissionfeature. Variations in shape as well as optical depth are evident in the 10- and 20-µmabsorption features. Weaker features beyond 20 µm can be discerned: these are fea-tures of water ice and crystalline silicates, and will be discussed below. Evident atshort wavelengths are molecular absorption bands (see Justtanont et al. 1996a,for identifications for the supergiant source NML Cyg, which is not included here)and the 3.1-µm H2O ice absorption feature.
2.3.1 Determination of the continuum
In order to determine the shape and relative strength of the emission and absorptionfeatures we will define a pseudo-continuum, which is assumed to represent featurelessthermal emission from the dust. The continuum-divided spectrum will provide uswith information on the optical depth of the different species that are located outsidethe continuum-producing region and the wavelength at which the material becomesoptically thin. However, one has to be very careful with the physical meaning ofthe pseudo-continuum, since the observed continuum results from several wavelength-dependent dust emissivities, with a large range of dust temperatures, modified bystrong optical depth effects, rather than being simply a superposition of blackbodyenergy distributions corresponding to the physical temperature gradient.
For the determination of the continuum we plotted the energy distribution logFλ
(W m−2 µm−1) against λ (µm). Plotting the data this way one can easily recognizethe general shape of the continuum; the parts of the spectrum where the continuum iswell defined, i.e. the long and short wavelength edges, are emphasized. This makes iteasier to constrain the continuum in the wavelength regions where the strong spectral
31
Chapter 2
features are present. At λ > 50 µm, the dust is optically thin, and only weak emissionfeatures are present. At λ < 7 µm, the radiation from the stellar photosphere ispartially (for the Miras) or completely (OH/IR stars) absorbed by molecular linesand the high dust opacity towards the central star. When a spline fit is performedin logFλ space, we can thus constrain the continuum by using the known long andshort wavelength continuum contributions as reference points. Applying spline fittingwith the same reference points in other parameter spaces (λlogFλ space, Fν space,logFν space etc.) shows that all the fits vary within 10% (in flux) with respect to theadopted pseudo-continuum in the 10–20 µm region.
2.3.2 Description of the spectrum
Figs. 2.2–2.4 show the observed spectra after division by the adopted continuum. Awealth of interesting features can be recognized in the spectra. At the shortest wave-lengths, from λ = 2.38 – ∼7 µm, see Fig. 2.2, the spectrum is dominated by molecularabsorption bands and the effects of dust absorption. In Mira and the intermediate typestars (WX Psc and CRL 2199), strong absorption features due to a blend of H2O andCO are present from 2.38–∼3.3 µm (2.38–∼3.8 µm in the case of WX Psc), see Fig. 2.2.Absorption due to SiO is found in some objects around 4.0 µm, most prominently inWX Psc and OH104.9. In most of our spectra we find clear absorption features ofgaseous CO2 at 4.3 µm. CO line absorption around 4.5 µm is found in all our spec-tra. Throughout the whole 2.38–7 µm wavelength region, H2O absorption lines arepresent; very strong lines of gaseous H2O are found at 6.60–6.63 µm. Yamamuraet al. (1999) have performed a detailed study of the water features in the spectrumof Mira; Mira is also the only source in our sample that shows OH absorption linesin the 2.5–3.5 µm region. In the high mass-loss rate objects, water ice features arepresent as well, at 3.1 and (possibly) 6.0 µm. The ice features will be discussed in thenext section.
The 7–25 µm region (see Fig. 2.3 on p. 34) is dominated by the strong features ofamorphous silicates. The 9.7-µm feature (ranging from 8 to 12–13 µm) and the 18 µmfeature (ranging from 15 to 20–25 µm) are very strong bands that occur in emission or(self-)absorption. Crystalline silicate features also occur in the same wavelength rangesbut are usually much weaker, so the actual shape of the observed silicate bands is dueto a blend of crystalline and amorphous silicates. Absorption by molecular SiO canbe seen at 8 µm, on the wing of the silicate feature. Around 15 µm the spectrum ofMira exhibits some sharp emission lines due to CO2.
Longwards of 25 µm (see Fig. 2.4 on p. 35), most spectral features occur in emis-sion. The only absorption feature is the OH pumping line at 34.6 µm, which is detectedin some of the sample stars. Groups of crystalline silicate emission features occur near28, 33, and 43 µm, the latter probably being a blend with the 43 µm crystalline waterice feature, while a broad feature, which we ascribe to water ice, peaks around 62 µm.Superposed on this is a sharp feature at 69 µm, due to forsterite.
Several sources show emission features near 47.5 and 52 µm. The longitudinaloptical band of water ice lies close to 52 µm (Bertie and Whalley 1967), but in
32
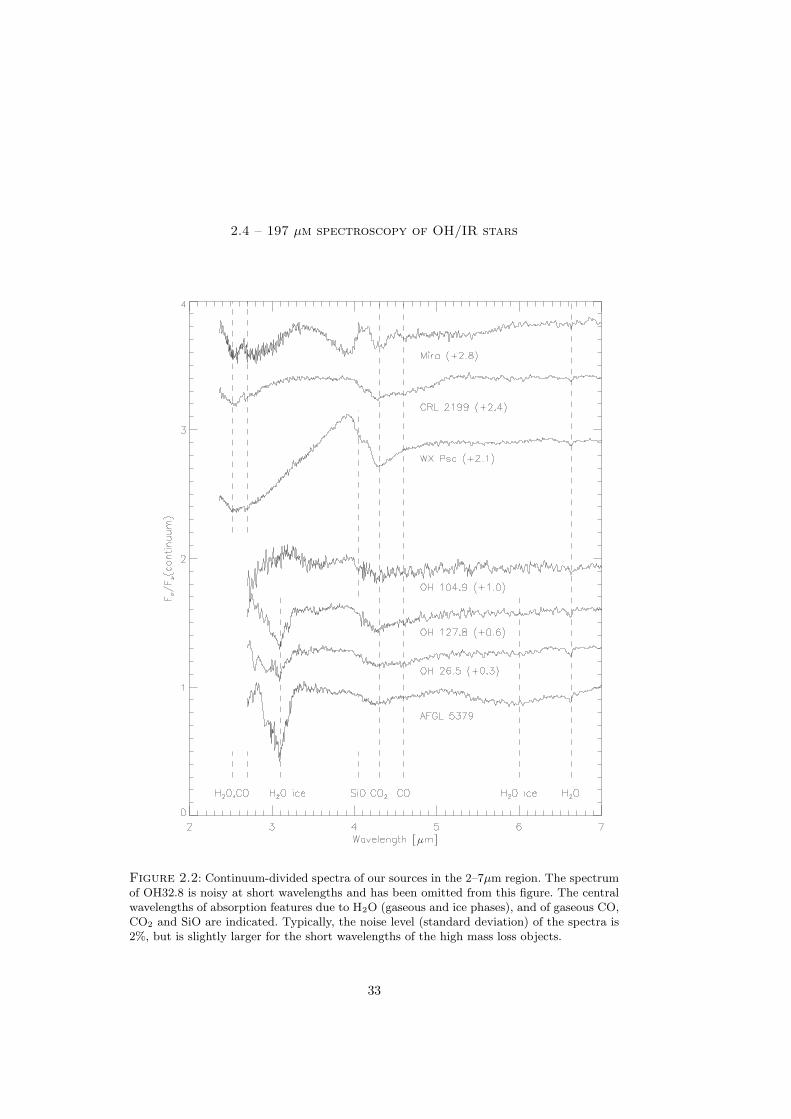
2.4 – 197 µm spectroscopy of OH/IR stars
Figure 2.2: Continuum-divided spectra of our sources in the 2–7µm region. The spectrumof OH32.8 is noisy at short wavelengths and has been omitted from this figure. The centralwavelengths of absorption features due to H2O (gaseous and ice phases), and of gaseous CO,CO2 and SiO are indicated. Typically, the noise level (standard deviation) of the spectra is2%, but is slightly larger for the short wavelengths of the high mass loss objects.
33
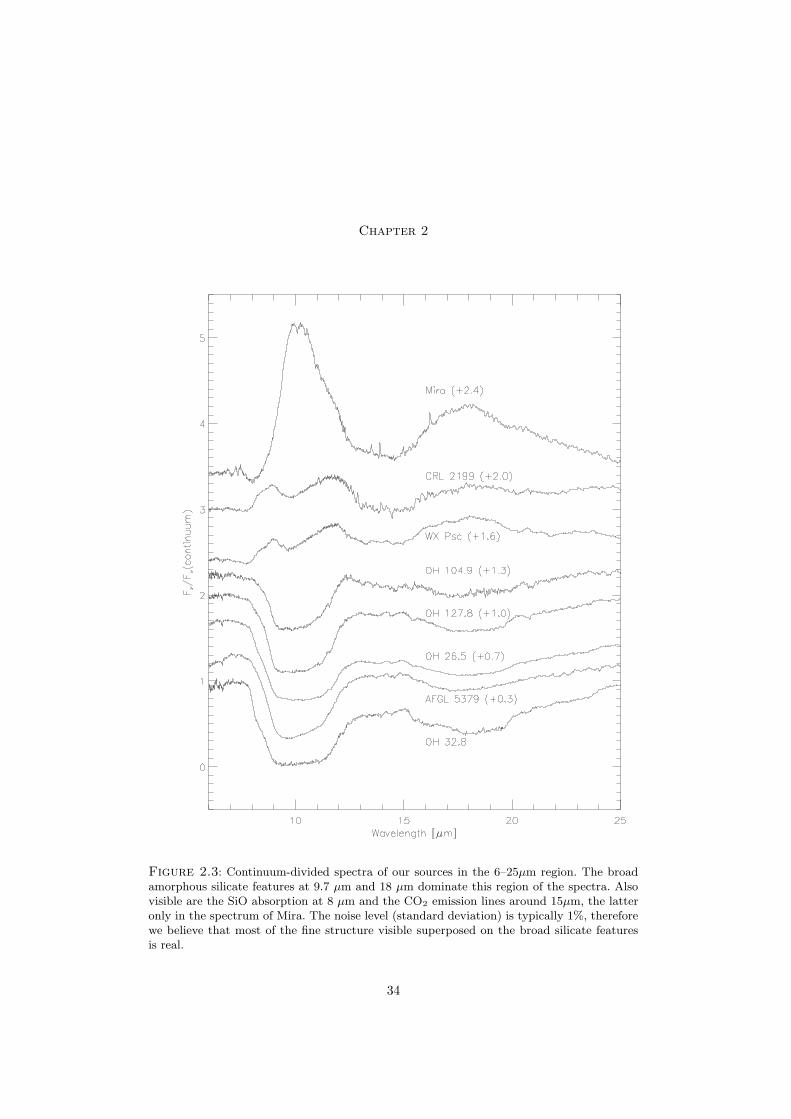
Chapter 2
Figure 2.3: Continuum-divided spectra of our sources in the 6–25µm region. The broadamorphous silicate features at 9.7 µm and 18 µm dominate this region of the spectra. Alsovisible are the SiO absorption at 8 µm and the CO2 emission lines around 15µm, the latteronly in the spectrum of Mira. The noise level (standard deviation) is typically 1%, thereforewe believe that most of the fine structure visible superposed on the broad silicate featuresis real.
34
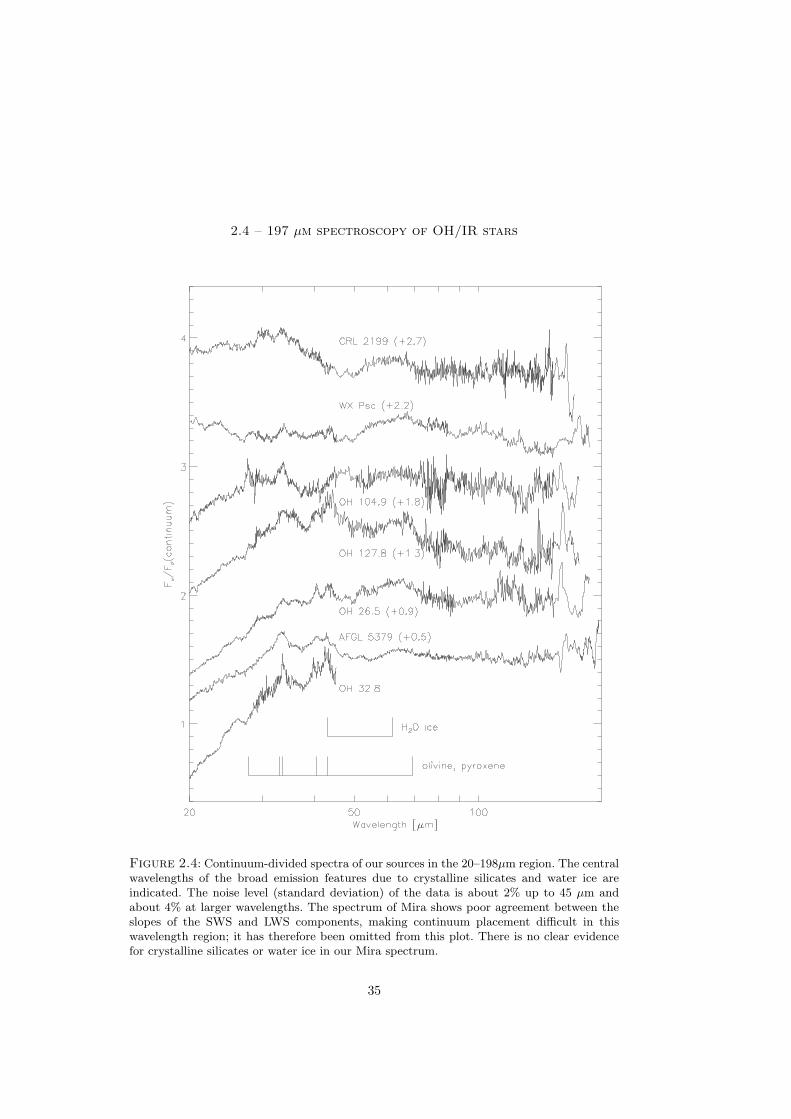
2.4 – 197 µm spectroscopy of OH/IR stars
Figure 2.4: Continuum-divided spectra of our sources in the 20–198µm region. The centralwavelengths of the broad emission features due to crystalline silicates and water ice areindicated. The noise level (standard deviation) of the data is about 2% up to 45 µm andabout 4% at larger wavelengths. The spectrum of Mira shows poor agreement between theslopes of the SWS and LWS components, making continuum placement difficult in thiswavelength region; it has therefore been omitted from this plot. There is no clear evidencefor crystalline silicates or water ice in our Mira spectrum.
35

Chapter 2
laboratory data it is only ever seen as a shoulder on the 43-µm band (e.g. Smith et al.1994), not a clearly-separated feature. The observed feature is therefore unlikely tobe the longitudinal ice band. Malfait et al. (1999) suggested that montmoril-lonite, which gave a good fit to the broad 100-µm emission feature in the spectrumof HD 142527, is a possible carrier of the 47 and 50µm features in this source. Theplanetary nebula NGC 6302 also shows the 47, 53 and 100 µm bands (Molsteret al. 2001a). If the three features do have a common carrier, the apparent absenceof the 100 µm band in the spectra presented here may be due to a difference in dusttemperature.
As well as broad emission bands, unresolved emission lines can be detected in thelong-wavelength regions of the least noisy of our spectra, (e.g. WX Psc and AFGL5379). Most of these lines are pure rotational lines of water vapour. The 157.7-µm[C ii] line is also visible in most of our sources; this is the residual Galactic background[C ii] emission after subtraction of the off-source spectrum. In the case of AFGL 5379,the [C ii] line is seemingly in absorption: again, this is due to imperfect cancellationof the background emission.
2.3.3 Water Ice
Water ice is an important component of the solid-phase material in cool astronomi-cal sources. Its spectrum shows bands at 3.1, 6.0, 11-12, 43 and 62 µm. The 3.1-µmstretching band is seen (always in absorption) in the spectra of many highly-embeddedyoung stars (e.g. Whittet et al. 1988) and in some OH/IR stars (e.g. Meyeret al. 1998). Its formation in the circumstellar envelopes of OH/IR stars has beendiscussed in particular by Jura and Morris (1985). Before the ISO mission, thefar-IR ice bands had been observed in emission in a small number of sources includ-ing the OH/IR stars OH26.5, OH127.8 and OH231.8+4.2 (Omont et al. 1990, andreferences therein). ISO spectra have shown the 43- and 62-µm ice bands in emis-sion in various objects (Barlow 1998), such as the planetary nebulae CPD−56o8032(Cohen et al. 1999) and NGC 6302 (Molster et al. 2001a), the post Red Super-giant source AFGL 4106 (Molster et al. 1999a) and Herbig Ae/Be stars (Watersand Waelkens 1998; Malfait et al. 1998, 1999), while the 43-µm band has beendetected in absorption towards the highly-embedded sources AFGL 7009 and IRAS19110+1045 (Dartois et al. 1998; Cox and Roelfsema 1999). Both of the far-IRbands can be blended with crystalline silicate emission, but examination of the shapesand positions of the observed bands can distinguish between silicate and ice emission.
The new ISO spectra have significantly better resolution and sensitivity thanthe earlier KAO data. Fig. 2.5 shows attempts to fit the 30–90 µm region of our(continuum-subtracted) spectra, using a spectral synthesis routine kindly providedby Dr T. Lim (priv. comm.). This routine takes absorption (or emission) efficienciesfor materials of interest, along with user-defined temperatures and relative amounts,and produces the resulting spectrum for optically-thin emission from the individualmaterials, as well the total emission from all the materials (shown as the thin solidline in Fig. 2.5). The materials used to fit the OH/IR star spectra were forsterite,
36
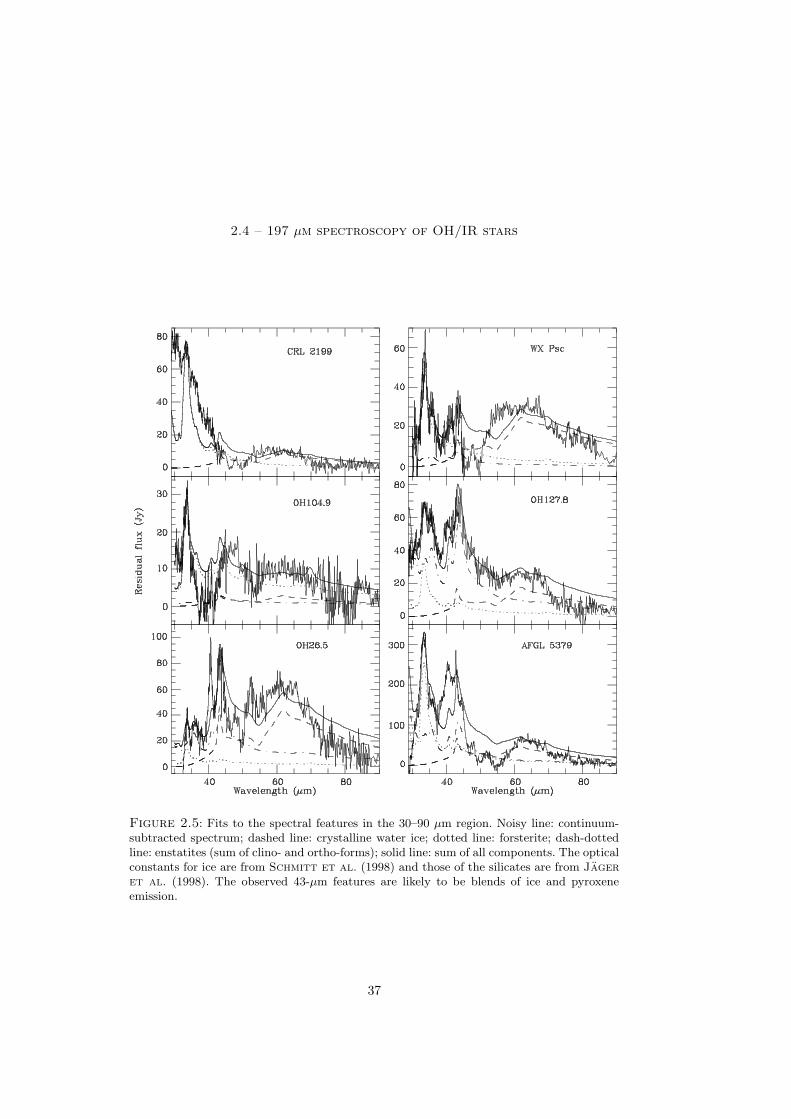
2.4 – 197 µm spectroscopy of OH/IR stars
Figure 2.5: Fits to the spectral features in the 30–90 µm region. Noisy line: continuum-subtracted spectrum; dashed line: crystalline water ice; dotted line: forsterite; dash-dottedline: enstatites (sum of clino- and ortho-forms); solid line: sum of all components. The opticalconstants for ice are from Schmitt et al. (1998) and those of the silicates are from Jageret al. (1998). The observed 43-µm features are likely to be blends of ice and pyroxeneemission.
37
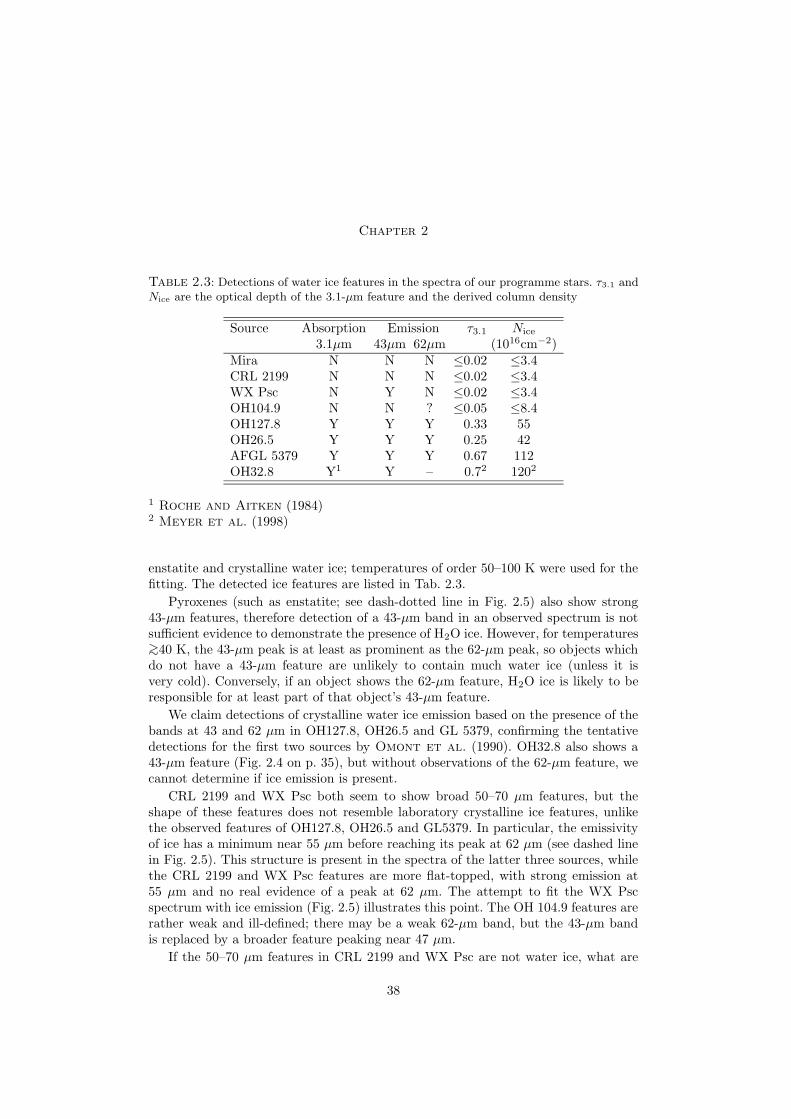
Chapter 2
Table 2.3: Detections of water ice features in the spectra of our programme stars. τ3.1 andNice are the optical depth of the 3.1-µm feature and the derived column density
Source Absorption Emission τ3.1 Nice
3.1µm 43µm 62µm (1016cm−2)Mira N N N ≤0.02 ≤3.4CRL 2199 N N N ≤0.02 ≤3.4WX Psc N Y N ≤0.02 ≤3.4OH104.9 N N ? ≤0.05 ≤8.4OH127.8 Y Y Y 0.33 55OH26.5 Y Y Y 0.25 42AFGL 5379 Y Y Y 0.67 112OH32.8 Y1 Y – 0.72 1202
1 Roche and Aitken (1984)2 Meyer et al. (1998)
enstatite and crystalline water ice; temperatures of order 50–100 K were used for thefitting. The detected ice features are listed in Tab. 2.3.
Pyroxenes (such as enstatite; see dash-dotted line in Fig. 2.5) also show strong43-µm features, therefore detection of a 43-µm band in an observed spectrum is notsufficient evidence to demonstrate the presence of H2O ice. However, for temperatures>∼40 K, the 43-µm peak is at least as prominent as the 62-µm peak, so objects whichdo not have a 43-µm feature are unlikely to contain much water ice (unless it isvery cold). Conversely, if an object shows the 62-µm feature, H2O ice is likely to beresponsible for at least part of that object’s 43-µm feature.
We claim detections of crystalline water ice emission based on the presence of thebands at 43 and 62 µm in OH127.8, OH26.5 and GL 5379, confirming the tentativedetections for the first two sources by Omont et al. (1990). OH32.8 also shows a43-µm feature (Fig. 2.4 on p. 35), but without observations of the 62-µm feature, wecannot determine if ice emission is present.
CRL 2199 and WX Psc both seem to show broad 50–70 µm features, but theshape of these features does not resemble laboratory crystalline ice features, unlikethe observed features of OH127.8, OH26.5 and GL5379. In particular, the emissivityof ice has a minimum near 55 µm before reaching its peak at 62 µm (see dashed linein Fig. 2.5). This structure is present in the spectra of the latter three sources, whilethe CRL 2199 and WX Psc features are more flat-topped, with strong emission at55 µm and no real evidence of a peak at 62 µm. The attempt to fit the WX Pscspectrum with ice emission (Fig. 2.5) illustrates this point. The OH 104.9 features arerather weak and ill-defined; there may be a weak 62-µm band, but the 43-µm bandis replaced by a broader feature peaking near 47 µm.
If the 50–70 µm features in CRL 2199 and WX Psc are not water ice, what are
38

2.4 – 197 µm spectroscopy of OH/IR stars
they? They may simply be instrumental artefacts: Fig. 2.1 (see p. 30) illustrates howthe spectra are dominated by the steep downward slope of the SED, and that spec-tral features around 60 µm are small perturbations on this overall trend. (Clearly,this statement also holds for the features which we believe to be real.) Experimentswith adopting different LWS dark currents and with methods for dealing with detec-tor memory effects made little difference to the spectra. The clino-pyroxene opticalconstants of Koike et al. (1993) show a broad feature around 60 µm (see also Co-hen et al. 1999), but this peaks at longer wavelengths than the crystalline water iceband, and so is not a likely carrier for the CRL 2199 and WX Psc features. Similarly,the 62-µm features in OH127.8, OH26.5 and GL 5379 do not need an additional long-wavelength component, so the Koike pyroxene is not necessary to fit these spectra.The Jager et al. (1998) laboratory data do not reproduce the broad 60-µm bandseen in the Koike data, so the feature may not be real.
In general, we find that the observed features in Fig. 2.5 are narrower than our fits,suggesting that we have overestimated the continuum level in this wavelength region,or that the optical constants we used do not adequately represent the circumstellarmaterials.
The sources in which we detect the ice emission features are the four stars withthe deepest 10-µm silicate absorption, and hence presumably the highest mass-lossrates. These same stars also show the 3.1-µm absorption band (see Fig. 2.2). OH32.8was too faint at 3 µm to be detected by the SWS, but the 3.1-µm ice absorptionfeature has been detected in ground-based spectra (Roche and Aitken 1984). Thesources with self-absorbed silicate emission features, do not appear to show ice fea-tures. OH104.9, which shows a relatively shallow silicate absorption, may show a weak3.1-µm absorption, but it is hard to discern, because the spectrum is noisy at shortwavelengths.
The 6.0-µm band of water ice is significantly weaker than the 3.1µm band (see e.g.Moore 1999). The spectra of our most heavily-obscured sources, OH32.8, AFGL 5379and OH26.5, show a weak depression around 6 µm, but this wavelength region is veryrich in gaseous H2O lines, making it difficult to ascribe the observed feature to iceabsorption.
Ice formation requires cool temperatures and sufficient shielding from stellar andinterstellar radiation (e.g. Whittet et al. 1988). The high densities in the (general)outflow that accompany large mass-loss rates may provide the required shielding.Alternatively, enhanced densities could be provided by the formation of a circumstellardisk in the superwind phase, or by inhomogeneous mass loss, such as is apparent instudies of H2O and OH maser clumps (e.g. Richards et al. 1999). As discussed byOmont et al. (1990), the presence of the 63-µm band requires that the water ice isat least partially crystalline, implying that the ice remained relatively warm (>∼100 K)for long enough to allow crystalline reorganization to take place.
Optical depths and column densities for the detected 3.1-µm features are givenin Tab. 2.3. Meyer et al. (1998) have proposed that the ice column density cor-relates better with the ratio of mass-loss rate to luminosity (M/L) than with Malone. Adopting reasonable estimates (based on values in the literature) for these pa-
39

Chapter 2
rameters, our results support the relation between ice column density and log M/Lproposed by Meyer et al. (see their Fig. 3). However, given the uncertainties inboth parameters, and that the luminosity changes significantly with the variabilityphase, the relationship should be treated with some caution.
OH32.8 shows the 3.1-µm ice band, and an 11-µm absorption feature in the wingof the silicate absorption feature (Roche and Aitken 1984) which was attributedto the libration mode of water ice. Justtanont and Tielens (1992) were able tomodel ground-based and IRAS observations of this source using silicate grains withwater-ice mantles, which give a much broader 10-µm absorption feature than do baresilicate grains.
The broad 11-µm feature is clearly seen in the five sources with strong 10-µmabsorption (Fig. 2.1 on p. 30). It appears strongly in OH26.5, OH104.9, OH127.8 andOH32.8, and as an inflection near 11.5 µm in AFGL 5379. The contribution of thisfeature to the overall 10-µm absorption profile therefore does not appear to correlatefully with the presence of the other water ice bands: AFGL 5379 shows strong far-IRice emission and 3.1-µm absorption, but only weak 11-µm absorption, while OH104.9shows strong 11-µm absorption but has weak or absent far-IR and 3.1-µm features.
Smith and Herman (1990) found an 11-µm absorption feature in the spectrum ofanother OH/IR star, OH138.0+7.3, which does not show any ice absorption at 3.1 µm.Since the 3.1-µm stretching mode is intrinsically stronger than the libration mode,Smith and Herman concluded that the 11-µm feature observed towards OH138.0 isnot produced by water ice, and suggested that it is due to partially-crystalline silicates.Another possibility is that spectra like that of OH138.0 are the absorption counterpartof the Little-Marenin and Little (1990) ‘Sil++’ or ‘Broad’ emission features,which show an emission component at ∼11 µm on the wing of the silicate feature.These features have been ascribed to crystalline silicates or amorphous alumina grains(see e.g. Sloan and Price 1998). Clearly, full radiative-transfer modelling would beuseful to determine whether ice mantles can indeed explain the range of 11-µm featuresseen, or whether other grain components are necessary.
The presence of strong water ice features in our spectra indicates that a substantialamount of the H2O in the circumstellar envelopes may be depleted into the solidphase. This would decrease the amount of gas-phase H2O (and photodissociated OH)in the outer regions of the circumstellar envelope which can be detected by maserand thermal emission, Water maser lines are observed to be relatively weaker inOH/IR stars than in objects with lower mass-loss rates (e.g. Likkel 1989). Collisionalquenching due to the high densities in the inner parts of the outflow is thought tosuppress the maser action; our results indicate that depletion into the solid (ice) phasemay also play a role.
CO ice shows features near 4.7 µm (e.g. Chiar et al. 1995): these are not seenin our spectra, but a broad absorption band around 4.3 µm, due to gas-phase CO isseen. This band is significantly broader than the 4.27-µm CO2 ice absorption featureseen in molecular clouds (e.g. de Graauw et al. 1996b). We see no evidence ofCO2 ice at 4.27 µm. CO2 ice shows another strong feature at 15 µm; our spectrashow some structure near this wavelength (Fig. 2.6), but this may be an artefact of
40
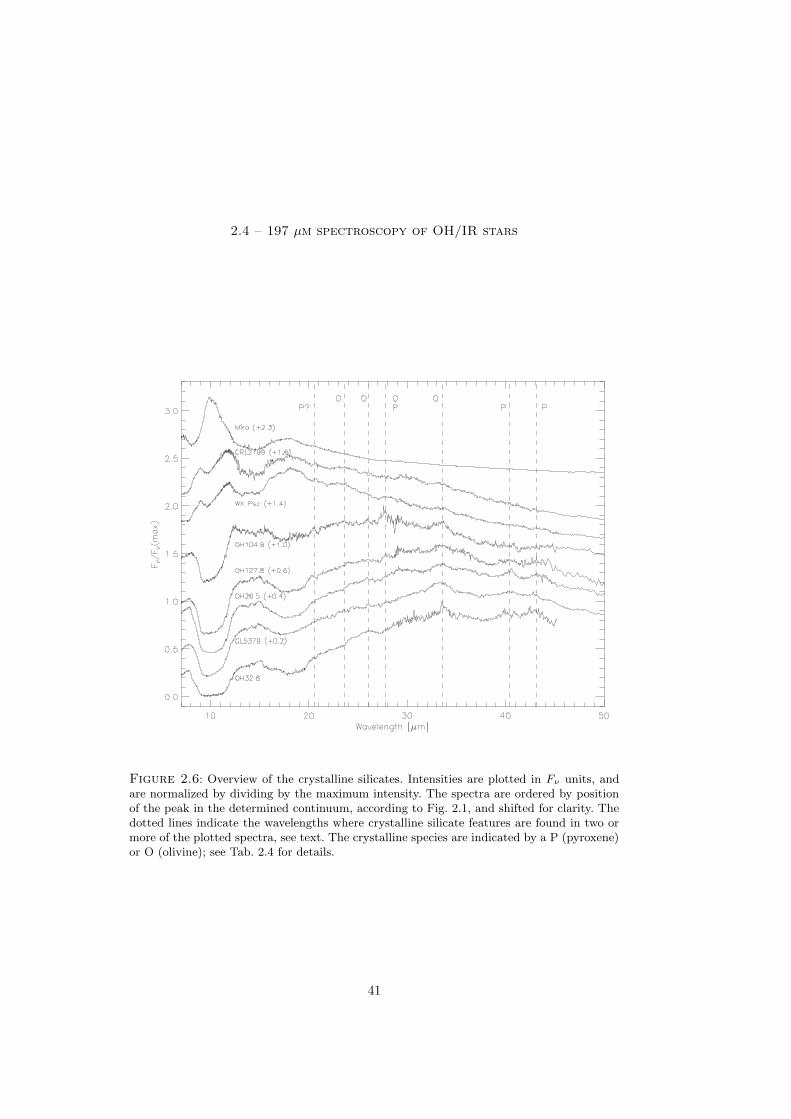
2.4 – 197 µm spectroscopy of OH/IR stars
Figure 2.6: Overview of the crystalline silicates. Intensities are plotted in Fν units, andare normalized by dividing by the maximum intensity. The spectra are ordered by positionof the peak in the determined continuum, according to Fig. 2.1, and shifted for clarity. Thedotted lines indicate the wavelengths where crystalline silicate features are found in two ormore of the plotted spectra, see text. The crystalline species are indicated by a P (pyroxene)or O (olivine); see Tab. 2.4 for details.
41

Chapter 2
the instrument or data-reduction process.
2.3.4 Silicates
For these objects, most of the energy radiated by the central star is absorbed bythe circumstellar dust shell and re-radiated as thermal emission, predominantly byamorphous silicates. Amorphous silicates have strong features at 10 and 18 µm. Thecurrent objects can be ordered by increasing optical depth of those features, whichagrees with ordering by increasing wavelength of the peak of the SED. When the10-µm feature becomes optically thick, the energy from the central star must bere-radiated at even longer wavelengths, therefore the peak position shifts towards30 µm (see Fig. 2.1). It is believed that the low mass loss rate Miras evolve intohigh mass loss rate OH/IR stars, while the IRAS colors indicate that the peak of thedust emission shifts towards longer wavelengths (van der Veen and Habing 1988).With increasing mass loss rate the characteristic density in the wind will increase,increasing the optical depth towards the central star. This evolution can be found inthe oxygen-rich AGB stars in our sample.
In Fig. 2.6 the objects are plotted in the same order as in Fig. 2.1, however,the intensities are now in Fν units, and normalized with respect to the measuredmaximum intensity. The 10-µm feature of Mira is completely in emission; for WX Pscand CRL 2199, the 10-µm feature is partially self-absorbed. For the OH/IR starsOH104.9, OH127.8, OH26.5, AFGL 5379 and OH32.8, the 10-µm feature is completelyin absorption, with optical depths ranging from 1.1 for OH104.9 to 3.6 for OH32.8. Adetailed analysis of the amorphous silicate features will be presented in a future paper(Kemper et al., in prep.). As the optical depth increases, some structure becomesapparent in the 20–45 µm region.
In the lower mass-loss rate objects, strong emission features due to amorphoussilicates are present, but there are no obvious narrow features at λ > 20 µm. Forthe redder objects, we find that the amorphous silicates features are (self-)absorbed,and that some structure is apparent at wavelengths λ > 20 µm. These narrow fea-tures can be identified as crystalline silicates, both olivines and pyroxenes (Waterset al. 1996). The identifications are based on laboratory spectra of crystalline sil-icates (Jager et al. 1998; Koike et al. 1993; Koike and Shibai 1998) andsimilar bands seen in other objects on which detailed studies have been performed,i.e. AFGL 4106 (Molster et al. 1999a) and to HD 45677 (Voors 1999). Thedashed lines in Fig. 2.6 represent the position of some important crystalline silicatecomplexes, which are listed in Tab. 2.4. These crystalline silicate features are found inemission at the longest wavelengths but sometimes in absorption at somewhat shorterwavelengths, for example the 23.6 µm olivine feature in OH32.8 and in OH26.5 (seeFig. 2.6). The OH/IR stars presented here are the only objects known to exhibitcrystalline silicates in absorption outside the 8-13 µm wavelength region. For OH32.8this was already reported by Waters and Molster (1999) in comparison withAFGL 4106. The presence of the most important crystalline silicate features is indi-cated in Tab. 2.4 for all the sources in our sample. Note that those features are detected
42
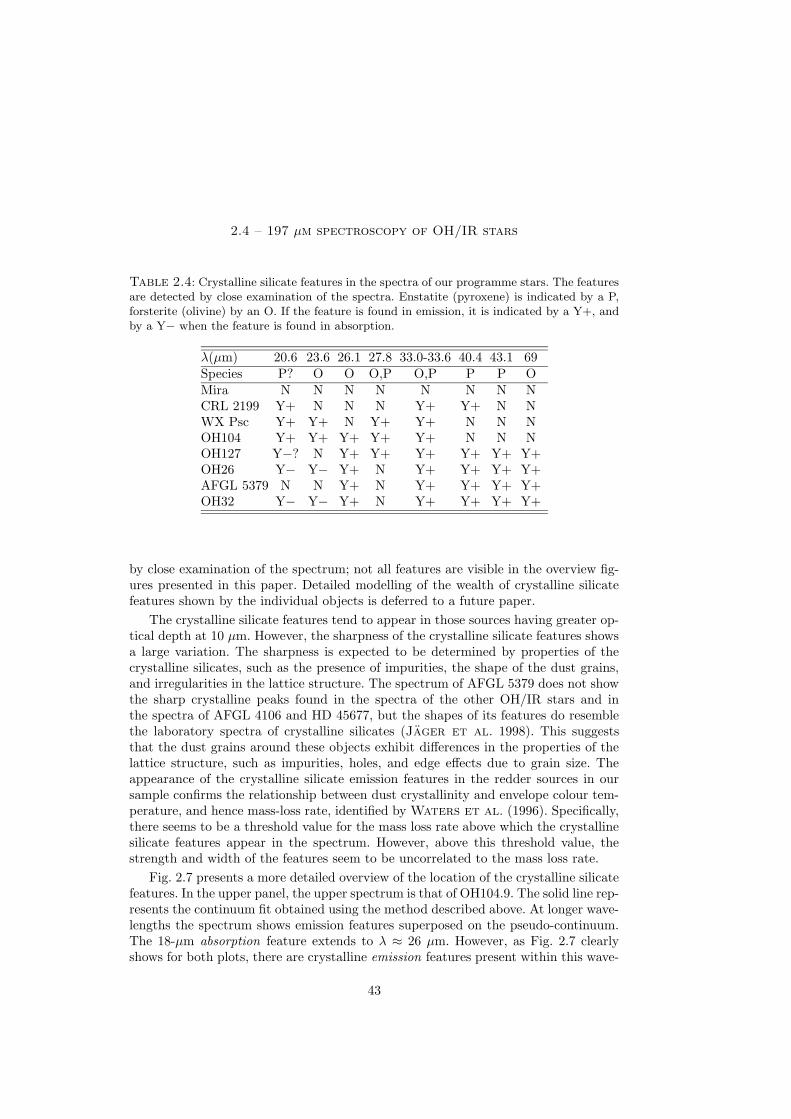
2.4 – 197 µm spectroscopy of OH/IR stars
Table 2.4: Crystalline silicate features in the spectra of our programme stars. The featuresare detected by close examination of the spectra. Enstatite (pyroxene) is indicated by a P,forsterite (olivine) by an O. If the feature is found in emission, it is indicated by a Y+, andby a Y− when the feature is found in absorption.
λ(µm) 20.6 23.6 26.1 27.8 33.0-33.6 40.4 43.1 69Species P? O O O,P O,P P P OMira N N N N N N N NCRL 2199 Y+ N N N Y+ Y+ N NWX Psc Y+ Y+ N Y+ Y+ N N NOH104 Y+ Y+ Y+ Y+ Y+ N N NOH127 Y−? N Y+ Y+ Y+ Y+ Y+ Y+OH26 Y− Y− Y+ N Y+ Y+ Y+ Y+AFGL 5379 N N Y+ N Y+ Y+ Y+ Y+OH32 Y− Y− Y+ N Y+ Y+ Y+ Y+
by close examination of the spectrum; not all features are visible in the overview fig-ures presented in this paper. Detailed modelling of the wealth of crystalline silicatefeatures shown by the individual objects is deferred to a future paper.
The crystalline silicate features tend to appear in those sources having greater op-tical depth at 10 µm. However, the sharpness of the crystalline silicate features showsa large variation. The sharpness is expected to be determined by properties of thecrystalline silicates, such as the presence of impurities, the shape of the dust grains,and irregularities in the lattice structure. The spectrum of AFGL 5379 does not showthe sharp crystalline peaks found in the spectra of the other OH/IR stars and inthe spectra of AFGL 4106 and HD 45677, but the shapes of its features do resemblethe laboratory spectra of crystalline silicates (Jager et al. 1998). This suggeststhat the dust grains around these objects exhibit differences in the properties of thelattice structure, such as impurities, holes, and edge effects due to grain size. Theappearance of the crystalline silicate emission features in the redder sources in oursample confirms the relationship between dust crystallinity and envelope colour tem-perature, and hence mass-loss rate, identified by Waters et al. (1996). Specifically,there seems to be a threshold value for the mass loss rate above which the crystallinesilicate features appear in the spectrum. However, above this threshold value, thestrength and width of the features seem to be uncorrelated to the mass loss rate.
Fig. 2.7 presents a more detailed overview of the location of the crystalline silicatefeatures. In the upper panel, the upper spectrum is that of OH104.9. The solid line rep-resents the continuum fit obtained using the method described above. At longer wave-lengths the spectrum shows emission features superposed on the pseudo-continuum.The 18-µm absorption feature extends to λ ≈ 26 µm. However, as Fig. 2.7 clearlyshows for both plots, there are crystalline emission features present within this wave-
43

Chapter 2
Figure 2.7: The upper panel shows the spectrum of OH104.9 (upper spectrum), togetherwith its continuum fit (solid line). A fit to the 18-µm absorption feature is also plotted.The lower spectrum in the upper panel is the continuum subtracted spectrum of AFGL 4106(Molster et al. 1999a). The dashed lines indicate a correlation between crystalline silicateemission features in both spectra. The lower panel is a close up of the upper panel, for thewavelength region 14 – 26 µm; the spectrum of AFGL 4106 is shifted upward for clarity. Thecrystalline species is indicated on the plot by the symbols P (pyroxene) and O (olivine).
44
2.4 – 197 µm spectroscopy of OH/IR stars
length region, in particular, the 17.5–20 µm complex. For reference, the continuum-subtracted spectrum of AFGL 4106 (Molster et al. 1999a) is also plotted. The20.6 µm emission feature is probably related to crystalline silicates, although it isnot yet identified (Molster et al. 1999a; Voors 1999). These OH/IR star spectraare the first to show crystalline silicates in emission simultaneously with amorphoussilicates in absorption in the same wavelength region.
The presence of crystalline emission features in the spectrum of OH104.9, at wave-lengths where the amorphous dust component is still in absorption, implies that thecrystalline silicate dust must have a different spatial distribution than the amorphoussilicate dust. We consider two possible geometries: spherical and axi-symmetrical.
For the case of a spherically symmetric distribution, the crystalline dust can havea different radial distribution and be located further out in the envelope than theamorphous dust. The SWS and LWS beam sizes are much larger than the angularsize of the dust shells of these OH/IR stars, so the amorphous silicate absorption canoriginate from the entire dust shell, while the crystalline silicate emission can arisefrom the cool outer layers of the dust shell, where the material is optically thin. If thecrystalline silicates are located further out, we can conclude that the crystalline andamorphous dust has not formed at the same time, but that the amorphous dust an-nealed as it moved away from the star. This could imply that lower mass loss rate Miravariables could in principle be able to form crystalline material as well, but that wecannot detect it because the column densities are not high enough. However, giventhat higher temperatures are required for annealing amorphous silicates into crys-talline silicates than are required for the formation of amorphous silicates themselves,it does seem unlikely that crystalline silicate grains could be formed further out in anoutflow than amorphous silicate grains. One possibility is that some small fraction ofthe particles which formed in an outflow (perhaps the smallest particles) immediatelyannealed into crystalline silicates in the inner, hottest regions. The large total col-umn density of amorphous silicate grains would lead to net absorption in the 10- and18-um bands and thus obscure these hot crystalline silicates. When these particlesare cooled while flowing outwards, the strong emission features of crystalline silicatesat wavelengths longer than ∼ 15 µm can be seen superposed on the amorphous dustfeatures.
An alternative scenario for the observed behaviour is that OH/IR stars possessa dust disk, in addition to a more spherically symmetric outflow. Two alternativessuggest themselves:
• Crystalline silicates that have formed and moved out from the inner regions of theoutflow produce emission bands that are seen superposed against the continuumemission and amorphous silicate features that arise from the disk. This wouldrequire that those OH/IR stars that have the largest 10-µm amorphous silicateoptical depths are the ones whose disks are seen most nearly edge-on.
• The crystalline silicates are located in the disk, while the amorphous silicatesare located mainly in the outflow and thus have a more spherically symmetric
45
Chapter 2
distribution, with the amorphous silicate absorption features arising from opticallythick lines of sight towards the central star. Depending on the inclination angleof the system, the crystalline silicate features can be seen in emission. When thedisk is viewed face-on, the crystalline silicate features would be optically thin.Radiation from most of the disk surface reaches the observer via lines of sightwhich pass through only the outer regions of the spherical dust shell, where theamorphous material is not optically thick.
Two mechanisms can be invoked to explain the high abundance of crystallinesilicates in a disk. Below the so-called glass temperature, only amorphous silicatescondense, while crystalline silicates can form at temperatures greater than the glasstemperature. At the high densities occurring in a disk, condensation of silicates will beable to proceed at higher temperatures than usual (Gail and Sedlmayr 1999) andthe temperature range in which it is possible to condense crystalline silicates is thusbroadened. In our current sample there is empirical evidence for a correlation betweencrystallinity and density. Second, if there is amorphous material present in the disk,this can be transformed into crystalline material by annealing. In order to allow theannealing process of the silicates to proceed, the dust-forming region should not cooltoo rapidly. An orbiting (or slowly outflowing) disk provides the required stability andkeeps the amorphous silicates relatively close to the central star for a sufficiently longtime for the annealing into crystalline material to occur. Both the above mechanismsprovide circumstances that allow the formation of crystalline silicates, which wouldnot be the case if the stellar wind removes the newly-formed silicates at the outflowvelocity, such that they rapidly cool.
In order to study the spatial distribution of both dust components in more de-tail, spectral mapping of the OH/IR stars is necessary. Then we may be able toput constraints on the spatial distribution, and determine the annealing time, of thecrystalline dust, using travel time and stability arguments. Using laboratory dataon annealing time scales, we may be able to determine physical parameters such astemperature and density in the circumstellar dust shell, thus helping to clarify theAGB mass loss phase of stellar evolution. Recent high-resolution imaging of the dustaround evolved stars, such as Mira (Lopez et al. 1997) and VY CMa (Monnieret al. 1999), has shown that substantial inhomogeneities exist in the dusty out-flows; our spectra suggest that the dust around OH/IR stars may also show complexmorphologies.
For any geometry of the circumstellar shell, the amorphous–crystalline volumeratio could also be affected by grain-grain collisions. Such collisions have long beenrecognised as important processes for the evolution of grains in circumstellar envelopes(see e.g. Biermann and Harwit 1980) and in the interstellar medium (Jones et al.1996). The shock wave driven into the two grains by the collision can lead to vapor-ization, the formation of high pressure phases, melting, annealing, and shatteringdepending on the pressures involved (cf., Tielens et al. 1994). Experiments showthat at a relative collision velocity of ∼1 km s−1, mechanical effects (shattering, craterformation) become important. Thermal effects such as crystallization, involving the
46
2.4 – 197 µm spectroscopy of OH/IR stars
intergranular nucleation of new, strain–free grains in a previously highly deformed ma-trix start at somewhat higher velocities (∼ 5 km s−1; 700 kbar) and are never verypervasive. Above ∼ 7 km s−1 (1 Mbar), melting followed by rapid quenching leads toglass formation (Bauer 1979; Schaal et al. 1979). Thus, these experiments implythat crystallization only occurs over a very narrow collision velocity range and is notvery efficient. Of course, if the projectile/target size ratio is large, even high velocityimpacts will lead to a small volume fraction of the target grain passing through theregime where recrystallization can occur when the shock wave expands.
Given the grain velocity profile in AGB outflows (Habing et al. 1994), poten-tially crystallizing grain-grain collisions will be largely confined to the accelerationzone at the base of the flow. An important objection against annealing through grain-grain collisions is that the cooling time scales of dust grains are very short comparedto the annealing time scales. Therefore the silicate dust grains solidify in the amor-phous state (Molster et al. 1999b). The annealing process can be described asa three dimensional random walk diffusion process on a cubic lattice (Gail 1998),which provides an estimate of the annealing time scale as a function of dust temper-ature. At a Td = 2000 K the annealing time scale is ∼ 1 s and strongly increases forlower temperatures. The cooling time scale can be derived under the assumption thatthe power emitted by the dust grain is given by the Planck function, modified by thePlanck mean of the absorption efficiency Qabs. By comparing the emitted power tothe internal heat of the grain one finds for the cooling time scales τcool ∼ 10−3 s forTd = 2000 K and τcool ∼ 0.02 s for Td = 800 K. In agreement with the experiments,only a small fraction of crystallized material is expected due to the grain-grain col-lisional shock loading. Final assessment of the viability of this mechanism for theformation of crystalline silicates in AGB outflows has to await detailed modeling ofsuch grain-grain collisions in circumstellar outflows (Kemper et al., in prep.). Fi-nally, we note that the spectrum of β Pic, which is due to a dust size distributionthat is surely collisionally dominated, shows little evidence for crystalline silicates.Although the 10 µm spectrum of β Pic (Knacke et al. 1993; Aitken et al. 1993)may show some spectral structure resembling that of solar system comets – charac-teristic for silicate minerals – the longer wavelength bands so prominent in cometaryspectra are completely absent in this source (Pantin et al. 1999). While this mayat first sight argue against this mechanism, the collisional velocities in this systemmay be much lower and predominantly lead to shattering.
2.4 Conclusions
We have presented the complete SWS/LWS spectra for seven oxygen-rich evolvedstars, together with the SWS spectrum of an eighth source. For the OH/IR stars,which have optically thick dust shells, essentially all of the stellar luminosity is radi-ated in the wavelength region covered by ISO. Emission features of crystalline silicatesare seen longwards of 15 µm in the dustier objects. Some of these emission featureslie within the 20-µm absorption feature of amorphous silicate, suggesting that the
47

Chapter 2
crystalline and amorphous components have different spatial distributions. The dustshells of these sources are sufficiently cool for abundant water ice to form, as indicatedby the near-IR absorption and far-IR emission features of crystalline ice.
In Chapter 4 we will present some of the further analysis and modelling requiredto determine the physical conditions and processes which give rise to these very richspectra.
Acknowledgements. We thank Tanya Lim for making available the spectral synthesis routine,and the referee, H. Habing, for constructive comments. This work is based on observationswith ISO, an ESA project with instruments funded by ESA Member States (especiallythe PI countries: France, Germany, the Netherlands and the United Kingdom) with theparticipation of ISAS and NASA. FK and LBFMW acknowledge financial support fromNWO Pionier grant number 616-78-333, and from an NWO Spinoza grant number 08-0 toE.P.J. van den Heuvel.
48
Chapter 3
Crystallinity versus mass-lossrate in Asymptotic GiantBranch stars
Astronomy & Astrophysics 369, 132–141 (2001)
F. Kemper, L.B.F.M. Waters, A. de Koter and A.G.G.M. Tielens
ABSTRACTInfrared Space Observatory (ISO) observations have shown that O-richAsymptotic Giant Branch (AGB) stars exhibit crystalline silicate featuresin their spectra only if their mass-loss rate is higher than a certain thresholdvalue. Usually, this is interpreted as evidence that crystalline silicates are notpresent in the dust shells of low mass-loss rate objects. In this study, radia-tive transfer calculations have been performed to search for an alternativeexplanation to the lack of crystalline silicate features in the spectrum of lowmass-loss rate AGB stars. It is shown that due to a temperature difference be-tween amorphous and crystalline silicates it is possible to include up to 40%of crystalline silicate material in the circumstellar dust shell, without thespectra showing the characteristic spectral features. Since this implies thatlow mass-loss rate AGB stars might also form crystalline silicates and de-posit them into the Interstellar Medium (ISM), the described observationalselection effect may put the process of dust formation around AGB starsand the composition of the predominantly amorphous dust in the InterstellarMedium in a different light. Our model calculations result in a diagnostic toolto determine the crystallinity of an AGB star with a known mass-loss rate.
3.1 Introduction
Oxygen-rich Asymptotic Giant Branch (AGB) stars are M-type stars of intermediatemass (1M� < M < 8M�) in the late stages of stellar evolution, which exhibit He-and H-shell burning (for a review on AGB stars, see Habing 1996, and references
49
Chapter 3
herein). These stars undergo an increasing mass loss while they evolve along theAGB; the stars with low mass-loss rates (∼ 10−8 – ∼ 10−6 M� yr−1) are referred toas Miras, whereas the stars with high mass-loss rates (∼ 10−5 – ∼ 10−3 M� yr−1) arethe so-called OH/IR stars. In the cooling outflow dust formation occurs, which addsan infrared excess to the Spectral Energy Distribution (SED). In case of Miras, thedust shell is optically thin, and the underlying stellar spectrum is still visible, but theoptically thick dust shell of OH/IR stars completely obscures the stellar spectrum,making these objects only detectable at infrared wavelengths (Bedijn 1987; van derVeen and Habing 1988).
Important reasons for studying the nature of dust in AGB stars can be foundin the fact that these stars are the main contributors of dust into the interstellarmedium. The properties of the dust in the ISM can thus be directly compared tothe dust properties in shells around evolved stars. This will provide information onthe processing of the dust in the ISM and will improve our insight into the life cycleof dust. Moreover, studying the condensation of dust in the outflows of AGB starswill provide useful diagnostics for the determination of the physical conditions inthese outflows, thus increasing our understanding of this important stage of stellarevolution.
Most AGB stars exhibit an oxygen-rich chemistry, i.e. a number ratio C/O < 1,in their dust shells, which gives rise to the condensation of oxygen-rich dust species.Based on early infrared observations, the presence of silicate species has been pro-posed by several authors (e.g. Gilman 1969; Jones and Merrill 1976). Pre-ISOstudies almost exclusively pointed towards the presence of amorphous Fe-bearing sili-cates; such dust shells are for example studied by Butchart and Whittet (1983);Pegourie and Papoular (1985) and Bedijn (1987). Infrared spectroscopy per-formed with the Infrared Space Observatory (Kessler et al. 1996) revealed thepresence of crystalline silicates next to the amorphous silicate dust in the circumstel-lar dust shells of some evolved stars (Waters et al. 1996). In addition, the observedwavelengths of the emission bands of the crystalline silicates in evolved stars suggestthat these grains contain little or no Fe, but are very Mg-rich (Molster et al.1999a). The data are consistent with no Fe in the grains. There seems to be a corre-lation between the peak of the SED, i.e. the optical depth towards the central star,and the presence of spectral features of crystalline olivine (forsterite, Mg2SiO4) andcrystalline pyroxene (enstatite, MgSiO3) (Waters et al. 1996; Cami et al. 1998,see also Chapter 2 of this work), in the sense that this material is not seen in starsthat are not obscured. This is usually interpreted as evidence that crystalline silicatesare not present in the dust shells around low mass-loss rate AGB stars, which havean optically thin dust shell. Apparently, a threshold value for the mass-loss rate Mis required to enable the condensation of crystalline silicate in the stellar outflows.This critical density would thus put constraints on the dust condensation sequence.Various explanations have been offered for this threshold density (Tielens et al.1998; Gail and Sedlmayr 1999; Sogawa and Kozasa 1999). Yet, its existence isnot well established.
In this study, we will evaluate the existence of the threshold value for the mass-
50

Crystallinity versus M in AGB stars
loss rate below which crystalline silicates are not detected. Does the lack of crystallinesilicate features in the SED of Miras really imply that the crystalline silicates are notpresent, or is some other effect at work suppressing the characteristic narrow features?We will study this issue by calculating a grid of detailed model spectra of circumstellardust shells for a wide range of mass loss and degree of crystallinity.
In Sect. 3.2 the model for the circumstellar dust shell will be described, includingthe applied optical constant for the silicates. In Sect. 3.3 the results will be discussedfor varying mass-loss rate and degree of crystallinity. Sect. 3.4 contains the physi-cal explanation of the obtained results and highlights possible implications for theevolution of dust. A summary of this study is given in Sect. 3.5.
3.2 Modelling the circumstellar dust shell
The dust radiative transfer programme modust (de Koter et al., in prep.; Bouw-man 2001) has been used to calculate detailed spectra of circumstellar dust shells. Thecode solves the transfer equations subject to the constraint of radiative equilibrium,fixing the temperature distribution of the dust grains. The solution technique focusseson the combined moment form of the transfer equation, such that the scattering termin the source function can be solved for explicitely, updating the Eddington factorsthroughout the lambda iteration by means of a ray-by-ray formal solution.
In the mode used in this paper, the dust is assumed to be distributed in a sphericalshell with a radial density profile ρ ∝ r−2, i.e. that of a time-independent stellar windoutflow at constant velocity
M = 4πr2ρ(r)vexp
where M is the mass-loss rate and vexp the outflow velocity. The program allowsone to specify an arbitrary number of dust species, each with its own shape and sizedistribution (see also Bouwman et al. 2000). Here we adopted spherical grains, forwhich we use Mie calculations to determine the absorption and scattering coefficients.The adopted chemical composition and laboratory measurements of optical constants– necessary to calculate the extinction properties – will be discussed in Sect. 3.2.1.For the size distribution we used a powerlaw N(a) ∝ a−3.5, consistent with the grain-size distribution of the ISM (Mathis et al. 1977). Following studies on the sizes ofinterstellar grains and of stardust recovered from meteorites (Anders and Zinner1993; Kim et al. 1994) we have adopted a grain-size range of 0.01 – 1 µm. The dustshell consists of separate grain populations, i.e. each dust grain contains one typeof silicate, implying that the separate dust species can have different temperatureprofiles. Finally, all dust species have the same spatial distribution.
The models in this study cover a wide range in mass-loss rates and degree of crys-tallinity. The mass-loss rate is varied from 5 ·10−8 to 10−4 M� yr−1. The crystallinityx, defined as
51

Chapter 3
x =total mass crystalline silicates
total mass silicates
is varied from 0% to 50%. The dust shell is illuminated at the inner radius by atypical M9 giant, of which the spectrum is taken from Fluks et al. (1994). The sizeof the inner radius Rin of the dust shell is determined by the condensation temperatureof the dust, Tcond ≈ 1000 K (Gail and Sedlmayr 1999). The outer radius is set toRout = 200Rin, which is sufficiently far out to account for all the near infrared (NIR)and mid infrared (MIR) flux. The outflow velocity is assumed to be at a constant valueof vexp = 20 km s−1. The dust/gas mass ratio in the outflow is taken to be f = 0.01.The last two numbers are typical for Miras and OH/IR stars. The presented resultsare expressed in terms of mass-loss rates for the above value of the outflow velocity.However the critical parameter determining the spectrum is obviously the dust densityρdust(r). Therefore the results are invariant for the quantity
Q =M
vexp(1 + f−1)' fM
vexpfor f � 1
which follows from the mass continuity equation.
3.2.1 Dust optical constants
Previous studies of the SED of dust shells surrounding AGB stars (Bedijn 1987;Justtanont and Tielens 1992; Le Sidaner and Le Bertre 1993, 1996) usedso-called astronomical or dirty silicates, of which the optical constants were obser-vationally determined (Jones and Merrill 1976; Draine and Lee 1984). Thechemical composition of astronomical silicate is not known, although likely the extraabsorption is due to the presence of iron in the form of Fe2+ in the mineral (Schutteand Tielens 1989).
In the last few years, accurate laboratory measurements of the optical constantsof amorphous silicates (Dorschner et al. 1995) and crystalline silicates (Koikeet al. 1993; Koike and Shibai 1998; Jager et al. 1998) have become available.Together with the high spectral resolution of the ISO Short Wavelength Spectrometer(SWS; de Graauw et al. 1996a) and Long Wavelength Spectrometer (LWS; Clegget al. 1996) this opens the possibility to determine the dust composition in greatdetail, at least in principle. However, model calculations have shown that the SED cannot be fitted using only the optical constants of amorphous and crystalline silicates.An additional source of opacity in the NIR appears to be missing (Chapter 4). Thisis a well-known problem which dates back to Jones and Merrill (1976); Bedijn(1987) and Schutte and Tielens (1989). Although it is a fundamental issue, forthe present study it suffices to use the optical constants of the amorphous silicatescalculated from the observed spectra of AGB stars (Suh 1999). The thus obtainedoptical constants of the AGB silicate cannot provide information on the exact com-position of the amorphous component of the dust shell, however for our studies of
52

Crystallinity versus M in AGB stars
the appearance and strength of the crystalline silicate features, the use of the “Suh-silicate” will not affect our results. As the peak position of the crystalline features inlaboratory samples is strongly dependent on the Fe-content, ISO observations of AGBand post-AGB stars demonstrate that the dust shells only contain Mg-rich crystallinesilicates (Molster et al. 1999a, and Chapter 2 of this work). For these crystallinesilicates, we used optical constants of two different types: forsterite (Mg2SiO4) andenstatite (MgSiO3) (Jager et al. 1998). It is important to realize that because ofthe low Fe-content, their absorptivity in the Near Infrared (NIR) is very low. Equalmass fractions of both crystalline species have been used, unless stated otherwise.
3.3 Model results
Here we present the model results for increasing mass-loss rates (Sect. 3.3.1) andincreasing degree of crystallinity (Sect. 3.3.2). In Sect. 3.3.3 the observational con-straints of ISO will be taken into account and applied to the model spectra.
3.3.1 Varying the mass-loss rate
In Figs. 3.1, 3.2 and 3.3 results of the model calculations are presented. Each figureshows the fluxes Fν(λ[µm]) for mass-loss rates varying from 10−7 to 10−4 M� yr−1
for a constant degree of crystallinity. In Fig. 3.1 results for a dust shell consistingof completely amorphous dust are shown. Clearly visible are the bands due to Si-O stretching and O-Si-O-bending around 10 and 20 µm respectively. The strengthof these bands varies with increasing mass-loss rate; for low M the dust shell isoptically thin and the amorphous silicate bands appear in emission. The strength ofthe emission bands increases with increasing mass-loss rate. When the radial opticaldepth of the peaks of the spectral features approaches unity, the features becomeself-absorbed. This occurs around M = 10−5 M� yr−1 in case of the 10 µm feature.For the 20 µm feature this transition is less well defined, and occurs at a somewhathigher mass-loss rate.
Figs. 3.2 and 3.3 show the emerging spectra for a crystallinity of 10% and 20%respectively. The overall shape of these spectra resemble that of the amorphous sili-cate dust shell spectra in Fig. 3.1. However, while the degree of crystallinity remainsconstant, the narrow crystalline silicate features at 23.6, 27.6, 32.5, 36.1, 41.2 and43.2 µm become quite apparent at relatively high mass-loss rates.
In the models with low mass-loss rate, the narrow crystalline silicate features arenot discernible. Let us first investigate the relative strength of the crystalline silicatefeatures with respect to the amorphous dust continuum in some more detail. For thispurpose the contrast is calculated by dividing the spectrum of a dust model of agiven crystallinity by the spectrum of a model with equal properties and the sameamorphous silicate dust mass, but which is lacking the mass component taken upby the crystalline silicates. Fig. 3.4 shows the contrast for three different mass-lossrates, including 10% crystalline material. The narrow bands due to crystalline silicates
53
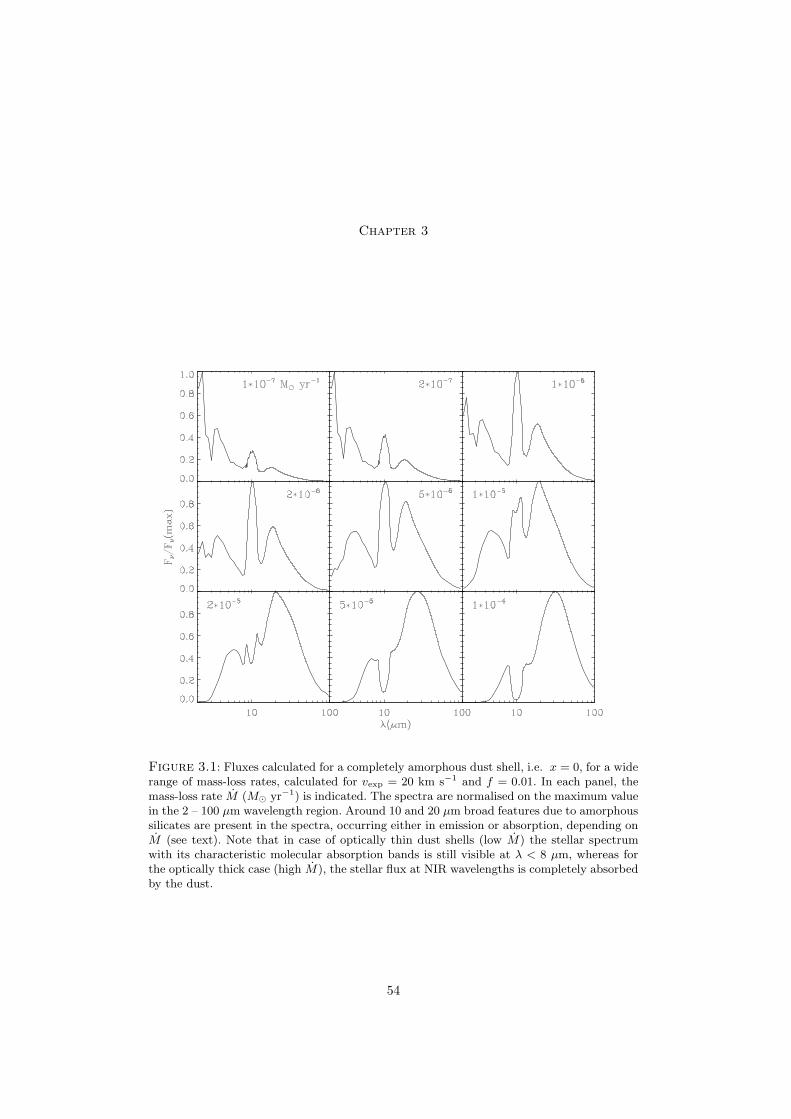
Chapter 3
Figure 3.1: Fluxes calculated for a completely amorphous dust shell, i.e. x = 0, for a widerange of mass-loss rates, calculated for vexp = 20 km s−1 and f = 0.01. In each panel, themass-loss rate M (M� yr−1) is indicated. The spectra are normalised on the maximum valuein the 2 – 100 µm wavelength region. Around 10 and 20 µm broad features due to amorphoussilicates are present in the spectra, occurring either in emission or absorption, depending onM (see text). Note that in case of optically thin dust shells (low M) the stellar spectrumwith its characteristic molecular absorption bands is still visible at λ < 8 µm, whereas forthe optically thick case (high M), the stellar flux at NIR wavelengths is completely absorbedby the dust.
54
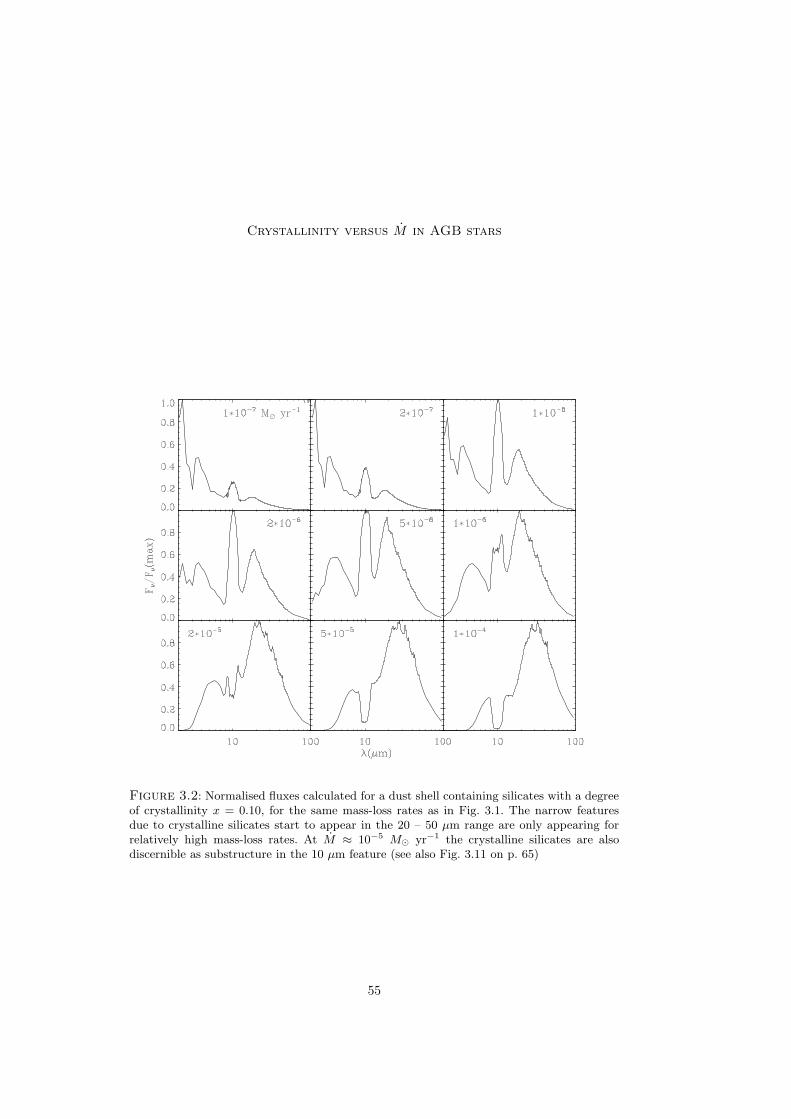
Crystallinity versus M in AGB stars
Figure 3.2: Normalised fluxes calculated for a dust shell containing silicates with a degreeof crystallinity x = 0.10, for the same mass-loss rates as in Fig. 3.1. The narrow featuresdue to crystalline silicates start to appear in the 20 – 50 µm range are only appearing forrelatively high mass-loss rates. At M ≈ 10−5 M� yr−1 the crystalline silicates are alsodiscernible as substructure in the 10 µm feature (see also Fig. 3.11 on p. 65)
55

Chapter 3
Figure 3.3: Normalised fluxes calculated for a dust shell containing silicates with a degreeof crystallinity x = 0.20, for the same mass-loss rates as in Fig. 3.1. The narrow featuresdue to crystalline silicates in the 20 – 50 µm range are only appearing for relatively highmass-loss rates. At M ≈ 5 · 10−6 M� yr−1 the crystalline silicates are also discernible assubstructure in the 10 µm feature (see also Fig. 3.11 on p. 65)
56

Crystallinity versus M in AGB stars
Figure 3.4: Contrast plot of the 25 – 50 µm region for different mass-loss rates at a constantdegree of crystallinity x = 0.10. The M (M� yr−1) values are indicated for each curve. Thecontrast is obtained by dividing the model spectrum containing 10% crystalline dust by themodel spectrum of a dust shell with an equal amount of amorphous dust, but lacking thecrystalline dust component.
at 27.6, 32.5, 36.1, 41.2 and 43.2 µm show that the relative strength increases withmass-loss rate. Note that the continuum between the crystalline silicate features doesnot necessarily return to unity, as the ”extra” IR emission from crystalline silicatesraises the temperature of the amorphous silicates slightly. For M = 10−7 M� yr−1 thecontrast between the crystalline silicate peaks and the surrounding continuum is lessthan 1% for all features; for M = 10−6 M� yr−1 some peaks have a relative strengthof ∼ 4% above continuum; whereas the strongest peaks of the M = 10−5 M� yr−1
model show a contrast of ∼ 10% above continuum. The detection limit of ISO forbroad spectral features in this wavelength region is — depending on the quality of thespectrum — around 5% of the continuum level, which implies that of the three curvesplotted in Fig. 3.4 only the ISO spectrum of a star with an outflow of 10−5 M� yr−1
would result in a unambiguous detection of crystalline silicate features. A detectionin the spectrum of an AGB star with M = 10−6 M� yr−1 would be dubious. Atypical Mira, with M = 10−7 M� yr−1, with a crystallinity of 10% would not showthe characteristic features. This result is consistent with the threshold mass-loss rateabove which crystalline silicates are detected with ISO observations (Waters et al.1996; Cami et al. 1998, and Chapter 2 of this work).
3.3.2 Varying the degree of crystallinity
In order to determine the amount of crystalline silicates that should be present in atypical Mira dust shell such that the narrow features would be detected in an ISOspectrum, model spectra with different degrees of crystallinity have been calculated.For a typical Mira mass-loss of M = 10−7 M� yr−1 the crystallinity has been var-ied from 5% to 50%. The spectra of the x = 0.10 and x = 0.20 models, discussed
57
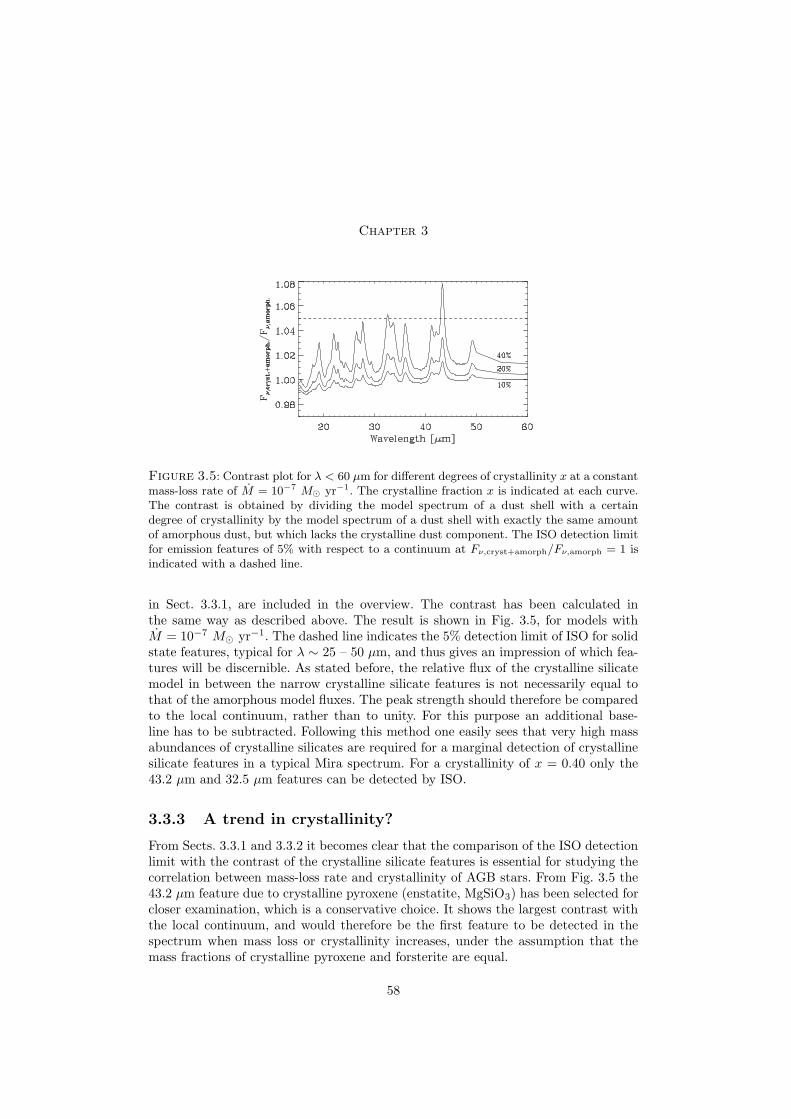
Chapter 3
Figure 3.5: Contrast plot for λ < 60 µm for different degrees of crystallinity x at a constantmass-loss rate of M = 10−7 M� yr−1. The crystalline fraction x is indicated at each curve.The contrast is obtained by dividing the model spectrum of a dust shell with a certaindegree of crystallinity by the model spectrum of a dust shell with exactly the same amountof amorphous dust, but which lacks the crystalline dust component. The ISO detection limitfor emission features of 5% with respect to a continuum at Fν,cryst+amorph/Fν,amorph = 1 isindicated with a dashed line.
in Sect. 3.3.1, are included in the overview. The contrast has been calculated inthe same way as described above. The result is shown in Fig. 3.5, for models withM = 10−7 M� yr−1. The dashed line indicates the 5% detection limit of ISO for solidstate features, typical for λ ∼ 25 – 50 µm, and thus gives an impression of which fea-tures will be discernible. As stated before, the relative flux of the crystalline silicatemodel in between the narrow crystalline silicate features is not necessarily equal tothat of the amorphous model fluxes. The peak strength should therefore be comparedto the local continuum, rather than to unity. For this purpose an additional base-line has to be subtracted. Following this method one easily sees that very high massabundances of crystalline silicates are required for a marginal detection of crystallinesilicate features in a typical Mira spectrum. For a crystallinity of x = 0.40 only the43.2 µm and 32.5 µm features can be detected by ISO.
3.3.3 A trend in crystallinity?
From Sects. 3.3.1 and 3.3.2 it becomes clear that the comparison of the ISO detectionlimit with the contrast of the crystalline silicate features is essential for studying thecorrelation between mass-loss rate and crystallinity of AGB stars. From Fig. 3.5 the43.2 µm feature due to crystalline pyroxene (enstatite, MgSiO3) has been selected forcloser examination, which is a conservative choice. It shows the largest contrast withthe local continuum, and would therefore be the first feature to be detected in thespectrum when mass loss or crystallinity increases, under the assumption that themass fractions of crystalline pyroxene and forsterite are equal.
58

Crystallinity versus M in AGB stars
Table 3.1: Relative fluxes and mass-loss rates of the sample stars from Chapter 2. Thereferences are 1 Planesas et al. (1990) 2 Knapp and Morris (1985) 3 Justtanont andTielens (1992) 4 Sopka et al. (1989) 5 Le Bertre and Winters (1998) 6 Schutte andTielens (1989) 7 Justtanont et al. (1996b) 8 Groenewegen (1994b)
Star rel. flux rel. flux M ref.32.5 µm 43.2 µm M� yr−1
o Cet < 0.05 < 0.05 1.0 · 10−7 1CRL 2199 < 0.05 < 0.05 1.5 · 10−5 2,3WX Psc 0.115 0.090 1.9 · 10−5 2,4,5,6OH 104.9+2.4 0.064 < 0.05 6.0 · 10−5 6OH 127.8+0.0 < 0.05 0.15 2.0 · 10−4 3OH 26.5+0.6 0.062 0.095 1.6 · 10−4 3,6,7AFGL 5379 0.077 0.093OH 32.8−0.3 < 0.05 0.16 1.0 · 10−4 3,6,8
For a range of enstatite mass fractions and mass-loss rates the contrast spectrahave been calculated. To determine the relative peak strength with respect to the localcontinuum, a first order polynomial base-line has been subtracted from the feature,such that the local continuum is equal to unity. Then the peak value of the 43.2 µmfeature was measured, and plotted in Fig. 3.6. Note that the enstatite mass fractionsdiffer a factor 2 with the elsewhere used crystallinity x, because it was assumed inSect. 3.2.1 that enstatite and forsterite are equally abundant. Fig. 3.6 is a diagnostictool to determine the crystalline pyroxene content of the silicates present in the dustshell around an AGB star. To do so, one has to determine the relative peak strengthof the 43.2 µm feature with respect to the local continuum, a quantity plotted onthe vertical axis, and combine this with the mass-loss rate of the object. The datapoints of the sample of AGB stars previously analysed in Chapter 2 are presented toillustrate the method. The relative strength is measured from ISO spectra with anaccuracy of 2 per cent of the continuum (Tab. 3.1). We adopted an accuracy of a factor2 for the mass-loss rates. Using these data, one can estimate from Fig. 3.6 that theenstatite makes up around 3% ± 2% of the total silicate dust mass around WX Pscand OH 26.5+0.6, and around 6% ± 2% in OH 127.8+0.0 and OH 32.8−0.3. InCRL 2199 and OH 104.9+2.4 the enstatite mass fraction is well below 2–3%, whereasthe upper limit obtained for o Cet (Mira itself) does not put interesting constraintson the enstatite content. The dust shell of o Cet could still easily contain a massfraction of 20% of crystalline pyroxene. A constant enstatite mass fraction of ∼ 5%is consistent with the observed strength of the 43.2 µm feature for a wide range ofmass-loss rates.
A similar analysis can be performed on the forsterite (Mg2SiO4, crystalline olivine)mass fraction, using the 32.5 µm feature, which has the best contrast. For the same
59
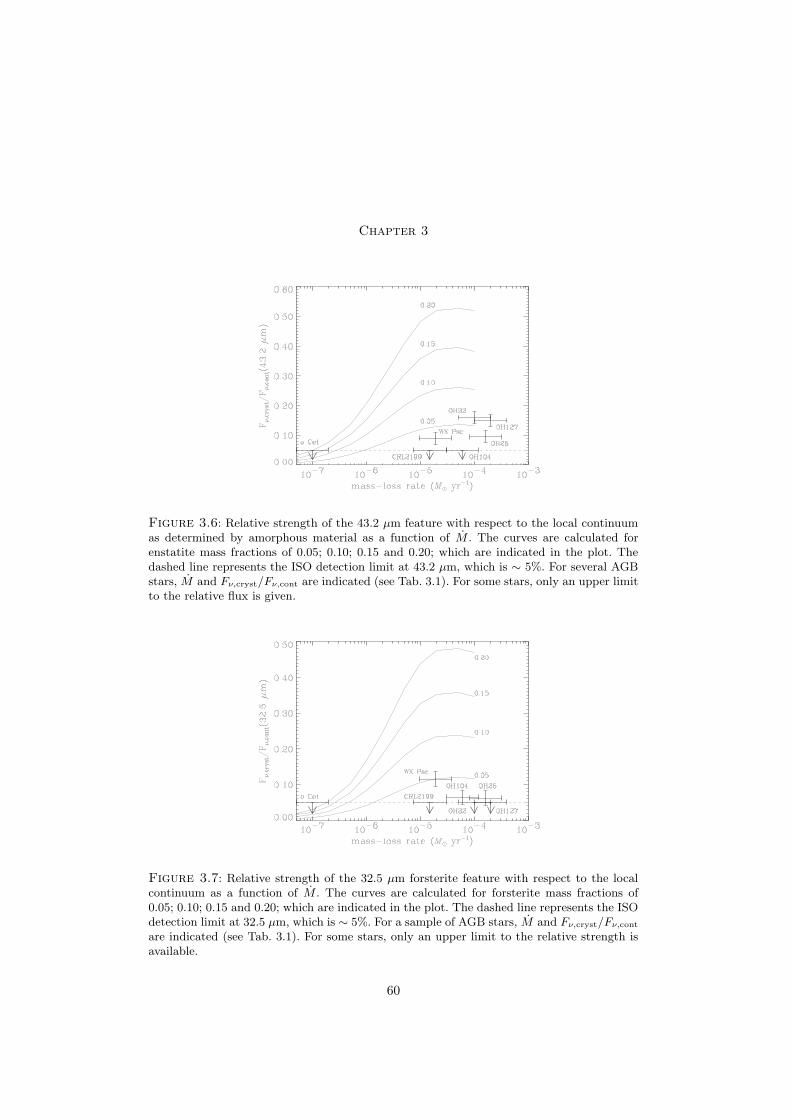
Chapter 3
Figure 3.6: Relative strength of the 43.2 µm feature with respect to the local continuumas determined by amorphous material as a function of M . The curves are calculated forenstatite mass fractions of 0.05; 0.10; 0.15 and 0.20; which are indicated in the plot. Thedashed line represents the ISO detection limit at 43.2 µm, which is ∼ 5%. For several AGBstars, M and Fν,cryst/Fν,cont are indicated (see Tab. 3.1). For some stars, only an upper limitto the relative flux is given.
Figure 3.7: Relative strength of the 32.5 µm forsterite feature with respect to the localcontinuum as a function of M . The curves are calculated for forsterite mass fractions of0.05; 0.10; 0.15 and 0.20; which are indicated in the plot. The dashed line represents the ISOdetection limit at 32.5 µm, which is ∼ 5%. For a sample of AGB stars, M and Fν,cryst/Fν,cont
are indicated (see Tab. 3.1). For some stars, only an upper limit to the relative strength isavailable.
60
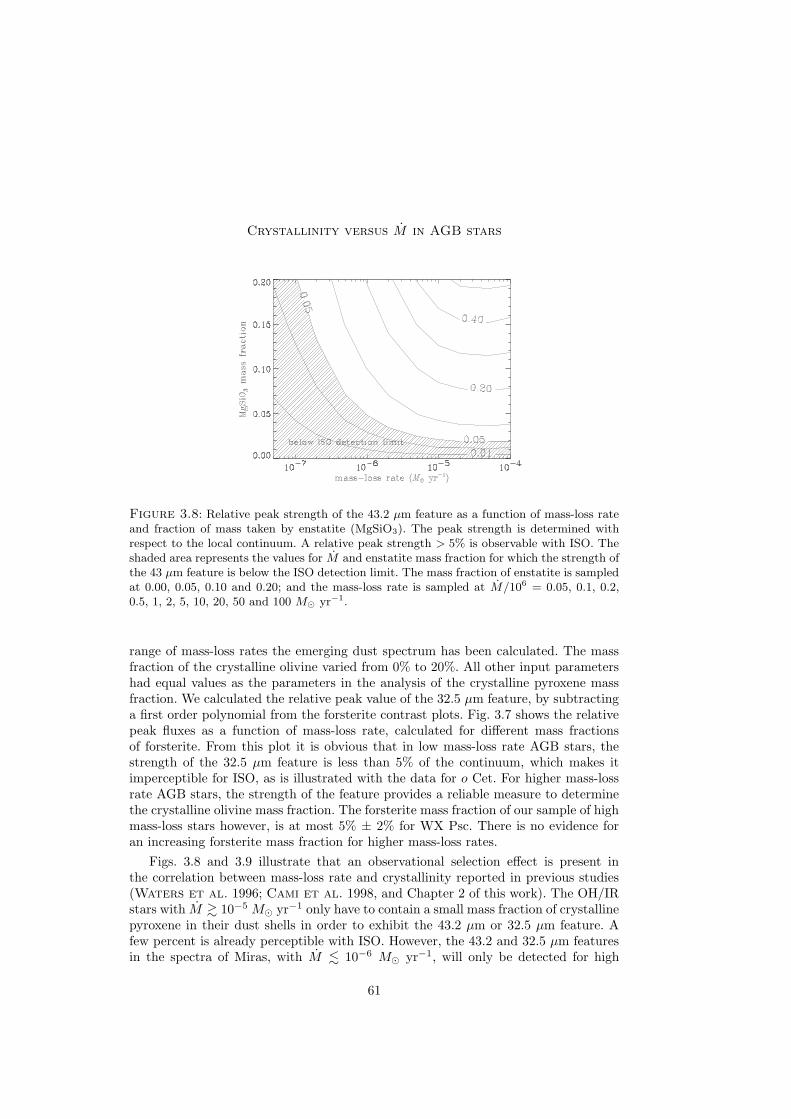
Crystallinity versus M in AGB stars
Figure 3.8: Relative peak strength of the 43.2 µm feature as a function of mass-loss rateand fraction of mass taken by enstatite (MgSiO3). The peak strength is determined withrespect to the local continuum. A relative peak strength > 5% is observable with ISO. Theshaded area represents the values for M and enstatite mass fraction for which the strength ofthe 43 µm feature is below the ISO detection limit. The mass fraction of enstatite is sampledat 0.00, 0.05, 0.10 and 0.20; and the mass-loss rate is sampled at M/106 = 0.05, 0.1, 0.2,0.5, 1, 2, 5, 10, 20, 50 and 100 M� yr−1.
range of mass-loss rates the emerging dust spectrum has been calculated. The massfraction of the crystalline olivine varied from 0% to 20%. All other input parametershad equal values as the parameters in the analysis of the crystalline pyroxene massfraction. We calculated the relative peak value of the 32.5 µm feature, by subtractinga first order polynomial from the forsterite contrast plots. Fig. 3.7 shows the relativepeak fluxes as a function of mass-loss rate, calculated for different mass fractionsof forsterite. From this plot it is obvious that in low mass-loss rate AGB stars, thestrength of the 32.5 µm feature is less than 5% of the continuum, which makes itimperceptible for ISO, as is illustrated with the data for o Cet. For higher mass-lossrate AGB stars, the strength of the feature provides a reliable measure to determinethe crystalline olivine mass fraction. The forsterite mass fraction of our sample of highmass-loss stars however, is at most 5% ± 2% for WX Psc. There is no evidence foran increasing forsterite mass fraction for higher mass-loss rates.
Figs. 3.8 and 3.9 illustrate that an observational selection effect is present inthe correlation between mass-loss rate and crystallinity reported in previous studies(Waters et al. 1996; Cami et al. 1998, and Chapter 2 of this work). The OH/IRstars with M & 10−5 M� yr−1 only have to contain a small mass fraction of crystallinepyroxene in their dust shells in order to exhibit the 43.2 µm or 32.5 µm feature. Afew percent is already perceptible with ISO. However, the 43.2 and 32.5 µm featuresin the spectra of Miras, with M . 10−6 M� yr−1, will only be detected for high
61
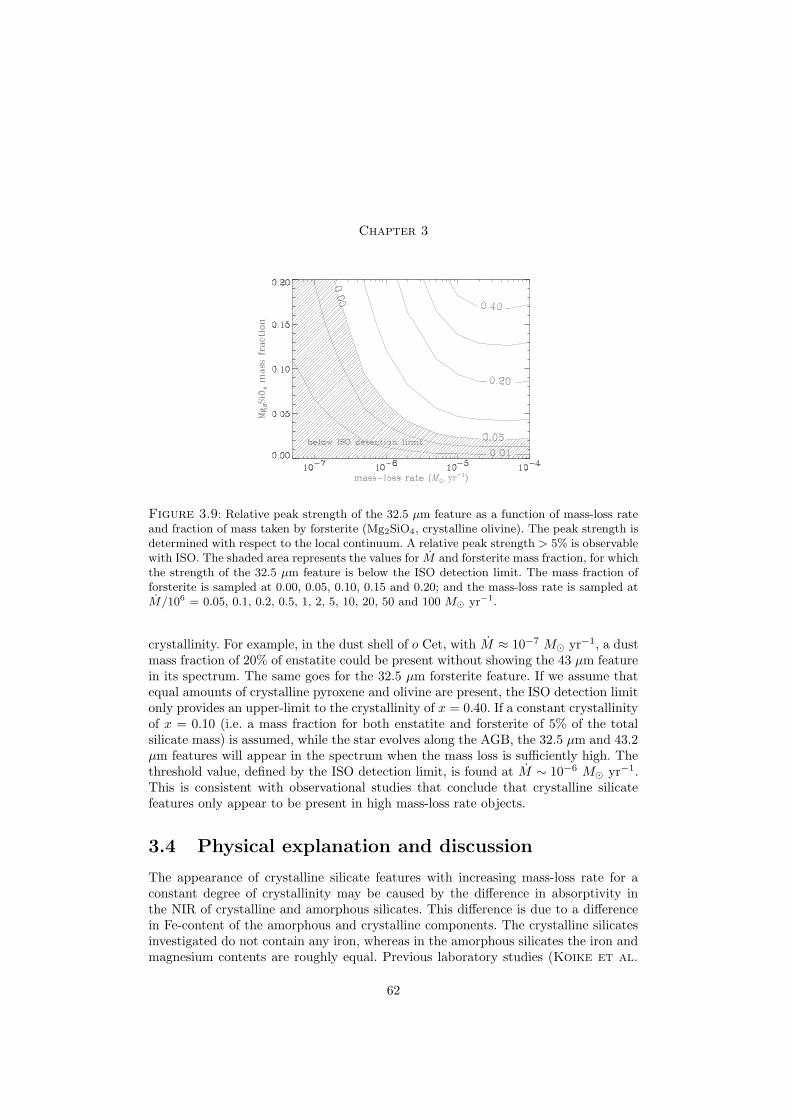
Chapter 3
Figure 3.9: Relative peak strength of the 32.5 µm feature as a function of mass-loss rateand fraction of mass taken by forsterite (Mg2SiO4, crystalline olivine). The peak strength isdetermined with respect to the local continuum. A relative peak strength > 5% is observablewith ISO. The shaded area represents the values for M and forsterite mass fraction, for whichthe strength of the 32.5 µm feature is below the ISO detection limit. The mass fraction offorsterite is sampled at 0.00, 0.05, 0.10, 0.15 and 0.20; and the mass-loss rate is sampled atM/106 = 0.05, 0.1, 0.2, 0.5, 1, 2, 5, 10, 20, 50 and 100 M� yr−1.
crystallinity. For example, in the dust shell of o Cet, with M ≈ 10−7 M� yr−1, a dustmass fraction of 20% of enstatite could be present without showing the 43 µm featurein its spectrum. The same goes for the 32.5 µm forsterite feature. If we assume thatequal amounts of crystalline pyroxene and olivine are present, the ISO detection limitonly provides an upper-limit to the crystallinity of x = 0.40. If a constant crystallinityof x = 0.10 (i.e. a mass fraction for both enstatite and forsterite of 5% of the totalsilicate mass) is assumed, while the star evolves along the AGB, the 32.5 µm and 43.2µm features will appear in the spectrum when the mass loss is sufficiently high. Thethreshold value, defined by the ISO detection limit, is found at M ∼ 10−6 M� yr−1.This is consistent with observational studies that conclude that crystalline silicatefeatures only appear to be present in high mass-loss rate objects.
3.4 Physical explanation and discussion
The appearance of crystalline silicate features with increasing mass-loss rate for aconstant degree of crystallinity may be caused by the difference in absorptivity inthe NIR of crystalline and amorphous silicates. This difference is due to a differencein Fe-content of the amorphous and crystalline components. The crystalline silicatesinvestigated do not contain any iron, whereas in the amorphous silicates the iron andmagnesium contents are roughly equal. Previous laboratory studies (Koike et al.
62
Crystallinity versus M in AGB stars
1993; Jager et al. 1998) have shown that the peak positions of crystalline silicatefeatures strongly depend on the Fe-content of the silicate. At present, there have notbeen any detections of crystalline silicates containing iron around evolved stars, whichjustifies the use of laboratory data of pure Mg2SiO4 and MgSiO3.
The absorptivity in the NIR and at shorter wavelengths increases with increasingFe-content. The amorphous silicates thus absorb more radiation from the centralstar, which emits most of its flux at NIR wavelengths, than the crystalline silicatesdo, resulting in a large temperature difference between amorphous and crystallinematerial, the latter staying much cooler. In the mid and far infrared the absorptivityof both dust types are more or less equal. In an optically thick dust shell, where thestellar flux is absorbed and re-radiated several times by the dust, the grains in theouter regions are illuminated by a radiation field that typically peaks at mid infraredwavelengths. As in this wavelength regime only a small difference in absorptivityoccurs, a large temperature difference between the amorphous and crystalline dustcomponents will not develop. Summarising, at the inner radius of an optically thickdust shell the crystalline silicates are much colder than the amorphous silicate grains,but the temperature difference decreases at larger distances.
The implications for the strength of the crystalline silicate features due to thistemperature difference are quite dramatic. In low mass-loss rate AGB stars (Miras),the dust shell is optically thin, implying the entire dust shell is visible and contributesto the SED. The relatively hot amorphous silicates at the inner radius then dominatethe SED of a Mira, and the contrast of the crystalline silicates with respect to theamorphous silicate spectrum becomes very poor. In case of a high mass-loss rate AGBstar, only the outer regions of the dust shell are visible, because the shell is opticallythick at IR wavelengths. The temperature differences in the outer layers are small,as explained above, and therefore the crystalline and amorphous dust componentsboth contribute in comparable amounts to the spectrum. This improved contrastof the crystalline silicates with respect to the amorphous dust emission enables thedetection of the narrow crystalline features in the spectrum of OH/IR stars.
The ISO detection limit allows the presence of a significant fraction of crystallinesilicates in the circumstellar shells of low mass-loss rate AGB stars. In fact, the ISOdata are consistent with model calculations assuming that the crystallinity of the dustis constant with mass-loss. Until now, most theoretical studies (Tielens et al. 1998;Gail and Sedlmayr 1999; Sogawa and Kozasa 1999) assumed that crystallinesilicates are only formed in high density outflows. The results presented in this studysuggest that the possibility of the condensation of crystalline silicates in low mass-lossrate AGB stars should be considered in future studies.
3.4.1 How to search for crystalline silicates in Miras
To date, there are no significant detections of crystalline silicates in low mass-loss rateAGB stars reported. As shown above, this provides a relatively high upper limit to themass fraction taken by crystalline silicates in the shells around these stars. In order tolower this upper limit and to investigate the presence of crystalline silicates in Miras,
63

Chapter 3
Figure 3.10: ISO SWS spectrum of AFGL 2999. The spectrum of this star is typical forthat of an object somewhere in between typical Miras and OH/IR stars. High resolutionand high signal-to-noise observations may perhaps reveal crystalline silicate features as sub-structure in the broad amorphous 10 µm feature. No crystalline silicates are seen at the 5percent level in the 20 – 45 µm range. The artefact at 28 µm is due to calibration problemswith band 3e of ISO SWS.
additional observations with a better detection limit than that of ISO, are required.Unfortunately, the most prominent and characteristic features of crystalline silicatesappear in the 25 – 50 µm region, and with the end of the ISO mission the opportunitiesto observe in this wavelength region are limited. An important future mission coveringpart of this wavelength region is SIRTF, which can perform intermediate resolutionspectroscopy (R ∼ 600) up to λ ≈ 37 µm. The crystalline silicate feature with thelargest contrast value within this wavelength range is the 32.5 µm forsterite feature.In Fig. 3.9, the contrast of this feature with respect to the continuum is presented asa function of mass-loss rate and Mg2SiO4 mass fraction.
In addition, it is also possible to study the 10 and 20 µm silicate features, whichboth can be observed from the ground. Since it is already known that the high mass-loss rate OH/IR stars contain crystalline silicates in their circumstellar dust shells, itis particularly interesting to study the 10 µm feature of low and intermediate mass-loss rate objects, with M < 10−5 M� yr−1. From Figs. 3.2 and 3.3 (on p. 55–56)one can conclude that the 10 µm feature of intermediate mass-loss rate AGB stars(M ≈ 10−6 to 10−5 M� yr−1) would be the most likely to reveal the presence ofcrystalline silicates. The 10 µm region has the intrinsically strongest resonance peaksof crystalline silicates. Superposed on the 10 µm feature of amorphous silicates whichis just optically thick (τ & 1) these strong resonances appear as absorption featuresin the spectrum. The intermediate mass-loss rate AGB stars can be easily recognisedfrom the ratio between the strength of the 10 and 20 µm features. For exampleAFGL 2999, of which the ISO SWS spectrum is shown in Fig. 3.10, can be identified
64
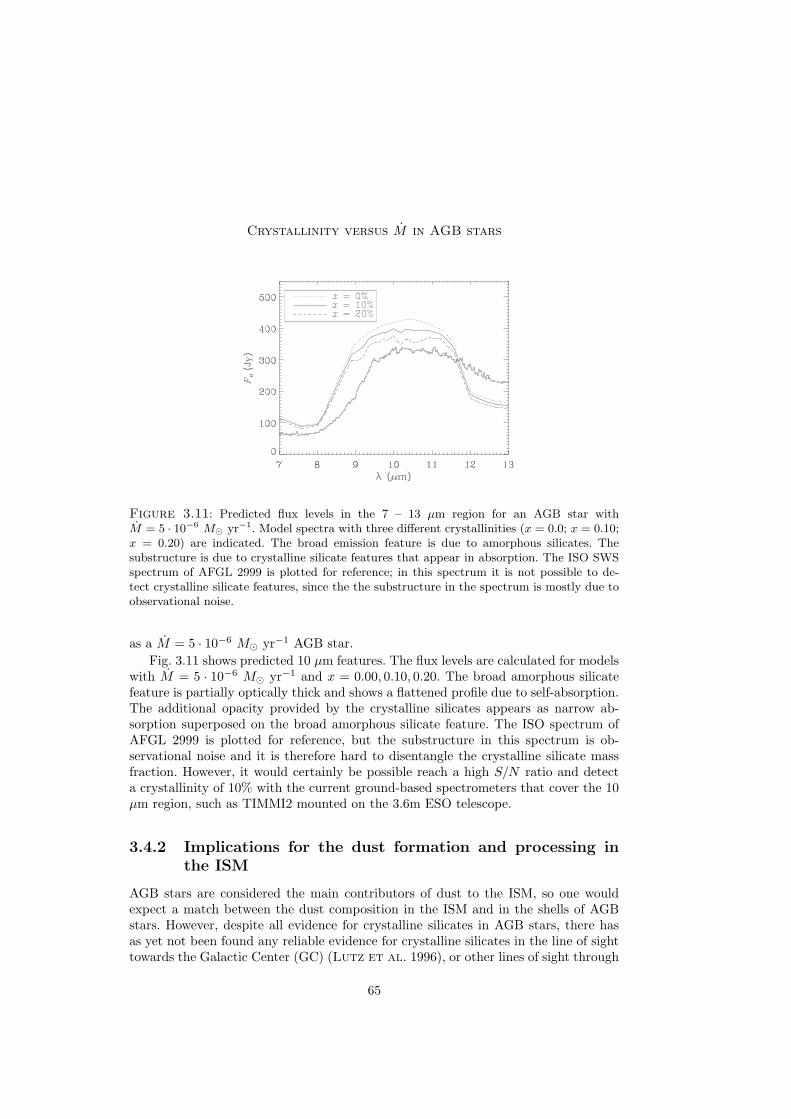
Crystallinity versus M in AGB stars
Figure 3.11: Predicted flux levels in the 7 – 13 µm region for an AGB star withM = 5 · 10−6 M� yr−1. Model spectra with three different crystallinities (x = 0.0; x = 0.10;x = 0.20) are indicated. The broad emission feature is due to amorphous silicates. Thesubstructure is due to crystalline silicate features that appear in absorption. The ISO SWSspectrum of AFGL 2999 is plotted for reference; in this spectrum it is not possible to de-tect crystalline silicate features, since the the substructure in the spectrum is mostly due toobservational noise.
as a M = 5 · 10−6 M� yr−1 AGB star.
Fig. 3.11 shows predicted 10 µm features. The flux levels are calculated for modelswith M = 5 · 10−6 M� yr−1 and x = 0.00, 0.10, 0.20. The broad amorphous silicatefeature is partially optically thick and shows a flattened profile due to self-absorption.The additional opacity provided by the crystalline silicates appears as narrow ab-sorption superposed on the broad amorphous silicate feature. The ISO spectrum ofAFGL 2999 is plotted for reference, but the substructure in this spectrum is ob-servational noise and it is therefore hard to disentangle the crystalline silicate massfraction. However, it would certainly be possible reach a high S/N ratio and detecta crystallinity of 10% with the current ground-based spectrometers that cover the 10µm region, such as TIMMI2 mounted on the 3.6m ESO telescope.
3.4.2 Implications for the dust formation and processing inthe ISM
AGB stars are considered the main contributors of dust to the ISM, so one wouldexpect a match between the dust composition in the ISM and in the shells of AGBstars. However, despite all evidence for crystalline silicates in AGB stars, there hasas yet not been found any reliable evidence for crystalline silicates in the line of sighttowards the Galactic Center (GC) (Lutz et al. 1996), or other lines of sight through
65

Chapter 3
the ISM (Demyk et al. 1999). In fact, the line of sight towards the GC is found toresemble closely the silicate feature of the evolved star µ Cep, and can be fitted withcompletely amorphous olivine (Vriend 1999; Bouwman et al. 2001). Cesarskyet al. (2000) report a questionable detection of crystalline silicates in the Orion Bar.
On the other hand, it is doubtful that Miras contribute significantly to the dustpopulation in the ISM. It is generally accepted that the Mira phase lasts ∼ 3 · 105 yr,and the OH/IR phase ∼ 3000 yr (Habing 1996). The mass-loss rates for Miras andOH/IR stars (MMira ≈ 10−7 M� yr−1, and MOH/IR ≈ 10−4 M� yr−1) can be used toestimate the total mass lost in each of the two phases; for OH/IR stars this is ∼ 0.3M�,for Miras ∼ 0.03M�. Under the assumption that all Miras will eventually evolve intoOH/IR stars, only a minor fraction (∼ 10%) of the interstellar dust population isformed in a Mira dust shell. So, the possibility that Miras contain a significant fractionof crystalline silicates in their dust shells does not heavily aggravate the discrepancybetween the dust composition in the ISM and that in AGB dust shells, under theassumption that all Miras eventually evolve into OH/IR stars. However, if Mira starsindeed deposit dust with a high degree of crystallinity into the ISM, and a significantfraction of Miras does not evolve into OH/IR stars, it is more surprising that theinterstellar silicate grains appear to have an amorphous lattice structure. Grain-graincollisions and ion bombardments might cause the required amorphitization. Due tothe collision, the grain will partially melt and consequently solidify in an amorphousform on time scales shorter than the annealing time scales (Chapter 2). In a futurestudy (Kemper et al., in prep.) we will thoroughly examine the differences betweensilicates in the ISM and in circumstellar shells, and discuss possible mechanisms ofgrain processing.
3.5 Summary
In this work, three important aspects of crystalline silicates around AGB stars havebeen studied by modelling the dust shell. First, we have calculated spectra emergingfrom circumstellar dust shells for different mass-loss rates. Moreover, the effects ofdifferent degrees of crystallinity on the SED have been taken into account, as a func-tion of optical depth towards the central star. Finally, we provide a useful and easyto use diagnostic tool to determine the degree of crystallinity for an AGB star with aknown mass-loss rate.
The dust shells of low mass-loss rate AGB stars can contain a significant fractionof crystalline silicates, while the characteristic sharp spectral peaks are indiscerniblewith ISO. This is caused by a large temperature difference in the inner parts of theseoptically thin dust shells, such that the relatively warm amorphous silicate emissiondominates the SED. The temperature difference between the warm amorphous dustand the cold crystalline dust is caused by a difference in absorptivity at NIR andvisible wavelengths, where the amorphous dust component more efficiently absorbsthe stellar radiation. The low absorptivity of the crystalline component is due to thevery low Fe-content of these dust species. In case of high mass-loss AGB stars, the
66
Crystallinity versus M in AGB stars
radiation from the central star is absorbed by the dust and re-radiated several times,so that the dust in the outer parts receives a relatively red radiation field, which peaksin the mid-IR. In that region the absorptivity of crystalline and amorphous silicatesare similar, leading to similar temperatures of both species. The dust shell is opticallythick, so only the outer layers, where crystalline and amorphous silicates have similartemperatures, are visible, leading to a high contrast of the crystalline silicate features.
From these results one may conclude that crystallinity is not necessarily a functionof mass-loss rate, as many observational and theoretical studies have suggested. Thethreshold value for the mass-loss rate above which crystalline silicates are observed isconsistent with the ISO detection limit if a constant crystallinity of 10% is assumed.The strong observational selection effect undermines previously drawn conclusionsregarding this threshold value. The meaning and the existence of the threshold mass-loss rate should be reconsidered. Future observations of the 10 µm silicate feature oflow mass-loss AGB stars at high spectral resolution can probably further constrain theupper limit for the crystalline silicate content in Miras. The low degree of crystallinityof grains in the interstellar medium with respect to grains in AGB shells, however,remains subject to further study.
Acknowledgements. We wish to thank C. Dominik, J. Bouwman, F.J. Molster and T. de Jongfor the useful discussions. We are grateful to I. Yamamura for the reduction of the ISO SWSspectrum of AFGL 2999. This work is based on observations with ISO, an ESA project withinstruments funded by ESA Member States (especially the PI countries: France, Germany,the Netherlands and the United Kingdom) with the participation of ISAS and NASA. FK,LBFMW and AdK acknowledge financial support from NWO Pionier grant 616-78-333. Wegratefully acknowledge support from NWO Spinoza grant 08-0 to E.P.J. van den Heuvel.
67


Chapter 4
Dust and the spectral energydistribution of the OH/IRstar OH 127.8+0.0: Evidencefor circumstellar metallic iron
Astronomy & Astrophysics 384, 585–593 (2002)
F. Kemper, A. de Koter, L.B.F.M. Waters, J. Bouwman and
A.G.G.M. Tielens
ABSTRACTWe present a fit to the spectral energy distribution of OH 127.8+0.0, a typicalasymptotic giant branch star with an optically thick circumstellar dust shell.The fit to the dust spectrum is achieved using non-spherical grains consistingof metallic iron, amorphous and crystalline silicates and water ice. Previoussimilar attempts have not resulted in a satisfactory fit to the observed spectralenergy distributions, mainly because of an apparent lack of opacity in the3–8 µm region of the spectrum. Non-spherical metallic iron grains provide anidentification for the missing source of opacity in the near-infrared. Using thederived dust composition, we have calculated spectra for a range of mass-loss rates in order to perform a consistency check by comparison with otherevolved stars. The L − [12 µm] colours of these models correctly predict themass-loss rate of a sample of AGB stars, strengthening our conclusion that themetallic iron grains dominate the near-infrared flux. We discuss a formationmechanism for non-spherical metallic iron grains.
4.1 Introduction
Oxygen-rich Asymptotic Giant Branch (AGB) stars show an infrared excess on theirspectral energy distribution (SED), which arises from thermal emission of dust lo-cated in a circumstellar shell. It is well established that the dust in this shell mainly
69

Chapter 4
consists of silicates, deduced from the clear detection of the 10 and 18 µm features.These bands are due to the Si-O bond stretching and Si-O-Si bond bending vibra-tions, respectively. It was noticed already some 25 years ago (Jones and Merrill1976; Bedijn 1977) that the opacities of various types of silicates measured in thelaboratory, were not high enough to explain the shape of the spectrum in the near-infrared (NIR, 3 < λ < 8 µm). Jones and Merrill (1976) investigated the effect ofpure silicates with graphite inclusions and of meteoritic rock on the shape of the SED.These materials were taken to represent silicates with various metallic inclusions, andreferred to as dirty silicates. Radiative transfer calculations using the opacity of dirtysilicates were in good agreement with the observations. Draine and Lee (1984) usedlaboratory measurements of limited resolution and wavelength coverage (Huffmanand Stapp 1973) in which the optical constants are partly modified and expandedin wavelength regime to match the astronomical observations of interstellar and cir-cumstellar silicates (Jones and Merrill 1976; Rogers et al. 1983) These opticalconstants are usually referred to as astronomical silicate. The exact chemical com-position of this astronomical silicate is not known, nevertheless it is widely used intheoretical studies of the radiative transfer in circumstellar dust shells (e.g. Bedijn1987; Schutte and Tielens 1989; Justtanont and Tielens 1992; Le Sidanerand Le Bertre 1993). Recently there have been efforts to derive improved opticalconstants for astronomical silicates, both for lines-of-sight in the interstellar medium(ISM) and towards oxygen-rich evolved stars exclusively (Ossenkopf et al. 1992;David and Pegourie 1995; Suh 1999). These optical constants still do not providethe answer to the composition and the nature of circumstellar silicates.
The study of circumstellar dust shells in the pre-ISO era was based on low res-olution spectroscopy, but with the launch of the Infrared Space Observatory (ISO;Kessler et al. 1996), a large wavelength region, from 2–200 µm, became availablefor intermediate resolution spectroscopic observations (λ/∆λ & 400). The ISO spectraof oxygen-rich evolved stars turned out to be extremely rich in solid state features.Hence, it became meaningful to attempt spectral fits using properly characterizedcosmic dust analogs, rather than astronomical silicates. Demyk et al. (2000) aimto do this for OH/IR stars (i.e. AGB stars with an optically thick dust shell), buttheir work is not complete and parts of the spectrum are not fitted to a satisfactorylevel. Harwit et al. (2001) have studied the optically thin dust shell surroundingred supergiant VY CMa and are able to fit the SED, albeit after including a largeoverabundance of metallic iron in the dust composition.
In this study, we aim to determine the dust composition with full radiative transfercalculations using exclusively optical constants of well-defined materials measured inthe laboratory, examining all astronomically relevant materials, and taking abundanceconstraints into account. Revealing the exact dust composition is an important steptowards understanding dust formation and processing in the outflows of oxygen-richevolved stars.
The paper is organized as follows: In Sect. 4.2 we discuss the spectral energydistribution arising from full radiative transfer calculations using amorphous olivineas the only dust component, and compare it to the observations. Sect. 4.3 discusses the
70
The spectral energy distribution of OH 127.8+0.0
dust composition and grain properties required to improve the fit to the observations.A spectral fit to OH 127.8+0.0 is presented in Sect. 4.4, supported by a consistencycheck on other AGB stars in Sect. 4.5. Sect. 4.6 contains a discussion of the results.
4.2 Modelling the circumstellar environment
In this section we describe and discuss the results from the radiative transfer calcu-lations assuming that the dust only consists of amorphous olivine. We describe thediscrepancies between the calculated and observed spectral energy distributions ofAGB stars.
4.2.1 Model assumptions and default grid
Our approach is to calculate a set of model spectra of dust shells characteristic forboth Mira and OH/IR stars, and to compare these with ISO observations. The stellarand wind parameters are the same for all models in the grid, except for the mass-lossrate which is varied from relatively low values, typical for Mira’s, to relatively largevalues, characteristic for OH/IR stars. This leads to a variety of optical depths, whichcan be compared to the optical depth in the 10 µm feature of observed spectra. Asimilar approach has been taken by Bedijn (1987) who also studied the appearanceof the SED of AGB stars as a function of mass loss, comparing the results with IRASobservations and ground based infrared data.
We use the code modust to model the spectrum of the circumstellar dust shell.The radiative transfer technique applied in this code has been outlined in Chapter 3.The specification of grain properties, such as size and shape distribution, are discussedin Bouwman et al. (2000). Here, we only discuss details relevant for the presentedmodels. The dust is assumed to be distributed in a spherical shell, with inner radiusRin and outer radius Rout, which is irradiated by a central star with Teff = 2.7 ·103 K,a radius R? = 372R� and a luminosity L? = 6.3 · 103 L�, thus describing a typicalAGB star. The input spectrum of the central star is not simply a black body but is acharacteristic mean spectrum for spectral type M9III, inferred from observations (380nm . λ . 900 nm) and extended with synthetic spectra in the range 99 – 12500 nm(Fluks et al. 1994). The M9III star with a Teff = 3126 K, emits significantly lessflux at λ < 1 µm than a black body of the same temperature. Dust is efficientlyheated in this wavelength region, and therefore the dust located at the inner edge ofthe dust shell around an M9III star would be somewhat cooler than the dust at theinner radius around a black body of 3126 K. This temperature difference decreaseswith distance from the central star. In case of an optically thin dust shell, the observedspectrum is dominated by the thermal emission of the warm dust at the inner radius.Therefore, the silicate features are somewhat stronger in case the black body is usedas a central source. In case of an optically thick dust shell, there is no difference inthe spectral energy distribution between the two possibilities, because only the dustin the outer regions is visible for the observer.
71
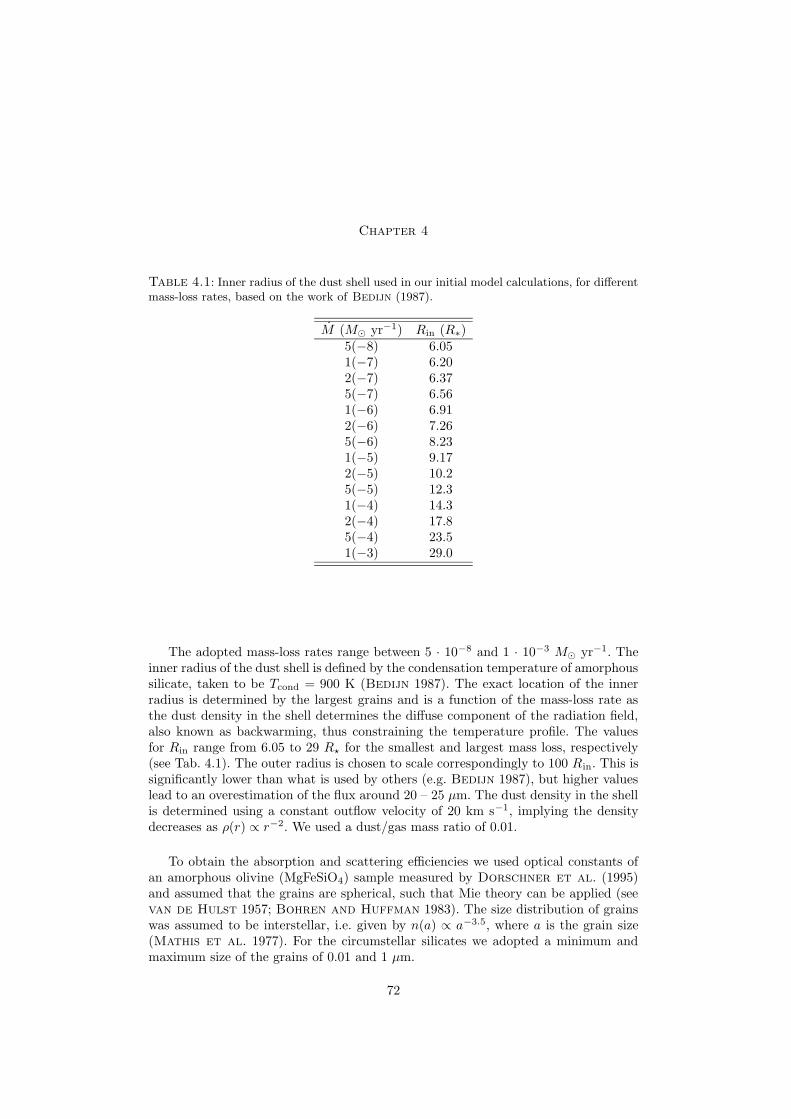
Chapter 4
Table 4.1: Inner radius of the dust shell used in our initial model calculations, for differentmass-loss rates, based on the work of Bedijn (1987).
M (M� yr−1) Rin (R∗)5(−8) 6.051(−7) 6.202(−7) 6.375(−7) 6.561(−6) 6.912(−6) 7.265(−6) 8.231(−5) 9.172(−5) 10.25(−5) 12.31(−4) 14.32(−4) 17.85(−4) 23.51(−3) 29.0
The adopted mass-loss rates range between 5 · 10−8 and 1 · 10−3 M� yr−1. Theinner radius of the dust shell is defined by the condensation temperature of amorphoussilicate, taken to be Tcond = 900 K (Bedijn 1987). The exact location of the innerradius is determined by the largest grains and is a function of the mass-loss rate asthe dust density in the shell determines the diffuse component of the radiation field,also known as backwarming, thus constraining the temperature profile. The valuesfor Rin range from 6.05 to 29 R? for the smallest and largest mass loss, respectively(see Tab. 4.1). The outer radius is chosen to scale correspondingly to 100 Rin. This issignificantly lower than what is used by others (e.g. Bedijn 1987), but higher valueslead to an overestimation of the flux around 20 – 25 µm. The dust density in the shellis determined using a constant outflow velocity of 20 km s−1, implying the densitydecreases as ρ(r) ∝ r−2. We used a dust/gas mass ratio of 0.01.
To obtain the absorption and scattering efficiencies we used optical constants ofan amorphous olivine (MgFeSiO4) sample measured by Dorschner et al. (1995)and assumed that the grains are spherical, such that Mie theory can be applied (seevan de Hulst 1957; Bohren and Huffman 1983). The size distribution of grainswas assumed to be interstellar, i.e. given by n(a) ∝ a−3.5, where a is the grain size(Mathis et al. 1977). For the circumstellar silicates we adopted a minimum andmaximum size of the grains of 0.01 and 1 µm.
72
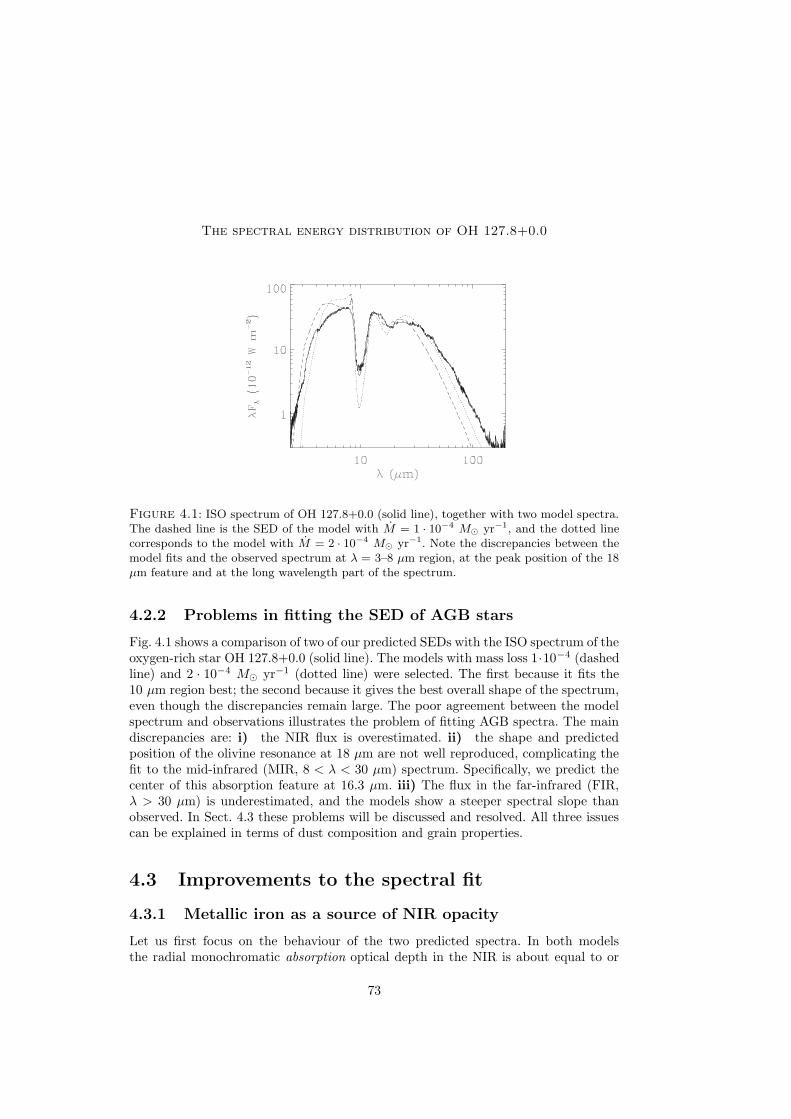
The spectral energy distribution of OH 127.8+0.0
Figure 4.1: ISO spectrum of OH 127.8+0.0 (solid line), together with two model spectra.The dashed line is the SED of the model with M = 1 · 10−4 M� yr−1, and the dotted linecorresponds to the model with M = 2 · 10−4 M� yr−1. Note the discrepancies between themodel fits and the observed spectrum at λ = 3–8 µm region, at the peak position of the 18µm feature and at the long wavelength part of the spectrum.
4.2.2 Problems in fitting the SED of AGB stars
Fig. 4.1 shows a comparison of two of our predicted SEDs with the ISO spectrum of theoxygen-rich star OH 127.8+0.0 (solid line). The models with mass loss 1·10−4 (dashedline) and 2 · 10−4 M� yr−1 (dotted line) were selected. The first because it fits the10 µm region best; the second because it gives the best overall shape of the spectrum,even though the discrepancies remain large. The poor agreement between the modelspectrum and observations illustrates the problem of fitting AGB spectra. The maindiscrepancies are: i) the NIR flux is overestimated. ii) the shape and predictedposition of the olivine resonance at 18 µm are not well reproduced, complicating thefit to the mid-infrared (MIR, 8 < λ < 30 µm) spectrum. Specifically, we predict thecenter of this absorption feature at 16.3 µm. iii) The flux in the far-infrared (FIR,λ > 30 µm) is underestimated, and the models show a steeper spectral slope thanobserved. In Sect. 4.3 these problems will be discussed and resolved. All three issuescan be explained in terms of dust composition and grain properties.
4.3 Improvements to the spectral fit
4.3.1 Metallic iron as a source of NIR opacity
Let us first focus on the behaviour of the two predicted spectra. In both modelsthe radial monochromatic absorption optical depth in the NIR is about equal to or
73
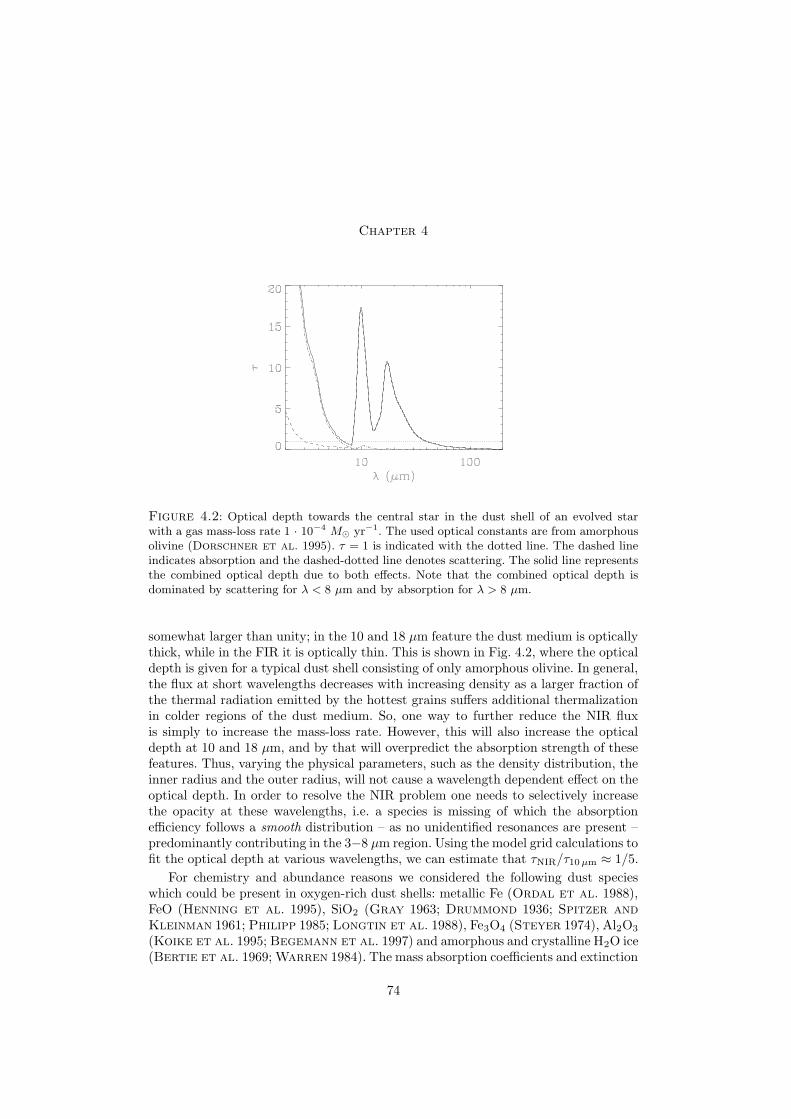
Chapter 4
Figure 4.2: Optical depth towards the central star in the dust shell of an evolved starwith a gas mass-loss rate 1 · 10−4 M� yr−1. The used optical constants are from amorphousolivine (Dorschner et al. 1995). τ = 1 is indicated with the dotted line. The dashed lineindicates absorption and the dashed-dotted line denotes scattering. The solid line representsthe combined optical depth due to both effects. Note that the combined optical depth isdominated by scattering for λ < 8 µm and by absorption for λ > 8 µm.
somewhat larger than unity; in the 10 and 18 µm feature the dust medium is opticallythick, while in the FIR it is optically thin. This is shown in Fig. 4.2, where the opticaldepth is given for a typical dust shell consisting of only amorphous olivine. In general,the flux at short wavelengths decreases with increasing density as a larger fraction ofthe thermal radiation emitted by the hottest grains suffers additional thermalizationin colder regions of the dust medium. So, one way to further reduce the NIR fluxis simply to increase the mass-loss rate. However, this will also increase the opticaldepth at 10 and 18 µm, and by that will overpredict the absorption strength of thesefeatures. Thus, varying the physical parameters, such as the density distribution, theinner radius and the outer radius, will not cause a wavelength dependent effect on theoptical depth. In order to resolve the NIR problem one needs to selectively increasethe opacity at these wavelengths, i.e. a species is missing of which the absorptionefficiency follows a smooth distribution – as no unidentified resonances are present –predominantly contributing in the 3−8 µm region. Using the model grid calculations tofit the optical depth at various wavelengths, we can estimate that τNIR/τ10 µm ≈ 1/5.
For chemistry and abundance reasons we considered the following dust specieswhich could be present in oxygen-rich dust shells: metallic Fe (Ordal et al. 1988),FeO (Henning et al. 1995), SiO2 (Gray 1963; Drummond 1936; Spitzer andKleinman 1961; Philipp 1985; Longtin et al. 1988), Fe3O4 (Steyer 1974), Al2O3
(Koike et al. 1995; Begemann et al. 1997) and amorphous and crystalline H2O ice(Bertie et al. 1969; Warren 1984). The mass absorption coefficients and extinction
74

The spectral energy distribution of OH 127.8+0.0
Figure 4.3: Mass absorption coefficients κ (cm2 g−1) as a function of wavelength for dif-ferent species contributing in the NIR. The left panel shows the calculations for a continuousdistribution of ellipsoids (CDE) which supposedly represents non-spherical particles, andthe right panel shows the Mie calculations, used for spherical particles. The labels indicatethe mass absorption coefficient curves for the considered species. Note the large differencesbetween the mass absorption coefficients for CDE and Mie calculations in case of metalliciron and Fe3O4, caused by their highly conductive nature.
efficiencies have been determined from the optical constants. The missing source ofopacity has to contribute significantly to the continuum in the 3–8 µm region, butshould not show strong and narrow features in the 2–20 µm region. This eliminatesSiO2 and water ice for this purpose. SiO2 has very strong resonances at ∼8.7, ∼12.4,∼14.4 and ∼20.5 µm, while the contribution to the continuum in the 3–8 µm regionis orders of magnitude less. These sharp resonances are not observed, therefore onlya small amount of SiO2 can be present in the dust shell, which is not enough tosignificantly increase the NIR opacity. Water ice, both amorphous and crystalline, hasfeatures at ∼3.1, ∼4.4, ∼6.3 and ∼12 µm. In between these features, the continuumis relatively weak. The ∼3.1 micron feature is the strongest feature and is actuallyseen in absorption in most AGB spectra. The amount of water ice required to fit thisfeature explains only a negligible fraction of the NIR opacity. Fig. 4.3 shows the massabsorption coefficients of the remaining candidates, with broad band or continuumemission in the NIR wavelength region, calculated for both spherical and non-sphericalparticles. A continuous distribution of ellipsoids (CDE, see Bohren and Huffman1983) is used to represent non-spherical grains. The strongest contribution in the3–8 µm region is caused by non-spherical metallic iron particles, suggesting theseare a likely candidate for the missing opacity in the NIR in the spectrum of AGBstars. The mass absorption coefficients of FeO and Al2O3 are much lower in the NIRregion, while the contribution at longer wavelengths is more significant. This rules
75

Chapter 4
these species out as the missing source of opacity. Fe3O4 does contribute in the NIRalthough a factor of 2 less than Fe, but shows spectral features in the 15-20 µm regionwhich are not observed in the spectrum. In this study we will therefore concentrateon Fe as the most likely candidate for the moving NIR opacity, because it has thehighest mass absorption coefficient in the 3–8 µm region and the most favourablespectroscopic properties.
4.3.2 Non-spherical grains
The shift in the peak position of the 18 µm feature between model calculations andobservations is a second problem that occurs. This can be solved using non-sphericalamorphous olivine grains. The difference between the mass absorption coefficients ofspherical and non-sperical olivine grains is clearly shown in Fig. 2 of the work byDemyk et al. (2000). In particular the shape of the 18 µm feature is much affectedand the peak position shifts to a somewhat longer wavelength for non-spherical grains.However, Demyk et al. (2000) did not use these non-spherical particles in theirradiative transfer calculations of optically thick dust shells.
A continuous distribution of ellipsoids (CDE) may better approximate the actualvariety of grain shapes that is present in the outflow of evolved stars. The opticalproperties are dependent on the shape, which is for example apparent in a shift of thepeak position of spectral features. Shape effects are most prominent for conductingmaterials. Strictly speaking, the CDE approximation is only valid in the Rayleighlimit, where the size of the particles is at least a factor of ∼ 20 smaller than the wave-length. As we are using CDE calculations to solve problems with the 18 µm featureand our maximum grain size used is 1.0 µm, this condition is not violated. The resultthat metallic iron in CDE accounts for the missing NIR opacity, is also consistentwith the Rayleigh limit, because the metallic iron grains are probably incorporatedin the silicate grains (see Sect. 4.6) and therefore have sizes significantly smaller than1.0 µm. For an elaborate description of resonances and the absorption characteristicsof non-spherical particles the reader is referred to Bohren and Huffman (1983).
4.3.3 Water ice features in the far-infrared
The improved fit to the NIR part of the SED leads to a redistribution of the radi-ation such that the flux in the NIR is suppressed and FIR flux levels are increased.Additional improvement of the FIR flux might be achieved by adjusting the outerradius of the dust shell, where cold dust – optically thin in the FIR – contributes.The remaining discrepancy between the observed and modelled flux levels at the longwavelength side can probably be overcome by water ice as an additional dust compo-nent. The presence of the 3, 43 and 60 µm features in most OH/IR stars implies thatcrystalline water ice is an important dust component (Chapter 2). The 3 µm featureis seen in absorption (see also Sect. 4.3.1). In addition to the 43 and 60 µm emissionfeatures, crystalline water ice also has an instrinsically strong underlying continuum> 30 µm which contributes to the FIR emission in the SED.
76
The spectral energy distribution of OH 127.8+0.0
4.4 Results for OH 127.8+0.0
4.4.1 Stellar parameters and radiative transfer modelling
We have constructed a model representative for AGB stars, with the intention to fitthe spectrum of OH 127.8+0.0, a high mass-loss rate AGB star. The input spectrumat the inner radius is that of a star with spectral type M9III (Fluks et al. 1994),and a radius of 372 R�. The density distribution and total mass of the dust shell aredetermined by the velocity profile and the inner and outer radii. The outflow velocitywas again set to 20 km s−1, implying a density distribution ∝ r−2. In reality the windprobably accelerates while dust is being formed in the inner regions, until it reachesthe terminal velocity. However, the dust shell is very optically thick in the NIR, wherethe warm dust in the inner regions most effectively radiates, implying that densityvariations in the inner parts – well inside the τ = 1 surface – of the dust shell do notaffect the emerging SED. Therefore it is impossible to further constrain the velocityprofile and the inner radius; we chose the latter to be consistent with a condensationtemperature of ∼ 900 K, using Rin = 14.3R∗ (3.7 · 1014 cm). This temperaturecorresponds to the condensation temperature of amorphous silicates, but crystallinesilicates and metallic iron condense at higher temperatures (Gail and Sedlmayr1999). We performed test calculations in which we varied the inner radius and didnot see a difference in the resulting SED. It is possible to determine the outer radius,found to be at Rout = 5000R∗ (1.3 · 1017 cm), with an accuracy of 15%, by fitting theslope in the FIR. By fitting the optical depth of the 10 µm silicate feature, the dustmass-loss rate was found to be 7(±1) · 10−7M� yr−1, which translates in a gas mass-loss rate of 7(±1) · 10−5M� yr−1, assuming a dust/gas ratio 0.01. Together with Rout
this parameter determines the total dust mass in the shell surrounding OH 127.8+0.0and sets it to be 1.4 · 10−3 M�.
By scaling the SED to the observations, we find that the distance towards OH127.8+0.0 is 1800 (± 50) pc, which assumes the stellar luminosity is 6300 L�. This issignificantly smaller than results using the phase lag of the 1612 MHz OH maser incombination with imaging. Herman and Habing (1985) find a distance of 6.98 kpc,and Bowers and Johnston (1990) report 6.21 ± 1.0 kpc, using the phase lagdetermination of Herman and Habing (1985). Such a large distance consequentlyleads to a very high luminosity (2.6 · 105 L�), more typical for red supergiants thanOH/IR stars. Other studies result in distances of 5.6 kpc (Engels et al. 1986) and2.8 kpc (Heske et al. 1990).
Dust properties
We find that the dust shell consists of the following dust components: amorphousolivine (80% by mass), forsterite (3%), enstatite (3%), metallic iron (4%) and crys-talline water ice (10%, Tcond = 150 K), based on the assumption that all dust speciesare present in separate grain populations. The crystalline silicates forsterite and en-statite are identified in the spectra of AGB stars (Chapter 2), and their relative mass
77

Chapter 4
Figure 4.4: The large panel shows the fit (dashed line) to the ISO spectrum of OH127.8+0.0 (solid line). In the inset, the same fit is presented for the 30 – 1500 µm wave-length range. The diamonds indicate the IRAS 60 and 100 µm and JCMT SCUBA 450 and850 µm photometry points. The error bars on the measurements are smaller than the size ofthe symbols. A mass fraction of 4% of metallic iron was included in the dust. See Sect. 4.4for a description of the model parameters and the dust composition.
fraction is assumed to be 3% each, a typical value for AGB stars (Chapter 3). We didnot attempt to fit the actual mass fraction taken by enstatite and forsterite, which issubject to further study (Kemper et al., in prep.). The overall shape of the SED isnot affected by assuming a degree of crystallinity of 3%, since aside from the sharpresonances in the MIR, the opacities of amorphous and crystalline silicates are com-parable. All dust is found to be present in non-spherical (CDE) grains. The adoptedoptical constants of crystalline and amorphous silicates are provided by Dorschneret al. (1995), Jager et al. (1998) and Koike (priv.comm.). For crystalline waterice we used the optical constants derived by Bertie et al. (1969) and Warren(1984); the optical constants of metallic iron are taken from Ordal et al. (1988).
Fig. 4.4 shows the fit to OH 127.8+0.0. The ISO spectroscopy is taken from Chap-ter 2 and the 60 and 100 µm photometry originates from the IRAS Point Source Cat-
78

The spectral energy distribution of OH 127.8+0.0
Figure 4.5: Comparison of the extinction efficiency Qext for the composition found for thecircumstellar dust shell of OH 127.8+0.0 (this work), compared with the Qext of synthesizedamorphous olivine (Dorschner et al. 1995), and the Qext for several different astronomicalsilicates (Draine and Lee 1984; Ossenkopf et al. 1992; David and Pegourie 1995;Suh 1999). All extinction efficiencies are normalised on the 10 µm peak strength to allowcomparison of the NIR extinction.
alog. Additional observations with the James Clerk Maxwell Telescope (JCMT) havebeen performed to obtain the 450 and 850 µm photometry points (Kemper et al.,in prep.). It is clear that if 4% of the total dust mass is contained in non-sphericalmetallic iron grains, the NIR problem is solved. This is consistent with the averageinterstellar Fe and Si abundances (Snow and Witt 1996) that allow a mass fractionof 15% in the form of metallic iron, with respect to amorphous olivine.
In order to fit the FIR part of the SED, it is required to include a significantfraction of water ice in the dust shell (10%) for which a condensation temperature of150 K is assumed. This is consistent with the mass fraction contained in water ice inthe oxygen-rich dust shell of post-AGB star HD 161796 (Hoogzaad et al. 2002).
4.4.2 Comparison with astronomical silicate
The derived total dust extinction towards OH 127.8+0.0 can be compared with astro-nomical and laboratory measurements. The extinction efficiency Qext of the individualdust species assuming CDE have been added proportionately and the resulting totalQext is plotted in Fig. 4.5. Note that all curves are normalised to the strength of the10 µm feature to emphasize the differences in the NIR region. To provide some quan-titative insight, Tab. 4.2 presents the extinction efficiencies at 7 µm and at 18 µmwith respect to the extinction efficiencies at 10 µm. The long-dashed line shows theextinction efficiency for a synthesized pure amorphous olivine (Dorschner et al.
79
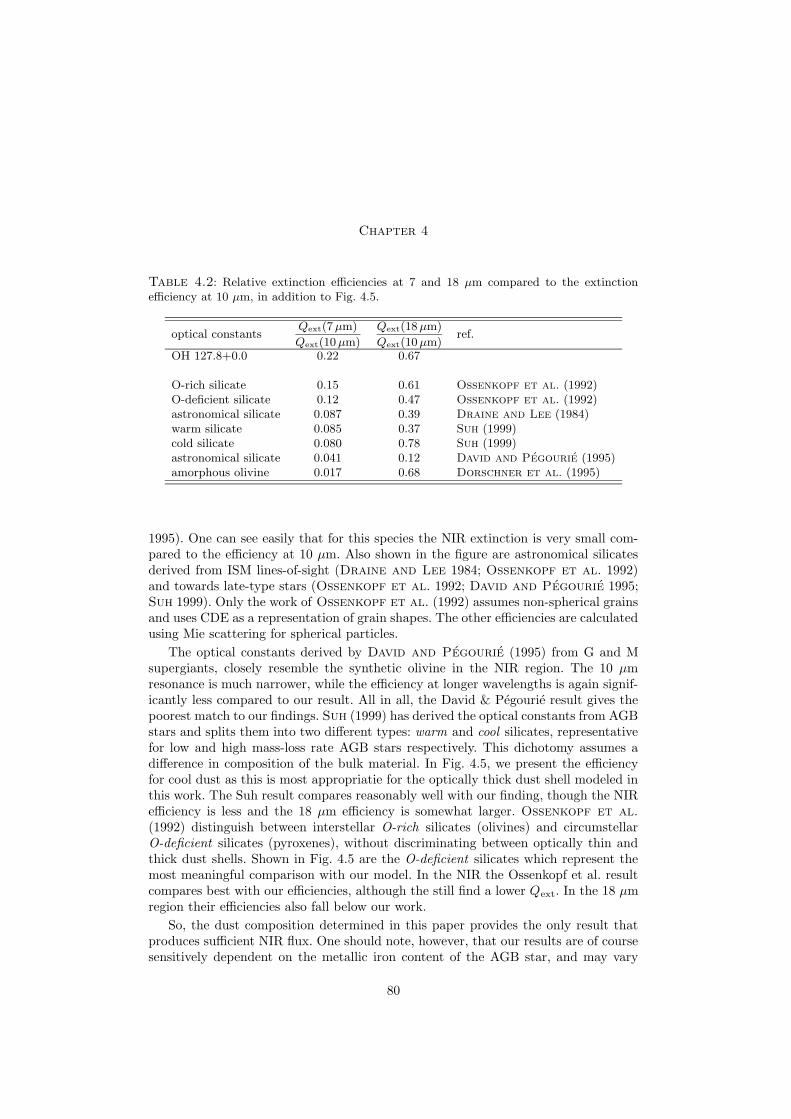
Chapter 4
Table 4.2: Relative extinction efficiencies at 7 and 18 µm compared to the extinctionefficiency at 10 µm, in addition to Fig. 4.5.
optical constantsQext(7 µm)
Qext(10 µm)
Qext(18 µm)
Qext(10 µm)ref.
OH 127.8+0.0 0.22 0.67
O-rich silicate 0.15 0.61 Ossenkopf et al. (1992)O-deficient silicate 0.12 0.47 Ossenkopf et al. (1992)astronomical silicate 0.087 0.39 Draine and Lee (1984)warm silicate 0.085 0.37 Suh (1999)cold silicate 0.080 0.78 Suh (1999)astronomical silicate 0.041 0.12 David and Pegourie (1995)amorphous olivine 0.017 0.68 Dorschner et al. (1995)
1995). One can see easily that for this species the NIR extinction is very small com-pared to the efficiency at 10 µm. Also shown in the figure are astronomical silicatesderived from ISM lines-of-sight (Draine and Lee 1984; Ossenkopf et al. 1992)and towards late-type stars (Ossenkopf et al. 1992; David and Pegourie 1995;Suh 1999). Only the work of Ossenkopf et al. (1992) assumes non-spherical grainsand uses CDE as a representation of grain shapes. The other efficiencies are calculatedusing Mie scattering for spherical particles.
The optical constants derived by David and Pegourie (1995) from G and Msupergiants, closely resemble the synthetic olivine in the NIR region. The 10 µmresonance is much narrower, while the efficiency at longer wavelengths is again signif-icantly less compared to our result. All in all, the David & Pegourie result gives thepoorest match to our findings. Suh (1999) has derived the optical constants from AGBstars and splits them into two different types: warm and cool silicates, representativefor low and high mass-loss rate AGB stars respectively. This dichotomy assumes adifference in composition of the bulk material. In Fig. 4.5, we present the efficiencyfor cool dust as this is most appropriatie for the optically thick dust shell modeled inthis work. The Suh result compares reasonably well with our finding, though the NIRefficiency is less and the 18 µm efficiency is somewhat larger. Ossenkopf et al.(1992) distinguish between interstellar O-rich silicates (olivines) and circumstellarO-deficient silicates (pyroxenes), without discriminating between optically thin andthick dust shells. Shown in Fig. 4.5 are the O-deficient silicates which represent themost meaningful comparison with our model. In the NIR the Ossenkopf et al. resultcompares best with our efficiencies, although the still find a lower Qext. In the 18 µmregion their efficiencies also fall below our work.
So, the dust composition determined in this paper provides the only result thatproduces sufficient NIR flux. One should note, however, that our results are of coursesensitively dependent on the metallic iron content of the AGB star, and may vary
80

The spectral energy distribution of OH 127.8+0.0
Table 4.3: Absolute magnitudes and infrared colour index as a function of mass-loss rate,for modelled SEDs with 4% of the dust mass contained in non-spherical metallic iron grains.
M (M� yr−1) M[12] ML L − [12]4(−8) −8.8 −7.4 1.47(−8) −9.0 −7.4 1.61(−7) −9.1 −7.4 1.72(−7) −9.4 −7.5 2.04(−7) −9.9 −7.5 2.47(−7) −10.3 −7.5 2.81(−6) −10.6 −7.6 3.02(−6) −11.0 −7.7 3.34(−6) −11.5 −7.9 3.67(−6) −11.6 −7.9 3.71(−5) −11.7 −8.0 3.72(−5) −11.9 −7.8 4.14(−5) −11.9 −7.4 4.47(−5) −11.9 −6.8 5.11(−4) −11.8 −6.3 5.52(−4) −11.6 −4.9 6.74(−4) −11.2 −3.2 8.07(−4) −10.7 −1.7 9.01(−3) −10.1 −0.7 9.4
from source to source, whereas other studies tried to derive mean values for a sampleof stars.
4.5 A consistency check
The SED of OH 127.8+0.0 is typical for high mass-loss rate AGB stars, which jus-tifies the calculation of a series of models for varying mass-loss rates, while the dustcomposition and other physical parameters were kept the same. Gail and Sedl-mayr (1999) show that metallic iron and silicates condense simultaneously in thestellar outflow, suggesting that the relative mass fraction of iron compared to thesilicates remains constant. We allowed the inner radius to change in order to satisfythe constraint that the condensation temperature Tcond = 900 K.
Using the SEDs predicted by the model, the infrared colours in different stagesof the mass-loss evolution on the AGB can be determined. For example, the relationbetween the K − [12 µm] colour or K − L colour and the optical depth is a usefuldiagnostic tool to determine the mass-loss rate of an AGB star (Le Sidaner andLe Bertre 1996; Le Bertre and Winters 1998). We searched for the presence
81
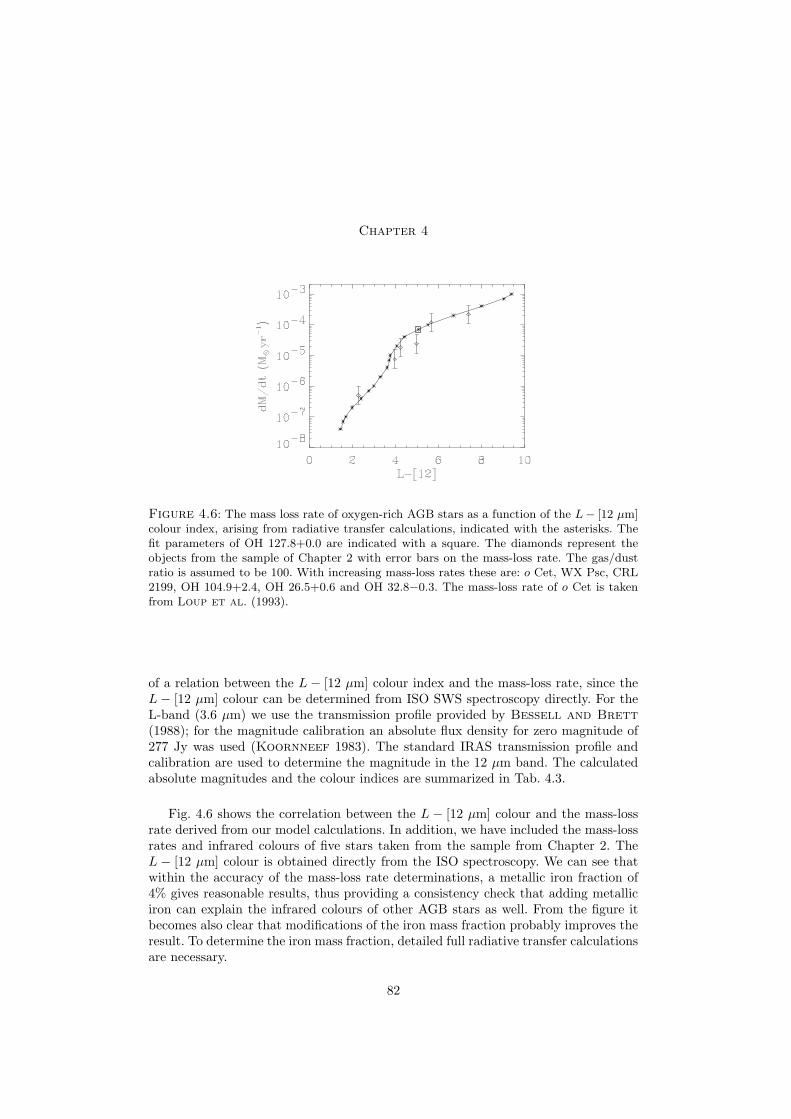
Chapter 4
Figure 4.6: The mass loss rate of oxygen-rich AGB stars as a function of the L− [12 µm]colour index, arising from radiative transfer calculations, indicated with the asterisks. Thefit parameters of OH 127.8+0.0 are indicated with a square. The diamonds represent theobjects from the sample of Chapter 2 with error bars on the mass-loss rate. The gas/dustratio is assumed to be 100. With increasing mass-loss rates these are: o Cet, WX Psc, CRL2199, OH 104.9+2.4, OH 26.5+0.6 and OH 32.8−0.3. The mass-loss rate of o Cet is takenfrom Loup et al. (1993).
of a relation between the L − [12 µm] colour index and the mass-loss rate, since theL − [12 µm] colour can be determined from ISO SWS spectroscopy directly. For theL-band (3.6 µm) we use the transmission profile provided by Bessell and Brett(1988); for the magnitude calibration an absolute flux density for zero magnitude of277 Jy was used (Koornneef 1983). The standard IRAS transmission profile andcalibration are used to determine the magnitude in the 12 µm band. The calculatedabsolute magnitudes and the colour indices are summarized in Tab. 4.3.
Fig. 4.6 shows the correlation between the L − [12 µm] colour and the mass-lossrate derived from our model calculations. In addition, we have included the mass-lossrates and infrared colours of five stars taken from the sample from Chapter 2. TheL − [12 µm] colour is obtained directly from the ISO spectroscopy. We can see thatwithin the accuracy of the mass-loss rate determinations, a metallic iron fraction of4% gives reasonable results, thus providing a consistency check that adding metalliciron can explain the infrared colours of other AGB stars as well. From the figure itbecomes also clear that modifications of the iron mass fraction probably improves theresult. To determine the iron mass fraction, detailed full radiative transfer calculationsare necessary.
82

The spectral energy distribution of OH 127.8+0.0
4.6 Discussion
The results presented in this work provide the first sound identification of metalliciron in the circumstellar dust shell around AGB stars, without violating abundanceconstraints. Demyk et al. (2000) have tried to include metallic iron in their modelcalculations of evolved stars, but because they did not consider non-spherical grains,metallic iron could not be abundant enough to account for the missing NIR opac-ity. Harwit et al. (2001) have concluded that metallic iron is necessary to fit thespectrum of VY CMa, although all Fe-atoms should be incorporated in metallic iron,implying that the amorphous silicate is completely Mg-rich, and even then a largeoverabundance is required.
From meteoritic and theoretical studies it is known that metallic iron can condensein a cooling gas of solar composition (e.g. Grossman and Larimer 1974; Lewis andNey 1979; Kozasa and Hasegawa 1988). In that case, metallic iron forms almostsimultaneously with silicates, since its condensation temperature is only 50 – 100 Kbelow that of silicates. In an oxygen-rich chemistry, metallic iron is stable above 700K. Below that temperature it will react to form FeS and/or FeO (Jones 1990).
An alternative is that it will remain metallic because it is protected from theoxidizing environment by inclusion in a grain. This can be achieved through the for-mation of iron islands on the surface of silicate grains (Gail and Sedlmayr 1999).During the formation process of silicates, Fe-atoms in the lattice will be replaced bythe thermodynamically more favourable Mg. The Fe-atoms will migrate to the sur-face of the grain to form iron islands and stimulate the condensation of additionalFe-atoms, to continue the growth of the islands. Gail and Sedlmayr (1999) suggestthat the islands will eventually be covered by younger silicate layers, thus creatingsilicate grains with platelet shaped, i.e. non-spherical, metallic iron inclusions. Theseinclusions greatly increase the opacity of the grains in the NIR region. The model cal-culations presented in this work use separate grain populations, rather than metalliciron inclusions in silicate grains, but still provide an idea of the mass fraction con-tained in the iron inclusions. This result, together with the inclusion of crystallinewater ice and the use of CDE for all grain shapes provide an important step in dis-entangling the dust composition of the circumstellar shell of AGB stars. No exoticassumptions were required to match the spectrum. A spherical outflow of materialat constant velocity suffices to produce a good fit to the SED if chemical and shapeproperties of the grains are treated in sufficient detail.
The presence and formation of metallic iron in astrophysical environments hasbeen subject to many studies in the past (Jones 1990, and references herein). Studiesof the interstellar extinction towards the galactic centre (GC) revealed a discrepancyin the 3–8 µm region with the standard dirty silicate opacity (Lutz 1999; Lutzet al. 1996). Of course, this is an ISM line-of-sight, implying that amorphous carbonis an important dust component. On the other hand, the opacity contribution ofamorphous carbon is already included in the optical constants of the dirty silicate,i.e. a graphite-silicate mixture. Thus also in this case, non-spherical metallic irongrains might explain the missing opacity in the NIR region. In addition, it is known
83
Chapter 4
that superparamagnetic inclusions, such as metallic iron, in elongated silicate grainscan cause these grains to align when a magnetic field is present (Mathis 1986). Thealignment of silicate grains explains the polarization of starlight passing through theinterstellar medium, a suggestion first made by Spitzer Jr. and Tukey (1951).
This theory appears to be supported by studies of interplanetary dust grains,which are collected by aircraft in the upper atmosphere of the Earth. Some of thecollected particles are believed to be very pristine and probably even from interstellarorigin, rather than being reprocessed during the formation of the solar system. Thesepristine particles consist of an amorphous matrix material with metal inclusions, andare referred to as GEMs (glasses with embedded metal and sulphides). Metallic ironinclusions are quite common in these supposedly interstellar grains (Bradley 1994;Martin 1995). Whether these grains really originate from the outflows of evolvedstars remains subject to speculation at this moment.
Acknowledgements. FK, AdK, LBFMW and JB acknowledge financial support from NWOPionier grant 616-78-333. We gratefully acknowledge support from NWO Spinoza grant 08-0to E.P.J. van den Heuvel. This work is based on observations with ISO, an ESA projectwith instruments funded by ESA Member States (especially the PI countries: France, Ger-many, the Netherlands and the United Kingdom) and with the participation of ISAS andNASA. The James Clerk Maxwell Telescope is operated on behalf of the Particle Physicsand Astronomy Research Council of the United Kingdom, the Netherlands Organisation forScientific Research and the National Research Council of Canada.
84

Chapter 5
Detection of carbonates indust shells around evolvedstars
Nature 415, 295–297 (2002)
F. Kemper, C. Jager, L.B.F.M. Waters, Th. Henning, F.J. Molster,
M.J. Barlow, T. Lim and A. de Koter
ABSTRACTCarbonates on large Solar System bodies like Earth and Mars (the latter rep-resented by the meteorite ALH84001) (Mittlefehldt 1994; Scott et al.1998) form through the weathering of silicates in a watery (CO3)
2− solution.The presence of carbonates in interplanetary dust particles and asteroids(again represented by meteorites) is not completely understood. Despite ef-forts (Gillett et al. 1973; Penman 1976; Sandford and Walker 1985),the presence of carbonates outside our Solar System has hitherto not beenestablished (Cohen et al. 1986; Keane et al. 2001). Here we report thediscovery of the carbonates calcite and dolomite in the dust shells of evolvedstars, where the conditions are too primitive for the formation of large par-ent bodies with liquid water. These carbonates, therefore, are not formed byaqueous alteration, but perhaps through processes on the surfaces of dust orice grains or gas phase condensation. The presence of carbonates which didnot form by aqueous alteration suggests that some of the carbonates foundin Solar System bodies no longer provide direct evidence that liquid waterwas present on large parent bodies early in the history of the Solar System(Endress et al. 1996).
The mineralogy of interstellar dust can be studied (Waters et al. 1996; Jageret al. 1998; Molster et al. 1999b) by infrared spectroscopy, using the InfraredSpace Observatory (ISO) (Kessler et al. 1996). Here we concentrate on two evolvedstars (NGC6302 and NGC6537, see Fig. 5.1): each of these stars has lost its envelopeby means of a dusty stellar wind, usually referred to as a planetary nebula, and is
85
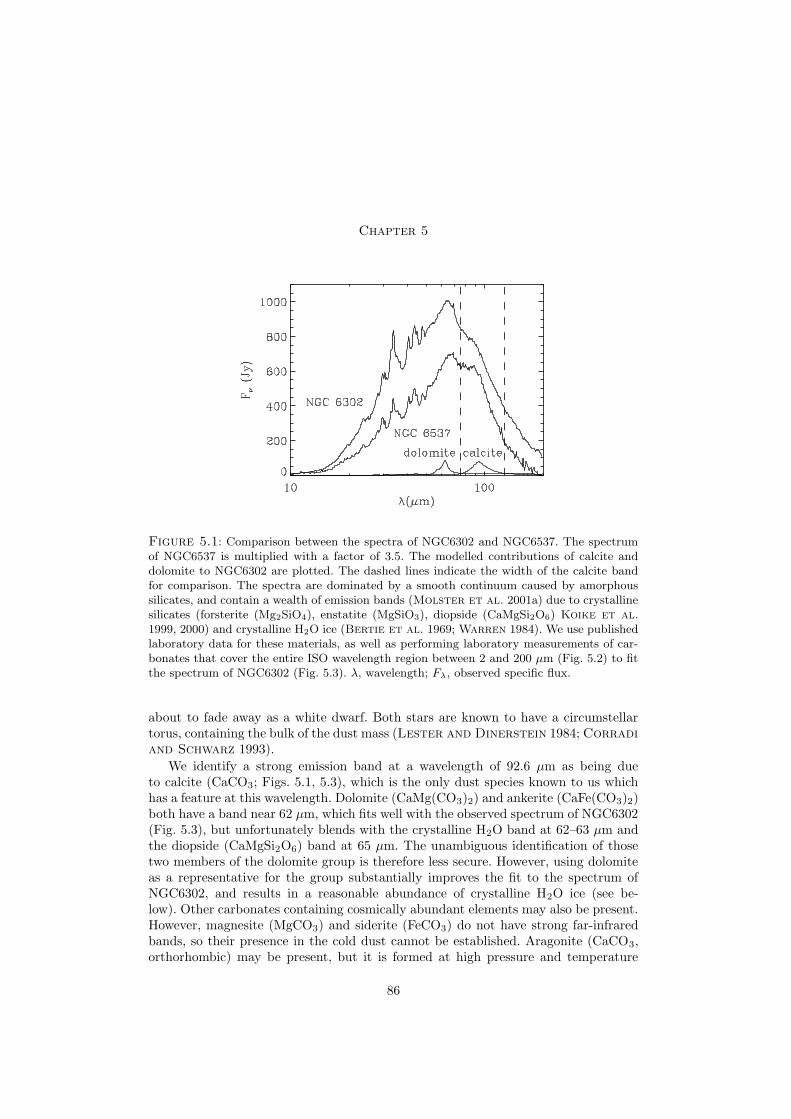
Chapter 5
Figure 5.1: Comparison between the spectra of NGC6302 and NGC6537. The spectrumof NGC6537 is multiplied with a factor of 3.5. The modelled contributions of calcite anddolomite to NGC6302 are plotted. The dashed lines indicate the width of the calcite bandfor comparison. The spectra are dominated by a smooth continuum caused by amorphoussilicates, and contain a wealth of emission bands (Molster et al. 2001a) due to crystallinesilicates (forsterite (Mg2SiO4), enstatite (MgSiO3), diopside (CaMgSi2O6) Koike et al.1999, 2000) and crystalline H2O ice (Bertie et al. 1969; Warren 1984). We use publishedlaboratory data for these materials, as well as performing laboratory measurements of car-bonates that cover the entire ISO wavelength region between 2 and 200 µm (Fig. 5.2) to fitthe spectrum of NGC6302 (Fig. 5.3). λ, wavelength; Fλ, observed specific flux.
about to fade away as a white dwarf. Both stars are known to have a circumstellartorus, containing the bulk of the dust mass (Lester and Dinerstein 1984; Corradiand Schwarz 1993).
We identify a strong emission band at a wavelength of 92.6 µm as being dueto calcite (CaCO3; Figs. 5.1, 5.3), which is the only dust species known to us whichhas a feature at this wavelength. Dolomite (CaMg(CO3)2) and ankerite (CaFe(CO3)2)both have a band near 62 µm, which fits well with the observed spectrum of NGC6302(Fig. 5.3), but unfortunately blends with the crystalline H2O band at 62–63 µm andthe diopside (CaMgSi2O6) band at 65 µm. The unambiguous identification of thosetwo members of the dolomite group is therefore less secure. However, using dolomiteas a representative for the group substantially improves the fit to the spectrum ofNGC6302, and results in a reasonable abundance of crystalline H2O ice (see be-low). Other carbonates containing cosmically abundant elements may also be present.However, magnesite (MgCO3) and siderite (FeCO3) do not have strong far-infraredbands, so their presence in the cold dust cannot be established. Aragonite (CaCO3,orthorhombic) may be present, but it is formed at high pressure and temperature
86
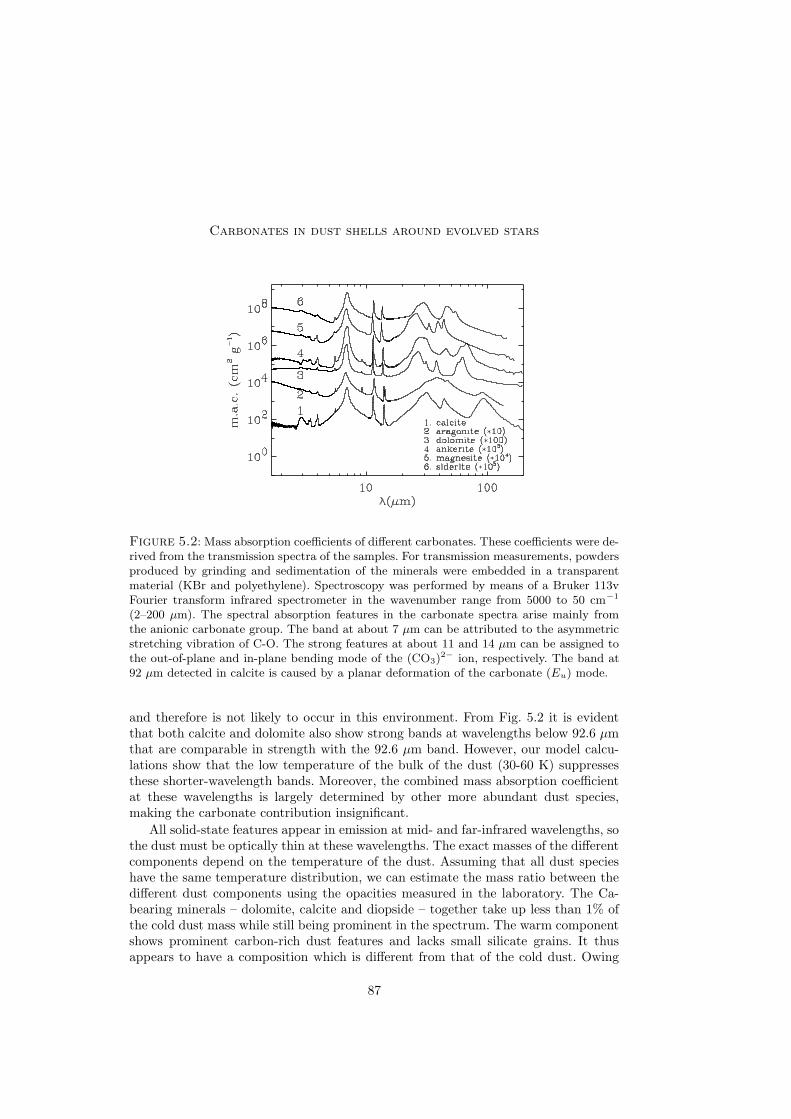
Carbonates in dust shells around evolved stars
Figure 5.2: Mass absorption coefficients of different carbonates. These coefficients were de-rived from the transmission spectra of the samples. For transmission measurements, powdersproduced by grinding and sedimentation of the minerals were embedded in a transparentmaterial (KBr and polyethylene). Spectroscopy was performed by means of a Bruker 113vFourier transform infrared spectrometer in the wavenumber range from 5000 to 50 cm−1
(2–200 µm). The spectral absorption features in the carbonate spectra arise mainly fromthe anionic carbonate group. The band at about 7 µm can be attributed to the asymmetricstretching vibration of C-O. The strong features at about 11 and 14 µm can be assigned tothe out-of-plane and in-plane bending mode of the (CO3)
2− ion, respectively. The band at92 µm detected in calcite is caused by a planar deformation of the carbonate (Eu) mode.
and therefore is not likely to occur in this environment. From Fig. 5.2 it is evidentthat both calcite and dolomite also show strong bands at wavelengths below 92.6 µmthat are comparable in strength with the 92.6 µm band. However, our model calcu-lations show that the low temperature of the bulk of the dust (30-60 K) suppressesthese shorter-wavelength bands. Moreover, the combined mass absorption coefficientat these wavelengths is largely determined by other more abundant dust species,making the carbonate contribution insignificant.
All solid-state features appear in emission at mid- and far-infrared wavelengths, sothe dust must be optically thin at these wavelengths. The exact masses of the differentcomponents depend on the temperature of the dust. Assuming that all dust specieshave the same temperature distribution, we can estimate the mass ratio between thedifferent dust components using the opacities measured in the laboratory. The Ca-bearing minerals – dolomite, calcite and diopside – together take up less than 1% ofthe cold dust mass while still being prominent in the spectrum. The warm componentshows prominent carbon-rich dust features and lacks small silicate grains. It thusappears to have a composition which is different from that of the cold dust. Owing
87
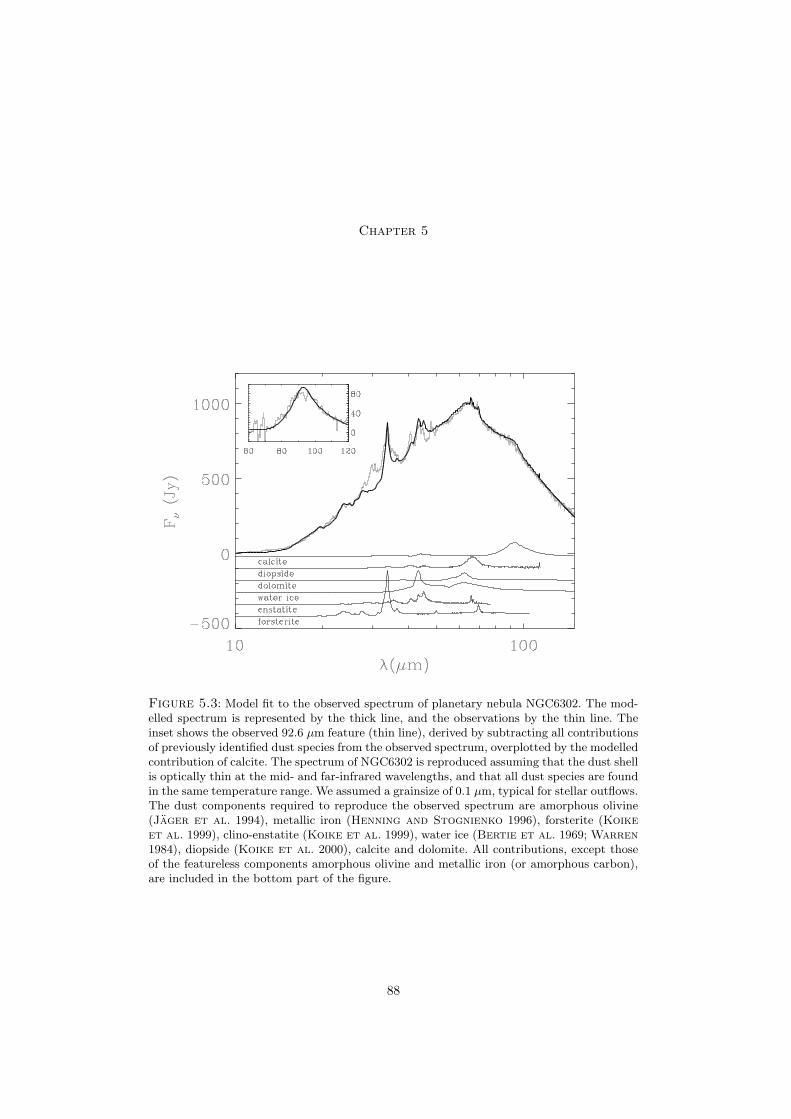
Chapter 5
Figure 5.3: Model fit to the observed spectrum of planetary nebula NGC6302. The mod-elled spectrum is represented by the thick line, and the observations by the thin line. Theinset shows the observed 92.6 µm feature (thin line), derived by subtracting all contributionsof previously identified dust species from the observed spectrum, overplotted by the modelledcontribution of calcite. The spectrum of NGC6302 is reproduced assuming that the dust shellis optically thin at the mid- and far-infrared wavelengths, and that all dust species are foundin the same temperature range. We assumed a grainsize of 0.1 µm, typical for stellar outflows.The dust components required to reproduce the observed spectrum are amorphous olivine(Jager et al. 1994), metallic iron (Henning and Stognienko 1996), forsterite (Koikeet al. 1999), clino-enstatite (Koike et al. 1999), water ice (Bertie et al. 1969; Warren1984), diopside (Koike et al. 2000), calcite and dolomite. All contributions, except thoseof the featureless components amorphous olivine and metallic iron (or amorphous carbon),are included in the bottom part of the figure.
88
Carbonates in dust shells around evolved stars
to the lack of the 6.8- and 11.4-µm features, we can rule out a substantial warm(T = 100 − 118 K) carbonate component. Assuming solar abundances, we find that∼ 30% of the Ca is locked up in the modelled Ca-bearing minerals. The rest of theCa is probably taken up by other solids that cannot be identified from the spectrum,such as amorphous silicates. We find that, assuming an H2O/H2 abundance ratio of1 · 10−3 by mass (Gonzalez-Alfonso and Cernicharo 1999), only ∼ 10% of theH2O is in the form of ice. If dolomite and diopside are not included in the model, allwater needs to be contained in water ice, which is hard to reconcile with observationsof OH masers (Payne et al. 1988) that require the presence of a significant amountof gas phase water. Therefore, dolomite and diopside must contribute significantly tothe 60-µm complex.
By analogy with terrestrial processes, the presence of carbonates in meteorites isinterpreted as evidence for secondary processing on large parent bodies with liquidwater, although an alternative origin has been suggested (Metzler et al. 1992).However, our detection of carbonates in planetary nebulae shows that the formationof carbonates may occur under much more primitive conditions. The age of the dustshell in the planetary nebula is ∼ 104 years, which makes the process of parent-bodyaccretion required for aqueous alteration, and the subsequent shattering into sub-micrometre sized grains very unlikely. The mass of the ionized gas in the nebula istwo solar masses (Pottasch and Beintema 1999), providing a lower limit to thetotal gas mass, which also includes neutral and molecular components. Assuming agas-to-dust ratio of 100 and using the relative dust masses, we find that the massof the carbonates is & 30 Earth masses. This is far too large to be a relic of ahypothetical planetary system that may have formed together with the star that isnow the central star of the planetary nebula, considering that abundance constraintsimply that calcite and dolomite cannot make up more than ∼ 2% of the total massof rocky material. This leaves no other conclusion than that an alternative formationmechanism exists for the carbonates.
We discuss three alternative mechanisms. First, the coexistence of carbonates withwater ice suggests that the water ice layer frozen out on the grain surface has an impor-tant role. It is known that a few layers of water molecules which are directly adjacentto the surface of the grain are quite mobile, with properties similar to liquid water(Rietmeijer 1985). If CO2 molecules are included in the ice layer, a grain-surfacereaction with Ca2+ or Mg2+ contained in a silicate lattice could possibly lead to theformation of carbonates. However, we do not find spectral evidence for a mixture ofH2O/CO2 ice. Moreover, the thickness of the layer of mobile water molecules in the icelayer depends on the temperature, and is virtually absent below 193 K (Rietmeijer1985). The CO2 would freeze out at a much lower temperature than water ice, caus-ing a layered ice structure which would prevent interaction between the cations in thegrain and the CO2, especially when the mobility is low.
Second, we propose a mechanism for carbonate formation through the reactionof H2O and CO2 in the gas phase with the grain surface. This mechanism proceedsthrough an intermediate step of the formation of hydrated silicates, which increasesthe availability of cations required for the synthesis of carbonates (Lancet and
89
Chapter 5
Anders 1970). This occurs at a pressure of 10−4 atm and T = 350 K. However, inthe outflow of evolved stars, the available pressures at these temperatures are ∼ 7–8orders of magnitude lower than this, making this mechanism unlikely. Moreover, thereare no spectral indications for the presence of hydrated silicates.
Last, carbonates are stable below ∼ 1200 K, so they could already be presentat the silicate condensation radius. As terrestrial sediments at impact sites suggest,calcite and dolomite can condense directly from a gas containing high abundances ofCO2 and MgO/CaO at ∼ 1000–1200 K (Pope et al. 1996). This process has not yetbeen reproduced in a laboratory experiment, but deserves a more careful examinationbecause of its observed occurrence.
The presence of carbonates in the dust shells of planetary nebulae require a non-aqueous formation mechanism. This mechanism probably also played a role in thesolar nebula, where physical conditions resembled those in the outflows of evolvedstars. If carbonates are not exclusively formed in the presence of liquid water, aswas previously thought, the carbonates found in interplanetary dust particles andchondritic meteorites do not unambiguously indicate aqueous alteration of the grains.
Acknowledgements. This work is based on observations with ISO, an ESA project withinstruments funded by ESA Member States (especially the PI countries: France, Germany,the Netherlands and the United Kingdom) and with the participation of ISAS and NASA.We like to thank F.J.M. Rietmeijer, D. Fabian, J. Bouwman, C. Dominik, A.G.G.M. Tielens,J. Bradley, W. Schutte, J. Keane, P. Morris, L.P. Keller, H.Y. McSween Jr. and R.N. Claytonfor their support and the useful discussions. The authors acknowledge financial support froman NWO ’Pionier’ grant.
90

Chapter 6
The mineral composition andspatial distribution of thedust ejecta of NGC 6302
submitted to Astronomy & Astrophysics
F. Kemper, F.J. Molster, C. Jager, L.B.F.M. Waters
ABSTRACTWe have analysed the full ISO spectrum of the planetary nebula NGC 6302in order to derive the mineralogical composition of the dust in the nebula.We use an optically thin dust model in combination with laboratory measure-ments of cosmic dust analogues. We find two main temperature componentsat about 100 and 50 K respectively, with distinctly different dust composi-tions. The warm component contains an important contribution from dustwithout strong infrared resonances. In particular the presence of small warmamorphous silicate grains can be excluded. The detection of weak PAH bandsalso points to a peculiar chemical composition of the dust in this oxygen-richnebula. The cool dust component contains the bulk of the mass and showsstrong emission from crystalline silicates, which contain about 10 percent ofthe mass. In addition, we identify the 92 µm band with the mineral calcite,and argue that the 60 µm band contains a contribution from the carbonatedolomite. We present the mass absorption coefficients of six different carbon-ate minerals. The geometry of the dust shell around NGC 6302 is studiedwith mid-infrared images obtained with TIMMI2. We argue that the cooldust component is present in a circumstellar dust torus, while the diffuseemission from the warm component originates from the lobes.
6.1 Introduction
All low and intermediate mass stars end their life on the Asymptotic Giant Branch(AGB) by ejecting their entire H-rich envelope through a slowly expanding, dusty
91

Chapter 6
wind. After the AGB, the central star quickly increases its effective temperature tovalues high enough to begin ionizing its AGB ejecta: a planetary nebula (PN) is born.Depending on the mass and thus luminosity of the star, the transition from AGB toPN can go very fast: for the most massive objects, in less than 1000 years ionizationof the nebula begins. These massive objects therefore are characterized by dense AGBremnants and a very hot luminous central star.
NGC 6302 is probably one of the best studied PNe with a massive progenitor. Arecent determination of the mass of the ionized nebula is about 2 M� (Pottaschand Beintema 1999), based on a distance determination of 1.6 kpc (Gomez et al.1993). Dust mass estimates also indicate a very massive shell (Md = 0.02M�), usinga distance of 2.2 kpc (Gomez et al. 1989). In this work however, we adopt a distanceof 0.91 kpc, based on the optical characteristics of NGC 6302 (Shaw and Kaler1989). The nebular abundances indicate that NGC 6302 is a type I nebula, consistentwith a massive progenitor. Casassus et al. (2000) estimate that the progenitor massis 4–5 M�. The morphology of the nebula observed at optical wavelengths is highlybipolar, pointing to non-spherical mass loss on the AGB, resulting in a dusty torus inthe equatorial region (Lester and Dinerstein 1984). The inclination angle of thesystem is ∼ 45o with respect to the line-of-sight (Bohigas 1994). The temperatureof the central star is very high: Casassus et al. (2000) mention a temperature of∼ 250 000 K, while Pottasch et al. (1996) arrive a temperature of ∼ 380 000 K.Although, there is some uncertainty about the distance and therefore masses andluminosities involved, everything points to a rather massive and luminous progenitor.
The Infrared Space Observatory (ISO) spectrum has been presented in several pa-pers (Barlow 1998; Molster et al. 2001a, 2002b) and is characterized by a wealthof narrow solid state features in the 20–70 µm spectral range caused by circumstellardust in the AGB remnant, as well as by strong emission lines from a multitude offine-structure lines originating from the ionized gas in the nebula. The dust bandshave been identified with crystalline silicates and a number of other components (e.g.Koike et al. 2000; Molster et al. 2001a, 2002a). In Chapter 5 we have reportedon the detection of carbonates in the dust shell, based on the identification of broadfeatures at ∼60 and ∼92 µm.
Optical and near-infrared images have already shown that the dust distributionaround NGC 6302 is rather complex (Lester and Dinerstein 1984; Schwarzet al. 1992). The ISO spectroscopy supports this, because a broad dust temperaturerange is required to explain the shape of the spectral energy distribution. In additionthe dust composition seems to be very complex, as there is evidence for a mixedchemistry by the presence of both oxygen-rich dust and carbon-rich dust features, thelatter in the form Polycyclic Aromatic Hydrocarbons (PAHs) (see Molster et al.2001a, for a discussion on the origin of this dichotomy).
In order to reconstruct the mass loss history of NGC 6302, including the geometryand composition of the AGB wind, infrared spectroscopy and imaging are needed.Unfortunately, the ISO data lack spatial information, limiting the analysis to thebulk dust composition. Mid-infrared imaging can reveal the present-day geometry ofthe dust envelope, which puts limits on the mass loss history.
92

The mineralogy of NGC 6302
This chapter is organized as follows: In Sect. 6.2 the ground-based mid-infraredimaging and spectroscopy is presented. The ISO spectroscopy is discussed in Sect. 6.3,which describes our laboratory data of carbonates (Sect. 6.3.1) and a model fit tothe observed spectrum (Sect. 6.3.2). In Sect. 6.4 we propose a possible geometryof NGC 6302 and discuss the astronomical relevance of carbonates. Our results aresummarized in Sect. 6.5.
6.2 The TIMMI2 observations
6.2.1 N- and Q-band imaging
We have observed NGC 6302 using the TIMMI2 mid-infrared imaging spectrographattached to the 3.6m telescope at the European Southern Observatory, La Silla, Chile.For a description of the instrument see Reimann et al. (2000). The observationswere carried out on the night of June 17/18, 2001. Observing conditions were notoptimal, with occasional clouds and variable seeing (between about 0.6′′ and 1.4′′).Imaging was done in four photometric bands, centred at 9.8 (N2), 10.4, 11.9, and 20(Q) µm. In addition, we obtained two 8.35-11.55 µm long-slit spectra. We observedHD 81797 and HD 169916 as point sources in order to determine the shape of thepoint spread function, as well as for flux calibration purposes.
To correct for background, chopping and nodding has been performed. Apart fromthe Q-band image, the chopping and nodding images fell all inside the frame. For thevarious N-band images we used a lens scale corresponding to a pixel size of 0.3′′/pixel,whereas the Q-band image was obtained with a pixel size of 0.2′′/pixel. The dimensionsof the detector are 320×240 pixels of which the central 300×220 pixels were used forfurther analysis. The chop throw used for the images in the N-band is 30′′, with anodding offset of 30′′ perpendicular on the chop direction. For the Q-band image, weapplied a chop throw of 40′′, and a nodding offset of 40′′ in the same direction.
Both the positive and negative images were used for the resulting image. Thefinal image has been sharpened by means of a deconvolution using the point spreadfunction (PSF) derived from HD 81797 for the Q-band. Unfortunately, for the N2,10.4 and 11.9 filters no standard star was measured in the same night with the samesettings, and we used observations of standards of another night. For the N2 and10.4 filters no standards were available at all. Therefore, we had to use HD 169916measured with the 11.9 µm filter for all three filters for the PSF, assuming that thePSF would be similar in all three N-bands. A comparison with other N2-band images(with different settings, but the positive and negative images did overlap each other)showed that our assumption is not unreasonable.
Fig. 6.1 shows the final TIMMI2 images at N2, N10.4, N11.9, and Q band, aswell as the raw (i.e. before deconvolution) N2 image, and an optical VLT image ofthe nebula for comparison (ESO 1998). The raw N2 image shows a bright elongatedregion of approximately 10′′ by 4′′, and a much fainter region offset to the southand west. There is also evidence for faint arcs of emission that are reminiscent of
93
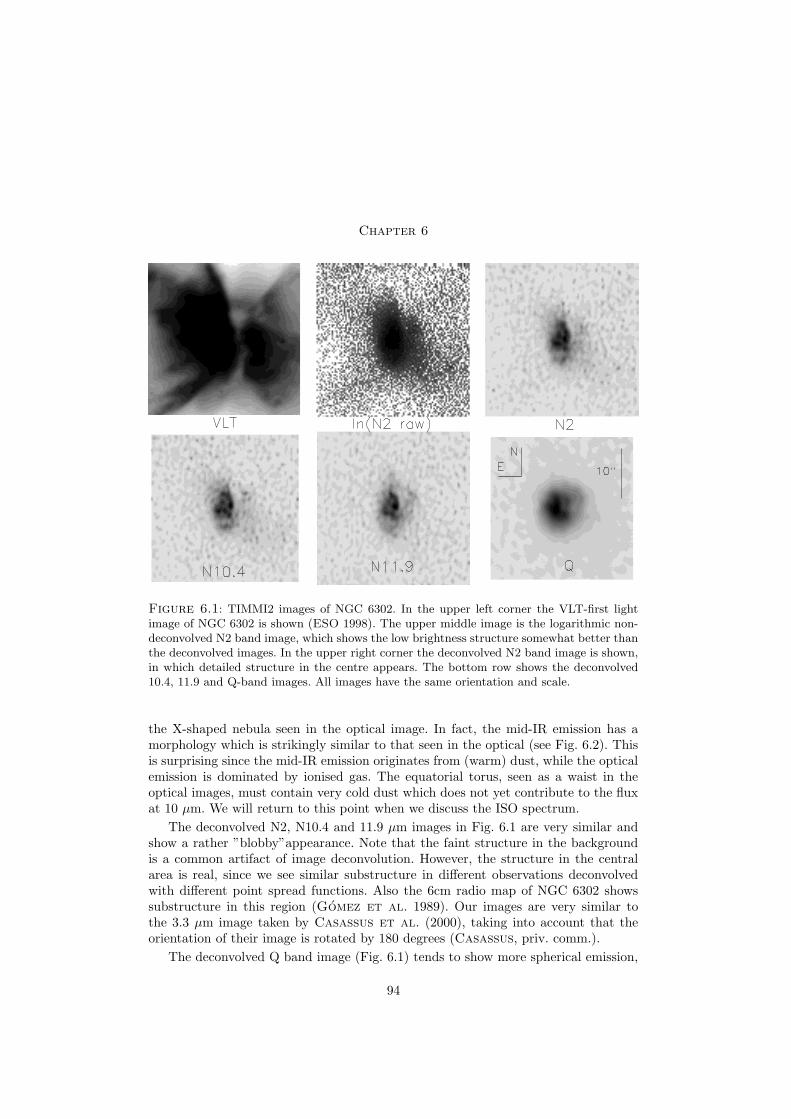
Chapter 6
Figure 6.1: TIMMI2 images of NGC 6302. In the upper left corner the VLT-first lightimage of NGC 6302 is shown (ESO 1998). The upper middle image is the logarithmic non-deconvolved N2 band image, which shows the low brightness structure somewhat better thanthe deconvolved images. In the upper right corner the deconvolved N2 band image is shown,in which detailed structure in the centre appears. The bottom row shows the deconvolved10.4, 11.9 and Q-band images. All images have the same orientation and scale.
the X-shaped nebula seen in the optical image. In fact, the mid-IR emission has amorphology which is strikingly similar to that seen in the optical (see Fig. 6.2). Thisis surprising since the mid-IR emission originates from (warm) dust, while the opticalemission is dominated by ionised gas. The equatorial torus, seen as a waist in theoptical images, must contain very cold dust which does not yet contribute to the fluxat 10 µm. We will return to this point when we discuss the ISO spectrum.
The deconvolved N2, N10.4 and 11.9 µm images in Fig. 6.1 are very similar andshow a rather ”blobby”appearance. Note that the faint structure in the backgroundis a common artifact of image deconvolution. However, the structure in the centralarea is real, since we see similar substructure in different observations deconvolvedwith different point spread functions. Also the 6cm radio map of NGC 6302 showssubstructure in this region (Gomez et al. 1989). Our images are very similar tothe 3.3 µm image taken by Casassus et al. (2000), taking into account that theorientation of their image is rotated by 180 degrees (Casassus, priv. comm.).
The deconvolved Q band image (Fig. 6.1) tends to show more spherical emission,
94

The mineralogy of NGC 6302
Figure 6.2: TIMMI2 N2-band image of NGC 6302, overlaid with the contours of the opticalVLT image (Fig. 6.1). The contours in the inner part of the figure are in white, to improvethe contrast.
although the eastern part of the nebula is still dominating the emission. Due to thereduced spatial resolution at 20 µm it is not possible to say if the emission is equallyblobby as seen at 10 µm.
6.2.2 N-band spectroscopy
In Fig. 6.3 we show the spectra taken at the slit positions indicated in Fig. 6.4. Weused HD 169916 as a reference spectrum, assuming that this star has a F (ν) ∼ ν2
flux distribution. The comparison with other calibration observations showed that theabsolute flux calibration is only accurate up to about 40%. The relative flux calibra-tion is much more accurate. The wavelength calibration provided by the EuropeanSouthern Observatory (ESO) on the TIMMI2 home page appeared to be inaccurate,and we determined a new wavelength calibration, based on the [Ariii] and [Siv] line,assuming a linear pixel to wavelength dependence. The fact that the [Navi] line andthe PAH features are now at the right wavelengths shows that our assumption is valid(using the calibration files provided by ESO the 11.3 µm PAH feature was found at11.7 µm). The comparison with the ISO spectrum (dashed line in Fig. 6.3), givesconfidence in the new wavelength calibration.
The spectrum is dominated by the forbidden emission lines of [Siv] and [Ariii].However the PAH features at 11.3 and also 8.6 µm are also found. The noise around9.5 µm is due to telluric lines.
The east and west slit are both probing the eastern lobe of the nebula (Fig. 6.4).The difference spectrum is very flat, apart from the [Siv] line. The fact that evenaround 8.6 and 11.3 µm it is flat, indicates that the distribution of the PAHs is quite
95

Chapter 6
Figure 6.3: TIMMI2 N-band spectra NGC 6302. The spectra were taken 1.2′′ east and 1.2′′
west of the brightest (east of the torus) lobe in the image. For comparison the ISO spectrum(divided by 5) is given as a dashed line. The relative flux calibration is quite accurate, butthe absolute flux calibration is only certain up to 40%. The difference spectrum of the westand east side of the lobe is also given. The lines around 9.5 µm are due to telluric lines.
constant in the bright eastern lobe. This is in agreement with the 3.3 µm imageobtained by Casassus et al. (2000).
6.3 Analysis of the ISO spectrum
The ISO Short Wavelength Spectrometer (SWS) and Long Wavelength Spectrome-ter (LWS) spectra have previously been presented (Barlow 1998; Molster et al.2001a, 2002b, and in Chapter 5 of this work). We briefly repeat the overall char-acteristics of the spectrum. The SWS and LWS apertures, which have sizes in therange 14′′ × 20′′ to 80′′, cover a large fraction of the nebula and therefore provideno detailed spatial information. The spectrum, shown in Fig. 6.5, is dominated by astrongly rising spectrum which peaks near 55 µm, and numerous, sometimes rathernarrow emission bands. Both the continuum and these emission bands are caused bythe circumstellar dust. In addition, strong, spectrally unresolved emission from fine-
96
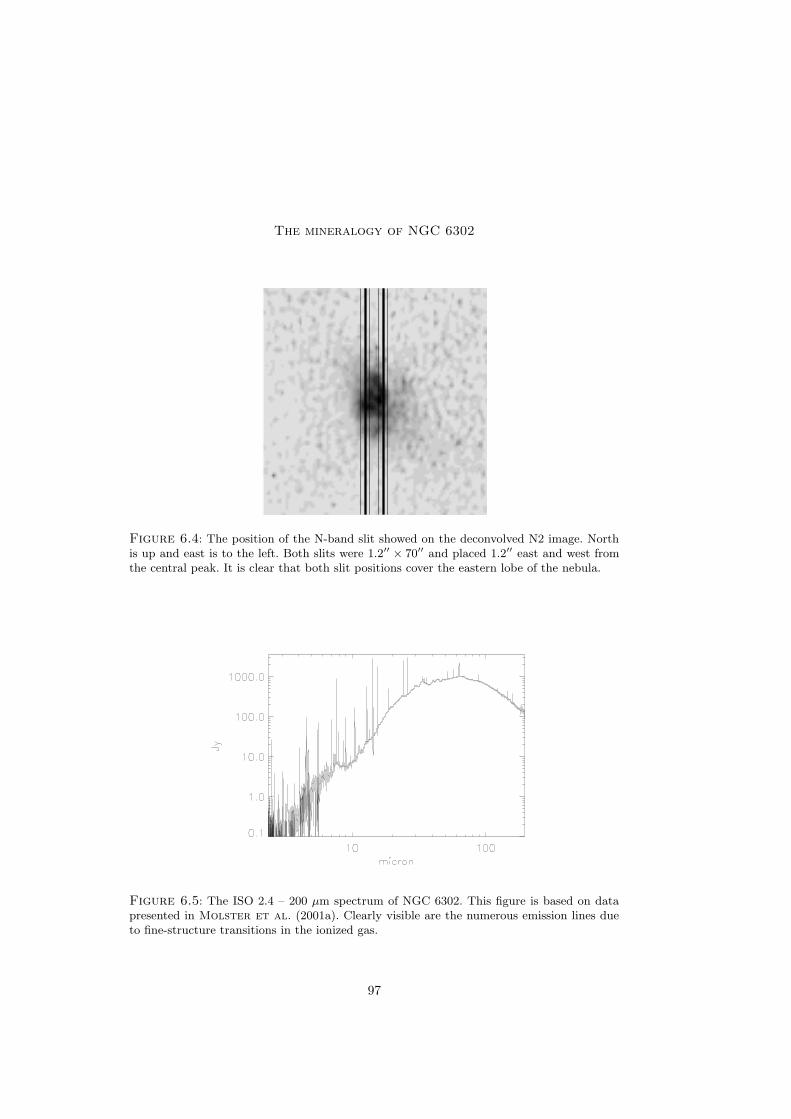
The mineralogy of NGC 6302
Figure 6.4: The position of the N-band slit showed on the deconvolved N2 image. Northis up and east is to the left. Both slits were 1.2′′
× 70′′ and placed 1.2′′ east and west fromthe central peak. It is clear that both slit positions cover the eastern lobe of the nebula.
Figure 6.5: The ISO 2.4 – 200 µm spectrum of NGC 6302. This figure is based on datapresented in Molster et al. (2001a). Clearly visible are the numerous emission lines dueto fine-structure transitions in the ionized gas.
97
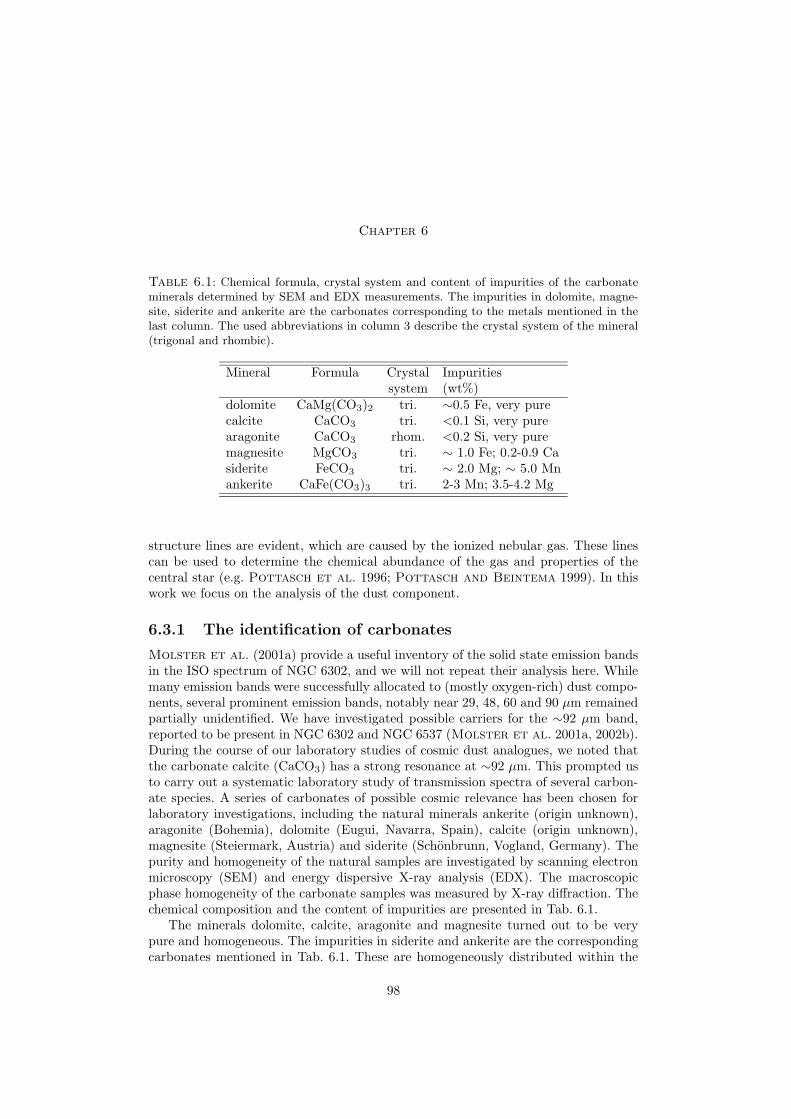
Chapter 6
Table 6.1: Chemical formula, crystal system and content of impurities of the carbonateminerals determined by SEM and EDX measurements. The impurities in dolomite, magne-site, siderite and ankerite are the carbonates corresponding to the metals mentioned in thelast column. The used abbreviations in column 3 describe the crystal system of the mineral(trigonal and rhombic).
Mineral Formula Crystal Impuritiessystem (wt%)
dolomite CaMg(CO3)2 tri. ∼0.5 Fe, very purecalcite CaCO3 tri. <0.1 Si, very purearagonite CaCO3 rhom. <0.2 Si, very puremagnesite MgCO3 tri. ∼ 1.0 Fe; 0.2-0.9 Casiderite FeCO3 tri. ∼ 2.0 Mg; ∼ 5.0 Mnankerite CaFe(CO3)3 tri. 2-3 Mn; 3.5-4.2 Mg
structure lines are evident, which are caused by the ionized nebular gas. These linescan be used to determine the chemical abundance of the gas and properties of thecentral star (e.g. Pottasch et al. 1996; Pottasch and Beintema 1999). In thiswork we focus on the analysis of the dust component.
6.3.1 The identification of carbonates
Molster et al. (2001a) provide a useful inventory of the solid state emission bandsin the ISO spectrum of NGC 6302, and we will not repeat their analysis here. Whilemany emission bands were successfully allocated to (mostly oxygen-rich) dust compo-nents, several prominent emission bands, notably near 29, 48, 60 and 90 µm remainedpartially unidentified. We have investigated possible carriers for the ∼92 µm band,reported to be present in NGC 6302 and NGC 6537 (Molster et al. 2001a, 2002b).During the course of our laboratory studies of cosmic dust analogues, we noted thatthe carbonate calcite (CaCO3) has a strong resonance at ∼92 µm. This prompted usto carry out a systematic laboratory study of transmission spectra of several carbon-ate species. A series of carbonates of possible cosmic relevance has been chosen forlaboratory investigations, including the natural minerals ankerite (origin unknown),aragonite (Bohemia), dolomite (Eugui, Navarra, Spain), calcite (origin unknown),magnesite (Steiermark, Austria) and siderite (Schonbrunn, Vogland, Germany). Thepurity and homogeneity of the natural samples are investigated by scanning electronmicroscopy (SEM) and energy dispersive X-ray analysis (EDX). The macroscopicphase homogeneity of the carbonate samples was measured by X-ray diffraction. Thechemical composition and the content of impurities are presented in Tab. 6.1.
The minerals dolomite, calcite, aragonite and magnesite turned out to be verypure and homogeneous. The impurities in siderite and ankerite are the correspondingcarbonates mentioned in Tab. 6.1. These are homogeneously distributed within the
98

The mineralogy of NGC 6302
Figure 6.6: Mass absorption coefficients (MAC) of natural carbonates derived from trans-mission measurements of the powders embedded in KBr and polyethylene. For clarity, thespectra have been multiplied by the factor indicated in the plot.
main mineral component.
Small carbonate grains with an average size smaller than 2 µm have been pro-duced by grinding and sedimentation in water-free acetone. In order to measure theinfrared spectrum over a wide spectral range the small grains were embedded intransparent material like KBr and polyethylene. Infrared spectroscopy was performedusing a Bruker 113v Fourier transform spectrometer in the wavelength range between2–200 µm. The infrared spectral behaviour of the carbonate minerals is demonstratedin Fig. 6.6, and can be found in digitized form in the Jena-St. Petersburg Databaseof Optical Constants (Henning et al. 1999).
Magnesite, siderite, ankerite, dolomite, and calcite belong to the carbonates of thecalcite group and crystallize in the trigonal crystal system. Carbonates containingcations with larger radii than Ca2+ crystallize in the rhombic crystal system. CaCO3
is dimorph and can exist in both structures as calcite and aragonite. The typicalcrystalline structure of the carbonates in the calcite group is characterized by analternating sequence of cation and anion layers. In both magnesite and calcite, theplane carbonate group consists of three oxygen located at the corners of an equilateraltriangle and a carbon in the centre. The bonding between C and O is covalent whereasthe bonding between the cations and the carbonate anion (CO3
2−) is mainly ionic.
99

Chapter 6
Each cation is octahedrally coordinated by six O atoms of the adjacent CO32− ion.
The crystals of the calcite group with mixed metal composition – like dolomite andankerite – show an alternating arrangement of the calcium and magnesium or calciumand iron layers. In contrast to the calcite structure the Ca2+ ion in aragonite iscoordinated by 9 O-atoms.
The infrared optical properties are determined by the crystalline structure of theminerals. The spectral behaviour of carbonates has been measured several times inprevious studies (e.g. Hellwege et al. 1970; Penman 1976; Orofino et al. 1997;Yamagishi et al. 2001). The measured mid-infrared bands arise mainly from thecarbonate anion. The planar structure of this anion and its C3 symmetry gives riseto three infrared active modes at about 7, 11 and 14 µm. The 7 µm band can beattributed to the C=O stretching mode whereas the 11 and 14 µm bands are causedby the out-of-plane and in-plane bending modes. The low frequency bands beyond25 µm are due to translation of the metal cations and represent motions perpendicularand parallel to the plane of the carbonate anions (Hellwege et al. 1970).
6.3.2 Dust model fit
Description of the model
We use the identified solid state components to quantitatively fit the entire ISO spec-trum. Inspection of the ISO data shows that all dust bands are in emission, suggestingthat the dust shell is optically thin at infrared wavelengths. This substantially sim-plifies the analysis. Given the complex geometry of the nebula, the multiple dustcomponents present in the spectrum, and the still incomplete knowledge of the dustspecies present, we decided to focus our analysis on determining the relative masscontributions of the known dust species, rather than attempting a full 2D radiativetransfer calculation. We use the optically thin nature of the dust at far-infrared wave-lengths to constrain the dust mass of the components, since these will not dependon the assumed geometry as long as the emission is optically thin. The problem thenreduces to deriving the temperature over mass distribution of the various dust com-ponents (e.g. Bouwman et al. 2000). The advantage of this method is that it doesnot require knowledge of the location of the dust.
We derive the dust mass and temperature distribution under the following as-sumptions: (1) The dust is optically thin (2) all grains have the same size; (3) allgrains are spherical; (4) the density gradient in the dust is a simple power law; (5) thedust species all have the same temperature ranges, limited by Tmin and Tmax, whichare free parameters. The result of our analysis is a temperature over mass distributionof all relevant dust species.
In case of an optically thin dust cloud, the specific intensity emitted by the dustin the cloud can in general be written as
Iν(T ) =
∫
V
αν Bν(T ) dV for τ � 1 (6.1)
100

The mineralogy of NGC 6302
where αν is the specific absorptivity. By integrating over volume V this can bewritten as
Iν(T ) = NσνBν(T ) or Iν(T ) = MdκνBν(T ) (6.2)
with the absorption cross-section can be described in terms of the geometric cross-section and absorption efficiency, according to σν = σgeomQν . Md is the total dustmass and κν is the mass absorption coefficient. The number of grains in the volumeis represented by N .
When we realize that we can write for the specific flux Fν = Iν/D2, and underthe assumption that the dust grains are identical spherical grains with a radius a, wefind
Fν(T ) =1
D2
1
ρd
3
4
1
aMd(T )QνBν(T ) (6.3)
with D the distance to the dust cloud and ρd the density of the material in thedust grain.
In case of a circumstellar dust shell, we may assume that the temperature anddensity distribution follow a power law:
T (r) = T0
( r
r0
)−q
(6.4)
ρ(r) = ρ0
( r
r0
)−p
(6.5)
where r represents the distance to the central star, and r0 the inner radius of thedust shell. Using dM = 4πr2ρ(r)dr, we can express M in terms of the temperaturedistribution in the dust shell, according to
Md(T (r)) =4πρ0r0
3
3 − p
(
T (r)
T0
)− 3−p
q
(6.6)
For spherical dust grains the density at the inner radius is ρ0 = 43πa2ρdn0, with
n0 the number density at the inner radius. This can be combined with Eqs. (6.6)and (6.3) to obtain an expression of the specific flux:
Fν(T ) =1
D2
4πa2r03n0
3 − p
(
T (r)
T0
)− 3−p
q
QνBν(T ) (6.7)
where the total observable flux Fν is given by
Fν =
∫
T
Fν(T ) dT (6.8)
101

Chapter 6
Figure 6.7: The warm and cool dust components required to fit the ISO spectrum ofNGC 6302. The thin line represents the ISO spectrum. The warm (100–118 K) and cool(30–60 K) dust components are represented by the labelled thick lines.
Fit parameters and dust composition
Following the analysis of Molster et al. (2001a), we assumed that enstatite(MgSiO3), forsterite (Mg2SiO4) and crystalline water ice are present, in addition toamorphous silicates. Diopside ((Ca,Mg)SiO3) is believed to contribute to the 60 µmcomplex (Koike et al. 2000). Diopside is in the form of a solid solution between wol-lastonite (CaSiO3) and enstatite (MgSiO3) in the number ratio 46:54, i.e. Wo46En54.In addition, we considered metallic iron as a dust component, which is found to bepresent in the dust shells of evolved stars (Chapter 4), and the carbonate species pre-sented in this work. Under the assumption that all dust grains are spherical and havea radius a of 0.1 µm, we have derived Qν values from laboratory measurements ofamorphous olivine (Dorschner et al. 1995); metallic iron (Henning and Stog-nienko 1996); forsterite and clino-enstatite (Koike et al. 1999); diopside (Koikeet al. 2000); water ice (Bertie et al. 1969; Warren 1984) and carbonates (thiswork).
Using Eqs. (6.7) and (6.8) the far-infrared spectrum was fitted, under the assump-tion that all dust species are found in the same temperature regimes. p and q arefree parameters, and when they were both chosen to be −1/2 the best results wereobtained. Inspection of the spectrum shows that the temperature distribution of thedust must be very wide, which is incompatible with a simple r−2 density distributionof the dust. We attempted to fit the spectrum with a single range of temperaturesbut were not successful; apart from a cool dust component (30–60 K), peaking near55 µm, we had to introduce a second dust component at 100–118 K dominating thespectrum between 10 and 30 µm (see Fig. 6.7).
102

The mineralogy of NGC 6302
The warm dust component could not consist of amorphous olivine, because thestrong resonances due to the Si-O stretching and O-Si-O bending modes at 9.7 an18 µm are not observed. Iron is used as the carrier of the warm continuum, but asPAHs have been detected in NGC 6302 (Molster et al. 2001a), amorphous carbon,instead of iron, could also explain the continuum emission. A mixed chemistry is notuncommon for evolved stars, it is for example seen in IRAS 09425−6040 (Molsteret al. 2001b). We conclude that the composition of the warm dust is different fromthe composition of the cool dust.
The exact composition of the cold amorphous dust is unknown. Amorphous olivineis used to produce the required continuum emission, but other abundant species witha smooth absorption spectrum at far-infrared wavelengths, such as pyroxene andiron, could be contributing as well. The mass fractions of forsterite and enstatite arelower limits. We used the laboratory data leading to the best spectral match withthe observations, i.e. those of Koike et al. (1999). However, in these datasets, thecrystalline silicate features are intrinsically much stronger (up to 5 times), than thesame features in measurements by other groups (Servoin and Piriou 1973; Steyer1974; Jager et al. 1998). Consequently, the crystallinity, defined by the mass ofenstatite and forsterite as a fraction of the total dust mass, lies within 5% – 25%, andthe values given in this work are thus just lower limits.
The previously unidentified 92 µm band (Molster et al. 2001a) can be fittedvery accurately with calcite (CaCO3), see Fig. 6.8. The strong resonances of calciteat shorter wavelengths (see Fig. 6.6 on p. 99) are not discernible in the ISO spectrum,indicating that it is not a significant component in the warm dust. Aragonite (CaCO3)also has a resonance at ∼92 µm, and may therefore contribute to the observed featurein NGC 6302. However it is not very likely to exist in a Planetary Nebula. Althoughit has the same chemical composition as calcite, its lattice structure is different, andit can only exist under relatively high pressure and temperature.
The 60 µm feature can be accurately fitted using absorption efficiencies ofdolomite, diopside and water ice (see Fig. 6.9 on p. 105). Ankerite (FeCO3) has aresonance at approximately the same wavelength (see Fig. 6.6 on p. 99) and couldin principle contribute to the 60 µm complex. However, solar system carbonates arealmost exclusively in the form of dolomite and calcite (Johnson and Prinz 1993;Brearley and Jones 1998) and therefore, we concentrated our analysis on dolomite.
The results of our model fit are shown in Fig. 6.8 and Tab. 6.2. Since the dustshell is optically thin, the relative mass fractions can be derived from the model fit.The absolute dust mass of each mineralogical component scales with the distance,and if 910 pc is adopted for the distance (Shaw and Kaler 1989), we arrive atthe dust masses as indicated in Tab. 6.2. We derived that the depletion of calciuminto the identified calcium bearing species – calcite, dolomite and diopside – is about30% (Chapter 5), if we assume a dust/gas mass ratio of 1/100 and adopt a calciumabundance of [Ca/H] = 2.2 · 10−6 (Snow 1984). From the fit to the 60 µm complexthe fraction of water contained in the solid phase can be calculated. Adopting a massratio of 1 ·10−3 between H2O and H2 (Gonzalez-Alfonso and Cernicharo 1999)we find that ∼ 10% of the water is contained in water ice. This is consistent with the
103

Chapter 6
Figure 6.8: Model fit to the ISO spectrum of NGC 6302. The thin line represents theobserved spectrum, the fit, consisting of the components given in Tab. 6.2, is indicatedwith the thick line. In the lower part of the plot, the contributions of the cold dust com-ponents (30–60 K) are indicated, except the contribution of amorphous olivine, which leadsto a smooth overall contribution. The emission from these minerals is already corrected forM(T ). The inset shows the observed spectrum (thin line) and the model fit (thick line) from80–120 µm, where the contributions of all species, except calcite, are subtracted from boththe observations and the model. Thus, it only shows the observed and modelled calcite 92µm feature. Figure adopted from Chapter 5.
104
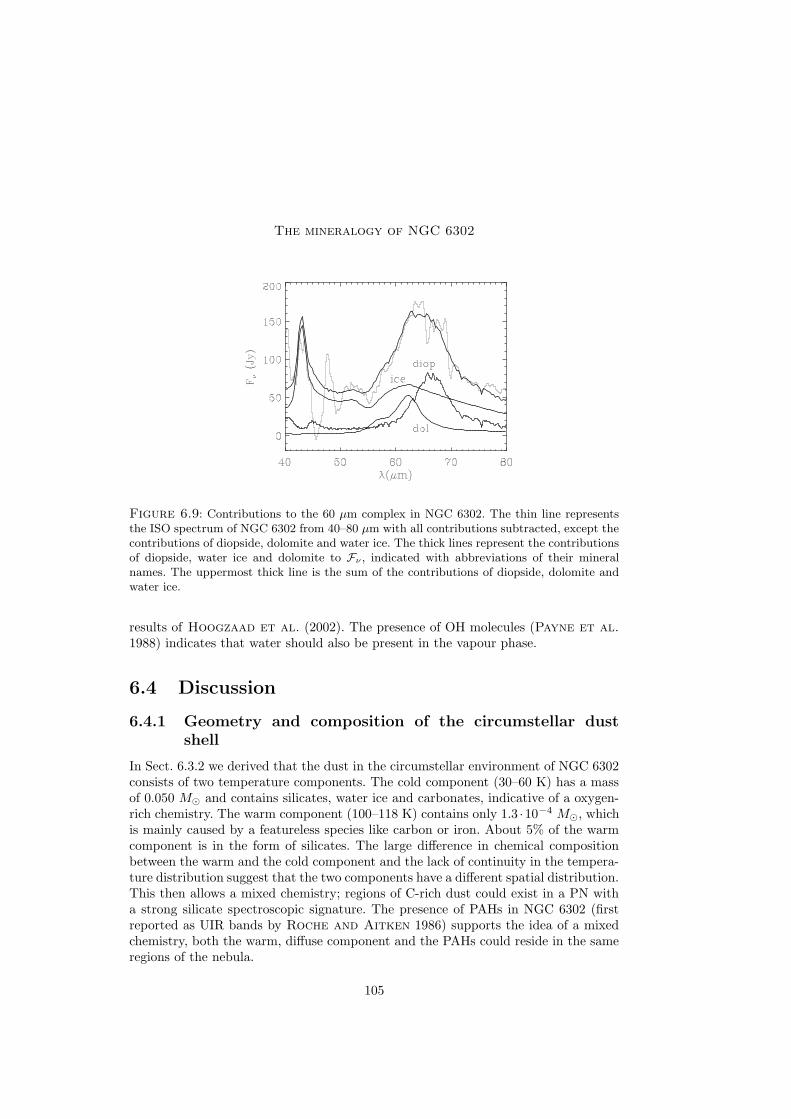
The mineralogy of NGC 6302
Figure 6.9: Contributions to the 60 µm complex in NGC 6302. The thin line representsthe ISO spectrum of NGC 6302 from 40–80 µm with all contributions subtracted, except thecontributions of diopside, dolomite and water ice. The thick lines represent the contributionsof diopside, water ice and dolomite to Fν , indicated with abbreviations of their mineralnames. The uppermost thick line is the sum of the contributions of diopside, dolomite andwater ice.
results of Hoogzaad et al. (2002). The presence of OH molecules (Payne et al.1988) indicates that water should also be present in the vapour phase.
6.4 Discussion
6.4.1 Geometry and composition of the circumstellar dustshell
In Sect. 6.3.2 we derived that the dust in the circumstellar environment of NGC 6302consists of two temperature components. The cold component (30–60 K) has a massof 0.050 M� and contains silicates, water ice and carbonates, indicative of a oxygen-rich chemistry. The warm component (100–118 K) contains only 1.3 ·10−4 M�, whichis mainly caused by a featureless species like carbon or iron. About 5% of the warmcomponent is in the form of silicates. The large difference in chemical compositionbetween the warm and the cold component and the lack of continuity in the tempera-ture distribution suggest that the two components have a different spatial distribution.This then allows a mixed chemistry; regions of C-rich dust could exist in a PN witha strong silicate spectroscopic signature. The presence of PAHs in NGC 6302 (firstreported as UIR bands by Roche and Aitken 1986) supports the idea of a mixedchemistry, both the warm, diffuse component and the PAHs could reside in the sameregions of the nebula.
105
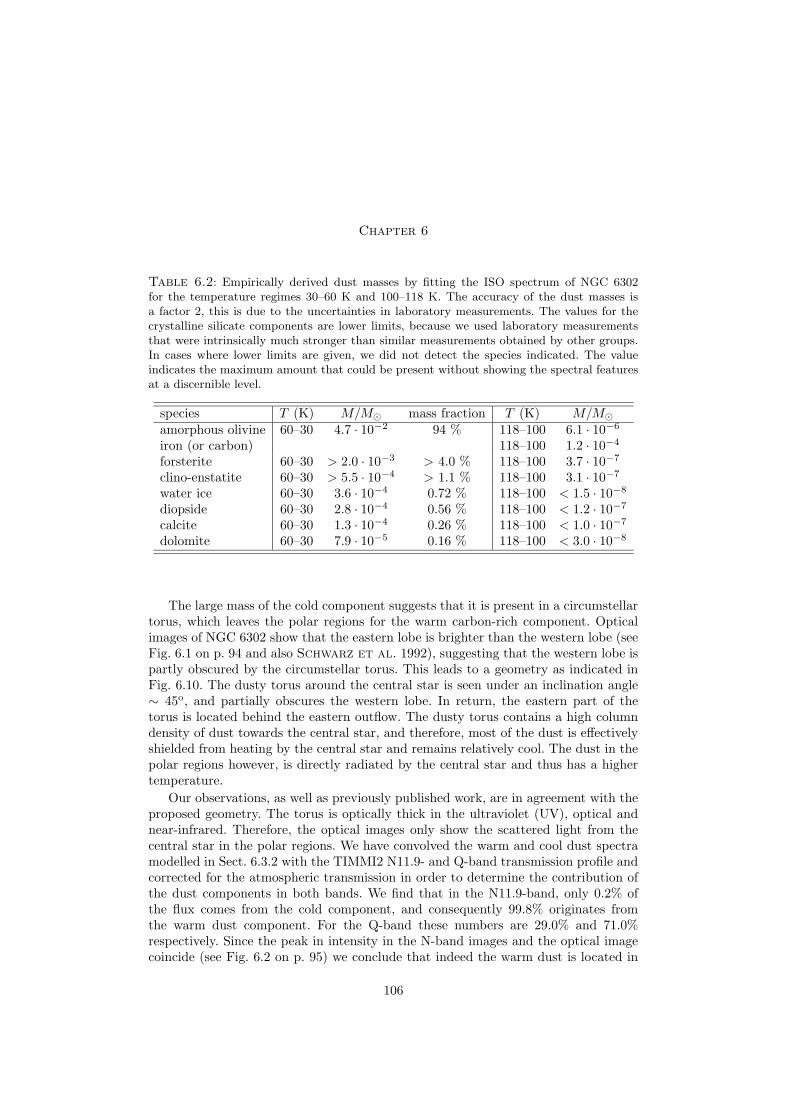
Chapter 6
Table 6.2: Empirically derived dust masses by fitting the ISO spectrum of NGC 6302for the temperature regimes 30–60 K and 100–118 K. The accuracy of the dust masses isa factor 2, this is due to the uncertainties in laboratory measurements. The values for thecrystalline silicate components are lower limits, because we used laboratory measurementsthat were intrinsically much stronger than similar measurements obtained by other groups.In cases where lower limits are given, we did not detect the species indicated. The valueindicates the maximum amount that could be present without showing the spectral featuresat a discernible level.
species T (K) M/M� mass fraction T (K) M/M�
amorphous olivine 60–30 4.7 · 10−2 94 % 118–100 6.1 · 10−6
iron (or carbon) 118–100 1.2 · 10−4
forsterite 60–30 > 2.0 · 10−3 > 4.0 % 118–100 3.7 · 10−7
clino-enstatite 60–30 > 5.5 · 10−4 > 1.1 % 118–100 3.1 · 10−7
water ice 60–30 3.6 · 10−4 0.72 % 118–100 < 1.5 · 10−8
diopside 60–30 2.8 · 10−4 0.56 % 118–100 < 1.2 · 10−7
calcite 60–30 1.3 · 10−4 0.26 % 118–100 < 1.0 · 10−7
dolomite 60–30 7.9 · 10−5 0.16 % 118–100 < 3.0 · 10−8
The large mass of the cold component suggests that it is present in a circumstellartorus, which leaves the polar regions for the warm carbon-rich component. Opticalimages of NGC 6302 show that the eastern lobe is brighter than the western lobe (seeFig. 6.1 on p. 94 and also Schwarz et al. 1992), suggesting that the western lobe ispartly obscured by the circumstellar torus. This leads to a geometry as indicated inFig. 6.10. The dusty torus around the central star is seen under an inclination angle∼ 45o, and partially obscures the western lobe. In return, the eastern part of thetorus is located behind the eastern outflow. The dusty torus contains a high columndensity of dust towards the central star, and therefore, most of the dust is effectivelyshielded from heating by the central star and remains relatively cool. The dust in thepolar regions however, is directly radiated by the central star and thus has a highertemperature.
Our observations, as well as previously published work, are in agreement with theproposed geometry. The torus is optically thick in the ultraviolet (UV), optical andnear-infrared. Therefore, the optical images only show the scattered light from thecentral star in the polar regions. We have convolved the warm and cool dust spectramodelled in Sect. 6.3.2 with the TIMMI2 N11.9- and Q-band transmission profile andcorrected for the atmospheric transmission in order to determine the contribution ofthe dust components in both bands. We find that in the N11.9-band, only 0.2% ofthe flux comes from the cold component, and consequently 99.8% originates fromthe warm dust component. For the Q-band these numbers are 29.0% and 71.0%respectively. Since the peak in intensity in the N-band images and the optical imagecoincide (see Fig. 6.2 on p. 95) we conclude that indeed the warm dust is located in
106

The mineralogy of NGC 6302
OH maser
N
E
cool dust
warm dustPAHsscattered light
Figure 6.10: Proposed geometry of NGC 6302. A dense torus of cool dust is present aroundthe central star (light grey) under an inclination of 45o with respect to the line-of-sight. Morediffuse material in the polar regions, is indicated in dark grey. The torus obscures the polarregion on the western side. A part of the torus is located behind the eastern lobe. Theemission from the warm dust and PAHs originates from the lobes, as well as scattered lightfrom the central star. The torus contains the cool dust and the OH maser. For clarity theapproximate position of the central star is indicated, however in reality it is obscured by thedusty torus and can only be studied in scattered light from the polar regions.
the polar regions. The Q-band imaging reveals a different picture; one third of theflux originates from the cool dust component, and two third from the warm dust.Both the warm dust in the eastern lobe, and the cool dust in the western part of thetorus contribute to the observed image, leading to a more or less spherical structurein this wavelength band (Fig. 6.1 on p. 94).
N-band spectroscopy of the eastern lobe shows PAH emission. From Fig. 6 of(Casassus et al. 2000, figure is rotated by 180o) it is clear that the PAH emissionintensity peak coincides with the intensity peak in the optical and N-band, indicatingthat the PAH emission also arises from the lobes, where UV radiation from the centralstar can penetrate. The UV radiation field also explains the ionization observed inthe lobes (Fig. 6.3 on p. 96). Persi et al. (1999) also notice that the emission ofwarm dust grains and forbidden line transitions emerges from the same region. The6cm data presented by Gomez et al. (1989) traces the location Hii region. In theirFig. 3 the region confined by the torus is clearly visible.
On the other hand, the optically thick torus around the central star effectivelyshields the molecular material in the torus from the high energy radiation. The in-frared radiation field in the torus will pump OH molecules present and cause theformation of OH masers. Indeed, OH maser emission is observed in NGC 6302, on thewest side of the object (Payne et al. 1988), indicating that it arises from part ofthe torus located at the front side of the object. This is consistent with the fact that
107
Chapter 6
predominantly the blue-shifted part of the line profile is seen (Payne et al. 1988).
Validity of model assumptions
The geometry described here is consistent with the assumptions we have used to fitthe ISO spectrum, and with the TIMMI2 images. Here we will discuss the validity ofthe assumptions used in this model.
i) We assumed that the dust is optically thin at large wavelengths. The TIMMI2images indeed suggest that this is true: the torus is still visible as a dark lane inthe N-band images but starts to disappear when NGC 6302 is observed in theQ-band. At longer wavelengths, where the spectral energy distribution peaks andthe different solid state species are identified, the dust torus will be optically thin.
A simplified calculation verifies this: The dust is thought to be present in a torus,with a scale height h from the equatorial plane and an outer radius Rout. Theinner radius is small compared to the outer radius and can be ignored. The torusis seen under an inclination angle of 45o (Bohigas 1994). The length of the line-of-sight through the disk is thus l = 2h
√2. Assuming that the density is constant
throughout the disk, we find for the infrared optical depth along this line-of-sight:
τIR = Qnσgeom 2h√
2 (6.9)
where
n =Md
Mgrain
1
2hπRout2 (6.10)
The dust contained in the torus is Md = 0.05 M�. The mass of a grain followsfrom the used grain size of 0.1 µm, and the average density of silicate grains. Usingcgs units, we find that the torus is optically thin in the mid- and far-infrared incase
QIR
Rout2 < 1.1 · 10−36 (6.11)
For a typical value of QIR in the mid- and far-infrared of 0.0028 we find thatfor Rout > 5.0 · 1016 cm, or 3.4 · 103 AU, the dusty torus is optically thin atthese wavelengths. This is size is not unreasonable for a circumstellar torus, asit is comparable to the sizes of the dust shell shells around AGB stars, the PNprogenitors. In addition, we can argue that the density distribution will not beflat, but probably behaves more like a power law. Then, most lines-of-sight throughthe torus will be optically thin even in case of a smaller torus. Therefore, we areconfident that the torus is indeed optically thin in the mid- and far-infrared.
108
The mineralogy of NGC 6302
ii) We assumed that all grains have a size of 0.1 µm. In reality, the grains formedin the circumstellar environment will cover a wide range of sizes. However, webelieve that we actually get a good estimate of the actual dust masses, because weuse the mass absorption coefficients. The MAC will lead to a direct determinationof the dust mass, without calculating the mass of individual grains. The calciteand dolomite data presented in this work are MACs, the data used for diopside,enstatite and forsterite are measured in terms of absorption efficiency Q/a. Foramorphous olivine, metallic iron and water ice we used optical constants, andderived absorption efficiency for grains with a size of 0.1 µm. Only the mass deter-mination of these three species is probably somewhat affected by our assumptionon the grain size.
iii) We assumed that all grains are spherical. Again an assumption that is probablynot very realistic. The dominant dust component (amorphous olivine) must be inthe form of non-spherical particles to explain the infrared-spectrum of AGB stars,and the same is true for metallic iron (Chapter 4). As AGB stars are the directprogenitors of PNe, the dust grains in the two types of objects probably havesimilar properties, and thus are the grains in NGC 6302 very likely not spherical.However, in our model the only purpose of the grain shape is to calculate the totalmass of some of the dust components. The effect that grain shape has on lightscattering is not taken into account, as our model uses MACs.
iv) We assumed that the density and temperature gradients are simple power lawsof the distance to the central star. The complex structure of NGC 6302 indicatesthat this is probably far besides the truth, but since the optical depth is low, allinfrared radiation emitted by the grains is received. Therefore not the density andtemperature as a function of distance to the central star, but the mass-temperaturerelation of the different dust species becomes important, in a similar fashion asdescribed by Bouwman et al. (2000). Our simulation of this relation by a powerlaw density and temperature gradient seems to be in agreement with the observedspectrum.
v) Finally we assumed that all dust species are found in the same temperature range.However, if the different dust components are not in thermal contact with eachother, i.e. if they are present in separate – but co-spatial – grain populations,the difference in optical properties causes a difference in the temperature profile(Bouwman et al. 2000, and Chapter 3 of this thesis). The determination of thetemperature range is based on the overall shape of the spectral energy distribution,and we forced the crystalline components – which are the carriers of the narrowfeatures superposed on the broad continuum – to have the same temperatureprofile as the amorphous component. Since the dust emission strongly dependson the temperature of the grains, this will probably be our main source of errorin our mass estimates. However, dropping the constraint that all dust species arefound in the same temperature range, leads to a large increase in free parametersfor our simple model and might lead to unphysical results.
109
Chapter 6
Considering all the effects discussed here, we estimate that our absolute massdeterminations are accurate within a factor of two, if the distance towards NGC 6302is 910 pc. If we take into account the large uncertainty in the distance determinations,the error in the absolute dust mass determination further increases. The uncertaintyin the various laboratory measurements introduces an additional uncertainty of afactor of two (see Sect. 6.3.2), leading to a total accuracy of a factor of four. Therelative dust masses, however, are independent of the distance towards NGC 6302,and are also less affected by our model assumptions. We estimate the error in therelative dust mass fractions of the order of 50%.
In order to further approach reality, full radiative transfer calculations shouldbe performed. Using spatial information derived from imaging and measurementsof outflow velocities it is possible to reconstruct the geometry of the nebula. With2-dimensional full radiative transfer calculations it is possible to resolve the tempera-ture and density distribution throughout the PN, for the different dust components.Also, the effect of grain sizes and grain shapes then becomes apparent in the spec-troscopy. This will lead to a much more accurate description of the properties of thedust in the nebula. However, we chose not to do these calculations for the followingreasons: First, optical constants are not available for some of the identified dust com-ponents. Second, our knowledge about the geometry of the nebula is still too limitedto justify the huge effort of 2-dimensional radiative transfer calculations. These calcu-lations introduce new free parameters, and it will be very hard to constrain the modelparameters in an unambiguous way with the limited information available. Spatiallyresolved spectroscopy of the mid- and far-infrared regions will certainly improve theimage we have of NGC 6302. Finally, to obtain reliable mass estimates the distancetowards NGC 6302 should be more accurately known.
6.4.2 The astronomical relevance of carbonates
In Chapter 5 and this chapter, we present the first extrasolar detection of carbonates.The detection is based on far-infrared features of carbonate at 92 µm and dolomite,which contributes to the 60 µm complex. Due to the low abundances, the strong res-onances present at short wavelengths (see Fig. 6.6 on p. 99) do not stand out in thespectra, as many other species contribute significantly to the opacity at these wave-lengths. This is not the case at the far-infrared wavelengths, therefore it is possibleto detect even very small amounts of carbonates, beyond reasonable doubt.
There have been a number of searches for carbonate features in the mid-infrared.The previously unidentified infrared (UIR) feature at 11.3 µm seen in planetary nebulaNGC 7027 was attributed to carbonates (Gillett et al. 1973; Bregman andRank 1975). However, this identification became unlikely with the non-detection ofthe 6.8 µm carbonate feature in NGC 7027 (Russell et al. 1977b), and the lackof characteristic features due to carbonates in the 22–35 µm region of the spectrum(McCarthy et al. 1978). The UIR feature at 11.3 µm in HD 44179, also known asthe Red Rectangle, was attributed to the carbonate magnesite (MgCO3) (Bregman1977). However, Cohen et al. (1986) showed PAHs are the most likely carrier of
110
The mineralogy of NGC 6302
the UIR feature at 11.3 µm seen in various astrophysical environments. Thus, the soledetection of the 11.3 µm feature is no longer considered evidence for the presence ofcarbonates.
Interesting environments to search for carbonates are star forming regions andyoung stars. Carbonates form easily on the surface of planets when liquid water ispresent, but other formation mechanisms cannot be excluded (Chapter 5). Russellet al. (1977a) have determined an upper limit to the carbonate/silicate mass ratio inthe interstellar medium towards Orion. They find that the this mass ratio is at most0.05, based on the detection limit of the 6.8 µm feature. The 6.8 µm feature is seen inabsorption towards embedded protostars. The resemblance of the spectral appearanceof the 6.8 µm feature in W33A and in Interplanetary Dust Particles (IDPs) has leadto the conclusion that they have the same carrier, most likely carbonates (Sandfordand Walker 1985; Tomeoka and Buseck 1986), although Tielens et al. (1984)argue that it is due to hydrocarbons. Cox (1989) observes the 6.8 µm feature towardsprotostar AFGL 961 and claims that it is partially due to carbonates along with acontribution of hydrocarbons. Hints of the 11.3 and 13.4 µm carbonate features arealso claimed to be present. The similarity between the 6.8 µm features in IDPs and ininterstellar lines-of-sight is reported by Quirico et al. (2000) as well, presumablycoming from the same carrier, although carbonates are rejected as a carrier. Fromthe high resolution ISO SWS spectroscopy it becomes clear that the spectral shapeof the 6.8 µm absorption feature observed towards protostars cannot be explained bycarbonates, but a satisfactory alternative is still lacking (Keane et al. 2001).
Although extraterrestrial carbonates are quite often found in meteorites and IDPs,they are actually not easy to detect by means of astronomical observations. The onlyclaim still standing at the moment is the detection of features at 26.5 and 31 µm dueto dolomite and calcite respectively in the ISO SWS spectrum of Mars (Lellouchet al. 2000). However, the far-infrared features of dolomite and calcite at ∼60 and∼92 µm are not seen on Mars (Burgdorf et al. 2000).
As pointed out in Chapter 5, until now carbonates are believed to be formedthrough aqueous alteration. In this formation process, carbon dioxide (CO2) dissolvesin liquid water and forms carbonate ions (CO3
2−). If cations like Ca2+ or Mg2+ arefound in the solution as well, carbonates can be formed as a lake sediment when satu-ration is reached. The presence of carbonates is seen as evidence of planet formation,as an atmosphere containing carbon dioxide is required, as well as liquid water on thesurface of the planet. The connection with planet formation is the justification forthe (so far fruitless) search for carbonates in the circumstellar environment of youngstars. Carbonates are ubiquitous in our own solar system, as is shown from the compo-sition studies of meteorites and interplanetary dust particles. Carbonate-containingmeteorites are considered tracers of the formation history of the solar system (e.g.Endress et al. 1996; Bischoff 1998). However, the detection of carbonates inPNe suggests that alternative formation mechanisms exist and that the presence ofcarbonates no longer provides direct evidence for planet formation (Chapter 5).
111
Chapter 6
6.5 Summary
We have determined the composition and distribution of the dust in the planetarynebula NGC 6302. We found that a warm (100-118 K) and a cool (30-60 K) dustcomponent are present. The cool dust component is located in a circumstellar torusof which the inner part effectively shields the UV/optical and near-infrared radiationfrom the central star. The torus contains amorphous olivine, forsterite, clino-enstatite,water ice, diopside, dolomite and calcite. Outside the solar system, the carbonatesdolomite and calcite are only seen in NGC 6302 and NGC 6537 (see also Chapter 5),and the formation mechanism of carbonates in these environments is not yet under-stood. Diopside is so far only found in NGC 6302 (Koike et al. 2000) and in twoOH/IR stars (Demyk et al. 2000). Water ice, forsterite, enstatite and amorphousolivine are very common in the dust shells of evolved stars (e.g. Molster et al.2002a,b,c). The circumstellar torus also contains the OH maser reported by Payneet al. (1988).
The optical depth in the polar regions is smaller, and therefore, these regionscan be observed in the optical in scattered light from the central star. These regionscontain the warm dust component, which thermally emits in the mid-infrared. TheN-band images are dominated by thermal emission from the warm dust. From the ISOspectroscopy, constraints on the dust composition could be derived: predominantlymetallic iron (or another featureless dust component), amorphous olivine, forsteriteand clino-enstatite are detected. For water ice, diopside, calcite and dolomite wehave derived upper limits for the mass fraction in the warm component. Only 0.3%of the total dust mass is contained in the warm component, which has a differentmineralogical composition than the cool component. UV radiation can penetrate thepolar regions and thus we are able to explain the observed PAH emission, which isalso reported by Casassus et al. (2000).
In addition, the mass absorption coefficients of carbonate minerals are presentedin this work. We studied calcite, dolomite, ankerite, aragonite siderite and magnesite.
Acknowledgements. We thank M. Matsuura for the TIMMI2 observations and A. de Koterfor useful discussions. We are grateful for the support by the staff of the ESO 3.6m telescope.This work is based on observations with ISO, an ESA project with instruments funded byESA Member States (especially the PI countries: France, Germany, the Netherlands and theUnited Kingdom) with the participation of ISAS and NASA. LBFMW and FK acknowledgefinancial support from an NWO ’Pionier’ grant. This work was partly supported by NWOSpinoza grant 08-0 to E.P.J. van den Heuvel.
112

Chapter 7
Mass loss and rotational COemission from AsymptoticGiant Branch stars
To be submitted to Astronomy & Astrophysics
F. Kemper, R. Stark, K. Justtanont, A. de Koter, A.G.G.M. Tielens
and L.B.F.M. Waters
ABSTRACTWe present submillimeter observations of rotational transitions of carbonmonoxide from J = 2 → 1 up to 7 → 6 for a sample of Asymptotic GiantBranch stars and red supergiants. It is the first time that the high transitions6 → 5 and 7 → 6 are included in such a study. With line radiative transfercalculations, and assuming a standard physical structure of the circumstel-lar outflow, we aimed to determine the mass-loss history of these stars byfitting the CO line intensities. We find that the observed line intensities ofthe high transitions, including the 4 → 3 transition, were significantly lowerthan the values predicted by standard model calculations. We conclude thatthe physical structure of the outflow of Asymptotic Giant Branch stars ismore complex than previously thought. In order to understand the observedline intensities and line profiles, a physical structure with at least a variablemass-loss rate and/or a gradient in stochastic gas velocity should be takenas input for the radiative transfer calculations. A case study of WX Psc isperformed. We find that the CO line strengths may possibly be explained byvariations in the mass-loss rate on time scales similar to those observed in theseparated arc-like structures observed around post-AGB stars. A gradient inthe stochastic velocity may also play a role.
7.1 Introduction
Low and intermediate mass stars (1M� < M < 8M�) end their life on the red giantbranch and asymptotic giant branch (AGB; see Habing 1996, and references herein).
113
Chapter 7
During this AGB phase, the stars have very extended tenuous atmospheres and shedalmost their entire hydrogen-rich envelope through a dense and dusty stellar wind.In case of OH/IR stars, mass-loss rates can be so high that the dust shell completelyobscures the central star, and the object is observable only at infrared wavelengthsand through molecular line emission at radio wavelengths. The AGB phase is oneof the few occasions in stellar evolution when time scales are not driven by nuclear(shell) burning but by surface mass loss. Helped by the low surface gravity, gas canmove away from the star and will gradually cool. When the temperature drops below∼1400 K, dust formation occurs, and a dust driven wind will develop. The mass-lossrates increase from M ≈ 10−7 to a few times 10−5 M� yr−1, while the AGB starevolves from the Mira phase to an OH/IR star (van der Veen and Habing 1988).More recently however, it is believed that higher mass-loss rates can be achievedfor oxygen-rich AGB stars. Justtanont et al. (1996b) suggest that OH 26.5+0.6has undergone a recent increase in mass loss, leading to a current mass-loss rateof 5.5 · 10−4 M� yr−1. Moreover, it was shown that another oxygen-rich AGB star,IRAS 16342−3814, has a mass-loss rate of ∼10−3 M� yr−1 (Dijkstra et al., inprep.).
AGB stars are important contributors of dust to the interstellar medium (ISM);it is estimated that approximately two thirds of the interstellar dust is produced byoxygen-rich AGB stars (Gehrz 1989). In the outflow of evolved stars with an oxygen-rich chemistry the dust composition is dominated by silicates, both amorphous andcrystalline (see e.g. Chapter 2 and Molster 2000). The appearance of crystallinesilicate features in the far-infrared spectra of AGB stars seems to be correlated witha high optical depth in the amorphous silicate resonance at 9.7 µm and hence ahigh mass-loss rate (Waters et al. 1996; Cami et al. 1998, and Chapter 2 ofthis thesis). This could be interpreted as evidence that a certain threshold value forthe density is required to form crystalline silicates. However, in Chapter 3 we showedthat observational selection effects may play an important role in detecting crystallinesilicates in AGB stars with low mass-loss rates. Therefore, the relation between mass-loss rate and crystallinity remains unclear at present.
In order to further study the correlation between the wind density and the dustcomposition, reliable mass-loss rates should be determined. Mass loss rates of AGBstars can be obtained from the thermal emission from dust, predominantly comingfrom the warm inner regions (e.g. Bedijn 1987). They can also be inferred from ob-servations of molecular transitions, in particular from CO (e.g. Knapp and Morris1985). A catalogue compiled by Loup et al. (1993) lists observations of the COJ = 1 → 0 and J = 2 → 1 transitions of both O-rich and C-rich AGB stars. Themass-loss rates of a large number of objects from the catalogue are derived. How-ever, the derived mass-loss rates seem to be underestimated for OH/IR stars. Heskeet al. (1990) have studied the correlation between IRAS colours and mass-loss ratesderived from J = 2 → 1 and J = 1 → 0 observations. In the case of very massive dustshells, they find that the intensity of the J = 1 → 0 transition is too low compared tothe J = 2 → 1 transition, which they suspect to be due to a mass-loss rate increaseover time. This then hints towards a superwind phase, which is generally believed to
114
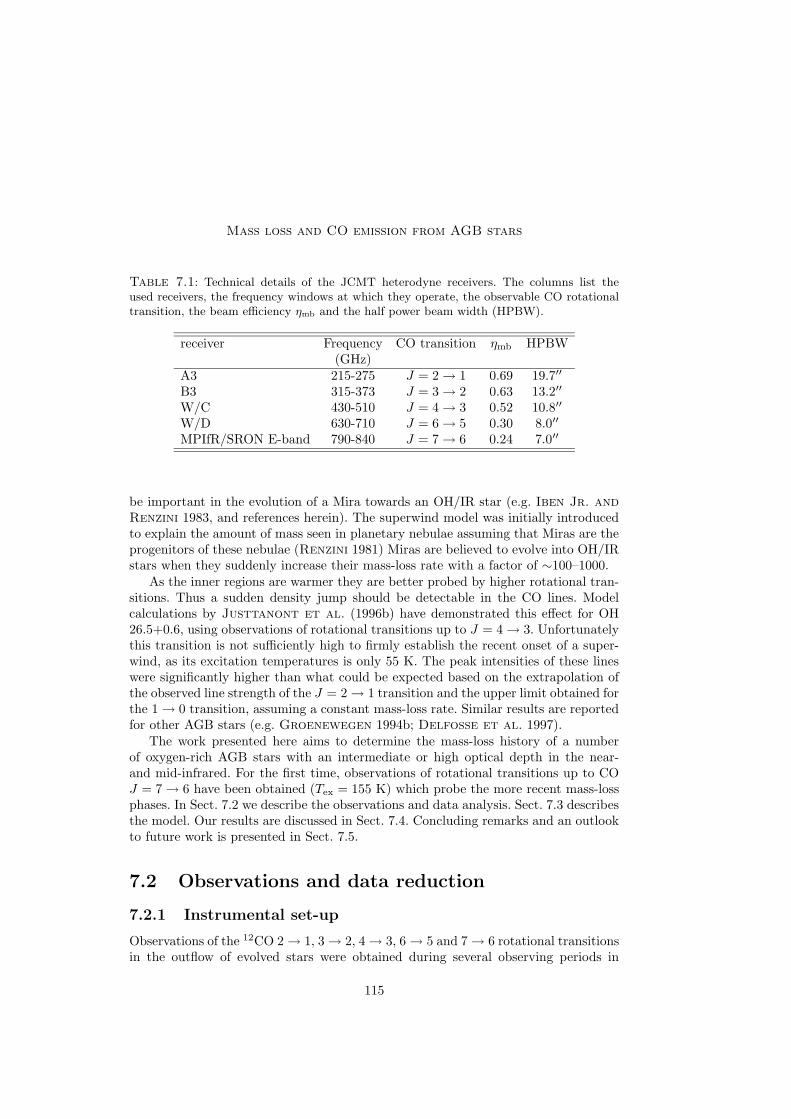
Mass loss and CO emission from AGB stars
Table 7.1: Technical details of the JCMT heterodyne receivers. The columns list theused receivers, the frequency windows at which they operate, the observable CO rotationaltransition, the beam efficiency ηmb and the half power beam width (HPBW).
receiver Frequency CO transition ηmb HPBW(GHz)
A3 215-275 J = 2 → 1 0.69 19.7′′
B3 315-373 J = 3 → 2 0.63 13.2′′
W/C 430-510 J = 4 → 3 0.52 10.8′′
W/D 630-710 J = 6 → 5 0.30 8.0′′
MPIfR/SRON E-band 790-840 J = 7 → 6 0.24 7.0′′
be important in the evolution of a Mira towards an OH/IR star (e.g. Iben Jr. andRenzini 1983, and references herein). The superwind model was initially introducedto explain the amount of mass seen in planetary nebulae assuming that Miras are theprogenitors of these nebulae (Renzini 1981) Miras are believed to evolve into OH/IRstars when they suddenly increase their mass-loss rate with a factor of ∼100–1000.
As the inner regions are warmer they are better probed by higher rotational tran-sitions. Thus a sudden density jump should be detectable in the CO lines. Modelcalculations by Justtanont et al. (1996b) have demonstrated this effect for OH26.5+0.6, using observations of rotational transitions up to J = 4 → 3. Unfortunatelythis transition is not sufficiently high to firmly establish the recent onset of a super-wind, as its excitation temperatures is only 55 K. The peak intensities of these lineswere significantly higher than what could be expected based on the extrapolation ofthe observed line strength of the J = 2 → 1 transition and the upper limit obtained forthe 1 → 0 transition, assuming a constant mass-loss rate. Similar results are reportedfor other AGB stars (e.g. Groenewegen 1994b; Delfosse et al. 1997).
The work presented here aims to determine the mass-loss history of a numberof oxygen-rich AGB stars with an intermediate or high optical depth in the near-and mid-infrared. For the first time, observations of rotational transitions up to COJ = 7 → 6 have been obtained (Tex = 155 K) which probe the more recent mass-lossphases. In Sect. 7.2 we describe the observations and data analysis. Sect. 7.3 describesthe model. Our results are discussed in Sect. 7.4. Concluding remarks and an outlookto future work is presented in Sect. 7.5.
7.2 Observations and data reduction
7.2.1 Instrumental set-up
Observations of the 12CO 2 → 1, 3 → 2, 4 → 3, 6 → 5 and 7 → 6 rotational transitionsin the outflow of evolved stars were obtained during several observing periods in
115
Chapter 7
2000 and 2001 using the James Clerk Maxwell Telescope (JCMT) on Mauna Kea,Hawaii. For this purpose, all five different heterodyne receivers available at the JCMTwere used, including the new MPIfR/SRON E-band receiver which operates in the790–840 GHz frequency range. A description of this new receiver is given in Sect. 7.2.2.The technical details and beam properties of the JCMT set up with the appropriateheterodyne receivers are summarized in Tab. 7.1. Observations with the B3- and W-receivers were performed in double sideband (DSB) and dual polarization mode. TheDSB mode was also used for the observations with the MPIfR/SRON E-band receiver.The bandwidth configuration of the receiver, and hence the spectral resolution wasdetermined by the expected line width of the CO lines. We used bandwidths of atleast twice the expected line width to have a sufficiently broad region for baselinesubtraction. Estimates for the line width – which is determined by the outflow velocity– were based on published values of line widths of the CO J = 1 → 0 transition (e.g.Loup et al. 1993, and references herein).
We used the beam-switching technique to eliminate the background. The sec-ondary mirror was chopped in azimuthal direction over an angle of 120′′. Over thesesmall angles the noise from the sky is assumed to be constant. In case of extendedsources we used a beam-switch of 180′′.
7.2.2 The MPIfR/SRON 800 GHz receiver
The observations of the CO J = 7 → 6 line were made with the MPIfR/SRON800 GHz receiver in October 2001. This PI system is in operation at the JCMTCassegrain focus cabin since spring 2000. The receiver consists of a single-channelfixed-tuned waveguide mixer with a diagonal horn. The mixer consists of a Nb SISjunction with NbTiN and Al wiring layers fabricated at the University of Gronin-gen, The Netherlands. Details on the fabrication of similar devices can be found inJackson et al. (2000). Measured receiver temperatures at the cryostat window areTRx ' 550 K DSB. The receiver has an intermediate frequency of 2.5 − 4 GHz. Sys-tem temperatures including atmospheric losses varied between 6000–14000 K (SSB)at the time of the observations. The beam shape and efficiency have been determinedthrough observations of Mars and yield a deconvolved half power beam width (HPBW)of 7′′ and a main beam efficiency ηmb of 24%. The absolute calibration uncertainty isestimated at 30%.
7.2.3 Observations and data reduction
Our sample of evolved stars is given in Tab. 7.2, which also indicates the distancestowards the programme stars. The sample includes AGB stars and supergiants. InTab. A.1 (see p. 143) an overview of the observed transitions is given, including cu-mulative integration times and the observing date. The data were obtained over along period from March 2000 until October 2001 in flexible observing mode. Duringthe observations, spectra of CO spectral standards used at the JCMT were also ob-tained. If necessary, a multiplication factor was applied to the observations of our
116
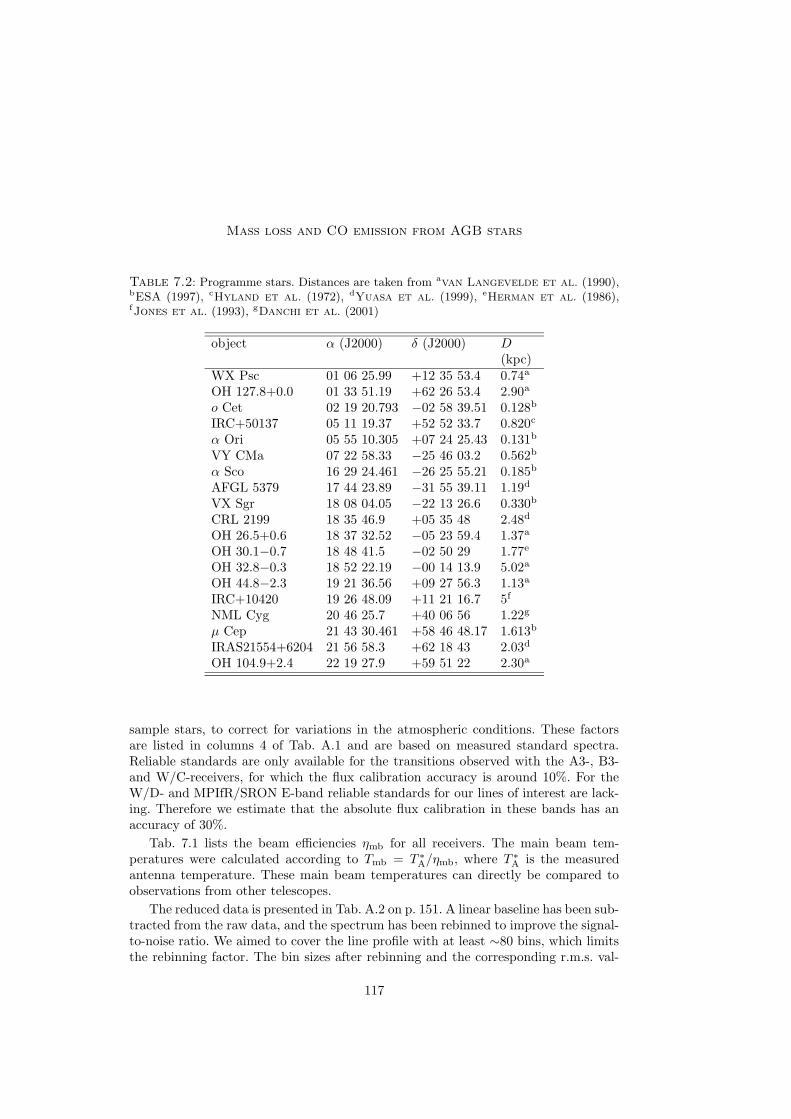
Mass loss and CO emission from AGB stars
Table 7.2: Programme stars. Distances are taken from avan Langevelde et al. (1990),bESA (1997), cHyland et al. (1972), dYuasa et al. (1999), eHerman et al. (1986),fJones et al. (1993), gDanchi et al. (2001)
object α (J2000) δ (J2000) D(kpc)
WX Psc 01 06 25.99 +12 35 53.4 0.74a
OH 127.8+0.0 01 33 51.19 +62 26 53.4 2.90a
o Cet 02 19 20.793 −02 58 39.51 0.128b
IRC+50137 05 11 19.37 +52 52 33.7 0.820c
α Ori 05 55 10.305 +07 24 25.43 0.131b
VY CMa 07 22 58.33 −25 46 03.2 0.562b
α Sco 16 29 24.461 −26 25 55.21 0.185b
AFGL 5379 17 44 23.89 −31 55 39.11 1.19d
VX Sgr 18 08 04.05 −22 13 26.6 0.330b
CRL 2199 18 35 46.9 +05 35 48 2.48d
OH 26.5+0.6 18 37 32.52 −05 23 59.4 1.37a
OH 30.1−0.7 18 48 41.5 −02 50 29 1.77e
OH 32.8−0.3 18 52 22.19 −00 14 13.9 5.02a
OH 44.8−2.3 19 21 36.56 +09 27 56.3 1.13a
IRC+10420 19 26 48.09 +11 21 16.7 5f
NML Cyg 20 46 25.7 +40 06 56 1.22g
µ Cep 21 43 30.461 +58 46 48.17 1.613b
IRAS21554+6204 21 56 58.3 +62 18 43 2.03d
OH 104.9+2.4 22 19 27.9 +59 51 22 2.30a
sample stars, to correct for variations in the atmospheric conditions. These factorsare listed in columns 4 of Tab. A.1 and are based on measured standard spectra.Reliable standards are only available for the transitions observed with the A3-, B3-and W/C-receivers, for which the flux calibration accuracy is around 10%. For theW/D- and MPIfR/SRON E-band reliable standards for our lines of interest are lack-ing. Therefore we estimate that the absolute flux calibration in these bands has anaccuracy of 30%.
Tab. 7.1 lists the beam efficiencies ηmb for all receivers. The main beam tem-peratures were calculated according to Tmb = T ∗
A/ηmb, where T ∗A is the measured
antenna temperature. These main beam temperatures can directly be compared toobservations from other telescopes.
The reduced data is presented in Tab. A.2 on p. 151. A linear baseline has been sub-tracted from the raw data, and the spectrum has been rebinned to improve the signal-to-noise ratio. We aimed to cover the line profile with at least ∼80 bins, which limitsthe rebinning factor. The bin sizes after rebinning and the corresponding r.m.s. val-
117

Chapter 7
ues are listed in column 4 and 5 of Tab. A.2. Emission lines were detected in almostall observations, except for α Sco CO 3→2 and OH 104.9+2.4 CO 6→5 and 7→6,for which we only obtained upper limits on the main beam temperatures. The lineprofiles of all transitions are shown in Figs. A.1–A.10. In some cases, interstellar linesare visible in the spectrum, for example in VX Sgr (Fig. A.5 on p. 147). To determinethe integrated intensities we have cut the interstellar lines out of the spectrum, andinterpolated both parts of the spectrum with a straight line. The resulting profile wasintegrated to obtain I, which is the integrated intensity in K km s−1. The systemvelocity VLSR and the terminal expansion velocity v∞ are estimated directly from theline profile.
Justtanont et al. (1996b) have observed OH 26.5+0.6 with the JCMT as welland report that they find line intensities I = 25.8 and 36.0 K km s−1 for the CO(3−2)and (4−3) transition respectively. In addition they have scaled IRAM observations ofthe CO(2−1) to a 15m dish, to mimic the JCMT. The intensity of this line turned outto be 7.8 K km s−1. Their results agree well with our results in case of the J = 2 → 1and 3 → 2 transition, but they have observed an intensity of a factor of ∼2 higher forthe J = 4 → 3 transition, thus indeed observing an increasing line strength for highertransitions. The origin of the discrepancy with our results is unknown.
7.3 Physical conditions in the outflow: a model
The observed line profiles provide information on the physical structure of the outflowof these AGB stars, as the spectral resolution at the observed frequencies is sufficientlyhigh to resolve the velocity structure. The terminal expansion velocity v∞ can bederived directly from the width of the line profile (Tab. A.2 on p. 151). The modelwe use to analyze the CO data is based on a study by Schonberg (1988) and waspreviously used by Justtanont et al. (1994). The interpretation of our observationsusing this model is discussed in Sect. 7.4.
7.3.1 Description of the model
The code consists of two parts: The first part solves the radiation transfer equationin a co-moving frame (Mihalas et al. 1975), computes the level populations (in fullnon-LTE, using rate equations) and iterates until level populations and radiation fieldare consistent. For solving the level populations, a Newton-Raphson method is used(Schonberg and Hempe 1986). The calculations take into account (de-)excitationthrough collisions, of which the rate is defined by the thermal velocity distribution,calculated from the local temperature, as well as (de-)excitation induced by a localradiation field and spontaneous de-excitation. The code treats pure rotational tran-sitions in the ground and first vibrational levels, which are connected through thesecollisional and radiative transitions. The model can calculate the populations of asmany as 50 levels at once, and is in principle also applicable to molecules other thanCO. The non-LTE rate equations to determine the level populations are described by
118

Mass loss and CO emission from AGB stars
ni
∑
j 6=i
(Aij + Cij + BijJ ij) −∑
j 6=i
nj(Aji + Cji + BjiJ ij) = 0 (7.1)
A change from level i to level j can be induced by collisional transitions (with thecollisional rate Cij) and radiative transitions, including spontaneous emission (Aij ,where Aij = 0 for i < j) and stimulated emission and absorption (BijJ ij). Thecollisional transition rate Cij can be written as
Cij(r) = n(r)〈σijvtherm(r)〉 (7.2)
where n(r) is the density of the main collision partner (i.e. the H2 molecule), σij
the collisional cross-section and vtherm(r) the thermal velocity, which is defined bythe temperature profile. The average is taken over the thermal velocities at a certaindistance r.
The line profile integrated mean intensity J ij consists of two components:
i) The continuum radiation, originating from dust locally present. This radiationfield can be switched off, by assuming there is no dust present in the consideredpart of the outflow
ii) Line radiation originating from a local region. The size of this region is defined bya velocity which Schonberg (1988) and also Justtanont et al. (1994) havereferred to as stochastic velocity vsto. The nature of this stochastic velocity isnot specified, but physically should consist of a thermal component vtherm and aturbulent component vturb, given by
vsto =√
(vtherm)2 + (vturb)2 (7.3)
In the outflow, the stochastic velocity is assumed to be constant, and in almostall cases dominated by turbulence. The effect of the stochastic velocity is Dopplerbroadening of the lines, which is taken into account in the radiative transfer.
In the second part of the code, the calculated level populations are used as input todetermine the observable line profiles by ray-tracing. Again the stochastic velocity isused, this time to determine the width of the interaction region along the line-of-sightto the observer. Integration over the full beam, for which the telescope parametersare required, will yield the emergent line profile.
7.3.2 Free parameters
The model has a number of free parameters (see Tab. 7.3). In this section we willdiscuss the various parameters and their relevance for the model calculations.
119
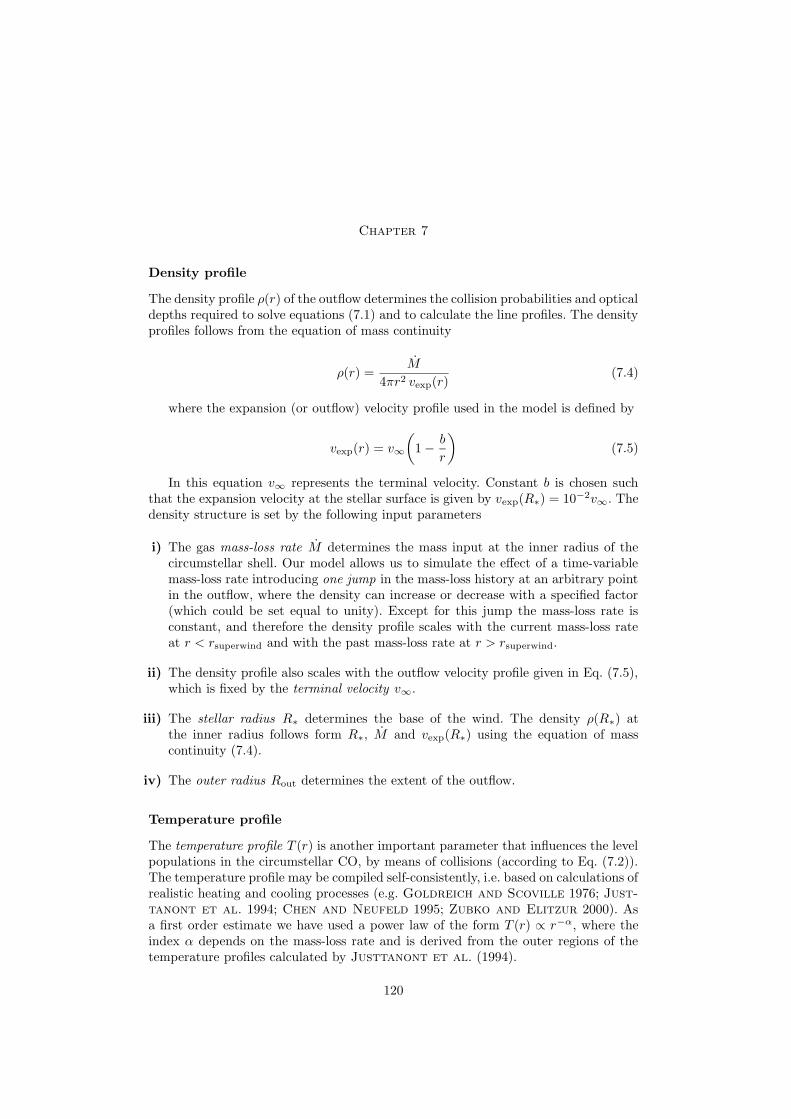
Chapter 7
Density profile
The density profile ρ(r) of the outflow determines the collision probabilities and opticaldepths required to solve equations (7.1) and to calculate the line profiles. The densityprofiles follows from the equation of mass continuity
ρ(r) =M
4πr2 vexp(r)(7.4)
where the expansion (or outflow) velocity profile used in the model is defined by
vexp(r) = v∞
(
1 − b
r
)
(7.5)
In this equation v∞ represents the terminal velocity. Constant b is chosen suchthat the expansion velocity at the stellar surface is given by vexp(R∗) = 10−2v∞. Thedensity structure is set by the following input parameters
i) The gas mass-loss rate M determines the mass input at the inner radius of thecircumstellar shell. Our model allows us to simulate the effect of a time-variablemass-loss rate introducing one jump in the mass-loss history at an arbitrary pointin the outflow, where the density can increase or decrease with a specified factor(which could be set equal to unity). Except for this jump the mass-loss rate isconstant, and therefore the density profile scales with the current mass-loss rateat r < rsuperwind and with the past mass-loss rate at r > rsuperwind.
ii) The density profile also scales with the outflow velocity profile given in Eq. (7.5),which is fixed by the terminal velocity v∞.
iii) The stellar radius R∗ determines the base of the wind. The density ρ(R∗) atthe inner radius follows form R∗, M and vexp(R∗) using the equation of masscontinuity (7.4).
iv) The outer radius Rout determines the extent of the outflow.
Temperature profile
The temperature profile T (r) is another important parameter that influences the levelpopulations in the circumstellar CO, by means of collisions (according to Eq. (7.2)).The temperature profile may be compiled self-consistently, i.e. based on calculations ofrealistic heating and cooling processes (e.g. Goldreich and Scoville 1976; Just-tanont et al. 1994; Chen and Neufeld 1995; Zubko and Elitzur 2000). Asa first order estimate we have used a power law of the form T (r) ∝ r−α, where theindex α depends on the mass-loss rate and is derived from the outer regions of thetemperature profiles calculated by Justtanont et al. (1994).
120

Mass loss and CO emission from AGB stars
Dust-to-gas ratio and dust properties
Unfortunately it is difficult to study the gas and dust mass-loss rate completely in-dependent from each other, as continuum emission from dust may have an effect on(de-)excitation, as described in Sect. 7.3.1. In particular, infrared photons at 4.6 µmprovide the energy to excite a CO molecule from the ground vibrational state v = 0 tothe first vibrational level v = 1 (e.g. Morris 1980; Schonberg 1988). The moleculeswill eventually de-excite to the vibrational ground level, but not necessarily to thesame rotational ground level from which they started. This causes a higher populationof the higher CO rotational levels than could be expected from the kinetic tempera-ture of the gas and the line radiation field. As the source of the 4.6 µm radiation ispredominantly thermal dust emission, the dust-to-gas ratio and the dust opacity κν
are important input parameters. For simplicity, we assumed that there was no dustpresent in the outflows. For some of the calculations we did include a dust fractionto study the effect on the line strengths. In those cases we used a dust opacity corre-sponding to the mixture of solid state components derived for OH 127.8+0.0, a typicalOH/IR star (see Chapter 4). The same power-law temperature distribution as for thegas is used to calculate the thermal emission from the dust.
Velocity field
The velocity field has already been mentioned as a constraint for the density struc-ture, but it also plays an important role in the formation of the line profiles, in theray-tracing discussed in Sect. 7.3.1. The outflow velocity profile (constrained by theterminal velocity v∞ and the velocity law given in Eq. (7.5)) and the stochastic ve-locity vsto determine the location and size of the interaction regions. As said before,the stochastic velocity is assumed to be constant throughout the dust shell.
Distance and telescope parameters
The resulting main beam temperatures depend on the distance towards the object. Inaddition, the telescope beam size is important to determine what part of the object fallinside the beam. In case the circumstellar shell is resolved, the pointing displacement(usually 0′′) should be known as well.
7.4 Analysis of the results
Here we will analyze the observations using the model described in Sect. 7.3. Fig. 7.1shows the intensities integrated over line width of each observed line for all our samplestars. For all sources, except VY CMa, the integrated intensity increases from the COJ = 2 → 1 to J = 3 → 2 transition, and decreases again for higher transitions. Thisis also visible in the peak main beam temperatures Tmb (Tab. A.2 on p. 151). Sincemost studies concentrate on the lower transitions (up to J = 3 → 2) this was notnoticed before.
121
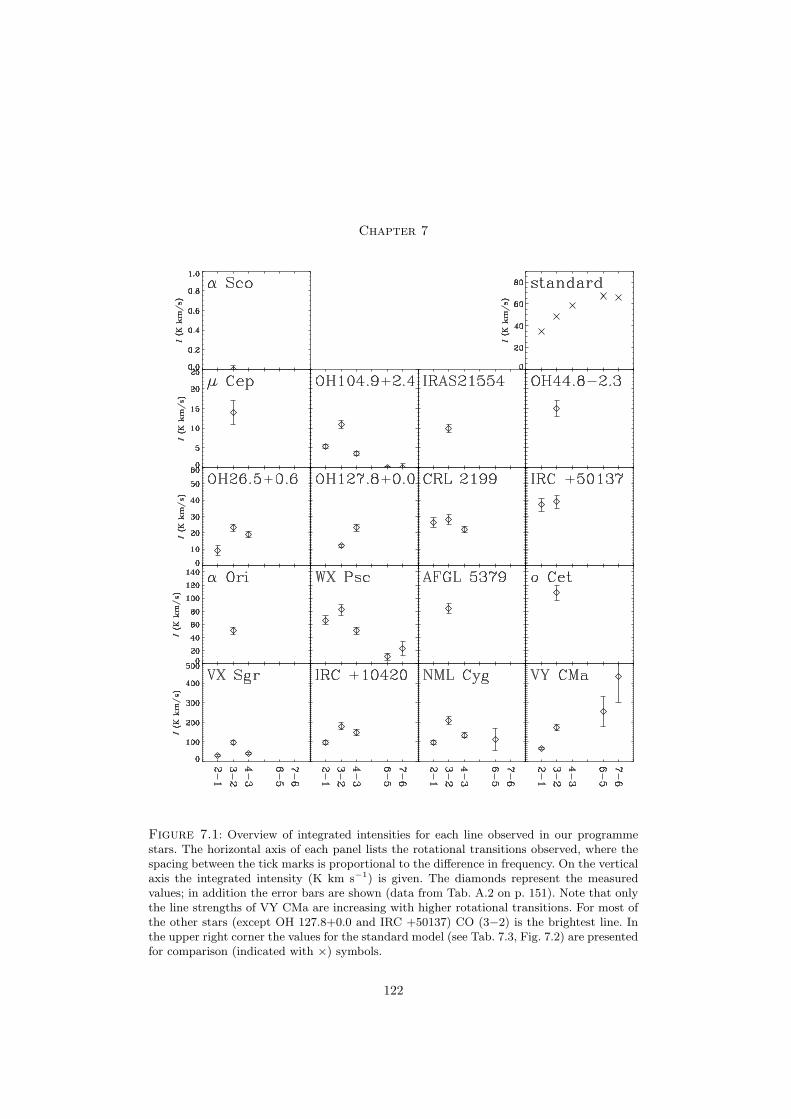
Chapter 7
Figure 7.1: Overview of integrated intensities for each line observed in our programmestars. The horizontal axis of each panel lists the rotational transitions observed, where thespacing between the tick marks is proportional to the difference in frequency. On the verticalaxis the integrated intensity (K km s−1) is given. The diamonds represent the measuredvalues; in addition the error bars are shown (data from Tab. A.2 on p. 151). Note that onlythe line strengths of VY CMa are increasing with higher rotational transitions. For most ofthe other stars (except OH 127.8+0.0 and IRC +50137) CO (3−2) is the brightest line. Inthe upper right corner the values for the standard model (see Tab. 7.3, Fig. 7.2) are presentedfor comparison (indicated with ×) symbols.
122
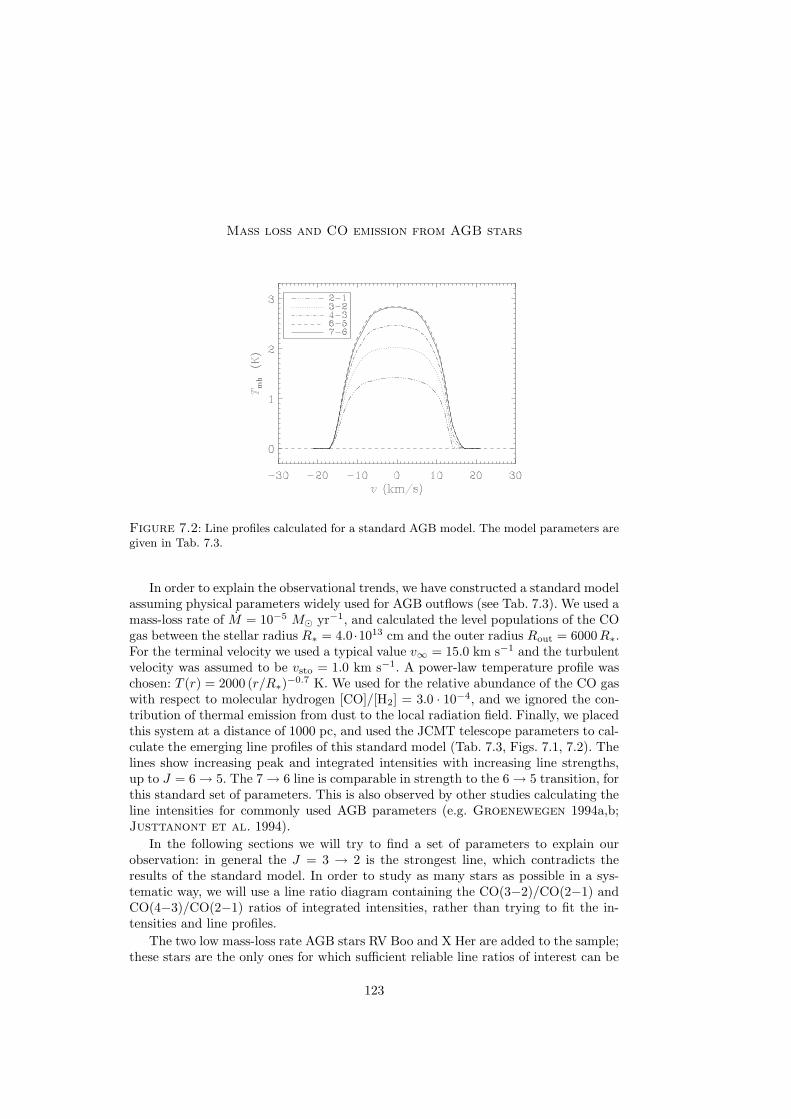
Mass loss and CO emission from AGB stars
Figure 7.2: Line profiles calculated for a standard AGB model. The model parameters aregiven in Tab. 7.3.
In order to explain the observational trends, we have constructed a standard modelassuming physical parameters widely used for AGB outflows (see Tab. 7.3). We used amass-loss rate of M = 10−5 M� yr−1, and calculated the level populations of the COgas between the stellar radius R∗ = 4.0 ·1013 cm and the outer radius Rout = 6000R∗.For the terminal velocity we used a typical value v∞ = 15.0 km s−1 and the turbulentvelocity was assumed to be vsto = 1.0 km s−1. A power-law temperature profile waschosen: T (r) = 2000 (r/R∗)
−0.7 K. We used for the relative abundance of the CO gaswith respect to molecular hydrogen [CO]/[H2] = 3.0 · 10−4, and we ignored the con-tribution of thermal emission from dust to the local radiation field. Finally, we placedthis system at a distance of 1000 pc, and used the JCMT telescope parameters to cal-culate the emerging line profiles of this standard model (Tab. 7.3, Figs. 7.1, 7.2). Thelines show increasing peak and integrated intensities with increasing line strengths,up to J = 6 → 5. The 7 → 6 line is comparable in strength to the 6 → 5 transition, forthis standard set of parameters. This is also observed by other studies calculating theline intensities for commonly used AGB parameters (e.g. Groenewegen 1994a,b;Justtanont et al. 1994).
In the following sections we will try to find a set of parameters to explain ourobservation: in general the J = 3 → 2 is the strongest line, which contradicts theresults of the standard model. In order to study as many stars as possible in a sys-tematic way, we will use a line ratio diagram containing the CO(3−2)/CO(2−1) andCO(4−3)/CO(2−1) ratios of integrated intensities, rather than trying to fit the in-tensities and line profiles.
The two low mass-loss rate AGB stars RV Boo and X Her are added to the sample;these stars are the only ones for which sufficient reliable line ratios of interest can be
123
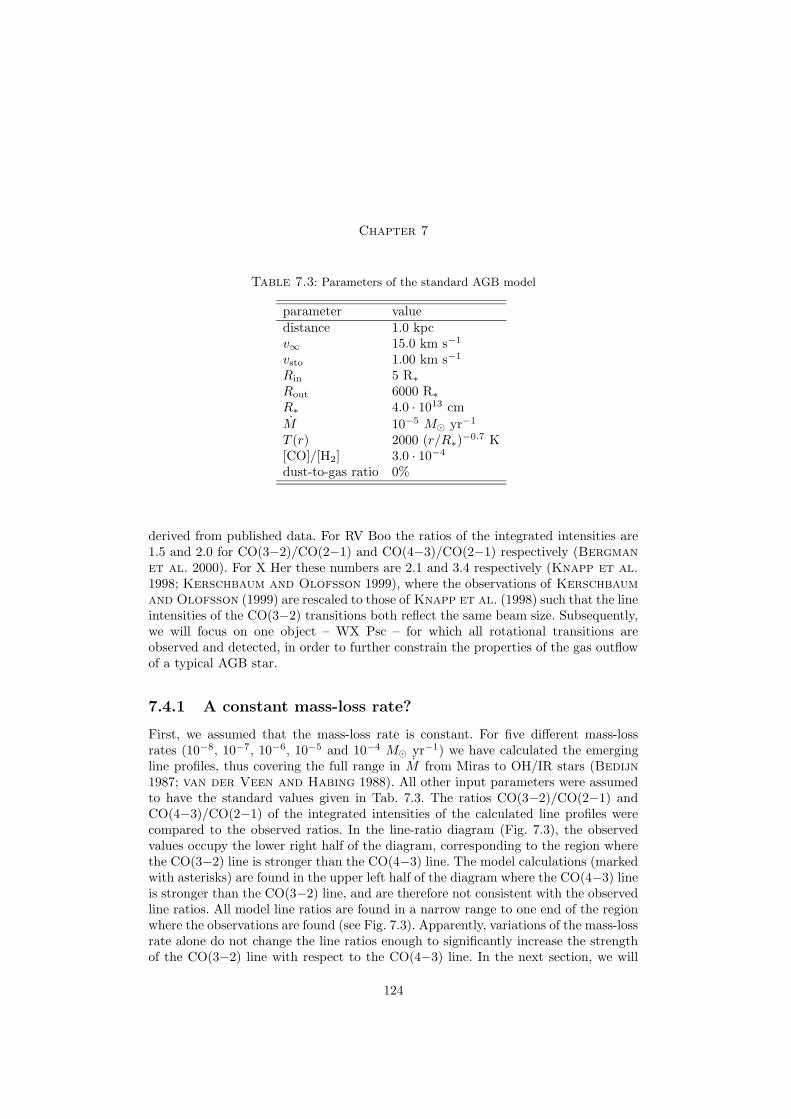
Chapter 7
Table 7.3: Parameters of the standard AGB model
parameter valuedistance 1.0 kpcv∞ 15.0 km s−1
vsto 1.00 km s−1
Rin 5 R∗
Rout 6000 R∗
R∗ 4.0 · 1013 cm
M 10−5 M� yr−1
T (r) 2000 (r/R∗)−0.7 K
[CO]/[H2] 3.0 · 10−4
dust-to-gas ratio 0%
derived from published data. For RV Boo the ratios of the integrated intensities are1.5 and 2.0 for CO(3−2)/CO(2−1) and CO(4−3)/CO(2−1) respectively (Bergmanet al. 2000). For X Her these numbers are 2.1 and 3.4 respectively (Knapp et al.1998; Kerschbaum and Olofsson 1999), where the observations of Kerschbaumand Olofsson (1999) are rescaled to those of Knapp et al. (1998) such that the lineintensities of the CO(3−2) transitions both reflect the same beam size. Subsequently,we will focus on one object – WX Psc – for which all rotational transitions areobserved and detected, in order to further constrain the properties of the gas outflowof a typical AGB star.
7.4.1 A constant mass-loss rate?
First, we assumed that the mass-loss rate is constant. For five different mass-lossrates (10−8, 10−7, 10−6, 10−5 and 10−4 M� yr−1) we have calculated the emergingline profiles, thus covering the full range in M from Miras to OH/IR stars (Bedijn1987; van der Veen and Habing 1988). All other input parameters were assumedto have the standard values given in Tab. 7.3. The ratios CO(3−2)/CO(2−1) andCO(4−3)/CO(2−1) of the integrated intensities of the calculated line profiles werecompared to the observed ratios. In the line-ratio diagram (Fig. 7.3), the observedvalues occupy the lower right half of the diagram, corresponding to the region wherethe CO(3−2) line is stronger than the CO(4−3) line. The model calculations (markedwith asterisks) are found in the upper left half of the diagram where the CO(4−3) lineis stronger than the CO(3−2) line, and are therefore not consistent with the observedline ratios. All model line ratios are found in a narrow range to one end of the regionwhere the observations are found (see Fig. 7.3). Apparently, variations of the mass-lossrate alone do not change the line ratios enough to significantly increase the strengthof the CO(3−2) line with respect to the CO(4−3) line. In the next section, we will
124

Mass loss and CO emission from AGB stars
Figure 7.3: Line ratio diagram. On the horizontal axis the ratio of the integrated intensitiesof CO(3−2)/CO(2−1) is given, while the CO(4−3)/CO(2−1) ratio is plotted on the verticalaxis. The diamonds represent the positions of our sample stars, complemented with thedata for X Her and RV Boo from the literature. In case of our sample stars, the J = 3 → 2transition is stronger than the 4 → 3 transition, therefore all these observations can be foundin the lower right half of the diagram. The asterisks mark the positions of model calculations,where we used the standard parameters (see Tab. 7.3). Only the mass-loss rate was variedand is given in units of M� yr−1.
investigate to what extent variations in the other parameters can shift the modelcalculations such that the line strength ratios more closely resemble the observedvalues.
From Fig. 7.3, it is clear that the literature data of RV Boo and X Her are locatedin the upper left half of the diagram. Especially the observations of RV Boo matchthe modelled line ratios. These low-mass loss rate objects are apparently much betterrepresented by our standard model.
7.4.2 Exploring parameter space
To further explore parameter space, we opted to vary the input parameters of the stan-dard model (Tab. 7.3) one by one, and compare the line ratios with the observations.Combining the changes in line ratios from variations in the individual parametersthen gives a feeling for the range in line ratios that can be covered, and may showwhether or not it is possible to explain the observed line ratios at all. Of course, oncea satisfactory match in line ratios is achieved by combining the effects of changes inindividual parameters, fine tuning should be performed to fit the observed data indetail. This is necessary as some of these parameters might not be completely inde-pendent from each other, and the precise combined effect on the line profile is difficult
125

Chapter 7
Figure 7.4: Mosaic of line-ratio diagrams representing the CO(4−3)/CO(2−1) ratio onthe vertical axis versus the CO(3−2)/CO(2−1) ratio on the horizontal axis. We used thestandard model described in Sect. 7.4 and Tab. 7.3 and varied for each panel one of theparameters. From the upper left corner turning clockwise the varied parameters are: thestochastic velocity vsto (km s−1), the outer radius Rout (R∗), the dust-to-gas ratio and thedistance D (pc). The line ratios resulting from the model calculations are marked withasterisks and the observed line ratios with diamonds. Note that the ranges plotted on theaxes are smaller than the ranges in Fig. 7.3 to improve the readability.
to predict.
In Fig. 7.4 a mosaic of line-ratio diagrams is shown, in which the effects of changesin the stochastic velocity, the outer radius, the dust-to-gas ratio and the distance areshown. In general the effects due to changes in these parameters are small. To keepthe plots readable, only small parts of the original line-ratio diagram (Fig. 7.3) areshown. The modelled line ratios for which these parameters are varied scatter mainlyclosely around the observed values for RV Boo. In all these modelled line strengths, theCO(3−2) line is still weaker than the CO(4−3) line. Of course varying the parametersmentioned here causes changes in the absolute line strengths, but the line ratios arenot so much affected.
126

Mass loss and CO emission from AGB stars
In the models where the distance was varied, we placed the object progressivelycloser to the observer, such that the beam filling factor is initially less than unity,but increases with decreasing distance. Although the beam size corresponding to theCO(2−1) transition is larger than that corresponding to the CO(3−2) transition,the line formation region of the CO(2−1) transition is located so much further outthat the object is first resolved for the CO(2−1) transition. This implies that lessemission from this line is received by the telescope. When this happens, the line ratiosincrease. The CO(4−3)/CO(2−1) line ratio increases faster for decreasing distancethan does CO(3−2)/CO(2−1), because the CO(3−2) line emission is the next tobecome resolved, as this line is formed more inwards in the circumstellar shell, butstill further out than the higher transitions.
The stochastic or turbulent velocity determines the interaction length along theline-of-sight, i.e. the region over which the line is formed (see also Sect. 7.3.1 and 7.3.2).The effect of a larger turbulent velocity is different for optically thick and opticallythin lines. In the optically thin case, a change in profile strength may result fromchanges in the line source function in the (near and far) parts of the line interactionregion, that is added relative to the default case. In the optically thick case therelevant source function is the one at the location where τ ≈ 1, which shifts towardsthe observer when vsto is increased. It may therefore differ from the default case.As these effects tend in the same direction for all lines (except possibly when lineschange from optically thin to optically thick), the line ratios are found not to changedramatically when varying the turbulent velocity.
Changing the outer radius has a stronger effect on the line ratios, as can beseen in Fig. 7.4. When the outer radius is increased, more relatively cold gas will bepresent. In this gas mostly the lower rotational levels are populated, thus increasingpredominantly the CO(2−1) transition. The higher the transition, the less it is affectedby the outer radius.
The last parameter shown in Fig. 7.4 is the dust-to-gas ratio. The most importanteffect of adding dust to the circumstellar shell, is in the population of the rotationallevels. Continuum emission at 4.6 µm can be absorbed by CO molecules, exciting itfrom the ground to the first vibrational level. It will return to the vibrational groundstate by spontaneous emission, but will very likely become rotationally excited whenit does so. This has a non-LTE effect on the level populations, leading to variationsin both the line strengths and the line ratios.
We also investigated the effect of the temperature distribution. The resultsare shown in Fig. 7.5. Various temperature profiles have been used in the differ-ent panels of this figure. The most simple approach is to consider a power lawT (r) = T0(r/R∗)
−α, where α is usually positive and has a value around 0.5–0.6 forrealistic profiles (Justtanont et al. 1994). We considered a much broader range ofα, including negative values and also a constant temperature, i.e. α = 0. These casesare of course not a true physical representation of the dust shell, but are just consid-ered to study the effect of extreme conditions. In most cases, we used a temperatureat the inner edge of T0 = 2000 K. However, when the power law is shallow (small α),the resulting temperature at the outer radius would be higher than 25 K if we use
127

Chapter 7
Figure 7.5: Mosaic of line-ratio diagrams representing the CO(4−3)/CO(2−1) ratio versusthe CO(3−2)/CO(2−1) ratio. Again, the standard model parameters (Tab. 7.3) were used.Only the temperature profile T (r) was varied. From the panel in the upper left corner turningclockwise the adopted temperature profiles are: i) T (r) ∝ r−α, with α indicated in the plot.ii) The temperature is described with a function consisting of two power-laws. See textfor description. iii) T (r) ∝ r−α, with negative values of α, indicated in the plot. iv) Aconstant temperature throughout the circumstellar shell, where the adopted temperaturesare indicated in the plot. Again, the line ratios resulting from the model calculations aremarked with asterisks and the observed line ratios with diamonds. The diamonds are notlabelled to avoid a crowded plot, but can easily be identified using Fig. 7.3.
128

Mass loss and CO emission from AGB stars
Table 7.4: Parameters for the temperature profiles with a change in slope. See text fordetails.
profile α0 T0 (K) Tex (K)1 1.0 2500 33.12 1.5 2500 33.13 1.0 2500 16.64 1.0 2500 55.25 1.0 2200 33.1
the same value for T0. In that case, we adjusted T0 such that T (Rout) = 25 K. Thistemperature, 25 K, is in the regime of excitation temperatures of the lower rotationaltransitions. For the negative values of α, the temperature T0 was assumed to be 25 K.A number of models with α = 0 has also been computed, see the lower left panel ofFig. 7.5. Adopted temperatures are 10, 25, 50 and 100 K. The models with a constanttemperature or an outwards increasing temperature are unrealistic, but we includedthem in our parameter study, to see if it is possible at all to change the line ratiossignificantly by changing the run of the temperature.
In an attempt to approach reality, we composed a number of temperature profilesconsisting of two power laws with different values for α. These profile are inspiredby the heat balance calculations of Justtanont et al. (1994), and are defined asfollows:
T (r) =
{
T0(r/R∗)−α0 for T > Tex
T1(r/R∗)−α1 for T < Tex
Five different profiles with a change in slope were constructed, where the excitationtemperatures of the J = 2 → 1 (55.2 K), 3 → 2 (33.1 K) and 4 → 3 (16.6 K) were usedto define the position of the kink in the slope. In all cases α1 was chosen to be 0.7. Forthe other parameters, the reader is referred to Tab. 7.4. The resulting line ratios areplotted in the upper right panel of Fig. 7.5. All models with a power law with a slopechange cluster remarkably close to the CO(4−3)/CO(2−1) and CO(3−2)/CO(2−1)ratios observed in CRL 2199 and WX Psc. The only outlier is profile 2 (see Tab. 7.4).Although from the various panels in Fig. 7.5 it seems to be possible to explain theobserved ratios of WX Psc and CRL 2199 in addition to those of RV Boo, it is notpossible to explain the line ratios of other stars of our sample, not even for extremetemperature profiles. However, one has to bear in mind that the line ratios in the twolower plots represent very unrealistic temperature profiles.
7.4.3 A representative case: WX Psc
In order to investigate the possibilities to explain the integrated intensities of the COrotational transitions, we will focus on WX Psc. All transitions are observed and de-
129

Chapter 7
Table 7.5: Physical parameters of WX Psc. The terminal velocity v∞ and system velocityof the object vLSR are derived from our observations (Tab. A.2). The other parametersare extracted from the literature, the references are: 1van Langevelde et al. (1990),2Hofmann et al. (2001), 3Justtanont et al. (1994), 4Zubko and Elitzur (2000),5simbad, 6He and Chen (2001), 7Le Sidaner and Le Bertre (1996), 8Lancon andWood (2000).
parameter value ref.distance 0.74 kpc 1v∞ 20 km s−1
vLSR +9 km s−1
Rin 6.6 R∗ 2Teff 2250 K 2α 0.5 3,4sp. type M9-10 5L∗ 2.456 · 104 L� 6
1.22 · 104 L� 71.31 · 104 L� 7
M∗ > 5 M� 8
tected with reasonable signal-to-noise ratio for this object. The previous section hasshown that the line ratios of the lower rotational transitions can be explained usingpower law temperature profiles. In this section we are going to expand our investi-gations to the higher rotational transitions. The observed values for the integratedintensities I of the J = 6 → 5 and 7 → 6 transition are much lower than the expectedvalues based on the standard model described in Sect. 7.4.
WX Psc is a well studied AGB star with an intermediate mass-loss rate. Fromrecent studies, notably the work of Hofmann et al. (2001), we have retrieved thephysical characteristics of the star and the circumstellar environment (see Tab. 7.5).These values were used as input parameters for our model calculations. For requiredparameters which are not accurately known, we maintained the values of our standardmodel (Tab. 7.3 on p. 124). The most recent determination of the luminosity is doneby He and Chen (2001) who arrived at a L = 2.456·104 L�. Using Teff = 2250 K, re-sulting from dust-shell modelling (Hofmann et al. 2001), a stellar radius of 1036 R�
(7.2 ·1013 cm) can be derived for this luminosity. This value is unrealistic for this typeof AGB star, and did not lead to reliable results when we used this value in our modelcalculations. We adopted 2 · 1013 cm (288 R�) instead, as a more realistic value forthe stellar radius, at this temperature corresponding to the much lower L = 1909L�.
As the lines studied here have excitation temperatures and critical densities whichincrease with J (see Tab. 7.6), each line traces a different region of the outflow. Thelower the transition, the more outward the line formation region is located, due to
130

Mass loss and CO emission from AGB stars
Table 7.6: Mass-loss rates for WX Psc. The values are derived for each observed transitionindependently. While all other parameters of WX Psc were kept constant, the mass-loss ratewas determined by fitting the integrated intensity. The third column contains the excitationtemperature of the corresponding rotational transition. The fourth and fifth column representthe outflow distances, and the last column shows the travel times of the gas since leaving thestellar surface. In addition to the CO mass-loss determinations, the mass-loss rate derivedfrom the L − [12 µm] colour is given (see Chapter 4).
tracer Mgas Tex (K) R/R∗ R (cm) travel time(M� yr−1) (yr)
L − [12µm] 2.0 · 10−5
CO 7–6 1.9 · 10−6 155 250 5.0 · 1015 80CO 6–5 6.5 · 10−7 116 410 8.2 · 1015 130CO 4–3 4.4 · 10−6 55.1 1100 2.2 · 1016 350CO 3–2 8.0 · 10−6 33.1 2300 4.6 · 1016 730CO 2–1 1.1 · 10−5 16.6 3800 7.6 · 1016 1200
the monotonously decreasing temperature and density profiles. Determination of themass-loss rate from the integrated intensities of these rotational transitions then givesan idea of the mass-loss history of the AGB star. Fig. 7.6 shows how the integrated lineintensities depend on the mass-loss rates. In Tab. 7.6 the mass-loss rates determinedfrom the observations of each transition are listed, while all other parameters werekept fixed. In addition, the gas mass-loss rate, derived from the L − [12µm] colour(Chapter 4) is given, where a dust-to-gas ratio of 1% is assumed. The dust spectralenergy distribution covers a temperature range of ∼ 200 − 800 K, which correspondsto a region even more inwards than the CO line emission.
We conclude that constant mass-loss rate models cannot explain all of the observedline intensities. Rather, it seems that the mass-loss rate varies with the J-level underconsideration. Specifically, the mass-loss rate corresponding to the CO(2−1) emis-sion is comparable in strength to the mass-loss rate derived from the dust emission(Tab. 7.6), assuming a dust/gas ratio of 1/100. For the higher rotational transitions,the derived mass-loss rates go down with increasing line frequency, although it perhapsincreases slightly again for the CO(7−6) transition. The mass-loss rates determinedfrom the high rotational transitions disagree with the mass-loss rate derived from theinfrared dust emission. A difference of at least an order of magnitude occurs althoughthe regions that are traced by the high rotational transitions and the dust emissiondo not differ much in temperature, and are spatially close together. In addition, adecreasing mass-loss rate with increasing rotational energy level is observed, whichis inconsistent with predictions based on the superwind model (e.g. Groenewegen1994b; Justtanont et al. 1996b; Delfosse et al. 1997). The results derived herepoint towards an inverse density, rather than stratification towards the onset of a
131

Chapter 7
Figure 7.6: Integrated intensity for various mass-loss rates in models of WX Psc. Usingthe known parameters of WX Psc (Tab. 7.5) predicted integrated intensities are given for alarge range of mass-loss rates. The integrated intensities are plotted in a logarithmic scaleon the vertical axis, and the mass-loss rate (M� yr−1) is given on the horizontal axis, alsoin logarithmic scale. The integrated intensities have been calculated for all lines observablewith the JCMT and these calculated models are indicated with symbols (see legend). Themodels have been connected with a line. Using the observed integrated intensity for a certainline, the mass-loss rate of WX Psc can be estimated from this plot (see Tab. 7.6).
superwind phase. In the next sections we will try to explain this discrepancy.
7.4.4 Possible explanations for the inconsistency
Mass-loss variations?
In principle, it should be possible to construct a combination of a density and tem-perature profile, such that the observed line intensity ratios can be explained. Thisis not possible for a constant mass-loss rate, as becomes apparent from Fig. 7.5, soapparently there must also have been variations in M . Using the WX Psc model cal-culations, we can derive an impression of the mass-loss history using the mass-lossrate listed in Tab. 7.6. For all these mass-loss rates we have calculated the regionwhere the respective line originates (Fig. 7.7). This is not done in terms of radialdistance to the central star, but it is done as a function of impact parameter, in whichcase contributions in the line-of-sight due to interactions at various radial distanceshave been added. Therefore, the values on the horizontal axis can not directly betranslated to a radial distance towards the central star, they tend to be underesti-mated. In addition, one has to bear in mind that the regions from which the variouslines originate are not distinct, but largely overlap. Some overlap in Fig. 7.7 is dueto projection effects, but a significant fraction is due to real physical overlap of the
132
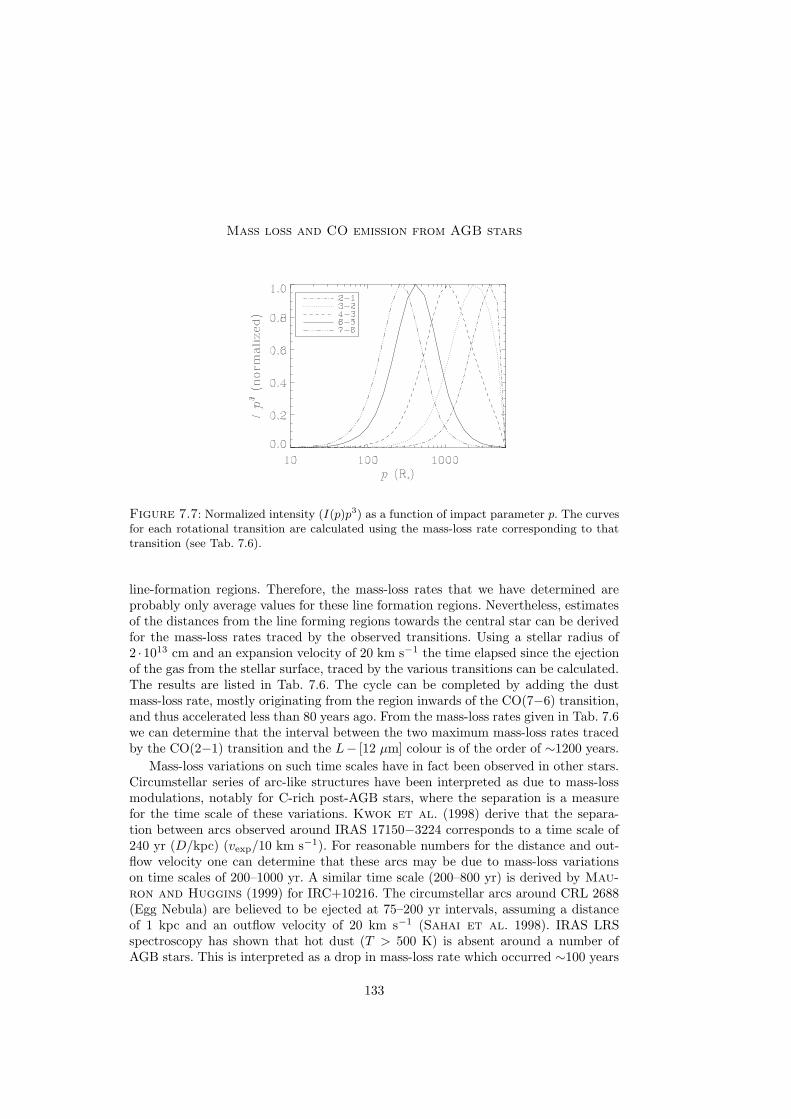
Mass loss and CO emission from AGB stars
Figure 7.7: Normalized intensity (I(p)p3) as a function of impact parameter p. The curvesfor each rotational transition are calculated using the mass-loss rate corresponding to thattransition (see Tab. 7.6).
line-formation regions. Therefore, the mass-loss rates that we have determined areprobably only average values for these line formation regions. Nevertheless, estimatesof the distances from the line forming regions towards the central star can be derivedfor the mass-loss rates traced by the observed transitions. Using a stellar radius of2 ·1013 cm and an expansion velocity of 20 km s−1 the time elapsed since the ejectionof the gas from the stellar surface, traced by the various transitions can be calculated.The results are listed in Tab. 7.6. The cycle can be completed by adding the dustmass-loss rate, mostly originating from the region inwards of the CO(7−6) transition,and thus accelerated less than 80 years ago. From the mass-loss rates given in Tab. 7.6we can determine that the interval between the two maximum mass-loss rates tracedby the CO(2−1) transition and the L− [12 µm] colour is of the order of ∼1200 years.
Mass-loss variations on such time scales have in fact been observed in other stars.Circumstellar series of arc-like structures have been interpreted as due to mass-lossmodulations, notably for C-rich post-AGB stars, where the separation is a measurefor the time scale of these variations. Kwok et al. (1998) derive that the separa-tion between arcs observed around IRAS 17150−3224 corresponds to a time scale of240 yr (D/kpc) (vexp/10 km s−1). For reasonable numbers for the distance and out-flow velocity one can determine that these arcs may be due to mass-loss variationson time scales of 200–1000 yr. A similar time scale (200–800 yr) is derived by Mau-ron and Huggins (1999) for IRC+10216. The circumstellar arcs around CRL 2688(Egg Nebula) are believed to be ejected at 75–200 yr intervals, assuming a distanceof 1 kpc and an outflow velocity of 20 km s−1 (Sahai et al. 1998). IRAS LRSspectroscopy has shown that hot dust (T > 500 K) is absent around a number ofAGB stars. This is interpreted as a drop in mass-loss rate which occurred ∼100 years
133
Chapter 7
ago, consistent with the spacing between the arcs observed around post-AGB stars(Marengo et al. 2001). Hydrodynamic calculations considering the gas and dustoutflow as a 1.5- and 2-component fluid resulted in mass-loss variations of an order ofmagnitude at intervals of 200–350 and 400 yr respectively (Simis et al. 2001). Thecircumstellar arcs observed around post-AGB stars and the density enhancementsemerging from hydrodynamic calculations have time scales that are a bit shorter thanthe time scales we derive here for mass-loss variations in the outflow of WX Psc, butthe difference is small, indicating that the same phenomenon may perhaps play a rolehere. A recent study by Schoier et al. (2002) incorporates the periodic mass-lossvariations in models used to calculate the rotational transitions of CO in C-rich stars.The authors argue that the mass-loss modulations over the last few thousands of yearsare less than a factor of ∼5, and that the average mass-loss rate over the last ∼100 isrepresentative for the last few thousands of years in case of their sample stars.
Variations in the mass-loss rate of AGB stars have a long history. It is gener-ally accepted that the AGB phase is terminated by the superwind; a phase in whichthe mass-loss rate rapidly increases (Renzini 1981; Baud and Habing 1983). How-ever, the mass-loss rates inferred from the CO line intensities for WX Psc decreasewith time and are thus opposite to the superwind model predictions. The thermalpulses associated with He-shell ignition are also thought to cause mass-loss variations(Vassiliadis and Wood 1993). As for the superwind, the behaviour and time scaleof these variations do not comply with the model predictions.
A gradient in the turbulent velocity?
Besides a complex density-temperature profile due to periodic mass-loss variations,there may be another way to explain the line intensities of the CO rotational transi-tions observed in WX Psc; a gradient in turbulent velocity. The turbulent or stochas-tic velocity is an important parameter in the line formation process (see Sect. 7.3).Fig. 7.8 illustrates this for the line profiles of one of the rotational transitions forvarious stochastic velocities.
Analogous to the determination of the mass-loss history, it is possible to estimatethe variations in the stochastic velocities traced by the integrated intensities of thesequence of rotational transition observed for WX Psc. For this purpose, the mass-lossrate was assumed to be constant at a rate of 10−6 M� yr−1 throughout the circum-stellar outflow. The temperature profile and the other parameters were kept the sameas the ones used in the mass-loss history analysis. The results are listed in Tab. 7.7.Again, the line formation regions, which are different from those calculated for thevariations in M , overlap, and thus the values derived here are not independent andshould be seen as averages over the formation regions. For a constant mass-loss rate,the observed line intensities may be explained by a gradient in the turbulent velocityif it is lowest in the outer parts of the outflow, traced by the low rotational transitions,and has its maximum in the gas traced by the J = 6 → 5 transition. Only a minorfraction of it can be explained by thermal velocities. These thermal molecular veloci-ties for CO are given by (vtherm)2 = 2kT/mCO, where T is the temperature at the line
134

Mass loss and CO emission from AGB stars
Figure 7.8: The influence on the line profile of CO(3−2) due to variations of the stochasticvelocity. The input parameters of our standard model are used (Tab. 7.3), only the turbulentvelocity – which in our model is independent of r – is varied, in the range from 0.05 – 2.0km s−1.
formation region (Tab. 7.7). One has to bear in mind that we derived the stochasticvelocities for one particular mass-loss rate, namely 10−6 M�. As pointed out before,the mass-loss rate has a considerable effect on the line strengths as well, however, thenegative gradient will be maintained for other choices of M . The gradient in thermalvelocity is not sufficiently steep to fit the gradient in stochastic velocity. To provide auseful explanation, a turbulent velocity component should be included. The nature ofthis turbulence is poorly known, but could include stellar pulsations. These pulsationscause stochastic velocities of 2–5 km s−1 in the inner parts of the circumstellar shellrequired to start the dust formation process. However, these stochastic velocities willdamp quickly and are practically absent beyond 100 R∗ (Simis 2001).
Other factors
Other factors that could be important include the outflow velocity profile, and thegeometry. The currently used outflow velocity profile is very simple (see Eq. (7.5)),but hydrodynamical calculations show that the outflow velocity profile may be morecomplex and also time-dependent (Simis et al. 2001). The effect of such complexoutflow velocity profiles on the CO line profiles is not yet studied. Perhaps they couldserve as a source of turbulence.
Non-spherical winds, e.g. density enhancements in the equatorial region, couldalso play a role in the observed line strengths. The observed line profiles would reflectsuch an axi-symmetric geometry, if it exists. Close examination of the observed lineprofiles (Figs. A.1–A.10) shows that these profiles are similar for all transitions (per
135
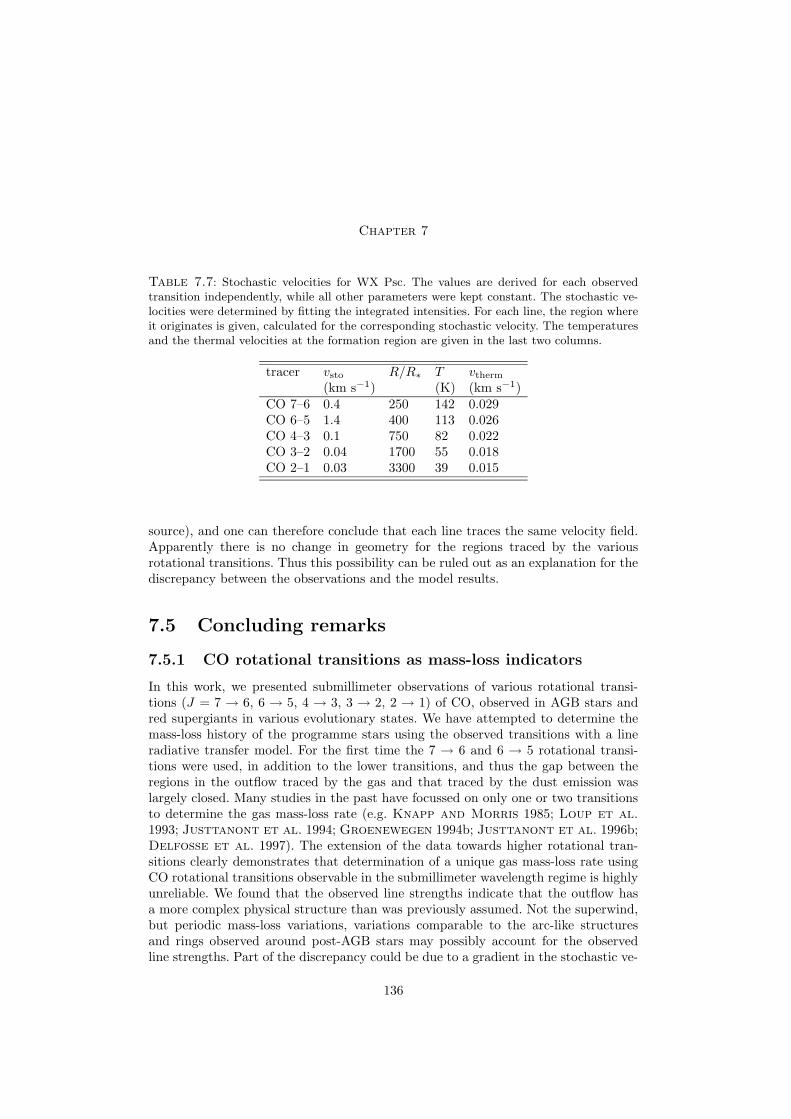
Chapter 7
Table 7.7: Stochastic velocities for WX Psc. The values are derived for each observedtransition independently, while all other parameters were kept constant. The stochastic ve-locities were determined by fitting the integrated intensities. For each line, the region whereit originates is given, calculated for the corresponding stochastic velocity. The temperaturesand the thermal velocities at the formation region are given in the last two columns.
tracer vsto R/R∗ T vtherm
(km s−1) (K) (km s−1)CO 7–6 0.4 250 142 0.029CO 6–5 1.4 400 113 0.026CO 4–3 0.1 750 82 0.022CO 3–2 0.04 1700 55 0.018CO 2–1 0.03 3300 39 0.015
source), and one can therefore conclude that each line traces the same velocity field.Apparently there is no change in geometry for the regions traced by the variousrotational transitions. Thus this possibility can be ruled out as an explanation for thediscrepancy between the observations and the model results.
7.5 Concluding remarks
7.5.1 CO rotational transitions as mass-loss indicators
In this work, we presented submillimeter observations of various rotational transi-tions (J = 7 → 6, 6 → 5, 4 → 3, 3 → 2, 2 → 1) of CO, observed in AGB stars andred supergiants in various evolutionary states. We have attempted to determine themass-loss history of the programme stars using the observed transitions with a lineradiative transfer model. For the first time the 7 → 6 and 6 → 5 rotational transi-tions were used, in addition to the lower transitions, and thus the gap between theregions in the outflow traced by the gas and that traced by the dust emission waslargely closed. Many studies in the past have focussed on only one or two transitionsto determine the gas mass-loss rate (e.g. Knapp and Morris 1985; Loup et al.1993; Justtanont et al. 1994; Groenewegen 1994b; Justtanont et al. 1996b;Delfosse et al. 1997). The extension of the data towards higher rotational tran-sitions clearly demonstrates that determination of a unique gas mass-loss rate usingCO rotational transitions observable in the submillimeter wavelength regime is highlyunreliable. We found that the observed line strengths indicate that the outflow hasa more complex physical structure than was previously assumed. Not the superwind,but periodic mass-loss variations, variations comparable to the arc-like structuresand rings observed around post-AGB stars may possibly account for the observedline strengths. Part of the discrepancy could be due to a gradient in the stochastic ve-
136
Mass loss and CO emission from AGB stars
locity as well. This immediately raises the question whether additional complexity inother outflow properties, such as the velocity law, might influence the line intensitiesas well.
7.5.2 Future work
Clearly the work presented here has given few answers and raised many questions.Additional research is required, which we plan to do in the near future. Of particularimportance are the following subjects:
• First, more observational data should be obtained, in particular of high rota-tional transitions. Our study is the first to include the high rotational transitions(J = 6 → 5 and J = 7 → 6) in the mass-loss rate determinations of three AGBstars. In addition, for one object (NML Cyg) observations up to the CO(6−5)transition were secured. This is not enough to draw firm conclusions on the degreeof complexity of the physical structure in the outflows of AGB stars, therefore thissample should be enlarged. It is important to pay attention to the completeness:if all transitions are observed, variations in the important physical parameters canbe much better constrained. In that respect it is also worthwhile to extend thedata with observations of 13CO for the lower transitions, which trace the sameregions as the 12CO transitions, but provide additional independent constraintson the physical conditions.
• Second, a more realistic representation of the physical conditions in the outflowof AGB stars should be used. This includes adding a gradient in turbulence andperiodic mass-loss variations as we argue in this study. In addition, the velocitylaw could also be put in a more realistic form, e.g. following the results of Simiset al. (2001). Although these adjustments will lead to an increase in the numberof free parameters, it is likely that we will be able to use the line profiles to againconstrain the model parameters. This will most likely increase the feasibility ofdisentangling the physical structure of the outflow.
• Finally, it is necessary to rule out the possibility that the discrepancies origi-nate from problems with the radiative transfer calculations. Although the appliedmethod seems reliable, it is necessary to estimate the accuracy of the calculations.This can be done by applying the model to simple test cases and compare theresults with other line radiative transfer models (e.g. van Zadelhoff 2002; vanZadelhoff et al. 2002).
Acknowledgements. FK is grateful for the hospitality at the Stockholm Observatory. Thesupport provided by the staff of the JCMT is greatly appreciated. We would also like tothank C. Dijkstra for doing part of the observations. The James Clerk Maxwell Telescope isoperated on behalf of the Particle Physics and Astronomy Research Council of the United
137

Chapter 7
Kingdom, the Netherlands Organisation for Scientific Research and the National ResearchCouncil of Canada. This research has made use of the SIMBAD database, operated atCDS, Strasbourg, France. FK, AdK and LBFMW acknowledge financial support from NWO’Pionier’ grant 616-78-333.
138

Chapter 8
Future prospects
The aim of the work presented here was to study the formation and evolution ofdust around oxygen-rich evolved stars and to find a correlation between the dustcomposition and the physical conditions in the outflow. It became clear during thecourse of the project that the physical structure of the outflow is more complex thanpreviously thought. Since the chemical composition of dust depends on the conditionsin the outflow, also the condensation and evolution of the solid state particles in thecircumstellar environment are not fully understood.
The work presented in this thesis sheds new light on the formation of dust inthe outflows of evolved stars; for example, carbonates (Chapter 5) and metallic iron(Chapter 4) were discovered as new dust components; we found that it is possiblethat Mira stars have a large degree of crystallinity of the silicates in their outflows(Chapter 3); additional observational evidence was found that grains in the outflowsof evolved stars are non-spherical (Chapter 4); and an inventory was made of thesolid state and gaseous components detected with ISO in a sample of evolved stars(Chapter 2). Further evidence for the complex physical structure of the circumstellarenvironment was found. We report on the axi-symmetric geometry of evolved stars(Chapters 2, 6), and the presence of turbulence or mass-loss modulations (Chapter 7).
8.1 The life cycle of silicates
In the outflow of oxygen-rich Asymptotic Giant Branch (AGB) stars silicate dust isformed. Amorphous silicates are found around almost all AGB stars, but the spectralfeatures due to crystalline silicates are only observed in outflows with high opticaldepth, and consequently high mass-loss rates. (Waters et al. 1996, see also Chap-ter 2). The lack of crystalline silicate features in low mass-loss rate AGB stars couldbe due to a contrast effect in the observed data (Chapter 3), but a true thresholdvalue for the density to form crystalline silicates could also explain the observations.
The formation mechanism of crystalline silicates in the winds of evolved stars isnot well understood. Many authors have tried to model the condensation of crystallineand amorphous silicates as a function of density in the outflow (e.g. Tielens et al.1998; Gail and Sedlmayr 1999; Sogawa and Kozasa 1999). Unfortunately, thesemodels are not well constrained due to a lack of knowledge of the physics and chem-istry of dust nucleation. The condensation theories tend to use initial gas composi-tions specifically aimed to reproduce solid state material observed in circumstellar
139

Chapter 8
environments. This implies they have only limited predictive power with regard tothe condensation sequence. In addition, observations are not yet detailed enough toconstrain these models. Laboratory studies of the condensation of circumstellar dustanalogues have been performed (e.g. Rietmeijer et al. 1999a) but the composi-tion of these analogues do not approach the composition of the dust observed aroundevolved stars.
A large fraction of the silicates around evolved stars are crystalline, while thesilicates in the ISM are completely amorphous. Around young stars again a largedegree of crystallinity is observed. This indicates that the dust is processed fromcrystalline to amorphous, and back to crystalline during its life cycle.
Observations with the new Space Infrared Telescope Facility (SIRTF), anticipatedto be launched in January 2003, should be able to further constrain the degree ofcrystallinity in various astrophysical environments. The high sensitivity of the SIRTFspectrometers will help to detect even very faint spectral features due to crystallinesilicates. The Infrared Spectrograph (IRS) on board of SIRTF covers a wavelengthrange of 5.3–40 µm with low resolution (R ≈ 60–120), and a range of 10–37 µm withhigh resolution (R ≈ 600). Some of the most prominent crystalline silicate resonancelie within this range.
In addition, the physical processes that cause either crystallization or amorphiza-tion of silicate grains should be investigated. Grain-grain collisions, irradiation withenergetic particles and other energetic events might cause the grain to melt. Whetherthe grain solidifies in amorphous or crystalline form depends on the cooling rate. Thecooling rates have to be compared with annealing rates from laboratory studies (e.g.Hallenbeck et al. 1998; Brucato et al. 1999; Fabian et al. 2000). Processingmay be an important crystallization mechanism for grains in slowly outflowing diskor high-density outflows around evolved stars, besides direct condensation from thegas phase.
8.2 The life cycle of carbonates
In two planetary nebulae (PNe), a small amount of carbonates is identified (see Chap-ter 5). This is the first detection of calcite (CaCO3) and dolomite (CaMg(CO3)2)outside the solar system. Although the mass fraction is very low (< 1%), the carbon-ates stand out in the ISO spectroscopy. They show features in the far-infrared (∼ 60and 92 µm) which are intrinsically strong and are even more enhanced by the dusttemperature in PNe.
The astrophysical relevance of carbonates can be found in its formation mecha-nism. Most carbonates – found in the solar system – are formed through aqueousalteration, but the lack of liquid water in PNe suggests that an alternative formationmechanism exists. It is important to study how important this formation mechanismis, i.e. if the conditions in these two PNe are anomalous or not. Therefore, a searchfor carbonates in astrophysical environments should be started. Using the carbonateabundance in NGC 6302 as a starting point, the strength of the infrared features can
140
Prospects
be calculated by incorporating carbonate optical properties in dust radiative trans-fer calculations of AGB stars, PNe, the ISM and towards young stars. Then, theseresonances should be looked for in infrared spectra obtained with the Infrared SpaceObservatory (ISO) and in those to be obtained with SIRTF, in order to study theoccurrence and the life cycle of carbonates.
8.3 The outflow properties of evolved stars
In Chapter 7 it is shown that the outflow properties of AGB stars are not well un-derstood. The stochastic velocity field strongly affects the intensity of CO rotationallines. This velocity field is not sufficiently well understood to be able to derive thedensity profile, i.e. mass-loss history, of AGB stars. In addition, the mass-loss historyof AGB stars has proven to be more complex than was previously assumed: the mass-loss modulations observed in (post-)AGB stars (Kwok et al. 1998; Sahai et al.1998; Mauron and Huggins 1999) and predicted by 2-fluid hydrodynamical modelcalculations (Simis et al. 2001) indeed seem to be detectable in the line ratios ofthe CO rotational transitions.
Therefore, the model used in Chapter 7 to predict the level populations and lineprofiles needs to be improved. Time variable mass loss and a turbulence gradientshould be introduced to better explain the observed line strengths, and to understandthe physical structure of the AGB outflow. In addition, more observations of theCO rotational transitions must be obtained, where the emphasis is put on the highfrequency transitions. Unfortunately, the MPIfR/SRON E-band receiver will be de-commissioned in February 2003, implying that the CO (7−6) transition can no longerbe observed from the James Clerk Maxwell Telescope. Therefore, this project shouldbe continued on another telescope. Future projects like ALMA and Herschel are verysuitable to study the physical conditions of the gas in AGB stars.
In Chapter 2 and 6 the geometry of the outflow of evolved stars is studied. Adensity enhancement in the equatorial region is observed. Therefore, axi-symmetricdensity structures should be taken into account in future radiative transfer calcu-lations, as the heating process might be influenced. The extent, opening angle andorientation of the equatorial density enhancement can be studied using a new tech-nique: infrared interferometry, offered for instance by VLTI.
Studying the physical conditions in the circumstellar outflows of AGB stars pro-vides a good starting point to study the formation and evolution of dust in theseenvironments.
141

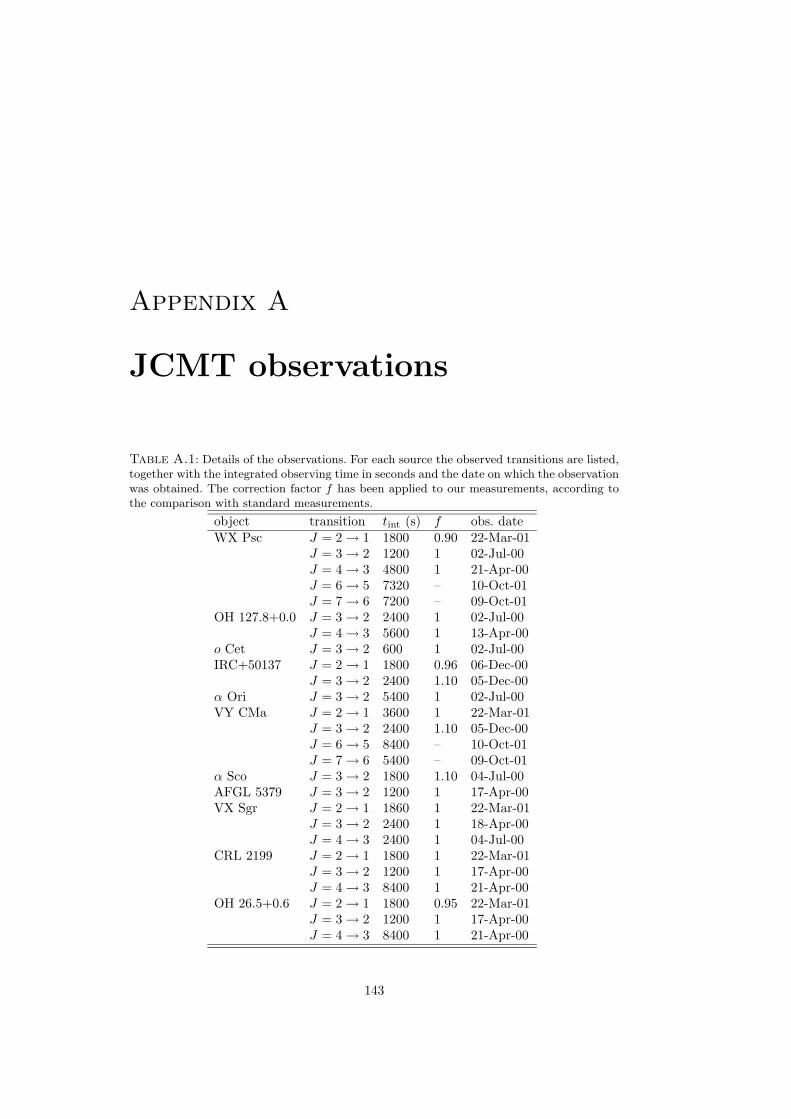
Appendix A
JCMT observations
Table A.1: Details of the observations. For each source the observed transitions are listed,together with the integrated observing time in seconds and the date on which the observationwas obtained. The correction factor f has been applied to our measurements, according tothe comparison with standard measurements.
object transition tint (s) f obs. dateWX Psc J = 2 → 1 1800 0.90 22-Mar-01
J = 3 → 2 1200 1 02-Jul-00J = 4 → 3 4800 1 21-Apr-00J = 6 → 5 7320 – 10-Oct-01J = 7 → 6 7200 – 09-Oct-01
OH 127.8+0.0 J = 3 → 2 2400 1 02-Jul-00J = 4 → 3 5600 1 13-Apr-00
o Cet J = 3 → 2 600 1 02-Jul-00IRC+50137 J = 2 → 1 1800 0.96 06-Dec-00
J = 3 → 2 2400 1.10 05-Dec-00α Ori J = 3 → 2 5400 1 02-Jul-00VY CMa J = 2 → 1 3600 1 22-Mar-01
J = 3 → 2 2400 1.10 05-Dec-00J = 6 → 5 8400 – 10-Oct-01J = 7 → 6 5400 – 09-Oct-01
α Sco J = 3 → 2 1800 1.10 04-Jul-00AFGL 5379 J = 3 → 2 1200 1 17-Apr-00VX Sgr J = 2 → 1 1860 1 22-Mar-01
J = 3 → 2 2400 1 18-Apr-00J = 4 → 3 2400 1 04-Jul-00
CRL 2199 J = 2 → 1 1800 1 22-Mar-01J = 3 → 2 1200 1 17-Apr-00J = 4 → 3 8400 1 21-Apr-00
OH 26.5+0.6 J = 2 → 1 1800 0.95 22-Mar-01J = 3 → 2 1200 1 17-Apr-00J = 4 → 3 8400 1 21-Apr-00
143

Appendix A
Table A.1: Continued.
object transition tint (s) f obs. dateOH 30.1−0.7 J = 3 → 2 1020 1 06-Jul-00OH 32.8−0.3 J = 3 → 2 1200 1 18-Apr-00OH 44.8−2.3 J = 3 → 2 2400 1 07-Jul-00IRC+10420 J = 2 → 1 1800 0.95 22-Mar-01
J = 3 → 2 1200 1 17-Apr-00J = 4 → 3 2400 1 21-Apr-00
NML Cyg J = 2 → 1 1800 0.90 22-Mar-01J = 3 → 2 1200 1 17-Apr-00J = 4 → 3 1200 1 21-Apr-00J = 6 → 5 4800 – 10-Oct-01
µ Cep J = 3 → 2 1200 1 18-Apr-00IRAS 21554+6204 J = 3 → 2 3600 1 07-Jul-00OH 104.9+2.4 J = 2 → 1 2400 0.90 22-Mar-01
J = 3 → 2 2400 1 18-Apr-00J = 4 → 3 4800 1.16 13-Apr-00
2160 1 21-Apr-00J = 6 → 5 11400 – 10-Oct-01J = 7 → 6 2400 – 09-Oct-01
Figure A.1: JCMT observations of rotational transitions of CO observed in OH 127.8+0.0(left panel) and IRC +50137 (right panel). See text for details on data reduction and analysis.
144
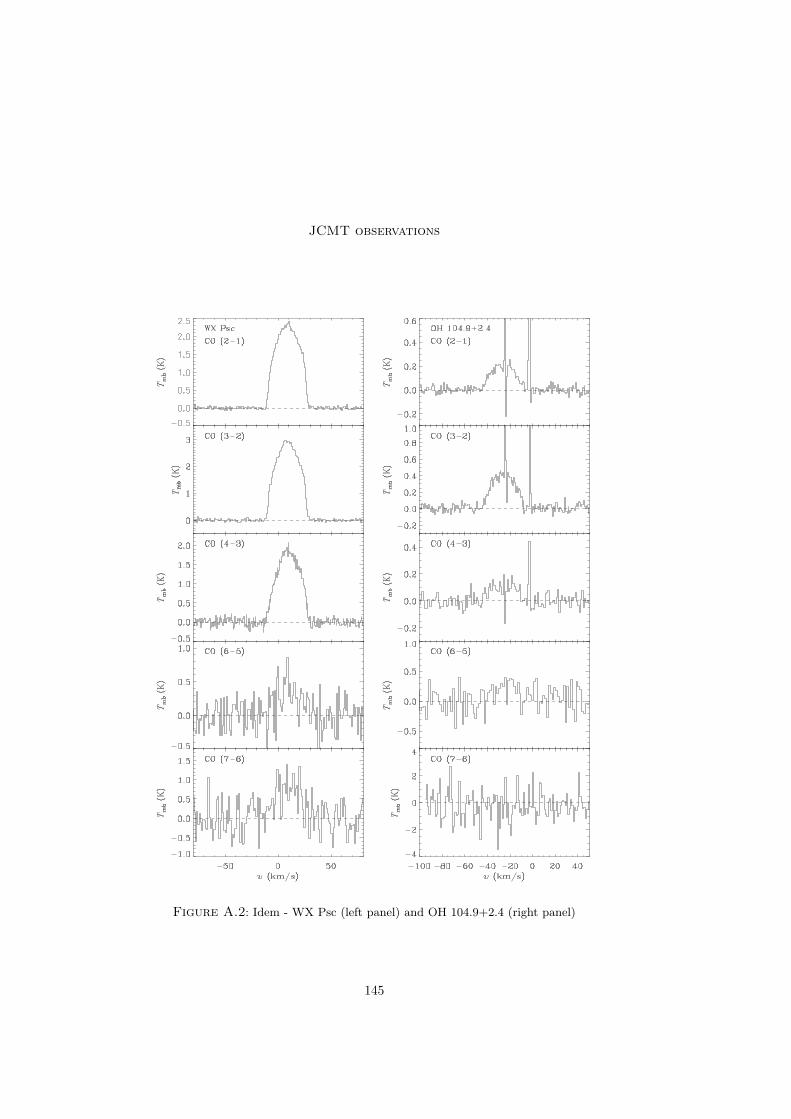
JCMT observations
Figure A.2: Idem - WX Psc (left panel) and OH 104.9+2.4 (right panel)
145

Appendix A
Figure A.3: Idem – VY CMa (left panel) and NML Cyg (right panel)
146

JCMT observations
Figure A.4: Idem – o Cet (left panel) and α Ori (right panel)
Figure A.5: Idem – VX Sgr (left panel) and CRL 2199 (right panel)
147

Appendix A
Figure A.6: Idem – α Sco (left panel) and AFGL 5379 (right panel)
Figure A.7: Idem – OH 26.5+0.6 (left panel) and IRC +10420 (right panel)
148

JCMT observations
Figure A.8: Idem – OH 30.1−0.7 (left panel) and OH 32.8−0.3 (right panel)
Figure A.9: Idem – OH 44.8−2.3 (left panel) and µ Cep (right panel)
Figure A.10: Idem – IRAS 21554+6204
149
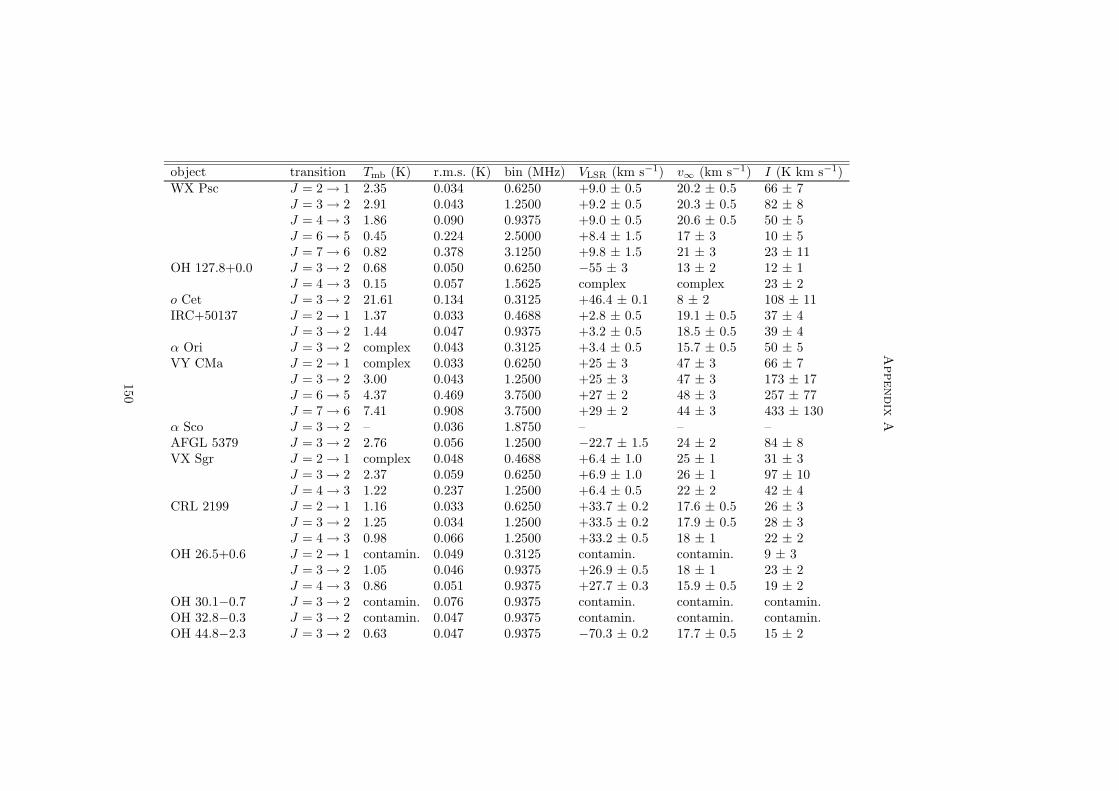
Appendix
A
object transition Tmb (K) r.m.s. (K) bin (MHz) VLSR (km s−1) v∞ (km s−1) I (K km s−1)WX Psc J = 2 → 1 2.35 0.034 0.6250 +9.0 ± 0.5 20.2 ± 0.5 66 ± 7
J = 3 → 2 2.91 0.043 1.2500 +9.2 ± 0.5 20.3 ± 0.5 82 ± 8J = 4 → 3 1.86 0.090 0.9375 +9.0 ± 0.5 20.6 ± 0.5 50 ± 5J = 6 → 5 0.45 0.224 2.5000 +8.4 ± 1.5 17 ± 3 10 ± 5J = 7 → 6 0.82 0.378 3.1250 +9.8 ± 1.5 21 ± 3 23 ± 11
OH 127.8+0.0 J = 3 → 2 0.68 0.050 0.6250 −55 ± 3 13 ± 2 12 ± 1J = 4 → 3 0.15 0.057 1.5625 complex complex 23 ± 2
o Cet J = 3 → 2 21.61 0.134 0.3125 +46.4 ± 0.1 8 ± 2 108 ± 11IRC+50137 J = 2 → 1 1.37 0.033 0.4688 +2.8 ± 0.5 19.1 ± 0.5 37 ± 4
J = 3 → 2 1.44 0.047 0.9375 +3.2 ± 0.5 18.5 ± 0.5 39 ± 4α Ori J = 3 → 2 complex 0.043 0.3125 +3.4 ± 0.5 15.7 ± 0.5 50 ± 5VY CMa J = 2 → 1 complex 0.033 0.6250 +25 ± 3 47 ± 3 66 ± 7
J = 3 → 2 3.00 0.043 1.2500 +25 ± 3 47 ± 3 173 ± 17J = 6 → 5 4.37 0.469 3.7500 +27 ± 2 48 ± 3 257 ± 77J = 7 → 6 7.41 0.908 3.7500 +29 ± 2 44 ± 3 433 ± 130
α Sco J = 3 → 2 – 0.036 1.8750 – – –AFGL 5379 J = 3 → 2 2.76 0.056 1.2500 −22.7 ± 1.5 24 ± 2 84 ± 8VX Sgr J = 2 → 1 complex 0.048 0.4688 +6.4 ± 1.0 25 ± 1 31 ± 3
J = 3 → 2 2.37 0.059 0.6250 +6.9 ± 1.0 26 ± 1 97 ± 10J = 4 → 3 1.22 0.237 1.2500 +6.4 ± 0.5 22 ± 2 42 ± 4
CRL 2199 J = 2 → 1 1.16 0.033 0.6250 +33.7 ± 0.2 17.6 ± 0.5 26 ± 3J = 3 → 2 1.25 0.034 1.2500 +33.5 ± 0.2 17.9 ± 0.5 28 ± 3J = 4 → 3 0.98 0.066 1.2500 +33.2 ± 0.5 18 ± 1 22 ± 2
OH 26.5+0.6 J = 2 → 1 contamin. 0.049 0.3125 contamin. contamin. 9 ± 3J = 3 → 2 1.05 0.046 0.9375 +26.9 ± 0.5 18 ± 1 23 ± 2J = 4 → 3 0.86 0.051 0.9375 +27.7 ± 0.3 15.9 ± 0.5 19 ± 2
OH 30.1−0.7 J = 3 → 2 contamin. 0.076 0.9375 contamin. contamin. contamin.OH 32.8−0.3 J = 3 → 2 contamin. 0.047 0.9375 contamin. contamin. contamin.OH 44.8−2.3 J = 3 → 2 0.63 0.047 0.9375 −70.3 ± 0.2 17.7 ± 0.5 15 ± 2
150
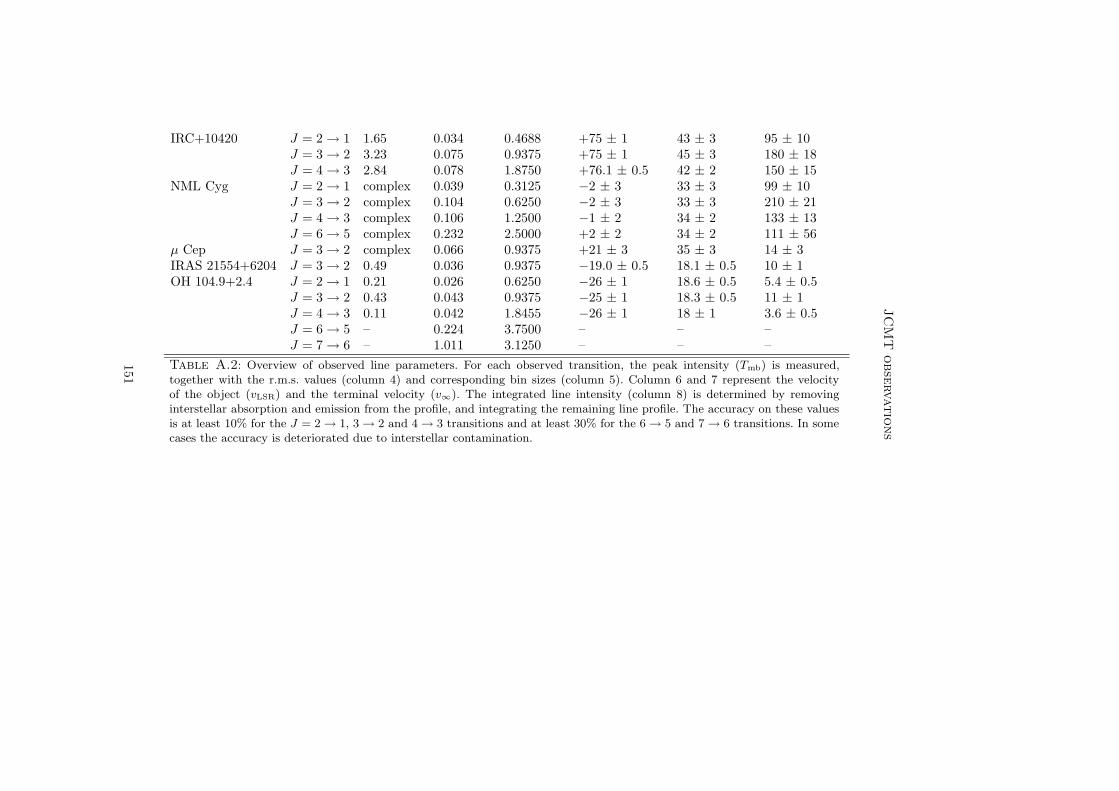
JC
MT
obse
rvatio
ns
IRC+10420 J = 2 → 1 1.65 0.034 0.4688 +75 ± 1 43 ± 3 95 ± 10J = 3 → 2 3.23 0.075 0.9375 +75 ± 1 45 ± 3 180 ± 18J = 4 → 3 2.84 0.078 1.8750 +76.1 ± 0.5 42 ± 2 150 ± 15
NML Cyg J = 2 → 1 complex 0.039 0.3125 −2 ± 3 33 ± 3 99 ± 10J = 3 → 2 complex 0.104 0.6250 −2 ± 3 33 ± 3 210 ± 21J = 4 → 3 complex 0.106 1.2500 −1 ± 2 34 ± 2 133 ± 13J = 6 → 5 complex 0.232 2.5000 +2 ± 2 34 ± 2 111 ± 56
µ Cep J = 3 → 2 complex 0.066 0.9375 +21 ± 3 35 ± 3 14 ± 3IRAS 21554+6204 J = 3 → 2 0.49 0.036 0.9375 −19.0 ± 0.5 18.1 ± 0.5 10 ± 1OH 104.9+2.4 J = 2 → 1 0.21 0.026 0.6250 −26 ± 1 18.6 ± 0.5 5.4 ± 0.5
J = 3 → 2 0.43 0.043 0.9375 −25 ± 1 18.3 ± 0.5 11 ± 1J = 4 → 3 0.11 0.042 1.8455 −26 ± 1 18 ± 1 3.6 ± 0.5J = 6 → 5 – 0.224 3.7500 – – –J = 7 → 6 – 1.011 3.1250 – – –
Table A.2: Overview of observed line parameters. For each observed transition, the peak intensity (Tmb) is measured,together with the r.m.s. values (column 4) and corresponding bin sizes (column 5). Column 6 and 7 represent the velocityof the object (vLSR) and the terminal velocity (v∞). The integrated line intensity (column 8) is determined by removinginterstellar absorption and emission from the profile, and integrating the remaining line profile. The accuracy on these valuesis at least 10% for the J = 2 → 1, 3 → 2 and 4 → 3 transitions and at least 30% for the 6 → 5 and 7 → 6 transitions. In somecases the accuracy is deteriorated due to interstellar contamination.
151


Nederlandse samenvatting
Dit proefschrift gaat over de vorming van stof rond geevolueerde zon-achtige sterren.In deze Nederlandse samenvatting zal ik kort beschrijven wat voor sterren dit zijnen wat de rol is van het gevormde stof. Vervolgens ga ik in op de resultaten van hetonderzoek gepresenteerd in dit proefschrift.
Sterren met een massa vergelijkbaar met die van de zon, krijgen gedurende hetlangste deel van hun leven (de hoofdreeks) hun energie uit kernfusieprocessen in hetcentrum van de ster, waarbij waterstof wordt omgezet in helium. Deze sterren kun-nen enkele miljarden jaren op de hoofdreeks verblijven. Als de waterstofvoorraad inde kern is uitgeput, zal de ster beginnen met het verstoken van waterstof in schillenrond de kern, waar de druk en temperatuur nog hoog genoeg is voor de nucleaire re-acties. Door samentrekking loopt de druk en temperatuur in de heliumkern op, totdatde omstandigheden geschikt zijn voor verdere kernfusie van helium naar koolstof enzuurstof, een proces dat ook weer energie oplevert. Deze energiebron is echter slechtsvan korte duur, al snel is alle helium in de kern verbruikt. De ster komt nu in eenfase waarbij heliumverbranding plaatsvindt in een schil rond de zuurstof/koolstofkern.Even verder naar buiten wordt in een tweede schil nog steeds waterstof verbrand. Indeze fase van waterstof- en heliumschilverbranding bevindt de ster zich op de asymp-totische reuzentak (asymptotic giant branch; AGB). De ster is opgezwollen tot eenstraal die enkele honderden malen groter is dan de straal van de ster tijdens hetverblijf op de hoofdreeks. De buitenlagen zijn daardoor erg koel geworden, ongeveer2000–2500 K (ter vergelijking – de temperatuur van de buitenlagen van de zon is5800 K), en de ster ziet er rood uit. In deze buitenlagen zullen zich al snel de eerstemoleculen vormen.
Het oppervlak van de AGB ster is zeer ijl en nauwelijks gravitationeel gebondenaan de ster. Gas raakt dus gemakkelijk los van de ster en zal steeds verder afkoelenterwijl het langzaamaan naar buiten wordt geduwd door nieuw gas dat van de sterontsnapt. Als de temperatuur laag genoeg is – zo’n 1400 K –, zullen sommige molecu-len bij botsingen aan elkaar blijven plakken en geleidelijk vaste stofdeeltjes vormen.De eerste stofdeeltjes die gevormd worden zijn nog vrij eenvoudig van chemische sa-menstelling, maar naarmate de temperatuur verder daalt ontstaan meer complexemineralen, zoals silicaten. De meeste mineralen absorberen straling heel efficient opkorte golflengte (visueel en nabij-infrarood). Aangezien de straling van een kant komt,namelijk uit de richting van de ster, ervaart het stofdeeltje dat een stralingspakketje
153

Nederlandse samenvatting
Planetaire nevel NGC 6302, ook wel bekend als de Vlindernevel. De vlinder wordt ge-vormd door de weggeblazen mantel van de vroegere AGB ster. Ergens in het centrum,niet zichtbaar op deze afbeelding, moet de kern van de ster, de witte dwerg, nog aan-wezig zijn. Ultraviolette straling van de witte dwerg is in staat het gas in de nevel teioniseren, en daarom is de nevel te zien als een oplichtend object. Op de achtergrondzijn nog enkele gewone sterren zichtbaar. Figuur afkomstig van ESO (1998).
absorbeert, een kracht die naar buiten, dus van de ster af, gericht is. Dit wordt ookwel stralingsdruk genoemd. Het stofdeeltje zal daardoor versnellen in uitwaartse rich-ting, onderwijl het omringende gas deels meeslepend. Zo gaat het materiaal rond dester ineens sneller naar buiten bewegen en ontstaat een sterwind gedreven door destralingsdruk op stof. De massaverliezen die de ster ondervindt via deze wind zijn aan-vankelijk laag – zo’n 10−7 zonsmassa’s per jaar – maar lopen gedurende het verblijfop de asymptotische reuzentak op tot 10−4 zonsmassa’s per jaar. Meestal gaat dit ineen nogal abrupte sprong, waarbij het massaverlies in een keer een factor 100–1000kan toenemen. Dit wordt ook wel de superwind genoemd.
Deze superwindfase kan slechts enkele duizenden jaren duren, daarna heeft de sterzijn volledige mantel weggeblazen. Wat overblijft is een naakte, hete zuurstof/koolstof-kern, die als witte dwerg nog enige tijd zal bestaan, maar wegens gebrek aan brandstoflangzaam zal uitdoven. De uitgestoten mantel beweegt zich nog altijd weg van de kernen zal eerst enige tijd zichtbaar zijn als een planetaire nevel. De hete kern ioniseerthet gas dat aanwezig is in de planetaire nevel, waardoor het gas oplicht, zie de figuurhierboven. Gaandeweg zal het gas en stof opgaan in het interstellaire medium.
AGB sterren zijn niet de enige sterren die stof produceren, ook supernova’s en an-
154

Nederlandse samenvatting
dere zware sterren produceren erg veel stof, maar doordat AGB sterren veel talrijkerzijn dan zware sterren zijn ze toch de belangrijkste stofproducenten in ons Melkweg-stelsel. Men schat dat ongeveer twee derde van het stof in het interstellaire mediumafkomstig is van AGB sterren. Dit onderstreept onmiddellijk het belang van de stu-die naar stofvorming in AGB sterren. In stervormings gebieden in het interstellairemedium is dus ook een groot deel van het daar aanwezige stof afkomstig van AGBsterren. Deze stofdeeltjes zijn de bouwstenen van planeten die mogelijk rond de nieuwesterren gevormd worden. Zo is dus eens, 5 miljard jaar geleden, onze aarde gevormduit stof afkomstig van stervende AGB sterren.
Dit proefschrift
In het onderzoek gepresenteerd in dit proefschrift is de nadruk gelegd op de samen-stelling van het stof en de fysische omstandigheden in de sterwind van AGB sterren,met het doel hier een verband tussen te vinden.
Voor de studie naar de samenstelling van het stof is gebruik gemaakt van waar-nemingen verkregen met het Infrared Space Observatory (ISO). Deze satelliet heeftvan 1996 tot 1998 in een baan om de aarde gecirkeld, en op infrarode golflengte hetheelasl bestudeerd. In dit proefschrift wordt gebruik gemaakt van de korte en langegolflengte spectrometers (Short Wavelength Spectrometer; SWS en Long WavelengthSpectrometer; LWS) die samen een golflengtebereik van 2.4 tot 197 µm omvatten. Indit golflengtegebied is de thermische straling van het meeste astrofysische stof waarte nemen. Middels karakteristieke resonanties is het mogelijk de verschillende mine-ralen die in het stof aanwezig zijn te identificeren. Hiertoe is gebruik gemaakt vanlaboratoriummetingen van aardse en synthetische mineralen, waarbij gemeten is hoetransparant de mineralen op iedere golflengte zijn. Deze laboratoriumspectra kunnenvervolgens vergeleken worden met de astronomische spectra zodat de samenstellingvan het stof bepaald kan worden. Tevens is het mogelijk om aan de hand van hetspectrum allerlei andere eigenschappen van het stof te bepalen. Hiervoor is gebruikgemaakt van een stralingstransportmodel, een model dat bijhoudt hoeveel straling ie-der stofdeeltje absorbeert, en hoe dat weer uitgestraald wordt als thermische straling.Zodoende is het mogelijk om een idee te krijgen van de samenstelling, totale massa,temperatuur en de ruimtelijke verdeling van het stof.
In hoofdstuk 2 zijn de volledige ISO spectra van een aantal AGB sterren voorde eerste maal gepubliceerd. De nadruk ligt op de sterren met hoog massaverlies,maar er zijn ook enkele sterren met laag of middelmatig massaverlies. Op basis vande spectrale kenmerken zijn een aantal verschillende stofcomponenten geıdentificeerd.Vijf van de bestudeerde sterren hebben waterijs in hun stofschil, in drie van dezesterren is een deel van dit waterijs zeker kristallijn. De stofschillen van alle bestudeerdesterren bevatten amorf silicaat; kristallijne silicaten zijn gezien in alle sterren metmiddelmatig en hoog massaverlies. In een van de sterren met een hoog massaverlieszien we kristallijne silicaten in emissie bij een golflengte waar we amorfe silicatenin absorptie zien. Dit is een aanwijzing dat de amorfe en kristallijne silicaten niet
155
Nederlandse samenvatting
dezelfde ruimtelijke verdeling hebben. Mogelijkerwijs vormen de kristallijne silicatenzich vooral in een equatoriale schijf, waar de fysische omstandigheden blijkbaar anderszijn dan in de polaire richtingen.
In hoofdstuk 3 gaan we verder in op het observationele gegeven dat AGB sterrenmet een laag massaverlies geen spectrale kenmerken van kristallijne silicaten verto-nen. We onderzoeken of het gebrek aan dergelijke kenmerken betekent dat er ookwerkelijk geen kristallijne silicaten in laag massaverlies AGB sterren aanwezig zijn.Hiervoor maken we gebruik van het stralingstransportmodel modust dat de absorp-tie en emissie van stofdeeltjes in een circumstellaire omgeving berekent. We vindendat rond AGB sterren met een laag massaverlies een zeer grote fractie kristallijnesilicaten aanwezig kan zijn, zonder dat dit zich manifesteert in de ISO spectra. Deverborgen kristallijne fractie in de sterren met het laagste massaverlies kan oplopentot zo’n 40% van de totale massa aan silicaten. Dit verschijnsel is te begrijpen doordatkristallijne en amorfe silicaten een verschil in samenstelling vertonen; de kristallijnesilicaten zijn zeer arm aan ijzer, terwijl in amorf materiaal ijzer-ionen aanwezig zijn.Hierdoor hebben de kristallijne silicaten een lagere absorptiecoefficient in het nabij-infrarood, waardoor ze kouder blijven. Dit verslechtert het contrast van de spectralekenmerken van de kristallijne component ten opzichte van de overige stofemissie. Insterren met een hoog massaverlies speelt dit effect geen rol meer, omdat niet al hetstof te zien is voor de waarnemer. Het stof dat de waarnemer ziet, bevindt zich aande buitenkant, waar verhitting van de stofdeeltjes niet meer in het nabij-infrarood,maar in het mid-infrarood plaatsvindt, waar nauwelijks nog verschil is in de absorp-tiecoefficienten van kristallijn en amorf materiaal. Daardoor is de temperatuur minof meer gelijk en is het contrast van de kristallijne kenmerken beter. We concluderendus dat sterren met een laag en hoog massaverlies een even grote fractie kristallijnesilicaten kunnen omvatten, terwijl de sterren met laag massaverlies geen en de sterrenmet hoog massaverlies wel de karakteristieke spectrale signatuur vertonen.
In hoofdstuk 4 berichten we dat metallisch ijzer is gedetecteerd in de stofschil rondOH 127.8+0.0, een AGB ster met hoog massaverlies. Niet-sferische metallische ijzer-deeltjes blijken een belangrijke bijdrage te leveren aan de absorptiecoefficient in hetgolflengtegebied van 5 tot 8 µm. Metallisch ijzer is reactief in een zuurstofrijke om-geving. Als de temperatuur zakt tot onder de ongeveer 400 K vormt zich ijzeroxide,i.e. gaat het roesten, en veranderen de optische eigenschappen. Het is dus van be-lang het ijzer te beschermen tegen deze roestvorming. We suggereren dat het ijzerin inclusies in de silicaatkorrels gaat zitten. Door aan te nemen dat de niet-sferischemetallische ijzerdeeltjes 4% van de stofmassa innemen, is het mogelijk om voor deeerste maal een spectrale energieverdeling uit te rekenen (met behulp van modust)die het werkelijk waargenomen spectrum zeer goed benadert. Hierbij gebruiken wenaast metallisch ijzer de optische constanten van amorf olivijn, forsteriet, enstatiet enkristallijn waterijs; van al deze stofsoorten is de samenstelling en roosterstructuur zeergoed bekend. Dit is een verbetering ten opzichte van de gewoonte om waargenomenspectrale energieverdelingen met astronomisch silicaat te benaderen. Astronomischsilicaat is namelijk een materiaal van onbekende samenstelling waarvan de optischeconstanten uit astronomische waarnemingen zijn afgeleid, en geeft dus geen informatie
156

Nederlandse samenvatting
over de stofsamenstelling.In hoofdstuk 5 wordt de ontdekking van een nieuwe groep mineralen beschreven.
Voor de eerste maal worden carbonaten buiten het zonnestelsel gevonden. Het gaatom de carbonaten calciet (kalk) en dolomiet die geıdentificeerd zijn in de planetairenevels NGC 6302 (Vlindernevel) en NGC 6537 (Rode Spin-nevel) aan de hand vanspectrale resonanties rond 62 en 92 µm. Carbonaten komen veel voor op aarde, enworden hier gevormd door een verweringsproces, waarbij CO2 gas oplost in water eneen reactie aangaat met in het water opgeloste minerale zouten. Als carbonaten wor-den gevonden in meteorieten en interplanetaire stofdeeltjes, wordt dat uitgelegd alsbewijs voor verwering middels vloeibaar water op het oppervlak van een planetoıde.Dergelijke argumenten zijn vaak de spil in studies naar de vormingsgeschiedenis vanhet zonnestelsel. Echter, in NGC 6302 hebben we meer dan 30 aardemassa’s aan car-bonaten gevonden. Het is niet erg waarschijnlijk dat deze carbonaten gevormd zijnop het oppervlak van grotere lichamen. De waargenomen massaverhouding op aardetussen carbonaten en silicaten is namelijk 1 a 2%, en dit impliceert dat NGC 6302ooit, wellicht onlangs, een planeetstelsel moet hebben gehad dat zwaarder is dan 3000aardemassa’s en wat geheel uit steenachtige planeten bestaat die allemaal enige tijdvloeibaar water op het oppervlak hebben gehad. Bovendien zou de totale massa aancarbonaten vervolgens in deeltjes kleiner dan 1 µm uiteen moeten vallen om te kun-nen worden waargenomen. Dit scenario is zeer onwaarschijnlijk in de uitstroom vangeevolueerde sterren, dus concluderen we dat een ander vormingsmechanisme voor car-bonaten een rol speelt in dit soort omgevingen. De aard van dit vormingsmechanismeis op dit moment onbekend, maar wellicht speelt het ook een rol in het zonnestelsel.In dat geval dient men voorzichtig te zijn bij de interpretatie van de aanwezigheidvan carbonaten in meteorieten en interplanetaire stofdeeltjes; de carbonaten zoudenweleens zonder vloeibaar water kunnen zijn ontstaan.
In hoofdstuk 6 gaan we verder in op de mineralogie in de planetaire nevelNGC 6302. We presenteren nieuwe mid-infrarood-afbeeldingen van NGC 6302, verkre-gen met TIMMI2, een instrument dat gemonteerd is op de ESO 3.6m telescoop. Doordeze mid-infrarood-afbeeldingen te combineren met de analyse van de ISO resultatenuit hoofdstuk 5 en gepubliceerde visuele, infrarood- en radio-kaartjes, is het mogelijkom de ruimtelijke verdeling van de verschillende stofcomponenten te bepalen. Hetblijkt dat het grootste deel van de massa aanwezig is in een koude stofcomponent, dieaanwezig is als een schijf in het equatoriale vlak. Deze component omvat zuurstofrijkemineralen, namelijk de silicaten, waterijs en carbonaten. Een zeer klein deel van demassa wordt gevonden in de polaire richtingen en bevat voornamelijk vaste stoffenzonder sterke infrarood resonanties, bijvoorbeeld amorf koolstof of metallisch ijzer,maar ook is er een kleine fractie (5%) silicaten in deze warme component te vinden.Tevens komt de straling van polycyclische aromatische koolwaterstoffen (PAHs) uitde polaire gebieden. De laboratoriumspectroscopie van de carbonaten wordt ook indit hoofdstuk beschreven.
In hoofdstuk 7 bestuderen we de fysische structuur van het gas in de circum-stellaire omgeving van AGB sterren. Hiervoor zijn vijf rotationele overgangen vankoolmonoxide waargenomen met de James Clerk Maxwell Telescope (JCMT) op Ha-
157
Nederlandse samenvatting
waii. Door per ster zoveel overgangen waar te nemen is het mogelijk een groot deelvan de uitstroom in radiele richting te peilen, en dus de fysische omstandigheden opverschillende afstanden van de centrale ster te bepalen. Dit kan worden gedaan doortheoretische lijnprofielen te berekenen middels een lijnstralingstransport-model vande circumstellaire uitstroom, en dit te vergelijken met de waarnemingen. Het blijktechter dat de gangbare fysische modellen van de toestand van het gas de waarne-mingen niet verklaren; de hogere overgangen blijken veel minder sterk te zijn dan demodellen voorspellen. Een studie naar de fysische parameters wijst uit dat in iedergeval twee aannames te simpel zijn. Het model bepaalt de Doppler-verbreding vanmoleculaire lijnen middels een stochastische snelheid die op elk punt in de uitstroomdezelfde waarde heeft. Echter, een gradient in de stochastische snelheid, die wellichtvoorkomt uit een gradient in de micro-turbulentie, zou de werkelijkheid beter bena-deren en de waarnemingen wellicht kunnen verklaren. Een andere aanname is dat hetmassaverlies constant is, of dat er maximaal een sprong inzit, om de superwindfase tebeschrijven. Deze aanname zou ook wel eens te eenvoudig kunnen zijn, wellicht kunnenook massaverliesmodulaties op een tijdschaal van enkele honderden jaren de waarge-nomen lijnsterktes verklaren. Dit soort massaverliesmodulaties zijn zowel voorspeldals waargenomen in post-AGB sterren.
Uit dit proefschrift ontstaat het beeld van een complexe fysische structuur in deuitstroom van AGB sterren, waarin turbulentie, variaties in het massaverlies, maarook een niet-sferische geometrie een rol spelen. In deze ingewikkelde fysische struc-tuur kunnen veel verschillende stofcomponenten condenseren, afhankelijk van de om-standigheden ter plaatse. Het is duidelijk dat dit proefschrift geen volledig sluitendebeschrijving van de stofsamenstelling en de fysische structuur geeft, maar dat hetaanknopingspunten biedt voor verder onderzoek op het gebied van de vorming vanastrofysisch stof en de geometrie van circumstellaire stofschillen en planetaire nevels.
158

Nawoord
Op deze plaats wil ik mijn dank betuigen voor de steun die ik van verscheidene kantenheb ontvangen bij het samenstellen van dit proefschrift. Op de eerste plaats ben ikRens Waters, Xander Tielens en Alex de Koter zeer dankbaar voor de deskundigewetenschappelijke begeleiding. De begeleiding vanuit hun verschillende invalshoekenheeft in belangrijke mate bijgedragen aan de kwaliteit van dit proefschrift. Weten-schappelijke besprekingen met collega’s binnen en buiten het instituut zijn ook vanessentieel belang geweest voor de totstandkoming van dit proefschrift, hierbij noemik speciaal de vele discussies met Carsten Dominik, Teije de Jong, Jeroen Bouw-man, Sacha Hony en Frank Molster. De enthousiaste begeleiding, de collegiale sfeerop het “Anton Pannekoek” Instituut en de bijstand van het ondersteunend personeelcreeerden de ideale omstandigheden voor het doen van promotieonderzoek.
Tijdens dit onderzoek heb ik gewerkt met infraroodwaarnemingen verkregen metde Infrared Space Observatory (ISO). Ik heb dankbaar gebruik gemaakt van de kennisaanwezig in de ISO gemeenschap in Nederland en Belgie en de ondersteuning van hetDutch ISO Data Analysis Centre (DIDAC) in Groningen.
In addition, I have performed observations with TIMMI2 mounted on the 3.6mtelescope of the European Southern Observatory at La Silla, Chile, and with the JamesClerk Maxwell Telescope at Mauna Kea, Hawaii. I am grateful to both telescope teamsfor the support offered in the preparation, performing and analysis of the observations.
During the past four years, I have set up a number of collaborations with colleaguesabroad. In particular I appreciate and enjoy the ongoing collaborations with the groupof Thomas Henning in Jena, with the group of Mike Barlow in London, with RonaldStark and with Kay Justtanont.
I have visited a number of foreign institutes during my research project. I amgrateful for the hospitality offered by the Astrophysical Institute in Jena, StockholmObservatory, the SIRTF Science Center, the University of California in Los Angeles,the NASA Ames Research Center, Steward Observatory in Tucson, the University ofIllinois at Urbana-Champaign, the Harvard-Smithsonian Center for Astrophysics inCambridge and the Joint Astronomy Center in Hilo.
Tijdens mijn promotieonderzoek heb ik conferenties en zomerscholen bezocht inHouston, Wenen, Villafranca (Spanje), Erice (Italie), Leiden en Canberra. Tevens hebik waarneemreizen gemaakt naar Chili en Hawaii. De financiele steun van de Universi-teit van Amsterdam, NWO en het Leidsch Kerkhoven Bosscha Fonds is onontbeerlijk
159
Nawoord
geweest voor het maken van deze reizen.Ik heb erg veel plezier beleefd aan het onderzoek naar de vorming van stof rond
geevolueerde sterren. Het werk beschreven in dit proefschrift vormt echter geen af-gesloten hoofdstuk, er zijn juist veel nieuwe aanknopingspunten bijgekomen. Ik hebbesloten verder te gaan met dit onderwerp. De komende drie jaar zal ik als SIRTFFellow verbonden zijn aan de University of California in Los Angeles, waar ik, ge-bruikmakend van de nieuwe infrarood-ruimtetelescoop SIRTF van NASA, verder zalwerken aan vraagstukken omtrent de vorming en evolutie van zuurstofrijk stof.
Ciska KemperAmsterdam, 4 september 2002
160

Bibliography
Aitken D.K., Moore T.J.T., Roche P.F., Smith C.H., Wright C.M., 1993.Mid-infrared spectroscopy of Beta Pictoris: constraints on the dust grain size. MN-RAS 265, L41.
Anders E., Zinner E., 1993. Interstellar grains in primitive meteorites: diamond,silicon carbide, and graphite. Meteoritics 28, 490.
Askeland D.R., 1994. The Science and Engineering of Materials, 3rd ed. PWSPublishing Company.
Barlow M.J., 1998. ISO LWS observations of cool evolved stars and post-AGBobjects. Ap&SS 255, 315.
Baud B., Habing H.J., 1983. The maser strength of OH/IR stars, evolution of massloss and the creation of a superwind. A&A 127, 73.
Bauer J.F., 1979. Experimental shock metamorphism of mono- and polycrystallineolivine - A comparative study. In Lunar and Planetary Science Conference, vol-ume 10, pp. 2573–2596.
Bedijn P.J., 1977. Studies of dust shells around stars. Ph.D. thesis, Leiden Univer-sity, The Netherlands.
—, 1987. Dust shells around Miras and OH/IR stars: interpretation of IRAS andother infrared measurements. A&A 186, 136.
Begemann B., Dorschner J., Henning T., et al., 1997. Aluminum oxide andthe opacity of oxygen-rich circumstellar dust in the 12-17 µm range. ApJ 476, 199.
Begemann B., Henning T., Mutschke H., Dorschner J., 1995. Magnesium-iron oxides – astrophysical origin and optical constants. Planet. Space Sci. 43,1257.
Bergman P., Kerschbaum F., Olofsson H., 2000. The circumstellar CO emissionof RV Bootis: Evidence for a Keplerian disk? A&A 353, 257.
Bertie J.E., Labbe H.J., Whalley E., 1969. Absorptivity of ice I in the range4000-30 cm−1. J. Chem. Phys. 50 (10), 4501.
Bertie J.E., Whalley E., 1967. Optical spectra of orientationally disorderedcrystals. II. Infrared spectrum of ice Ih and ice Ic from 360 to 50 cm−1.J. Chem. Phys. 46, 1271.
Bessell M.S., Brett J.M., 1988. JHKLM photometry: standard systems, pass-bands, and intrinsic colors. PASP 100, 1134.
Biermann P., Harwit M., 1980. On the origin of the grain-size spectrum of inter-
161
BIBLIOGRAPHY
stellar dust. ApJ 241, L105.Bischoff A., 1998. Aqueous alteration of carbonaceous chondrites: Evidence for
preaccretionary alteration – A review. Meteoritics and Planetary Science 33, 1113.Bohigas J., 1994. Bidimensional spectral analysis of NGC 6302. A&A 288, 617.Bohren C.F., Huffman D.R., 1983. Absorption and scattering of light by small
particles. New York: Wiley.Boulanger F., Cox P., Jones A.P., 2000. Dust in the interstellar medium. In
Infrared space astronomy, today and tomorrow, p. 251.Bouwman J., 2001. The processing and evolution of dust in Herbig Ae/Be systems.
Ph.D. thesis, University of Amsterdam, The Netherlands.Bouwman J., de Koter A., van den Ancker M.E., Waters L.B.F.M., 2000.
The composition of the circumstellar dust around the Herbig Ae stars AB Aur andHD 163296. A&A 360, 213.
Bouwman J., Meeus G., de Koter A., Hony S., Dominik C., WatersL.B.F.M., 2001. Processing of silicate dust grains in Herbig Ae/Be systems.A&A 375, 950.
Bowers P.F., Hagen W., 1984. Luminosities and mass loss rates of OH/H2O maserstars. ApJ 285, 637.
Bowers P.F., Johnston K.J., 1990. Sensitive VLA observations of OH 127.8−0.0and OH 26.5+0.6. ApJ 354, 676.
Bowey J.E., Barlow M.J., Molster F.J., et al., 2002. The 69-µm forsteriteband as a dust temperature indicator. MNRAS 331, L1.
Bowey J.E., Lee C., Tucker C., Hofmeister A.M., Ade P.A.R., BarlowM.J., 2001. Temperature effects on the 15-85-µm spectra of olivines and pyroxenes.MNRAS 325, 886.
Bradley J.P., 1994. Chemically anomalous, preaccretionally irradiated grains ininterplanetary dust from comets. Science 265, 925.
Brearley A.J., Jones R.H., 1998. Chondritic meteorites. In J. Papike, ed., Plan-etary Materials, volume 36 of Reviews in Mineralogy, chapter 3, pp. 1–398. Miner-alogical Society of America.
Bregman J.D., 1977. Observations and interpretation of the infrared spectrum ofHD 44176. PASP 89, 335.
Bregman J.D., Rank D.M., 1975. Identification of the 890 per CM carbonatesignature in NGC 7027. ApJ 195, L125.
Brucato J.R., Colangeli L., Mennella V., Palumbo P., Bussoletti E.,1999. Mid-infrared spectral evolution of thermally annealed amorphous pyroxene.A&A 348, 1012.
Burgdorf M.J., Encrenaz T., Brucato J.R., et al., 2000. The emissivityof Mars and Callisto in the far infrared. In ISO beyond the peaks: The 2nd ISOworkshop on analytical spectroscopy, ESA-SP 456, p. 9.
Butchart I., Whittet D.C.B., 1983. Interstellar grain composition and the in-frared spectrum of OH 26.5 +0.6. MNRAS 202, 971.
Cami J., 2002. Molecular gas and dust around evolved stars. Ph.D. thesis, Universityof Amsterdam, The Netherlands.
162
BIBLIOGRAPHY
Cami J., de Jong T., Justtanont K., Yamamura I., Waters L.B.F.M., 1998.ISO-SWS spectra of OH/IR stars. Ap&SS 255, 339.
Cardelli J.A., Clayton G.C., Mathis J.S., 1989. The relationship betweeninfrared, optical, and ultraviolet extinction. ApJ 345, 245.
Casassus S., Roche P.F., Barlow M.J., 2000. The coronal line regions of plan-etary nebulae NGC 6302 and 6537: 3-13µm grating and echelle spectroscopy. MN-RAS 314, 657.
Cesarsky D., Jones A.P., Lequeux J., Verstraete L., 2000. Silicate emissionin Orion. A&A 358, 708.
Chen W., Neufeld D.A., 1995. Far-infrared water line emissions from circumstellaroutflows. ApJ 453, L99.
Chiar J.E., Adamson A.J., Kerr T.H., Whittet D.C.B., 1995. High-resolutionstudies of solid CO in the Taurus Dark Cloud: Characterizing the ices in quiescentclouds. ApJ 455, 234.
Chihara H., Koike C., Tsuchiyama A., 2001. Low-temperature optical propertiesof silicate particles in the far-infrared region. PASJ 53, 243.
Clegg P.E., Ade P.A.R., Armand C., et al., 1996. The ISO Long-WavelengthSpectrometer. A&A 315, L38.
Cohen M., Allamandola L., Tielens A.G.G.M., et al., 1986. The infraredemission bands. I - Correlation studies and the dependence on C/O ratio. ApJ 302,737.
Cohen M., Barlow M.J., Sylvester R.J., et al., 1999. Water ice, silicate,and polycyclic aromatic hydrocarbon emission features in the Infrared Space Ob-servatory spectrum of the carbon-rich planetary nebula CPD -56o8032. ApJ 513,L135.
Corradi R.L.M., Schwarz H.E., 1993. The kinematics of the high velocity bipolarnebulae NGC 6537 and HB 5. A&A 269, 462.
Cox P., 1989. The line of sight towards AFGL 961 - Detection of the libration bandof water ice at 13.6 microns. A&A 225, L1.
Cox P., Roelfsema P.R., 1999. Combined SWS-LWS Spectra of Solid State Fea-tures. In Solid Interstellar Matter: The ISO Revolution, Les Houches Workshop,February 2-6, 1998. Edited by L. d’Hendecourt, C. Joblin, and A. Jones. EDPSciences and Springer-Verlag, p. 151.
Crovisier J., Leech K., Bockelee-Morvan D., et al., 1997. The spectrum ofcomet Hale-Bopp (C/1995 01) observed with the Infrared Space Observatory at 2.9AU from the Sun. Science 275, 1904.
Danchi W.C., Green W.H., Hale D.D.S., et al., 2001. Proper motions of dustshells surrounding NML Cygni. ApJ 555, 405.
Dartois E., Cox P., Roelfsema P.R., et al., 1998. Detection of the ”44 µm”band of water ice in absorption in combined ISO SWS-LWS spectra. A&A 338,L21.
David P., Pegourie B., 1995. The complex dielectric function for circumstellarsilicate grains based on the IRAS data. A&A 293, 833.
Day K.L., Donn B., 1978. An experimental investigation of the condensation of
163
BIBLIOGRAPHY
silicate grains. ApJ 222, L45.de Graauw T., Haser L.N., Beintema D.A., et al., 1996a. Observing with the
ISO Short-Wavelength Spectrometer. A&A 315, L49.de Graauw T., Whittet D.C.B., Gerakines P.A., et al., 1996b. SWS obser-
vations of solid CO2 in molecular clouds. A&A 315, L345.de Jong T., Kamijo F., 1973. Growth and destruction of interstellar grains in the
presence of low energy cosmic rays. A&A 25, 363.Deguchi S., 1980. Grain formation in cool stellar envelopes. ApJ 236, 567.Delfosse X., Kahane C., Forveille T., 1997. Superwind in evolved OH/IR stars.
A&A 320, 249.Demyk K., Dartois E., Wiesemeyer H., Jones A.P., d’Hendecourt L., 2000.
Structure and chemical composition of the silicate dust around OH/IR stars.A&A 364, 170.
Demyk K., Jones A.P., Dartois E., Cox P., d’Hendecourt L., 1999. The chem-ical composition of the silicate dust around RAFGL7009S and IRAS 19110+1045.A&A 349, 267.
Dominik C., Tielens A.G.G.M., 1997. The physics of dust coagulation and thestructure of dust aggregates in space. ApJ 480, 647.
Dorschner J., Begemann B., Henning T., Jager C., Mutschke H., 1995.Steps toward interstellar silicate mineralogy. II. Study of Mg-Fe-silicate glasses ofvariable composition. A&A 300, 503.
Draine B.T., 1979. Time-dependent nucleation theory and the formation of inter-stellar grains. Ap&SS 65, 313.
Draine B.T., Lee H.M., 1984. Optical properties of interstellar graphite and silicategrains. ApJ 285, 89.
Draine B.T., Salpeter E.E., 1977. Time-dependent nucleation theory.J. Chem. Phys. 67 (5), 2230.
Drummond D.G., 1936. Absorption coefficients of crystal quartz in the infrared.Proc. Roy. Soc. (London)-Series A 153, 328.
Duley W.W., 1979. Origin of the diffuse interstellar absorption bands - Transitionmetal ions in oxide grains. ApJ 227, 824.
Endress M., Zinner E., Bischoff A., 1996. Early aqueous activity on primitivemeteorite parent bodies. Nature 379, 701.
Engels D., Schmid-Burgk J., Walmsley C.M., 1986. Water maser emission fromOH/IR stars. A&A 167, 129.
ESA, 1997. The Hipparcos & Tycho Catalogues. ESA-SP 1200. ESA PublicationsDivision, Noordwijk, The Netherlands.
ESO, 1998. ESO Press Release 06/98.Evans A., 1994. The dusty universe. John Wiley & Sons.Fabian D., Jager C., Henning T., Dorschner J., Mutschke H., 2000. Steps
toward interstellar silicate mineralogy V. Thermal evolution of amorphous magne-sium silicates and silica. A&A 364, 282.
Fabian D., Posch T., Mutschke H., Kerschbaum F., Dorschner J., 2001.Infrared optical properties of spinel. A study of the carrier of the 13, 17 and 32 µm
164
BIBLIOGRAPHY
emission features observed in ISO-SWS spectra of oxygen-rich AGB stars. A&A 373,1125.
Farmer V.C., ed., 1974. The infrared spectra of minerals. Mineralogical society,London, UK.
Fluks M.A., Plez B., The P.S., de Winter D., Westerlund B.E., SteenmanH.C., 1994. Spectra and photometry of M-giant stars. A&A 105, 311.
Gail H.P., 1998. Chemical reactions in protoplanetary accretion disks IV. Multi-component dust mixture. A&A 332, 1099.
Gail H.P., Sedlmayr E., 1998. Dust Formation in M Stars. In The MolecularAstrophysics of Stars and Galaxies, pp. 285–312.
—, 1999. Mineral formation in stellar winds. I. Condensation sequence of silicate andiron grains in stationary oxygen rich outflows. A&A 347, 594.
Gehrz R., 1989. Sources of stardust in the Galaxy. In L.J. Allamandola, A.G.G.M.Tielens, eds., IAU Symp. 135: Interstellar Dust, pp. 445–453.
Gehrz R.D., Woolf N.J., 1971. Mass loss from M stars. ApJ 165, 285.Gillett F.C., Forrest W.J., Merrill K.M., 1973. 8–13 micron spectra of
NGC7027, BD+30o3639, and NGC6572. ApJ 183, 87.Gilman R.C., 1969. On the composition of circumstellar grains. ApJ 155, L185.—, 1972. On the coupling of grains to the gas in circumstellar envelopes. ApJ 178,
423.Goldreich P., Scoville N., 1976. OH-IR stars. I. Physical properties of circum-
stellar envelopes. ApJ 205, 144.Gomez Y., Moran J.M., Rodrıguez L.F., Garay G., 1989. The distance to
NGC 6302. ApJ 345, 862.Gomez Y., Rodrıguez L.F., Moran J.M., 1993. Detection of the angular expan-
sion rate and determination of the distance of the planetary nebula NGC 6302.ApJ 416, 620.
Gonzalez-Alfonso E., Cernicharo J., 1999. The water vapor abundance incircumstellar envelopes. ApJ 525, 845.
Gray D.E., 1963. American Institute of Physics Handbook. McGraw-Hill, New York,2nd edition.
Groenewegen M.A.T., 1994a. A revised model for circumstellar molecular emis-sion. A&A 290, 531.
—, 1994b. The mass loss rates of OH/IR 32.8−0.3 and OH/IR 44.8−2.3. A&A 290,544.
Grossman L., 1972. Condensation in the primitive solar nebula. Geochim. Cos-mochim. Acta 36, 597.
Grossman L., Larimer J.W., 1974. Early chemical history of solar system.Rev. Geophys. Space Phys. 12, 71.
Habing H., 1996. Circumstellar envelopes and Asymptotic Giant Branch stars.A&A Rev. 7, 97.
Habing H.J., Tignon J., Tielens A.G.G.M., 1994. Calculations of the outflowvelocity of envelopes of cool giants. A&A 286, 523.
Hallenbeck S.L., Nuth III J.A., Daukantas P.L., 1998. Mid-infrared spectral
165

BIBLIOGRAPHY
evolution of amorphous magnesium silicate smokes annealed in vacuum: Compari-son to cometary spectra. Icarus 131, 198.
Hartmann J., 1904. Investigations on the spectrum and orbit of delta Orionis.ApJ 19, 268.
Harwit M., Malfait K., Decin L., Waelkens C., Feuchtgruber H., MelnickG.J., 2001. The infrared continuum spectrum of VY Canis Majoris. ApJ 557, 844.
He J.H., Chen P.S., 2001. On the difference between type E and type A OH/IRstars. AJ 121, 2752.
Hellwege K.H., Lesch W., Plihal M., Schaack G., 1970. Z. Physik 232, 61.Henning T., Begemann B., Mutschke H., Dorschner J., 1995. Optical prop-
erties of oxide dust grains. A&AS 112, 143.Henning T., Il’In V.B., Krivova N.A., Michel B., Voshchinnikov N.V.,
1999. WWW database of optical constants for astronomy. A&AS 136, 405.http://www.astro.uni-jena.de/Users/database/entry.html.
Henning T., Stognienko R., 1996. Dust opacities for protoplanetary accretiondisks: influence of dust aggregates. A&A 311, 291.
Herman J., Burger J.H., Penninx W.H., 1986. IRAS observations of OH/IRstars - Determination of absolute luminosities and mass loss rates. A&A 167, 247.
Herman J., Habing H.J., 1985. Time variations and shell sizes of OH masers inlate-type stars. A&AS 59, 523.
Heske A., Forveille T., Omont A., van der Veen W.E.C.J., Habing H.J.,1990. Deficiency of CO emission from massive envelopes around cool OH/IR stars.A&A 239, 173.
Hofmann K.H., Balega Y., Blocker T., Weigelt G., 2001. A multi-wavelengthstudy of the oxygen-rich AGB star CIT 3: Bispectrum speckle interferometry anddust-shell modelling. A&A 379, 529.
Hoogzaad S., 2001. The properties of water ice an other dust components aroundthe post-AGB stars HD 161796. Master’s thesis, University of Amsterdam, TheNetherlands.
Hoogzaad S.N., Molster F.J., Dominik C., Waters L.B.F.M., Barlow M.J.,de Koter A., 2002. The circumstellar dust shell of the post-AGB star HD 161796.A&A 389, 547.
Hron J., Aringer B., Kerschbaum F., 1997. Semiregular variables of types SRaand SRb. Silicate dust emission features. A&A 322, 280.
Huffman D.R., Stapp J.L., 1973. Optical Measurements on Solids of PossibleInterstellar Importance. In IAU Symp. 52: Interstellar Dust and Related Topics, p.297.
Huss G.R., Fahey A.J., Gallino R., Wasserburg G.J., 1994. Oxygen isotopesin circumstellar Al2O3 grains from meteorites and stellar nucleosynthesis. ApJ 430,L81.
Hutcheon I.D., Huss G.R., Fahey A.J., Wasserburg G.J., 1994. Extreme Mg-26 and O-17 enrichments in an Orgueil corundum: Identification of a presolar oxidegrain. ApJ 425, L97.
Hyland A.R., Becklin E.E., Frogel J.A., Neugebauer G., 1972. Infrared
166

BIBLIOGRAPHY
observations of 1612 MHz IR/OH sources. A&A 16, 204.Iben Jr. I., Renzini A., 1983. Asymptotic Giant Branch evolution and beyond.
ARA&A 21, 271.Jackson B.D., de Lange G., Laauwen W.M., Gao J.R., Iosad N.N., Klap-
wijk T.M., 2000. In Proc. of the 11th Int. Symp. on Space THz Technology, p.238.
Jager C., Molster F.J., Dorschner J., Henning T., Mutschke H., WatersL.B.F.M., 1998. Steps toward interstellar silicate mineralogy. IV. The crystallinerevolution. A&A 339, 904.
Jager C., Mutschke H., Begemann B., Dorschner J., Henning T., 1994.Steps toward interstellar silicate mineralogy. I. Laboratory results of a silicate glassof mean cosmic composition. A&A 292, 641.
Johnson C.A., Prinz M., 1993. Carbonate compositions in CM and CI chondrites,and implications for aqueous alteration. Geochim. Cosmochim. Acta 57, 2843.
Jones A.P., 1990. Iron or iron oxide grains in the interstellar medium? MNRAS 245,331.
Jones A.P., Tielens A.G.G.M., Hollenbach D.J., 1996. Grain shattering inshocks: the interstellar grain size distribution. ApJ 469, 740.
Jones A.P., Tielens A.G.G.M., Hollenbach D.J., McKee C.F., 1994. Graindestruction in shocks in the interstellar medium. ApJ 433, 797.
Jones T.J., Humphreys R.M., Gehrz R.D., et al., 1993. IRC +10420: A coolhypergiant near the top of the H-R diagram. ApJ 411, 323.
Jones T.W., Merrill K.M., 1976. Model dust envelopes around late-type stars.ApJ 209, 509.
Jura M., 1986. The role of dust in mass loss from late-type stars. Irish Astron. J. 17,322.
Jura M., Morris M., 1985. Condensation onto grains in the outflows from mass-losing red giants. ApJ 292, 487.
Justtanont K., de Jong T., Helmich F.P., et al., 1996a. The ISO-SWS spec-trum of NML Cyg. A&A 315, L217.
Justtanont K., Skinner C.J., Tielens A.G.G.M., 1994. Molecular rotationalline profiles from oxygen-rich red giant winds. ApJ 435, 852.
Justtanont K., Skinner C.J., Tielens A.G.G.M., Meixner M., Baas F.,1996b. Modeling of the dust and gas outflows from OH 26.5 +0.6: the superwind.ApJ 456, 337.
Justtanont K., Tielens A.G.G.M., 1992. Mass loss from OH/IR stars: modelsfor the infrared emission of circumstellar dust shells. ApJ 389, 400.
Keane J.V., Tielens A.G.G.M., Boogert A.C.A., Schutte W.A., WhittetD.C.B., 2001. Ice absorption features in the 5–8 µm region toward embeddedprotostars. A&A 376, 254.
Kerschbaum F., Olofsson H., 1999. Oxygen-rich semiregular and irregular vari-ables. A catalogue of circumstellar CO observations. A&AS 138, 299.
Kessler M.F., Steinz J.A., Anderegg M.E., et al., 1996. The Infrared SpaceObservatory (ISO) mission. A&A 315, L27.
167

BIBLIOGRAPHY
Kim S., Martin P.G., Hendry P.D., 1994. The size distribution of interstellardust particles as determined from extinction. ApJ 422, 164.
Klein C., Hurlbut Jr. C.S., 1993. Manual of Mineralogy (after James D. Dana),21st edition. John Wiley & Sons, Inc.
Knacke R.F., Fajardo-Acosta S.B., Telesco C.M., Hackwell J.A., LynchD.K., Russell R.W., 1993. The silicates in the disk of β Pictoris. ApJ 418, 440.
Knapp G.R., Morris M., 1985. Mass loss from evolved stars. III. Mass loss ratesfor fifty stars from CO J=1–0 observations. ApJ 292, 640.
Knapp G.R., Phillips T.G., Leighton R.B., et al., 1982. Mass loss from evolvedstars. I. Observations of 17 stars in the CO(2–1) line. ApJ 252, 616.
Knapp G.R., Young K., Lee E., Jorissen A., 1998. Multiple molecular windsin evolved stars. I. A survey of CO(2−1) and CO(3−2) emission from 45 nearbyAsymptotic Giant Branch stars. ApJS 117, 209.
Kohler T.M., Gail H.P., Sedlmayr E., 1997. MgO dust nucleation in M-Stars:calculation of cluster properties and nucleation rates. A&A 320, 553.
Koike C., Kaito C., Yamamoto T., Shibai H., Kimura S., Suto H., 1995.Extinction spectra of corundum in the wavelengths from UV to FIR. Icarus 114,203.
Koike C., Shibai H., 1990. Optical constants of hydrous silicates from 7 to 400 µm.MNRAS 246, 332.
—, 1998. The infrared spectra of candidate materials for celestial dust by laboratorymeasurements. Technical Report 671, The institute of space and astronauticalscience, Kanagawa, Japan.
Koike C., Shibai H., Tuchiyama A., 1993. Extinction of olivine and pyroxene inthe mid- and far-infrared. MNRAS 264, 654.
Koike C., Tsuchiyama A., Shibai H., et al., 2000. Absorption spectra of Mg-richMg-Fe and Ca pyroxenes in the mid- and far-infrared regions. A&A 363, 1115.
Koike C., Tsuchiyama A., Suto H., 1999. The spectra of crystalline silicates ininfrared region. In Proc. 32nd ISAS Lunar Planet. Symp., pp. 175–178.
Koornneef J., 1983. Near-infrared photometry. A&A 128, 84.Kouchi A., Kuroda T., 1990. Amorphization of cubic ice by ultraviolet irradiation.
Nature 344, 134.Kozasa T., Hasegawa H., 1988. Formation of iron-bearing materials in a cooling
gas of solar composition. Icarus 73, 180.Kwok S., Su K.Y.L., Hrivnak B.J., 1998. Hubble Space Telescope V-Band Imag-
ing of the Bipolar Proto-Planetary Nebula IRAS 17150-3224. ApJ 501, L117.Lancet M.S., Anders E., 1970. Carbon isotope fractionation in the Fischer-Tropsch
synthesis and in meteorites. Science 170, 980.Lancon A., Wood P.R., 2000. A library of 0.5 to 2.5 µm spectra of luminous cool
stars. A&AS 146, 217.Le Bertre T., Winters J.M., 1998. On the relations between infrared colors and
mass loss rates for Mira stars. A&A 334, 173.Le Sidaner P., Le Bertre T., 1993. Optical and infrared observations of two
oxygen-rich miras: dust shell modelling as a function of phase. A&A 278, 167.
168
BIBLIOGRAPHY
—, 1996. Optical and infrared observations of 27 oxygen-rich stars. Modelling of thecircumstellar dust shells. A&A 314, 896.
Lellouch E., Encrenaz T., de Graauw T., et al., 2000. The 2.4-45 µm spec-trum of Mars observed with the infrared space observatory. Planet. Space Sci. 48,1393.
Lester D.F., Dinerstein H.L., 1984. An infrared disk at the center of the bipolarplanetary nebula NGC 6302. ApJ 281, L67.
Lewis J.S., Ney E.P., 1979. Iron and the formation of astrophysical dust grains.ApJ 234, 154.
Likkel L., 1989. OH and H2O observations of cold IRAS stars. ApJ 344, 350.Little-Marenin I.R., Little S.J., 1990. Emission features in IRAS LRS spectra
of M Mira variables. AJ 99, 1173.Longtin D.R., Shettle E.P., Hummel J.R., Pryce J.D., 1988. A wind depen-
dent desert aerosol model: Radiative properties. Technical Report AFGL-TR-88-0112, Air Force Geophysics Laboratory, Hanscom AFB, MA.
Lopez B., Danchi W.C., Bester M., et al., 1997. Nonspherical structures andtemporal variations in the dust shell of o Ceti observed with a long baseline inter-ferometer at 11 microns. ApJ 488, 807.
Lorenz-Martins S., de Araujo F.X., 1997. OH/IR objects: modelling of circum-stellar dust envelopes by a Monte Carlo method. MNRAS 291, 296.
Lorenz-Martins S., Pompeia L., 2000. Modelling of oxygen-rich envelopes usingcorundum and silicate grains. MNRAS 315, 856.
Loup C., Forveille T., Omont A., Paul J.F., 1993. CO and HCN observations ofcircumstellar envelopes. A catalogue – mass loss rates and distributions. A&AS 99,291.
Lutz D., 1999. ISO observations of the galactic centre. In Proceedings of the Con-ference ”The Universe as seen by ISO”, ESA SP-427, pp. 623–626.
Lutz D., Feuchtgruber H., Genzel R., et al., 1996. SWS observations of theGalactic center. A&A 315, L269.
Malfait K., Waelkens C., Bouwman J., de Koter A., Waters L.B.F.M.,1999. The ISO spectrum of the young star HD 142527. A&A 345, 181.
Malfait K., Waelkens C., Waters L.B.F.M., Vandenbussche B., HuygenE., de Graauw M.S., 1998. The spectrum of the young star HD 100546 observedwith the Infrared Space Observatory. A&A 332, L25.
Mamon G.A., Glassgold A.E., Huggins P.J., 1988. The photodissociation ofCO in circumstellar envelopes. ApJ 328, 797.
Marengo M., Ivezic Z., Knapp G.R., 2001. 100-yr mass-loss modulations on theasymptotic giant branch. MNRAS 324, 1117.
Martin P.G., 1995. On the value of GEMs (Glass with embedded metal and sul-phides). ApJ 445, L63.
Mathis J.S., 1986. The alignment of interstellar grains. ApJ 308, 281.—, 1990. Interstellar dust and extinction. ARA&A 28, 37.Mathis J.S., Rumpl W., Nordsieck K.H., 1977. The size distribution of inter-
stellar grains. ApJ 217, 425.
169
BIBLIOGRAPHY
Mauron N., Huggins P.J., 1999. Multiple shells in the circumstellar envelope ofIRC+10216. A&A 349, 203.
McCarthy J.F., Forrest W.J., Houck J.R., 1978. 16-38 micron spectroscopyof NGC 7027. ApJ 224, 109.
Meixner M., Ueta T., Bobrowsky M., Speck A., 2002. Two subclasses ofproto-planetary nebulae: model calculations. ApJ 571, 936.
Metzler K., Bischoff A., Stoeffler D., 1992. Accretionary dust mantles in CMchondrites - Evidence for solar nebula processes. Geochim. Cosmochim. Acta 56,2873.
Meyer A.W., Smith R.G., Charnley S.B., Pendleton Y.J., 1998. H2O Ice inthe Envelopes of OH/IR Stars. AJ 115, 2509.
Mihalas D., Kunasz P.B., Hummer D.G., 1975. Solution of the comoving frameequation of transfer in spherically symmetric flows. I - Computational method forequivalent-two-level-atom source functions. ApJ 202, 465.
Mittlefehldt D.W., 1994. ALH84001, a cumulate orthopyroxenite member of themartian meteorite clan. Meteoritics 29, 214.
Molster F.J., 2000. Crystalline silicates in circumstellar dust shells. Ph.D. thesis,University of Amsterdam, The Netherlands.
Molster F.J., Lim T.L., Sylvester R.J., et al., 2001a. The complete ISOspectrum of NGC 6302. A&A 372, 165.
Molster F.J., Waters L.B.F.M., Tielens A.G.G.M., 2002a. Crystalline silicatedust around evolved stars II. The crystalline silicate complexes. A&A 382, 222.
Molster F.J., Waters L.B.F.M., Tielens A.G.G.M., Barlow M.J., 2002b.Crystalline silicate dust around evolved stars I. The sample stars. A&A 382, 184.
Molster F.J., Waters L.B.F.M., Tielens A.G.G.M., Koike C., Chihara H.,2002c. Crystalline silicate dust around evolved stars III. A correlations study ofcrystalline silicate features. A&A 382, 241.
Molster F.J., Waters L.B.F.M., Trams N.R., et al., 1999a. The compositionand nature of the dust shell surrounding the binary AFGL 4106. A&A 350, 163.
Molster F.J., Yamamura I., Waters L.B.F.M., et al., 1999b. Low-temperaturecrystallization of silicate dust in circumstellar disks. Nature 401, 563.
—, 2001b. IRAS 09425−6040: A carbon star surrounded by highly crystalline silicatedust. A&A 366, 923.
Monnier J.D., Tuthill P.G., Lopez B., Cruzalebes P., Danchi W.C., Han-iff C.A., 1999. The last gasps of VY Canis Majoris: Aperture synthesis andadaptive optics imagery. ApJ 512, 351.
Moore M.H., 1999. The Physics and Chemistry of Ices in the Interstellar Medium.In Solid Interstellar Matter: The ISO Revolution, Les Houches Workshop, February2-6, 1998. Edited by L. d’Hendecourt, C. Joblin, and A. Jones. EDP Sciences andSpringer-Verlag, p. 199.
Moore M.H., Hudson R.L., 1994. Far-infrared spectra of cosmic-type pure andmixed ices. A&AS 103, 43.
Morris M., 1980. Molecular emission from expanding envelopes around evolvedstars. III. Thermal and maser CO emission. ApJ 236, 823.
170

BIBLIOGRAPHY
Omont A., Forveille T., Moseley S.H., et al., 1990. Observations of 40-70micron bands of ice in IRAS 09371 +1212 and other stars. ApJ 355, L27.
Onaka T., de Jong T., Willems F.J., 1989. A study of M Mira variables basedon IRAS LRS observations. I - Dust formation in the circumstellar shell. A&A 218,169.
Ordal M.A., Bell R.J., Alexander R.W., Newquist L.A., Querry M.R.,1988. Optical properties of Al, Fe, Ti, Ta, W, and Mo at submillimeter wavelengths.Applied Optics 27, 1203.
Orofino V., Blanco A., Fonti S., Proce R., Rotundi A., 1997. The infraredoptical constants of limestone particles and implications for the search of carbonateson Mars. Planet. Space Sci. 46, 1659.
Ossenkopf V., Henning T., Mathis J.S., 1992. Constraints on cosmic silicates.A&A 261, 567.
Pantin E., Waelkens C., Malfait K., 1999. SWS observations of the β Pictorisdust disk. In ESA SP-427: The Universe as Seen by ISO, volume 427, p. 385.
Payne H.E., Phillips J.A., Terzian Y., 1988. A young planetary nebula with OHmolecules - NGC 6302. ApJ 326, 368.
Pegourie B., Papoular R., 1985. The optical properties of dust in the mid-IRsilicate bands. A&A 142, 451.
Penman J.M., 1976. Measurements of infrared reflectivity of astronomically inter-esting non-silicates. MNRAS 176, 539.
Persi P., Cesarsky D., Marenzi A.R., et al., 1999. Mid-infrared spectral imagesof planetary nebulae with ISOCAM. A&A 351, 201.
Philipp H.R., 1985. Handbook of Optical Constants of Solids, pp. 719–747. AcademicPress, Inc., Orlando, FL.
Planesas P., Bachiller R., Martın-Pintado J., Bujarrabal V., 1990. Themolecular envelope of Mira. ApJ 351, 263.
Pope K.O., Ocampo A.C., Fischer A.G., Morrison J., Sharp Z., 1996. Car-bonate Condensates in the Chicxulub Ejecta Deposits from Belize. In Lunar andPlanetary Science Conference, volume 27, p. 1045.
Posch T., Kerschbaum F., Mutschke H., Fabian D., Dorschner J., HronJ., 1999. On the origin of the 13 µm feature: A study of ISO-SWS spectra ofoxygen-rich AGB stars. A&A 352, 609.
Pottasch S.R., Beintema D., Dominguez-Rodriguez F.J., Schaeidt S.,Valentijn E., Vandenbussche B., 1996. The central star of the planetary nebulaNGC 6302. A&A 315, L261.
Pottasch S.R., Beintema D.A., 1999. The ISO spectrum of the planetary nebulaNGC 6302 II. Nebular abundances. A&A 347, 975.
Quirico E., Raynal P.I., Borg J., et al., 2000. The Question of the 6.8 µm-bandin the Spectra of 5 IDPs. In Lunar and Planetary Science Conference, volume 31,p. 1260.
Reimann H.G., Linz H., Wagner R., et al., 2000. TIMMI2: a new multimodemid-infrared instrument for the ESO 3.6-m telescope. Proc. SPIE 4008, 1132.
Renzini A., 1981. Red giants as precursors of planetary nebulae. In I. Iben Jr.,
171

BIBLIOGRAPHY
A. Renzini, eds., Physical processes in red giants, pp. 431–446. D. Reidel PublishingCompany, Dordrecht, Holland.
Richards A.M.S., Yates J.A., Cohen R.J., 1999. Maser mapping of small-scalestructure in the circumstellar envelope of S Persei. MNRAS 306, 954.
Rietmeijer F.J.M., 1985. A model for diagenesis in proto-planetary bodies. Na-ture 313, 293.
Rietmeijer F.J.M., Karner J.M., 1999. Metastable eutectic gas to solid conden-sation in the Al2O3-SiO2 system. J. Chem. Phys. 110, 4554.
Rietmeijer F.J.M., Nuth J.A., Mackinnon I.D.R., 1986. Analytical electronmicroscopy of Mg-SiO smokes: A comparison with infrared and XRD studies.Icarus 66, 211.
Rietmeijer F.J.M., Nuth III J.A., Karner J.M., 1999a. Metastable eutecticcondensation in a Mg-Fe-SiO-H2-O2 vapor: analogs to circumstellar dust. ApJ 527,395.
—, 1999b. Metastable eutectic, gas to solid, condensation in the FeO-Fe2O3-SiO2
system. Phys. Chem. Chem. Phys. 1, 1511.Roche P.F., Aitken D.K., 1984. OH 32.8 −0.3 - A second source with absorption
features of pure water ice. MNRAS 209, 33P.—, 1986. The infrared spectral properties of planetary nebulae. MNRAS 221, 63.Rogers C., Martin P.G., Crabtree D.R., 1983. The circumstellar dust of MU
Cephei. ApJ 272, 175.Rossi S.C.F., Benevides-Soares P., Barbuy B., 1991. Grain coagulation in
contracting protostellar clouds. A&A 251, 587.Russell R.W., Soifer B.T., Puetter R.C., 1977a. The 4–8 µm spectrum of the
BNKL source in Orion. A&A 54, 959.Russell R.W., Soifer B.T., Willner S.P., 1977b. The 4 to 8 micron spectrum
of NGC 7027. ApJ 217, L149.Sahai R., Trauger J.T., Watson A.M., et al., 1998. Imaging of the Egg Nebula
(CRL 2688) with WFPC2/HST: A History of AGB/Post–AGB Giant Branch MassLoss. ApJ 493, 301.
Sandford S.A., Walker R.M., 1985. Laboratory infrared transmission spectra ofindividual interplanetary dust particles from 2.5 to 25 microns. ApJ 291, 838.
Schaal R.B., Thompson T.D., Horz F., Bauer J.F., 1979. Shock metamorphismof granulated lunar basalt. In Lunar and Planetary Science Conference, volume 10,pp. 2547–2571.
Schaeidt S.G., Morris P.W., Salama A., et al., 1996. The photometric cali-bration of the ISO Short Wavelength Spectrometer. A&A 315, L55.
Schmitt B., Quirico E., Trotta F., Grundy W.M., 1998. Optical propertiesof ices from UV to infrared. In ASSL Vol. 227: Solar System ices, p. 199.
Schoier F.L., Ryde N., Olofsson H., 2002. Probing the mass loss his-tory of carbon stars using CO line and continuum emission. A&A In press,http://xxx.lanl.gov/abs/astro-ph/0206078.
Schonberg K., 1988. Molecular line spectra from circumstellar envelopes. I - Ex-citation of 12CO, 13CO, and CS, and the formation of line profiles. A&A 195,
172
BIBLIOGRAPHY
198.Schonberg K., Hempe K., 1986. Multilevel line formation in the comoving frame
- Accurate solution using an approximate Newton-Raphson operator. A&A 163,151.
Schutte W.A., Tielens A.G.G.M., 1989. Theoretical studies of the infrared emis-sion from circumstellar dust shells: the infrared characteristics of circumstellar sil-icates and the mass-loss rate of oxygen-rich late-type giants. ApJ 343, 369.
Schwarz H.E., Corradi R.L.M., Melnick J., 1992. A catalogue of narrow bandimages of planetary nebulae. A&AS 96, 23.
Scott E.R.D., Krot A.N., Yamaguchi A., 1998. Carbonates in fractures of Mar-tian meteorite Allan Hills 840001: petrologic evidence for impact origin. Meteoriticsand Planetary Science 33, 709.
Seab C.G., Snow T.P., 1985. A search for diffuse interstellar bands in the ultravi-olet. ApJ 295, 485.
Servoin J.L., Piriou B., 1973. Infrared reflectivity and Raman scattering ofMg2SiO4 single crystal. Phys. Stat. Sol. 55, 677.
Shaw R.A., Kaler J.B., 1989. Apparent magnitudes of luminous planetary nebulanuclei. II - A survey of southern hemisphere planetary nebulae. ApJS 69, 495.
Simis Y.J.W., 2001. Mass loss modulation in dust forming stellar winds. Ph.D.thesis, Leiden University, The Netherlands.
Simis Y.J.W., Icke V., Dominik C., 2001. Origin of quasi-periodic shells in dustforming AGB winds. A&A 371, 205.
Sloan G.C., Price S.D., 1998. The infrared spectral classification of oxygen-richdust shells. ApJS 119, 141.
Smith R.G., Herman J., 1990. Absorption features in the infrared spectra of OH/IRstars - 3- and 10-micron spectroscopy of OH 138.0 + 7.3. A&A 227, 147.
Smith R.G., Robinson G., Hyland A.R., Carpenter G.L., 1994. Molecular icesas temperature indicators for interstellar dust: the 44 and 62 µm lattice features ofH2O ice. MNRAS 271, 481.
Snow T.P., 1984. Interstellar abundances and depletions inferred from observationsof neutral atoms. ApJ 287, 238.
Snow T.P., Witt A.N., 1996. Interstellar depletions updated: Where all the atomswent. ApJ 468, L65.
Sofia U.J., Cardelli J.A., Savage B.D., 1994. The abundant elements in inter-stellar dust. ApJ 430, 650.
Sogawa H., Kozasa T., 1999. On the origin of crystalline silicate in circumstellarenvelopes of oxygen-rich asymptotic giant branch stars. ApJ 516, L33.
Soifer B.T., Willner S.P., Caps R.W., Rudy R.J., 1981. 4–8 micron spec-trophotometry of OH 0739−14. ApJ 250, 631.
Sopka R.J., Olofsson H., Johansson L.E.B., Nguyen-Q-Rieu, ZuckermanB., 1989. Molecular emission lines from the envelopes of evolved stars. A&A 210,78.
Speck A.K., Barlow M.J., Sylvester R.J., Hofmeister A.M., 2000. Dustfeatures in the 10 µm infrared spectra of oxygen-rich evolved stars. A&AS 146,
173
BIBLIOGRAPHY
437.Spitzer W.G., Kleinman D.A., 1961. Infrared lattice bands of quartz.
Phys. Rev. 121, 1324.Spitzer Jr. L., Tukey J.W., 1951. A theory of interstellar polarization. ApJ 114,
187.Steyer T.R., 1974. Infrared optical properties of some solids of possible interest in
astronomy and atmospheric physics. Ph.D. thesis, University of Arizona, USA.Suh K.W., 1999. Optical properties of the silicate dust grains in the envelopes around
asymptotic giant branch stars. MNRAS 304, 389.Suh K.W., Kim H.Y., 2002. Modeling IR spectra of OH/IR stars at different phases.
A&A Accepted.Suttner G., Yorke H.W., Lin D.N.C., 1999. Dust coagulation in infalling pro-
tostellar envelopes. I. Compact grains. ApJ 524, 857.Swinyard B.M., Burgdorf M.J., Clegg P.E., et al., 1998. In-orbit perfor-
mance of the ISO long-wavelength spectrometer. In Proc. SPIE, Infrared Astro-nomical Instrumentation, Albert M. Fowler; Ed., volume 3354, pp. 888–899.
Swinyard B.M., Clegg P.E., Ade P.A.R., et al., 1996. Calibration and perfor-mance of the ISO Long-Wavelength Spectrometer. A&A 315, L43.
Thompson S.P., Tang C.C., 2001. Laboratory investigations of crystallisation inannealed amorphous MgSiO3. A&A 368, 721.
Tielens A.G.G.M., 1989. Towards a circumstellar silicate mineralogy. In M.O.Mennessier, A. Omont, eds., From Miras to Planetary Nebulae: which path forstellar evolution?, pp. 186–200.
Tielens A.G.G.M., Allamandola L.J., Bregman J., Goebel J.,d’Hendecourt L.B., 1984. Absorption features in the 5–8 micron spectraof protostars. ApJ 287, 697.
Tielens A.G.G.M., Hollenbach D., 1985. Photodissociation regions. I - Basicmodel. ApJ 291, 722.
Tielens A.G.G.M., McKee C.F., Seab C.G., Hollenbach D.J., 1994. Thephysics of grain-grain collisions and gas-grain sputtering in interstellar shocks.ApJ 431, 321.
Tielens A.G.G.M., Seab C.G., Hollenbach D.J., McKee C.F., 1987. Shockprocessing of interstellar dust: diamonds in the sky. ApJ 319, L109.
Tielens A.G.G.M., Waters L.B.F.M., Molster F.J., Justtanont K., 1998.Circumstellar silicate mineralogy. Ap&SS 255, 415.
Tomeoka K., Buseck P.R., 1986. A carbonate-rich, hydrated, interplanetary dustparticle: possible residue from protostellar clouds. Science 231, 1544.
Trumpler R.J., 1930. Absorption of light in the galactic system. PASP 42, 214.van de Hulst H.C., 1957. Light scattering by small particles. New York: John Wiley
& Sons.van der Veen W.E.C.J., Habing H.J., 1988. The IRAS two-colour diagram as a
tool for studying late stages of stellar evolution. A&A 194, 125.van Langevelde H.J., van der Heiden R., van Schooneveld C., 1990. Phase
lags from multiple flux curves of OH/IR stars. A&A 239, 193.
174
BIBLIOGRAPHY
van Zadelhoff G.J., 2002. Shaping disks. A radiative transfer and gas abundancestudy of circumstellar matter. Ph.D. thesis, Leiden University, The Netherlands.
van Zadelhoff G.J., Dullemond C.P., Yates J.A., et al., 2002. Numericalmethods for non-LTE line radiative transfer: Performance and convergence charac-teristics. A&A Submitted.
Vassiliadis E., Wood P.R., 1993. Evolution of low- and intermediate-mass starsto the end of the asymptotic giant branch with mass loss. ApJ 413, 641.
Voors R.H.M., 1999. Infrared studies of hot stars with dust. Ph.D. thesis, UtrechtUniversity, The Netherlands.
Vriend W.J., 1999. Memory effects in the Si:Ga detectors of the ISO and the in-terstellar 10 µm silicate feature. Master’s thesis, Kapteijn Institute, GroningenUniversity, The Netherlands.
Waelkens C., Waters L.B.F.M., de Graauw M.S., et al., 1996. SWS obser-vations of young main-sequence stars with dusty circumstellar disks. A&A 315,L245.
Warren S.G., 1984. Optical constants of ice from the ultraviolet to the microwave.Applied Optics 23, 1206.
Waters L.B.F.M., Molster F.J., 1999. Crystalline silicates in AGB and post-AGB stars. In IAU Symp. 191: Asymptotic Giant Branch Stars, volume 191, p.209.
Waters L.B.F.M., Molster F.J., de Jong T., et al., 1996. Mineralogy ofoxygen-rich dust shells. A&A 315, L361.
Waters L.B.F.M., Molster F.J., Waelkens C., 1999. Crystalline silicates incircumstellar shells. In Solid interstellar matter: The ISO revolution, Les HouchesWorkshop, February 2-6, 1998. Edited by L. d’Hendecourt, C. Joblin, and A. Jones.EDP Sciences and Springer-Verlag, p. 219.
Waters L.B.F.M., Waelkens C., 1998. Herbig Ae/Be Stars. ARA&A 36, 233.Weidenschilling S.J., Cuzzi J.N., 1993. Formation of planetesimals in the solar
nebula. In Protostars and Planets III, pp. 1031–1060.Wetherill G.W., Stewart G.R., 1989. Accumulation of a swarm of small plan-
etesimals. Icarus 77, 330.Whittet D.C.B., Bode M.F., Longmore A.J., et al., 1988. Infrared spec-
troscopy of dust in the Taurus dark clouds - Ice and silicates. MNRAS 233, 321.Wolfire M.G., Churchwell E., 1994. Circumstellar dust emission models.
ApJ 427, 889.Wooden D.H., Butner H.M., Harker D.E., Woodward C.E., 2000. Mg-
rich silicate crystals in comet Hale-Bopp: ISM relics or solar nebula condensates?Icarus 143, 126.
Wooden D.H., Harker D.E., Woodward C.E., et al., 1999. Silicate mineralogyof the dust in the inner coma of comet C/1995 01 (Hale-Bopp) pre- and post-perihelion. ApJ 517, 1034.
Woolf N.J., Ney E.P., 1969. Circumstellar infrared emission from cool stars.ApJ 155, L181.
Yamagishi K., Saeki T., Koike C., Chihara H., 2001. The absorption spec-
175
BIBLIOGRAPHY
tra of carbonates in the mid- and far-infrared regions. Meteoritics and PlanetaryScience 36, 228.
Yamamura I., de Jong T., Cami J., 1999. Infrared emission of hot water in theatmosphere of Mira. A&A 348, L55.
Yuasa M., Unno W., Magono S., 1999. Distance determination of mass-losingstars. PASJ 51, 197.
Zubko V., Elitzur M., 2000. Water and Dust Emission from W Hydrae. ApJ 544,L137.
176