Utilizing Responses to Smart Phone Notifications as Affective ...
13
1 NotiMind: Utilizing Responses to Smart Phone Notifications as Affective sensors Eiman Kanjo 1 , Daria J. Kuss 2 , and Chee Siang Ang 3 1 Computing and Technology Department, Nottingham Trent University, eiman.kanjo@ ntu.ac.uk 2 Psychology Department , Nottingham Trent University Daria.Kuss@ ntu.ac.uk University of Kent 3 [email protected]. Abstract—Today’s mobile phone users are faced with large numbers of notifications on social media, ranging from new followers on Twitter and emails to messages received from WhatsApp and Facebook. These digital alerts continuously disrupt activities through instant calls for attention. This paper examines closely the way everyday users interact with notifications and their impact on users’ emotion. Fifty users were recruited to download our application NotiMind and use it over a five-week period. Users’ phones collected thousands of social and system notifications along with affect data collected via self-reported PANAS tests three times a day. Results showed a noticeable correlation between positive affective measures and keyboard activities. When large numbers of Post and Remove notifications occur, a corresponding increase in negative affective measures is detected. Our predictive model has achieved a good accuracy level using three different classifiers “in the wild” (F-measure 74-78% within- subject model, 72-76% global model). Our findings show that it is possible to automatically predict when people are experiencing positive, neutral or negative affective states based on interactions with notifications. We also show how our findings open the door to a wide range of applications in relation to emotion awareness on social and mobile communication. Keywords— Mobile Sensing, Affective Computing, Mobile Computing, Mobile Social media, Machine Learning 1 INTRODUCTION notification is generally defined as a visual cue, auditory signal, or haptic alert generated by an application or service to capture the user’s attention (Iqbal and Horvitz, 2010). Currently, all major smartphone platforms (i.e., iOS and Android) offer a standardized user interface mechanism for notifications, displaying all notifications in the notification bar located at the top of the screen. Given the increase of mobile applications (apps) on smartphones, notifications are becoming ubiquitous, providing a broad range of information, from system (e. g., app updates) to social information (e. g., a message from a friend). More specifically, notifications on smartphones inform users about a variety of events, such as the arrival of a text message or emails, an incoming phone call, a new comment on one of their social network posts, game- related status updates, system status or the availability of an application update. Notifications hence provide a means for app publishers and advertisers to connect with users. Within the HCI and Ubicomp research communities, there has been a growing interest in studying how users respond to notifications, with an aim to design better notification delivery systems, which minimize disruption. For instance, it has been found that not all notifications are treated the same way by the users. In response to notifications, users may take immediate action or ignore notifications depending on the importance of a notification as well as the user’s current context. It is important to understand how users respond to notifications in the context of smartphones. In contrast to notifications on desktop computers, notifications on smartphones are less likely to be delivered when the users are actively interacting with the device: despite the large amount of time users spend with their smartphones, the device is often not in active use when notifications arrive. Therefore, with smartphones, notifications have some unique characteristics which need to be considered: i) they are delivered through a standardized mechanism, ii) they inform about a larger variety of events, ranging from social messages to system events, and iii) they are pervasive due to the omnipresent nature of smartphones, which are always with the user (Ichikawa, Chipchase et al. 2005; Wiese, Saponas et al. 2013). While mobile phones and mobile notifications have enhanced the convenience of our life, their obsessive use may have an adverse impact on mental health and wellbeing. This impact is still under investigation and researchers have started to look at various techniques to understand and diagnose problematic mobile phone use and mobile phone addiction (Billieux, Maurage, Olatz- Lopez, Kuss & Griffiths, 2015). In this paper, we present our mobile phone application NotiMind which aims to: 1. Monitor mobile notifications and gather interaction data unobtrusively based on the amount of notifications received and delivery pattern of notifications on mobile phones. 2. Model user interaction and reaction to mobile notifications and their impact on affective states based on a machine learning approach. A
-
Upload
khangminh22 -
Category
Documents
-
view
2 -
download
0
Transcript of Utilizing Responses to Smart Phone Notifications as Affective ...

1
NotiMind: Utilizing Responses to Smart Phone Notifications as Affective sensors
Eiman Kanjo1, Daria J. Kuss2, and Chee Siang Ang3
1Computing and Technology Department, Nottingham Trent University, eiman.kanjo@ ntu.ac.uk
2Psychology Department , Nottingham Trent University Daria.Kuss@ ntu.ac.uk
University of Kent [email protected].
Abstract—Today’s mobile phone users are faced with large numbers of notifications on social media, ranging from new followers
on Twitter and emails to messages received from WhatsApp and Facebook. These digital alerts continuously disrupt activities
through instant calls for attention. This paper examines closely the way everyday users interact with notifications and their impact
on users’ emotion. Fifty users were recruited to download our application NotiMind and use it over a five-week period. Users’
phones collected thousands of social and system notifications along with affect data collected via self-reported PANAS tests three
times a day. Results showed a noticeable correlation between positive affective measures and keyboard activities. When large
numbers of Post and Remove notifications occur, a corresponding increase in negative affective measures is detected. Our
predictive model has achieved a good accuracy level using three different classifiers “in the wild” (F-measure 74-78% within-
subject model, 72-76% global model). Our findings show that it is possible to automatically predict when people are experiencing
positive, neutral or negative affective states based on interactions with notifications. We also show how our findings open the
door to a wide range of applications in relation to emotion awareness on social and mobile communication.
Keywords— Mobile Sensing, Affective Computing, Mobile Computing, Mobile Social media, Machine Learning
1 INTRODUCTION
notification is generally defined as a visual cue, auditory signal, or haptic alert generated by an
application or service to capture the user’s attention (Iqbal and Horvitz, 2010). Currently, all major smartphone platforms (i.e., iOS and Android) offer a standardized user interface mechanism for notifications, displaying all notifications in the notification bar located at the top of the screen. Given the increase of mobile applications (apps) on smartphones, notifications are becoming ubiquitous, providing a broad range of information, from system (e. g., app updates) to social information (e. g., a message from a friend). More specifically, notifications on smartphones inform users about a variety of events, such as the arrival of a text message or emails, an incoming phone call, a new comment on one of their social network posts, game-related status updates, system status or the availability of an application update. Notifications hence provide a means for app publishers and advertisers to connect with users.
Within the HCI and Ubicomp research communities, there has been a growing interest in studying how users respond to notifications, with an aim to design better notification delivery systems, which minimize disruption. For instance, it has been found that not all notifications are treated the same way by the users. In response to notifications, users may take immediate action or ignore notifications depending on the importance of a notification as well as the user’s current context. It is important to understand how users respond to notifications in the context of smartphones. In contrast to notifications on
desktop computers, notifications on smartphones are less likely to be delivered when the users are actively interacting with the device: despite the large amount of time users spend with their smartphones, the device is often not in active use when notifications arrive. Therefore, with smartphones, notifications have some unique characteristics which need to be considered: i) they are delivered through a standardized mechanism, ii) they inform about a larger variety of events, ranging from social messages to system events, and iii) they are pervasive due to the omnipresent nature of smartphones, which are always with the user (Ichikawa, Chipchase et al. 2005; Wiese, Saponas et al. 2013).
While mobile phones and mobile notifications have enhanced the convenience of our life, their obsessive use may have an adverse impact on mental health and wellbeing. This impact is still under investigation and researchers have started to look at various techniques to understand and diagnose problematic mobile phone use and mobile phone addiction (Billieux, Maurage, Olatz-Lopez, Kuss & Griffiths, 2015).
In this paper, we present our mobile phone application NotiMind which aims to:
1. Monitor mobile notifications and gather interaction data unobtrusively based on the amount of notifications received and delivery pattern of notifications on mobile phones.
2. Model user interaction and reaction to mobile notifications and their impact on affective states based on a machine learning approach.
A

2
3. Examine patterns of user interaction with mobile phone notifications, status and screen activities and their correlations with affective states of the users.
Our approach is based on utilising machine learning to recognize affective states of smartphone users to assess the users’ emotional states. We set up “in the wild” user studies and gathered various types of notifications data from participants’ smartphones. These data were collected using a custom-built application, called “NotiMind” which collects a wide range of social and work notifications, such as screen events (e.g. Screen-On and Screen Unlock), Time/Date, ringtone volume. Additionally, NotiMind collects self-reported affective states of users, using a short version of the Positive and Negative Affective States scale (PANAS; Thompson, 2007). The ultimate aim of the study is to unobtrusively recognize individual smartphone users’ positive negative emotions, and their relationship with type and frequency of notifications received on their smartphones.
2 BACKGROUND
2.1 Notifications
Notifications are a feature on smartphones and other devices to keep users informed and engaged. Notifications can alert users to information regarding a range of subjects, including incoming messages, engagement with their social media posts, and availability of WIFI networks or applications updates, curated nearby places according to their geolocations and email content preview (Iqbal and Horvitz 2010), and are commonly presented on a notification panel on top of the screen. Figure 1 shows types of mobile notifications and their main categories.
In the desktop and mobile environment, notifications have been viewed as means to proactively provide awareness of information while users are attending to a primary task. These alerts arrive in form of a brief text and alerting sound (if the volume is on) or vibrating (on mobile phones and smart watches) to catch end-users’ attention. The time taken by users to attend to those notifications often depends on how important the context of the notifications is (e.g., a family emergency may require a more immediate response than a work email), and what contexts the users find themselves in when receiving the notification (e.g., a user is more likely to attend to a notification when they are not currently actively engaged in another activity). A main function of notifications is to allow users to switch between work-related and social apps. Such switches are often driven by the user’s own need to forage information as required for the current task, or after being proactively alerted about the arrival of new information.
Previous work has shown that although users are aware of the disruptive effects of notifications, they generally appreciate the awareness that notifications provide (Iqbal & Horvitz 2010; Mark, Voida et al. 2012). Specifically in the smartphone context, users are eager to receive notifications as they keep checking their smartphones frequently (Oulasvirta, Rattenbury et al.
2012). The level of importance of notifications varies depending on the categories of the notifying apps (Oulasvirta, Rattenbury et al. 2012; Pielot, Oliveira et al. 2014).
Furthermore, some mobile social network users hardly show what they feel; therefore their friends cannot sense or react to their emotional states appropriately. This is probably because they are unfamiliar with the expression of emotion or are not aware of their own emotions. A possible solution for this problem is adopting emotion recognition technologies which are being extensively studied by the affective computing research society to determine user emotions.
Shirazi et al. (2014) carried out a large-scale assessment of mobile notifications and found that participants rated notifications from messenger applications as the most important ones, at 4.43 out of 5 (5 being the most important). Notifications from the three other communication categories and from the calendar also received high ratings with averages between 3.66 and 3.45. Notifications from the system clearly received the lowest rating (1.6). The large scale assessment (Shirazi, Henze et al. 2014) concluded that important notifications are about people and events, specifically if they notify about communication with other users, inform about other users’ actions, or about real life events. Another factor why notifications are considered unimportant is the frequency with which they are created, and whether they provide information about the phone’s internal processes.
Pielot, Oliveira et al. (2014) investigated users’ response time to various types of notifications and found a wide range of differences. Specifically, the median response time ranged from 3.5 min for messengers on weekends to 27.7 min for email on weekends. The shortest notification responses were provided for messengers (6.6 and 3.5 min) and social network applications (3.8 and 7.0 min / weekday and weekend day, respectively). It was also found that half of the notifications were viewed within a few minutes, and that the majority were attended to within an hour. When notifications arrived, the screen was off in 69.2% of the cases. The speed at which people attended to notifications indicates that notifications often triggered interaction with the phone. Moreover, given the perceived importance of various categories of apps, most users might not want to disable notifications. However this depends on the notification, such as: 1. Frequency: some applications (e.g., social media) have
the potential to send a large number of alerts by the minute: for chats, for new posts and tagged photos, etc. The notification content is likely to become less important in a situation where a large number of interruptions occur over a short period of time.
2. Content: Many mobile applications use notifications as nothing more than marketing vehicles to remind users to use those respective apps. These applications are trivial in their own right, but a potential constant distraction if not turned off. 3. Importance: In the case of a large number of
applications sending notifications to the user, the user may begin to prioritise these in order of the

3
most immediately important. For instance, notifications which were previously considered important may be re-evaluated with the introduction of new notifications which may render the notification previously considered important to comparatively less relevant.
4. Category/Source: Some notifications grab users’ at-tention more than others merely based on the appli-cation source which has generated the notification: e.g. email, WhatsApp, Facebook, Udacity, etc.
2.2 The drawback of notifications
Although notifications serve an important purpose for smartphone users, the number of apps which compete for the user’s attention using notifications has grown signifi-cantly over the years. Initially designed to raise infor-mation awareness, it has been argued that notifications have now become too frequent (Iqbal and Horvitz 2010; Shirazi, Henze et al. 2014), and may be contributing to stress (Westermann et al. 2015).
Extensive research has been conducted investigating in-terruption of information workers through notifications in a desktop context (Horvitz 2001; Adamczyk & Bailey 2004; Czerwinski, Horvitz et al. 2004). Studies have shown that workers tend to drop their current task to check the notifi-cation, and it is difficult for them to return to their previous tasks (Czerwinski, Horvitz et al. 2004). Indeed, a large body of work in HCI has looked into the detrimental ef-fects of digital interruptions. Experiments in a controlled laboratory environment have revealed that notifications arriving at random times are particularly disruptive (Horvitz 2001; Baethge & Rigotti 2013). In field experi-ments, digital interruptions at work (e.g., email alerts) have been linked to feeling distracted, stressed, and anx-ious (Kushlev & Dunn 2015).
As discussed previously (Section 2.1), people often at-tend quickly, if not immediately, to notifications on their smartphones, which arrive at random times, making
smartphones particularly disruptive (Adamczyk et al., 2004). Furthermore, due to the omnipresence of smartphones, users are constantly disrupted regardless of where they are, as they are likely to take their phones with them. Even when their phones are set to vibration, studies have demonstrated that people still attend to notifications quickly regardless of the alert type (Pielot, Church et al. 2014; Chang & Tang 2015).
Kushlev, Proulx et al. (2016) provided some evidence that interruptions due to notifications can cause inatten-tion and hyperactivity in the general population. It was found that when people switched on notifications and kept their phones within physical reach, they experienced higher levels of inattention and hyperactivity. They found that notifications draw users’ attention away from other ongoing activities, making people more prone to distrac-tions, increasing cognitive load, which may in turn make people experience inattention and hyperactivity. Even when users choose to disable notifications, research has suggested that for some individuals, disabling alerts may produce anxiety over missing out (Pielot and Rello 2015). Such anxiety may lead users to self-interrupt more fre-quently. In one study, information workers disabled their email notifications for one week; it was found that some workers checked their email even more to avoid missing important emails (Iqbal & Horvitz 2010). Hence, simply turning the notifications off may not be the solution to the disruptive nature of smartphone notifications. This may lead users to compulsively check for missed notifications, for instance from social networking apps due to social pressure (Pielot, Church et al. 2014) and the fear of missing out (FOMO; Przybylski et al. 2013).
Apart from distraction and stress, some studies have suggested that extensive use of smartphones could poten-tially lead to smartphone addiction (Bayer & Campbell 2012; Billieux et al. 2015; Oulasvirta, Rattenbury et al. 2012). In one study, researchers found that their partici-pants checked their smartphones 34 times a day (Oulasvirta, Rattenbury et al. 2012). Yoon, Lee et al. (2014) investigated the way young people make use of smartphones. It was found that they receive an average of 400 notifications a day. It was claimed that the usage pat-tern of smartphone by young people bordered on addic-tion.
However, research on the extent to which mobile phone notifications fare in this is currently limited. Moreover, the traditional clinical approach based questionnaires and in-terviews typically used in mobile phone addiction research (Lopez-Fernandez, Kuss, et al., 2017) have limitations: health professionals cannot perform continual assessments and interventions for their clients, and the subjectivity of assessments is questionable. This indicates objective data that tracks users in an ecologically valid way is needed in order to better understand mobile phone usage patterns and associated problems.
2.3 Machine learning work on notifications
Despite the disruptive nature of notifications, studies have found that users suffered no negative consequences when they were interrupted at opportune times in between work
Work Social
System
Reminder
WIFI GPS
Personal Health
Fitness
Game
Update
Viper
Skype
Fig 1. Types of Notifications.

4
tasks. Therefore, various studies have been conducted by means of machine learning to understand the factors lead-ing to users responding to notifications, with the aim to predict how long it will take for users to respond to a noti-fication, and to understand what the most opportune mo-ments are and what are the best ways to deliver notifica-tions.
Avrahami and Hudson (2006) used machine learning techniques to predict how fast a user responds to an instant message in a desktop computer setting including 16 co-workers at Microsoft with a total of 90,000 messages. Using these data, they trained models with an accuracy of 90.1% to predict if a message would get a response in 0.5, 1, 2, 5, and 10 minutes. Strong predictors of responsiveness were “the amount of user interaction with the system”, “the time since the last outgoing message”, and “the duration of the current online-status”.
Fogarty, Hudson et al. (2005) and Hudson, Fogarty et al. (2003) collected data from four information workers to pre-dict when they were interrupted whilst at work. They con-cluded that a single microphone, the time of the day, the use of the phone, and the interaction with mouse and key-board can estimate a worker’s interruptibility with an ac-curacy of 76.3%. Drawing from this, Begole, Matsakis et al. (2004) developed a prototype sensing sounds, motion, us-ing the phone, and using the office door to predict if a worker is potentially available to interruptions.
Rosenthal, Dey et al. (2011) developed a model to pre-dict when a phone should be put in silent mode using ex-perience sampling to collect data on user preferences for different situations. They considered features such as time and location, reason for the alert, and details about the alert (e.g., whether it came from a caller listed in the user’s fa-vorites) in their model. An experimental study showed that thirteen out of nineteen participants were satisfied with the accuracy of the automatic muting.
Pielot, Oliveira et al. (2014) identified that features ex-tracted from the phone, such as the user’s interaction with the notification center, the screen activity, the proximity sensor, and the ringer mode, can be used to predict how quickly the user will respond to the messages. It was found that with seven high-level features a user’s level of atten-tiveness to mobile messages can be successfully estimated, with an overall accuracy of 70.6%. Taken together, these studies demonstrate the value of machine learning for identifying user interaction trends based on mobile device notifications.
2.4 Recognition and Emotional Impact of Notifications
Although machine learning has been used to identify user interactions with smartphones based on notifications, there has been little previous research using machine learning to predict the direct emotional impact of these no-tifications and interruptions. Many affective computing and HCI researchers have suggested various methods to sense and recognize human emotions (Kanjo, Al-Husain et al. 2015). Existing emotion recognition technologies can be divided into various categories, depending on what kinds of data are analyzed for recognizing human emotion:
physiological signals, facial expressions, text or voice. Physiological emotion recognition shows acceptable per-formance but has some critical weaknesses that prevent its widespread use: they are obtrusive to users and need spe-cial equipment or devices (such as a skin conductance sen-sor, blood pressure monitor, or electrocardiography (ECG)). These devices are not only intrusive to users, but involve additional costs. Similarly, emotion recognition using facial expressions or speech limits their usage be-cause the device needs to be positioned in front of the user’s face and needs to continuously listen to the user’s voice or record the user’s face. This is not only not practical in the mobile context, but it raises various issues with re-gards to user acceptance and ethics.
While emotional recognition using physiological sig-nals and facial/voice recognition has been extensively re-searched (Kanjo, (2017); Alhusain, (2013); Mawas, (2013); Alajmi, (2013); AlBarrak, (2013)), few studies have looked into the emotional responses to smartphone notifications. Many studies have found that notifications are predomi-nantly linked to negative emotions. Pielot, Church et al.’s (2014) qualitative analysis revealed that using emails and social networks was correlated with feeling overwhelmed, stressed, interrupted and annoyed. Furthermore, when re-ceiving more emails, participants were also more likely to report experiences where notifications kept them from do-ing something else or when they felt pressure to respond faster than they were able to. On the other hand, social no-tifications, despite their equally high volume, and social networks to a certain extent, caused more positive emo-tional responses. For example, it was found that receiving more social messages is significantly correlated with in-creased feelings of being connected with others. It is likely that this relates to the personal nature of messaging apps. Therefore, it would appear that the nature of notifications (work vs social) in this context rather than the amount of notifications may have an impact on users’ emotional states, which will be assessed in the present study.
2.5 Impact on mental activity and affective states
Nomophobia is defined as fear of being without the mobile phone, resulting in discomfort, anxiety, and stress, and has been considered to be included in the most recent fifth edi-tion of the Diagnostic and Statistical Manual for Mental Disorders (DSM-5) (Bragazzi & Del Puente, 2014). Psy-chologists recommend cognitive-behavioral psychother-apy combined with pharmacological intervention for the treatment of this potential disorder (Bragazzi & Del Puente, 2014). Recent research findings have also shown that young adults who make particularly heavy use of mobile phones and computers run a greater risk of sleep disturbances, stress and symptoms of mental illness (Billieux et al., 2014). Thomée et al. (2011) conducted four studies assessing how the use of computers and mobile phones affects the mental health of young adults. Their findings have highlighted the need for moderation in the use of these technological devices. Their studies furthermore revealed that intensive use of mobile phones and computers can be linked to stress, sleep disorders and depressive symptoms. They
5
also discovered that frequently using a computer or phone without breaks also increases the risk of stress, sleeping problems and depressive symptoms in women, whereas men who use computers intensively are more likely to develop sleeping problems. According to the mental health charity Young Minds (2016), problems highlighted as a consequence of excessive mobile phone use include the following: addiction, attention deficiency, attentiveness/or lack of it, depression, anxiety and stress, sleep disturbances and insomnia, as well as a lack of involvement in family life, suggesting excessive mobile phone use can be associated with a considerable array of difficulties.
DATA COLLECTION SYSTEM
2.6 Software
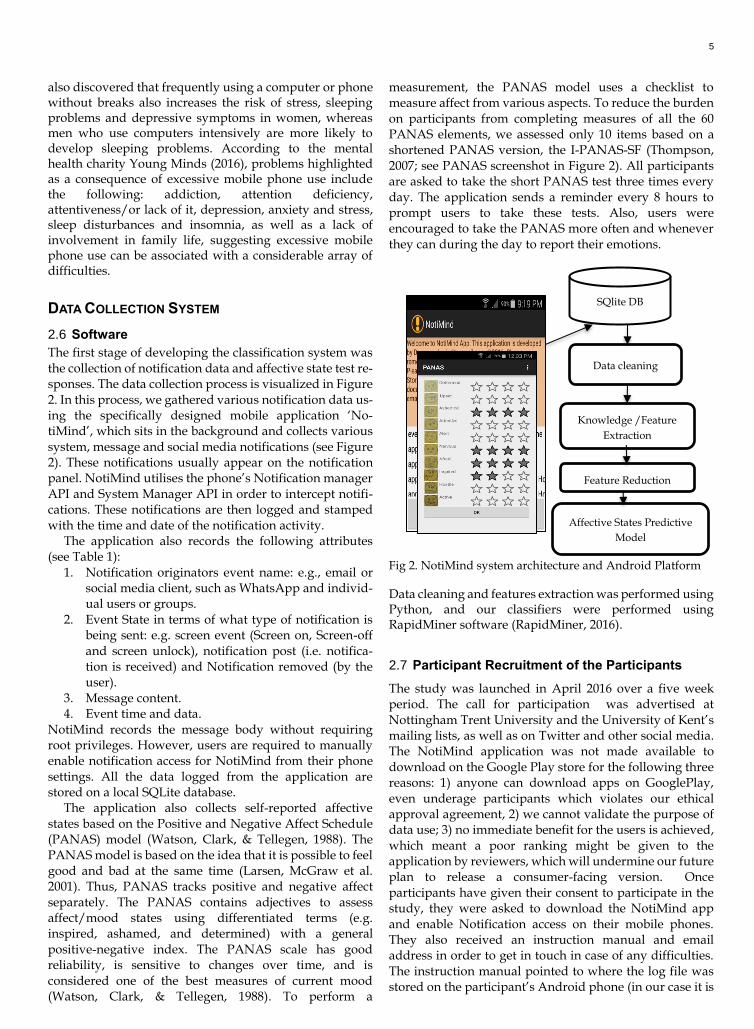
The first stage of developing the classification system was the collection of notification data and affective state test re-sponses. The data collection process is visualized in Figure 2. In this process, we gathered various notification data us-ing the specifically designed mobile application ‘No-tiMind’, which sits in the background and collects various system, message and social media notifications (see Figure 2). These notifications usually appear on the notification panel. NotiMind utilises the phone’s Notification manager API and System Manager API in order to intercept notifi-cations. These notifications are then logged and stamped with the time and date of the notification activity.
The application also records the following attributes (see Table 1):
1. Notification originators event name: e.g., email or social media client, such as WhatsApp and individ-ual users or groups.
2. Event State in terms of what type of notification is being sent: e.g. screen event (Screen on, Screen-off and screen unlock), notification post (i.e. notifica-tion is received) and Notification removed (by the user).
3. Message content. 4. Event time and data.
NotiMind records the message body without requiring root privileges. However, users are required to manually enable notification access for NotiMind from their phone settings. All the data logged from the application are stored on a local SQLite database.
The application also collects self-reported affective states based on the Positive and Negative Affect Schedule (PANAS) model (Watson, Clark, & Tellegen, 1988). The PANAS model is based on the idea that it is possible to feel good and bad at the same time (Larsen, McGraw et al. 2001). Thus, PANAS tracks positive and negative affect separately. The PANAS contains adjectives to assess affect/mood states using differentiated terms (e.g. inspired, ashamed, and determined) with a general positive-negative index. The PANAS scale has good reliability, is sensitive to changes over time, and is considered one of the best measures of current mood (Watson, Clark, & Tellegen, 1988). To perform a
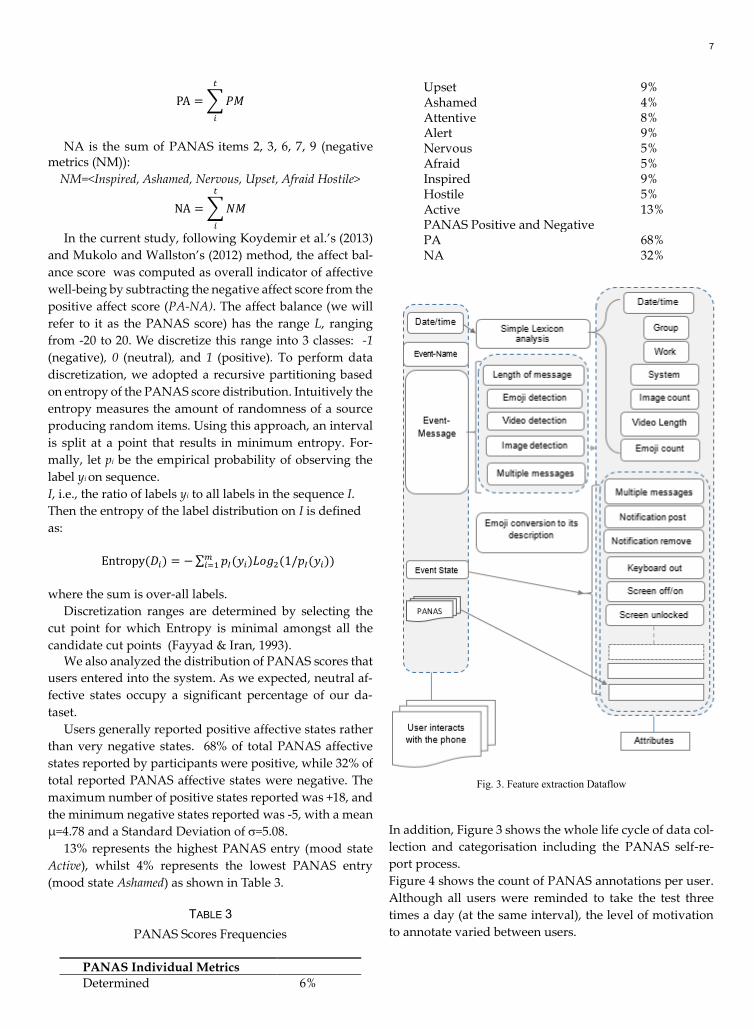
measurement, the PANAS model uses a checklist to measure affect from various aspects. To reduce the burden on participants from completing measures of all the 60 PANAS elements, we assessed only 10 items based on a shortened PANAS version, the I-PANAS-SF (Thompson, 2007; see PANAS screenshot in Figure 2). All participants are asked to take the short PANAS test three times every day. The application sends a reminder every 8 hours to prompt users to take these tests. Also, users were encouraged to take the PANAS more often and whenever they can during the day to report their emotions.
Fig 2. NotiMind system architecture and Android Platform
Data cleaning and features extraction was performed using Python, and our classifiers were performed using RapidMiner software (RapidMiner, 2016).
2.7 Participant Recruitment of the Participants
The study was launched in April 2016 over a five week period. The call for participation was advertised at Nottingham Trent University and the University of Kent’s mailing lists, as well as on Twitter and other social media. The NotiMind application was not made available to download on the Google Play store for the following three reasons: 1) anyone can download apps on GooglePlay, even underage participants which violates our ethical approval agreement, 2) we cannot validate the purpose of data use; 3) no immediate benefit for the users is achieved, which meant a poor ranking might be given to the application by reviewers, which will undermine our future plan to release a consumer-facing version. Once participants have given their consent to participate in the study, they were asked to download the NotiMind app and enable Notification access on their mobile phones. They also received an instruction manual and email address in order to get in touch in case of any difficulties. The instruction manual pointed to where the log file was stored on the participant’s Android phone (in our case it is
SQlite DB
Data cleaning
Affective States Predictive
Model
Knowledge /Feature
Extraction
Feature Reduction
6
a Sqlite file in .db format). Our application triggered three silent alerts a day with
popup notifications to remind the users of taking the PANAS test and to check that NotiMind is working as in-tended. Those who successfully completed the study were presented with a voucher as incentive for volunteering their time.
Fifty participants took part in the study (30 male and 20 female). All were existing Android users with an average age of 25. The study was approved by Nottingham Trent University’s Ethics Committee.
During the data collection process, 832,776 notifications were collected. Many users stopped responding to the questionnaires after a few days and some did not respond at all. Therefore, we selected a subset of the data for the analysis and included data of 34 users who completed the data collection task. If no PANAS test score was recorded over 10 hours, then the data for this period were dismissed. Therefore, our final dataset comprises 534,346 notifications, and 3328 unique PANAS entries.
2.8 Response Rate
We first calculated the response rate of the overall PANAS affective measure input, confirming the reliability of user input into our system.
Although we asked users to report their mood at least three times a day, we expected some absence of self-report entry due to the extensive nature of our study. We calcu-lated the daily response rate of our users and found that on average, 70% of users had three or more entries, which demonstrates the effectiveness of our self-report applica-tion. The affect distributions were fairly consistent during different times, seemingly unaffected by whether the entry was during work mornings, afternoons or evenings. The response rate, affect persistence, and distribution of the en-tered moods show NotiMind’s efficacy in collecting a wide variety of data from the users, and provide insight into the design of NotiMind.
3 DATA PREPARATION
3.1 Basic definitions and Attributes
The NotiMind app generates five attributes, which are de-
scribed in Table 1.
Due to the unstructured nature of these data, a considera-
ble amount of cleaning, removing redundant data and
reformatting was required. This step was followed by a
feature extraction step (from Event-Name, and Event-
Message columns).
Similar to prior work (Shirazi, Henze et al. 2014, Iqbal et
al., 2010), we have derived a specific categorisation scheme
based on messages and the applications they originated
from. These new categories were then discussed with the
users and finalised through further team discussion.
Also, following a similar approach to previous research
(Shirazi, Henze et al. 2014), notifications were categorised
as “work”, if the message originated from email
applications. Also we have found that “Group” messages
names were often tagged with the symbol @, which made
it easy to detect a “Group” category. Table2 shows the
derived categories.
TABLE 1
DESCRIPTION OF ATTRIBUTES COLLECTED FROM THE NO-
TIMIND APP
Attributes Description
Date/Time Time and Date of notification arrival
Event-Name Including which application or internal
mobile service initiated the message, phone
number or name of a user, or a group ( e.g. com.android.systemui : Cable charging).
Event-State With two possible values, either Notifica-
tion is posted or removed from the notifica-
tion panel
Event-Message Content of the message
Type Notification event or screen event, such as
screen locked screen On or Off
TABLE 2
LIST OF CATEGORIES DERIVED FOR THE AFFECT STATE PREDIC-
TION
Catego-
ries
Description
Group Detected when the ‘@’ sign is present in the Event-
Name. e.g. whatsapp : William @ Friendship-Group
Work Detected when certain email tags are present in the
Message. Also messages received from LinkedIn are
considered as work related.
System Detected when the following keywords are present
in the Message or Event-Name, including: ‘Updat-
ing’, ‘WIFI’, or ‘USB’.
Emoji De-
scription
Emojis detected in the text are decoded to its descrip-
tion according to the Emoji/Unicode table*.
Emoji
Count
The number of Emojis in the message.
Video
Presence
Video presence in the message is represented by the
‘Camera Recording’ Emoji (🎥 Unicode: U+1F3A5).
Video
Length
Length of the video is recorded from the value ac-
companying the ‘Camera Recording’ Emoji
Image
Presence
Image presence in message is represented by the
‘Camera’ Emoji (📷, Unicode: U+1F4F7).
Message
Length
Length of the message.
Multiple
Messages
Multiple messages notifications don’t show actual
messages, however, they indicate that the user is re-
ceiving many number messages simultaneously.
3.2 PANAS Data distribution
We considered the PANAS as a two-dimensional vector with 20 possible values for PA (Positive Affect) and 20 pos-sible values for NA (Negative Affect).
PA is the sum of PANAS items 1, 4, 5, 8, 10 (positive metrics (PM)):
PM= <Determined, Attentive, Alert, and Active>
7
PA = ∑ 𝑃𝑀
𝑡
𝑖
NA is the sum of PANAS items 2, 3, 6, 7, 9 (negative
metrics (NM)):
NM=<Inspired, Ashamed, Nervous, Upset, Afraid Hostile>
NA = ∑ 𝑁𝑀
𝑡
𝑖
In the current study, following Koydemir et al.’s (2013)
and Mukolo and Wallston’s (2012) method, the affect bal-
ance score was computed as overall indicator of affective
well-being by subtracting the negative affect score from the
positive affect score (PA-NA). The affect balance (we will
refer to it as the PANAS score) has the range L, ranging
from -20 to 20. We discretize this range into 3 classes: -1
(negative), 0 (neutral), and 1 (positive). To perform data
discretization, we adopted a recursive partitioning based
on entropy of the PANAS score distribution. Intuitively the
entropy measures the amount of randomness of a source
producing random items. Using this approach, an interval
is split at a point that results in minimum entropy. For-
mally, let pi be the empirical probability of observing the
label yi on sequence.
I, i.e., the ratio of labels yi to all labels in the sequence I.
Then the entropy of the label distribution on I is defined
as:
Entropy(𝐷𝑖) = − ∑ 𝑝𝐼(𝑦𝑖)𝐿𝑜𝑔2(1/𝑝𝐼(𝑦𝑖))𝑚
𝑖=1
where the sum is over-all labels.
Discretization ranges are determined by selecting the
cut point for which Entropy is minimal amongst all the
candidate cut points (Fayyad & Iran, 1993). We also analyzed the distribution of PANAS scores that
users entered into the system. As we expected, neutral af-
fective states occupy a significant percentage of our da-
taset.
Users generally reported positive affective states rather
than very negative states. 68% of total PANAS affective
states reported by participants were positive, while 32% of
total reported PANAS affective states were negative. The
maximum number of positive states reported was +18, and
the minimum negative states reported was -5, with a mean
μ=4.78 and a Standard Deviation of =5.08.
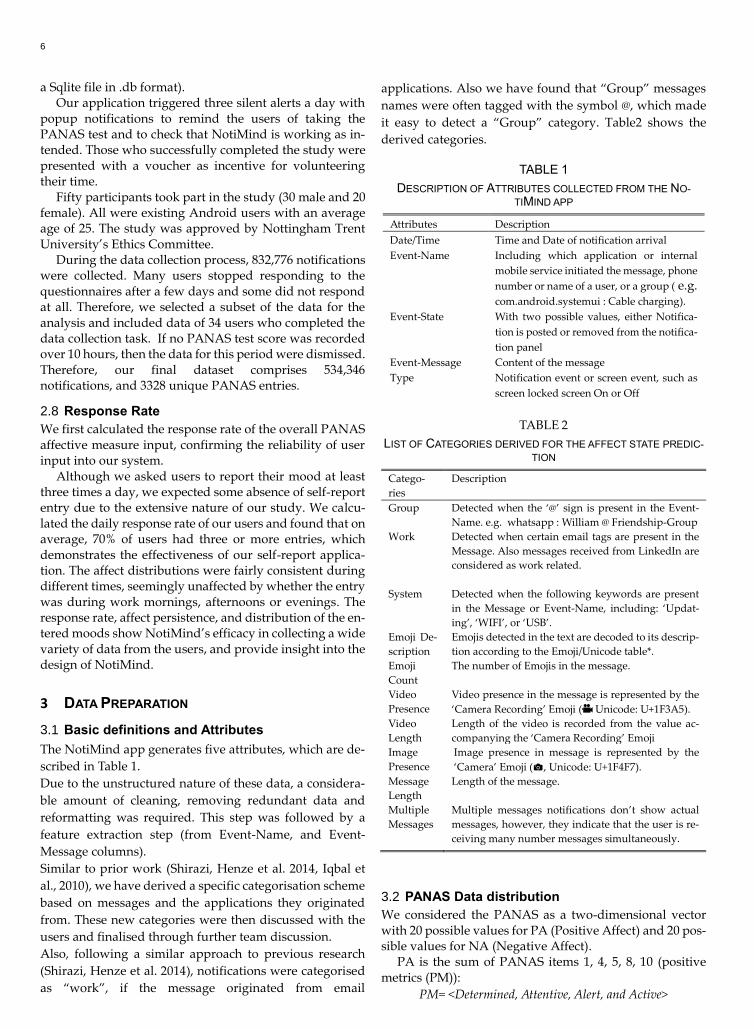
13% represents the highest PANAS entry (mood state
Active), whilst 4% represents the lowest PANAS entry
(mood state Ashamed) as shown in Table 3.
TABLE 3
PANAS Scores Frequencies
PANAS Individual Metrics
Determined 6%
Upset 9% Ashamed 4% Attentive 8% Alert 9% Nervous 5% Afraid 5% Inspired 9% Hostile 5% Active 13% PANAS Positive and Negative PA 68% NA 32%
Fig. 3. Feature extraction Dataflow
In addition, Figure 3 shows the whole life cycle of data col-
lection and categorisation including the PANAS self-re-
port process.
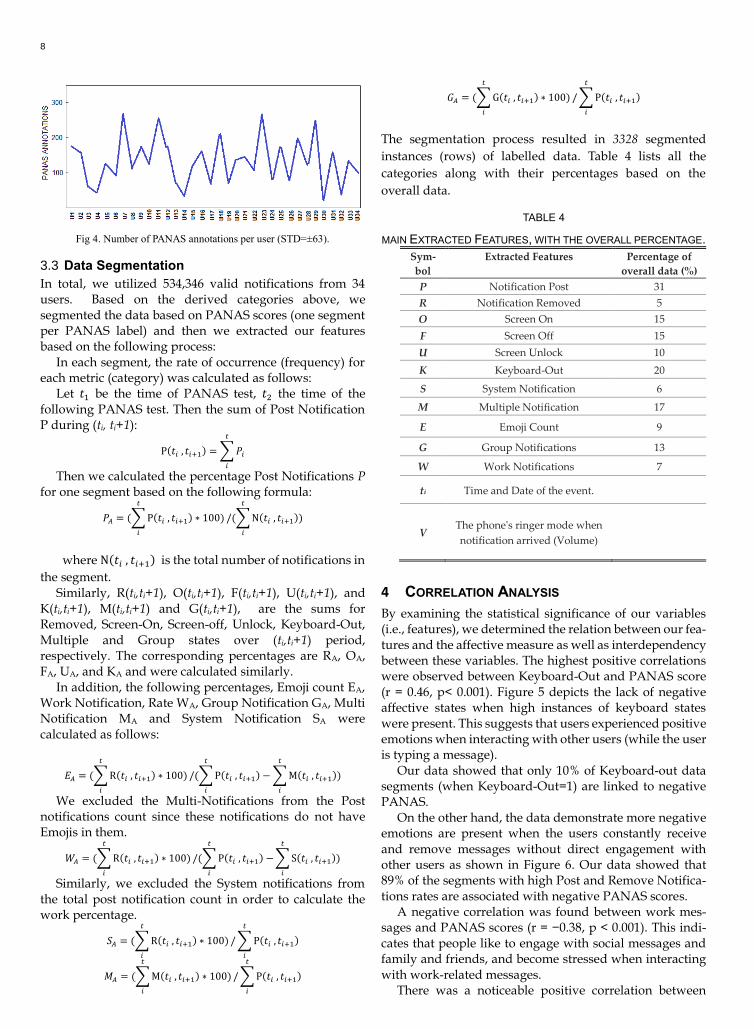
Figure 4 shows the count of PANAS annotations per user.
Although all users were reminded to take the test three
times a day (at the same interval), the level of motivation
to annotate varied between users.
8
Fig 4. Number of PANAS annotations per user (STD=±63).
3.3 Data Segmentation
In total, we utilized 534,346 valid notifications from 34 users. Based on the derived categories above, we segmented the data based on PANAS scores (one segment per PANAS label) and then we extracted our features based on the following process:
In each segment, the rate of occurrence (frequency) for each metric (category) was calculated as follows:
Let 𝑡1 be the time of PANAS test, 𝑡2 the time of the following PANAS test. Then the sum of Post Notification P during (ti, ti+1):
P(𝑡𝑖 , 𝑡𝑖+1) = ∑ 𝑃𝑖
𝑡
𝑖
Then we calculated the percentage Post Notifications P for one segment based on the following formula:
𝑃𝐴 = (∑ P(𝑡𝑖 , 𝑡𝑖+1) ∗ 100)
𝑡
𝑖
/(∑ N(𝑡𝑖 , 𝑡𝑖+1)
𝑡
𝑖
)
where N(𝑡𝑖 , 𝑡𝑖+1) is the total number of notifications in
the segment. Similarly, R(ti,ti+1), O(ti,ti+1), F(ti,ti+1), U(ti,ti+1), and
K(ti,ti+1), M(ti,ti+1) and G(ti,ti+1), are the sums for Removed, Screen-On, Screen-off, Unlock, Keyboard-Out, Multiple and Group states over (ti,ti+1) period, respectively. The corresponding percentages are RA, OA, FA, UA, and KA and were calculated similarly.
In addition, the following percentages, Emoji count EA, Work Notification, Rate WA, Group Notification GA, Multi Notification MA and System Notification SA were calculated as follows:
𝐸𝐴 = (∑ R(𝑡𝑖 , 𝑡𝑖+1) ∗ 100)
𝑡
𝑖
/(∑ P(𝑡𝑖 , 𝑡𝑖+1) − ∑ M(𝑡𝑖 , 𝑡𝑖+1)
𝑡
𝑖
𝑡
𝑖
)
We excluded the Multi-Notifications from the Post notifications count since these notifications do not have Emojis in them.
𝑊𝐴 = (∑ R(𝑡𝑖 , 𝑡𝑖+1) ∗ 100)
𝑡
𝑖
/(∑ P(𝑡𝑖 , 𝑡𝑖+1) −
𝑡
𝑖
∑ S(𝑡𝑖 , 𝑡𝑖+1)
𝑡
𝑖
)
Similarly, we excluded the System notifications from the total post notification count in order to calculate the work percentage.
𝑆𝐴 = (∑ R(𝑡𝑖 , 𝑡𝑖+1) ∗ 100)
𝑡
𝑖
/ ∑ P(𝑡𝑖 , 𝑡𝑖+1)
𝑡
𝑖
𝑀𝐴 = (∑ M(𝑡𝑖 , 𝑡𝑖+1) ∗ 100)
𝑡
𝑖
/ ∑ P(𝑡𝑖 , 𝑡𝑖+1)
𝑡
𝑖
𝐺𝐴 = (∑ G(𝑡𝑖 , 𝑡𝑖+1) ∗ 100)
𝑡
𝑖
/ ∑ P(𝑡𝑖 , 𝑡𝑖+1)
𝑡
𝑖
The segmentation process resulted in 3328 segmented
instances (rows) of labelled data. Table 4 lists all the
categories along with their percentages based on the
overall data.
TABLE 4
MAIN EXTRACTED FEATURES, WITH THE OVERALL PERCENTAGE.
Sym-
bol
Extracted Features
Percentage of
overall data (%)
P Notification Post 31
R Notification Removed 5
O Screen On 15
F Screen Off 15
U Screen Unlock 10
K Keyboard-Out 20
S System Notification 6
M Multiple Notification 17
E Emoji Count 9
G Group Notifications 13
W Work Notifications 7
ti Time and Date of the event.
V The phone's ringer mode when
notification arrived (Volume)
4 CORRELATION ANALYSIS
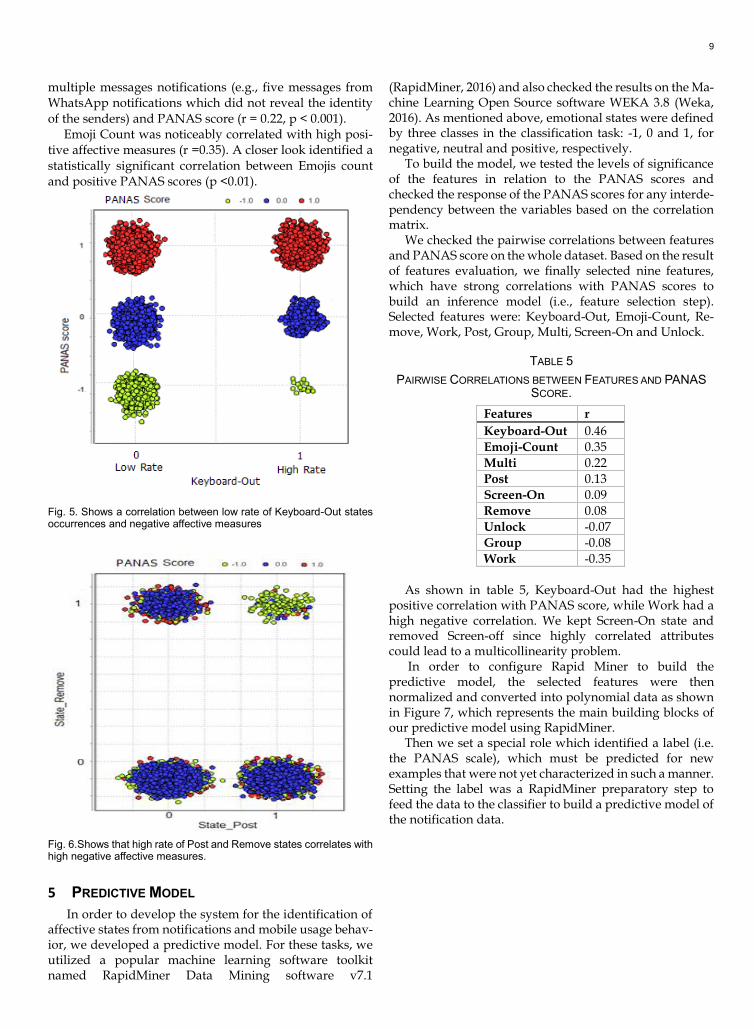
By examining the statistical significance of our variables (i.e., features), we determined the relation between our fea-tures and the affective measure as well as interdependency between these variables. The highest positive correlations were observed between Keyboard-Out and PANAS score (r = 0.46, p< 0.001). Figure 5 depicts the lack of negative affective states when high instances of keyboard states were present. This suggests that users experienced positive emotions when interacting with other users (while the user is typing a message).
Our data showed that only 10% of Keyboard-out data segments (when Keyboard-Out=1) are linked to negative PANAS.
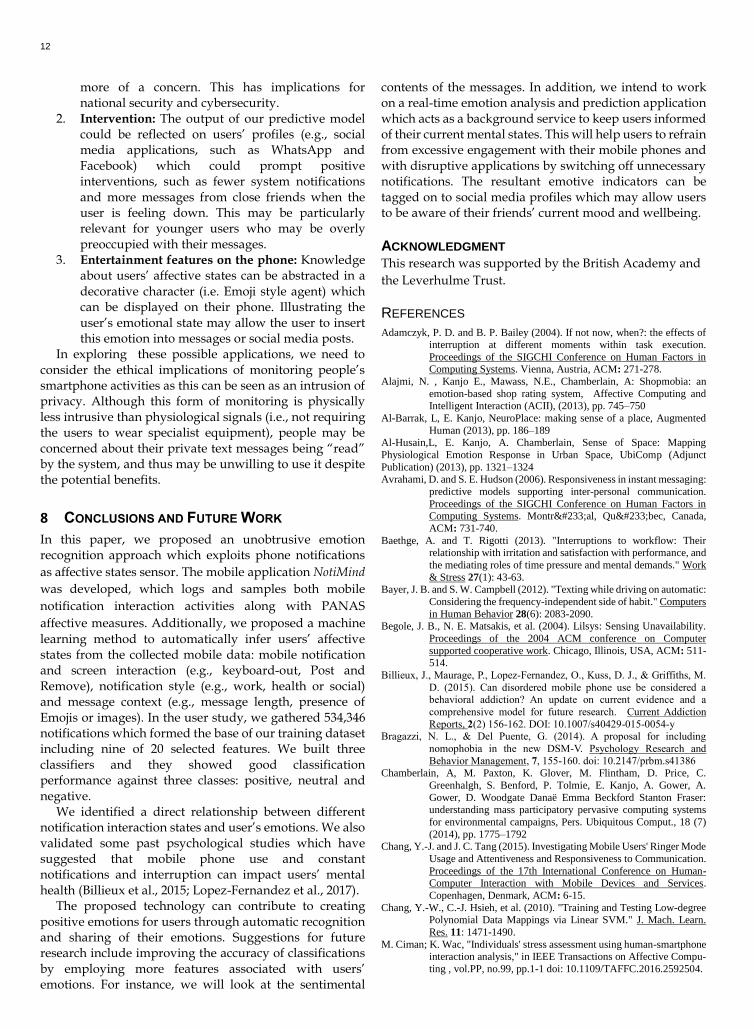
On the other hand, the data demonstrate more negative emotions are present when the users constantly receive and remove messages without direct engagement with other users as shown in Figure 6. Our data showed that 89% of the segments with high Post and Remove Notifica-tions rates are associated with negative PANAS scores.
A negative correlation was found between work mes-sages and PANAS scores (r = −0.38, p < 0.001). This indi-cates that people like to engage with social messages and family and friends, and become stressed when interacting with work-related messages.
There was a noticeable positive correlation between
9
multiple messages notifications (e.g., five messages from WhatsApp notifications which did not reveal the identity of the senders) and PANAS score (r = 0.22, p < 0.001).
Emoji Count was noticeably correlated with high posi-tive affective measures (r =0.35). A closer look identified a statistically significant correlation between Emojis count and positive PANAS scores (p <0.01).
Fig. 5. Shows a correlation between low rate of Keyboard-Out states occurrences and negative affective measures
Fig. 6.Shows that high rate of Post and Remove states correlates with high negative affective measures.
5 PREDICTIVE MODEL
In order to develop the system for the identification of affective states from notifications and mobile usage behav-ior, we developed a predictive model. For these tasks, we utilized a popular machine learning software toolkit named RapidMiner Data Mining software v7.1
(RapidMiner, 2016) and also checked the results on the Ma-chine Learning Open Source software WEKA 3.8 (Weka, 2016). As mentioned above, emotional states were defined by three classes in the classification task: -1, 0 and 1, for negative, neutral and positive, respectively.
To build the model, we tested the levels of significance of the features in relation to the PANAS scores and checked the response of the PANAS scores for any interde-pendency between the variables based on the correlation matrix.
We checked the pairwise correlations between features and PANAS score on the whole dataset. Based on the result of features evaluation, we finally selected nine features, which have strong correlations with PANAS scores to build an inference model (i.e., feature selection step). Selected features were: Keyboard-Out, Emoji-Count, Re-move, Work, Post, Group, Multi, Screen-On and Unlock.
TABLE 5
PAIRWISE CORRELATIONS BETWEEN FEATURES AND PANAS
SCORE.
Features r
Keyboard-Out 0.46
Emoji-Count 0.35
Multi 0.22
Post 0.13
Screen-On 0.09
Remove 0.08
Unlock -0.07
Group -0.08
Work -0.35
As shown in table 5, Keyboard-Out had the highest
positive correlation with PANAS score, while Work had a high negative correlation. We kept Screen-On state and removed Screen-off since highly correlated attributes could lead to a multicollinearity problem.
In order to configure Rapid Miner to build the predictive model, the selected features were then normalized and converted into polynomial data as shown in Figure 7, which represents the main building blocks of our predictive model using RapidMiner.
Then we set a special role which identified a label (i.e. the PANAS scale), which must be predicted for new examples that were not yet characterized in such a manner. Setting the label was a RapidMiner preparatory step to feed the data to the classifier to build a predictive model of the notification data.

10
Fig. 8. Rapid Miner design of ANN predictive model
The performances of three supervised machine learning
algorithms were tested to classify user interaction segments into three PANAS classes. A feed-forward Neural Network (ANNs) with a hidden layer, and radial basis function-Support Vector Machine (rbf-SVM) (Chang, Hsieh et al. 2010), and a Logistic Regression (LR) analysis (Cox 1958) were performed. We chose these algorithms in order to evaluate how discriminative (SVM), probabilistic (LR) and neural network (ANN) (McCulloch & Pitts 1943) algorithms work on our dataset.
A neural network system (ANN) for recognition is defined by a set of input neurons (nodes) which can be activated by the information of the intended object to be classified. The input can be either raw data, or pre-processed data from the samples. In our case, we have pre-processed our data by building a feature vector. The feed-forward neural network was trained by a back propagation algorithm (single layer). An artificial neural network (ANN) is a mathematical model or computational model that is inspired by the structure and functional aspects of biological neural networks.
Our ANN was set with one hidden layer, 500 learning cycles and a 0.3 learning rate and a momentum of 0.2. The momentum simply added a fraction of the previous weight update to the current one. This prevented local maxima and smoothed optimization directions. It indicated
whether the learning rate should be decreased during
learning. The averaged performance of each classifier was as-
sessed via a multiple-run k-fold (nested) stratified cross-validation. In our study, we adopted fifteen and ten folds. The inner loop of the cross-validation aimed to perform
model selection. To quantify the performance of the classi-
fication models, we used the F-Measure, the harmonic
mean of precision and recall, as our primary evaluation
metric. F-Measure is calculated as follows:
𝐹 − 𝑀𝑒𝑎𝑠𝑢𝑟𝑒 = 2.𝑃𝑟𝑒𝑐𝑖𝑠𝑖𝑜𝑛. 𝑅𝑒𝑐𝑎𝑙𝑙
𝑃𝑟𝑒𝑐𝑖𝑠𝑖𝑜𝑛 + 𝑅𝑒𝑐𝑎𝑙𝑙
Figure 7 shows the performance of the three classifiers
across the two cross-validation methods.
Fig.8.F-Measure of different Classification Models: ANN, SVM and LR.
TABLE 6
F-MEASURE OF THE MODELS
ANN SVM LR
Average 0.784 0.762 0.741
STD ±0:09 ±0:15 ±0:16
Global 0.753 0.752 0.721
We employed 15-Fold Cross-Validations to evaluate
the within-subject models, and Leave-One-Out for the
global one. F-measures were calculated to evaluate the
goodness of the classification model among the three
classification methods (ANN, SVM and LR). When a
comparative study comprises n classifiers, 𝑐 =𝑛(𝑛−1)
2
pairwise comparisons are possible.
As shown in Figure 8 and Table 6, we observed that
ANN worked significantly better than SVM (p-
value=0:007) using the within-the-subject model, and SVM
was significantly better than LR (p-value=0:009). ANN was
significantly better than LR (p-value=0:002).
By applying Bonferroni Adjustment, we obtained the
critical value as follows: α =0.0.5/3=0.016. The statistical
power was then calculated based on α. This means the null
hypothesis of equal performance was rejected for all the
comparative tests (p-value<0.016).
Similarly, we obtained similar results when applying com-
parative pairwise tests on the Global models (p-values
were 0.04, 0.012 and 0.003, respectively), and the null hy-
pothesis of equal performance was also rejected (p-
value<0.016).
The data from our first field study with participants
showed that it is possible to create a machine-learning
model to automatically predict when people are experienc-
ing positive, neutral or negative affective states from
smartphone notification activities with F-measures

11
between 74-78% for the within-subject model, and between
72-76% for the global model.
In the next section, we will demonstrate how we can im-
prove the accuracy level of the model performance by con-
ducting another experiment when the user is in a less dis-
ruptive environment.
6 DISCUSSION
The main focus of this work was to explore whether
notification and screen interaction information extracted
from smartphones can be a good predictor of users’
affective states. We took a systematic approach to model
the dependency of mobile notifications and screen
interaction patterns and users’ emotions. We
demonstrated that our model can predict users’ affect state
with good performance, as shown in the previous section.
Furthermore, our initial hypothesis was that all
interactions with mobile phone notifications have a
negative impact on affective states of users. Our findings
indicate that users feel positive when engaged directly
with other humans using social media applications.
One possible interpretation of this finding is that people
are more willing to share their positive emotional states,
while those experiencing negative emotions are reluctant
to broadcast how they feel or share information in general.
We discussed these results with some of the participants
after sharing our findings, and our data interpretation was
confirmed.
On the other hand, notifications of non-social messages
(e.g., WIFI availability and system updates) have the most
negative impact on users. Users usually get frustrated
when they receive a notification which is not sent by a human.
Positive affective states further correlated with multi-messages notifications (e.g., 5 messages from WhatsApp) which did not show the identity of the senders directly, but created a sense of belonging and feeling more connected. As expected, work-related notifications had a negative impact on affective states, especially when they arrived in bulks.
The presence of Emojis in notification messages influenced the sentimental value of the message and hence correlated with positive affective states of users who were receiving them. This is not surprising since we have found recently a significant relationship between the number of Emojis and the overall positive affective measure in a relevant project (Tauch & Kanjo, 2016). Emoji characters may seem trivial, but they are becoming the world’s fastest growing language in all forms of communications, text messages, posts on social media, chatting applications and emails (Kralj Novak, Smailović et al. 2015). This may be
due to a richer set of graphical representations of facial
expressions in comparison to text only, which may lead to
improved reader comprehension of the emotional message
content, and a visual representation of animals, food,
activities, etc.
6.1 Limitations
Our evaluation results presented in Section 5 illustrate the promising nature of affective states sensing based on interaction with messages and notifications, despite noisy labels and variation in user input. Our future work is required to more thoroughly evaluate our models on larger datasets.
We outline the limitations of our work subsequently so
future work can address these.
Incentivized Public Deployment: Currently our
NotiMind application and our call for participation have
managed to attract a reasonably high level of user
participation (mainly from within university contexts).
Although we originally recruited 50 users, only 34 users’
data have provided PANAS labels. Future work will look
at improving user participation and enhancing various
user interface features and performance to enable a robust,
continuous and flawless collection phase.
Robustness of Self-reports: A remaining challenge in
training data from sensing systems is the collection of
accurate subjective labels from users. Similarly, annotating
affective responses can be imprecise, since users may
deviate in expressing their own emotions, or mapping
them differently on a scale.
Additional Affective states cues: With the
advancement of the off-the-shelf wearable devices that can
monitor health and physiological change, we can easily
combine our approach with recent work of others
exploring alternative data sources for mental health
inference, such as sensor data. This could account for other
co-founder variables that may influence mood and
affective states.
Finally, we will look at new techniques to extract
features that are not limited to a specific window size.
Instead, we will explore the potential of adaptive data
segmentation and recurrent networks which is one of the
staples of deep learning that allow to contextualize and
learn the temporal dynamics of sequential data across long
periods of time.
7 POTENTIAL APPLICATIONS
In summary, the present research paves the foundation for future studies looking into predicting emotions based on smartphone user responses to notifications and activities. In the long term, research in this direction will have a significant impact, as outlined in the following:
1. Impact on society: Emotion detection could help improve behavior prediction. For example, people who discuss dangerous and violent acts, but seem to be happy and emotionally stable, might be less of a threat to society or themselves than people who do not discuss these subjects in their messages, but their overall negative emotions might make them
12
more of a concern. This has implications for national security and cybersecurity.
2. Intervention: The output of our predictive model could be reflected on users’ profiles (e.g., social media applications, such as WhatsApp and Facebook) which could prompt positive interventions, such as fewer system notifications and more messages from close friends when the user is feeling down. This may be particularly relevant for younger users who may be overly preoccupied with their messages.
3. Entertainment features on the phone: Knowledge about users’ affective states can be abstracted in a decorative character (i.e. Emoji style agent) which can be displayed on their phone. Illustrating the user’s emotional state may allow the user to insert this emotion into messages or social media posts.
In exploring these possible applications, we need to consider the ethical implications of monitoring people’s smartphone activities as this can be seen as an intrusion of privacy. Although this form of monitoring is physically less intrusive than physiological signals (i.e., not requiring the users to wear specialist equipment), people may be concerned about their private text messages being “read” by the system, and thus may be unwilling to use it despite the potential benefits.
8 CONCLUSIONS AND FUTURE WORK
In this paper, we proposed an unobtrusive emotion recognition approach which exploits phone notifications
as affective states sensor. The mobile application NotiMind
was developed, which logs and samples both mobile
notification interaction activities along with PANAS
affective measures. Additionally, we proposed a machine
learning method to automatically infer users’ affective states from the collected mobile data: mobile notification and screen interaction (e.g., keyboard-out, Post and Remove), notification style (e.g., work, health or social) and message context (e.g., message length, presence of Emojis or images). In the user study, we gathered 534,346 notifications which formed the base of our training dataset including nine of 20 selected features. We built three classifiers and they showed good classification performance against three classes: positive, neutral and negative.
We identified a direct relationship between different notification interaction states and user’s emotions. We also validated some past psychological studies which have suggested that mobile phone use and constant notifications and interruption can impact users’ mental health (Billieux et al., 2015; Lopez-Fernandez et al., 2017).
The proposed technology can contribute to creating positive emotions for users through automatic recognition and sharing of their emotions. Suggestions for future research include improving the accuracy of classifications by employing more features associated with users’ emotions. For instance, we will look at the sentimental
contents of the messages. In addition, we intend to work on a real-time emotion analysis and prediction application which acts as a background service to keep users informed of their current mental states. This will help users to refrain from excessive engagement with their mobile phones and with disruptive applications by switching off unnecessary notifications. The resultant emotive indicators can be tagged on to social media profiles which may allow users to be aware of their friends’ current mood and wellbeing.
ACKNOWLEDGMENT
This research was supported by the British Academy and
the Leverhulme Trust.
REFERENCES
Adamczyk, P. D. and B. P. Bailey (2004). If not now, when?: the effects of interruption at different moments within task execution.
Proceedings of the SIGCHI Conference on Human Factors in Computing Systems. Vienna, Austria, ACM: 271-278.
Alajmi, N. , Kanjo E., Mawass, N.E., Chamberlain, A: Shopmobia: an
emotion-based shop rating system, Affective Computing and Intelligent Interaction (ACII), (2013), pp. 745–750
Al-Barrak, L, E. Kanjo, NeuroPlace: making sense of a place, Augmented
Human (2013), pp. 186–189 Al-Husain,L, E. Kanjo, A. Chamberlain, Sense of Space: Mapping
Physiological Emotion Response in Urban Space, UbiComp (Adjunct
Publication) (2013), pp. 1321–1324
Avrahami, D. and S. E. Hudson (2006). Responsiveness in instant messaging:
predictive models supporting inter-personal communication.
Proceedings of the SIGCHI Conference on Human Factors in Computing Systems. Montréal, Québec, Canada,
ACM: 731-740.
Baethge, A. and T. Rigotti (2013). "Interruptions to workflow: Their relationship with irritation and satisfaction with performance, and
the mediating roles of time pressure and mental demands." Work
& Stress 27(1): 43-63. Bayer, J. B. and S. W. Campbell (2012). "Texting while driving on automatic:
Considering the frequency-independent side of habit." Computers
in Human Behavior 28(6): 2083-2090. Begole, J. B., N. E. Matsakis, et al. (2004). Lilsys: Sensing Unavailability.
Proceedings of the 2004 ACM conference on Computer
supported cooperative work. Chicago, Illinois, USA, ACM: 511-514.
Billieux, J., Maurage, P., Lopez-Fernandez, O., Kuss, D. J., & Griffiths, M.
D. (2015). Can disordered mobile phone use be considered a behavioral addiction? An update on current evidence and a
comprehensive model for future research. Current Addiction
Reports, 2(2) 156-162. DOI: 10.1007/s40429-015-0054-y Bragazzi, N. L., & Del Puente, G. (2014). A proposal for including
nomophobia in the new DSM-V. Psychology Research and
Behavior Management, 7, 155-160. doi: 10.2147/prbm.s41386 Chamberlain, A, M. Paxton, K. Glover, M. Flintham, D. Price, C.
Greenhalgh, S. Benford, P. Tolmie, E. Kanjo, A. Gower, A.
Gower, D. Woodgate Danaë Emma Beckford Stanton Fraser: understanding mass participatory pervasive computing systems
for environmental campaigns, Pers. Ubiquitous Comput., 18 (7)
(2014), pp. 1775–1792 Chang, Y.-J. and J. C. Tang (2015). Investigating Mobile Users' Ringer Mode
Usage and Attentiveness and Responsiveness to Communication.
Proceedings of the 17th International Conference on Human-Computer Interaction with Mobile Devices and Services.
Copenhagen, Denmark, ACM: 6-15.
Chang, Y.-W., C.-J. Hsieh, et al. (2010). "Training and Testing Low-degree Polynomial Data Mappings via Linear SVM." J. Mach. Learn.
Res. 11: 1471-1490.
M. Ciman; K. Wac, "Individuals' stress assessment using human-smartphone interaction analysis," in IEEE Transactions on Affective Compu-
ting , vol.PP, no.99, pp.1-1 doi: 10.1109/TAFFC.2016.2592504.

13
Cox, D. R. (1958). "The Regression Analysis of Binary Sequences." Journal
of the Royal Statistical Society. Series B (Methodological) 20(2): 215-242.
Czerwinski, M., E. Horvitz, et al. (2004). A diary study of task switching and
interruptions. Proceedings of the SIGCHI Conference on Human Factors in Computing Systems. Vienna, Austria, ACM: 175-182.
Fogarty, J., S. E. Hudson, et al. (2005). "Pred (Watson, Clark, & Tellegen,
1988)icting human interruptibility with sensors." ACM Trans. Comput.-Hum. Interact. 12(1): 119-146.
Horvitz, E. C. M. C. E. (2001). Notification, Disruption, and Memory:
Effects of Messaging Interruptions on Memory and Performance, IOS Press.
Hudson, S., J. Fogarty, et al. (2003). Predicting human interruptibility with sensors: a Wizard of Oz feasibility study. Proceedings of the
SIGCHI Conference on Human Factors in Computing Systems.
Ft. Lauderdale, Florida, USA, ACM: 257-264. Ichikawa, F., J. Chipchase, et al. (2005). Where's The Phone? A Study of
Mobile Phone Location in Public Spaces. 2005 2nd Asia Pacific
Conference on Mobile Technology, Applications and Systems. Iqbal, S. T. and E. Horvitz (2010). Notifications and awareness: a field study
of alert usage and preferences. Proceedings of the 2010 ACM
conference on Computer supported cooperative work. Savannah, Georgia, USA, ACM: 27-30.
Kanjo, E., L. Al-Husain, et al. (2015). "Emotions in context: examining
pervasive affective sensing systems, applications, and analyses." Personal and Ubiquitous Computing 19(7): 1197-1212.
Kanjo, E, Eman M.G. Younis, Nasser Sherkat, Towards unravelling the
relationship between on-body, environmental and emotion data using sensor information fusion approach, Information Fusion,
Volume 40, March 2018, Pages 18-31, ISSN 1566-2535,
https://doi.org/10.1016/j.inffus.2017.05.005. Koydemir, S., Faruk, Ö., Schütz, Ş. A., & Tipandjan, A. (2013). Differences
in How Trait Emotional Intelligence Predicts Life Satisfaction:
The Role of Affect Balance Versus Social Support in India and Germany. Journal of Happiness Studies. doi:10.1007/s10902-
011-9315-1.
Kralj Novak, P., J. Smailović, et al. (2015). "Sentiment of Emojis." PLoS ONE 10(12): e0144296.
Kushlev, K. and E. W. Dunn (2015). "Checking email less frequently reduces
stress." Computers in Human Behavior 43: 220-228. Kushlev, K., J. Proulx, et al. (2016). "Silence Your Phones": Smartphone
Notifications Increase Inattention and Hyperactivity Symptoms.
Proceedings of the 2016 CHI Conference on Human Factors in Computing Systems. Santa Clara, California, USA, ACM: 1011-
1020.
Larsen, J. T., A. P. McGraw, et al. (2001). "Can people feel happy and sad at the same time?" Journal of personality and social psychology
81(4): 684-696.
Lopez-Fernandez, O., Kuss, D. J., Romo, L., Morvan, Y., Kern, L., Graziani, P., Rousseau, A., Rumpf, H.J., Bischof, A., Gässler, A. K.,
Schimmenti, A., Passanisi, A., Männikkӧ, N., Kääriänen, M.,
Demetrovics, Z., Király, O., Chóliz, M., Zacarés, J. J., Serra, E., Griffiths, M. D., Pontes, H. M., Lelonek-Kuleta, B., Chwaszcz, J.,
Zullino, D., Rochat, L., Achab, S., & Billieux, J. (2016). Self-
reported dependence on mobile phones in young adults: A European cross-cultural empirical survey. Journal of Behavioral
Addictions, in press.
Mark, G., S. Voida, et al. (2012). "A pace not dictated by electrons": an empirical study of work without email. Proceedings of the
SIGCHI Conference on Human Factors in Computing Systems.
Austin, Texas, USA, ACM: 555-564. McCulloch, W. S. and W. Pitts (1943). "A logical calculus of the ideas
immanent in nervous activity." The bulletin of mathematical
biophysics 5(4): 115-133.
Mawass, N.E., E. Kanjo, A Supermarket Stress Map, UbiComp (Adjunct
Publication) (2013), pp. 1043–1046 Oulasvirta, A., T. Rattenbury, et al. (2012). "Habits make smartphone use
more pervasive." Personal and Ubiquitous Computing 16(1): 105-
114. Pielot, M., K. Church, et al. (2014). An in-situ study of mobile phone
notifications. Proceedings of the 16th international conference on
Human-computer interaction with mobile devices & services. Toronto, ON, Canada, ACM: 233-242.
Pielot, M., T. Dingler, et al. (2015). When attention is not scarce - detecting
boredom from mobile phone usage. Proceedings of the 2015
ACM International Joint Conference on Pervasive and Ubiquitous
Computing. Osaka, Japan, ACM: 825-836. Pielot, M., R. d. Oliveira, et al. (2014). Didn't you see my message?:
predicting attentiveness to mobile instant messages. Proceedings
of the 32nd annual ACM conference on Human factors in computing systems. Toronto, Ontario, Canada, ACM: 3319-3328.
Pielot, M. and L. Rello (2015). The Do Not Disturb Challenge: A Day
Without Notifications. Proceedings of the 33rd Annual ACM Conference Extended Abstracts on Human Factors in Computing
Systems. Seoul, Republic of Korea, ACM: 1761-1766.
Przybylski, A. K., Murayama, K., DeHaan, C. R., & Gladwell, V. (2013). Motivational, emotional, and behavioral correlates of fear of
missing out. Computers in Human Behavior, 29(4), 1841-1848. doi: http://dx.doi.org/10.1016/j.chb.2013.02.014.
RapidMiner. (2016, 08 19). https://rapidminer.com. Retrieved from
https://rapidminer.com. Rosenthal, S., A. K. Dey, et al. (2011). Using Decision-Theoretic Experience
Sampling to Build Personalized Mobile Phone Interruption
Models. Pervasive Computing: 9th International Conference, Pervasive 2011, San Francisco, USA, June 12-15, 2011.
Proceedings. K. Lyons, J. Hightower and E. M. Huang. Berlin,
Heidelberg, Springer Berlin Heidelberg: 170-187. Shirazi, A. S., N. Henze, et al. (2014). Large-scale assessment of mobile
notifications. Proceedings of the 32nd annual ACM conference on
Human factors in computing systems. Toronto, Ontario, Canada, ACM: 3055-3064.
Tauch, C., & Kanjo, E. ( September 12-16, 2016). The roles of Emojis in
Mobile Phone Notifications. Ubicomp/ISWC'16 Adjunct, Heidelberg, Germany, ACM.
Thomée, S., Härenstam, A., & Hagberg, M. (2011). Mobile phone use and
stress, sleep disturbances, and symptoms of depression among young adults - A prospective cohort study. BMC Public Health,
11(1), 1-11. doi: 10.1186/1471-2458-11-66
Thompson, E. R. (2007). "Development and Validation of an Internationally Reliable Short-Form of the Positive and Negative Affect
Schedule (PANAS)." Journal of Cross-Cultural Psychology
38(2): 227-242. Usama M. Fayyad, K. B. (1993). Multi-interval discretization of
continuousvalued attributes for classification learning. :
Thirteenth International Joint Conference on Articial Intelligence. Watson, D., Clark, L. A., & Tellegen, A. (1988). Development and validation
of brief measures of positive and negative affect: The PANAS
scales (Vol. 54(6)). Journal of Personality and Social Psychology. doi:0022-3514.54.6.1063.
Weka. (2016, 08 19). Weka 3: Data Mining Software in Java. Retrieved 2016,
from Weka: http://www.cs.waikato.ac.nz/ Westermann, T., S. M, et al. (2015). Assessing the Relationship between
Technical Affinity, Stress and Notifications on Smartphones.
Proceedings of the 17th International Conference on Human-Computer Interaction with Mobile Devices and Services Adjunct.
Copenhagen, Denmark, ACM: 652-659.
Wiese, J., T. S. Saponas, et al. (2013). Phoneprioception: enabling mobile phones to infer where they are kept. Proceedings of the SIGCHI
Conference on Human Factors in Computing Systems. Paris,
France, ACM: 2157-2166. Yoon, S., S.-s. Lee, et al. (2014). Understanding notification stress of
smartphone messenger app. Proceedings of the extended abstracts
of the 32nd annual ACM conference on Human factors in computing systems. Toronto, Ontario, Canada, ACM: 1735-1740.
Young Minds. (2016). Worried about your child? Internet and mobile phone
use. Retrieved 16.08.2016, from http://www.youngminds.org.uk/for_parents/worried_about_your
_child/internet_mobile