Utilization of Closed Loop Geothermal Heat Pumps at Verizon ...
63
Utilization of Closed Loop Geothermal Heat Pumps at Verizon Wireless Cellular Towers Brandon LaBrozzi Ed Dodge Jefferson Tester July 9, 2010 In Conjunction With: School of Chemical and Biomolecular Engineering And Cornell Energy Institute CEI‐2010‐1 Final Project Report for
-
Upload
khangminh22 -
Category
Documents
-
view
0 -
download
0
Transcript of Utilization of Closed Loop Geothermal Heat Pumps at Verizon ...

UtilizationofClosedLoopGeothermalHeatPumpsatVerizonWirelessCellularTowers
BrandonLaBrozzi
EdDodgeJeffersonTester
July9,2010
InConjunctionWith:
SchoolofChemicalandBiomolecularEngineering
And
CornellEnergyInstituteCEI‐2010‐1
FinalProjectReportfor

2
TableofContents
PART 1: Geothermal Heat Pumps
1.1 BackgroundandMotivation________________________________________5
1.1.1 TypicalOperatingConditions__________________________________5
1.1.2 GeothermalHeatPumpAdvantage_____________________________5
1.2 ProjectObjectiveandScope________________________________________7
1.3 Approach______________________________________________________8
1.4 Boreholes_____________________________________________________12
1.5 Simulations____________________________________________________16
1.5.1 BaseCaseDesign__________________________________________17
1.5.2 DoubleUTube____________________________________________17
1.5.3 Grout___________________________________________________18
GroutSimulations________________________________________18
1.5.4 BoreholeDiameter________________________________________20
1.5.5 GroundLoopExchangerPipeDiameter_________________________21
1.6 ValidationofDesigns_____________________________________________21
1.7 CapitalCosts___________________________________________________22
1.7.1 CostAnalysisbyZone_______________________________________23
Zone1and2___________________________________________23
Zone3________________________________________________24
Zone4________________________________________________25
Zone5________________________________________________25
3
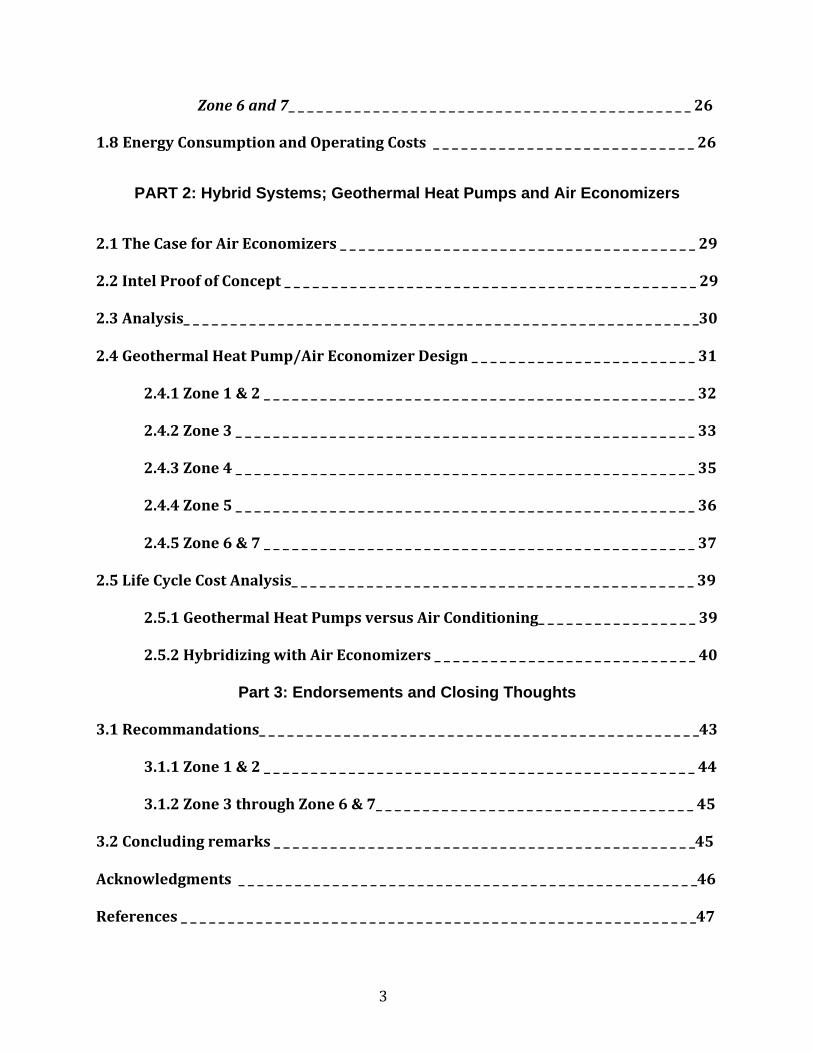
Zone6and7___________________________________________26
1.8 EnergyConsumptionandOperatingCosts____________________________26
PART 2: Hybrid Systems; Geothermal Heat Pumps and Air Economizers
2.1TheCaseforAirEconomizers______________________________________29
2.2IntelProofofConcept____________________________________________29
2.3Analysis_______________________________________________________30
2.4GeothermalHeatPump/AirEconomizerDesign________________________31
2.4.1Zone1&2______________________________________________32
2.4.2Zone3_________________________________________________33
2.4.3Zone4_________________________________________________35
2.4.4Zone5_________________________________________________36
2.4.5Zone6&7______________________________________________37
2.5LifeCycleCostAnalysis___________________________________________39
2.5.1GeothermalHeatPumpsversusAirConditioning_________________39
2.5.2HybridizingwithAirEconomizers____________________________40
Part 3: Endorsements and Closing Thoughts
3.1Recommandations_______________________________________________43
3.1.1Zone1&2______________________________________________44
3.1.2Zone3throughZone6&7__________________________________45
3.2Concludingremarks_____________________________________________45
Acknowledgments_________________________________________________46
References_______________________________________________________47

4
Appendixes
AppendixA:AverageMonthlyTemperaturebyClimateZone(°F)______________48
AppendixB:AverageMonthlyHighTemperaturebyClimateZone(°F)__________50
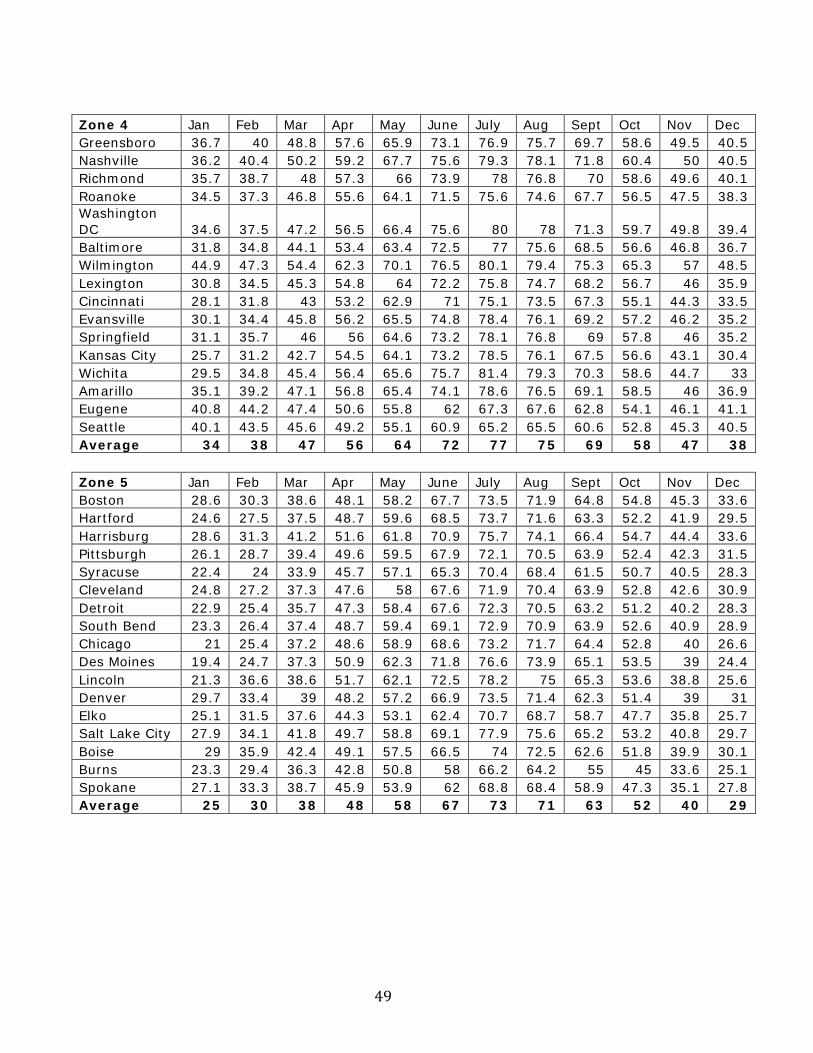
AppendixC:AverageMonthlyLowTemperaturebyClimateZone(°F)__________53
AppendixD:AdditionalGLHEPROSimulationsandSampleOutput_____________56
AppendixE:GLD2009SimulationsandSampleOutput______________________59
AppendixF:EnergyConsumptionBasedUponOperatingFactor_______________61
AppendixG:LifeCycleCosts:HybridA/Cvs.HybridGHP–VerticalWell,DoubleU,EnhancedGrout(k=1.4BTU/hr*ft*°F)________________________63
AppendixH:LifeCycleCosts:HybridA/Cvs.HybridGHP–VerticalWell,DoubleU,EnhancedGrout(k=1.4BTU/hr*ft*°F)–DiscountedGHP__________63

5
PART 1: Geothermal Heat Pumps
1.1BackgroundandMotivation
Thecurrentindustrystandardforcoolingcelltowerequipmentsheltersemploys
theuseofconventionalwallmountedairconditioningunitsinordertoremoveexcessheat
builduptopreventthemalfunctionofthekeyequipmentnecessarytotheoperationofthe
network.Systemsaretypicallyoversizedinordertomeetanyunforeseenheat
abnormalitiesandareinstalledasann+1systemforredundancyintheeventthatthereis
anHVACequipmentfailure.Whilethesesystemsarereadilyavailable,provenreliableand
inexpensivetoinstall,theyareexpensivetooperateoverthelifetimeoftheshelterinterms
ofbothpowerconsumptionandmaintenance.Withtensofthousandsoftheseunits
installedacrossthecountry,thescaleofthisproblemisexceedinglylarge.
1.1.1 TypicalOperatingConditions
Airconditioningequipmentinstalledinthecelltowershelterstypicallyoperateataset
pointof72°Fandareneededthroughouttheyear.Onlyduringwintermonthsinthe
coldestregionsofthecountryisheatingrequiredwithintheshelter.Typicallytheseair
conditioningunitshavearatedcoolingcapacityofapproximately50,000BTU/hr(14.6
kWt)andhaveanEER1(EnergyEfficiencyRatio)of9.However,thetypicalloadwithina
shelterisontheorderof28,000BTU/hr(8.1kWt).Aprototypicalshelterlocatedin
Boston,Massachusettsrequires11,500kWhperyearofelectricityforspacecooling,and
costing$1150peryearprovidedarateof$0.10perkWh.Theshelterisnormally
constructedfromcastconcreteandhasaninsulationratingofR–13.Infiltrationfrom
ambientairconditionsonlycontributesa5%increasetothecoolingloadintheworst‐case
(hightemperature)scenario.
1.1.2GeothermalHeatPumpAdvantage
Closedloop,watertoairgeothermalorgroundsourceheatpumpspresenta
greener,moreefficientalternativetoconventionalairconditioning.Geothermalheat
pumpstakeadvantageofheatstorageundergroundatnearlyuniformground
1.TheEERisdefinedasthetotalthermalcoolingprovidedbytheunit(BTU/hr),dividedbythepowerrequiredtooperatetheunit(Watts)

6
temperatures,whichgivesrisetoaninherentlyhighercoefficientofperformance(COP)
overconventionalair‐to‐airsystems.ThehigherCOPofheatpumpsisprovidedby
watersidecondensing(asopposedtoairside)whichallowsGHP’stoprovideanequal
amountofcoolingwhileconsuming,onaverage,onethirdlesselectricity.Despitethefact
thatgeothermalheatpumpsaremorecostlyupfront,mostlyduetoinstallingtheground
loopheatexchanger,operatingcostsaresubstantiallylowerandpossesstheabilitytopay
forthemselvesoverthelifetimeoftheunit.Geothermalheatpumpsrequireconsiderably
lessmaintenancethanconventionalairconditioningunitsandlastmuchlonger.Withthe
ever‐growingpushforgreenenergyalternativesandreducingconsumption,geothermal
heatpumpsareanexcellentalternativebyexploitingtheconstantlowtemperature
undergroundheatsourcethatisavailable.
Geothermalheatpumpsrequiretwoclosed,independentloopsinordertofunction
properly.Therefrigerantloop,whichishousedinsidetheunit,exchangesheatwiththeair
andgroundloopviaheatexchangersinthecondenserandevaporator.Thegroundloop
circulateswater(orotherfluid)throughthepipingwhereheatisexchangedfromthefluid
totheground(orviceversa).ThegroundloopwillbediscussedfurtherinSection1‐3
“Approach”.
TherefrigerantloopcirculatesR‐410Athroughitsfourbasiccomponents:a
compressor,acondenser,athrottlingvalveandanevaporator,whereheatistransferred
fromonelocationtoanother,inthiscase,fromthesheltertotheground.Itoperatesby
utilizingthevaporcompressioncycleoftherefrigerant,whichtakesadvantageofitslatent
heatofvaporization.Thelatentheatofvaporizationistheamountofheatthatasubstance
absorbswhileundergoingphasechangefromaliquidtoagasatconstantpressureand
temperature.Forexample,onegramofliquidwaterat100°Cvaporizedintothegasphase
atconstantpressure,undergoesnotemperaturechange,butabsorbs2,257Joulesofenergy
(SVNA133).Forcomparison,2,257Joulesiscapableofraisingthetemperature(at
constantpressure)ofthesamegramofliquidwaterinitiallyat25°C,to267°C.Thelatent
heatofvaporizationofR410Ais258kJ/kg(ElkRefrigerants).

7
Thecycleproceedsasfollows(seeFigure1‐1):liquidrefrigerantevaporatesata
constantpressure(1to2)thatprovidesapathwayforconstantheatabsorptionatalow,
constanttemperature.Theproducedvaporiscompressedtoahigherpressure(2to3)
whereitisthencooledandcondensed(3to4)whiletheheatisrejectedatahigher
temperature.Theliquidreturnstoitsoriginalstatebypassingthroughthethrottlingvalve
(4to1),whichlowersthepressure(SVNA318).
Figure11.VaporCompressionCyclefromSVNApg.319Figure9.2
NearlyeverycommerciallyavailableheatpumpmanufacturedutilizesR‐410Aasthe
refrigerantinitsvapor‐compressioncycle,therefore,thereisrelativelylittledifferencein
performanceamongstdifferentmanufacturerswhencomparingsimilarmodels.R‐410A
hasreplacedR‐22astherefrigerantofchoicebecauseitcontainsnochlorine,thushasno
effectontheozonelayerandexhibitsahigherpressureandrefrigerationcapacitythanR‐
22,increasingtheperformanceoftheGHP(ElkRefrigerants).
1.2ProjectObjectiveandScope
Thisstudywillevaluatethefeasibilityofreplacingconventionalwallmountedair
conditioningunitswithclosedloop,geothermalheatpumps.Inordertobeconsidered
successful,severalconditionsmustbemet.Theseinclude:
1.TheGHPmustbeabletomeetacontinuous7‐10kWtcoolingload.
2.Theentireinstallationmustbecontainedwithinasmallfootprintatthetower
locations.
8
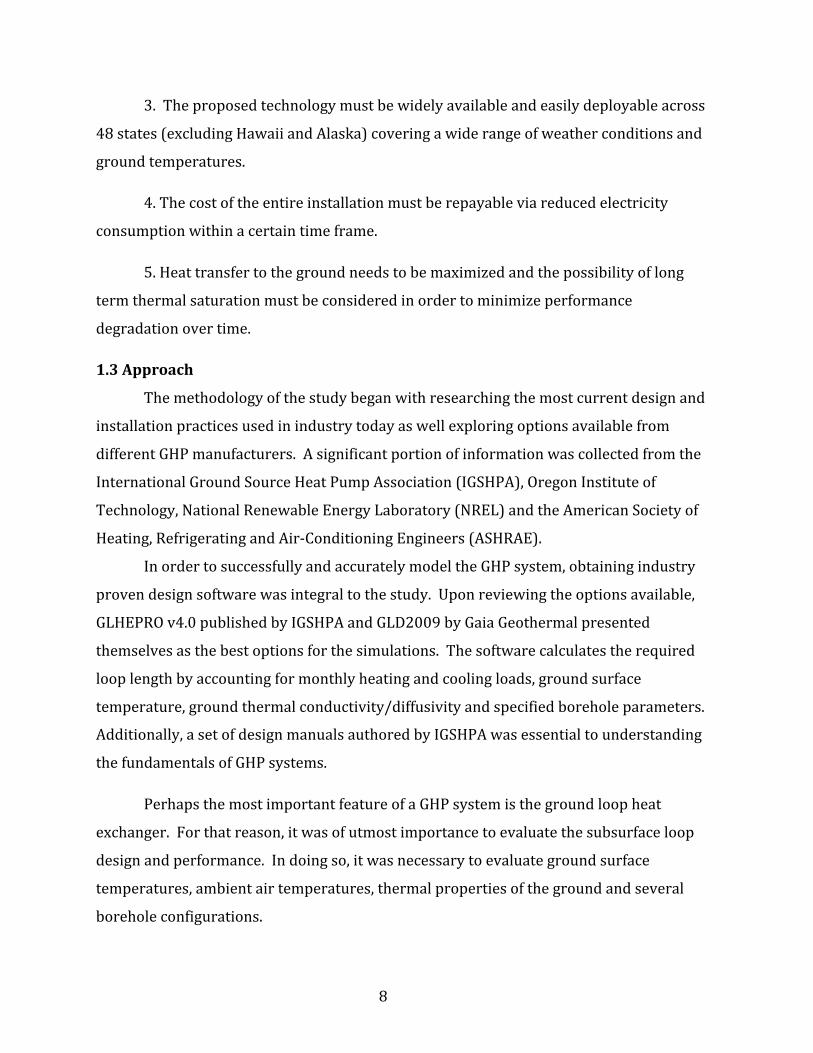
3.Theproposedtechnologymustbewidelyavailableandeasilydeployableacross
48states(excludingHawaiiandAlaska)coveringawiderangeofweatherconditionsand
groundtemperatures.
4.Thecostoftheentireinstallationmustberepayableviareducedelectricity
consumptionwithinacertaintimeframe.
5.Heattransfertothegroundneedstobemaximizedandthepossibilityoflong
termthermalsaturationmustbeconsideredinordertominimizeperformance
degradationovertime.
1.3Approach
Themethodologyofthestudybeganwithresearchingthemostcurrentdesignand
installationpracticesusedinindustrytodayaswellexploringoptionsavailablefrom
differentGHPmanufacturers.Asignificantportionofinformationwascollectedfromthe
InternationalGroundSourceHeatPumpAssociation(IGSHPA),OregonInstituteof
Technology,NationalRenewableEnergyLaboratory(NREL)andtheAmericanSocietyof
Heating,RefrigeratingandAir‐ConditioningEngineers(ASHRAE).
InordertosuccessfullyandaccuratelymodeltheGHPsystem,obtainingindustry
provendesignsoftwarewasintegraltothestudy.Uponreviewingtheoptionsavailable,
GLHEPROv4.0publishedbyIGSHPAandGLD2009byGaiaGeothermalpresented
themselvesasthebestoptionsforthesimulations.Thesoftwarecalculatestherequired
looplengthbyaccountingformonthlyheatingandcoolingloads,groundsurface
temperature,groundthermalconductivity/diffusivityandspecifiedboreholeparameters.
Additionally,asetofdesignmanualsauthoredbyIGSHPAwasessentialtounderstanding
thefundamentalsofGHPsystems.
PerhapsthemostimportantfeatureofaGHPsystemisthegroundloopheat
exchanger.Forthatreason,itwasofutmostimportancetoevaluatethesubsurfaceloop
designandperformance.Indoingso,itwasnecessarytoevaluategroundsurface
temperatures,ambientairtemperatures,thermalpropertiesofthegroundandseveral
boreholeconfigurations.

9
Combiningthebroadscopeofthisstudy(48states)andthevastvariabilityin
groundsurfacetemperaturesrangingfrom4°Cto26°C(39°Fto79°F),ambientair
temperaturesfrom‐45°Cto54°C(‐50°Fto130°F)andsoilproperties(geology,thermal
conductivity,permeability,etc)acrosstheselimits,itbecamenecessarytodefineseveral
setsofparameterstofocustheanalysis.
Whendeterminingthesizeofthegroundloopheatexchanger,oneofthemost
importantvariablesthatneedstobeconsideredisthegroundtemperaturenearthe
surface.EquallyimportantistheclimaticconditionswheretheGHPsystemistobe
installed.Bycomparingmapsofbothgroundsurfacetemperature(Figure1‐2)andclimate
(Figure1‐3),itwaspossibletodefine5basecaseregionstoconcentratethestudy.
Figure12.GroundSurfaceTemperaturesoftheUnitedStatesfromTheFutureofGeothermalEnergy,Tester,et.al.(2006)
10
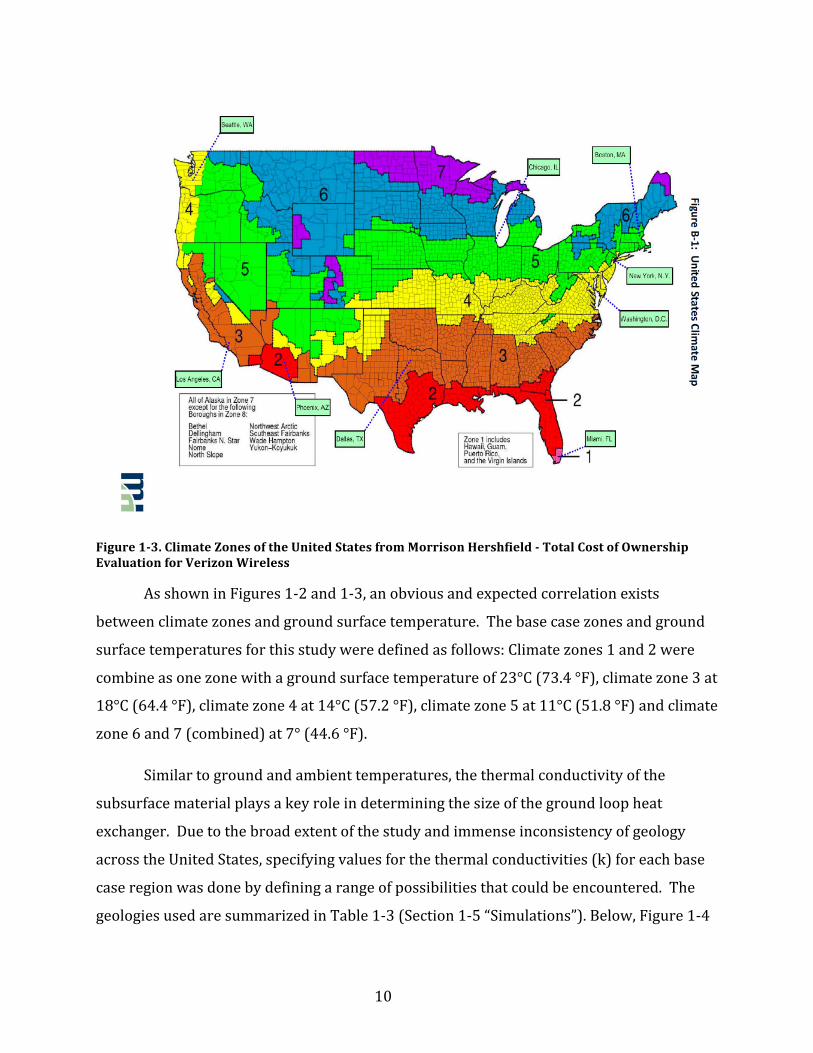
Figure13.ClimateZonesoftheUnitedStatesfromMorrisonHershfieldTotalCostofOwnershipEvaluationforVerizonWireless
AsshowninFigures1‐2and1‐3,anobviousandexpectedcorrelationexists
betweenclimatezonesandgroundsurfacetemperature.Thebasecasezonesandground
surfacetemperaturesforthisstudyweredefinedasfollows:Climatezones1and2were
combineasonezonewithagroundsurfacetemperatureof23°C(73.4°F),climatezone3at
18°C(64.4°F),climatezone4at14°C(57.2°F),climatezone5at11°C(51.8°F)andclimate
zone6and7(combined)at7°(44.6°F).
Similartogroundandambienttemperatures,thethermalconductivityofthe
subsurfacematerialplaysakeyroleindeterminingthesizeofthegroundloopheat
exchanger.Duetothebroadextentofthestudyandimmenseinconsistencyofgeology
acrosstheUnitedStates,specifyingvaluesforthethermalconductivities(k)foreachbase
caseregionwasdonebydefiningarangeofpossibilitiesthatcouldbeencountered.The
geologiesusedaresummarizedinTable1‐3(Section1‐5“Simulations”).Below,Figure1‐4

11
demonstratesthedegreetowhichthegeologyvariesacrossthecountry,whereeachcolor
representsadifferentgeologicalformation.
Figure14.GeologicMapoftheUnitedStatessourceBeikmanandKing,USGS1974
Groundloopheatexchangerscanextractordepositthermalenergyintheearthina
numberofways;horizontalloops,verticalloops,standingcolumnloopsandpondloops.
Giventhatprototypicalcelltowersareoftenleasedfromotherlandowners,groundloop
locationsrequireaminimalamountofspaceonthesurface,typicallyfiftyfeetsquareor
less.Themostviableoptionforinstallingthegroundloopheatexchangerinthis
applicationisusingaverticalloopduetotheselimitedspaceconstraints.Thepipe
carryingtheworkingfluidofthesystemcanbearrangedintheboreholeinanumberof
ways:singleUtube,doubleUtubeandcoaxial.Allthreeverticalflowarrangementswere
evaluated.

12
AtypicalGHPinstallationusestheearthasaheatsinkinthewarmermonthsandas
aheatsourceinthecoolermonths.However,duetothe“coolingonly”natureofthecell
towerequipmentshelters,theGHPisalwaysdepositingheatintothegroundloop.Inorder
toevaluatetheeffectofthistypeofoperation,itwouldbenecessarytoperformatransient
heattransferanalysisofthewellfieldtopredictthetemperatureofthegroundovertime.
Thisanalysiswasbeyondthescopeofthisproject,however,similarworkisbeing
conductedatCornellUniversitythatwouldbeapplicabletothisspecificsetof
circumstances.Thetransientheattransferanalysiswillpredictthetemperatureriseinthe
rockformationandtheextentinwhichthedepositedthermalenergydissipates.Ifthewell
fieldbecomesthermallysaturated,theperformanceoftheGHPdeclinesdramatically(i.e.
astherefrigerantcondensersidetemperaturesincrease,theCOPoftherefrigeration
systemdecreases).Thisisthesamephenomenonthatoccurswithair‐cooleddirect‐
expansionrefrigerantHVACsolutionsduringoperationinthesummermonthswhenthe
ambienttemperaturerises.
Whilethetechnologyproposedmayappearsuperiorintermsofengineering
principles,itmustalsobefinanciallysuperior.Calculatingcapitalandinstallationcosts,
operatingcostsandlifecyclecostshavebeenanalyzedinSection1‐7,1‐8and2‐5,
respectively.
1.4Boreholes
Thetwomostcommontypesofloopdesignsarehorizontalandverticalloops.
Horizontalloopsrunpipingparalleltothegroundinshallowtrenches6‐8feetdeepand
require2500sqft/ton.Verticalloopsrunpipingintothegroundseveralhundredfeet
deep,requiring250‐300sqft/ton(McQuayInternational6‐7).Thelimitedspace
constraintsthestudyisposedwith,dictatesthattheloopmustcontainasfewvertical
boreholesaspossible.

13
Figure15.DiagramofVerticalLoopSystemsource:McQuayInternational,2009.
ThepipeinstalledintotheboreholeistypicallyaSchedule40,SDR11orSDR9high‐
densitypolyethylene(HDPE)materialrangingindiametersfrom¾to1‐½inches.Pipe
diameteralsodictatestheapproximateminimumflowrateneededfortheworkingfluid.
Thepipingistypicallyinstalledinoneofthreearrangements,singleUtube,double
Utubeandcoaxialflow.SingleanddoubleUtubearrangementsaremostcommonlyused
forverticalGHPsystems,whereascoaxialflowismuchlesscommon.Coaxialflow
arrangementistypicallytoodifficulttoimplementinpracticeandfewinstallersutilizethis
method.RyganCorporationmanufacturesacoaxialflowpipingsystem,butfewinstallers
arefamiliarwiththisproductandwouldbedifficulttodeploynationally.
Table11.MinimumFlowRates
Source:McQuayInternational

14
Groutingtheboreholeaftertheinstallationofthepipesisimportantforboth
environmentalandperformancereasons.Groutingtheboreholefillsintheannularspace
betweenthepipeandtheboreholewall,whichpreventsorrestrictstheabilityofsurface
and/orgroundwatertoflowverticallyalongtheborehole.Thesealingofthegroundloop
heatexchangerboreholeisrequiredforthesamereasonsaswaterwells,whichisthe
sanitaryprotectionofanyexistingorpotentialwatersupplyaquiferthatispenetratedbya
borehole(Hiller1‐1).
Inordertomaximizetheheattransferredtothegroundfromthepipe,thegrout
musthaveahighthermalconductivitythatminimizestheresistanceofheatflowtothe
earth.Thegroutingmaterialalsoneedstopossessalowviscosityduringplacementasto
circumventcreatinganyvoidspacesintheborehole,whichreducesheattransfer.The
selectedgroutmustalsoremaininconstantcontactwithpipe,notonlyduringexpanding
andcontractingduringtemperaturechangesbutalsoduringthecuringprocess.Thegrout
mustalsoretainitspropertiesoverthelifetimeofthewellandnotdegradeinanyway
(Hiller1‐6).
Therearetwomaintypesofgroutsavailableforusetoday;bentonitebasedgrouts
andcement‐basedgrouts.
Bentoniteisavolcanicphyllosilicateofthemontmorillonitegroupthatisfoundin
thewesternandsouthernUnitedStates.BentoniteminedintheWestismorespecifically
calledsodiummontmorillonitebentonite,whichcanswelltofifteentimesitsdryvolume.
Southernbentonite,orcalciummontmorillonitebentonitedoesnotpossesstheabilityto
significantlyswellinthepresenceofwater.Theextensiveswellingofsodiumbentonite
andlowviscositymakesittheleadingchoiceofbentoniteinthedrillingindustry(Hiller1‐
9,10).
Cement‐basedgroutscanrefertoavarietyofbindingmaterialsincludingboth
Portlandandneatcements,glues,epoxies,mortarsandaggregates.Neatcementshavein
thepastbeenfavoredoverbentonite‐basedgroutswhereboreholespenetrate
consolidatedandfracturedrockformationswithhighratesofgroundwatermovement
throughunsaturatedzones(Hiller2‐7).Neatcementsformarigidsealthatistypically
impervioustogroundwatererosion,whereasbentonitegroutsmayerodeundersuch

15
conditions.Whenusedinconjunctionwithconsolidatedrockformations,cementisthought
toformabettersealwiththenaturalrockformation(Hiller2‐7).
However,cement‐basedgroutsdohavetheirdisadvantages.Thehydrationofneat
cementscausesthemasstoshrinkslightly,causingthematerialtopullawayfromthepipe,
thuscreatingavoidspaceandinhibitingheattransfer.Furthermore,asignificantamount
ofheatisreleasedduringthehydrationprocessthathasbeenshowntodamagePVCand
HDPEpipes.Thebiggestfactorforthedeclineinuseofcementbasedgroutsisthecost.
Bentonitebasedgroutsaregenerallylessexpensiveperunitvolumethancementbased
grouts(Hiller2‐8).Table1‐2listsasmallnumberofcommerciallyavailablegrout
products.
Table12.CommerciallyAvailableBentoniteGrout
Source:Hiller23(Note:PermeabilityinTable12referstohydraulicconductivity)

16
Thermalconductivitytestingisusedtodetermineamoreaccuratevaluefortheheat
transferrateassociatedwiththespecificgeologywheretheunitistobeinstalled.While
thisprocesscanbecompletedin24‐48hours,costsareoftenprohibitiveforinstallationsof
thissizeandasaconsequencethesetestsarenotnormallyused.
Theworkingfluidusedtotransportheatthroughthegroundloopiseitherpure
water,amixtureofwaterandmethanolorethanoloramixtureofwaterandpropyleneor
ethyleneglycol.Purewatershouldnotbeusedifthefluidtemperatureisexpectedtofall
below42°Ftoavoidfreezing.Glycolsolutionsworkwellinwarmerclimatesbutincrease
inviscosityasthetemperaturedecreasesthuscausingthecirculatingpumpefficiencyto
fall.Alcohol‐basedsolutionstendtoperformwellinalltemperatureconditions(McQuay
International12,19).
1.5Simulations
Astandardsetofbaseparameterswereneededtobedefinedinordertoevaluate
theeffectsofalteringthevariablesofthesimulation.Theprimarydesignprogramused
wasGLHEPROv4.0andGLD2009wasusedtovalidatetheresults.Whileeachprogram
requiredslightlydifferentinputsinordertoperformthecalculations,alleffortsweremade
toensurethatidenticalparameterswereusedbetweenprograms.
Duetothelargevariationofgeologyandthermalconductivity(k)acrosseach
definedclimatezone,threesetsofsoilconditionswereselectedtorepresenttherangeof
variablesthatcouldbeencountered.Specifyingexactsoilandrockcompositionsforeach
zonewasunrealisticinthiscase,thusgeneralizationsweremade.
Table13.GeologicalPropertiesUsed
Geology ConductivityBTU/hr*ft*°F
Densitylb/ft3
SpecificHeatBTU/lb*°F
VolumetricHeatBTU/°F*ft3
Light,DampSoil 0.50 100.0 0.25 24.98AverageRock 1.40 175.0 0.20 34.93DenseRock 2.00 200.0 0.20 39.93

17
1.5.1BaseCaseDesign
WithinGLHEPROv4.0,thebasecaseGHPusedwasaWaterFurnacePremier2series
unit,sizedat28,000BTU/hr.Thechosenworkingfluidwasa20%wtsolutionofmethanol
andwater,circulatingat10gpmthrough1½inch,Schedule40HDPEpipe(pipethermal
conductivity0.225BTU/hr*ft*°F)ina6inchborehole.Asingleboreholewasassumedtobe
sealedwithagroutthathadathermalconductivityof0.43BTU/hr*ft*°F.Thesimulation
wasperformedover120monthsandusedamaximumfluidtemperatureenteringtheheat
pumpof90°Fandaminimumtemperatureof20°F.Thesystemloadusedwasa
continuous,8.1kWt(~28,000BTU/hr)coolingload.
Thecalculationwasperformedtodeterminethedepthoftheborehole(infeet),for
thegivenparameters.Eachregionwasevaluatedatthespecifiedgroundtemperatureand
soilconditionsdefinedaboveforasingleUtubeinstallation.
Table14.BaseCaseBoreholeDepth
Zone
Depth in ft Light, Damp Soil
k = 0.50
Depth in ft Average Rock
k = 1.4
Depth in ft Dense Rock
k = 2.0
1 and 2 3450 1570 1230
3 2380 1080 850
4 1900 860 680
5 1660 750 590
6 and 7 1410 640 500 Note–khasunitsofBTU/hr*ft*°F
AsshowninTable1‐4,designingthesystemtoaworstpossibleU.S.caseregarding
groundtemperatureandgeologicalconditions,thedepthofboreholerequiredforthe
systemtoadequatelyoperateis3450feet,whichisbeyondtherealmofpracticality.Once
thesimulationwasrunusingrockastheheattransfermediumthedepthoftheboreholes
becomesmoresensible.
1.5.2DoubleUTube
IntuitionimpliesthatdoublingthelengthofHDPEpipewithintheboreholewould
decreasetheoveralldepthofborehole,butassumingalinearrelationshipbetweenthetwo
variableswouldprovemisguided.Allvariablesusedinthebasecasewereheldconstant
exceptfortheboreholeflowarrangement.

18
Table15.BaseCasewithDoubleUExchanger
Zone
Depth in ft Light, Damp Soil
k = 0.50
Depth in ft Average Rock
k = 1.4
Depth in ft Dense Rock
k = 2.0 1 and 2 3270 1400 1220
3 2260 960 740 4 1820 770 590 5 1570 670 510
6 and 7 1340 570 430 Note–khasunitsofBTU/hr*ft*°F
ChangingtheboreholeflowarrangementfromasingleUtoadoubleUexchanger
decreasesthedepthofboreholeinlight,dampsoilby~5%,averagerockby~10%and
denserockby~13%.
1.5.3Grout
Therearemanyoptionsavailableregardinggroutproducts,themostimportant
factortoconsiderwhencalculatingboreholedepthisthethermalconductivity.Many
manufacturersofferarangeofgroutswithdifferingconductivitiesthatcanbealteredby
varyingtheamountofwater,aggregateandotheradditivestothemixture.Tocompensate
fortherangeofoptionsavailable,threedifferentvaluesforthermalconductivitywereused
inthesimulation:standardgroutwithk=0.43BTU/hr*ft*°F(basecase),andtwo
thermallyenhancedgroutswithk=1.0BTU/hr*ft*°Fandk=1.4BTU/hr*ft*°F.
GroutSimulations
Thebasecaseparameterswereheldconstantexceptforthethermalconductivityof
thegrout.
Table16.BaseCase,Groutk=1.0BTU/hr*ft*°F
Zone
Depth in ft Light, Damp Soil
k = 0.50
Depth in ft Average Rock
k = 1.4
Depth in ft Dense Rock
k = 2.0 1 and 2 3370 1390 1080
3 2250 960 730 4 1830 780 590 5 1570 660 500
6 and 7 1340 570 430 Note–khasunitsofBTU/hr*ft*°F

19
Increasingthethermalconductivityofthegroutfrom0.43to1.0BTU/hr*ft*°F
decreasedthedepthofboreholeforlightdampsoilby~5%,averagerockby~11%and
denserockby~14%.
Table17.BaseCase,Groutk=1.4BTU/hr*ft*°F
Note–khasunitsofBTU/hr*ft*°F
Byusingathermallyenhancedgrout(Table1‐7)inplaceofastandardconductivity
groutthereductioninboreholedepthforlight,dampsoilwas~6%,averagerock~14%
anddenserock~18%.
Selectingthetypeofgroutforthegivenapplicationshouldbedoneonacase‐by‐
casebasis.Aspreviouslymentioned,neatcementbasedgroutscanperformbetterin
certainsituations(areasofhighgroundwaterflow)thanbentonite‐basedgrouts.
Furthermore,thethermalconductivityofthegroutshouldroughlymatchthatoftherock
formationandthepermeabilityofthegroutshouldbeatleastoneorderofmagnitude
lowerthanthatoftheformation(Hiller1‐15).Table1‐8listssomecommongeologiesand
theirrespectivepermeability.AsdemonstratedbytheresultsinTable1‐6and1‐7,utilizing
enhancedgroutsinformationswithlowthermalconductivitiesonlyprovidesa5%and6%
respectivedecreaseinboreholedepthascomparedwiththebasecasevalues.However,
usingenhancedgroutsinhigherconductivityformationscanyieldan18%decreasein
boreholedepthversusthebasecaseconditions,asshowninTable1‐7.
Zone
Depth in ft Light, Damp Soil
k = 0.50
Depth in ft Average Rock
k = 1.4
Depth in ft Dense Rock
k = 2.0 1 and 2 3170 1300 1060
3 2190 900 670
4 1750 710 530
5 1520 620 460
6 and 7 1300 530 390

20
Table18.PermeabilityofGeologicalFormationMaterials
GeologicalFormation HydraulicConductivitym/s
PermeabilityDarcy=m2
Gravel 10‐4to1 10‐11to10‐7
CleanSand 10‐6to10‐4 10‐13to10‐11
SiltySand 10‐7to10‐3 10‐14to10‐10
GlacialTill 10‐12to10‐9 10‐19to10‐16
UnweatheredMarineClay 10‐13to10‐10 10‐20to10‐17
Shale 10‐14to10‐10 10‐21to10‐17
IgneousRock(unfractured) 10‐10to10‐6 10‐17to10‐13
Sandstone 10‐9to10‐6 10‐16to10‐13
LimestoneorDolomite 10‐9to10‐6 10‐16to10‐13
KarstLimestone 10‐6to10‐2 10‐13to10‐9
Source:Hiller115
1.5.4BoreholeDiameter
Determiningthediameteroftheboreholeusedrequirestheconsiderationofseveral
factors.Perhapsthemostdominantdrivingforcewhendeterminingthediameteristhe
capabilitiesofthedrillingequipmentavailableinagivenarea.AccordingtoDanielFienof
eVanHeeEnergySolutionsinRochester,NY,a4to6inchboreholeisatypicalstandardin
theGHPindustryandiscommonfordrillingcontractors.Intermsoftheeffectthe
diameterhasontheoveralldepthoftheborehole,effortsshouldbemadetokeepit
minimized.Increasingthediameterincreasesthedistancetheheatmustflowfromthe
exchangerpipetotherockformation,thusincreasingtheboreholethermalresistance.
Table1‐9providesasummaryofthebasecasesimulationsperformedwithaborehole
diameterof10inches.

21
Table19.BaseCase,BoreholeDiameter=10Inches
Zone
Depth in ft Light, Damp Soil
k = 0.50
Depth in ft Average Rock
k = 1.4
Depth in ft Dense Rock
k = 2.0 1 and 2 3700 1810 1500
3 2410 1240 1040 4 1930 1000 830 5 1680 870 720
6 and 7 1430 740 610 Note–khasunitsofBTU/hr*ft*°F
Ascomparedtothebasecasesimulationswitha6inchborehole,the10inchborehole
yieldeda7%increaseinboreholedepthinlight,dampsoil,a14%increaseinaveragerock
anda19%increaseindenserock.
1.5.5GroundLoopExchangerPipeDiameter
Asopposedtotheboreholediameter,asthediameteroftheHDPEpipeusedinthe
groundloopheatexchangerincreases,theboreholethermalresistancedecreasesdueto
theincreasedsurfaceareaoftheexchangerpipe.Thusimprovingtheheatconductionwith
thegroundanddecreasingthedepthoftheborehole.
Table110.BaseCase,¾”DiameterExchangerPipe
Zone
Depth in ft Light, Damp Soil
k = 0.50
Depth in ft Average Rock
k = 1.4
Depth in ft Dense Rock
k = 2.0 1 and 2 3770 1900 1570
3 2610 1310 1090 4 2090 1050 870 5 1820 910 760
6 and 7 1550 780 640 Note–khasunitsofBTU/hr*ft*°F
Table1‐10showsthatdecreasingthediameteroftheexchangerpipingfrom1½”inthe
basecaseto¾”producesanincreaseregardingboreholedepthinlight,dampsoilof9%,an
increaseof18%inaveragerockandanincreaseof22%indenserock.
1.6ValidationofDesign
InordertovalidatetheGLHEPROdesignrecommendationspresented,the
simulationswererunoncemoreusingGLD2009.Whiledifferencesexistedintherequired
inputsforeachmodelingprogram,alleffortsweremadetoensureidenticaloperating
conditionsweremimicked.TheresultsobtainedusingGLD2009replicatedthosefound

22
usingGLHEPROverywell.Whencomparingthecalculatedtotaldepthofboreholefrom
bothprograms,theresultsaveragedasevenpercentdifferenceinvalues,havingastandard
deviationofthree.Obtainingsimilarvaluesfrombothdesignprogramsensuresthatthe
resultsareaccurate.AdditionalGHLEPROoutputaswellasoutputfromGLD2009canbe
foundinAppendixDandAppendixE,respectively.Theresultswerealsoconfirmedby
eVanHeeEnergySolutionstobeappropriateforthespecifiedconditionsandwerewithin
fivetotenpercentoftheresultsobtainedfromtheirsoftwaresimulationsunderthesame
conditions.Furthermore,RobinCurtisandTonyBatchelorofEarthEnergyLtdperformed
thesamecalculations,whichresultedinonlyathirteenpercentdifferencebetweenthe
resultsofthisstudy,wellwithintherealmofacceptableerror.
1.7CapitalCosts
Costinformationwasgatheredbysurveyinginstallersandretailersfromdifferent
partsofthecountry.Pricescanandwillvarydependinguponlocationandvolume.Most
notably,purchasinginvolumecanlowerthepriceoftheheatpumpunititself.EIAdata
collectedonthegeothermalheatpumpindustryindicatesthatapproximately100,000
unitsweremanufacturedin2008.Thus,orderingseveralhundredunitswouldbeavery
significantincreaseforasinglemanufacturer.DavidNealeofeVanHeeEnergySolutions
suggeststhatpurchasing100‐400unitscouldlowerthecosttoapproximately$3000each,
lessthanhalfofpurchasingtheaverageunitindividually.
Capitalcostsofconventionalairconditioningunitsaresignificantlylowerthanthat
ofaGHP.Thepriceofairconditioningunitsinstalledinthesheltersrangesfrom$1,700to
$4,200($3,000average)sizedbetween36,000to60,000BTU/hr(10to18kW).Thelow
capitalcostsofairconditioningunitsdriveconsumerstochoosethemoverGHP’s,without
consideringlongtermoperatingexpenses.
Table111.AverageCostsforGHPSurfaceandSubsurfaceEquipment
WatertoAir,28‐30kBTU/hrGHP Retail:$6000‐$8500Average:$7400
BentoniteBaseGrout(k~0.43BTU/hr*ft*°F)
ThermallyEnhanced(k~1.0–1.4BTU/hr*ft*°F)
Average:$3‐$4.50percubicfoot
Average:$7.50‐$9.75percubicfoot
HDPEPipe Average:$0.22perfoot
Drilling Average:$11‐$18perfoot

23
1.7.1CostAnalysisbyZone
Asnotedpreviously,thevariationsingeologythatexistacrossthescopeofthe
projectdonotallowforpracticalconsiderationofspecificgeologiesinthesimulations.By
utilizingseveralvaluesforgroundsurfacethermalconductivity,itispossibletocoverthe
rangeofconditionsthatmaybeencounteredinthefield.Similarly,takingintoaccountthe
effectofgroundwatermovementacrossthewellfieldfurthercomplicatestheanalysis.
MakinguseofFigure1‐2:GroundSurfaceTemperatureMapoftheUnitedStatesandFigure
1‐3:ClimateZonesoftheUnitedStates,aswellasaveragemonthlytemperaturedata
collectedforeachzone(AppendixA),itwaspossibletoestimateoperatingconditions.
CalculationofthecapitalcostsusedtheinformationlistedinTable1‐11.Theprice
usedfortheGHPunitwastakenasanaverageof$7400.Groutwaspricedat$3percubic
footand$9.75percubicfootforthermallyenhancedgrout.Groundloopexchangerpipe
waspricedat$0.22perfootanddrillingat$11perfoot.
Zones1and2
Zone1and2posethemostchallengeswhendesigningaGHPsystem;mainlydueto
thehighgroundsurfacetemperatureassociatedwiththeregion,averaging23°C(73.4°F).
Clearly,thesehightemperaturesarenotasconduciveforcoolingapplicationsaslower
temperatures.Formationthermalconductivityiskeytominimizingtheoveralldepthof
theborehole,whichessentiallydictatessystemcapitalcosts.
Table112.CapitalCostsandBoreholeDepthZone1and2
Depth in ft Light, Damp Soil k = 0.50 Cost
Depth in ft Average Rock
k = 1.4 Cost
Depth in ft Dense Rock
k = 2.0 Cost Single U 3450 $48,800 1570 $26,300 1230 $22,200 Double U 3270 $48,200 1400 $24,900 1220 $22,600
Double U w/ Enhanced Grout 3140 $50,800 1280 $25,000 960 $20,600
Note–khasunitsofBTU/hr*ft*°F
Table1‐12showsthatevenwhenformationthermalconductivityapproaches2.0
BTU/hr*ft*°Ftheboreholedepthrequiredtosatisfythesystemisstillratherlargeat1230
feet.Inthissetofcircumstances,implementingadoubleUtubegroundloopexchanger
24
doesnotyieldalowercapitalcost.Thedepthofboreholedecreasesby10feetto1220feet;
thissmalldifferenceinboreholedepthdoesnotallowthedecreaseindrillingdepthto
counterthecostofdoublingtheamountexchangerpipeintheground.Thecapital
requiredtoinstalladoubleUsystemintheseconditionsis$22,600,anincreaseof$400.
Thedesigncanbeimproveduponbyreplacingthestandardconductivitygrouttoa
thermallyenhancedgroutwithaconductivityof1.4BTU/hr*ft*°F.Toreducecostsfurther,
utilizingadoubleUtubegroundloopexchangerandenhancedgroutswillbringthecapital
costofthesystemto$20,600.
Itisworthnoting,thatusingenhancedgroutinlowconductivitygeologydoesnot
leadtoadecreaseincost.Thebasecasedesigninlight,dampsoilwouldrequire$48,800
whilechangingovertothermallyenhancedgroutwouldincreasethecostto$50,800.As
previouslymentionedinsection1.5.3GroutSimulations,effortsshouldbemadetomatch
thethermalconductivityofthegroutwiththatofthegeologyattheinstallationsite.
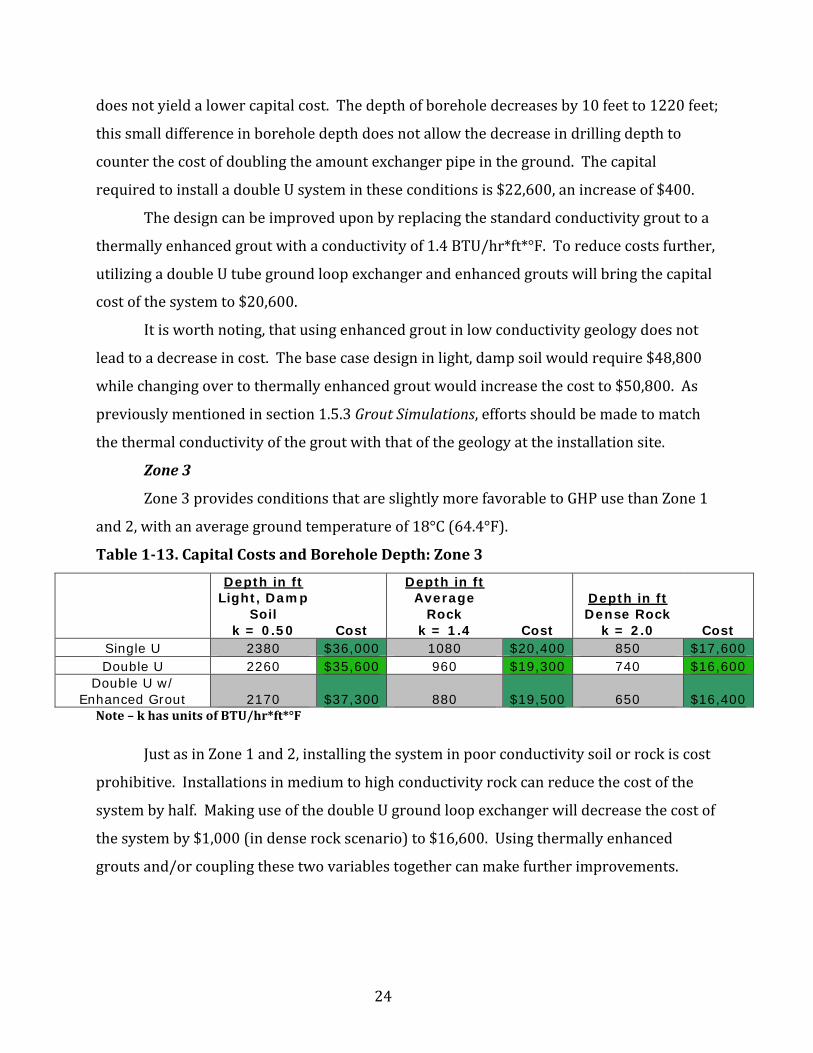
Zone3
Zone3providesconditionsthatareslightlymorefavorabletoGHPusethanZone1
and2,withanaveragegroundtemperatureof18°C(64.4°F).
Table113.CapitalCostsandBoreholeDepth:Zone3
Depth in ft Light, Damp
Soil k = 0.50 Cost
Depth in ft Average
Rock k = 1.4 Cost
Depth in ft Dense Rock
k = 2.0 Cost Single U 2380 $36,000 1080 $20,400 850 $17,600 Double U 2260 $35,600 960 $19,300 740 $16,600
Double U w/ Enhanced Grout 2170 $37,300 880 $19,500 650 $16,400 Note–khasunitsofBTU/hr*ft*°F
JustasinZone1and2,installingthesysteminpoorconductivitysoilorrockiscost
prohibitive.Installationsinmediumtohighconductivityrockcanreducethecostofthe
systembyhalf.MakinguseofthedoubleUgroundloopexchangerwilldecreasethecostof
thesystemby$1,000(indenserockscenario)to$16,600.Usingthermallyenhanced
groutsand/orcouplingthesetwovariablestogethercanmakefurtherimprovements.

25
Zone4
Intuitively,asthelatitudeincreases,thegroundtemperaturedecreases,thus
improvingtheabilityofthegeothermalheatpumptoeffectivelycooltheshelter.The
averagegroundsurfacetemperatureexpectedinZone4is14°C(57.2°F).
Table114.CapitalCostsandBoreholeDepth:Zone4
Depth in ft Light, Damp
Soil k = 0.50 Cost
Depth in ft Average
Rock k = 1.4 Cost
Depth in ft Dense Rock
k = 2.0 Cost Single U 1900 $30,300 860 $17,800 680 $15,600 Double U 1820 $30,100 770 $17,000 590 $14,800
Double U w/ Enhanced Grout 1740 $31,400 700 $17,100 520 $14,500 Note–khasunitsofBTU/hr*ft*°F
Continuingthesamepatternasbefore,boreholedepthdecreasesasimprovements
areimplementedtothedesign,whichinturnreducescosts.EmployingbothadoubleU
groundloopexchangerandthermallyenhancedgroutinadenserockgeologicalscenario,it
ispossibletosaveabout$1,000incomparisonwiththebase,singleUandstandardgrout
design.
Zone5
TheaveragegroundsurfacetemperatureexpectedtobefoundinZone5is11°C
(51.8°F),whichprovestoprovideanexcellentsourceforgeothermalcooling.
Table115.CapitalCostsandBoreholeDepth:Zone5
Depth in ft Light, Damp
Soil k = 0.50 Cost
Depth in ft Average
Rock k = 1.4 Cost
Depth in ft Dense Rock
k = 2.0 Cost Single U 1660 $27,300 750 $16,400 590 $14,500 Double U 1570 $27,000 670 $15,800 510 $13,800
Double U w/ Enhanced Grout 1510 $28,300 610 $15,800 450 $13,600 Note–khasunitsofBTU/hr*ft*°F
Thecosttoinstallasysteminaveragetodenserockatthegroundsurface
temperaturesencounteredinZone5continuestodecreasemakingthedecisiontouse
26
geothermalheatpumpsmoreappealing.Inbothsituations,thedecreaseinsystemcostby
usingbothenhancedgroutanddoubleUgroundloopexchangersisapproximately$1,000.
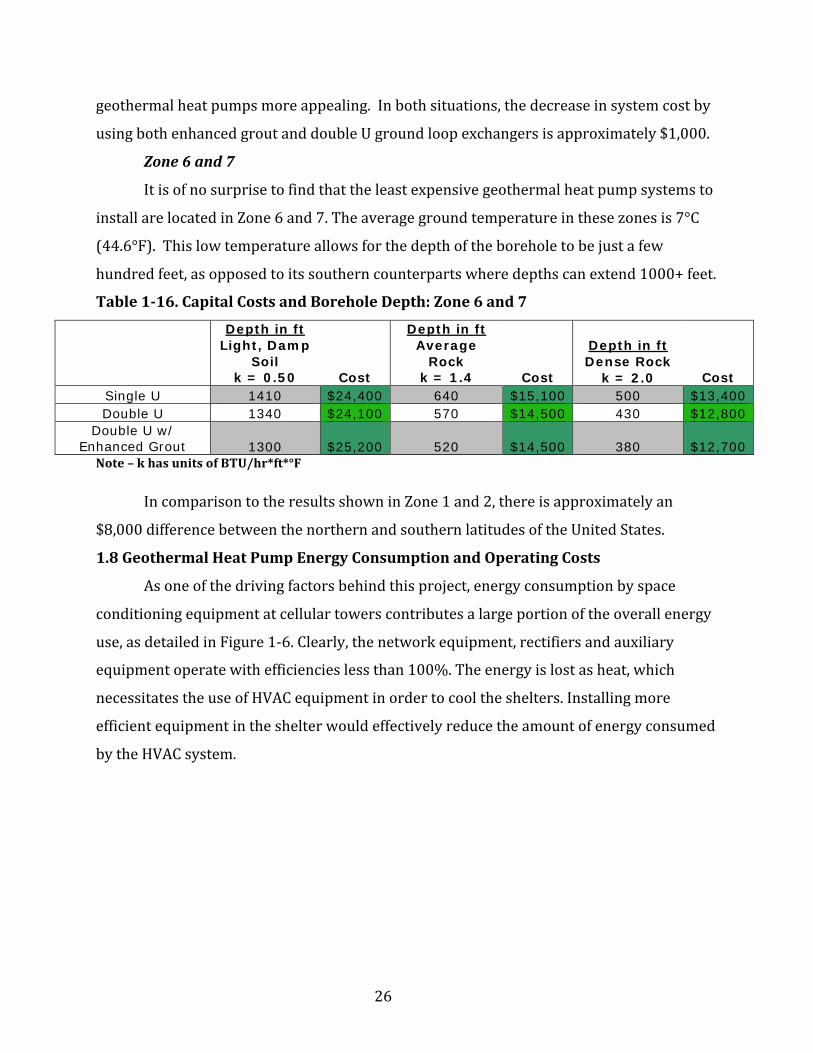
Zone6and7
Itisofnosurprisetofindthattheleastexpensivegeothermalheatpumpsystemsto
installarelocatedinZone6and7.Theaveragegroundtemperatureinthesezonesis7°C
(44.6°F).Thislowtemperatureallowsforthedepthoftheboreholetobejustafew
hundredfeet,asopposedtoitssoutherncounterpartswheredepthscanextend1000+feet.
Table116.CapitalCostsandBoreholeDepth:Zone6and7
Depth in ft Light, Damp
Soil k = 0.50 Cost
Depth in ft Average
Rock k = 1.4 Cost
Depth in ft Dense Rock
k = 2.0 Cost Single U 1410 $24,400 640 $15,100 500 $13,400 Double U 1340 $24,100 570 $14,500 430 $12,800
Double U w/ Enhanced Grout 1300 $25,200 520 $14,500 380 $12,700 Note–khasunitsofBTU/hr*ft*°F
IncomparisontotheresultsshowninZone1and2,thereisapproximatelyan
$8,000differencebetweenthenorthernandsouthernlatitudesoftheUnitedStates.
1.8GeothermalHeatPumpEnergyConsumptionandOperatingCosts
Asoneofthedrivingfactorsbehindthisproject,energyconsumptionbyspace
conditioningequipmentatcellulartowerscontributesalargeportionoftheoverallenergy
use,asdetailedinFigure1‐6.Clearly,thenetworkequipment,rectifiersandauxiliary
equipmentoperatewithefficiencieslessthan100%.Theenergyislostasheat,which
necessitatestheuseofHVACequipmentinordertocooltheshelters.Installingmore
efficientequipmentintheshelterwouldeffectivelyreducetheamountofenergyconsumed
bytheHVACsystem.

27
Figure16.CellTowerEnergyConsumptionfromVerizonWireless
SheltersoperateatanHVACsetpointof72°Finordertomaintainsatisfactory
conditionsforsuccessfulequipmentoperation.Theaveragesiteconsumeselectricity
pricedat$0.10/kWhandcontainsawallmountedairconditioningunitratedwithanEER
of9.VerizonWirelessprovidedareportinwhichenergyrelateddatawascollectedfroma
prototypicalshelterlocatedinBoston,Massachusetts.Thereportshowedthatthecostof
coolingtheshelterforoneyearwas$1,149.Calculatingthecostassociatedwithcoolingthe
shelterbaseduponanEERof9resultsin$1,153peryear.
Table117.HVACPerformanceandEnergyUse
GeothermalheatpumpshigherEERvalueallowsthemtocoolthesheltermuch
moreefficiently.Usingtheaboveinformation,itispossibletodeterminethattheair
conditioningunitoperatedfor3700hoursduringtheyearinwhichdatawascollected
(approximately10hoursperday).UsingtheaveragegeothermalheatpumpEERof26and
therequiredcoolingloadof28,000BTU/hrat$0.10/kWh,theoperatingcostoftheheat
NetworkEquipment
66%
HVACEquipment
20%
Rectitiers10%
AuxilaryEquipment
4%
CellTowerLoadDistribution
EER kWe kWhr/year $/year
Geothermal Heat Pump 26 1.07 3991 400
Air Conditioning 9 3.11 11531 1153

28
pumpis$400peryear,asavingsof$750.Takingthesefiguresovera15yearperiod,
geothermalheatpumpsarecapableofsaving$11,300.Table1‐17summarizesthis
information.

29
PART 2: Hybrid Systems; Geothermal Heat Pumps and Air Economizers
2.1TheCaseforAirEconomizers
WiththeclimaticconditionsexperiencedinalargepartoftheUnitedStatesforat
leasthalfoftheyear,coolingtheshelterswithoutsideairprovidesasimplesolution.This
canbeaccomplishedbytheuseofaireconomizers,whichisessentiallyafanthatexpels
warmairfrominsidetheshelteranddrawsincoolairfromtheenvironment.Thefans
operatewithrelativelylowpowerconsumption,averaging0.25horsepower(0.18kWe)at
1500cubicfeetperminute(cfm).Duetotheirsimplicityandlackofacompressor,the
capitalcostofaireconomizerunitsareverylow,approximately$300‐$400each.Coupling
aireconomizerswithothercoolingmethodscanreduceenergyconsumption,whichsaves
money.
2.2IntelProofofConcept
IntelCorporationhasalreadydemonstratedthataireconomizerscanprovide
adequatecoolingintemperaturesupto90°Finoneoftheir10MWserverlocations.The
exactlocationoftheserverwasnotrevealedwithinthereport,butclaimeditwaslocated
“inatemperatedesertclimatewithgenerallylowhumidity”.Thesystemwasdesigned
suchthattheaireconomizerwouldoperatebetween65°Fand90°F.Whentheambient
temperaturefellbelow65°F,theincomingairwaspreconditionedwiththeexitingair.
Whentheambienttemperatureexceeded90°F,theaireconomizerwasshutdownandan
aircooledchillerturnedon.Theserverlocationwassubjectedtovariationsinhumidity
rangingbetweenfourandninetypercentandhadlimitedairqualitycontrol,utilizingonlya
standardhouseholdHVACairfiltertocapturelargeparticulatematter(Atwood1‐4).
ThestudybeganinOctoberof2007andcommencedinAugust2008.Attheendof
thestudyitwasfoundthatdespitetheserversbeingexposedtolargevariationsin
humidityandairqualityconditions(alayerofdustcoveredtheservers),theserverfailure
rateinsidetheaircooledbuildingwas4.46percent.Thefailurerateatthemaindata
center,withairconditioning(noeconomizers)andbetterairqualitycontrol,was3.83
percent(Atwood1‐4).Clearly,aireconomizerspresentalowcostcoolingsolutionwith
almostnoimpactonthefailurerateofelectronicequipment.

30
2.3Analysis
Inordertodeterminetheamountofcoolingprovidedbytheambientairconditions,
itwasnecessarytodefinethevolumetricflowrateofthefan.DanielFeinandDavidNeale
ofeVanHeeEnergySolutionssuggestedthataflowrateof1500cfm(0.708m3/s)wouldbe
appropriateforthisapplication.ItwasthenpossibletoapplytheFirstLawof
Thermodynamicsandusethefollowingequationtosolvefortheheat:
€
Q•
= m•
CvΔT
Where
€
Q•
=heat(kWt)
€
m•
=massflowrate=0.708kg/s
Cv=constantvolumeheatcapacity=1.005kJ/kg*K
ΔT=(T2–T1)=temperaturechange(°C)
T2=Setpointinsideshelter=80°F(27°C)
T1=Ambientairtemperature
Theheatsuppliedbytheambientairwascalculatedonamonthlybasisandforsimplicityit
wasassumedthateverydayoftheyearexperiencedtwelvehoursofsunshineandtwelve
hoursofnight.
Thesetpointtemperatureinsidetheshelter,T2,wasfixedat80°F2(27°C),whileT1
wasvariedastheambientairtemperature.Inordertoprovideconservativeresults,the
ambientairtemperature(T1)during12hoursofdaytimeoperationwasassumedtobethe
averagehighforthemonth(AppendixB)underanalysiswithinthespecificclimatezone.
Similarly,theambientairtemperatureduring12hoursofnightwasassumedtobethe
averagelowforthemonth(AppendixC)underanalysiswithinthespecificclimatezone.
Thethermalkilowattsofcoolingprovidedbytheaireconomizerwasthencalculatedbythe
additionofthecoolingprovidedbythetwodifferenttwelvehourtimeperiods.This
coolingloadprovidedbytheeconomizerwasthenconvertedtokWhbysimplymultiplying
bytherespectivenumberofhoursinthemonthunderanalysis.Thisvaluewasthen
subtractedfromthecoolingdemandinsidetheshelterforthemonthassuminga
2Thecurrentsheltersetpointis72°F,however,effortsarebeingmadetoincreasethesetpointto80°F

31
continuous8.1kWtheatoutputfromthenetworkequipment.Thisthenprovidedthe
amountofadditionalcoolingcapacitythealternatecoolingunit(GHPorA/C)wasrequired
tomeet.
2.4GeothermalHeatPump/AirEconomizerDesign
Fourdifferentgroundloopexchangerdesignswereexaminedwiththeload
reductionprovidedbytheimplementationofaireconomizers:
Design1:Thebasecasedesign,featuringasingleverticalwellwithasingleUtube
exchanger,simulatedin“AverageRock”conditionswithstandardconductivitygrout
(0.43BTU/hr*ft*°F).
Design2:ThesameasDesign1,above,withadoubleUtubeexchangerandenhanced
conductivitygrout(1.0BTU/hr*ft*°F).
Design3:ThesamebasecasedesignwithaHORIZONTALwellfieldina6.6feetdeep
trench,12incheswidewithtwoexchangerpipes,placedinsoilwithathermal
conductivityof0.60BTU/hr*ft*°F.
Design4:ThesameasDesign3abovewiththreeexchangerpipesina24inchwide
trench.
Thehorizontalwellfieldwasexaminedbecauseitwaspossiblethattheaireconomizer
couldreducethecoolingloadsuchthatitcouldbeinstalledwithinthelimitsofthesite
location,whichcouldsignificantlyreducecapitalcosts.Horizontalwellsrequirenogrout
andcanbeinstalledwithcommonexcavationequipment.Amediumsizedexcavatorcan
becontractedforroughly$100perhour.Conservatively,itispossibletoexcavate300
linearfeetofa6’x2’trenchin8hours.Thecostsforheatpumpequipmentwerethesame
asthecostsusedinSection1.7.
Resultsarealsoprovidedforthecapitalandoperatingcostsofanair
conditioning/economizerhybridsystem.Theairconditioningunitmustoffsetthesame
coolingloadasgeothermalheatpumpsineachrespectivezone,butdosoatalowerEER,
increasingoperatingcosts.However,capitalrequirementsaremuchlowerforair
conditioners.Section2.5providesadetailedlifecyclecostanalysis.

32
2.4.1Zone1and2
Thesouthernmostclimatezonesprovidethebiggestchallengeforaireconomizers
duetothelowtemperaturedeltainreferencetothesheltersetpointandambient
conditions.Despitethesepoorconditions,improvementswerestillmadeinloop
reduction.
Table21TemperatureExtremesandSuppliedKilowatthoursbyEquipmentType
Zone 1 & 2 Jan Feb Mar Apr May June July Aug Sept Oct Nov Dec Avg High (°F) 69 71 76 81 86 90 92 91 89 83 76 71 Avg Low (°F) 50 52 57 62 68 73 75 75 73 66 58 52 Air Economizer (kWh) 7451 6080 4901 3217 2074 1269 878 921 1326 2506 4515 6678 Geothermal HP (kWh) 0 69 1125 2615 3953 4563 5148 5105 4506 3521 1317 164
TheredvaluesinTable2‐1(andsimilar,subsequenttables)indicatethemonthsin
whichtheaveragehightemperaturedoesnotprovideenoughofatemperaturedifferential
inordertocooltheshelterduringthe12hourdaytimeperiod.Consequently,thekilowatt‐
hoursinthesemonthsareonlyafunctionofthe12hournighttimecoolingperiod.Theblue
valuesrepresentmonthsinwhichtheaveragemonthlyhighandlowprovideenough
temperaturedifferentialtocooltheshelter24/7.
Design1fromaboveprovidedaverticalwelldepthof1200feetandacapital
investmentof$22,200andDesign2yielded960feetofverticalboreholeand$21,000.The
samedesignswithnoaireconomizerresultedinwelldepthsof1570feetandupfront
expensesof$26,300and1280feetand$25,000,respectively,savingabout$4,000ineach
case.
Table22.HorizontalDesignResultsinZone1&2
Zone 1 & 2 Trench Length
(ft) Pipe Length
(ft) Area (ft2)
Design 3 1130 2270 1130 Design 4 910 2740 1820
ThecapitalrequiredforDesign3is$11,200andDesign4is$10,700.Theadditional
pipinginthegroundreducestheamountofexcavationneeded,whichoutweighstheextra

33
costofthepipe.Thecapitalofthehorizontalsystemislessthanhalfthatofavertical
systemmeetingthesamecoolingload,butrequiresamuchlargerarea.
Section1.8showedthattheconventionalairconditioningunitsoperatedfor
approximately3700hoursperyearandcost$1150(at$0.10/kWh).Whenthisoperating
factor(approximately10hoursperday)wasappliedtoastandalonegeothermalheat
pumpwhoseEERwasequalto26,theyearlyoperatingcostwasabout$400.Ifweapply
thesameoperatingfactortoahybridgeothermal/aireconomizersystem,theyearly
operatingcostsareestimatedtobe$220,adifferenceof$930whencomparedtoair
conditioning.Whenthisfigureisappliedovera15yearperiod,thesavingsinenergyuseis
nearly$14,000.Theadditionalcostoftheeconomizercanpayforitselfinlessthanone
yearwhilereducingthetotalcostofaverticalsystemaround$5,500,whileahorizontal
systemcansaveover$20,000.Table2‐3providesasummaryofcapitalandoperating
expenses,aswellassavingsandpaybackperiods.
Table23SummaryofExpenses:Zone1&2
Zone 1 & 2 Capital ($)
Operating ($/yr) Savings ($/yr)
Payback (yrs)
Air Conditioner 3000 1150 - - GHP Vertical Well Design 1 26300 400 750 31 GHP Vertical Well Design 2 25000 400 750 29 GHP/Econ Vertical Well Design 1 22100 220 930 20 GHP/Econ Vertical Well Design 2 20900 220 930 19 GHP/Econ Horizontal Design 3 11200 220 930 9 GHP/Econ Horizontal Design 4 10700 220 930 8 Air Conditioner/Economizer 3300 556 594 < 1 SavingsandPaybackperiodcalculatedinreferencetooperationofAirConditioningunitONLY
2.4.2Zone3
ClimateZone3providesmoresuitableconditionsfortheuseoftheaireconomizers
asameansofcooling.Table2‐4showsthatthegeothermalheatpumpisonlyrequiredto
operate5monthsoftheyear,andduringthattimeitsupplementswhattheeconomizeris
unabletoprovide.

34
Table24TemperatureExtremesandSuppliedKilowatthoursbyEquipmentType
Zone 3 Jan Feb Mar Apr May June July Aug Sept Oct Nov Dec Avg High (°F) 53 58 65 73 80 86 89 88 83 75 65 56 Avg Low (°F) 32 36 43 50 58 65 68 68 63 52 43 35 Air Economizer (kWh) 13209 10713 9276 6400 4176 2799 2081 2262 3149 6007 9066 12253 Geothermal HP (kWh) 0 0 0 0 1850 3033 3945 3765 2683 19 0 0
Design1resultedinasingleverticalwellof600feetwhileDesign2required460
feetofborehole.CapitalrequiredforDesign1isestimatedtobe$14,800andDesign2is
$14,000.ThecapitalofDesign1withnoaireconomizeris$20,400(1080feet)andDesign
2is$19,500(880feet).
Table25HorizontalDesignResultsinZone3
Zone 3 Trench Length
(ft) Pipe Length
(ft) Area (ft2)
Design 3 710 1420 710 Design 4 560 1690 1120
ThecapitalrequiredforDesign3is$9,900andDesign4is$9,700,whichisroughly
$5,100lessexpensivethaninstallingthesamecapacityasDesign1.
ApplyingthesameoperatingfactorfromSection1.8andassumingthesamepriceof
electricity,thehybridsystemdesignedforZone3wouldcost$135peryeartooperate.In
comparisontotheconventionalairconditioner,thissaves$1,015peryear,ornearly
$15,000over15years.Table2‐6providesasummaryofestimatedexpensesinZone3.
Table26SummaryofExpenses:Zone3
Zone 3 Capital ($) Operating
($/yr) Savings ($/yr)
Payback (yrs)
Air Conditioner 3000 1150 - - GHP Vertical Well Design 1 20400 400 750 23 GHP Vertical Well Design 2 19500 400 750 22 GHP/Econ Vertical Well Design 1 14900 135 1015 12 GHP/Econ Vertical Well Design 2 14100 135 1015 11 GHP/Econ Horizontal Design 4 9900 135 1015 7 GHP/Econ Horizontal Design 4 9600 135 1015 6 Air Conditioner/Economizer 3300 295 855 < 1 SavingsandPaybackperiodcalculatedinreferencetooperationofAirConditioningunitONLY

35
2.4.3Zone4
ThetemperaturedifferentialprovidedbytheambientairconditionsfoundinZone4
morethanjustifytheuseofaireconomizers.Table2‐7showsthatthegeothermalsystemis
onlyneeded5monthsoftheyearandthattheaireconomizercanprovide24hourcooling
forallbut3months.
Table27TemperatureExtremesandSuppliedKilowatthoursbyEquipmentType
Zone 4 Jan Feb Mar Apr May June July Aug Sept Oct Nov Dec Avg High (°F) 44 48 57 67 75 83 87 86 79 69 57 47 Avg Low (°F) 25 28 36 44 53 61 66 64 58 46 37 28 Air Economizer (kWh) 16173 13415 11852 8458 5784 3317 2630 2849 4111 8061 11267 14944 Geothermal HP (kWh) 0 0 0 0 242 2515 3396 3177 1721 0 0 0
Design1inZone4producedaverticalboreholeof400feetwhileDesign2yielded
310feetofborehole.ThecapitalrequiredforDesign1is$12,500andDesign2is$12,000.
TheboreholedepthrequiredforDesign1withnoeconomizeris860feet,whichgivesa
capitalcostof$17,800.Design2withnoeconomizernecessitates700ofboreholeat
$17,100.
Table28HorizontalDesignResultsinZone4
Zone 4 Trench Length
(ft) Pipe Length
(ft) Area (ft2)
Design 3 550 1100 550 Design 4 430 1280 860
InZone4,thecapitalneededforDesign3is$9,399andDesign4is$9,117.The
amountoflandrequiredtoinstallahorizontalsystemcontinuestodecrease,withDesign4
requiringslightlymorethantwicetheperimeterofthestandardcelltowerlocationfora
wellfield.
ContinuingtousetheoperatingfactorinSection1.8,theoperatingcostofahybrid
geothermal/aireconomizersystemiscalculatedat$120peryear,saving$1,030versus
operatinganairconditioner.Takenover15years,thissavesabout$15,500.Table2‐9
summarizestheexpensesofeachsysteminZone4.

36
Table29SummaryofExpenses:Zone4
Zone 4 Capital ($) Operating
($/yr) Savings ($/yr)
Payback (yrs)
Air Conditioner 3000 1150 - - GHP Vertical Well Design 1 17800 400 750 20 GHP Vertical Well Design 2 17100 400 750 19 GHP/Econ Vertical Well Design 1 12500 120 1030 9 GHP/Econ Vertical Well Design 2 12000 120 1030 8 GHP/Econ Horizontal Design 3 9400 120 1030 6 GHP/Econ Horizontal Design 4 9100 120 1030 6 Air Conditioner/Economizer 3300 235 915 < 1 SavingsandPaybackperiodcalculatedinreferencetooperationofAirConditioningunitONLY
2.4.4Zone5
Spanningthenorth‐centralportionofthecountry,thetemperaturesinZone5
providemorethanenoughtemperaturedifferentialtorationalizetheuseofair
economizers.Table2‐10showsthattheheatpumponlyoperates3monthsoftheyearand
theaireconomizeriscapableofcontinuouscoolingallbutfor2monthsoftheyear.
Table210TemperatureExtremesandSuppliedKilowatthoursbyEquipmentType
Zone 5 Jan Feb Mar Apr May June July Aug Sept Oct Nov Dec Avg High (°F) 34 38 48 59 70 79 86 83 75 63 49 37 Avg Low (°F) 16 20 28 37 46 55 60 59 51 40 31 21 Air Economizer (kWh) 19386 16216 14776 10955 7870 4531 3523 3800 5961 10092 13698 18046 Geothermal HP (kWh) 0 0 0 0 0 1301 2503 2227 0 0 0 0
Design1inZone5yieldedaverticalboreholedepthof250feetrequiring$10,700of
capital.TheboreholedepthforDesign2was190feetcosting$10,300.Theboreholedepth
andcapitalcostforDesign1withnoaireconomizerwas750feetand$16,400.Installing
Design2withnoaireconomizerresultedin610feetofboreholedepthand$15,800.
Table211HorizontalDesignResultsinZone5
Zone 5 Trench Length
(ft) Pipe Length
(ft) Area (ft2)
Design 3 420 830 420 Design 4 320 970 640

37
CapitalcostsforDesign3and4withinZone5are$9,000and$8,800,respectively.
Instinctively,thearearequiredforthehorizontalgroundloopexchangercontinuesto
decreaseasthetemperaturedifferentialsincrease,makingtheiruseallthemoreappealing.
TheoperatingfactorappliedtotheloadrequiredinZone5resultedinyearly
operatingcostsofthehybridgeothermal/aireconomizersystemtobe$95,saving$1,055
whencomparedtostandaloneairconditioning.Whencarriedovera15yearperiod,the
energysavingsamounttonearly$16,000.Table2‐12summarizesestimatedexpensesin
Zone5.
Table212SummaryofExpensesinZone5
Zone 5 Capital ($) Operating
($/yr) Savings ($/yr)
Payback (yrs)
Air Conditioner 3000 1150 - - GHP Vertical Well Design 1 16400 400 750 17 GHP Vertical Well Design 2 15800 400 750 17 GHP/Econ Vertical Well Design 1 10700 95 1055 7 GHP/Econ Vertical Well Design 2 10300 95 1055 7 GHP/Econ Horizontal Design 3 9000 95 1055 6 GHP/Econ Horizontal Design 4 8700 95 1055 5 Air Conditioner/Economizer 3300 158 992 < 1 SavingsandPaybackperiodcalculatedinreferencetooperationofAirConditioningunitONLY
2.4.5Zone6and7
ItisquiteobviousthatZone6and7willprovidethebestambientconditionstocool
theshelters.Evenduringthesummermonths,thetemperaturesremainmoderateand
significantlyreducetheamountofgroundlooprequiredbythegeothermalheatpumpto
offsettheload.Table2‐13demonstratesthereductionindemandrequiredfromthe
geothermalheatpump,operatingonlythreemonthsperyear,twoofwhichareatlowkWh
consumption.Theaireconomizerisabletosupplycooling24hoursadayfor11months.

38
Table213TemperatureExtremesandSuppliedKilowatthoursbyEquipmentType
Zone 6 & 7 Jan Feb Mar Apr May June July Aug Sept Oct Nov Dec Avg High (°F) 23 28 39 53 65 74 80 78 68 56 39 26 Avg Low (°F) 4 8 20 32 42 51 56 54 45 34 22 9 Air Economizer (kWh) 23485 19644 17937 12950 9394 6063 4455 5093 8198 12413 16880 21939 Geothermal HP (kWh) 0 0 0 0 0 40 1571 933 0 0 0 0
Fromthisinformation,Design1resultedin130feetofverticalboreholeandDesign
2required90feet.ThecapitalinvestmentforDesign1is$9,200andDesign2is$9,000.
Designs1and2withnoaireconomizerwouldcallfor640feetand520feet,andthe
requiredcapitalof$15,000and$14,500,respectively.Theadditionofanaireconomizer
couldsaveasmuchas$6,000.
Table214HorizontalDesignResultsinZone6&7
ThecapitalinvestmentforDesign3is$8,700andDesign4is$8,500.Itshouldbe
notedthatthetrenchlengthofDesign4isnearlythatoftheperimeterofthecelltower
location.
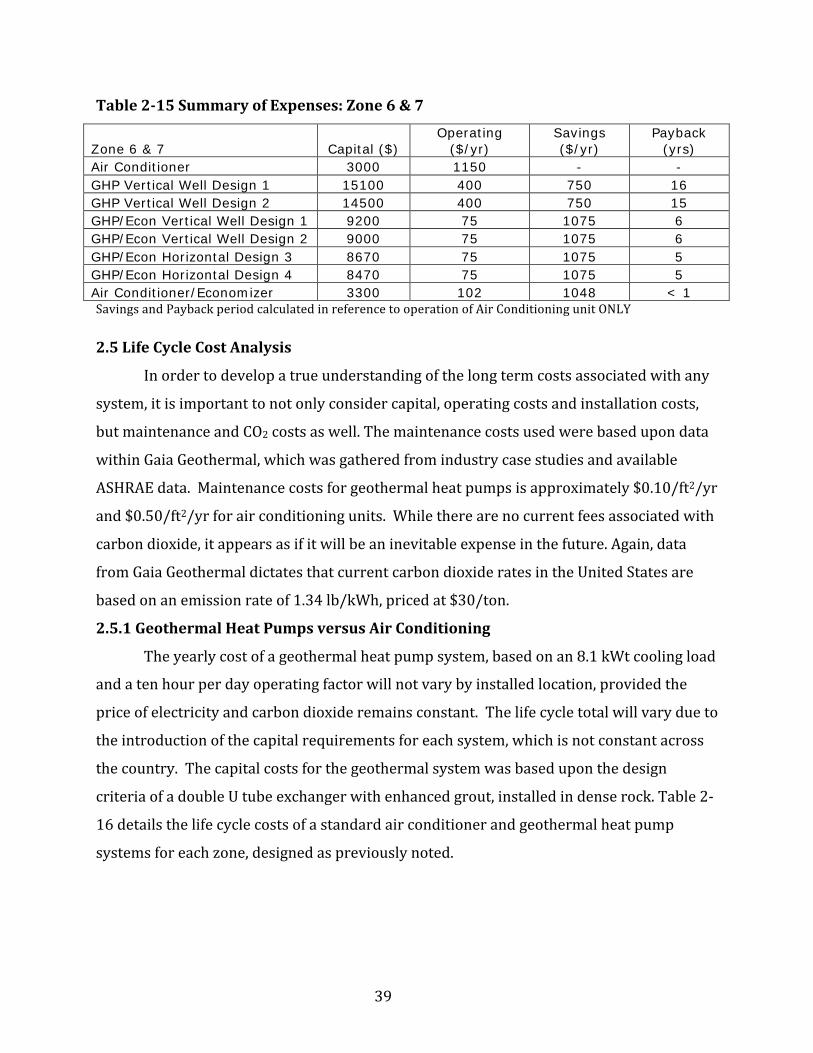
WhentheoperatingfactorisappliedtotheproposedhybridsysteminZone6&7,
theyearlyoperatingcostis$75,saving$1,075versusconventionalairconditioning.Taken
over15yearsthesavingspotentialis$16,100.Table2‐15summarizesexpensesinZone6
&7.
Zone 6 & 7 Trench Length
(ft) Pipe Length
(ft) Area (ft2)
Design 3 310 630 310 Design 4 230 700 460
39
Table215SummaryofExpenses:Zone6&7
Zone 6 & 7 Capital ($) Operating
($/yr) Savings ($/yr)
Payback (yrs)
Air Conditioner 3000 1150 - - GHP Vertical Well Design 1 15100 400 750 16 GHP Vertical Well Design 2 14500 400 750 15 GHP/Econ Vertical Well Design 1 9200 75 1075 6 GHP/Econ Vertical Well Design 2 9000 75 1075 6 GHP/Econ Horizontal Design 3 8670 75 1075 5 GHP/Econ Horizontal Design 4 8470 75 1075 5 Air Conditioner/Economizer 3300 102 1048 < 1 SavingsandPaybackperiodcalculatedinreferencetooperationofAirConditioningunitONLY
2.5LifeCycleCostAnalysis
Inordertodevelopatrueunderstandingofthelongtermcostsassociatedwithany
system,itisimportanttonotonlyconsidercapital,operatingcostsandinstallationcosts,
butmaintenanceandCO2costsaswell.Themaintenancecostsusedwerebasedupondata
withinGaiaGeothermal,whichwasgatheredfromindustrycasestudiesandavailable
ASHRAEdata.Maintenancecostsforgeothermalheatpumpsisapproximately$0.10/ft2/yr
and$0.50/ft2/yrforairconditioningunits.Whiletherearenocurrentfeesassociatedwith
carbondioxide,itappearsasifitwillbeaninevitableexpenseinthefuture.Again,data
fromGaiaGeothermaldictatesthatcurrentcarbondioxideratesintheUnitedStatesare
basedonanemissionrateof1.34lb/kWh,pricedat$30/ton.
2.5.1GeothermalHeatPumpsversusAirConditioning
Theyearlycostofageothermalheatpumpsystem,basedonan8.1kWtcoolingload
andatenhourperdayoperatingfactorwillnotvarybyinstalledlocation,providedthe
priceofelectricityandcarbondioxideremainsconstant.Thelifecycletotalwillvarydueto
theintroductionofthecapitalrequirementsforeachsystem,whichisnotconstantacross
thecountry.Thecapitalcostsforthegeothermalsystemwasbaseduponthedesign
criteriaofadoubleUtubeexchangerwithenhancedgrout,installedindenserock.Table2‐
16detailsthelifecyclecostsofastandardairconditionerandgeothermalheatpump
systemsforeachzone,designedaspreviouslynoted.

40
Table216GeothermalHeatPumpvs.AirConditioningLifecycleCosts
Annual Costs A/C GHP Zone
1&2 GHP
Zone 3 GHP
Zone 4 GHP
Zone 5 GHP Zone
6&7 Energy ($) 1150 400 400 400 400 400 CO2 ($) 230 80 80 80 80 80 Maintenance ($) 120 20 20 20 20 20 TOTAL ($) 1500 500 500 500 500 500 20 Year Cost Energy ($) 23100 8000 8000 8000 8000 8000 CO2 ($) 4600 1600 1600 1600 1600 1600 Maintenance ($) 2400 500 500 500 500 500 Capital ($) 3000 24000 18700 16400 15218 14000 Lifecycle Total ($) 33100 34100 28800 2650 25300 24100
TheresultsfromTable2‐16showthatgeothermalheatpumpsarelessexpensiveto
operateovertime,exceptinZone1&2.Regardlessofthethermalgroundconditions,a
geothermalsystemdesignedwithadoubleUtubeheatexchangerandenhancedgrout
(costsasdefinedinSection1.7)wouldrequiretheboreholedepthtobenogreaterthan
900feetinordertobelessexpensivethanairconditioning.
2.5.2HybridizingwithAirEconomizers
Includinganaireconomizerwitheithercoolingsystemcansignificantlyreduce
capitalandoperatingcosts.Geothermalheatpumpsreceivethemostbenefitinthe
reductionofcapitalexpenses,becausetheaireconomizercarriesasignificantpercentage
ofthecoolingloadrequirement,whichallowsforthegroundloopexchangertobescaled
down.
Bydesigningeithertechnology(A/CorGHP)toincorporateaneconomizer,the
energyuseforeachsystemwillvarybyclimatezoneduetoeachzonehavingadifferent
percentreductioninkWhfromtheeconomizer(afunctionofambientairtemperature).
Thelifecyclecostsforthegeothermalsystemwerebaseduponthecriteriadefinedby
Design4inSection2.4andexpendituresfromSection1.7.Table2‐17outlinestheresults.

41
Table217HybridSystemLifeCycleCosts:HorizontalGHP&AirConditioning
Annual Costs
GHP Zone 1&2
AC Zone 1&2
GHP Zone 3
AC Zone 3
GHP Zone 4
AC Zone 4
GHP Zone 5
AC Zone 5
GHP Zone 6&7
AC Zone 6&7
Energy ($) 220 560 140 300 120 240 100 160 80 100 CO2 ($) 40 110 30 60 20 50 20 30 20 20 Maintenance ($) 20 120 20 120 20 120 20 120 20 120 TOTAL ($) 280 790 190 480 160 410 140 310 120 240 20 Year Cost Energy ($) 4400 11100 2700 5900 2400 4700 1900 3200 1500 2000 CO2 ($) 890 2200 540 1200 480 900 380 630 300 400 Maintenance ($) 480 2400 480 2400 480 2400 480 2400 480 2400 Capital ($) 10800 3300 9600 3300 9100 3300 8800 3300 8500 3300 Lifecycle Total ($) 16570 19000 13320 12800 12460 11300 11560 9530 10780 8100
Surprisingly,Table2‐17demonstratesthatinallbutZone1&2,ahybridair
conditioner/economizerdesignislessexpensivethanasystemcomposedofageothermal
heatpumpandaireconomizer.Thedifferenceinoperatingexpensebetweenhybridized
airconditionersandhybridizedgeothermalheatpumpsissosmallthattheamountoftime
necessaryfortheheatpumptomakeupthelargecapitalexpendituresinenergysavingsis
beyondthelifeoftheequipment.Bearinmindthatthegeothermalheatpumpvaluesin
Table2‐17arecalculatedforthemosteconomicalgroundloopsysteminthisstudy
(horizontalwell).LifecyclecostsforhybridA/Cvs.hybridGHPsystemswithavertical
well,doubleUgroundloopexchangerandenhancedgroutcanbefoundinAppendixG.
However,hybridizedgeothermalheatpumpsstillhavethepotentialtobemorecost
effectivethanhybridizedairconditioning.VerizonWirelesshasthecapacitytoinstalla
largenumberofsystemsnationwide.Itiswithintherealmofpossibilitytonegotiatelower
pricesnotonjusttheunitsfromasinglemanufacturer,butfromregionalinstallersaswell.
AspreviouslymentionedinSection1.7,apricepointof$3000pergeothermalunitcould
hypotheticallybeachieved.Table2‐18estimateslifecyclecostsbaseduponthis
assumption.AppendixHprovideslifecyclecostsforhybridA/Cvs.hybridGHPsystems
withaverticalwell,doubleUgroundloopexchangerandenhancedgroutwiththis
discountedrate.

42
Table218HybridizedLifecycleCostswithDiscountedGHP’s
Annual Costs
GHP Zone 1&2
AC Zone 1&2
GHP Zone
3 AC
Zone 3
GHP Zone
4 AC
Zone 4
GHP Zone
5
AC Zone
5
GHP Zone 6&7
AC Zone 6&7
Energy ($) 220 560 140 300 120 240 100 160 80 100 CO2 ($) 40 110 30 60 20 50 20 30 20 20 Maintenance ($) 20 120 20 120 20 120 20 120 20 120 TOTAL ($) 280 790 190 480 160 410 140 310 120 240 20 Year Cost Energy ($) 4400 11100 2700 5900 2400 4700 1900 3200 1500 2000 CO2 ($) 890 2200 540 1200 480 950 380 630 300 410 Maintenance ($) 480 2400 480 2400 480 2400 480 2400 480 2400 Capital ($) 6300 3300 5200 3300 4700 3300 4400 3300 4100 3300 Lifecycle Total ($) 12070 19000 8920 12800 8060 11350 7160 9530 6380 8110
Table2‐18indicatesthatifalowerpricecanbenegotiatedforjusttheheatpump
unit,thelifecyclecostfavorsgeothermalenergy.Thelifecyclecostscanbeevenfurther
reducedifdiscountscanbeattainedforthenecessarysubsurfaceequipment.
43
Part 3: Endorsements and Closing Thoughts
3.1Recommendations
Designingageothermalheatpumpsystemthatisapplicabletogeologicand
atmosphericconditionsfoundacrosstheentireUnitesStatesisnotasimpletask.The
rangeofvariablesthatwouldneedtobetakenintoconsiderationforadetailedtowerby
towerorevenstatebystateanalysisaresimplytoogreat.Simplificationsand
generalizationswereneededinordertomaketheprojectrealistic,whilestillcoveringa
representativerangeofcharacteristicsnecessarytosatisfythescopeofthestudy.
UsingtheworstcasescenarioforconditionsfoundintheU.S,namelygroundsurface
temperature(23°C)andanaveragegroundthermalconductivity(0.50BTU/hr*ft*°F)and
applyingitacrosstheentirecountrywouldbeaseveremistake.Whilethesystemwould
certainlyoperateinnearlyeverysituation,itwouldnotonlybegrosslyoversized,but
unreasonablyexpensiveforthemajorityofthecountry.Forexample,asysteminstalledin
Zone6and7indenserockwithenhancedgroutandadoubleUtubeexchangershould
require380feetofborehole.Theworstcasedesigncallsfor3,450feetofborehole,nearly
ninetimesmorethanwhatisneeded,causingnearly$36,000extradollarstobespent.Itis
forthisreasondesigningasystemforthespecificlocationwhereitistobeinstalledis
imperative.
Byexaminingtheresultspresentedinthisreport,alleffortshouldbemadetoavoid
theinstallationofaunitinlowconductivitygeology.EveninZone6and7,thevertical
boreholedepthrequiredforasolitarysystemisstillratherhighandsearchingforsuitable
rockformationscansaveasignificantamountofmoney.Identifyingnewlocationsforcell
towerconstructionalreadyrequiressomegeologicalresearchtodeterminethefoundation
inwhichthetowerwillbelocated.Itwouldrequireverylittleadditionalworktoestablish
locationsthataresuitableforgeothermalheatpumps.Localwaterwelldrillingrecordscan
provideanexcellentsourceforthetypeofgeologythatcanbeencountered.
Inordertoensurepropersystemperformance,eachsystemshouldbeindividually
designedforthespecificlocationtotakeintoaccountallappropriatevariables.Discussing
optionswithlocal,certifiedinstallerswhoarefamiliarwiththeregionalgeological
conditionswillyieldmoreaccuratedesigns.Furthermore,notallmaterialsareusedorare

44
availabletoeveryinstaller.Differencesinbrand,pricingandperformancecharacteristics
couldvarydependingupontheregion.Asmentionedinthereport,purchasingequipment
andnegotiatingmultipleinstallationswithasinglecontractorinalocalizedgeographywill
almostcertainlyleadtoloweringcosts.
BasedupontheresultspresentedinSection2,itistheauthor’srecommendation
thatthecoolingofcelltowerequipmentsheltersbeinstalledassystemshybridizedwith
aireconomizers.Theirlowenergyexpenditure(0.18kWe)suppliestheshelterwith
significantquantitiesofcooling,whichallowsthegeothermalheatpump(1.1kWe)andair
conditioner(3.1kWe)tooperatelessfrequently,thussavingmoney.Ifthegeothermal
heatpumpequipmentistobepurchasedatretailvalue,thelifecyclecostsindicatethatair
conditionersactuallyprovideamorecosteffectivesolutionwheneachiscoupledwithan
aireconomizer.However,thelargenumberofunitsthatVerizonWirelesshasthecapacity
toinstallcanreducethecostofthegeothermalheatpumpequipmentimmensely.As
discussedinSection2.5.2,arealisticvolumepricefortheheatpumpunitof$3000would
shiftthelifecyclecostanalysisinfavorofgeothermalheatpumps,assumingDesign4with
horizontalwells.AppendixHshowsthelifecyclecostanalysisusingverticalwellswith
enhancedgroutanddoubleUgroundloopexchangersatthesamediscountedrate;where
inonlyZone1&2andZone3thatthehybridairconditioningsystemsarelessexpensive
thanhybridgeothermalsystems.
Minimizingtheamountoflandoccupiedbycelltowerinstallationsisahighpriority
issue;hencethereasonfordesigningverticalgroundloops;havingsaidthat,dismissingthe
applicationofhorizontalgroundloopswouldbeunfortunate.Aireconomizer’spossessthe
abilitytoreducethelengthofthegroundloopsuchthathorizontalsystemscouldbe
implemented.Dependinguponthecostsassociatedwithleasingtheavailableland,itmay
befeasibletoleaseslightlymorelandtosatisfythelooprequirementsandsavemoneyby
nothavingtoinstallaverticalsystem.Itisforthatreasonthathorizontalloopsshouldnot
bedisregarded.
3.1.1Zone1&2
TheclimaticandambientconditionsfoundinZone1&2donotlendthemselves
verywelltogeothermalcoolingapplications,butitistheseregionswherecoolingdemand
45
potentiallyisthehighest.Assumingretailpricingforequipment,thebestsolutionfor
coolingshelterswithinZone1&2istheuseofahybridairconditioner/economizer.The
lifecyclecostanalysissuggeststhatahybridgeothermal/economizersystemwouldbe
superior,butthedesignisbasedonthepredicationthatahorizontalgroundloopwouldbe
installed,requiring910linearfeetoftrench.Itisverylikelythatthisisbeyondwhat
VerizonWirelessiswillingtoundertake.ShouldVerizonWirelesschoosetoinstalla
solitarysystem(noeconomizer),thengenerallyspeaking,airconditioningunitsshould
continuetobeused.Thehighaveragegroundsurfacetemperatureinthiszonerequires
thattheverticalboreholebetoodeeptorecoverthecostsinatimelymanner.Itmaybe
possibleforlocationstoexistwithinthiszonethatlendthemselvestogeothermalheat
pumps,beitfromahigherconductivitygeology,lowergroundsurfacetemperatureor
enhancedcoolingeffectsfromaquifers.
3.1.2Zone3throughZone6&7
Eachzonelendsitselftoindividualdesignsbasedondifferentgroundandambient
temperatureconditionsandvaryingcoolingloads(whenaireconomizersareintroduced).
Yet,theendresultinselectingamethodtocooltheshelterremainsthesamefromZone3
toZone6&7.Inthecaseforinstallingindividualsystemswithnoeconomizer,geothermal
heatpumpsprovideabettercoolingsolutionthanairconditioning.Whenconsidering
hybridizedsystemspurchasedatretail,airconditionerscoupledwithaireconomizersare
morecosteffectivethanhybridgeothermalsystems.Discountedcostswilllendthemselves
togeothermalheatpumps,againusingDesign4.
3.2Concludingremarks
Geothermalheatpumpscanprovideanexcellentopportunitytoreducecostsand
electricityconsumptionforheatingandcoolingapplicationscomparedwithtraditional
coolingmethods.Takingadvantageofthenaturalenergystoragecapacitybeneaththe
surfaceoftheearthpresentsafantasticopportunitytoemploygeothermalenergyasafully
deployableandreliablerenewableenergysourceforthewidespreadapplicationofcell
towerpowerandenergymanagement
Theadditionofaireconomizerspresentsaninterestingcomplexity.Thereduction
incoolingloadrequiredtobemetbythealternatesystem(geothermalheatpumpsorair

46
conditioners)isreduceddrastically,particularlyinnorthernclimates.Whilebothhybrid
systemswillreducecostsandenergyconsumptionwhencomparedtoconventionalcooling
methods,analyzingthehybridsystemsagainstoneanothermakesthechoicelessclearand
requiringcorporategoalstobedefinedandusedinthedecisionmakingprocess.Ifsaving
moneyintheshorttermistheprimarygoal,thehybridairconditioning/aireconomizer
systemisthesystemofpreference.Ifsavingenergyforthelongtermistheprincipal
concern,thengeothermalheatpumpsarevastlysuperior.Itmaybeentirelyfeasibleto
meetbothgoalsifgeothermalheatpumpequipmentcanbepurchasedatvolume
discountedrates.
Itisindisputablethatenergysavingscanbemadebyemployingalternatecooling
methodstocelltowerequipmentshelters.Savingenergyisnotonlybeneficialfromthe
economicstandpointofVerizonWireless,butasasustainabilitymeasureithasvaluefor
thegeneralcommunityaswell.Alloftheoptionspresentedinthisreportcanprovide
substantialenergysavingswhencomparedtothecoolingmethodcurrentlyinplace.No
matterwhatoptionsareselected,decisionsthatdecreaseenergyusearetherightchoice
forthelongtermwhenfacinguncertaintywithrespecttofutureelectricitypricesandin
anticipationofpossibleregulationsonperformance.
Acknowledgements
Theauthorswouldliketothankallofthosewhomadecontributionsandprovided
assistancewiththeproject.VerizonWirelesswasessentialtotheprogressofthestudyby
providinguswiththedatanecessarytoperformanaccurateanalysis:namelyMark
Williams,DavidQuirkandRichardCraig.Furthermore,wewouldliketothankDaniel
FienandDavidNealeofeVanHeeEnergySolutionsandRobinCurtisandTonyBatchelorof
EarthEnergy,LLC.Theirinsightandguidanceinthegeothermalheatpumpindustryhas
beeninvaluable.Additionally,wewouldalsoliketoextendourgratitudetoPollyMarionof
CornellUniversityforhereffortsorganizingandplanningmeetingsthatwerevitaltothe
successoftheproject.Mostimportantly,wewouldliketorecognizetheVerizon
Foundationforsupportingourresearchefforts.

47
References
Atwood,Don,Miner,John.2008.“ReducingDataCenterCostwithanAirEconomizer”.IntelInformationTechnology.Companywebsite.AccessedApril14,2010.
http://www.intel.com/it/pdf/Reducing_Data_Center_Cost_with_an_Air_Economizer.pdf
Beikman,HelenM.,King,PhilipB.1974.“GeologicMapoftheUnitedStates.”U.S.Geological
Survey.EIA.2008.“GeothermalHeatPumpManufacturingActivities.”EnergyInformation
Administration,U.S.DepartmentofEnergy.ElkRefrigerants.2009.Companywebsite.AccessedMay13,2010. http://www.elkrefrigerants.com/r‐410a‐refrigerant.html
Fien,Daniel.2010.Personalcommunication.eVanHeeEnergySolutions.Ontario,NewYork
Hiller,Alan,ed.2000.GroutingforVerticalGeothermalHeatPumpSystems:Engineering
DesignandFieldProceduresManual.InternationalGroundSourceHeatPumpAssociation,OklahomaStateUniversity,Stillwater,Oklahoma
McQuayInternational.2002.“GeothermalHeatPumpDesignManual”ApplicationGuideAG31‐008.Staunton,Virginia
MorrisonHershfield.October2,2009.“TotalCostofOwnershipEvaluation,Presentedto
VerizonWireless.”ReportNo.6090166.Atlanta,GeorgiaNeale,David.2010.Personalcommunication.eVanHeeEnergySolutions.Ontario,New
York
Smith,J.M.,VanNess,H.C.,Abbott,M.M.2005.IntroductiontoChemicalEngineeringThermodynamics.7thed.McGraw‐Hill.NewYork,NewYork
Tester,Jefferson,etal.2006.TheFutureofGeothermalEnergy:ImpactofEnhanced
GeothermalSystemsintheUnitedStatesinthe21stCentury.IdahoNationalLaboratory,IdahoFalls,Idaho
UnitedStatesTemperatureData.AccessedMarch20,2010. http://www.climate‐zone.com/climate/united‐states

48
APPENDIXES
AppendixA:AverageMonthlyTemperaturesbyClimateZone(°F)
ZONE 1 Jan Feb Mar Apr May June July Aug Sept Oct Nov Dec Key West 69.9 70.5 73.8 77.1 83.1 84.4 84.3 83.3 80 75.6 71.5 77.8 Miami 67.2 68.5 71.7 75.2 78.7 81.4 82.6 82.8 81.9 78.3 73.6 69.1 Fort Myers 63.8 64.8 69.1 73.1 78.3 81.7 82.8 83 82 77.2 70.8 65.6 Average 67 67 71 75 80 82 83 83 81 77 72 70
ZONE 2 Jan Feb Mar Apr May June July Aug Sept Oct Nov Dec Orlando 59.7 61.2 66.7 71.2 76.9 81.1 82.3 82.5 81 75.2 68 62.1 Jacksonville 52.4 55.2 61.1 67 73.4 79.1 81.6 81.2 78.1 69.8 61.9 55.1 Tallahassee 50.5 53.2 60.2 66.3 73.6 79.6 81.3 81 78.3 68.7 59.7 53.2 Pensacola 50.6 53.6 60.4 67.6 74.5 80.3 82.1 81.5 78.4 69.3 60.6 53.7 Savannah 48.9 51.8 59.2 66 73.5 79.1 81.8 81 76.6 67.3 59.1 51.7 Mobile 49.9 53.2 60.5 67.8 74.5 80.4 82.3 81.8 77.9 68.4 59.8 53 New Orleans 51.3 54.3 61.6 68.5 74.8 80 81.9 81.5 78.1 69.1 61.1 54.5 Waco 45.2 49.4 58.2 67.1 74.3 81.5 85.6 85.6 78.6 68.5 57.7 48.3 San Antonio 49.3 53.5 61.7 69.3 75.5 82.2 85 84.9 79.3 70.2 60.4 52.2 Corpus Christi 55.1 58.5 65.6 72.5 77.9 81.9 84.1 84.2 81 73.9 65.7 58.3 Phoenix 53.6 57.7 62.2 69.9 78.8 88.2 93.5 91.5 85.6 74.5 61.9 54.1 Average 51 54 61 68 75 81 83 83 79 70 61 54
Zone 3 Jan Feb Mar Apr May June July Aug Sept Oct Nov Dec Charlotte 39.3 42.5 50.9 59.4 67.4 75.7 79.3 78.3 72.4 61.3 52.1 42.6 Charleston 48.4 51 57.9 65.4 72.8 78.8 81.8 81 76.8 67.9 59.7 52.2 Atlanta 41 44.8 53.5 61.5 69.2 76 78.8 78.1 72.7 62.3 53.1 44.5 Birmingham 41.5 45.7 54.2 62 69.4 76.3 79.8 79 73.4 62.5 53.1 45.2 Huntsville 38.8 43.1 51.9 60.8 68.4 75.8 79 78.3 72.2 61.2 51.5 42.9 Meridian 45 48.9 56.6 64.1 71.3 78.1 81 80.6 75.4 64.1 55.5 48.4 Little Rock 39.1 43.6 53.1 62.1 70.2 78.4 81.9 80.6 74.1 63 52.1 42.8 Dallas 43.4 47.9 56.7 65.5 72.8 81 85.3 84.9 77.4 67.2 56.2 46.9 Amarillo 35.1 39.2 47.1 56.8 65.4 74.1 78.6 76.5 69.1 58.5 46 36.9 San Angelo 43.7 48.4 58.1 67 74.2 79.5 82.7 81.9 75.4 66.2 55.4 46 Oklahoma City 35.9 40.9 50.3 60.4 68.4 76.7 82 81.1 73 62 49.6 39.3 Roswell 39.5 44.5 52.1 61 69.7 77.9 80.7 78.4 72.6 62.2 50.6 40.8 Los Angeles 58.3 60.1 60.7 62.2 65.8 69.7 74.3 75.1 73.7 69.7 63 58.2 San Francisco 48.7 52.2 53.3 55.6 58.1 61.5 62.7 63.7 64.5 61 54.8 49.4 Average 43 47 54 62 69 76 79 78 73 64 54 45
49
Zone 4 Jan Feb Mar Apr May June July Aug Sept Oct Nov Dec Greensboro 36.7 40 48.8 57.6 65.9 73.1 76.9 75.7 69.7 58.6 49.5 40.5 Nashville 36.2 40.4 50.2 59.2 67.7 75.6 79.3 78.1 71.8 60.4 50 40.5 Richmond 35.7 38.7 48 57.3 66 73.9 78 76.8 70 58.6 49.6 40.1 Roanoke 34.5 37.3 46.8 55.6 64.1 71.5 75.6 74.6 67.7 56.5 47.5 38.3 Washington DC 34.6 37.5 47.2 56.5 66.4 75.6 80 78 71.3 59.7 49.8 39.4 Baltimore 31.8 34.8 44.1 53.4 63.4 72.5 77 75.6 68.5 56.6 46.8 36.7 Wilmington 44.9 47.3 54.4 62.3 70.1 76.5 80.1 79.4 75.3 65.3 57 48.5 Lexington 30.8 34.5 45.3 54.8 64 72.2 75.8 74.7 68.2 56.7 46 35.9 Cincinnati 28.1 31.8 43 53.2 62.9 71 75.1 73.5 67.3 55.1 44.3 33.5 Evansville 30.1 34.4 45.8 56.2 65.5 74.8 78.4 76.1 69.2 57.2 46.2 35.2 Springfield 31.1 35.7 46 56 64.6 73.2 78.1 76.8 69 57.8 46 35.2 Kansas City 25.7 31.2 42.7 54.5 64.1 73.2 78.5 76.1 67.5 56.6 43.1 30.4 Wichita 29.5 34.8 45.4 56.4 65.6 75.7 81.4 79.3 70.3 58.6 44.7 33 Amarillo 35.1 39.2 47.1 56.8 65.4 74.1 78.6 76.5 69.1 58.5 46 36.9 Eugene 40.8 44.2 47.4 50.6 55.8 62 67.3 67.6 62.8 54.1 46.1 41.1 Seattle 40.1 43.5 45.6 49.2 55.1 60.9 65.2 65.5 60.6 52.8 45.3 40.5 Average 34 38 47 56 64 72 77 75 69 58 47 38
Zone 5 Jan Feb Mar Apr May June July Aug Sept Oct Nov Dec Boston 28.6 30.3 38.6 48.1 58.2 67.7 73.5 71.9 64.8 54.8 45.3 33.6 Hartford 24.6 27.5 37.5 48.7 59.6 68.5 73.7 71.6 63.3 52.2 41.9 29.5 Harrisburg 28.6 31.3 41.2 51.6 61.8 70.9 75.7 74.1 66.4 54.7 44.4 33.6 Pittsburgh 26.1 28.7 39.4 49.6 59.5 67.9 72.1 70.5 63.9 52.4 42.3 31.5 Syracuse 22.4 24 33.9 45.7 57.1 65.3 70.4 68.4 61.5 50.7 40.5 28.3 Cleveland 24.8 27.2 37.3 47.6 58 67.6 71.9 70.4 63.9 52.8 42.6 30.9 Detroit 22.9 25.4 35.7 47.3 58.4 67.6 72.3 70.5 63.2 51.2 40.2 28.3 South Bend 23.3 26.4 37.4 48.7 59.4 69.1 72.9 70.9 63.9 52.6 40.9 28.9 Chicago 21 25.4 37.2 48.6 58.9 68.6 73.2 71.7 64.4 52.8 40 26.6 Des Moines 19.4 24.7 37.3 50.9 62.3 71.8 76.6 73.9 65.1 53.5 39 24.4 Lincoln 21.3 36.6 38.6 51.7 62.1 72.5 78.2 75 65.3 53.6 38.8 25.6 Denver 29.7 33.4 39 48.2 57.2 66.9 73.5 71.4 62.3 51.4 39 31 Elko 25.1 31.5 37.6 44.3 53.1 62.4 70.7 68.7 58.7 47.7 35.8 25.7 Salt Lake City 27.9 34.1 41.8 49.7 58.8 69.1 77.9 75.6 65.2 53.2 40.8 29.7 Boise 29 35.9 42.4 49.1 57.5 66.5 74 72.5 62.6 51.8 39.9 30.1 Burns 23.3 29.4 36.3 42.8 50.8 58 66.2 64.2 55 45 33.6 25.1 Spokane 27.1 33.3 38.7 45.9 53.9 62 68.8 68.4 58.9 47.3 35.1 27.8 Average 25 30 38 48 58 67 73 71 63 52 40 29

50
Zone 6 Jan Feb Mar Apr May June July Aug Sept Oct Nov Dec Portland 39.6 43.6 47.3 51 57.1 63.5 68.2 68.6 63.3 54.5 46.1 40.2 Concord 18.6 21.8 32.4 43.9 55.2 64.2 69.5 67.3 58.8 47.8 37.1 24.3 Burlington 16.3 18.2 30.7 43.9 56.3 65.2 70.5 67.9 58.9 47.8 36.8 23 Alpena 17.6 18.3 28 40.9 52 61.3 67.1 64.8 57.3 46.9 35.7 23.7 Green Bay 14.3 18.3 30 44 55.5 64.5 69.7 67.1 50 48 34.4 20.2 Minneapolis 11.8 17.9 31 46.4 58.5 68.2 73.6 70.5 60.5 48.8 33.2 17.9 Aberdeen 10.1 16.7 29.8 45.2 57.1 66.6 72.8 70.6 59.6 47.3 30.3 15.3 Bismarck 9.2 15.7 28.2 43 55 64.4 70.4 68.3 57 45.7 28.6 14 Sheridan 20.8 26.4 33.9 43.8 52.7 62.1 69.6 68.4 57.1 46.7 32.5 22.6 Billings 22.8 29 35.5. 45.6 55 64.8 72.5 70.7 59.1 49.1 35.1 25.5 Missoula 22.7 29.2 35.8 44.2 51.8 60 66.8 65.8 55.7 44.2 32.4 23.4 Average 19 23 33 45 55 64 70 68 58 48 35 23
Zone 7 Jan Feb Mar Apr May June July Aug Sept Oct Nov Dec Caribou 8.9 11.9 24.6 37.9 50.9 60.5 65.5 62.8 53.7 43.2 30.7 14.8 Int'l Falls 1 7.7 22.1 39 52.1 61.4 66.7 63.7 53.4 42.4 24.9 7.2 Fargo 5.9 12 25.9 43 56.2 65.5 71.1 68.8 57.7 45.7 28.1 11.6 Williston 8.9 16.1 28.4 43.2 55.3 64.7 70.7 68.7 56.3 44.8 27.2 13.2 Anchorage 14.9 18.7 25.7 35.8 46.6 54.4 58.4 56.3 48.4 34.6 21.2 16.3 Average 8 13 25 40 52 61 66 64 54 42 26 13 AppendixB:AverageMonthlyHighTemperaturebyClimateZone(°F)
Zone 1 Jan Feb Mar Apr May June July Aug Sept Oct Nov Dec Key West 74.8 75.4 78.6 81.7 85.1 87.6 89.1 89.2 88 84.4 80 76.1 Miami 75.2 76.5 79.1 82.4 85.3 87.6 89 89 87.8 84.5 80.4 76.7 Fort Myers 74.3 75.4 79.7 84.2 88.7 90.3 91.1 91.3 89.8 85.8 80.7 76 Average 75 76 79 83 86 89 90 90 89 85 80 76
Zone 2 Jan Feb Mar Apr May June July Aug Sept Oct Nov Dec Orlando 70.8 72.7 78 83 87.8 90.5 91.5 91.5 89.7 84.6 78.5 72.9 Jacksonville 64.2 67 73 79.1 84.7 89.3 91.4 90.7 87.2 80.2 72.6 66.8 Tallahassee 62.9 66.3 73.5 80.4 86.3 90.8 91.3 91 88.5 81.5 73 65.9 Pensacola 59.8 62.9 69.4 76.6 83.2 88.7 89.9 89.2 86.4 79.1 70.1 62.9 Savannah 59.7 62.4 70.1 77.5 84 88.8 91.1 89.7 85.2 77.5 70 62.3 Mobile 59.7 63.6 70.9 78.5 84.6 90 91.3 90.5 86.9 79.5 70.3 62.9 New Orleans 60.8 64.1 71.6 78.5 84.4 89.2 90.6 90.2 86.6 79.4 71.1 64.3 Waco 56.1 60.8 69.6 78 84.4 92 96.8 97.2 89.6 80.3 68.8 59.3 San Antonio 60.8 65.7 73.5 80.3 85.3 91.8 95 95.3 89.3 81.7 71.9 63.5 Corpus Christi 65 69 75.7 81.7 86.2 90.4 93.3 93.4 89.7 83.9 75.8 68.3 Phoenix 65.9 70.7 75.5 84.5 93.6 104 106 104 98.3 88.1 74.9 66.2 Average 62 66 73 80 86 91 93 93 89 81 72 65

51
Zone 3 Jan Feb Mar Apr May June July Aug Sept Oct Nov Dec Charlotte 49 53 62.3 71.2 78.3 85.8 88.9 87.7 81.9 72 62.6 52.3 Charleston 57.8 61 68.6 75.8 82.7 87.6 90.2 89 84.9 77.2 69.5 61.6 Atlanta 50.4 55 64.3 72.7 79.6 85.8 88 87.1 81.8 72.7 63.4 54 Birmingham 51.7 56.9 66.1 74.6 81 87.4 89.9 89.1 83.9 74.7 64.6 55.7 Huntsville 48.2 53.5 62.8 72.5 79.3 86.6 89 88.8 82.8 73 62.4 52.6 Meridian 56.4 61.2 69.6 77.4 83.6 90 92.1 91.8 86.9 77.7 68.6 60.1 Little Rock 49 53.9 64 73.4 81.3 89.3 92.4 91.4 84.6 75.1 62.7 52.5 Dallas 54.1 58.9 67.8 76.3 82.9 91.9 96.5 96.2 87.8 78.5 66.8 57.5 Amarillo 49 52.8 61.6 71.5 79.1 87.6 91.7 89.1 81.8 72.5 59.7 50.1 San Angelo 56.8 62 72.6 81.2 87.4 92.7 96.2 95.3 86.8 78.8 68.2 59 Oklahoma City 46.7 52.1 62 71.9 79.1 87.3 93.4 92.5 83.8 73.6 60.4 49.9 Roswell 54.3 59.9 67.8 76.7 84.7 93.6 94.6 91.9 86 77.3 66 56 Los Angeles 65.7 65.9 65.6 67.4 69 71.9 75.3 76.6 76.6 74.4 70.3 65.9 San Francisco 55.6 59.4 60.8 63.9 66.5 70.3 71.6 72.3 73.6 70.1 62.4 56.1 Average 53 58 65 73 80 86 89 88 83 75 65 56
Zone 4 Jan Feb Mar Apr May June July Aug Sept Oct Nov Dec Greensboro 46.7 50.7 60.2 69.6 77 83.6 86.9 85.5 79.9 69.9 60.5 50.5 Nashville 45.9 50.8 61.2 70.8 78.8 86.5 89.5 88.4 82.5 72.5 60.4 50.2 Richmond 45.7 49.2 59.5 70 77.8 85.1 88.4 87.1 80.9 70.7 61.3 50.2 Roanoke 43.8 47.3 57.8 67.3 75.7 82.9 86.4 85.3 78.5 68.1 58 47.6 Washington DC 42.3 45.9 56.5 66.7 76.2 84.7 88.5 86.9 80.1 69.1 58.3 47 Baltimore 40.2 43.7 54 64.3 74.2 83.2 87.2 85.4 78.5 67.3 56.5 45.2 Wilmington 55.3 58.1 65.7 74 80.8 85.4 88.5 87.6 85.2 76.9 69.1 59.4 Lexington 39.1 43.6 55.3 65.5. 74.3 82.7 85.8 84.9 78.3 67.2 54.9 44.2 Cincinnati 36.6. 40.8 53 64.2 74 82 85.5 84.1 77.9 66 53.3 41.5 Evansville 38.9 43.7 55.9 67.4 76.9 86.2 89.1 87.2 80.7 69.6 55.9 43.6 Springfield 41.8 46.3 57.4 67.9 76 84.4 89.6 88.6 80.3 69.8 56.6 45.3 Kansas City 34.7 40.6 52.8 65.1 74.3 83.3 88.7 86.4 78.1 67.5 52.6 38.8 Wichita 39.8 45.9 57.2 68.3 76.9 86.8 92.8 90.7 81.4 70.6 55.3 43 Amarillo 49 52.8 61.6 71.5 79.1 87.6 91.7 89.1 81.8 72.5 59.7 50.1 Eugene 46.4 51.4 55.9 60.5 67.1 74.2 81.7 81.8 76.2 64.6 52.4 46.2 Seattle 46.1 50.6 53.7 58.1 64.2 69.6 74.1 74.1 68.8 60 51.5 46.2 Average 44 48 57 67 75 83 87 86 79 69 57 47

52
Zone 5 Jan Feb Mar Apr May June July Aug Sept Oct Nov Dec Boston 35.7 37.5 45.8 55.9 66.6 76.3 81.8 79.8 72.8 62.7 52.2 40.4 Hartford 33.2 36.4 46.8 59.9 71.6 80 85 82.7 74.8 63.7 51 37.5 Harrisburg 35.9 39.2 50.3 62 72.5 81.2 85.8 83.8 76.3 64.7 52.6 40.6 Pittsburgh 33.7 36.9 49 60.3 70.6 78.9 82.6 80.8 74.3 62.5 50.4 38.6 Syracuse 30.6 32.5 42.7 56 68.3 76.7 81.7 79 71,6 60.3 48 35.4 Cleveland 31.9 35 46.3 57.9 68.6 78.3 82.4 80.5 73.6 62.1 50 37.4 Detroit 30.3 33.3 44.4 57.7 69.6 78.9 83.3 81.3 73.9 62.5 48.1 35.2 South Bend 30.4 34.1 45.6 58.7 70 79.5 82.9 80.7 74.1 62.3 48.5 35.4 Chicago 29 33.5 45.8 58.6 70.1 79.6 83.7 81.8 74.8 63.3 48.4 34 Des Moines 28.1 33.7 46.9 61.8 73 82.2 86,7 84.2 75.6 64.3 48 32.6 Lincoln 32.4 37.9 50.3 64.4 74.2 84.7 90 86.6 77.2 66.7 50.2 35.8 Denver 43.2 46.6 52.2 61.8 70.8 81.4 88.2 85.8 76.9 66.3 52.5 44.5 Elko 36.7 43 50.2 59.1 69.4 80.2 91 88.6 78.3 65.9 49.1 37.4 Salt Lake City 36.4 43.6 52.2 61.3 71.9 82.8 92.2 89.4 79.2 66.1 50.8 37.8 Boise 36.4 44.2 52.9 61.4 71 80.9 90.2 88.1 77 64.6 48.7 37.7 Burns 33.6 39.5 47.7 56.5 65.6 74.4 85.1 83.3 73.6 61.8 45.2 35.2 Spokane 33.2 40.6 47.7 57 65.8 74.4 83.1 82.5 72 58.6 41.4 33.8 Average 34 38 48 59 70 79 86 83 75 63 49 37
Zone 6 Jan Feb Mar Apr May June July Aug Sept Oct Nov Dec Portland 45.5 51 56 60.6 67.1 74 79.9 80.3 74.6 64 52.6 45.6 Concord 29.8 33 42.8 56.3 68.9 77.3 82.4 79.8 71.6 60.7 47.1 34.2 Burlington 25.1 27.5 39.3 53.6 67.2 75.8 81.2 77.9 69 57 44 30.4 Alpena 26.4 28.2 37.9 51.6 64.8 74.5 80.2 76.9 68.3 56.8 43 30.9 Green Bay 22.8 27.1 38.5 54 67.2 75.5 80.5 77.5 69.1 57.4 42 27.7 Minneapolis 20.7 26.6 39.2 56.6 69.4 78.8 84 80.7 70.7 58.8 41 25.5 Aberdeen 20.9 26.9 39.8 57.3 69.7 78,8 85.9 84.4 72.9 60.4 40.5 25.4 Bismarck 20.2 26.4 38.5 54.9 67.8 77.1 84.4 82.7 70.8 58.7 39.3 24.5 Sheridan 33 38.3 46.2 57.1 66.3 76.9 86.1 85.2 72.8 61.7 45.3 35 Billings 31.8 38.6 45.8 57.1 66.7 77.6 86.7 84.7 71.6 60.6 44.5 34.4 Missoula 30 37.4 46.6 57.5 65.7 73.9 83.4 82.2 70.9 57 40.6 30.2 Average 28 33 43 56 67 76 83 81 71 59 44 31
Zone 7 Jan Feb Mar Apr May June July Aug Sept Oct Nov Dec Caribou 19.4 23 34.3 46.7 61.7 71.9 76.5 73.6 64 52 37.6 24 Int'l Falls 11.9 19.3 32.8 50.1 64.6 73.4 78.8 75.6 64.3 51.8 32.8 16.6 Fargo 15.4 21.1 34.6 53.8 68.5 77.4 83.4 81.3 69.4 56.7 36.8 20.1 Williston 19.6 26.8 39.4 55.8 68.3 78 84.8 83.3 70.1 58.1 38 23.6 Anchorage 21.4 25.8 33.1 42.8 54.4 61.6 65.2 63 55.2 40.5 27.2 22.5 Average 18 23 35 50 64 72 78 75 65 52 34 21
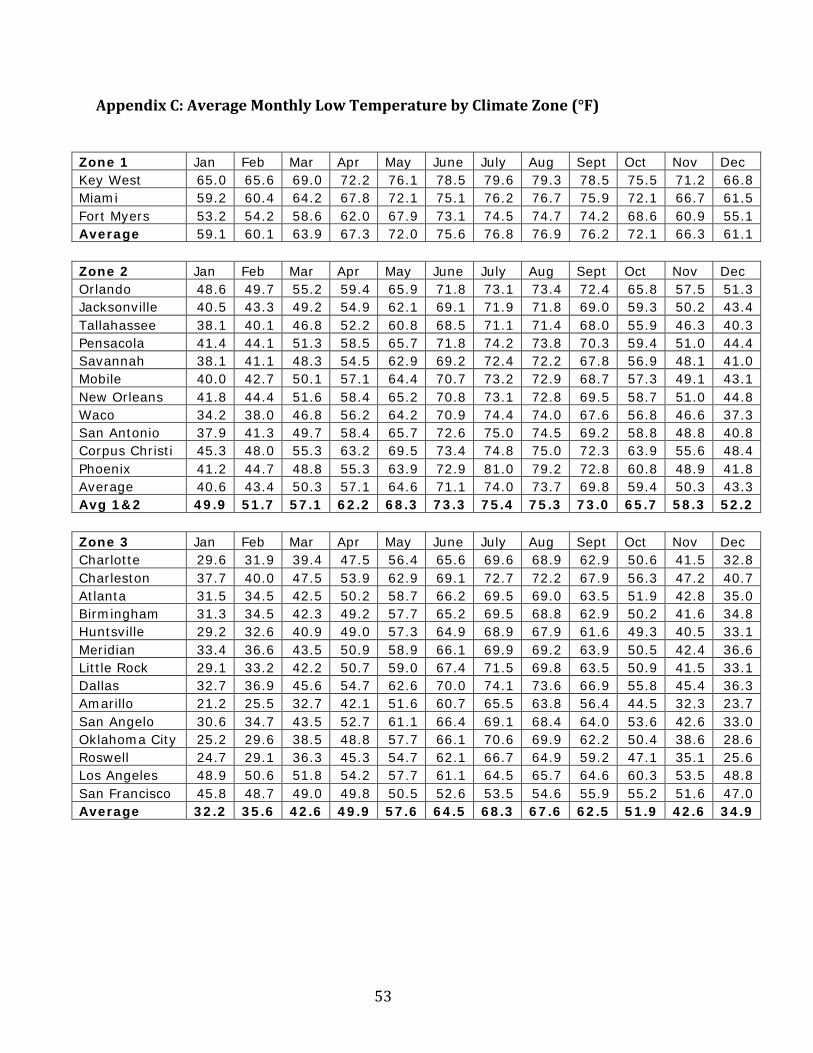
53
AppendixC:AverageMonthlyLowTemperaturebyClimateZone(°F)
Zone 1 Jan Feb Mar Apr May June July Aug Sept Oct Nov Dec Key West 65.0 65.6 69.0 72.2 76.1 78.5 79.6 79.3 78.5 75.5 71.2 66.8 Miami 59.2 60.4 64.2 67.8 72.1 75.1 76.2 76.7 75.9 72.1 66.7 61.5 Fort Myers 53.2 54.2 58.6 62.0 67.9 73.1 74.5 74.7 74.2 68.6 60.9 55.1 Average 59.1 60.1 63.9 67.3 72.0 75.6 76.8 76.9 76.2 72.1 66.3 61.1
Zone 2 Jan Feb Mar Apr May June July Aug Sept Oct Nov Dec Orlando 48.6 49.7 55.2 59.4 65.9 71.8 73.1 73.4 72.4 65.8 57.5 51.3 Jacksonville 40.5 43.3 49.2 54.9 62.1 69.1 71.9 71.8 69.0 59.3 50.2 43.4 Tallahassee 38.1 40.1 46.8 52.2 60.8 68.5 71.1 71.4 68.0 55.9 46.3 40.3 Pensacola 41.4 44.1 51.3 58.5 65.7 71.8 74.2 73.8 70.3 59.4 51.0 44.4 Savannah 38.1 41.1 48.3 54.5 62.9 69.2 72.4 72.2 67.8 56.9 48.1 41.0 Mobile 40.0 42.7 50.1 57.1 64.4 70.7 73.2 72.9 68.7 57.3 49.1 43.1 New Orleans 41.8 44.4 51.6 58.4 65.2 70.8 73.1 72.8 69.5 58.7 51.0 44.8 Waco 34.2 38.0 46.8 56.2 64.2 70.9 74.4 74.0 67.6 56.8 46.6 37.3 San Antonio 37.9 41.3 49.7 58.4 65.7 72.6 75.0 74.5 69.2 58.8 48.8 40.8 Corpus Christi 45.3 48.0 55.3 63.2 69.5 73.4 74.8 75.0 72.3 63.9 55.6 48.4 Phoenix 41.2 44.7 48.8 55.3 63.9 72.9 81.0 79.2 72.8 60.8 48.9 41.8 Average 40.6 43.4 50.3 57.1 64.6 71.1 74.0 73.7 69.8 59.4 50.3 43.3 Avg 1&2 49.9 51.7 57.1 62.2 68.3 73.3 75.4 75.3 73.0 65.7 58.3 52.2
Zone 3 Jan Feb Mar Apr May June July Aug Sept Oct Nov Dec Charlotte 29.6 31.9 39.4 47.5 56.4 65.6 69.6 68.9 62.9 50.6 41.5 32.8 Charleston 37.7 40.0 47.5 53.9 62.9 69.1 72.7 72.2 67.9 56.3 47.2 40.7 Atlanta 31.5 34.5 42.5 50.2 58.7 66.2 69.5 69.0 63.5 51.9 42.8 35.0 Birmingham 31.3 34.5 42.3 49.2 57.7 65.2 69.5 68.8 62.9 50.2 41.6 34.8 Huntsville 29.2 32.6 40.9 49.0 57.3 64.9 68.9 67.9 61.6 49.3 40.5 33.1 Meridian 33.4 36.6 43.5 50.9 58.9 66.1 69.9 69.2 63.9 50.5 42.4 36.6 Little Rock 29.1 33.2 42.2 50.7 59.0 67.4 71.5 69.8 63.5 50.9 41.5 33.1 Dallas 32.7 36.9 45.6 54.7 62.6 70.0 74.1 73.6 66.9 55.8 45.4 36.3 Amarillo 21.2 25.5 32.7 42.1 51.6 60.7 65.5 63.8 56.4 44.5 32.3 23.7 San Angelo 30.6 34.7 43.5 52.7 61.1 66.4 69.1 68.4 64.0 53.6 42.6 33.0 Oklahoma City 25.2 29.6 38.5 48.8 57.7 66.1 70.6 69.9 62.2 50.4 38.6 28.6 Roswell 24.7 29.1 36.3 45.3 54.7 62.1 66.7 64.9 59.2 47.1 35.1 25.6 Los Angeles 48.9 50.6 51.8 54.2 57.7 61.1 64.5 65.7 64.6 60.3 53.5 48.8 San Francisco 45.8 48.7 49.0 49.8 50.5 52.6 53.5 54.6 55.9 55.2 51.6 47.0 Average 32.2 35.6 42.6 49.9 57.6 64.5 68.3 67.6 62.5 51.9 42.6 34.9

54
Zone 4 Jan Feb Mar Apr May June July Aug Sept Oct Nov Dec Greensboro 26.6 29.3 37.4 45.6 54.7 62.6 66.9 65.6 59.5 47.2 38.5 30.5 Nashville 26.5 29.9 39.1 47.5 56.6 64.7 68.9 67.7 61.1 48.3 39.6 30.9 Richmond 25.7 28.1 36.3 44.6 54.2 62.7 67.5 66.4 59.0 46.5 37.9 29.9 Roanoke 25.0 27.2 35.7 43.8 52.5 60.2 64.8 63.8 56.8 44.8 37.0 28.9 Washington DC 21.0 23.3 31.8 40.3 50.0 59.2 64.1 62.8 55.4 42.4 34.2 25.8 Baltimore 23.4 25.9 34.1 42.5 52.6 61.8 66.8 65.7 58.4 45.9 37.1 28.2 Wilmington 34.4 36.4 43.1 50.5 59.3 65.7 71.7 71.0 65.3 53.7 44.8 37.5 Lexington 22.4 25.3 35.3 44.2 53.5 61.5 65.7 64.4 58.0 46.0 37.0 27.6 Cincinnati 19.5 22.7 33.1 42.2 51.8 60.0 64.8 62.9 56.6 44.2 35.3 25.3 Evansville 21.2 25.0 35.7 45.0 54.2 63.3 67.5 64.9 57.6 44.7 36.5 26.7 Springfield 20.4 35.0 34.4 44.1 53.2 61.9 66.6 65.0 57.7 45.9 35.5 25.3 Kansas City 16.7 21.8 32.6 43.8 53.9 63.1 68.2 65.7 56.9 45.7 33.6 21.9 Wichita 19.2 23.7 33.6 44.5 54.3 64.6 69.9 67.9 59.2 46.6 33.9 23.0 Amarillo 21.2 25.5 32.7 42.1 51.6 60.7 65.5 63.8 56.4 44.5 32.3 23.7 Eugene 35.2 37.0 38.9 40.6 44.5 49.7 52.8 53.2 49.3 43.5 39.7 35.9 Seattle 36.4 38.0 39.5 42.7 47.9 53.2 56.4 57.2 52.9 46.9 41.0 37.0 Average 24.7 28.4 35.8 44.0 52.8 60.9 65.5 64.3 57.5 46.1 37.1 28.6
Zone 5 Jan Feb Mar Apr May June July Aug Sept Oct Nov Dec Boston 21.6 23.0 31.3 40.2 49.8 59.1 65.1 64.0 56.8 46.9 38.3 26.7 Hartford 15.8 18.6 28.1 37.5 47.6 56.9 62.2 60.4 51.8 40.7 32.8 21.3 Harrisburg 21.2 23.3 32.0 41.2 51.1 60.6 65.6 64.3 56.5 44.6 36.1 26.1 Pittsburgh 18.5 20.3 29.8 38.8 48.4 56.9 61.6 60.2 53.5 42.3 34.1 24.4 Syracuse 14.2 15.4 25.1 35.5 46.0 53.8 59.0 57.7 51.4 41.1 33.0 21.1 Cleveland 17.6 19.3 28.2 37.3 47.3 56.8 61.4 60.3 54.2 43.5 35.0 24.5 Detroit 15.6 17.6 27.0 36.8 47.1 56.3 61.3 59.6 52.5 40.9 32.2 21.4 South Bend 16.1 18.7 29.1 38.7 48.8 58.6 63.0 61.1 53.7 42.8 33.4 22.3 Chicago 12.9 17.2 28.5 38.6 47.7 57.5 62.6 61.6 53.9 42.2 31.6 19.1 Des Moines 10.7 15.6 27.6 40.0 51.5 61.2 66.5 63.6 54.5 42.7 29.9 16.1 Lincoln 10.1 15.1 26.8 38.9 50.0 60.2 66.3 63.3 53.2 40.5 27.3 15.4 Denver 16.1 20.2 25.8 34.5 43.6 52.4 58.6 56.9 47.6 36.4 25.4 17.4 Elko 13.4 19.9 25.0 29.5 36.8 44.6 50.3 48.6 38.9 29.6 22.5 14.0 Salt Lake City 19.3 24.6 31.4 37.9 45.6 55.4 63.7 61.8 51.0 40.2 30.9 21.6 Boise 21.6 27.5 31.9 36.7 43.9 52.1 57.7 56.8 48.2 39.0 31.1 22.5 Burns 13.0 19.3 24.9 29.0 35.9 41.6 47.2 45.0 36.3 28.1 22.0 15.0 Spokane 20.8 25.9 29.6 34.7 41.9 49.2 54.4 54.3 45.8 36.0 28.8 21.7 Average 16.4 20.1 28.4 36.8 46.1 54.9 60.4 58.8 50.6 39.9 30.8 20.6

55
Zone 6 Jan Feb Mar Apr May June July Aug Sept Oct Nov Dec Portland 33.7 36.1 38.6 41.3 47.0 52.9 56.5 56.9 52.0 44.9 39.5 34.8 Concord 7.4 10.4 22.1 31.5 41.4 51.2 56.5 54.7 46.0 34.9 27.0 14.4 Burlington 7.5 8.9 22.0 34.2 45.4 54.6 59.7 57.9 48.8 38.6 29.6 15.5 Alpena 8.8 8.3 18.0 30.1 39.2 48.0 54.0 52.6 46.3 37.0 28.4 16.5 Green Bay 5.8 9.5 21.4 33.9 43.7 53.5 58.9 56.8 48.8 38.5 26.8 12.5 Minneapolis 2.8 9.2 22.7 36.2 47.6 57.6 63.1 60.3 50.3 38.8 25.2 10.2 Aberdeen -0.6 6.5 19.8 33.0 44.5 54.3 59.6 56.8 46.1 34.1 19.9 5.3 Bismarck -1.7 5.1 17.8 31.0 42.2 51.6 56.4 53.9 43.1 32.5 17.8 3.3 Sheridan 8.5 14.5 21.5 30.4 39.0 47.3 53.0 51.7 41.4 31.7 19.8 10.2 Billings 13.7 19.4 25.2 34.0 43.3 52.0 58.3 56.7 46.5 37.5 25.6 16.5 Missoula 15.4 20.9 24.9 30.9 37.9 46.1 50.1 49.2 40.4 31.3 24.2 16.4 Average 9.2 13.5 23.1 33.3 42.8 51.7 56.9 55.2 46.3 36.3 25.8 14.1
Zone 7 Jan Feb Mar Apr May June July Aug Sept Oct Nov Dec Caribou -1.6 0.7 14.9 29.0 40.1 49.1 54.5 52.1 43.2 34.4 23.7 5.5 Int'l Falls -10.0 -4.0 11.4 27.8 39.6 49.5 54.6 51.7 42.5 32.9 17.0 -2.2 Fargo -3.6 2.7 17.3 32.1 43.8 53.6 58.8 56.4 45.9 34.6 19.4 3.1 Williston -1.8 5.3 17.4 30.5 42.2 51.4 56.5 54.1 42.4 31.4 16.3 2.8 Anchorage 8.4 11.5 18.1 28.6 38.8 47.2 51.7 49.5 41.6 28.7 15.1 10.0 Average -1.7 3.2 15.8 29.6 40.9 50.2 55.2 52.8 43.1 32.4 18.3 3.8 Average 6&7 3.7 8.4 19.5 31.5 41.9 50.9 56.1 54.0 44.7 34.4 22.1 9.0
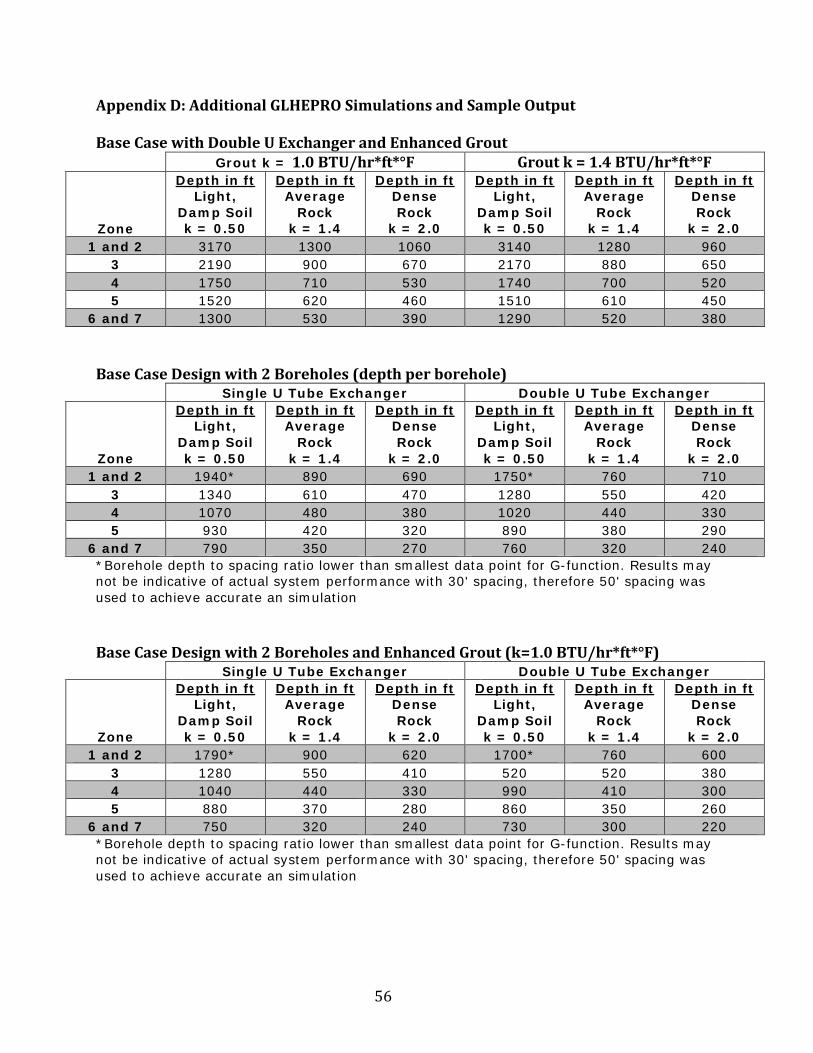
56
AppendixD:AdditionalGLHEPROSimulationsandSampleOutputBaseCasewithDoubleUExchangerandEnhancedGrout
Grout k = 1.0BTU/hr*ft*°F Groutk=1.4BTU/hr*ft*°F
Zone
Depth in ft Light,
Damp Soil k = 0.50
Depth in ft Average
Rock k = 1.4
Depth in ft Dense Rock
k = 2.0
Depth in ft Light,
Damp Soil k = 0.50
Depth in ft Average
Rock k = 1.4
Depth in ft Dense Rock
k = 2.0 1 and 2 3170 1300 1060 3140 1280 960
3 2190 900 670 2170 880 650 4 1750 710 530 1740 700 520 5 1520 620 460 1510 610 450
6 and 7 1300 530 390 1290 520 380 BaseCaseDesignwith2Boreholes(depthperborehole)
Single U Tube Exchanger Double U Tube Exchanger
Zone
Depth in ft Light,
Damp Soil k = 0.50
Depth in ft Average
Rock k = 1.4
Depth in ft Dense Rock
k = 2.0
Depth in ft Light,
Damp Soil k = 0.50
Depth in ft Average
Rock k = 1.4
Depth in ft Dense Rock
k = 2.0 1 and 2 1940* 890 690 1750* 760 710
3 1340 610 470 1280 550 420 4 1070 480 380 1020 440 330 5 930 420 320 890 380 290
6 and 7 790 350 270 760 320 240 *Borehole depth to spacing ratio lower than smallest data point for G-function. Results may not be indicative of actual system performance with 30' spacing, therefore 50' spacing was used to achieve accurate an simulation BaseCaseDesignwith2BoreholesandEnhancedGrout(k=1.0BTU/hr*ft*°F)
Single U Tube Exchanger Double U Tube Exchanger
Zone
Depth in ft Light,
Damp Soil k = 0.50
Depth in ft Average
Rock k = 1.4
Depth in ft Dense Rock
k = 2.0
Depth in ft Light,
Damp Soil k = 0.50
Depth in ft Average
Rock k = 1.4
Depth in ft Dense Rock
k = 2.0 1 and 2 1790* 900 620 1700* 760 600
3 1280 550 410 520 520 380 4 1040 440 330 990 410 300 5 880 370 280 860 350 260
6 and 7 750 320 240 730 300 220 *Borehole depth to spacing ratio lower than smallest data point for G-function. Results may not be indicative of actual system performance with 30' spacing, therefore 50' spacing was used to achieve accurate an simulation
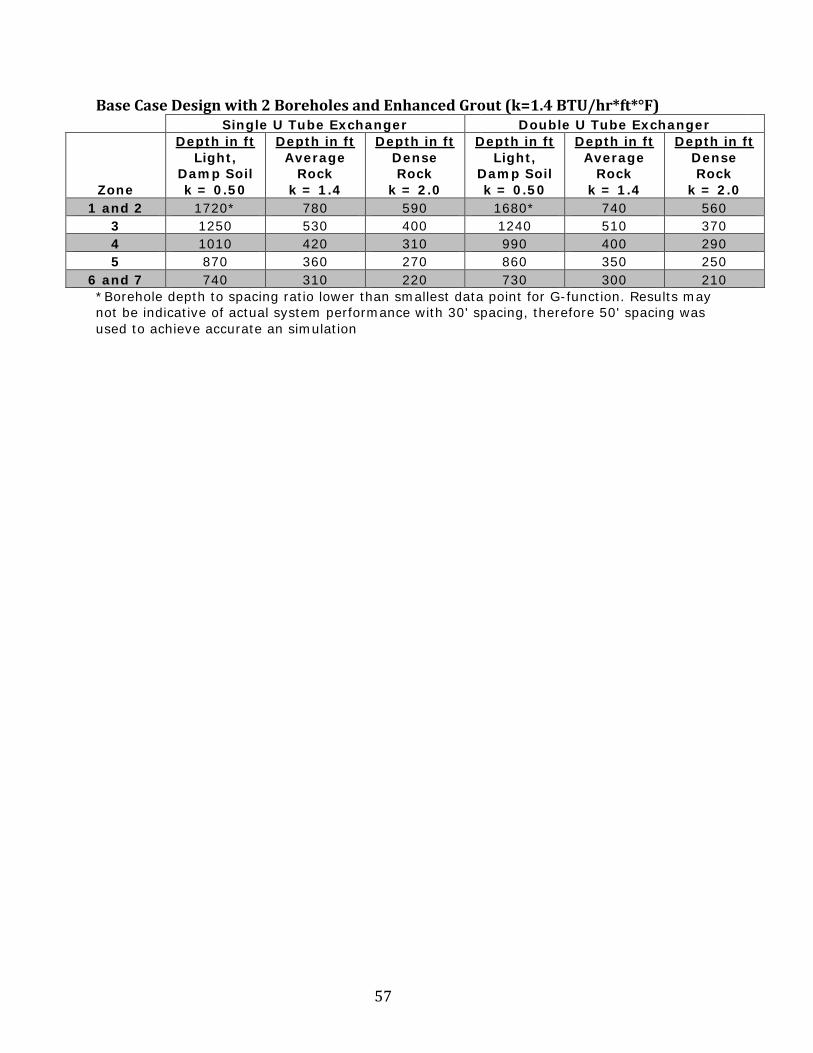
57
BaseCaseDesignwith2BoreholesandEnhancedGrout(k=1.4BTU/hr*ft*°F) Single U Tube Exchanger Double U Tube Exchanger
Zone
Depth in ft Light,
Damp Soil k = 0.50
Depth in ft Average
Rock k = 1.4
Depth in ft Dense Rock
k = 2.0
Depth in ft Light,
Damp Soil k = 0.50
Depth in ft Average
Rock k = 1.4
Depth in ft Dense Rock
k = 2.0 1 and 2 1720* 780 590 1680* 740 560
3 1250 530 400 1240 510 370 4 1010 420 310 990 400 290 5 870 360 270 860 350 250
6 and 7 740 310 220 730 300 210 *Borehole depth to spacing ratio lower than smallest data point for G-function. Results may not be indicative of actual system performance with 30' spacing, therefore 50' spacing was used to achieve accurate an simulation

58
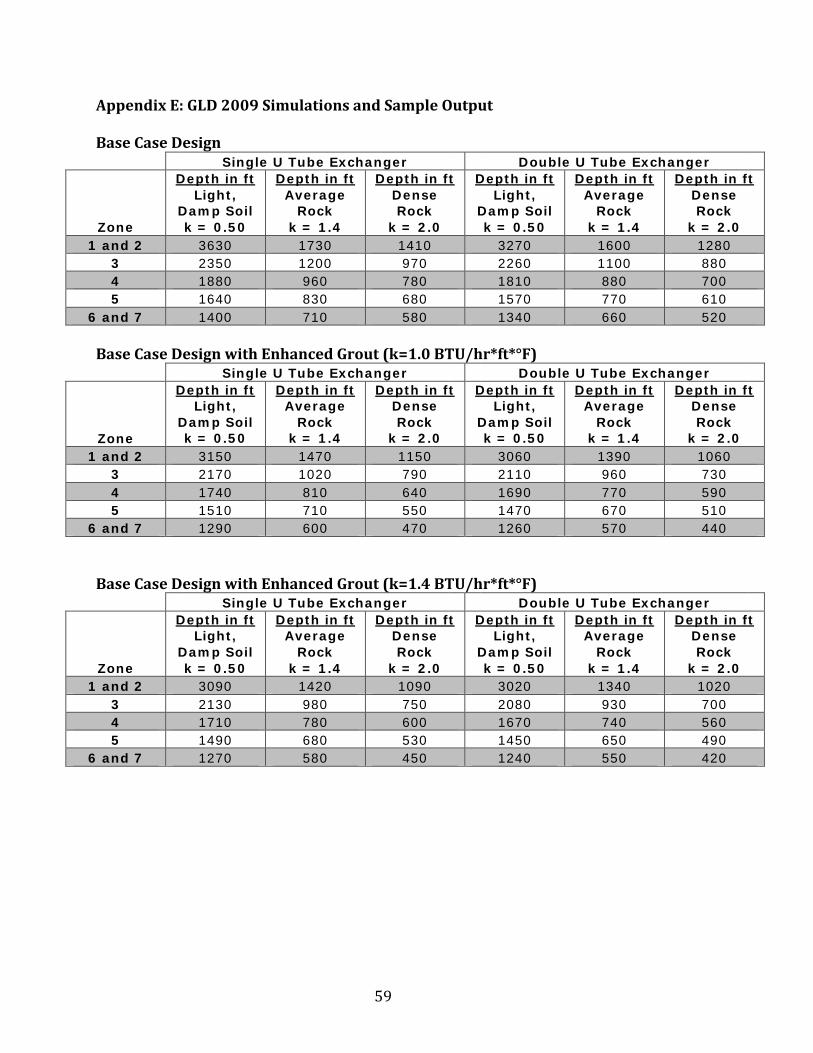
59
AppendixE:GLD2009SimulationsandSampleOutputBaseCaseDesign
Single U Tube Exchanger Double U Tube Exchanger
Zone
Depth in ft Light,
Damp Soil k = 0.50
Depth in ft Average
Rock k = 1.4
Depth in ft Dense Rock
k = 2.0
Depth in ft Light,
Damp Soil k = 0.50
Depth in ft Average
Rock k = 1.4
Depth in ft Dense Rock
k = 2.0 1 and 2 3630 1730 1410 3270 1600 1280
3 2350 1200 970 2260 1100 880 4 1880 960 780 1810 880 700 5 1640 830 680 1570 770 610
6 and 7 1400 710 580 1340 660 520 BaseCaseDesignwithEnhancedGrout(k=1.0BTU/hr*ft*°F)
Single U Tube Exchanger Double U Tube Exchanger
Zone
Depth in ft Light,
Damp Soil k = 0.50
Depth in ft Average
Rock k = 1.4
Depth in ft Dense Rock
k = 2.0
Depth in ft Light,
Damp Soil k = 0.50
Depth in ft Average
Rock k = 1.4
Depth in ft Dense Rock
k = 2.0 1 and 2 3150 1470 1150 3060 1390 1060
3 2170 1020 790 2110 960 730 4 1740 810 640 1690 770 590 5 1510 710 550 1470 670 510
6 and 7 1290 600 470 1260 570 440 BaseCaseDesignwithEnhancedGrout(k=1.4BTU/hr*ft*°F)
Single U Tube Exchanger Double U Tube Exchanger
Zone
Depth in ft Light,
Damp Soil k = 0.50
Depth in ft Average
Rock k = 1.4
Depth in ft Dense Rock
k = 2.0
Depth in ft Light,
Damp Soil k = 0.50
Depth in ft Average
Rock k = 1.4
Depth in ft Dense Rock
k = 2.0 1 and 2 3090 1420 1090 3020 1340 1020
3 2130 980 750 2080 930 700 4 1710 780 600 1670 740 560 5 1490 680 530 1450 650 490
6 and 7 1270 580 450 1240 550 420

60
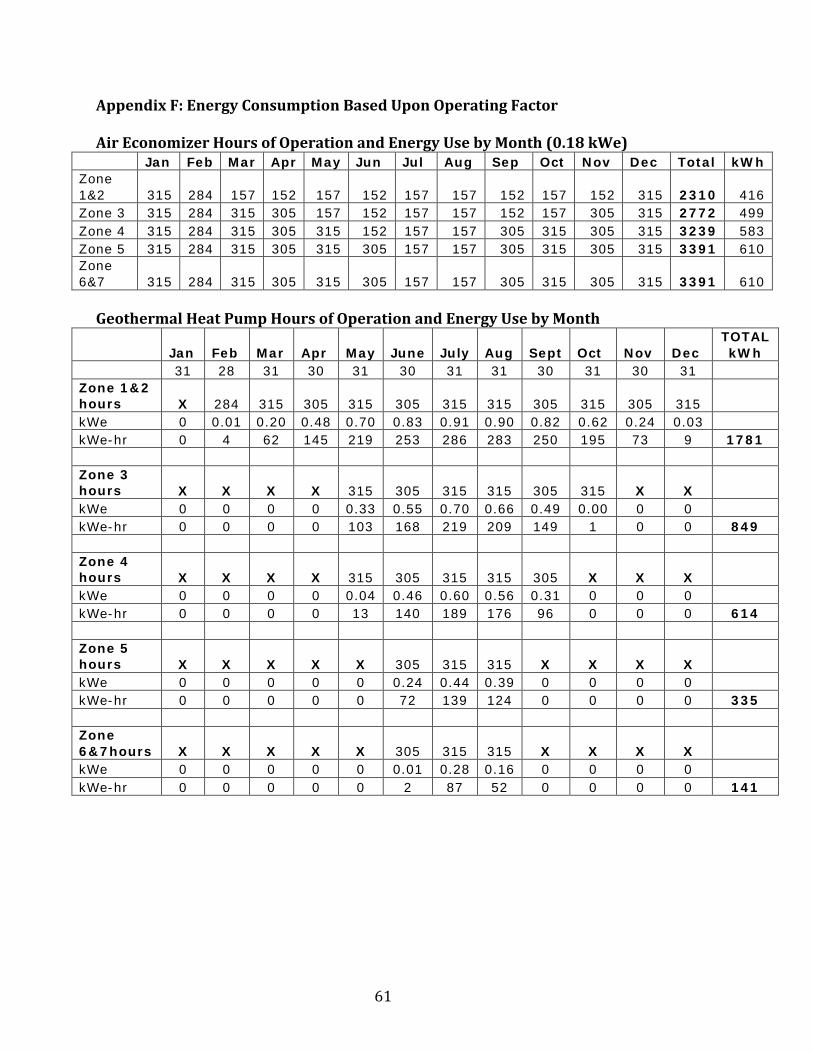
61
AppendixF:EnergyConsumptionBasedUponOperatingFactorAirEconomizerHoursofOperationandEnergyUsebyMonth(0.18kWe)
Jan Feb Mar Apr May Jun Jul Aug Sep Oct Nov Dec Total kWh Zone 1&2 315 284 157 152 157 152 157 157 152 157 152 315 2310 416 Zone 3 315 284 315 305 157 152 157 157 152 157 305 315 2772 499 Zone 4 315 284 315 305 315 152 157 157 305 315 305 315 3239 583 Zone 5 315 284 315 305 315 305 157 157 305 315 305 315 3391 610 Zone 6&7 315 284 315 305 315 305 157 157 305 315 305 315 3391 610 GeothermalHeatPumpHoursofOperationandEnergyUsebyMonth
Jan Feb Mar Apr May June July Aug Sept Oct Nov Dec TOTAL kWh
31 28 31 30 31 30 31 31 30 31 30 31 Zone 1&2 hours X 284 315 305 315 305 315 315 305 315 305 315 kWe 0 0.01 0.20 0.48 0.70 0.83 0.91 0.90 0.82 0.62 0.24 0.03 kWe-hr 0 4 62 145 219 253 286 283 250 195 73 9 1781 Zone 3 hours X X X X 315 305 315 315 305 315 X X kWe 0 0 0 0 0.33 0.55 0.70 0.66 0.49 0.00 0 0 kWe-hr 0 0 0 0 103 168 219 209 149 1 0 0 849 Zone 4 hours X X X X 315 305 315 315 305 X X X kWe 0 0 0 0 0.04 0.46 0.60 0.56 0.31 0 0 0 kWe-hr 0 0 0 0 13 140 189 176 96 0 0 0 614 Zone 5 hours X X X X X 305 315 315 X X X X kWe 0 0 0 0 0 0.24 0.44 0.39 0 0 0 0 kWe-hr 0 0 0 0 0 72 139 124 0 0 0 0 335 Zone 6&7hours X X X X X 305 315 315 X X X X kWe 0 0 0 0 0 0.01 0.28 0.16 0 0 0 0 kWe-hr 0 0 0 0 0 2 87 52 0 0 0 0 141

62
AirConditionerHoursofOperationandEnergyUsebyMonth
Jan Feb Mar Apr May June July Aug Sept Oct Nov Dec TOTAL kWh
31 28 31 30 31 30 31 31 30 31 30 31 Zone 1&2 hours X 284 315 305 315 305 315 315 305 315 305 315 kWe 0 0.04 0.57 1.38 2.01 2.40 2.62 2.60 2.37 1.79 0.69 0.08 kWe-hr 0 11 180 419 634 732 826 819 723 565 211 26 5146 Zone 3 hours X X X X 315 305 315 315 305 315 X X kWe 0 0 0 0 0.94 1.60 2.01 1.92 1.41 0.01 0 0 kWe-hr 0 0 0 0 297 486 633 604 430 3 0 0 2453 Zone 4 hours X X X X 315 305 315 315 305 X X X kWe 0 0 0 0 0.12 1.32 1.73 1.62 0.91 0 0 0 kWe-hr 0 0 0 0 39 403 545 510 276 0 0 0 1773 Zone 5 hours X X X X X 305 315 315 X X X X kWe 0 0 0 0 0 0.68 1.28 1.13 0 0 0 0 kWe-hr 0 0 0 0 0 209 402 357 0 0 0 0 967 Zone 6&7hours X X X X X 305 315 315 X X X X kWe 0 0 0 0 0 0.02 0.80 0.48 0 0 0 0 kWe-hr 0 0 0 0 0 6 252 150 0 0 0 0 408
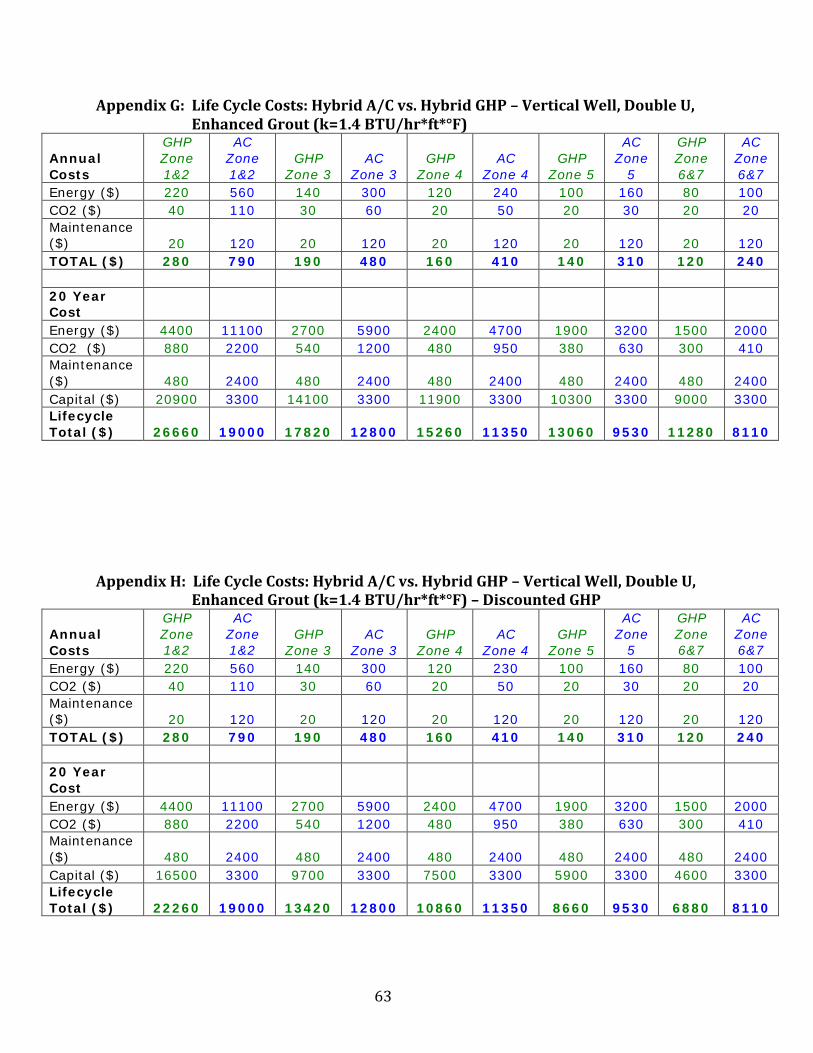
63
AppendixG:LifeCycleCosts:HybridA/Cvs.HybridGHP–VerticalWell,DoubleU,EnhancedGrout(k=1.4BTU/hr*ft*°F)
Annual Costs
GHP Zone 1&2
AC Zone 1&2
GHP Zone 3
AC Zone 3
GHP Zone 4
AC Zone 4
GHP Zone 5
AC Zone
5
GHP Zone 6&7
AC Zone 6&7
Energy ($) 220 560 140 300 120 240 100 160 80 100 CO2 ($) 40 110 30 60 20 50 20 30 20 20 Maintenance ($) 20 120 20 120 20 120 20 120 20 120 TOTAL ($) 280 790 190 480 160 410 140 310 120 240 20 Year Cost Energy ($) 4400 11100 2700 5900 2400 4700 1900 3200 1500 2000 CO2 ($) 880 2200 540 1200 480 950 380 630 300 410 Maintenance ($) 480 2400 480 2400 480 2400 480 2400 480 2400 Capital ($) 20900 3300 14100 3300 11900 3300 10300 3300 9000 3300 Lifecycle Total ($) 26660 19000 17820 12800 15260 11350 13060 9530 11280 8110
AppendixH:LifeCycleCosts:HybridA/Cvs.HybridGHP–VerticalWell,DoubleU,
EnhancedGrout(k=1.4BTU/hr*ft*°F)–DiscountedGHP
Annual Costs
GHP Zone 1&2
AC Zone 1&2
GHP Zone 3
AC Zone 3
GHP Zone 4
AC Zone 4
GHP Zone 5
AC Zone
5
GHP Zone 6&7
AC Zone 6&7
Energy ($) 220 560 140 300 120 230 100 160 80 100 CO2 ($) 40 110 30 60 20 50 20 30 20 20 Maintenance ($) 20 120 20 120 20 120 20 120 20 120 TOTAL ($) 280 790 190 480 160 410 140 310 120 240 20 Year Cost Energy ($) 4400 11100 2700 5900 2400 4700 1900 3200 1500 2000 CO2 ($) 880 2200 540 1200 480 950 380 630 300 410 Maintenance ($) 480 2400 480 2400 480 2400 480 2400 480 2400 Capital ($) 16500 3300 9700 3300 7500 3300 5900 3300 4600 3300 Lifecycle Total ($) 22260 19000 13420 12800 10860 11350 8660 9530 6880 8110