Using the National Student Clearinghouse for Statewide Collaboration
28
Using the National Student Clearinghouse for Statewide Collaboration SHEEO/NCES Network Conference Washington, DC (May 2012) Braden J. Hosch, Ph.D. SHEEO State Data Conference
Transcript of Using the National Student Clearinghouse for Statewide Collaboration

Using the National Student Clearinghouse for Statewide CollaborationSHEEO/NCES Network ConferenceWashington, DC (May 2012)
Braden J. Hosch, Ph.D. SHEE
O St
ate
Data
Co
nfer
ence

Overview•The problem, solution, and initial outcomes
•Project scope, approach, and use of the National Student Clearinghouse
•Validity and findings
•Conclusions
SHEE
O St
ate
Data
Co
nfer
ence
2

The Problems•Levels of educational attainment in Connecticut are slipping
•When students arrive at college, they lack important skills SH
EEO
Stat
e Da
ta
Conf
eren
ce
3
•Misalignment between secondary and postsecondary systems.

Educational Attainment2006-10 2000 Change
Pct Rank Pct Rank Pct Rank Δ
RankMassachusetts 54.1% 1 49.2
% 1 4.9% 17 0
New York 49.4% 2 42.3% 6 7.2% 1 4
Minnesota 49.3% 3 45.2% 2 4.1% 27 -1
North Dakota 48.5% 4 43.8
% 3 5.1% 14 -1
New Jersey 46.9% 5 41.3% 7 5.6% 6 2
New Hampshire 46.6% 6 40.9
% 9 5.7% 5 3
Connecticut 45.9% 7 42.5
% 4 3.4% 37 -3
Maryland 45.3% 8 40.3% 10 5.5% 8 2
Iowa 45.0% 9 39.0% 14 6.0% 3 4
Virginia 44.8% 10 39.3% 13 5.5% 9 4
4
SHEE
O St
ate
Data
Co
nfer
ence
Percent of 25-34 year olds with Associate’s Degree or Higher
Sources: U.S. Census 2000 and American Community Survey 5-Year Estimates 2006-10.

Remediation for Entering College StudentsStudents Entering College from HS Needing Remedial Coursework
5
2007 2008 2009 20100%20%40%60%80%100%
79.5
%
80.8
%
72.2
%
73.6
%
31.6% 29.3% 21.6
%
19.6%
Community Colleges*An additional 37-43% of entering state university students need “developmental” coursework which counts for credit but does not fulfill general education requirements. Data Sources: Connecticut Community Colleges and Connecticut State Universities
SHEE
O St
ate
Data
Co
nfer
ence
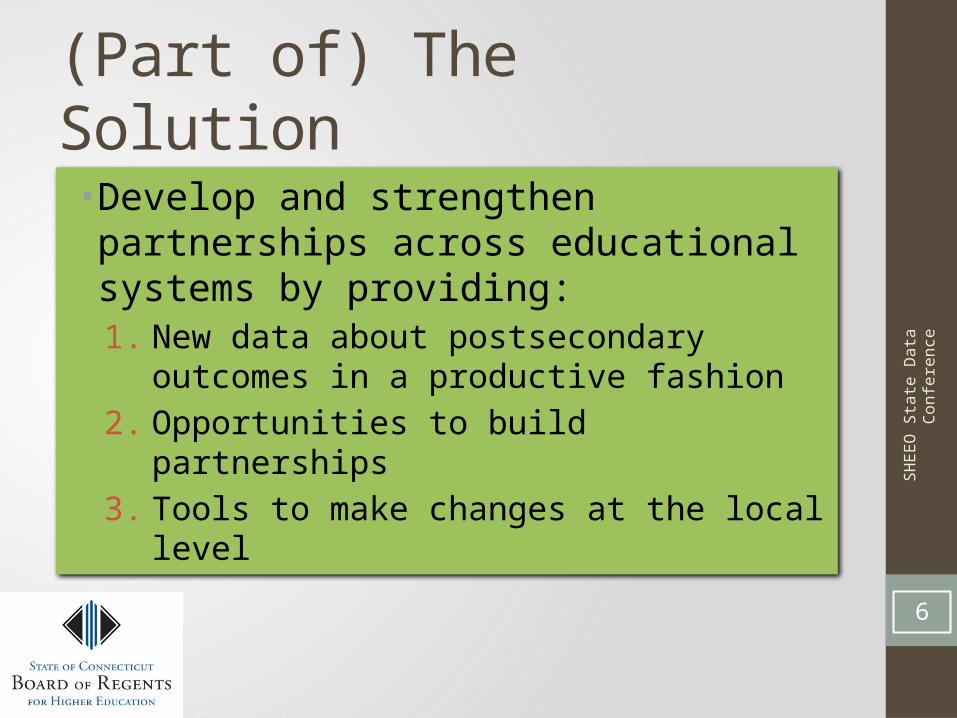
(Part of) The Solution
6
•Develop and strengthen partnerships across educational systems by providing:1. New data about postsecondary
outcomes in a productive fashion2. Opportunities to build
partnerships3. Tools to make changes at the local
level
SHEE
O St
ate
Data
Co
nfer
ence
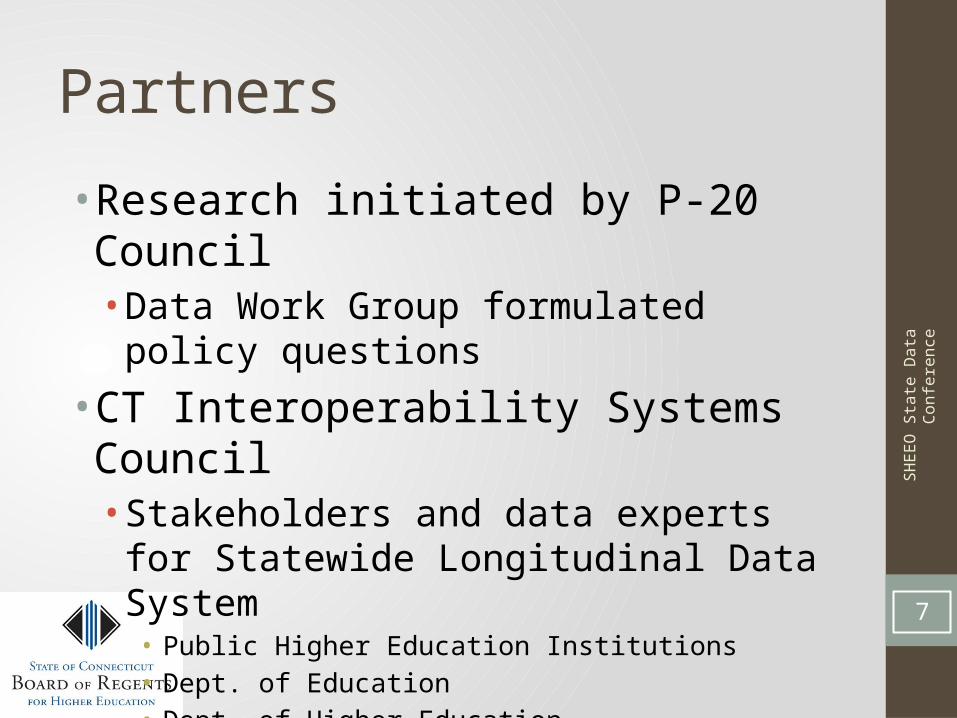
Partners•Research initiated by P-20 Council•Data Work Group formulated policy questions
•CT Interoperability Systems Council•Stakeholders and data experts for Statewide Longitudinal Data System• Public Higher Education Institutions• Dept. of Education• Dept. of Higher Education• Dept. of Labor
7
SHEE
O St
ate
Data
Co
nfer
ence

Initial Outcomes•Connecticut College and Career Readiness Toolkit•Three regionalized workshops for leadership of schools and colleges•High school-specific data shared
•45% of school districts participated (representing ~300,000 students)
•100% of public colleges and universities (representing ~125,000 student)
8
SHEE
O St
ate
Data
Co
nfer
ence

Foundational Higher Ed. Data•Remediation rates for students entering public institutions, by high school•From the National Student Clearinghouse for the CT public high school class of 2004 by high school:•Completion of first credential degree or certificate (any institution)
•Postsecondary enrollment rates (first fall and anytime)
9
SHEE
O St
ate
Data
Co
nfer
ence

Scope of Project Using NSC•Determine postsecondary outcomes of public high school class of 2004 for•Degree/Certificate completions•Postsecondary enrollments•Did not limit only to Connecticut
10
SHEE
O St
ate
Data
Co
nfer
ence

Method (1)•Connecticut Dept. of Education•Entered into agreement with the NSC:
•Submitted classes of 2003 through 2009 to NSC for postsecondary enrollment and completions
•Removed personally identifiable info from returned records
•Sent data files to CT. Dept. of Higher Ed./Board of Regents for analysis.
11
SHEE
O St
ate
Data
Co
nfer
ence

Method (2)•Connecticut Department of Higher Education / Board of Regents for Higher Education•Conducted initial analysis•Cleaned data using SPSS•Developed analytical principles based on project scope and NSC reporting practices in consultation w/ Depts. of Education and Labor
•Produced high school reports•Produced analytical population level report
12
SHEE
O St
ate
Data
Co
nfer
ence

Analytical Principles•Always counted each individual only once, even if multiple records appeared in the NSC data file•Developed rules for reporting hierarchy for enrollment status and completions:•Fall enrollment•Enrollment in a given year•Enrollment during any time through 8/31/10•Completion of first postsecondary credential. 13
SHEE
O St
ate
Data
Co
nfer
ence

Example Criteria•Students were counted as enrolled in a fall term if:•Enrollment status was full-time, half-time, less-than half-time or null
•Enrollment period• Began on or before 10/1• Ended on or after 10/1
•Term duration ≥ 10 days14
SHEE
O St
ate
Data
Co
nfer
ence

Data Set and Record Cleaning Enrollme
ntFall 2004
Any enrollmentAug 2004-Aug 2010
FirstCompletion
Total records in 2004 NSC data set
250,037 250,037 250,037
Total unduplicated individuals
35,671
35,671
35,671
Total records meeting enrollment or completion criteria
22,072
211,179 14,727
Total unduplicated individuals meeting enrollment criteria or first completion criteria
20,467
26,220
14,727
15
Number of Records and Individuals in Connecticut NSC Data File for Class of 2004
SHEE
O St
ate
Data
Co
nfer
ence

NSC Technical Limitations•Suppressed enrollment data•Institutional participation changes over time•Incomplete academic history•Matching issues•Identification of high school graduates•Lag time in outcomes•Complicated data set 16
SHEE
O St
ate
Data
Co
nfer
ence

Other Limitations•Multi-agency collaboration and FERPA•Competing sources for data•Change is hard
IPED
S Up
date
201
1
17

Validity Check – Enrollment: IPEDS College-Going Rate - CT
18
55%
60%
65%
70%
75%IPEDS CT college-going rate (includ...
Fall
Percent of HS Students
Enrolling in College
During Fall Following
High School Graduation
Error bars represent the range between NSC estimates (bottom error bar) and ED540 estimates (top error bar) for postsecondary enrollment.
Data sources: IPEDS Fall Enrollment Survey (data for odd-numbered years interpolated as the average of surrounding years; National Student Clearinghouse & CT Dept. of Education.
SHEE
O St
ate
Data
Co
nfer
ence

Validity Check – Completions4-Year Institution Grad Rates
19
0%
20%
40%
60%
80%
100%
IPEDS completion rate in 6-Years
Same Institution 6-Year Completion Rate
Bachelor’s Degree / Higher Completed at any institution in 6 years
Any Completion at any institution in 6 Years
IPEDS GRS 150% Graduation Rate Compared to NSC Completion Rates
Data are limited only to students entering college in Fall 2004* Includes regional campuses.
SHEE
O St
ate
Data
Co
nfer
ence

Validity Check – Completions2-Year Institution Grad Rates
Highest Performing
Lowest Performing
CT Community College Avg
0%30%60%90% IPEDS completion
rate in 3 YearsSame Institution 3-Year Completion RateCompletion of any Credential at any institution in 3 years 150%Any Completion at any institution in 6 Years
20
Data are limited only to students entering college in Fall 2004
IPEDS GRS 150% Graduation Rate Compared to NSC Completion Rates
SHEE
O St
ate
Data
Co
nfer
ence

Findings (1)•41% of the public high school class of 2004 completed at least one degree or certificate before September 2010. •Half of these (20%) completed awards in-state:• 13% at public 4-year institutions• 4% at public 2-year institutions, and • 3% at private 4-year institutions.
•Half (20%) completed awards out-of-state:• 15% at private 4-year institutions and • 5% at public 4-year institutions.
21
SHEE
O St
ate
Data
Co
nfer
ence

Findings (2)•41% of the public high school class of 2004 completed at least one degree or certificate before September 2010.•33% enrolled at a college or university but did not complete a credential.•26% did not enroll in a collegiate institution during those six years.
22
SHEE
O St
ate
Data
Co
nfer
ence

Pathways to Completion
23
SHEE
O St
ate
Data
Co
nfer
ence

Conclusions•Data are necessary but not sufficient to advance a change agenda•NSC provides a valuable•Means to deliver information about postsecondary outcomes back to high schools
•Supplement to state longitudinal data systems because of national scope
•Platform for future research •Simple steps can be taken to promote better data sharing and alignment 24
SHEE
O St
ate
Data
Co
nfer
ence

Postscript•Since Fall 2011•Four new college / high school partnerships have been launched, including data sharing agreements
•Legislation pending to•Require alignment between HS and college curriculum following Common Core State Standards
•Use research-based remediation models •Initiative among 17 out of 18 public higher education institutions to capture and use high school transcript data for placement
SHEE
O St
ate
Data
Co
nfer
ence
25

Resources•http://www.ctregents.org/policy/p20•Connecticut College and Career Readiness Toolkit
•High School Reports •Recorded Webinars on High School Data
•Full Statewide Report•Background Information 26
SHEE
O St
ate
Data
Co
nfer
ence

Acknowledgments
IPED
S Up
date
201
1
27
Connecticut Board of Regents for Higher Education
Connecticut Department of Education
Jan KiehneSenior Consultant
Chuck MartieEducation Consultant
Malia SieveAssociate Director and P-20 Council Manager
Sarah EllsworthFmr. Bureau Chief for Data Collection, Research and Evaluation
Barbara BeaudinAssociate Commissioner, Division of Assessment and Accountability

Contact Information
Braden J. HoschCT Board of Regents for Higher [email protected]
28
IPED
S Up
date
201
1