Creative design of the Lotus bicycle: implications for knowledge support systems research
2
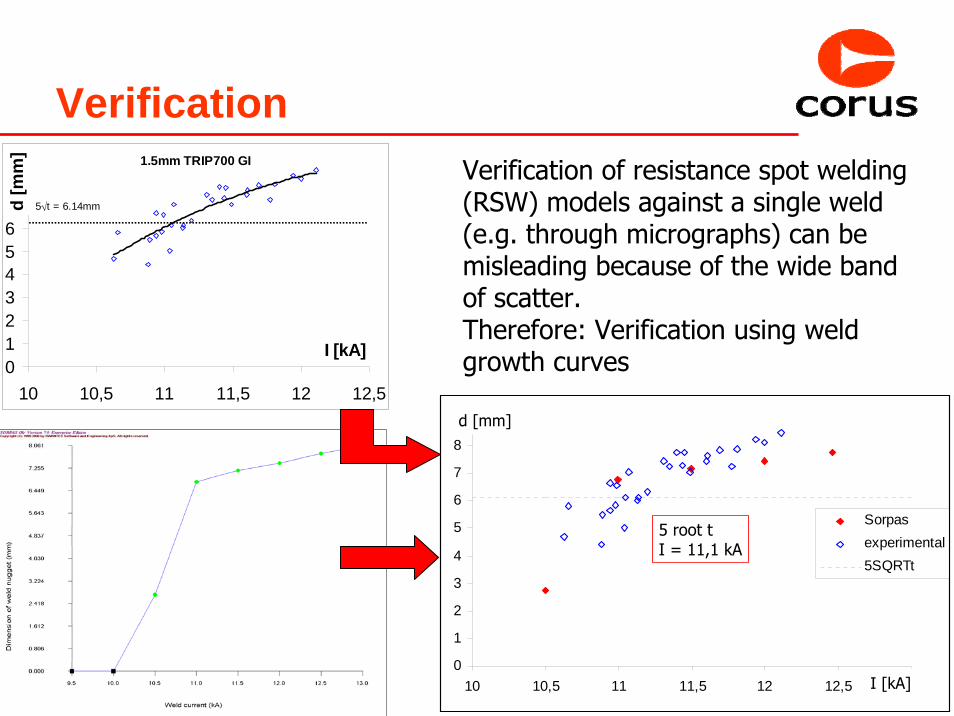
VerificationVerification of resistance spot welding (RSW) models against a single weld(e.g. through micrographs) can be misleading because of the wide band of scatter.Therefore: Verification using weld growth curves
0
1
2
3
4
5
6
7
8
9
10 10,5 11 11,5 12 12,5 13
Sorpasexperimental5SQRTt
5 root tI = 11,1 kA
1.5mm TRIP700 GI
0123456789
10 10,5 11 11,5 12 12,5
I [kA]
d [m
m]
5√t = 6.14mm
I [kA]
d [mm]
3
Weldability
Weldability:1. process
Can welds actually be made?2. quality
How do the welds perform?
4
Weldability
Process: Can welds actually be made?
1. process windowWhen the material parameters have been verified (against experimental results), it is found that Sorpas is a very useful tool to examine process window and parameter settings.
– optimisation (5√t)– weld growth curves– welding lobes
2. process parametersSorpas can also be used to establish the influence of process parameters.
– surface contamination– electrode geometry
5
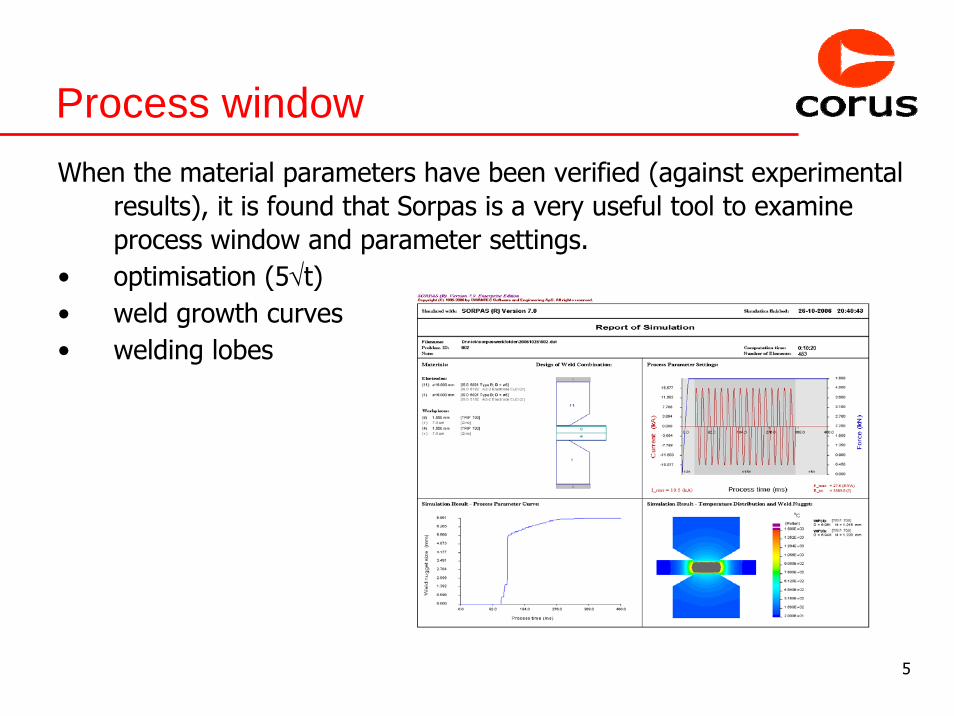
Process windowWhen the material parameters have been verified (against experimental
results), it is found that Sorpas is a very useful tool to examine process window and parameter settings.
• optimisation (5√t)• weld growth curves• welding lobes
6
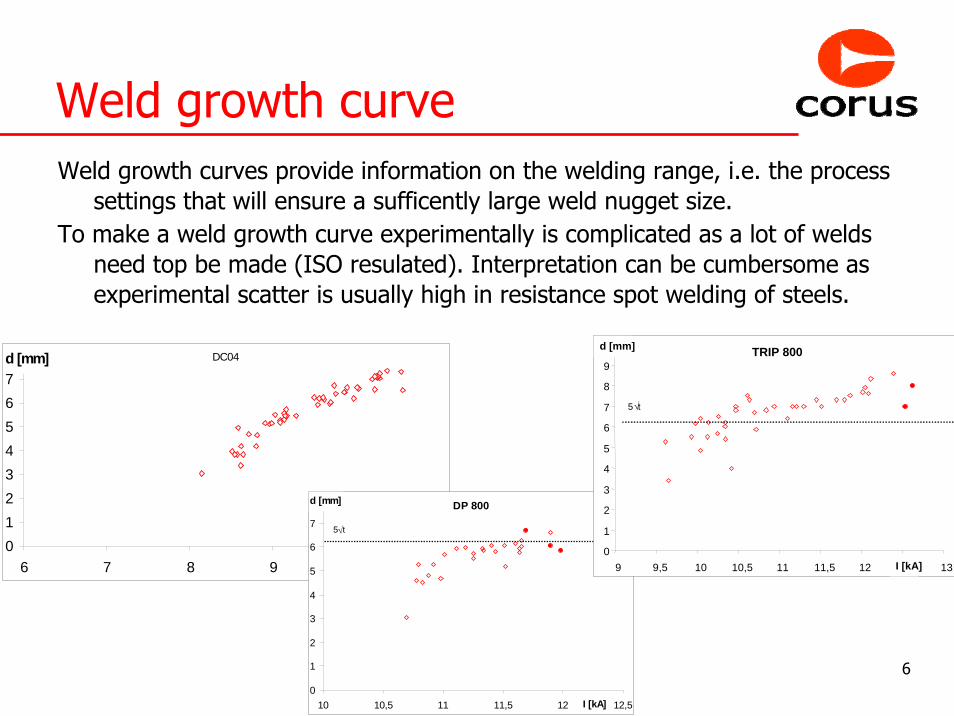
Weld growth curveWeld growth curves provide information on the welding range, i.e. the process
settings that will ensure a sufficently large weld nugget size.To make a weld growth curve experimentally is complicated as a lot of welds
need top be made (ISO resulated). Interpretation can be cumbersome as experimental scatter is usually high in resistance spot welding of steels.
DC04
012345678
6 7 8 9 10 11I [kA]
d [mm]
DP 800
0
1
2
3
4
5
6
7
8
10 10,5 11 11,5 12 12,5I [kA]
d [mm]
5√t
TRIP 800
0
1
2
3
4
5
6
7
8
9
10
9 9,5 10 10,5 11 11,5 12 12,5 13I [kA]
d [mm]
5√t
7
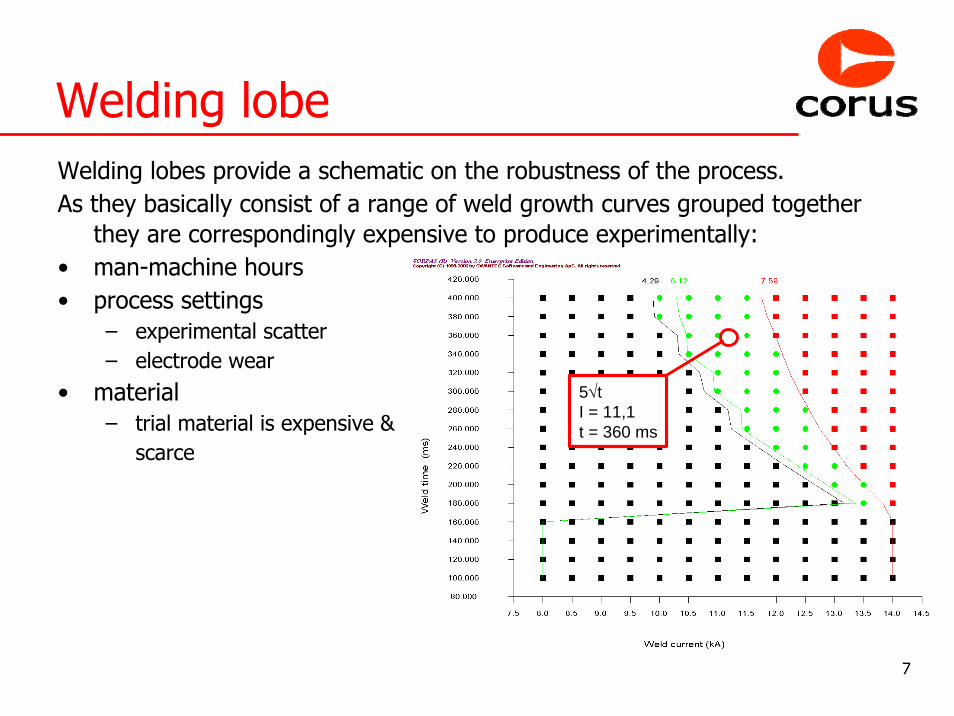
Welding lobeWelding lobes provide a schematic on the robustness of the process.As they basically consist of a range of weld growth curves grouped together
they are correspondingly expensive to produce experimentally:• man-machine hours• process settings
– experimental scatter– electrode wear
• material– trial material is expensive &
scarce
5√tI = 11,1t = 360 ms
5√tI = 11,1t = 360 ms
8
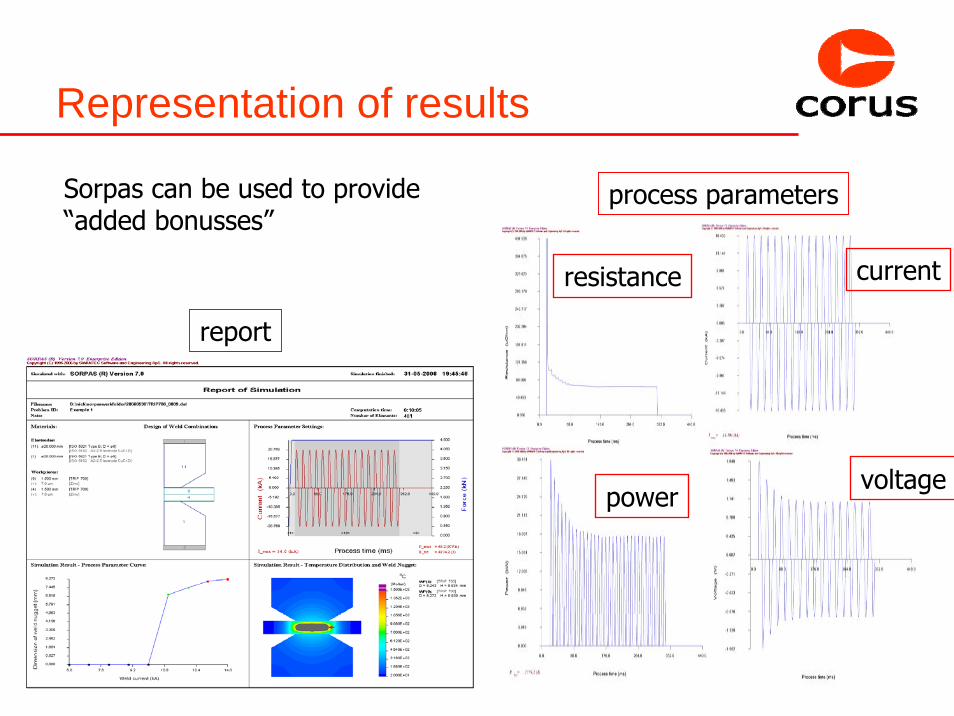
Representation of results
resistance
powervoltage
current
process parameters
report
Sorpas can be used to provide “added bonusses”
9
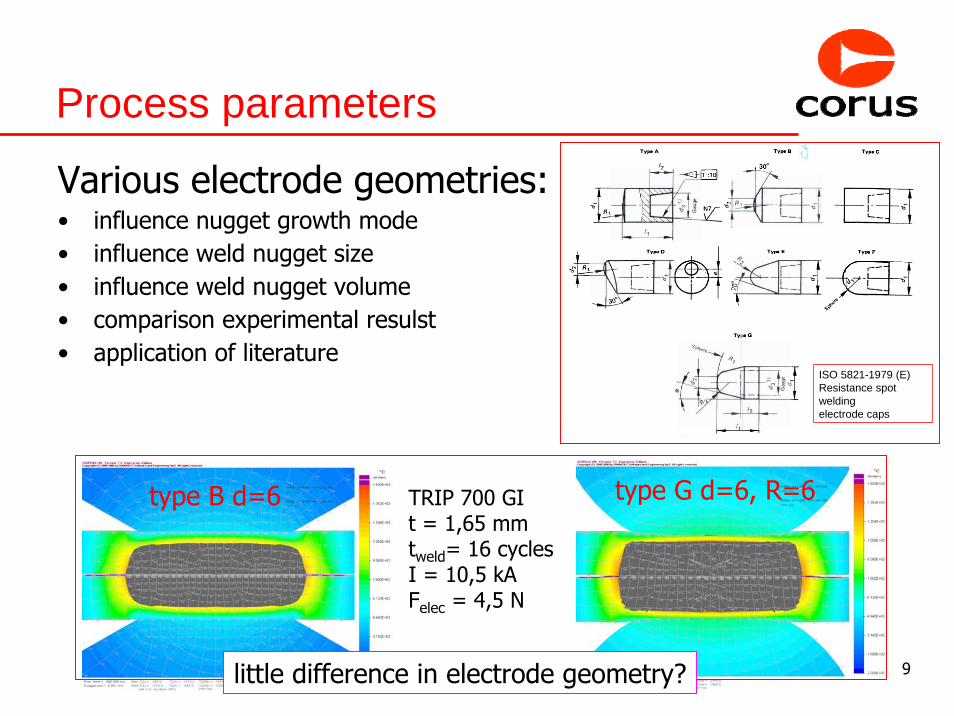
Process parameters
Various electrode geometries:• influence nugget growth mode• influence weld nugget size• influence weld nugget volume• comparison experimental resulst• application of literature
ISO 5821-1979 (E)Resistance spot welding electrode caps
TRIP 700 GIt = 1,65 mmtweld= 16 cyclesI = 10,5 kAFelec = 4,5 N
type G d=6, R=6type B d=6
little difference in electrode geometry?
10
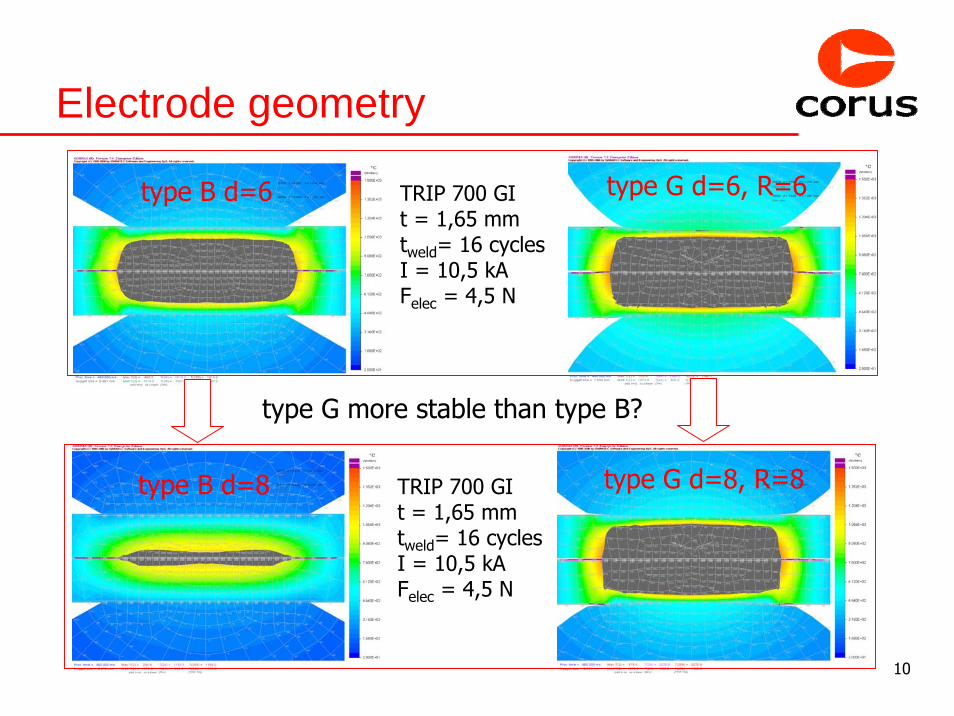
Electrode geometry
TRIP 700 GIt = 1,65 mmtweld= 16 cyclesI = 10,5 kAFelec = 4,5 N
type G d=6, R=6type B d=6
TRIP 700 GIt = 1,65 mmtweld= 16 cyclesI = 10,5 kAFelec = 4,5 N
type G d=8, R=8type B d=8
type G more stable than type B?
11
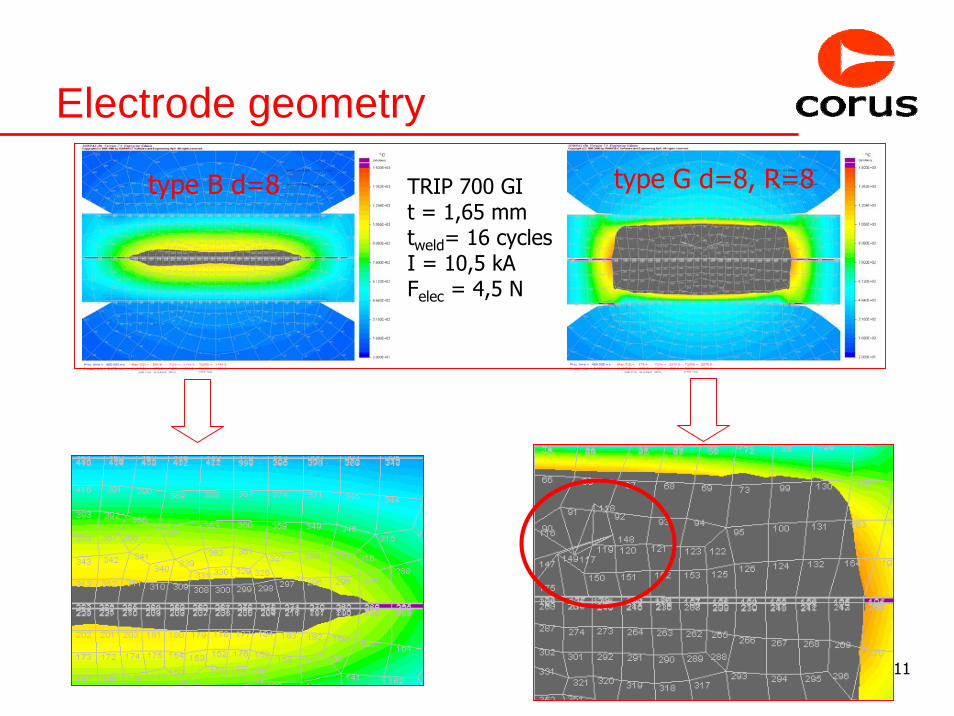
Electrode geometry
TRIP 700 GIt = 1,65 mmtweld= 16 cyclesI = 10,5 kAFelec = 4,5 N
type G d=8, R=8type B d=8
12
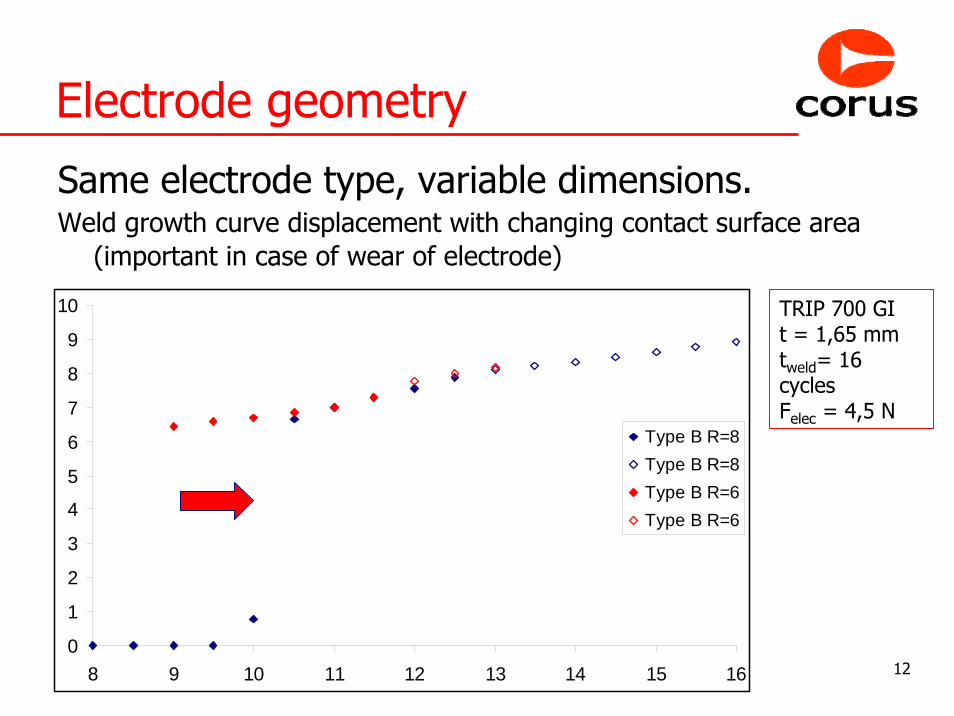
Electrode geometry
Same electrode type, variable dimensions.Weld growth curve displacement with changing contact surface area
(important in case of wear of electrode)
0
1
2
3
4
5
6
7
8
9
10
8 9 10 11 12 13 14 15 16
Type B R=8Type B R=8Type B R=6Type B R=6
TRIP 700 GIt = 1,65 mmtweld= 16 cyclesFelec = 4,5 N
13
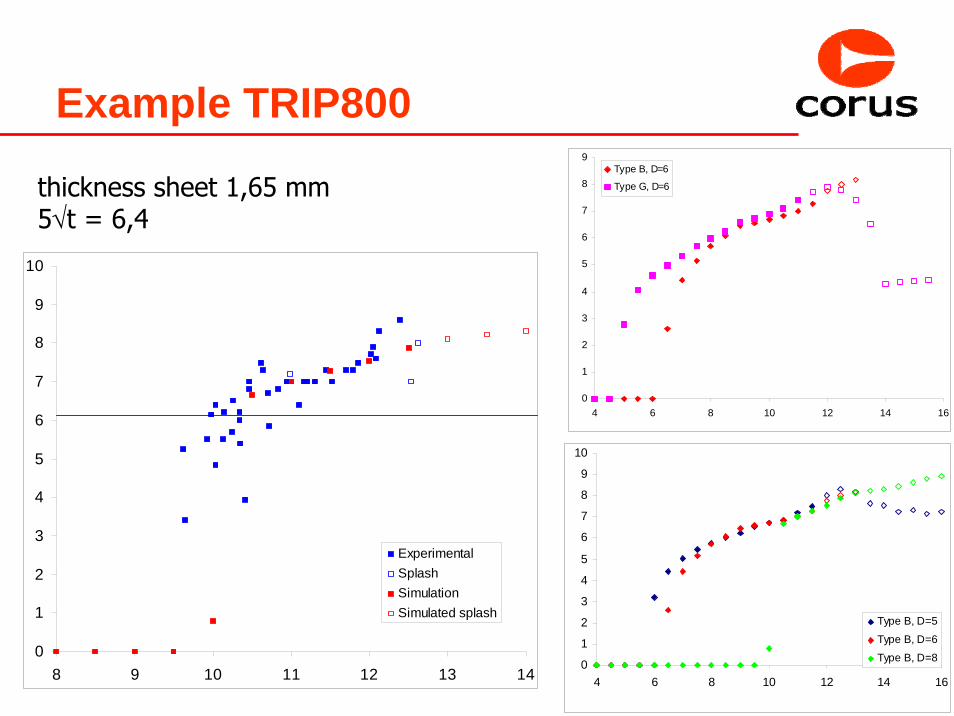
Example TRIP800
0
1
2
3
4
5
6
7
8
9
10
8 9 10 11 12 13 14
ExperimentalSplashSimulationSimulated splash
0
1
2
3
4
5
6
7
8
9
4 6 8 10 12 14 16
Type B, D=6
Type G, D=6
0
1
2
3
4
5
6
7
8
9
10
4 6 8 10 12 14 16
Type B, D=5
Type B, D=6
Type B, D=8
thickness sheet 1,65 mm5√t = 6,4

14
Chemistry & weldabilityTraditionally textbook weldability is described as the inverse of hardenability.
I.e. the post weld hardness determines the quality of the weld.
The weldability of a material is represented by a Carbon Equivalence (CE) number, describing the ability of a material to form martensite after welding.
The CE relates chemical composition of a material to post weld hardness.The CE can be used to predict post weld hardness.Post weld hardness is dependent upon chemical composition and cooling rate
In resistance spot welding the weld becomes fully martensitic due to the very high cooling rates.
If post weld hardness exceeds 450 HV, crack formation is likely, leading to undesirable failure modes (i.e. plug failure).
Excess hardness can be removed by tempering of the martensite (PWHT)
15
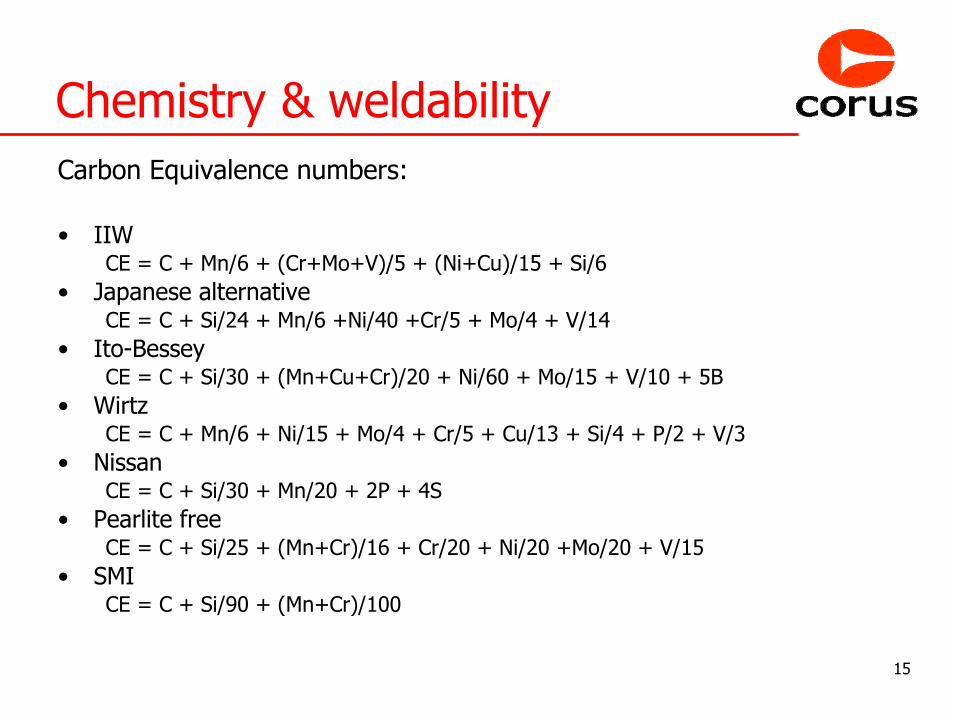
Chemistry & weldabilityCarbon Equivalence numbers:
• IIWCE = C + Mn/6 + (Cr+Mo+V)/5 + (Ni+Cu)/15 + Si/6
• Japanese alternativeCE = C + Si/24 + Mn/6 +Ni/40 +Cr/5 + Mo/4 + V/14
• Ito-BesseyCE = C + Si/30 + (Mn+Cu+Cr)/20 + Ni/60 + Mo/15 + V/10 + 5B
• WirtzCE = C + Mn/6 + Ni/15 + Mo/4 + Cr/5 + Cu/13 + Si/4 + P/2 + V/3
• NissanCE = C + Si/30 + Mn/20 + 2P + 4S
• Pearlite freeCE = C + Si/25 + (Mn+Cr)/16 + Cr/20 + Ni/20 +Mo/20 + V/15
• SMICE = C + Si/90 + (Mn+Cr)/100
16
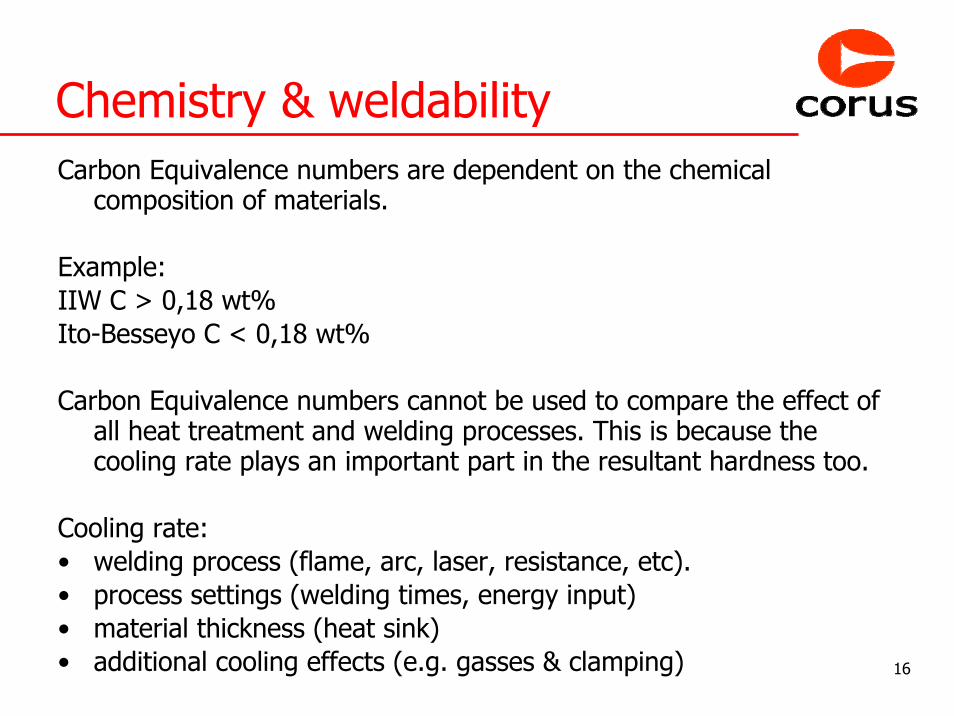
Chemistry & weldabilityCarbon Equivalence numbers are dependent on the chemical
composition of materials.
Example:IIW C > 0,18 wt%Ito-Besseyo C < 0,18 wt%
Carbon Equivalence numbers cannot be used to compare the effect of all heat treatment and welding processes. This is because the cooling rate plays an important part in the resultant hardness too.
Cooling rate:• welding process (flame, arc, laser, resistance, etc).• process settings (welding times, energy input)• material thickness (heat sink)• additional cooling effects (e.g. gasses & clamping)
17
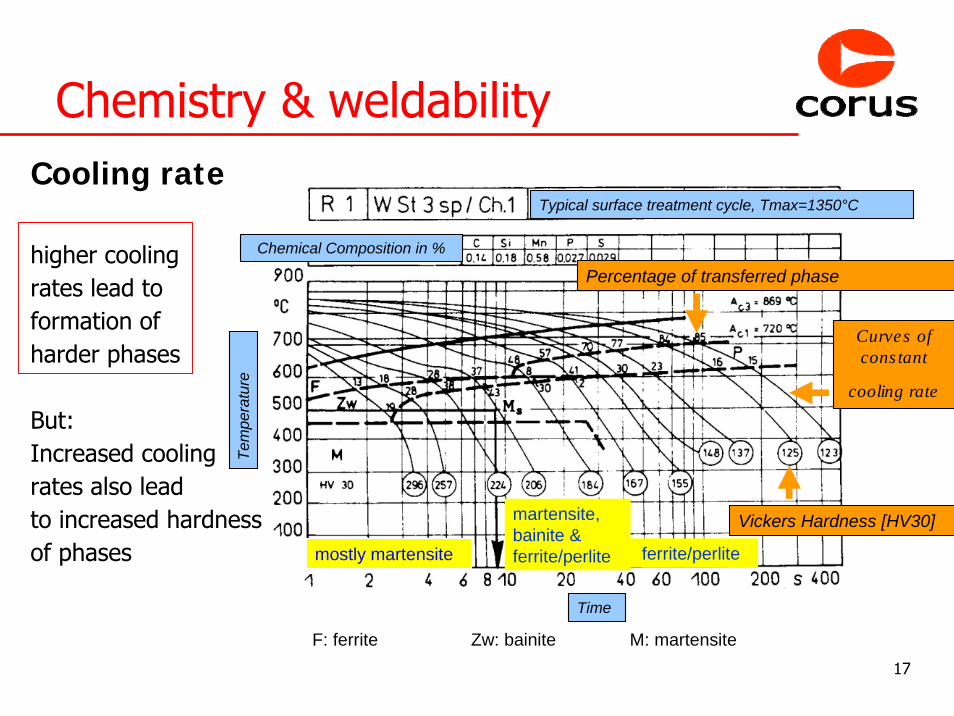
Chemistry & weldabilityCooling rate
higher coolingrates lead toformation ofharder phases
But:Increased coolingrates also leadto increased hardnessof phases
martensite,bainite & ferrite/perlitemostly martensite ferrite/perlite
Tem
pera
ture
Time
Chemical Composition in %
Typical surface treatment cycle, Tmax=1350°C
Curves of cons tant
cooling rate
Vickers Hardness [HV30]
F: ferrite Zw: bainite M: martensite
Percentage of transferred phase
18
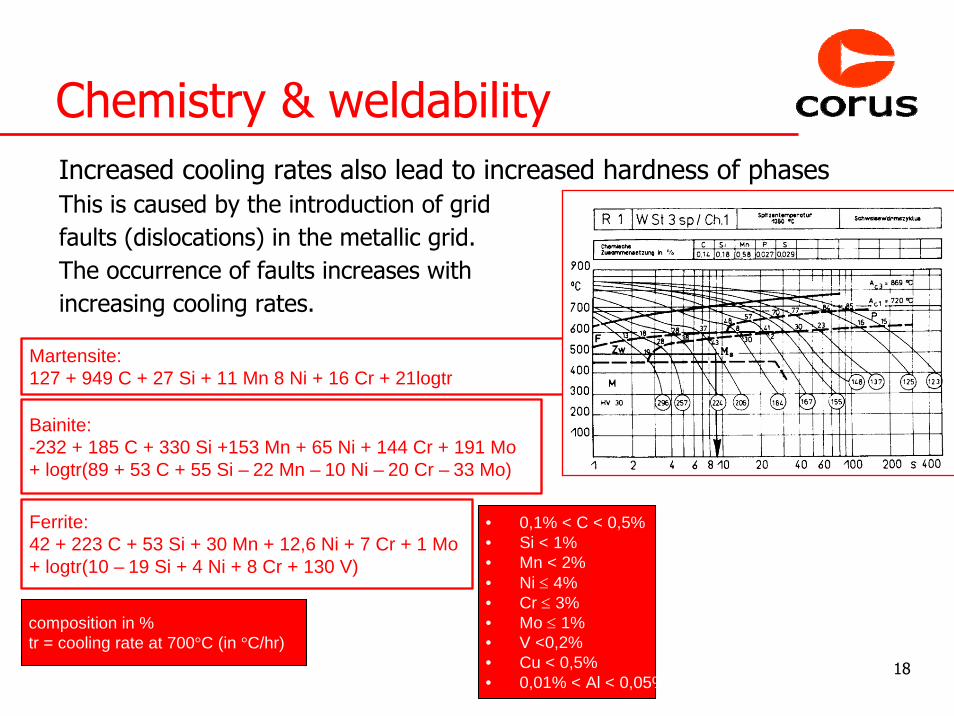
Chemistry & weldabilityIncreased cooling rates also lead to increased hardness of phasesThis is caused by the introduction of gridfaults (dislocations) in the metallic grid.The occurrence of faults increases with increasing cooling rates.
Martensite:127 + 949 C + 27 Si + 11 Mn 8 Ni + 16 Cr + 21logtr
Bainite:-232 + 185 C + 330 Si +153 Mn + 65 Ni + 144 Cr + 191 Mo + logtr(89 + 53 C + 55 Si – 22 Mn – 10 Ni – 20 Cr – 33 Mo)
Ferrite:42 + 223 C + 53 Si + 30 Mn + 12,6 Ni + 7 Cr + 1 Mo+ logtr(10 – 19 Si + 4 Ni + 8 Cr + 130 V)
composition in %tr = cooling rate at 700°C (in °C/hr)
• 0,1% < C < 0,5%• Si < 1%• Mn < 2%• Ni ≤ 4%• Cr ≤ 3%• Mo ≤ 1%• V <0,2%• Cu < 0,5%• 0,01% < Al < 0,05%
19
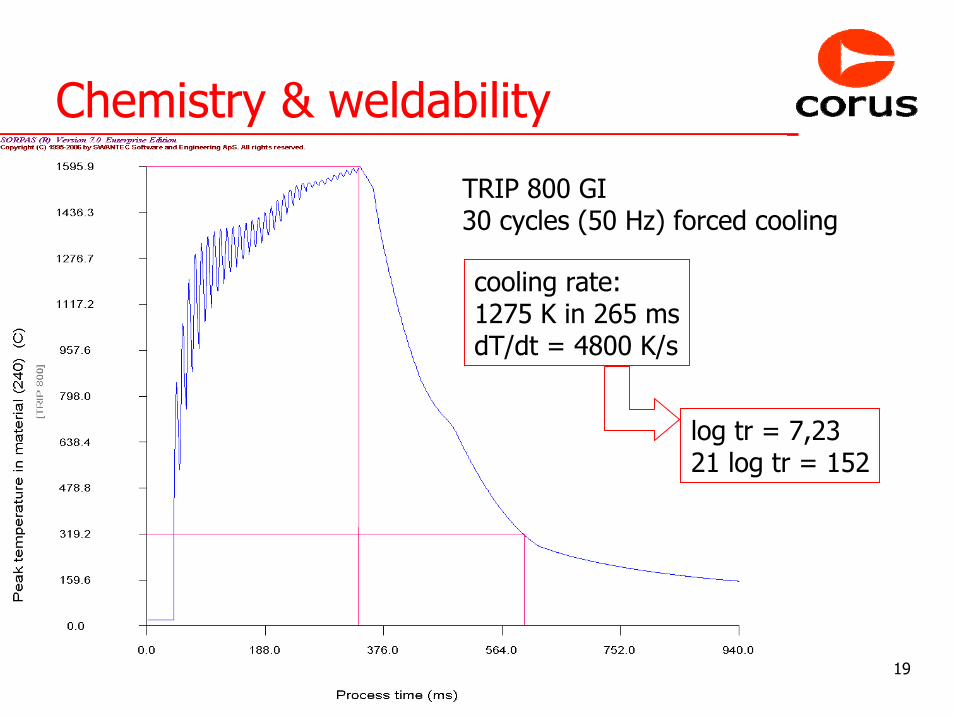
Chemistry & weldability
cooling rate:1275 K in 265 msdT/dt = 4800 K/s
TRIP 800 GI30 cycles (50 Hz) forced cooling
log tr = 7,2321 log tr = 152
20
Post Weld Hardness
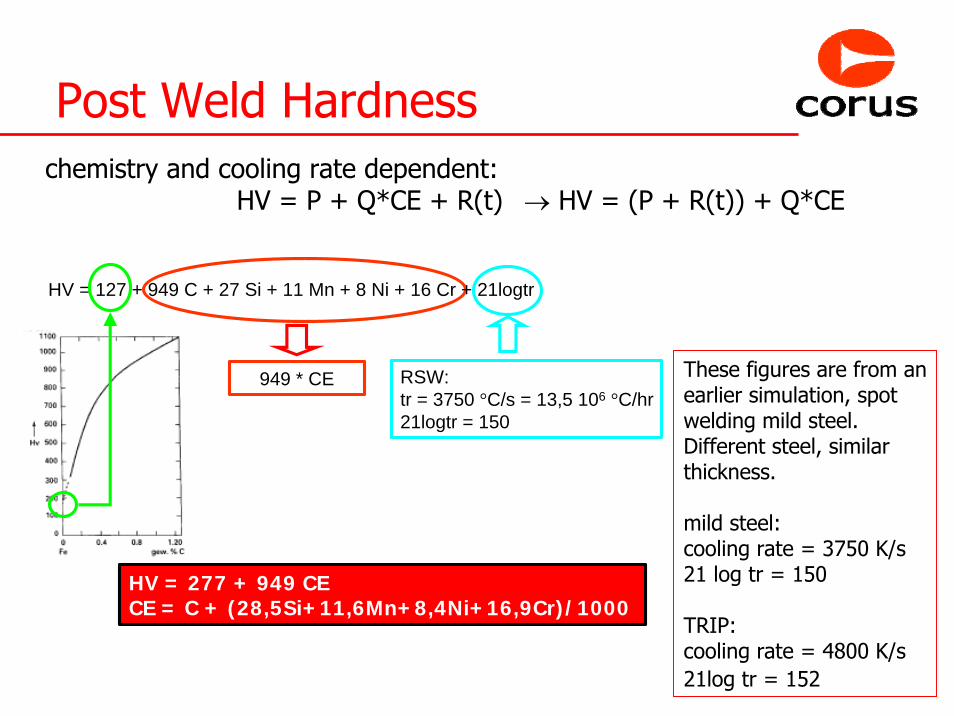
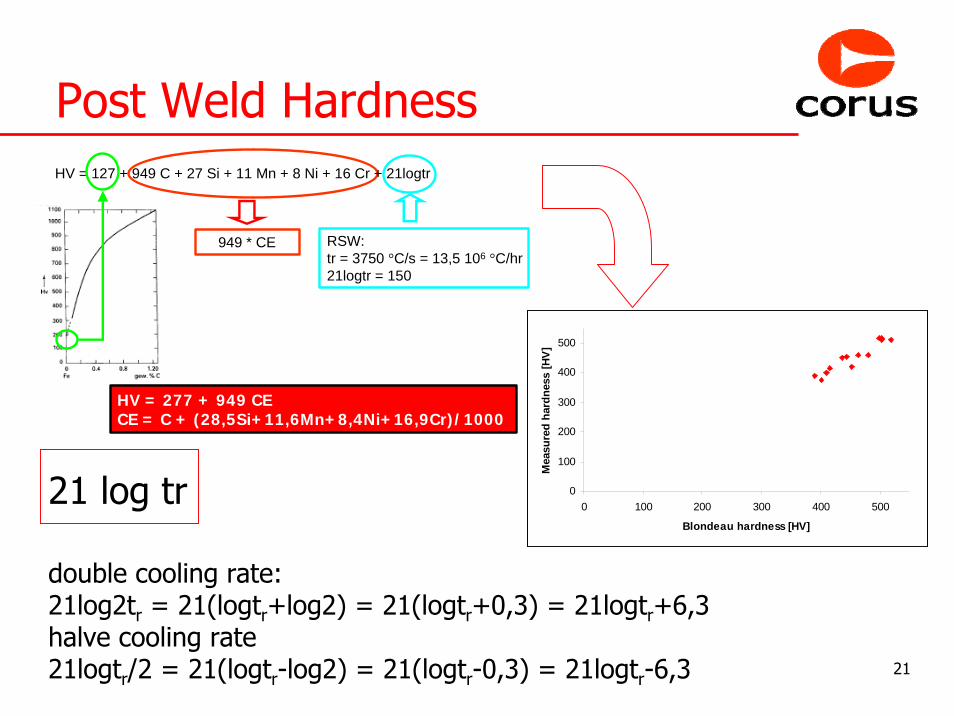
HV = 127 + 949 C + 27 Si + 11 Mn + 8 Ni + 16 Cr + 21logtr
949 * CE RSW:tr = 3750 °C/s = 13,5 106 °C/hr21logtr = 150
HV = 277 + 949 CECE = C + (28,5Si+11,6Mn+8,4Ni+16,9Cr)/1000
chemistry and cooling rate dependent:HV = P + Q*CE + R(t) → HV = (P + R(t)) + Q*CE
These figures are from anearlier simulation, spotwelding mild steel.Different steel, similarthickness.
mild steel:cooling rate = 3750 K/s21 log tr = 150
TRIP:cooling rate = 4800 K/s21log tr = 152
21
Post Weld HardnessHV = 127 + 949 C + 27 Si + 11 Mn + 8 Ni + 16 Cr + 21logtr
949 * CE RSW:tr = 3750 °C/s = 13,5 106 °C/hr21logtr = 150
HV = 277 + 949 CECE = C + (28,5Si+11,6Mn+8,4Ni+16,9Cr)/1000
21 log tr
double cooling rate: 21log2tr = 21(logtr+log2) = 21(logtr+0,3) = 21logtr+6,3halve cooling rate21logtr/2 = 21(logtr-log2) = 21(logtr-0,3) = 21logtr-6,3
0
100
200
300
400
500
0 100 200 300 400 500
Blondeau hardness [HV]
Mea
sure
d ha
rdne
ss [H
V]
22
Post Weld Hardness
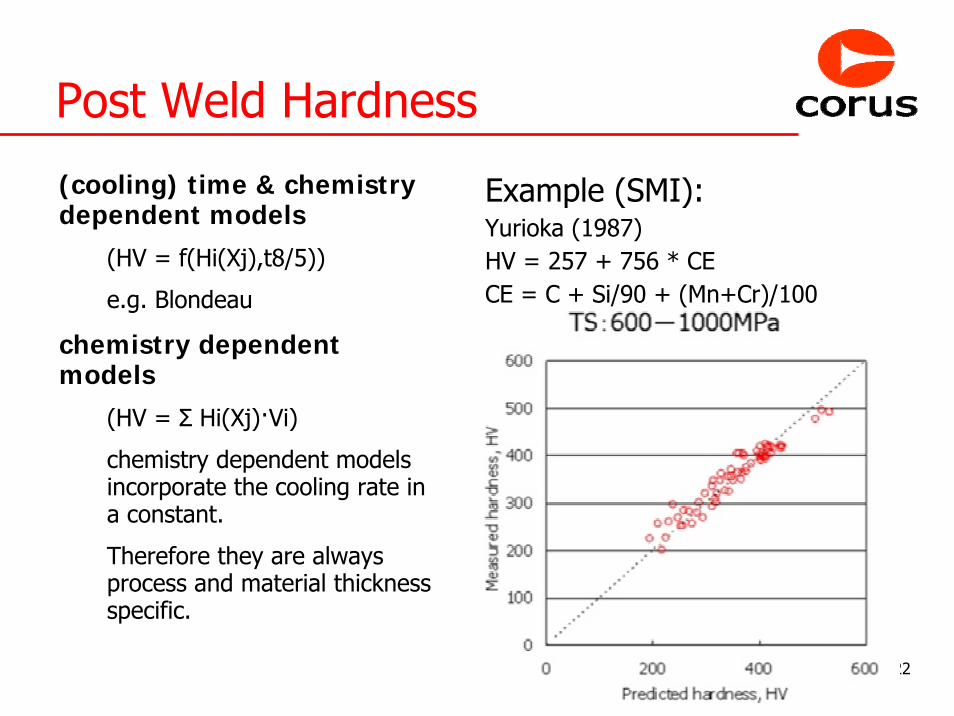
Example (SMI):Yurioka (1987) HV = 257 + 756 * CECE = C + Si/90 + (Mn+Cr)/100
(cooling) time & chemistry dependent models
(HV = f(Hi(Xj),t8/5))
e.g. Blondeau
chemistry dependent models
(HV = Σ Hi(Xj)·Vi)
chemistry dependent models incorporate the cooling rate in a constant.
Therefore they are always process and material thickness specific.
23
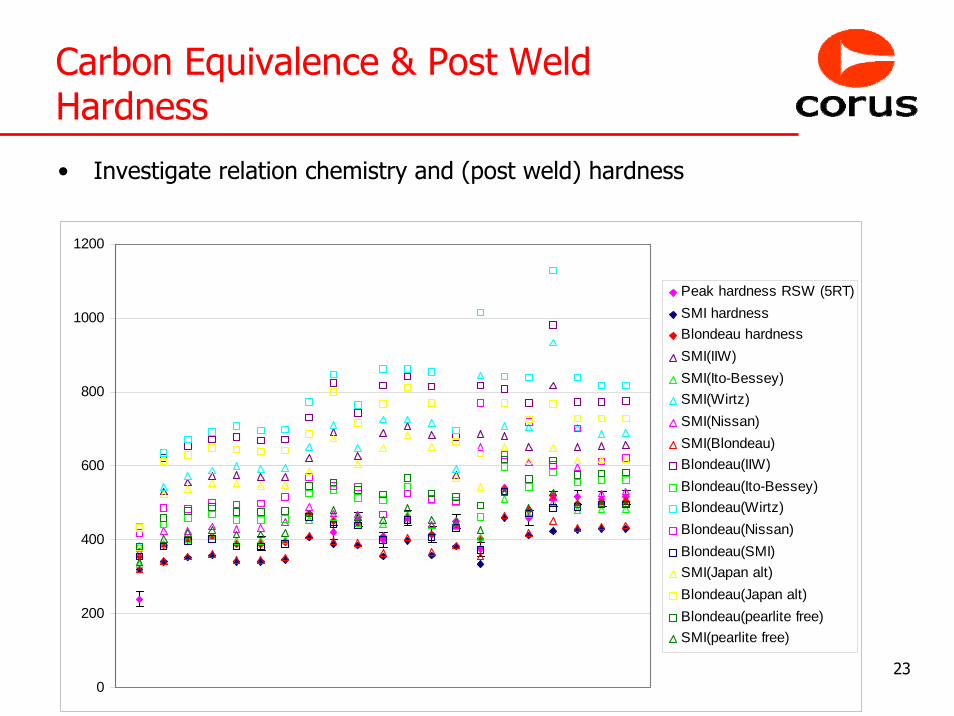
Carbon Equivalence & Post Weld Hardness
• Investigate relation chemistry and (post weld) hardness
0
200
400
600
800
1000
1200
Peak hardness RSW (5RT)SMI hardnessBlondeau hardnessSMI(IIW)SMI(Ito-Bessey)SMI(Wirtz)SMI(Nissan)SMI(Blondeau)Blondeau(IIW)Blondeau(Ito-Bessey)Blondeau(Wirtz)Blondeau(Nissan)Blondeau(SMI)SMI(Japan alt)Blondeau(Japan alt)Blondeau(pearlite free)SMI(pearlite free)
24
Carbon Equivalence & Post Weld Hardness
• Investigate relation chemistry and (post weld) hardness
0
100
200
300
400
500
600
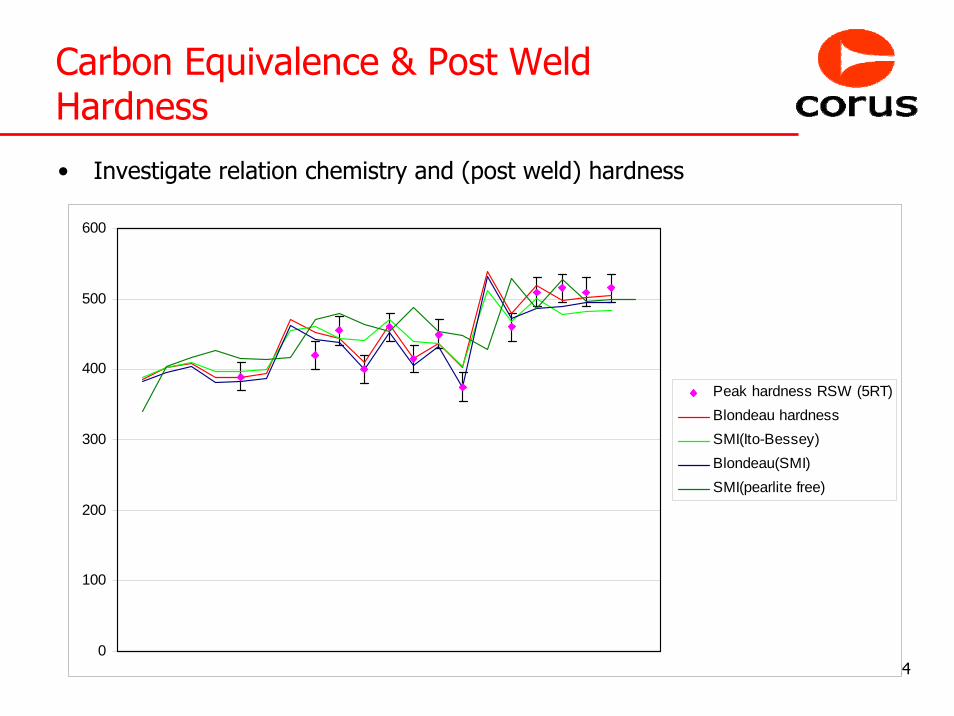
Peak hardness RSW (5RT)Blondeau hardnessSMI(Ito-Bessey)Blondeau(SMI)SMI(pearlite free)
25
Carbon Equivalence & Post Weld Hardness
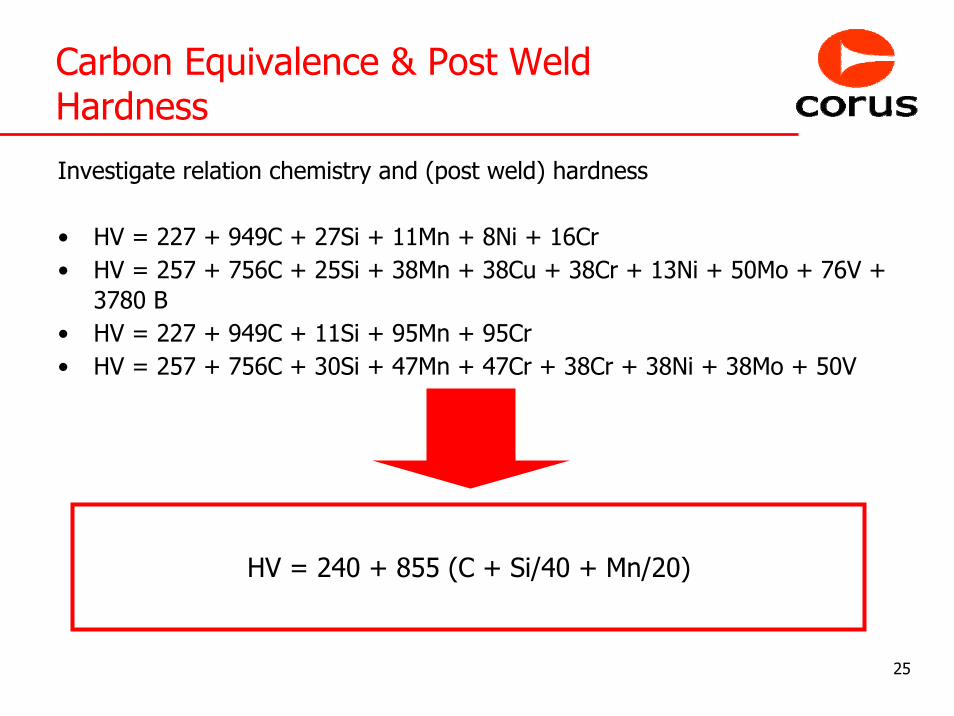
Investigate relation chemistry and (post weld) hardness
• HV = 227 + 949C + 27Si + 11Mn + 8Ni + 16Cr• HV = 257 + 756C + 25Si + 38Mn + 38Cu + 38Cr + 13Ni + 50Mo + 76V +
3780 B• HV = 227 + 949C + 11Si + 95Mn + 95Cr• HV = 257 + 756C + 30Si + 47Mn + 47Cr + 38Cr + 38Ni + 38Mo + 50V
HV = 240 + 855 (C + Si/40 + Mn/20)
26
Carbon Equivalence & Post Weld Hardness
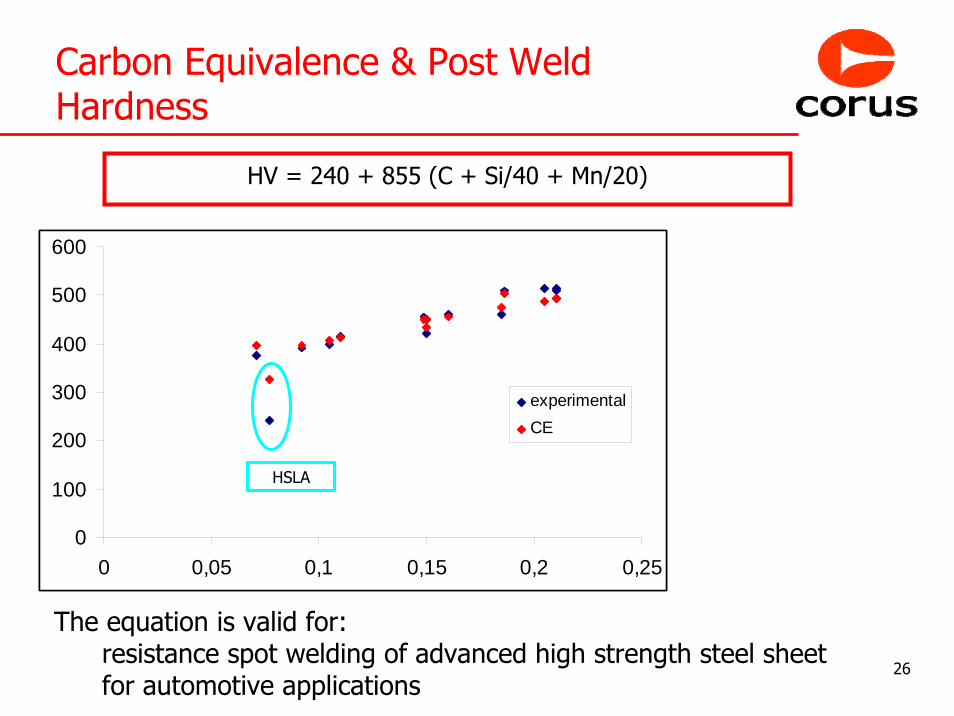
HV = 240 + 855 (C + Si/40 + Mn/20)
0
100
200
300
400
500
600
0 0,05 0,1 0,15 0,2 0,25
experimentalCE
HSLA
0
100
200
300
400
500
600
0 0,05 0,1 0,15 0,2 0,25
experimentalCE
HSLA
The equation is valid for: resistance spot welding of advanced high strength steel sheetfor automotive applications
27
Post Weld Heat Treatment• If the post weld hardness of the weld nugget exceeds 450 HV (rule
of thumb) onset of cracks becomes a possibility. This can lead to undesirable weld failure modes.
• Therefore the hardness of the weld nugget should be decreased bytempering to ensure full plug failure.
• To temper, the weld should be heated to a temperature not exceeding Ac1. If the temperature does exceed Ac1, martensite will transform into austenite. Upon cooling this austenite will transform into hard untempered martensite again.
28
Post Weld Heat Treatment
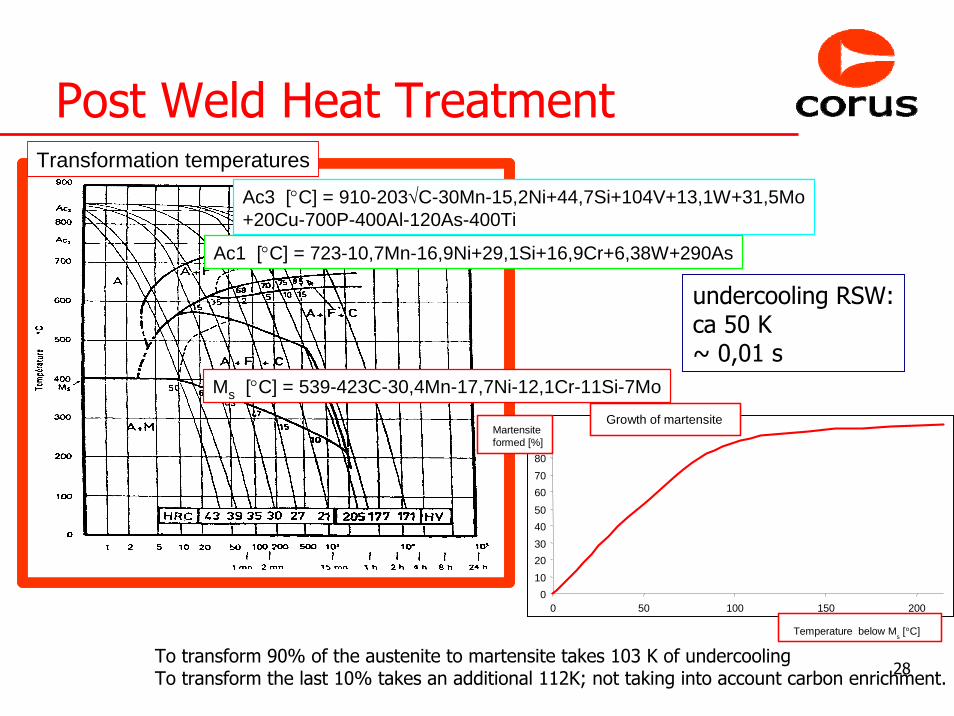
Ac1 [°C] = 723-10,7Mn-16,9Ni+29,1Si+16,9Cr+6,38W+290As
Ac3 [°C] = 910-203√C-30Mn-15,2Ni+44,7Si+104V+13,1W+31,5Mo+20Cu-700P-400Al-120As-400Ti
Ms [°C] = 539-423C-30,4Mn-17,7Ni-12,1Cr-11Si-7Mo
Ac1 [°C] = 723-10,7Mn-16,9Ni+29,1Si+16,9Cr+6,38W+290As
Ac3 [°C] = 910-203√C-30Mn-15,2Ni+44,7Si+104V+13,1W+31,5Mo+20Cu-700P-400Al-120As-400Ti
Ms [°C] = 539-423C-30,4Mn-17,7Ni-12,1Cr-11Si-7Mo
Transformation temperatures
01020304050
60708090
100
0 50 100 150 2000
1020304050
60708090
100
0 50 100 150 200
Martensiteformed [%]
Temperature below Ms
[°C]
Growth of martensite
To transform 90% of the austenite to martensite takes 103 K of undercoolingTo transform the last 10% takes an additional 112K; not taking into account carbon enrichment.
undercooling RSW:ca 50 K~ 0,01 s
29
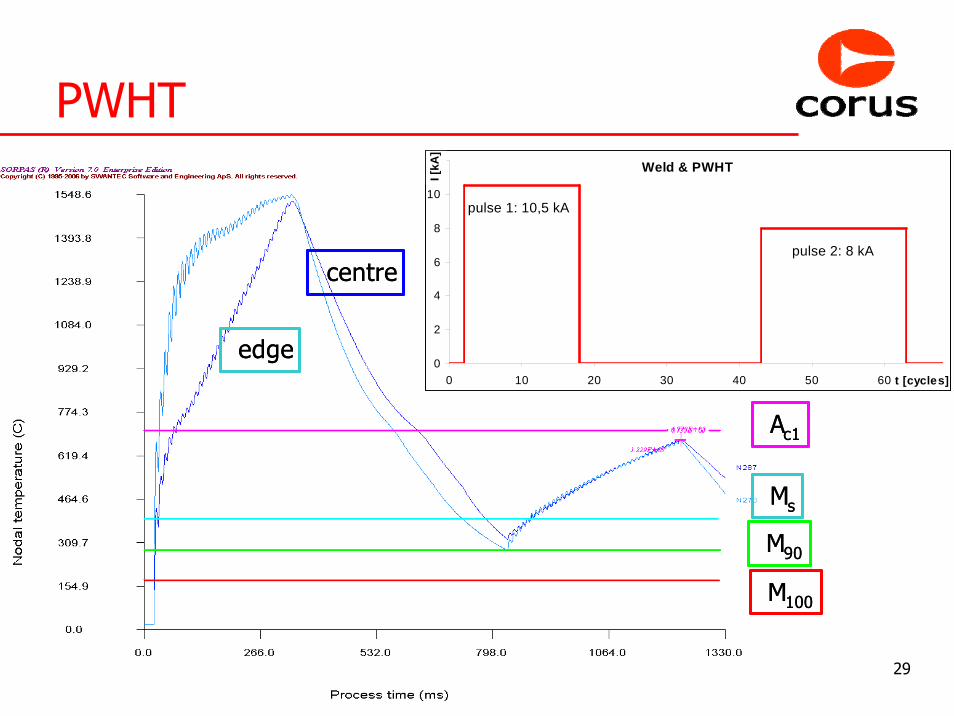
PWHTWeld & PWHT
0
2
4
6
8
10
12
0 10 20 30 40 50 60 t [cycles]
I [kA
]Ac1
Ms
M90
M100
centre
edge
Ac1
Ms
M90
M100
centre
edge
pulse 1: 10,5 kA
pulse 2: 8 kA

30
Other welding challenges
1. Welding of high carbon and phospherous TRIP steels (see yesterdays presentation)
2. Geometry related mechanical characteristics (e.g. residual stresses)
1. Hot Cracking SusceptibilityHCS = (C(S+P+Si/25+Ni/100)*1000)/(3Mn+Cr+Mo+V)If HCS > 4, hot cracking can occur (value may be different
for RSW)2. Temper embrittlement: J = Mn + Si + 104 (P + Sn)
grade HCS DP800 A 0,894 DP800 B 0,553 TRIP 780 A 3,270 TRIP 700 A 3,991 TRIP 700 B 2,468 TRIP 800 A 5,599 TRIP 800 B 2,266
grade JDP800 A 3,87DP800 B 3,55TRIP 780 A 4,16TRIP 700 A 11,54TRIP 700 B 5,74TRIP 800 A 11,90TRIP 800 B 5,13
31
Conclusions
1. Verification of simulations is most reliable using weld growth curves2. SORPAS is very suited to support weldability research on process
parameters3. SORPAS can be used as a tool to support weldability research on
metallurgy4. Chemistry and cooling rates determine post weld hardness5. Cooling rate is determined by process, thickness of materials and
chemical composition (in that order).6. Simple equations can be derived to determine post weld hardness of
classes of resistance welded steel sheet7. SORPAS can be used to design PWHT schemes
But: Always take into account the full metallurgical background.
Copyright © 2022 FDOKUMEN