Using single top rapidity to measure Vtd, Vts, Vtb at hadron colliders
12
Using single top rapidity to measure V td , V ts , V tb at hadron colliders J. A. Aguilar-Saavedra Departamento de Fı ´sica Teo ´rica y del Cosmos and CAFPE, Universidad de Granada, E-18071 Granada, Spain A. Onofre Departamento de Fisica, Universidade do Minho, P-4710-057 Braga, Portugal (Received 2 June 2010; published 6 April 2011) Single top production processes are usually regarded as the ones in which V tb can be directly measured at hadron colliders. We show that the analysis of the single top rapidity distribution in t-channel and tW production can also set direct limits on V td . At LHC with 10 fb 1 at 14 TeV, the combined limits on V td may be reduced by almost a factor of 2 when the top rapidity distribution is used. This also implies that the limits on V tb can also be reduced by 15%, since both parameters, as well as V ts , must be simultaneously obtained from a global fit to data. At Tevatron, the exploitation of this distribution would require very high statistics. DOI: 10.1103/PhysRevD.83.073003 PACS numbers: 12.15.Ff, 12.15.Hh, 12.60.i, 14.65.Ha I. INTRODUCTION In the Cabibbo-Kobayashi-Maskawa (CKM) matrix [1,2] describing quark mixing, the matrix elements V td , V ts , V tb in the third row are the ones for which direct measurements are less precise. Yet, the determination of these mixing parameters is of the utmost importance, in particular, to test the CKM description of the observed CP violation in the K and B meson systems (see, for example, Ref. [3] and references therein). Within the standard model (SM), V td ’ 0:009, V ts ’ 0:04, V tb ’ 1, but substantial de- viations from these predictions, based on 3 3 CKM unitarity, are possible in SM extensions. For example, the mixing of the top quark with a heavy-charge 2=3 quark isosinglet allows for V tb significantly smaller than unity [4], while the mixing with a hypercharge 1=3 quark triplet may result in V tb > 1 [5], in sharp contrast with the SM unitarity bound jV tb j 2 1. Several collider observables can probe the top mixing with SM quarks. Top pair production can measure the ratio R ¼ Brðt ! WbÞ Brðt ! WqÞ ¼ jV tb j 2 jV td j 2 þjV ts j 2 þjV tb j 2 (1) (with q ¼ d; s; b), by comparing event samples with zero, one, and two b tags. Recently, the possibility of s tagging has been explored [6], which would yield a measurement of R 0 ¼ Brðt ! WsÞ Brðt ! WbÞ ¼ jV ts j 2 jV tb j 2 ; (2) by comparing the number of events with b, s tags and with two b tags. Single top production processes have total cross sections which can be generically written as ' ¼ A d jV td j 2 þ A s jV ts j 2 þ A b jV tb j 2 ; (3) with A d;s;b numerical constants (see the next section). But, clearly, the ratios R, R 0 and the several single top and antitop cross sections do not exhaust all possible observables sensi- tive to V td , V ts , and V tb . In this paper, we will show that the rapidity distribution of single top quarks is a very good discriminant between initial states with d valence quarks against s and b. Therefore, the inclusion of this observable in global fits allows to obtain much better constraints on V td , which also translate into more stringent bounds on V tb , once the three top CKM mixings must be simultaneously ob- tained from the fit. Besides, we note that rapidity analyses are well-known for the determination of Z 0 boson couplings to quarks [7] but have been rarely used in top physics. In the following section, we review the constraints that R and the different single (anti)top cross sections place on the ðV td ;V ts ;V tb Þ parameter space, extending previous work in Ref. [8] to the Large Hadron Collider (LHC), for which single top production has many different features from Tevatron. In Sec. III, we discuss the top rapidity distribu- tions and their uncertainties, including a brief analysis of the experimental issues regarding the top rapidity measure- ment. In Sec. IV , we incorporate the rapidity distributions into global fits to V td , V ts , and V tb for LHC and Tevatron, showing how they may improve the determination of V td and V tb . We point out that the full exploitation of the top rapidity distribution, as any other precision analysis, re- quires sufficient statistics and excellent knowledge of the SM backgrounds. For this reason, we limit ourselves to LHC at 14 TeV with 10 fb 1 , giving, for completeness, results for Tevatron. We summarize our results in Sec. V . II. CONSTRAINTS FROM CROSS SECTIONS AND R There are three single top production processes at had- ron colliders, usually denoted as t-channel (also abbrevi- ated here as tj), s-channel (also t b), and tW production. Representative Feynman diagrams for these processes are depicted in Fig. 1, including top quark mixing with the down-type quarks d, s, b. For t-channel and tW production, the final state is, in all cases, the same (a top quark plus a jet PHYSICAL REVIEW D 83, 073003 (2011) 1550-7998= 2011=83(7)=073003(12) 073003-1 Ó 2011 American Physical Society
-
Upload
independent -
Category
Documents
-
view
0 -
download
0
Transcript of Using single top rapidity to measure Vtd, Vts, Vtb at hadron colliders
Using single top rapidity to measure Vtd, Vts, Vtb at hadron colliders
J. A. Aguilar-Saavedra
Departamento de Fısica Teorica y del Cosmos and CAFPE, Universidad de Granada, E-18071 Granada, Spain
A. Onofre
Departamento de Fisica, Universidade do Minho, P-4710-057 Braga, Portugal(Received 2 June 2010; published 6 April 2011)
Single top production processes are usually regarded as the ones in which Vtb can be directly measured
at hadron colliders. We show that the analysis of the single top rapidity distribution in t-channel and tW
production can also set direct limits on Vtd. At LHC with 10 fb�1 at 14 TeV, the combined limits on
Vtd may be reduced by almost a factor of 2 when the top rapidity distribution is used. This also implies
that the limits on Vtb can also be reduced by 15%, since both parameters, as well as Vts, must be
simultaneously obtained from a global fit to data. At Tevatron, the exploitation of this distribution would
require very high statistics.
DOI: 10.1103/PhysRevD.83.073003 PACS numbers: 12.15.Ff, 12.15.Hh, 12.60.�i, 14.65.Ha
I. INTRODUCTION
In the Cabibbo-Kobayashi-Maskawa (CKM) matrix[1,2] describing quark mixing, the matrix elements Vtd,Vts, Vtb in the third row are the ones for which directmeasurements are less precise. Yet, the determination ofthese mixing parameters is of the utmost importance, inparticular, to test the CKM description of the observed CPviolation in the K and B meson systems (see, for example,Ref. [3] and references therein). Within the standard model(SM), Vtd ’ 0:009, Vts ’ 0:04, Vtb ’ 1, but substantial de-viations from these predictions, based on 3� 3 CKMunitarity, are possible in SM extensions. For example, themixing of the top quark with a heavy-charge 2=3 quarkisosinglet allows for Vtb significantly smaller than unity[4], while the mixing with a hypercharge �1=3 quarktriplet may result in Vtb > 1 [5], in sharp contrast withthe SM unitarity bound jVtbj2 � 1.
Several collider observables can probe the top mixingwith SM quarks. Top pair production can measure the ratio
R ¼ Brðt ! WbÞBrðt ! WqÞ ¼
jVtbj2jVtdj2 þ jVtsj2 þ jVtbj2
(1)
(with q ¼ d; s; b), by comparing event samples with zero,one, and two b tags. Recently, the possibility of s tagginghas been explored [6], which would yield a measurement of
R0 ¼ Brðt ! WsÞBrðt ! WbÞ ¼
jVtsj2jVtbj2
; (2)
by comparing the number of events with b, s tags and withtwo b tags. Single top production processes have totalcross sections which can be generically written as
� ¼ AdjVtdj2 þ AsjVtsj2 þ AbjVtbj2; (3)
with Ad;s;b numerical constants (see the next section). But,
clearly, the ratios R, R0 and the several single top and antitopcross sections do not exhaust all possible observables sensi-
tive to Vtd, Vts, and Vtb. In this paper, we will show that therapidity distribution of single top quarks is a very gooddiscriminant between initial states with d valence quarksagainst s and b. Therefore, the inclusion of this observablein global fits allows to obtain much better constraints on Vtd,which also translate into more stringent bounds on Vtb, oncethe three top CKM mixings must be simultaneously ob-tained from the fit. Besides, we note that rapidity analysesare well-known for the determination of Z0 boson couplingsto quarks [7] but have been rarely used in top physics.In the following section, we review the constraints that R
and the different single (anti)top cross sections place on theðVtd; Vts; VtbÞ parameter space, extending previous work inRef. [8] to the Large Hadron Collider (LHC), for whichsingle top production has many different features fromTevatron. In Sec. III, we discuss the top rapidity distribu-tions and their uncertainties, including a brief analysis ofthe experimental issues regarding the top rapidity measure-ment. In Sec. IV, we incorporate the rapidity distributionsinto global fits to Vtd, Vts, and Vtb for LHC and Tevatron,showing how they may improve the determination of Vtd
and Vtb. We point out that the full exploitation of the toprapidity distribution, as any other precision analysis, re-quires sufficient statistics and excellent knowledge of theSM backgrounds. For this reason, we limit ourselves toLHC at 14 TeV with 10 fb�1, giving, for completeness,results for Tevatron. We summarize our results in Sec. V.
II. CONSTRAINTS FROM CROSSSECTIONS AND R
There are three single top production processes at had-ron colliders, usually denoted as t-channel (also abbrevi-ated here as tj), s-channel (also t �b), and tW production.Representative Feynman diagrams for these processes aredepicted in Fig. 1, including top quark mixing with thedown-type quarks d, s, b. For t-channel and tW production,the final state is, in all cases, the same (a top quark plus a jet
PHYSICAL REVIEW D 83, 073003 (2011)
1550-7998=2011=83(7)=073003(12) 073003-1 � 2011 American Physical Society
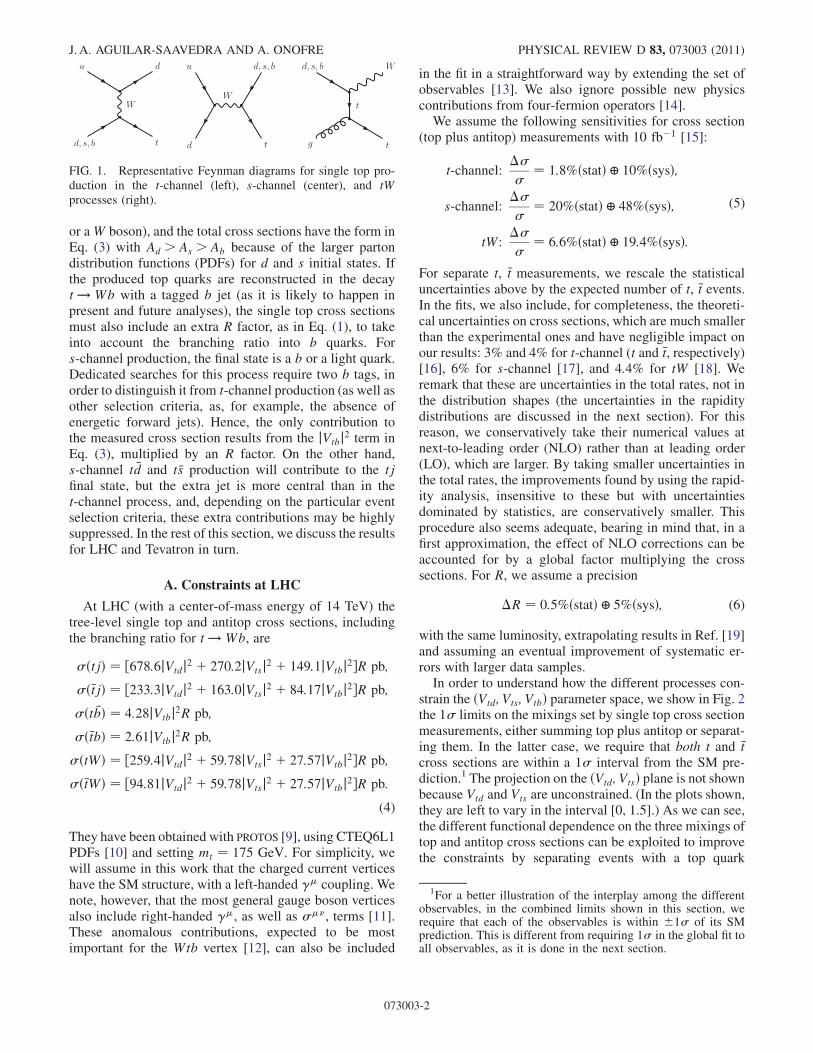
or aW boson), and the total cross sections have the form inEq. (3) with Ad > As > Ab because of the larger partondistribution functions (PDFs) for d and s initial states. Ifthe produced top quarks are reconstructed in the decayt ! Wb with a tagged b jet (as it is likely to happen inpresent and future analyses), the single top cross sectionsmust also include an extra R factor, as in Eq. (1), to takeinto account the branching ratio into b quarks. Fors-channel production, the final state is a b or a light quark.Dedicated searches for this process require two b tags, inorder to distinguish it from t-channel production (as well asother selection criteria, as, for example, the absence ofenergetic forward jets). Hence, the only contribution tothe measured cross section results from the jVtbj2 term inEq. (3), multiplied by an R factor. On the other hand,s-channel t �d and t �s production will contribute to the tjfinal state, but the extra jet is more central than in thet-channel process, and, depending on the particular eventselection criteria, these extra contributions may be highlysuppressed. In the rest of this section, we discuss the resultsfor LHC and Tevatron in turn.
A. Constraints at LHC
At LHC (with a center-of-mass energy of 14 TeV) thetree-level single top and antitop cross sections, includingthe branching ratio for t ! Wb, are
�ðtjÞ ¼ ½678:6jVtdj2 þ 270:2jVtsj2 þ 149:1jVtbj2�R pb;
�ð�tjÞ ¼ ½233:3jVtdj2 þ 163:0jVtsj2 þ 84:17jVtbj2�R pb;
�ðt �bÞ ¼ 4:28jVtbj2R pb;
�ð�tbÞ ¼ 2:61jVtbj2R pb;
�ðtWÞ ¼ ½259:4jVtdj2 þ 59:78jVtsj2 þ 27:57jVtbj2�R pb;
�ð�tWÞ ¼ ½94:81jVtdj2 þ 59:78jVtsj2 þ 27:57jVtbj2�R pb:
(4)
They have been obtained with PROTOS [9], using CTEQ6L1PDFs [10] and setting mt ¼ 175 GeV. For simplicity, wewill assume in this work that the charged current verticeshave the SM structure, with a left-handed �� coupling. Wenote, however, that the most general gauge boson verticesalso include right-handed ��, as well as ���, terms [11].These anomalous contributions, expected to be mostimportant for the Wtb vertex [12], can also be included
in the fit in a straightforward way by extending the set ofobservables [13]. We also ignore possible new physicscontributions from four-fermion operators [14].We assume the following sensitivities for cross section
(top plus antitop) measurements with 10 fb�1 [15]:
t-channel:��
�¼ 1:8%ðstatÞ � 10%ðsysÞ;
s-channel:��
�¼ 20%ðstatÞ � 48%ðsysÞ;
tW:��
�¼ 6:6%ðstatÞ � 19:4%ðsysÞ:
(5)
For separate t, �t measurements, we rescale the statisticaluncertainties above by the expected number of t, �t events.In the fits, we also include, for completeness, the theoreti-cal uncertainties on cross sections, which are much smallerthan the experimental ones and have negligible impact onour results: 3% and 4% for t-channel (t and �t, respectively)[16], 6% for s-channel [17], and 4:4% for tW [18]. Weremark that these are uncertainties in the total rates, not inthe distribution shapes (the uncertainties in the rapiditydistributions are discussed in the next section). For thisreason, we conservatively take their numerical values atnext-to-leading order (NLO) rather than at leading order(LO), which are larger. By taking smaller uncertainties inthe total rates, the improvements found by using the rapid-ity analysis, insensitive to these but with uncertaintiesdominated by statistics, are conservatively smaller. Thisprocedure also seems adequate, bearing in mind that, in afirst approximation, the effect of NLO corrections can beaccounted for by a global factor multiplying the crosssections. For R, we assume a precision
�R ¼ 0:5%ðstatÞ � 5%ðsysÞ; (6)
with the same luminosity, extrapolating results in Ref. [19]and assuming an eventual improvement of systematic er-rors with larger data samples.In order to understand how the different processes con-
strain the ðVtd; Vts; VtbÞ parameter space, we show in Fig. 2the 1� limits on the mixings set by single top cross sectionmeasurements, either summing top plus antitop or separat-ing them. In the latter case, we require that both t and �tcross sections are within a 1� interval from the SM pre-diction.1 The projection on the ðVtd; VtsÞ plane is not shownbecause Vtd and Vts are unconstrained. (In the plots shown,they are left to vary in the interval [0, 1.5].) As we can see,the different functional dependence on the three mixings oftop and antitop cross sections can be exploited to improvethe constraints by separating events with a top quark
FIG. 1. Representative Feynman diagrams for single top pro-duction in the t-channel (left), s-channel (center), and tWprocesses (right).
1For a better illustration of the interplay among the differentobservables, in the combined limits shown in this section, werequire that each of the observables is within �1� of its SMprediction. This is different from requiring 1� in the global fit toall observables, as it is done in the next section.
J. A. AGUILAR-SAAVEDRA AND A. ONOFRE PHYSICAL REVIEW D 83, 073003 (2011)
073003-2

(giving a positive charge lepton) from those with an anti-quark (with a negative charge). Noticeably, the constraintson Vtd from tW combined with �tW are more stringent thanfrom tj combined with �tj, due to the more pronounceddifferences between t and �t production for the former. Wealso observe that t-channel and tW production give similarlimits in parameter space, while those from s-channel arecomplementary.
The limits from each single top process, in combinationwith R, are also shown in each plot. We point out theapparent paradox that the two-dimensional combined lim-its are much smaller than the overlap of the different areas.This is easily understood because the allowed regions areactually three-dimensional volumes, and the areas shownin the plots are their projection in different planes. For abetter comparison, we also present in Fig. 3 the limits from
0 0.5 1.0 1.5
|Vtd
|
0
0.5
1.0
1.5
|Vtb
|σ(t) ⊕ σ(t) ⊕ R
σ(t + t) ⊕ R
σ(t) ⊕ σ(t)
σ(t + t)
R
LHC tj
0 0.5 1.0 1.5
|Vtd
|
0
0.5
1.0
1.5
|Vtb
|
σ(t) ⊕ σ(t) ⊕ R
σ(t + t) ⊕ R
σ(t) ⊕ σ(t)
σ(t + t)
R
LHC tW
0 0.5 1.0 1.5
|Vtd
|
0
0.5
1.0
1.5
|Vtb
|
σ(t) ⊕ σ(t) ⊕ R
σ(t + t) ⊕ R
σ(t) ⊕ σ(t)
σ(t + t)
R
LHC tb
0 0.5 1.0 1.5
|Vts|
0
0.5
1.0
1.5
|Vtb
|
σ(t) ⊕ σ(t) ⊕ R
σ(t + t) ⊕ R
σ(t) ⊕ σ(t)
σ(t + t)
R
LHC tj
0 0.5 1.0 1.5
|Vts|
0
0.5
1.0
1.5
|Vtb
|σ(t) ⊕ σ(t) ⊕ R
σ(t + t) ⊕ R
σ(t) ⊕ σ(t)
σ(t + t)
R
LHC tW
0 0.5 1.0 1.5
|Vts|
0
0.5
1.0
1.5
|Vtb
|
σ(t) ⊕ σ(t) ⊕ R
σ(t + t) ⊕ R
σ(t) ⊕ σ(t)
σ(t + t)
R
LHC tb
FIG. 2 (color online). Projections of the limits from single top cross section measurements on the ðVtd; VtbÞ and ðVts; VtbÞ planes(gray lines). The solid and dashed black lines show the limits in combination with R. The black dotted lines show the limitsfrom R alone.
0 0.5 1.0 1.5
|Vtd
|
0
0.5
1.0
1.5
|Vts|
tj ⊕ R
tW ⊕ R
tb ⊕ R
LHC
0 0.5 1.0 1.5
|Vtd
|
0
0.5
1.0
1.5
|Vtb
|
tj ⊕ R
tW ⊕ R
tb ⊕ R
LHC
0 0.5 1.0 1.5
|Vts|
0
0.5
1.0
1.5
|Vtb
|
tj ⊕ R
tW ⊕ R
tb ⊕ R
LHC
FIG. 3. Projections on the ðVtd; VtsÞ, ðVtd; VtbÞ, and ðVts; VtbÞ planes of the limits from each single top process, in combination with R.
USING SINGLE TOP RAPIDITY TO MEASURE . . . PHYSICAL REVIEW D 83, 073003 (2011)
073003-3

each single top process combined with R. Clearly, if the Rmeasurement is taken into account in the fits, s-channelproduction does not give any extra constraint, even ifsystematic uncertainties were reduced by a factor of 2.We also observe that the limits from t-channel are morerestrictive than those from tW, except for a small region inthe ðVtd; VtbÞ plane.
From this analysis, we can conclude that limits can beset on the mixings by combining at least
(i) t-channel or tW production plus R,(ii) t-channel or tW production plus s-channel,(iii) s-channel plus R,
although the first ones provide the most stringent con-straints at LHC, given the large experimental uncertaintyfor s-channel cross section measurements.
B. Limits at Tevatron
At Tevatron, the tree-level single top plus antitop crosssections, including the branching ratio for t ! Wb, are
�ðtjþ �tjÞ ¼ ½20:72jVtdj2 þ 5:476jVtsj2þ 1:838jVtbj2�R pb;
�ðt �bþ �tbÞ ¼ 0:5245jVtbj2R pb;
(7)
obtained using PROTOS with CTEQ6L1 PDFs. The theo-retical uncertainty is taken as 9:3% for t-channel [16] and13% for s-channel [17]. As it is well-known, tW produc-tion has a very small cross section to be measured and onlyamounts to a small correction to the tj final state.2 Weassume the sensitivity
sþ t-channels:��
�¼ 10%ðstatÞ � 18:5%ðsysÞ; (8)
extrapolating the statistical uncertainty in the CDFCollaboration analysis of Ref. [20] to 12 fb�1 and assum-ing an eventual reduction of the systematic uncertainty to3=4 of its present value. For separate s- and t-channelmeasurements, we rescale the statistical uncertaintiesabove by the SM cross sections corresponding to eachprocess and keep the same systematics. For R, we takethe measured value R ¼ 0:97þ0:09
�0:08 [21].
We show in Fig. 4 the limits on the mixings set by singletop cross section measurements, either separating s- andt-channel production or summing both.We observe that the
0 0.5 1.0 1.5
|Vtd
|
0
0.5
1.0
1.5|V
tb|
tj ⊕ R
tj
R
Tevatron
0 0.5 1.0 1.5
|Vtd
|
0
0.5
1.0
1.5
|Vtb
| tb ⊕ R
tbR
Tevatron
0 0.5 1.0 1.5
|Vtd
|
0
0.5
1.0
1.5
|Vtb
|
tj + tb ⊕ R
tj + tb
R
Tevatron
0 0.5 1.0 1.5
|Vts|
0
0.5
1.0
1.5
|Vtb
|
tj ⊕ R
tj
R
Tevatron
0 0.5 1.0 1.5
|Vts|
0
0.5
1.0
1.5
|Vtb
| tb ⊕ R
tbR
Tevatron
0 0.5 1.0 1.5
|Vts|
0
0.5
1.0
1.5
|Vtb
|
tj + tb ⊕ R
tj + tb
R
Tevatron
FIG. 4. Projections of the limits from single top cross section measurements on the ðVtd; VtbÞ and ðVts; VtbÞ planes (gray lines). Thesolid and dashed black lines show the limits in combination with R. The black dotted lines show the limits from R alone.
2For initial d and s quarks, its cross section is also muchsmaller than for tj production, too, and its contribution would befurther suppressed by the event selection criteria designed for thet-channel kinematics.
J. A. AGUILAR-SAAVEDRA AND A. ONOFRE PHYSICAL REVIEW D 83, 073003 (2011)
073003-4
latter case is practically equivalent to measuring thet-channel cross section alone. If s- and t-channel crosssections are measured independently, the constraints theyset are complementary. We also show, in each plot, theconstraints from single top cross sections in combinationwith the measurement of R. As in the previous subsection,when combining observables, we require that each of themis within 1� of its SM value.
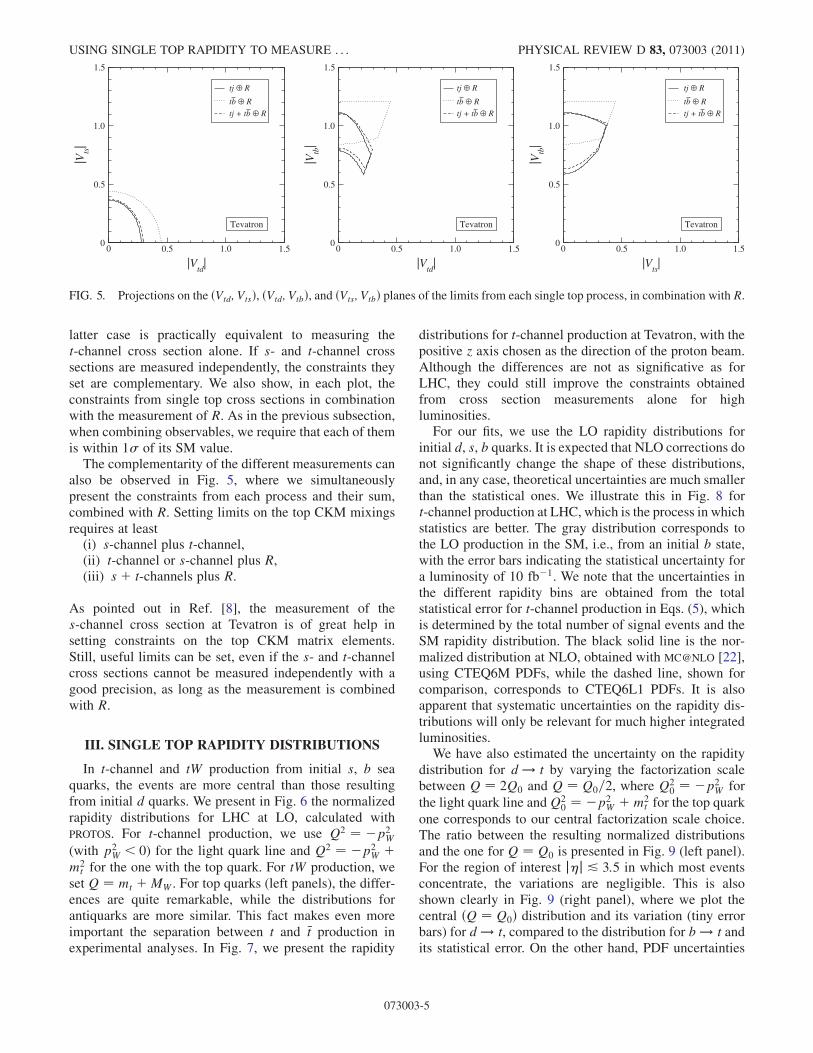
The complementarity of the different measurements canalso be observed in Fig. 5, where we simultaneouslypresent the constraints from each process and their sum,combined with R. Setting limits on the top CKM mixingsrequires at least
(i) s-channel plus t-channel,(ii) t-channel or s-channel plus R,(iii) sþ t-channels plus R.
As pointed out in Ref. [8], the measurement of thes-channel cross section at Tevatron is of great help insetting constraints on the top CKM matrix elements.Still, useful limits can be set, even if the s- and t-channelcross sections cannot be measured independently with agood precision, as long as the measurement is combinedwith R.
III. SINGLE TOP RAPIDITY DISTRIBUTIONS
In t-channel and tW production from initial s, b seaquarks, the events are more central than those resultingfrom initial d quarks. We present in Fig. 6 the normalizedrapidity distributions for LHC at LO, calculated withPROTOS. For t-channel production, we use Q2 ¼ �p2
W
(with p2W < 0) for the light quark line and Q2 ¼ �p2
W þm2
t for the one with the top quark. For tW production, weset Q ¼ mt þMW . For top quarks (left panels), the differ-ences are quite remarkable, while the distributions forantiquarks are more similar. This fact makes even moreimportant the separation between t and �t production inexperimental analyses. In Fig. 7, we present the rapidity
distributions for t-channel production at Tevatron, with thepositive z axis chosen as the direction of the proton beam.Although the differences are not as significative as forLHC, they could still improve the constraints obtainedfrom cross section measurements alone for highluminosities.For our fits, we use the LO rapidity distributions for
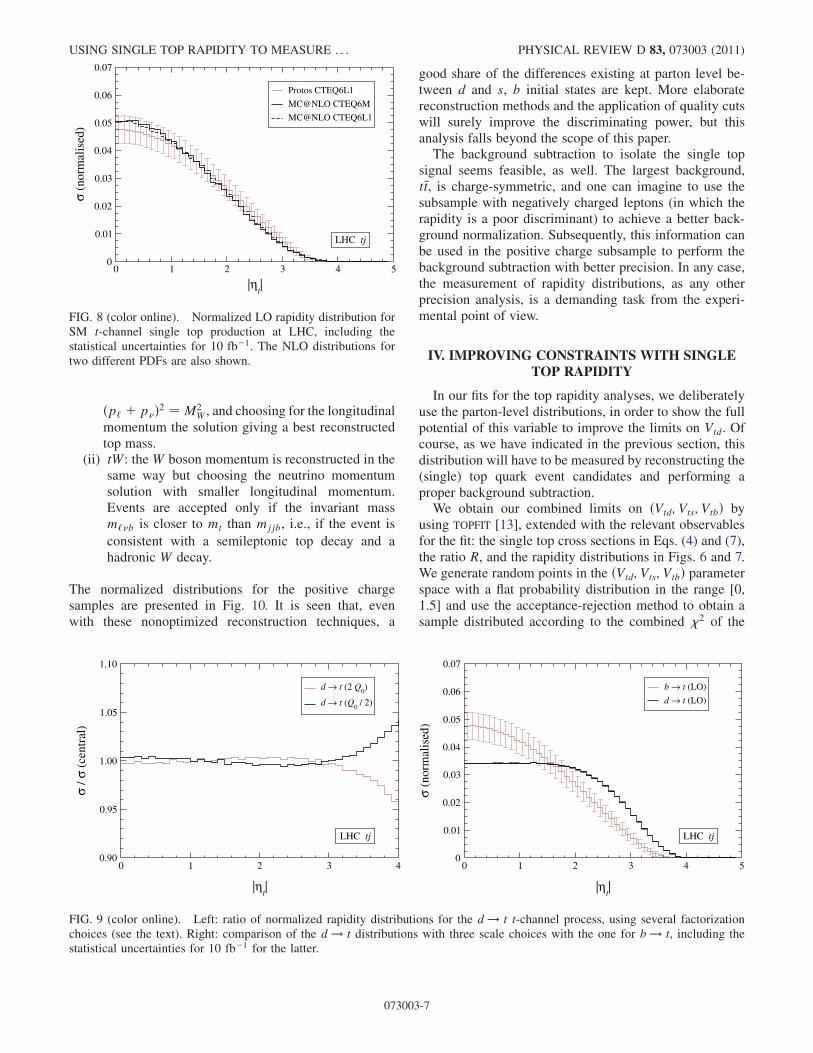
initial d, s, b quarks. It is expected that NLO corrections donot significantly change the shape of these distributions,and, in any case, theoretical uncertainties are much smallerthan the statistical ones. We illustrate this in Fig. 8 fort-channel production at LHC, which is the process in whichstatistics are better. The gray distribution corresponds tothe LO production in the SM, i.e., from an initial b state,with the error bars indicating the statistical uncertainty fora luminosity of 10 fb�1. We note that the uncertainties inthe different rapidity bins are obtained from the totalstatistical error for t-channel production in Eqs. (5), whichis determined by the total number of signal events and theSM rapidity distribution. The black solid line is the nor-malized distribution at NLO, obtained with MC@NLO [22],using CTEQ6M PDFs, while the dashed line, shown forcomparison, corresponds to CTEQ6L1 PDFs. It is alsoapparent that systematic uncertainties on the rapidity dis-tributions will only be relevant for much higher integratedluminosities.We have also estimated the uncertainty on the rapidity
distribution for d ! t by varying the factorization scalebetween Q ¼ 2Q0 and Q ¼ Q0=2, where Q2
0 ¼ �p2W for
the light quark line andQ20 ¼ �p2
W þm2t for the top quark
one corresponds to our central factorization scale choice.The ratio between the resulting normalized distributionsand the one for Q ¼ Q0 is presented in Fig. 9 (left panel).For the region of interest j�j & 3:5 in which most eventsconcentrate, the variations are negligible. This is alsoshown clearly in Fig. 9 (right panel), where we plot thecentral ðQ ¼ Q0Þ distribution and its variation (tiny errorbars) for d ! t, compared to the distribution for b ! t andits statistical error. On the other hand, PDF uncertainties
0 0.5 1.0 1.5
|Vtd
|
0
0.5
1.0
1.5
|Vts|
tj ⊕ R
tb ⊕ R
tj + tb ⊕ R
Tevatron
0 0.5 1.0 1.5
|Vtd
|
0
0.5
1.0
1.5
|Vtb
|
tj ⊕ R
tb ⊕ R
tj + tb ⊕ R
Tevatron
0 0.5 1.0 1.5
|Vts|
0
0.5
1.0
1.5
|Vtb
|
tj ⊕ R
tb ⊕ R
tj + tb ⊕ R
Tevatron
FIG. 5. Projections on the ðVtd; VtsÞ, ðVtd; VtbÞ, and ðVts; VtbÞ planes of the limits from each single top process, in combination with R.
USING SINGLE TOP RAPIDITY TO MEASURE . . . PHYSICAL REVIEW D 83, 073003 (2011)
073003-5

will likely be under good control, because copious Drell-Yan W production will be used to determine them at thesescales by using a W rapidity analysis or an equivalent one.
Detector and reconstruction effects degrade the top ra-pidity distributions, although they do not wipe out the
differences between them. In order to show this, we haveperformed a fast simulation of t-channel and tW samplesfor each initial state flavor d, s, b, using PROTOS for theevent generation (including the top and W boson spin, aswell as finite width effects), PYTHIA [23] for hadronization,and ACERDET [24] for the detector simulation. A b taggingis applied with an efficiency of 60%, which corresponds toa 15% mistagging rate for charm jets and 1:1% for lightquark jets. Our selection criteria for the samples are(i) t-channel: one charged lepton with transverse mo-
mentum pT > 25 GeV; one b-tagged jet withpT > 30 GeV; missing energy 6pT > 25 GeV.
(ii) tW: one charged lepton with transverse momentumpT > 25 GeV and no other lepton above 10 GeV;one b-tagged jet with pT > 30 GeV and two un-tagged jets also with pT > 30 GeV; missing energy6pT > 25 GeV.
A very simple reconstruction of the top quark is performedin each case (see Ref. [15] for more optimized methods):(i) t-channel: the W boson momentum is recon-
structed in the usual way, taking the neutrinotransverse momentum as missing energy, requiring
0 1 2 3 4 5
|ηt|
0
0.01
0.02
0.03
0.04
0.05
0.06
0.07σ
(nor
mal
ised
)b → ts → td → t
LHC tj
0 1 2 3 4 5
|ηt|
0
0.01
0.02
0.03
0.04
0.05
0.06
0.07
σ (n
orm
alis
ed)
b → ts → td → t
LHC tj
0 1 2 3 4 5
|ηt|
0
0.01
0.02
0.03
0.04
0.05
0.06
0.07
σ (n
orm
alis
ed)
b → ts → td → t
LHC tW
0 1 2 3 4 5
|ηt|
0
0.01
0.02
0.03
0.04
0.05
0.06
0.07
σ (n
orm
alis
ed)
b → ts → td → t
LHC tW
FIG. 6. Normalized rapidity distributions for t-channel and tW single top production at LHC.
-3 -2 -1 0 1 2 3
ηt
0
0.01
0.02
0.03
0.04
0.05
0.06
0.07
σ (n
orm
alis
ed)
b → ts → td → t
Tevatron tj
FIG. 7. Normalized rapidity distribution for t-channel singletop production at Tevatron.
J. A. AGUILAR-SAAVEDRA AND A. ONOFRE PHYSICAL REVIEW D 83, 073003 (2011)
073003-6
ðp‘ þ p�Þ2 ¼ M2W , and choosing for the longitudinal
momentum the solution giving a best reconstructedtop mass.
(ii) tW: the W boson momentum is reconstructed in thesame way but choosing the neutrino momentumsolution with smaller longitudinal momentum.Events are accepted only if the invariant massm‘�b is closer to mt than mjjb, i.e., if the event is
consistent with a semileptonic top decay and ahadronic W decay.
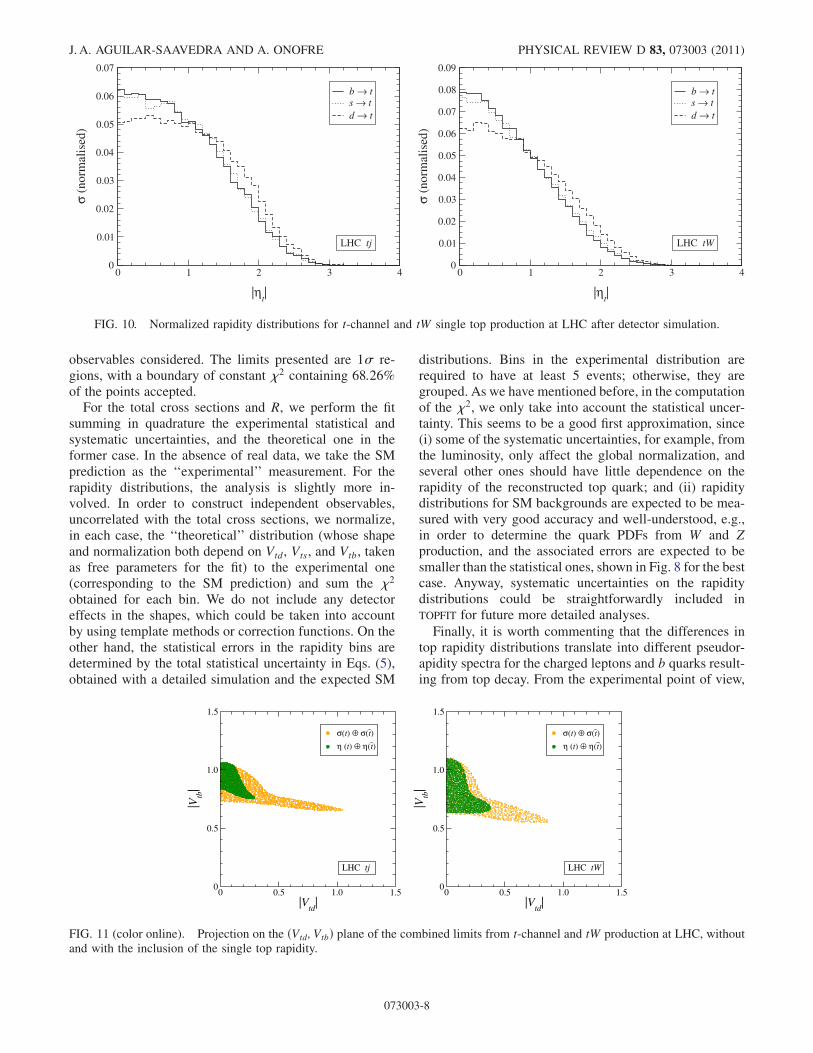
The normalized distributions for the positive chargesamples are presented in Fig. 10. It is seen that, evenwith these nonoptimized reconstruction techniques, a
good share of the differences existing at parton level be-tween d and s, b initial states are kept. More elaboratereconstruction methods and the application of quality cutswill surely improve the discriminating power, but thisanalysis falls beyond the scope of this paper.The background subtraction to isolate the single top
signal seems feasible, as well. The largest background,t�t, is charge-symmetric, and one can imagine to use thesubsample with negatively charged leptons (in which therapidity is a poor discriminant) to achieve a better back-ground normalization. Subsequently, this information canbe used in the positive charge subsample to perform thebackground subtraction with better precision. In any case,the measurement of rapidity distributions, as any otherprecision analysis, is a demanding task from the experi-mental point of view.
IV. IMPROVING CONSTRAINTS WITH SINGLETOP RAPIDITY
In our fits for the top rapidity analyses, we deliberatelyuse the parton-level distributions, in order to show the fullpotential of this variable to improve the limits on Vtd. Ofcourse, as we have indicated in the previous section, thisdistribution will have to be measured by reconstructing the(single) top quark event candidates and performing aproper background subtraction.We obtain our combined limits on ðVtd; Vts; VtbÞ by
using TOPFIT [13], extended with the relevant observablesfor the fit: the single top cross sections in Eqs. (4) and (7),the ratio R, and the rapidity distributions in Figs. 6 and 7.We generate random points in the ðVtd; Vts; VtbÞ parameterspace with a flat probability distribution in the range [0,1.5] and use the acceptance-rejection method to obtain asample distributed according to the combined �2 of the
0 1 2 3 4
|ηt|
0.90
0.95
1.00
1.05
1.10
σ / σ
(ce
ntra
l)
d → t (2 Q0)
d → t (Q0 / 2)
LHC tj
0 1 2 3 4 5
|ηt|
0
0.01
0.02
0.03
0.04
0.05
0.06
0.07
σ (n
orm
alis
ed)
b → t (LO)
d → t (LO)
LHC tj
FIG. 9 (color online). Left: ratio of normalized rapidity distributions for the d ! t t-channel process, using several factorizationchoices (see the text). Right: comparison of the d ! t distributions with three scale choices with the one for b ! t, including thestatistical uncertainties for 10 fb�1 for the latter.
0 1 2 3 4 5
|ηt|
0
0.01
0.02
0.03
0.04
0.05
0.06
0.07σ
(nor
mal
ised
)Protos CTEQ6L1
MC@NLO CTEQ6M
MC@NLO CTEQ6L1
LHC tj
FIG. 8 (color online). Normalized LO rapidity distribution forSM t-channel single top production at LHC, including thestatistical uncertainties for 10 fb�1. The NLO distributions fortwo different PDFs are also shown.
USING SINGLE TOP RAPIDITY TO MEASURE . . . PHYSICAL REVIEW D 83, 073003 (2011)
073003-7
observables considered. The limits presented are 1� re-gions, with a boundary of constant �2 containing 68:26%of the points accepted.
For the total cross sections and R, we perform the fitsumming in quadrature the experimental statistical andsystematic uncertainties, and the theoretical one in theformer case. In the absence of real data, we take the SMprediction as the ‘‘experimental’’ measurement. For therapidity distributions, the analysis is slightly more in-volved. In order to construct independent observables,uncorrelated with the total cross sections, we normalize,in each case, the ‘‘theoretical’’ distribution (whose shapeand normalization both depend on Vtd, Vts, and Vtb, takenas free parameters for the fit) to the experimental one(corresponding to the SM prediction) and sum the �2
obtained for each bin. We do not include any detectoreffects in the shapes, which could be taken into accountby using template methods or correction functions. On theother hand, the statistical errors in the rapidity bins aredetermined by the total statistical uncertainty in Eqs. (5),obtained with a detailed simulation and the expected SM
distributions. Bins in the experimental distribution arerequired to have at least 5 events; otherwise, they aregrouped. As we have mentioned before, in the computationof the �2, we only take into account the statistical uncer-tainty. This seems to be a good first approximation, since(i) some of the systematic uncertainties, for example, fromthe luminosity, only affect the global normalization, andseveral other ones should have little dependence on therapidity of the reconstructed top quark; and (ii) rapiditydistributions for SM backgrounds are expected to be mea-sured with very good accuracy and well-understood, e.g.,in order to determine the quark PDFs from W and Zproduction, and the associated errors are expected to besmaller than the statistical ones, shown in Fig. 8 for the bestcase. Anyway, systematic uncertainties on the rapiditydistributions could be straightforwardly included inTOPFIT for future more detailed analyses.
Finally, it is worth commenting that the differences intop rapidity distributions translate into different pseudor-apidity spectra for the charged leptons and b quarks result-ing from top decay. From the experimental point of view,
0 0.5 1.0 1.5|V
td|
0
0.5
1.0
1.5
|Vtb
|
σ(t) ⊕ σ(t)
η (t) ⊕ η(t)
LHC tj
0 0.5 1.0 1.5|V
td|
0
0.5
1.0
1.5
|Vtb
|
σ(t) ⊕ σ(t)
η (t) ⊕ η(t)
LHC tW
FIG. 11 (color online). Projection on the ðVtd; VtbÞ plane of the combined limits from t-channel and tW production at LHC, withoutand with the inclusion of the single top rapidity.
0 1 2 3 4
|ηt|
0
0.01
0.02
0.03
0.04
0.05
0.06
0.07σ
(nor
mal
ised
)b → ts → td → t
LHC tj
0 1 2 3 4
|ηt|
0
0.01
0.02
0.03
0.04
0.05
0.06
0.07
0.08
0.09
σ (n
orm
alis
ed)
b → ts → td → t
LHC tW
FIG. 10. Normalized rapidity distributions for t-channel and tW single top production at LHC after detector simulation.
J. A. AGUILAR-SAAVEDRA AND A. ONOFRE PHYSICAL REVIEW D 83, 073003 (2011)
073003-8

the latter are easier to measure, especially at lower lumi-nosities, because they do not require the reconstruction ofthe missing neutrino momentum. However, in some cases,a large extent of the information from the top rapidity islost due to spin effects. For example, in t-channel produc-tion, the top quarks are produced with a polarizationP ’ �0:9 in the helicity basis, and charged leptons arepreferably emitted in the opposite direction to the topmomentum. Therefore, the boost along the initial d quarkdirection is smaller for the charged lepton, and the differ-ences among d, s, and b flavors are smeared. On the otherhand, for tW production, the top polarization is smaller,and the charged lepton pseudorapidity spectra show im-portant differences for initial d, s, and b quarks. Theseissues will be studied in more detail elsewhere.
A. Limits at LHC
The excellent statistics for t-channel and tW productionat LHC allow to constrain Vtd only using either of theseprocesses. For illustration, we show in Fig. 11 the projec-tions of the limits on the ðVtd; VtbÞ plane, using the crosssection measurements �ðtÞ and �ð�tÞ and also including therapidities �ðtÞ, �ð�tÞ. In the former case, Vtd is practically
unconstrained, while the cross sections and rapidity distri-butions set the bound jVtdj & 0:4. For Vts, the limits arepractically unchanged.We present in Fig. 12 the result of the global fits,
including either t-channel (up) or tW production (down)and R. We point out that significant constraints on theðVtd; Vts; VtbÞ parameter space can be set by using onlyone of these single top processes, in combination with theR measurement from t�t production. The limits, includingboth processes as well as the s-channel cross section(which has a negligible impact), are given in Fig. 13. Weobserve that the global limits on Vtd are reduced by a factorof 2 with the rapidity distribution analysis, from jVtdj �0:21 to jVtdj � 0:12. The limits on Vtb are also reduced,from 0:92 � jVtbj � 1:05 to 0:94 � jVtbj � 1:05, whereasthe bound jVtsj � 0:27 is not significantly affected.3 Thesefigures may be degraded with detector effects, but animprovement is expected, in any case, when the top rapid-ity distribution is used.
0 0.1 0.2 0.3 0.4 0.5 0.6 0.7 0.8
|Vtd
|
0
0.1
0.2
0.3
0.4
0.5
0.6
0.7
0.8
|Vts|
σ(t) ⊕ σ(t)
η (t) ⊕ η(t)
LHC tj ⊕ RLHC tj ⊕ R
0 0.1 0.2 0.3 0.4 0.5 0.6 0.7 0.8
|Vtd
|
0.4
0.5
0.6
0.7
0.8
0.9
1.0
1.1
1.2
|Vtb
|
σ(t) ⊕ σ(t)
η (t) ⊕ η(t)
LHC tj ⊕ RLHC tj ⊕ R
0 0.1 0.2 0.3 0.4 0.5 0.6 0.7 0.8
|Vts|
0.4
0.5
0.6
0.7
0.8
0.9
1.0
1.1
1.2
|Vtb
|
σ(t) ⊕ σ(t)
η (t) ⊕ η(t)
LHC tj ⊕ R
0 0.1 0.2 0.3 0.4 0.5 0.6 0.7 0.8
|Vtd
|
0
0.1
0.2
0.3
0.4
0.5
0.6
0.7
0.8
|Vts|
σ(t) ⊕ σ(t)
η (t) ⊕ η(t)
LHC tW ⊕ R
0 0.1 0.2 0.3 0.4 0.5 0.6 0.7 0.8
|Vtd
|
0.4
0.5
0.6
0.7
0.8
0.9
1.0
1.1
1.2
|Vtb
|σ(t) ⊕ σ(t)
η (t) ⊕ η(t)
LHC tW ⊕ R
0 0.1 0.2 0.3 0.4 0.5 0.6 0.7 0.8
|Vts|
0.4
0.5
0.6
0.7
0.8
0.9
1.0
1.1
1.2
|Vtb
|
σ(t) ⊕ σ(t)
η (t) ⊕ η(t)
LHC tW ⊕ R
FIG. 12 (color online). Projections on the ðVtd; VtsÞ, ðVtd; VtbÞ, and ðVts; VtbÞ planes of the combined limits from t-channel (up) andtW production (down), in combination with R at LHC.
3We remind the reader that these intervals are not 1� limits onthe individual mixings but the range of variation of the parame-ters in the 1� volume.
USING SINGLE TOP RAPIDITY TO MEASURE . . . PHYSICAL REVIEW D 83, 073003 (2011)
073003-9

B. Limits at Tevatron
Despite the experimental challenges for single top ob-servation at Tevatron [25,26], a future analysis of the toprapidity distributions might improve the global fits. Thismeasurement obviously demands significant statistics but
does not require the separate identification of the t- ands-channel processes. We show in Fig. 14 the combinedlimits, using the sum of sþ t-channel cross sections(up) or combining their separate measurements (down) astwo extreme cases. In both cases, we include the ratio R,
0 0.1 0.2 0.3 0.40.5
0.6 0.7 0.8
|Vtd
|
0
0.1
0.2
0.3
0.4
0.5
0.6
0.7
0.8
|Vts|
σ(t) ⊕ σ(t)
η (t) ⊕ η(t)
LHC all ⊕ R
0 0.1 0.2 0.3 0.4 0.5 0.6 0.7 0.8
|Vtd
|
0.4
0.5
0.6
0.7
0.8
0.9
1.0
1.1
1.2
|Vtb
|
σ(t) ⊕ σ(t)
η (t) ⊕ η(t)
LHC all ⊕ R
0 0.1 0.2 0.3 0.4 0.5 0.6 0.7 0.8
|Vts|
0.4
0.5
0.6
0.7
0.8
0.9
1.0
1.1
1.2
|Vtb
|
σ(t) ⊕ σ(t)
η (t) ⊕ η(t)
LHC all ⊕ R
FIG. 13 (color online). Projections on the ðVtd; VtsÞ, ðVtd; VtbÞ, and ðVts; VtbÞ planes of the combined limits from all single topchannels and R at LHC.
0 0.1 0.2 0.3 0.4 0.5 0.6 0.7 0.8
|Vtd
|
0
0.1
0.2
0.3
0.4
0.5
0.6
0.7
0.8
|Vts|
σ(t + t)
η (t + t)
Tevatron tj + tb ⊕ R
0 0.1 0.2 0.3 0.4 0.5 0.6 0.7 0.8
|Vtd
|
0.4
0.5
0.6
0.7
0.8
0.9
1.0
1.1
1.2
|Vtb
|
σ(t + t)
η (t + t)
Tevatron tj + tb ⊕ R
0 0.1 0.2 0.3 0.4 0.5 0.6 0.7 0.8
|Vts|
0.4
0.5
0.6
0.7
0.8
0.9
1.0
1.1
1.2
|Vtb
|
σ(t + t)
η (t + t)
Tevatron tj + tb ⊕ R
0 0.1 0.2 0.3 0.4 0.5 0.6 0.7 0.8
|Vtd
|
0
0.1
0.2
0.3
0.4
0.5
0.6
0.7
0.8
|Vts|
σ(t + t)
η (t + t)
Tevatron tj ⊕ tb ⊕ R
0 0.1 0.2 0.3 0.4 0.5 0.6 0.7 0.8
|Vtd
|
0.4
0.5
0.6
0.7
0.8
0.9
1.0
1.1
1.2
|Vtb
|
σ(t + t)
η (t + t)
Tevatron tj ⊕ tb ⊕ R
0 0.1 0.2 0.3 0.4 0.5 0.6 0.7 0.8
|Vts|
0.4
0.5
0.6
0.7
0.8
0.9
1.0
1.1
1.2
|Vtb
|
σ(t + t)
η (t + t)
Tevatron tj ⊕ tb ⊕ R
FIG. 14 (color online). Projections on the ðVtd; VtsÞ, ðVtd; VtbÞ, and ðVts; VtbÞ planes of the combined limits from single topproduction and R at Tevatron.
J. A. AGUILAR-SAAVEDRA AND A. ONOFRE PHYSICAL REVIEW D 83, 073003 (2011)
073003-10
as well. The improvement brought by the top rapiditydistribution is not as clear as for LHC, but the results ofour fit suggest that the limits on Vtd, Vtb might both bereduced:
(i) For an inclusive measurement (upper plots), thereduction is of 10% in the Vtd, Vtb bounds, resultingin jVtdj � 0:26, jVtsj � 0:38, 0:70 � Vtb � 1:14.
(ii) If the s- and t-channel cross sections are measuredindependently, the reduction is around 8%, resultingin jVtdj � 0:21, jVtsj � 0:37, 0:80 � Vtb � 1:12.
Therefore, a detailed analysis would be welcome if suffi-cient data is collected. We also note that the estimatedTevatron limit on Vtd is as good as the one expected forLHC, if the top rapidity distribution is not used for thelatter (see the previous subsection).
V. SUMMARY
Single top measurements at Tevatron and LHC are es-sential for the determination of the top quark chargedcurrent interactions—in particular, the CKM matrix ele-ments Vtd, Vts, and Vtb. In this paper, we have pointed outthe important role of the single top rapidity distribution inorder to discriminate the production of top quarks from dinitial states against s and b. This is important not only forthe experimental determination of Vtd but to improve thelimits on Vtb: both of them, as well as Vts, must be obtainedfrom a global fit to several observables, and improving theconstraints on Vtd also tightens the limits on Vtb. We haveshown that, with its excellent statistics, LHC can takeadvantage of this distribution to improve the bound onVtd by a factor of 2. With a luminosity of 10 fb�1 at14 TeV, the limits jVtdj � 0:12, jVtsj � 0:27, 0:94 �jVtbj � 1:05 could be achieved. At Tevatron with a lumi-nosity of 12 fb�1, the corresponding limits would bejVtdj � 0:21, jVtsj � 0:37, 0:80 � Vtb � 1:12, if s- andt-channel cross sections can be measured independentlywith a good precision. Otherwise, the limits would be lessstringent, jVtdj � 0:26, jVtsj � 0:38, 0:70 � Vtb � 1:14. Itis also important to remark here that LHC will improvesignificantly the Tevatron limit on Vtd only if the rapidity
distribution is used or if experimental uncertainties aregreatly reduced with respect to present expectations [15].Our analysis highlights the importance of separating
t and �t events in single top production at LHC. For totalcross sections, the different functional dependence on Vtd,Vts, and Vtb can be exploited to set more stringent boundson them. For rapidity measurements, the separation is evenmore important because the differences between initial dand s, b flavors are much more pronounced for final state tquarks than for antiquarks. We also emphasize the impor-tance of measuring R ¼ Brðt ! WbÞ=Brðt ! WqÞ in t�tproduction. At LHC, the s-channel cross section determi-nation will have large experimental errors; hence, themeasurement of R is essential to set limits on thetop CKM matrix elements in combination with thet-channel and/or tW cross sections. At Tevatron, this ob-servable is also required if the s- and t-channel crosssections are not measured separately and improves thelimits, in any case.Finally, the results presented here make apparent an
obvious fact: the total cross sections are not the only ob-servables sensitive to Vtd, Vts, and Vtb in single top produc-tion processes. Indeed, the determination of these mixingsat Tevatron and LHC will be better achieved by usingtemplate methods and performing a global fit, includingnot only the cross sections but also the rapidity and otherdistributions possibly sensitive to the top mixing parame-ters. This work is left for future experimental studies.
ACKNOWLEDGMENTS
We thank B. Casal and A. Ruiz for useful discussionsand correspondence. This work has been partially sup-ported by CRUP (Accao integrada Ref. E 2/09), FCT(Project. No. CERN/FP/83588/2008), MICINN(FPA2006-05294, FPA2010-17915, and HP2008-0039),Junta de Andalucıa (FQM 101 and FQM 437), and by theEuropean Community’s Marie-Curie Research TrainingNetwork under Contract No. MRTN-CT-2006-035505‘‘Tools and Precision Calculations for PhysicsDiscoveries at Colliders.’’ The work of J. A.A. S. hasbeen supported by a MICINN Ramon y Cajal contract.
[1] N. Cabibbo, Phys. Rev. Lett. 10, 531 (1963).[2] M. Kobayashi and T. Maskawa, Prog. Theor. Phys. 49, 652
(1973).[3] M. Battaglia et al., arXiv:hep-ph/0304132.[4] J. A. Aguilar-Saavedra, Phys. Rev. D 67, 035003 (2003);
69, 099901(E) (2004).[5] F. del Aguila, M. Perez-Victoria, and J. Santiago, Phys.
Lett. B 492, 98 (2000); J. High Energy Phys. 09 (2000)011.
[6] A. Ali, F. Barreiro, and T. Lagouri, Phys. Lett. B 693, 44(2010).
[7] F. del Aguila, M. Cvetic, and P. Langacker, Phys. Rev. D48, R969 (1993).
[8] J. Alwall et al., Eur. Phys. J. C 49, 791 (2007).[9] J. A. Aguilar-Saavedra, Nucl. Phys. B804, 160
(2008).[10] J. Pumplin, D. R. Stump, J. Huston, H. L. Lai, P. Nadolsky,
and W.K. Tung, J. High Energy Phys. 07 (2002) 012.
USING SINGLE TOP RAPIDITY TO MEASURE . . . PHYSICAL REVIEW D 83, 073003 (2011)
073003-11
[11] J. A. Aguilar-Saavedra, Nucl. Phys. B812, 181 (2009);B821, 215 (2009).
[12] W. Bernreuther, P. Gonzalez, and M. Wiebusch, Eur. Phys.J. C 60, 197 (2009).
[13] J. A. Aguilar-Saavedra, J. Carvalho, N. Castro, A. Onofre,and F. Veloso, Eur. Phys. J. C 50, 519 (2007); J. A.Aguilar-Saavedra and J. Bernabeu, Nucl. Phys. B840,349 (2010).
[14] J. A. Aguilar-Saavedra, Nucl. Phys. B843, 638 (2011).[15] G. Aad et al. (The ATLAS Collaboration),
arXiv:0901.0512.[16] J.M. Campbell, R. Frederix, F. Maltoni, and F.
Tramontano, Phys. Rev. Lett. 102, 182003 (2009).[17] Z. Sullivan, Phys. Rev. D 70, 114012 (2004).[18] J.M. Campbell and F. Tramontano, Nucl. Phys. B726, 109
(2005).[19] R. Volpe, arXiv:0910.3329.
[20] T. Aaltonen et al. (CDF Collaboration), CDF ReportNo. 9701; see also http://www-cdf.fnal.gov/physics/new/top/2009/singletop/BDT/SingleTop_BDT.html.
[21] V.M. Abazov et al. (D0 Collaboration), Phys. Rev. Lett.100, 192003 (2008).
[22] S. Frixione and B. R. Webber, J. High Energy Phys. 06(2002) 029; S. Frixione, P. Nason, and B. R. Webber, ibid.08 (2003) 007; S. Frixione, E. Laenen, P. Motylinski, andB. R. Webber, ibid. 03 (2006) 092.
[23] T. Sjostrand, S. Mrenna, and P. Skands, J. High EnergyPhys. 05 (2006) 026.
[24] E. Richter-Was, arXiv:hep-ph/0207355.[25] V.M. Abazov et al. (D0 Collaboration), Phys. Rev. Lett.
103, 092001 (2009).[26] T. Aaltonen et al. (CDF Collaboration), Phys. Rev. Lett.
103, 092002 (2009).
J. A. AGUILAR-SAAVEDRA AND A. ONOFRE PHYSICAL REVIEW D 83, 073003 (2011)
073003-12