
Using Rate of Return Analyses to Understand Sector Skill Needs
35
Using Rate of Return Analyses to Understand Sector Skill Needs Nattavudh Powdthavee Anna Vignoles July 2006
Transcript of Using Rate of Return Analyses to Understand Sector Skill Needs

Using Rate of Return Analyses to Understand Sector
Skill Needs
Nattavudh Powdthavee
Anna Vignoles
July 2006

Published by
Centre for the Economics of Education
London School of Economics
Houghton Street
London WC2A 2AE
© Nattavudh Powdthavee and Anna Vignoles, submitted January 2006
July 2006
ISBN 07530 2017 3
Individual copy price: £5
The Centre for the Economics of Education is an independent research centre funded by the Department for Education and Skills. The views expressed in this work are those of the author and do not reflect the views of the DfES. All errors and omissions remain the authors.

Executive Summary
Policy-makers in almost all countries agree on one thing: namely on the importance of
education and skills to ensuring future economic prosperity. A fruitful line of research has
focused on determining the impact that acquiring education or training has on an individual’s
labour market productivity and earning prospects: this is known as rate of return analysis. The
CEE has undertaken extensive research in this area and provided evidence on the returns to a
variety of qualifications in the UK (CEE Discussion Papers 4, 6, 35 and 47). The CEE has
also investigated specific issues such as the return to basic skills (CEE DP 3), returns to the
marginal learner (CEE DP 45), returns to NVQ2 (CEE DP 46), the returns to qualifications
acquired in adulthood (CEE DPs 19 and 39) and the returns to training (CEE DP 36). In
addition the CEE has researched the range of methodological issues pertaining to rate of
return analysis (see CEE DP 5 and 16).
In this paper we summarise current understanding on the returns to qualifications, focusing
specifically on differences in the economic values of qualifications by sector. First we explain
what we mean by rate of return analysis in section 2. In section 3 we then discuss how rates of
return estimates might be useful for policy-makers, and in particular how those who are trying
to understand and meet the skill needs of different sectors of the economy might use such
information. In section 4 we describe how rates of return are actually calculated in practice,
before going on to summarise the evidence base. We start with a discussion of aggregate
supply and demand in section 5, before focusing on the rate of return to specific qualifications
and types of education in section 6. We conclude with an analysis of what the empirical
evidence implies for policy-makers working on sector skills issues (section 7).
A complex picture emerges from the evidence base.
• In the UK there has been a massive expansion in the supply of qualified labour. This
expansion has not lead to a fall in the average return to a year of schooling in the UK,
suggesting that the demand for qualifications in the UK is still sufficiently high to
justify further expansion.

• Qualifications that are supposedly tailored to employers’ skill needs, such as NVQs,
are actually valued less highly in the labour market. On the ground, it is the traditional
vocational qualifications and academic qualifications that have the greater economic
value.
• Newer vocational qualifications (particularly NVQ2) yield a zero or minimal return in
the labour market, although they do increase an individual’s likelihood of being in
employment.
• The return to lower level vocational qualifications varies substantially across sectors.
More research is needed on the ground to understand why NVQs have been successful
in some sectors and less so in others.
• NVQ qualifications yield a respectably high return if they are acquired through a
modern apprenticeship.
• Rapid expansion of the supply of graduates has resulted in much more variation in
graduate outcomes. Although the overall return to a degree has not declined, it does
appear that some types of more recent graduates are seeing a small decline in the
return to their degree.
• Much of the apparent fall in the return to a degree for very new graduates is
concentrated specifically on graduates who fail to get graduate level jobs.
• There is substantial variation in returns across different degree subjects, and by
implication across different sectors of the economy.
• In particular, the return to arts and humanities degrees for very recent graduates
appears to have fallen to zero.

Using Rate of Return Analyses to Understand Sector
Skill Needs
Nattavudh Powdthavee
Anna Vignoles
1. Introduction 1
2. Some Theory 1
3. Using Rates of Return in Policy-Making 3
4. Measuring the Return to Education 6
5. What id Happening to Aggregate Supply and Demand? 8
6. The Evidence Base: Returns to Education and Training in
the UK 10
Returns to staying on post compulsory schooling 11
The return to UK qualifications 12
Returns to National Vocational Qualifications (NVQ) 13
Returns to apprenticeship 16
Returns to higher education 17
7. Discussion and Policy Implications 20
References 23
Appendix 25

Acknowledgments
Nattavudh Powdthavee is a Research Officer at the Bedford Group for Lifecourse and
Statistical Studies, Institute of Education. Anna Vignoles is a Reader in Economics of
Education at the Bedford Group, Institute of Education, a Research Associate at the Centre for
Economic Performance, London School of Economics and Deputy Director of the Centre for
the Economics of Education.
This literature review was financed by the Sector Skills Development Agency and will be
appearing in a SSDA book in 2006, in a slightly modified form. The views expressed in this
paper are those of the authors and not necessarily those of the Sector Skills Development
Agency nor the Department for Education and Skills.

1. Introduction
Policy-makers in almost all countries agree on one thing: namely on the importance of
education and skills to ensuring future economic prosperity. Certainly we know that countries
with higher levels of education and skill, on average have higher levels of productivity and
economic growth (Machin and Vignoles, 2005). However, proving that there is a causal
relationship between education and skill, and economic growth, at a country level has proved
quite problematic, not least because countries vary in so many dimensions, not just their
levels of education and skill (Sianesi and Van Reenen, 2000). Yet despite the difficulties in
this research area, policy-makers still need to quantify the impact of education and skill if
they are to justify continued investment in education and skill development. A more fruitful
line of research has focused on determining the impact that acquiring education or training
has on an individual’s labour market productivity and earning prospects: this is known as rate
of return analysis. This type of analysis tends to, by necessity, focus largely on qualifications,
rather than skill acquisition per se.
Nonetheless rate of return analyses can still be useful in informing sector skill issues, as we
shall show in this paper. First we explain what we mean by rate of return analysis in section
2. In section 3 we then discuss how rates of return estimates might be useful for policy-
makers, and in particular how those who are trying to understand and meet the skill needs of
different sectors of the economy might use such information. In section 4 we describe how
rates of return are actually calculated in practice, before going on to summarise the evidence
base. We start with a discussion of aggregate supply and demand in section 5, before
focusing on the rate of return to specific qualifications and types of education in section 6.
We conclude with an analysis of what the empirical evidence implies for policy-makers
working on sector skills issues (section 7).
2. Some Theory
In rate of return analyses, education is analysed as an investment, which involves individuals
and the state incurring costs now (lost income or direct costs of tuition), in order to reap gains
in the future (higher income). So how does education and training actually enhance
individuals’ earnings? Human capital theory suggests that when individuals invest in
education and training they make themselves more productive in the labour market, and this
1
then leads them to have higher earnings. This assumes that the labour market is fully
competitive so that wages will fully reflect the productivity of workers, and that any gain in
productivity due to education will subsequently result in higher earnings for the worker. Of
course one can question these assumptions. Signalling theory (Spence, 1973) for example,
hypothesizes that individuals acquire education merely to signal their already superior
productivity to potential employers, and that the education itself is not necessarily
productivity enhancing. Equally there are a number of theoretical reasons as to why wages
may not reflect an individual’s true productivity2. However, the bulk of the empirical
evidence on this issue is broadly supportive of a human capital perspective (Machin and
Vignoles, 2005).
Based on the human capital theory framework, one can use rate of return analyses to evaluate
the economic value of education and training, and this information can be used to guide
policy makers on two crucially important questions, namely:
1) How much education or training and what types of education or training should
individuals invest in?
2) How much education or training and what types of education or training should
society invest in?
Of course if individuals reap the benefits of investment in education and training, in the form
of higher earnings, one might ask why the state is involved in the process at all. There are a
number of market failures that potentially justify state involvement. Firstly, if education or
training has knock on effects to other people and organisations in society, i.e. if there are
externalities, then leaving investment decisions purely to individuals will tend to lead to
underinvestment. This is because individuals only take into account their personal gain from
the investments they are making. Thus if a graduate not only becomes more productive as a
result of her degree, but also causes others in her team to work more productively, then there
is a positive externality from her education that she will ignore when deciding whether to
take a degree or not. In this instance, the state should intervene to encourage her to invest (by
subsidising the education or giving a grant), so that our level of investment in education is
optimal from the perspective of society as a whole. A second important market failure is that
individuals may lack the resources to make education or training investments and may be
2 For example, this might be the case in the public sector where there is no profit motive and wages are less likely to reflect true productivity.
2

unable to borrow what they need, i.e. they are credit constrained. Thus poorer families may
be unable to send their children to school because of they cannot meet the costs of schooling.
This is certainly the case in many developing countries. A number of other market failures
may exist, including information failure. Individuals may not help their children invest in
education to the optimal level because they do not know of the full economic value of
education. By and large these arguments for some state intervention in education have long
been accepted by most societies, as is evident from the fact that primary and secondary
education is state funded in all developed countries.
Equally however, it should be recognized that where governments do intervene in the market
for education and training, they often fail to provide the socially optimal amount of
education/training. This can be because governments invest on the basis of voters’
preferences, which may encourage disproportionate investment in some types of education
(higher education) and less investment in others (special needs education). Another important
reason why state investments may be inefficient is simply that policy-makers do not know
where they should be investing. It is therefore essential that policy-makers have access to
methodologically robust and accurate rate of return analyses to inform them of where they
may expect the highest social or private rate of return to education and training. Only if
policy-makers act on the basis of accurate information about the economic value of different
forms of education and training investment is it likely to be the case that state intervention
actually overcomes the market failures we described above.
3. Using Rates of Return in Policy-Making
So what can rates of return actually tell us? Information on private rates of return3 can inform
individuals as to which type of education or training investment will yield them the highest
return, i.e. the highest future gain in wages. Or more specifically, private rates of return can
inform individuals as to the average rate of return experienced by individuals who have made
that kind of investment in the past.
Social rates of return can inform policy-makers of what they might expect to get back from
investments made by the state, i.e. higher income levels and by implication higher
3 Private rates of return take into account private direct and indirect costs of investment and the private benefit, i.e. the net earnings gain accruing to the individual as a result of his or her educational investment.
3
productivity. Social rates of return take into account the social gain from the investment,
generally measured as higher pre-tax earnings although sometimes including financial
estimates of other wider benefits such as lower crime and better health. On the cost side,
social rates of return take into account any investments made by the state in the education or
training, such as subsidies.
One can then identify where private rates of return are very high relative to social rates of
return, which would suggest that some of the burden of the costs of the investment could be
shifted from the state to the individual thereby reducing the gap between the private and
social rate of return. An example of where rates of return have been used in this way is in
higher education. The private rate of return to higher education in the UK is extremely high,
as we shall see below, and by most accounts much higher than the social rate of return. This
implies that individuals would still invest in their own higher education, even if the state did
not subsidise it as much as it does. This argument was indeed used in the late 1990s to shift
some of the burden of the costs of HE on to individuals via the introduction of tuition fees.
Equally high social rates of return can be used to justify additional resources being allocated
to education and training at the expense of other types of investment, for example
investments in transport. An example of where social rates of return to education is used in
this manner is in the government’s Comprehensive Spending Review, during which each
government department puts forward its estimates of the rate of return on its various proposed
investments. In the case of the Department for Education and Skills, rate of return analyses
have been used to justify a range of educational investments, including support for improving
basic skills and the Government’s “Skills for Life Strategy”.
Some caution is required however. As will be evident from the next section, estimates of the
rate of return to a particular type of investment tend to be based on retrospective data. In
other words, one estimates the rate of return to education by looking at the current labour
market earnings of individuals who acquired different levels of education in the past.
However, this will not necessarily predict the future labour market value of education
acquired today. Thus rates of return are inherently backward looking and one needs to take
care not to use them too prescriptively. For example, in the 1980s and 1990s there was much
discussion of the need for more language graduates to meet the challenge of globalisation.
Rates of return analyses at that time suggested a relatively high return to language degrees
and policy-makers attempted to boost the number of individuals taking that subject. Some
4

years later the rate of return to a language degree is on the low side (particularly for women)4,
and concern has shifted to shortages in other subject areas. In some sense this is what one
would like to see happen. As the supply of language graduates expands so the return to that
degree should fall somewhat. The point is however, that while rate of return analyses can be
used effectively to signal trends in the supply and demand for different types of skill, more
detailed manpower planning on the basis of specific rate of return estimates is fraught with
difficulties.
Another limitation is that rate of return analyses generally focus on the rate of return to
specific qualifications or training investments. Yet what determines individuals’ actual level
of productivity is the level and appropriateness of their skills. Skills are acquired in a number
of different ways, of which arguably the most important is on the job experience and training.
Much of this form of skill acquisition is ignored in the rate of return literature.
With those caveats in mind, what can rate of return analyses tell us about sector skills needs
specifically? Those seeking to understand and meet the skill needs of particular sectors need
more information. They need to understand what is happening to the supply of different
qualifications and skills in their sector, as well as the demand for different types of skill by
employers in that sector. Rate of return analyses can help on two levels. Firstly, they add to
our understanding of what is going on in the market for skills nationally, and in doing so
highlight trends that may cause problems in a particular sector. For example, very high
returns to a particular degree subject suggests either high demand or low supply or both,
which may be very pertinent information for sectors that make high use of graduates from
that discipline.
Equally rate of return analyses that are conducted on a sector-by-sector basis can inform
policy-makers of labour market conditions within a particular sector. One might of course ask
why the value of a particular qualification varies from sector to sector. Surely if the market is
working properly individuals who have a NVQ3 and work in car manufacturing, for example,
will simply start working in another sector if they see that workers with NVQ3 qualifications
are higher paid there. However, the reality is that apparently similar qualifications still differ
enormously in terms of content and applicability to the job, and therefore can vary in terms of
labour market value across different sectors. This is especially the case with many vocational
qualifications. Thus estimating rates of return to different qualifications by sector can not
4 See Table 1 in the Appendix.
5

only inform policy-makers as to relative supply and demand conditions in that sector but can
also potentially inform policy-makers of the effectiveness of different types of qualifications
across different sectors. In other words it can tell us the extent to which a particular
qualification, such as an NVQ2 in hairdressing, is genuinely valued by and valuable to
employers, as compared to an NVQ2 in construction for example.
4. Measuring the Return to Education
Although we will not spend long on the technical details of how rates of return are actually
calculated, a brief explanation will aid the reader in interpreting the evidence base.
Regression analysis is most commonly used to estimate or approximate the return to
education. Information is generally collected on a cross section of individuals working in the
labour market5, including data on their earnings, education and training, work experience or
age and other personal characteristics, such as gender. A statistical model of wages is then
estimated which relates individuals’ current wages to their education and training, as well as
their other characteristics. This is shown below, where
iW indicates individuals’ earnings
represents each individual’s years of schooling or training iS
'X represents individuals’ personal characteristics, such as gender
,log '10 iiii XSwW εγββ +++==
The equation therefore indicates that an individual’s wages6 are determined by their
schooling and personal characteristics. The impact of an additional year of schooling on
wages is given by the coefficient 1β . Thus if the coefficient 1β takes a value of 0.1, this
implies that a person with an additional year of schooling (or increment of training) has
earnings that are around 10% higher than their counterpart that is similar in all other respects
but who does not have the additional year of schooling. Another way of estimating this
5 Although longitudinal data has been used to estimate robust estimates of the rate of return to education. See for example Dearden et al. 2002. 6 The Mincerian wage function is expressed in terms of the logarithm of wages.
6

equation is not to include years of schooling but to use indicators of whether the person has
got a particular type of qualification, such as O levels or an NVQ3. The principle however is
the same. The coefficients on these indicator variables will then indicate the approximate
wage premium associated with that particular qualification, as compared to individuals who
have no qualifications at all.
Most of the UK literature on rates of return analyses uses this methodology, which provides
an estimate of the private return or wage premium associated with a year of schooling or a
particular type of qualification. This approach does take into account the indirect costs of
education, i.e. the lost income due to taking initial schooling. However, to properly calculate
the rate of return to education one must also take account of the direct costs of the
educational investment, such as tuition fees. Most of the estimates of presented in this paper
focus only on the wage gain from education and training, including opportunity costs of
investment but not direct costs. We also said that theory suggests we should be interested in
two types of returns. Firstly, private returns that accrue to the individual, and secondly social
returns that accrue to the state. In practice, most of the UK estimates are private returns or at
best gross returns (which indicate the pre-tax income gain due to education rather than net
income gain). There are far fewer robust estimates of the true social rate of return to
education and training, and even fewer quantified estimates of the wider benefits of education
and training, such as better health and lower crime (noteable exceptions are papers by
Feinstein, 2002). Despite these limitations however, the evidence base on the private returns
to education and training is still potentially very important in helping policy-makers
determine the right skill strategies, as will become apparent below.
Before we review the empirical evidence, it is worth noting the major methodological
problem in this area of work, namely that it is difficult to separate out the impact of education
on individuals’ wages from the impact of individuals’ inherent ability. Thus if more able and
productive individuals tend to acquire more education, it is hard to determine whether their
higher wages (and by implication their productivity) are really down to the education itself.
The most robust evidence in this field has tackled this issue in a number of different ways
(Harmon and Oosterbeek 2000) and has at least partially overcome this particular problem.
One simple way that has been used by a number of UK researchers (Dearden et al. 2002) is to
include measures of ability in the model described above. In other words, one can attempt to
separate the impacts of education and inherent ability by including test scores from early
7

childhood in the model, alongside variables measuring an individual’s education. Other
econometric methods have also been used, including the method of instrumental variables.
We do not discuss the methodologies in detail but merely note that it is an issue to be aware
of, and one that we will need to return to when we discuss the evidence base on the value of
vocational qualifications specifically.
5. What is Happening to Aggregate Supply and Demand?
Even before we start discussing the economic value of specific qualifications, there is a more
fundamental policy question: what has the large expansion in the supply of qualifications
over recent decades done to the UK labour market? Economic theory suggests that a large
expansion in the supply of qualified workers should have lowered the price for skilled labour,
all other things equal. In other words, a large increase in the number of qualified workers
should reduce the rate of return to qualifications. However, we also know that technology is
causing firms to upgrade their skill requirements (Machin and Van Reenen, 1997), and it is
conceivable that the supply of more qualified labour has expanded and yet still not kept
supply with an even larger increase in demand. In this instance, we would expect a rise in the
‘price’ of skilled labour, in other words a rise in the rate of return to qualifications.
So what has happened in practice? Certainly we have expanded the supply of qualifications.
This is illustrated below with data from the recent update to the UK skills audit. The supply
of younger workers with qualifications at level 3 or above has risen dramatically in recent
years, albeit to levels that are still below that of many of our international competitors.
Figure 2 below also indicates that Great Britain and Northern Ireland have very high returns
to schooling7. For example, the rate of return to a year of schooling in Great Britain and
Northern Ireland is second only to the rate of return in the Philippines. Workers with one
more year of schooling in Great Britain earn around 13% more in terms of wages. This
compares to West
7 See also Table 2 in the Appendix.
8

Figure 1 The Supply of 25-28 Years Old at Level 3 or Above
,log '10 iiii XSwW εγββ +++==
Source: Steedman et al. 2004 http://www.dfes.gov.uk/research/data/uploadfiles/RR548.pdf
Germany, for example, where the additional year of schooling is worth only 4%. Other
studies confirm that, using the most robust methodologies and allowing for the ability bias
problem8 we described earlier, the return to education in the UK is between 10-15% for an
additional year of schooling9. This implies a relatively high demand and/or low supply of
more educated workers. Given that we know the supply of more qualified labour has
increased so much, it seems likely that the real factor driving the high return to schooling in
Great Britain and Northern Ireland is in fact very high demand.
The figure below considers the average return to a year of schooling during the period 1985-
1995, the period during which there was a significant expansion in the supply of skilled
labour. Of course what policy-makers would like to know is whether the rate of return is
falling during this period and beyond. Trostel et al. (2002) suggest that rates of return over
time have been relatively stable for both Great Britain and Northern Ireland. Other evidence
supports this (Dearden et al. 2002; Dearden et al. 2004a; Dickerson, 200510). In aggregate
8 That more able individuals get more education and it is hard to distinguish the effect of education from the effect of inherent ability. 9 See Table 4 in the Appendix. 10Dearden, L., McIntosh, S., Myck, M. and Vignoles, A. (2002) ‘The Returns to Academic, Vocational and Basic Skills in Britain’, Bulletin of Economic Research, vol 54, no. 3, pp. 249-274.
Dearden, L; McGranahan, L; Sianesi, B. (2004a). “Returns to Education for the ‘Marginal Learner’: Evidence from the BCS70”, Centre for Economics of Education Discussion Paper No. 45.
9

therefore, there appears to be no major oversupply problem yet. However, as we discuss later
in this paper, this does not mean that the return to education is stable for all types of
education investment and for all types of individuals.
Figure 2 International Comparisons of the Returns to Schooling (1985-1995)
0
2
4
6
8
10
12
14
16
18
20
USA
Great B
ritain
West Germ
any
Russia
Norway
Austra
lia
Netherl
ands
AustriaPola
nd
East G
erman
y
New Zea
land
Italy
Irelan
dJa
pan
Hunga
ry
N. Irela
nd
Sweden
Slovenia
Israe
l
Czech
Rep
.
Bulgari
a
Solvak R
ep.
Canad
a
Czech
oslov
akiaSpa
in
Switzerl
andLa
tvia
Philipp
ines
Ret
urn
to S
choo
ling
(%)
Men Women
Source: Trostel et al (2002)11.
6. The Evidence Base: Returns to Education and Training in the UK
The previous section suggested that the return to a year of education in the UK is between 10
and 15%. However, for policy-makers this is not particularly useful information. There are
many different forms of education and training investments, and we need to understand the
Dickerson, E.P. (2005) A Study on Rates of Return to Investment in Level 3 and Higher Qualifications, Warwick Institute for Employment Reserch. 11Trostel, P.; Walker, I.; Woolley, P. (2002). “Estimates of the Economic Return to Schooling for 28 Countries”, Labour Economics, 9, 1-16.
10
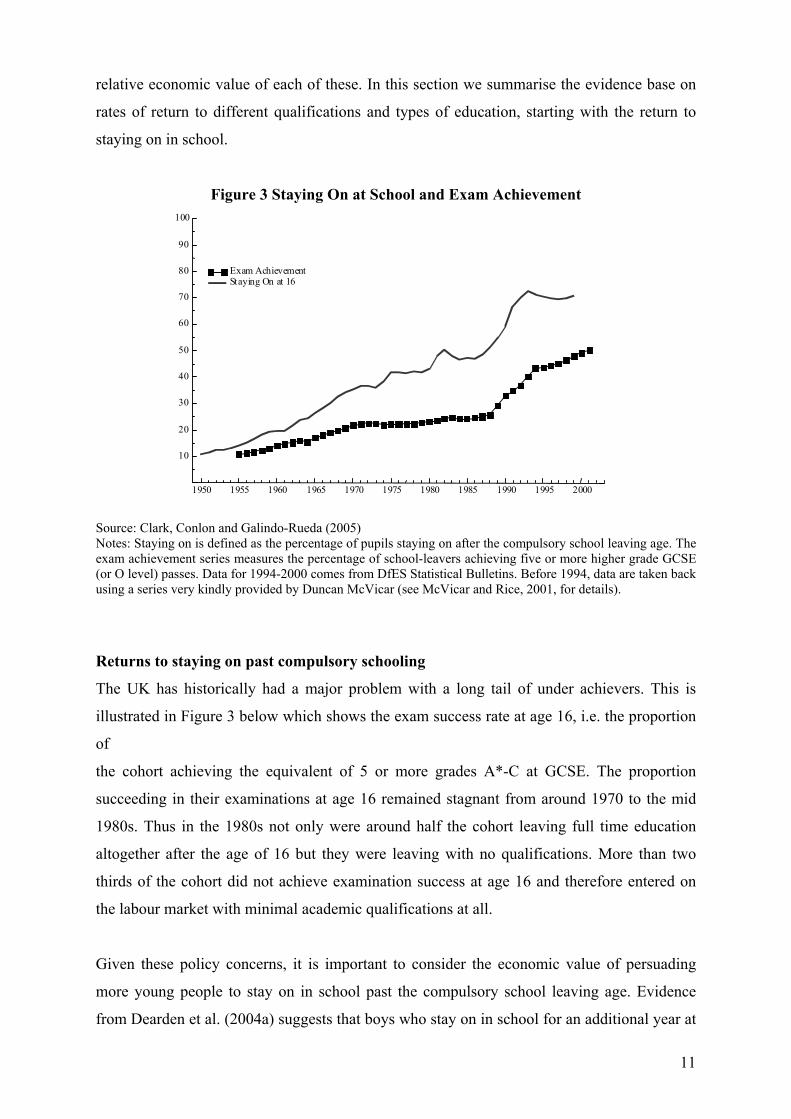
relative economic value of each of these. In this section we summarise the evidence base on
rates of return to different qualifications and types of education, starting with the return to
staying on in school.
Figure 3 Staying On at School and Exam Achievement
1950 1955 1960 1965 1970 1975 1980 1985 1990 1995 2000
10
20
30
40
50
60
70
80
90
100
Exam Achievement Staying On at 16
Source: Clark, Conlon and Galindo-Rueda (2005) Notes: Staying on is defined as the percentage of pupils staying on after the compulsory school leaving age. The exam achievement series measures the percentage of school-leavers achieving five or more higher grade GCSE (or O level) passes. Data for 1994-2000 comes from DfES Statistical Bulletins. Before 1994, data are taken back using a series very kindly provided by Duncan McVicar (see McVicar and Rice, 2001, for details).
Returns to staying on past compulsory schooling
The UK has historically had a major problem with a long tail of under achievers. This is
illustrated in Figure 3 below which shows the exam success rate at age 16, i.e. the proportion
of
the cohort achieving the equivalent of 5 or more grades A*-C at GCSE. The proportion
succeeding in their examinations at age 16 remained stagnant from around 1970 to the mid
1980s. Thus in the 1980s not only were around half the cohort leaving full time education
altogether after the age of 16 but they were leaving with no qualifications. More than two
thirds of the cohort did not achieve examination success at age 16 and therefore entered on
the labour market with minimal academic qualifications at all.
Given these policy concerns, it is important to consider the economic value of persuading
more young people to stay on in school past the compulsory school leaving age. Evidence
from Dearden et al. (2004a) suggests that boys who stay on in school for an additional year at
11

age 16 earn around 11-12% more than boys who drop out at that age. For women the return
to staying on is much higher, around 18%. This suggests that there is a sizeable economic
return to enabling more young people to stay on in school for longer and raises the question
as to why more young people do not stay on, given that they could expect to get such a high
return from doing so. One possibility is that students are credit constrained. This possibility
motivated policies such as the Education Maintenance Allowances scheme, which provides a
cash subsidy to poor students to encourage them to stay on in school past the compulsory
school age of 16.
The return to UK qualifications
Most of those who stay on past the age of 16 end up getting a qualification of some kind,
whether academic or vocational. Understanding the relative economic value of these different
qualifications is also important. Table 1 below gives a summary of the return to a number of
different academic and vocational qualifications in the UK.
The figures in Table 1 represent additive wage premiums. To calculate the return to the usual
route to a degree one must sum returns to O levels, A levels, and a Degree. This table neatly
illustrates a number of important findings in the literature. Firstly, the returns to many UK
qualifications, particularly higher level ones, are high. For example, males with a degree earn
up to 67% more than an unqualified worker. Secondly, the returns to academic qualifications
Table 1 Summary of Returns to Specific Qualifications
Qualification Men Women O levels – GCSE 12-21% 10-19% A levels 15-18% 18-23% Degree 10-28% 21-26% Level 1-2 NVQ/BTEC First Nil Nil Level 3-5 NVQ 6-9% 1-5% C&G Craft 4-7% Nil C&G Advanced 7-10% Nil OND/OND/BTEC National 7-12% 8% HNC/HND 6-22% 3-12%
Source: Dearden et al. 2002.
12
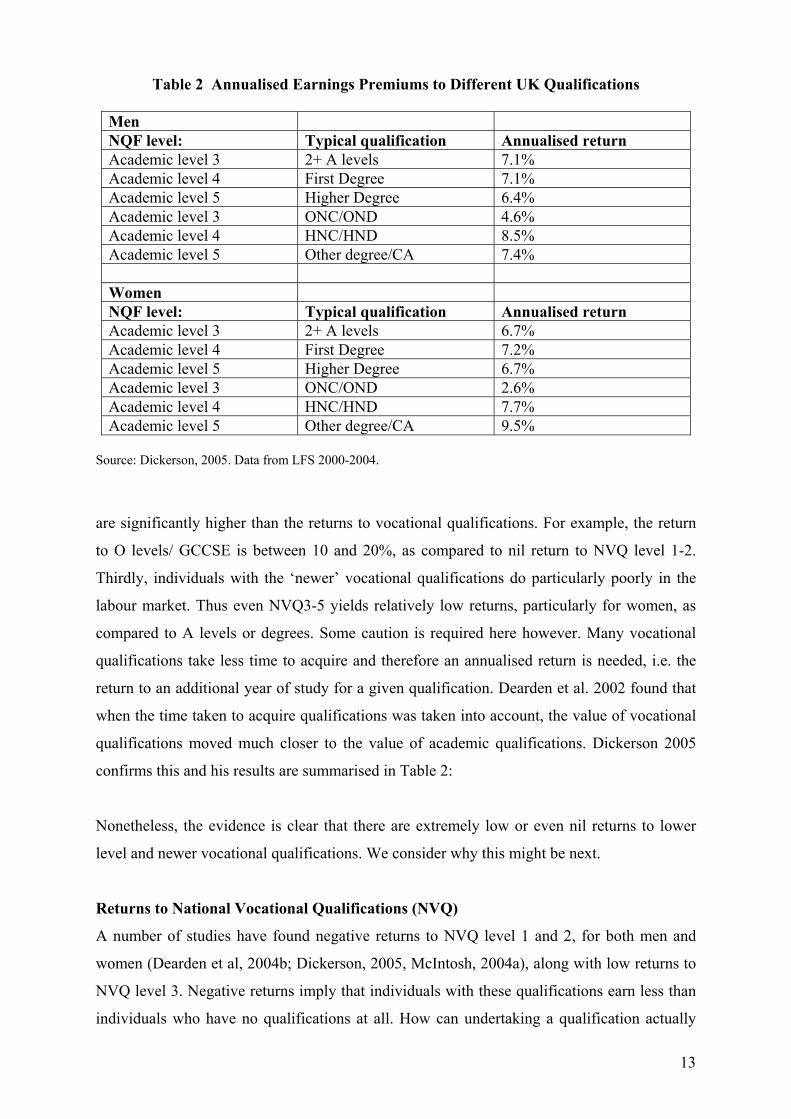
Table 2 Annualised Earnings Premiums to Different UK Qualifications
Men NQF level: Typical qualification Annualised return Academic level 3 2+ A levels 7.1% Academic level 4 First Degree 7.1% Academic level 5 Higher Degree 6.4% Academic level 3 ONC/OND 4.6% Academic level 4 HNC/HND 8.5% Academic level 5 Other degree/CA 7.4% Women NQF level: Typical qualification Annualised return Academic level 3 2+ A levels 6.7% Academic level 4 First Degree 7.2% Academic level 5 Higher Degree 6.7% Academic level 3 ONC/OND 2.6% Academic level 4 HNC/HND 7.7% Academic level 5 Other degree/CA 9.5%
Source: Dickerson, 2005. Data from LFS 2000-2004.
are significantly higher than the returns to vocational qualifications. For example, the return
to O levels/ GCCSE is between 10 and 20%, as compared to nil return to NVQ level 1-2.
Thirdly, individuals with the ‘newer’ vocational qualifications do particularly poorly in the
labour market. Thus even NVQ3-5 yields relatively low returns, particularly for women, as
compared to A levels or degrees. Some caution is required here however. Many vocational
qualifications take less time to acquire and therefore an annualised return is needed, i.e. the
return to an additional year of study for a given qualification. Dearden et al. 2002 found that
when the time taken to acquire qualifications was taken into account, the value of vocational
qualifications moved much closer to the value of academic qualifications. Dickerson 2005
confirms this and his results are summarised in Table 2:
Nonetheless, the evidence is clear that there are extremely low or even nil returns to lower
level and newer vocational qualifications. We consider why this might be next.
Returns to National Vocational Qualifications (NVQ)
A number of studies have found negative returns to NVQ level 1 and 2, for both men and
women (Dearden et al, 2004b; Dickerson, 2005, McIntosh, 2004a), along with low returns to
NVQ level 3. Negative returns imply that individuals with these qualifications earn less than
individuals who have no qualifications at all. How can undertaking a qualification actually
13
lead to lower earnings? Part of the explanation is that individuals who take NVQ2
qualifications tend to be of lower ability than individuals who do not take any qualifications
at all, although the difference is small (Dearden et al. 2004b). This is not the whole story
however, since the same work suggests that even for high ability workers, NVQ 2
qualifications do not give a positive wage premium. This raises the question as to whether
there is a signalling problem here. Workers, regardless of their actual ability, may be
considered by employers to be less able or motivated if they take lower level NVQ
qualifications. Certainly the returns to NVQ2 depend on where the qualification was
obtained. The return is highest if the qualification was obtained via an employer and lowest
(negative) if the qualification was obtained through government training (Dearden et al.
2004b). Since most of the individuals taking NVQ2 via government training were previously
unemployed, this too hints at a signalling problem. If employers perceive that less motivated/
less able and unemployed workers tend to take NVQ2 qualifications, they will offer lower
salaries to workers with this qualification, since on average their expectation is that these
workers will not be very productive. The negative signal that comes from having a NVQ2
will then cause even higher ability workers with NVQ2 qualifications to be paid less (at least
initially). This is just one potential explanation for the poor performance of these newer
vocational qualifications however.
What is also noticeable is that the return to other older Level 2 vocational qualifications (i.e.
apprentices, City & Guilds and BTEC) is generally very positive. For example, males with
City and Guilds qualifications at Level 2 earn 19% more than workers with no qualifications.
Again there is some evidence that part of the explanation for this is that individuals who take
these more traditional Level 2 qualifications are of higher ability. However, the difference in
ability between workers with newer NVQs and those with older qualifications is relatively
small. So perhaps the most likely explanation for the low value-added of the NVQ2, for
example, is that individuals actually learn less through an NVQ2 course than through other
level 2 vocational training. This is somewhat difficult to prove. However, we do know that
the return to NVQs varies by sector (see Figures 4a and 4b), although they remain by and
large negative or zero. For example, the return to NVQ 2 is positive and significant for men
in Energy & Water Sector (12% in 1996-2001, and 3% in 2000-2004). The return to NVQ2 is
positive and significant for women in Public Administration, Education and Health (3%) in
1996-2001. Returns to higher level NVQs also tend to be greater in the private sector, than in
the public sector.
14

This would suggest that where the content of these apparently similar qualifications differs,
so does the economic value of the qualification. It is equally possible therefore, that the
difference in returns between newer NVQs and the more traditional vocational qualifications
is down to genuine differences in content and perceived value by employers.
Figure 4A Returns to NVQ2 by Sectors for Men
-15 -10 -5 0 5 10 15
Other Services
Public Administration, Education & Health
Banking, Finance & Insurance
Transport & Communication
Distribution, Hotels & Restaurants
Construction
Manufacturing
Energy & Water
Agriculture & Fishing
Rate of Return to NVQ2 (%) 1996-2001 2000-2004
Figure 4B Returns to NVQ2 by Sectors for Women
-20 -15 -10 -5 0 5 10
Other Services
Public Administration, Education & Health
Banking, Finance & Insurance
Transport & Communication
Distribution, Hotels & Restaurants
Construction
Manufacturing
Energy & Water
Agriculture & Fishing
Rate of Return to NVQ2 (%) 1996-2001 2000-2004
Source: Dearden et al (2004b); Dickenson (2005) 12.
12 See also Table 3 in the Appendix.
15

There is some good news about NVQs however. Although there is little hard evidence that
taking a NVQ2 helps individuals to achieve higher qualifications later on, there is evidence
that NVQs (even at Level 2) do help individuals to find and remain in employment. For
example, workers with NVQ2 qualifications are 7 percentage points more likely to be
employed if they are male, and 15 percentage points more likely if they are women who left
school with no formal qualification (McIntosh, 2004a). At Level 3 the effect is even more
impressive. Workers with NVQ3 qualifications have employment rates that are 10 percentage
points higher for males and 17 percentage points higher for females. Furthermore, women are
more likely to re-enter the labour market if they take an NVQ2 qualification (Jenkins, 2005).
One must not underestimate the importance that these qualifications may have in assisting
individuals into work or helping them stay the labour market. However, the low wage returns
to NVQ2 remains of significant policy concern.
Returns to apprenticeship
We established that the economic value of lower level NVQs varies according to how the
individual acquired the qualification. NVQs acquired via an employer had higher returns than
those obtained via other routes. This suggests that where employers and employees identify a
need for a particular NVQ qualification it yields a higher return. One would therefore expect
that more structured training that results in NVQ certification would also yield higher returns.
One route of particular interest to those addressing sector skill needs is the Modern
Apprenticeship. Empirical evidence is somewhat mixed however. The return to an
apprenticeship (with or without qualifications) is around 7% for men, but zero for women
(McIntosh, 2004b). Interestingly, the return to an apprenticeship for men is doubled (from 7%
to approximately 14%) if combined with an NVQ qualification at level 3 or above. At NVQ2
level, if the qualification is acquired as a result of an apprenticeship, the return is around 7%.
So apprenticeships that do not lead to qualifications still have some economic value for
males, particularly in manufacturing. However, apprenticeships combined with higher-level
NVQ qualifications yield a much higher return. This implies that where vocational training
leading to an NVQ is delivered jointly by employers and by learning providers, it has greater
economic value in the labour market. The fact that apprenticeship is not working so well for
women may be a sector rather than a gender bias issue. Women are concentrated in particular
sectors of work and if apprenticeship is not so effective in these sectors this would explain the
results. Further investigation of this is needed to be sure however.
16

Returns to higher education
As is well known, there has been a particularly large expansion of higher education in the
UK, resulting in many more individuals having both degrees and other types of level 4
qualifications, such as HNCs and diplomas. Thus it might be in this area that we would
expect to see falls in the return to education, even though in section 5 we concluded that there
had been no aggregate fall in the rate of return to education. On average, compared to having
level 3 qualifications or below, men with some higher education earn 18-21% more, whilst
women earn 25-27% more (Dearden et al. (2004a)). However the more interesting question is
what has happened to the return over time? Figures 5a and 5b show the return to a first degree
for men and women by age at two points in time. The return to a first degree clearly varies
across the life-course, peaking between the ages of 37 and 45 for males and the ages of 33 to
41 years for women. Generally the figures suggest that there has not been much change in the
return to a first degree across the two time periods (1996-1999 and 2000-2003). The
exception being that the youngest age groups that appear to be earning a lower return to their
first degree in 2000-2003, as compared to 1996-1999. Since it is the youngest age groups that
will be most affected by the increase in the supply of graduates coming on to the labour
market, this might be indicative evidence that the return to a first degree is falling.
Figure 5A Returns to First Degree by Time since Graduate for Men
14
18
22
26
30
Age 41-59
Age 37-45
Age 33-41
Age 29-37
Age 25-33
Age 25-29
Rate
of R
etur
n to
Fir
st D
egre
e (%
)
1996-19992000-2003
17

Figure 5B Returns to First Degree by Time since Graduate for Women
20
26
32
38
44
Age 41-59
Age 37-45
Age 33-41
Age 29-37
Age 25-33
Age 25-29
Rate
of R
etur
n to
Firs
t Deg
ree
(%)
1996-19992000-2003
Source: Walker and Zhu, 2005. Note: Least squares estimation on Labour Force Survey data, controlling for first degree, doctorate, Master’s degree, other higher degree, postgraduate certificate in education, vocational qualification and a range of individual characteristics. Some caution is required however. It could be that individuals are taking longer to integrate
into the labour market, and there is some evidence that they are more likely to spend some
time in a non-graduate job than was previously the case. Around one third of new graduates
are finding it more difficult to make the transition into the labour market, ending up in non-
graduate level jobs and earning less as a result (Dolton and Vignoles, 2000; Green et al.
2002). This is particularly a problem for graduates with certain degree subjects, such as arts
and humanities. It does not necessarily mean however, that these individuals will not
eventually end up in graduate jobs earning a high return to their degree. In fact, the evidence
in Table 3 suggests that for graduates who do secure a graduate level job, there has been
hardly any decline in the returns to a degree. It appears that the value of a degree is falling
somewhat only for those who fail to secure graduate level employment.
Furthermore, it may not be the case that all young graduates face the same downturn in the
return to their degree. As the number of graduates has increased, so has the heterogeneity of
the graduate group. This is reflected in the larger variation in returns of a first degree. For
example, Chevalier and Conlon (2003) find that male graduates from prestigious universities
can expect to earn up to 6% more than those from Modern universities. Furthermore, as Table
18

4 illustrates, the returns to a degree vary hugely by subject of degree13. This in turn reflects
the variation in the returns to a degree across different sectors and types of work.
Table 3 Returns to Degrees by Job Types – in percentage (%)
Men Women Non-graduate jobs 96-99 00-03 96-99 00-03 Age 41-59 -4 0 11 11 Age 37-45 7 12 10 7 Age 33-41 14 8 14 22 Age 29-37 12 3 24 12 Age 25-33 11 6 11 18 Age 25-29 12 0 13 11 Graduate jobs 96-99 00-03 96-99 00-03 Age 41-59 28 35 51 53 Age 37-45 34 32 52 53 Age 33-41 28 31 49 59 Age 29-37 28 29 53 53 Age 25-33 32 30 44 47 Age 25-29 30 29 35 38
Source: Walker and Zhu, 2005.
Table 4 indicates that in certain subjects, such as economics, business and law, there has been
little change in the return to a first degree across the two time periods, at least for males.
Nonetheless, the overriding trend is downward for the youngest cohort. Furthermore,
although the return to most subjects is still very high by international standards, in some
subject areas and for some individuals it has collapsed to zero (arts and humanities for men).
Thus although the demand for graduates still outstrips the supply and so there is still a
significant payoff for possessing higher educational qualifications (Blundell, Dearden and
Sianesi, 2005; McIntosh, 2005), this recent evidence does suggest a slight fall in the wage
premium for very recent graduates in particular subjects (Purcell et al. 2005; Sloane and
O’Leary, 2004; Walker and Zhu, 2005). In particular, very recent arts and humanities
graduates have seen a fall in the immediate return to their degrees to zero.
13 See also Table 1 in the Appendix for the returns to narrower subject areas.
19
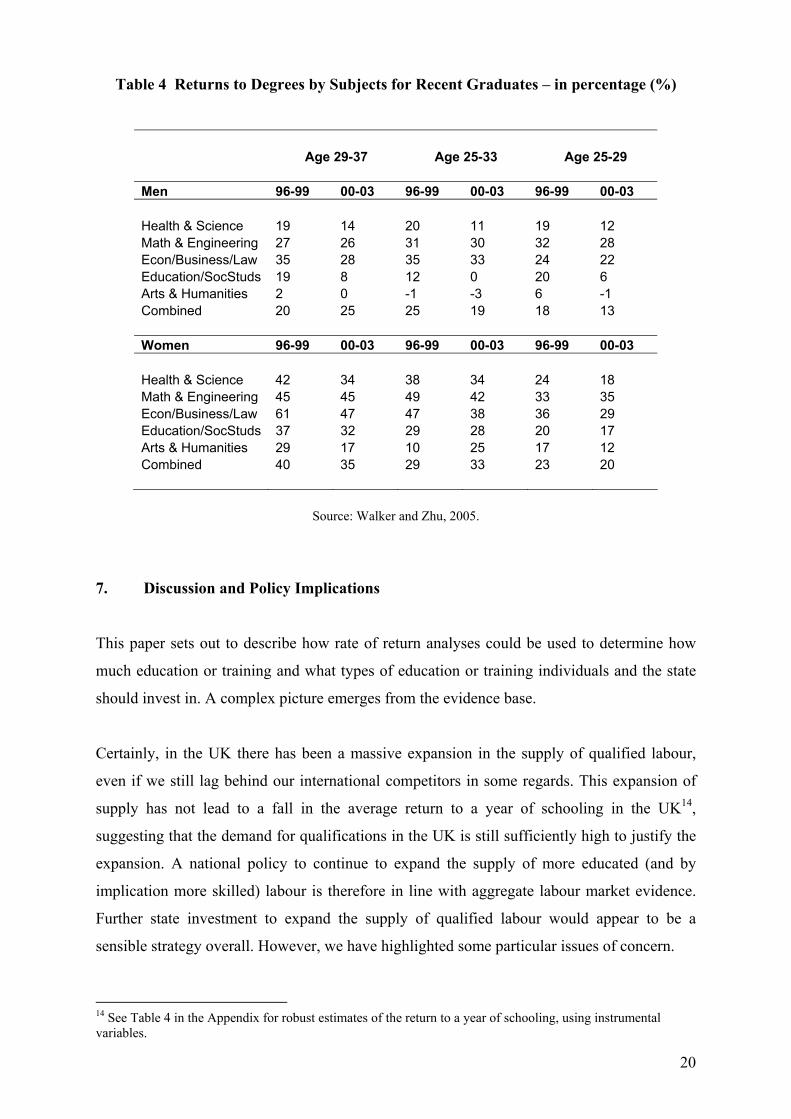
Table 4 Returns to Degrees by Subjects for Recent Graduates – in percentage (%)
Age 29-37 Age 25-33 Age 25-29 Men 96-99 00-03 96-99 00-03 96-99 00-03 Health & Science 19 14 20 11 19 12 Math & Engineering 27 26 31 30 32 28 Econ/Business/Law 35 28 35 33 24 22 Education/SocStuds 19 8 12 0 20 6 Arts & Humanities 2 0 -1 -3 6 -1 Combined 20 25 25 19 18 13 Women 96-99 00-03 96-99 00-03 96-99 00-03 Health & Science 42 34 38 34 24 18 Math & Engineering 45 45 49 42 33 35 Econ/Business/Law 61 47 47 38 36 29 Education/SocStuds 37 32 29 28 20 17 Arts & Humanities 29 17 10 25 17 12 Combined 40 35 29 33 23 20
Source: Walker and Zhu, 2005.
7. Discussion and Policy Implications
This paper sets out to describe how rate of return analyses could be used to determine how
much education or training and what types of education or training individuals and the state
should invest in. A complex picture emerges from the evidence base.
Certainly, in the UK there has been a massive expansion in the supply of qualified labour,
even if we still lag behind our international competitors in some regards. This expansion of
supply has not lead to a fall in the average return to a year of schooling in the UK14,
suggesting that the demand for qualifications in the UK is still sufficiently high to justify the
expansion. A national policy to continue to expand the supply of more educated (and by
implication more skilled) labour is therefore in line with aggregate labour market evidence.
Further state investment to expand the supply of qualified labour would appear to be a
sensible strategy overall. However, we have highlighted some particular issues of concern.
14 See Table 4 in the Appendix for robust estimates of the return to a year of schooling, using instrumental variables.
20
Firstly, whilst the return to academic and older vocational qualifications has remained high,
newer vocational qualifications (particularly NVQ2) yield a zero or minimal return in the
labour market. Research suggests that lower level NVQs can assist those individuals who are
out of the labour market back into work, so they do have some economic value. However, the
evidence seems to suggest that the content and hence the real value of these qualifications to
employers, varies substantially across sectors. More research is needed on the ground to
understand why NVQs have been successful in some sectors and less so in others. We know
that qualifications do not equate to skill and perhaps NVQs in some sectors are not providing
individuals with the skills that employers need. We also need to inform individuals about the
variable and low returns to these newer vocational qualifications so that they can make
optimal decisions about what type of education and training to invest in. For example, many
of these NVQ qualifications yield a respectably high return if they are acquired through a
modern apprenticeship. This is the type of vital information that a young person needs when
making his or her career decisions.
At the other end of the scale, rapid expansion of the supply of graduates has resulted in much
more variation in graduate outcomes. Although the overall return to a degree has not
declined, suggesting sufficient demand for the kinds of skill developed in higher education, it
does appear that some types of more recent graduates are seeing a small decline in the return
to their degree. Much of the apparent fall in the return to a degree for very new graduates is
concentrated specifically on graduates who fail to get graduate level jobs. Around one third
of new graduates are ending up in non-graduate level jobs and earning less as a result.
Furthermore, the likelihood of not being able to get a graduate job is higher for graduates
with particular degree subjects, namely those subjects that also have very low returns, such as
arts and humanities. Certainly there is increasing diversity of the graduate group, with larger
variation in returns across different degree subjects, and by implication across different
sectors of the economy. The strength of the demand for different degree subjects obviously
varies and for some subjects, it appears we already have sufficient supply. In particular, the
return to arts and humanities degrees for very recent graduates appears to have fallen to zero.
This evidence has important implications for the higher education sector, given that the
introduction of higher and variable tuition fees is likely to focus students’ minds on the return
to their choice of degree subject. By shifting some of the costs of HE on to students, it is
likely that more students will seek to choose subjects that better reflect the demands of the
labour market. One would expect therefore a decline in the numbers taking certain subjects
that are already showing signs of oversupply.
21

What all this means in policy terms is that we need to be doing more to understand how well
different qualifications meet the needs of employers, particularly in terms of their curriculum
content. It is an interesting fact that qualifications that are supposedly tailored to employers’
skill needs, such as NVQs, are actually valued less highly in the labour market. Employers
may demand certain specific skills that are indeed encapsulated in NVQs but on the ground, it
is the traditional vocational qualifications and academic qualifications that have the greater
economic value. In this context, there is still much to be done in terms of rethinking our
vocational strategy and ensuring that our vocational qualifications really do develop the range
of skills that employers need. Of course, the evidence presented here is very much looking
backwards, showing the current labour market value of qualifications that were introduced
some time ago. It cannot tell us about the likely economic value of the newer vocational
qualifications, such as vocational GCSEs. What we can conclude however is that a policy of
expanding the aggregate supply of skills is not sufficient. What is needed is an expansion of
the supply of the right kind of skills. For this to happen, employers, individuals and policy-
makers need robust up to date information on the real labour market value of different
qualifications, in order to help them navigate through the increasingly complex education
system and make the optimal kinds of investment decisions.
22

References:
1. Blundell, R., Dearden, L., and Sianesi, B. (2005). “Evaluating the effect of education
on earnings: models, methods and results from the National Child Development
Survey”, Journal of the Royal Statistical Society: Series A, Vol. 168, No. 3, pp. 473-
512.
2. Chevalier, A., and Conlon, G. (2003). “Does it Pay to Attend a Prestigious
University?”, IZA Discussion Paper No. 848.
3. Clark, D., Conlon, G. and Galindo-Rueda, F. (2005). “Post Compulsory Education
and Qualification Attainment”, in The Economics of Education in the United
Kingdom, G. Conlon, S. Machin and A. Vignoles (eds). Princeton University Press:
Princeton and Oxford.
4. Dearden, L., S. Mcintosh, M. Myck and A. Vignoles (2002) The Returns to Academic
and Vocational Qualifications in Britain, Bulletin of Economic Research, 54, 249-
274.
5. Dearden, L; McGranahan, L; Sianesi, B. (2004a). “Returns to Education for the
‘Marginal Learner’: Evidence from the BCS70”, Centre for Economics of Education
Discussion Paper No. 45.
6. Dearden, L; McGranahan, L; Sianesi, B. (2004b). “An In-depth Analysis of the
Returns to National Vocational Qualifications Obtained at Level 2”, Centre for
Economics of Education Discussion Paper No. 46.
7. Dickerson, A.P. (2005). “A Study on Rates of Return to Investment in Level 3 and
Higher Qualifications”, Warwick Institute for Employment Research: University of
Warwick, manuscript.
8. Dolton, P. and Vignoles, A. (2000) 'The Incidence and Effects of Overeducation in
the Graduate Labour Market', Economics of Education Review, Vol. 19, pp.179-198.
9. Feinstein, L. (2002) Quantitative estimates of the social benefits of learning, 1: crime,
Wider Benefits of Learning Research Report No.5.
10. Feinstein, L. (2002) Quantitative estimates of the social benefits of learning, 2: health
(depression and obesity), Wider Benefits of Learning Research Report No.6.
11. Green, F., McIntosh, S., and Vignoles, A. (2002) “The Utilization of Education and
Skills: Evidence from Britain”, Vol. 70, No.6, pp.792-811.
12. Harmon, C. and Oosterbeek, H. (2000) ‘The Returns to Education: A Review of Evidence,
Issues and Deficiencies in the Literature’, CEE Discussion Paper No. 5.
http://cee.lse.ac.uk/cee%20dps/CEEDP05.pdf
23

13. Machin, S. and Van Reenen, J. (1997). ‘Technology and Changes in Skill Structure:
Evidence from Seven OECD Countries’, Quarterly Journal of Economics (November
1998) CXI, 113, 1215-44.
14. Jenkins, A. (2005). “Women, lifelong learning and employment”, CEE Discussion
Paper No. 39, http://cee.lse.ac.uk/cee%20dps/ceedp39.pdf .
15. McIntosh, S. (2004a). “The Impact of Post-school Vocational Qualifications on the
Labour Outcomes of Low-achieving School Leavers in the UK”, Centre for
Economics Performance, London School of Economics, manuscript.
16. McIntosh, S. (2005) Skills & Labour Market Outcomes, London School of Economics
mimeo.
17. McVicar, D., & Rice, P. (2001). Participation in Further Education in England and
Wales: an Analysis of Post-War Trends. Oxford Economic Papers, 53, 47 - 66.
18. Machin, S. and Vignoles, A. (2005) What’s the Good of Education?: The Economics
of Education in the UK, Princeton University Press: Princeton and Oxford.
19. McIntosh, S. (2004b). “The Returns to Apprenticeship Training”, Centre for
Economics Performance, London School of Economics, manuscript.
20. Purcell, K., Elias, P., Davies, R., Wilton, N. (2005) The Class of ’99: A study of the
early labour market experiences of recent graduates, Department for Education and
Skills Research, www.dfes.gov.uk/research
21. Sloane, P.J., and O’Leary, N.C. (2004). “The Return to a University Education in
Great Britain”, IZA Discussion Paper No. 1199.
22. Sianesi, B. and VanReenen, J (2000) ‘The returns to education: a review of the macro
literature’, London School of Economics: CEE Discussion Paper No. 20,
http://cee.lse.ac.uk/cee%20dps/CEEDP06.pdf .
23. Spence, M. (1973) Job Market Signalling, Quarterly Journal of Economics, 87, pp.
355-374.
24. Trostel, P.; Walker, I.; Woolley, P. (2002). “Estimates of the Economic Return to
Schooling for 28 Countries”, Labour Economics, 9, 1-16.
25. Walker, I, and Zhu, Y. (2005). “The College Wage Premium, Overeducation, and the
Expansion of Higher Education in the UK”, IZA Discussion Paper No. 1627.
24

Appendix
Table 1A Percentage Returns to Narrow First Degree Subjects for Men (1994-2004)
Men Mark-up Accountancy 42.15 Electrical engineering 40.73 Maths and computing 37.23 Mechanical engineering 33.71 Medicine and related 32.06 Engineering and technology 31.85 Civil engineering 29.25 Economics 28.57 Law 28.04 Education 26.47 Business and financial studies 26.53 Sciences 25.22 Geography 23.42 Combined 22.41 Architecture and related 20.97 Languages 19.22 Psychology 18.66 Biology 15.87 Politics 15.70 Nursing 14.39 Social sciences 14.20 History 11.69 English 10.84 Sociology 10.83
25
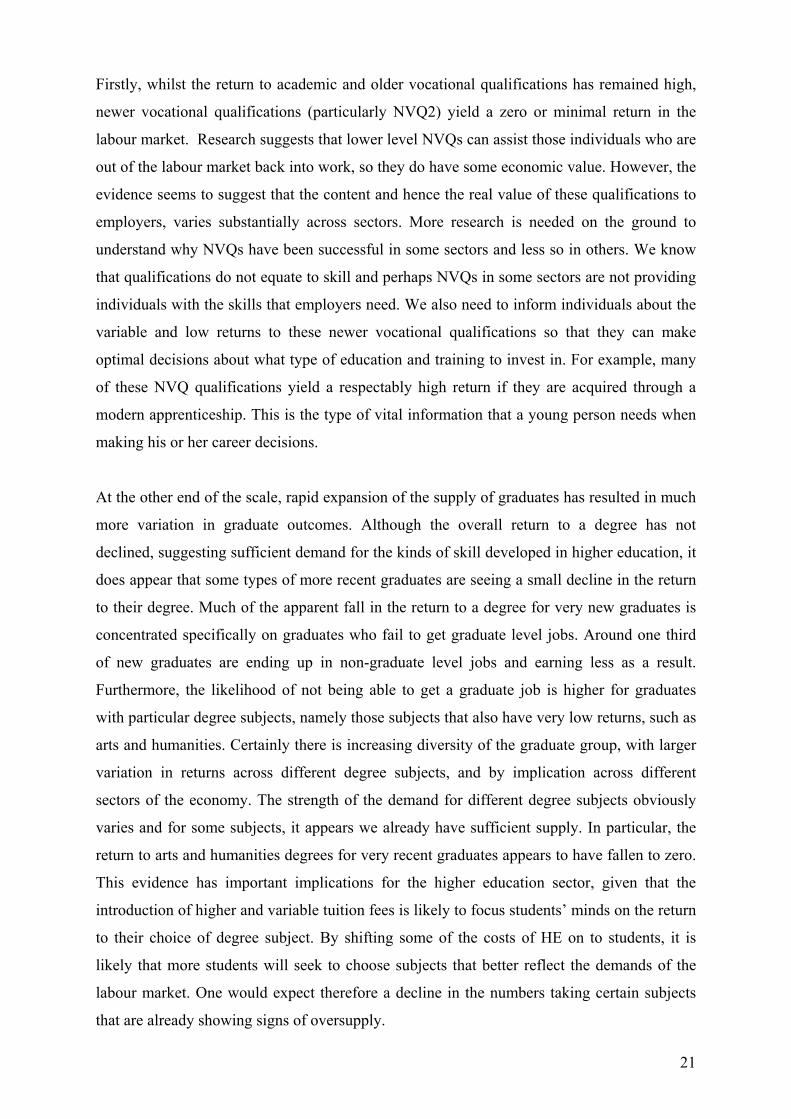
Table 1B Percentage Returns to Narrow First Degree Subjects for Women (1994-2004)
Women Mark-up Accountancy 37.12 Medicine and related 27.52 Law 23.97 Education 22.40 Electrical engineering 19.04 Architecture and related 18.70 Maths and computing 18.10 Business and financial studies 14.34 Nursing 13.93 Mechanical engineering 13.84 Civil engineering 13.70 Engineering and technology 13.54 Social sciences 13.45 Economics 9.68 English 6.65 Sociology 6.50 Sciences 6.13 Combined 5.58 Geography 4.34 Languages 3.30 Psychology 1.98 Biology 1.60 History 0.95 Politics -0.91
Note: All returns are measured relative to an Arts degree.
Source: Sloane and O’Leary (2004)
26

Table 2 International Comparisons of the Returns to Schooling (1985-1995) – in percentage (%)
Men Women USA 7.4 9.6 Great Britain 12.7 13 West Germany 3.6 4.3 Russia 4.4 5.3 Norway 2.3 2.5 Australia 5.1 5.2 Netherlands 3.1 1.9 Austria 3.8 6.4 Poland 7.3 10 East Germany 2.6 4.5 New Zealand 3.3 2.9 Italy 3.7 5.3 Ireland 8.5 9 Japan 7.5 9.4 Hungary 7.5 7.7 N. Ireland 17.4 14.6 Sweden 2.4 3.3 Slovenia 8 10.1 Israel 5.3 6.1 Czech Rep. 3.5 4.3 Bulgaria 4 5.7 Solvak Rep. 5.2 6.4 Canada 3.8 4.5 Czechoslovakia 3.1 3.6 Spain 4.6 3.8 Switzerland 4.5 4.8 Latvia 6.7 7.8 Philippines 11.3 19.2 Pooled 4.8 5.7
27

Table 3 The Returns to NVQ2 by Sectors for Men (%)
1996-2001
2000-2004
Agriculture & Fishing -6.4 -3.9 Energy & Water 12.3 3.3 Manufacturing -1.9 -5 Construction -4 1.3 Distribution, Hotels & Restaurants -4.6 -0.7 Transport & Communication -3.8 0.4 Banking, Finance & Insurance -14.3 -13.6 Public Administration, Education & Health -8.3 -10.2 Other Services -7.2 -6.5
Table 3B: The Returns to NVQ2 by Sectors for Women (%)
1996-2001
2000-2004
Agriculture & Fishing 4.3 -13.8 Energy & Water -11.8 -19.4 Manufacturing -0.4 -5.2 Construction -2.9 -15 Distribution, Hotels & Restaurants 1.3 -5.7 Transport & Communication -6.7 -12 Banking, Finance & Insurance -6.6 -13.6 Public Administration, Education & Health 3.1 -12 Other Services 6.6 -10
28

Table 4 Instrumental Variables (IV) Estimates of the Return to Schooling for the UK
OLS IV Instruments
NCDS Men 4.8% 5.5% Family composition, parental education
Dearden (1998)
FES 78-86 Men 6.1% 15.2% Changes in school leaving age
Harmon and Walker (1995)
GHS 92 Men 4.9% 14.0% Changes in school leaving age and
Harmon and Walker (1999) educational reforms
NCDS Men 5.0% 9.9% Family background
Harmon and Walker (2000)
Twins research (Women) 7.7% 10.4% Smoking at 16 on identical twins data
Bonjour et al (2003)
29