1365 Partially Implantable Active Middle Ear Implant for ...

Using panel data to partially identify HIV prevalence when
HIV status is not missing at random∗
Bruno Arpino† Elisabetta De Cao‡ Franco Peracchi §
August 8, 2011
Abstract
Good estimates of HIV prevalence are important for policy makers in order toplan control programs and interventions. Although population-based surveys are nowconsidered the “gold standard” to monitor the HIV epidemic, they are usually plaguedby problems of nonignorable nonresponse. We use a bounding approach to assess theuncertainty that nonresponse causes when estimating HIV prevalence in rural Malawiusing data from the Malawi Diffusion and Ideational Change Project (MDICP). Weexploit the longitudinal nature of the data and the absorbing nature of HIV to narrowthe worst-case bounds without imposing assumptions on the missing-data mechanism.We then use plausible instrumental variables and monotone instrumental variablesrestrictions to further narrow the bounds.
JEL Classification: C13; I10.
Keywords: HIV prevalence; Nonignorable nonresponse; Nonmonotone nonresponse;Partial identification; Longitudinal data; MDICP data.
∗We thank Hans-Peter Kohler and Philip Anglewicz for providing the data from the Malawi Diffusionand Ideational Change Project (MDICP) and for support. The MDICP has been funded by the NationalInstitute of Child Health and Human Development and the Rockfeller Foundation, and received ethicalapproval from institutional review boards at the University of Pennsylvania and the University of Malawi.†Department of Decision Sciences and Dondena Centre for Research on Social Dynamics, Bocconi Uni-
versity.‡Dondena Centre for Research on Social Dynamics, Bocconi University. Corresponding author
([email protected]).§University of Rome Tor Vergata and EIEF.
1 Introduction
The prevalence of HIV in a population is defined as the proportion of people who are
infected or, equivalently, the probability that a randomly drawn individual has the disease.
Having reliable estimates of the HIV prevalence is essential for policy makers in order to
plan control programs and interventions. Since the mid-1980s, the mainstay for monitoring
the HIV epidemic has been facility-based sentinel surveillance data. Based on these data,
HIV prevalence has been found to be higher among women, sexually active people, and in
urban areas. In many cases, estimates have been derived from pregnant women attending
antenatal clinics (ANC) (Brookmeyer, 2010). ANC data have several sources of bias. First,
they are only representative of pregnant women who are sexually active, and exclude men.
Second, they may provide biased estimates even for the sub-population of pregnant women
because of the selective location of the clinics, that are more concentrated in urban areas.
As a result, ANC-based estimates of HIV prevalence may be substantively biased upward
(UNAIDS, 2003; Gouws et al., 2008; Montana et al., 2008; Reniers and Eaton, 2009).
In recent years, many large-scale national surveys began to include biomarker modules
to collect information on HIV serostatus. These biometric surveys are an important new
source of data because they accurately measure HIV status and are not restricted to a
selected sub-population, as it is the case with ANC-based surveys. Estimates of HIV
prevalence derived from biometric surveys are, in general, considerably lower than those
based on ANC data (Gouws et al., 2008; Montana et al., 2008). Based on these new results,
UNAIDS corrected downward HIV prevalence estimates in several countries (Brookmeyer,
2010).
Even tough population-based surveys are now considered the “gold standard” to moni-
tor the HIV epidemic (Boerma et al., 2003; Garcia-Calleja et al., 2006; Martin-Herz et al.,
2006; Sakarovitch et al., 2007; Gouws et al., 2008; Mishra et al., 2008a) these data may also
be affected by a different but not necessarily less severe source of bias, due to missing data
on the respondents’ HIV status. There are two main causes of missing data: refusal to take
1
part to the HIV testing procedures and temporary absence or migration of the respondent.
Approaches that discard cases with missing HIV status (complete-case analysis) implicitly
rely on the assumption that data are Missing Completely at Random (MCAR) (Rubin,
1976). Because MCAR implies that the distribution of observable characteristics should
be the same for cases with and without missing data, this assumption is easily testable and
is often rejected by the data. For example, Janssens et al. (2008) report that refusal to
participate to the HIV test is higher for men and for richer people. Failure of the MCAR
assumption is likely to produce biased estimates of the HIV prevalence.
To relax the MCAR assumption, imputation and weighting techniques are frequently
used to estimate HIV prevalence (Mishra et al., 2008b; McNaghten et al., 2007; Mishra
et al., 2008a). These methods, based on the weaker Missing at Random assumption (MAR)
(Little and Rubin, 1987; Rubin, 1989) produce unbiased estimates only if the missing
data mechanism does not depend on unobservable characteristics. In fact, there may
be important potential unobserved differences between individuals, such as knowledge or
perceptions about one’s HIV-status, that can severely bias HIV prevalence estimates. For
example, there is evidence that people refusing to be tested have higher risk of being
infected (Reniers and Eaton, 2009; Janssens et al., 2008). Fear, social stigma and privacy
are some of the reasons behind refusal. It has also been found that those who are not
interviewed because of migration have higher risk of being HIV infected (Marston et al.,
2008; Crampin et al., 2003; Lurie et al., 2003; Obare, 2010). Anglewicz (2007) analyzed
this phenomenon in the context of a longitudinal survey for Malawi. A migration follow-up
was specifically designed to interview respondents who did not participate in one of the
waves of the survey because of absence. He found that migrants were likely to report a
higher number of sexual partners and to be HIV positive. An explanation is that HIV
infected people are more likely to migrate as a consequence of union dissolution, due to
death of the partner or divorce.
Alternative approaches that relax the MAR assumption are routinely applied in econo-
metrics (see Vella, 1998, for a survey) and have recently been used to estimate HIV preva-
2

lence (Bignami-Van Assche et al., 2005; Lachaud, 2007; Janssens et al., 2008; Reniers and
Eaton, 2009; Barnighausen et al., 2011). For example, Barnighausen et al. (2011) use data
from the Zambia Demographic and Health Survey (DHS), where 28% of men refused to
be tested, and found that the estimate of male HIV prevalence based on imputed data is
12%, while using a Heckman-type selection model (Heckman, 1979) it increases to 21%.
Their result suggests that bias in prevalence estimates can be very severe when missingness
depends on unobserved variables. One problem with these alternative approaches is that
they tend to impose strong restrictions on the distribution of the unobservables.
The aim of our paper is to study what can be learned about HIV prevalence when
data are subject to a nonignorable missing data mechanism. In order to avoid strong
untestable assumptions, following Horowitz and Manski (1998) and Manski (1995, 2003)
we switch the focus away from point identification, which typically relies on a combination
of strong requirement about the data and strong assumptions about the model, to partial
identification. We first use the empirical evidence alone to identify a region of credible
values for the parameter of interest. We then exploit the availability of panel data and
the absorbing nature of HIV to narrow the width of this region. Although additional
assumptions, such as instrumental variable (IV) and monotone instrumental variable (MIV)
restrictions, may be used to further narrow the width of the identification region, our main
contribution is to show the power of combining substantive information about the HIV
process with the longitudinal nature of the data.
We use data from the Malawi Diffusion and Ideational Change Project (MDICP), a
longitudinal survey conducted every two years in rural Malawi. Malawi is one of the
countries most affected by the HIV epidemic. Out of a population of 15 million people,
80% of them living in rural areas, almost one million people are living with HIV (UNGASS,
2010) and AIDS is the leading cause of death among adults (CIA, 2009). The national
HIV prevalence rate, based on the 2004 Malawi Demographic and Health Survey (MDHS),
is equal to 11.8% for people aged 15–49. Like for most countries in sub-Saharan Africa,
where HIV is mainly transmitted via heterosexual contact, HIV prevalence is estimated
3

to be higher for women than for men (13.3% against 10.2%), and to be higher in urban
than in rural areas (17.1% versus 10.8%). Although the MDICP may only be considered
representative of the population of rural Malawi, it has the advantage over the MDHS of
being a longitudinal survey with three waves available for the years 2004, 2006 and 2008,
a period not covered by the MDHS.
The remainder of this paper is organized as follows. Section 2 describes the data and the
problem of missing data. Section 3 reviews the bounding approach and shows how to exploit
the longitudinal nature of the data and the absorbing nature of HIV to narrow the worst-
case bounds. It also discusses how to use plausible instrumental variables and monotone
instrumental variables restrictions to further narrow the bounds. Section 4 presents the
estimated HIV prevalence bounds for the whole population, and then by region, gender
and cohort. Finally, Section 5 offers some conclusions.
2 Data
Our data come from the Malawi Diffusion and Ideational Change Project (MDICP), a
longitudinal survey conducted in rural Malawi.1 This data set is particularly interesting
for our purposes because it is longitudinal and includes HIV tests for the years 2004, 2006
and 2008.
2.1 MDICP survey design
The MDICP survey has been carried out in three of the 28 Malawian districts, one for each
of the three administrative regions of the country: Balaka in the South, Mchinji in the
Center and Rumphi in the North. The three regions are significantly different in terms of
ethnic composition, language, religious practice, population density, literacy, and prevailing
social system (e.g. patrilocal or matrilocal residence).
The first wave of the survey was carried out in 1998, interviewing 1,541 ever-married
women of childbearing age and 1,198 men, most of them husbands of the married women in1 The data can be freely downloaded from the following website: http://www.malawi.pop.upenn.edu.
4

the sample. The second wave of the survey, carried out in 2001, followed-up the respondents
and interviewed the new spouses of respondents who got married between the first and
the second wave (Watkins et al., 2003). The third ave, carried out in 2004, augmented the
original sample with a random sample of about 1,500 people aged 15–28 (both married and
never-married), to correct for aging of the baseline sample and the fact that the original
sample was restricted to ever-married women and their husband. With this addition, the
survey may be regarded as broadly representative of the population of rural Malawi.2 The
fourth (2006) and fifth (2008) waves added the spouses of newly married people.
The survey instrument collects information on sexual relations, risk assessments, mar-
riage and partnership histories, household rosters and transfers, as well as income and
other measures of wealth. The survey also includes information on village-level variables,
as well as regional market prices and weather related variables. Interviews were carried
out face-to-face. Interviewers were males and females hired and trained locally, so they
were generally of the same ethnic group as the respondents. Effort was put in ensuring
that interviewers spoke the same language as the interviewees. The survey instrument was
translated from English in the three most common local languages (Yao, Chichewa, and
Tumbuka) by a group of university-educated English-speaking supervisors who had first
been extensively trained.
Starting from 2004, a biomarker survey, also called the voluntary consulting and test
(VCT) survey, has been added to the main survey. The biomarker survey consists of a
short questionnaire, administered a few days after the main survey and focused on sexual
behavior and questions related to AIDS, and free tests for HIV and other sexually trans-
mitted infections (STI), carried out by nurses from outside the area. Respondents to the
biomarker survey are also offered pre-test counseling about HIV prevention strategies. In
2004, oral swabs were used for the HIV test and results were given to respondents be-
tween two to four months after testing.3 In 2006 and 2008, the MDICP team used an2 See http://www.malawi.pop.upenn.edu/Level%203/Malawi/docs/Sampling3.pdf for further details
about the 2004 sampling strategy.3 Thornton (2008) run an experiment that consists in giving vouchers with a small monetary rewards
5

improved testing procedure (rapid response blood tests) that eliminates the time delay be-
tween testing and test results. All individuals tested in 2006 and 2008 received their results
immediately. Measurement error in the two types of tests (oral swabs and blood test) is
very limited and, being due only to the accuracy limit of the measuring instruments, it can
be considered as random.
Although the survey was not designed to be representative of the population in rural
Malawi, the characteristics of the 2004 sample closely match those of the 2004 MDHS for
rural Malawi (Thornton, 2008). Since the HIV tests were administered only in 2004, 2006
and 2008, we only use data from these three waves. We focus on people interviewed in
2004, excluding new entrants in 2006 and 2008 and dropping from the analysis people who
were never successfully contacted. Because prevalence is defined on the population of alive
people, we also exclude people who died after 2004. The resulting working sample consists
of 4,062 alive persons in 2004.
2.2 Missing data
In each of the three waves considered, HIV status is missing for a substantial number of
respondents. Missing HIV status may be due to either unit or item nonresponse. Given
that the survey consists of the main survey and the biomarker survey, we define as unit
nonresponse the case in which both parts of the survey are missing because of failure to
establish a contact or refusal to cooperate. Item nonresponse occurs when responding units
do not provide useful answers to particular items of the questionnaire. In this paper, the
item of interest is HIV status.
There are different longitudinal patterns of unit nonresponse across the three waves
considered. About 55% of the sample are unit respondents in all three waves, about 12%
are unit respondents in 2004 and unit nonrespondents in the 2006 and 2008, about 11%
are unit respondents in 2004 and 2006 and unit nonrespondents in 2008.
to the respondents to encourage them to obtain their test results at nearby VCT centers. She shows thatmissingness of HIV status is independent of the receipt of HIV test results by the respondents.
6

Table 1 shows the different sources of missing data. Overall, HIV status is missing
for 29% of the sample in 2004, but the percentage rises to 42% in 2008 as a result of
a large increase in unit nonresponse from 15% to 24% and a more moderate increase in
item nonresponse from 14% to 18%. An important reason for unit nonresponse, and for
its increase across waves, is migration. Hospitalization and refusal to participate in the
survey are relatively unimportant. Other reasons for unit nonresponse are lumped into the
residual category ‘other’, consisting mainly of people who did not fulfill the questionnaire
because they were too old or too sick, or for unknown reasons. An important reason for item
nonresponse is refusal to get tested, although the refusal rate in the MDICP is relatively
low compared to the 2004 MDHS. (Thornton, 2008) argues that in 2004 this may be due to
the fact that respondents were not required to learn their results at the time of testing, or
to the method of testing through saliva. However, a low refusal rate is also found in 2006
and 2008. In very few cases the HIV test did not give a clear result (indeterminate) or test
results were lost. Other reasons for item nonresponse are lumped into the residual category
‘other’, consisting of people who completed the main survey but not the biomarket survey,
for example because they were temporarily absent. The importance of this category almost
doubled between 2004 and 2008.
The classification of the different sources of missing data is important. In fact, it
has been argued that people who refuse to be tested have higher risk of being infected
(Janssens et al., 2008; Reniers and Eaton, 2009), while people who do not participate
in a survey because of migration have higher HIV prevalence than those who participate
(Crampin et al., 2003; Lurie et al., 2003; Marston et al., 2008; Obare, 2010). Thus, ignoring
missing data due to refusal to be tested or migration may bias the HIV prevalence estimate
downward. On the other hand, missing data due to loss of test results are not a major
source of concern because they may be considered as purely random.
7

3 Partial identification of HIV prevalence
To formalize our problem, consider a population that at a given time t consists of Nt living
individuals who can be either susceptible to HIV4 or infected. HIV status of individual
i is represented by the binary indicator yit, which is equal to one if individual i is HIV
positive at time t and to zero otherwise. HIV prevalence at time t is just the proportion
πt = N−1t
∑Nti=1 yit of HIV infected people, which in turn is equal to Pr(Yt = 1), where Yt
is a binary random variable equal to one if a randomly selected individual is HIV positive
at time t and to zero otherwise.
Our aim is to construct informative bounds for πt when HIV status may be missing
for a fraction of individuals in the population. As explained in the previous section, in
our data measurement error is negligible and may be considered as purely random. Thus,
unlike Nicoletti et al. (2011), we ignore this problem and focus on the uncertainty about
πt produced by the missing data mechanism.
3.1 Bounds with cross-sectional data
We first consider the problem of bounding HIV prevalence when data are only available at
a given point in time, as in a single cross-section or when the longitudinal dimension of a
panel survey is not exploited.
By the law of total probability, we can write HIV prevalence at time t as
πt = Pr(Yt = 1|Dt = 1) Pr(Dt = 1) + Pr(Yt = 1|Dt = 0) Pr(Dt = 0), (1)
where Dt is a binary indicator equal to one if HIV status is known and to zero otherwise.
As pointed out by Manski (1989), the missing data problem arises because the data tell
us nothing about Pr(Yt = 1|Dt = 0). However, because necessarily 0 ≤ Pr(Yt = 1|Dt =
0) ≤ 1, substituting the lower and upper bounds for Pr(Yt = 1|Dt = 0) into (1) gives the4 A susceptible individual is a member of the population who, at a given point in time, is at risk of
becoming infected by the disease.
8

following lower and upper bounds on πt
LBt = Pr(Yt = 1|Dt = 1) Pr(Dt = 1) = Pr(Yt = 1, Dt = 1),
UBt = Pr(Yt = 1|Dt = 1) Pr(Dt = 1) + Pr(Dt = 0),
= Pr(Yt = 1, Dt = 1) + Pr(Dt = 0).
These bounds are often refereed to as worst-case bounds.
The identification region for πt consists of all the points in the interval between LBt and
UBt. The width Wt = UBt − LBt of this region is equal to the nonresponse probability
Pr(Dt = 0), which therefore represents a direct measure of the uncertainty about HIV
prevalence caused by nonresponse (Horowitz and Manski, 1998). Without nonresponse,
there is no uncertainty about πt. When nonresponse is frequent, the uncertainty is large.
In this case, an important issue is whether there exist credible restrictions on the HIV
process that may be used to narrow the worst-case bounds.
3.2 Bounds with panel data
We know from medical research that HIV is an absorbing state (Gallo, 1993; Montagnier,
2000): a person infected at any given time has zero probability of becoming susceptible
at later times, while a person susceptible at any given time was also susceptible at earlier
times with probability one. We now show that these simple considerations help narrow
the worst-case bounds when panel data are available and HIV status of people who are
nonrespondent in one wave may be observed in other waves. We will refer to the new
bounds as ‘dynamic’, because they use restrictions on the dynamics of the HIV epidemic.
To keep things simple, we only present results for the case of short panels with two or
three waves. Appendix A presents the results for the general case of a panel with P ≥ 1
waves before wave t, or F ≥ 1 waves after wave t, or both.
Suppose first that we use only two waves of a panel, at times t and t + 1. To narrow
the worst-case bounds on πt, consider again equation (1) and notice that
Pr(Yt = 1|Dt = 0) = Pr(Yt = 1|Dt+1 = 0, Dt = 0) Pr(Dt+1 = 0|Dt = 0)+
+ Pr(Yt = 1|Dt+1 = 1, Dt = 0) Pr(Dt+1 = 1|Dt = 0),
9

where
Pr(Yt = 1|Dt+1 = 1, Dt = 0) =
= Pr(Yt = 1|Yt+1 = 1, Dt+1 = 1, Dt = 0) Pr(Yt+1 = 1|Dt+1 = 1, Dt = 0),
since Pr(Yt = 1|Yt+1 = 0, Dt+1 = 1, Dt = 0) = 0 due to the absorbing nature of HIV status.
Thus, we can rewrite (1) as
Pr(Yt = 1) = Pr(Yt = 1, Dt = 1)+
+ Pr(Yt = 1|Dt+1 = 0, Dt = 0) Pr(Dt+1 = 0, Dt = 0)+
+ Pr(Yt = 1|Yt+1 = 1, Dt+1 = 1, Dt = 0)×
× Pr(Yt+1 = 1|Dt+1 = 1, Dt = 0) Pr(Dt+1 = 1, Dt = 0).
(2)
From (2) we derive lower and upper bounds on πt by assuming that the unknown prob-
abilities Pr(Yt = 1|Dt+1 = 0, Dt = 0) and Pr(Yt = 1|Yt+1 = 1, Dt+1 = 1, Dt = 0) are
respectively equal to their lower bound of zero and their upper bound of one. Setting both
probabilities equal to zero gives the lower bound
LB(+1)t = LBt,
while setting both of them equal to one gives the upper bound
UB(+1)t = Pr(Yt = 1, Dt = 1) + Pr(Dt+1 = 0, Dt = 0)+
+ Pr(Yt+1 = 1|Dt+1 = 1, Dt = 0) Pr(Dt+1 = 1, Dt = 0)
= Pr(Yt = 1, Dt = 1) + Pr(Dt = 0)×
× [Pr(Yt+1 = 1, Dt+1 = 1|Dt = 0) + Pr(Dt+1 = 1|Dt = 0)]
= UBt − Pr(Dt = 0) [1− Pr(Yt+1 = 1, Dt+1 = 1|Dt = 0)− Pr(Dt+1 = 1|Dt = 0)] ,
where the term in square brackets in the last relationship is equal to the conditional prob-
ability that Yt+1 = 0 and Dt+1 = 1 given Dt = 0, and is therefore bounded between zero
and one. The width of the resulting identification region for πt is
W(+1)t = UB
(+1)t − LB(+1)
t = Wt − Pr(Yt+1 = 0, Dt+1 = 1, Dt = 0).
10

Because Pr(Yt+1 = 0, Dt+1 = 1, Dt = 0) is bounded between zero and one, and cannot
exceed Pr(Dt = 0), we have that 0 ≤W (+1)t ≤Wt.
Notice that simply knowing the HIV status in wave t + 1 of people with missing HIV
status in wave t is not enough to narrow the worst-case bounds. In fact, among the
respondents in wave t+ 1, only the information about negative HIV status can be used to
infer HIV status in wave t, so only the upper bound can be reduced relative to the worst-
case. Respondents in wave t + 1 who are found to be HIV positive cannot be assumed
to have been already HIV positive in wave t, so the lower bound is the same as in the
worst-case.
If the two waves of the panel are at times t−1 and t, then we can rewrite the unknown
probability in (1) by exploiting past rather than future information. This gives
Pr(Yt = 1|Dt = 0) = Pr(Yt = 1|Dt = 0, Dt−1 = 0) Pr(Dt−1 = 0|Dt = 0)+
+ Pr(Yt = 1|Dt = 0, Dt−1 = 1) Pr(Dt−1 = 1|Dt = 0),
where
Pr(Yt = 1|Dt = 0, Dt−1 = 1) =
= Pr(Yt = 1|Dt = 0, Dt−1 = 1, Yt−1 = 0) Pr(Yt−1 = 0|Dt = 0, Dt−1 = 1)+
+ Pr(Yt−1 = 1|Dt = 0, Dt−1 = 1),
since Pr(Yt = 1|Dt = 0, Dt−1 = 1, Yt−1 = 1) = 1 due to the absorbing nature of HIV status.
Proceeding as before, we obtain the following bounds
LB(−1)t = LBt + Pr(Yt−1 = 1, Dt−1 = 1, Dt = 0),
UB(−1)t = UBt,
Notice that, unlike the case when future information is used, here the upper bound is the
same as in the worst-case, while the lower bound is greater. This is because past negative
HIV status is uninformative, as we cannot assume that a person who was HIV negative in
the past remains HIV negative in the future, while past positive HIV status is informative,
as a person who was HIV positive in the past remains HIV positive in the future. The
11

width of the resulting identification region for πt is
W(−1)t = UB
(−1)t − LB(−1)
t = Wt − Pr(Yt−1 = 1, Dt−1 = 1, Dt = 0).
Again, 0 ≤W (−1)t ≤Wt.
Using three waves of a panel, we can further narrow the identification region for πt.
Suppose that, in addition to wave t, we use one wave before t and one after t. Then it
follows immediately from our previous results that
LB(−1,+1)t = LB
(−1)t ,
UP(−1,+1)t = UB
(+1)t ,
W(−1,+1)t = Wt − Pr(Yt+1 = 0, Dt+1 = 1, Dt = 0)− Pr(Yt−1 = 1, Dt−1 = 1, Dt = 0).
Using wave t and two waves after t we instead have
LB(+2)t = LB
(+1)t ,
UB(+2)t = UB
(+1)t − Pr(Yt+2 = 0, Dt+2 = 1, Dt+1 = Dt = 0),
W(+2)t = W
(+1)t − Pr(Yt+2 = 0, Dt+2 = 1, Dt+1 = Dt = 0),
while using wave t and two waves before t we have
LB(−2)t = LB
(−1)t + Pr(Yt−2 = 1, Dt−2 = 1, Dt−1 = Dt = 0),
UB(−2)t = UB
(−1)t ,
W(−2)t = W
(−1)t − Pr(Yt−2 = 1, Dt−2 = 1, Dt−1 = Dt = 0).
In the last two cases, the uncertainty about πt due to missing data decreases because of
either an increase in the lower bound or a decrease in the upper bound, in the first case
because of a combination of the two effects. Increasing the number of available waves
further decreases the uncertainty due to missing data.
3.3 IV and MIV restrictions
To further narrow the identification region for πt, one may combine the restrictions dis-
cussed in Section 3.2 with those implied by additional assumptions on the HIV process.
12

One possibility are instrumental variable (IV) restrictions (Manski, 1994, 2003). A ran-
dom variable is an IV if it helps predict nonresponse but does not help predict HIV status,
possibly after conditioning on a set of observable covariates. Although it is generally diffi-
cult to find valid instrumental variables, a convincing case can be made for data collection
characteristics (characteristics of the interviewer, interview mode, length and design of
the questionnaire, etc.), because they help predict nonresponse (Groves and Couper, 1998;
Dillman et al., 2002; Lepkowski and Couper, 2002; Nicoletti and Peracchi, 2006), but lack
predictive power for HIV status.
Since IV restrictions are often controversial, another possibility is to impose weaker
monotone instrumental variable (MIV) restrictions (Manski and Pepper, 2000). A random
variable is a MIV if it shifts monotonically the HIV prevalence, possibly after conditioning
on a set of observable covariates.
4 Results
In this section, we illustrate our previous results by presenting complete-case estimates,
worst-case bounds and dynamic bounds for HIV prevalence in rural Malawi constructed
from the MDICP data for the years 2004, 2006 and 2008. Since it is of interest for both
research and policy-making to know how the HIV epidemic is spread among different
demographic groups, we present estimates for the whole population and for subgroups
defined by region of origin, gender and birth cohort. We distinguish between four cohorts:
i) Cohort A: born 1984–1989 (aged 15–20 in 2004), ii) Cohort B: born 1975–1983 (aged
21–29 in 2004), iii) Cohort C: born 1965–1974 (aged 30–39 in 2004), and iv) Cohort D:
born before 1965 (aged 40+ in 2004).
We present the results mostly in graphical form. Detailed numerical tabulations for the
entire sample and separately by region are contained in Appendix B.
13

4.1 Complete-case estimates
The complete-case estimates of HIV prevalence in rural Malawi are 6.15% in 2004, 4.86%
in 2006, and 5.24% in 2008 (see Table 1 in Appendix B). These estimates are substantially
lower than the 2004 MDHS estimate of 10.8% for rural Malawi, possibly because the
MDICP sample does not include peri-urban areas (Obare et al., 2009), and show no clear
trend.
For the youngest cohort (born 1984–1989), estimated HIV prevalence is very low in
all three waves. Among males, estimated HIV prevalence is always highest for the cohort
born before 1965. Among females, estimated HIV prevalence is highest for the 1975–83
cohort in 2004 and the 1965–74 cohort in 2006 and 2008. However, since the fraction of the
sample with missing HIV status is very high in each year, uncertainty about the complete
case estimates is also high.
4.2 Worst-case and dynamic bounds
The bounds introduced in Section 3 are easily estimated nonparametrically by simple
weighted empirical frequencies using the survey weights provided by the MDICP. Since the
bounds are estimated, their sampling variability must be taken into account. We do this
by constructing 95%-level bootstrap confidence intervals based on the percentile method
with 999 bootstrap replications. The interval between the upper limit of the 95%-level
confidence interval for the upper bound and the lower limit of the 95%-level confidence
interval for the lower bound is a 95%-level confidence interval for the identification region.
The top-left plot in Figure 1 displays graphically the worst-case and the dynamic bounds
on HIV prevalence in rural Malawi, along with the complete-case estimates. Using the
worst-case bounds, the identification region is the interval between 3.8% and 34.2% in
2004, the interval between 4.5% and 28.9% in 2006, and the interval between 2.4% and
46.6% in 2008. Notice that the width of these intervals increases over time following the
pattern of missing data. Also notice that the complete case estimates are always very close
to the lower bound of the identification region.
14

Using the dynamic bounds, the identification region is the interval between 3.8% and
15.9% in 2004, between 2.6% and 40.2% in 2006, and between 4.9% and 46.6% in 2008.
Thus, for the first two waves, we have a sizable reductions of the uncertainty about HIV
prevalence compared to the worst-case bounds (about 18.2 percentage points in 2004 and
13.2 percentage points in 2006). For the last wave, the reduction is instead negligible (only
2.4 percentage points). This pattern reflects the number of waves available before and
after the point in time where HIV prevalence is estimated. In 2004 only future information
about HIV status can be used. As a consequence, the dynamic upper bound is lower than
the worst-case upper bound but the lower bound is unchanged. In 2006, both previous and
future information about HIV status help reduce the uncertainty, resulting in a decrease
of the upper bound and an increase of the lower bound. In 2008, since no subsequent wave
of the panel is available, only previous information about HIV status helps reduce the
uncertainty, resulting in an increase of the lower bound with the upper bound unchanged.
The other three panels in Figure 1 refer to the three regions of Malawi: South, Center
and North. According to the MDHS, Southern Malawi is the region with the highest HIV
prevalence, followed by the Center and the North. Although the dynamic bounds are much
narrower than the worst-case bounds, they are still too wide to support this conclusions.
Tables 4 and 5 in Appendix B show that the dynamic bounds are much narrower
than the worst-case bounds also if we consider subgroups characterized by gender and
birth cohort. Again, this is especially true for 2004 and 2006. Although the width of the
dynamic bounds is generally lower for males, meaning that there is more uncertainty about
HIV prevalence among females, the identification regions remain too wide to allow us to
establish a rank by gender.
4.3 Imposing additional IV and MIV restrictions
Unfortunately, our data offer little in terms of IVs or MIVs (Table 2). As IVs, we consider
gender differences between the interviewer and the interviewee, interviewer’s experience,
interviewer’s age categorized in two classes, and the month of the first interview attempt.
15
The latter is the only IV available in 2008. As MIV, we consider the number of sexual
partners a respondent had till that year. This is a valid MIV if the probability of being
HIV infected does not fall as the number of sexual partners increases. Further, because
information on IVs and MIVs is not available for unit nonrespondents, our analysis is
restricted to the subsample of unit respondents.
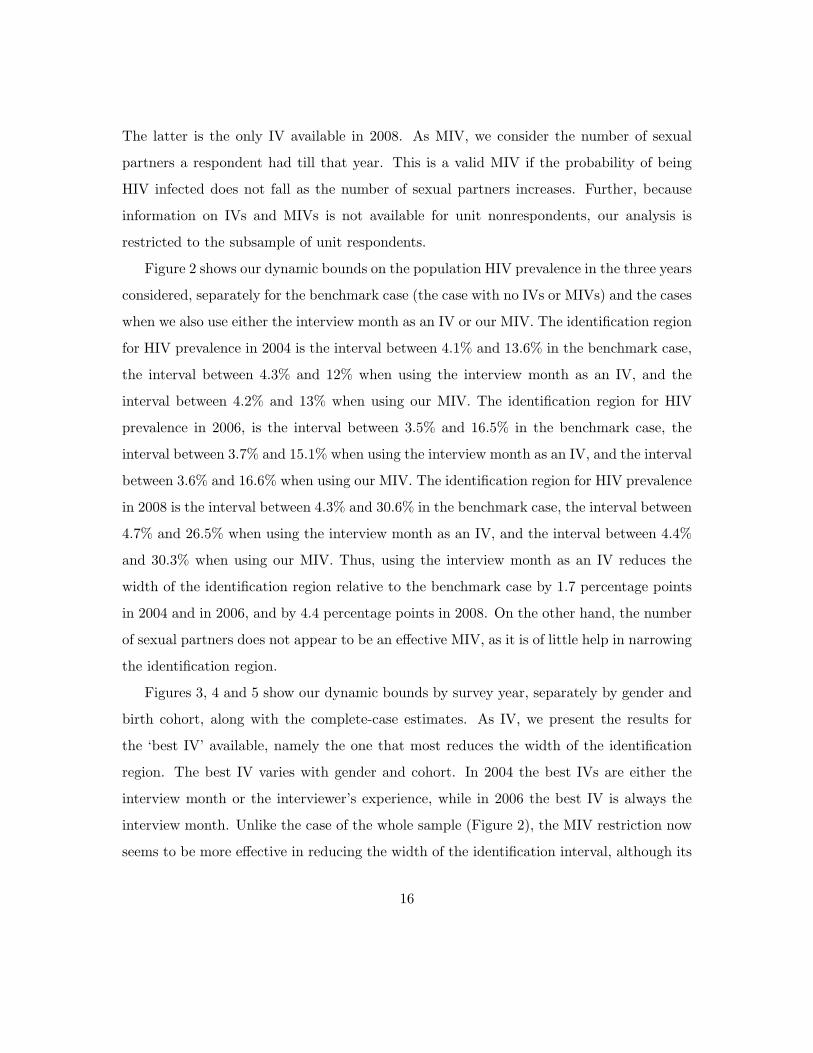
Figure 2 shows our dynamic bounds on the population HIV prevalence in the three years
considered, separately for the benchmark case (the case with no IVs or MIVs) and the cases
when we also use either the interview month as an IV or our MIV. The identification region
for HIV prevalence in 2004 is the interval between 4.1% and 13.6% in the benchmark case,
the interval between 4.3% and 12% when using the interview month as an IV, and the
interval between 4.2% and 13% when using our MIV. The identification region for HIV
prevalence in 2006, is the interval between 3.5% and 16.5% in the benchmark case, the
interval between 3.7% and 15.1% when using the interview month as an IV, and the interval
between 3.6% and 16.6% when using our MIV. The identification region for HIV prevalence
in 2008 is the interval between 4.3% and 30.6% in the benchmark case, the interval between
4.7% and 26.5% when using the interview month as an IV, and the interval between 4.4%
and 30.3% when using our MIV. Thus, using the interview month as an IV reduces the
width of the identification region relative to the benchmark case by 1.7 percentage points
in 2004 and in 2006, and by 4.4 percentage points in 2008. On the other hand, the number
of sexual partners does not appear to be an effective MIV, as it is of little help in narrowing
the identification region.
Figures 3, 4 and 5 show our dynamic bounds by survey year, separately by gender and
birth cohort, along with the complete-case estimates. As IV, we present the results for
the ‘best IV’ available, namely the one that most reduces the width of the identification
region. The best IV varies with gender and cohort. In 2004 the best IVs are either the
interview month or the interviewer’s experience, while in 2006 the best IV is always the
interview month. Unlike the case of the whole sample (Figure 2), the MIV restriction now
seems to be more effective in reducing the width of the identification interval, although its
16

effectiveness varies with gender and cohort.
5 Conclusions
Having reliable estimates of the HIV prevalence is critical for policy. Today, the gold-
standard is estimates based on biomarkers collected in population based surveys. These
surveys, however, are plagued by nonignorable missing data problems, which in turn trans-
late into a substantial uncertainty about the HIV prevalence rate in the population.
Our paper uses a bounding approach to assess what can be learnt from this type of
data. Its main contribution is to show how worst-case bounds, which are often distressingly
wide, can be narrowed in the presence of panel data by exploiting the absorbing nature of
HIV.
Longitudinal data are typically used to study HIV incidence rates. We argue that they
can also be used to estimate HIV prevalence at different points in time. Prior information
on transition probabilities between the two states of susceptible and infected helps us reduce
the worst-case bounds by about 18.2 percentage points in 2004, 13.2 percentage points in
2006, and 2.4 percentage points in 2008. Introducing plausible IV and MIV restrictions
helps to further narrow these bounds. Our approach is easy to implement, as it does not
require any assumptions about the nature of the missing data mechanism, and it allows to
obtain relatively small and precisely estimated intervals for HIV prevalence.
Our results confirm the importance of keeping low the nonresponse rates, although
this requires considering unit and item nonresponse separately. They also illustrate the
importance of including in the data critical information on interviewers’ characteristics,
fieldwork procedures etc, as these variables can be used as IVs or MIVs.
17

References
Anglewicz, P., 2007. Migration, HIV Infection, and Risk Perception in Malawi. Ph.D.
thesis, Philadelphia: Graduate Group in Demography, Population Studies Center, Uni-
versity of Pennsylvania.
Barnighausen, T., J. Bor, S. Wandira-Kazibwe, and D. Canning, 2011. Correcting hiv
prevalence estimates for survey non-participation: An application of heckman-type selec-
tion models to the zambian demographic and health survey. Epidemiology, 22(1):27–35.
Bignami-Van Assche, S., J. A. Salomon, and C. J. Murray, 2005. Evidence from national
population-based estimates of bias in HIV prevalence. In P. Philadelphia, editor, Popu-
lation Association of America Meeting.
Boerma, J., P. Ghys, and N. Walker, 2003. Estimates of HIV-1 prevalence from national
population-based surveys as a new gold standard. Lancet, 363(9399):1929–1931.
Brookmeyer, R., 2010. Measuring the HIV/AIDS Epidemic: Approaches and Challenges.
Epidemiologic Reviews, 32:26–37.
CIA, 2009. CIA World factbook: Malawi. Technical report, CIA.
Crampin, A. C., J. R. Glynn, B. M. M. Ngwira, F. D. Mwaungulu, J. M. Ponnighauss,
D. K. Warndorff, and P. Fine, 2003. Trends and measurement of HIV prevalence in
Northern Malawi. AIDS, 17:1817–1825.
Dillman, D., J. Eltinge, and R. Little, 2002. Surveys nonresponse. Wiley: New York.
Gallo, R., 1993. Virus Hunting: AIDS, Cancer, And The Human Retrovirus: A Story Of
Scientific Discovery. Harper Collins: New York.
Garcia-Calleja, J., E. Gouws, and P. Ghys, 2006. National population based hiv preva-
lence surveys in sub-saharan africa: Results and implications for hiv and aids estimates.
Sexually Transmitted Infections, 82(Suppl III):iii64–iii70.
18

Gouws, E., V. Mishra, and T. Fowler, 2008. Comparison of adult HIV prevalence from
national population-based surveys and antenatal clinic surveillance in countries with gen-
eralized epidemics: Implications for calibrating surveillance data. Sexually Transmitted
Infections, 84(Suppl 1):i17–i23.
Groves, R. and M. Couper, 1998. Nonresponse in Household Interview Surveys. Wiley:
New York.
Heckman, J. J., 1979. Sample selection bias as a specification error. Econometrica, 47:153–
161.
Horowitz, J. L. and C. F. Manski, 1998. Censoring of Outcomes and Regressors Due
to Survey Nonresponse: Identification and Estimation Using Weights and Imputation.
Journal of Econometrics, 84:37–58.
Janssens, W., J. van der Gaag, and T. Rinke de Wit, 2008. Refusal Bias in the Estimation
of HIV Prevalence. Amsterdam Institute for International Development Research Series,
AIID RS 08-03/2.
Lachaud, J. P., 2007. HIV prevalence and poverty in Africa: Micro- and macro-econometric
evidences applied to Burkina Faso. Journal of Health Economics, 26:483–504.
Lepkowski, J. M. and M. P. Couper, 2002. Survey Nonresponse, chapter Nonresponse
in Longitudinal Household Surveys, pages 259–272. eds R.M. Groves, D. Dillman, J.
Eltinge, and R. Little, New York: Wiley.
Little, J. A. and D. B. Rubin, 1987. Statistical Analysis with Missing Data. New York:
Wiley.
Lurie, M., B. Williams, K. Zuma, D. Mkaya-Mwamburi, and G. e. a. Garnett, 2003. The
impact of migration on HIV-1 transmission in South Africa: a study of migrant and
nonmigrant men and their partners. Sexually Transmitted Infections-Dis, 30:149–156.
19

Manski, C., 1994. The Selection Problem. In C. Sims and C. C. U. Press, editors, Advances
in Econometrics, Sixth World Congress, pages 143–170.
Manski, C., 1995. Identification Problems in the Social Sciences. Harvard University Press,
Cambridge, MA.
Manski, C., 2003. Partial Identification of Probability Distributions. New York: Springer-
Verlag.
Manski, C. F., 1989. Anatomy of the Selection Problem. Journal of Human Resources,
24:343–360.
Manski, C. F. and J. Pepper, 2000. Monotone Instrumental Variables with an Application
to the Returns to Schooling. Econometrica, 68:997–1010.
Marston, M., K. Harriss, and E. Slaymaker, 2008. Nonresponse bias in estimates of HIV
prevalence due to the mobility of absentees in national population-based surveys: a study
of nine national surveys. Sexually Transmitted Infections, 84(1):i71–i77.
Martin-Herz, S., A. Shetty, M. Bassett, C. Ley, M. Mhazo, S. Moyo, A. Herz, and
D. Katzenstein, 2006. Perceived risks and benefits of hiv testing, and predictors of
acceptance of hiv counseling and testing among pregnant women in Zimbabwe. Interna-
tional Journal of Sexually Transmitted Diseases and AIDS, 17:835–841.
McNaghten, A., J. Herold, H. Dube, and M. St Louis, 2007. Response rates for provid-
ing a blood specimen for HIV testing in a population-based survey of young adults in
Zimbabwe. BMC Public Health, 7:145–150.
Mishra, V., B. Barrere, R. Hong, and S. Khan, 2008a. Evaluation of bias in HIV sero-
prevalence estimates from national household surveys. Sexually Transmitted Infections,
84(Suppl I):i63–i70.
20
Mishra, V., M. Vaessen, J. T. Boerma, and et al., 2008b. HIV testing in national
population-based surveys: Experience from the Demographic and Health Surveys. Bul-
letin World Health Organization, 84:537–545.
Montagnier, L., 2000. Virus: The Co-discoverer of HIV Tracks Its Rampage and Charts
the Future. Norton: New York.
Montana, L., V. Mishra, and R. Hong, 2008. Measuring the HIV/AIDS Epidemic: Ap-
proaches and Challenges. Sexually Transmitted Infections, 84(1):i78–i84.
Nicoletti, C. and F. Peracchi, 2006. The effects of income imputation on micro analyses:
Evidence from the ECHP. Journal of the Royal Statistical Society, Series A, 169:625–646.
Nicoletti, C., F. Peracchi, and F. Foliano, 2011. Estimating income poverty in the presence
of missing data and measurement error estimating income poverty in the presence of
missing data and measurement error. Journal of Business and Economic Statistics,
29(1):61–72.
Obare, F., 2010. Nonresponse in Repeat Population-Based Voluntary Counseling and
Testing for HIV in Rural Malawi. Demography, 47(3):651–665.
Obare, F., P. Fleming, R. Anglewicz, R. Thornton, F. Martinson, A. Kapatuka, M. Poulin,
S. Watkins, and H. Kohler, 2009. Acceptance of repeat population-based voluntary
counselling and testing for HIV in rural Malawi. Sexually transmitted infections, 85(139).
Reniers, G. and J. Eaton, 2009. Refusal bias in HIV prevalence estimates from nationally
representative seroprevalence surveys. AIDS, 23(5):621–629.
Rubin, D., 1976. Inference and missing data. Biometrika, 63:581–592.
Rubin, D. B., 1989. Multiple Imputation for Nonresponse in Surveys. New York: Wiley.
21

Sakarovitch, C., A. Alioum, D. Ekouevi, P. Msellati, V. Leroy, and F. Dabis, 2007. Estimat-
ing incidence of HIV infection in childbearing age African women using serial prevalence
data from antenatal clinics. Stat Med, 26:320–335.
Thornton, R., 2008. The demand for, and impact of, learning HIV status. American
Economic Review, 98:1829–1863.
UNAIDS, 2003. Reconciling antenatal clinic-based surveillance and population-based survey
estimates of HIV prevalence in sub-Saharan Africa.
UNGASS, 2010. Malawi HIV and AIDS Monitoring and Evaluation Report: 2008-2009.
Technical report, United Nation.
Vella, F., 1998. Estimating Models with Sample Selection Bias: A Survey. Journal of
Human Resources, 33:127–169.
Watkins, S. C., E. M. Zulu, H. P. Kohler, and J. R. Behrman, 2003. Introduction to: Social
interactions and HIV/AIDS in rural Africa. Demographic Research, Special Collection
1(1):1–30.
22

6 Tables and figures
Table 1: Distribution of respondents across waves
2004 2006 2008Freq. Percent Freq. Percent Freq. Percent
UNIT RESPONDENTSHIV negative 2700 66.47 2408 59.28 2116 52.09HIV positive 177 4.36 123 3.03 117 2.88Items nonresponse
Test refused 256 6.30 200 4.92 172 4.23Indeterminate 14 0.34 6 0.15 1 0.02Results lost 24 0.59 0 0.00 0 0.00Other* 319 7.85 313 7.71 569 14.01UNIT NONRESPONDENTSRefused 27 0.66 11 0.27 58 1.43Moved 184 4.53 479 11.79 470 11.57Temporarily absent 36 0.89 41 1.01 76 1.87Hospitalized 6 0.15 5 0.12 1 0.02Other** 319 7.85 432 10.64 359 8.84Dead / / 44 1.08 123 3.03
Total 4062 100 4062 100 4062 100
HIV prevalence“Complete cases” 6.15% 4.86% 5.24%
% of HIVstatus missing 29.17% 36.61% 42.00%
The new entrants 2006/2008 are excluded.
* The category other item nonrespondents corresponds to people that fulfill the first part
of the questionnaire, but not the second, for example because they were temporarily absent
during the biomarker collection.
** The majority of unit nonrespondents categorized in the class other corresponds to people
who did not fulfill the questionnaire for unknown reasons or because too old or too sick.
23

Table 2: Instrumental variables and monotone instrumental variables for the unit respondents.
2004 2006 2008Freq Perc Freq Perc Freq Perc
IVInterviewer’s gender n/a
Same 1350 48.95 1405 62.84Different 1408 51.05 831 37.16
Interviewer’s experience n/aNo 1214 44.02 1087 48.61Yes 1544 55.98 1149 51.39
Interviewer’s age n/aYoung 1112 40.32 1111 49.69Old 1646 59.68 1,125 50.31
Month of the interviewMay-June 1804 65.41 1255 56.13 1250 44.25July-August 954 34.59 981 43.87 1575 55.75
MIVNumber of sexual partners
0-1 1142 41.41 773 34.57 944 33.422-3 671 24.33 595 26.61 659 23.333 365 13.23 358 16.01 448 15.863+ 580 21.03 510 22.81 774 27.4
Notes: n/a = not applicable because information was not collected.
24

Figure 1: HIV prevalences for all sample by region and survey year: the black lines correspond tothe worst-case bounds; the green lines correspond to the dynamic bounds; the dash line indicatesthe complete-case estimates.
25

Figure 2: HIV prevalences for unit respondents by survey year: dynamic bounds in the benchmarkcase, dynamic bounds with the best IV restriction, dynamic bounds with MIV restriction, andcomplete-case estimates.
26

Figure 3: HIV prevalences for unit respondents by gender and cohort in 2004: dynamic boundsin the benchmark case, dynamic bounds with best IV restriction, dynamic bounds with MIV re-striction, and complete-case estimates. Cohort A is the cohort born in 1984–1989, cohort B is thecohort born in 1975–1983, cohort C is the cohort born in 1965–1974, and cohort D is the cohortborn before 1965.
27

Figure 4: HIV prevalences for unit respondents by gender and cohort in 2006: dynamic boundsin the benchmark case, dynamic bounds with best IV restriction, dynamic bounds with MIV re-striction, and complete-case estimates. Cohort A is the cohort born in 1984–1989, cohort B is thecohort born in 1975–1983, cohort C is the cohort born in 1965–1974, and cohort D is the cohortborn before 1965.
28

Figure 5: HIV prevalences for unit respondents by gender and cohort in 2008: dynamic boundsin the benchmark case, dynamic bounds with best IV restriction, dynamic bounds with MIV re-striction, and complete-case estimates. Cohort A is the cohort born in 1984–1989, cohort B is thecohort born in 1975–1983, cohort C is the cohort born in 1965–1974, and cohort D is the cohortborn before 1965.
29

A General case
Consider bounding HIV prevalence at time t in the general case when several waves of a
panel survey are available, either before or after wave t.
A.1 F waves after t
With information on F waves after wave t, the lower bound on πt does not change while
the upper bound is characterized by the following recursion
t : UBt,
t, t+ 1 : UB(+1)t = UBt − Pr(Yt+1 = 0, Dt+1 = 1, Dt = 0),
t, t+ 1, t+ 2 : UB(+2)t = UB
(+1)t − Pr(Yt+2 = 0, Dt+2 = 1, Dt+1 = 0, Dt = 0),
· · ·
t, . . . , t+ F : UB(+F )t = UB
(+(F−1))t − Pr(Yt+F = 0, Dt+F = 1, Dt+F−1 = 0, . . . , Dt = 0).
Thus we obtain
LB(+F )t = LBt,
UB(+F )t = UBt −
F∑f=1
Pr(Yt+f = 0, Dt+f = 1, Dt+f−1 = 0, . . . , Dt+1 = 0, Dt = 0),
and
Wt(+F ) = Wt −F∑
f=1
Pr(Yt+f = 0, Dt+f = 1, Dt+f−1 = 0, . . . , Dt+1 = 0, Dt = 0).
It is easy to see that increasing the number of future waves decreases the width of the
identification region.
30

A.2 P waves before t
With information on P waves before wave t, the upper bound does not change while the
lower bound is characterized by the following recursions
t : LBt,
t− 1, t : LB(−1)t = LBt + Pr(Yt−1 = 1, Dt−1 = 1, Dt = 0),
t− 2, t− 1, t : LB(−2)t = LB
(−1)t + Pr(Yt−2 = 1, Dt−2 = 1, Dt−1 = 0, Dt = 0),
· · ·
t− P, . . . , t : LB(−P )t = LB
(−(P−1))t + Pr(Yt−P = 1, Dt−P = 1, Dt−P+1 = 0, . . . , Dt = 0).
Thus we obtain
LB(−P )t = LBt +
P∑p=1
Pr(Yt−p = 1, Dt−p = 1, Dt−p+1 = 0, . . . , Dt−1 = 0, Dt = 0),
UB(−P )t = UBt,
and
W(−P )t = Wt −
P∑p=1
Pr(Yt−p = 1, Dt−p = 1, Dt−p+1 = 0, . . . , Dt−1 = 0, Dt = 0).
It is easy to see that increasing the number of past waves decreases the width of the
identification region.
A.3 P waves before and F waves after t
Combining the previous results gives
LB(−P,+F )t = LB
(−P )t
= LBt +P∑
p=1
Pr(Yt−p = 1, Dt−p = 1, Dt−p+1 = 0, . . . , Dt−1 = 0, Dt = 0),
UB(−P,+F )t = UB
(+F )t
= UBt −F∑
f=1
Pr(Yt+f = 0, Dt+f = 1, Dt+f−1 = 0, . . . , Dt+1 = 0, Dt = 0),
31

and
W(−P,+F )t = Wt −
P∑p=1
Pr(Yt−p = 1, Dt−p = 1, Dt−p+1 = 0, . . . , Dt−1 = 0, Dt = 0)−
−F∑
f=1
Pr(Yt+f = 0, Dt+f = 1, Dt+f−1 = 0, . . . , Dt+1 = 0, Dt = 0).
32

B Additional results
Table 3: Number of observations and complete case estimates bysurvey year, gender and cohort.
Cohort Gender 2004 2006 2008
All All n 4008 3926 3733Prevalencecc 0.062 0.049 0.051
A Male n 404 400 398Prevalencecc 0.003 0 0.011
B Male n 374 359 355Prevalencecc 0.029 0.015 0.04
C Male n 398 385 338Prevalencecc 0.06 0.035 0.04
D Male n 691 662 636Prevalencecc 0.094 0.056 0.045
A Female n 474 473 471Prevalencecc 0.015 0.02 0.042
B Female n 560 559 552Prevalencecc 0.092 0.069 0.07
C Female n 530 528 439Prevalencecc 0.082 0.105 0.098
D Female n 577 560 544Prevalencecc 0.079 0.04 0.038
Prevalencecc corresponds to the complete case estimate of the prevalence.
The total number of individuals is 4,008 instead of 4,062 because we drop
54 individuals for which age is missing.
33

Table 4: Bootstrapped bounds for the whole sample and by genderand birth cohort.
2004 2006 2008Cohort Gender Worst Dyn Worst Dyn Worst Dyn
All All L 0.038 0.038 0.026 0.045 0.024 0.049U 0.342 0.159 0.402 0.289 0.466 0.466W 0.304 0.122 0.376 0.244 0.442 0.417
A Male L 0.000 0.000 0.000 0.000 0.000 0.000U 0.265 0.094 0.455 0.322 0.583 0.583W 0.265 0.094 0.455 0.322 0.583 0.583
B Male L 0.008 0.008 0.000 0.008 0.006 0.020U 0.321 0.139 0.485 0.370 0.577 0.577W 0.313 0.131 0.485 0.362 0.572 0.558
C Male L 0.020 0.020 0.010 0.023 0.009 0.024U 0.452 0.216 0.403 0.309 0.485 0.485W 0.432 0.196 0.392 0.286 0.476 0.462
D Male L 0.048 0.049 0.024 0.047 0.016 0.047U 0.395 0.211 0.393 0.305 0.480 0.476W 0.347 0.162 0.369 0.258 0.464 0.429
A Female L 0.002 0.002 0.002 0.006 0.008 0.015U 0.359 0.169 0.529 0.385 0.616 0.611W 0.357 0.167 0.526 0.379 0.607 0.597
B Female L 0.041 0.045 0.027 0.057 0.027 0.067U 0.420 0.218 0.465 0.333 0.457 0.462W 0.379 0.173 0.438 0.275 0.429 0.395
C Female L 0.042 0.040 0.055 0.074 0.041 0.075U 0.364 0.198 0.381 0.280 0.440 0.437W 0.323 0.158 0.326 0.207 0.399 0.362
D Female L 0.042 0.042 0.016 0.039 0.015 0.039U 0.331 0.154 0.362 0.236 0.386 0.388W 0.289 0.113 0.346 0.196 0.371 0.349
L corresponds to the Lower bound, U to the Upper bound and W to the width.
34

Table 5: Bootstrapped bounds for the whole sample and by regions.
2004 2006 2008Region Worst Dyn Worst Dyn Worst Dyn
All L 0.038 0.038 0.026 0.045 0.024 0.049U 0.342 0.159 0.402 0.289 0.466 0.466W 0.304 0.122 0.376 0.244 0.442 0.417
South L 0.043 0.044 0.028 0.060 0.026 0.068U 0.339 0.195 0.471 0.372 0.554 0.555W 0.296 0.150 0.443 0.312 0.528 0.486
Center L 0.031 0.031 0.018 0.033 0.015 0.037U 0.453 0.199 0.440 0.293 0.436 0.438W 0.422 0.168 0.421 0.259 0.420 0.401
North L 0.023 0.023 0.018 0.028 0.023 0.037U 0.285 0.133 0.361 0.275 0.472 0.473W 0.262 0.110 0.343 0.247 0.449 0.437
L corresponds to the Lower bound, U to the Upper bound and W to the width.
35

Table
6:
2004
Boo
tstr
appe
dbo
unds
for
unit
resp
onde
nts.
Cohort
Gender
Bench
mark
IVD
iffG
ender
IVE
xp
eri
ence
IVA
ge
IVM
onth
MIV
Wors
tD
yn
Wors
tD
yn
Wors
tD
yn
Wors
tD
yn
Wors
tD
yn
Wors
tD
yn
All
All
L0.0
41
0.0
41
0.0
43
0.0
43
0.0
43
0.0
44
0.0
45
0.0
44
0.0
42
0.0
43
0.0
42
0.0
42
(n=
2758
)U
0.2
74
0.1
36
0.2
68
0.1
33
0.2
64
0.1
25
0.2
69
0.1
29
0.2
23
0.1
20
0.2
73
0.1
30
Pre
vale
nce
cc=
0.0
62
W0.2
33
0.0
95
0.2
25
0.0
90
0.2
21
0.0
81
0.2
24
0.0
85
0.1
81
0.0
78
0.2
30
0.0
87
AM
ale
L0.0
00
0.0
00
0.0
00
0.0
00
0.0
00
0.0
00
0.0
00
0.0
00
0.0
00
0.0
00
0.0
00
0.0
00
(n=
259
)U
0.2
09
0.0
85
0.2
01
0.0
77
0.1
85
0.0
65
0.1
96
0.0
78
0.1
51
0.0
73
0.2
02
0.0
69
Pre
vale
nce
cc=
0.0
05
W0.2
09
0.0
85
0.2
01
0.0
77
0.1
85
0.0
65
0.1
96
0.0
78
0.1
51
0.0
73
0.2
02
0.0
69
BM
ale
L0.0
12
0.0
08
0.0
14
0.0
14
0.0
15
0.0
15
0.0
14
0.0
14
0.0
12
0.0
13
0.0
11
0.0
08
(n=
258
)U
0.2
64
0.1
16
0.2
50
0.1
07
0.2
31
0.0
87
0.2
27
0.1
00
0.2
25
0.0
95
0.2
44
0.0
81
Pre
vale
nce
cc=
0.0
33
W0.2
52
0.1
09
0.2
36
0.0
93
0.2
17
0.0
72
0.2
14
0.0
86
0.2
13
0.0
82
0.2
32
0.0
74
CM
ale
L0.0
24
0.0
24
0.0
28
0.0
28
0.0
29
0.0
30
0.0
33
0.0
36
0.0
29
0.0
30
0.0
31
0.0
32
(n=
251
)U
0.4
06
0.1
95
0.3
30
0.1
82
0.3
64
0.1
77
0.3
42
0.1
28
0.3
84
0.1
81
0.3
83
0.1
65
Pre
vale
nce
cc=
0.0
68
W0.3
82
0.1
71
0.3
02
0.1
53
0.3
34
0.1
47
0.3
08
0.0
92
0.3
55
0.1
51
0.3
52
0.1
33
DM
ale
L0.0
49
0.0
47
0.0
54
0.0
54
0.0
53
0.0
54
0.0
52
0.0
52
0.0
56
0.0
57
0.0
50
0.0
50
(n=
468
)U
0.3
21
0.1
80
0.3
02
0.1
60
0.3
09
0.1
77
0.3
08
0.1
69
0.3
00
0.1
67
0.3
10
0.1
75
Pre
vale
nce
cc=
0.0
89
W0.2
71
0.1
33
0.2
48
0.1
06
0.2
56
0.1
22
0.2
55
0.1
17
0.2
44
0.1
10
0.2
60
0.1
24
AF
emale
L0.0
03
0.0
03
0.0
07
0.0
04
0.0
06
0.0
06
0.0
05
0.0
06
0.0
05
0.0
05
0.0
06
0.0
06
(n=
325
)U
0.3
17
0.1
57
0.3
01
0.1
42
0.2
92
0.1
40
0.2
96
0.1
45
0.2
16
0.1
36
0.2
98
0.1
18
Pre
vale
nce
cc=
0.0
20
W0.3
14
0.1
54
0.2
94
0.1
38
0.2
86
0.1
34
0.2
90
0.1
40
0.2
12
0.1
31
0.2
92
0.1
12
BF
emale
L0.0
43
0.0
43
0.0
48
0.0
49
0.0
47
0.0
49
0.0
48
0.0
48
0.0
47
0.0
49
0.0
43
0.0
43
(n=
393
)U
0.3
64
0.2
06
0.3
48
0.1
98
0.3
48
0.1
91
0.3
48
0.1
92
0.3
39
0.1
97
0.3
51
0.1
95
Pre
vale
nce
cc=
0.0
88
W0.3
21
0.1
63
0.3
00
0.1
49
0.3
01
0.1
42
0.3
00
0.1
44
0.2
91
0.1
48
0.3
08
0.1
52
CF
emale
L0.0
47
0.0
44
0.0
52
0.0
53
0.0
60
0.0
58
0.0
52
0.0
52
0.0
52
0.0
52
0.0
55
0.0
55
(n=
384
)U
0.2
92
0.1
61
0.2
75
0.1
52
0.2
76
0.1
51
0.2
66
0.1
55
0.2
30
0.1
36
0.2
70
0.1
45
Pre
vale
nce
cc=
0.0
85
W0.2
45
0.1
17
0.2
24
0.0
98
0.2
16
0.0
93
0.2
14
0.1
03
0.1
78
0.0
84
0.2
15
0.0
90
DF
emale
L0.0
36
0.0
36
0.0
43
0.0
43
0.0
41
0.0
42
0.0
41
0.0
41
0.0
42
0.0
42
0.0
39
0.0
38
(n=
420
)U
0.2
62
0.1
36
0.2
52
0.1
28
0.2
49
0.1
18
0.2
49
0.1
21
0.2
25
0.0
92
0.2
55
0.1
33
Pre
vale
nce
cc=
0.0
76
W0.2
26
0.1
00
0.2
09
0.0
85
0.2
08
0.0
76
0.2
07
0.0
80
0.1
83
0.0
50
0.2
16
0.0
95
Pre
vale
nce
cc
corr
esp
on
ds
toth
eco
mp
lete
case
esti
mate
of
the
pre
vale
nce
Lco
rres
pon
ds
toth
eL
ow
erb
ou
nd,
Uto
the
Up
per
bou
nd
an
dW
toth
ew
idth
.
36

Table
7:
2006
Boo
tstr
appe
dbo
unds
for
unit
resp
onde
nts.
Cohort
Gender
Bench
mark
IVD
iffG
ender
IVE
xp
eri
ence
IVA
ge
IVM
onth
MIV
Wors
tD
yn
Wors
tD
yn
Wors
tD
yn
Wors
tD
yn
Wors
tD
yn
Wors
tD
yn
All
All
L0.0
29
0.0
35
0.0
32
0.0
40
0.0
32
0.0
37
0.0
34
0.0
40
0.0
31
0.0
37
0.0
30
0.0
36
(n=
2236
)U
0.2
25
0.1
65
0.2
15
0.1
60
0.2
17
0.1
58
0.2
14
0.1
57
0.1
93
0.1
51
0.2
20
0.1
66
Pre
vale
nce
cc=
0.0
44
W0.1
96
0.1
31
0.1
83
0.1
20
0.1
85
0.1
21
0.1
80
0.1
17
0.1
61
0.1
14
0.1
90
0.1
30
AM
ale
L0.0
00
0.0
00
0.0
00
0.0
00
0.0
00
0.0
00
0.0
00
0.0
00
0.0
00
0.0
00
0.0
00
0.0
00
(n=
230
)U
0.2
78
0.1
83
0.2
60
0.1
70
0.2
61
0.1
68
0.2
56
0.1
70
0.2
14
0.1
47
0.2
26
0.1
49
Pre
vale
nce
cc=
0.0
00
W0.2
78
0.1
83
0.2
60
0.1
70
0.2
61
0.1
68
0.2
56
0.1
70
0.2
14
0.1
47
0.2
26
0.1
49
BM
ale
L0.0
00
0.0
00
0.0
00
0.0
07
0.0
00
0.0
00
0.0
00
0.0
10
0.0
00
0.0
10
0.0
00
0.0
05
(n=
188
)U
0.2
61
0.1
97
0.2
46
0.1
86
0.2
15
0.1
61
0.2
35
0.1
69
0.1
61
0.1
06
0.2
12
0.1
67
Pre
vale
nce
cc=
0.0
20
W0.2
61
0.1
97
0.2
46
0.1
79
0.2
15
0.1
61
0.2
35
0.1
59
0.1
61
0.0
96
0.2
12
0.1
62
CM
ale
L0.0
04
0.0
04
0.0
06
0.0
06
0.0
07
0.0
10
0.0
09
0.0
09
0.0
07
0.0
10
0.0
04
0.0
04
(n=
226
)U
0.2
35
0.1
90
0.2
20
0.1
80
0.2
19
0.1
74
0.2
13
0.1
68
0.1
80
0.1
60
0.2
01
0.1
77
Pre
vale
nce
cc=
0.0
21
W0.2
30
0.1
86
0.2
14
0.1
74
0.2
12
0.1
64
0.2
04
0.1
59
0.1
73
0.1
50
0.1
97
0.1
73
DM
ale
L0.0
30
0.0
35
0.0
37
0.0
42
0.0
34
0.0
38
0.0
36
0.0
40
0.0
37
0.0
39
0.0
33
0.0
37
(n=
399
)U
0.2
63
0.2
18
0.2
41
0.2
02
0.2
41
0.1
93
0.2
50
0.2
07
0.2
45
0.2
05
0.2
55
0.2
08
Pre
vale
nce
cc=
0.0
60
W0.2
33
0.1
83
0.2
04
0.1
61
0.2
08
0.1
55
0.2
14
0.1
67
0.2
09
0.1
66
0.2
23
0.1
70
AF
emale
L0.0
00
0.0
05
0.0
00
0.0
08
0.0
00
0.0
07
0.0
00
0.0
08
0.0
00
0.0
08
0.0
00
0.0
06
(n=
222
)U
0.2
84
0.2
25
0.2
66
0.2
15
0.2
50
0.1
92
0.2
65
0.2
08
0.2
29
0.1
81
0.2
47
0.1
85
Pre
vale
nce
cc=
0.0
17
W0.2
84
0.2
21
0.2
66
0.2
07
0.2
50
0.1
85
0.2
65
0.2
00
0.2
29
0.1
73
0.2
47
0.1
79
BF
emale
L0.0
33
0.0
42
0.0
37
0.0
55
0.0
40
0.0
51
0.0
41
0.0
56
0.0
39
0.0
51
0.0
33
0.0
46
(n=
306
)U
0.2
68
0.1
99
0.2
55
0.1
84
0.2
52
0.1
87
0.2
50
0.1
74
0.2
52
0.1
85
0.2
51
0.1
87
Pre
vale
nce
cc=
0.0
67
W0.2
35
0.1
57
0.2
18
0.1
29
0.2
12
0.1
36
0.2
09
0.1
18
0.2
13
0.1
34
0.2
18
0.1
42
CF
emale
L0.0
49
0.0
55
0.0
56
0.0
62
0.0
55
0.0
63
0.0
62
0.0
67
0.0
57
0.0
60
0.0
54
0.0
59
(n=
326
)U
0.2
33
0.1
96
0.2
03
0.1
81
0.2
19
0.1
85
0.2
22
0.1
86
0.2
18
0.1
79
0.2
13
0.1
76
Pre
vale
nce
cc=
0.0
86
W0.1
84
0.1
41
0.1
47
0.1
19
0.1
64
0.1
23
0.1
61
0.1
19
0.1
60
0.1
20
0.1
59
0.1
17
DF
emale
L0.0
12
0.0
18
0.0
19
0.0
21
0.0
19
0.0
21
0.0
17
0.0
22
0.0
18
0.0
21
0.0
15
0.0
19
(n=
339
)U
0.2
21
0.1
39
0.2
02
0.1
26
0.2
09
0.1
27
0.1
96
0.1
24
0.2
05
0.1
12
0.2
14
0.1
35
Pre
vale
nce
cc=
0.0
35
W0.2
09
0.1
21
0.1
84
0.1
05
0.1
90
0.1
05
0.1
79
0.1
02
0.1
87
0.0
91
0.1
99
0.1
15
Pre
vale
nce
cc
corr
esp
on
ds
toth
eco
mp
lete
case
esti
mate
of
the
pre
vale
nce
Lco
rres
pon
ds
toth
eL
ow
erb
ou
nd,
Uto
the
Up
per
bou
nd
an
dW
toth
ew
idth
.
37

Table 8: 2008 Bootstrapped bounds for unit respondents.
Cohort Gender Benchmark IV Month MIVWorst Dyn Worst Dyn Worst Dyn
All All L 0.030 0.043 0.033 0.047 0.032 0.044(n=2825) U 0.305 0.306 0.268 0.265 0.303 0.303
Prevalencecc=0.050 W 0.276 0.262 0.235 0.218 0.272 0.259A Male L 0.000 0.000 0.000 0.000 0.000 0.000
(n=253) U 0.348 0.348 0.303 0.307 0.324 0.324Prevalencecc=0.006 W 0.348 0.348 0.303 0.307 0.324 0.324
B Male L 0.004 0.008 0.008 0.014 0.004 0.008(n=238) U 0.357 0.366 0.298 0.298 0.346 0.345
Prevalencecc=0.029 W 0.353 0.357 0.290 0.284 0.341 0.337C Male L 0.011 0.019 0.015 0.021 0.015 0.024
(n=264) U 0.341 0.348 0.324 0.326 0.307 0.309Prevalencecc=0.036 W 0.330 0.330 0.309 0.304 0.292 0.285
D Male L 0.018 0.035 0.020 0.041 0.018 0.039(n=514) U 0.354 0.354 0.300 0.301 0.325 0.324
Prevalencecc=0.043 W 0.337 0.319 0.280 0.260 0.307 0.285A Female L 0.010 0.014 0.012 0.021 0.014 0.017
(n=293) U 0.396 0.396 0.376 0.381 0.369 0.373Prevalencecc=0.040 W 0.386 0.382 0.365 0.360 0.354 0.355
B Female L 0.033 0.053 0.043 0.067 0.037 0.056(n=430) U 0.314 0.316 0.295 0.298 0.306 0.307
Prevalencecc=0.068 W 0.281 0.263 0.253 0.230 0.269 0.252C Female L 0.053 0.075 0.058 0.085 0.058 0.083
(n=375) U 0.344 0.347 0.305 0.305 0.336 0.336Prevalencecc=0.099 W 0.291 0.272 0.246 0.220 0.279 0.253
D Female L 0.015 0.022 0.021 0.026 0.017 0.024(n=458) U 0.269 0.269 0.245 0.244 0.258 0.257
Prevalencecc=0.038 W 0.253 0.247 0.224 0.219 0.240 0.232
Prevalencecc corresponds to the complete case estimate of the prevalence
L corresponds to the Lower bound, U to the Upper bound and W to the width.
38
Copyright © 2022 FDOKUMEN