Using global diversity and local features to identify influential social network spreaders
12
Physica A 433 (2015) 344–355 Contents lists available at ScienceDirect Physica A journal homepage: www.elsevier.com/locate/physa Using global diversity and local topology features to identify influential network spreaders Yu-Hsiang Fu a , Chung-Yuan Huang b,∗ , Chuen-Tsai Sun a a Department of Computer Science, National Chiao Tung University, 1001 Ta Hsueh Road, Hsinchu 300, Taiwan b Department of Computer Science and Information Engineering, School of Electrical and Computer Engineering, College of Engineering, Chang Gung University, 259 Wen Hwa 1st Road, Taoyuan 333, Taiwan highlights • We combine global diversity and local features to identify influential nodes. • A robust and reliable two-step framework is presented as a node ranking measure. • Results from a series of experiments indicate our method performs well and stably. article info Article history: Received 3 June 2014 Received in revised form 30 January 2015 Available online 16 April 2015 Keywords: Node diversity Entropy Social network analysis k-shell decomposition SIR epidemic model abstract Identifying the most influential individuals spreading ideas, information, or infectious diseases is a topic receiving significant attention from network researchers, since such identification can assist or hinder information dissemination, product exposure, and contagious disease detection. Hub nodes, high betweenness nodes, high closeness nodes, and high k-shell nodes have been identified as good initial spreaders. However, few efforts have been made to use node diversity within network structures to measure spreading ability. The two-step framework described in this paper uses a robust and reliable measure that combines global diversity and local features to identify the most influential network nodes. Results from a series of Susceptible–Infected–Recovered (SIR) epidemic simulations indicate that our proposed method performs well and stably in single initial spreader scenarios associated with various complex network datasets. © 2015 The Authors. Published by Elsevier B.V. This is an open access article under the CC BY-NC-ND license (http://creativecommons.org/licenses/by-nc-nd/4.0/). 1. Introduction The network-spreading phenomenon is the focus of studies ranging from information diffusion via online social media sites, to viral marketing, to epidemic disease identification and control, to cascading failures in electrical power grids and the Internet, among many others [1–9]. Strategies for identifying key spreaders are being established and tested to accelerate information dissemination, increase product exposure, detect contagious disease outbreaks, and execute early intervention strategies [10]. Topological structure is a core concept in this network spreading identification process [1,2]. In social network analyses, centrality measures for identifying influential network nodes are broadly categorized as local or global [3,7,11]. Degree centrality, defined as the number of nodes that a focal node is connected to, measures node involvement in a network. However, techniques favored by most researchers for measuring the influence of network nodes fail to consider the importance of global topological structures. The two most widely used global centrality measures for ∗ Corresponding author. Tel.: +886 3 211 8800x3474; fax: +886 3 211 8700. E-mail address: [email protected] (C.-Y. Huang). http://dx.doi.org/10.1016/j.physa.2015.03.042 0378-4371/© 2015 The Authors. Published by Elsevier B.V. This is an open access article under the CC BY-NC-ND license (http://creativecommons.org/ licenses/by-nc-nd/4.0/).
-
Upload
independent -
Category
Documents
-
view
6 -
download
0
Transcript of Using global diversity and local features to identify influential social network spreaders
Physica A 433 (2015) 344–355
Contents lists available at ScienceDirect
Physica A
journal homepage: www.elsevier.com/locate/physa
Using global diversity and local topology features to identifyinfluential network spreaders
Yu-Hsiang Fu a, Chung-Yuan Huang b,∗, Chuen-Tsai Sun a
a Department of Computer Science, National Chiao Tung University, 1001 Ta Hsueh Road, Hsinchu 300, Taiwanb Department of Computer Science and Information Engineering, School of Electrical and Computer Engineering, College of Engineering,
Chang Gung University, 259 Wen Hwa 1st Road, Taoyuan 333, Taiwan
h i g h l i g h t s
• We combine global diversity and local features to identify influential nodes.• A robust and reliable two-step framework is presented as a node ranking measure.• Results from a series of experiments indicate our method performs well and stably.
a r t i c l e i n f o
Article history:
Received 3 June 2014
Received in revised form 30 January 2015
Available online 16 April 2015
Keywords:
Node diversity
Entropy
Social network analysis
k-shell decomposition
SIR epidemic model
a b s t r a c t
Identifying the most influential individuals spreading ideas, information, or infectiousdiseases is a topic receiving significant attention from network researchers, since suchidentification can assist or hinder information dissemination, product exposure, andcontagious disease detection. Hub nodes, high betweenness nodes, high closeness nodes,and high k-shell nodes have been identified as good initial spreaders. However, few effortshave been made to use node diversity within network structures to measure spreadingability. The two-step framework described in this paper uses a robust and reliable measurethat combines global diversity and local features to identify the most influential networknodes. Results from a series of Susceptible–Infected–Recovered (SIR) epidemic simulationsindicate that our proposed method performs well and stably in single initial spreaderscenarios associated with various complex network datasets.© 2015 The Authors. Published by Elsevier B.V. This is an open access article under the CC
BY-NC-ND license (http://creativecommons.org/licenses/by-nc-nd/4.0/).
1. Introduction
The network-spreading phenomenon is the focus of studies ranging from information diffusion via online social mediasites, to viralmarketing, to epidemic disease identification and control, to cascading failures in electrical power grids and theInternet, among many others [1–9]. Strategies for identifying key spreaders are being established and tested to accelerateinformation dissemination, increase product exposure, detect contagious disease outbreaks, and execute early interventionstrategies [10]. Topological structure is a core concept in this network spreading identification process [1,2].
In social network analyses, centrality measures for identifying influential network nodes are broadly categorized as localor global [3,7,11]. Degree centrality, defined as the number of nodes that a focal node is connected to, measures nodeinvolvement in a network. However, techniques favored by most researchers for measuring the influence of network nodesfail to consider the importance of global topological structures. The two most widely used global centrality measures for
∗ Corresponding author. Tel.: +886 3 211 8800x3474; fax: +886 3 211 8700.
E-mail address: [email protected] (C.-Y. Huang).
http://dx.doi.org/10.1016/j.physa.2015.03.042
0378-4371/© 2015 The Authors. Published by Elsevier B.V. This is an open access article under the CC BY-NC-ND license (http://creativecommons.org/
licenses/by-nc-nd/4.0/).
Y.-H. Fu et al. / Physica A 433 (2015) 344–355 345
overcoming these limitations are betweenness and closeness. Betweenness centrality, which assesses the degree to whicha node lies on the shortest path between two other nodes, determines network flow. Closeness centrality is defined as theinverse sum of the shortest distances from a focal node to all other nodes. Influence is tied to the occupation of advantageousnetwork positions. Three basic sources of advantages are high degree, high closeness, and high betweenness. In simplenetwork structures, these advantages tend to vary individually. In complex networks, the potential exists for significantdisjunctures among these position characteristics, meaning that a spreader’s location may be advantageous in some waysand disadvantageous in others.
In addition to centrality measures, results from a k-shell decomposition analysis indicate that network nodes locatedin core layers are capable of spreading throughout a much broader area than nodes located in peripheral layers [1,2].Although the spreading capability of each node differs, those with similar k-shell values are perceived as having equalimportance. A method for ranking the network spreading ability of nodes in terms of degree centrality in identical k-shelllayers for purposes of adjusting rank lists has been proposed [8]. To rank spreaders, a method referred to as mixed degreedecomposition (MDD) adds otherwise ignored degree nodes to the decomposition process [3,6,12]. Still, researchers haveshown a tendency to overlook the importance of network topology and node diversity, despite their positive correlationswith factors such as community economic development [13]. Further, the entropy values of locations visited by usersare positively correlated with the numbers of social ties those same users have in a social network [14]. The combinedentropy values of node degree, betweenness, and closeness centralities have been applied to create complex networkvisualizations [15,16].
Inspired by past studies of network topology and node diversity, we used the entropy concept to develop a robust andreliable method for measuring the spreading capability of nodes, and for identifying super-spreader nodes in complexnetworks. This measure can be used to analyze the numbers of global network topological layers and local neighborhoodnodes that are affected by specific individual nodes. Our assumption is that k-shell decomposition [1,2] can be used forpurposes of global analysis, with nodes having high degrees of global diversity and local centrality capable of penetratingmultiple global layers and influencing large numbers of neighbors in the local layers of a complex network. Tomeasure nodeinfluence, we propose a two-step framework for acquiring global and local node information within complex networks. Inthe first step, global node information is obtained using algorithms such as a community detection algorithm for complexnetworks [5,17,18] or a k-shell decomposition algorithm for core/periphery network layers, after which entropy is usedto evaluate the global diversity of network nodes. In the second step, local node information is acquired through theuse of various types of local centrality, including degree centrality. Last, global diversity and local features are combinedto determine node influence. In our experiments, spreading ability was measured as the total number of recoverednodes over time. We compared the spreading capability of the proposed measure and the local/global centralities of thesocial network using an SIR (susceptible–infective–recovered) epidemic simulation [2,19,20] with various social networkdatasets [21–25].
2. Background
To represent a complex social network, let an undirected graph G = (V , E), where V is the node set and E the edge setof the network. Let n = |V | indicate the number of network nodes and m = |E| the number of edges. Network structure isrepresented as an adjacency matrix A =
aij
and aij ∈ Rn, where aij = 1 if a link exists between nodes i and j, otherwiseaij = 0.
Degree (or local) centrality is a simple yet effectivemethod formeasuring node influence in a complex network. Let Cd (i)denote the degree centrality of node i. A high-degree centrality indicates a large number of connections between a node andits neighbors. NBh (i) denotes the set of neighbors of node i at a h-hop distance. The degree centrality of node i is thereforedefined as
Cd (i) = |NBh (i)| =n
j=1
aij (1)
where |NBh (i)| is the number of neighbors of node i at the h-hop distance; in most cases, h = 1 [7].
Betweenness centrality or dependencymeasures the proportion of the shortest paths going through a node in a complexnetwork. Let Cb (i) denote the betweenness centrality of node i. A high betweenness value indicates that a complex networknode is located along an important communication path. Accordingly, the betweenness centrality of node i is defined as
Cb (i) =
s=t=v∈V
Qst (i)
Qst
(2)
whereQst (i) is the number of shortest paths from node s to node t through node i, and Qst the total number of shortest pathsfrom node s to node t [3,7,11].
Closeness (also known as global) centrality measures the average length of the shortest paths from one node to othernodes. Let Cl (i) denote the closeness centrality of node i. A high closeness centrality value indicates that a node is located in
346 Y.-H. Fu et al. / Physica A 433 (2015) 344–355
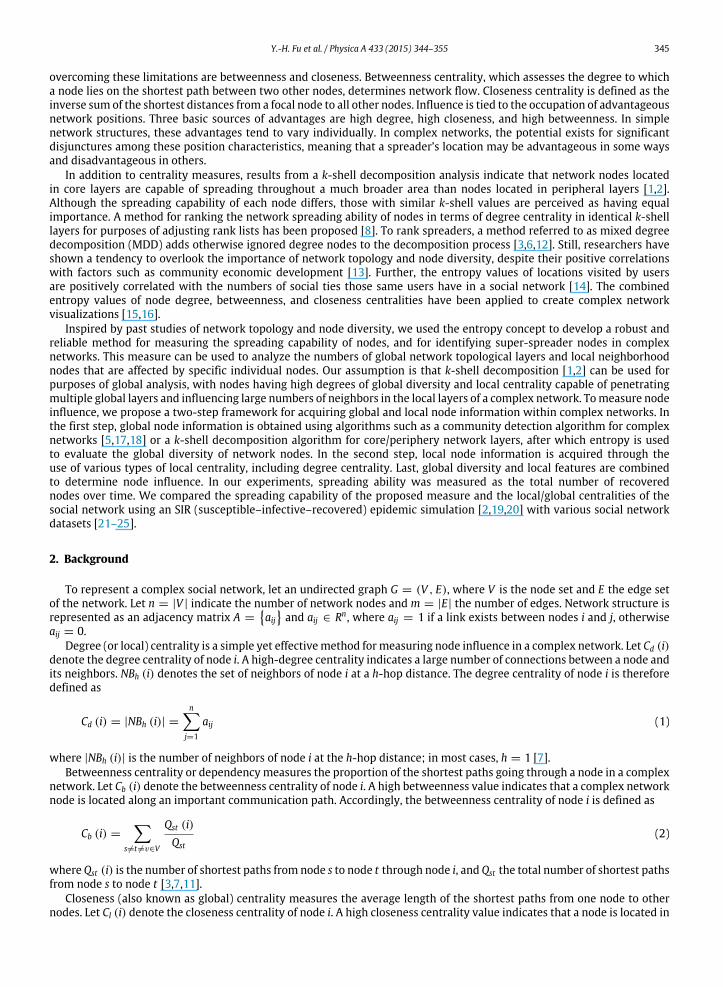
Fig. 1. The SIR (susceptible–infected–recovered) epidemic simulation model.
the center of a complex network, and that the average distance from that node to other nodes is shorter compared to nodeswith low closeness centrality. The closeness centrality of node i is defined as
Cl (i) =1
li, li =
1
n·
n
j=1
dij (3)
where li is the average length of the shortest paths from node i to the other nodes, and dij is the distance from node i to nodej [11].
The k-shell decomposition [1,2] iteratively assigns a k-shell layer value to every node in a complex network. During thefirst step, let k = 1 and remove all nodes where Cd (n) = k = 1. Following removal, the degrees of some remaining networknodesmay be k = 1. Nodes are continuously pruned from the network until there are no k = 1 nodes. All removed nodes areassigned a k-shell value of ks = 1. The next step entails a similar process: let k = 2, prune nodes, and assign a k-shell valueof 2 to all removed nodes. This procedure is repeated until all network nodes are removed and assigned k-shell indexes. Themethod reveals the significant features of a complex network—for example, all Internet nodes can be classified as nuclei,peer-connected components, or isolated components [1].
There are slight differences in the k-shell index and k-core layer concepts. The k-shell index is a global indicatorrepresenting the network core layer that a node is located in. A higher k-shell index represents inner core layer nodesthat are more important than periphery layer nodes. The k-core layer is a sub-network consisting of nodes having ks k-shellindexes that exceed a given value k [1,2]. High k-shell index nodes are capable of infecting a larger number of neighborsthan nodes with identical degree centrality values [2,6,8].
According to the global measures described above, node network positions are determined by analyzing whole networkstructures and the relative relationships of neighboring node network positions. Node network position information isacquired by computing the shortest paths of all pairs in terms of their betweenness centrality and the average length ofall shortest paths in their closeness centrality. Decomposing k-shell network structure from periphery layer to core layerindicates the global property involving the entire network structure; in contrast, ‘‘local’’ indicators involve node informationsuch as the number of connections.
The SIR epidemic model shown in Fig. 1 [2,19,20] has been widely used in multiple fields to study the theoreticalspreading processes of information, rumors, biological diseases, and other phenomena within populations. The ‘‘infectious’’concept is a general property of the spreading phenomena described above. Using epidemiology jargon, ideas and rumorscan be represented as disease pathogens causing infected individuals to spread a disease among a larger population.The individual may have pathogen antibodies after recovering or receiving a vaccine, and therefore become incapable ofreinfection. Due to this characteristic, the SIR epidemic model is widely used as a general-purpose model to describe thestates of a disease and to study contagious spreading processes. Regarding a population’s social network structure, the SIRmodel can be applied to network spreading dynamics, with disease transmission an example of a general network spreadingphenomenon. The SIRmodel has beenmodified and extended (e.g., SEIR [26] and SIHR [27]) to study the spreading dynamicsof different diseases and rumors within networks [28].
The SIR model consists of three states: susceptible (S), infective (I), and recovered (R). S set nodes are susceptible toinformation or diseases, I set nodes are capable of infecting neighbors, and R set nodes are immune and cannot be reinfected.Initially, almost all network nodes are in the S set, with a small number of infected nodes (sometimes a single individual)acting as spreaders. During each time step, I nodes infect their neighbors at a pre-established infection rate β , after whichthey become recovered nodes at a recovery rate of γ . Let S(t) denote the number of susceptible nodes at time t , I(t) thenumber of infected nodes at time t , R(t) the number of recovered nodes at time t , and ρ (t) = R(t)/N the proportion ofimmune nodes. The total number of nodes in an SIR model is S(t) + I (t) + R (t) = n.
3. The proposed measure
The influential social network spreader should satisfy two network topology conditions: high global diversity and highlocal features. First, node global diversity is determined by the network positions of neighbors. Greater differences inneighbor position information increase node diversity—that is, neighbors are distributed equally in all network layers(communities), otherwise they have similar network positions. There is an expectation that high global diversity nodeswill spread information, ideas, or rumors very quickly in the early stages of the spreading process. Second, the local featuresof nodes are measured using the sum of neighbor connections. Here the expectation is that high local feature nodes willtrigger an early and rapid accumulation of contagious transmissions among a large number of candidate nodes.
Y.-H. Fu et al. / Physica A 433 (2015) 344–355 347
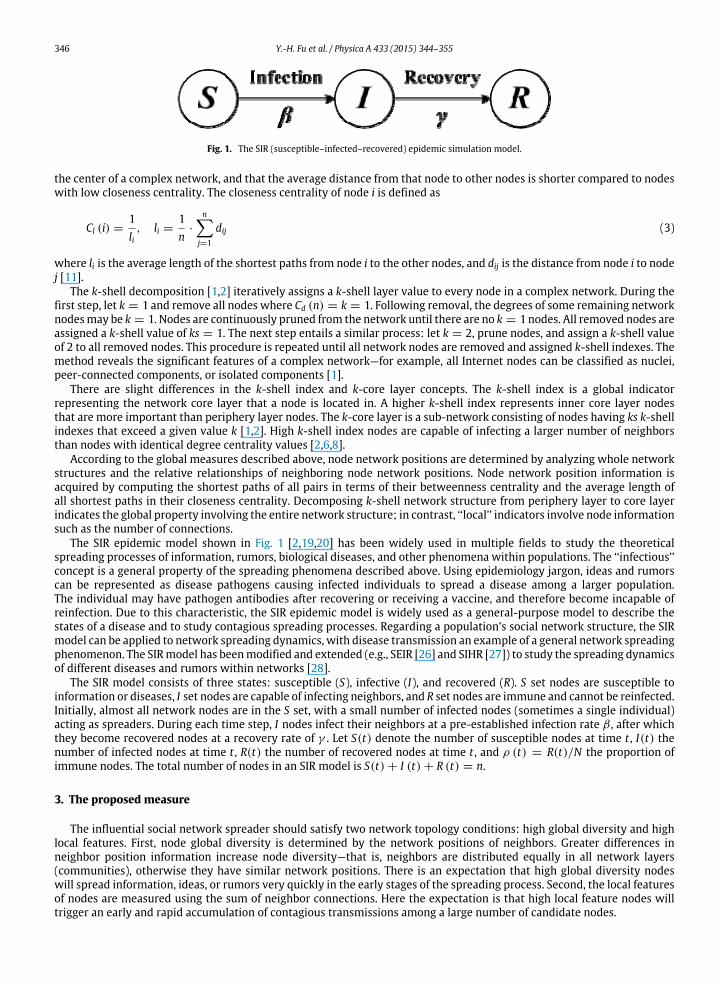
Fig. 2. The proposed two-step framework for computing the influence of network nodes.
The two-step framework shown in Fig. 2 is our proposed method for obtaining global and local node information in acomplex network. In step 1, global algorithms (e.g., community detection, graph clustering, k-shell decomposition) are usedto analyze the global features of nodes in a complex network. Results are used to compute the global diversity of nodes.In step 2, degree centrality is used to measure local node features. Last, global diversity and local features are combined todetermine the final influence of complex network nodes.
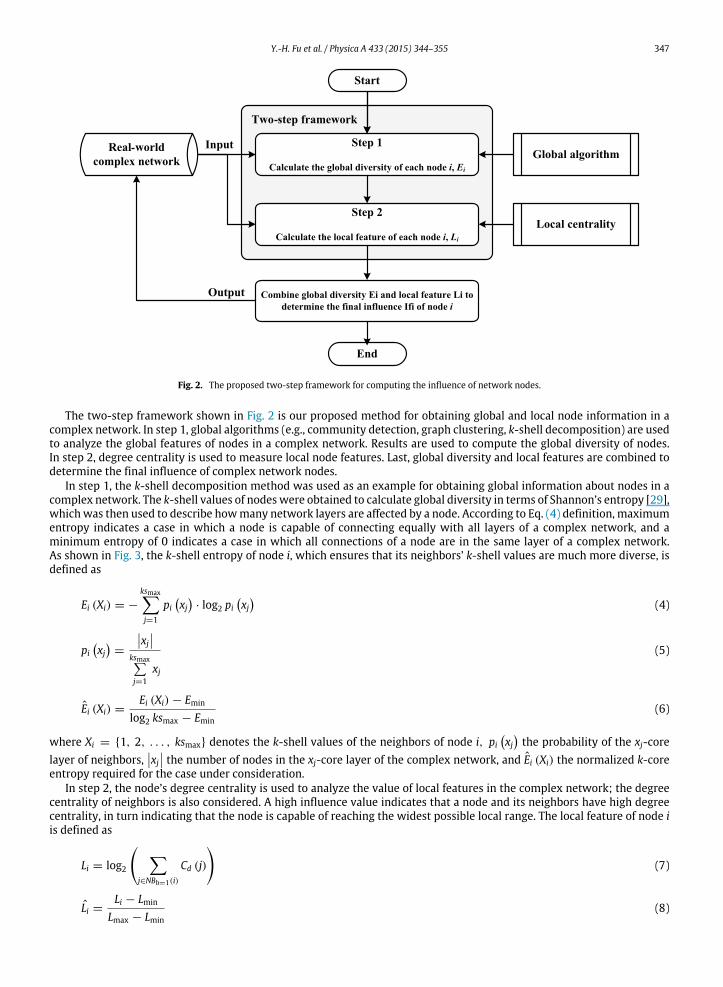
In step 1, the k-shell decomposition method was used as an example for obtaining global information about nodes in acomplex network. The k-shell values of nodeswere obtained to calculate global diversity in terms of Shannon’s entropy [29],whichwas then used to describe howmany network layers are affected by a node. According to Eq. (4) definition, maximumentropy indicates a case in which a node is capable of connecting equally with all layers of a complex network, and aminimum entropy of 0 indicates a case in which all connections of a node are in the same layer of a complex network.As shown in Fig. 3, the k-shell entropy of node i, which ensures that its neighbors’ k-shell values are much more diverse, isdefined as
Ei (Xi) = −
ksmax
j=1
pi
xj
· log2 pi
xj
(4)
pi
xj
=
xj
ksmax
j=1
xj
(5)
Ei (Xi) =Ei (Xi) − Emin
log2 ksmax − Emin
(6)
where Xi = {1, 2, . . . , ksmax} denotes the k-shell values of the neighbors of node i, pi
xj
the probability of the xj-core
layer of neighbors,
xj
the number of nodes in the xj-core layer of the complex network, and Ei (Xi) the normalized k-coreentropy required for the case under consideration.
In step 2, the node’s degree centrality is used to analyze the value of local features in the complex network; the degreecentrality of neighbors is also considered. A high influence value indicates that a node and its neighbors have high degreecentrality, in turn indicating that the node is capable of reaching the widest possible local range. The local feature of node i
is defined as
Li = log2
j∈NBh=1(i)
Cd (j)
(7)
Li =Li − Lmin
Lmax − Lmin
(8)
348 Y.-H. Fu et al. / Physica A 433 (2015) 344–355
Fig. 3. An illustration of k-shell entropy to describe how neighbors are distributed in the network layers.
where Cd (j) is the degree centrality of neighbor j and NBh=1 (i) the neighbor set of node i at a h-hop distance. Li (i) canbe extended to become a ‘‘neighbor’s neighbor’’ version, meaning that all neighbors of node i with a 2-hop distance are
considered, and that Li (i) is the normalized local feature required for the case under consideration.
According to the definition of an influential spreader, Ei and Li are considered simultaneously to maximize the spreadingcapability of node i in a complex network. The identified nodes are expected to connect to hub nodes in different networklayers. Finally, global diversity Ei and local feature Li are combined to denote IF i, the final influence of node i, defined as
IF i = Ei · Li. (9)
Time and space complexities are important for some applications; those of the proposed two-step framework (includingthe combined step) are presented in Fig. 2. In step one, the time complexity associated with computing global diversityvalue E is O (⟨k⟩ · n), meaning that each node visits all of its neighbors to acquire k-shell values, where ⟨k⟩ is the averagenode degree centrality, and space complexity is denoted as the O (n) of storing the E values of nodes. In step two, the timecomplexity of computing local feature value L is O
⟨k⟩2 · n
, meaning that each node accumulates the sum of its neighbors’degree centrality values, andwhere space complexity is denoted as theO (n) of storing the L values of nodes. In the combinedstep, the time complexity is O (n), meaning that final influence IF values are E multiplied by L (or an adding operation ifintroducing the logarithm to equation [11]), and space complexity is denoted as the O (n) of storing the IF values of nodes.Total time complexity is expressed as O
⟨k⟩2 · n + ⟨k⟩ · n + n
= O
⟨k⟩2 + ⟨k⟩ + 1
· n
and total space complexity asO (n + n + n) = O (3n), which can be reduced to O (n) by storing E, L and IF values in the samememory space and ignoringthe combined step to reduce time complexity to O
⟨k⟩2 + ⟨k⟩
· n
.
4. Experimental results and discussion
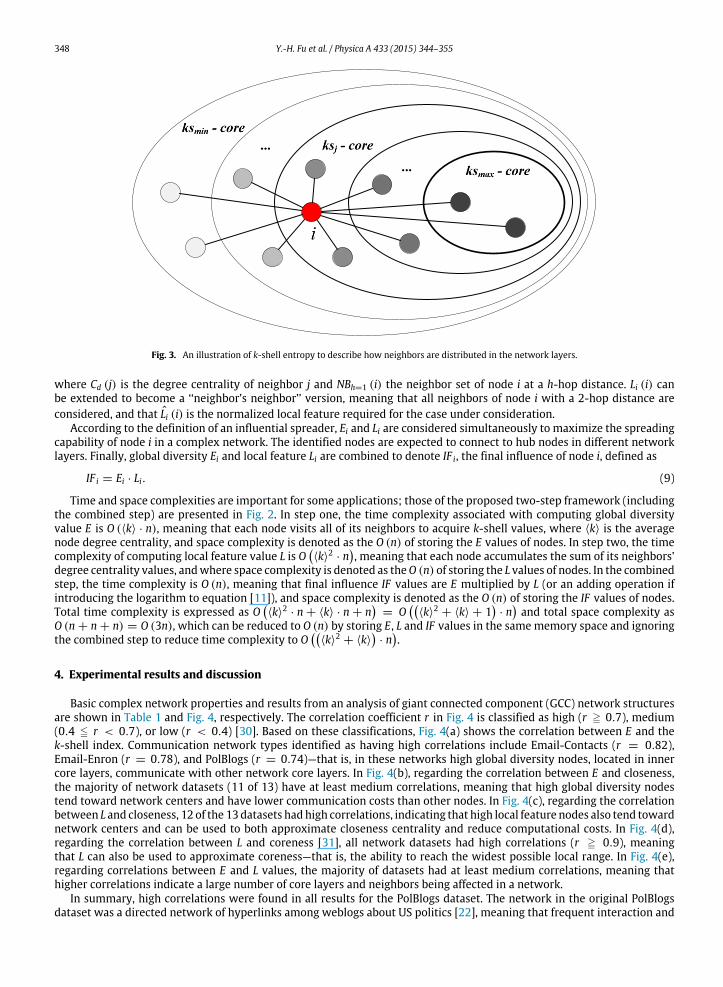
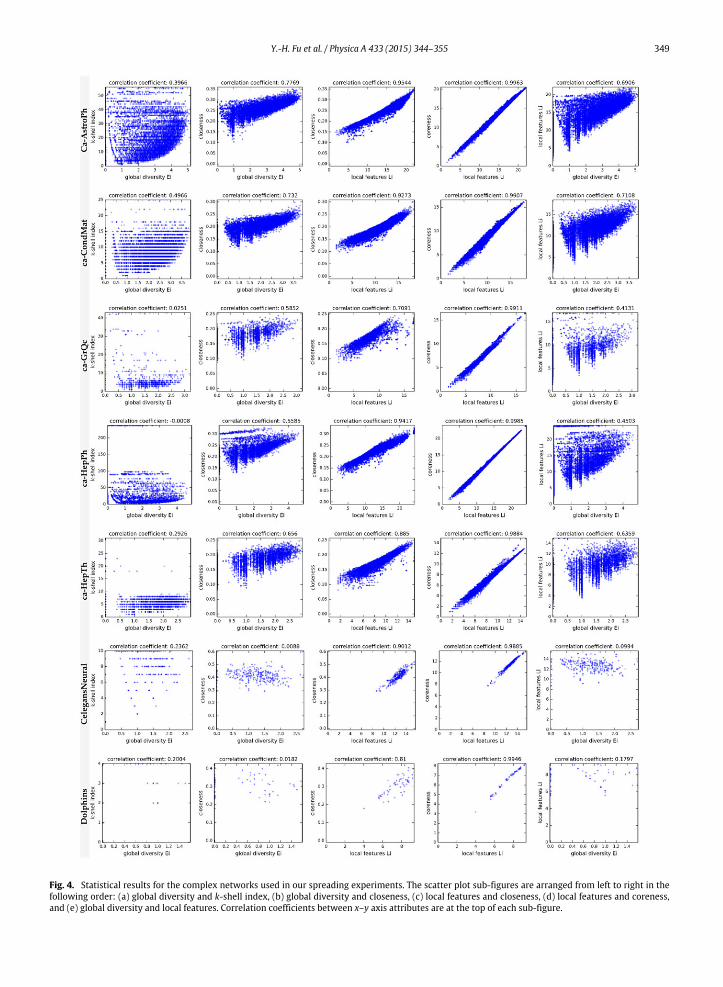
Basic complex network properties and results from an analysis of giant connected component (GCC) network structuresare shown in Table 1 and Fig. 4, respectively. The correlation coefficient r in Fig. 4 is classified as high (r ≧ 0.7), medium(0.4 ≦ r < 0.7), or low (r < 0.4) [30]. Based on these classifications, Fig. 4(a) shows the correlation between E and thek-shell index. Communication network types identified as having high correlations include Email-Contacts (r = 0.82),Email-Enron (r = 0.78), and PolBlogs (r = 0.74)—that is, in these networks high global diversity nodes, located in innercore layers, communicate with other network core layers. In Fig. 4(b), regarding the correlation between E and closeness,the majority of network datasets (11 of 13) have at least medium correlations, meaning that high global diversity nodestend toward network centers and have lower communication costs than other nodes. In Fig. 4(c), regarding the correlationbetween L and closeness, 12 of the 13 datasets hadhigh correlations, indicating that high local feature nodes also tend towardnetwork centers and can be used to both approximate closeness centrality and reduce computational costs. In Fig. 4(d),regarding the correlation between L and coreness [31], all network datasets had high correlations (r ≧ 0.9), meaningthat L can also be used to approximate coreness—that is, the ability to reach the widest possible local range. In Fig. 4(e),regarding correlations between E and L values, the majority of datasets had at least medium correlations, meaning thathigher correlations indicate a large number of core layers and neighbors being affected in a network.
In summary, high correlations were found in all results for the PolBlogs dataset. The network in the original PolBlogsdataset was a directed network of hyperlinks among weblogs about US politics [22], meaning that frequent interaction and
Y.-H. Fu et al. / Physica A 433 (2015) 344–355 349
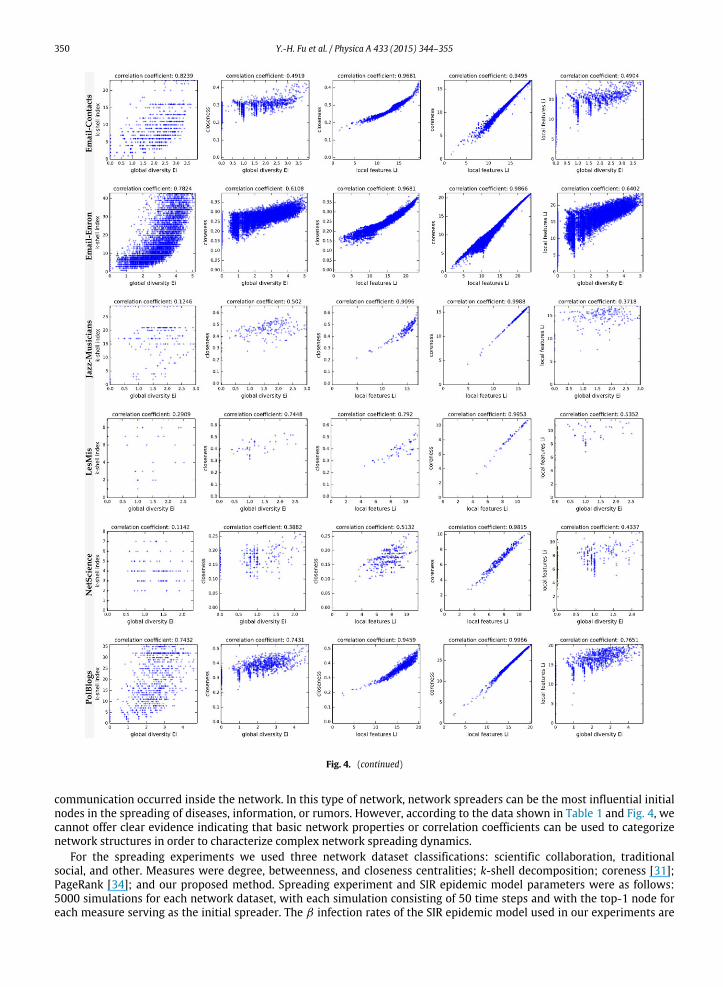
Fig. 4. Statistical results for the complex networks used in our spreading experiments. The scatter plot sub-figures are arranged from left to right in the
following order: (a) global diversity and k-shell index, (b) global diversity and closeness, (c) local features and closeness, (d) local features and coreness,
and (e) global diversity and local features. Correlation coefficients between x–y axis attributes are at the top of each sub-figure.
350 Y.-H. Fu et al. / Physica A 433 (2015) 344–355
Fig. 4. (continued)
communication occurred inside the network. In this type of network, network spreaders can be the most influential initialnodes in the spreading of diseases, information, or rumors. However, according to the data shown in Table 1 and Fig. 4, wecannot offer clear evidence indicating that basic network properties or correlation coefficients can be used to categorizenetwork structures in order to characterize complex network spreading dynamics.
For the spreading experiments we used three network dataset classifications: scientific collaboration, traditionalsocial, and other. Measures were degree, betweenness, and closeness centralities; k-shell decomposition; coreness [31];PageRank [34]; and our proposed method. Spreading experiment and SIR epidemic model parameters were as follows:5000 simulations for each network dataset, with each simulation consisting of 50 time steps and with the top-1 node foreach measure serving as the initial spreader. The β infection rates of the SIR epidemic model used in our experiments are
Y.-H. Fu et al. / Physica A 433 (2015) 344–355 351
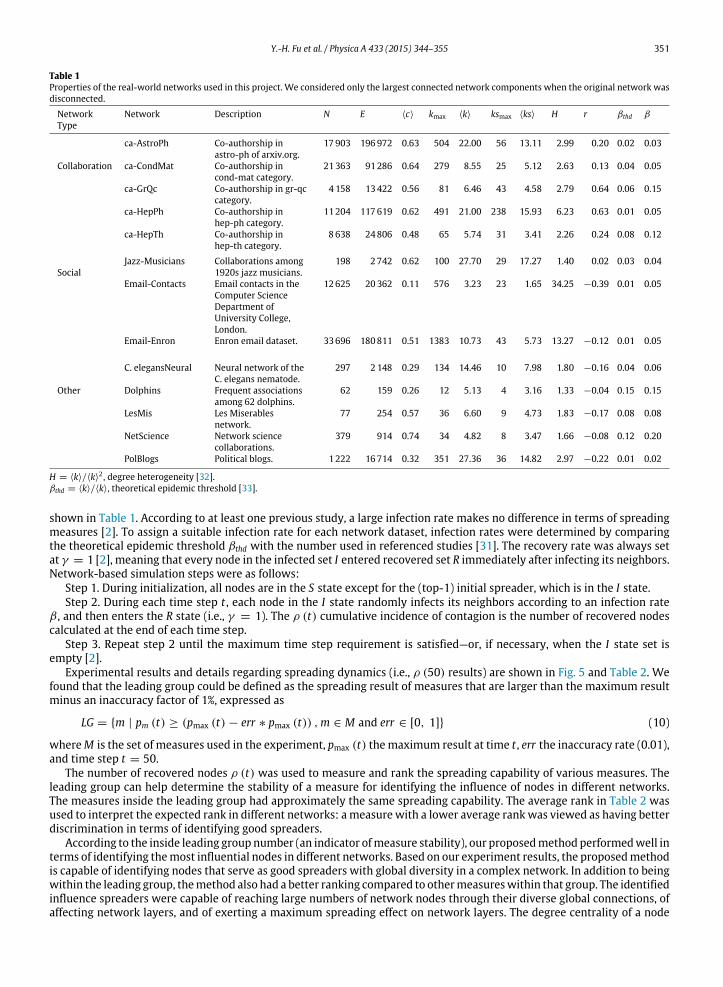
Table 1
Properties of the real-world networks used in this project. We considered only the largest connected network components when the original network was
disconnected.
Network
Type
Network Description N E ⟨c⟩ kmax ⟨k⟩ ksmax ⟨ks⟩ H r βthd β
Collaboration
ca-AstroPh Co-authorship in
astro-ph of arxiv.org.
17 903 196972 0.63 504 22.00 56 13.11 2.99 0.20 0.02 0.03
ca-CondMat Co-authorship in
cond-mat category.
21 363 91286 0.64 279 8.55 25 5.12 2.63 0.13 0.04 0.05
ca-GrQc Co-authorship in gr-qc
category.
4 158 13422 0.56 81 6.46 43 4.58 2.79 0.64 0.06 0.15
ca-HepPh Co-authorship in
hep-ph category.
11 204 117619 0.62 491 21.00 238 15.93 6.23 0.63 0.01 0.05
ca-HepTh Co-authorship in
hep-th category.
8 638 24806 0.48 65 5.74 31 3.41 2.26 0.24 0.08 0.12
Social
Jazz-Musicians Collaborations among
1920s jazz musicians.
198 2742 0.62 100 27.70 29 17.27 1.40 0.02 0.03 0.04
Email-Contacts Email contacts in the
Computer Science
Department of
University College,
London.
12625 20362 0.11 576 3.23 23 1.65 34.25 −0.39 0.01 0.05
Email-Enron Enron email dataset. 33 696 180811 0.51 1383 10.73 43 5.73 13.27 −0.12 0.01 0.05
Other
C. elegansNeural Neural network of the
C. elegans nematode.
297 2148 0.29 134 14.46 10 7.98 1.80 −0.16 0.04 0.06
Dolphins Frequent associations
among 62 dolphins.
62 159 0.26 12 5.13 4 3.16 1.33 −0.04 0.15 0.15
LesMis Les Miserables
network.
77 254 0.57 36 6.60 9 4.73 1.83 −0.17 0.08 0.08
NetScience Network science
collaborations.
379 914 0.74 34 4.82 8 3.47 1.66 −0.08 0.12 0.20
PolBlogs Political blogs. 1 222 16714 0.32 351 27.36 36 14.82 2.97 −0.22 0.01 0.02
H = ⟨k⟩/⟨k⟩2 , degree heterogeneity [32].
βthd = ⟨k⟩/⟨k⟩, theoretical epidemic threshold [33].
shown in Table 1. According to at least one previous study, a large infection rate makes no difference in terms of spreadingmeasures [2]. To assign a suitable infection rate for each network dataset, infection rates were determined by comparingthe theoretical epidemic threshold βthd with the number used in referenced studies [31]. The recovery rate was always setat γ = 1 [2], meaning that every node in the infected set I entered recovered set R immediately after infecting its neighbors.Network-based simulation steps were as follows:
Step 1. During initialization, all nodes are in the S state except for the (top-1) initial spreader, which is in the I state.
Step 2. During each time step t , each node in the I state randomly infects its neighbors according to an infection rateβ , and then enters the R state (i.e., γ = 1). The ρ (t) cumulative incidence of contagion is the number of recovered nodescalculated at the end of each time step.
Step 3. Repeat step 2 until the maximum time step requirement is satisfied—or, if necessary, when the I state set isempty [2].
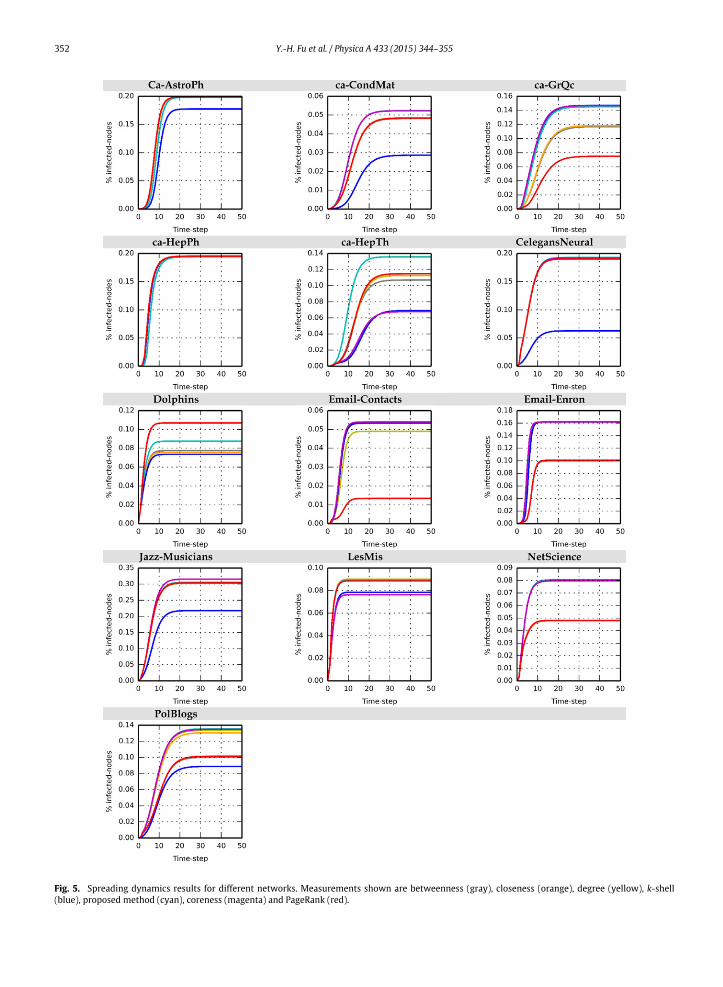
Experimental results and details regarding spreading dynamics (i.e., ρ (50) results) are shown in Fig. 5 and Table 2. Wefound that the leading group could be defined as the spreading result of measures that are larger than the maximum resultminus an inaccuracy factor of 1%, expressed as
LG = {m | pm (t) ≥ (pmax (t) − err ∗ pmax (t)) ,m ∈ M and err ∈ [0, 1]} (10)
whereM is the set of measures used in the experiment, pmax (t) themaximum result at time t , err the inaccuracy rate (0.01),and time step t = 50.
The number of recovered nodes ρ (t) was used to measure and rank the spreading capability of various measures. Theleading group can help determine the stability of a measure for identifying the influence of nodes in different networks.The measures inside the leading group had approximately the same spreading capability. The average rank in Table 2 wasused to interpret the expected rank in different networks: ameasure with a lower average rankwas viewed as having betterdiscrimination in terms of identifying good spreaders.
According to the inside leading group number (an indicator ofmeasure stability), our proposedmethod performedwell interms of identifying themost influential nodes in different networks. Based on our experiment results, the proposedmethodis capable of identifying nodes that serve as good spreaders with global diversity in a complex network. In addition to beingwithin the leading group, themethod also had a better ranking compared to othermeasureswithin that group. The identifiedinfluence spreaders were capable of reaching large numbers of network nodes through their diverse global connections, ofaffecting network layers, and of exerting a maximum spreading effect on network layers. The degree centrality of a node
352 Y.-H. Fu et al. / Physica A 433 (2015) 344–355
Fig. 5. Spreading dynamics results for different networks. Measurements shown are betweenness (gray), closeness (orange), degree (yellow), k-shell
(blue), proposed method (cyan), coreness (magenta) and PageRank (red).
Y.-H. Fu et al. / Physica A 433 (2015) 344–355 353
Table 2
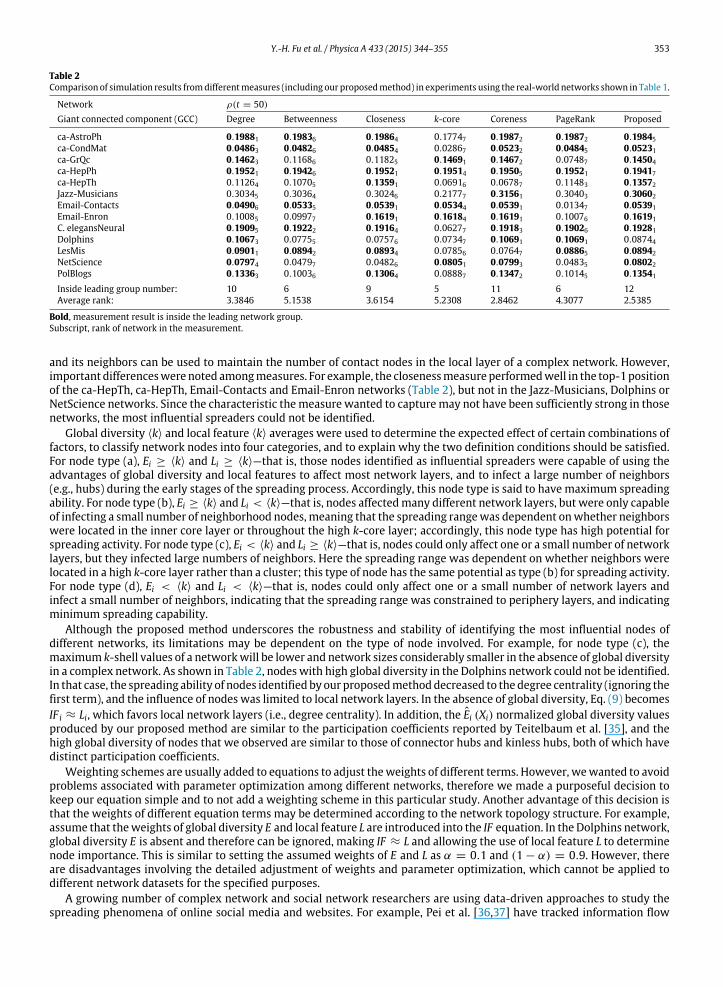
Comparison of simulation results fromdifferentmeasures (including our proposedmethod) in experiments using the real-world networks shown in Table 1.
Network ρ(t = 50)
Giant connected component (GCC) Degree Betweenness Closeness k-core Coreness PageRank Proposed
ca-AstroPh 0.19881 0.19836 0.19864 0.17747 0.19872 0.19872 0.19845
ca-CondMat 0.04863 0.04826 0.04854 0.02867 0.05232 0.04845 0.05231
ca-GrQc 0.14623 0.11686 0.11825 0.14691 0.14672 0.07487 0.14504
ca-HepPh 0.19521 0.19426 0.19521 0.19514 0.19505 0.19521 0.19417
ca-HepTh 0.11264 0.10705 0.13591 0.06916 0.06787 0.11483 0.13572
Jazz-Musicians 0.30345 0.30364 0.30246 0.21777 0.31561 0.30403 0.30602
Email-Contacts 0.04906 0.05335 0.05391 0.05344 0.05391 0.01347 0.05391
Email-Enron 0.10085 0.09977 0.16191 0.16184 0.16191 0.10076 0.16191
C. elegansNeural 0.19095 0.19222 0.19164 0.06277 0.19183 0.19026 0.19281
Dolphins 0.10673 0.07755 0.07576 0.07347 0.10691 0.10691 0.08744
LesMis 0.09011 0.08942 0.08934 0.07856 0.07647 0.08865 0.08942
NetScience 0.07974 0.04797 0.04826 0.08051 0.07993 0.04835 0.08022
PolBlogs 0.13363 0.10036 0.13064 0.08887 0.13472 0.10145 0.13541
Inside leading group number: 10 6 9 5 11 6 12
Average rank: 3.3846 5.1538 3.6154 5.2308 2.8462 4.3077 2.5385
Bold, measurement result is inside the leading network group.
Subscript, rank of network in the measurement.
and its neighbors can be used to maintain the number of contact nodes in the local layer of a complex network. However,important differenceswerenoted amongmeasures. For example, the closenessmeasure performedwell in the top-1positionof the ca-HepTh, ca-HepTh, Email-Contacts and Email-Enron networks (Table 2), but not in the Jazz-Musicians, Dolphins orNetScience networks. Since the characteristic themeasure wanted to capturemay not have been sufficiently strong in thosenetworks, the most influential spreaders could not be identified.
Global diversity ⟨k⟩ and local feature ⟨k⟩ averages were used to determine the expected effect of certain combinations offactors, to classify network nodes into four categories, and to explain why the two definition conditions should be satisfied.For node type (a), Ei ≥ ⟨k⟩ and Li ≥ ⟨k⟩—that is, those nodes identified as influential spreaders were capable of using theadvantages of global diversity and local features to affect most network layers, and to infect a large number of neighbors(e.g., hubs) during the early stages of the spreading process. Accordingly, this node type is said to have maximum spreadingability. For node type (b), Ei ≥ ⟨k⟩ and Li < ⟨k⟩—that is, nodes affectedmany different network layers, but were only capableof infecting a small number of neighborhood nodes, meaning that the spreading rangewas dependent onwhether neighborswere located in the inner core layer or throughout the high k-core layer; accordingly, this node type has high potential forspreading activity. For node type (c), Ei < ⟨k⟩ and Li ≥ ⟨k⟩—that is, nodes could only affect one or a small number of networklayers, but they infected large numbers of neighbors. Here the spreading range was dependent on whether neighbors werelocated in a high k-core layer rather than a cluster; this type of node has the same potential as type (b) for spreading activity.For node type (d), Ei < ⟨k⟩ and Li < ⟨k⟩—that is, nodes could only affect one or a small number of network layers andinfect a small number of neighbors, indicating that the spreading range was constrained to periphery layers, and indicatingminimum spreading capability.
Although the proposed method underscores the robustness and stability of identifying the most influential nodes ofdifferent networks, its limitations may be dependent on the type of node involved. For example, for node type (c), themaximum k-shell values of a networkwill be lower and network sizes considerably smaller in the absence of global diversityin a complex network. As shown in Table 2, nodeswith high global diversity in the Dolphins network could not be identified.In that case, the spreading ability of nodes identified by our proposedmethoddecreased to the degree centrality (ignoring thefirst term), and the influence of nodes was limited to local network layers. In the absence of global diversity, Eq. (9) becomes
IF i ≈ Li, which favors local network layers (i.e., degree centrality). In addition, the Ei (Xi) normalized global diversity valuesproduced by our proposed method are similar to the participation coefficients reported by Teitelbaum et al. [35], and thehigh global diversity of nodes that we observed are similar to those of connector hubs and kinless hubs, both of which havedistinct participation coefficients.
Weighting schemes are usually added to equations to adjust theweights of different terms. However, wewanted to avoidproblems associated with parameter optimization among different networks, therefore we made a purposeful decision tokeep our equation simple and to not add a weighting scheme in this particular study. Another advantage of this decision isthat the weights of different equation terms may be determined according to the network topology structure. For example,assume that theweights of global diversity E and local feature L are introduced into the IF equation. In the Dolphins network,global diversity E is absent and therefore can be ignored, making IF ≈ L and allowing the use of local feature L to determinenode importance. This is similar to setting the assumed weights of E and L as α = 0.1 and (1 − α) = 0.9. However, thereare disadvantages involving the detailed adjustment of weights and parameter optimization, which cannot be applied todifferent network datasets for the specified purposes.
A growing number of complex network and social network researchers are using data-driven approaches to study thespreading phenomena of online social media and websites. For example, Pei et al. [36,37] have tracked information flow
354 Y.-H. Fu et al. / Physica A 433 (2015) 344–355
involving actual diffusion processes using Facebook, LiveJournal, Twitter, and other online social network datasets. Theyused the sum of nearest neighbors’ degrees to approximate a global measure (i.e., k-core decomposition), and found thatthe approximate measure performed almost as well as a k-shell index, and outperformed degree centrality and PageRank.Assuming that a network topology structure and actual information flow can be fully obtained, our proposed two-stepframework can be applied to a data-driven approach as follows:
Step 1: Deploy the search algorithm (i.e., BFS) to extract the actual diffusion range of users and to calculate their globaldiversity E using a k-shell index or estimated values. Global diversity E in a data-driven approach is called actual-baseddiversity. In this paper global diversity is called topology-based diversity.
Step 2: Use local features to calculate how many neighbors may be infected during the spreading process.Step 3: Combine actual-based global diversity Eactual and local feature L to acquire the network’s node influence IF actual.A data-driven approach has great potential for directly analyzing actual user diffusion process data and for obtaining node
influence values, as opposed to using a theoretical SIR or SIS model to analyze the spreading ability of nodes in a network.However, in cases involving a network topology structure and partial user data, a topology-based approach and theoreticalepidemic model may still be useful in analyzing and identifying influential spreaders in a complex social network.
5. Conclusion
In this paper we described our proposal for a two-step framework for calculating the influence of network nodes. In step1, a global algorithm was used to analyze global node information, with the entropy concept from information theory usedto assist in measuring node global diversity. Affected global network layers could be identified using k-shell entropy. In step2, the degree centralities of nodes and their neighbors were considered simultaneously in order to maintain the number ofaffected neighbors in the local layer of a complex network. In the final step, global diversity and local featureswere combinedto determine the influence of nodes in the network. Our experimental results indicate that the proposedmethod performedwell andmaintained stability in leading groups of different network datasets. In otherwords, the proposedmethod is capableof identifying the most influential nodes as initial spreaders that disseminate information, ideas, or diseases in differentnetworks.
Our plans are to add considerable details to our analysis, to introduce a sophisticated method for evaluating spreadingability, and to clarify how the proposed method is affected by network structure. For example, global algorithms such ascommunity detection algorithms can be used to analyze and obtain global information on community network structures,and to determine how factors such as position and node role [35] affect the degree towhich spreaders distribute informationor diseases throughout a complex network. We also plan to study strategies associated with multiple initial spreaders innetworks. Since overlapping infected areas for selected spreadersmust beminimized [2], amultiple initial spreader scenariomay either accelerate or hinder spreading within a complex network.
Acknowledgments
Theworkwas supported in part by a Grant from the Republic of China National Science Council (MOST-103-2221-E-182-052). The work was supported in part by the High Speed Intelligent Communication (HSIC) Research Center, Chang GungUniversity, Taiwan.
References
[1] S. Carmi, S. Havlin, S. Kirkpatrick, Y. Shavitt, E. Shir, A model of Internet topology using k-shell decomposition, Proc. Natl. Acad. Sci. 104 (27) (2007)11150–11154.
[2] M. Kitsak, L.K. Gallos, S. Havlin, F. Liljeros, L. Muchnik, H.E. Stanley, H.A. Makse, Identification of influential spreaders in complex networks, Nat. Phys.6 (11) (2010) 888–893.
[3] B. Hou, Y. Yao, D. Liao, Identifying all-around nodes for spreading dynamics in complex networks, Physica A 391 (15) (2012) 4012–4017.[4] D. Chen, L. Lü, M.-S. Shang, Y.C. Zhang, T. Zhou, Identifying influential nodes in complex networks, Physica A 391 (4) (2012) 1777–1787.[5] X. Zhang, J. Zhu, Q. Wang, H. Zhao, Identifying influential nodes in complex networks with community structure, Knowl.-Based Syst. 42 (2013) 74–84.[6] A. Zeng, C.J. Zhang, Ranking spreaders by decomposing complex networks, Phys. Lett. A 377 (14) (2013) 1031–1035.[7] S. Gao, J. Ma, Z. Chen, G. Wang, C. Xing, Ranking the spreading ability of nodes in complex networks based on local structure, Physica A 403 (2014)
130–147.[8] J.G. Liu, Z.-M. Ren, Q. Guo, Ranking the spreading influence in complex networks, Physica A 392 (18) (2013) 4154–4159.[9] B. Doerr, M. Fouz, T. Friedrich, Why rumors spread so quickly in social networks, Commun. ACM 55 (6) (2012) 70–75.
[10] N.A. Christakis, J.H. Fowler, Social network sensors for early detection of contagious outbreaks, PLoS One 5 (9) (2010) e12948.[11] M. Newman, Networks: An Introduction, Oxford University Press, 2010.[12] M.G. Kendall, A new measure of rank correlation, Biometrika 30 (1–2) (1938) 81–93.[13] N. Eagle, M. Macy, R. Claxton, Network diversity and economic development, Science 328 (5981) (2010) 1029–1031.[14] J. Cranshaw, E. Toch, J. Hong, A. Kittur, N. Sadeh, Bridging the gap between physical location and online social networks, in: Proceedings of the 12th
ACM International Conference on Ubiquitous Computing, 2010, pp. 119–128.[15] E. Serin, S. Balcisoy, Entropy based sensitivity analysis and visualization of social networks, in: 2012 IEEE/ACM International Conference on Advances
in Social Networks Analysis and Mining, ASONAM, 2012, pp. 1099–1104.[16] S.J. Russell, P. Norvig, Artificial Intelligence: A Modern Approach, Prentice Hall, 2010.[17] M. Rosvall, C.T. Bergstrom, An information-theoretic framework for resolving community structure in complex networks, Proc. Natl. Acad. Sci. 104
(18) (2007) 7327–7331.[18] M. Girvan, M.E.J. Newman, Community structure in social and biological networks, Proc. Natl. Acad. Sci. 99 (12) (2002) 7821–7826.
Y.-H. Fu et al. / Physica A 433 (2015) 344–355 355
[19] R. Pastor-Satorras, A. Vespignani, Epidemic dynamics and endemic states in complex networks, Phys. Rev. E 63 (6) (2001) 066117.[20] C.Y. Huang, C.L. Lee, T.H. Wen, C.T. Sun, A computer virus spreading model based on resource limitations and interaction costs, J. Syst. Softw. 86 (3)
(2012) 801–808.[21] Stanford large network dataset collection. http://snap.stanford.edu.[22] Network datasets collected by Mark Newman. http://www-personal.umich.edu/~mejn/netdata/.[23] Network datasets collected by Hernán Alejandro Makse. http://lisgi1.engr.ccny.cuny.edu/~makse/soft_data.html.[24] Jazz musicians network dataset. http://www.infochimps.com/datasets/jazz-musicians-network.[25] P. Basaras, D. Katsaros, L. Tassiulas, Detecting influential spreaders in complex, dynamic networks, Computer 46 (4) (2013) 24–29.[26] C.Y. Huang, T.H. Wen, Y.S. Tsai, FLUed: A novel four-layer model for simulating epidemic dynamics and assessing intervention policies, J. Appl. Math.
2013 (2013) e325816.[27] L. Zhao, J. Wang, Y. Chen, Q. Wang, J. Cheng, H. Cui, SIHR rumor spreading model in social networks, Physica A 391 (7) (2012) 2444–2453.[28] C.Y. Huang, C.T. Sun, H.C. Lin, Influence of local information on social simulations in small-world network models, J. Artif. Soc. Soc. Simul. 8 (4) (2005).[29] C.E. Shannon, A mathematical theory of communication, Bell Syst. Tech. J. 27 (3) (1948) 379–423.[30] C.P. Dancey, J. Reidy, Statistics Without Maths for Psychology, fifth ed., Prentice Hall, Harlow, England, New York, 2011.[31] J. Bae, S. Kim, Identifying and ranking influential spreaders in complex networks by neighborhood coreness, Physica A 395 (2014) 549–559.[32] H.B. Hu, X.F. Wang, Unified index to quantifying heterogeneity of complex networks, Physica A 387 (14) (2008) 3769–3780.[33] C. Castellano, R. Pastor-Satorras, Thresholds for epidemic spreading in networks, Phys. Rev. Lett. 105 (21) (2010) 218701.[34] L. Page, S. Brin, R. Motwani, T. Winograd, The PageRank citation ranking: Bringing order to the web, Technical Report, Stanford InfoLab, 1999.[35] T. Teitelbaum, P. Balenzuela, P. Cano, J.M. Buldú, Community structures and role detection in music networks, Chaos 18 (4) (2008) 043105.[36] S. Pei, H.A. Makse, Spreading dynamics in complex networks, J. Stat. Mech. 2013 (12) (2013) P12002.[37] S. Pei, L. Muchnik, J.J.S. Andrade, Z. Zheng, H.A. Makse, Searching for superspreaders of information in real-world social media, Sci. Rep. 4 (2014).