
EXPLORING ONLINE IDENTITIES OF INFLUENTIAL USERS ...
296
EXPLORING ONLINE IDENTITIES OF INFLUENTIAL USERS IN ONLINE COMMUNITIES: A MIXED METHODS APPROACH A thesis submitted in fulfilment of the requirements for admission to the degree of Doctor of Philosophy University of the West of England Samantha Richardson July 2021
-
Upload
khangminh22 -
Category
Documents
-
view
3 -
download
0
Transcript of EXPLORING ONLINE IDENTITIES OF INFLUENTIAL USERS ...

EXPLORING ONLINE IDENTITIES OF INFLUENTIAL
USERS IN ONLINE COMMUNITIES: A MIXED
METHODS APPROACH
A thesis submitted in fulfilment of the requirements for admission to the degree of
Doctor of Philosophy
University of the West of England
Samantha Richardson
July
2021

2
“It always seems impossible until it’s done.”
―Nelson Mandela

3
ABSTRACT
At present the use of online communities has become a great interest to
practitioners and scholars alike due to the potential for recruitment and social marketing
(Johnson, Safadi, & Faraq, 2015). However, despite the growth in interest for online
communities and the vast potential that online communities offer, fairly little is known
about who influences these groups and the social dynamics of influence. This research
aimed to advance existing knowledge on online communities and examine the online
identities and behaviours of individuals who gain momentum and status within online
communities and how they subsequently lose this perceived status amongst followers.
The present research utilised a pragmatic, mixed methods approach to exploring
influential users. The first phase of the research employed quantitative methods to
determine role transition in two online communities. Using secondary data, the cluster-
analysis illustrated those who had been influential over a two-year period and the
various role transitions that occurred within that time frame. From this, the present
research was able to assess particular online behaviours associated with influential
individuals and identify those deemed influential. A MANOVA revealed that those
categorised as always influential over the two-year period had higher posts, threads,
word count for threads, number of thanks, and reputation and average number of thanks
in comparison with their counterparts. Additionally, social network analysis and a
number of fixed effects are discussed in relation to status. There were no significant
differences found between the two different online discussion sites.
Phase two of the research was conducted via narrative analysis of 16 online
community users (eight from LWP and eight from IU). A detailed examination of the
themes are discussed, the journey that individuals embarked upon when entering a new
forum and this then illustrates how individuals try to seek acceptance from others within

4
their communities. This explored the online identities of influential individuals from a
Social Identity Theory perspective (Tajfel & Turner, 1979). Social identity is key in
understanding online community life and understanding how influential individuals
relate to their salient roles embedded in the community. Consequently, this research
contributes to knowledge by ulitising this theory to explore social identities of those
who gain and lose status and how their identities transpire through online
communication. The research has produced some key questions and interesting ideas
for future research with regards to undermining credibility in online forums, which
could be incorporated into government strategy for counter-terrorism interventions.

5
This is to certify that
(i) the thesis comprises only my original work towards the PhD,
(ii) acknowledgement have been made to funders, supervisory team and the
University
(iii) my thesis is less than 100,000 words in length

6
ACKNOWLEDGEMENTS
To everyone that has made this thesis a reality; I would like to give you a
massive thank you. All the individuals that regularly contributed to their own online
communities, these are your words and you have provided insight into a valuable topic.
I would like to thank my family; Mum, Dad and Amirah for being there continually and
pushing me to work harder and generally be a better person. This is for you.
I would like to thank my funders and of course supervisory team Dr Gareth
Edwards and Dr Adam Joinson, not to mention Dr Helen Frisby in the graduate school
for your continued help and support over the years I honestly never thought that I would
ever get this far. Your help and support has been hugely appreciated.
Finally, Andy Grant who spent hours teaching me how to use MySQL. You are
a lifesaver!

7
LIST OF TABLES
Table 3.1 Characteristics of the Basic Paradigms of Social Research
Table 3.2 Research Questions/Hypotheses for Research Outline
Table 3.3 Table Showing Groups Use in Phase Two from LWP and IU
Table 3.4 Table Showing the Four Different Approaches to Narrative
Analysis
Table 4. 1
Table 4.2
Table Showing Role Transitions for Eight Users LWP
Hypothesis for Phase One
Table 4.3 Group Properties for the Independent Variable Status
Table 4.4
Group Status Mean and Standard Deviation Scores for
Dependent Variable Reputation
Table 4.5
Group Status Mean and Standard Deviation Scores for
Dependent Variable Post Total and Post Word Count
Table 4.6
Group Status Mean and Standard Deviation Scores for
Dependent Variables Thread Total and Thread Word Count
Table 4.7
Group Status Mean and Standard Deviation Scores for
Dependent Variables Average Thread Word Count and Average
Post Word Count
Table 4.8
Group Status Mean and Standard Deviation Scores for
Dependent Variable Number of Thanks Received and Average
Number of Thanks
Table 4.9 Descriptive Statistics for Status Group Monthly Thread
Frequency
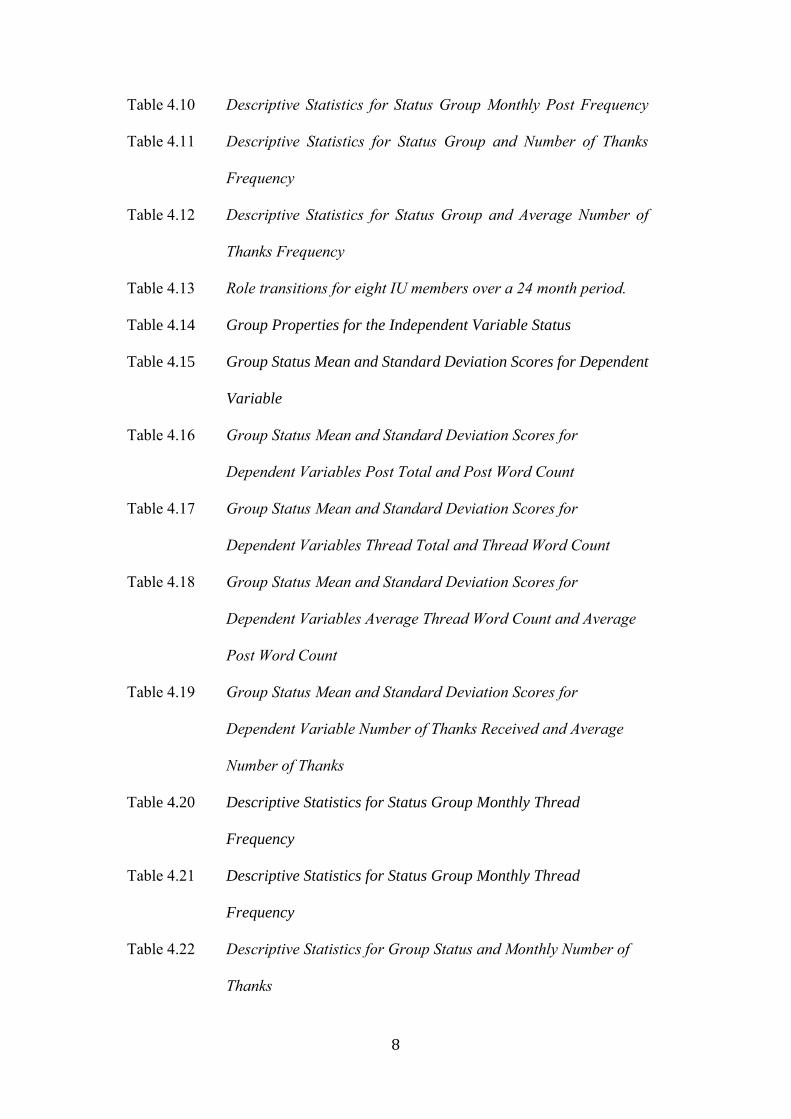
8
Table 4.10
Table 4.11
Descriptive Statistics for Status Group Monthly Post Frequency
Descriptive Statistics for Status Group and Number of Thanks
Frequency
Table 4.12 Descriptive Statistics for Status Group and Average Number of
Thanks Frequency
Table 4.13 Role transitions for eight IU members over a 24 month period.
Table 4.14 Group Properties for the Independent Variable Status
Table 4.15 Group Status Mean and Standard Deviation Scores for Dependent
Variable
Table 4.16 Group Status Mean and Standard Deviation Scores for
Dependent Variables Post Total and Post Word Count
Table 4.17
Group Status Mean and Standard Deviation Scores for
Dependent Variables Thread Total and Thread Word Count
Table 4.18
Group Status Mean and Standard Deviation Scores for
Dependent Variables Average Thread Word Count and Average
Post Word Count
Table 4.19
Group Status Mean and Standard Deviation Scores for
Dependent Variable Number of Thanks Received and Average
Number of Thanks
Table 4.20
Descriptive Statistics for Status Group Monthly Thread
Frequency
Table 4.21
Descriptive Statistics for Status Group Monthly Thread
Frequency
Table 4.22
Descriptive Statistics for Group Status and Monthly Number of
Thanks

9
Table 4.23
Descriptive Statistics for Group Status and Monthly Average
Number of Thanks
Table 4.24
Betweenness Centrality Descriptive Statistics for Influential
Individuals of IU and LWP.
Table 4.25
Table 4.26
PageRank Descriptive Statistics for Influential Members of IU and
LWP.
Hypotheses Summary Table
Table 6.1
Table Displaying Similarities and Differences in Behaviour
Between Members of LWP and IU
Table 6.2 Table Illustrating Key Themes and Subthemes for Influential
Individuals that Gained Status
Table 6.3 Table Illustrating Key Themes and Subthemes for Influential
Individuals that Lost Status

10
LIST OF FIGURES
Figure 2.1 Diagram of “Two-Step Flow Model of Influence”
Figure 3.1 Screenshot of User Information and Reputation Scores
Figure 3.2 Diagram of Threaded Discussion
Figure 3.3 Diagram of Reader-to-Leader Framework
Figure 3.4 Query Used For MySQL Database
Figure 3.5 Query Used to Create Table for MySQL Database
Figure 3.6 Diagram showing the various nodes and edges in a social network
analysis.
Figure 4.1 Line Graph Showing Mean Threads Each Month for the Status
Groups
Figure 4.2 Line Graph Showing the Mean Number of Posts Each Month for
the Status Groups
Figure 4.3 Line Graph Showing the Mean Number of Thanks Each Month for
Status Groups
Figure 4.4 Line Graph Showing Average Number of Thanks Each Month for
Status Groups
Figure 4.5 Line Graph Showing Mean Number of Threads Started Each
Month for Status Group IU
Figure 4.6 Line Graph Showing Mean Number of Posts Started Each Month
for Status Groups IU
Figure 4.7 Line Graph Showing Mean Number of Thanks Each Month for
Status Groups IU
Figure 4.8 Line Graph Showing Mean Average Number of Thanks Each
Month for Status Groups IU

11
Figure 5.1 Themes and Subthemes of Part One for LWP.
Figure 5.2 Screenshot of Polls Started in Community Discussion by Guerrilla
Warfare
Figure 5.3 Threads Moved to Trashcan as Too Controversial
Figure 5.4 Themes and Subthemes for Part One LWP
Figure 5.5 Themes and Subthemes for Part One IU
Figure 6.1 Themes and subthemes of Part Two for LWP.
Figure 6.2 Screenshot of Posting Behaviour for community member Kay
Figure 6.3 Screenshot of Repetitive Behaviour for community member
Brothering
Figure 6.4 Themes and Subthemes for Part Two IU

12
TABLE OF CONTENTS
CHAPTER ONE .......................................................................................................... 17
BACKGROUND AND OVERVIEW ......................................................................... 17 1.1. Background ....................................................................................................... 17
1.2. Introduction ....................................................................................................... 17
1.3. Theoretical Framework ..................................................................................... 20
1.4. Philosophical Stance ......................................................................................... 22
1.5. Narrative Analysis ............................................................................................ 23
1.6. Structure of Thesis ............................................................................................ 23
1.7. Contribution to Knowledge ............................................................................... 25
CHAPTER TWO ......................................................................................................... 27
LITERATURE REVIEW ............................................................................................ 27 2.1. Online Communities ......................................................................................... 27
2.1.1. User Participation in Online Communities ................................................ 28
2.1.2. Credibility in Online Communities ............................................................ 34
2.2. Communicator Characteristics .......................................................................... 37
2.3. Language and Authority ................................................................................... 46
2.4. Rationale for Present Research ......................................................................... 49
2.5 Theoretical Framework: Social Identity Theory ................................................ 49
2.5.1. Social Identity ............................................................................................ 49
2.5.2. Social Identity and the Internet .................................................................. 51
2.5.3. Group Processes ......................................................................................... 52
2.5.4. Limitations of Social Identity Theory ........................................................ 54
2.5.5. Contribution to Theoretical Framework .................................................... 54
2.6. Research Questions and Aims .......................................................................... 55
2.7. Contribution to Knowledge ............................................................................... 55
CHAPTER THREE ..................................................................................................... 57
METHODOLOGY ...................................................................................................... 57
3.1. Chapter Overview ............................................................................................. 57

13
3.2. Paradigms of Social Research ........................................................................... 57
3.2.1. Ontology .................................................................................................... 58
3.2.2. Epistemology ............................................................................................. 59
3.3. Present Research Design ................................................................................... 59
3.4. Research Outline ............................................................................................... 61
3.5 Community Selection ......................................................................................... 63
3.6 User Selection .................................................................................................... 66
3.7 Data Collection for Study One ........................................................................... 69
3.7.1. Sampling .................................................................................................... 70
3.7.2. Selection Criteria ....................................................................................... 71
3.7.3. Analysis ..................................................................................................... 72
3.8 Data Collection for Study Two .......................................................................... 74
3.8.1.Design ......................................................................................................... 74
3.8.2. Sample ....................................................................................................... 75
3.8.3. Analysis ..................................................................................................... 80
3.8.4.Triangulation ............................................................................................... 84
3.9 Ethical Considerations ....................................................................................... 85
CHAPTER FOUR ........................................................................................................ 87
STUDY ONE: QUANTITATIVE ANALYSIS OF ROLE TRANSITIONS IN
ONLINE COMMUNITY............................................................................................. 87 4.1. Overview of Chapter ......................................................................................... 87
4.3. Left Wing Politics Analysis .............................................................................. 87
4.4 Summary of LWP members and Hypothesis Development .............................. 88
4. 2. Summary of Hypotheses: ................................................................................. 89
4.5. SNA for Online Community Members ............................................................. 90
4.6 Global LWP Descriptive and Inferential Statistics ............................................ 91
4.6.1. Inferential Statistics ................................................................................... 94
4.7. Mixed Effects Models ....................................................................................... 99
4.7.1 Thread Frequency and Status Group........................................................... 99

14
4.7.2. Post Frequency and Status Group ............................................................ 101
4.7.3. Number of Thanks Frequency and Status Group ..................................... 103
4.7.4. Average Number of Thanks Frequency and Status Group ...................... 105
4.8 Islamic United Analysis ................................................................................... 109
4.8.3. Descriptive Statistics ................................................................................ 111
4.8.4. Inferential Statistics ................................................................................. 113
4.8.5. Mixed Effects Models .............................................................................. 117
4.9. Comparing Influence between Communities .................................................. 127
4.9.1. Method of Analysis .................................................................................. 128
4.10. Chapter Summary ......................................................................................... 129
CHAPTER FIVE: ...................................................................................................... 135
STUDY TWO: NARRATIVE ANALYSIS OF INFLUENTIALS IN ONLINE
COMMUNITIES ......................................................... Error! Bookmark not defined. 5.1. Overview and Summary of Research Questions/Aims .... Error! Bookmark not
defined.
5.2. The Rise to Influence Analysis LWP ................ Error! Bookmark not defined.
5.2.1.Introduction to Left-Wing Politics .............. Error! Bookmark not defined.
5.3. Left-Wing Politics Analysis .............................. Error! Bookmark not defined.
5.3.1. Part One: Becoming Influential ................. Error! Bookmark not defined.
5.3.2. Theme Two: Adopting a Role ................... Error! Bookmark not defined.
5.3.3. Theme Three: Maintaining Credibility ...... Error! Bookmark not defined.
5.3.4. Summary of Part One: How Influential Individuals Become Reputatable.
............................................................................. Error! Bookmark not defined.
5.4. The Rise to Influence Analysis Islamic United Error! Bookmark not defined.
5.4.1. Theme One: Integration ................................. Error! Bookmark not defined.
5.4.2. Theme Two: Role Formation ..................... Error! Bookmark not defined.
CHAPTER SIX: ......................................................................................................... 136
LOSING STATUS ....................................................... Error! Bookmark not defined. 6.1. Overview of Chapter ......................................... Error! Bookmark not defined.
6.2 Losing Status LWP Analysis ............................. Error! Bookmark not defined.
15
6.2.1. Theme One: Retrogression ........................ Error! Bookmark not defined.
6.2.2. Theme Two: Disengagement ..................... Error! Bookmark not defined.
6.3. Analysis of Losing Status for Islamic United ... Error! Bookmark not defined.
6.4. Theme One: Disengagement ............................. Error! Bookmark not defined.
6.4.1 Subtheme one: The dissolution of self-identity ......... Error! Bookmark not
defined.
6.4.2. Subtheme Two: The dissolution of social-identity ... Error! Bookmark not
defined.
6.5.3. Theme One Summary ................................ Error! Bookmark not defined.
6.6. Chapter Summary ............................................. Error! Bookmark not defined.
6.7 Discussion of Qualitative Data .......................... Error! Bookmark not defined.
CHAPTER SEVEN ................................................................................................... 136
GENERAL DISCUSSION ........................................................................................ 137
CHAPTER EIGHT .................................................................................................... 145
LIMITATIONS, CONCLUSIONS, FURTHER RESEARCH AND RELFECTIONS
.................................................................................................................................... 145 8.1 Limitations ....................................................................................................... 145
8.2. Future Directions and Implications ................................................................. 149
8.3. Conclusions and Knowledge Contributions .................................................... 151
8.4. Summary of Key Limitations .......................................................................... 154
8.5. Summary of Practical Implications ................................................................ 155
8.6. Summary of Future Recommendations for Research ..................................... 155
8.7. Summary of Gaining/Losing Influence in Online Communities .................... 156
CHAPTER NINE ....................................................................................................... 158
REFLECTION ON MY JOURNEY .......................................................................... 158 9.1. Literature Review ............................................................................................ 160
9.2. Methodology ................................................................................................... 162
9.3.Study One - Quantitative Examination of Role Transitions ............................ 166
9.4. Study Two – Narrative Analysis of Influential Individuals ............................ 168

16
9.5. Discussion ....................................................................................................... 169
References .................................................................................................................. 172 APPENDICES ....................................................................................................... 205
Appendix 1: Ethical Approval ............................................................................... 205
Appendix 2: MySQL Queries ................................................................................ 206
Appendix 3: Sample of SPSS Output for Phase One ............................................. 209
Appendix 4: Tables from Quantitative Chapter ..................................................... 242
Appendix 5: Sample Theme Table for Phase Two ................................................ 296

17
CHAPTER ONE
BACKGROUND AND OVERVIEW
1.1. Background
From a personal view, I have always believed that individuals interact
differently online due to the anonymity. Having come from a social psychological
background, online interactions have always been the focus of my research and sparked
my interest in the area of cyberpsychology and behaviour. As such, when I initially
embarked on my journey it was a funded PhD to examine online groups and
interactions. However, over time the focus of the PhD became narrower and attention
to influentials and credibility became the focal point of the research.
One of the main difficulties I encountered through this thesis is the notion of
leadership and influentials. Indeed, when the focus of the research narrowed to popular
individuals it brought forth questions about leaders and leadership. Having
permanently struggled to comprehend the notion of leadership in online communities,
it was removed from the thesis as the research began to focus on those individuals who
had influence but did not necessarily hold a position of power. For example, Kim
Kardashian is not a CEO or World leader, but has a level of interpersonal influence. It
is this level of influence that the thesis will examine in-depth as it is rooted within my
research interests and background. Whilst there are instances where individuals are
referred to as ‘leaders’, this terminology has only been utilised if the research authors
themselves in previously literature have used that term and it is relevant to the study of
influentials in online communities.
1.2. Introduction
Online communities have been described as social-relationship aggregation,
which is facilitated by internet-based technological advancements (Lin & Lee, 2006).

18
These communities are social hubs where individuals can communicate and share
resources with one another (Preece, 2001). These large groups of internet users reflect
a considerable proportion of global internet use as they manifest in many forms; such
as social networking sites, discussion forums, blogs or message boards (Horrigan,
2001; Huffaker, 2010). For instance, in 2009, Facebook (founded in 2004) had a
staggering 175 million active community members (Jameson, 2009). Since then,
however, Facebook now has over 2.8 billion monthly users (McCarthy, 2020,
Protalinski, 2012; Statista, 2018). Likewise, YouTube have an average of 10 billion
video views (per month) making it the third most active website in the world, after
Facebook and Google (Preece & Shneiderman, 2009).
Evidently, these online forums are expanding at a rapid pace and are now
becoming integrated and common-place in everyday life. Additionally, due to the
recent COVID-19 pandemic, remote working and online communities have dispersed
into the workplace (Bavel et al., 2020; Baym, 2000; Rheingold, 2000) and educational
settings (Martin, 2021; Pittinsky, 1999; 2003; Sherer, Shea, & Kritensen, 2003). The
past year has seen 1.32 billion students adapt to remote e-learning across the world
(McCarthy, 2020). Moreover, the effects of numerous lockdowns and social isolation
have seen more people than ever take to digital platforms for emotional support and
social contact (Bavel et al., 2020; Duan & Zhu, 2020; Elmer, Mepham, & Stadtfeld,
2020; Fried, Papanikolaou, & Epskamp, 2020). Indeed, there is an online community
to support every interest or creative endeavor (Johnson, Safadi, & Faraj, 2015).
Consequently, understanding the social dynamics of behaviour in these communities
would provide invaluable insight for social sciences, marketing and communication
researchers alike. This knowledge on influencers could provide businesses and
companies techniques to strengthen their relationship with brands and consumers

19
through digital advertising (Berne-manero & Marzo-Navarro, 2020; Khodabandeh &
Lindh, 2020).
Nevertheless, despite this recent growth in online communities very little is
known about who influences these groups and what the social structure of these
communities looks like given the lack of hierarchy online (Johnson et al., 2015).
Accordingly, in-depth understanding of the communication characteristics and social
network ties would enlighten research on influence and information propagation online.
Thus far, very little research has examined what makes an individual influential, or the
online identities of these influential users within online fora.
That is, what are the online behaviours and characteristics that make individuals
influential to onlookers? How can we identify influentials in online communities?
Therefore, the goal of the present research is to identify the roles of influential
individuals in online communities. Consequently, identifying what makes an individual
influential online can address a far more pressing issue, why do individuals lose their
influence? This question is one that is far less understood and researched in the
available literature but an in-depth exploration of these online identities does have
strong implications for those within the managerial and marketing setting as well as
possible implications for government policies and those working with internet security.
For example, this research can provide clarity to why some brands fail when others
flourish and also help develop strategies for government policies on counter-terrorism
with regards to online recruitment and influence.
Equally, the growing industry of “influencers” has become the focus of recent
research due to the leverage influential individuals have with respect to potential buyers
(Berne-manero & Marzo-Navarro, 2020; Khodabandeh & Lindh, 2020). As product
research and reviews are now readily available, information search is now an integrated

20
part of the online shopping process (Flavián, Gurrea, & Orús, 2009). Therefore, brands
who incorporate social platforms into their marketing strategy and embrace influencers
to endorse their products would benefit from a greater understanding of how and why
influencing works in disseminating information to the masses. Therefore, this research
adds understanding to how influencers may lose their influence over time by exploring
these online identities.
At present the research relating to online identities perceives a ‘static conception
of identity’ through data driven techniques such as ‘personal information’ (Maden, Foz,
Smith, 2007; Zhang, Jiang, & Carroll, 2010). Thus, the current literature does not
examine the social interactions embedded in online community life. Moreover, the
dominant work on identities in cyberspace from Turkle (1999) focuses on game-play
rather than communities on multiplayer real-time virtual worlds (MUDs). Therefore,
the contribution from the present research is that it explores naturally occurring data in
online communities and examines such social networks and interactions sustained by
social identities for users that are particularly influential or popular (Zhang et al., 2010).
This examines how social identity and group categorisation is rooted within community
life and promoted in discussion. From this, the research will add to literature on online
identities and examine those that gain momentum within the community and
subsequently influentials that lose their status within the community to explore
interactions, roles and identities that alter over time.
1.3. Theoretical Framework
Having always had a preferential interest in the social psychology paradigm –
Social Identity Theory (SIT) has been a theoretical framework that I was quite familiar
with (Tajfel & Turner, 1979). Social Identity Theory was originally developed by

21
Henri Tajfel (1974) and has become a key theory within social psychology as it is often
utilised to explain the influence of groups; group favouritism and prejudice.
John Turner and Henri Tajfel worked together and expanded this notion of
group influence to include Self-Categorisation Theory (Turner, 1975). Taken together,
these two influential theories are the foundations of the Social Identity Approach. This
framework examines how individuals self-identify as group members and how this
membership ultimately impact on their notion of identity and social categories. These
theories and current limitations are discussed further in chapter two.
Van de Mieroop (2015) notes that there has been previous shortcoming with the
literature on social identities as research posit “a priori ingroup-outgroup opposition”
(p. 410). Thus, existing research appears to be somewhat problematic and reductionist
in that it does not examine the shifting of identities (Coupland, 2010). Therefore, by
adopting this stance on group membership, previous research has omitted the social
construction of identity apparent in discourses and narratives. Equally, as identity is
primarily viewed as a product of social interaction, natural occurring data is far more
relevant to the social identity approach of online influentials than the existing literature
which assigns established categories (Widdecombe, 1998).
This particular approach has been the framework for the present investigation
as the way in which influential individuals develop their notion of identity and group
membership is central to their online identities and virtual selves (Turkle, 1999). Due
to the nature of anonymity, there are few social markers, therefore, their categorisation
and group identity within an online community is paramount to understanding how an
individual becomes influential within online communities, and subsequently why an
individual might lose their influence over others.
22
1.4. Philosophical Stance
Equally, in choosing to utilise this theoretical framework, comes the issue of
epistemology and ontology (Creswell, 2003) which is the focus of chapter three of the
thesis. This thesis utilises a mixed methods approach to investigating influentials in
online communities. Investigating social identities requires an in-depth understanding
of the interactions of individuals (Van De Mieroop, 2015). Thus, this can be best
accomplished via narrative analysis as online identities and interactions are only
available via language and text, as the only source of communication. I had often
thought of myself as stemming from a constructivist ontology; interested in how
individuals perceive their social worlds and multiple realities (Creswell, 2003;
Reissman, 2008). However, I would now class myself as a pragmatist, as this journey
has thrown me into quantitative data and measurement which I would have previously
tried to avoid before this thesis.
I have maintained through the thesis that I was utilising a pragmatic approach
due to the mixed methodology; however, with mixed methods it is usually presumed
that qualitative research then leads onto the quantitative phase of research and that the
exploratory phase is essentially helping the researcher operationalise one’s hypotheses;
though, this was not the case with the final version of the methodology chapter three,
but pragmatic still appeared to be the most suitable approach as both parts were equally
as important. Therefore, chapter four (the first empirical phase) identifies influential
individuals and examines online behaviours congruent with that of previous literature
to determine who and when an online community member was particularly
popular/influential (Anger & Kittl, 2011; Bakshy, Hofman, Manson, & Watts, 2011;
Fisher, Smith, & Wesler, 2006; Joinson & Dove, n.d.; Ma & Agarwal, 1997).

23
1.5. Narrative Analysis
Accordingly, after the influentials had been identified in the communities, the
next two chapters provided a narrative analysis of online influentials. Chapter five
examines individuals as they gain momentum within their online forums and chapter
six examines when they are losing influence. Van De Mieroop (2015) denotes that
narratives and narrative analysis is central in the exploration of social identities as the
way in which individuals discuss, converse and identify social categories is present
through language and social interactions. Utilising narrative analysis (with a prominent
thematic edge) 16 online community members that were identified from the
quantitative chapter as being influential, this was investigated further to examine online
behviours and interactions when they rise and lose status.
Whilst the narrative analysis does have a strong thematic edge, Reisman (2008)
claims this particular model of narrative analysis focuses more on the content and what
is being told by the individual, opposed to how it is told. Thus, this thematic narrative
analysis was deemed most suitable for the analysis to investigate online identities via a
social identity approach. Language is central to identity; therefore, the analysis focuses
on how individuals interact with on-an-other and how they embody their social
identities within the online forum.
1.6. Structure of Thesis
Chapter One Background and Overview
Chapter Two Literature Review
Chapter Three Methodology
Chapter Four Quantitative Analysis

24
Chapter Five Narrative Analysis
(Gaining Influence)
Chapter Six Narrative Analysis
(Losing Influence)
Chapter Seven General Discussion
Chapter Eight Limitations, Conclusions, Future
Recommendations
Chapter Nine Reflection
While it does appear unusual to have two chapters focusing on narrative analysis
for a mixed methods approach. I had thought combining this into one global narrative
chapter would be far too long and this structure would lose coherence for the reader.
Moreover, by separating these chapters there is more of a narrative and story to the
journey of influentials which, in line with the theoretical framework would provide far
clearer insight into the fluidity of social identities. Therefore, chapter five examines
individuals when they are gaining momentum within their online communities and
chapter six examines online behaviours and interactions when they are losing their
status in their online communities.
Equally, I have also included a discussion of the qualitative findings in chapter
six – before the general discussion. I included this section because I felt that in some
ways the essence of the narrative analysis was lost with the contribution of mixed
methods to the area. As such, by having a discussion at the end of chapter six about
the findings provided a summary of the chapters and main findings in relation to the
theoretical framework ultimately created more coherence. Therefore, the general
discussion in chapter seven focused on the contribution to mixed methods in line with
the pragmatic stance taken for this thesis.

25
This research is not without limitations and shortcoming, but rather than present
them here they are in chapter eight. Additionally, this chapter discusses some ideas for
future research and reiterates my knowledge contribution. Finally, I have put my
reflection in a new chapter (chapter nine). I believe this chapter is as important as the
other chapters as it documents my journey and the various issues I have overcome as a
researcher. I had initially included a lot of the information as an introduction, but I
believe that the reader must read the thesis, before reading my challenges.
1.7. Contribution to Knowledge
The aims of my research were:
• To identify influential individuals present in online communities
• To examine the online behaviours and characteristics that influential
individuals have that distinguishes them from their followers
• To examine the context of conversations online to establish the ways in which
influence can be gained and lost
• To explore online identities of influential users in online communities
This thesis contributes to the social identity approach by exploring online identities
on influential individuals. Specifically, by looking at how influentials embrace their
membership and interact with other members has enabled some guidance as to how and
why influentials gain and lose their status within online communities. Therefore, the
unique aspect of the research is that the extant literature on this topic is yet to focus on
diminishing influence of influential individuals, nor does the literature explore the
online journeys these influential community members embark on when gaining
momentum in an online community. This research adds knowledge to the question,
why do individual lose influence in their online communities? This question is the next

26
logical progression for the research in this area, as this thesis illustrates that social
identities are not fixed in time.
Furthermore, this research advances understanding in this area by utilising a
qualitative narrative analysis approach to examine the transitions of influential
individuals and substantiate the existing literature available by providing a mixed
methods approach. Indeed, there are a variety of approaches which will be discussed
in the literature review but few have yet to qualitatively look at the rise and fall of
influential individuals in conjuncture with one-an-other.

27
CHAPTER TWO
LITERATURE REVIEW
2.1. Online Communities
Online communities are virtual spaces “where people can come together with
others to converse, exchange information or other resources, learn, play or just be with
each-other” (Kraut & Resnick, 2011, p.1). Likewise, Preece (2001) describes these
social hubs as persistent collections of people with common interests whose primary
use of communication is the internet. These are rather broad terms that apply
themselves to many social configurations through the use of internet technology. Online
communities (or virtual communities as they are also known) have become very
popular internet applications due to their ability to attract and potentially sustain
membership (Code & Zaparynuik, 2007; Kraut & Resnick, 2011; Zhou, 2011), thus
thrusting these computerised subcultures into the limelight of social science and
information systems researchers alike.
A report issued by the International Telecommunications Union (ITU), in 2013,
stated that there was an estimated 2.3 billion internet users worldwide (ITU, 2013), this
figured nearly doubled in 2018 (Global Internet Statistics, 2018). Furthermore, internet
traffic is expected to grow and it is further predicted that more than half (53%) of the
global population will be surfing the net in 2020 (Germalto, 2019). According to a
recent report by the China Internet Network Information Centre (CNNIC), about half
of all these internet users have, at some point, accessed an online community (CNNIC,
2010). Facebook, the world’s largest online community, has 2.8 billion active monthly
users (McCarthy, 2020; Prigg, 2015). Equally, virtual worlds such as Second Life have
also seen an accelerated increase in users and activity (Korolov, 2011). Therefore, this

28
emerging arena has great potential for research as it is rapidly becoming commonplace
in everyday life.
2.1.1. User Participation in Online Communities
Paradoxically, while many scholars have discussed the growth of internet usage,
empirical research illustrates that there are fairly few online communities that gain
success and momentum (Ma & Agarwal, 2007; Zhou, 2011). For example, the majority
of communities on websites such as MSN (www.msn.com) have fewer than 25
members and sparse contributions amongst their online members (Ma & Agarwal,
2007). Bateman, Gray, and Butler (2011) articulate the pervasive nature of online
communities, claiming that a members’ contribution is entirely voluntary and the extent
to which one contributes is dependent upon free choice. Accordingly then, this brings
forth the question, if all online communities have these same equal opportunities why
do some succeed when others fail? In response to this notion, a vast amount of literature
has devoted time to investigating member commitment in a bid to determine what
makes successful online communities (Bateman et al., 2011; Zhou, 2011).
Perhaps it is not surprising that an emerging research agenda has dedicated
resources to investigating the intrinsic and extrinsic motivations of member
participation in these communities in a bid to understand successful communities and
sustained membership (Kankanhalli, Tan, & Kwok-Kee, 2005; Lakhani & von Hippel,
2003; Martinez-Torres & Diaz-Fernandez, 2014). Online community membership has
been found to be characterised by levels of engagement (Ren et al., 2012). Therefore,
the strength of an individual’s identification with a group and the interpersonal
relationships and bonds that are formed within these social hubs can determine their
level of participation. As such, online communities are characterised by expertise-

29
based authority, emergent roles, high turnover, interaction and participation (Johnson,
Safardi, & Faraj, 2015; Ren et al., 2007).
Accordingly, extant literature have applied many theories to the success of
online communities, the technology acceptance model (TAM), trust theory, social
capital theory and social network theory just to name a few, have all been utilised in an
attempt to explain online community participation amongst users (Ridings, Gefen,
Arinze, 2002; Hsu & Lu, 2007; Hsu, Ju, Yen, & Chang, 2007). TAM claims that
perceived usefulness (PU) and perceived ease of use (PEOU) are influential factors
affecting an individual’s willingness to commit to an online community. Additionally,
Lin (2008) empirically tested this theory and found both components of the TAM
theory to influence loyalty within some virtual communities.
While TAM has been a popular theory applied to successful online communities
and membership loyalty, commitment theory also has merit within this area and has
also been found to influence member devotion (Bateman et al., 2010). Commitment
theory states the various types of commitment (continuance, affective and normative
commitment) impacts upon members behaviour within organisations. While this has
traditionally been applied to the management literature to explain volunteers’
dedication to non-profit organizations (Becker, 1960), this also has application in the
online communities literature in an attempt to explain voluntary participation in online
communities. A plethora of studies have demonstrated that online behaviours (such as
frequency of contribution) are somewhat determined by an individuals’ perceived value
from the online community. For example, Wesler, Gleave, Fisher, and Smith (2007)
have illustrated informational benefits from online communities. Alternatively, the
benefits of staying in a community may outweigh the cost of leaving the community if

30
the member believes the community serves a social function and has invested
considerable time establishing an identity (Ma & Agarwal, 2007).
Accordingly, Bateman et al.’s (2010) research supported the notion of three
established forms of organisational commitment. These three forms of organisational
commitment have a unique impact of user behaviour. Firstly, continuance commitment
can predict thread-reading behaviour as members appear to analyse the cost/benefit
ratio associated with the community. That is, one may perceive strong informational
benefits from reading discussion threads, which would ultimately impact upon their
thread-reading user behaviour (Wesler et al., 2007). Secondly, affective commitment
was found to impact upon reply-behaviour. Specifically, those with a strong emotional
attachment were more inclined to help others in the community, thus those with a strong
sense of belonging would feel more inclined to invest time into helping others within
their community (Fisher et al., 2006, Wellman & Gulia, 1999). Equally, this can also
be perceived by others as an act of solidarity amongst the community (Bateman et al.,
2011). On the other hand, those who demonstrate lower levels of emotional attachment
are far less likely to care about how other members perceive them, or indeed care about
the development of the community on-the-whole. Consequently, those individuals in
particular are far less likely to contribute to the community and reply to posts. Finally,
normative commitment, which is the feeling individuals have towards remaining in the
community, predicted only moderating behaviours. Therefore, those members of an
online community who internalised their sense of loyalty, were indeed more likely to
moderate and foster discussions (Kim, Choi, Qualls, & Han, 2010).
In accordance with the previous point, Ma and Agarwal’s (2007) research is
congruent with aspects of continuance community commitment. Their research
denotes that identity communication is a salient characteristic for knowledge

31
contribution in online communities as it is central to social discourse (Wynn & Katz,
1997). Ma and Agarwal’s empirical research assessed the impact of community
infrastructure design and identity verification with regards to computer-mediated
communication. Their systematic theory relating to design and knowledge contribution
states that when members confirmed their salient identities, they were in-turn more
likely to rate their community experience higher and ultimately contribute more to the
community as a whole. This study claims that accurate communication combined with
verification of identity creates an amplified sense of self-worth that serves as a
motivator for continued contribution to the community. However, due to the design of
the study, no causations can be determined (Heiman, 2001; Heiman & Harper, 1999;
Langdridge, 2004).
Ren et al. (2007) have noted the different rationalisation for joining or indeed
staying within a particular group. Essentially, this relates to the distinction between
identity and bonds, identity-based attachment refers to an attachment formed with the
group as a whole; alternatively, bond-based attachments refers to individuals staying
within the group because they are fond of specific members within the group (Back,
1951). Prentice, Miller, and Lightdale (1994) investigated the distinction between these
two interlinked concepts within University clubs. Groups were classified as follows;
topic-based groups such as newspaper and sports team were deemed common-identity
groups and fraternity clubs were categorised as relation-based groups. The results
found that common-identity groups reported feeling a stronger attachment to the group,
rather than any specific members; whereas, relation-based groups reported feeling
attached to both the group and members.
Correspondingly then, this has been applied to online community research
(Postmes & Spears 2000; Sassenberg & Postmes 2002; Utz, 2003; Utz & Sassenberg,

32
2002). In general, common-identity (or identity-based groups) suggests that members
feel a stronger commitment to the online community’s purpose or topic, rather than
attachment to members. While Ren et al. (2007) have also investigated this notion,
their research suggested that group design can “increase the likelihood of mainly bond-
based or identity-based attachment to the group” (p.381, Ren et al., 2007). Moreover,
as online communities are dependent upon communication, it is also likely that the
communication that is exchanged in these virtual spaces is dependent upon the types of
attachment formed.
While Ren et al. (2007) adopt a social engineering theoretical approach to
designing online communities; this aspect of online behaviour has not yet been studied
in-depth. However, based on the available literature it is plausible to assume that
individuals who form bond-based attachments have different motivations for joining
and remaining in an online community in comparison to individuals who form identity-
based attachment. Consequently, those individuals who become popular in identity-
based groups are more likely to discuss and promote topics congruent with the groups’
identity. In contrast, those who form bond-based attachments are likely to engage in
off-topic discussions with friends (Ren et al., 2011).
More recently research focusing on identities and online communities has
begun to focus on group identities, and more specifically the emotional and moral
connections that the online community may offer (Lockwood, 2014; Othmani &
Bouslama, 2015). This is largely due to the fact that communities, which tend to have
stronger group identities, have a higher number of contributions from different
members (Bonacich & Schneider, 1992). This is based on the premise that those who
share a common identity also have similar goals and interests which ultimately impacts

33
upon the information sharing and discussions amongst users (Nahapiet & Ghoshal,
1998).
Zhou (2011) found social identity to have a significant effect on membership
participation. More specifically, this survey-research design demonstrated that social
processes such as identification and internalisation, opposed to compliance, influence
members to contribute to discussions and posts. Equally, Zhou’s findings were
consistent with that of previous literature, which claimed affective identity (or one’s
sense of community) had an effect of social network usage and allows newcomers to
adapt to the community quicker (Zhang, 2010). However, while Zhou and Zhang’s
research is somewhat limited as they are largely based on popular social networking
sites; nonetheless, similar findings have been generalized to online communities.
Indeed, several scholars have denoted that finding a sense of belonging, such as
emotional connections, influence and membership to ultimately affect online user
participation (Lin, 2008; Teo, Chan, Wei, & Zhang, 2003)
Sun, Rau, and Ma (2014) denote a number of factors that affect user
participation in online communities. These factors are “group identity, usability, pro-
sharing norm, reciprocity and reputation” (p. 1, Sun et al., 2014). Accordingly, this
appears to advocate both the TAM and commitment theory relating to online
communities and stress the importance of reputation. While informational needs are
strong motivators for online behaviour (Han, Hou, Kim, & Gustafson, 2013; Nonnecke
& Preece, 2001; Schneider, von Krogh, & Jager, 2013), other motivators include; self-
efficacy (Cabrera, Collins, & Salgado, 2006; Chen & Hung, 2010), the desire to achieve
(Tedjamulia, Olsen, Dean, & Albrecht, 2005), and the need for social capital
(Gulanowski, 2018; Han et al., 2007) and popularity (Utz, Tanis, & Vermeulen, 2012).
However, Fan, Wu, and Chiang (2009) state that people feel compelled to share

34
knowledge in communities to avoid the perception of “free-riding.”
Despite the vast amount of research focusing on contribution in online
communities, research has illustrated that the majority of information available in
online communities is actually only created by a small minority of users. To elaborate
on this point, van Mierlo (2014) found that top 1% most active users created 73.6% of
posts on average. Moreover, it has been documented that every user appears to read
more than they actually post (Ebner, Holzinger, & Catarci, 2005). However, the group
influence of community behaviour has seldom been examined in comparison to the
motivational needs and online community user participation. Additionally, the vast
amount of literature appears to focus on the rationalisations for participating such as
emotive, attachments and identity reasons (Bateman et al., 2011; Ma & Agarwal, 2007;
Ren et al., 2007) when, in fact, it could be the other members deemed “credible” that
influences participation from users and gain momentum for online communities.
Alternatively, member participation could be influence by perceived credibility of the
site. As such, credibility of both online communities and communicators will be the
next focus of the review.
2.1.2. Credibility in Online Communities
As discussed previously, the popularity of social technologies and online
platforms can influence online participation as a whole (Casaló, Flavián, & Guinalíu,
2008; Greer & Jehn, 2009). Consequently, more traditional channels of communication
seem to have lost credibility and individuals appear to be favouring online sources for
perceived accurate information (Scoble & Israel, 2007; Sims, Powell, & Vidgens 2013).
Online consumers make judgments about the credibility and accuracy of information
that they encounter on the internet, but their notion of credibility ultimately affects their
participation and online behavior (Metzger & Flanagin, 2013).

35
2.1.2.1. Credibility and the Internet
More recent accounts of credibility focus on how believable the source and the
message received, rather than the speaker to determine source credibility (Hovlan,
Janis, & Kelly, 1953). Hajli, Sims, Featherman, and Love (2014) coined credibility as
the “believability and trustworthiness of information” (p.2); though, this concept has
also been related to accuracy, reliability and objectivity (Self, 1996). The notion of
credibility has been widely researched and is founded on the belief that “credible people
are believable people, and credible information is believable information” (Hilligoss &
Rieh, 2008, p. 1468). Moreover, this rather multi-dimensional concept has been
associated with two fundamental aspects; trustworthiness and expertise (Hilligoss &
Rieh, 2008; Hovland et al., 1953, Young, Komlodi, Rozsa, & Chu, 2016).
“Trustworthiness refers to the perceived goodness or morality of a source” (Young et
al., 2016, p.14). Whereas expertise has been defined as “perceived knowledge, skill,
and experience of the source” (Fogg, 2003, p. 124). Ultimately, these attributes
determine online users’ perceptions of credibility, which affects a multitude of potential
online behaviours such as attitude change and participation (Zhao et al., 2014).
Research has found that the more relevant the information presented in online
communities, the higher the quality of the content (Hajli et al., 2014). Individuals
concerned with this quality of content have adopted a checklist for online consumers to
help aid them in recognising credible information. Understandably, the characteristics
of the source lead to the assumption that credible sources produce credible information.
Accordingly, consumers are told to examine aspects such as layout, visual quality,
spelling and grammar to establish website credibility in a bid to determine accuracy
(Kim, 2010; Metzger & Hall, 2005). Additionally, research has found another level of
criterion to ascertain credibility and in relation to source sponsor or Uniform Resource
Locators (URLs); thus, individuals are told to examine authority, bias, expertise and

36
reputation to assess objectivity (Glantz, 2000; Greer & Jehn, 2009; Kim, 2010; Metzger
& Hall, 2005). Therefore, this criterion appears to be on different echelons but
essentially all of these elements interact with one-an-other to inaugurate both credibility
of information and credibility of source (Fogg et al., 2003; Hong, 2006; Kim, 2010; Liu
& Huang, 2005;). Equally, word length has been found to be an indicator of perceived
quality and impact upon credibility with regards to information needs (Agichtein et al.,
2008).
Moreover, Greer (2003) found that source credibility was significantly
correlated with story credibility, thus, demonstrating that rather than relying on
advertising cues, individuals use their existing knowledge to assess online information
and focus on the information in the content to determine credibility. Consequently,
advertising is not necessarily correlated with source credibility and online community’s
members tend to use alternative online sources of information as trusted sources
(Scoble & Isreal, 2006; Sims et al., 2013). Due to this individuals are increasingly
empowered to generate their own content of information (Hajli et al., 2013). Thus,
there is an emerging body of research on knowledge sharing in online communities
which this review will examine later.
There appears to be huge discrepancies with regards to how individuals evaluate
credibility online. Eysenbach and Kohler (2002) examined how consumers appraise
and rate health information online. Their content analysis revealed that authority
opposed to information or source was a more prominent determinant of credibility in
information online, therefore, opposing the notion that credibility is compiled of source
and information online (Metzer & Flanigan, 2013). Alternatively, Reih (2002) found
that scholars were far more concerned with source reputation and content rather than
visuals. Contrastingly, Fogg et al. (2003) found that the average consumer based their

37
credibility rating upon visual cues (46.1% of the population sample) and superficial
information rather than the content on website; though reputation was also a prominent
indicator or credibility evaluations. Hong (2006) found students rate message features
(quotations and referenced sources) as more important than attributes of the message.
Yet, Liu and Huang (2005) claim that authors name, reputation and affiliation are
important.
Evidently, the importance of credibility varies hugely due to the characteristics
of the research. In Reih’s (2002), Hong (2006) and Liu and Huang’s (2005) their
research relies solely on students as participants, which could account for the
significance of reputation being at the heart of their credibility rating. Alternatively,
Fogg et al. (2003) examined the average internet user, which could provide some
insight on these discrepancies. Nonetheless, when amalgamated these findings seem
to suggest that expert or skilled computer literate individuals place emphasis on the
content to ascertain credibility.
2.2. Communicator Characteristics
As exhibited in the above literature, credibility alongside quality and overall
representativeness is one of the criteria found to influence attitudes (Sundar, 1999).
This is especially prominent when individuals assess media information (Greer, 2000).
Those within media fields have stated that a credible source is one that is seen as
providing correct, bias-free information (Hass, 1981). As mentioned previously,
trustworthiness and overall expertise are considered the most important aspect to
evaluating source credibility (Greer, 2000). Indeed, Milburns’ (1991) research pertains
this point in that information which was rated as high-expertise led to a greater change
in attitude when compared with low-expertise source content which found no changes
in attitude in the message received. However, Milburn also found that overall
38
trustworthiness of the “communicator” is equally as important as their expertise.
Seemingly, bias-free objective communicators are also essential in evaluating the
credibility of a message/content to avoid apparent resistance to message persuasion
(Greenburg & Miller, 1966; Metzger & Hall, 2005). Consequently, there needs to be
a more substantiated body of literature surrounding communicators and what makes an
individual appear credible and whether this impacts upon participation in online
communities.
2.2.1. Opinion Leaders
2.2.1.1. Origin of the Opinion Leader
In respect to the latter point, a growing body of research has investigated the
necessary components of persuasive speakers or those that appear to exert the most
influence (Gass & Seiter, 1999). Indeed, this has become ever more important in the
online world due to the potential for marketers to maximise efforts in online
communities by finding those with the greatest influence and highest levels of
credibility (Guldbrandsson, Nordvik, & Bremberg, 2012). Opinion leaders or
‘influentials’ have a primary role as they filter information from the media to their
followers (Joinson & Dove, n.d.). Katz and Lazarsfield (1957) proposed a ‘Two Step
Communication Model” whereby ‘opinion leaders’ or [influentials] “act as
intermediaries between the mass media and the majority of society” (Watts & Dodds,
2007, p.441). Opinion leaders are individuals who are most likely to influence others
in their “immediate environment” (Katz & Larsfield, 1957, p.3) as demonstrated in the
figure below.

39
Figure 2.1. Two-Step Model of Influence. Adapted from “Influentials, networks and
public opinion” by D., J. Watts, & P., S. Dodds, (2007), Journal of Consumer Research,
34(4), 441-458. 1
However, these individuals are not necessarily leaders in the usual sense of the
word like someone in a position of authority, rather, this is a person-to-person
“ordinary” informal influence whereby select individuals are highly informed and
connected; thus, diffuse the message to their ‘followers’ (Goldsmith, 2004; Grewal,
Mehta, & Kardes, 2000;Watts & Dodds, 2007). Put simply, David Beckham is not a
CEO or World leader, but has a level of interpersonal influence, which is why
corporations employ him for marketing strategies. This is the level of influence one is
talking about for the present review.
Opinion leaders have been found to be important with regards to the success of
health interventions (Valente & Pumpuage, 2007). Kelly et al. (1991) found engaging
opinion leaders popular with gay men ultimately served as behaviour change endorsers
1 1Figure shows the diffusion of information from media (TV) to various sources. The stars
represent opinion leaders who are well connected to others and transmit the information.

40
and unsafe sex practices decreased. More so, Lomas et al. (1991) found opinion leaders
to be successful at decreasing the rate of caesarian births while Earp et al. (2002) found
opinion leaders increase in communitywide mammography use. Evidently, opinion
leaders serve as a role model for conveying health messages and are crucial in message
adoption which creates a positive outcome with regards to changing the opinions and
behaviours of the masses (Doumit et al., 2006; Flodren et al., 2011; Joinson & Dove,
n.d.; Kelly et al., 1991, Lomas et al., 1991; Weimann, Trustin, Vuuren, & Foubery,
2007).
2.2.1.2. Identifying Opinion Leaders
Based on the potential that opinion leaders have with regards to behaviour
change, it is not surprising that scholars have invested considerable time to identifying
these influentials. Rogers (1962) claim opinion leaders have a number of typical
characteristics a) a high level of social participation b) high social status within a given
community and finally c) high levels of social responsibility. Moreover, research has
gone a step further and found that opinion leaders are more innovative and are
particularly skilled or knowledgeable within a certain area (Childers, 1986;
Venkatraman, 1990; Weimann, Tustin, van Vuuren, & Joubert, 2007). Accordingly,
Zhang and Dong (2008) state “[opinion leaders] can obtain information by more than
one channel and have rich life experiences. They [opinion leaders] are knowledgeable
and professional in one specialty. They can contact innovation agencies frequently and
they prefer to take part in formal and informal social activities. They have a wide social
relationship and connect with the public closely, have far-reaching insight and an
eagerness to accept new things” (p. 22).
Broadly speaking, psychometric measures have found mixed results when
assessing items relative to opinion leaders (Weimann, 1991; Weiman et al., 2007).

41
However, both Troldahl and van Dam (1965) and Booth and Babchuk (1972) claim
opinion leaders report a high level of gregariousness in comparison to their
counterparts. Additionally, opinion leaders have a higher level of personal involvement
in public affairs, educational matters and family planning (Heath & Bekker, 1986;
South-Winter, Dai, & Porter, 2015). Moreover, Rieken and Yavan (1983) ascertain
that such individual leaders (which are arguably more influentials than leaders) are
characterised by certain sociographic measures. More specifically, they attend far more
social events such as church, plays, concerts and campus activities (Heath & Bekker,
1986; Rieken & Yavan, 1983; Weimann, 1994). Though, these findings have recently
been disputed, as research has opposed these notions of sociability claiming that
opinion leaders do not necessarily occupy formal positions within a society or
community and it is their expertise that denounces their role (Danesi, 2013; Kwon &
Song, 2015; Winter et al., 2015).
Equally, age, gender, marital status and other socio-economic statuses have also
received mixed results thus far. Lee (2010) and Vishwanath (2011) posit that
individuals are shaped by the opinions and perceptions of others and as such marital
status and age do not appear to matter much in the influential-followers relationship.
However, Sarathy and Patro (2013) found opinion leaders to be younger and have a
post-high school level of education and high occupational statuses. To add further
confusion, Williams and Duvel (2005) found opinion leaders to have a relatively low
level of education. Evidently, the ways in which opinion leaders are characterised has
resulted in various inconsistencies, which is not advancing knowledge on how or why
these specific individuals are regarded with such importance in the dyadic leader-
follower relationship.

42
Despite the large body of research on opinion leadership, identifying
appropriate ‘leaders’2 for practical purposes is somewhat of a challenge for researchers
(Weimann et al., 2007). Traditional methods for identifying opinion leaders included
observation, grading key roles, social interpersonal relationship measurement and self-
reports/identification. However, on the internet such characteristics are not necessarily
available due to the anonymous nature of the Web (Kang, Brown, & Kiesler, 2013).
As such, researchers have begun to determine new ways to identify these influential
individuals in online communities (Bakshy, Hofman, Mason, & Watts, 2011; Cha,
Haddadi, Benevenuto, & Gummadi, 2010; Gilwa & Zygmunt, 2015; Kawk, Lee, Park,
& Moon, 2010; Jungnickel, 2018; Weng, Lim, Jiang, & He, 2010).
2.2.1.3. Identifying Influentials in Online Communities
Several attempts have been made throughout the literature to track influence in
social mediums such as Twitter (Bakshy et al., 2011; Cha et al., 2010; Leavitt,
Burchard, Fisher, & Gilbert, 2009); consequently, academics have examined the spatial
and social dynamics of top influentials on social networking sites. These influential
individuals are targeted for research purposes as they are particularly skilled in
persuading others (Rogers, 1962). As such, communication theory states that by
targeting these top influentials it will produce a cascade of social influence and word-
of-mouth (WOM; Katz & Lazarsfeld, 1955).
Cha et al. (2010) investigated the dynamics of user influence across time, this
study investigated three measures of influence: in-degree (how many followers an
individual has), retweets (how much an individual is mentioned by other users) and
mentions (how much one is mentioned to engage others in conversation). They found
2 These specific individuals are referred to as ‘leaders’ in the research articles
examined

43
that influence is not gained spontaneously, but rather through a concerted effort.
Additionally, their results demonstrated that those who have the most followers online
may not necessarily get mentioned by others the most.
Alternatively, Aral, Muchkin, and Sundararajan (2009) measured influence
through mobile services adoption over Yahoo Messenger. Whereas, Kawk et al. (2010)
determined influence by three measures; the number of followers, the number of
retweets and the PageRanking. Similarly, Weng et al. (2010) assessed influence using
a comparable measurement; PageRank, modified PageRank and number of followers.
Finally, Goyal, Bonchi, and Lakshmanan (2010) identified influence via “leaders” from
Yahoo! Movie users. As illustrated above, the vast amount of research conducted on
Twitter has aimed to define influence and identify those who exert the most power over
others. However, research has ascertained that those deemed as influential users is
dependent upon the influence measurement employed by researchers (Kwak et al.,
2010; Weng et al., 2010).
Despite the limitations of previous literature, some consistent results have
emerged with regards to attempting to measure influence. As such, the characteristics
of influential users generally demonstrate that these individuals have personality traits
such as expertise and credibility (Gladwell, 2002). Likewise, these users have network
attributes such as connectivity and centrality among followers (Anger & Kittl, 2011;
Bakshy et al., 2011; Cha et al., 2010). Though, popularity amongst users (number of
followers) or “indegree influence” has produced mixed results (Cha et al., 2010; Kwal
et al., 2010). Anger and Kittl (2011) state that the number of followers a user has reveals
very little about their influence, thus, claiming the quality of the relationships (as
mentioned in online community user participation) are more important than the number

44
of followers when identifying those whom exert influence. As such, this can only be
achieved through in-depth analysis, rather than simple quantification.
Agarwal, Lin, Tang, and Yu (2008) examined influential bloggers in a
community but differentiated between those influential bloggers that are active and
influentials that are inactive. Indeed, they discuss the challenges in identifying
influentials that are active in a fixed amount of time as posting frequency may be
posting of “junk” or irrelevant material. Nonetheless, their criteria for identifying
influential individuals included post length, average length of comments per post,
number of comments per post, length of time and number of interlinks. However, while
Agarwal et al. (2008) note that influentials are not necessarily fixed in time, their study
was initially only conducted over a 30-day window in line with monthly top blogger
ratings for influential websites, then later their preliminary model was applied to a
moving 30-day window to examine those deemed influential. Thus, there may be many
other influentials that have been overlooked in this investigation. Though, there was a
concerted effort to distinguish between those that were active and those that were not
which previous quantification may not have recognised or accounted for. Nevertheless,
this study did not examine why individuals may have lost potential influence which is
where the present research will advance knowledge.
Huffakers’ (2010) attempt to characterise the traits of online influentials
examines both social influence and leadership; thus, utilising both terms reciprocally.
While this has been examined through a brief discussion of opinion leadership, it cannot
be determined whether this study is actually assessing leaders, or merely influential
individuals of online communities as both are coined together. Therefore, by briefly
including influence into the definition, influence and leadership are then referred to
simultaneously and there is no attempt to differentiate the characteristics of influentials

45
from the online characteristics associated with online leaders. Therefore, making this
relevant for the present review. With regards to the aforementioned definition, opinion
leaders do occasionally display leadership behaviours; however, research has stated that
opinion leaders are not necessarily figures of authority (Soumerai et al., 1998).
Moreover, opinion leaders influence is largely derived from their social status and
perceived influence (Watts & Dodds, 2007), thus, rationalising including opinion
leaders into the present review.
Huffaker (2010) analysed 16 Google groups that encompassed more than
600,000 messages over a two-year period. He found that number of posts, number of
replies and tenure were all indicators of influential individuals in online communities.
Equally, network centrality was also found to be a positively related. Overall, Huffaker
found talkativeness, affect, credibility, assertiveness and linguistic diversity to be
positively associated with online “leaders” or potential influentials. Equally, they
display more confidence in their posts. However, Huffaker did not include those that
had previously been in the community for some time and then become inactive early in
their 20-month time frame. Therefore, there is some misrepresentation in their sample.
As Agrawal et al. (2008) have previously displayed; not all influentials are those that
are active; thus, some element of behaviour may have been overlooked which this
research will remedy.
Correspondingly, Zhu, Haiyi, Kraut, and Kittur (2012) investigated the
effectiveness of distinct ‘leader’ behaviours on Wikipedia. Their classification of
leaders was determined by the messages left on editors’ pages. More so, their
measurement of effectiveness was determined by the extent to which others were
affected and contributed. This work identified different types of language to be
associated with different leadership styles.

46
Predictors of emergent influentials online appear to vary somewhat, depending
upon the scholar. Research has ascertained that sociability, responsibility, cultural
values, performance and trust are indicators of perceived “leaders” online; while others
claim that the amount of communication is essential in identifying online influentials
(Cassell, Huffaker, & Tversky, 2005; Cassell, Huffaker, Tversky, & Ferriman, 2006;
Greer & Jehn, 2009).
In accordance with the latter point, Yoo and Alavi (2002) find emergent
“leaders” send a higher quantity of emails in comparison to their counterparts. These
emails are often longer in length and more task-orientated (Yoo & Avali, 2002; 2004).
Wickham and Walther (2007) ascertain this notion and assert that high levels of
communication were consistent with a group member displaying influential
behaviours. Alternatively, Cassell et al. (2005) denotes that those emerging as
influentials use more social processes. Whereas Greer and Jehn (2009) found flattery
to have advantageous outcomes with regards to gaining support as a soft tactic
influence. This indicated that those that emerge as “leaders” possess a certain mentoring
quality in their online utterances. Taken together, these studies illustrate that the quality
of the conversation is as important as the frequency when investigating those that have
influence online.
2.3. Language and Authority
As noted by Cha et al. (2010) influential status is earned in online communities.
Evidently, influential individuals communicate more than their counterparts (Yoo &
Avali, 2004), but the research presented also indicates that it is not just activity levels
– the quality of the communication is also pivotal in computer-mediated environments.
Balthazard, Waldman, and Warren (2009) examined the etiology of “leaders” in virtual
teams and find linguistic quality and grammatical complexity to be significant

47
predictors of “leadership” emergence. Moreover, Cassell et al. (2006) examined 48,000
messages and found emergent “leaders” use more “we” words, use more social
processes to encourage dialog and ask more questions (Who? What? Where? When?).
Therefore, they have an apparent group identity and foster discussion amongst
members. Equally, while they use a large sample, they include adolescent or
undergraduate populations; thus, this cannot be applied to the average internet users as
younger students may be more resilient to language diversity and more prone to
answering questions.
On the other hand, Joinson and Dove (n.d.) examined two online communities
and comprised a sample of 245 “leaders” and 353 “leaders” retrospectively (with a
matched sample of non-leaders for each community). Interestingly, from using this
sample their results contradicted that of Cassell et al. (2006), in that they found
influentials of both communities to use significantly less first person pronouns (“I”),
and ask less questions. Yet, they found influentials of just one of the communities to
use fewer first person plurals than their counterparts (‘we”). Interestingly however,
influentials from both communities did use more second person pronouns (“you”).
Mixed results also emerged with regards to the use of emotive language; one
community appeared to broadly support the notion that influentials use more emotive
language; whereas, the second community found no difference in the use of emotive
language between influential and non-influentials. Accordingly, this may relate back
to the research previously presented and the notions of attachments and bond in online
communities (Bateman et al., 2011; Ma & Agarwal, 2007; Ren et al., 2011). In other
words, different communities may have different attachments, which needs to be
investigated to enhance knowledge on participation. Therefore, participation may be a
result of both influentials and the bonds that are formed. This research intends to

48
respond to this through investigation of online communities via a combination for
methods.
Together Joinson and Doves’ (n.d.) research appears to highlight the uniqueness
of online communities. In that different community influentials have a different pattern
of behaviour. There was a higher level of agreements and a lack of sense of community
in the religious online community; leading to more conversation about home life.
Alternatively, results revealed that negative emotive words attained some degree of
status in the second community. As such, while Joinson and Dove and Cassell et al.
(2006) have provided valuable insight into online community identity and authority,
they are not without limitations. Namely, their investigation addresses word frequency
through Linguistic Inquiry and Word Count (LIWC) rather than semantic meaning and
omits exact meaning of utterances online (Pennebaker, Mehl, & Niederhoffer, 2003).
While this research has provided some clarity regarding identifying influentials online,
it is evident that some of the potential indicators of influentials in online communities
vary depending upon the community. As such, the markers of so-called influentials
may only be ascertained via detailed qualitative enquiry.
As exhibited above, there is a clear issue in the literature identifying influentials
in online communities; though, there is clear evidence that there are certain behavioural,
social and linguistic features that aid identification of those that possess influence over
others in online communities. However, a greater understanding of the features, tactics
and language that influential individuals use cannot be obtained without an exploratory
and in-depth investigation. Additionally, research must acknowledge the fluidity of
influentials and role transitions that occur in online communities as influential
individuals are not fixed in time.

49
2.4. Rationale for Present Research
Agrawal et al. (2008) claim influential bloggers are not necessarily those that
are active. Indeed, most sites advertise top bloggers within time frames such as monthly
top bloggers. However, this would omit those that are not active within certain time
frames. With the speed of the internet and rapid growth of online communities, it is
important to address influential individuals that are not fixed in time and conceptualise
how and why they become influential within a given community. From that, research
would need to address and utilise all of the methods currently available to identify
influentials and provide a richer, more pragmatic account of the behaviours these select
few individuals ascertain. While Agrawal et al. (2008) and Joinson and Dove (n.d.)
have used historical data and applied their identification techniques to those that may
no longer be active, they have not also examined reasoning behind why individuals
subsequently lose influential status within a given community. Quantification may not
be the way forward to address the fluidity of roles within these online communities.
An in-depth understanding must be provided to examine the transition from follower to
influential (and vice versa) as these individuals do hold permanent influential status,
they can become inactive or revert back to a less important role. Equally, drawing from
the previously discussed work from Cha et al. (2010), influence or indeed influentials
are developed over time with considerable effort. Therefore, this can only be explored
in-depth through qualitative exploration.
2.5 Theoretical Framework: Social Identity Theory
2.5.1. Social Identity
Recently, organisational literature has seen the emergence of Social Identity
Theory (SIT) as a perspective on understanding the organisational context and social
environment in which groups develop and function (Haslam et al., 2006; Hogg, Terry,

50
& White, 1995; Pegg, O’Donnell, Lala, & Barbar, 2018). This is derived from the
notion that identification within particular groups ultimately leads to more cooperation
and a higher level of productivity and performance (Kimble, 2011; Kimble, Li, &
Barlow, 2009; Jimenez, Boehe, Taras, & Caprar, 2017). Therefore, drawing from the
work of Tajfel and Turner (1979) and developments within social psychology, social
identity presents a framework for the present study within online communities as online
communities play an important role in how online community members enact their
social selves online (Pegg et al., 2018).
Stryker and Burke (2000) claim three distinct uses of identity which apply to
online communities and online selves. Firstly, an identity may refer to a culture;
secondly, a common identification within a social category and lastly, identities are
entwined meaning that people attach to the many different roles that they may play.
Tajfel (1974) defined social identity as “an individuals’ knowledge that he belongs to
a certain social group together with some emotional value and significance to them of
this group membership” (p.292). In addition, this social identity can be perceived as
ones position within a social structure as groups impact on an individuals’ sense on
belonging (Hogg, 2004).
As discussed earlier in the review, Fisher et al. (2006) found individuals invest
more time into an online community when they have a strong sense of self. Equally,
Kim et al. (2010) and Ren et al.’s (2011) work, together found that popular individuals
have a stronger loyalty to their online community and promote topics consist with the
groups’ identity; yet, there appears to be a caveat within the online community research
addressing the online identities of these influentials despite their clear influence over
other online community members and usefulness to online discussions (Aggarwal et
al., 2008; Aral et al., 2009; Cha et al., 2010; Fisher et al., 2006; Ma & Agarwal, 1997;

51
Ren et al., 2011; Weng et al., 2010). As such, their identities seem key in understanding
contributions in online communities (Ma & Agarwal, 1997).
SIT posits that an individual can express an awareness of their social category
and the value they feel towards that membership classification (Hogg, 2004). Due to
this, groups also have a huge impact on an individual and their identity, and who
influences the group that they feel a sense of belonging to (Hogg et al., 2004); thus,
showing theoretical relevance to the present study when identifying those who are
particularly influential within a community and how their social identification may
impact on their online behaviour. This perception of self-belonging and group
membership is known as self-categorisation (Turner, 1982) This means that when an
individual perceives themselves as being part of a certain category or group it
subsequently enhances feelings of self-esteem, as groups wish to have positive
identities (Stets & Burke, 2000). This asserted categorisation may drive an individual
to behave differently towards in-group and out-group members (Akba, 2015). In other
words, the more an individual identifies with a particular group, the more likely they
are to make attributions to their group (in-group) and subsequent discriminations
towards those not in their group (out-group; Branscombe et al., 1999; Operario & Fiske,
2001). Therefore, the way in which influential individuals behave within their online
communities is of great interest but has often been examined via experimental designs
opposed to naturally occurring groups (Abbink & Harris, 2019).
2.5.2. Social Identity and the Internet
Jenkins (2004) posits that all human identities are by definition social identities
and that it is this identity which concerns how we identify our similarities and
differences from other groups of individuals. Indeed, it is this interplay between how
we identify with ourselves and how others identify us which the social identity

52
approach examines (Code & Zaparyniuk, 2010; Jenkins, 2004). Given that the internet
allows individuals to explore multiple identities and adopt various roles (Korte, 2007),
the internet and online communities offers a virtual space where individuals can address
their need to belong and develop their social identities (Gangadharbatla, 2009;
Vernuccio, Pagani, Barbarossa & Pastore, 2015).
Research has frequently considered the effect of anonymity and the change in
social interaction due to this (Turkle, 1999; Wellerman et al., 2001), and the positive
and negative effects of a reduction of psychological constraints (Joinson, 2007;
Lapidot-Lefler & Barak, 2015; Pegg et al., 2018). However, Zajacz (2013) suggests
that this over focus on the use of anonymity has meant that research into the importance
of user identity have been overlooked. Recent research on the online identity
phenomena claims that the online identity is central to understanding intrapersonal
relations and how this influences real world events (Pakhyusiva, 2019). Moreover, that
online identities can indeed help understand one’s self more fully (Zhichkina &
Belinskaya, 2019). The present research uses ideologically driven communities and
proposes that such communities are in fact opinion-based group – as these collections
of online users share similar beliefs, opinions and ideologies (Bliuc, Betts, Vergani,
Iqbal., & Dunn, 2019; Bliuc et al., 2015); thus, drawing from the previously discussed
online identity research to incorporate a better understanding of how individuals
become popular (Cha et al., 2010; Fisher et al., 2006; Ma and Agarwal, 1997; Ren et
al., 2011).
2.5.3. Group Processes
Many theories have tried to explain group behaviour (Haslam et al., 2006;
Harris, 1995; Hogg, 1987; Kolbe & Boos, 2009; Tajfel & Turner, 1979). However,
this research will focus on the social identity approach. The social identity approach

53
has three core element involved in the study of intergroup behaviour; first, is one’s
psychological processes that lead to a social identity; second, strategies that are
involved in maintaining a positive social identity and lastly, key characteristics of the
social structure (Everett, Faber, & Crockett, 2015). The social identity approach has
focused on how individuals can enhance their social identities via categorising
themselves as a group member; known as self-categorization (Turner, 1982). Indeed,
this theory denotes that individuals, or in this case, online community members, must
associate themselves with those with similar beliefs to identify as part of a group or
category (Abrams & Hogg, 2001). Subsequently, individuals come to perceive the
world as groups; ingroups (where an individual is a member) and out-groups (where an
individual has no membership). When individuals internalise their group member, this
then becomes part of the self and those characteristics of the in-groups become part of
the individual’s sense of self (Smith, Coats, & Walling 1999).
Research has also ascertained that ultimately in-group members are more
influential than out-group members and a collective identity can depersonalise the
individual as they would rather belong to a collective identity (Code & Zaparyniuk,
2010). Equally, those who identify highly with the group think of themselves as in-
group members to feel more connected to other members of that group (Everett et al.,
2015). This is often done via comparison and striving to maintain a positive collective
identity; as such, groups often preserves positive social identities by evaluating one’s
own group more favourably than the out-group (Tajfel, 1982). However, from a
theoretical point of view, online interaction and longitudinal data on how individuals
develop their collective identities is not very well understood, nor is there a vast amount
of research examining whether group members perceive a social order within online
groups (Bliuc et al., 2019; Everett, et al., 2015; Turner & Reynolds, 2001), as research

54
has focused more on self-presentation, commitment and participation in online
communities (Schwammlein & Wodzicki, 2012).
2.5.4. Limitations of Social Identity Theory
While a plethora of research has been conducted on SIT (Tajfel & Turner, 1979)
and the benefits of self-categorisation with regards to self-esteem, it is important to
point out that there is limited knowledge on a groups status and perceived power or
authority (Abrams & Hogg, 1988; Hogg & Abrams, 1990). Consequently, more
research is needed into identity and social structure (Postmes et al., 2005; Reicher,
2004). Therefore, at present, there is a caveat in research addressing the identities of
popular or influential individuals online, despite research denoting how central identity
is to contribution in online communities (Ma & Agarwal, 1997).
Equally, the majority of the research conducted on SIT and online identity has
been investigated in respect to virtual teams, which are task orientated and motivated
in nature (Kimble, 2011). Therefore, SIT needs to be examined in a naturally occurring
groups such as an online communities rather than an assigned groups. As such, the way
social identity is formed and then influences behaviour cannot necessarily be
understood at the assigned group level (Wei-Au, 2010). Equally, SIT has mostly been
examined in a static perspective (i.e. social identities are fixed), whereas more recent
research has come to see social identity as a fluid process as people can switch between
identities and roles (Champniss et al., 2015; Vernuccio et al., 2015).
2.5.5. Contribution to Theoretical Framework
This research offers a number of contributions to SIT (Tajfel & Turner, 1979);
firstly, an in-depth analysis in naturally occurring, longitudinal data from two far-right
online communities with a strong ideological foundation to foster a strong sense of self
belonging and membership. Indeed, this research is the only research to have examined
both the identification markers of influential or authoritative online community

55
members, as well as qualitatively exploring the nature of their social identities in
naturally occurring data. Therefore, when individuals have emerged as authoritative
or influential users within a particular online forum, do they display more self-
categorisation? Also, when they lose such status do they display less evidence of their
social identities? Could this be a factor in why one loses influence amongst their peers?
This also adds knowledge by exploring the social identities of influential community
members during their community tenure and exploring how their notions of loyalty,
identity and group membership are promoted and exhibited in their interactions with
others.
2.6. Research Questions and Aims
R1: How do influential users interact with others?
R2: What online behaviours do influentials display that distinguishes them from
followers?
R3: What are the online behaviours that inspire their rise to power?
R4: How do influential individuals lose their power status?
R5: Explore online identities of influentials
2.7. Contribution to Knowledge
Evidently, the literature available on online influentials suffers from limitations,
which is preventing research advancement in this area. As such, the contribution of
this research is to examine in-depth, influentials in online communities that are not
fixed in time and utilise a multitude of techniques (qualitative and quantitative) to
explore influential online behaviour. By amalgamating a variety of methods a greater
understanding of the influence process that occurs online can be achieved.
Additionally, by exploring online communities and investigating those
individuals who have the capacity to influence the opinions and attitudes of others

56
through online mediums, this research will highlight the power processes that occur
online. In addition, the second aim of this research is to identify what makes these
individuals influential and subsequently what happens to their social identities when
they are losing their gaining/influence? Finally, this research aims to determine the
social status in online communities with respect to potential influence patterns and
frameworks and explore the online identities of these specific individuals.

57
CHAPTER THREE
METHODOLOGY
3.1. Chapter Overview
This chapter describes the methods used to study influential behaviour in online
communities. The research adopts a mixed methods design consisting of two phases;
the first phase of the research utilised quantitative methods to assess the associations of
various variables on users’ reputation and online status. Secondly, the next empirical
phase comprised a narrative analysis to generate a deeper understanding of the
characteristics of influential behaviour and the discourses that occur online.
However, to accomplish the proposed aims, and increase reader transparency,
an overview of the philosophical and methodological choices made throughout this
research will be highlighted and discussed. As such, the beginning of this chapter will
provide an overview of the philosophical dimensions associated with this research,
whilst the latter part of this chapter will reveal the research outline and design.
3.2. Paradigms of Social Research
Paradigms have been discussed as a “cluster of beliefs” or simply “world
views”. These “world views” guide how the research should be conducted and how
various realities should be researched (Corbetta, 2003; Creswell, 1998; Creswell, Clark,
Guttman, & Hanson, 2003). In other words, a paradigm is an assumption about how
particular issues surrounding the research should be investigated.
There are different styles of research which are linked to the various
philosophical stances, for example, positivism is associated with experimental designs,
whilst interpretivism is often associated with interviews (Crotty, 2003; Henn,
Weinstein, & Foard, 2006). Moreover, the method or way of data collection procedure
is largely predetermined by the epistemological position (discussed later). Therefore,

58
according to Bryman (1989) “society exhibits contrasting paradigms about the nature
of social reality and about what is acceptable knowledge concerning that reality” (p.
248). In this way, the division of qualitative and quantitative research is not merely a
matter of alternative approaches and methods, but rather this is to do with the very
nature of the subject under investigation, thus, researchers cannot use methods outside
of the paradigm that they are working within. See table below for summary.
Table 3.1
Characteristics of the Basic Paradigms of Social Research
Positivist View Interpretive View
Ontology Naïve Realism – Social
world is “real”, one stable
reality
Constructivism – world
built up of multiple
realities
Epistemology Dualism Non-dualism
One truth exists Different people have
different experiences
(many realities)
Methodology
Methods Quantitative Qualitative
Strategy Mostly deductive Mostly inductive
Experimental –
manipulation
Interviews
Analysis by “variables” Analysis by “cases”
Data Measurable data Descriptive, explanatory
text
Note: characteristics of the basic paradigms of social research. Adapted from “Social
Research” by P. Corbetta, 2003, in Social research: Theory, methods and techniques.
London, England: Sage Publications.
3.2.1. Ontology
Ontology refers to the nature of social phenomenon as it is concerned with the
form of social realities (Corbetta, 2003; Denscombe, 2009). Indeed, ontology has
inspired a number of debates; however, central to such debates are two basic positions;
realists and constructivists. Essentially, realists perceive the social world to be an
objective reality, which exists regardless of whether an individual believes in its

59
existence or not. Alternatively, constructivists regard the social world as a creation.
Therefore, individuals create their own social reality through their actions, values and
beliefs (Crotty, 2003; Denscombe, 2009).
The main distinction between the two positions is that the latter perspective
believes in multiple realities; whereas realists believe in one stable reality. In other
words, “the existence of an idea in the mind tells us nothing about the object in reality”
(Corbetta, 2003, p.12). Therefore, ontology is concerned with what an individual
believes is their social reality (Blaikie, 2009). As such, reflection about these issues
helps researchers clarify the theoretical position.
3.2.2. Epistemology
Indeed, claims about what exists ultimately leads to questions about how it
exists, thus, onto epistemological issues (Hughes, 1990). Grix (2004) claims
“epistemology focuses on the knowledge gathering process and is concerned with
developing new models or theories that are better than the competing models (p.27)”.
As such, there are a number of competing epistemological perspectives that coincide
with the various ontological positions. However, the epistemology inherent in the
theoretical perspective for the present research is pragmatism. Pragmatism is not
necessarily dedicated to one single system of philosophy as researchers are free to
choose the methods, techniques and procedures that best fit their research question(s)
(Creswell, 2003; Morgan, 2007; Murphy, 1990). Thus, pragmatism provides a middle
position philosophically which is largely focused on the problem being studied, rather
than methods (Creswell, 1998; 2003).
3.3. Present Research Design
This study used a mixed methods design to capture the best of both quantitative
and qualitative approaches (Creswell, 1998). This is a method for “collecting and

60
analysing both quantitative and qualitative data in a single study” (Creswell, 2003, p.
24), thus, by mixing the data, a better understanding of the phenomena is produced than
relying solely on a single dataset. Mixed methods maximises strengths and minimises
the weaknesses of singular qualitative and quantitative approaches (Creswell et al.,
2003).
The rationale for integrating the two methods is simple, neither qualitative nor
quantitative methods are sufficient to address the purpose of this research. Therefore,
when using a combination, qualitative and quantitative approaches ultimately allow for
a more complete analysis of the status quo that occur online (Greene, 2007). By
adopting this strategy, a more holistic depiction of online identities and virtual
communities can be provided (Creswell, 2003; Creswell et al., 2003; Tashakkori &
Teddlie, 1998), which is currently omitted from the literature.
Traditionally, quantitative research involves an over-reliance by the researcher
on numerical data. Primarily, quantitative approaches are concerned with magnitude
and measurement (Langdridge, 2004). Therefore, this was used for the first phase of
the research to highlight areas for further exploration and determine the influential
individuals for the qualitative investigation. Qualitative research is concerned with the
quality of the phenomena, thus, there is a greater focus on inductive, rather than
deductive research (Creswell, 1998; Langdridge, 2004). In other words, “qualitative
research consists of a set of interpretative, material practices that make the world
visible” (Creswell, 2003, p.42). Therefore, qualitative research, in comparison to
quantitative measurement, is concerned with the meaning or account of some event or
unit from the participants’ perspective (Creswell, 1998; King, Keohane, & Verba, 1999;
Langdridge, 2004; Maxwell, 2005). As this research is analysing both interactions and
communications for influentials in online communities, this approach is more

61
appropriate for the second phase of the research to give further depths to the information
provided from phase one.
When designing the study, a number of issues were considered, these are as
follows; priority, integration and implementation (Creswell et al., 2003). Firstly,
priority refers to which aspect of the study will receive the most emphasis; qualitative
or quantitative methods. Secondly, implementation refers to the order of the phases in
the research; that is, is the data collected sequentially or concurrently? Finally,
integration is the combining of the data. For this research, an exploratory, sequential
design has been utilised as the methods are implemented consecutively (Creswell,
2003).
3.4. Research Outline
This research consisted of two distinct phases. The first phase of the research
used a quantitative approach to examine groups of users and their behaviours in online
communities. This, in turn, informed the qualitative aspect of the research and allowed
a more in-depth analysis examining behaviours through an exploratory method (see
detailed discussion below). Specifically, quantitative approaches have illustrated an
overview of certain behavioural characterstics associated with those who were
influential; whilst qualitative methods facilitated greater inquiry into the language,
identities and interactions with followers. Ultimately, this provides a more holistic
image of online behaviours and adds greater knowledge acquisition. The table below
discusses the research questions and hypotheses in conjunction with the two phases for
this thesis.
Table 3.2
Research Questions/Hypotheses for Research Outline
Phase One:

62
Quantitative Database
H1 – Influential individuals will have a higher number of posts in comparison with their
counterparts (Greer & Jehn, 2009; Huffaker, Tversky, & Ferriman, 2006)
H2 – Influential individuals will have a higher number of threads in comparison with
their counterparts (Greer & Jehn, 2009; Huffaker et al., 2006)
H3 – Influential individuals will have a higher word count (per post) than their
counterparts (Huffaker et al., 2006)
H4 – Influential individuals will have a higher word count (per thread) than their
counterparts (Huffaker et al., 2006)
H5 – Influential individuals will have a higher number of thanks from other community
members than their counterparts (Joinson & Dove, n.d.)
H6 – There will be a relationship between posting frequency and status (Greer & Jehn,
2009)
H7 – There will be a relationship between thread starting frequency and status (Bakshy
et al., 2011)
H8 – There will be a relationship between acknowledgement from others and status
(Cha et al., 2010)
H9 – Influential members of IU will have more connections to other members in
comparison with influential members of LWP (Anger & Kittl, 2011; Bakshy et al.,
2011; Cha et al., 2010)
H10 – Influential members in LWP will have more connections with other influential
members than in IU (Anger & Kittl, 2011; Bakshy et al., 2011; Cha et al., 2010)
Phase Two:
Case Study Research Questions
R1: How do influential users interact with others?
R2: What online behaviours do influentials display that distinguishes them from
followers?
R3: What are the online behaviours that inspire their rise to power?
R4: How do influential individuals lose their power status?
R5: Exploring online identities of influentials

63
3.5 Community Selection
The data consisted of forum posts from two online discussion groups. The sites
in question have been given pseudonyms for the purpose of this research. Virtual
communities were selected using the Google search phrase “vBulletin” and “ideology”
as these search terms produced online communities that included visible reputation
scores for each of the users within these discussion sites. This particular research needs
some verification that the users that are being examined are indeed influential to their
peers; consequently, only communities that used reputation scores and reputation
power were used for the study (see detailed discussion below). Ultimately, this led to
the selection of two online communities one left-wing community (referred to as Left-
Wing Politics; LWP) and one Islamic Community (referred to as Islam United; IU).
The names of these communities have been changed due to ethical reasons and no
identifiable data is given throughout the thesis. In addition, all of the online community
members have been given aliases and the only identifiable data will be the quotes that
are taken directly from each of the forums, to adhere with ethical guidelines regarding
re-identifiable information (BPS, 2018).
The first case study was a far left political discussion forum known as Left-
Wing Politics (LWP). The LWP community is an ideological left-wing forum.
Roughly, this forum has over 10,000 users and over 2 million posts yielded from a 10-
year archive. LWP has 32 sub-forums discussing literature, art and opposing
ideologies. This particular forum has thousands of members from a variety of
progressive tendencies (such as communist, anarchists and Marxist Leninists).
The second online community, Islamic United (IU), is a religious forum,
dedicated to concepts and practices central to the five pillars of Islam. IU has around
900 active users across 25 sub-forums and 500,000 posts from a 7 year achieve. Both

64
online communities are founded on strong ideological beliefs (religion and politics) so
members are enthusiastically involved. This is particularly important as the various
public spaces and online resources means that individuals are free to search and find
forums significant to their beliefs which means that individuals can find public domains
where they are “comfortable” and can consolidate into groups with other like-minded
individuals. With regards to politically endorsed online fora numerous authors have
remarked at the “ideological purity” within these discussion forums and claimed there
is a strong tendency to agree or enforce opinions, rather than challenge them (Davis,
1999; Jansen & Koop, 2005; Sustein, 2001; Wilhelm, 2000). Consequently, the notion
of authority and influentials maintenance is prominent within many of the discussion
threads within the selected online communities as these forums are uniting individuals
with a common goal.
Furthermore, both IU and LWP implement vBulletin Software which provide a
measure of status via reputation rankings (see figure below).
Figure 3.1. Screenshots of user information and reputation scores.
“Reputation” and “reputation power” both indicate a community members’
potential status. Reputation is a way of monitoring the quality of a user’s posts via
reputation rankings (vBulletin, 2019). If the site administrators have enabled this
setting then the reputation icons will be visible to all community members in their posts.
They are there so that at a glance individuals can gauge how much credibility to give
authors of posts. Reputation scores are assigned visible scores, which illustrate
potential influence or popularity (Joinson & Dove, n.d.). They are assigned to each

65
user so peers can rate post positively, negatively or neutral. Essentially, each user’s
ability to affect one-an-others’ reputation is determined by the magnitude of their own
reputation points score known as “reputation power”. That is, if those with a high
“reputation power” rate another member positively, the subsequent members’
reputation ranking will increase. Overall, “reputation power” is the product of; total
number of days in a community, number of posts and the user’s own reputation score.
Alternatively, an individual’s “reputation” is the number of points accumulated
for all of the posts that have received reputation, for example a user might receive 1
reputation bar for every 100 reputation points that are given by other users. To put it
bluntly, “reputation” is the number of points one can give or take away when reputation
is given to a post. Previous research has identified some methods for examining the
development of authority and influence in online communities (Joinson & Dove, n.d.).
Generally, reputation and reputation power appear to be relatively good indicators of
status and influence within a community; however, it must be noted that it is just one
of aspect of the meta-data that was collected from these communities. Those with a
high reputation power scores regularly post comments that are rated highly by other
members and have long-standing membership in an online community.
Based on this visible information, eight users from each of two online
communities were selected for further analysis (16 in total) as they were deemed to be
those with some level of influence within the communities. Accordingly, all the threads
started by these selected individuals were reviewed. A thread is an initial posting with
subsequent responses; a post is a reply to the thread discussion. See figure below.

66
Figure 3.2 Example of treated discussion, replies and self replies. Adapted from
“Finding influential users of online health communities” by K. Zhao, J. Yen, G. Greer,
B. Qui, P. Mitra, & K. Portier (2014), Journal of the American Medical Informatics
Association, 21(e21), e212-e218.
Threads and the thread originators, opposed to individual posts, were chosen for
analysis specifically as these are comments that user’s themselves have initiated rather
than followed which displayed a more coherent timeline. Equally, this is congruent
with existing research as threads “reflect each user’s potential to influence others’
sentiment” (Zhao et al., 2013, p.213). If posts, opposed to threads were chosen for the
analysis, the researcher would not necessarily have seen the context of the conversation
and other posts (from other users) may have been missing. Nonetheless, some posts
were also visually reviewed to ascertain the applicability of the research findings.
3.6 User Selection
Eight users were selected from the discussion forum Left-Wing Politics (LWP)
for the analysis and a further eight from Islamic United (IU). These users were
determined via social network and behavioural marker analysis to have had influential

67
status in the community (at some point) based on the meta-data collected. This meta-
data included the measure of “grounded” reputation via reputation rankings as well as
linguistic, semantic and social network analysis. In other words, the reputation data
collected could also help track the networks between community members. Therefore,
this meta-data helped to identify specific roles within the community based on patterns
of behavior (frequency of posting, thread starting, question asking) and position within
networks, which helped trace roles and status development within the communities.
Accordingly, an algorithm identified those most likely to be an influential in this
ideological forum based on communication skills, activity levels and linguistics style.
Based on the behavioural markers, the algorithm grouped users into one of four
categories; leader, collaborator, contributor or inactive user/reader.
These grouping criteria are based on Preece and Shneiderman’s (2009) reader-
to-leader framework. This framework describes how often people join social media by
first reading, then briefly contributing (asking a question or uploading a photograph).
Then, some users go onto collaborate with other users by making a video or even co-
writing an article together, or some users adopt an authoritative role by helping
newcomers to undergo a similar behavioural pattern and maintain community policies
and norms (Preece & Shneiderman, 2009). See the figure below.

68
Figure 3.3 Reader-to-Leader Framework by J. Preece, & B. Shneiderman (2009), AIS
Transactions on Human-Computer Interaction, 1(1), 13-32.
The above figure is a framework which categorises online community members
based on roles, while this framework discusses potential ‘leaders’, it is used in the
present research to discuss those individuals whom are influential within the online
community. The reader-to-leader framework defines a reader/inactive user as the
typical first step towards more active participation (Kollock, 1999). This is used to
describe someone who is not making a visible contribution but maybe reading forum
content. Alternatively, a contributor is when an individual adds a larger communal
effort; these can be modest steps such as making a correction or even rating a film; thus,
there is no intention of collaborating or forming bond with others (Preece &
Shneiderman, 2009). Specifically, with LWP this was an individual who was a low
volume supporter, meaning they may have only provided a small amount of information
or asked questions when new to the forum. Collaboration involves two or more
contributions, however modest, though there must be a common ground established in
this step. That is, there must be mutual understanding between users to facilitate their
communication (Preece & Shneiderman, 2009). Therefore, these individuals were
deemed to be conversationalists in the online forum.

69
While individual contributions and group collaborations are the most visible in
social media, there still needs to be a way of establishing community norms (Burke &
Kraut, 2008), this is the role of a “leader” (or influential). As such, “leaders” tend to
synthesise communications and discussions to articulate to others and recognise their
respected role in a community (Kim, 2000). Consequently, within online communities
these “leaders” were most likely to be popular participants (classed as influentials for
the purpose of this research). Therefore, eight popular participants were chosen from
each community for the analysis as they had all become “leaders” or reputable
individuals at some point in their forum life-span. However, there was a diverse range
and combination of different reader-to-leader steps. Also, it should be noted that
individuals may also terminate their participation and become inactive for a number of
different reasons which are not represented in the above figure.
3.7 Data Collection for Study One
The data collection for phase one of the analysis consisted of a technique called
“screen scrapping”. In other words, this is a way of conducting large-scale cut-and-
pasting of webpages. Scraping was conducted using the MySQL tool; this is an open-
source relational database management system which large volumes of data can be
sorted and accessed upon certain commands. No scraping behind logins was attempted
only publicly available information was stored. All posts from both LWP and IU online
communities were scraped and subsequently stored using the MySQL. MySQL
database was chosen as it is the world’s second most frequently used open-source
relational database management system (RDBMS). For LWP this generated a dataset
of 1,494,464 posts from 11,778 users dating from July 2001 to November 2011.
Alternatively, for the online community IU the dataset consisted of 485,299 posts from
3,205 users ranging from April 2004 to December 2011. All these posts were stored in

70
MySQL alongside identifiable information such as poster name, posting place, number
of thanks received, those that were re-quoted (and who by), and word count.
3.7.1. Sampling
The sample technique was derived from the previous literature on identifying
influentials from Joinson and Dove (n.d.). Though, some modifications were made, for
the purpose of phase one, 4-status groups were created in the database as only
individuals that were at some point in time deemed influential were of interest for this
aspect of the research. These individuals were chosen from the database as this was the
best way to gauge reputation, as the information in the database was only a “snapshot”
at the current time of scraping. In other words, reputation cannot be traced or tracked
in the database and only reputation at the time of collecting the posts was stored and
cannot be a reliable estimate with regards to social roles and transitions. The following
query was used to identify those from the database that were always influential/popular
throughout the two year cluster analysis;
SELECT * FROM roles_timeliced. rl_roles_timesliced
WHERE
24_18_cluster = 'Cluster 0' AND 18_12_cluster = 'Cluster 0'
AND 12_6_cluster = 'Cluster 0' AND 6_0_cluster = 'Cluster 0'
Figure 3.4. The Query Used to Determine Users from MySQL Database
Therefore, those individuals that had always been influential over a two-year
cluster analysis were included in the sample. Equally, influential individuals who
became inactive or left the community were included, influentials who gradually lost
their status and went to a lesser role were included as well as those individuals who
gradually gained status (went from collaborator/contributor to popular) within the
community were included to compare online behaviour in conjuncture with the

71
hypotheses. The following query was used to update a column and create a group
identifier;
UPDATE rev_left.all_revleft3
SET `status` = 1
WHERE
poster like '%blackmagi%'
Figure 3.5. The Query Used to Create Table from MySQL Database
This query enabled MySQL to select specific poster identifiers and give them a status
number (status 1, 2, 3 or 4), which was dependent upon their social role.
Table 3.3
Showing the groups used in Phase Two from LWP and IU
Status Group Group IU
N
LWP
N
1 Always
Influential/Popular
12 43
2 Influential – Demoted 10 29
3 Influential – Inactive 5 19
4 Promoted to Influential 9 17
3.7.2. Selection Criteria
With regards to those that were promoted to influential status and those that
were demoted there was strict criteria in the database for the selection process. Only
3 Coding scheme used to general database information

72
individual users that had been influential for a year out of the two-year cluster analysis
were included in the in the demoted category (group 3). Similarly, only those that had
been influential for the last 12 months of the cluster analysis were able to be included
in the promoted category. Therefore, the status groups were clearly defined to allow
comparisons on posting/thread behaviour, number of thanks and word count.
3.7.3. Analysis
Analysis of the relationship between the IV (status) and the dependent variables
(seniority [total number of posts], post word count, reputation, and number of thanks,
average number of thanks, thread total and thread word count) were analysed using a
MANOVA. A MANOVA was conducted opposed to a series of univariate analysis of
variance (or ANOVA) to reduce the likelihood of making a Type I error (rejecting null
hypothesis when it is true). As there were multiple hypotheses in the present
investigation the chance of making such an error was significantly increased; thus,
validating the choice of multivariate analysis of variance, opposed to ANOVA.
Equally, this analysis takes into account the possibility of intercorrelations amongst the
various dependent variables (Langdridge, 2005).
In addition, social network analysis (SNA) was conducted to assess socially
meaningful relationships. In that, an analyst of social networks is able to examine the
ties of individuals to other members within a network and assess how individuals are
positioned/centralised in overall network patterns (Prell, Hubacek, & Reed, 2009).
SNA is the mapping of relationships or informal connections between individuals
within groups or organisation (Ehrlich & Carboni, 2005). In order to understand a
particular individual or network SNA examines the location of a node; by locating or
measuring a particular node, one must assess its centrality. In other words, is this
particular node in the core of a network or in the periphery? And how well connected

73
is that node to reach others in a particular organisation? The graphs below used the
following graph metrics; betweenness centrality, eigenvector centrality (closely related
to degree centrality) and closeness centrality to create visual network graphs to reveal
centrality. However, as eigenvector and closeness centrality are considerably smaller
than betweenness centrality in size smaller and therefore do not show dramatic
differences, they were not reported in the tables below.
The graphs are built up of nodes and edges that connect them. Each circle is a
VC user and the connection is a tie or social relationship. Thus, that illustrates an
exchange in communication. The more central an individual is within a network, the
more access individuals have to other constituents. Equally, if an individual is
connected to a popular neighbour, then that specific relationship or edge would produce
a high level of potential influence of diffusion. See diagram below for basic principles
of social network graphs.
Figure 3.6. Diagram showing the various nodes and edges in a social network analysis.

74
Consequently, social network graphs are based on the cluster analysis, which
was time-sliced and divided into four (24-18 months, 18-12 months, 12-6, months and
6-0 months) from the two-year period. These diagrams are used to illustrate the change
in social structure from influential statuses to other social roles and clearly portray
social ties and connections with LWP and IU (See Appendix 4).
3.8 Data Collection for Study Two
3.8.1.Design
The second phase of the research adopted qualitative methods to investigate the
social processes that occur online. In phase two narrative analysis was used to explore
this lived phenomenon in the naturalistic context in which it occurred. A wide range
of disciplines find narrative analysis and story-telling processes useful in explaining a
variety of social and psychosocial processes (Mankowski & Pappaport, 2000).
Researchers of online communities have favoured this qualitative approach as
narratives themselves appear to serve a variety of functions in spiritually based
communities (such as membership and identity development; Kozinets, de Valck,
Wojnicki, & Willner, 2010). Accordingly, research on narratives may be useful in
examining individual level experiences, community building, communal norms and
social processes.
Van De Mieroop (2015) states that are social groups are fluid and inherently
evolve over time; therefore, language occupies a central role in creating identities.
Furthermore, “identity is thus viewed as a discursive accomplishment and a product of
social interaction” (Van De Mieroop, 2015, p.410). Accordingly, narrative analysis of
individual’s social groups or categories, best embodies the fluidity and changes over
time as individuals can shift in and out of social groups which can be best examined
through narratives of collective identities (Holmes, 2006; Labov, 2006; Smith &

75
Sparkes, 2008). Additionally, narrative analysis can focus on which memberships are
made relevant by the individuals in the investigation and how their membership serves
a specific function to their social identity (Holmes, 2006).
Furthermore, this can allow the researcher to follow and document clearly
participants “down their trails” (Riessman, 2008, p.24). Therefore, two online
communities were selected as cases for “an in-depth, intensive and sharply focused
exploration” of behaviour (Willig, 2010, p. 74).
3.8.2. Sample
Influentials were identified from the dataset based on their reputation and
reputation power scores. Those that were deemed to be influentials had a reputation
and reputation power score within the top 10% of all the users in the entire community.
In LWP the top 10% of users resulted in a sample of 353 leaders, eight of which were
used for the analysis. In the IU community, those ranking in the top 10% produced a
sample of 245 leaders, which were extracted for qualitative analysis. These users were
of interest in the research (see below for detailed description of individual user
selection).
3.8.2.1. Four Users that Rose to Popular Status in LWP:
The first user “Black Magician” first joined LWP in July 2005. On average,
this user posts twice daily. “Black Magician” has a total of 6,289 posts and 121 threads
started. This community member has been thanked over 8,000 times by different forum
members. Based on the computational linguistics, it is likely that “Black Magician”
has had long-term status within this discussion site and has been an avid member of the
forum based on an observation of online behaviour. This users’ last activity was on in
May 2013. Therefore, was still active within the community at the time of data
collection.

76
Second, “Guy Fawkes” first joined this discussion site in March 2006. This
user has 2,869 total posts and 203 threads started. On average this user posts once per
day. “Guy Fawkes” has been thanked over 2,000 times and was last active in the forum
in September 2013, thus was still engaged in the community at the time of data
collection. On a behaviour note, this user has hidden his reputation score from others.
The algorithm categorised this user as initially a contributor, then collaborator and
finally an influential. As such, this user has engaged in a variety of reader-to-leader
steps (Preece & Shneiderman, 2009).
Third, “Community Member” has a total of 1,000 posts and only 7 threads; on
average, this user posts less than one post per day but has been thanked by other
members over 800 times. “Community Member” joined LWP in June 2009 and was
last active in the community in June 2012. Therefore, it is likely that this user is now
inactive. Based on the computational techniques over a two year period this user has
gone from contributor to collaborator, back to contributor and finally a “leader”.
Finally, “Guerrilla Warfare” first joined the community in June 2004 and has a
total of 3,668 posts and 189 threads. On average, “Guerrilla Warfare” posts once daily
and has been thanked over 700 times by other forum members. Based on the
information received via computational linguistics, this member went from “leader” to
inactive. Their last activity was in September 2010. This member has been banned
from the forum. All of the four users are presumed male based on the information and
content of their posts and are referred to as male by other users.
3.8.2.2. Four Users that Rose to Popular Status in IU:
The first user “Gag Order” joined the forum in August 2004. This community
member has received 82 likes from others. Moreover, Gag Order has been thanked
1,825 times in 869 posts but has not been active in the community since August 2011.

77
Gag Order has a total of 5,289 posts and 44 threads started. Based on the cluster
analysis, Gag Order joined the forum and became a collaborator then moved to “leader”
or popular participant status. There is no mention of the gender of this users’ profile
but based on the posts and correspondence between various other IU members, it is
presumed Gag Order is male due to the frequent reference “brother” from other
members.
Secondly, “Intoodeep” joined IU in June 2006 and still remains active at the
time of data collection. Intoodeep has only given one like but has received ten.
Additionally, this user has been thanked 299 in 135 posts. Overall, Intoodeep has 1,749
posts and 54 threads. Based on the analysis, Intoodeep jumped from contributor to
“leader” status throughout his time in the community. While there is no mention of
gender, this user is also presumed male based on correspondence with other IU
members. “Intoodeep” is classified as a “Senior Member”.
Third, “Pluma” joined in October 2008 and was still involved in the community
at the time of data collection. Pluma has received ten likes and has been thanked 559
in 302 posts. Overall, Pluma has posted 2,977 times and has initiated only 22 threads
(though has received many replies from others). Pluma (like Gag Order) moved from
collaborator to popular status throughout his time in the community. While there is no
mention of gender, other members frequently refer to Pluma as “brother”; thus, it is
presumed Pluma is male.
Fourth, Al-Omari joined in June 2004 and last contributed to the community a
week ago (1/1/2014). Therefore, this member was still active at the time of data
collection. Al-Omari has received 15 likes, 1,942 posts and 49 threads started (with a
large amount of replies). Al-Omari speaks Arabic and is categorised as a “Senior
Member”. Overall, Al-Omari has been thanked 556 times in 319 posts. Al-Omari was

78
a contributor for a large amount of time, until recently when he became a ‘leader’. Once
again, there is no mention of gender, but is referred to as “brother” by other members’.
3.8.2.3. Four Users that Lost Status in LWP
Following on from the above section, four users were selected from LWP
forum. However, opposed to examining individuals that became influential this aspect
selected individuals that the previous analysis has identified that they transitioned role
from influential status to a lesser role within the community. As such, four users that
lost status were as follows:
“Brothering” first joined LWP in January 2008. This user has a total of 1,483
posts and 166 threads started. This LWP community member has been thanked over
300 times by different members and was last active 2 years ago. Based on the
information Brothering has provided it states gender as both Male and Female.
However, based on the username selected it is presumed that Brothering is male.
Brothering went from contributor, to “leader” and then to a collaborator.
“Kay” joined the forum in October 2008 and is still an active member of the
community. Overall, Kay has over 2,000 posts and has started over 140 threads. This
user has been thanked 2,453 times and has stated his gender as male. This online
member moved roles contiguously from “leader” to collaborator then back to “leader”
and down a role transition to collaborator once again.
“Skinhead” has a total of 1,610 post but 61 threads and has only been thanked
694 times by other LWP members. While there is no mention of gender in this user’s
profile, he is presumed male on inspection of his threads and posts. This user joined
the forum in June 2005 and was last active in October 2013. This online member went
from collaborator, to contributor, to “leader”, then collaborator.

79
Finally, “Comrade Believer” first joined the forum in May 2008 and was last
active in October 2013. This user has over 1,000 posts and has started 186 threads but
has only been thanked by other users 209 times. This user has claimed to be male in
his posts and threads. This online community member was a contributor for a long
period of time then progressed to “leader”.
3.8.2.4. Four Users that Lost Status in IU:
The first user “Umar247” first joined Islamic United in February 2008. This
user has received a total of ten likes from other members within the online community.
Overall, “Umar247” has a total of 1,407 posts and has started 143 threads. This user
has also been thanked 233 times in 100 posts/threads from other community users (but
given none) and was still an active member of the community at the time of data
collection. Based on the computer linguistics, “Umar247” entered the community and
became an influential member or “leader” relatively quickly. His activity level then
declined and he was categorised as a contributor but then rose up through the ranks
again and became a collaborator. This user has stated their gender as male in his profile.
Second, “Free the Oppressed” first joined IU in December 2009. This user is
presumed female through her interactions with others. She has 935 posts throughout
her time in the online community and a total of 111 threads started. She has been
thanked 15 times in 10 posts but not given any likes to other members. On average,
she posts once per day and is currently categorised as a “Senior Member” and was still
active within the community at the time of data collection. Based on the statistics,
“Free the Oppressed” became a “leader”, and then subsequently went inactive. Her last
post was in October 2010.
Community member “Iqra” first joined the community in November 2006. Iqra
is also presumed female due to her various encounters with other members where she

80
is referred to as “sister”. On average, she posts less than once per day but has a total of
508 posts and 57 threads. She has been thanked 3 times in 3 posts. Computer analyses
categorise her as a contributor, then a “leader”, then inactive. She has been inactive
within the community since March 2010.
Finally, “Weshallnotkeepsilent” first joined IU in March 2010 but is still
categorised as an “Active Senior Member.” This member’s last post was in October
2013. It is presumed due to behavioural characteristics and interactions that
“Weshallnotkeepsilent” is male. This member has a total of 914 posts and has started
52 threads, on average he posts approximately once per day and has been thanked 263
times in 168 posts by other IU online community members. It is presumed based on
the computational analysis that Weshallnotkeepsilent was a “leader”, then slowly
became a collaborator.
3.8.3. Analysis
The analysis was conducted through narrative analysis. This method uses
documents or interviews to follow participants’ trails (Riessman, 2008). This analytic
procedure refers to a large number of approaches to various different types of text
(Riessman, 2008). Narrative analysis seeks to put together the ‘big picture’ about
experiences or events as participants understand them. Equally, this process aims to
understand both the sequence and the consequence of occurrences. Narrative analysis
focuses on the story itself and attempts to preserve the integrity of particular events as
they happen by displaying the goals and intentions of human actors (Richardson, 1995;
Riessman, 2008). Indeed, this method is “based on the belief that we interpret and
construct the world around us through interactive talk” (p. 90, Wiles, Rosenberg, &
Kearns, 2005).

81
There are a variety of different approaches that fall under the term ‘narrative
analysis.’ Some of these approaches can be stringent in the way in which data is
organised and some favour more interpretative strategies employed by researchers
(Wiles et al., 2005). However, this research incorporated a thematic analytic procedure
to narrative analysis in that there was a clear framework to devise and recognise patterns
within the entire data set (Braun & Clarke, 2006). Therefore, this research employed
Reissmans’ (2008) methodological approach to narrative analysis.
Riessman (2008) claims that there are four different methodological approaches
to narrative analysis (see table below). Thematic analysis was the appropriate analytic
strategy for this thesis.
Table 3.4
Showing the four different approaches to narrative analysis.
Model of Narrative Analysis Rationale of Process
Thematic Analysis Emphasis on what is told, and the content
rather than specifically how it is told.
Structural Analysis Language plays a stronger role in this
approach. Focus on how language is
used to tell the story.
Interactional Analysis Stories of personal experience are
organized around the teller. Also
emphasis is placed on the teller and
listener and the dialogic process.

82
Performative Analysis Storytelling is seen as a performance and
goes beyond the spoken word.
Note: Different models of narrative analysis. Adapted from “Narrative
Methods” by C., K. Riessman, 2008, “Narrative Methods for the Human Science.”
Thousand Oaks, CA: Sage.
Each of the various approaches in the table above implies a different attitude
towards the data. This, in turn, reflects upon the epistemological assumptions entwined
in the data collection phase and ultimately impacts upon the role that the transcripts
play in the research. For this research, a thematic approach to narrative analysis was
adopted as it focuses on the content of the narratives as well as how the narrative is
written. This approach is often found in health journals as a way of analysing large
amounts of text from online discussion boards (Kannaley, Mehta, Yelton, & Friedman,
2019).
As such, the main emphasis is on what was said by individual community
members, rather than how it was said (Riessman, 2008). While language is not the sole
feature of the investigation, it is still an integral feature (or resource) of the analysis. In
further justification to the thematic narrative analysis, it is also particularly useful for
finding and grouping themes across a number of cases (Riessman, 2008). (Birch, 2011)
The coding for narrative analysis involves coding the narrative as a whole,
rather than selecting specific aspects and grouping them into general patterns.
Riessman’s (2008) thematic approach to narrative analysis relies on categorising
accounts or aspects of an account told by an individual. This approach to the data
aided the researcher in moving from simply reading the data set to discovering
emergent patterns in the data. Braun and Clarke (2006) claim there is a lot of overlap
between thematic analysis and narrative analysis as they “share a search for patterns
and themes across and (entire) data set” (p. 8).

83
As there is no standardised method for assessing broad patterns emerging in
data, a thematic framework was incorporated into the process. This method provided
“a flexible and useful research tool, which can potentially provide a rich, detailed, yet
complex account of data” (Braun & Clarke, 2006, p.78). Generating themes from data
is a common analytic method in qualitative research methods. As such, thematic
analysis is the interpretative process where the data is systematically searched for
reoccurring patterns to provide a detailed description of the phenomena under
investigation (Tesch, 1990).
This process involved reading the entire data set repeatedly and noting down
any initial ideas. These ideas are then coded based on interesting features of the data
for potential themes. The entire data set was then searched for repeated patterns of
meaning or themes. Once the reoccurring themes were established they were grouped
together, allocated clear definitions and divided into various subthemes accordingly
(Braun & Clarke, 2006).
As such, there were 1,072 threads in the corpus for LWP forum and a further
532 threads from IU for the 16 online community members (with relevant replies from
users). Braun and Clarke’s (2006) framework was utilised in this process.
Accordingly, the data corpus was reviewed and any noteworthy or interesting features
were then taken from the data set. Overall, the data corpus was searched and any
interesting aspect relating to social identities in line with the theoretical framework
(Tajfel & Turner, 1979). As such, any interesting aspect of online identities or group
categorisation was noted.
Subsequently, in line with Braun and Clarke’s (2006) framework for thematic
analysis, a content analysis (tally chart) illustrates the most prominent themes and
subthemes. This content analysis procedure was undertaken to determine the most

84
prominent themes/subthemes from each of the community member and these were the
discussed themes in the analysis. This process adapted from the work of Macià and
Garcia (2016) and their procedure for focusing large data in online community research
and generating themes. Equally, due to the large scale nature of the data corpus this
was the most logical way to assure that the most prominent themes and subthemes were
extracted for the final themes for the analysis.
Whilst this does seem an usual method for qualitative enquiry, Gbrich (2007)
does claim that it is indeed possible for qualitative analysis whilst quantifying the data
(though this seems like a juxtaposition). Moreover, content analysis in this example is
utilised as a method for clarifying the data via quantitative counts of the codes and is
merely one of the steps taken in the thematic analysis (Downe-Wamboldt, 1992;
Morgan, 1993).
3.8.4.Triangulation
To demonstrate qualitative rigor various strategies were incorporated into the
research design. One way to establish credibility throughout the research was to
incorporate methods triangulation (Patton, 1999). As such, prolonged exposure to the
various online communities ensured that the researcher is interpreting the textual
information correctly. Equally, having observed interactions with other users, it
allowed for a more detailed analysis and greater understanding of the topic being
discussed as the researcher gained a better understanding of the conversation style of
each user and their friendship-ties with other forum members. This essentially helped
understand the context of forum posts.
Dependability was established via a clear audit trial. Therefore, adopting
systematic steps in the analytic process enhanced the trustworthiness of the data.
Ultimately, this permits external checks and validations through the documentation of

85
the analysis procedure (Drissen, van der Vleuten, Schuwirth, van Tarwijk, & Vermunt,
2008). Finally, a reflexive account was also incorporated to facilitate any preconceived
ideas the researcher may have previously held before the analysis any issues that the
researcher may have overcame.
3.9 Ethical Considerations
With regards to ethical considerations, firstly, the necessary procedural ethical
clearance was granted from the University (See Appendix 1). In addition to the latter
point, all identifiable information was removed from the data and only quotations were
included in the analysis to support analytical claims (Coolican, 2009; Roberts, 2015).
Utilising online communities as a way of collecting qualitative data creates unique
ethical challenges; such as the ‘traceability’ of quotes (Beaulieu & Estalella, 2012).
To tackle such issues, quotations were anonymised and in some cases, paraphrased to
avoid further trace.4
Online community members were given pseudonyms to conceal their online
community identities (usernames) and to provide confidentiality (Roberts, 2015).
Equally, in line with research strategies to improve ethical research, the online
communities themselves were also given pseudonyms and website addresses have not
been disclosed (Malik & Coulson, 2013). Therefore, only the researcher knew the
identities of the online community members that were included in this research
(Lahman et al., 2015).
A further ethical complication around the use of internet data, specifically
online communities is the acceptability of covert research. As such, there is much
4 it should be noted that these online communities have since been closed down due
to some of their ideologies and are not traceable via search engines

86
debate around whether researchers should identify themselves as researchers and
whether this is classified as deception (Reir, 2007; Roberts, 2015). In the case of this
research, covert, passive research was conducted (Reir, 2007). In other words, the
researcher did not identify as a researcher whilst observing the online community (and
creating a username to do so) and the researcher did not make any contributions such
as posts or threads during their time in the community. Therefore, this passive approach
“did not intrude on participants or group discussions” nor deceived other online
community members about their intentions or identity (Roberts, 2015, p.12).
Whilst the internet does undoubtedly provide a way to collect data from diverse
participants and explore new social phenomenon, it is not without ethical challenges
(Kraut, Olson, Banaji, Bruckman, Cohen, & Couper, 2004; Roberts, 2015). Another
issue surrounding the ethics of online community research is the notion of informed
consent. It is generally accepted that research should obtain the consent of participants;
however, passive data collection methods promote a difficulty in seeking and acquiring
such consent from participants. As such, this online community setting was
acknowledged by members as being a ‘public domain’ no further permissions were
sought as this is seen as public data; thus, no consent is needed (Honey & Herring,
2009; Kitchin, 2003; Roberts, 2015; Sigura, Wiles, & Pope, 2017).

87
CHAPTER FOUR
STUDY ONE: QUANTITATIVE ANALYSIS OF ROLE TRANSITIONS IN
ONLINE COMMUNITY
4.1. Overview of Chapter
The following chapter illustrates the individual data and online beahvioural
patterns for a number of online community users. Overall, this involved a detailed
display of posting and thread starting behaviour and this was found to be a reoccuring
pattern of behaviour as previous research posited these characteristics were significant
factors of influential individuals. However, number of thanks was not included in this
section as there was no data before 2009, indicating this was a relatively recent feature
added to the communities. Social network analysis (SNA) demonstrated popularity and
centrality within the online community and social role transitions based on the cluster
analysis in the table below which were referred to throughout the previous chapter.
As well as detailed examination of 16 users that exhibit strong role transition,
this sections also examined all those that rose to status (and lost status) for both VCs
LWP and IU. More specifically, this involved seperating all those that rose to status
(at some point in between 2009-2011) and categorising them into four groups.
Subsequently, detailed statistics examining the four categorised groups were analysed
to investigate the hypotheses. Finally, this chapter examined potential differences
between the two communities to ensure that levels of influence were similar between
IU and LWP.
4.3. Left Wing Politics Analysis

88
This section will portray behaviour characteristics for each of the eight users
discussed in phase one for LWP.
Table 4.1.
Showing role transitions for eight users of LWP over a 24-month period
Months
LWP Member 24 – 18 18 - 12 12 - 6 6 – 0
Members that Gained Reputation (Part One)
Black Magician Leader Leader Leader Leader
Guy Fawkes Contributor Collaborator Leader Leader
Community
Member
Contributor Collaborator Contributor Leader
Guerrilla Warfare Leader Collaborator Inactive Inactive
Members that Lost Reputation (Part Two)
Kay Leader Collaborator Leader Collaborator
ComradeBeliever Leader Contributor Contributor Contributor
Skinhead Collaborator Contributor Leader Collaborator
Brothering Contributor Contributor Leader Collaborator
4.4 Summary of LWP members and Hypothesis Development
As illustrated in the charts in the appendices, when individual members are
gaining status (or indeed holding status), there is an increase in posting, thread starting
behaviour and word count which appears to correspond with the cluster analysis in the
table at the beginning of the chapter. Conversely, when members are losing their status,
there is a decrease in activity. Whist this does not state a cause and effect, it does

89
illustrate that there are certain online behaviours which parallel perceived status. Many
of the charts for individuals who gain status show a gradual increase (with the
occasional exception) and many of the charts in the losing status part of this chapter do
illustrate a slope or decline in thread starting and posting behaviours. Consequently,
this appears to add some theoretical implications for the hypotheses, in that, posting
and thread-starting behaviour (in particular) do appear to be associated with influential
status. The table below lists the hypotheses relevant to this chapter.
4. 2. Summary of Hypotheses:
Table 4.2
Hypotheses for Phase One
Phase One:
SQL
H1 – Influential individuals will have a higher number of posts in comparison with
their counterparts
H2 – Influential individuals will have a higher number of threads in comparison with
their counterparts
H3 – Influential individuals will have a higher word count (per post) than their
counterparts
H4 – Influential individuals will have a higher word count (per thread) than their
counterparts
H5 – Influential individuals will have a higher number of thanks from other
community members than their counterparts
H6 – There will be a relationship between posting frequency and status
H7 – There will be a relationship between thread starting frequency and status

90
H8 – There will be a relationship between acknowledgement from others and status
H9 – Influential members of IU will have more connections to other members in
comparison with influential members of LWP
H10 – Influential members in LWP will have more connections with other influential
members than in IU.
4.5. SNA for Online Community Members
Overall, it is evident from the social network graphs in appendices that online
community members tended to demonstrate far more centrality within the network
when they were holding an influential status within the online community. While some
individuals were far more central than others, all of the diagrams in the appendices
show a high level of centrality when users were categorised as having an influential
status within the community. Equally, when individuals were categorised as
influential/popular they tended to have more ties to nodes and edges within the social
structure, compared to other social roles.
In relation to the hypotheses, influential individuals tended to have more edges
with others who were also placed relatively central within the social structure. These
individuals are also likely to have increased influence and betweenness; thus,
demonstrating a high level of social capital. In many of the graphs (See Appendix 4),
users tended to have a higher number of short edges when they were occupying
influential status within the two online communities. These short ties represent
betweenness centrality and high social status. PageRank also appears to increase with
status, suggesting that they form more ties with other influential individuals when
gaining high-ranking status.

91
4.6 Global LWP Descriptive and Inferential Statistics
This section examines all of the individuals that gained and lost status within
LWP over a two-year period. In expanding from the previous eight users, this section
includes N = 108 LWP online community members, which have been influential at
some point within the cluster analysis and relates to the following hypotheses:
H1 – Influential individuals will have a higher number of posts in comparison with
their counterparts
H2 – Influential individuals will have a higher number of threads in comparison
with their counterparts
H3 – Influential individuals will have a higher word count (per post) than their
counterparts
H4 – Influential individuals will have a higher word count (per thread) than their
counterparts
H5 – Influential individuals will have a higher number of thanks from other
community members than their counterparts
The independent variable in the present investigation is the group status that has
four levels (see table below). Group status is a means of assessing reputation over time;
therefore, the levels are as follows; always influential, influential then demoted to
another role, influential then inactive and promoted from a lesser role to influential.
Equally, there are a number of dependent variables which are as follows; reputation,
post total, post word count, thread total, thread word count, average word count per
posts, average word count per thread, number of thanks and average number of thanks.
As previously mentioned, reputation is not a reliable indicator of status as this was taken

92
as a snapshot when the community was meta-scraped; however, this is still included as
a dependent variable in the following section to further verify and support the different
status groups as a way of assessing social capital. As such, those who have always been
influential should have a higher reputation score than the other groups.
Table 4.3.
Group Properties for the Independent Variable Status
Group Identifier Number Status Group No. of participants (n)
1 Always Influential 43
2 Influential to Another
Role
29
3 Influential to Inactive 19
4 Promoted to Influential 17
Descriptive Statistics
Table 4.4.
Group Status Mean and Standard Deviation Scores for Dependent Variable
Reputation
Group Identifier
Number
Mean SD
1 3705.33 2369.196
2 1032.72 831.390
3 767.58 2714.287
4 527.94 530.666
Table 4.5

93
Group Status Mean and Standard Deviation Scores for Dependent Variable Post
Total and Post Word Count
Post Total Post Word Count
Group Identifier
Number
Mean SD Mean SD
1 4077.40 2400.971 249215.93 222554.996
2 2088.24 2656.973 105.9650 93926.351
3 3800.58 5530.725 134.2905 366635.303
4 3800.58 2596.211 97.3186 130105.482
Table 4.6.
Group Status Mean and Standard Deviation Scores for Dependent Variables Thread
Total and Thread Word Count
Thread Total Thread Word Count
Group Identifier
Number
Mean SD Mean SD
1 60.79 66.206 12369.81 13413.554
2 24.90 27.817 5714.55 8145.960
3 49.63 60.390 14464,89 22003.684
4 26.94 36.450 6407.06 7920.250
Table 4.7.
Group Status Mean and Standard Deviation Scores for Dependent Variables Average
Thread Word Count and Average Post Word Count
Average Thread Word Count Average Post Word Count

94
Group Identifier
Number
Mean SD Mean SD
1 252.1730 269.97332 62.6250 42.98549
2 345.5033 854.85891 55.4558 35.84885
3 277.4852 236.35806 51.5646 28.10025
4 313.9647 522.35140 55.6137 54.84119
Table 4.8.
Group Status Mean and Standard Deviation Scores for Dependent Variable Number
of Thanks Received and Average Number of Thanks
Number of Thanks Average Number of Thanks
Group Status
Number
Mean SD Mean SD
1 1468.56 1148.123 3.9824 3.44720
2 324.10 285.366 10.1248 18.33318
3 468.89 531.710 22.3714 44.01906
4 440.35 310.930 11.2603 23.30610
Note. All missing values (-1) were excluded from number of thanks.
4.6.1. Inferential Statistics
4.6.1.1. Method of Analysis
Analysis of the relationship between the IV (status) and the dependent variables
(seniority [total number of posts], post word count, reputation, and number of thanks,
average number of thanks, thread total and thread word count) were analysed using a
MANOVA. With regards to the various assumptions that need to be met, Box’s M was

95
executed to determine the equality of variance covariance as well as Levene’s test for
homogeneity to assess equality of variance. In this case both the Box’s M result
(p<0.001) and Levene’s test were found to be statistically significant (p<0.05) for all
dependent variables apart from average word count (for both threads and posts).
Consequently, the assumption of equality amongst the various groups had been
violated. Despite ANOVA being relatively robust, non-parametric tests (Kruskal-
Wallis) were used to confirm the effects of the MANOVA, all apart from average word
count for posts and average word count for threads were significant at the p<0.05 level
(and seniority, word count for posts, reputation, average number of thanks and number
of thanks were found to be significant at the p<0.001 level). In every instance Kruskal-
Wallis confirmed the findings from the MANOVA. For the post-hoc comparisons
Games-Howell was used due to the uncertainty regarding equal population variance;
thus equal variance could not be assumed.
4.6.1.2. Multivariate Effects
A one-way MANOVA revealed a significant multivariate main effect for status,
F (27, 278) = 3.366, p <. 0001; Wilks’ λ = .438, partial η2= .241. Power to detect the
effect was 1.00. The MANOVA also found a significant intercept, F(9, 95)=51.621,
p< .001; Wilks’ λ = .170, partial η2= .830. Therefore, this demonstrates that there is a
difference in the means for status groups with regards to the various variables,
illustrating a different pattern of behavior for each of the four groups in the IV.
Significant univariate effects were found for all of the dependent variables
(apart from average word count per post and average word count per thread) at the
p<0.05 level or above. Seniority, F (3, 103) = 5.343, p<0.05, η2 = .075, power = .658;
Word Count for Posts F (3, 103) = 3.606, p<0.05, η2 = .095, power = .780; Reputation
F (3, 103) = 18.910, p<0.001, η2 = .355, power = 1.00; and Number of Thanks, F(3,

96
103) = 15.913, p<0.001, η2 =.317, power =1.00; Thread Total F(3, 103) =3.296, p<0.05,
η2 =.088, power = .738; Thread Word Count F(3, 103) = 2.722, p<0.05, η2 =.073, power
= .646; Average Number of Thanks, F (3, 103) = 2.913, p<0.05, η2 = .078, power = .679.
Pairwise Comparisons for Seniority
Significant status pairwise differences were obtained in the dependent variable
Seniority between Always PP and PP Demoted. The mean number for group seniority
were 4077.40 for Always PP, 2088.48 for PP Demoted.
Pairwise Comparisons for Post Word Count
Significant status pairwise differences were found for the dependent variable
Post Word Count between Always PP and both PP Demoted and Promoted PP. The
means for this dependent variable were as follows; 249215.93 for Always PP, 96116.79
for PP Demoted and 91324.94 for Promoted PP.
Pairwise Comparisons for Reputation
Significant pairwise comparisons were found for the dependent variable
Reputation for Always PP and PP demoted, PP Inactive and Promoted PP. The means
for these groups were as follows; 3705.33 for Always PP, 1032.72 for PP Demoted,
767.58 for PP Inactive and 1970.71 for Promoted PP.
Pairwise Comparison for Number of Thanks
For the dependent variable Number of Thanks significant comparisons were
found between Always PP and the other levels. The means were as follows; 1468.56
for Always PP, 324.10 for PP Demoted, 468.89 for PP Inactive and 440.35 for
Promoted PP.
Pairwise Comparison for Thread Word Count

97
One significant pairwise comparison was found for Thread Count. This
difference was found to be significant for Always PP and PP Demoted. The mean for
Always PP was 60.79 and 24.90 for PP Demoted.
4.6.1.3. Conclusion
The previous section quantitatively analysed all those that rose to status between
2009-2011. This related to the following hypotheses;
H1 – Influential individuals will have a higher number of posts in comparison with
their counterparts
H2 – Influential individuals will have a higher number of threads in comparison
with their counterparts
H3 – Influential individuals will have a higher word count (per post) than their
counterparts
H4 – Influential individuals will have a higher word count (per thread) than their
counterparts
H5 – Influential individuals will have a higher number of thanks from other
community members than their counterparts
Overall, the analyses confirmed a number of hypotheses, the MANOVA confirmed that
there was a difference in the total number of posts, total number of threads, reputation,
word count for threads, number of thanks and average number of thanks between the
status groups. Therefore, H1 that influential individuals would have a higher number
of posts in comparison with their counterparts was supported by the differences found
between the means in the four status groups. Moreover, the post-hoc analysis further
elucidated these differences and revealed that influential individuals had a higher mean
difference in comparison with their counterparts, further supporting this hypothesis.

98
With regards to H2 that influential individuals would have a higher number of
threads started in comparison with their counterparts was also supported by the
differences found from the MANOVA. Equally, the post hoc analysis found a
significant difference between influential individuals and all other comparison groups
thus affirming this hypothesis.
However, H3 suggested that influential individuals would have a higher word
count (per post) than their counterparts was only partially supported by the results.
There was no significant difference found for status groups and average word count per
posts (p>0.05). However, total post word count was significantly different. Therefore,
this hypothesis cannot be confirmed as these users do not necessarily have a constantly
higher word count in their posts, but overall they have a higher total word count.
Similarly, H4 that influential individuals would have a higher word count (per
thread) than their counterparts was only partially confirmed from the findings as the
MANOVA. Word count (per thread) or average word count was not significantly
different for the four different groups illustrating that influential individuals did not
have a higher word count in the threads that they started in comparison to the three
other groups. Nonetheless, the total number of words they had throughout all their
threads was significantly higher than their counterparts. Therefore, H4 can only be
partially supported and not accepted, as their thread starting behaviour does not
consistently portray a higher level of words.
H5 suggested that influential individuals would have a higher number of thanks
in comparison to their counterparts. This hypothesis was supported from the
MANOVA and the post hoc analysis. Supporting the notion that those that are
influential within VCs receive more acknowledgement and thanks from others in
comparison with those that are not influential.

99
With regards to other DVs that were included the MANOVA and post-hoc
analysis supported the notion that influential individuals a higher reputation than their
counterparts. While this was not hypothesised as explained previously, it confirms the
rationale for separating VC users into four groups.
4.7. Mixed Effects Models
A mixed effects model was incorporated into the analysis to assess posting and
thread starting frequency. As such, due to the groupings (posters within a particular
status group) and the repeated measures nature of assessing multiple variables at
different points in time; a mixed model appeared most suitable to provide a flexible
approach with a variety of correlation patterns to be modelled. Moreover, mixed
models can handle uneven spacing of data particularly with repeated measures. Thus,
making this analysis more appropriate to assess frequency.
This section examines the following hypotheses via mixed effects modelling:
H6 – There will be a relationship between posting frequency and status
H7 – There will be a relationship between thread starting frequency and status
H8 – There will be a relationship between acknowledgement from others and status
4.7.1 Thread Frequency and Status Group
Table 4.9
Descriptive Statistics for Status Group Monthly Thread Frequency
Status Group Mean SD
Always PP 2.48 1.813
PP Demoted .35 .626
PP Inactive .49 .835

100
Promoted to PP .28 .695
4.7.1.1 Fixed Effect for Mixed Model
There was a significant main effect for status and thread frequency, F(3, 2546)
= 96.931, p < 0.001 and a significant interaction for status*month and thread frequency,
F(3, 2546) = 16.556, p < 0.001. This implies that status is an important predictor of
thread frequency and that the relationship between time (months) is moderated by status
groups.
Figure 4.1. Line Graph Showing Mean Threads Each Month for the Status Groups

101
Therefore the intercept for PP Demoted is .024276-.049084= -0.016564 and this
is significantly lower than for Always PP (t=-5.414, p<0.001). Equally, PP Inactive
was significantly lower than Always PP (t=-5.544, p< 0.001), but Promoted to PP was
not significant (t=-1.357, p=.175). This therefore shows a lower thread frequency for
PP Demoted and PP Inactive when compared with Always PP.
Pairwise Comparisons for Status
All pairwise comparisons were significant (at the 0.001 level) for Always PP
and the other status groups. Illustrating that Always PP had a higher thread frequency
when compared with PP Inactive, PP Demoted and Promoted to PP. This supports the
hypothesis that influential individuals start threads more frequently.
4.7.2. Post Frequency and Status Group
Table 4.10
Descriptive Statistics for Status Group Monthly Post Frequency
Status Group Mean SD
Always PP 82.93 27.932
PP Demoted 12.86 10.698
PP Inactive 17.30 11.337
Promoted to PP 8.83 8.324
4.7.2.1 Fixed Effect for Mixed Model
There was a significant main effect for status and thread frequency, F(3, 2546)
= 517.320, p < 0.001 and a significant interaction for status*month, F(3, 2550) =
135.735, p < 0.001. This implies that status is an important predictor of post frequency
and that the relationship between time (month) and post frequency is moderated by
group status.
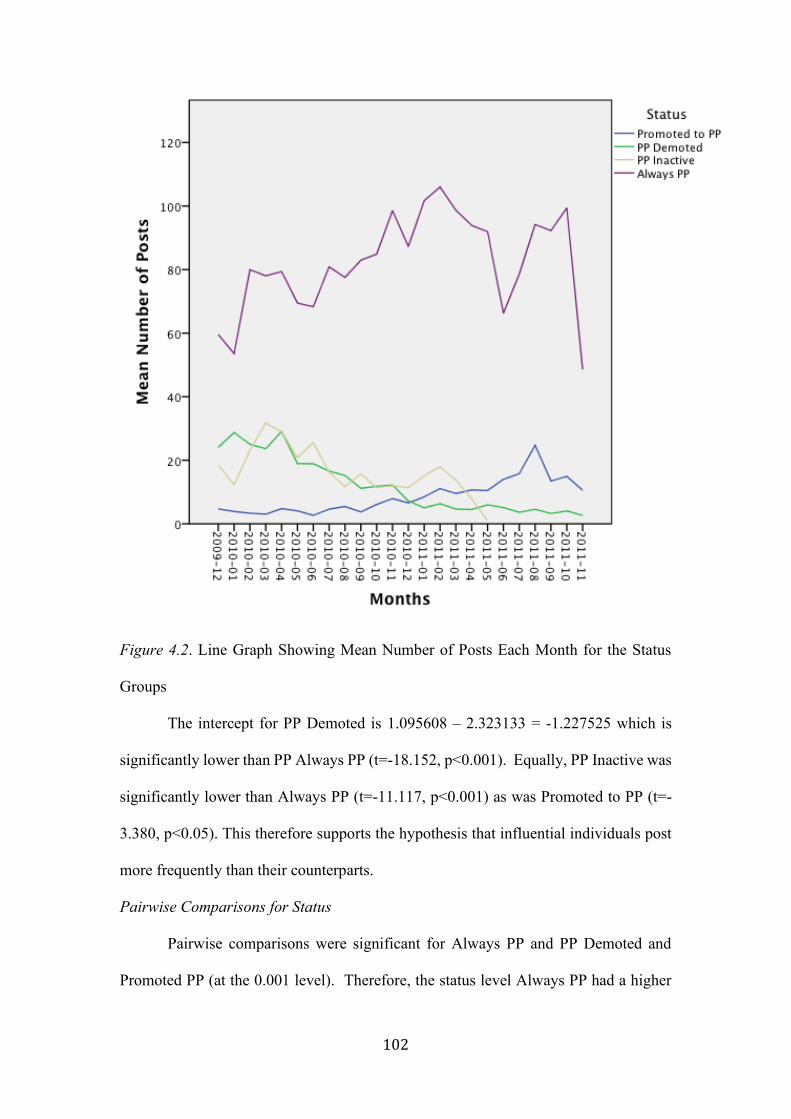
102
Figure 4.2. Line Graph Showing Mean Number of Posts Each Month for the Status
Groups
The intercept for PP Demoted is 1.095608 – 2.323133 = -1.227525 which is
significantly lower than PP Always PP (t=-18.152, p<0.001). Equally, PP Inactive was
significantly lower than Always PP (t=-11.117, p<0.001) as was Promoted to PP (t=-
3.380, p<0.05). This therefore supports the hypothesis that influential individuals post
more frequently than their counterparts.
Pairwise Comparisons for Status
Pairwise comparisons were significant for Always PP and PP Demoted and
Promoted PP (at the 0.001 level). Therefore, the status level Always PP had a higher

103
mean difference, showing a high posting frequency. This therefore adds support for
the hypothesis that influential individuals post more frequently.
4.7.3. Number of Thanks Frequency and Status Group
Table 4.11.
Descriptive Statistics for Status Group and Number of Thanks Frequency
Status Group Mean SD
Always PP 34.59 17.041
PP Demoted 4.48 3.479
PP Inactive 5.32 3.968
Promoted to PP 3.95 4.304
4.7.3.1. Fixed Effects for Mixed Model
There was a significant main effect for status and number of thanks received,
F(3, 2546) = 135.842, p<0.001 and a significant interaction status*month, F(3, 2546)
= 238.083, p< 0.001. This implies that status is an important predictor of number of
thanks received frequency. In addition, the interaction between status and month
implies that the relationship between month (time) and number of thanks frequency is
moderated by status group.

104
Figure 4.3. Line Graph Showing Mean Number of Thanks Each Month for the Status
Groups
The intercept for PP demoted is 1.389133-1.646879 = -0.257746. This is
significantly lower than for the status group Always PP (t=-25.232, p<0.001). In
addition, PP Inactive was also found to be significantly lower than Always PP (t=-
16.898, p<0.001) as well as Promoted to PP (t=-15.901, p<0.001). This illustrates a
significant difference between the groups and appears to add some support to the
hypothesis that influential individuals receive a higher number of thanks each month in
comparison to their counterparts.
Pairwise Comparisons for Status
All status groups were found to be significantly different from Always PP (at

105
the 0.001 level). Therefore, Always PP consistently had a higher mean difference
when compared to the other groups; illustrating number of thanks was higher for this
particular group; thus supporting the notion that influential individuals receive a
higher level of acknowledgment from others. Moreover, Promoted to PP was found to
be significantly lower that PP Inactive.
4.7.4. Average Number of Thanks Frequency and Status Group
Table 4.12.
Descriptive Statistics for Status Group and Average Number of Thanks Frequency
Status Group Mean SD
Always PP 2.825 1.5449
PP Demoted 3.174 2.8181
PP Inactive 3.992 2.8894
Promoted to PP 2.461 1.4116
4.7.4.1. Fixed Effects for Mixed Model
There was a significant main effect for status and average number of thanks,
F(3, 2368) = 27.338, p < 0.001 and a significant interaction for status*month, F(3,
2368) = 19.188, p < 0.001. This implies that status is an important predictor of average
number of thanks frequency and the interaction suggests that the relationship between
time (month) and average number of thanks frequency is moderated by group status.

106
Figure 4.4. Line Graph Showing the Mean Average Number of Thanks Each Month
for the Status Groups
The intercept for average number of thanks for PP Demoted is -.124935 -
0.51547 = -0.176482. This is significantly lower Always PP (t=-2.985, p<0.05). PP
Inactive was not significant (t=-.431 p=.667) and PP Promoted was significantly higher
than Always PP (t=4.983, p<0.001). Therefore, there is a clear difference among the
levels for status with regards to average number of thanks and Promoted to PP appears
to have the highest number of average number of thanks. This adds some support to
the notion that influential individuals gain more acknowledgement as they are gaining

107
status within a community, though does not fully support the hypothesis in the present
investigation.
Pairwise Comparisons for Status
PP Inactive was the only group that was significantly different from all the other
status groups; equally, this group had a higher mean difference than their counterparts.
This demonstrated that PP Inactive had a higher average number of thanks frequency
than Always PP, PP Demoted and Promoted to PP. Equally, Always PP had a higher
mean difference in comparison with Promoted to PP. However, this does not appear to
support the notion that influential individual receive more acknowledgement from other
community members.
Conclusion for Mixed Effect Models
This section of the analysis related to the following hypotheses:
H6 – There will be a relationship between posting frequency and status
H7 – There will be a relationship between thread starting frequency and status
H8 – There will be a relationship between acknowledgement from others and status
H7 suggested there would be a relationship between posting frequency and
status. The model illustrated a significant main effect for both status and posting
frequency and an interaction between status and time and post frequency, accordingly,
supporting the hypothesis. Equally, the pairwise comparisons from the post hoc test
revealed that influential individuals outperformed those that were promoted and those
that were demoted on monthly postings, further supporting the notion of influential
individuals having a higher post frequency.
Based on the models, H7 there would be a relationship between posting
frequency and status was supported by the significant main effect for group status and
thread frequency. This illustrated the groups had a different mean monthly thread

108
number. Moreover, there was a significant interaction between status and time upon
thread frequency. Consequently, supporting the notion that time and thread frequency
was moderated by group status. Upon further analysis, the post hoc test found
significant differences between the influential users and all other group categories.
More specifically, influential individuals had a higher thread frequency.
Hypothesis 8 suggested that there would be a relationship between
acknowledgement from other and group status. Subsequently, there was a significant
main effect for number of thanks and status and average number of thanks and status.
Equally, the mixed effects model illustrated a significant interaction between status and
time for both average number of thanks and number of thanks. This supports the
hypothesis that there is a relationship between group status and acknowledgement from
others. For number of thanks frequency the post hoc test found significant mean
differences for influential individuals and all other categories, this further confirms the
assertion that influential individual receive a greater level of acknowledge in
comparison with their counterparts.
However, the post hoc test for average number of thanks did not reveal
significant mean differences for influential individuals in comparison to the three other
groups. Nonetheless, the test did find significant mean differences for demoted
individuals. That is, those that lost status had a significantly lower mean difference
from their counterparts (Promoted to PP and PP Inactive). This, together with the
number of thanks frequency indicates that influential individuals receive more
acknowledgements from others by way of number of thanks, than their counterparts;
conversely, those that lose their status experience a decline in acknowledgement from
others.

109
4.8 Islamic United Analysis
This section will potray behaviour characteristics for each of the 8 users
discussed in phase one for IU. As such, the charts below illustrate posting frequency,
thread frequency and average word count (per year) to reveal any corresponding
patterns of behaviour amongst individuals when they were deemed to be influetnial in
the community. As previously illustrated in the overview of the chapter, this sections
of the thesis relates to the following hypotheses;
H1 – Influential individuals will have a higher number of posts in comparison with
their counterparts
H2 – Influential individuals will have a higher number of threads in comparison with
their counterparts
H3 – Influential individuals will have a higher word count (per post) than their
counterparts
H4 – Influential individuals will have a higher word count (per thread) than their
counterparts
H5 – Influential individuals will have a higher number of thanks from other
community members than their counterparts
H6 – There will be a relationship between posting frequency and status
H7 – There will be a relationship between thread starting frequency and status
H8 – There will be a relationship between acknowledgement from others and status
Table 4.13
Role transitions for eight IU members over a 24 month period.
Months
IU Member 24 - 18 18 – 12 12 - 6 6 – 0
Members that Gained Reputation (Part One)

110
Gag Order Collaborator Collaborator Leader Leader
Intoodeep Contributor Contributor Collaborator Leader
Pluma Collaborator Leader Leader Leader
Al-Omari Contributor Contributor Contributor Leader
Members that Lost Reputation (Part Two)
Umar247 Leader Leader Contributor Collaborator
Free the Oppressed Leader Leader Inactive Inactive
Iqra Contributor Leader Inactive Inactive
Weshallnotkeepsilent Leader Leader Leader Collaborator
4.8. Global IU Descriptive and Inferential Statistics
This next section examines all of the individuals that gained and lost status within LWP
over a two-year period. In expanding from the previous eight users, this section
includes N = 36 IU online community members, which have been influential at some
point within the cluster analysis as relates to the following hypotheses:
H1 – Influential individuals will have a higher number of posts in comparison with
their counterparts
H2 – Influential individuals will have a higher number of threads in comparison with
their counterparts
H3 – Influential individuals will have a higher word count (per post) than their
counterparts
H4 – Influential individuals will have a higher word count (per thread) than their
counterparts
H5 – Influential individuals will have a higher number of thanks from other
community members than their counterparts

111
4.8.3. Descriptive Statistics
Table 4.14
Group Properties for the Independent Variable Status
Group Identifier Number Status Group N
1 Always Influential 12
2 Influential to Another
Role
10
3 Influential to Inactive 5
4 Promoted to Influential
(without null values)
9
Table 4.15
Group Status Mean and Standard Deviation Scores for Dependent Variable
Reputation
Group Identifier
Number
Mean SD
1 5150.00 3735.21
2 350.00 33
3 0.00 0.00
4 1744.44 1227.92
Table 4.16
Group Status Mean and Standard Deviation Scores for Dependent Variables Post
Total and Post Word Count
Post Total Post Word Count

112
Group Identifier
Number
Mean SD Mean SD
1 4110.67 3129.50 29263.75 29214.43
2 825.50 669.66 6152.30 6625.72
3 502.00 408.70 20255.60 38305.19
4 2866.56 2714.61 20269.78 18269.35
Table 4.17
Group Status Mean and Standard Deviation Scores for Dependent Variables Thread
Total and Thread Word Count
Thread Total Thread Word Count
Group Identifier
Number
Mean SD Mean SD
1 115.42 83.71 37659.75 40938.16
2 69.20 84.53 42917.20 87950.83
3 25.60 45.46 10109.00 21310.70
4 74.22 66.31 19586.89 18612.71
Table 4.18
Group Status Mean and Standard Deviation Scores for Dependent Variables Average
Thread Word Count and Average Post Word Count
Average Thread Word Count Average Post Word Count
Group Identifier
Number
Mean SD Mean SD
1 367.4171 404.67439 70.0990 69.06169

113
2 368.2107 345.32378 13.2168 20.07446
3 179.4292 176.11280 6.0828 1.95793
4 233.5321 225.02219 10.4569 9.69614
Table 4.19
Group Status Mean and Standard Deviation Scores for Dependent Variable Number
of Thanks Received and Average Number of Thanks
Number of Thanks Average Number of Thanks
Group Identifier
Number
Mean SD Mean SD
1 658.08 503.93 7.0319 3.42860
2 70.40 66.32 108.0820 286.16297
3 1.20 2.168 49.4000 81.18990
4 450.00 352.99 6.1497 3.42082
Note. All missing values (-1) were excluded from number of thanks.
4.8.4. Inferential Statistics
4.8.4.1. Method of Analysis
Analysis of the relationship between the IV (status) and the dependent variables
(seniority, post word count, reputation, number of thanks, average number of thanks,
thread total, thread word count, average post word count and average thread word)
count were analysed using a MANOVA. As previously mentioned, MANOVA is
preferred over a series of ANOVAs due to the increased probability of making a Type
I error.

114
With regards to the various assumptions that need to be met, Box’s M was
executed to determine the equality of variance covariance. In this case the Box’s M
result was statistically significant (p<0.001), illustrating significant differences
amongst the levels of the IV (status) in the covariance matrices. However, as sample
sizes in this case are relatively similar in size (though not exact), and acknowledging
the fact that Box’s M is highly sensitive to violations of normality, Levene’s test of
equality of variance was also conducted. Whenever Levene’s test for homogeneity of
variance was significant (at the p<0.05 level), non-parametric tests (Kruskal-Wallis)
were used to confirm the effects of the MANOVA (at the p<0.001 level). In almost all
cases (apart from post word count) Kruskal-Wallis confirmed the findings from the
MANOVA; nonetheless, in cases where one test had a significant result and the other
32comparisons Games-Howell was used due to the uncertainty regarding equal
population variances; thus equal variance and normality could not be assumed.
4.8.4.2. Multivaraite Effects
A one-way MANOVA revealed a significant multivariate main effect for status,
F (27, 71) = 2.821, p <. 001; Wilks’ λ = .118, partial η2= .509. Power to detect the
effect was .999. In addition, a significant intercept was also found via the MANOVA
F (9, 24) = 15.699, p <. 001; Wilks’ λ = .145, partial η2= .855. Power to detect was
1.00. Thus, there was a difference in the means for the status groups with regards to the
various dependent variables under investigation, concluding that individuals in each of
the groups have a different pattern of online behavior from one-an-other and did not
have similar means with regards to the various DVs under investigation.
Significant univariate effects were found for Seniority, F 3, 36) = 5.343, p<0.05, η2 =
.334, power = .404; Reputation F (3, 36) = 10.545, p<0.05, η2 = .497, power = .869;
Number of Thanks, F(3, 36) = 7.294, p<0.05, η2 =.627 and Average Post Word Count

115
F(3, 36) = 5.328, p<0.05, η2 = .333 Yet, there were no significant multivariate effects
for post word count, thread total, thread word count, average thread word count and
average number of thanks.
Pairwise Comparisons for Seniority
Significant status pairwise differences were obtained in the dependent variable
Seniority between Always PP and both PP Demoted and PP inactive as well as
between PP Inactive and Promoted to PP. The mean number for Seniority was
4110.67 for Always PP, 825.50 for PP Demoted, 502.00 for PP Inactive and 2866.56
for Promoted to PP.
Pairwise Comparisons for Reputation
Pairwise differences were also obtained for the dependent variable Reputation
between Always PP and PP Demoted, PP Inactive and Promoted to PP. The means
for reputations were as follows; 5150.00 for Always PP, 350.00 for PP Demoted, 0.00
for PP Inactive and 1744.44 for Promoted to PP.
Pairwise Comparison for Number of Thanks
Pairwise comparisons were found to be significant for the dependent variable Number
of Thanks between Always PP and both PP Demoted and PP Inactive. For the PP
Demoted level of the IV differences were found be significant between PP Demoted
and PP Inactive and between PP Inactive and Promoted to PP. The means are as
follows; 658.08 Always PP, 70.40 PP Demoted, 1.20 for PP Inactive and 450.00 for
Promoted to PP.
Pairwise Comparison for Average Post Word Count
Finally, a comparison was found to be significant for the dependent variable
Average Post Word Count between Always PP and PP Inactive. The mean for
Always PP was 70.0990 and the mean for PP Inactive was 6.0828.

116
4.8.4.3. Conclusion
The MANOVA investigated a number of hypotheses in relation to group
status. Seniority, average post word count, reputation, number of thanks and average
number of thanks were all found to have significant effects. Thus, leading to the
conclusion that the means for the status groups for those particular DVs were
significantly different from one-an-other. Contrary to that, post word count, thread
total and thread word count did not reveal significantly different means for the four
status groups. With regards to the previously mentioned hypotheses, the above
statistics related to the following:
H1 – Influential individuals will have a higher number of posts in comparison with
their counterparts
H2 – Influential individuals will have a higher number of threads in comparison with
their counterparts
H3 – Influential individuals will have a higher word count (per post) than their
counterparts
H4 – Influential individuals will have a higher word count (per thread) than their
counterparts
H5 – Influential individuals will have a higher number of thanks from other
community members than their counterparts
Hypothesis 1 suggested that influential individuals from IU would have a higher
number of posts in comparison with the other status groups. The MANOVA result in
conjuncture with the post hoc tests illustrated that influential individuals had
significantly higher mean differences than the demoted and promoted group (though
there was no significant difference found for the inactive group), thus this does indeed
support Hypothesis 1.
117
Hypothesis 2 suggested influentials would have a higher thread total in
comparison with the other status groups; however, the lack of significance found for
the multivariate analysis does not support this hypothesis.
Alternatively, Hypothesis 3 has only partial support as the word count (per post)
was found to be significantly different for the status groups; specifically, influential
individuals had a significantly higher mean difference than those that became inactive
(but not for the other two groups). However, total post word count was not found to be
significant; thus, Hypothesis 3 cannot be fully supported, but there is evidence to
suggest some difference.
The findings do not support Hypothesis 4 that influential individuals have a
higher word count (per thread) than their counterparts as there was no significant
difference found between the groups for total word count for threads and word count
per thread.
Equally, mixed results were produced for average number of thanks and total
number of thanks. That is, number of thanks was found to be significant; therefore,
there was a difference in the means for the groups with regards to number of thanks
(specifically between Always PP and PP Demoted), which add partial support for
Hypothesis 5 that influential individuals will have a higher number of thanks in
comparison with their counterparts. Yet, there was no significant difference found
between the groups for average number of thanks. Thus, this cannot be fully confirmed.
4.8.5. Mixed Effects Models
A mixed effects model was incorporated into the analysis to assess posting
and thread starting frequency and number of thanks over time. As previously stated
in the LWP section, due to the groupings and clusters of the data (posters within a
particular status group) and the repeated measures nature of assessing multiple

118
variables at different points in time a mixed model appeared most suitable to provide
a flexible approach with a variety of correlation patterns to be modelled.
This section examines the following hypotheses via mixed effects modelling:
H6 – There will be a relationship between posting frequency and status
H7 – There will be a relationship between thread starting frequency and status
H8 – There will be a relationship between acknowledgement from others and status
4.8.5.1. Thread Frequency and Status Group
Table 4.20.
Descriptive Statistics for Status Group Monthly Thread Frequency
Status Group Mean SD
Always PP .80 .999
PP Demoted .28 .567
PP Inactive .567 .716
Promoted to PP .72 1.031
4.8.5.1.1. Fixed Effect for Mixed Model for Thread Frequency
There was no significant main effect for status and threads, F(3, 2270) = 1.936,
p = .122. However, there was a significant interaction between status*month, F (1,
2270) = 7.982, p < 0.001. This implies that status is not a predictor of thread frequency,
but that there is a relationship between time and thread frequency which is moderated
by status group.

119
Figure 4.5. Line Graph Showing Mean Number of Threads Started Per Month for Each
of the Status Groups
Therefore the intercept for PP Demoted is .588886-.030823 = 0.558063 and that
this is significantly lower than for Always PP (t=-4.402, p< 0.001). Equally, PP
Inactive was significantly lower than Always PP (t=-2.658, p< 0.05), however,
Promoted to PP was not significantly different (t=-1.638, p=.101). This therefore
shows a lower thread frequency for PP Demoted and PP Inactive but not for Promoted
to PP when compared with Always PP. As such, the interaction between month thread
frequencies does appear to be moderated by group status.
Pairwise Comparisons for Status

120
Always PP and Promoted to PP appeared to have a higher mean difference
(for each month) with regards to thread frequency in comparison with their
counterparts. This adds support for the hypothesis that influential individuals initiate
threads more frequently than those who are losing influence within an online
community. However, status on its own is not a predictor of thread frequency, status
is a moderating variable between time and thread frequency only (see section
4.8.5.1.Thread Frequency and Status Group).
4.8.5.2. Group Status and Post Frequency
Table 4.21.
Descriptive Statistics for Status Group Monthly Thread Frequency
Status Group Mean SD
Always PP 20.14 14.865
PP Demoted 4.35 4.35
PP Inactive 3.448 3.448
Promoted to PP 20.20 12.492
4.8.5.2.1. Fixed Effects for Mixed Model for Post Frequency
There was a significant main effect for status and number of posts, F(3, 2270)
= 61.521, p < 0.001 and a significant interaction for month*status, F(1, 2270) = 67.677,
p < 0.001. This illustrates that status group is a predictor of number of posts and that
the relationship between number of posts and time is moderated by status group.

121
Figure 4.6. Line Graph Showing Mean Number of Posts Per Month for Each of the
Status Groups
Therefore the intercept for PP Demoted is 8.286013-1.035868= 7.250145. This is
significantly lower than for Always PP (t=-12.406, p< 0.001). Equally, PP Inactive
was significantly lower than Always PP (t=-4.964, p< 0.001) as was Promoted to PP
(t=-11.593, p< 0.001).
Pairwise Comparisons for Status
Always PP and Promoted to PP appeared to have a higher post frequency in
comparison with their counterparts. This adds support for the hypothesis that
influential individuals post more frequently than those who are losing influence
within an online community.

122
4.8.5.3. Total Number of Thanks
Table 4.22.
Descriptive Statistics for Group Status and Monthly Number of Thanks
Status Group Mean SD
Always PP 3.97 7.120
PP Demoted .44 1.148
PP Inactive .02 .149
Promoted to PP 2.50 4.923
4.8.5.3.1. Fixed Effect for Mixed Model
There was a significant main effect for status and number of total thanks
received, F(3, 2270) = 31.087, p < 0.001 and a significant interaction between
status*month, F(1, 2270) = 117.753, p < 0.001. This implies that status is an important
predictor of total number of thanks received. Additionally, the interaction reveals that
the relationship between time and total number of thanks is moderated by group status.

123
Figure 4.7. Line Graph Showing Mean Number of Thanks Per Month for Group Status
Therefore the intercept for PP Demoted is .641972 – .556892 = 0.08508 and
this is significantly lower than for Always PP (t=-18.223, p< 0.001). Equally, PP
Inactive was significantly lower than Always PP (t=-7.171, p< 0.001), as was Promoted
to PP (t=-8.087, p< 0.001). This therefore shows a lower total number of thanks
received for PP Demoted, PP Inactive and Promoted to PP when compared with Always
PP. As such, status group does appear to be a predictor of number of thanks.
Pairwise Comparisons for Status
All pairwise comparisons were significant (at the 0.001 level) apart from PP
Demoted vs PP Inactive (p>0.05). Equally, Always PP had a higher significant mean
difference in comparison with all other groups illustrating that this group in particular
had a higher total number of thanks received. Moreover, those that were demoted had

124
a lower mean difference when compared to all groups apart from PP Inactive
illustrating that individuals in this group had a higher total number of thanks.
4.8.5.4. Average Number of Thanks
Table 4.23.
Descriptive Statistics for Group Status and Monthly Average Number of Thanks
Status Group Mean SD
Always PP 6.9770 10.18039
PP Demoted 2.2016 1.65236
PP Inactive 3.2000 .83666
Promoted to PP 6.1192 7.77978
4.8.5.4.1. Fixed Effect for Mixed Model Average Number of Thanks
There was a significant main effect for status and average number of thanks
received, F(3, 682) = 20.493, p < 0.001 and a significant interaction between
status*month, F(3, 682) = 14.517, p < 0.001. This implies that status is an important
predictor of average number of thanks received and the relationship between time and
average number of thanks is moderated by group status.

125
Figure 4.8. Line Graph Showing Mean Average Number of Thanks Per Month for
Group Status
Therefore the intercept for PP Demoted is -1.176069 + .956235 = -0.219834
and this is significantly higher than for Always PP (t=5.805, p< 0.001). However, PP
Inactive was not significant (t=1.013, p=.311), neither was Promoted to PP (t=-1.462,
p=.144).
Pairwise Comparisons for Status
The only significant pairwise comparisons were found between PP Demoted
vs Promoted to PP and PP Demoted vs Always PP. These comparisons show that
Always PP had a higher average number of thanks in comparison with the demoted
group. Moreover, those that were promoted also had a higher average number of

126
thanks in comparison with the demoted group. This adds partial support for the
notion that individuals who gain kudos in a community received more frequent
acknowledgement from others.
Conclusion for Mixed Effects Models
The mixed effects models tested the following hypotheses:
H6 – There will be a relationship between posting frequency and status
H7 – There will be a relationship between thread starting frequency and status
H8 – There will be a relationship between acknowledgement from others and status
Hypothesis 6 indicated that a difference between posting frequency and status
groups, which was supported by the significant main effect for status group and
posting frequency. Similarly, status was found to have a moderating relationship on
time and posting frequency. Further support for Hypothesis 6 is found in the post hoc
analysis where influential individuals were found to have a significantly higher mean
difference (as did those that were promoted) which supports the prediction of a
relationship, specifically influential individuals post more frequently.
Hypothesis 7 predicted a relationship between group status and thread starting
frequency. However, there was no significant main effect found to support such a
prediction for status and thread frequency; though, there was a relationship found for
time and thread frequency which was moderated by group status. Equally, the post-
hoc analysis found significantly higher mean differences for promoted individuals and
always influential individual, which adds support for Hypothesis 7.
Hypothesis 8 suggested that there was a relationship between acknowledgement
and group status, based on the number of thanks that particular individuals receive.
There was indeed a relationship found between number of thanks frequency and status

127
and status was also found to be a moderating variable for time and number of thanks
frequency. This supports the prediction made for Hypothesis 8. To further corroborate
this notion, there was also a significant main effect found for the status groups with
regards to average number of thanks and an interaction between time and group status
for average number of thanks. This implies that status is an important predictor of
thanks received and the relationship between time and number of thanks. Once again,
the post hoc test found the greatest difference in the influential category, indicating that
influential individuals receive a higher level of number of thanks on a frequent basis.
Moreover, those that are demoted or have lost some level of respected status receive
far less acknowledgement or thanks from other community members; thus supporting
Hypothesis 8.
4.9. Comparing Influence between Communities
As illustrated above, there are been some (slight) differences in the results
between IU and LWP. As such, this section will examine influential individuals across
both communities to assess whether there are notable differences in the social structure
for those that have been categorised as “Always PP” or influential individuals.
Specifically, this will address whether influentials in IU have more connections than
influentials in LWP; moreover, this will also assess how influential connecting vertices
are with regards to the influential individuals. Therefore, this addresses that those that
were always influential throughout the cluster analysis had similar types of influence
within their online communities.
This section relates to the following hypotheses:
H9 – Influential members of IU will have more connections to other members in
comparison with influential members of LWP

128
H10 – Influential members in LWP will have more connections with other influential
members than in IU.
4.9.1. Method of Analysis
Betweenness Centrality was used to assess level of connections between the two
online communities. However, in relation to the parametric assumptions, the data did
not have normality of distribution and had violated the assumption of variance as the
Levene’s test revealed a significant result (p > 0.05). As such, a Mann Whitney U Test
was conducted to assess the differences in means for Betweenness Centrality for all
those that had been categorised as “Always Influential” across both IU and LWP.
Alternatively, to investigate the level of influential neighbours for specific vertexes,
PageRank was used. This assessed how influential ones friends/neighbours are. In
relation to the parametric assumptions, the data did have normality of distribution and
variance was not violated; thus an independent samples t-test was employed for a
comparison of means for influential individual’s PageRank.
4.9.1.1. Betweenness Centrality
Table 4.24
Betweenness Centrality Descriptive Statistics for Influential Individuals of IU and
LWP.
Community N Median Range
Islamic United 13 4.7420 9.18
Left-Wing Politics 43 4.7070 10.63
There was no significant difference found for Betweenness Centrality for the
influential individuals in IU and LWP U=180, p = .0535. Therefore, the hypothesis
5 Not significant at the 0.05 level

129
that IU will have more connections to other members in comparison with influential
members of LWP cannot be confirmed.
4.9.1.2. PageRank
Table 4.25.
PageRank Descriptive Statistics for Influential Members of IU and LWP.
Community N Mean SD
Islamic United 13 4.7409 2.59229
Left-Wing Politics 43 5.2322 2.53372
There was no significant difference found between the online communities for
PageRank t(54) = -.609, p=.539. Therefore, Hypothesis 10 that influential members in
LWP have more connections with other influential members than in IU is not supported
by the findings in this investigation.
4.10. Chapter Summary
For the online community LWP it appears from the MANOVA that those that
were categorised as “Always PP” or indeed influential individuals had a higher number
of posts, threads, word count for threads, number of thanks, reputation and average
number of thanks in comparison with those that were promoted, those that were
demoted and those that became inactive. Therefore, this confirms Hypotheses 1 – 5.
Group status was also found to be a significant predictor of post frequency. The
interaction between time and status suggests that status is a moderating variable
between time and post frequency. With regards to the pairwise comparisons that were
found to be significantly different from each other, Always PP had a significantly

130
higher mean difference than Demoted PP and Promoted to PP (but not PP Inactive).
This therefore suggests that influential individuals do post more frequently than their
counterparts, which adds partial support for Hypothesis 6.
With regards to the notion of online behaviour and frequency, the mixed effects
models provide support for the notion that influential individuals start threads more
frequently than their counterparts. This was illustrated by the significant main effect
for status and thread starting frequency, as well as the significant interaction between
time and status for thread frequency. Consequently, this suggests that there is indeed a
relationship between status and thread starting frequency; more specifically, status is a
moderating variable in time and thread frequency. Equally, the pairwise comparisons
revealed that Always PP had a significant higher mean difference than PP Inactive, PP
Demoted and Promoted to PP, which supports the predictions made and confirms
Hypothesis 7.
Group status was found to be a predictor of number of thanks frequency and
equally was found to be the moderating variable between time and number of thanks
frequency. Moreover, the biggest pairwise comparisons were found for Always PP as
this category had a higher number of thanks frequency in comparison with all other
levels; however, PP Demoted was not found to have a lower mean difference in
comparison with Promoted to PP or PP Inactive. As such, this supports the notion that
influential individuals receive more acknowledgements from others on a regular basis,
but does not confirm the hypothesis that those that lose their status endure a noticeable
decline in acknowledgement. Therefore, this only partially supports Hypothesis 8.
The final analysis for LWP examined average number of thanks frequency.
Once again, status was found to be a significant predictor of average number of thanks
frequency. However, the pairwise comparisons found the greatest difference to be

131
within the PP Inactive category as this group had a higher mean difference in average
monthly thanks in comparison with Always PP, PP Demoted and Promoted to PP,
which does confirm Hypothesis 8 that there is a relationship, but does not support the
notion that influentials receive a higher level of average number of thanks frequency.
Alternatively, IU revealed slightly different results. The MANOVA found the
status groups to have different means for the following dependent variables; seniority,
average post word count, reputation and number of thanks. With regards to the pairwise
comparisons, Always PP was found to be significantly different from at least one other
group in all of the significant dependent variable illustrating that influential individuals
have a higher total number of posts, average word count, reputation and number of
thanks in comparison with their counterparts. Therefore, this confirms Hypothesis 1,
Hypothesis 3, Hypothesis 4 and Hypothesis 5. Nonetheless, Hypothesis 2 could not be
confirmed as there was no significant difference found between the groups for thread
starting, thread word count or average thread word count.
Status was found to be a predictor of posting frequency and also the interactions
between time and status suggests that status is a moderating variable. Equally, the post
hoc analysis revealed that Always PP and PP Promoted had a significantly higher mean
than both PP Inactive and PP Demoted. Consequently, this supports Hypothesis 6 that
there is indeed a relationship between status and posting frequency; more specifically,
influential individuals post more frequently than their counterparts.
In accordance with the latter point, the mixed effects model also produced
different results to that of LWP. Namely, status was not found to be a predictor of
thread frequency. However, this was found to be a moderating variable between time
and thread frequency due to the interaction effect that was found between status and
month (See Section 4.8.5.1.Thread Frequency and Status Group). There was a

132
significant difference found in the post-hoc analysis for status and thread frequency as
Always PP was found to be significantly different found PP Inactive and PP Demoted,
suggesting that individuals that have always been influential throughout the cluster
analysis start threads more frequently than others. This adds some support for
Hypothesis 7.
Likewise, status was also found to be a predictor of number of thanks frequency
and also a moderating variable between time and number of thanks. Once again,
Always PP and Promoted to PP had a significantly higher mean difference than their
counterparts (PP Demoted) illustrating some support for the notion that influential
individual received more acknowledgement from other in the community; equally, this
does provide support for the notion that those that are losing reputation or status within
the community experience a decline in acknowledgment and thanks from others.
Therefore, this adds support for Hypothesis 8.
Finally, status was found to be a predictor of average number of thanks
frequency and a moderating variable between time and average number of thanks. The
pairwise comparisons only revealed significant mean differences for Always PP vs PP
Demoted and Promoted to PP vs PP Demoted. Therefore, the demoted category
experienced a significantly lower mean difference than those that are influential. While
there was no significant pairwise comparison between PP Inactive and PP Demoted,
this still supports the notion that individuals who lose reputation in a community receive
less acknowledgement and thanks from others (especially in comparison with those that
are gaining or sustaining status). Consequently, this information, alongside the results
from number of thanks frequency, appears to support Hypothesis 8.
Overall, the results from IU and LWP appear relatively similar; though, there is
only one noticeable difference in the results. Thread behaviour was found to be

133
significant for influential individuals of LWP, but was not significant for influential
individuals in IU. Interestingly, this suggests that influential individuals in LWP start
threads more frequently and have longer threads, than do influential individuals in IU.
Aside from thread behaviour, the results remain relatively similar across both
communities. Consequently, this confirms the notion the influential individuals (or
individuals gaining momentum within a community) post more frequently and with
longer posts. Equally, they receive a higher number of thanks from other members on
a regular basis. See table below for hypotheses summary table.
Table 4.26
Hypothesis Summary Table
Hypothesis Finding
Hypothesis 1:
Influential individuals will have a higher number of posts in
comparison with their counterparts
Supported
Hypothesis 2:
Influential individuals will have a higher number of threads in
comparison with their counterparts
Supported
Hypothesis 3:
Influential individuals will have a higher word count (per post)
than their counterparts
Supported
Hypothesis 4:
Influential individuals will have a higher word count (per thread)
than their counterparts
Supported
Hypothesis 5: Supported

134
Influential individuals will have a higher number of thanks from
other community members than their counterparts
Hypothesis 6:
There will be a relationship between posting frequency and
status
Partially
Supported
Hypothesis 7:
There will be a relationship between thread starting frequency and
status
Supported
Hypothesis 8:
There will be a relationship between acknowledgement from
others and status
Partially
Supported
Hypothesis 9:
Influential members of IU will have more connections to other
members in comparison with influential members of LWP
Supported
Hypothesis 10:
Influential members in LWP will have more connections with
other influential members than in IU
Supported

135
CHAPTER FIVE
RESTRICTED ACESS

136
CHAPTER SIX
RESTRICTED ACESS
.

137
CHAPTER SEVEN
GENERAL DISCUSSION
The aim of this thesis was to identify influential individuals in online
communities and explore their online identities. In doing so, the research examined
various online behaviours that were associated with influential individuals via
numerous different quantitative techniques and approaches. This therefore, ultimately
led to an in-depth qualitative analysis of a select amount of users to examine their rise
and fall from influential status to illustrate the ways in which they lost influence and
followership within two different online communities. Furthermore, this examined the
ways in which they interacted with other users and evolved over time.
The findings from the quantitative data analysis confirmed a number of
hypotheses. Specifically, that there was a difference in the total number of posts,
threads, reputation, word count for threads, number of thanks and average number of
thanks between the influential individuals and other members of the community.
Therefore, those that had always been influential or daubed as reputable engaged in
these behaviours and scored higher in the analysis in comparison with their
counterparts. However, hypothesis 3 relating to average word count (per post) was not
found to be statistically significant for high ranking individuals; however, total word
count post was higher in consistently influential individuals in comparison with their
counterparts. Therefore, high ranking individuals do indeed have a higher overall word
count for their posts, though this is not consistent with each of their posts as their
average word count (per post) was not found to be significantly higher than their
counterparts.
In relation to the latter point, average word count (per thread) was not found to
be statistically significant for influential individuals. However, similar to the previous

138
point, overall word count for threads were found to be statistically significant for
influential individuals in comparison to their counter parts. To simplify, influentials
generally have a higher total word count for their threads, but not an average word count
per thread. Therefore, their threads are not consistently higher than their counterparts.
Nonetheless, Hypothesis 5 was also confirmed; thus influential individuals also
received more thanks in comparison with their less influential counterparts from the
other status groups.
There was a main effect for status and posting frequency, thread frequency and
number of thanks received. However, the results did not fully support the hypothesis
for average number of thanks. To reiterate, there were significant main effects found
for both status and posting frequency and thread frequency. Yet, the notion that
influential individuals would receive more acknowledgement from others was not
consistently supported as the post hoc analysis did not reveal differences between
influential individuals and the other status categories; though, there was a main effect
found suggesting that individuals that are influential do receive more acknowledgement
from others over the months.
On the contrary, results from IU were different from that of LWP which was a
surprising result in itself. Accordingly, there was only support for the notion that
influential individuals post more (and more frequently) than members with different
social roles within their communities; however, there was no support to corroborate
that influential individuals start more threads and initiate conversation more than others
in their online communities; thus, disputing Hypothesis 2. Equally, the results did not
support the notion that word count and average word count were higher from those with
reputable status within IU. Also, there was no support for the notion that high ranking
individuals post more threads, nor that they have longer threads in general.
139
Additionally, there was mixed support for acknowledgement from others, in
that, number of overall thanks was supported, but average number of thanks was not
found to be significant in the MANOVA. However, there was a relationship found for
number of thanks and average number of thanks, which contradicted the results from
the previous online community; thus, suggesting different online behaviours are needed
for different ideological online forums.
The findings from the qualitative empirical chapters derived a number of themes
significant to influentials in online forums. This illustrated the journey that influentials
engage in when entering a new forum, gaining reputation within a particular online
forum and subsequently how they lose their following and influence with regards to
other online community members. In turn, the qualitative analysis displayed that all
individuals that were analysed in the LWP forum engaged in acceptance seeking
behaviours when first entering an online forum. Thus, attracting attention and getting
noticed by others is the first step to gaining some momentum within online
communities and establishing ones place within a given online community. This relates
to previous literature as one of the ways in which this was established was to divulge
information on particularly skilled areas or ideological values which may correspond
with the goals of the community (Gladwell, 2002; Hilligoss & Rieh, 2008; Hovland et
al., 1953, Young, Komlodi, Rozsa, & Chu, 2016). Ultimately, these attributes
determine online users’ perceptions of credibility, which affects status and credibility
online.
However, in expanding previous research in online communities the qualitative
research illustrated that while their credentials and expertise were often disseminated
to other users when joining a forum, new individuals (that rose to high ranking status)
also engaged in advice-seeking behaviours. Thus, it is assumed that this behaviour

140
would ultimately help seek out those that were already established and credible within
the forum. Still, it could also be interpreted that these individuals were contributing to
the community to avoid any perceptions of “free riding” as discussed by previous
literature (Fan et al., 2009).
In relation to previous research, Rogers (1962) found that opinion leaders
consisted of a number of typical characteristics; these were high levels of social
participation, high social status within a given community and high levels of
responsibility. With regards to the present research, influential individuals did
demonstrate high levels of social participation and status within their online
communities. Moreover, the qualitative analysis did demonstrate that online
influentials did exhibit elements of social responsibility and a need to delegate to others,
which relates well and further corroborates earlier research
Nonetheless, one of the main communications characteristics amongst
influentials when they were particularly influential was a need to display knowledge
within a certain area. This also supports a vast amount of previous literature on
knowledge sharing (Childer, 1986; Ventraman, 1990; Weimann et al., 2007);
furthermore, with regards to IU and LWP those that were deemed influential or
particularly reputable to others in their designated communities displayed knowledge
and offered advice to their following; demonstrating some skill or expertise within their
area (Zang & Dong, 2008). Equally, particularly within IU high ranking individuals
did engage with social activities; thus, their experiences were not predominantly related
to online, which supports the research of Zang and Dong (2008). Interestingly however,
individuals often appeared to actively recruit and rally for individuals and support
within the IU community specifically. This behaviour was not solely for online

141
purposes demonstrating that social activities and recruitment was for offline purposes
also.
There is also evidence which supports the need for credibility and how to attain
credibility in online forums. For example, Metzger and Flanagin (2013) discuss source
credibility in relation to the work of Artistotle and rhetoric. Thus, it appears that
individuals do use linguistic devices such as logos, ethos and pathos when particularly
influential within a community within their threads and posts. Therefore, the way in
which people speak (or type) may be just as important as the words that are spoken as
all community members in the narrative analysis utilised these strategies when they
were perceived as influential.
With regards to identifying influentials within online communities specifically,
tracking potential influence illustrated that those that were characterised as influentials
in the online communities, did indeed have numerous connections to social ties to
others in comparison with when they did not have their status (Bakshy et al., 2011; Cha
et al., 2010; Leavitt et al., 2009). Likewise, these users did have high levels of
connectivity and centrality within their networks (Anger & Kittl, 2011; Bakshy et al.,
2011; Cha et al., 2010) which supports the notion and current research with regards to
utilising this particular measurement to track supposed influence or status within online
communities which has been previously criticised (Kwak et al., 2010).
Equally, credibility and expertise did appear with almost every reputable
individual when they had high ranking status; thus, corresponding with the notion that
online influentials do display many of the characteristics of opinion leaders (Gladwell,
2002). Equally, Anger and Kittl (2011) stated that the quality of the relationship was
far more important than the number of connections with regards to popularity. In
expanding upon that notion, the present research found that reputable individuals often

142
had a vast number of ties but also displayed strong relationships with others and
identified as particularly close friends to them. Thus, the quality and number of
relationships lead to online behaviours and characteristics that are associated
influentials within online communities.
Equally, Agarwal et al. (2008) found influential bloggers often report items that
may be junk or irrelevant in content. Accordingly, particularly in the IU community
there were instances were high ranking individuals often posted relevant material but it
was often more of a “sharing” activity. Likewise, in the LWP community repeated
“sharing” threads did often lead to a lack of responses and were usually around the time
that users were losing their status within the community. As such, while it cannot be
determined that this was a casual factor in their demise; it was a noted pattern of
behaviour, which could be related to their diminished popularity.
It must also be stated that this research examined those that were popular but
became inactive and expanded on previous research. This particular status group did
provide some noteworthy findings in relation to online behavior. Previously, Agarwal
et al. (2008) had examined influential bloggers that were active and those that were
influential but not active; as such, it is suggested that research includes those that were
active but became inactive to ultimately avoid misrepresentation in samples as these
individuals may become inactive for a number of different reasons. Furthermore,
research should examine roles over time as influentials may move roles or indeed as
illustrated in the qualitative analysis become active once again; thus, should be included
into sample designs.
With regards to distinct behaviours and predictors of influentials included
sociability, responsibility, cultural values, trust, and sheer volume of communication
(Cassell et al., 2005; Cassell et al., 2006; Greer & Jehn, 2009). Sociability was clearly

143
relevant as almost all individuals displayed elements of sociability while influential.
Evidently, this is in line with previous literature in that influentials did display levels
of gregariousness when their tenure had been established within an online community
and supports Troldahl and van Dam (1965) and Booth and Babchuk (1972).
Consequently, there are various inconsistencies that this research has not been able to
address; namely, are socio-economic aspects as important in virtual contexts as they
are with research in this area/?
However, a particularly interesting aspect of the analysis was that individuals
that became influential also had an eagerness to follow at the beginning of their
community lifespan; thus, demonstrating that social identities are not fixed. Moreover,
individuals, even influentials, can swap roles -and partition aspects of their social
identities (Eagly et al., 2003; Somech, 2006). This was illustrated in the way that
individuals reverted back to asking questions in phase two of the analysis and also
began to break away from their previously well-established social identities. Thus, this
demonstrates that online influentials are indeed a part of a larger online process.
Indeed, this does add some contribution to existing literature in that it does illustrate
that influentials are part of a wider online social process, one which is fluid in nature
rather than stable as much research does proclaim.
As exhibited in study two influentials enacted behaviours that ultimately
endorsed and promoted the sense of identity within the group. Seyranian (2014) found
language use to promote a strong sense of identity, which was supported throughout
both communities included in the qualitative analysis. Both LWP and IU often utilised
inclusive language and referred to other members as “comrade” or “brother”
demonstrating that they identified as part of the group and displayed behaviours
congruent with this identity. Moreover, it was apparent in the losing status chapter as

144
influentials tended to separate more with group norms and prototypes more when
coming towards the end of their reign of reputation, which coincides with existing
literature on social identity theory (Everett et al., 2015; Tajfel, 1982).
Similarly, the way in which people changed roles and status in the quantitative
analysis illustrated that individuals did not remain influential or popular throughout
their community lifespan. To substantiate this claim, the qualitative analysis also
demonstrated instances of people entering the forum and making their presence known
in their acceptance seeking behaviours. Likewise, there were specific instances of
individuals challenging authority figures in the community. Thus, social identities are
fluid in nature.
Consequently, this research has not only qualitatively explored identification
markers for influential individuals in online communities and substantiate that of
previous analytical claims via a new perspective. But, this research has also highlighted
possible ways in which an influential can lose their status within a online community.
Thus, through a social identity approach to online identities this research has
highlighted the importance of group membership and collective identity; as well as
discussing tactics on how to undermine an influential individual in an online
community.

145
CHAPTER EIGHT
LIMITATIONS, CONCLUSIONS, FURTHER RESEARCH AND
RELFECTIONS
8.1 Limitations
However, this research is not without its limitations. The first major limitation
to the research is the fact the researcher used secondary data analysis of existing data
for the initial stage of the empirical research (Cheng, 2014). Therefore, the researcher
in the present investigation did not collect the time sliced data or the meta-data from
the online communities, but collected all the qualitative data in the second phase.
Therefore, individuals were already categorised via algorisms as most likely to be
influentials in the particular forums based on certain behavioural and sematic
characteristics in time sliced data over a two-year period. Nonetheless, from this the
researcher then re-categorised online community members as “always influential”,
“influential then demoted”, “influential to inactive” or “promoted to influential” based
on how their roles changed throughout the two-year period as this was necessary for
the hypotheses in the present investigation.
Secondary data analysis does have some implications on the reliability of
research as it has been known for researchers to occasionally omit crucial aspects of
data when not included in the initial collection process due to a lack of thorough
understanding (Cheng, 2014; Johnston, 2014). However, the researcher was present
and aided in aspects of the research that the data set was originally intended for; thus,
has a high level of understanding. Reciprocally, the researchers for the original
research paper also aided in the present research during the quantitative aspects of the
empirical data. More so, the research paper has been published and well established
since publishing their finding on the original data (Davison et al., 2018).

146
In addition to the latter point, using an existing data set allowed for in-depth
analysis and accelerated the pace of the research for the researcher (Cheng, 2014;
Doolan & Froelicher, 2009; Johnston, 2014). Equally, this was only one aspect of the
empirical data as select individuals were then investigated further in the qualitative
analysis. In that, 16 online community members were studied in-depth throughout their
entire community lifespan to further determine whether they had certain behavioural
characteristics and online behaviours associated with influentials as the quantitative
analysis was time-sliced and limited to a two-year period. Therefore, mixing methods
added some triangulation and validity to the results.
Whilst examining online communities members throughout the qualitative
aspect of the analysis, threads opposed to posts were examined. This was due to
numerous time constraints on the research as well as the issue that posts pose with
coherency. More specifically, the data set had each individual users’ posts but they
were not in a coherent timeline with the other posts from other users, thus, only that
individual users’ posts could be seen in the database. Equally, there are instances where
posts are deleted, making it difficult to follow the conversational flow. By examining
threads that individual users started, opposed to posts, the researcher was able to see
the progression of conversation and examined the posts from others and the reactions
that each user under examination had to posts; thus, more of the context of the
conversation was preserved (Holtz, Kronberger, & Wagner, 2012).
Likewise, it was shown that those who were influentials had a high frequency
of posting and thread starting behaviours as displayed by the quantitative aspect of the
empirical chapters; also adding further verification and validity in opting this method.
Whilst analysing threads, posts are also examined to further corroborate notions derived
from the qualitative analysis which appears to support the methods used for other online

147
community research (Holtz et al., 2012; Myneni, Fujimoto, Cobb, & Cohen, 2015).
Therefore, it was hoped that this would improve overall interpretations of data and
improve the credibility of the research (De Vos. 1998; Denzin, 1978). It should also be
noted that previous research has focused on threads and thread originators to track
influence, thus further rationalising this methodological choice for data collection
(Zhao et al., 2013).
Another interesting aspect derived from the qualitative analysis was that
undermining others or engaging in mocking behaviours tended to gain support from
followers. Given the time constraints on the research and the continuity of the thesis,
further investigation was not achievable but has illustrated strong caveats and
noteworthy findings for future research to examine how to experimentally manipulate
behaviours and whether this affects the perception of onlookers. This could specifically
address the importance of mocking behaviours, undermining fact and authenticity when
gauging credibility amongst online community users.
This research examined two different forums; Islamic United and Left-Wing
Politics. Indeed, these two forums are based on rather different ideological foundations
but similar findings emerged in both aspects of the empirical research. This may act as
some form of data triangulation for the research (Korstjen & Moser, 2018). Korstjen
and Moser (2018) state using multiple sources of data can improve the overall
credibility of research, in this instance data triangulation was achieved by observing
similar findings with regards to influential behaviours and also how individuals
behaved when entering new forums or engaging in “newbie behaviours.” This is
further reinforced in the initial part of the empirical findings; thus the research
demonstrated some level of consistency amongst the findings with regards to posting,
liking behaviours, and word length and as previously stated there were no significant

148
difference found between the data of the two groups from the results (Langdridge,
2014).
However, this may also act as a limitation to the research as previous research
posits that individuals have a stronger identification with political ‘partysm’ than other
social identifiers such as ethnicity, religion or race (Westwood et al., 2017). This is
due to the voluntary nature of political party group affiliation; whereas, other social
groups are ascriptive or assigned from birth (Billig & Tajfel 1973; Martinovich, 2017;
Tajfel & Turner 1979; Westwood et al., 2017). Thus, it may be that different attachment
styles (such as bond based or identity based attachments; Ren, 2011; 2012) may be
apparent between the forums as the concept of group identity plays an implicit role in
motivating members to join a particular forums.
Nonetheless, this research did attempt to address some potential differences in
homogeneity within the forums through analysis in the first phase of research. This
was done via analysis on the differences within communities and their influence and/or
connections to other users. The t-tests were conducted to assess whether there were
notable differences in attachments and no significant differences were found. Thus,
this does show that the communities were relatively similar from a strictly positivist
stance.
Furthermore, this research extended knowledge within the influence field by
examining online behaviours that influentials displayed when at their height of power,
for example posting, thread starting and thanking behaviours. Additionally, it also
illustrated how word length was also a prominent indicator to substantiate previous
research (Agichtein et al., 2008). However, this has been conducted across different
online communities rather than focusing on one particular forum and has enabled the

149
researcher to replicate these findings via data triangulation, despite the differences in
the philosophical underpinning of the forums (Martinovich, 2017).
There are also several limitations to the use of the internet for data collection
and the various challenges that this encompasses. Firstly, it must be mentioned that the
very nature of the internet it’s dynamic and every changing reality creates issues as
aspects of texts may be incomplete or have changed since writing this thesis (Burke,
Dehne, Rau-Chaplin, & Robillard, 2017). Additionally, the internet in all its glory has
a unique of issue of hacking; thus, users may have been victim to internet crime at some
point, which must be noted (Moore, Clayton, & Anderson, 2009). This may also pose
issues for data transmission as certain excerpts of text may have been corrupted when
taking the information from the online forums themselves as well as issues with
missing, deleted or edited text within threads (Benfield & Szlemko, 2006).
8.2. Future Directions and Implications
Both phases of the research have exposed some noteworthy questions and ideas
for further research. Firstly, there seems to be a vast amount of knowledge contribution
with regards to the forums. In other words, influential individuals offered more
information to others in forums and shared their knowledge. Indeed, this may be seen
as an aspect of their credibility or a way of gaining recognition as demonstrated in the
qualitative analysis or could merely be a posting opportunity as seen in the quantitative
analysis. However, it is difficult to determine knowledge contribution and the
rationalisation for divulging information in online communities and this research was
unable to do so. Nonetheless, attempts to assess posting frequency and length were
examined; though, future research may want to address this further in conjuncture with
reputation.

150
This thesis has also revealed differences within the two communities LWP and
IU, this was disclosed in both aspects of the empirical research. Equally, the ideological
underpinnings of each of the forums may well have an impact on the different
attachments that are formed and this is an important point to consider for future
research. Whilst there were some similarities in behavioural characteristics, it is
understandable to consider that the forums may evoke different attachment style due to
the ideological polarization. In others words, do influential members of IU have more
bond-based connections to others? This comes from the notion that political beliefs
may indeed form different types of attachments opposed to religion.
Matinovich (2017) posits that Americans have a stronger attachment to their
political parties opposed to other social identifiers due to the voluntary nature of group
affiliation and ‘partysm.’ Building from this, Martinovich’s research was only relevant
to America, which is a relatively homogenous society (Newport, 2017). Though,
results have been consistent with nations such as Belguim, Spain and the United
Kingdom (Westwood et al., 2017), illustrating the importance of “partysm” with
regards to group identification (Greene, 2002; Huddy, Lilliana, & Lene, 2015). Indeed,
different attachment styles were touched upon in this thesis but more investigation into
whether different social identifiers causes different attachments to others needs to be
investigated further.
With regards to implications, this thesis has highlighted numerous ways in
which influentials could potentially be disrupted within online communities. For
example, qualitative exploration has elucidated ways to potentially gain momentum,
which could in fact replace another’s status. Moreover, it has illustrated that anyone
can become influential based on certain behavioural traits. Indeed, security sectors and
government agencies may want to research this particular area further as it has practical

151
implications for government strategy and may help aid policies on counter-terrorism by
undermining credibility in online recruitment forums. This could therefore be
transformed into online-terrorist interventions.
The results may also serve community managers regarding the notion of status
within online communities. It has been illustrated that one does not necessarily need
to be in a position of power to assert some influence over others in online forums.
Principally, for an individual to become influential a community member needs to make
their presence known through highly active communication (posting and thread
starting) on related topics and use certain terminologies and languages that the rest of
the forum are familiar with. Furthermore, this has illustrated ways for community
members to target those that may have the most influence over others which may aid
administrative roles or indeed those looking for social marketing research in
correspondence with the Two-Step Model of Influence (Katz & Larsfield, 1957).
8.3. Conclusions and Knowledge Contributions
This thesis has demonstrated the fluidity of social identities of influentials
within online communities. Equally, this has demonstrated through qualitative enquiry
the cycle that influential individuals embark upon when entering a new online
community and trying to gain some momentum and the transitional process of social
identity and group membership within these communities (Tajfel & Turner, 1972).
This builds upon existing notions of online identities and illustrates how the social
identity approach is especially relevant to influentials and how their self-categorization
is central to their identity and influence over others in online fora (Champniss et al.,
2015; Maden et al., 2007; Vernuccio et al., 2015; Zhang et al., 2010). As such, this
adds knowledge and demonstrates that individuals follow those who actively endorse

152
their social category and even occasionally create prejudice to ‘out-groups’ (Tajfel &
Turner, 1979; Turner, 1982).
There was a clear cycle that influential individuals underwent within these
online communities which provides some valuable contribution towards the literature
regarding how influential individuals subsequently lose their status within communities
(Huffaker, 2010). This is a particularly unique contribution as the use of mixed
methods enabled, not only the identification of individuals, but an in-depth exploration
of the transitional processes of online identities and fluidity of influence over time. This
illustrated online behaviours apparent in the decline of influence.
As exhibited in part two of the analysis (chapter six), individuals often engaged
in repetitive behaviours when their influence was diminishing within their given
communities; while no casual effect can be drawn from this finding it could be a
potential indicator as to why some level of followership was lost. Similarly, individuals
had a decline in online activity within the forum when losing elements of their status;
this was also supported with the qualitative analysis as individuals often remarked at
their lack of activity within the forums towards the end of their community tenure.
Another interesting contribution and finding is the notion that individuals enter
asking questions but ultimately when their influence is diminishing they seem to regress
and once again display a lack of knowledge and begin to ask questions once more. This
is a noteworthy finding with regards to why one may lose their reputation within online
communities and also adds some contribution to the literature on knowledge sharing in
online communities (Childer, 1986; Ventraman; Weimann et al., 2007). Therefore,
gaining attention and asking questions helps individuals find a niche or group within
an online community which had not been publicised with regards to SIT (Tajfel &
Turner, 1979).

153
The narrative analysis also revealed the use of mockery within online
communities which has not yet been widely researched. Evidently, individuals often
engaged in mockery towards higher levels of authority when becoming prominent
members of their online community. In addition to this point, it was seen that when
individuals were losing their followership and admirers, other members often mocked
them. As such, this provides a new line of enquiry for online community research with
regards to influence. This illustrates how strong notions of online identities (and quick
wit) can help sustain some level of credibility (Tajfel & Turner, 1979).
With regards to SIT specifically, the in-depth exploration of social interactions
illustrated how group membership and categorisation is central to the identities of these
influential members (Tajfel & Turner, 1972). More specifically, it has illustrated that
when losing status, they disengage from their groups membership – whilst this cannot
determine causality, it does exemplify the need to have a clear social identity congruent
with the online forum to gain momentum and status. Subsequently, influential
individuals lost this notion of collective-identity when their influence was declining.
Finally, individuals that were seen to be losing their influence in their respected
community also appeared to have separated with elements of their social identity,
therefore, opposing previous research which had seen social identities are fixed (Maden
et al., 2007; Zhang et al., 2010). Consequently, this appears to be a noteworthy
contribution to losing status as well as an important finding with regards to influential
individuals in online communities as they need to have a strong sense of belonging and
collective identity to sustain reputable statuses within online communities, which has
been omitted from online identity literature thus far. As such, the social identity
approach has not occupied a role examining influentials in the existing research, which
this research has contributed.

154
In summary, this research has made the following contribution to literature and
knowledge. Firstly, this research has utilised a mixed methods approach to studying
online identities of influential community members. Therefore, the first empirical stage
identified those influential and then the qualitative phase examined the online
behaviours and characteristics of influential individuals which can distinguish them
from their followers. Moreover, previous research examining the social identity
approach online has often focused on virtual teams, which in nature are task orientated
and purpose-created (Kimble, 2011; Sivunen, 2006; Vahtera, Buckley, Aliyev, Clegg,
& Cross, 2017; Wei-Au, 2010). Therefore, previous research suffers limitations as SIT
and virtual teams appears to be reductionist in the sense that these groups have existing
in-group and out-groups oppositions and existing prejudice (Coupland, 2010; Van De
Mieroop, 2015; Widdecombe, 1998). Yet, this research in comparison, adds to the
theoretical platform by utilising an naturally occurring, longitudinal data for
examination and investigation into the conversation as well as the online identities of
influential users.
8.4. Summary of Key Limitations
The first major limitation to the research is the fact the researcher used
secondary data analysis of existing data for the initial stage of the empirical research.
Equally, the research incorporated a small (but in depth) sample. However, the data
that was used was significant within the data base and the in-depth qualitative analysis
has added some sense of triangulation. Equally, threads opposed to posts were
examined. This was due to numerous time constraints on the research as well as the
issue that posts pose with coherency and loss of context. Furthermore, only two online
communities were utlised in this research. This also acts a limitation to the research in

155
that they were rather different in regards to the philosophical foundations. In other
words, one forum was religious and the other forum was political.
8.5. Summary of Practical Implications
This research has numerous practical implications which are as follows. This
research has highlighted numerous ways in which influentials could potentially be
disrupted within an online community. This has revealed ways in which an online
community member can augment their influence amongst their peers; but, more
importantly, ways in which their following can be diminished which has not yet been
published.
This research could therefore be ulitised within social marketing research, to
illustrate ways in which particular brands could flourish or fail. Additionally, this
research has presented ways to gain influence in online communities which could be
utilised in counter-terrorism policy.
8.6. Summary of Future Recommendations for Research
Future research needs to examine different online communities with different
ideological foundations to assess whether similar findings apply. Equally, this research
did not examine attachment styles of online influentials and other community members
within different online forums, which could be of further interest to researchers in this
area.
Making amends from the limitations of this research, future research should
utilise a larger sample size for mixed methods investigations into online communities.
Finally, research needs to experimentally verify some of the findings from the empirical
chapters. Therefore, research needs to advance the area further by investigating
whether undermining tactics and mockery does indeed reduce influence and credibility
to onlookers in online forums.

156
8.7. Summary of Gaining/Losing Influence in Online Communities
This purpose and unique contribution of this thesis was to illustrate how
individual members gain and lose status within their on line communities. Utilising a
combination of mixed-method on naturally occurring longitudinal data this thesis has
illustrated ways in which one may gain status when joining a new online forum. By
combining the empirical findings, an individual needs to have regular activity (posting
and thread starting) behaviour when joining a new forum. Equally, online users must
attract attention to their potential followership. This as seen in the narrative analysis
can be achieved in a number of ways.
1. Discussing popular topics
2. Undermining/mocking popular individuals
3. Finding a role
In addition, aspiring influentials need to create some intergroup bias via an “in-group”
and “out-group”. Also, techniques apparent in the narrative analysis when individuals
were gaining some status was the use of powerful and emotive language and the
creation of a common goal for the group. Finally, to become an influential online
community member one must identify and self-categorise as a group-member.
Accordingly, this research has also shed light on a newer, more contemporary
issue; how do people lose influence? Indeed, this particular question and research
finding has more real world applicability and a stronger contribution to knowledge.
Whilst some of these may seem obvious, this is the first research to not only
qualitatively explore identification markers of individuals and illustrate how influence
is gained amongst followers, but this research also shows online behaviours when
influentials were losing their status. Therefore, this research has illustrated that there
is a clear decrease in activity when losing influence. This decline is not only with

157
regards to posting and thread-starting behaviour but also with the interactions with
others in the online forum.
In addition, these individual use less convincing language when losing their
status, they ask more unassertive questions, they question the beliefs of the collective-
identity. Equally, they display far less knowledge about current issues and generally
appear uniformed in group matters. Another interesting finding is that individuals who
lose their influential status appear to undermine the effort of the group or the group
goals. In some cases, individuals even begin to question themselves.
Accordingly, there also appears to be a unique findings in that these individuals
tend to get ‘mocked’ or ‘undermined’ by others, and have less witty or quick comebacks
to defend themselves. Finally, and perhaps not surprising, this individuals break from
their once well-establish social identities.

158
CHAPTER NINE
REFLECTION ON MY JOURNEY
If a PhD was a test of shear endurance I would be a sure winner. I have never
had so many ups and down throughout my life than conducting and subsequently trying
to convey meaning from this research. I have reflected in my introductory chapter a
little on each of the various chapters, so this reflection chapter is mainly focused on the
thesis and PhD process as a whole.
When I look back at the idea I started with and the final product – I notice that
these are worlds apart. Equally, I have at times, found it very difficult to let go of my
initial ideas and progress with the research process. However, I feel that having a
supervisor that I have been able to call upon in times of distress has made this process
somewhat easier for me. Moreover, having taken on board comments from the viva, I
must admit I was grateful to see the removal of theory on leadership. Coming from a
social psychology background, social identity is something I am far more fond of and
find more applicable to my research and the world in general, due to my own personal
interests in the topic.
I had found leadership a very broad area and often confusing leadership and
influence had left my research and brain in somewhat of a mental-tangle. I do feel that
incorporating my revised theoretical framework of Social Identity Theory has provided
some much needed clarity to my work. I believe this was what I had initially wanted
to bring out in my qualitative chapter but through various changes and pressures from
external funders, and others interested in my research, my desires and focus point got
lost somewhere along the line. In addition, whilst making amendments, the world
changed, which was unhelpful. The past year has seen a global pandemic due to
COVID-19. This virus closed schools, shops, workplaces and created a new digital era

159
where even older generations had to adapt and seek digital platforms to communicate
with family and friends.
In light of the numerous lockdowns that the UK, in particular has seen, my
progression stopped; thus, my amendments stopped. Therefore, picking up from where
I last left off with amendments and various changes was extremely difficult, especially
whilst home-schooling and occupying my daughter. However, the importance of this
research has come to light and the need for exploration into online communities and
identities is now a prominent issue in light of businesses, individuals, shopping and
school, all entering a new, virtual reality, from which the world may never be the same.
As part of professional practice I have been made aware of the importance of
reflective practice, and as such, I have decided that this chapter is as important as the
research because it documents the research process and acknowledges my journey as a
researcher and illustrates the making of this thesis. My particular journey and learning
curve has encountered numerous obstacles and issues. Not purely based on the
difficulties that PhD students encounter when embarking on this research process, but
myself and my personal circumstance, which has continually been a major bump in the
road.
My learning curve has been extremely difficult, while I was not necessarily
naive in the notion of completing a thesis and all the hard work that would go into this
process, but more, the affect this has on life and family. Whilst still collecting my data
I fell pregnant with my daughter and juggling family life single-handedly and trying to
get a doctorate has been my greatest life challenge thus far. Equally, I did not
completely understand the process of a PhD and how part of this process is the ability
to change direction and adapt; thus, the feeling of losing control and doubting in my
own abilities has been a difficult element to overcome over the past few years.

160
Initially, I had started at an entirely different University, then moved when my
then supervisor and his team got a promotion at a different University. So the thesis
seems to have changed direction many times and taken far longer than projected. Also,
the recent global pandemic has seen many school closures and numerous lockdowns,
which has also effected, not only the way online communities are used now, but
impacted on my ability to do work whilst entertaining and home-schooling my
daughter.
9.1. Literature Review
While I have previously always found literature reviews an enjoyable part of
the research procedure, I have found this one of the most difficult elements. I believe
this was large due to the change in direction, when I changed supervisory teams and
began using influence and leadership interchangeably within the thesis. Equally, as
this had been a funded project there was some pressure from funders as I was expected
to undermining credibility as a main focal point. However, the focal point of this thesis
has since changed from credibility and it was decided that the undermining credibility
experimental element to become a separate paper (which it now is) and removed from
this thesis. As such, I found framing the research was extremely difficult and the work
did seemed to lack some coherence and structure in the literature review.
In other words, at the very beginning of this research, I had planned to have
three parts to this research; a qualitative aspects, MySQL aspect (a fourth generation
database) and finally an experimental chapter where I was to undermine credibility.
However, all the pieces did lack some coherence and in my progress review I was given
some advice to take the final chapter out as it did not seem to “mesh” as well as the
other two aspects. I took this advice, but the main aspect of the research and the bit
that the funders had most wanted, was the experimental chapter. Therefore, the whole

161
focus of my PhD changed as I was no longer trying to frame that last part of the thesis
in my literature review, then my work seemed to get a little more coherent. I was no
longer trying to discuss online communities, influence, leadership and the importance
of undermining credibility (with regards to the experimental chapter). Accordingly,
this then gave me some clarity with regards to the literature search.
Nonetheless, there was also some confusion with regards to incorporating
leadership and beginning to use influence and leadership interchangeably (as some
research has done in my literature review). However, I had frequently struggled with
this, and in complete truth, I never found the literature on leadership to necessarily fit
with my empirical chapters. This was discussed at long length with the examiners and
I did show far less passion and understanding of this broad area in comparison with the
influential literature. Consequently, it was decided to remove leadership from the thesis
– a decision I wholeheartedly supported. Indeed, as mentioned, some other research
does tend to use these two terms (influence and leadership) interchangeably, which is
evident in the literature review and if the authors on the papers that I am discussing
refers to online communities members as leaders, I do so. However, I, myself, the
researcher, have decided to remove this element and focus on influentials – as I am not
entirely certain whether leadership or leader in the managerial sense, occupies a place
in online communities.
When removing leadership from the thesis, there was a clear lack of a theoretical
framework. Another huge obstacle that I encountered. I had been given several
theoretical platforms to explore such as group dynamics, influence or reputation, to
name a few. But, felt that, perhaps due to the nature of online communities, these did
not necessarily inhabit a role either. For example, when exploring group dynamics with
virtual teams, group dynamics proclaims stages of group formation (Bonebright, 2010;

162
Cassidy, 2007; Colombini & McBridge, 2012; Hogg, 1987; Tuckman, 1964; 1965).
Within online communities, there is not necessarily a task; as such, group dynamics did
not necessarily apply to both forums the I examined (not to say all online communities
– just ones that were utilised in this research), more so virtual teams.
Taking the previous notion on board, I noticed that individuals did have a strong
sense of identities within these online communities – something that I had initially
explored but lost amongst the leadership research. As such, a social identity approach
provided a greater understanding on the online identities of influentials – especially
with both communities having strong ideologies. Having come from a social
psychology background – I noticed that this was evident in the qualitative chapters
which had often been overlooked in comparison to the quantitative element of the
thesis. Consequently, Social Identity Theory (SIT; Tajfel & Turner, 1979) does provide
a stronger sense of theoretical clarity and in-depth exploration into online identities of
influentials, which was previously omitted. Therefore, this theoretical clarity
compliments my quantitative chapter as it identifies influentials. These identities of
these influentials are then explored over time and tenure within the community.
Consequently, this thesis appears to advocate the premise that social identities are not
fixed identities and are fluid and can change over time.
9.2. Methodology
With regards to the methodology, there were no huge challenges for me
personally except for the obvious issue with three phases becoming two. As well as
the final phase of empirical research being taken out it was suggested to re-arrange the
two phases. Therefore, what is now known as phase one (SQL and quantitative
research) was in fact originally phase two and vice-versa. However, there was more

163
fluidity to the research changing these two bits around in the empirical chapters and I
fully agreed with the change and felt like it was a good direction for my thesis.
Therefore, I felt slightly more conflicted and struggled to decide whether a
critical realism stance may have been more appropriate for my methodology; however,
my initial journey did start with a qualitative exploration, which gradually expanded
thus, rationalising my choice to adhere to the pragmatic ontology. However, actually
conducting the research did pose many different challenges which I will discuss in the
empirical reflection of this chapter.
I did not gather the role transition data myself, this was secondary data, which
I modified and utilised in my research. It was given to me by my supervisor when I
first embarked upon the PhD and told that it was data which he has been working on
that the funders had wanted to see more of this. This was given to me in a MySQL
database file (known as a dump) and contained records of all the users, posts, threads,
reputation score, reputation power, seniority, number of thanks and whether they were
categorised as a ‘leader’ (which is an influential online community member for the
purpose of this research) over a two year period. I was given a ‘dump’ for each of the
two communities I discussed throughout my thesis.
While I did not gather the meta-data and compile it into a database, the
remaining coding and retrieving of information was entirely designed by myself.
Therefore, I had to learn how to navigate the MySQL database to retrieved the
information and also create my own data tables. This is where I decided that users that
had been classed as ‘leaders’ for two years were then categorised into Group 1 (Always
PP), Group 2 were those that lost status and went to a lesser role (PP Demoted), Group
3 were those that were a lesser role and then promoted to popular status (Promoted PP)
and finally Group 4 those that were popular then became inactive members (PP

164
Inactive). I had to extract these groups and then code then into MySQL to retrieve the
necessary data for the groups and individual users.
I am not particularly computer savvy; however, my first supervisor was.
Therefore, this was something that I had to learn very quickly and recruit friends who
could help in this particular area. I can easily state that learning this fourth generation
language was extremely difficult as it had to be typed perfectly for the commands to
work which I spent many hours pulling my hair out over. Though, I found completing
a coding booklet of the various queries I used and keeping track of my commands was
the easiest way to extract the correct information. Please see below for an example of
some of the commands used throughout the role transition chapter:
For individual data retrieval:
To select threads and word count query used:
select counT(postnum), sum(postwordcount),date_format(time,'%Y%m') as
NewTime from rev_left.all_revleft
WHERE poster LIKE "%Fawkes%" and postnum = 1
GROUP by date_format(time,'%Y%m')
order by date_format(time, '%y%m')
To select by year (With missing numthanks values-1):
select counT(postnum), sum(postwordcount),date_format(time,'%Y'),
sum(numthanks) from rev_left.all_revleft
WHERE poster LIKE "%black magick%" and numthanks != -1
GROUP by date_format(time,'%Y')
order by date_format(time, '%y')
To select group data:
select sum(numthanks), avg(numthanks) from rev_left.all_revleft where
`status` = 5 and numthanks != -1
To select group data for MANOVA:

165
select counT(postnum), sum(postwordcount), date_format(time,'%Y%m') as
NewTime, numthanks from rev_left.all_revleft
WHERE `status` = 5
group by numthanks
order by date_format(time,'%Y%m');
This is an example of some of the various queries that were used to collect the
information that was then transferred onto SPSS for analysis. I also feel especially
proud when I look at this chapter as before this I had regarded myself as a qualitative
researcher; thus, I really left my comfort zone and pushed myself with the various
models and statistical analyses for this aspect of the empirical research which I am now
most pleased with.
Accordingly, the second phase of the research was something that I thoroughly
enjoyed which I think is evident in my writing. While sometimes I do have a tendency
to over-interpret, years of completing qualitative projects have in some ways managed
to limit my tendency to do this. Equally, I had two online communities to improve my
interpretations as Left Wing Politics6 (LWP) and Islamic United (IU) did have similar
findings, which provides, to some extent, qualitative rigor to my analysis and
interpretations. Furthermore, all interpretations and analysis has been checked via
numerous researchers involved in the thesis as part of my doctoral team to improve the
credibility of the findings.
In addition to the latter point, I always use Braun and Clarke’s (2006)
framework when collecting and gathering data for qualitative analysis. Despite the
analysis being labeled narrative analysis (discussed later), I feel that this framework
documents well the entirety of the qualitative process. Also, as narrative analysis is a
rather flexible process, including a thematic edge does provide some consistency and
6 Pseudonyms for the communities

166
improves the audit trail of my research. Essentially, this involved reading all the threads
and corresponding comments on threads of specific individuals (16 used for qualitative
analysis) and copying and pasting any interesting threads onto a word document. Each
words document was the reviewed and coded accordingly, making notes where
applicable. Once all the online community members had been examined, I go through
each users’ and make a tally chart of all the comments to observe emerging themes, the
most prominent tallies then become the themes. Indeed, this almost quantifiable way
of doing thematic analysis enabled me to see my emerging themes more clearly and
removes any elements of bias that I, as the researcher, may have had.
I have always found qualitative research extremely rewarding and enjoyable. I
had struggled with various difficulties in respect to which analysis I was actually doing
in the beginning. Having previously toyed with the idea of doing standard thematic
analysis I then decided that it was more a narrative analysis as a lot of the existent
literature on online communities seemed to be following the thematic guideline but
denoting that it was narrative due to the online nature; as such, I followed suit. Equally,
this method of analysis appeared to allow more depth into language used which made
it more appropriate for online community research and enabled me to examine the
context of the conversations between users.
9.3.Study One - Quantitative Examination of Role Transitions
The role transition chapter was initially only conducted on the 16 users that were
discussed in the qualitative chapter. I then decided that seen as I had the data available,
to examine this in further detail. Therefore, global community statistics were examined
and I then categorised the users into the four groups as previously mentioned for further
analysis. This was to improve the reliability and generalisability of the research. In
doing this, I found myself finding further elements to examine and decided to conduct

167
further analysis into social network analysis and then went onto to various models for
the data. Equally, I then cross-compared any differences between the two communities
as I felt this was a fitting end to the chapter as they were constantly compared.
Similarly, I also felt that this improved the research as the qualitative aspect only
focused on threads (and subsequent posts or comments) but this examined a large
amount of data to validate my research and findings and identified influential members
to explore in further depth.
Although the database was secondary data which had already been time sliced
to illustrated various different roles, I feel that educating myself on this database and
subsequently determining my own categories for analysis meant that I have achieved a
good understanding of the data and thus, this diminishes some of the issues around
utilising secondary data. However, while the data for the role transition was indeed
secondary data, the second phase of the research was collected and analysed by myself.
Moreover, the role transitions only examined individuals that move over a two-
year period. However, the global statistics examined the entire community lifespan up
until the data was collected. I thought it would improve the scientific rigor of my
research to include both of these aspects; therefore, improving the validation of this
phase of the research. Therefore, the main aim of this chapter is to identify influentials
over time. Then, the qualitative chapter can explore online identities and the
transitional process of becoming influential in far more depth. This adds knowledge to
SIT (Tajfel & Turner, 1979) by examining the identities of those influential individuals,
and exploring how their group membership and social category is embedded in their
influential status (and loss of status).

168
9.4. Study Two – Narrative Analysis of Influential Individuals
Phase two of the research was the qualitative aspect, which as discussed was
collected and analysed via narrative analysis but with a strong thematic edge. This
particular chapter underwent numerous difficulties and adjustments throughout the PhD
journey. Firstly, I had only intended to examine those that rose to influential status at
the beginning of my PhD journey but as I investigated further it seemed fitting to
analyse the flip side of gaining influence; losing status. Furthermore, this appeared to
be a caveat in the literature and the tactic that had the most real world applicability.
Accordingly, I included another four users from each community that had
subsequently lost their influence amongst their followers and been demoted to a lesser
role. As such, each community then had eight users (16 in total) four that rose to status
and four that lost status. Initially, these had been segregated into community chapters
but then merged together into the chapters they are at present; rising to status and losing
status.
I do feel that in some parts there is some repetition to the chapters having them
as a rise to status and lose status chapters accordingly; however, this does improve the
dependability of the research as findings do seem to be consistent in parts across the
communities (despite the very different philosophical underpinnings). While there is
some repetition it does show a similar journey that individuals embark on when entering
a forum and gaining some momentum. However, any repetition from the ‘gaining
status’ chapter that I had included in the ‘losing status’ chapter was removed as it had
been described as ‘confusing’ in parts.
Whilst the first phase only shows time-sliced data from the 16 individual users
over a two-year period, the second phase of the research illustrates their entire
community lifespan to substantiate any claims that were made throughout the various

169
analyses. This does form some verification for the findings derived much like data
triangulation. Equally, examining the entire community lifespan provides a dialog and
an essence of communication that may have been lost without qualitative exploration
throughout the whole lifespan. This also allowed me to exemplify how the language,
interactions and social identities changed over the course of time.
Furthermore, as previously mentioned, despite the qualitative analysis only
utilising threads from users, posts were also examined when necessary, as a form of
member checking or cross validation and all corresponding information such as
comments were examined with each thread to illustrate the naturally occurring
conversations in the online environment. In addition to this point, the first phase of the
research examined all different behaviours; thus, providing a holistic image of each of
the different community members that were examined in both aspects of the research.
Therefore, while this may seem like a limitation it was the most viable way to extract
information from a substantial amount of data from each of the forums; also, posts can
often be deleted thus omitting crucial dialog. This chapter is rather long; therefore, I
decided to create a summary table (at the advice of others) to illustrate the main findings
and elucidate the narrative of the theoretical framework, which is most applicable to
this chapter in particular.
9.5. Discussion
The discussion was one of the hardest PhD challenges to overcome. I believe
that at some point I developed what is known as writers block. This is the inability to
write anything and I suffered with constant ‘mind-blank’. Usually, I find discussions
quite enjoyable as they are an opportunity to document the limitations you have found
but also the main analytical contributions that the research has made. However, I
believe that my daughter hit the ‘terrible twos’ phase by the time I got round to
170
completing this chapter which had an impact on my ability to work and concentrate for
long periods of time.
Having initially thought that juggling all my commitments would be a doddle
this chapter was the chance to finally pull together all the work that I had done but I
struggled greatly to see the thesis as a whole piece of work and unite it in this chapter
to complete a full draft. To overcome this I had to go to boot camp where I was once
again told to stop doubting myself and begin to piece together the thesis and ‘just type’.
Whilst I have been careful to prevent over-interpretations, I do think that it
should be noted that my socio-economic status would have had some influence of my
interpretation of the data. I do not hold any political views and have always maintained
that I do not advocate any political stance, which may have both helped and hindered
my research. Indeed, someone who identifies with a political group may have
interpreted the findings and threads that I examined differently. In addition, I do not
practice the pillars of Islamic faith. Similarly, I do not speak Arabic but have often
asked those who are fluent in Arabic to cross check and validate my interpretations that
I have translated. I feel that having this neutrality allowed me to remain relatively bias
free (as much as possible) and try and see the themes and data as they were intended
(though obviously I cannot be certain of this).
To establish trustworthiness in this research it is vital to convey the ways in
which I; as a researcher, may have influenced this investigation. Indeed, while it is
impossible to remain completely bias free, it is possible to control my existing
preconceptions on this matter. As such, my aim throughout this particular chapter was
to demonstrate continuous reflexivity and self-scrutiny through the recognition of my
role within this investigation, which may have inadvertently influenced the research
process and explain any choices that I made with regards to this thesis which may seem

171
unusual to those whom have not been actively involved in the research process.
Without this documentation, the trustworthiness of the present report cannot be
ascertained.

172
References
Agarwal, N., Liu, H., Tang, L., & Yu, P. S. (2008). Identifying the influential
bloggers in a community. Proceedings of the International Conference on
Web Search and Web Data Mining, Palo Alto, CA: USA.
Agichtein, E., Castillo, C., Donato, D., Gionus, A., & Mishne, S. (2008). Finding
high-quality content in social media with an application to community-based
question answering. Proceedings of WSDM, Retrieved from
http://www.mathcs.emory.edu/~egugene/papers/wsdm2008quality.pdf
Akbas, G. (2010). Social identity and intergroup relations: The case of Alevis and
Sunnis in Amasya. Middle East Technical University, September.
Anger, I., & Kittl, C. (2011). Measuring influence on Twitter. ACM WSDM , Hong
Kong, China.
Antaki, C., Billig, M., Edwards, D., & Potter, J. (2002). Discourse analysis means
doing analysis: A critique of six analytical shortcomings. Discourse Analysis
Online, 1(1), 1-24.
Aral, S., Dellarocas, C., & Godes, D. (2013). Introduction to the special issue—
social media and business transformation: A framework for research.
Information Systems Research, 24(1), 3–13.
Arroyo, D. (2010). Discovering sets of key players in social networks. In A.
Abraham, A-E. Hassanien., & V. Snasel, (Eds.), Computational Social
Networks Analysis, Trends, Tools and Research Advances (pp. 27-49).
London, England: Springer.
Avolio, B. J. (2005). Leadership development in balance. Mahwah, NJ: Lawrence
Erlbaum Associates.
Back, K. W. (1951). Influence through social communication. Journal of Abnormal
and Social Psychology, 46, 9–23.
Bakshy, E., Hofman, J. M., Manson, W. A., & Watts, D. J. (2011). Everyone’s an
influencer: Quantifying influence on twitter. WSDM, Hong Kong, China.
Balthazard, P. A., Waldman, D. A., & Warren, J. E. (2009). Predictors of the

173
emergence of transformational leadership in virtual decision teams. The
Leadership Quarterly, 20, 651–663.
Bateman, P. J., Gray, P. H., & Butler, B. S. (2011). Research note-the impact of
community commitment on participation in online communities. Information
Systems Research, 22(4), 841-854.
Bavel, J. J. V., Baicker, K., Boggio, P. S., Capraro, V., Cichocka, A., Cikara, M., et
al. (2020). Using social and behavioural science to support COVID-19
pandemic response. Nature Human Behaviour, 4(5), 460–471.
Baxter, P., & Jack, S. (2008). Qualitative case study methodology: Study design and
implementation for novice researchers. The Qualitative Report, 13(4), 544-
559.
Baym, N. (2000). Tune in, log on: Soaps, fandom, and online community. Thousand
Oaks, CA: Sage.
Beaulieu, A., & Estalella, A. (2012). ‘Rethinking research ethics for mediated settings.’
Information, Communication & Society,15, 23-42.
Becker, H. S. (1960). Notes on the Concept of Commitment. American Journal of
Sociology, 66, 58-60.
Benfield, J. A., & Szlemko, W. J. (2006). Internet-based data collection: Promises
and realities. Journal of Research Practice, 2(1), 1 – 15.
Berne-Manera, C., & Marzo-Navarro, M. (2020). Exploring how influencers and
relationship marketing serve corporate sustainability. Sustainability, 12, 1-19.
Billig, M. (2004). Methodological and scholarship in understanding ideological
explanations. In C. Seale (Ed.), Social research methods (pp. 13-19).
London, England: Routledge.
Billig, M., & Tajfel, H. (1973). Social categorization and similarity in intergroup
behaviour. European Journal of Social Psychology, 3(1), 27–52.
Blaikie, N. (2009). Designing social research. Cambridge, England: Policy Press.

174
Bliuc A., McGarthy, C., Thomas, E. F., et al. (2015). Public divisions about climate
change rooted in conflicting socio-political identities. Nature Climate Change,
5, 226-229.
Bliuc, A., Betts., Vergani, M., Iqbal., M., & Dunn, K. (2019). Collective identity
change in far-right online communities: The role of intergroup conflict. New
Media & Society, 21(1):DOI:10.1177/1461444819831779
Bonacich, P., & Schneider, S. (1992). Communication networks and collective action.
In W. B. G. Liebrand, D. M. Messick., & H. A. M. Wilke (Eds.), Social
dilemmas: Theoretical issues and research findings (pp. 225-245). New York,
NY: Permagon.
Bonebright, D. (2010). 40 years of storming: A historical review of Tuckman’s
model of small group development. Human Resource Development
International, 13(1), 111-120.
Booth, A., & Babchuk, N. (1972). Informal medical opinion leadership among the
middle aged and elderly. Public Opinion Quarterly, 36(1), 87-94.
Braun, V., & Carke, V. (2006). Using thematic analysis in psychology. Qualitative
Research in Psychology, 3, 77-101.
British Psychological Society (2008). Code of ethics and conduct. Leicester,
England: BPS.
Bryant, S. L., Forte, A., & Bruckman, A. (2005). Becoming wikipedian:
Transformation of participation in a collaborative online encyclopedia, ACM
GROUP, 11-20.
Bryman, A. (1989). Research methods and organizational studies. New York, NY:
Routledge.
Burke, M., & Kraut, R. (2008). Taking up the mop: Identifying future wikipedia
administrators. Proceedings of 26th Annual ACM Conference on Human
Factors in Computing Systems, 3441-3446.

175
Burke, N., Dehne, F., Rau-Chaplin, A., & Robillard, D. (2017). Quantifying eventual
consistency for aggregate queries. International Database Engineering &
Applications Symposium, ACM, 274-282.
Burns, J. M. (1978). Leadership. New York, NY: Harper & Row.
Butler, B., Joyce, E., & Pike, J. (2008). Don’t look now, but we’ve created a
bureaucracy: The nature and roles of policies and rules in Wikipedia.
Proceedings of 26th Annual ACM Conference on Human Factors in
Computing Systems, 2008, 1101-1110.
Butler, B., Sproull, S. Kiesler., & Kraut, R. (2002). Community effort in online
groups: Who does the work and why? Leadership at a Distance, 11, 171-194.
Cabrera, Á., Collins, W., & Salgado, J. (2006). Determinants of individual
engagement in knowledge sharing. The International Journal of Human
Resource Management, 17(2), 245-264.
Casaló, L. V., Flavián, C., & Guinalíu, M. (2008). The role of satisfaction and
website usability in developing customer loyalty and positive word‐of‐mouth
in the e‐banking services. International Journal of Bank Marketing, 26(6),
399-417.
Cassell, J., Huffaker, D., & Tversky, D. (2005). How to win a world election:
Emergent leadership in an international online community. In P. van den
Besselaar, G. De Michelis, J. Preece, & C. Simone (Eds.), Communities and
Technologies (pp. 149-169). Boston, MA/Dordrecht: Routledge.
Cassell, J., Huffaker, D., Tversky, D., & Ferriman, K. (2006). The language of online
leadership: Gender and youth engagement on the Internet. Developmental
Psychology 42(3), 436-449.
Cassell, C., & Symon, G. (2004). Essential guide to qualitative methods in
organisational research. London, England: Sage.
Cassidy, K. (2007). Tuckman revisited: Proposing a new model of group
development for practitioners. Journal of Experimental Education, 29(3),
413-417.

176
Cha, M., Haddadi, H., Benevenuto, F., & Gummadi, K. P. (2010). Measuring user
influence in Twitter: The million follower fallacy. ACM WSDM, 10-17.
Chen, C. J., & Hung, S. W. (2010). To give or to receive? Factors influencing
members’ knowledge sharing and community promotion in professional
virtual communities. Information and Management, 47(4), 226–236.
Childers, T. (1986). Assessment of the psychometric properties of an opinion
leadership scale. Journal of Marketing Research, 184-188.
Chiu, C. M., Hsu, M. H., & Wang, E. T. G. (2006). Understanding knowledge-sharing
in virtual communities: An integration of social capital and social cognitive
theories. Decision Support Systems, 42(3), 1872-1888.
Choi, W., & Stvilia, B. (2015). Web credibility assessment: conceptualization,
operationalization, variability, and models. Journal of the Association for
Information Science and Technology, 66(12), 2399-2414.
Code, J. R., & Zaparyniuk, N. E. (2007). Social identities, group formation and the
analysis of online communities. In S Hatzipanagos, & S. Warburton
(Eds.), Handbook of Research on Social Software and Developing
Community Ontologies (pp. 86-10). New York, NY: Information Science
Reference.
Colombini, C. B., & McBride, M. (2012). ‘Storming and norming’: Exploring the
value of group development models in addressing conflict in communal
writing assessment. Assessing Writing, 17(4), 191-207.
Coolican, H. (2009). Research methods and statistics in psychology. Oxford,
England: University Press.
Corbetta, P. (2003). Social research: Theory, methods and techniques. London,
England: Sage.
Coupland, N. (2010). ‘Other’ representations. In J. Jaspers, J. Verschueren, & J.-O.
Ostmen (Eds.), Society and Language Use (pp. 241-260). Amsterdam: John
Benjamins.

177
Creswell, J. W. (1998). Qualitative inquiry and research design: Choosing among
five traditions. Thousand Oaks, CA: Sage Publications.
Creswell, J. W. (2002). Educational research: Planning, conducting, and evaluating
quantitative and qualitative approaches to research. Upper Saddle River, NJ:
Merrill/Pearson Education.
Creswell, J. W. (2003). Research design: Qualitative, quantitative, and mixed
methods approaches (2nd ed.). Thousand Oaks, CA: Sage Publications.
Creswell, J. W., Plano Clark, V. L., Guttman, M., & Hanson, W. (2003). Advanced
mixed methods research designs. In A. Tashakkori, & C. Teddlie (Eds.),
Handbook on mixed methods in the behavioral and social sciences (pp. 209-
240). Thousand Oaks, CA: Sage Publications.
Crotty, M. (2003). The foundations for social research: Meaning and perspective in
the research process. London, England: Sage.
Danesi, M. (2013). Encyclopedia of Media and Communication. Toronto, Canada:
University of Toronto Press.
Dasgupta, N. (2004). Implicit ingroup favouritism, outgroup favouritism, and their
behavioural manifestations. Social Justice Research, 17(2), 143-168.
Davidson, B., Joinson, A., Jones, S., & Hinds, J. (2018, May). Social role evolution of
an ideological online community. Poster session presented at First
International Conference on Behavioural and Social Sciences in Security.
Lancaster, England.
Davis, R. (1999). The web of politics: The internet’s impact on the American political
system. New York, NY: Oxford University Press.
De Vos, A. S. (1998). Research at grass root. Academic: J.L. van Schaik.
Denscombe, M. (2009). The good research guide: For small-scale social research
projects. Berkshire, England: Open University Press.
Denzin, N. K. (1978). The Research Act: A theoretical introduction to sociological
methods. New York, NY: McGraw-Hill.

178
Doolan, D. M., & Froelicher, E. S. (2009). Using an existing data set to answer
new research questions: A methodological review. Research and Theory for
Nursing Practice: An International Journal, 23, 203-215.
Doumit, G., Grimshaw, J., Graham, I., Smith, A., & Wright, F. (2006). Opinion
leaders: Effectiveness, identification, stability, specificity, and mechanism of
action. Master Thesis. University of Ottawa; Ottawa, Canada.
Downe-Wamboldt, B. (1992). Content analysis: Methods, applications, and issues.
Health Care Women International, 13, 313–321.
Duan, L., & Zhu, G. (2020). Psychological interventions for people affected by the
COVID-19 epidemic. The Lancet Psychiatry, 7(4), 300–302.
Earp, J. L., Eng, E., O’Malley, M. S., Altpeter, M., Rauscher, G., Mayne, L, …
Qaqish, B. (2002). Increasing use of mammography among older, rural
African American women: Results from a community trial. American Journal
of Public Health, 82, 646–654.
Eagly, A. H., Johannesen-Schmidt, M. C., & van Engen, M. L. (2003).
Transformational, transactional, and laissez-faire leadership styles: A meta-
analysis comparing women and men. Psychological Bulletin, 129(4), 569-
591.
Ebner, M., Holzinger, A., & Catarci, T. (2005). Lurking: An underestimated human-
computer phenomenon. IEEE Multimedia 12(4), 70 – 75.
Edwards, G. (2011). Concept of community: A framework for contextualizing
distributed leadership. International Journal of Management Review, 13,
301-312.
Eisner, E. W. (1991). The enlightened eye: Qualitative inquiry and the enhancement
of educational practice. New York, NY: Macmillan.
Elmer, T., Mepham, K., & Stadtfeld, C. (2020). Students under lockdown:
Comparisons of students’ social networks and mental health before and during
the COVID-19 crisis in Switzerland. PLoS ONE 15(7): e0236337.
DOI.org/10.1371/journal.pone.0236337

179
Everett, J. A. C., Faber, N. S., & Crockett, M. (2015). Preferences and beliefs in
ingroup favoristism. Front Behavioural Neuroscience, 9-15.
Eysenbach, G., & Köhler, C. (2002). How do consumers search for and appraise
health information on the world wide web? Qualitative study using focus
groups, usability tests, and in-depth interviews. British Medical Journal,
324, 573-577.
Fan, Y-W., Wu, C-C., & Chiang, C-C. (2009). Knowledge sharing in virtual
community: The comparison between contributors and lurkers. The 9th
international conference on electronic business. Retrieved from,
http://iceb.nccu.edu.tw/proceedings/2009/661- 668.pdf
Fisher, D., M. Smith, H., & Welser, T. (2006). You are who you talk to: Detecting
roles in Usenet newsgroups. Internet Conferences Systems Science Los
Alamitos, CA: IEEE Computer Society Press.
Flanagin, A. J. (2007). Commercial markets as communication markets: Uncertainty
reduction through mediated information exchange in online auctions. New
Media Society, 9(3) 401–423.
Flavián, C., Gurrea, R., & Orús, C. The effect of product presentation mode on the
perceived content and continent quality of web sites. Online Information
Review, 33, 1103-1128.
Fleming, L., D., & Waguespack, M. (2007). Brokerage, boundary span- ning, and
leadership in open innovation communities. Organation Science, 18(2), 165–
180.
Flodgren, G. I., Parmelli, E., Doumit, G., Gattellari, M., O’Brian, M. A., Grimshaw,
J., & Eccles, M. P. (2011). Local opinion leaders: Effects on professional
practice and health care outcomes. Cochrane Database System Review, 10(8)
DOI: 10.1002/14651858.CD000125.pub4.
Fogg, B. J. (2003). Persuasive technology: Using computers to change what we think
and do. San Francisco, CA: Morgan Kaufmann Publishers.

180
Fogg, B. J., Soohoo, C., Danielson, D. R., Marable, L., Stanford, J., & Tauber, E. R.
(2003). How do users evaluate the credibility of Web sites?: A study with over
2,500 participants. Designing for User Experiences, 1-15.
Fried, E. I., Papanikolaou, F., & Epskamp, S. (2020). Mental Health and Social
Contact During the COVID-19 Pandemic: An Ecological Momentary
Assessment Study; 2020.
Gagich, M., & Zickel, E. (2017). A guide to rhetorical, genre, and success in first-
year writing. Cleveland State: University Press.
Gangadharbatla, M. (2009). Individual differences in social networking site adoption.
In C. Rom-Livermore & K. Setzekorn (Eds.), Social networking communities
and e-dating services: Concepts and implications (pp. 1-17). Information
Science Reference/IGI Global. http://doi.org/10.4018/978-1-60566-104-
9.ch001
Gass, R. H., & Seiter, J. S. (1999). Persuasion, social influence, and compliance
gaining. New York, NY: Allyn and Bacon Press.
Gbrich, C. (2007). Qualitative Data Analysis: An Introduction (1st edn). London,
England: Sage Publications.
Germalto (2019). Infographic: The number of internet users by 2020. Retrieved on
6th January, from, https://www.gemalto.com/review/Pages/infographic-the-
number-of-internet-users-by-2020.aspx
Gilwa, B., & Zygmunt, A. (2015). Finding influential bloggers. International
Journal of Machine Learning and Computing, 5(2), 127-131.
Gladwell, M. (2002). The tipping point: How little things can make a big difference.
New York, NY: Brown.
Glantz, S. (2000). The Internet: A credible source? Bookreport, 19(2), 40–41.
Gleibs, I. H., & Haslam, A. S. (2016). Do we want a fighter? The influence of group
status and the stability of intergroup relations on leader prototypicality and
endorsement. The Leadership Quarterly, 27(4), 557-573.
Global Internet Statictics. (2018). Internet statistics & facts for 2018. Retrieved on
18th December 2018, from, https://metapress.com/internet-statistics/

181
Godes, D., & Mayzlin, D. (2004). Using online conversations to measure word of
mouth communication. Marketing Science, 23(4) 545–560.
Goldsmith, R. E. (2004). The Influentials: One American in ten tells the other nine
how to vote, where to Eat, and what to Buy. Journal of Product & Brand
Management, 13(5), 371-372.
Goyal, A., Bonchi, F., & Lakshmanan, L. V. (2010). Learning influence probabilities
in social networks. WSMD, 4-6. doi: 10.1145/1718487.1718518
Greenburg, B., & Miller, G. (1966). The effects if low-credible source on message
acceptance. Speech Monographs, 33(2), 127-136.
Greene, J. C. (2007). Mixed methods in social inquiry. San Francisco, CA: John
Wiley & Sons.
Greene, S. (2002). The social-psychological measurement of partisanship. Political
Behavior, 24(3), 171–97.
Greer, L. L., & Jehn, K. A. (2009). Follow me: Strategies used by emergent leaders
in virtual organizations. International Journal of Leadership Studies, 5(1), 3-
21.
Grewal, R., Mehta, R., & Kardes, F. R. (2000). The role of the social-identity
function of attitudes in consumer innovativeness and opinion leadership.
Journal of Economic Psychology, 21(3), 233-252.
Grix, J. (2004). The foundations of research. London, England: Palgrave MacMillan.
Gronn, P. (2002). Distributed leadership as a unit of analysis. Leadership Quarterly,
13, 423–451.
Gulanoski, D. (2018). The role of online discussion forums in newcomers’ labour
market integration in Canada (Unpublished doctoral dissertation). Carleton
University Ottawa, Ontario.
Guldbrandsson, K., Nordvik, M. K., & Bremberg, S. (2012). Identification of
potential opinion leaders in child health promotion in Sweden using network
analysis. British Medical Centre Research Notes, 5(424).
doi.org/10.1186/1756-0500-5-424.

182
Hajli, M., Sims, J., Featherman, M., & Love, P. (2014). Credibility of information in
online communities. Journal of Strategic Marketing, 23(3), 238- 253.
Han, J. Y., Hou, J., Kim, E., & Gustafson, D. H. (2013). Lurking as an active
participation process: A longitudinal investigation of engagement with an
online cancer support group. Health Communication, 29(9), 911-923.
Haslam, N., Bastian, B., Bain, P., et al. (2006). Psychological essentialism, implicit
theories, and intergroup relations. Group Processes & Intergroup Relations, 9,
63-76.
Haslam, S. A., & Platow, M. J. (2001). The link between leadership and
followership: How affirming social identity translates vision into action.
Personality and Social Psychology Bulletin, 27, 1469-1479.
Haslam, S. A., Platow, M. J., Turner, J. C., Reynolds, K. J., McGarty, C., Oakes, P.
J., … Veenstra, K. (2001). Social identity and the romance of leadership: The
importance of being seen to be ‘doing it for us’. Group Processes and
Intergroup Relations, 4, 191-205.
Haslam, S. A., Reicher, S. D., & Levine, M. (2012). When other people are heaven,
when other people are hell: How social identity determines the nature and
impact of social support In J. Jetten, C. Haslam, & S.A. Haslam (Eds.), The
social cure: Identity, health, and well-being (pp. 157-174). New York, NY:
Psychology Press.
Haslam, S. A., Reicher, S. D., & Platow, M. J. (2011). The new psychology of
leadership: Identity, influence and power. London, England: Psychology
Press.
Hass, R. G. (1981). Effective of source characteristics on cognitive responses and
Persuasion. In R. E. Petty., T. M. Ostrom., & T. C. Brock (Eds.), Cognitive
respobses in persuasion (pp. 141-172). Hillsdale, NJ: Erlbaum.
Heiman, G. W. (2001). Understanding research methods and statistics: An
integrated introduction for psychology. Boston, MA: Houghton Mifflin.
183
Heiman, G. W., & Harper, R. (1999). Research methods in psychology. Boston, MA:
Houghton Mifflin.
Henn, M., Weinstein, M., & Foard, N. (2006). A short introduction to social
research. London, England: Sage Publications.
Hiller, H. H., & DiLuzio, L. (2004). The participant and the research interview:
Analysing a neglected dimension in research. The Canadian Review of
Sociology and Anthropology, 41, 1-26.
Hilligoss, B., & Rieh, S.Y. (2008). Developing a unifying framework of credibility
assessment: Construct, heuristics, and interaction in context. Information
Process Management, 44(4), 1467-1484.
Hogg, M. A. (2001). Social categorization, de- personalization, and group behavior.
In M. A. Hogg, & S. Tinsdale (Eds.), Blackwell handbook of social
psychology: Group processes (pp. 57- 85). Malden, MA: Blackwell.
Hogg, M. A., & Abrams, D. (1999). Social identity and social cognition: Historical
background and current trends. In D. Abrams, & M. A. Hogg (Eds.), Social
identity and social cognition (pp. 1–25). Oxford, England: Blackwell.
Hogg, M. A., & Reid, S. A. (2006) Social Identity, Self-Categorization, and the
Communication of Group Norms. Communication Theory, 16, 7-30.
Hogg, M. A., Terry. D., White, K. M. (1995). A tale of two theories: A critical
comparison of identity theory with social identity theory. Social Psychology
Quarterly, 58(4), 255-269.
Hogg, M. A., & van Knippenberg, D. (2003). Social identity and leadership
processes in groups. In M. P. Zanna (Ed.), Advances in Experimental Social
Psychology (pp. 1-52). New York, NY: Academic Press.
Holmes, J. (2006). Workplace narratives, professional identity and relational
practice. In A. De Fina, D. Schiffrin, & M. Bamberg (Eds.), Discourse and
Identity (pp. 166–187). Cambridge, England: University Press.

184
Holtz, P., Kronberger, N., & Wagner, W. (2012). Analyzing Internet forums: A
practical guide. Journal of Media Psychology Theories Methods and
Applications, 24(2), 1206-1212.
Honey, C., & Herring, S. C. (2009). Beyond microblogging: Conversation and
collaboration via Twitter. System Sciences, HICSS '09, 42nd Hawaii
International Conference, IEEE, January 2009, 1–10.
Hong, T. (2006a). Contributing factors to the use of health-related websites. Journal
of Health Communication, 11, 149-165.
Hong, T. (2006b). The influence of structural and message features on Web site
credibility. Journal of the American Society for Information Science and
Technology, 57, 114-127. doi:10.1002/asi.20258
Horrigan, J., & Rainie, L. (2006). When facing a tough decision, 60 million
Americans now seek the Internet’s help: the Internet’s growing role in life’s
major moments. Retrieved on 7th June 2014, from,
http://pewresearch.org/obdeck/?ObDeckID=19
Hosking, D. M. (1988). Organising, leadership and skillful process. Journal of
Management Studies, 25,147– 166.
Hovland, C. I., Janis, I. L., & Kelley, J. J. (1953). Communication and Persuasion.
New Haven, CT: Yale University Press.
Huddy, L., Lilliana, L., & Lene, A. (2015). Expressive partisanship: Campaign
involvement, political emotion, and partisan identity. American Political
Science Review, 109(1), 1–17.
Huffaker, D. (2010). Dimensions of leadership and social influence in online
communities. Human Communication Research, 36, 593–617.
Hughes, J. A (1990). The philosophy of social research. New York, NY: Longman.
Hung, S. Y., & Chang, C. M. (2005). User acceptance of WAP services: Test of
competing theories. Computer Standards & Interface, 27, 359–370.

185
Hsu, C. I., & Lu, H. P. (2004). Why do people play on-line games? An extended
TAM with social influences and flow experience. Information &
Management, 41(7), 853–868.
Hsu, M., Ju, T. L., Yen, C., & Chang, C. (2007). Knowledge sharing behaviour in
virtual communities: The relationship between trust, self-efficacy, and
outcome expectations. International Journal of Human-Computer Studies, 65,
153–169.
Jameson, J. (2009). Distributed Leadership, Trust and Online Communities. In A.
A. Ozok, & P. Zaphiris (Eds.), Online Communities & Social Computing
(pp.226-235). Berlin / Heidelberg: Springer.
Jansen, B. J., & Resnick, M. (2006). An examination of searcher's perceptions of
nonsponsored and sponsored links during ecommerce Web searching. Journal
of the American Society for Information Science and Technology, 57(14),
1949-1961.
Jansen,, H. J., & Koop, R. (2005). Pundits, ideologues, and ranters: The British
Columbia election online. Canadian Journal of Communication, 30, 613-632.
Jansson, J., Nordlund, A., & Westin, K. (2017). Examining drivers of sustainable
consumption: The influence of norms and opinion leadership on electric
vehicle adoption in Sweden. Journal of Cleaner Production, 154, 176-187.
Janzik, L., & Herstatt, L. (2008) Innovation communities: Motivation and incentives
for community members to contribute. IEEE International Conference on
Management of Innovation and Technology, 1–3(3), 350–355.
Jenkins, R. (2004). Social identity. London, England: Routledge Press.
Jimenez, A., Boehe, D. M., Taras, V., & Caprar, D. V. (2017). Working across
boundaries: Current and future perspective on virtual teams. Journal of
International Management, 23(4), DOI: 10.1016(i)intman.2017.05.001.
Johnson, S. L., Safadi, H., & Faraj, S. (2015). The emergence of online community
leadership. Information Systems Research, 26(1)

186
doi.org/10.1287/isre.2014.0562.
Johnston, M. P. (2014). Secondary data analysis: A method of which the time has
come. Qualitative and Quantitative Methods in Library, 3, 619-626.
Joinson, A., & Dove, J. (n.d.). Identifying online influential in ideological virtual
communities. Human Computer Interaction.
Jungnickel, K. (2018). New methods of measuring opinion leadership: A systematic,
interdisciplinary literature analysis. Internation Journal of Communication,
2702-2724.
Kang, R., Brown, S., & Kiesler, S. (2013). Why do people seek anonymity on the
Internet? Informing policy and design. ACM Conference on Human Factors
on Computer Systems. New York, NY: ACM Press.
Kankanhalli, A., Tan, B.C.Y., & Kwok-Kee, W. (2005). Contributing knowledge to
electronic knowledge repositories: An empirical investigation. MIS Quarterly,
29, 113–43.
Karau, S., & Williams, K. (1993). Social loafing: A meta-analytic review and
theoretical integration. Journal of Personality and Social Psychology, 65(4)
681–706.
Katz, E., & Lazarsfeld, P. F. (1957). The two-step flow of communication: An up-to-
date report on an hypothesis. Public Opinion Quarterly, 21, 61-78.
Kelly, C. (1993). Group identification, intergroup perception and collective action.
European Review of Social Psychology, 4, 59–83.
Kelly, J. A., St. Lawrence, J. S., Diaz, Y.E., Stevenson, L.Y., Hauth, A.C., Brasfield,
T. L.,… Andrew, M. E. (1991). HIV risk behavior reduction following
intervention with key opinion leaders of population: An experimental analysis.
American Journal of Public Health, 81(2), 168–171.

187
Khalifa, M., Yu, Y. A., & Shen, K. (2008). Knowledge management systems success:
A contingency perspective. Journal of Knowledge Management, 12(1), 119–
132.
Khodabandeh, A., & Lindh, C. (2020). The importance of brands, commitment, and
influencers on purchase intent and the context of online relationships.
Australasian Marketing Journal, 29(2), DOI:101016/j.ausmj.2020.03.003
Kim, J. W., Choi, J., Qualls, W., & Han, K. (2010). It takes a marketplace
community to raise brand commitment: The role of online communities.
Journal of Marketing Management, 24(3-4), 409-431.
Kim, S. (2010). Questioners' credibility judgments of answers in a social question and
answer site. Information Research, 15(2), 6-61.
Kimble, C. (2011). Building effective virtual teams: How to overcome the problems
of trust and identity in virtual teams. Global Business and Organizational
Excellence, 30(2), 6-15.
Kimble, C., Li, F., & Barlow, A. (2000). Effective virtual teams through communities
of practice. Strathclyde, UK: University of Strathclyde.
King, G. R., Keohane, O., & Verba, S. (1999). Designing social inquiry: Scientific
Inference in Qualitative Research. Princeton, NJ: University Press.
Kitchin, H. A. (2003). The Tri-Council Policy Statement and research in cyberspace:
Research ethics, the Internet, and revising a ‘living document’. Journal of
Academic Ethics, 1(4), 397–418.
Kittur, A., & Kraut, R. E. (2008). Harnessing the wisdom of crowds in wikipedia:
Quality through coordination. ACM Conference. New York, NY: ACM
Press.
Kitzinger, J. (1994). The methodology of focus groups: The importance of
interactions between research participants. Sociology of Heath, 16(1), 103-
121.

188
Kitzinger, J. (1995). Introducing focus groups. British Medical Journal, 311, 299-
302.
van Kleef, G. A., Steinel, W., van Knippenberg, D., & Hogg, M. A. & Svensson, A.
(2007). Group member prototypicality and intergroup negotiation: How one's
standing in the group affects negotiation behavior. The British Journal of
Social Psychology, 46, 129-152.
van Knippenberg, D., & Hogg, M. A. (2003). A social identity model of leadership
effectiveness in organizations. Research in Organizational Behavior, 25,
243-295.
Koh, J., Kim, Y.-G., Butler, B., & Bock, G.-W. (2007). Encouraging participation in
virtual communities. Communications of the ACM, 50(2), 69-73.
Kolbe, M., & Boos, M. (2009). Facilitating group decision-making: Facilitator
subjective theories on group coordination. Qualitative Social Research, 10,
http://nbh-resolving.de/urn:nbn:de:0114-fqs0901287
Korolov, M. (2011). Virtual world usage accelerates. Hypergrid Business, Retrieved
on 12th October, 2013, from,
http://www.hypergridbusiness.com/2011/07/virtual-world-usage-
accelerates/
Korstjens, I., & Moser, A. (2018). Series: Practical guidance to qualitative research.
Part 4: Trustworthiness and publishing. European Journal of General
Practice, 24(1), 120-124.
Knox, S., & Burkard, A. (2009). Qualitative research interviews. Psychotherapy
Research, 19(4-5), 566-575.
Kraut, R. E., Olson, J., Banaji, M., Bruckman, A., Cohen, J., & Couper, M. (2004).
Psychological research online: Report of Board of Scientific Affairs' Advisory
Group on the Conduct of Research on the Internet. American Psychologist,
59(2), 105–117.
Kraut, R. E., & Resnick, P. (2011). Building Successful Online Communities:
Evidence-Based Social Design. Cambridge, UK: MIT Press.

189
Krefting, L. (1990). Rigor in qualitative research: The assessment of trustworthiness.
American Journal of Occupational Therapy, 45(3), 214-222.
Kwak, H., Lee, C., Park, H., & Moon, S. (2010). What is Twiter, a social network or a
news media? ACM WSDM, 591-600. doi:10.1145/1772690.1772751
Kwon, Y-S., & Song, H. R. (2015). The role of opinion leaders in influencing
consumers behaviors with a focus on market mavens: A meta-analysis.
Athens Journal of Mass Media and Communications, 1(1), 43-54.
Labov, W. (2006). Narrative pre‐construction. Narrative Inquiry, 16(1), 37–45.
Lakhani, K.C., & E. von Hippel. (2003). How open source software works: ‘Free’
user-to-user assistance. Research Policy, 32, 923–43.
Lahman, M. K. E., Rodriguez, K. L., Moses, L., Griffen, K. M., Mendoza, B. M., &
Yacoub, W. (2015). A rose by any other name is still a rose? Problematizing
pseudonyms in research. Qualitative Inquiry, 21(5), 445-453.
Langdridge, D. (2004). Introduction to research methods and data analysis in
psychology. London, England: Pearson Education Ltd.
Lapidot-Lefler, N., & Barak, A. (2015). The benign online disinhibition effect: Could
situational fctors induce self-disclosure and prosocial behaviours? Journal of
Psychosocial Research on Cyberspace, 9(2), 1-19.
Lee, A. (2010). Who Are the Opinion Leaders? The Physicians, Pharmacists, Patients,
and Direct-to-Consumer Prescription Drug Advertising. Journal of Health
Communication, 15(6), 629-655.
Li, X., Hess, T. J., & Valacich, J. S. (2008). Why do we trust new technology? A
study of initial trust formation with organizational information systems. The
Journal of Strategic Information Systems, 17(1), 39-71.
Lin, H.-F. (2008). Determinants of successful virtual communities: Contributions
from system characteristics and social factors. Information & Management,
45(8), 522-527.

190
Lin, H.-F., & Lee, G.-G. (2006). Determinants of success for online communities: An
empirical study. Behaviour & Information Technology, 25(6), 479–488.
Liu, Z. M., & Huang, X. B. (2005). Evaluating the credibility of scholarly information
on the web: A cross cultural study. International Information & Library
Review, 37(2), 99-106.
Lockwood, E. M. (2014). You’re not alone: virtual communities, online relationships
and modern identities in the Military Spouse Blogging Community
(unpublished doctoral dissertation). London School of Economics and
Political Science, England.
Lomas, J., Enkin, M., Anderson, G. M,, Hannah, W. J., Vayda, E., & Singer, J.
(1991). Opinion leaders vs audit and feedback to implement practice
guidelines: delivery after previous cesarean section. JAMA, 265, 2202–2207.
Lord, R. G., Brown, D. J., & Harvey, J. L. (2001). System constraints on leadership
perceptions, behavior and influence: An example of connectionist level
processes. In M. A. Hogg, & R. S. Tindale (Eds.), Blackwell handbook of
social psychology: Group processes (pp. 283–310). Oxford, England:
Blackwell.
Ma, M., & Agarwal, R. (2007). Through a glass darkly: Information technology
design, identity verification, and knowledge contribution in technology-
mediated communities. Information Systems Research, 18(1) 42–67.
Macià, M., & Garcia, I. (2016). Informal online communities and networks as a
source of teacher professional development: A review. Teaching and
Teacher Education, 55, 291-307.
Mack, N., Woodsong, C., MacQueen, K. M., Guest, G., & Namey, E. (2005).
Qualitative research methods: A data collector’s guide. North Carolina, NC:
Family Health International.
Malik, S. H., & Coulson, N. S. (2013). Coming to terms with permanent involuntary
childlessness: A phenomenological analysis of bulletin board postings.
Europe’s Journal of Psychology, 91(1), 77-92.

191
Markham, A. N., & Buchanan, E. (2012). Ethical decision-making and Internet
research 2.0: Recommendations from the AoIR ethics working committee.
Retrieved on 11th May, 2020, from www.aoir.org/reports/ethics2.pdf
Martin, A. (2020). Coronavirus : People spending record numer of amount of time
online during lockdown. Retrieved on 2nd May, 2021, from, Coronavirus:
People spending record amount of time online during lockdown | Science &
Tech News | Sky News
Martinez-Torres, M. R., & Diaz-Fernandez, M.C. (2014). Current issues and research
trends on open source software communities. Technology Analysis and
Strategic Management 26(1), 55-68.
Martinovich, M. (2017). Americans’ partisan identities are stronger than race and
ethnicity, Stanford scholar finds. Retrieved on 4th December, from,
https://news.stanford.edu/2017/08/31/political-party-identities-stronger-race-
religion/
Maxwell, J. A. (2005). Qualitative Research Design: An Interactive Approach (2nd
ed.). Thousand Oaks, CA: Sage.
McCarthy, N. (2020). Covid-19’s staggering impact on global education. Retrieved
on 14th May, 2021, from http://www.statista.com/chart/21224/learners-
impacted-by-national-school-closures/
Metzger, M. J., & Flanagin, A. J. (2013). Credibility and trust of information in
online environments: The use of cognitive heuristics Journal of
Pragmatics, 59, 210-220.
Metzger, M. J., & Hall, E. (2005). Understanding how Internet users make sense of
credibility: A review of the state of our knowledge and recommendations for
theory, policy and practice. Internet Credibility and the User Symposium,
Seattle, WA: American Library Association’s Office for Information
Technology Policy.
van Mierlo, T. (2014). The 1% rule in four digital health social networks: An
observational study. Journal of Medical Internet Research, 16(2),e33.
doi: 10.2196/jmir.2966

192
Milburn, M. A. (1991). Persuasion and politics: The social psychology of public
opinion. USA: Brooks/Cole Publishing.
Moore, T., Clayton, R., & Anderson, R. (2009). The economics of online crime.
Journal of Economic Perspectives, 23(3), 3-20.
Morgan, D. L. (1993). Qualitative content analysis: A guide to paths not taken.
Qualitative Health Research, 3, 112–121.
Morgan, D L. (2000). Paradigms lost and pragmatism regained: Methodological
implications of combining qualitative and quantitative methods. Journal of
Mixed Methods Research, 1(1), 48-76.
Motl, R. W., Dishman, R. K., Saunders, R. P., Dowda, M., Felton, G., Ward, D. S., &
Pate, R. R. (2002). Examining social-cognitive determinants of intention and
physical activity among black and white adolescent girls using structural
equation modeling. Health Psychology, 21(5), 459-476.
Murphy, J. P. (1990). Pragmatism: From Pierce to Davidson. Boulder, CO:
Westview Press.
Myneni, S., Fujimoto, K., Cobb, N., & Cohen, T. (2015). Content-driven analysis of
an online community for smoking cessation: Integration of qualitative
techniques, automated text analysis, and affiliation networks. American
Journal of Public Health, 105(6), 1206-1212.
Nahapiet, J., & Ghoshal, S. (1998). Social capital, intellectual capital, and the
organizational advantage. Academy of Management Review, 23(2), 242-266.
Nonnecke, B., & Preece, J. (2000). Lurker demographics: Counting the silent.
Human Factors in Computing Systems. New York, NY.
Nonnecke, B., & Preece, J. (2001). Why lurkers lurk. Paper presented at the Americas
Conference on Information Systems, Boston, MA.
O’Keefe, D. J. (2002). Persuasion theory and research (2nd ed.). London, England:
Sage Publications.

193
Obst, P., Zinkiewicz, L., & Smith, S. G. (2002). Sense of community in science
fiction fandom, Part 1: Understanding sense of community in an international
community of interest. Journal of Community Psychology, 30(1), 87-103.
Opdenakker, R. (2006). Advantages and disadvantages of four interview techniques
in qualitative research. Forum: Qualitative Research, 7(4). doi:
http://dx.doi.org/10.17169/fqs-7.4.175
Othmani, L., & Bouslama, N. (2015). Perceived Quality of a Virtual Community and
Its Components: An Exploratory Investigation. Journal of Internet Social
Networking & Virtual Communities. doi: 10.5171/2015. 888628
Pakhtusova, N. A. (2019). Online identity in modern research. Social & Behavioural
Science, 623–629.
Patton, M. Q. (1999). Enhancing the quality and credibility of qualitative analysis.
Health Services Research, 34(5), 1189-1208.
Pavlou, P. A., & Fygenson, M. (2006). Understanding and predicting electronic
commerce adoption: An extension of the theory of planned behavior. MIS
Quarterly, 30(1), 115- 143.
Pegg, K. L., O’Donnell, A. W., Lala, G., & Barber, B.L. (2018). The role of online
social identity in the relationship between alcohol-related content on social
networking sites and adolescent alcohol use. Cyberpsychology , Behavior and
Social Networking, 21(1), 50-55.
Pennebaker, J. W., Mehl, M. R., & Niederhoffer, K.G. (2003). Psychological aspects
of natural language use: Our words, our selves. Annual Review of
Psychology, 54, 547-577.
Pittinsky, M. (1999). Campus and course portals in 2015 Converge. Retrieved 6th
February, 2001, from,
http://www.convergemag.com/Publications/CNVGOct99/Possibilities/
Possibilities.shtm

194
Pittinsky, M. (2003). The wired tower: Perspectives on the impact of the Internet in
higher education. New York, NY: Perason Education.
Platow, M. J., & van Knippenberg, D. (1999). The impact of leaders’ ingroup
prototypicality and normative fairness on leadership endorsements in an
intergroup context. Paper presented at the XII General Meeting of the
European Association of Experimental Social Psychology, Oxford, England.
Pope, C., & Mays, N. (2006). Qualitative research in health care. Oxford, England:
Blackwell Publishing.
Postmes, T., & Spears, R. (2000). Refining the cognitive redefinition of the group:
Deindividuation effects in common bond vs. common identity groups. In T.
Postmes, R. Spears, M. Lea, & S. Reicher (Eds.), SIDE effects centre stage:
Recent developments in studies of de-individuation in groups (pp. 63–78).
Amsterdam, the Netherlands: KNAW.
Postmes, T., Spears, R., & Lea. M. (2000). The formation of group norms in
computer-mediated communication. Human Communication Research, 26(3),
341–371.
Preece, J. (2001). Sociability and usability in online communities: Determining and
measuring success. Behaviour & Information Technology, 20(5), 347–356.
Preece, J., Maloney-Krichmar, D., & Abras, C. (2003). History of online
communities. In K. Christensen, & D. Levinson (Eds.), Encyclopedia of
Community: From Village to Virtual World (pp. 1023-1027). Thousand
Oaks, CA: Sage Publications.
Preece, J., & Shneiderman, B. (2009). The Reader-to-Leader Framework: Motivating
technology-mediated social participation. AIS Transactions on Human-
Computer Interaction, 1(1), 13-32.
Prentice, D. A., Miller, D. T., & Lightdale, J. R. (1994). Asymmetries in attachments
to groups and to their members: Distinguishing between common-identity and
common-bond groups. Personality and Social Psychology Bulletin, 20, 484–
493.

195
Prigg, M. (2015). Facebook hits one billion users in a single day: Mark Zuckerberg
reveals one in seven people on earth user’s social network on Monday.
Retrieved on 8th December 2017, from,
https://www.dailymail.co.uk/sciencetech/article-3213456/Facebook-s-billion-
user-day-Mark-Zuckerberg-reveals-one-seven-people-EARTH-used-social-
network-Monday.html
Protalinski, E. (2012). In Facebook. Retrieved on 12th January 2012, from,
https://thenextweb.com/facebook/2014/01/29/facebook-passes-1-23-billion-
monthly-active-users-945-million-mobile-users-757-million-daily-users/
Reicher, S. D., Haslam, S. A., & Hopkins, N. (2005). Social identity and the dynamics
of leadership: Leaders and followers as collaborative agents in the
transformation of social reality. Leadership Quarterly, 16, 547–568.
Reicher, S. D., Hopkins, N., Levine, M., & Rath, R. (2005). Entrepreneurs of hate and
entrepreneurs of solidarity: Social identity as a basis for communication.
International Review of Red Cross, 87, 621-637.
Reih, S. Y. (2002). Judgment of information quality and cognitive authority in the
Web. Journal of the American Soceity for Information Science and
Technology, 53(2), 145-161.
Ren, Y., R. Kraut, S. Kiesler. (2007). Applying common identity and bond theory to
design of online communities. Organational Studies, 28(3) 377–408.
Rheingold, H. (2000). The virtual community: Homesteading on the electronic
frontier. London, UK; MIT Press.
Ridings, C. M., Gefen, D., & Arinze, B. (2002). Some antecedents and effects of
trust in virtual communities. Journal of Strategic Information Systems, 11(3&4),
271-295.
Rieken, G., & Yavas, U. (1983). Internal consistency reliability of King Summers’
opinion leadership scale: Further evidence. Journal of Marketing Research,
20, 325-326.

196
Rier, D. A. (2007). Internet social support groups as moral agents: The ethical
dynamics of HIV+ status disclosure. Sociology of Health & Illness, 29(7),
1043–1058.
Rogers, E. M. (1962). Diffusion of Innovations. New York, NY: Free Press.
Sarathy, P., & Patro, S. (2013). The Role of Opinion Leaders in High-Involvement
Purchases: An Empirical Investigation. South Asian Journal of Management,
20(2), 11-53.
Schafer, M., & Taddicken, M. (2015). Mediatized opinion leaders: New patterns of
opinion leadership in new media environments? International Journal of
Communication, 9, 960-981.
Schneider, A., von Krogh, G., & Jager, P. (2013). What’s Coming Next? Epistemic
Curiosity and Lurking Behavior in Online Communities. Computers in
Human Behavior 29(1), 293-303.
Schwammlein, E., Wodzicki, K. (2012). What to tell about me? Self-presentation in
online communities. Journal of Computer Mediated Communication, 17, 387-
407.
Scoble, R., & Israel, S. (2007). Naked conversation: How Blogs are changing the
way businesses talk with customers. Journal of Product Innovation
Management 24(6), 632-633.
Seyranian, V. (2014). Social identity framing communication strategies for social
change. The Leadership Quarterly, 25, 468-486.
Sherer, P. D., Shea, T. P., & Kristensen, E. (2003). Online communities of practice:
A datalyst for Faculty development. Innovative Higher Education, 27(3), 183-
194.
Sigura, L., Wiles, R., & Pope, C. (2017). Ethical challenges in online research:
Public/private perceptions. Research Ethics, 13(3-4), 184-199.
Sims, J., Powell, P., & Vidgen, R. (2013, January). Identifying E-learning capabilities

197
and competences. Conference: Proceedings of the 18th UK Academy of
Information Systems Conference. Oxford University, Oxford.
Sivunen, A. (2006). Strengthening the identification with the team in virtual teams:
The leader’s perspective. Group Decisions and Negotiation, 15, 345-366.
Smith, B., & Sparkes, A. C. (2008). Changing bodies, changing narratives and the
consequences of tellability: A case study of becoming disabled through sport.
Sociology of Health & Illness, 30(2), 217–236
Smith, R. H., Coats, S., & Walling, D. (1999). Overlapping mental representations of
self, in-group and partner: Further response time evidence and a connectionist
model. Personality and Social Psychology Bulleting, 25, 873-882.
Snow, D. A., Rochford Jr, E. B., Worden, S. K., & Benford, R. D. (1986). Frame
alignment processes, micromobilization, and movement participation.
American Sociological Review, 464-481.
Somech, A. (2006). The Effects of leadership style and team process on performance
and innovation in functionally heterogeneous teams. Journal of Management,
32(1), 132-157.
Soumerai, S. B., McLaughlin, T. J., Gurwitz, J. H., Guadagnoli,E., Hauptman, P. J.,
Borbas, C., … Gobel, F. (1998). Effect of local medical opinion leaders on
quality of care for acute myocardial infarction. The Journal of the American
Medical Association, 279(17), 1358-1363. :
South-Winter, C., Dai, W., & Porter, J. A. (2015). Health care in Ghana: A study of
health care opinion leadership. Journal of Nursing and Health Care, 3(1),
79-87.
Statista (2018). Facebook users worldwide in 2018. Retrieved on 11th July 2018,
from, https://www.statista.com/statistics/264810/number-of-monthly-active-
facebook-users-worldwide/

198
Steffens, N. K., Haslam, S. A., & Reicher, S. D. (2014). Up close and personal:
Evidence that shared social identity is a basis for the ‘special’ relationship that
binds followers to leaders. The Leadership Quarterly, 25, 296-313.
Steffens, N. K., Haslam, S. A., Reicher, S. D., Platow, M. J., Fransen, K., Yang, J.,
Jetten, J., Ryan, M. K., Peters, K. O., & Boen, F. (2014). Leadership as social
identity management: Introducing the Identity Leadership Inventory (ILI) to
assess and validate a four-dimensional model. The Leadership Quarterly, 25,
1004–1025.
Steffens, N. K., Schuh, S. C., Haslam, S. A., Pérez, A., & van Dick, R. (2015). ‘Of the
group’ and ‘for the group’: How followership is shaped by leaders'
prototypicality and group identification. European Journal of Social
Psychology, 45, 180–190.
Stets, J., & Burke, P. J. (2000). Identity theory and social identity theory. Social
Psychology Quarterly, 63(3), 224-237.
Stryker, S., & Burke, P. J. (2000). The past, present, and future of an identity theory.
Social Psychology Quarterly, 63, 284-297.
Sun, N., Rau, P-L., & Ma, L. (2014). Understanding lurkers in online communities:
A literature review. Computers in Human Behavior, 38, 110-117.
Sundar, S. S. (1999). Exploring receivers’ criteria for perception of print and online
news. Journalism and Mass Communication Quarterly, 76(2), 373-386.
Sunstein, C. (2001). Republic.com. Princeton, NJ: University Press.
Sutherland, N. (2018). Investigating leadership ethnographically: Opportunities and
potentialities. Leadership, 14(3), 263-290.
Sutherland, N., Land, C., & Böhm, S. (2014). Anti-leaders(hip) in the social
movement organizations: The case of autonomous grassroot groups.
Organization, 21(6), 759-781.
Tajfel, H. (1974). Social identity and intergroup behaviour. International Social
Science Council, 13(2), 65-93.

199
Tajfel, H., & Turner, J. C. (1979). An integrative theory of intergroup conflict. In W.
G. Austin & S. Worchel (Eds.), The social psychology of intergroup relations
(pp. 33-47). Monterey, CA: Brooks/Cole.
Tashakkori, A., & Teddlie, C. (1998). Mixed methodology: Combining qualitative
and quantitative approaches. Thousand Oaks, CA: Sage Publications.
Tedjamulia, S., Olsen, D., Dean, D., & Albrecht, C. (2005). Motivating Content
Contributions to Online Communities: Toward a More Comprehensive
Theory. Proceedings of the 38th Hawaii International Conference on System
Sciences, USA, 1503-1605. doi: 10.1109/HICSS.2005.444
Teo, H. H., Chan, H. C., Wei, K. K., & Zhang, Z. (2003). Evaluating information
accessibility and community adaptivity features for sustaining virtual learning
communities. International Journal of Human-Computer Studies, 59(5), 671-
697.
Troldahl, V. C., & van Dam, R. (1965). Face-to-face communication about major
topics in the news. Public Opinion Quarterly, 29(4), 626–634.
Tuckman, B. W. (1964). Personal structure, group composition, and group functioning.
Siociometry, 27(4), 469-487.
Tuckman, B. W. (1965). Developmental sequence in small groups. Psychological
Bulletin, 65(6), 384-399.
Turkle, S. (1999). Cyberspace and identity. Contemporary Sociology, 28(6), 643-548.
Turner, J. C. (1975). Social comparison and social identity: Some prospects for
intergroup behaviour. European Journal of Social Psychology, 5(1), 1-34.
Turner, J. C. (1985). Social categorization and the self-concept: A social cognitive
theory of group behavior. In E. J. Lawler (Ed.), Advances in group processes:
Theory and research (pp. 77–122). Greenwich, CT: JAI.
Turner, J. C. & Reynolds, K. J. (2001). The social identity perspective in intergroup
relations: Theories, themes and controversies. In R. Brown & S. Gaertner

200
(Eds.), Handbook of social psychology: Vol. 4: Intergroup processes (pp. 133–
152). Oxford, UK and Cambridge, USA: Blackwell.
Utz, S. (2000). Social information processing in MUDs: The development of
friendships in virtual worlds. Journal of Online Behavior, 1. Retrieved 7th
October, 2014, from, http://www.behavior.net/JOB/v1n1/utz.html
Utz, S. (2003). Social identification and interpersonal attraction in MUDs .Swiss
Journal of Psychology, 62(2), 91–101.
Utz, S., & Sassenberg, K. (2002). Distributive justice in common-bond and common-
identity groups. Group Processes & Intergroup Relations, 5(2), 151-162.
Utz, S., Tanis, M., & I. E. Vermeulen. (2012). It is all about being popular: The
effects of need for popularity on social network site use. Cyberpsychology,
Behavior, and Social Networking, 15(1), 37-42.
vBulletin. (2019). Overview. Retrieved on 11th January, from,
https://www.vbulletin.com/en/overview/
Vahtera, P., Buckley, P. J., Aliyev, M., Clegg, J. L., & Cross, A. (2017). Influence of
social identity on negative perception in global virtual teams. Journal of
International Management, 23(4), 367-381.
Valente, T., & Pumpuang, P. (2007). Identifying opinion leaders to promote behavior
change, Health Education Behaviour, 34(6), 881– 896.
Van De Mieroop, D. (2015). Social identity theory and the discourse analysis of
collective identity in narratives. In Georgakopoulou, A., & Anna, D. F.
(Eds.), Handbook of Narrative Analysis (pp. 408-428). Longdon, England:
Wiley Blackwell.
Venkatraman, M. P. (1990). Opinion leadership, enduring involvement and
characteristics of opinion leaders: A moderating or mediating relationship.
Advances in Consumer Research, 17, 60-67.

201
Vernuccio, M., Pagani, M., Barbarossa, C., & Pastore, A. (2015). Antecedents of
brand love in online network-based communities: A social identity perspective.
Journal of Product & Brand Management, 24(7), 706-719.
Vishwanath, A. (2011). The Effect of the Number of Opinion Seekers and Leaders on
Technology Attitudes and Choices. Human Communication Research, 34(7),
295-370.
Wagner, W. G., Pfeffer, J., & O’Reilly, C. A. (1984). Organizational demography
and turnover in top-management groups. Administrative Science Quarterly
29(1), 1 -74.
Watts, D. J. (1999). Networks, dynamics, and the small-world phenomenon.
American Journal of Sociology, 105(2) 493–527.
Watts, D. J., & Dodds, P. (2007). Influentials, networks, and public opinion
formation. Journal of Consumer Research, 34(4), 441–458.
Widdicombe, S. (1998). Identity as an analysist’ and participants’ resource. In C.
Antaki, & S. Widdicombe (Eds), Identities in talk (pp. 191-206). London,
England: Sage Publications.
Weber, M. (1948). The sociology of charismatic authority. In H. H. Gerth, & C. W.
Milles (Eds), Max Weber: Essays in sociology (p. 245-252). New York, NY:
Oxford University Press.
Wei-Au, Y. (2010). Identity and conflict in virtual teams: A social identity approach.
Scotland, Edinburgh: Eriot-Watt University.
Weimann, G. (1991). The influentials: Back to the concept of opinion leaders? Public
Opinion Quarterly, 55(2), 267–279.
Weimann, G. (1994). The influentials: People who influence people. New York, NY:
State University of New York Press.

202
Weimann, G., Tustin, D. H., van Vuuren, D., & Joubert, J. P. R. (2007). Looking for
opinion leaders: Traditional vs. Modern measures in traditional societies.
International Journal of Public Opinion Research, 19(1-2), 173-190.
doi.org/10.1093/ijpor/edm005.
Wellman, B. (2001). Physical place and cyber–place: The rise of networked
Individualism. International Journal for Urban and Regional Research, 25,
227–252.
Wellman, B., & Gulia, M. (1999). Virtual communities as communities’ net surfers `
don't ride alone. In M. A. Smith, & P. Kollock (Eds.), Communities in
cyberspace (pp. 167-194). New York, NY: Routledge.
Weng, J., Lim, E.-P., Jiang, J., & He, Q. (2010). TwitterRank: Finding topic-sensitive
influential twitterers. ACM WSDM, 261-270. doi: 10.1145/1718487.1718520
Wesler, H. T., Gleave, E., Fisher, D., & Smith, S. (2007). Visualizing the signatures
of social roles in online discussion groups. Journal of Social Structure, 9(2),
1- 32.
Westwood, S. J., Iyengar, S., Walgave, S., Leonisio, R., Miller, L., & Strijis, O.
(2017). The tie that divides: Cross-national evidence of the primacy of
partyism. European Journal of Political Research, 57(2), 333-354.
Wickham, K., & Walther, J. B. (2007). Perceived behaviors of emergent and assigned
leaders in virtual groups. International Journal of E-Collaboration, 3(1), 1-
17.
William, R. F., & Duvel, G. H. (2005). The nature and determinants of opinion
leadership in Lesotho. South African Journal of Agricultural Extension, 34(2),
259-277.
Wilhelm, G. (2000). Democracy in the digital age: Political life in cyberspace. New
York, NY: Routledge.
Willig, C. (2010). Introducing qualitative research in psychology (2nd ed.). Berkshire,
England: Open University Press.
Wood, M. (2005). The Fallacy of misplaced leadership. Journal of Management
Studies, 42(6), 1101-1121.

203
Wynn, E., & Katz, J. E. (1997). Hyperbole over Cyberspace: Self-Presentation and
Social Boundaries in Internet Home Pages and Discourse. The Information
Society, 13(4), 297- 327.
Yin, R. (2003). Case study research: Design and methods. Thousand Oaks, CA: Sage
Publications.
Yoo, Y., & Alavi, M. (2004). Emergent leadership in virtual teams: what do
emergent leaders do? Information and Organization, 14(1), 27-58.
Young, A. L., Komlodi, A., Rózsa, G., & Chu, P. (2016). Evaluating the credibility of
English web sources as a foreign‐language searcher. Proceedings of the
Association for Information Science and Technology, 53(1), 1-9.
Yukl, G. (1999). An evaluation of conceptual weaknesses in transformational and
charismatic leadership theories. The Leadership Quarterly, 10(2), 285-305.
Yukl, G. (2010). Leadership in organizations. Upper Saddle River, NJ: Pearson
Education.
Zhang, S., Jiang, H., & Carroll, J. M. (2010). Social identity in Facebook community
life. International Journal of Virtual Communities and Social Networking,
2(4), 66-78.
Zhang, X., & Dong, D. (2008). Ways of identifying the opinion leaders in virtual
communities. International Journal of Business and Management, 21-27.
Zhang, Z. (2010). Feeling the sense of community in social networking usage. IEEE
Transactions on Engineering Management, 57(2), 225-239.
Zhao, K., Yen, J., Greer, G., Qiu, B., Mitra, P., & Portier, K., (2014). Finding
influential users of online health communities: A new metric based on
sentiment influence. Journal of the American Medical Informatics
Association, 21(e2), e212–e218.
Zhou, T. (2011). Examining the critical success factors of mobile website adoption.
Online Information Review, 35(4), 636-652.

204
Zhu, H., Kraut, R., & Kittur, A. (2012). Effectiveness of shared leadership in online
communities. Proceedings of the ACM 2012 Conference on Computer
Supported Cooperative Work, 407-416.

205
APPENDICES
Appendix 1: Ethical Approval
RESTRICTED ACESS

206
Appendix 2: MySQL Queries
FOR INDIVIDUAL DATA
TO SELECT THREADS AND W/C
select counT(postnum), sum(postwordcount),date_format(time,'%Y%m') as
NewTime from rev_left.all_revleft
WHERE poster LIKE "%Fawkes%" and postnum = 1
GROUP by date_format(time,'%Y%m')
order by date_format(time, '%y%m')
TO SELECT BY YEAR (WITH MISSING NUMTHANKS VALUES -1)
select counT(postnum), sum(postwordcount),date_format(time,'%Y'),
sum(numthanks) from rev_left.all_revleft
WHERE poster LIKE "%black magick%" and numthanks != -1
GROUP by date_format(time,'%Y')
order by date_format(time, '%y')
TO SELECT BY YEAR - NUMTHANKS, W/C , POST TOTAL
select counT(postnum), sum(postwordcount),date_format(time,'%Y'),
sum(numthanks) from rev_left.all_revleft
WHERE poster LIKE "%black magick%"
GROUP by date_format(time,'%Y')
order by date_format(time, '%y')
TO SELECT GROUP DATA STUFF
select sum(numthanks), avg(numthanks) from rev_left.all_revleft where `status` = 5
and numthanks != -1
TO SELECT GROUP DATA MANOVA
select counT(postnum), sum(postwordcount), date_format(time,'%Y%m') as
NewTime, numthanks from rev_left.all_revleft
WHERE `status` = 5
group by numthanks
order by date_format(time,'%Y%m');
select seniority, reputation from rev_left.all_revleft
where `status` = 1

207
group by poster
order by poster
QUERY FOR MANOVA SPSS:
SELECT poster, seniority, sum(postwordcount), reputation, sum(numthanks)
FROM `rev_left`.`all_revleft` where `status` = 3 and numthanks != -1
group by poster
QUERY FOR CREATING COLUMN
SELECT
*
FROM
roles_timeliced.rl_roles_timesliced
where
`id` in ( select `poster` from rev_left.all_revleft )
;
UPDATE
rev_left.all_revleft
SET
`status` = 10
WHERE
poster like '%Barry Lyndon%' ;
QUERY FOR DATABASE
select
poster,
counT(postnum) as numberOfPosts,
sum(postwordcount) as wordcount,
date_format(time,'%Y-%m'),
sum(numthanks > 0),
sum(postnum=1) as threads,
sum( IF( postnum = 1, postwordcount, 0 ) ) as threadwordcount
from
rev_left.all_revleft
Where
date_format(time,'%Y-%m') > '2009-11'
and

208
`status` = 1
GROUP by date_format(time,'%Y-%m-%d')
order by poster
QUERY FOR MULTI-LEVEL MODELS SPSS
select count(postnum), reputation, poster, sum( IF( postnum = 1, postnum, 0 ) ) as
threadwordcount, sum(numthanks > 0) from rev_left.all_revleft
Where
date_format(time,'%Y-%m') > '2009-11'
and
`status` = 1
group by poster
order by poster

209
Appendix 3: Sample of SPSS Output for Phase One
MANOVA & MLM LWP
Between-Subjects Factors
Value Label N
Group Status 1 Always PP 43
2 PP - Another Role 29
3 PP - Inactive 19
4 Promoted - PP 16
Descriptive Statistics
Group Status Mean Std. Deviation N
Total Number of Posts Always PP 4077.40 2400.971 43
PP - Another Role 2088.48 2656.973 29
PP - Inactive 3800.58 5530.725 19
Promoted - PP 2288.19 2639.625 16
Total 3221.64 3342.033 107
Word Count for Posts Always PP 249215.93 222554.996 43
PP - Another Role 96116.79 93926.351 29
PP - Inactive 197185.32 366635.303 19
Promoted - PP 96044.94 132860.645 16
Total 175578.62 228572.949 107
Reputation Always PP 3705.33 2369.196 43
PP - Another Role 1032.72 831.390 29
PP - Inactive 767.58 2714.287 19
Promoted - PP 520.75 547.214 16
Total 1983.12 2395.415 107
Number fo Thanks Received Always PP 1468.56 1148.123 43
PP - Another Role 324.10 285.366 29
PP - Inactive 468.89 531.710 19
Promoted - PP 446.31 320.123 16
Total 828.01 941.988 107
Thread Word Count Always PP 12369.81 13413.554 43
PP - Another Role 5714.55 8145.960 29
PP - Inactive 14464.89 22003.684 19
Promoted - PP 5373.56 6895.209 16

210
Total 9891.91 13851.267 107
Thread Count Always PP 60.79 66.206 43
PP - Another Role 24.90 27.817 29
PP - Inactive 49.63 60.390 19
Promoted - PP 26.94 36.450 16
Total 44.02 54.884 107
av_numthanks Always PP 3.9824 3.44720 43
PP - Another Role 10.1248 18.33318 29
PP - Inactive 22.3714 44.01906 19
Promoted - PP 11.2603 23.30610 16
Total 10.0008 23.27579 107
Average Thread Word Count Always PP 252.1730 269.97332 43
PP - Another Role 345.5033 854.85891 29
PP - Inactive 277.4852 236.35806 19
Promoted - PP 313.9647 522.35140 16
Total 291.2027 521.10508 107
Average Post Word Count Always PP 62.6250 42.98549 43
PP - Another Role 55.4558 35.84885 29
PP - Inactive 51.5646 28.10025 19
Promoted - PP 55.6137 54.84119 16
Total 57.6695 40.61902 107
Box's Test of Equality of
Covariance Matricesa
Box's M 843.036
F 5.042
df1 135
df2 10475.674
Sig. .000
Tests the null hypothesis
that the observed
covariance matrices of the
dependent variables are
equal across groups.
a. Design: Intercept + Status
Multivariate Testsa

211
Effect Value F
Hypothesis
df Error df Sig.
Partial
Eta
Squared
Noncent.
Parameter
Observed
Powerd
Intercept Pillai's
Trace .830 51.621b 9.000 95.000 .000 .830 464.586 1.000
Wilks'
Lambda .170 51.621b 9.000 95.000 .000 .830 464.586 1.000
Hotelling's
Trace 4.890 51.621b 9.000 95.000 .000 .830 464.586 1.000
Roy's
Largest
Root
4.890 51.621b 9.000 95.000 .000 .830 464.586 1.000
Status Pillai's
Trace .625 2.835 27.000 291.000 .000 .208 76.534 1.000
Wilks'
Lambda .438 3.366 27.000 278.091 .000 .241 88.138 1.000
Hotelling's
Trace 1.143 3.965 27.000 281.000 .000 .276 107.048 1.000
Roy's
Largest
Root
1.006 10.841c 9.000 97.000 .000 .501 97.572 1.000
a. Design: Intercept + Status
b. Exact statistic
c. The statistic is an upper bound on F that yields a lower bound on the significance level.
d. Computed using alpha =
Levene's Test of Equality of Error Variancesa
F df1 df2 Sig.
Total Number of Posts 5.710 3 103 .001
Word Count for Posts 3.559 3 103 .017
Reputation 7.041 3 103 .000
Number fo Thanks Received 8.729 3 103 .000
Thread Word Count 6.454 3 103 .000
Thread Count 4.003 3 103 .010
av_numthanks 9.263 3 103 .000
Average Thread Word
Count 1.068 3 103 .366
Average Post Word Count 1.851 3 103 .143

212
Tests the null hypothesis that the error variance of the dependent variable is equal across groups.
a. Design: Intercept + Status
Multivariate Testsa
Effect Value F
Hypothesis
df Error df Sig.
Partial
Eta
Squared
Noncent.
Parameter
Observed
Powerd
Intercept Pillai's
Trace .830 51.621b 9.000 95.000 .000 .830 464.586 1.000
Wilks'
Lambda .170 51.621b 9.000 95.000 .000 .830 464.586 1.000
Hotelling's
Trace 4.890 51.621b 9.000 95.000 .000 .830 464.586 1.000
Roy's
Largest
Root
4.890 51.621b 9.000 95.000 .000 .830 464.586 1.000
Status Pillai's
Trace .625 2.835 27.000 291.000 .000 .208 76.534 1.000
Wilks'
Lambda .438 3.366 27.000 278.091 .000 .241 88.138 1.000
Hotelling's
Trace 1.143 3.965 27.000 281.000 .000 .276 107.048 1.000
Roy's
Largest
Root
1.006 10.841c 9.000 97.000 .000 .501 97.572 1.000
a. Design: Intercept + Status
b. Exact statistic
c. The statistic is an upper bound on F that yields a lower bound on the significance level.
d. Computed using alpha =
Parameter Estimates
Dependent
Variable
Parame
ter B
Std.
Error t
Si
g.
95% Confidence
Interval
Partial
Eta
Squar
ed
Noncen
t.
Parame
ter
Observ
ed
Powerb
Lower
Bound
Upper
Bound
Interce
pt
2288.18
7 815.095
2.8
07
.00
6 671.640
3904.73
5 .071 2.807 .794

213
Total
Number of
Posts
[Status
=1]
1789.20
8 954.772
1.8
74
.06
4 -104.358
3682.77
3 .033 1.874 .459
[Status
=2] -199.705 1015.34
9
-
.19
7
.84
4
-
2213.41
0
1814.00
0 .000 .197 .054
[Status
=3]
1512.39
1
1106.28
0
1.3
67
.17
5 -681.655
3706.43
8 .018 1.367 .273
[Status
=4] 0a . . . . . . . .
Word
Count for
Posts
Interce
pt 96044.9
38
55145.8
58
1.7
42
.08
5
-
13323.8
66
205413.
741 .029 1.742 .407
[Status
=1]
153170.
993
64595.8
59
2.3
71
.02
0
25060.3
42
281281.
644 .052 2.371 .651
[Status
=2] 71.856 68694.2
14
.00
1
.99
9
-
136166.
916
136310.
627 .000 .001 .050
[Status
=3] 101140.
378
74846.2
63
1.3
51
.18
0
-
47299.5
32
249580.
288 .017 1.351 .268
[Status
=4] 0a . . . . . . . .
Reputation Interce
pt 520.750 487.842
1.0
67
.28
8 -446.770
1488.27
0 .011 1.067 .185
[Status
=1]
3184.57
6 571.441
5.5
73
.00
0
2051.25
8
4317.89
4 .232 5.573 1.000
[Status
=2] 511.974 607.696
.84
2
.40
1 -693.248
1717.19
7 .007 .842 .133
[Status
=3] 246.829 662.120 .37
3
.71
0
-
1066.33
0
1559.98
8 .001 .373 .066
[Status
=4] 0a . . . . . . . .
Number fo
Thanks
Received
Interce
pt 446.312 197.481
2.2
60
.02
6 54.655 837.970 .047 2.260 .610
[Status
=1]
1022.24
6 231.322
4.4
19
.00
0 563.472
1481.01
9 .159 4.419 .992
[Status
=2] -122.209 245.999
-
.49
7
.62
0 -610.090 365.672 .002 .497 .078
[Status
=3] 22.582 268.030
.08
4
.93
3 -508.991 554.156 .000 .084 .051

214
[Status
=4] 0a . . . . . . . .
Thread
Word
Count
Interce
pt 5373.56
2
3381.38
5
1.5
89
.11
5
-
1332.61
8
12079.7
43 .024 1.589 .350
[Status
=1]
6996.25
1
3960.83
2
1.7
66
.08
0 -859.125
14851.6
28 .029 1.766 .417
[Status
=2] 340.989 4212.13
1
.08
1
.93
6
-
8012.78
0
8694.75
9 .000 .081 .051
[Status
=3]
9091.33
2
4589.35
7
1.9
81
.05
0 -10.576
18193.2
40 .037 1.981 .501
[Status
=4] 0a . . . . . . . .
Thread
Count
Interce
pt 26.937 13.296
2.0
26
.04
5 .568 53.307 .038 2.026 .519
[Status
=1] 33.853 15.574
2.1
74
.03
2 2.965 64.741 .044 2.174 .577
[Status
=2] -2.041 16.562
-
.12
3
.90
2 -34.889 30.807 .000 .123 .052
[Status
=3] 22.694 18.046
1.2
58
.21
1 -13.095 58.483 .015 1.258 .238
[Status
=4] 0a . . . . . . . .
av_numtha
nks
Interce
pt 11.260 5.668
1.9
87
.05
0 .020 22.501 .037 1.987 .503
[Status
=1] -7.278 6.639
-
1.0
96
.27
6 -20.444 5.889 .012 1.096 .192
[Status
=2] -1.135 7.060
-
.16
1
.87
3 -15.137 12.866 .000 .161 .053
[Status
=3] 11.111 7.692
1.4
44
.15
2 -4.145 26.367 .020 1.444 .299
[Status
=4] 0a . . . . . . . .
Average
Thread
Word
Count
Interce
pt 313.965 131.785
2.3
82
.01
9 52.599 575.330 .052 2.382 .655
[Status
=1] -61.792 154.369
-
.40
0
.69
0 -367.946 244.362 .002 .400 .068

215
[Status
=2] 31.539 164.163
.19
2
.84
8 -294.040 357.117 .000 .192 .054
[Status
=3] -36.479 178.865
-
.20
4
.83
9 -391.215 318.257 .000 .204 .055
[Status
=4] 0a . . . . . . . .
Average
Post Word
Count
Interce
pt 55.614 10.243
5.4
29
.00
0 35.299 75.929 .223 5.429 1.000
[Status
=1] 7.011 11.999
.58
4
.56
0 -16.785 30.808 .003 .584 .089
[Status
=2] -.158 12.760
-
.01
2
.99
0 -25.464 25.148 .000 .012 .050
[Status
=3] -4.049 13.903
-
.29
1
.77
1 -31.622 23.524 .001 .291 .060
[Status
=4] 0a . . . . . . . .
a. This parameter is set to zero because it is redundant.
b. Computed using alpha =
Group Status
Dependent Variable Group Status Mean Std. Error
95% Confidence Interval
Lower
Bound
Upper
Bound
Total Number of Posts Always PP 4077.395 497.203 3091.310 5063.480
PP - Another
Role 2088.483 605.437 887.741 3289.224
PP - Inactive 3800.579 747.982 2317.133 5284.025
Promoted - PP 2288.187 815.095 671.640 3904.735
Word Count for Posts Always PP 249215.930 33638.658 182501.586 315930.275
PP - Another
Role 96116.793 40961.315 14879.685 177353.901
PP - Inactive 197185.316 50605.310 96821.619 297549.013
Promoted - PP 96044.938 55145.858 -13323.866 205413.741
Reputation Always PP 3705.326 297.581 3115.144 4295.507
PP - Another
Role 1032.724 362.360 314.068 1751.380

216
PP - Inactive 767.579 447.675 -120.278 1655.436
Promoted - PP 520.750 487.842 -446.770 1488.270
Number fo Thanks
Received
Always PP 1468.558 120.462 1229.649 1707.467
PP - Another
Role 324.103 146.685 33.188 615.019
PP - Inactive 468.895 181.221 109.485 828.304
Promoted - PP 446.312 197.481 54.655 837.970
Thread Word Count Always PP 12369.814 2062.626 8279.082 16460.546
PP - Another
Role 5714.552 2511.630 733.326 10695.777
PP - Inactive 14464.895 3102.972 8310.882 20618.908
Promoted - PP 5373.562 3381.385 -1332.618 12079.743
Thread Count Always PP 60.791 8.110 44.706 76.876
PP - Another
Role 24.897 9.876 5.310 44.483
PP - Inactive 49.632 12.201 25.434 73.830
Promoted - PP 26.937 13.296 .568 53.307
av_numthanks Always PP 3.982 3.457 -2.874 10.839
PP - Another
Role 10.125 4.210 1.776 18.474
PP - Inactive 22.371 5.201 12.057 32.686
Promoted - PP 11.260 5.668 .020 22.501
Average Thread Word
Count
Always PP 252.173 80.388 92.742 411.604
PP - Another
Role 345.503 97.888 151.366 539.641
PP - Inactive 277.485 120.935 37.640 517.331
Promoted - PP 313.965 131.785 52.599 575.330
Average Post Word Count Always PP 62.625 6.248 50.233 75.017
PP - Another
Role 55.456 7.609 40.366 70.546
PP - Inactive 51.565 9.400 32.922 70.207
Promoted - PP 55.614 10.243 35.299 75.929
Multiple Comparisons
Games-Howell
Dependent
Variable
(I) Group
Status
(J) Group
Status Std. Error Sig.
95% Confidence
Interval

217
Mean
Difference
(I-J)
Lower
Bound
Upper
Bound
Total Number of
Posts
Always PP PP -
Another
Role
1988.91* 614.405 .011 362.04 3615.78
PP -
Inactive 276.82 1320.608 .997 -3403.28 3956.91
Promoted
- PP 1789.21 754.678 .109 -287.70 3866.12
PP -
Another
Role
Always PP -1988.91* 614.405 .011 -3615.78 -362.04
PP -
Inactive -1712.10 1361.387 .598 -5473.31 2049.11
Promoted
- PP -199.70 823.958 .995 -2435.07 2035.66
PP -
Inactive
Always PP -276.82 1320.608 .997 -3956.91 3403.28
PP -
Another
Role
1712.10 1361.387 .598 -2049.11 5473.31
Promoted
- PP 1512.39 1430.182 .718 -2404.12 5428.90
Promoted
- PP
Always PP -1789.21 754.678 .109 -3866.12 287.70
PP -
Another
Role
199.70 823.958 .995 -2035.66 2435.07
PP -
Inactive -1512.39 1430.182 .718 -5428.90 2404.12
Word Count for
Posts
Always PP PP -
Another
Role
153099.14* 38158.744 .001 52299.52 253898.75
PP -
Inactive 52030.61 90701.104 .939
-
198129.34 302190.57
Promoted
- PP 153170.99* 47488.149 .012 26498.75 279843.24
PP -
Another
Role
Always PP -153099.14* 38158.744 .001
-
253898.75 -52299.52
PP -
Inactive -101068.52 85901.253 .648
-
341975.93 139838.88
Promoted
- PP 71.86 37516.121 1.000
-
103593.86 103737.57

218
PP -
Inactive
Always PP -52030.61 90701.104 .939
-
302190.57 198129.34
PP -
Another
Role
101068.52 85901.253 .648 -
139838.88 341975.93
Promoted
- PP 101140.38 90432.626 .682
-
148815.34 351096.10
Promoted
- PP
Always PP -153170.99* 47488.149 .012
-
279843.24 -26498.75
PP -
Another
Role
-71.86 37516.121 1.000 -
103737.57 103593.86
PP -
Inactive -101140.38 90432.626 .682
-
351096.10 148815.34
Reputation Always PP PP -
Another
Role
2672.60* 392.902 .000 1632.21 3712.99
PP -
Inactive 2937.75* 719.925 .002 982.65 4892.85
Promoted
- PP 3184.58* 386.332 .000 2159.16 4209.99
PP -
Another
Role
Always PP -2672.60* 392.902 .000 -3712.99 -1632.21
PP -
Inactive 265.15 641.553 .976 -1528.73 2059.02
Promoted
- PP 511.97 206.276 .078 -40.08 1064.03
PP -
Inactive
Always PP -2937.75* 719.925 .002 -4892.85 -982.65
PP -
Another
Role
-265.15 641.553 .976 -2059.02 1528.73
Promoted
- PP 246.83 637.550 .980 -1539.81 2033.47
Promoted
- PP
Always PP -3184.58* 386.332 .000 -4209.99 -2159.16
PP -
Another
Role
-511.97 206.276 .078 -1064.03 40.08
PP -
Inactive -246.83 637.550 .980 -2033.47 1539.81
Number fo
Thanks
Received
Always PP PP -
Another
Role
1144.45* 182.931 .000 658.11 1630.80

219
PP -
Inactive 999.66* 213.390 .000 435.72 1563.61
Promoted
- PP 1022.25* 192.511 .000 512.13 1532.36
PP -
Another
Role
Always PP -1144.45* 182.931 .000 -1630.80 -658.11
PP -
Inactive -144.79 132.996 .700 -510.75 221.17
Promoted
- PP -122.21 95.984 .587 -384.20 139.78
PP -
Inactive
Always PP -999.66* 213.390 .000 -1563.61 -435.72
PP -
Another
Role
144.79 132.996 .700 -221.17 510.75
Promoted
- PP 22.58 145.893 .999 -374.02 419.18
Promoted
- PP
Always PP -1022.25* 192.511 .000 -1532.36 -512.13
PP -
Another
Role
122.21 95.984 .587 -139.78 384.20
PP -
Inactive -22.58 145.893 .999 -419.18 374.02
Thread Word
Count
Always PP PP -
Another
Role
6655.26 2544.096 .052 -41.85 13352.37
PP -
Inactive -2095.08 5446.695 .980 -17115.07 12924.91
Promoted
- PP 6996.25 2675.025 .055 -108.45 14100.96
PP -
Another
Role
Always PP -6655.26 2544.096 .052 -13352.37 41.85
PP -
Inactive -8750.34 5269.761 .368 -23423.57 5922.88
Promoted
- PP 340.99 2293.394 .999 -5838.40 6520.38
PP -
Inactive
Always PP 2095.08 5446.695 .980 -12924.91 17115.07
PP -
Another
Role
8750.34 5269.761 .368 -5922.88 23423.57
Promoted
- PP 9091.33 5334.202 .345 -5716.50 23899.16
Always PP -6996.25 2675.025 .055 -14100.96 108.45

220
Promoted
- PP
PP -
Another
Role
-340.99 2293.394 .999 -6520.38 5838.40
PP -
Inactive -9091.33 5334.202 .345 -23899.16 5716.50
Thread Count Always PP PP -
Another
Role
35.89* 11.341 .013 5.93 65.85
PP -
Inactive 11.16 17.143 .915 -34.91 57.23
Promoted
- PP 33.85 13.600 .074 -2.33 70.04
PP -
Another
Role
Always PP -35.89* 11.341 .013 -65.85 -5.93
PP -
Inactive -24.74 14.786 .360 -65.64 16.17
Promoted
- PP -2.04 10.475 .997 -30.87 26.79
PP -
Inactive
Always PP -11.16 17.143 .915 -57.23 34.91
PP -
Another
Role
24.74 14.786 .360 -16.17 65.64
Promoted
- PP 22.69 16.583 .528 -22.38 67.77
Promoted
- PP
Always PP -33.85 13.600 .074 -70.04 2.33
PP -
Another
Role
2.04 10.475 .997 -26.79 30.87
PP -
Inactive -22.69 16.583 .528 -67.77 22.38
av_numthanks Always PP PP -
Another
Role
-6.1424 3.44473 .301 -15.5211 3.2363
PP -
Inactive -18.3890 10.11234 .297 -46.9544 10.1764
Promoted
- PP -7.2779 5.85019 .610 -24.1071 9.5514
PP -
Another
Role
Always PP 6.1424 3.44473 .301 -3.2363 15.5211
PP -
Inactive -12.2466 10.65706 .664 -41.8247 17.3315
Promoted
- PP -1.1355 6.74820 .998 -19.6769 17.4060
Always PP 18.3890 10.11234 .297 -10.1764 46.9544

221
PP -
Inactive
PP -
Another
Role
12.2466 10.65706 .664 -17.3315 41.8247
Promoted
- PP 11.1112 11.65896 .777 -20.7058 42.9281
Promoted
- PP
Always PP 7.2779 5.85019 .610 -9.5514 24.1071
PP -
Another
Role
1.1355 6.74820 .998 -17.4060 19.6769
PP -
Inactive -11.1112 11.65896 .777 -42.9281 20.7058
Average Thread
Word Count
Always PP PP -
Another
Role
-93.3303 163.99529 .941 -537.8052 351.1445
PP -
Inactive -25.3123 68.08292 .982 -207.9713 157.3468
Promoted
- PP -61.7917 136.92407 .969 -448.6404 325.0570
PP -
Another
Role
Always PP 93.3303 163.99529 .941 -351.1445 537.8052
PP -
Inactive 68.0181 167.74895 .977 -384.9106 520.9467
Promoted
- PP 31.5386 205.55444 .999 -518.0785 581.1557
PP -
Inactive
Always PP 25.3123 68.08292 .982 -157.3468 207.9713
PP -
Another
Role
-68.0181 167.74895 .977 -520.9467 384.9106
Promoted
- PP -36.4794 141.39822 .994 -432.0379 359.0791
Promoted
- PP
Always PP 61.7917 136.92407 .969 -325.0570 448.6404
PP -
Another
Role
-31.5386 205.55444 .999 -581.1557 518.0785
PP -
Inactive 36.4794 141.39822 .994 -359.0791 432.0379
Average Post
Word Count
Always PP PP -
Another
Role
7.1692 9.34271 .869 -17.4482 31.7865
PP -
Inactive 11.0603 9.19403 .628 -13.3561 35.4768
Promoted
- PP 7.0113 15.19682 .967 -35.1537 49.1763

222
PP -
Another
Role
Always PP -7.1692 9.34271 .869 -31.7865 17.4482
PP -
Inactive 3.8912 9.26684 .975 -20.8427 28.6250
Promoted
- PP -.1579 15.24098 1.000 -42.4428 42.1271
PP -
Inactive
Always PP -11.0603 9.19403 .628 -35.4768 13.3561
PP -
Another
Role
-3.8912 9.26684 .975 -28.6250 20.8427
Promoted
- PP -4.0490 15.15029 .993 -46.1979 38.0999
Promoted
- PP
Always PP -7.0113 15.19682 .967 -49.1763 35.1537
PP -
Another
Role
.1579 15.24098 1.000 -42.1271 42.4428
PP -
Inactive 4.0490 15.15029 .993 -38.0999 46.1979
Based on observed means.
The error term is Mean Square(Error) = 1678.797.
*. The mean difference is significant at the
Between-Subjects Factors
Value Label N
Group Status 1 Always PP 43
2 PP - Another Role 29
3 PP - Inactive 19
4 Promoted - PP 16
Descriptive Statistics
Group Status Mean Std. Deviation N
Total Number of Posts Always PP 4077.40 2400.971 43
PP - Another Role 2088.48 2656.973 29
PP - Inactive 3800.58 5530.725 19
Promoted - PP 2288.19 2639.625 16
Total 3221.64 3342.033 107
Word Count for Posts Always PP 249215.93 222554.996 43
PP - Another Role 96116.79 93926.351 29

223
PP - Inactive 197185.32 366635.303 19
Promoted - PP 96044.94 132860.645 16
Total 175578.62 228572.949 107
Reputation Always PP 3705.33 2369.196 43
PP - Another Role 1032.72 831.390 29
PP - Inactive 767.58 2714.287 19
Promoted - PP 520.75 547.214 16
Total 1983.12 2395.415 107
Number fo Thanks Received Always PP 1468.56 1148.123 43
PP - Another Role 324.10 285.366 29
PP - Inactive 468.89 531.710 19
Promoted - PP 446.31 320.123 16
Total 828.01 941.988 107
Thread Word Count Always PP 12369.81 13413.554 43
PP - Another Role 5714.55 8145.960 29
PP - Inactive 14464.89 22003.684 19
Promoted - PP 5373.56 6895.209 16
Total 9891.91 13851.267 107
Thread Count Always PP 60.79 66.206 43
PP - Another Role 24.90 27.817 29
PP - Inactive 49.63 60.390 19
Promoted - PP 26.94 36.450 16
Total 44.02 54.884 107
av_numthanks Always PP 3.9824 3.44720 43
PP - Another Role 10.1248 18.33318 29
PP - Inactive 22.3714 44.01906 19
Promoted - PP 11.2603 23.30610 16
Total 10.0008 23.27579 107
Average Thread Word Count Always PP 252.1730 269.97332 43
PP - Another Role 345.5033 854.85891 29
PP - Inactive 277.4852 236.35806 19
Promoted - PP 313.9647 522.35140 16
Total 291.2027 521.10508 107
Average Post Word Count Always PP 62.6250 42.98549 43
PP - Another Role 55.4558 35.84885 29
PP - Inactive 51.5646 28.10025 19
Promoted - PP 55.6137 54.84119 16
Total 57.6695 40.61902 107

224
Box's Test of Equality of
Covariance Matricesa
Box's M 843.036
F 5.042
df1 135
df2 10475.674
Sig. .000
Tests the null hypothesis
that the observed
covariance matrices of the
dependent variables are
equal across groups.
a. Design: Intercept + Status
Descriptive Statistics
Group Status Mean Std. Deviation N
Total Number of Posts Always PP 4077.40 2400.971 43
PP - Another Role 2088.48 2656.973 29
PP - Inactive 3800.58 5530.725 19
Promoted - PP 2288.19 2639.625 16
Total 3221.64 3342.033 107
Word Count for Posts Always PP 249215.93 222554.996 43
PP - Another Role 96116.79 93926.351 29
PP - Inactive 197185.32 366635.303 19
Promoted - PP 96044.94 132860.645 16
Total 175578.62 228572.949 107
Reputation Always PP 3705.33 2369.196 43
PP - Another Role 1032.72 831.390 29
PP - Inactive 767.58 2714.287 19
Promoted - PP 520.75 547.214 16
Total 1983.12 2395.415 107
Number fo Thanks Received Always PP 1468.56 1148.123 43
PP - Another Role 324.10 285.366 29
PP - Inactive 468.89 531.710 19
Promoted - PP 446.31 320.123 16
Total 828.01 941.988 107
Thread Word Count Always PP 12369.81 13413.554 43

225
PP - Another Role 5714.55 8145.960 29
PP - Inactive 14464.89 22003.684 19
Promoted - PP 5373.56 6895.209 16
Total 9891.91 13851.267 107
Thread Count Always PP 60.79 66.206 43
PP - Another Role 24.90 27.817 29
PP - Inactive 49.63 60.390 19
Promoted - PP 26.94 36.450 16
Total 44.02 54.884 107
av_numthanks Always PP 3.9824 3.44720 43
PP - Another Role 10.1248 18.33318 29
PP - Inactive 22.3714 44.01906 19
Promoted - PP 11.2603 23.30610 16
Total 10.0008 23.27579 107
Average Thread Word Count Always PP 252.1730 269.97332 43
PP - Another Role 345.5033 854.85891 29
PP - Inactive 277.4852 236.35806 19
Promoted - PP 313.9647 522.35140 16
Total 291.2027 521.10508 107
Average Post Word Count Always PP 62.6250 42.98549 43
PP - Another Role 55.4558 35.84885 29
PP - Inactive 51.5646 28.10025 19
Promoted - PP 55.6137 54.84119 16
Total 57.6695 40.61902 107
Multivariate Testsa
Effect Value F
Hypothesis
df Error df Sig.
Partial
Eta
Squared
Noncent.
Parameter
Observed
Powerd
Intercept Pillai's
Trace .830 51.621b 9.000 95.000 .000 .830 464.586 1.000
Wilks'
Lambda .170 51.621b 9.000 95.000 .000 .830 464.586 1.000
Hotelling's
Trace 4.890 51.621b 9.000 95.000 .000 .830 464.586 1.000
Roy's
Largest
Root
4.890 51.621b 9.000 95.000 .000 .830 464.586 1.000

226
Status Pillai's
Trace .625 2.835 27.000 291.000 .000 .208 76.534 1.000
Wilks'
Lambda .438 3.366 27.000 278.091 .000 .241 88.138 1.000
Hotelling's
Trace 1.143 3.965 27.000 281.000 .000 .276 107.048 1.000
Roy's
Largest
Root
1.006 10.841c 9.000 97.000 .000 .501 97.572 1.000
a. Design: Intercept + Status
b. Exact statistic
c. The statistic is an upper bound on F that yields a lower bound on the significance level.
d. Computed using alpha =
Descriptive Statistics
Group Status Mean Std. Deviation N
Total Number of Posts Always PP 4077.40 2400.971 43
PP - Another Role 2088.48 2656.973 29
PP - Inactive 3800.58 5530.725 19
Promoted - PP 2288.19 2639.625 16
Total 3221.64 3342.033 107
Word Count for Posts Always PP 249215.93 222554.996 43
PP - Another Role 96116.79 93926.351 29
PP - Inactive 197185.32 366635.303 19
Promoted - PP 96044.94 132860.645 16
Total 175578.62 228572.949 107
Reputation Always PP 3705.33 2369.196 43
PP - Another Role 1032.72 831.390 29
PP - Inactive 767.58 2714.287 19
Promoted - PP 520.75 547.214 16
Total 1983.12 2395.415 107
Number fo Thanks Received Always PP 1468.56 1148.123 43
PP - Another Role 324.10 285.366 29
PP - Inactive 468.89 531.710 19
Promoted - PP 446.31 320.123 16
Total 828.01 941.988 107
Thread Word Count Always PP 12369.81 13413.554 43
PP - Another Role 5714.55 8145.960 29
PP - Inactive 14464.89 22003.684 19
Promoted - PP 5373.56 6895.209 16

227
Total 9891.91 13851.267 107
Thread Count Always PP 60.79 66.206 43
PP - Another Role 24.90 27.817 29
PP - Inactive 49.63 60.390 19
Promoted - PP 26.94 36.450 16
Total 44.02 54.884 107
av_numthanks Always PP 3.9824 3.44720 43
PP - Another Role 10.1248 18.33318 29
PP - Inactive 22.3714 44.01906 19
Promoted - PP 11.2603 23.30610 16
Total 10.0008 23.27579 107
Average Thread Word Count Always PP 252.1730 269.97332 43
PP - Another Role 345.5033 854.85891 29
PP - Inactive 277.4852 236.35806 19
Promoted - PP 313.9647 522.35140 16
Total 291.2027 521.10508 107
Average Post Word Count Always PP 62.6250 42.98549 43
PP - Another Role 55.4558 35.84885 29
PP - Inactive 51.5646 28.10025 19
Promoted - PP 55.6137 54.84119 16
Total 57.6695 40.61902 107
Levene's Test of Equality of Error Variancesa
F df1 df2 Sig.
Total Number of Posts 5.710 3 103 .001
Word Count for Posts 3.559 3 103 .017
Reputation 7.041 3 103 .000
Number fo Thanks Received 8.729 3 103 .000
Thread Word Count 6.454 3 103 .000
Thread Count 4.003 3 103 .010
av_numthanks 9.263 3 103 .000
Average Thread Word
Count 1.068 3 103 .366
Average Post Word Count 1.851 3 103 .143
Tests the null hypothesis that the error variance of the dependent variable is equal across groups.
a. Design: Intercept + Status
Tests of Between-Subjects Effects

228
Source
Dependent
Variable
Type III Sum of
Squares df Mean Square F
Si
g.
Partial
Eta
Squar
ed
Noncen
t.
Parame
ter
Observ
ed
Powerj
Correct
ed
Model
Total
Number of
Posts
89036527.915a 3 29678842.638 2.792 .04
4 .075 8.376 .658
Word
Count for
Posts
526356617972.
696b 3
175452205990.
899 3.606
.01
6 .095 10.818 .780
Reputation 216021652.554
c 3 72007217.518
18.91
0
.00
0 .355 56.731 1.000
Number fo
Thanks
Received
29788114.469d 3 9929371.490 15.91
3
.00
0 .317 47.739 1.000
Thread
Word
Count
1494058711.65
4e 3 498019570.551 2.722
.04
8 .073 8.167 .646
Thread
Count 27966.798f 3 9322.266 3.296
.02
3 .088 9.888 .738
av_numtha
nks 4490.945g 3 1496.982 2.913
.03
8 .078 8.738 .679
Average
Thread
Word
Count
162875.708h 3 54291.903 .195 .89
9 .006 .586 .085
Average
Post Word
Count
1973.796i 3 657.932 .392 .75
9 .011 1.176 .125
Interce
pt
Total
Number of
Posts
868723211.285 1 868723211.285 81.72
3
.00
0 .442 81.723 1.000
Word
Count for
Posts
235878011055
0.029 1
2358780110550
.029
48.47
8
.00
0 .320 48.478 1.000
Reputation 210083924.349 1 210083924.349
55.17
1
.00
0 .349 55.171 1.000
Number fo
Thanks
Received
42416539.275 1 42416539.275 67.97
7
.00
0 .398 67.977 1.000

229
Thread
Word
Count
8319194986.20
3 1
8319194986.20
3
45.47
5
.00
0 .306 45.475 1.000
Thread
Count 152294.169 1 152294.169
53.84
3
.00
0 .343 53.843 1.000
av_numtha
nks 13183.317 1 13183.317
25.65
1
.00
0 .199 25.651 .999
Average
Thread
Word
Count
8179671.911 1 8179671.911 29.43
6
.00
0 .222 29.436 1.000
Average
Post Word
Count
293524.734 1 293524.734 174.8
42
.00
0 .629 174.842 1.000
Status Total
Number of
Posts
89036527.915 3 29678842.638 2.792 .04
4 .075 8.376 .658
Word
Count for
Posts
526356617972.
697 3
175452205990.
899 3.606
.01
6 .095 10.818 .780
Reputation 216021652.554 3 72007217.518
18.91
0
.00
0 .355 56.731 1.000
Number fo
Thanks
Received
29788114.469 3 9929371.490 15.91
3
.00
0 .317 47.739 1.000
Thread
Word
Count
1494058711.65
4 3 498019570.551 2.722
.04
8 .073 8.167 .646
Thread
Count 27966.798 3 9322.266 3.296
.02
3 .088 9.888 .738
av_numtha
nks 4490.945 3 1496.982 2.913
.03
8 .078 8.738 .679
Average
Thread
Word
Count
162875.708 3 54291.903 .195 .89
9 .006 .586 .085
Average
Post Word
Count
1973.796 3 657.932 .392 .75
9 .011 1.176 .125
Error Total
Number of
Posts
1094896946.59
0
10
3 10630067.443
230
Word
Count for
Posts
501167624641
8.593
10
3
48657050936.1
03
Reputation 392207672.867
10
3 3807841.484
Number fo
Thanks
Received
64270052.521 10
3 623981.092
Thread
Word
Count
18842847071.4
11
10
3 182940262.829
Thread
Count 291333.164
10
3 2828.477
av_numtha
nks 52935.860
10
3 513.940
Average
Thread
Word
Count
28621477.403 10
3 277878.421
Average
Post Word
Count
172916.110 10
3 1678.797
Total Total
Number of
Posts
2294486004.00
0
10
7
Word
Count for
Posts
883661288771
6.000
10
7
Reputation 1029035808.00
0
10
7
Number fo
Thanks
Received
167417311.000 10
7
Thread
Word
Count
30806835992.0
00
10
7
Thread
Count 526628.000
10
7
av_numtha
nks 68128.484
10
7

231
Average
Thread
Word
Count
37857847.209 10
7
Average
Post Word
Count
530747.802 10
7
Correct
ed
Total
Total
Number of
Posts
1183933474.50
5
10
6
Word
Count for
Posts
553803286439
1.289
10
6
Reputation 608229325.421
10
6
Number fo
Thanks
Received
94058166.991 10
6
Thread
Word
Count
20336905783.0
65
10
6
Thread
Count 319299.963
10
6
av_numtha
nks 57426.805
10
6
Average
Thread
Word
Count
28784353.111 10
6
Average
Post Word
Count
174889.906 10
6
a. R Squared = .075 (Adjusted R Squared = .048)
b. R Squared = .095 (Adjusted R Squared = .069)
c. R Squared = .355 (Adjusted R Squared = .336)
d. R Squared = .317 (Adjusted R Squared = .297)
e. R Squared = .073 (Adjusted R Squared = .046)
f. R Squared = .088 (Adjusted R Squared = .061)
g. R Squared = .078 (Adjusted R Squared = .051)
h. R Squared = .006 (Adjusted R Squared = -.023)
i. R Squared = .011 (Adjusted R Squared = -.018)
j. Computed using alpha =

232
Parameter Estimates
Dependent
Variable
Parame
ter B
Std.
Error t
Si
g.
95% Confidence
Interval
Partial
Eta
Squar
ed
Noncen
t.
Parame
ter
Observ
ed
Powerb
Lower
Bound
Upper
Bound
Total
Number of
Posts
Interce
pt
2288.18
7 815.095
2.8
07
.00
6 671.640
3904.73
5 .071 2.807 .794
[Status
=1]
1789.20
8 954.772
1.8
74
.06
4 -104.358
3682.77
3 .033 1.874 .459
[Status
=2] -199.705 1015.34
9
-
.19
7
.84
4
-
2213.41
0
1814.00
0 .000 .197 .054
[Status
=3]
1512.39
1
1106.28
0
1.3
67
.17
5 -681.655
3706.43
8 .018 1.367 .273
[Status
=4] 0a . . . . . . . .
Word
Count for
Posts
Interce
pt 96044.9
38
55145.8
58
1.7
42
.08
5
-
13323.8
66
205413.
741 .029 1.742 .407
[Status
=1]
153170.
993
64595.8
59
2.3
71
.02
0
25060.3
42
281281.
644 .052 2.371 .651
[Status
=2] 71.856 68694.2
14
.00
1
.99
9
-
136166.
916
136310.
627 .000 .001 .050
[Status
=3] 101140.
378
74846.2
63
1.3
51
.18
0
-
47299.5
32
249580.
288 .017 1.351 .268
[Status
=4] 0a . . . . . . . .
Reputation Interce
pt 520.750 487.842
1.0
67
.28
8 -446.770
1488.27
0 .011 1.067 .185
[Status
=1]
3184.57
6 571.441
5.5
73
.00
0
2051.25
8
4317.89
4 .232 5.573 1.000
[Status
=2] 511.974 607.696
.84
2
.40
1 -693.248
1717.19
7 .007 .842 .133
[Status
=3] 246.829 662.120 .37
3
.71
0
-
1066.33
0
1559.98
8 .001 .373 .066

233
[Status
=4] 0a . . . . . . . .
Number fo
Thanks
Received
Interce
pt 446.312 197.481
2.2
60
.02
6 54.655 837.970 .047 2.260 .610
[Status
=1]
1022.24
6 231.322
4.4
19
.00
0 563.472
1481.01
9 .159 4.419 .992
[Status
=2] -122.209 245.999
-
.49
7
.62
0 -610.090 365.672 .002 .497 .078
[Status
=3] 22.582 268.030
.08
4
.93
3 -508.991 554.156 .000 .084 .051
[Status
=4] 0a . . . . . . . .
Thread
Word
Count
Interce
pt 5373.56
2
3381.38
5
1.5
89
.11
5
-
1332.61
8
12079.7
43 .024 1.589 .350
[Status
=1]
6996.25
1
3960.83
2
1.7
66
.08
0 -859.125
14851.6
28 .029 1.766 .417
[Status
=2] 340.989 4212.13
1
.08
1
.93
6
-
8012.78
0
8694.75
9 .000 .081 .051
[Status
=3]
9091.33
2
4589.35
7
1.9
81
.05
0 -10.576
18193.2
40 .037 1.981 .501
[Status
=4] 0a . . . . . . . .
Thread
Count
Interce
pt 26.937 13.296
2.0
26
.04
5 .568 53.307 .038 2.026 .519
[Status
=1] 33.853 15.574
2.1
74
.03
2 2.965 64.741 .044 2.174 .577
[Status
=2] -2.041 16.562
-
.12
3
.90
2 -34.889 30.807 .000 .123 .052
[Status
=3] 22.694 18.046
1.2
58
.21
1 -13.095 58.483 .015 1.258 .238
[Status
=4] 0a . . . . . . . .
av_numtha
nks
Interce
pt 11.260 5.668
1.9
87
.05
0 .020 22.501 .037 1.987 .503
[Status
=1] -7.278 6.639
-
1.0
96
.27
6 -20.444 5.889 .012 1.096 .192

234
[Status
=2] -1.135 7.060
-
.16
1
.87
3 -15.137 12.866 .000 .161 .053
[Status
=3] 11.111 7.692
1.4
44
.15
2 -4.145 26.367 .020 1.444 .299
[Status
=4] 0a . . . . . . . .
Average
Thread
Word
Count
Interce
pt 313.965 131.785
2.3
82
.01
9 52.599 575.330 .052 2.382 .655
[Status
=1] -61.792 154.369
-
.40
0
.69
0 -367.946 244.362 .002 .400 .068
[Status
=2] 31.539 164.163
.19
2
.84
8 -294.040 357.117 .000 .192 .054
[Status
=3] -36.479 178.865
-
.20
4
.83
9 -391.215 318.257 .000 .204 .055
[Status
=4] 0a . . . . . . . .
Average
Post Word
Count
Interce
pt 55.614 10.243
5.4
29
.00
0 35.299 75.929 .223 5.429 1.000
[Status
=1] 7.011 11.999
.58
4
.56
0 -16.785 30.808 .003 .584 .089
[Status
=2] -.158 12.760
-
.01
2
.99
0 -25.464 25.148 .000 .012 .050
[Status
=3] -4.049 13.903
-
.29
1
.77
1 -31.622 23.524 .001 .291 .060
[Status
=4] 0a . . . . . . . .
a. This parameter is set to zero because it is redundant.
b. Computed using alpha =
Group Status
Dependent Variable Group Status Mean Std. Error
95% Confidence Interval
Lower
Bound
Upper
Bound
Total Number of Posts Always PP 4077.395 497.203 3091.310 5063.480

235
PP - Another
Role 2088.483 605.437 887.741 3289.224
PP - Inactive 3800.579 747.982 2317.133 5284.025
Promoted - PP 2288.187 815.095 671.640 3904.735
Word Count for Posts Always PP 249215.930 33638.658 182501.586 315930.275
PP - Another
Role 96116.793 40961.315 14879.685 177353.901
PP - Inactive 197185.316 50605.310 96821.619 297549.013
Promoted - PP 96044.938 55145.858 -13323.866 205413.741
Reputation Always PP 3705.326 297.581 3115.144 4295.507
PP - Another
Role 1032.724 362.360 314.068 1751.380
PP - Inactive 767.579 447.675 -120.278 1655.436
Promoted - PP 520.750 487.842 -446.770 1488.270
Number fo Thanks
Received
Always PP 1468.558 120.462 1229.649 1707.467
PP - Another
Role 324.103 146.685 33.188 615.019
PP - Inactive 468.895 181.221 109.485 828.304
Promoted - PP 446.312 197.481 54.655 837.970
Thread Word Count Always PP 12369.814 2062.626 8279.082 16460.546
PP - Another
Role 5714.552 2511.630 733.326 10695.777
PP - Inactive 14464.895 3102.972 8310.882 20618.908
Promoted - PP 5373.562 3381.385 -1332.618 12079.743
Thread Count Always PP 60.791 8.110 44.706 76.876
PP - Another
Role 24.897 9.876 5.310 44.483
PP - Inactive 49.632 12.201 25.434 73.830
Promoted - PP 26.937 13.296 .568 53.307
av_numthanks Always PP 3.982 3.457 -2.874 10.839
PP - Another
Role 10.125 4.210 1.776 18.474
PP - Inactive 22.371 5.201 12.057 32.686
Promoted - PP 11.260 5.668 .020 22.501
Average Thread Word
Count
Always PP 252.173 80.388 92.742 411.604
PP - Another
Role 345.503 97.888 151.366 539.641
PP - Inactive 277.485 120.935 37.640 517.331
Promoted - PP 313.965 131.785 52.599 575.330
Average Post Word Count Always PP 62.625 6.248 50.233 75.017

236
PP - Another
Role 55.456 7.609 40.366 70.546
PP - Inactive 51.565 9.400 32.922 70.207
Promoted - PP 55.614 10.243 35.299 75.929
Multiple Comparisons
Games-Howell
Dependent
Variable
(I) Group
Status
(J) Group
Status
Mean
Difference
(I-J) Std. Error Sig.
95% Confidence
Interval
Lower
Bound
Upper
Bound
Total Number of
Posts
Always PP PP -
Another
Role
1988.91* 614.405 .011 362.04 3615.78
PP -
Inactive 276.82 1320.608 .997 -3403.28 3956.91
Promoted
- PP 1789.21 754.678 .109 -287.70 3866.12
PP -
Another
Role
Always PP -1988.91* 614.405 .011 -3615.78 -362.04
PP -
Inactive -1712.10 1361.387 .598 -5473.31 2049.11
Promoted
- PP -199.70 823.958 .995 -2435.07 2035.66
PP -
Inactive
Always PP -276.82 1320.608 .997 -3956.91 3403.28
PP -
Another
Role
1712.10 1361.387 .598 -2049.11 5473.31
Promoted
- PP 1512.39 1430.182 .718 -2404.12 5428.90
Promoted
- PP
Always PP -1789.21 754.678 .109 -3866.12 287.70
PP -
Another
Role
199.70 823.958 .995 -2035.66 2435.07
PP -
Inactive -1512.39 1430.182 .718 -5428.90 2404.12

237
Word Count for
Posts
Always PP PP -
Another
Role
153099.14* 38158.744 .001 52299.52 253898.75
PP -
Inactive 52030.61 90701.104 .939
-
198129.34 302190.57
Promoted
- PP 153170.99* 47488.149 .012 26498.75 279843.24
PP -
Another
Role
Always PP -153099.14* 38158.744 .001
-
253898.75 -52299.52
PP -
Inactive -101068.52 85901.253 .648
-
341975.93 139838.88
Promoted
- PP 71.86 37516.121 1.000
-
103593.86 103737.57
PP -
Inactive
Always PP -52030.61 90701.104 .939
-
302190.57 198129.34
PP -
Another
Role
101068.52 85901.253 .648 -
139838.88 341975.93
Promoted
- PP 101140.38 90432.626 .682
-
148815.34 351096.10
Promoted
- PP
Always PP -153170.99* 47488.149 .012
-
279843.24 -26498.75
PP -
Another
Role
-71.86 37516.121 1.000 -
103737.57 103593.86
PP -
Inactive -101140.38 90432.626 .682
-
351096.10 148815.34
Reputation Always PP PP -
Another
Role
2672.60* 392.902 .000 1632.21 3712.99
PP -
Inactive 2937.75* 719.925 .002 982.65 4892.85
Promoted
- PP 3184.58* 386.332 .000 2159.16 4209.99
PP -
Another
Role
Always PP -2672.60* 392.902 .000 -3712.99 -1632.21
PP -
Inactive 265.15 641.553 .976 -1528.73 2059.02
Promoted
- PP 511.97 206.276 .078 -40.08 1064.03
Always PP -2937.75* 719.925 .002 -4892.85 -982.65

238
PP -
Inactive
PP -
Another
Role
-265.15 641.553 .976 -2059.02 1528.73
Promoted
- PP 246.83 637.550 .980 -1539.81 2033.47
Promoted
- PP
Always PP -3184.58* 386.332 .000 -4209.99 -2159.16
PP -
Another
Role
-511.97 206.276 .078 -1064.03 40.08
PP -
Inactive -246.83 637.550 .980 -2033.47 1539.81
Number fo
Thanks
Received
Always PP PP -
Another
Role
1144.45* 182.931 .000 658.11 1630.80
PP -
Inactive 999.66* 213.390 .000 435.72 1563.61
Promoted
- PP 1022.25* 192.511 .000 512.13 1532.36
PP -
Another
Role
Always PP -1144.45* 182.931 .000 -1630.80 -658.11
PP -
Inactive -144.79 132.996 .700 -510.75 221.17
Promoted
- PP -122.21 95.984 .587 -384.20 139.78
PP -
Inactive
Always PP -999.66* 213.390 .000 -1563.61 -435.72
PP -
Another
Role
144.79 132.996 .700 -221.17 510.75
Promoted
- PP 22.58 145.893 .999 -374.02 419.18
Promoted
- PP
Always PP -1022.25* 192.511 .000 -1532.36 -512.13
PP -
Another
Role
122.21 95.984 .587 -139.78 384.20
PP -
Inactive -22.58 145.893 .999 -419.18 374.02
Thread Word
Count
Always PP PP -
Another
Role
6655.26 2544.096 .052 -41.85 13352.37
PP -
Inactive -2095.08 5446.695 .980 -17115.07 12924.91
Promoted
- PP 6996.25 2675.025 .055 -108.45 14100.96

239
PP -
Another
Role
Always PP -6655.26 2544.096 .052 -13352.37 41.85
PP -
Inactive -8750.34 5269.761 .368 -23423.57 5922.88
Promoted
- PP 340.99 2293.394 .999 -5838.40 6520.38
PP -
Inactive
Always PP 2095.08 5446.695 .980 -12924.91 17115.07
PP -
Another
Role
8750.34 5269.761 .368 -5922.88 23423.57
Promoted
- PP 9091.33 5334.202 .345 -5716.50 23899.16
Promoted
- PP
Always PP -6996.25 2675.025 .055 -14100.96 108.45
PP -
Another
Role
-340.99 2293.394 .999 -6520.38 5838.40
PP -
Inactive -9091.33 5334.202 .345 -23899.16 5716.50
Thread Count Always PP PP -
Another
Role
35.89* 11.341 .013 5.93 65.85
PP -
Inactive 11.16 17.143 .915 -34.91 57.23
Promoted
- PP 33.85 13.600 .074 -2.33 70.04
PP -
Another
Role
Always PP -35.89* 11.341 .013 -65.85 -5.93
PP -
Inactive -24.74 14.786 .360 -65.64 16.17
Promoted
- PP -2.04 10.475 .997 -30.87 26.79
PP -
Inactive
Always PP -11.16 17.143 .915 -57.23 34.91
PP -
Another
Role
24.74 14.786 .360 -16.17 65.64
Promoted
- PP 22.69 16.583 .528 -22.38 67.77
Promoted
- PP
Always PP -33.85 13.600 .074 -70.04 2.33
PP -
Another
Role
2.04 10.475 .997 -26.79 30.87
PP -
Inactive -22.69 16.583 .528 -67.77 22.38

240
av_numthanks Always PP PP -
Another
Role
-6.1424 3.44473 .301 -15.5211 3.2363
PP -
Inactive -18.3890 10.11234 .297 -46.9544 10.1764
Promoted
- PP -7.2779 5.85019 .610 -24.1071 9.5514
PP -
Another
Role
Always PP 6.1424 3.44473 .301 -3.2363 15.5211
PP -
Inactive -12.2466 10.65706 .664 -41.8247 17.3315
Promoted
- PP -1.1355 6.74820 .998 -19.6769 17.4060
PP -
Inactive
Always PP 18.3890 10.11234 .297 -10.1764 46.9544
PP -
Another
Role
12.2466 10.65706 .664 -17.3315 41.8247
Promoted
- PP 11.1112 11.65896 .777 -20.7058 42.9281
Promoted
- PP
Always PP 7.2779 5.85019 .610 -9.5514 24.1071
PP -
Another
Role
1.1355 6.74820 .998 -17.4060 19.6769
PP -
Inactive -11.1112 11.65896 .777 -42.9281 20.7058
Average Thread
Word Count
Always PP PP -
Another
Role
-93.3303 163.99529 .941 -537.8052 351.1445
PP -
Inactive -25.3123 68.08292 .982 -207.9713 157.3468
Promoted
- PP -61.7917 136.92407 .969 -448.6404 325.0570
PP -
Another
Role
Always PP 93.3303 163.99529 .941 -351.1445 537.8052
PP -
Inactive 68.0181 167.74895 .977 -384.9106 520.9467
Promoted
- PP 31.5386 205.55444 .999 -518.0785 581.1557
PP -
Inactive
Always PP 25.3123 68.08292 .982 -157.3468 207.9713
PP -
Another
Role
-68.0181 167.74895 .977 -520.9467 384.9106
Promoted
- PP -36.4794 141.39822 .994 -432.0379 359.0791

241
Promoted
- PP
Always PP 61.7917 136.92407 .969 -325.0570 448.6404
PP -
Another
Role
-31.5386 205.55444 .999 -581.1557 518.0785
PP -
Inactive 36.4794 141.39822 .994 -359.0791 432.0379
Average Post
Word Count
Always PP PP -
Another
Role
7.1692 9.34271 .869 -17.4482 31.7865
PP -
Inactive 11.0603 9.19403 .628 -13.3561 35.4768
Promoted
- PP 7.0113 15.19682 .967 -35.1537 49.1763
PP -
Another
Role
Always PP -7.1692 9.34271 .869 -31.7865 17.4482
PP -
Inactive 3.8912 9.26684 .975 -20.8427 28.6250
Promoted
- PP -.1579 15.24098 1.000 -42.4428 42.1271
PP -
Inactive
Always PP -11.0603 9.19403 .628 -35.4768 13.3561
PP -
Another
Role
-3.8912 9.26684 .975 -28.6250 20.8427
Promoted
- PP -4.0490 15.15029 .993 -46.1979 38.0999
Promoted
- PP
Always PP -7.0113 15.19682 .967 -49.1763 35.1537
PP -
Another
Role
.1579 15.24098 1.000 -42.1271 42.4428
PP -
Inactive 4.0490 15.15029 .993 -38.0999 46.1979
Based on observed means.
The error term is Mean Square(Error) = 1678.797.
*. The mean difference is significant at the

242
Appendix 4: Tables from Quantitative Chapter
4.3.1. Individual Synopses for Eight LWP Community Members
4.3.1.1. Guy Fawkes
Figure 4.1. Chart displaying posting behaviour from 2006 – 2011 for LWP member
Guy Fawkes
Figure 4.2. Chart displaying thread starting behaviour from 2006 – 2011 for LWP
member Guy Fawkes
0
200
400
600
800
1000
2006 2007 2008 2009 2010 2011
To
tal
Nu
mb
er
of
Po
sts
Pe
r Y
ea
r
Years
Total Number of Posts (Per Year)
0
5
10
15
20
25
30
2006 2007 2008 2009 2010 2011
To
tal
Nu
mb
er
of
Th
rea
ds
Sta
rte
d
Years
Total Number of Threads Started (Per Year)

243
Figure 4.3. Chart displaying average word count behaviour from 2006 – 2011 for LWP
member Guy Fawkes
Synopsis of Guy Fawkes
Guy Fawkes was an influential member within the community between December 2010
– December 2011. Based on the thread frequency, the highest number of threads started
within a year appears to correspond with his influential status at the time; however, his
posting peak was in 2007; though 2011 also had a high volume of threads posting in
relation to previous years in the community. With regards to word count, his average
word count appears to start quite high, then gradually peak when he was most
influential. As such, the notion of high word count, high-thread starting and a relatively
high posting behaviour appear to correspond with this user in particular.
4.3.1.2. Black Magician
0
50
100
150
200
2006 2007 2008 2009 2010 2011
Year
Average Word Count (Per Year)
Average Thread Word Count Average Post Word Count

244
Figure 4.4. Chart displaying posting behaviour from 2005 – 2011 for LWP Black
Magician.
Figure 4.5. Chart displaying thread starting behaviour from 2005 – 2011 for LWP
Black Magician.
0
100
200
300
400
500
600
2005 2006 2007 2008 2009 2010 2011
To
tal
Nu
be
r o
f P
ost
Years
Total Number of Posts (Per Year)
0
2
4
6
8
10
2005 2006 2007 2008 2009 2010 2011
To
tal
Nu
mb
er
of
Th
rea
d S
tart
ed
Year
Number of Threads Started (Per Year)

245
Figure 4.6. Chart displaying average word count behaviour from 2005 – 2011 for LWP
Black Magician.
Synopsis of Black Magician
Black Magician’s posting frequency appears to correspond to some degree with his
social status. This user was deemed to be influential throughout the cluster analysis
(from 2009-2011). While his posting behaviour increases with years in the community,
his thread starting behaviour does not display a huge variation for each year. Thread
behaviour is not consistent with postings as the highest number of threads started per
year was in 2006 (which is not included in the cluster analysis to assess influence at
that time). However, 2010 does show a high number of thread-starting behaviour,
which is when this user was supposedly influential within the community, showing that
thread starting behaviour may well be a factor entwined in status.
4.3.1.3. Community Member
0
200
400
600
800
1000
2005 2006 2008 2009 2010 2011
Year
Average Word Count (Per Year)
Average Post Word Average Thread Word

246
Figure 4.7. Chart displaying posting behaviour from 2008 – 2011 for LWP member
Community Member.
Figure 4.8. Chart displaying total number of thread started each from 2008 – 2011 for
LWP member Community Member.
0
50
100
150
200
250
300
350
2009 2010 2011To
tal
Nu
mb
er
of
Po
sts
Years
Total Number of Posts (Per Year)
0
1
2
3
4
2009 2010 2011
To
tal
Nu
mb
er
of
Th
rea
d
Sta
rte
d
Years
Total Number of Threads Started (Per Year)
0
1000
2000
3000
2009 2010 2011
Year
Average Word Count (Per Year)
Average Thread Word Count Average Post Word Count

247
Figure 4.9. Chart displaying average word count for threads and posts from 2008 –
2011 for LWP member Community Member.
Synopsis of Community Member
Community Member’s online behaviour appears to correspond with status within the
community. High volumes of posts and threads-started parallel his high status within
the community, thus confirming the transition of social roles in the table above as there
was limited activity when this user was a contributor within LWP. Average word count
behaviour also appears consistent with the notion of status.
4.3.1.4. Guerrilla Warfare
Figure 4.10. Chart Displaying posting behaviour from 2004 – 2010 for LWP member
Guerrilla Warfare.
0
50
100
150
200
250
2004 2005 2006 2007 2008 2009 2010To
tal
Nu
mb
er
of
Po
sts
Years
Total Number of Posts (Per Year)

248
Figure 4.11. Chart displaying total number of thread started each from 2004 – 2010 for
LWP member Guerrilla Warfare.
Figure 4.12. Chart displaying average word count for threads and posts from 2004 –
2010 for LWP member Guerrilla Warfare.
Synopsis of Guerrilla Warfare
Guerrilla Warfare’s behavioural pattern also confirms some aspects of social capital
and high number of posts and threads-started. This user was influential in 2009 then
was demoted to a lesser social role. Whilst the highest number of posts and threads is
in 2004, the cluster analysis presented in the table above only examined behaviour
between 2009 – 2011. However, from the information presented above, it suggests that
0
1
2
3
4
5
6
7
2004 2005 2006 2007 2008 2009 2010To
tal
Nu
mb
er
of
Th
rea
ds
Sta
rte
d
Year
Total Number of Threads Started (Per Year)
0
200
400
600
800
1000
2004 2005 2006 2007 2008 2009 2010
Year
Average Word Count (Per Year)
Average Word Count Posts Average Word Count Threads

249
this user had been influential in the community for some time. There is no available
information for this community member in 2011 as he was banned from the LWP
community.
4.4.2 Individual LWP Members that Lost Status
4.4.2.1. Skinhead
Figure 4.13. Chart displaying posting behaviour from 2004 – 2010 for LWP member
Skinhead.
Figure 4.14. Chart displaying total number of thread started each from 2004 – 2010 for
LWP member Skinhead.
0
50
100
150
200
250
2004 2005 2006 2007 2008 2009 2010
To
tal
Nu
mb
er
of
Po
sts
Year
Total Number of Post (Per Year)
0
1
2
3
2004 2005 2006 2007 2008 2009 2010
To
tal
Nu
mb
er
of
Th
rea
ds
Sta
rte
d
Year)
Total Number of Threads Started (Per Year)

250
Figure 4.15. Chart displaying average word count for threads and posts from 2004 –
2010 for LWP member Skinhead.
Synopsis of Skinhead
The above role transition table states that this member was influential in December
2010. With regards to thread starting behaviour and average word count the bar charts
above seem to confirm the notion that more threads are started when influence is highest
and word count increases. However, this user had a relatively constant posting
behaviour; thus it is only with thread starting behaviour a clear difference can be seen.
4.2.2.2. Kay
Figure 4.16. Chart displaying posting behaviour from 2008 – 2011 for LWP member
Kay.
0
10
20
30
40
50
2005 2006 2007 2008 2009 2010 2011
Year
Average Word Count (Per Year)
Average Word Count Posts Average Word Count Threads
0
100
200
300
400
2008 2009 2010 2011To
tal
Nu
mb
er
of
Po
sts
Year
Total Number of Posts (Per Year)

251
Figure 4.17. Chart displaying total number of thread started each from 2008 – 2011 for
LWP member Kay.
Figure 4.18. Chart displaying total average word count for threads and posts each year
from 2008 – 2011 for LWP member Kay.
Synopsis of Kay
The above graphs illustrating posting, thread starting and word count appear to
correspond with the notion that Skinhead was influential in early part of the cluster
around December 2009. Equally, there is a clear drop in posting and thread starting
behaviour, which corresponds with a change in social role. This suggests that this LWP
member posted more and started more threads when categorised as influential.
However, between December 2010 and June 2011 Kay rose to status once again, but
little evidence of a dramatic difference in the posting and thread starting behaviour as
0
2
4
6
8
2008 2009 2010 2011To
tal
Nu
mb
er
of
Th
rea
ds
Sta
rte
d
Years
Total Number of Threads Started (Per Year)
0
200
400
600
800
2008 2009 2010 2011
Year
Average Word Count (Per Year)
Average Post Word Count Average Thread Word Count
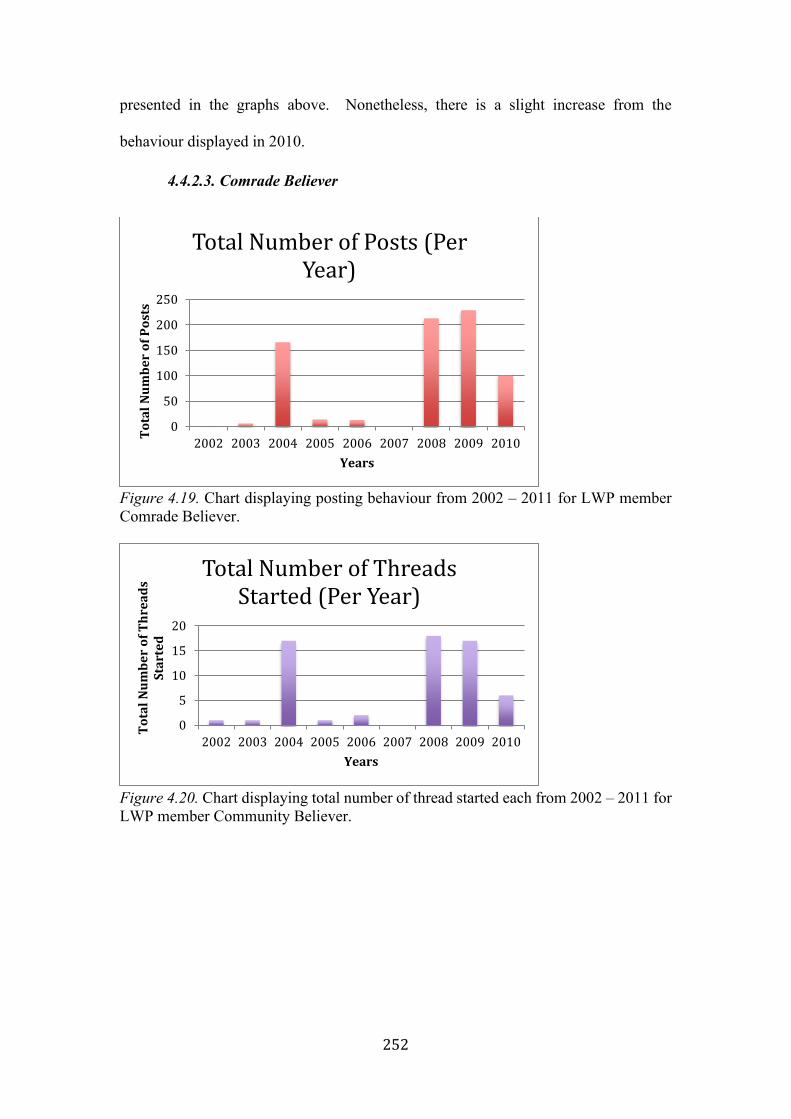
252
presented in the graphs above. Nonetheless, there is a slight increase from the
behaviour displayed in 2010.
4.4.2.3. Comrade Believer
Figure 4.19. Chart displaying posting behaviour from 2002 – 2011 for LWP member
Comrade Believer.
Figure 4.20. Chart displaying total number of thread started each from 2002 – 2011 for
LWP member Community Believer.
0
50
100
150
200
250
2002 2003 2004 2005 2006 2007 2008 2009 2010
To
tal
Nu
mb
er
of
Po
sts
Years
Total Number of Posts (Per Year)
0
5
10
15
20
2002 2003 2004 2005 2006 2007 2008 2009 2010
To
tal
Nu
mb
er
of
Th
rea
ds
Sta
rte
d
Years
Total Number of Threads Started (Per Year)

253
Figure 4.21. Chart displaying average word count for threads and posts each year from
2002 – 2011 for LWP member Comrade Believer.
Synopsis of Community Believer
While the cluster analysis only illustrates status between 2009 – 2011, the above graph
dates back to Community Believers entry into the community. As illustrated above,
there is a high level of both thread starting, posting behaviour and an increased word
count in 2004-2005. Equally, there is a high level of activity within the community in
2009 when this LWP community member was influential within the community. The
decrease in 2010 corresponds with a transition to contributor.
4.4.2.4. Brothering
0
50
100
150
200
250
300
2003 2004 2005 2006 2007 2008 2009 2010
Year
Average Word Count (Per Year)
Average Post Word Count Average Thread Word Count
0
100
200
300
400
500
2008 2009 2010 2011To
tal
Nu
mb
er
of
Po
sts
Years
Total Number of Posts (Per Year)

254
Figure 4.22. Chart displaying posting behaviour from 2008 – 2011 for LWP member
Brothering.
Figure 4.23. Chart displaying total number of thread started each from 2008 – 2011 for
LWP member Brothering.
Figure 4.24. Chart displaying average word count each year from 2008 – 2011 for LWP
member Brothering.
Synopsis of Brothering
Interestingly, the information displayed in the charts above for thread starting frequency
does not necessarily correspond with the cluster analysis. Between December 2010
and June 2011 Brothering was categorised as an influential. Yet, posting behaviour and
thread starting behaviour are highest in 2008. However, there is an increase in posting
behaviour during 2011, which may suggest posting behaviour is related to status and
0
5
10
15
20
25
2008 2009 2010 2011
To
tal
Nu
mb
er
of
Th
rea
ds
Sta
rte
d
Years
Total Number of Threads Started (Per Year)
0
50
100
150
2008 2009 2010 2011
Year
Average Word Count (Per Year)
Average Post Word Count Average Thread Word Count

255
influence. Nonetheless, word count for threads and posts does correspond with social
status between 2010 – 2011.
LWP Members that Gained Reputation over a Two-Year Period
Black Magician
24 - 18 months 6 - 0 months
24-18 months 6-0 months
Betweenness Centrality 13776.495 12717.185
PageRank 5.906 5.371
Figure 4.26. Two social network analysis diagrams for online community member
“Black Magician” taken over a two-year period from November 2009 – November
2011.
Both of these figures are taken from the cluster analysis when this user was categorised
as an influential individual and shows a continuous level of centrality and connectivity.
Guy Fawkes
18 - 12 months 12 - 6 months
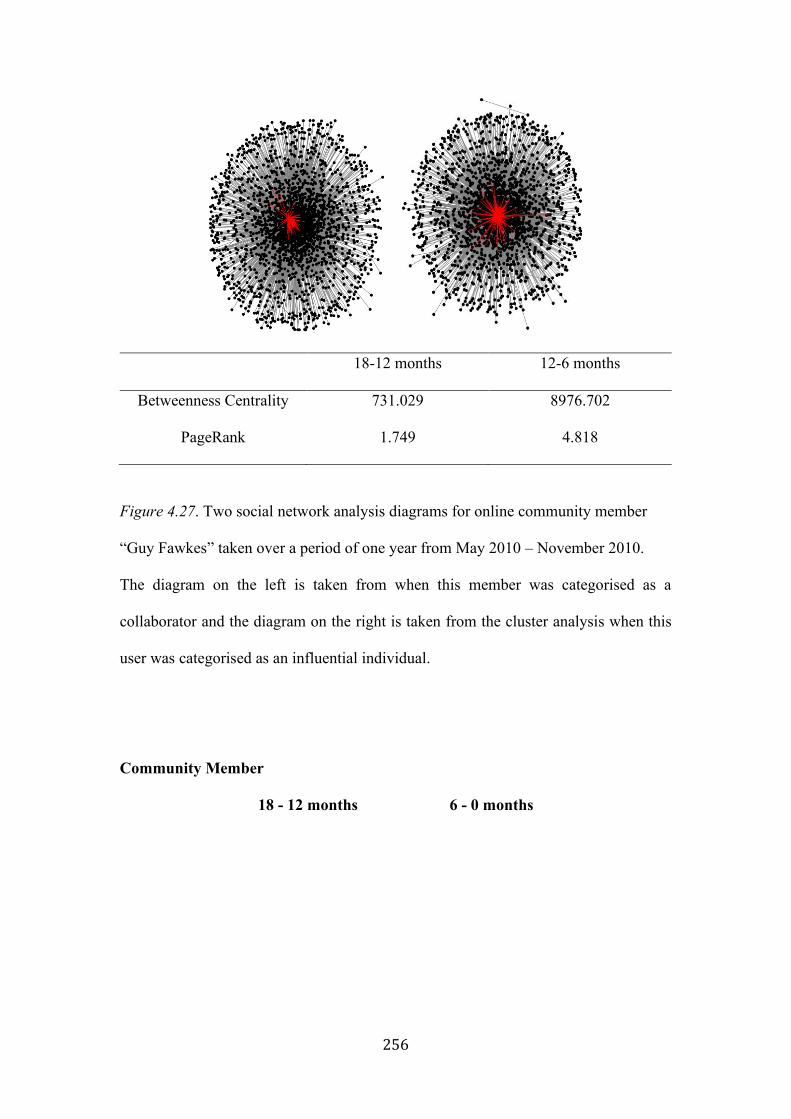
256
18-12 months 12-6 months
Betweenness Centrality 731.029
8976.702
PageRank 1.749 4.818
Figure 4.27. Two social network analysis diagrams for online community member
“Guy Fawkes” taken over a period of one year from May 2010 – November 2010.
The diagram on the left is taken from when this member was categorised as a
collaborator and the diagram on the right is taken from the cluster analysis when this
user was categorised as an influential individual.
Community Member
18 - 12 months 6 - 0 months

257
18-12 months 6-0 months
Betweenness Centrality 10889.218 44854.614
PageRank 2.338 7.645
Figure 4.28. Two social network analysis diagrams for online community member
“Community Member” taken over an 18 month period of one year from May 2010 –
November 2011.
The diagram on the left is taken from the cluster analysis when this online community
member was categorised as a collaborator. Alternatively, the diagram on the right is
taken when this LWP member was categorised as an influential individual with the
community.
Guerrilla Warfare
24 - 18 months 18 - 12 months

258
24-18 months 18-12 months
Betweenness Centrality 4096.360 1194.875
PageRank 3.950 1.882
Figure 4.29. Two social network analysis diagrams for online community member
“Guerrilla Warfare” taken over a one year period November 2009 – November 2010.
The diagram on the left illustrates when “Guerrilla Warfare” was categorised as an
influential member of the community via the cluster analysis. Moreover, the diagram
on the right demonstrates a change in social roles and centrality within the network
when this member was categorised as a collaborator. This user was banned for the
remainder of the cluster analysis.
LWP Members that Lost Reputation over a Two-Year Period
Kay
12 – 6 months 6 – 0 months

259
12-6 months 6-0 months
Betweenness Centrality 15972.326 0.369
PageRank 4.624 0.297
Figure 4.30. Two social network analysis diagrams for online community member
“Kay” taken over a one year period November 2010 – November 2011.
The diagram on the left is taken from when the cluster analysis categorised “Kay” as
an influential community member. Alternatively, the diagram on the right illustrates a
change in potential category to collaborator.
Comrade Believer
24 – 18 months 12 – 6 months

260
24-18 months 12-6 months
Betweenness Centrality 1982.298 0.000
PageRank 3.330 0.170
Figure 4.31. Two social network analysis diagrams for online community member
“CommunityBeliever” taken over 18 month period November 2009 – May 2011.
The diagram on the left is taken when the cluster analysis categorised
“CommunityBeliever” as an influential member within the community and the diagram
on the right shows the network structure for CommunityBeliever when the cluster
analysis deemed this member to be a contributor.
Skinhead
12 - 6 months 6-0 months

261
Figure 4.32. Two social network analysis diagrams for online community member
“Skinhead” taken over a one year period November 2010 – November 2011.
12-6 months 6-0 months
Betweenness Centrality 9972.139 383.367
PageRank 3.201 1.218
The diagram on the left shows LWP member “Skinhead” when he was influential
within the community and the diagram to the right shows a change in social role to
collaborator.
Brothering
18 – 12 months 12 – 6 months

262
18-12 months 12-6 months
Betweenness Centrality 46.671 4028.632
PageRank 0.426 3.629
Figure 4.33. Two social network analysis diagrams for online community member
“Skinhead” taken over a one year period May 2010 – May 2011.
The diagram on the left illustrates “Brothering” when he was a collaborator within the
community and the diagram on the right shows a change in social role to influential
status 6 months later.

263
4.8.1. Individual Synopsis for Eight Islamic United Members
4.8.1.1.Intoodeep
Figure 4.38. Chart displaying total number of posts per year from 2006 – 2011 for IU
community member Intoodeep.
Figure 4.39. Chart displaying total number of threads started per year from 2006 –
2011 for IU community member Intoodeep.
0
50
100
150
200
250
300
350
400
2006 2007 2008 2009 2010 2011
To
tal
Nu
mb
er
of
Po
sts
Years
Total Number of Posts (Per Year)
0
5
10
15
20
2006 2007 2008 2009 2010 2011
To
tal
Th
rea
ds
Sta
rte
d
Years
Total Number of Threads Started (Per Year)

264
Figure 4.40. Chart displaying average word count for threads and posts each year
from 2006 – 2011 for IU community member Intoodeep.
Synopsis of Intoodeep
The charts above appear to correspond with the notion that Intoodeep was an influential
member of the IU community in 2011. Equally, there is a relatively steady increase of
posts, threads and average word count leading upon a peak in 2011.
4.8.1.2. Gag Order
Figure 4.41. Chart displaying total number of posts per year for from 2006– 2011 for
IU community member Gag Order.
0
100
200
300
400
500
600
700
2006 2007 2008 2009 2010 2011
Av
era
ge
Wo
rd C
ou
nt
Years
Average Word Count (Per Year)
Average Word Count Posts Average Word Count Threads
0
50
100
150
200
250
300
350
400
2006 2007 2008 2009 2010 2011
To
tal
Nu
mb
er o
f P
ost
s
Year
Total Number of Posts (Per Year)

265
Figure 4.42. Displaying total number of threads started per year for from 2006 – 2011
for IU community member Gag Order.
Figure 4.43. Displaying average word count each year from 2006 – 2011 for IU
community member Gag Order.
Synopsis for Gag Order
According to the cluster analysis Gag Order was influential within the IU community
throughout 2011; however, the average word count per posts and threads does not
appear to correspond with the notion that individuals have a higher word count when
0
5
10
15
20
2006 2007 2008 2009 2010 2011
To
tal
Nu
mb
er
of
Th
rea
d S
tart
ed
Years
Total Number of Threads Started (Per Year)
0
50
100
150
200
2006 2007 2008 2009 2010 2011
Years
Average Word Count (Per Year)
Average Word Count Posts Average Word Count Threads

266
influential within a community. Nonetheless, thread starting behaviour and posting
behaviour does peak when status was gained within the community.
4.8.1.3. Al-Omari
Figure 4.44. Chart displaying average word count each year from 2006 – 2011 for IU
community member Gag Order.
Figure 4.45. Chart displaying total number of threads per year for from 2007 – 2011
for IU community member Al-Omari.
0
200
400
600
800
1000
2007 2008 2009 2010 2011
To
tal
Nu
mb
er
of
Po
sts
Years
Total Number of Posts (Per Year)
0
2
4
6
8
10
12
14
2007 2008 2009 2010 2011
To
tal
Nu
mb
er
of
Th
rea
ds
Sta
rte
d
Years
Total Number of Threads Started (Per Year)
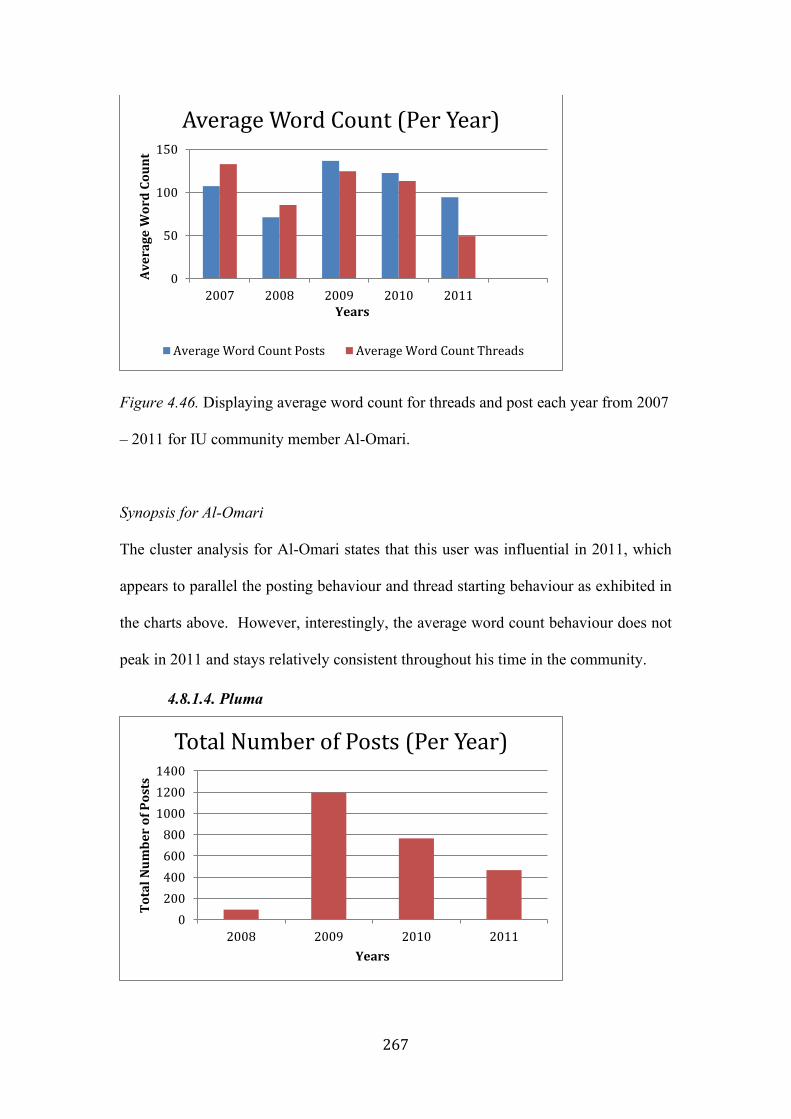
267
Figure 4.46. Displaying average word count for threads and post each year from 2007
– 2011 for IU community member Al-Omari.
Synopsis for Al-Omari
The cluster analysis for Al-Omari states that this user was influential in 2011, which
appears to parallel the posting behaviour and thread starting behaviour as exhibited in
the charts above. However, interestingly, the average word count behaviour does not
peak in 2011 and stays relatively consistent throughout his time in the community.
4.8.1.4. Pluma
0
50
100
150
2007 2008 2009 2010 2011
Av
era
ge
Wo
rd C
ou
nt
Years
Average Word Count (Per Year)
Average Word Count Posts Average Word Count Threads
0
200
400
600
800
1000
1200
1400
2008 2009 2010 2011
To
tal
Nu
mb
er
of
Po
sts
Years
Total Number of Posts (Per Year)
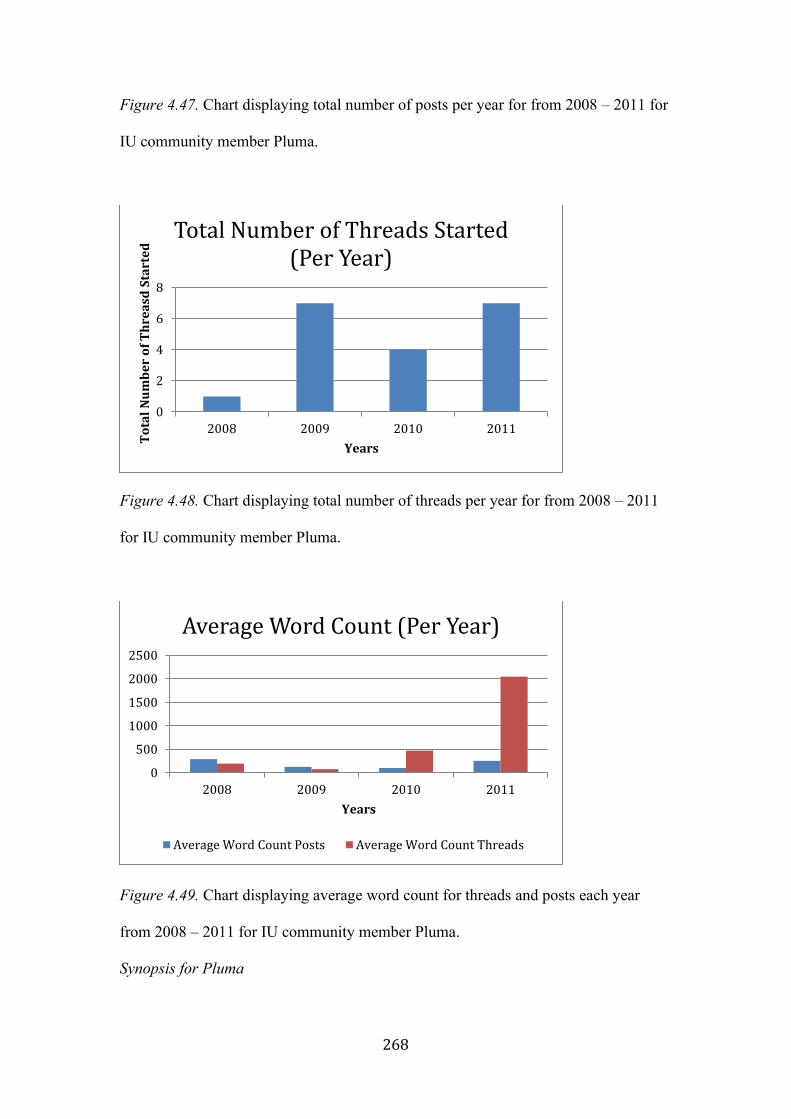
268
Figure 4.47. Chart displaying total number of posts per year for from 2008 – 2011 for
IU community member Pluma.
Figure 4.48. Chart displaying total number of threads per year for from 2008 – 2011
for IU community member Pluma.
Figure 4.49. Chart displaying average word count for threads and posts each year
from 2008 – 2011 for IU community member Pluma.
Synopsis for Pluma
0
2
4
6
8
2008 2009 2010 2011
To
tal
Nu
mb
er
of
Th
rea
sd S
tart
ed
Years
Total Number of Threads Started (Per Year)
0
500
1000
1500
2000
2500
2008 2009 2010 2011
Years
Average Word Count (Per Year)
Average Word Count Posts Average Word Count Threads

269
Posting behaviour and thread starting behaviour for IU member Pluma coincides with
that of the cluster analysis, supporting the notion that thread starting behaviour and
posting behaviour increases with influence. However, average word count peaks in
2011; while Pluma is still categorised as influential at this time, one would expect to
see an increase in 2009 when posts and threads were at their highest.
4.8.1.5.Weshallnotkeepsilent
Figure 4.50. Chart displaying total number of posts per year for from 2010 – 2011 for
IU community member Weshallnotkeepsilent.
0
50
100
150
200
250
2010 2011
To
tal
Nu
mb
er
of
Po
sts
Years
Total Number of Posts (Per Year)
0
5
10
15
20
25
30
35
40
2010 2011
To
tal
Nu
mb
er
of
Th
rea
ds
Sta
rte
d
Years
Total Number of Threads Started (Per Year)

270
Figure 4.51. Chart displaying total number of threads per year for from 2010 – 2011
for IU community member Weshallnotkeepsilent.
Figure 4.51. Chart displaying average word count for threads and posts each year
from 2010 – 2011 for IU community member Weshallnotkeepsilent.
Synopsis for Weshallnotkeepsilent
Interestingly, both the thread starting behaviour and posting behaviour is consistent
with the notion that Weshallnotkeepsilent was influential in 2010. However, the
average word count for threads dramatically increases in 2011, which is not consistent
with the previous charts or the cluster analysis. There is no other information for this
user.
0
100
200
300
400
500
600
700
2010 2011
Av
era
ge
Wo
rd C
ou
nt
Years
Average Word Count (Per Year)
Average Word Count Posts Average Word Count Threads

271
4.8.1.6. Free the Oppressed
Figure 4.53. Chart displaying total number of posts per year for from 2009 – 2010 for
IU community member Free the Oppressed.
Figure 4.54. Displaying total number of threads per year for from 2009 – 2010 for IU
community member Free the Oppressed.
0
100
200
300
400
500
600
700
800
2009 2010
Su
m o
f P
ost
s
Years
Total Number of Posts (Per Year)
0
20
40
60
80
100
2009 2010
Su
m o
f T
hre
ad
s
Years
Total Number of Threads Started (Per Year)

272
Figure 4.55. Chart displaying total number of posts per year for from 2009 – 2010 for
IU community member Free the Oppressed.
Synopsis for Free the Oppressed
All of the charts above appear to support each other and the notion that Free the
Oppressed was influential between December 2009 – December 2010. Equally,
average word count, threads starting behaviour and posting behaviour all peaked at the
same point in 2010. There is no more available information after this point as Free the
Oppressed became inactive in the community after this point.
4.8.1.7. Umar247
0
200
400
600
800
2009 2010
Years
Average Word Count (Per Year)
Average Word Count Posts Average Word Count Threads
0
100
200
300
400
500
600
2008 2009 2010 2011
To
tal
Nu
mb
er
of
Po
sts
Years
Total Number of Posts (Per Year)

273
Figure 4.56. Chart displaying total number of posts per year for from 2008 – 2011 for
IU community member Umar247.
Figure 4.57. Chart displaying total number of threads per year for from 2008 – 2011
for IU community member Umar247.
Figure 4.58. Chart displaying average word count each year from 2008 – 2011 for IU
community member Umar247.
0
10
20
30
40
50
60
70
80
2008 2009 2010 2011
To
tal
Nu
mb
er
of
Th
rea
ds
Sta
rte
d
Years
Total Number of Threads Started (Per Year)
0
100
200
300
400
500
600
700
800
2008 2009 2010 2011
Years
Average Word Count (Per Year)
Average Word Count Posts Average Word Count Threads

274
Synopsis for Umar247
According to the cluster analysis, this individual community member was deemed to
be influential in 2009-2010. Posting behaviour appears to be highest at this point in
time suggesting that frequent posting is a factor involved within high ranking status.
Thread starting behaviour was also quite high at this point too. Interestingly, average
word count does not appear to follow this pattern as exhibited in the charts above.
While average thread word count is considerably higher than average post word count,
both have a relatively stable frequency, regardless of influence or status., suggesting
longer posts and threads may not be a factor in high-ranking status.
4.8.1.8. Iqra
Figure 4.59. Chart displaying total number of posts per year for from 2006 – 2011 for
IU community member Iqra.
0
20
40
60
80
100
120
140
160
180
2006 2007 2008 2009 2010 2011
To
tal
Nu
mb
er
of
Po
sts
Years
Total Number of Posts (Per Year)

275
Figure 4.60. Chart displaying total number of threads per year for from 2006 – 2011
for IU community member Iqra.
Figure 4.61. Chart displaying total number of threads per year for from 2006 – 2011
for IU community member Iqra.
Synopsis for Iqra
The above cluster analysis only ranges from December 2009-2011, therefore, one
cannot determine whether Iqra was influential in 2008/2009 or not. However, posting
0
5
10
15
20
25
2006 2007 2008 2009 2010 2011
To
tal
Nu
mb
er
of
Th
rea
ds
Sta
rte
d
Years
Total Number of Threads Started (Per Year)
0
100
200
300
400
500
600
700
2006 2007 2008 2009 2010 2011
Years
Average Word Count (Per Year)
Average Word Count Posts Average Word Count Threads

276
behaviour and thread starting behaviour is highest in 2009 suggesting a somewhat high
ranking social status. According to the above cluster analysis, Iqra was influential in
2010, however, the above graphs do not necessarily coincide with this information.
4.8.2. Social Network Analysis for Islamic United
As mentioned in the LWP part of this chapter, the social network graphs
illustrate social structure and visually demonstrate how connected and central each of
the eight individuals are within their respected community. As such, the diagrams
below reveal social transitions and changes in structure over a two-year period. As
alluded to previously, the nodes represent other members and the lines are the
connections or social ties illustrating communication between the two members. The
more ties an individual had (or influential ties) the higher their social status within a
community.
4.8.2.1. IU Members that Gained Reputation over a Two-Year Period
Gag Order
24 - 18 months 6 - 0 months
24-18 months 6-0 months
Betweenness 543.240 9129.061

277
PageRank 2.169 6.385
Figure 4.62. Two social network analysis diagrams for user “Gag Order” taken over
a two-year period from December 2009 – December 2011.
Far left graph is taken from 24-18 months cluster analysis when “Gag Order” was
categorised as a collaborator within the community and graph on the right is the most
recent cluster analysis from 6-0 months when this user was deemed to be an
influential individual/popular participant within IU.
Intoodeep
24 - 18 months 6 - 0 months
24-18 months 6-0 months
Betweenness 4837.805 2115.090
PageRank 4.492 3.250
Figure 4.63. Two social network analysis diagrams for user “Intoodeep” taken over a
two-year period from December 2009 – December 2011.

278
The graph on the right demonstrates community member “Intoodeep’s” connectivity
and social structure when he was a contributor within the community. Alternatively,
the second diagram shows this user when he was an influential individual within IU.
Pluma
24 - 18 months 6 - 0 months
24-18 months 6-0 months
Betweenness 20651.617 5126.101
PageRank 9.052 4.597
Figure 4.64. Two social network analysis diagrams for user “Pluma” taken over a
two-year period from December 2009 – December 2011.
The network graph on the left shows “Pluma” when he was a collaborator within the
online community IU and the graph on the right shows the same user 2 years later,
when they had supposedly gained status and influence within the online community
(based on the cluster analysis).
Al-Omari

279
24 - 18 months 6 - 0 months
24-18 months 6-0 months
Betweenness 848.534 4480.231
PageRank 1.810 4.596
Figure 4.65. Two social network analysis diagrams for user “Al-Omari” taken over a
two-year period from December 2009 – December 2011.
The network graph on the left shows “Al-Omari’ when he was a contributor within
the IU community. The graph on the right shows this user two years later when they
became influential.
4.7.2.2. IU Members that Lost Reputation over a Two-Year Period

280
Umar 247
18 - 12 months 6 - 0 months
18-12 months 6-0 months
Betweenness 4377.714 1074.166
PageRank 5.127 2.903
Figure 4.66. Two social network analysis diagrams for user “Umar247” taken over an
18 month year period from June 2010 – December 2011.
The graph on the left shows “Umar247” when he was influential within the
community, alternatively, the second diagram illustrates a loss in connectivity 18
months later when they were demoted to the lesser status of collaborator.

281
Free the Oppressed
24 - 18 months 6 - 0 months
24-18 months 6-0 months
Betweenness 11952.395 0.000
PageRank 7.023 0.197
Figure 4.67. Two social network analysis diagrams for user “Free the Oppressed”
taken over a two-year period from December 2009 – December 2011.
As illustrated by the above diagrams, at 24-18 months community member “Free the
Oppressed” was highly influential within the IU community, though became almost
entirely inactive two years later.

282
Iqra
24 - 18 months 6 - 0 months
24-18 months 6-0 months
Betweenness 0.000 2.017
PageRank 0.208 0.319
Figure 4.68. Two social network analysis diagrams for user “Iqra” taken over a two-
year period from December 2009 – December 2011. No info from when she was a
‘leader’
“Iqra” was an influential member in the 18-12 month cluster analysis; however there
is no information to illustrate the social network structure for this period.
Nonetheless, the second diagram supports the notion that “Iqra” was almost entirely
inactive at the 6-0 month analysis and had lost status within the online community.

283
Weshallnotkeepsilent
18 - 12 months 6 - 0 months
18-12 months 6-0 months
Betweenness 5111.670 845.981
PageRank 3.347 2.423
Figure 4.69. Two social network analysis diagrams for user “Weshallnotkeepsilent”
taken over an 18 month period from June 2010 – December 2011.
The network graph on the left illustrates “Weshallnotkeepsilents’s” social network
structure and connectivity at 18-12 months. The second graph shows the same user
18 months later when they had lost some of their status within the community and
made the role transition from influential to collaborator.

284
Inferential Statistics LWP
Table 4.9.
Summary of ANOVA
df SS MS F η2 p
Seniority 3 89036527.92 29678842.64 2.792* .075 .044*
Total Post
Word Count
3 5.264E+11 1.755E+11 3.606* .095 .016*
Word Count
(per post)
3 1973.796 657.932 .392 .011 .759
Reputation 3 216021652.6 72007217.52 18.910 .355 .000**
Number of
Thanks
3 29788114.47 9929371.490 15.913 .317 .000**
Thread
Total
3 27966.798 9322.266 3.296 .088 .023*
Total
Thread
Word Count
3 1494058712 498019570.6 2.722 .073 .048*
Word Count
(per Thread)
3 162875.708 54291.903 .392 .006 .899
Average
Number of
Thanks
(per post)
3 4490.945 1496.982 2.913 .078 .038*
Note. * indicated findings that are significant at the p<0.05 level, ** illustrates
significance at the p<0.001 level.
Table 4.10.
Multiple Comparisons and Mean Differences in Status for the Significant Dependent
Variables

285
Note. * indicated findings that are significant at the p<0.05 level, ** illustrates
significance at the p<0.001 level.
Table 4.12
Estimates of Fixed Effects for Model for Group Status*Month Thread Frequency
Parameter Estimate Std.
Error
Df t p 95% Confidence
Interval
Intercept
.024276 .006232 2546.000 3.895 .000** .012054 .036497
Dependent
Variable
Comparison Mean
Difference
p Games-Howells
95% CI
Seniority Always PP vs PP Demoted 1988.91 .011* 362.04, 3615.78
Word Count
for Posts
Always PP vs PP Demoted 153099.14 .001* 52299.52,
253898.75
Always PP vs Promoted PP 153170.99 .012* 26498.75,
279843.24
Reputation Always PP vs PP Demoted 2672.60 .000** 1632.21, 3712.99
Always PP vs PP Inactive 2937.75 .002* 982.65, 4892.85
Always PP vs Promoted PP 3184.58 .000** 2159.16, 4209.99
Number of
Thanks
Always PP vs PP Demoted 1144.45 .000** 658.11, 1630.80
Always PP vs PP Inactive 999.66 .000** 435.72, 1563.61
Always PP vs Promoted PP 1022.25 .000** 512.12, 1532.36
Thread
Count
Always PP vs PP Demoted 35.89 .013* 5.93, 65.85

286
Always
PP
07 0 . . . .
PP
Demoted -.04908 .009067 2546 -5.414 .000** -.066863 -.031305
PP
Inactive -.066345 .011968 2546.000 -5.544 .000** -.089813 -.042877
Promoted
to PP
-.012240 .009021 2546 -1.357 .175 -.029929 .005449
Note. As Always PP is the baseline group the incept value of .024276 represents the
mean thread frequency for Always PP.
Table 4.13.
Pairwise Comparisons for Group Status and Thread Frequency
Comparison Mean
Difference
p 95% Confidence Interval
Always PP vs Promoted 2.200* .000 2.038 2.362
Always PP vs Demoted 2.107* .000 1.948 2.267
Always PP vs PP
Inactive
2.084* .000 1.899 2.270
Table 4.15.
7 Always PP is set to zero as this is the baseline for status groups to assess these intercepts.
As SPSS automatically choses the last category groups were recoded to allow for this
meaningful comparison.

287
Estimates of Fixed Effects for Model for Group Status*Month Post Frequency
Parameter Estimate Std.
Error
df t p 95% Confidence
Interval
Intercept 1.095608 .087970 2546.000 12.454 .000**
.923109
Always PP 0b 0 . . .
.
PP Demoted
-2.323113 .127978 2546 -18.152 .000** -2.574065 -2.072161
PP Inactive
-1.878023 .168926 2546.000 -11.117 .000** -2.209268 -1.546777
Promoted to
PP -.430358 .127330 2546.000 -3.380 .001* -.680038 -.180677
Table 4.16.
Pairwise Comparisons for Group Status and Post Frequency
Comparison Mean
Difference
p 95% Confidence Interval
Always PP vs Promoted PP
73.139* .000** 71.853 76.425
Always PP vs Demoted 69.150* .000** 66.898 71.402
PP Demoted vs PP Inactive 66.940* .000** 64.319 69.561
Promoted to PP vs PP
Inactive
-7.199 .000** -9.869 -4.529

288
Promoted to PP vs PP
Demoted
-4.989
.000** -7.298 -2.680
Table 4.18.
Estimates of Fixed Effects for Model for Group Status*Month Number of Thanks
Frequency
Parameter Estimate Std.
Error
df t p 95% Confidence
Interval
Intercept 1.389133 .044865 2546.000 30.962 .000** 1.301156 1.477109
Always PP 08 0 . . . .
PP Demoted
-1.646879 .065270 2546 -25.232 .000** -1.774867 -1.518892
PP Inactive
-1.455835 .086154 2546.000 -16.898 .000** -1.624774 -1.286897
Promoted to
PP -1.032589 .064939 2546.000 -15.901 .000** -1.159928 -.905250
Note. As Always PP is the baseline group the intercept value of 1.389133 represents
the mean number of thanks for Always PP.
Table 4.19.
Pairwise Comparisons for Group Status and Number of Thanks Frequency
8 Always PP is set to zero as this is the baseline for status groups to assess these intercepts.
SPSS automatically choses the last category. Thus, groups were recoded to allow for this
meaningful comparison.

289
Comparison Mean
Difference
p 95% Confidence Interval
Always PP vs PP Inactive 28.539 0.000** 27.202 29.876
Always PP vs Demoted 29.162 0.000** 28.013 30.310
Always PP vs Promoted PP 30.138 0.000** 28.973 31.304
Promoted to PP vs PP Inactive -1.599 .012* -2.961 -.237
Table 4.21
Estimates of Fixed Effects for Model for Group Status*Month Number of Thanks
Frequency
Parameter Estimate Std.
Error
Df t p 95% Confidence
Interval
Intercept -.124935 .011555 2368 -10.812 .000** -.147594 -.102275
Always PP 0 0 . . . .
PP
Demoted -.051547 .017268 2368 -2.985 .003* -.085408 -.017685
PP
Inactive -.009758 .022647 2368.000 -.431 .667 -.054168 .034653
Promoted
to PP .090186 .018099 2368.000 4.983 .000** .054696 .125677
Note. Always PP is the baseline group the incept value of -.124935 represents the mean
number of thanks for Always PP.
Table 4.22
Pairwise Comparisons for Group Status and Average Number of Thanks Frequency
Comparison Mean Difference p 95% Confidence Interval
Always PP vs PP Inactive -.719 .000 -1.074 -.364
Always PP vs Promoted PP .353 .024 .030 .676

290
PP Demoted vs PP Inactive -.508 .001 -.871 .001
PP Demoted vs Promoted to
PP
.564
.000
.233
.896
PP Inactive vs Promoted to
PP
1.072 .000 .691 1.453
Inferential Statistics IU
Table 4.30
Summary of ANOVA
df SS MS F η2 p
Seniority 3 85845924.92 28615308.31 5.343 .334 .004*
Post Word
Count
3 2932895420 977631806.7 1.707 .138 .185
Average Post
Word Count
3 328400.598 9466.866 5.328 .333 .004*
Reputation 3 164632777.8 54877592.59 10.545 .497 .000**
Number of
Thanks
3 2618962.633 872987.544 7.294 .406 .001*
Thread Total 3 31314.367 10438.122 1.807 .145 .166
Thread Word
Count
3 5305109844 1768369948 .611 .054 .613
Average
Thread Word
Count
3 211179.191 70393.064 .662 .582 .058
Average
Number of
Thanks
3 70127.642 23375.881 .980 .084
.415
Note. * indicated findings that are significant at the p<0.05 level, ** illustrates
significance at the p<0.001 level.

291
Table 4.31
Multiple Comparisons and Mean Differences in Status for the Significant Dependent
Variables
Note. Findings are significant at the p<0.05 level.
Table 4.33
Estimates of Fixed Effects for Model for Group Status*Month Thread Frequency
Dependent
Variable
Comparison Mean
Difference
p Games-Howells
95% CI
Seniority Always PP vs PP Demoted 3285.17 .018* -1564.96, 8135.02
Always PP vs Inactive 3905.67 .006* -960.55, 8771.88
PP Inactive vs Promoted to PP -2661.56 .074* -8276.38, 2953.27
Reputation Always PP vs PP – Demoted 4800.00 .005* -1044.92, 10644.92
Always PP vs PP Inactive 5150.00 .003* -711.26, 11011.26
Always PP vs Promoted to PP 3405.56 .046* -2353.71, 9164.82
PP Demoted vs PP Inactive 350.00 .038* -279.11, 979.11
PP Demoted vs Promoted PP -1394.44 0.38* -3901.80, 1112.91
PP Inactive vs Promoted to PP -1744.44 .012* -4342.73, 853.84
Number of
Thanks
Always PP vs PP Demoted 587.68 .009* -198.59, 1373.96
Always PP vs PP Inactive 656.88 .004* -133.87, 1447.64
PP Demoted vs PP Inactive 69.20 .038* -55.53, 193.93
PP Demoted vs Promoted to PP -379.60 .049* -1112.42, 353.22
Promoted to PP vs PP Inactive 448.80 .021* -1195.69, 298.09
Average Post
Word Count
Always PP vs PP Inactive 64.0162 .036* 3.9965, 124.0359

292
Parameter Estimate Std.
Error
df t p 95%
Confidence
Interval
Intercept .588886 .067656 2270 8.704 .000 .456212 .721559
Always
PP
09 0 . . . .
PP
Demoted -.030823 .007002 2270 -4.402 .000 -.044554 -.017093
PP
Inactive -.054583 .020534 2270 -2.658 .008 -.094850 -.014316
Promoted
to PP -.010746 .006558 2270 -1.638 .101 -.023607 .002115
Note. As Always PP is the baseline group the incept value of .588886 represents the
mean month*status thread frequency for Always PP.
Table 4.34
Pairwise Comparisons for Group Status and Thread Frequency
Comparison Mean
Difference
p 95% Confidence Interval
Promoted to PP vs PP Demoted .433* .000** .303 .563
Promoted to PP vs PP Inactive .427* .023* .038 .817
Always PP vs PP Demoted .500* .000** .369 .630
Always PP vs PP Inactive .494* .005* .104 .884
Table 4.36.
Estimates of Fixed Effects for Model for Group Status*Month Number of Posts
Frequency
Parameter Estimate Std. Error df t P 95% Confidence Interval
9 Always PP is set to zero as this is the baseline for status groups to assess these
intercepts. As SPSS automatically choses the last category groups were recoded to
allow for this meaningful comparison.

293
Intercept 8.286013 .806825 2270.000 10.270 .000 6.703821 9.868205
Always PP 0 0 . . . .
PP Demoted -1.035868 .083500 2270 -12.406 .000 -1.199612 -.872124
PP Inactive -1.215556 .244876 2270.000 -4.964 .000 -1.695760 -.735352
Promoted to
PP
-.906747 .078212 2270 -11.593 .000 -1.060121 -.753372
Table 4.39.
Estimates of Fixed Effects for Model Group Status*Month for Number of Thanks
Frequency
Parameter Estimate Std. Error df t p 95% Confidence
Interval
Intercept .641972 .020224 2270 31.742 .000 .602311 .681632
Always PP 0 0 . . . .
PP Demoted -.556892 .030559 2270.000 -18.223 .000 -.616819 -.496965
PP Inactive -.642682 .089620 2270.000 -7.171 .000 -.818427 -.466937
Promoted to
PP -.231482 .028624 2270 -8.087 .000 -.287614 -.175350
Table 4.40
Pairwise Comparison for Group Status and Monthly Number of Thanks
Comparison Mean
Difference
p 95% Confidence
Interval
Always PP vs Promoted 1.219* .000** .680 1.758
Always PP vs PP
Demoted 2.929* .000** 2.359 3.498
Always PP vs PP
Inactive 3.340* .000** 1.640 5.041
Promoted to PP vs PP
Demoted 1.710* .000** 1.141 2.279

294
Promoted to PP vs PP
Inactive 2.122* .006** .421 3.822
Table 4.42
Estimates of Fixed Effects for Model for Group Status*Month Average Number of
Thanks Frequency
Parameter Estimate Std. Error df t p 95% Confidence Interval
Intercept -1.176069 .065679 682 -17.906 .000 -1.305027 -1.047111
Always PP 0 0 . . . .
PP Demoted .956235 .164731 682.000 5.805 .000 .632794 1.279677
PP Inactive 1.551069 1.530864 682 1.013 .311 -1.454704 4.556842
Promoted to
PP -.155648 .106459 682.000 -1.462 .144 -.364675 .053378
Table 4.43
Pairwise Comparison for Group Status and Monthly Average Number of Thanks
Comparison Mean
Difference
p 95% Confidence
Interval
Promoted to PP vs PP
Demoted 3.872* .000** 2.005 5.739
Always PP vs PP
Demoted 3.770* .000** 1.936 5.603
Table 4.37.
Pairwise Comparisons for Group Status and Post Frequency
Comparison Mean
Difference
p 95% Confidence Interval

295
Always PP vs PP Demoted 14.890* .000** 13.335 16.446
Always PP vs PP Inactive 16.627* .000** 11.980 21.274
Promoted to PP vs PP Demoted 15.820* .000** 14.266 17.375
Promoted PP vs PP Inactive 17.557* .000** 12.911 22.203

296
0Appendix 5: Sample Theme Table for Phase Two
RESTRICTED ACESS