Using Fuzzy Cognitive Maps as a System Model for Failure Modes and Effects Analysis
23
NOgl]t°ttOIJ.AND Intelligent Systems Using Fuzzy Cognitive Maps as a System Model for Failure Modes and Effects Analysis C. ENRIQUE PEL~Z AND JOHN B. BOWLES Electrical and Computer EngineeringDepartment, Universityof South Carolina, Columbia, South Carolina 29208 ABSTRACT This paper explores the application of Fuzzy Cognitive Maps (FCM) to Failure Modes and Effects Analysis (FMEA). FMEAs are used in reliability and safety evalua- tions of complex systems to determine the effects of component failures on the system operation. FCMs use a digraph to show cause and effect relationships between con- cepts; thus, they can represent the causal relationships needed for the FMEA and provide a new strategy for predicting failure effects in a complex system. 1. INTRODUCTION Cognitive maps were introduced by Axelrod as a formal way of model- ing decision making in social and political systems [1]. In a cognitive map, concepts such as "interest rates," "unemployment .... business investment," etc., are represented as nodes in a directed graph (see Figure 1). Arrows from one node (concept) to another describe the relations between the concepts. These arrows are labeled with a plus, "+," to indicate that increasing one concept leads to an increase in the other, and a minus, "-," to indicate that increasing one causes the other to decrease. For example, in Figure 1, an increase in interest rates causes a decrease in business investment and an increase in unemployment. Fuzzy Cognitive Maps (FCM) extend the idea of cognitive maps by allowing the concepts to be represented linguistically with an associated fuzzy set [2, 3] rather than requiring them to be precise. Further extensions by Taber [4], Kosko [3, 5], and Pel~iez [6] allow fuzzy numbers or linguistic terms to be used to describe the degree of the relationship between concepts. INFORMATION SCIENCES 88, 177-199 (1996) © Elsevier Science Inc. 1996 0020-0255/96/$15.00 655 Avenue of the Americas, New York, NY 10010 SSDI 0020-0255(95)00161-H
-
Upload
independent -
Category
Documents
-
view
2 -
download
0
Transcript of Using Fuzzy Cognitive Maps as a System Model for Failure Modes and Effects Analysis
NOgl]t° ttOIJ.AND
Inte l l igent S y s t em s
Using Fuzzy Cognitive Maps as a System Model for Failure Modes and Effects Analysis
C. ENRIQUE P E L ~ Z AND JOHN B. BOWLES
Electrical and Computer Engineering Department, University of South Carolina, Columbia, South Carolina 29208
ABSTRACT
This paper explores the application of Fuzzy Cognitive Maps (FCM) to Failure Modes and Effects Analysis (FMEA). FMEAs are used in reliability and safety evalua- tions of complex systems to determine the effects of component failures on the system operation. FCMs use a digraph to show cause and effect relationships between con- cepts; thus, they can represent the causal relationships needed for the FMEA and provide a new strategy for predicting failure effects in a complex system.
1. I N T R O D U C T I O N
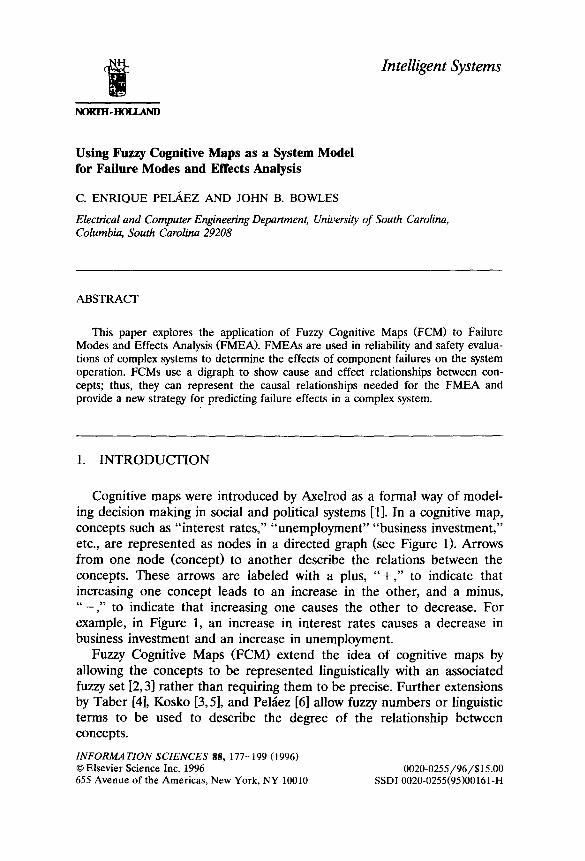
Cognitive maps were introduced by Axelrod as a formal way of model- ing decision making in social and political systems [1]. In a cognitive map, concepts such as "interest rates," "unemployment .... business investment," etc., are represented as nodes in a directed graph (see Figure 1). Arrows from one node (concept) to another describe the relations between the concepts. These arrows are labeled with a plus, " + , " to indicate that increasing one concept leads to an increase in the other, and a minus, " - , " to indicate that increasing one causes the other to decrease. For example, in Figure 1, an increase in interest rates causes a decrease in business investment and an increase in unemployment.
Fuzzy Cognitive Maps (FCM) extend the idea of cognitive maps by allowing the concepts to be represented linguistically with an associated fuzzy set [2, 3] rather than requiring them to be precise. Further extensions by Taber [4], Kosko [3, 5], and Pel~iez [6] allow fuzzy numbers or linguistic terms to be used to describe the degree of the relationship between concepts.
INFORMATION SCIENCES 88, 177-199 (1996) © Elsevier Science Inc. 1996 0020-0255/96/$15.00 655 Avenue of the Americas, New York, NY 10010 SSDI 0020-0255(95)00161-H
178 C. E. PELi~EZ AND J. B. BOWLES
+
Fig. 1. A cognitive map.
FCMs are analyzed either geometrically or numerically. A geometric analysis, which is practical only for very small FCMs, simply traces the increasing and decreasing effects along all paths from one concept to another.
In a numerical analysis, the concepts are represented by a state vector and the relations between concepts by a fuzzy relational matrix. A concept is " turned on" or "activated" by making its vector element a 1. New state vectors showing the effect of the activated concept are then computed by iteratively multiplying the previous state vector by the relational matrix using standard matrix multiplication:
[C 1 C 2...Cn]new = [C 1 C2. . -Cn]ol d
. . .
(1)
C i denotes the ith concept, and Cij is the relation from concept i to concept j. The iteration stops when a limit vector is reached (i.e., when [C 1 C2-..Cn]new = [C1 C2 ..-Q]old), when a limit cycle is reached (i.e., when [C 1 C2...C~],e w is the same as some previous vector), or after a predeter- mined number of iterations.
Several variations in FCMs are possible. In a bivalent state FCM, the values in the concept vector are restricted to {0,1}; the value 1 indicates that a state is " turned on" and the value 0 indicates that it is " turned off." In a trivalent state FCM, the values { - 1,0, + 1} are used; - 1 indicates a negative effect, 0 no effect, and + 1 a positive effect. The values of the state vector are generally thresholded to keep their values in the set {0,1} for bivalent FCMs and {-1 ,0 ,1} for trivalent FCMs, and the activated
U S I N G F U Z Z Y C O G N I T I V E MAPS 179
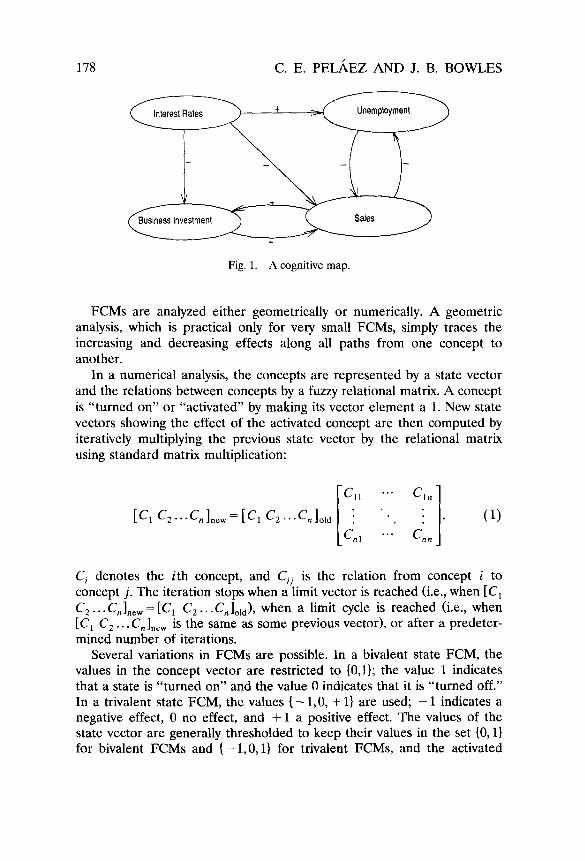
concept is reset to 1 af ter every matrix multiplication. The causal relations Ci~ may also be restricted to the values {0,1} for bivalent FCMs or { - 1, 0, + 1} for trivalent FCMs. In some cases, cont inuous values in [0,1] (or [ - 1, + 1]) may be used for the state vector a n d / o r the causal relation matrix. Bivalent and trivalent FCMs are finite state machines. FCMs in which the state vector can have continuous values may exhibit chaos [4, 7]. In principle, o ther fuzzy intersection, averaging, a n d / o r union operat ions could also be used instead of multiplication and thresholding. Figure 2 shows a simple FCM and its analysis.
Positive and negative feedback loops in the cognitive map show that changes in a concept can ultimately lead to still more changes. Stability (converging to a limit vector) is an important aspect of the analysis when predicting how changes in one concept will affect the overall system. Instability and the presence of limit cycles are of ten symptomatic of undesirable consequences [3].
+
[C A Cn Cc Col,,~ w = [C A CB Cc CD]old 0 0 0 0 0 --1 1
Concept A Active: [ 1 0 0 0l
1st multiplication: [0 1 - 1 - 1 ]
Thresholding: [ 1 1 - 1 - l ]
2nd multiplication: [0 2 -2 -3]
Thresholding: [ 1 1 - 1 - 1 ] ~ Limit vector
Fig. 2. Analysis of a simple FCM.

180 C. E. PEL,~EZ AND J. B. BOWLES
Kosko has advocated using FCMs to model and analyze descriptions of social interactions [2,3,5], as a way of introducing liveness into virtual reality simulations [7], and as a way of giving neural networks and other automata some "qualitative understanding" of the world in which they reside [5].
In this paper, we apply FCMs to model the behavior of a system for a Failure Modes and Effects Analysis (FMEA).
A FMEA is used in system design to ensure the safety and reliable operation of the system. The analysis requires that every possible failure mode (e.g., fail open, fail short, parameter change, leakage, etc.) of every component in the system be examined, and the effect of that failure mode on the system operation be determined. Where unacceptable failure effects occur, the design must be changed to eliminate that failure mode or procedures for mitigating its effects must be developed. As society be- comes ever more dependent on automated systems, more safety conscious, and more litigious, FMEA is becoming increasingly important in the design of many products--particularly automobiles, aircraft, and nuclear reactors [8, 9].
In spite of its importance, FMEA is one of the least liked tasks in the development process; it is monotonous, labor intensive, and error prone. Automated aids have been developed to help with many of the clerical aspects of the analysis--primarily formatting, storing, and merging reports - -and sometimes prompting the analyst with lists of component failure modes and descriptions of effects. Automating more than just the clerical aspects of the analysis has been an elusive goal for some time. (A good survey is contained in [10].)
2. CAUSAL REASONING FOR FAILURE MODES AND EFFECTS ANALYSIS
Automated FMEA analysis has been performed using primarily three technical approaches: numerical simulations, expert systems, and causal reasoning. Each of these techniques has both advantages and disadvan- tages.
Numerical Simulations. Numerical simulations were one of the first approaches to automating FMEA. With this technique, the analysis is performed by replacing the equations representing "normal" behavior for a system component, with a set of equations representing the failed state of the component. Then the behavior of the system can be predicted and reported by running the simulation with the injected fault. By plugging

USING FUZZY COGNITIVE MAPS 181
accurate numerical values into the equations, we can make precise predic- tions of what will happen. Unfortunately, we usually do not have such accurate information, and the parameter space corresponding to the ranges that the input parameters can take must be searched. This in- creases the amount of computation, often making a numerical simulation infeasible.
Some of the disadvantages of numerical simulation are apparent. One is in the definition of the simulation equations to describe the failed compo- nents. For example, consider the case of a resistor whose failure mode is "change in value." The implications of this failure could possibly vary widely depending on the actual amount of the change. The effect might be negligible for small changes in some circuits; i t could have disastrous effects in others. More troublesome would' be a circuit in which big or small changes in resistance values were tolerable, but instability resulted for some small range of resistance values. Clearly, then, it would not be appropriate to simply choose one or a fixed set of values to model the "change in value" equation of the resistor because one could never be sure if there were other values that produced critical failure effects. More complex techniques such as interval analysis or Monte Carlo simulations might be needed to analyze these failure modes.
Another disadvantage of numerical simulations is the interpretation of the failure effects after the simulation is run. Simulations produce what is essentially a set of numbers that represent various system states and parameter values. For example, in electrical systems, they represent volt- ages, currents, and other electrical parameters. Since the FMEA reports often need to be in qualitative, symbolic terms, postprocessing of the simulation results must be done to compare the results with the numbers representing normal behavior, interpret the differences in terms of the effects, and report them in linguistic terms.
Yet another disadvantage to numerical simulations is the run-time required. Simulations can be quite slow, even for analyses of the "normal" case, because of the number of iterations required for numerical conver- gence. To automate an FMEA, the simulation must be run again for every failure mode of every component, and that may be especially time consum- ing when performing analyses of systems containing large building blocks, or components with many failure modes such as microcircuits or micropro- cessors. In such cases, representing and simulating specific numerical faults may be prohibitive. The high computational complexity of symbolic algebraic also makes it infeasible.
Even if numerical simulations were feasible, they still would not be sufficient for an FMEA. Often, we want to characterize the possibilities that might occur, with some guarantee of completeness. With numerical

182 C. E. PEL~d2Z AND J. B. BOWLES
simulations, it is often hard to tell when one has captured all of the possible behaviors. For example, a failure modes analysis of a power plant that captured only a small fraction of the possible system failure modes would be insufficient.
Expert Systems. In expert systems we encode the expert knowledge about how component failure modes affect the system, depending on how they are placed in the system topology. The development effort for such an approach includes capturing a large set of failure modes along with effects information, and developing techniques for propagating the effects to the system input/output relationships. The expert system approach is good for overcoming some of the problems of numerical simulation. Contextual information about how the component is used in the design can be encoded in rules, tables, or some other explicit representation. This alleviates the problems associated with choosing equations representing faulted components, as well as the computational difficulties associated with running multiple simulations. Additionally, the rules for the expert system can be written using the same terminology required for the FMEA report. The major disadvantage is that it is extremely challenging to reach the stage of knowing that all component failure modes and system topolog- ical information have been captured.
Causal Reasoning. The causal reasoning approach also overcomes some of the problems noted for numerical simulations by directly reasoning with quantities such as "small" or "large." Because it does not need to commit to specific numerical values, the problems of modeling failure modes are greatly diminished. The problems of numerical convergence are also reduced due to the use of ranges, and best of all, causal reasoning is performed in terms of the FMEA language.
The causal reasoning approach can also be extended for building blocks larger than low-level circuit components. For example, an FMEA on microprocessors, with hundreds of thousands of components, done at the component level would be prohibitive, but at the input/output level or in terms of function, it is quite feasible. For such applications, qualitative rules at a higher level of abstraction can be used, and faults can be represented at a higher level.
Causal reasoning is an approach in which the reasoning about complex systems is in terms of their structure and behavior. Components are described in terms of the cause and effect behavior they exhibit among inputs, outputs, and internal states. A causal model of the target system is used directly by representing either the system structure or its behavior

USING FUZZY COGNITIVE MAPS 183
graphically. For example, a causal reasoning, diagnostic system will use the system's behavior model to infer which failures could cause the observed symptoms, rather than an explicit mapping from symptoms to failures. This cause and effect behavior can be modeled in discrete or symbolic terms using FCMs.
2.1. QUALITATIVE REASONING
Qualitative analysis captures both the commonsense knowledge of a person and the tacit knowledge underlying the quantitative knowledge used by engineers and scientists when solving a problem.
Qualitative physics and causal reasoning are strongly related. Qualita- tive physics is the study of the behavior of the world in inexact terms. It has been suggested that humans perceive, understand, and generate expec- tations about the physics of the world in an imprecise form [11]. Causality, on the other hand, is the study of how to represent what happens as a result of some action.
Differential equations rarely help us calculate the consequence of an action in the world. We can apply fundamental qualitative knowledge of physics even in highly novel situations. Deducing the consequences of actions on the world has a long tradition in A1, and has come to be known as the frame problem [11].
Many everyday physical phenomena, such as boiling, are not easily described by a single equation, and even when equations exist, people who know nothing about them can often reason fluently about the phenomena. Hence, equations cannot be necessary for performing such reasoning.
The key in qualitative reasoning is to find ways to represent continuous properties of the world by discrete systems of symbols. One can always quantize something continuous, but not all quantizations are equally useful. One way to state the idea is the relevance principle: "The distinc- tions made by a quantization must be relevant to the kind of reasoning performed" [11].
Often, rounding parameters to fewer significant digits, or replacing numbers by arbitrary intervals is not useful, but using simple, symbolic groups like "Medium," or "Big" is; signs are also often relevant since different things tend to happen when signs change. Inequalities also can be useful since processes tend to start and stop when inequalities change.
2.2. CAUSAL-BASED REASONING
Conventional causal-based reasoning expert systems do not rely on heuristics to classify the cause of failures from malfunction symptoms
184 C. E. P E L / ~ Z AND J. B. BOWLES
alone. Instead, causal expert systems often reason from first principles, and rely on a qualitative model of the physics of the device to deduce its behavior.
Traditional expert systems, on the other hand, depend on having an expert diagnostician to emulate. In the field of fault diagnosis, the machine must break several times before an expert diagnostic system can be developed. To be of use to a knowledge engineer, a diagnostician must adequately understand the device and be able to articulate knowledge of frequently observed and probable faults. When a complex system is in- volved, many years of experience may be required for the development of an expert who adequately understands observed and probable faults. If it then takes an additional year or so to produce a system to emulate the expert, there is a substantial lag between the time when the original machine is first produced and the time when the expert system for its maintenance become available.
Rule-based expert systems, sometimes called shallow reasoning systems, have several shortcomings, especially in fault diagnosis tasks. First, shallow reasoning is incapable of handling unanticipated faults. Second, as already mentioned, a significant time lag exists between the initial construction of the device and the development of a conventional expert system for its maintenance. Third, devices commonly go through a series of design modifications, and these modifications can affect the correctness of the fault reasoning system.
Typically, if a fault has not been anticipated, a shallow reasoning diagnosis system either halts with an incorrect answer, or supplies little or no information on the suspect components, or ignores the fault and continues on as if nothing were wrong. The performance of this type of expert system does not gracefully degrade. A causal expert system, on the other hand, uses expected versus known machine states to converge on a faulty component, and thus has the potential to tell the user that a fault exists between two points, even if it cannot explicitly identify it.
A repair expert system might have some general rules for isolating faults, but a human expert may not always follow these rules exclusively, as a shallow reasoning expert system would imply. Instead, the expert under- stands the purpose of the machine and knows its expected behavior. When the expert observes something unexpected, a process of deduction is initiated to explain the deviation. The expert arrives at one of two conclusions: either the diagnostician's expectations of the device are incorrect and in need of updating, or a reanalysis from first principles isolates the faulty component. In either case, reasoning based on a causal chain is performed.

USING FUZZY COGNITIVE MAPS 185
Generally, causal rules encode the interconnections between facts within a world. Hence, causal relationships take the form of rules. Before begin- ning to create rules to model causal relationships, the level of abstraction of the representation must be carefully chosen. A high-level abstraction is computationally efficient, but less expressive in that some important func- tionality might not be represented. A low-level abstraction allows the modeling of a multitude of phenomena, but with a consequent increase in memory requirements and computational complexity. The world should be modeled only with the necessary level of detail for the problem at hand.
2.3. CAUSAL K N O W L E D G E REPRESENTATION
Three qualitative representations of knowledge using numbers have proven useful: signs, inequalities, and orders of magnitude. Reducing numbers to signs is the simplest qualitative representation for numbers. For example, we might say that the level of water in a container is - 1, 0, or + 1, depending on whether or not the level is lower, the same as, or higher than a desired height. If the comparison is chosen carefully, we can satisfy our purpose of capturing relevant distinctions while not introducing irrelevant ones.
The signs of derivatives form a natural indicator of change: if the sign of the derivative is negative, the quantity is decreasing; if 0, it is constant; and if positive, it is increasing. Since change is intuitively important, and the direction of change determines what boundary conditions might be en- countered, the signs of derivatives carry critical information about the system behavior.
The major advantage of the sign representation is simplicity. However, signs alone are often not enough. Consider the problem of figuring out what might happen if we have three tanks A , B, and C with pipes interconnecting them as shown in Figure 3. Given some initial level of water in each tank, suppose that we open all the valves in the pipes between them. To determine how the water would flow requires compar- ing the pressures in the tanks that are linked together.
A sign value encodes a comparison of a magnitude with a single reference value. Suppose tank B is connected by pipes to both A and C. Clearly, no sign representation of pressure will suffice for the pressure in B, since we must compare its pressure with two reference values, the pressure in A and the pressure in C. The fact that these reference values are themselves changing is yet another complication.
With inequalities, comparing the value of a quantity with several other parameters is a common occurrence in qualitative reasoning, and some-

186 C. E. PEI_,/tEZ AND J. B. BOWLES
% , J
~l: ' : '~: i : i~:":5" " 4" " ,.:..-... :!~:!..::::~;~:
Fig. 3. Interconnected tanks A, B, and C.
times the parameters with which it makes sense to compare a value can change as conditions change. For example, if we discover that tank B has a leak, we should also consider the relationship between the pressure at the leak and that of the surroundings.
Inequalities make sense for several reasons. First, they provide a means to partition numerical values, and thus express boundary conditions for behavior. Second, a quantity can participate in any number of inequalities, thus providing the variable resolution we desire. Third, if numbers are combined by addition, inequality information often suffices to determine the sign of the outcome.
With orders of magnitude, sometimes saying that N1 is greater than N2 is not enough: one may need to say that N1 is so large compared to N2 that N2 may be ignored. In everyday life, engineers rely on the ability to distinguish a value that is significantly out of range from a normal variation. One way to represent such information is to extend the range of comparative relationships to include orders of magnitude.
Using orders of magnitude in terms of ranges simplifies the mapping from numerical values; it also allows a large but finite number of negligible values to add up to something that is significant, but again that may not reflect the effect of small but important variations.
Traditionally, in causal representations, equations are considered to be the hallmark of the reasoning process. But, as stated before, they restrict the accuracy to which numerical values are known; the notions of equa- tions developed in qualitative reasoning are also typically weaker. These constraints can better capture partial knowledge and simplify inference, thus addressing the resolution problem.
One of the weakest statements that can be made about the relationship between two quantities is that when one increases, the other tends to increase or decrease. This level of knowledge is captured by monotonic functions, which are used as a primitive in several systems of causal

USING FUZZY COGNITIVE MAPS 187
reasoning. Monotonic functions provide a means of approximating compli- cated or unknown functions with minimal commitment.
2.4. CAUSAL REASONING WITH FUZZY COGNITIVE MAPS
Kosko has developed a fuzzy causal algebra that describes the causal propagation and combination of concepts in an FCM [2]. The algebra depends only on the partial ordering P, the range set of the fuzzy causal edge function e, and on general fuzzy-graph properties (e.g., path connec- tivity). Kosko notes that this algebra can be used on any digraph knowl- edge representation scheme.
Axelrod speaks of indirect and total causal effects on cognitive maps [1]. A causal path from some concept node C i to concept node Cj, say C i - - ~ C k 1 -9 , . , - . - ) C k n --~Cj, can be indicated by the sequence (i, k l . . . . . kn , j ) . Then the indirect effect of C i on Cj is the causality C i imparts to Cj via the path (i, k l . . . . . kn , j ) . The total effect of Ci on Cj is the composite of all the indirect-effect causalities C~ imparts to Cj. If there is only one causal path from C i to Cj, the total effect C~ imparts to Cj reduces to the indirect effect.
By associating the operations of indirect and total effect with the multiplication and addition of real numbers, Axelrod developed a causal calculus of + and - signs. The indirect effect of a path from C i to Cj is negative if the number of negative causal edges in the path is odd and positive if the number is even. The total effect of C i on Cj is negative if all the indirect effects of C i on Cj are negative, positive if they all are positive, and indeterminate otherwise. Indeterminacy tends to dominate in this sign scheme. The indeterminacy can be removed with a numeric weighting scheme. If the causal edges are weighted with positive or negative real numbers wij, then the indirect effect of C i on Cj through path (i, kl . . . . . k n , j ) is the product wi, kl XWkl,k 2 X .. . XWkn,j and the total effect is the sum of the path products. This weighting scheme generalizes the sign calculus, removes indeterminacy from the total effect operation, and allows finer causal discrimination between concepts. But the real value requirement of P makes knowledge acquisition more difficult. It forces numbers from insufficient decision information leading to different num- bers from the same knowledge source in different sessions, eP.. The difficulties increase with the number of knowledge sources and with the number of their responses.
A fuzzy causal algebra, and hence FCMs, bypasses the knowledge acquisition processing tradeoff. It allows fuzzy inputs to be processed as systematically as real-valued inputs.

188 C. E. PEI_JdEZ AND J. B. BOWLES
A simple fuzzy causal algebra is created by interpreting the indirect- effect operator I as the minimum operator (min) and the total effect operator T as the maximum operator (max) on a partially ordered set P of causal values. Formally, let ~ be a causal concept space, and let e: ~ ×
~ P be a fuzzy causal edge function, and assume that there are m-many causal paths from C i to Cj: (i, k~ . . . . . k~, j ) for 1 ~< r ~< m. Then let l r (C i, Cj) denote the indirect effect of concept C i on concept Cj via the r th causal path, and let T(C i, Cj) denote the total effect of Ci on Cj over all m causal paths. Then
I ~ ( C i , C j ) = m i n { e ( C p , C p + , ) : ( p , p + 1) ~ (i ,k~ . . . . . k,~, j) }
T ( C i , C j ) = m a x I r ( C i , C j ) , l <~r<~m
where p and p + 1 are contiguous left-to right path indices. The indirect effect operation amounts to specifying the weakest causal
link in a path and the total effect operation amounts to specifying the strongest of the weakest links. For example, suppose the causal values are given by P = {none <~some <<. much <~ a lot} and the FCM is defined as in Figure 4.
There are three causal paths from C1 to C5:(C1, C3, C5) , (C1, C3, C4, C5) , (C1, Cz, Ca, C5). The three indirect effects of C 1 on C 5 are:
I1(C1,C5) = min {el3 , e35 ) = min {much , a lot} = much
12 ( C1 ,C5) = some,
I3(C1,C5) = some.
C 1 Some ~-- C 2 LMuch A0t C3 Some =_ C 4
C 5
Fig. 4. Fuzzy Cognitive Map [2].

USING FUZZY COGNITIVE MAPS 189
Hence, the total effect of C 1 on C5 is
T(C I,C5) = max {I,(C,,Cs),I2(C I,C5),I3(C I,C5) }
= max {much, some} = much.
In words, C1 can be said to impart much causality to C 5.
3. FAILURE MODES AND EFFECTS ANALYSIS USING FUZZY COGNITIVE MAPS
Since FCMs are able to show cause and effect relationships, they provide a possible tool for helping to automate the reasoning required in a FMEA. There are two main reasons for this. First, since the analyst must relate the underlying model to the real world without a significant map- ping gap, symbolic reasoning and qualitative thresholds such as high, slightly high, low, etc. are often more appropriate than continuous expres- sions [10]; thus, the use of linguistic variables and fuzzy logic is preferred for the analysis. Second, an FMEA is also a composite diagnostic and predictive task that often involves the integration of several expert opinions [10], and FCMs easily combine multiple expert opinions and predictions.
To show how FCMs can be used as a system model for FMEA, we consider the water tank leveling system shown in Figure 5. Concepts that are relevant to the FMEA include the component failure modes and their
Pul,ey q
[Co d Stopper [
M
~,~ntrolle r
Water ) Valve r
> -
Fig. 5. Water tank leveling system.
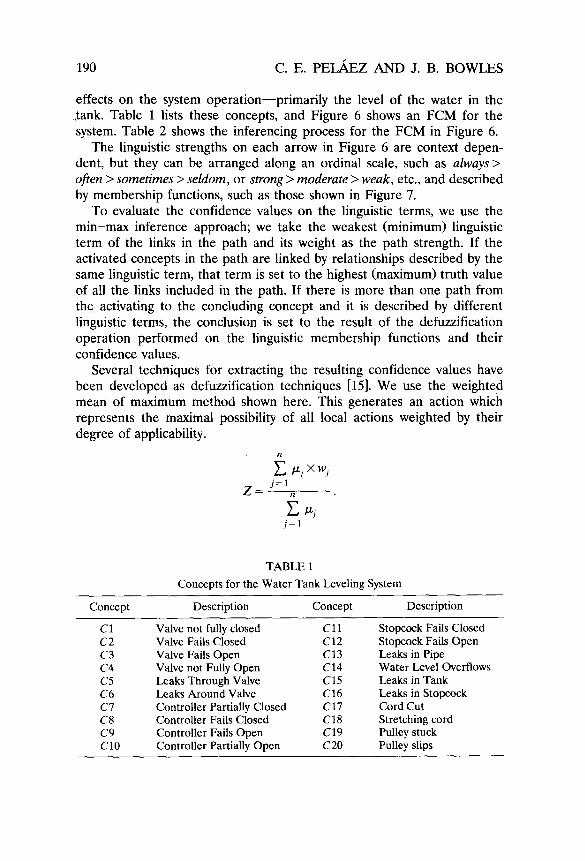
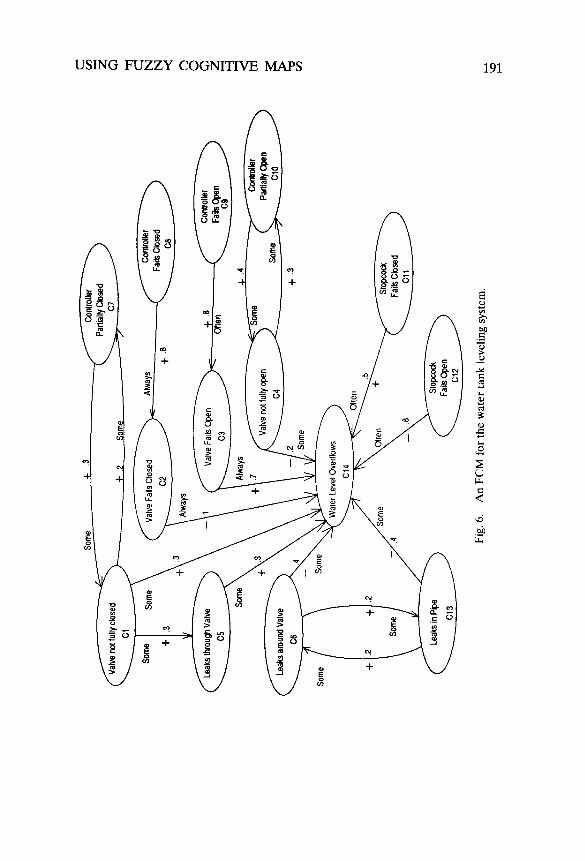
190 C. E. P E ~ E Z AND J. B. BOWLES
effects on the system operat ion--primari ly the level of the water in the °tank. Table 1 lists these concepts, and Figure 6 shows an FCM for the system. Table 2 shows the inferencing process for the FCM in Figure 6.
The linguistic strengths on each arrow in Figure 6 are context depen- dent, but they can be arranged along an ordinal scale, such as always > often > sometimes > seldom, or strong > moderate > weak, etc., and described by membership functions, such as those shown in Figure 7.
To evaluate the confidence values on the linguistic terms, we use the min-max inference approach; we take the weakest (minimum) linguistic term of the links in the path and its weight as the path strength. If the activated concepts in the path are linked by relationships described by the same linguistic term, that term is set to the highest (maximum) truth value of all the links included in the path. If there is more than one path from the activating to the concluding concept and it is described by different linguistic terms, the conclusion is set to the result of the defuzzification operation performed on the linguistic membership functions and their confidence values.
Several techniques for extracting the resulting confidence values have been developed as defuzzification techniques [15]. We use the weighted mean of maximum method shown here. This generates an action which represents the maximal possibility of all local actions weighted by their degree of applicability.
~xwj Z = J =1
n
j=l
TABLE 1 Concepts for the Water Tank Leveling System
Concept Description Concept Description
C 1 Valve not fully closed C 11 Stopcock Fails Closed C2 Valve Fails Closed C12 Stopcock Fails Open C3 Valve Fails Open C13 Leaks in Pipe C4 Valve not Fully Open C14 Water Level Overflows C5 Leaks Through Valve C15 Leaks in Tank C6 Leaks Around Valve C16 Leaks in Stopcock C7 Controller Partially Closed C17 Cord Cut C8 Controller Fails Closed C18 Stretching cord C9 Controller Fails Open C19 Pulley stuck C10 Controller Partially Open C20 Pulley slips
USING FUZZY COGNITIVE MAPS 191
.4-
t ~
-t-
i '-t-
-t-
• E
'-I-
q -
~5
LZ

192 C. E. PEIJdEZ AND J. B. BOWLES
TABLE 2
Inferencing Process Results
Concepts C1 C2 C3 C4 C5 C6 C7 C8 C9 C10 C l l C12 C13 C14
C1 0 C2 0 C3 0 C4 0 C5 0 C6 0 C7 +1 C8 C9 C10 C l l C12 C13 C14
C9 activated 0
C 9 ' = 9* CM 0
Thresholding 0 C 9 " =
C9'* CM 0 Thresholding 0
C9'" = C9"* CM 0 Thresholding 0
0 0 0 +1 0 +1 0 0 0 0 0 0 +1 0 0 0 0 0 0 0 0 0 0 0 0 - 1 0 0 0 0 0 0 0 0 0 0 0 0 +1 0 0 0 0 0 0 0 0 +1 0 0 0 - 1 0 0 0 0 0 0 0 0 0 0 0 0 +1 0 0 0 0 0 0 0 0 0 0 0 +1 - 1 0 0 0 0 0 0 0 0 0 0 0 0 0
0 +1 0 0 0 0 0 0 0 0 0 0 0 0 0 0 + 1 0 0 0 0 0 0 0 0 0 0 0 0 0 0 +1 0 0 0 0 0 0 0 0 0 0 0 0 0 0 0 0 0 0 0 0 0 0 0 +1 0 0 0 0 0 0 0 0 0 0 0 0 0 - 1 0 0 0 0 0 +1 0 0 0 0 0 0 0 - 1 0 0 0 0 0 0 0 0 0 0 0 0 0 0
0 0 0 0 0 0 0 1 0 0
0 1 0 0 0 0 0 0 0 0 0 1 0 0 0 0 0 1 0 0
0 1 0 0 0 0 0 0 0 0 0 1 0 0 0 0 0 1 0 0
0 1 0 0 0 0 0 0 0 0 0 1 0 0 0 0 0 1 0 0
0 0 0
0 0 0 0 0 0
0 0 +1 0 0 +1
0 0 +1 0 0 +1
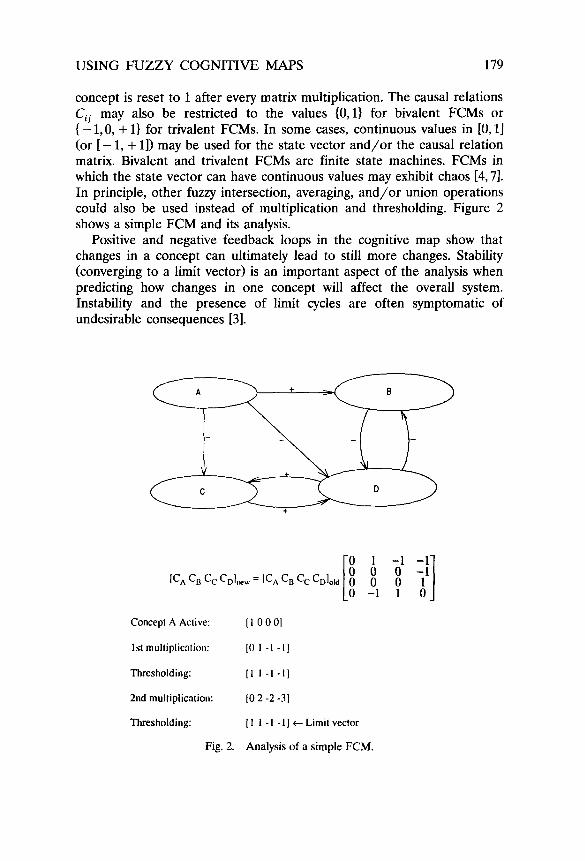
M 1.0 e 0.85 m b e r s
h i P
0.0
"Seldom Sometimes Often Almost-always Always
~ u e n c y of failure 1 2 3 4 5 6 T 7 8 9 10
WMoM
Fig. 7. Fuzzy conclusion set for the water tank leveling system.
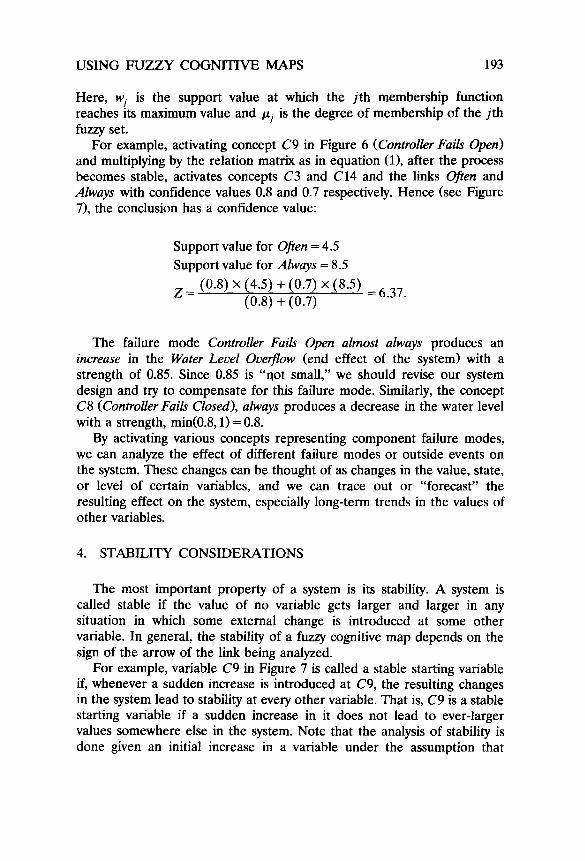
USING FUZZY COGNITIVE MAPS 193
Here, wj is the support value at which the jth membership function reaches its maximum value and /zj is the degree of membership of the jth fuzzy set.
For example, activating concept C9 in Figure 6 (Controller Fails Open) and multiplying by the relation matrix as in equation (1), after the process becomes stable, activates concepts C3 and C14 and the links Often and Always with confidence values 0.8 and 0.7 respectively. Hence (see Figure 7), the conclusion has a confidence value:
Support value for Often = 4.5 Support value for Always = 8.5
Z = (0.8) × (4.5) + (0.7) × (8.5) = 6.37. (0.8) + (0.7)
The failure mode Controller Fails Open almost always produces an increase in the Water Level Overflow (end effect of the system) with a strength of 0.85. Since 0.85 is "riot small," we should revise our system design and try to compensate for this failure mode. Similarly, the concept C8 (Controller Fails Closed), always produces a decrease in the water level with a strength, min(0.8,1) = 0.8.
By activating various concepts representing component failure modes, we can analyze the effect of different failure modes or outside events on the system. These changes can be thought of as changes in the value, state, or level of certain variables, and we can trace out or "forecast" the resulting effect on the system, especially long-term trends in the values of other variables.
4. STABILITY CONSIDERATIONS
The most important property of a system is its stability. A system is called stable if the value of no variable gets larger and larger in any situation in which some external change is introduced at some other variable. In general, the stability of a fuzzy cognitive map depends on the sign of the arrow of the link being analyzed.
For example, variable C9 in Figure 7 is called a stable starting variable if, whenever a sudden increase is introduced at C9, the resulting changes in the system lead to stability at every other variable. That is, C9 is a stable starting variable if a sudden increase in it does not lead to ever-larger values somewhere else in the system. Note that the analysis of stability is done given an initial increase in a variable under the assumption that

194 C, E. P E I _ ~ Z AND J. B. BOWLES
further external influences are not introduced into the system. Instability comes from the propagation of changes within the system itself. Thus, if a given variable is known to be an unstable starting variable, the instability could be counteracted by introducing other external changes in the system at other variables.
We shall call the system stable if every variable is stable subject to external changes in any of the other variables. The prediction of stability amounts to the determination of the failure effects and causes for a particular failure mode, and how a particular failure effect propagates through the structure of the map. Prediction of stability is not quite as meaningful as a prediction of instability because a system can stabilize at unacceptable high levels. Instability can also be used to predict the absence of critical relationships between concepts.
Feedback loops correspond to cycles in the signed digraph, for example, the loop from concept C1 to C7 and back in Figure 6. If there are many feedback loops, they often lead to instability because small initial changes can be amplified well beyond their initially foreseeable impact. It is easy to identify positive and negative feedback loops: a cycle corresponds to a positive feedback loop if and only if it has an even number of minus signs. The identification of positive and negative feedback loops is one step in pinpointing the factors underlying the analysis.
The presence of feedback loops contributes greatly to stability or instability, and knowing these loops, we can understand the major forces for change present within the system. A feedback loop can be identified without knowing the strengths of an effect, time lags, or how changes are propagated through the system. A good rule of thumb is that many positive feedback loops will lead to increasing deviations and instability. Negative feedback loops often lead to stability, since they tend to decrease the effect of a change, but they can also lead to larger and larger oscillations, which is another unstable situation. If there is a mixture of feedback loops, some positive and some negative, it is not easy to determine what the total effect will be. In any case, the identification of feedback loops is a crucial step in determining the behavior of the system.
5. IMPROVING THE FMEA COGNITIVE MAP
Generally, knowledge is a specification of classifications and causes; where the classes and causes are uncertain, it is usually fuzzy. This fuzziness passes into the knowledge representations and onto the knowl- edge bases, leading to a knowledge acquisition/processing tradeoff. The

USING FUZZY COGNITIVE MAPS 195
fuzzier the knowledge representation, the easier the knowledge acquisition and the greater the knowledge-source concurrence. But the fuzzier the knowledge, the harder the knowledge processing.
Often, knowledge representations have to deal with making declarative statements about the structural and, especially, the behavioral semantics of real-world problems, in terms of some syntactic constructs of the represen- tation formalism utilized. Most semantic models and knowledge represen- tation formalisms provide constructs which allow the capture of fuzzy knowledge regarding the structure and the terminology of the domain; some others provide constructs which allow the appropriate specification of assertions about the behavior of underlying elements of the problem at hand, and in general of the problem domain. In terms of knowledge representation, these assertions determine the boundaries of what is "believed" by the system about the world of interest, and they are usually expressed in some form of logic, which is used to perform inferencing over what is known about the domain [13].
Because of the limited set of constructs most modeling techniques provide, a great deal of work in semantic modeling involves the capturing of integrity constraints that can help in the representation of situations such as the mutual exclusiveness of events, sequencing, etc. A large portion of the constraints existing in any given domain are either not communicated or must be defined explicitly and formally through the associated model implementation language.
These limitations usually inhibit the utility of semantic modeling tech- niques as a design aid for the developer of knowledge representation applications. The modeling technique tends to guide the design process itself because of what it can effectively represent (its epistemology), and how it is used to capture and specify a schema (its behavior).
In general, the more constructs available, the more precisely and completely the representation of the domain's universe of discourse can be expressed. That is, there is less in the domain that is "not said," where specific assertions which, due to their absence, can be ambiguously inter- preted or omitted. For a modeling technique to be more effective in assisting the capturing of domain semantics, it must have a set of notation constructs which allow direct expression of semantic intent.
It should be noted that more modeling constructs give more alternatives for expressing domain information. If not managed properly, by constrain- ing the structure and behavior of the model formalism itself, the power for greater precision can lead to greater difficulty in the form of cumbersome and confusing representations.
A set of logic-based constructs used in Data-Base [13] allows the

196 C. E. P E I J ~ Z AND J. B. BOWLES
specification of certain types of prepositional semantic constraints that are carried between entity sets and their relationships, and which we can adopt to express the semantic constraints in a fuzzy cognitive map.
5.1. SEMANTIC INTEGRITY CONSTRAINTS
The underlying framework governing the FCM inference process allows for multiple failure modes to coexist in an FMEA. Consequently, it is imperative to establish a mechanism to avoid conflicting failure modes, and to eliminate contradicting failure effects. There are many approaches concerning how to more effectively and faithfully represent the structure and semantics of a real-world domain, such that the characteristics and behavior of a system can be represented without a significant gap.
Although the semantic constraints used in data modeling must be more exhaustive, the constraints for this application, because of the problem domain and fuzzy logic, are more flexible. Semantic connotations, such as nonempty and collective exhaustive, as used in data modeling, have no connotations in this approach. We are not considering the concept of partition, and a failure may or may not occur at any given point of the analysis. But there are situations where mutually exclusive failure modes are present and cannot be considered together (e.g., open and short), and sometimes it may be necessary to express time lags between failures. Davis [13] and Brodie [14] introduce the N D / A N D and IP integrity constraints as semantic constructs to overcome these situations.
5.1.1. The ND / A N D Integrity Constraint
The ND constraint resembles the "NAND" function in traditional logic. This constraint allows us to express the mutual-exclusiveness of certain failures. Often, real systems have failure modes or effects which are contradicting if considered at the same time. For example, from Figure 6, if the failure mode is a "Valve fails closed," a failure mode such as "Valve is not fully closed" cannot occur at the same time because of their contradict- ing nature (mutually exclusive). If it fails closed, it cannot fail open at the same time.
Note that for the nonmutuaUy-exclusive case, the min-max strategy can be used as described earlier. For the conjunctive case, where a set of two or more failure modes must occur at the same time in order for an effect to take place, the AND integrity constraint is used. For example, in a system with redundant elements, the mission of the system will not be accomplished only if all the redundant elements fail at the same time.

USING FUZZY COGNITIVE MAPS 197
5.1.2. The IP Integrity Constraint
The IP constraint is similar to the "implication" function in traditional logic. If more than two assertions (failure modes) are affected by this constraint, the preconditions are "ANDed" together, such that the impli- cations reflect the effects of all the contributing failures.
The IP constraint can be interpreted as the fuzzy implication operation given by the composition of the assertions; formally:
Then tz~(x)= max min~A-(x),/~(x, y)} where /~ (x, y) is the degree to
which the relation between ,4 and /~ is satisfied. Since a fuzzy cognitive map is a simplified model of the system behav-
ior, its analysis may not be precisely correct due to the simplifications used to model the problem. Some common occurrences that the model simpli- fies are: 1) the signs of effects may change over time, depending on the levels of the variables involved; 2) some effects may be stronger than others; 3) some effects may take longer than others to be realized (i.e., there are time lags); and 4) values are assumed not to change under the rules that define a pulse process.
Unfortunately, it is virtually impossible, in dealing with complex systems such as many real system designs, to get precise information on the strengths of effects, time lags, etc. Some of the limitations introduced by the model can be avoided by bringing additional information into the map as constraints; such is the case with time lags. The IP constraint can be used to express the fact that some effects may take longer than others, or that a particular effect must occur before (after) others.
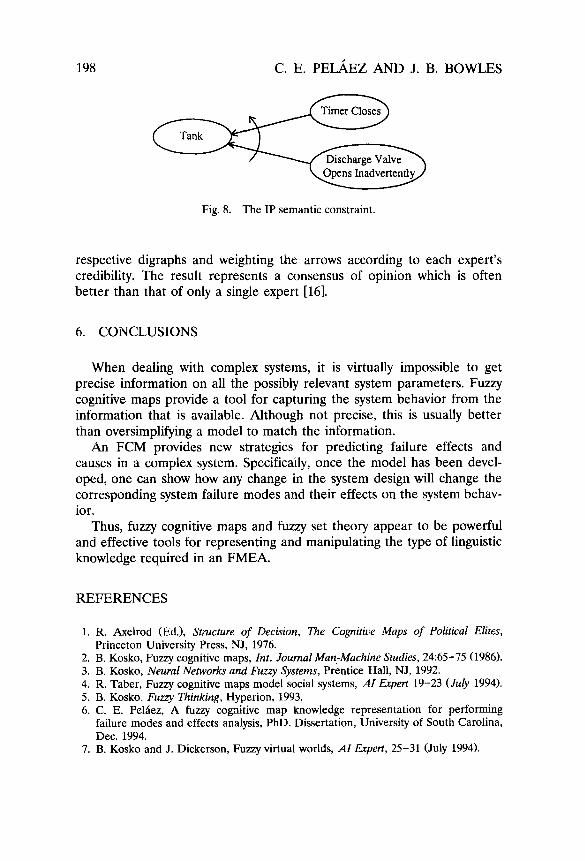
For example, if we need to express the fact that a failure mode such as "Timer closes inadvertently" can occur only after the "Discharge valve opens inadvertently" in the map that is represented as shown in Figure 8.
The analysis of FCMs does not change with the inclusion of semantic constraints, but the specification of an active failure mode prior to the analysis and the interpretation of results need to consider the presence of constraints to avoid contradictions and misinterpretations. The analysis of a failure mode such as "Discharge valve opens inadvertently" should be made before the analysis of the failure mode "Timer closes inadvertently."
The correctness of the FCM can also be improved by combining FCMs developed by different experts. The FCMs are combined by merging their
198 C. E. PEI_~EZ AND J. B. BOWLES
Fig. 8. The IP semantic constraint.
respective digraphs and weighting the arrows according to each expert's credibility. The result represents a consensus of opinion which is often better than that of only a single expert [16].
6. CONCLUSIONS
When dealing with complex systems, it is virtually impossible to get precise information on all the possibly relevant system parameters. Fuzzy cognitive maps provide a tool for capturing the system behavior from the information that is available. Although not precise, this is usually better than oversimplifying a model to match the information.
An FCM provides new strategies for predicting failure effects and causes in a complex system. Specifically, once the model has been devel- oped, one can show how any change in the system design will change the corresponding system failure modes and their effects on the system behav- ior.
Thus, fuzzy cognitive maps and fuzzy set theory appear to be powerful and effective tools for representing and manipulating the type of linguistic knowledge required in an FMEA.
REFERENCES
1. R. Axelrod (Ed.), Structure of Decision, The Cognitive Maps of Political Elites, Princeton University Press, NJ, 1976.
2. B. Kosko, Fuzzy cognitive maps, Int. Journal Man-Machine Studies, 24:65-75 (1986). 3. B. Kosko, Neural Networks and Fuzzy Systems, Prentice Hall, NJ, 1992. 4. R. Taber, Fuzzy cognitive maps model social systems, AI Expert 19-23 (July 1994). 5. B. Kosko, Fuzzy Thinking, Hyperion, 1993. 6. C. E. Pel~iez, A fuzzy cognitive map knowledge representation for performing
failure modes and effects analysis, PhD. Dissertation, University of South Carolina, Dec. 1994.
7. B. Kosko and J. Dickerson, Fuzzy virtual worlds, AI Expert, 25-31 (July 1994).

U S I N G F U Z Z Y C O G N I T I V E M A P S 199
8. J. B. Bowles and R. D. Bonnell, Failure mode, effects, and criticality analysis, in Annual Reliability and Maintainability Symposium, Tutorial Notes, 1993, pp. 1-36.
9. Potential Failure Mode and Effects Analysis in Design (Design FMEA) and for Manufacturing and Assembly Processes (Process FMEA) Instruction Manual, Ford Motor Company, Sept. 1988.
10. D.J. Russomanno, D. R. Bonnell, and J. B. Bowles, Viewing computer-aided failure modes and effects analysis from an artificial intelligence perspective, Integrated Computer-Aided Eng. 1 (3):209-228 (1994).
11. K. Forbus and J. Brown, Qualitative process theory, Artificial Intelligence 24:85-168 (1984).
12. K. Forbus and D. Gentner, Causal reasoning about quantities, in Proc. of the 8th Ann. Conf. of the Cognitive Science Society, Amherst, MA, 1986.
13. J. Davis and R. D. Bonnell, Modeling semantic constraints with logic in the EARL data model, in Proc. 5th International Conf. on Data Engineering, 1989, pp. 226-233.
14. M. Brodio, Association: A database abstraction for semantic modeling, in Entity- Relationship Approach to Information Modeling and Analysis, ER Institute, 1981, pp. 583-608.
15. T.A. Runkler and M. Glesner, A set of axioms for defuzzification strategies towards a theory of rational defuzzification operators, in Proc. of the 2nd IEEE International Conf. on Fuzzy Systems, 1993, pp. 1161-1166.
16. R. Taber, Knowledge processing with fuzzy cognitive maps, Expert Systems with Applications 2:83-87 (1991).
Received 1 May 1994; revised 15 November 1994, 23 March 1995