
Using Flowcharts, Code and Animation for Improved ...
445
Andrew. S. Scott PhD Thesis University of Glamorgan Page i Andrew Simon Scott Student ID: 01016601 A thesis submitted in partial fulfilment of the requirements of the University of Glamorgan / Prifysgol Morgannwg for the degree of a Doctor of Philosophy. March 2010 University of Glamorgan Faculty of Advanced Technology Using Flowcharts, Code and Animation for Improved Comprehension and Ability in Novice Programming
-
Upload
khangminh22 -
Category
Documents
-
view
0 -
download
0
Transcript of Using Flowcharts, Code and Animation for Improved ...

Andrew. S. Scott PhD Thesis University of Glamorgan
Page i
Andrew Simon Scott Student ID: 01016601
A thesis submitted in partial fulfilment of the requirements of the University of Glamorgan / Prifysgol Morgannwg for the degree of a Doctor of Philosophy.
March 2010
University of Glamorgan
Faculty of Advanced Technology
Using Flowcharts, Code and
Animation for Improved
Comprehension and Ability in
Novice Programming

Andrew. S. Scott PhD Thesis University of Glamorgan
Page ii
Certificate of Research
This is to certify that, except where specific reference is made, the work presented in this thesis is the result of the investigation undertaken by the candidate. Candidate: …………………………………………….. Director of Studies: ……………………………………………..

Andrew. S. Scott PhD Thesis University of Glamorgan
Page iii
Declaration
This is to certify that neither this thesis nor any part of it has been presented or is being currently submitted in candidature for any other degree other than the degree of Doctor of Philosophy of the University of Glamorgan. Candidate: ………………………………………………..

Andrew. S. Scott PhD Thesis University of Glamorgan
Page iv
Acknowledgements:
I would like to express my sincere appreciation and thanks to my research supervisors Mike
Watkins and Duncan McPhee for their kindness, unwavering support, guidance and encouragement
throughout this research.
I would also like to thank Dave Eyres for inspiring and encouraging me to develop my original
ideas into a fully fledged and successful research project.
I would also like to thank the faculty member Sue Stocking, external lecturers Geoff Rubner
(Manchester University), Dave Peirce (Bridgend College) and teachers Jo Farag (Lanishen
Secondary School) and Iain M. MacLean (Dyffryn Secondary School), that permitted, and facilitated
or helped arrange the evaluation activities.
Finally a very special thank you to my wife and family whose love, support and patience has helped
to make this work possible.

Andrew. S. Scott PhD Thesis University of Glamorgan
Page v
Abstract
Using Flowchart, Code and Animation for Improved Comprehension and Ability in Novice Programming
This thesis documents the research; development methodology and evaluation of „Progranimate‟, a visual programming environment and associated pedagogy that helps novices overcome their difficulties in learning programming via an imperatives first (non object oriented) approach. In particular it focuses on problem solving and its prerequisite skills, these are known to be particularly troublesome for novice programmers.
Progranimate is a unique, web deliverable, simplified development environment that utilises dynamic structured flowchart program construction, generated code in several selectable languages and animated execution. Progranimate uses a structured flowchart visualisation to convey the key concepts and underlying abstractions of programming, whilst allowing the novice to focus on the development of problem solving skills. Progranimate utilises an easy to use, uncluttered development environment and removes the necessity of writing complex code. This allows the user to focus solely on problem solving and on conceptualising the underlying abstractions and semantics of programming. In Progranimate, programs are constructed and executed visually via dynamic flowchart and code based representations. The visual synchronisation between the flowchart and code representations allow the user to draw an effective correlation between the flowchart and the logical code structure that it represents. Program animation features provide the user with an accurate mental model of program execution by emphasising the interaction and behaviour of the key structures and components used in programming. A variable inspection feature is also provided, allowing the user to observe the changes in data as a program is executed. Coupled to Progranimate is a scaffolding pedagogy designed to assist novice programmers in the development of problem solving skill. The pedagogy is underpinned by the theories of scaffolding support and the zone of proximal development. This pedagogy has been utilised within a range of contextual, fun, and gender neutral programming activities designed for use with Progranimate. This thesis hypothesises that using Progranimate on its own or with the scaffolding pedagogy for the creation of simple programs, will help novices strengthen their conceptual understanding of programming and problem solving skills. Evaluations of Progranimate with secondary school pupils, their teachers and first year university students support this hypothesis. The evaluations also show that Progranimate coupled to the scaffolding pedagogy and associated programming problems is a very motivating way to introduce secondary school pupils to programming.

Andrew. S. Scott PhD Thesis University of Glamorgan
Page vi
Table of Contents:
CHAPTER 1 INTRODUCTION AIMS AND OVERVIEW ........................................................................ 1
1.1 INTRODUCTION ........................................................................................................................................................... 1 1.2 AIMS AND OBJECTIVES OF RESEARCH PROJECT ................................................................................................... 3 1.3 THESIS LAYOUT AND OVERVIEW............................................................................................................................. 5
CHAPTER 2 BACKGROUND RESEARCH ................................................................................................ 7
2.1 INTRODUCTION ........................................................................................................................................................... 7 2.2 NO EXPERIENCE NECESSARY................................................................................................................................... 8 2.3 LEARNING PROGRAMMING IS DIFFICULT ............................................................................................................ 11 2.4 PARADIGM CHOICE - WHY IMPERATIVES SHOULD BE FIRST ........................................................................... 13 2.5 LEARNING IMPERATIVES FIRST PROGRAMMING - SKILLS AND DIFFICULTIES ............................................. 15
2.5.1 The Imperative Concepts ................................................................................................................................................ 17 2.5.2 Language ....................................................................................................................................................................... 19 2.5.3 Mastering the Development Environment ....................................................................................................................... 27 2.5.4 Problem Solving ............................................................................................................................................................. 28
2.6 CHAPTER SUMMARY AND CONCLUSIONS ............................................................................................................. 32
CHAPTER 3 VISUALISATION ................................................................................................................. 35
3.1 INTRODUCTION ......................................................................................................................................................... 35 3.2 MENTAL MODELS ..................................................................................................................................................... 35 3.3 LEARNING STYLES .................................................................................................................................................... 38
3.3.1 Visual Verbal Learning Styles Distribution ................................................................................................................. 40 3.3.2 Traditional Instruction May Not Favour Visual Learners ............................................................................................ 41
3.4 DYNAMIC VISUALISATION OF PROGRAMMING ................................................................................................... 42 3.4.1 Program Visualisation and Algorithm Animation ........................................................................................................ 43 3.4.2 The Mixed Success of Visualisation and Animation .................................................................................................... 45 3.4.3 Factors that Affect the Success of Visualisation ............................................................................................................. 46
3.5 FLOWCHARTS AN EFFECTIVE VISUALISATION FOR NOVICE PROGRAMMERS .............................................. 51 3.5.1 Other Related Techniques............................................................................................................................................... 53 3.5.2 Flowcharts and Structured Programming ........................................................................................................................ 54 3.5.3 Dynamic Flowcharts ...................................................................................................................................................... 55
3.6 REVIEW OF RELEVANT SYSTEMS ............................................................................................................................ 56 3.6.1 BACCII (Calloni, 1992, Calloni and Bagert, 1994, Calloni and Bagert, 1999) ........................................................ 57 3.6.2 FLINT - (Ziegle and Crews, 1999) .......................................................................................................................... 58 3.6.3 Empirica Control - (Lavonen et al, 2002) ................................................................................................................. 60 3.6.4 FlowChart Interpreter - (Atanasova and Hristova, 2003) ......................................................................................... 61 3.6.5 Raptor - (Carlisle et al, 2004, Carlisle et al, 2005) ..................................................................................................... 62 3.6.6 The SFC Editor - (Watts, 2004) ............................................................................................................................... 64 3.6.7 Visual Logic -- (Crews and Murphy, 2004, Crews, 2009) ......................................................................................... 65 3.6.8 The Iconic Programmer - (Chen and Morris, 2005) .................................................................................................... 66 3.6.9 Dev Flowcharter - (Domagala, 2006) ........................................................................................................................ 68 3.6.10 An Unnamed Application - (Arai and Yamazaki, 2006) .......................................................................................... 70 3.6.11 B# - (Greyling et al, 2006) .......................................................................................................................................... 71 3.6.12 Pro guide - (Areias and Mendes, 2007) ..................................................................................................................... 72 3.6.13 Using Microworlds Pro (Glezou and Gridoriadou, 2007) ............................................................................................. 73 3.6.14 Code Visual to Flowchart - (FateSoft, 2009) ............................................................................................................ 75 3.6.15 Review of Systems Discussion ......................................................................................................................................... 76
3.7 CHAPTER SUMMARY AND CONCLUSIONS ............................................................................................................. 78
CHAPTER 4 PROGRANIMATE ............................................................................................................... 81
4.1 INTRODUCTION ......................................................................................................................................................... 81 4.2 OVERVIEW OF PROGRANIMATE ............................................................................................................................. 81 4.3 THE USER INTERFACE - DESIGNED FOR NOVICE USE ...................................................................................... 83
Andrew. S. Scott PhD Thesis University of Glamorgan
Page vii
4.4 A VISUAL AND TEXTUAL REPRESENTATION OF PROGRAMMING ................................................................... 86 4.4.1 The Flowcharts .............................................................................................................................................................. 87 4.4.2 The Generated Code ....................................................................................................................................................... 90 4.4.3 The Inspectors – Designed to aid Tracing ....................................................................................................................... 92
4.5 PROGRAM CONSTRUCTION – PROBLEM SOLVING FOCUSED ........................................................................... 93 4.5.1 Beginning a Program ...................................................................................................................................................... 94 4.5.2 Defining Variables and Arrays ..................................................................................................................................... 95 4.5.3 Adding Components and Structures to a Program .......................................................................................................... 97 4.5.4 Creating Partially Complete Programs for Problem Solving by Others .......................................................................... 100
4.6 PROGRAM ANIMATION........................................................................................................................................... 100 4.7 THE CONCEPTS AND STRUCTURES IMPLEMENTED BY PROGRANIMATE ...................................................... 103
4.7.1 Start and Terminate..................................................................................................................................................... 103 4.7.2 Print ............................................................................................................................................................................ 104 4.7.3 Read ............................................................................................................................................................................ 105 4.7.4 Assign ......................................................................................................................................................................... 106 4.7.5 The Control Structures – If, If_Else, While and For .................................................................................................. 107 4.7.6 Construct Expression Handling ................................................................................................................................... 113
4.8 ERROR HANDLING .................................................................................................................................................. 114 4.8.1 Placement Errors ......................................................................................................................................................... 115 4.8.2 Syntax and Semantic Errors ........................................................................................................................................ 115 4.8.3 Path Testing to Prevent the use of Undeclared and Un-initialised Variables ................................................................ 116 4.8.4 Run time Errors .......................................................................................................................................................... 117
4.9 WEB BASED ACCESS AND INTEGRATION ............................................................................................................. 118 4.9.1 Web Start Deployment................................................................................................................................................. 118 4.9.2 Applet Deployment ...................................................................................................................................................... 119 4.9.3 The Progranimate Website. .......................................................................................................................................... 120
4.10 CHAPTER SUMMARY AND CONCLUSIONS ........................................................................................................... 121
CHAPTER 5 A PROBLEM SOLVING SCAFFOLDING PEDAGOGY .................................................. 124
5.1 INTRODUCTION ....................................................................................................................................................... 124 5.2 INSTRUCTIONAL SCAFFOLDING ........................................................................................................................... 124 5.3 THE ZONE OF PROXIMAL DEVELOPMENT ........................................................................................................ 125 5.4 A SCAFFOLDING PEDAGOGY ................................................................................................................................ 126 5.5 ONLINE PEDAGOGIC PROBLEM SOLVING ACTIVITIES.................................................................................... 131
5.5.1 The Activity Pack Worksheets .................................................................................................................................... 132 5.6 PEDAGOGY USE ...................................................................................................................................................... 137 5.7 CHAPTER SUMMARY AND CONCLUSIONS ........................................................................................................... 138
CHAPTER 6 METHODOLOGY .............................................................................................................. 139
6.1 INTRODUCTION ....................................................................................................................................................... 139 6.2 RESEARCH AND DEVELOPMENT METHODOLOGY ........................................................................................... 139 6.3 EVALUATION METHODOLOGY ............................................................................................................................ 141
6.3.1 What Evaluation Data was Collected, How and Why? .............................................................................................. 142 6.3.2 How was the Data Collected? ...................................................................................................................................... 148 6.3.3 Summary of Evaluation Data and Gathering Techniques ............................................................................................ 159 6.3.4 Control and Study Groups and Pre and Post Testing ................................................................................................... 160
6.4 CHAPTER SUMMARY AND CONCLUSIONS ........................................................................................................... 163
CHAPTER 7 DEVELOPMENT AND EVOLUTION ............................................................................. 164
7.1 INTRODUCTION ....................................................................................................................................................... 164 7.2 PHASE 1 - INITIAL DEVELOPMENT AND CONCEPTION - PROGRANIMATE V1.0 ........................................ 164 7.3 STUDY ONE - PRELIMINARY EVALUATION WITH V1.0 .................................................................................... 166
7.3.1 The Participants ........................................................................................................................................................... 167 7.3.2 Evaluation Method ...................................................................................................................................................... 167 7.3.3 Results ......................................................................................................................................................................... 168 7.3.4 Study One Conclusions ................................................................................................................................................ 169
7.4 PHASE 2 - PROGRANIMATE VERSION 2.0 ............................................................................................................ 169 7.4.1 Phase 2 Improvements .................................................................................................................................................. 169

Andrew. S. Scott PhD Thesis University of Glamorgan
Page viii
7.4.2 Study Two - High School Pupils with V2.0 ................................................................................................................ 172 7.5 PHASE 3 - PROGRANIMATE VERSION 2.5 ............................................................................................................ 176
7.5.1 Phase 3 Improvements .................................................................................................................................................. 176 7.5.2 Evaluation of Progranimate Version 2.5 ..................................................................................................................... 180 7.5.3 Study Three - Bridgend Technical College with version 2.5 ........................................................................................... 180 7.5.4 Study Four - Secondary School and College Teachers with Version 2.5 ........................................................................ 191
7.6 PHASES 4 AND 5 - PROGRANIMATE VERSIONS 3 AND 3.5 ................................................................................ 197 7.6.1 Phase 4 - Version 3.0 Improvements ........................................................................................................................... 198 7.6.2 Phase 5 - Version 3.5 Improvements ........................................................................................................................... 202
7.7 CHAPTER CONCLUSIONS........................................................................................................................................ 205
CHAPTER 8 SECONDARY SCHOOL EVALUATIONS ....................................................................... 209
8.1 INTRODUCTION ....................................................................................................................................................... 209 8.1.1 Evaluation Criteria...................................................................................................................................................... 210
8.2 STUDY FIVE - NOVICES AGED FIFTEEN TO SEVENTEEN ............................................................................. 211 8.2.1 Study Participants ........................................................................................................................................................ 212 8.2.2 Evaluation Method ...................................................................................................................................................... 212 8.2.3 Results ......................................................................................................................................................................... 213 8.2.4 Study Five Conclusions ................................................................................................................................................ 221
8.3 STUDY 6: NOVICES AGED THIRTEEN TO FIFTEEN: ......................................................................................... 223 8.3.1 Participants .................................................................................................................................................................. 223 8.3.2 Study Duration ............................................................................................................................................................ 224 8.3.3 Evaluation Method ...................................................................................................................................................... 224 8.3.4 Evaluation Feedback Methodology ............................................................................................................................... 225 8.3.5 Results ......................................................................................................................................................................... 226 8.3.6 Study Six Conclusions ................................................................................................................................................. 236
8.4 STUDY SEVEN: SECONDARY SCHOOL TEACHERS OPINIONS OF PROGRANIMATE ..................................... 238 8.4.1 Participants .................................................................................................................................................................. 238 8.4.2 Evaluation Method ...................................................................................................................................................... 238 8.4.3 Results ......................................................................................................................................................................... 239 8.4.4 Study Seven Conclusions .............................................................................................................................................. 245
8.5 CHAPTER SUMMARY AND CONCLUSIONS ........................................................................................................... 247
CHAPTER 9 UNIVERSITY EVALUATION .......................................................................................... 249
9.1 INTRODUCTION ....................................................................................................................................................... 249 9.2 EVALUATION CRITERIA ......................................................................................................................................... 250 9.3 THE TWO EVALUATION GROUPS MANCHESTER AND GLAMORGAN ........................................................... 251
9.3.1 The Glamorgan Group ................................................................................................................................................ 251 9.3.2 The Manchester Group ................................................................................................................................................ 253
9.4 QUESTIONNAIRE METHODOLOGY ...................................................................................................................... 254 9.5 RESULTS .................................................................................................................................................................... 255
9.5.1 Is Progranimate Usable with Respect to University Students? ....................................................................................... 257 9.5.2 Do Students Find Progranimate Helpful in their Learning of Programming? ............................................................... 259 9.5.3 Are the Flowcharts Helpful in Supporting the Learning of Programming .................................................................... 260 9.5.4 Is the Code Generation Helpful in Supporting the Students Learning? ......................................................................... 262 9.5.5 Are the Animation Features Useful in Supporting the Students Learning? .................................................................. 263 9.5.6 Does Progranimate Focus on Problem Solving and Assist the development of Problem Solving Skill? ........................... 264 9.5.7 Does Progranimate Help Students with all the Concepts and skills it is Designed to Support? ..................................... 266 9.5.8 How Does Progranimate Compare Against Existing Learning Recourses, Development Systems and Help Available to Students?. 267 9.5.9 Has Progranimate‟s Integration with the Introductory Programming Module Improved Grades? ................................... 269 9.5.10 Does Progranimate benefit All Abilities or Only one Particular Group? ...................................................................... 270 9.5.11 Does Progranimate Favour the Visual, Balanced or Verbal Learning Styles? ............................................................. 272
9.6 CHAPTER SUMMARY AND CONCLUSIONS ........................................................................................................... 275
CHAPTER 10 SUMMARY AND CONCLUSIONS ................................................................................... 278
10.1 HOW THE OBJECTIVES WERE MET ..................................................................................................................... 279 10.2 HOW THE AIMS WERE MET .................................................................................................................................. 281 10.3 CONTRIBUTIONS OF THIS RESEARCH .................................................................................................................. 283

Andrew. S. Scott PhD Thesis University of Glamorgan
Page ix
10.4 CURRENT AND FUTURE WORK ............................................................................................................................. 284 10.5 FINAL REMARKS ...................................................................................................................................................... 285
REFERENCES ................................................................................................................................................... 287
APPENDICES ................................................................................................................................................... 299
APPENDIX A Reviewed Systems .................................................................................................................. 301
APPENDIX B Progranimate Images and Class Structure ................................................................................. 316
APPENDIX C Example Programming Problems ............................................................................................ 331
APPENDIX D Study 1 And 2 Exercises ......................................................................................................... 342
APPENDIX E Study 3 - Bridgend Evaluation ................................................................................................ 345
APPENDIX F Study 4 – Secondary School And College Teachers ................................................................... 374
APPENDIX G Study 5 - Novices Ages Fifteen to Seventeen ............................................................................ 485
APPENDIX H Study 6: Novices Aged 13 To 15 ............................................................................................. 401
APPENDIX I Study 7: Secondary School Teachers Opinions ......................................................................... 421
APPENDIX J Study 8 – University Evaluation .............................................................................................. 429

Andrew. S. Scott PhD Thesis University of Glamorgan
Page x
List of Figures:
Figure 2-1 Hello World in the Java Language. .............................................................................................................................. 22 Figure 2-2 Various User Input Syntaxes in Java ............................................................................................................................ 22 Figure 2-3 A Common Novice Pitfall when Learning the Control Structures in Java ........................................................... 23 Figure 3-1. The Felder Silverman LSM. ........................................................................................................................................... 39 Figure 3-2. An Example of The Visual /Verbal Dimension Continuum .................................................................................. 40 Figure 3-3. Program Visualisation and Algorithm Animation...................................................................................................... 45 Figure 3-4. Results From Grissom et al............................................................................................................................................ 47 Figure 3-5. The Simplicity of Flowchart Notation ......................................................................................................................... 52 Figure 3-6. Unstructured and Structured Bubble Sort Flowcharts .............................................................................................. 55 Figure 3-7. The various elements of BACCI and a sample of its generated code .................................................................... 58 Figure 3-8. Various images of FLINT‟s user interface .................................................................................................................. 59 Figure 3-9. Empirica Control ............................................................................................................................................................. 61 Figure 3-10. The Flowchart Interpreter ............................................................................................................................................ 62 Figure 3-11. RAPTOR and an example of its generated code ..................................................................................................... 63 Figure 3-12. The SFC Editor .............................................................................................................................................................. 65 Figure 3-13. Visual Logic and a sample of its generated code...................................................................................................... 66 Figure 3-14. The Iconic Programmer ............................................................................................................................................... 68 Figure 3-15. Dev Flowcharter ............................................................................................................................................................ 69 Figure 3-16. Ari and Yamazaki‟s Web Based Flowcharting Application .................................................................................... 71 Figure 3-17. The B# Iconic Programming Environment ............................................................................................................. 72 Figure 3-18. The ProGuide Environment ....................................................................................................................................... 73 Figure 3-19. Glezou and Gridoriadoi‟s Interactive Tutorial ......................................................................................................... 74 Figure 3-20. Code Visual to Flowchart ............................................................................................................................................. 75 Figure 4-1. The Progranimate Environment with All Its Features Visible ................................................................................ 83 Figure 4-2. Further Simplifications of Progranimate. .................................................................................................................... 84 Figure 4-3. The Six Main Parts Progranimate‟s User Interface .................................................................................................... 84 Figure 4-4. Bi-directional Synchronised Highlighting of the Flowchart, Code and Inspectors ............................................. 86 Figure 4-5. The Flowchart Components and Structures ............................................................................................................... 88 Figure 4-6. Progranimate‟s nesting capabilities. .............................................................................................................................. 89 Figure 4-7. The Generated Code ....................................................................................................................................................... 91 Figure 4-8. The Variable ...................................................................................................................................................................... 92 Figure 4-9. Naming a Program........................................................................................................................................................... 94 Figure 4-10. The variable definition dialog ...................................................................................................................................... 96 Figure 4-11. Variable Definition Error handling ............................................................................................................................ 96 Figure 4-12. The Inspector Variables and Related Declarations ................................................................................................. 96 Figure 4-13. Array Definition Dialog ................................................................................................................................................ 97 Figure 4-14. Array Definition Dialog Errors ................................................................................................................................... 97 Figure 4-15. Program Arrays in the Inspector and in Code.......................................................................................................... 97 Figure 4-16. An Example of Program Construction...................................................................................................................... 99 Figure 4-17. Definition Dialogs for the Assign, While and For Constructs ........................................................................... 100 Figure 4-18. Definition Dialog Error Handling ............................................................................................................................ 100 Figure 4-19. The Inspectors at Run Time ...................................................................................................................................... 101 Figure 4-20. Program output via the IO console .......................................................................................................................... 101 Figure 4-21. The Animation Controls ............................................................................................................................................ 102 Figure 4-22. The correlation between the Start and Terminate components and their code equivalents .......................... 104 Figure 4-23. The code generated by the Print component ......................................................................................................... 105 Figure 4-24. The code generated by the Read component ......................................................................................................... 106 Figure 4-25. Example Assignment Expressions ........................................................................................................................... 107 Figure 4-26. The Code Generated by the Assign Component ................................................................................................... 107 Figure 4-27. How the Flowchart and Code of the If structure Relate to Each Other. .......................................................... 109 Figure 4-28. How the Flowchart and Code of the If_Else Structure Relate to Each Other. ............................................... 110 Figure 4-29. The While Loop Representation in the Flowchart and Code Views and How they Relate. .......................... 111 Figure 4-30. The For Loop Definition Dialogs for Java and Visual Basic ............................................................................... 112 Figure 4-31. The Flowchart and Code Representation of the For Looping Structure in Java and Visual Basic .............. 113 Figure 4-32. Example data set for expression error examples ................................................................................................... 116 Figure 4-33. Example path testing error......................................................................................................................................... 117

Andrew. S. Scott PhD Thesis University of Glamorgan
Page xi
Figure 4-34. A run time error for exceeding an arrays bounds ................................................................................................. 117 Figure 4-35. The web link for launching Progranimate ............................................................................................................... 118 Figure 4-36. Examples of applet deployment ................................................................................................................................ 120 Figure 5-1. The Zone or Proximal Development ......................................................................................................................... 125 Figure 5-2. An Overview of the Cyclic Scaffolding Based Pedagogy ....................................................................................... 130 Figure 5-3. Selecting a Language in an Activity Pack Page ......................................................................................................... 133 Figure 5-4. A Typical Stage C1 Problem Worksheet ................................................................................................................... 134 Figure 5-5. A Typical Stage C3 Worksheet .................................................................................................................................... 135 Figure 5-6. Typical Steps C4 and D Worksheets .......................................................................................................................... 136 Figure 6-1. The Blend of Formal and Action Research Methodologies Used ........................................................................ 139 Figure 6-2. The Iterative Development of Progranimate via Formal and Action Research ................................................. 140 Figure 7-1. An Early Conceptual Design of Progranimate ......................................................................................................... 165 Figure 7-2. Progranimate Version 1.0 from Phase 1 .................................................................................................................... 166 Figure 7-3. The Package Structure of Progranimate V3.0to V3.5 ............................................................................................. 198 Figure 7-4. Implemented Read Syntaxes in Java ........................................................................................................................... 199 Figure 7-5. Website Structure ........................................................................................................................................................... 200 Figure 7-6. Popup Error Messages. ................................................................................................................................................. 202 Figure 7-7. Improved Error Handling Mechanisms. ................................................................................................................... 203 Figure 7-8. A Comparison Between the User Interfaces of Versions 3.0 and V.5 ................................................................. 204 Figure 8-1. Study Five - Usability Questions 3 and 4 by Gender .............................................................................................. 215 Figure 8-2. Problem Completion Statistics For Study Five - Bar Chart ................................................................................... 221 Figure 8-3. Study 6 - Average Questionnaire Responses Grouped by Gender and Year ..................................................... 233 Figure 8-4. Completion Times for Study 6 .................................................................................................................................... 234 Figure 8-5. Study 6 - Male Problem Statistics ................................................................................................................................ 235 Figure 8-6. Study 6 - Female Problem Statistics ........................................................................................................................... 235 Figure 8-7. Study 6 – Year 9 Problem Statistic ............................................................................................................................. 235 Figure 8-8. Study 6 – Year 10 Problem Statistics .......................................................................................................................... 235 Figure 9-1 - Grade Improvements in the Years Progranimate was Used ................................................................................ 270 Figure 9-2. Q15 - How Many Times did you use Progranimate without Being Asked? –by Grade Group ..................... 271 Figure 9-3. Q3 Progranimate was useful in my studies of Programming –by Grade Group ............................................... 272 Figure 9-4. Visual / Verbal / Balanced Learning Styles Classification of the Participants ................................................... 272 Figure 9-5. The General Efficacy of Progranimate by Visual, Balanced and Verbal Learning Style Groups.................... 273 Figure 9-6. Flowchart Questions Six to Nine by Learning Style ................................................................................................ 274 Figure 9-7. Code Generation Questions Q19b, Nine and Ten .................................................................................................. 275

Andrew. S. Scott PhD Thesis University of Glamorgan
Page xii
List of Tables
Table 2-1 First Years Coming from Secondary Education .......................................................................................................... 9 Table 3-1. Visual Verbal Learning Style Distributions................................................................................................................... 41 Table 3-2. Multi Institutional Results from Felder and Spurlin ................................................................................................... 41 Table 3-3. A Comparison of the Reviewed Systems ...................................................................................................................... 76 Table 4-1. The Data Types .............................................................................................................................................................. 113 Table 4-2. General Operators, Commands and Symbols ............................................................................................................ 113 Table 4-3. Arithmetic Operators...................................................................................................................................................... 114 Table 4-4. Relational Operators ....................................................................................................................................................... 114 Table 4-5. Logical Operators ............................................................................................................................................................ 114 Table 4-6. Example Expressions ..................................................................................................................................................... 114 Table 4-7. Expression error examples ............................................................................................................................................ 116 Table 4-8. Comparing Progranimate with other relevant systems ............................................................................................. 123 Table 5-1. The Problem Solving Activity Packs ........................................................................................................................... 132 Table 6-1. Evaluation Groups .......................................................................................................................................................... 141 Table 6-2. Example Likert Questions ............................................................................................................................................. 150 Table 6-3 Example Multiple Choice Questions ............................................................................................................................ 151 Table 6-4. Example Dichotomous Question ................................................................................................................................ 151 Table 6-5. Two examples of the Hybrid Questions Used. .......................................................................................................... 152 Table 6-6 Summary of Evaluation Criteria and Data Gathering Techniques.......................................................................... 159 Table 7-1.The Initial Requirements Definition ............................................................................................................................. 165 Table 7-2. Evaluation Results for Study One ................................................................................................................................ 168 Table 7-3. Evaluation Results for Study Two with Version 2.0 ................................................................................................. 173 Table 7-4. Bridgend Evaluator Attendance ................................................................................................................................... 180 Table 7-5. Bridgend Study Usability Questionnaire ..................................................................................................................... 183 Table 7-6. Efficacy Questionnaire Results ..................................................................................................................................... 185 Table 7-7. Correlations between Q12 to Q15 Responses and Problem Solving Performance of the Evaluators ............ 186 Table 7-8. Average Number of Problems Solved Per Session Grouped by Ability Range................................................... 187 Table 7-9. Number of Problems Solved by the Evaluators Grouped by Attendance ........................................................... 188 Table 7-10. Completion Times of Improvers ............................................................................................................................... 189 Table 7-11. Difficulty of the Problem Solving Activities – Feedback from 21 Evaluators .................................................. 189 Table 7-12. Secondary School Teachers Evaluation Participants .............................................................................................. 192 Table 7-13. Secondary School Teachers Usability Questionnaire Results. .............................................................................. 193 Table 7-14. How Features were Derived ...................................................................................................................................... 205 Table 7-15. The Feature Set and Evolution of Progranimate .................................................................................................... 206 Table 8-1. Secondary School Studies Evaluation Criteria ........................................................................................................... 210 Table 8-2. Evaluators Providing Data for Study Five .................................................................................................................. 212 Table 8-3. Study 5 High School Pupils Aged 15-17 - Questionnaire Results .......................................................................... 214 Table 8-4. Study 5 – Results of Efficacy Questions ..................................................................................................................... 217 Table 8-5. Study 5 – Results of Problem Solving Questions ...................................................................................................... 218 Table 8-6. Study 5 – Perceived Difficulty of Problems by School Year ................................................................................... 219 Table 8-7. Comparison of Problem Completion Times Between Study Three and Five ..................................................... 220 Table 8-8. Problem Completion Statistics for Study Five ........................................................................................................... 221 Table 8-9. Participant Information for Study 6 ............................................................................................................................. 223 Table 8-10. Study 6 Duration Breakdown ..................................................................................................................................... 224 Table 8-11. Study 6 - Usability Questionnaire Results ................................................................................................................. 226 Table 8-12. Study 6 – The Evaluators‟ Initial Impressions of Progranimate V3.5 ................................................................. 227 Table 8-13. Study Six - Efficacy Questionnaire Results .............................................................................................................. 229 Table 8-14. Study 6 - Programming Problem Related Questionnaire Responses................................................................... 231 Table 8-15. Study 6 - Completion Statistics ................................................................................................................................... 233 Table 8-16. Completion Statistics Studies 3, 5 and 6 .................................................................................................................. 234 Table 8-17. Study 7 - A Summary of the Teacher Profile Question Responses .................................................................... 240 Table 8-18. Programming Ability and Whether Programming is Taught ................................................................................ 240 Table 8-19. Language Knowledge of Teachers in this Evaluation and Study Four ............................................................... 241 Table 8-20. Perspectives of Progranimate Questionnaire Responses ....................................................................................... 242 Table 8-21. Study Severn Programming Ability and Individual Responses to Questions 1 to 3 ......................................... 243 Table 8-22. Programming Ability and Individual Responses to Questions 4 to 7 ................................................................. 243

Andrew. S. Scott PhD Thesis University of Glamorgan
Page xiii
Table 8-23. Study 7 - Perceptions of Programming Questions 17 and 18. .............................................................................. 245 Table 9-1. Evaluation Criteria and Justification for them. .......................................................................................................... 250 Table 9-2. An Overview of the Glamorgan Group Student Demographic ............................................................................. 251 Table 9-3. An Overview of the Manchester Group Student Demographic ............................................................................ 253 Table 9-4. Final Questionnaire - Five Point Likert Questions 1 to 14 – Efficacy and Usability ........................................ 255 Table 9-5. Final Questionnaire - Multi Option - Multi Response - Questions 15 to 19 – Usage ........................................ 255 Table 9-6. Final Questionnaire - Seven Point Liker Questions 20a to 20n – Areas of Assistance ...................................... 256 Table 9-7. Final Questionnaire - Seven Point Likert Questions 21a to 21e - Evaluating Main Features ........................... 256 Table 9-8. Final Questionnaire - Seven Point Likert Questions 22a to 22e - Comparison of Learning Aids ................... 256 Table 9-9. Final Questionnaire – Ease of Use Responses by all Students ............................................................................... 258 Table 9-10. Enjoyment – Responses by All Students .................................................................................................................. 258 Table 9-11. Final Evaluation - Q4 and Q5 - Helpfulness of Progranimate ............................................................................. 259 Table 9-12. Final Questionnaire - How Much Was Progranimate Used – Q15, Q16 and Q17 .......................................... 259 Table 9-13. Final Questionnaire - Helpfulness of the Flowcharts ............................................................................................. 261 Table 9-14. Final Questionnaire - Flowchart Question Responses ........................................................................................... 261 Table 9-15. Final Questionnaire – Seven Point Likert Code Generation Related Questions .............................................. 262 Table 9-16. Final Questionnaire – Five Point Likert Code Generation Related Questions ................................................. 262 Table 9-17. Final Questionnaire - Animation Related Questions .............................................................................................. 264 Table 9-18. Final Questionnaire - Five Point Likert Problem Solving Questions ................................................................. 265 Table 9-19. Final Questionnaire - Seven Point Likert Problem Solving Questions .............................................................. 265 Table 9-20. Final Questionnaire - What Skills and Concepts does Progranimate Assist ...................................................... 267 Table 9-21. Glamorgan Students Rating the Helpfulness of the Learning Resources Available to Them ........................ 268 Table 9-22. Manchester Students Rating the Helpfulness of the Learning Recourses Available to Them ........................ 268 Table 9-23. Overall Module Marks for the Introduction to Programming Module .............................................................. 270 Table 9-24. Learning Style Distributions of the Participants ...................................................................................................... 273 Table 10-1. Study Participants .......................................................................................................................................................... 281 Table 10-2. How Progranimate and the Pedagogy Assist the Development of Problem Solving Skills ............................ 282

Andrew. S. Scott PhD Thesis University of Glamorgan
Page xiv
List of Abbreviations and Acronyms:
ACM = Association for Computing Machinery
BACCI = Ben A Calloni Coding for Iconic Interface
CPHC = Council of Professors and Heads of Computing
CSS = Cascading Style Sheets
CVS = Code Visual to Flowchart,
DF = Dev Flowcharter
EC = Empirica Control
FCI = Flowchart Interpreter,
FLINT = Flowchart Interpreter.
FSLM = The Felder Silverman Learning Styles Model
GIU = Graphical User Interface
HE = Higher Education
HESA = Higher Education Statistics Agency
HND = Higher National Diploma
HTML = Hyper Text Mark-up Language
ICT = Information and Communication Technology
IDE = Integrated Development Environment
ILSQ = Index of Learning Styles Questionnaire
Jar = Java Archie Executable File.
JSP = Jackson Structured Programming
JWS = Java Web Start
LSM = Learning Style Model
LSTN-ICS = Learning and Teaching Support Network Centre for Information and Computer Sciences
MBPS = Megabytes Per Second
MCQ = Multiple Choice Questionnaire
MS = Microsoft Corporation
MVC = Model View Controller
NSD = Nassi-Shneiderman Diagram
OBOE = Off By One Error
OHP = Overhead Projector
PC = Personal Computer
PG = ProGuide
PV = Program Visualisation
SFC = Structured Flowchart Editor.
UCAS = University and Colleges Admissions Service
UML = Unified Modelling Language
URL = Uniform Resource Locator
VB = Visual Basic > Version 6
VB6 = Visual Basic Version 6
VB.NET = Visual Basic .NET
VL = Visual Logic
VLE = Virtual Learning Environment
ZPD = Zone of Proximal Development

Andrew. S. Scott PhD Thesis University of Glamorgan
Page xv
Published Works:
This work documented in this thesis has resulted in a number of published research papers. A selection of the most prominent papers is shown below. Printouts of these papers can be found at the back of the thesis after the appendices.
Watkins M, Stocking S and Scott A,2008, Taking University to Schools, ICSHEA 2008, The Higher Education Academy, Liverpool - UK,
Conference Website: [Online Accessed April 2008]http://www.ics.heacademy.ac.uk/events/9th-annual-conf/
Scott A, Watkins M, and McPhee D,2008,Progranimate - A Web Enabled Problem Solving Application, The 2008 International Conference
on e-Learning, e-Business, Enterprise Information Systems, and e-Government, 2008 World Congress in Computer Science, Computer
Engineering and Applied Computing, Las Vegas – USA, pp: 498-508.
Scott A, Watkins M and McPhee D,2008, E-Learning For Novice Programmers - A Dynamic Visualisation and Problem Solving Tool,
Proceedings of the ICTTA 2008, Syrian Computing Society / IEEE, Damascus – Syria.
Scott A, Watkins M and McPhee D, 2007, A Step Back From Coding- An Online Environment and Pedagogy for Novice Programmers,
Proceedings of the 11h Java in the Internet Curriculum Conference, The Higher Education Academy, London Metropolitan University - UK,
pp: 35-41.

Introduction Aims and Overview Chapter 1.- Introduction
Page 1
Chapter 1 Introduction Aims and Overview
Introduction Aims and Overview
1.1 Introduction
Learning to program has long been established as a particular difficulty for novices. This claim is
backed up by the large amount of literature devoted to the numerous problems they experience.
Over this time there has been a plethora of instructional approaches and tools that aim to overcome
the various problems encountered by novice programmers. Despite this vast body of research,
introductory programming continues to be a problem for the unacquainted novice trying to learn
the subject at school, college and university.
In order to succeed a novice programmer must simultaneously acquire many new skills and
concepts and needs to:
Learn the core imperative the programming concepts (i.e. variables, sequence, selection and
iteration).
Quickly learn to represent and read these concepts via the keywords and symbols of a
programming language.
Learn to apply this knowledge within a development environment.
Develop various problem solving skills and strategies in order to put the imperative concepts
together to achieve intended outcomes.
Novices studying objects first will also have to contend with classes, methods, constructors,
overloading and other introductory OO concepts, thus complicating the subject yet further.
With so many new conceptually challenging things to learn it is easy for all but the most innately
skilled novices to become overwhelmed, overburdened and de-motivated, especially during the first
term. It is for this reason that programming courses are regarded as difficult and have higher than
average drop out rates (Robins. A et al, 2003, Bennedsen and Caspersen, 2007), and why many

Introduction Aims and Overview Chapter 1.- Introduction
Page 2
novices continue their studies with an aversion to the subject (Jenkins and Davy, 2002). Between
2004 and 2008 Glamorgan‟s Java based imperatives first (objects later) introductory programming
courses have seen average combined failure and dropout rates of approximately 40%.
Chapter 2 of this thesis reviews the literature relating to novice programmers and the difficulties
they face. The reviewed literature demonstrates that of all programming skills, in general problem
solving appears to be the most prominent weakness of novice programmers, during and even after
an introductory course. Not only do novices have a difficulty putting the imperative concepts
together to achieve an intended outcome, they experience difficulty abstracting a program‟s
requirements or problem specification into a working program.
While the lack of problem solving skill has been highlighted as the most prominent difficulty, the
cause of this difficulty is not simply problem solving itself, though it is part of the problem. This
weakness is also partially due to deficiencies in skills which are pre-requisites of problem solving.
These include but are not limited to comprehension of the imperative concepts, knowledge of how
these concepts can be combined to build algorithms, and the ability to read and comprehend code
in order to predict its flow and outcome. Further examples are discussed in Chapter 2. However, an
additional and more pressing issue is that mastery of these prerequisite skills and problem solving as
a whole is being overshadowed by complexities associated with writing code in professional
languages, and the use of development environments never intended for novice use.
The syntax and semantics of a programming language can have a profound effect on the
performance of novices. Most introductory courses introduce their students to a full strength
industrial language such as Java or C++. These are easily misunderstood, intolerant of mistakes and
deluge the novice with overly complex syntax and inconsistent semantic behaviour. As a result, the
students end up spending the majority of their time wrestling with the grammar, leaving other skills
such as problem solving underdeveloped. However, despite spending time with the grammar,
authors report that novices are unable to read, comprehend and predict the outcome of even simple
programs. This inability is another contributory factor in the novices‟ poor problem solving ability,
as they are unable to fully understand, validate or debug the code they have written.
Novices are also often expected to use a fully featured professional integrated development
environment (IDE). A professional IDE will be counter-productive to introductory programming,
as the vast array of visual and functional complexity may overwhelm and intimidate a novice. The
learning curve of a professional IDE will increase the difficulty of programming and further distract
the novice from conceptual understanding and the development of problem solving and its

Introduction Aims and Overview Chapter 1.- Introduction
Page 3
prerequisite skills.
This thesis suggests that in teaching novices, more attention needs to be paid to the underlying
abstractions of programming, problem solving and its prerequisite skills, especially early on and
when introducing to new concepts. To achieve this, the emphasis of the novices‟ programming
tasks needs to be shifted from the language and the IDE, towards the abstractions of programming,
the underlying algorithms, how the imperative pieces fit together and the flow of execution between
them. Languages and development environments come and go, but mastery of the imperatives and
problem solving will offer transferable skills pertinent to programming in any paradigm or language
and provide a solid foundation for which to graduate on to more complex topics.
This thesis charts the research, development and evaluation of „Progranimate‟, an interactive web
based problem solving application that utilises flowchart based programming, code generation in a
variety of languages, visualised execution, and an associated pedagogy to address the skill
deficiencies and weaknesses of novice programmers within their first few weeks and months of
instruction. The overall objective is to reduce the impact of complex development environments
and language syntax. This aims to allow novices to focus on gaining a better conceptual
understanding and on overcoming their weaknesses of algorithmic problem solving and subsequent
development of source code.
1.2 Aims and Objectives of Research Project
The overall goal of this research is to bring about improvements in the abilities of novice
programmers taking their first steps in programming at university, college and secondary school
levels.
The main research question being addressed is: can side by side user constructed and structured
flowchart and code program representations and animated execution of them bring about
improvements in the general comprehension and problem solving skills of novice programmers
taking their first steps in an imperatives first introduction to programming?

Introduction Aims and Overview Chapter 1.- Introduction
Page 4
Aims:
Embedded within the overall goal of this research are four key aims which are specified as follows:
1. To help novices overcome their problem solving and related skill deficiencies and
comprehension problems in learning programming
2. By improving student ability increase the pass rates and grades of students studying
introductory programming at Glamorgan
3. To provide an effective and motivating way to introduce programming to secondary school
pupils.
4. To make teaching programming in secondary schools a more appealing option for teachers
and thus less likely avoided.
Objectives:
To achieve the above aims the following objectives were defined:
1. To research the precise nature of the difficulties and skill deficiencies novices have when
learning programming.
2. To research the potential of visualisation and how the use of dynamic structured flowcharts
may be effective in aiding the conceptual understanding and problem solving skills of
novice programmers.
3. Critically review past and current flowchart based visualisation systems and environments
aimed at novice programmers and improve on the state of the art.
4. Using a blend of action research and formal research methodologies, develop, evaluate and
refine a structured flowchart and code based visualisation aid associated pedagogy that
assists novices in learning programming and its associated skills.
5. To evaluate the use of the visualisation aid and pedagogy with high school and university
level novice programmers.

Introduction Aims and Overview Chapter 1.- Introduction
Page 5
1.3 Thesis Layout and Overview
This thesis consists of 10 chapters (including this one) and 10 appendices and is structured as
follows:
Chapter 2 – Background Research, contains the background research relating to novice programmers
and the difficulties they face when taking their initial steps in the subject. In particular problem
solving is highlighted as a prominent weakness of novice programmers due to weaknesses in
prerequisite skills.
Chapter 3 – Visualisation, contains the background research pertaining to the visualisation of
programming. It discusses how interactive and dynamic structured flowchart visualisations may
help novices to conceptualise programming more effectively. It also critically reviews several current
systems in this area of visualisation.
Chapter 4 – Progranimate, presents „Progranimate‟, a unique interactive and visually dynamic flowchart
and generated code based programming environment and execution simulator that aims to address
the novices‟ difficulties in learning programming.
Chapter 5 – Problem Solving Scaffolding Pedagogy, proposes a scaffolding pedagogy designed specifically
for teaching the imperative concepts of programming and problem solving skills via Progranimate.
Chapter 6 – Methodology, discusses and rationalises the various methodologies used in the research,
development and evaluation of Progranimate.
Chapter 7 – Development and Evolution, documents the initial conceptualisation and subsequent
evolution of Progranimate though successive versions and evaluations which helped to refine it, the
associated scaffolding pedagogy, related programming activities and website.
Chapter 8 – Secondary School Evaluations, documents three studies aimed at evaluating Progranimate
and its pedagogy for use in teaching the basics of programming (imperatives first) to secondary
school pupils from 13 to 17.
Chapter 9 – University Evaluation, comprises of a long term evaluation study conducted at two
academic institutions. The study evaluates the benefit of integrating Progranimate within a
university level introductory programming course.

Introduction Aims and Overview Chapter 1.- Introduction
Page 6
Chapter 10 – Summary and Conclusions, concludes this thesis by providing an overview of this research,
restating its key findings and clarifying its contributions to the field of novice programming and
how it met the aims and objectives discussed previously.
References, an A to Z list of references that were used throughout this thesis.
The appendices of this thesis are fairly substantial and contain: images too large to be contained
within the body of this thesis, illustrated examples of Progranimate‟s usage, information on
Progranimate‟s class structure and implementation, example programming activities from
Progranimate‟s website and detailed information and data that support the documented evaluation
studies. These are labelled A to J and begin from page 289 onwards.

The Learning and Teaching of Programming Chapter 2.- Background Research
Page 7
Chapter 2 Background Research
Background Research
The Learning and Teaching of Programming
2.1 Introduction
Since the nineteen seventies researchers have been interested in the abilities of the programmer.
Initial research focused on novice and expert programmers‟ interaction with the computer
(Sackman. H, 1970). Later studies of the seventies and eighties focused on the psychological and
cognitive aspects of programming, for example (Sheil, 1981), (Solloway and Iyengar, 1986).
Literature relating specifically to the difficulties of novice programmers was particularly active in the
nineteen eighties and early nineties, for example (Mayer, 1988, Solloway. E and Spohrer. J, 1988).
More recent trends have moved towards the novice‟s comprehension of object oriented concepts,
for example: (Rist R, 1996, Ramalingham. V and Weidenbeck. S, 1997) and (Cooper et al, 2003).
Over this time there has been a plethora of instructional approaches and tools that aim to overcome
the various problems encountered by novice programmers. Despite this vast body of research
introductory programming continues to be a problem for the unacquainted novice.
This chapter contains the background research relating to novice programmers and the difficulties
they face when taking their initial steps in the subject. Section 2.2 discusses the prior programming
experiences of students enrolling on HE computing courses and establishes why all students are
taught programming from the ground up. Section 2.3 acknowledges the difficulty of learning to
program and the extent to which this problem has been recognised in research literature. Section
2.4 advocates an imperatives first approach to introductory programming stating the case against
the recent trend of teaching objects first in introductory programming courses. Section 2.5 then
looks into the individual skill requirements of programming and highlights the individual difficulties
that novice programmers have. Finally, section 2.5 closes this chapter by presenting the overall
conclusions drawn from the background research into the learning and teaching of programming.
The findings of this research have directed and focused this research project.

The Learning and Teaching of Programming Chapter 2.- Background Research
Page 8
2.2 No Experience Necessary
At the University of Glamorgan, as with most institutions, prior technical knowledge of computing
and programming is not a prerequisite for enrolment on its courses involving programming, as the
quality and quantity of a prior student‟s experience cannot be guaranteed. The students enrolling on
Glamorgan‟s computing courses are able to use a computer and its applications, but many lack
technical expertise and experience with regard to programming. These days computers are more
abundant than ever; this is especially true in the home and at school. Despite their immense
capability, modern home computers are more often than not merely used as tool for entertainment,
i.e. browsing the internet, playing games, music and videos or for more serious tasks via off the
shelf application software. Home computers of the 80‟s were simple, and usually came with a built
in programming language such as Basic. It is testament to the simplicity of computers such as the
ZX Spectrum that many programming books were available for young audiences. Modern
computers do not come pre-packaged with a simple programming language; also their vast
capabilities distract users from exploring the technical side of computing. On the whole, today‟s
students who have owned a computer prior to their studies are less proficient and experienced in
the technical side of computing (such as programming) than those of some fifteen to twenty five
years ago. A similar opinion has also been expressed by (Jenkins and Davy, 2002).
Given that IT is a compulsory subject of the UK secondary school national curriculum, one would
expect enrolling students to have some pre-exposure to programming. Disappointingly, this is not
the case for a large proportion of students. In UK secondary schools computing is split into two
main disciplines: Information and Communication Technology (ICT) and Computer Studies (CS).
The basic distinction between the two subjects can be generalised as follows: ICT students learn
how to use a computer and its software whereas CS students learn the fundaments of computer
hardware, software development and implementation. Students of ICT will learn to use the internet
and application software such as word processors, spreadsheets, databases, desktop publishing etc.
Students studying CS will cover the more technical aspects such as: computer architecture and
hardware, the development of web pages, databases, systems analysis, software development, and
programming. It is clear that students studying a technical computing degree at HE level would
benefit from a good foundation in both ICT and CS at A-Level. Table 2-1 presents the results of a
study of first year undergraduates at Glamorgan (Watkins et al, 2008) and shows that a significant
proportion of students will be arriving from secondary education with no prior programming
tuition.

The Learning and Teaching of Programming Chapter 2.- Background Research
Page 9
Table 2-1 First Years Coming from Secondary Education
Characteristics % of Students Studied CS at A Level 22%
Studied ICT at A Level 71%
Studied neither CS or ICT 7%
Males surveyed 84%
Females surveyed 16%
Source: (Watkins et al, 2008)
In UK schools ICT is compulsory throughout primary and secondary school (ages 5 to 16 pre A-
Level) and most schools offer national qualifications in the subject. (Qualifications and Curriculum
Authority, 2007). In contrast, CS is not compulsory at any level and is usually only studied at the
level of GCSE or A-Level. Most secondary schools offer qualifications in ICT at GCSE and AS /
A2 levels. However, fewer secondary schools offer CS because many schools lack the teaching and
technical skills required for CS topics such as programming. Even where schools offer CS it
transpires that the avoidance of programming is commonplace.
Focus groups were held with secondary school computing teachers from the South Wales (UK)
region (University of Glamorgan, 2007). The aim of these groups was to gain the teachers‟
perspectives on programming in secondary schools. It was discovered that many IT teachers felt
they lacked the skills required to teach computer programming confidently and effectively; as a
result it is often stealthily avoided, despite being a vital part of CS education. In schools where CS
was taught but programming was avoided, teachers expressed a reluctance to spend the time
brushing up on their programming skills, producing course work and sourcing learning materials.
Some of these teachers stated that with an already crammed syllabus there would be insufficient
time to cover programming effectively. Another key driver behind the lack of programming tuition
in the high school is its lack of prominence in the examination. Many teachers did not consider the
subject a high priority due to its low proportion of the marks in the examination. A prevailing view
that went along with this was that the time and effort required to teach the subject effectively can
be more productively spent (in terms of grades) focusing on topics worth a greater proportion of
marks in the examination.
However, this is not a new problem; the shortage of technical skills has been a long standing
problem in secondary education CS. In 1997 Goldstein (1997) stated that most IT teachers lack
qualifications in the subject, and the quality of teaching is poorer than in most other secondary
school subjects. Carter (2001) interviewed pupils about their pre-exposure to computing subjects in
secondary education. Disturbingly, the students interviewed unanimously agreed that most IT
teachers know less about computing than many of their pupils. In this study the students also said
they found it more useful to ask a knowledgeable friend for help than to ask the teachers.
The Learning and Teaching of Programming Chapter 2.- Background Research
Page 10
It is important that the first impressions of the discipline are good. A research report commissioned
by the Council of Professors and Heads of Computing (CHPC, 2006) has demonstrated that many
students have been put off progressing to computing at A-Level due to poor experiences in the
subject at GCSE level. McBride criticises the GCSE and AS/A-level syllabi of many examination
boards as boring, outdated and irrelevant (McBride, 2008). If a school avoids programming or
teaches the subject poorly, how can a student make an informed choice about studying the subject
at HE level? Furthermore, poor teaching of the subject may depict computer programming as a
boring subject and thus, as far as continued study is concerned, do more harm than good.
An additional source of students is those who have taken a foundation year, access course or BTEC
national diploma in computer studies. Students who have entered via these routes will almost
certainly approach their first year with more experience in the technical aspects of computing.
These courses will have more of a computing focus and will more often than not engage the
students in the basics of programming.
At the University of Glamorgan mature students make up approximately 30% of enrolments in first
year computing subjects. Jenkins and Davey (2002) state that the modern trend of recruiting a
larger proportion of mature students means that some students do have a background in
programming and the technical side of computing, but these students are in the minority. Higher
Education Statistics Authority (HESA) statistics show that in the UK approximately 21.5% of full
time computing students studying foundation, HND and degree awards are mature. As a
comparison 73.8% of full time students are under the age of 21 and from state funded schools
(Higher Education Statistics Agency, 2007). The remaining 4.7% are students from other
demographic groups such as private sector schools.
It is obvious that students with experience of programming are at an initial advantage. However,
there is debate whether this advantage is sustained throughout the duration of an introductory
course. Hagen and Markham (2000) have shown that prior experience of at least one language can
have a significant positive effect on the performance and confidence of students throughout the
duration of an introductory programming course. Kumwenda et al (2006) also demonstrated that
prior programming experience has a positive effect on students learning the imperative and
procedural aspects of programming. However, Ventura and Ramamurthy (2004) demonstrated that
students with prior experience of programming performed no better than students with none when
undertaking an objects first introductory course. As the students‟ pre exposure was imperative and
procedural (non OO), it was felt that this experience was not a predictor of success in an objects
first introductory course. At Glamorgan empirical evidence has demonstrated that even students

The Learning and Teaching of Programming Chapter 2.- Background Research
Page 11
with a pre-exposure to programming have been known to fail programming modules. This
correlates with Hagen and Markem (2000) who state, „students who have learnt to program in a situation
where a working program is all that matters can react negatively when required to adopt a software engineering
approach and document their test strategies and program designs. These students have been known to fail the course
because they refuse to put enough effort into the non-coding parts of an assignment‟.
Because the quality and quantity of the students‟ programming experience cannot be guaranteed
and since a large number of students have no experience, programming is generally taught from the
ground up to all students. In most institutions it is simply not practical to split students up based on
ability, due to the low number of students enrolling or the unbalanced class sizes this would create.
Furthermore, dividing students into ability streams would add problems as the students studying
subsequent courses or modules would still not be on a level playing field. Hence the need for ability
streams would continue into the second year and beyond. This would put the non experienced
programmers at a perpetual disadvantage.
With relatively few students coming to university with programming experience, the tutor must
expend a great deal of time and effort teaching students who have difficulty understanding the
basics. Ensuring students have achieved a solid foundation in the basics of programming is the
main aim of an introductory course. Like most subjects the first few weeks are the most important
to get right and are crucial to continued success. In the following sections the difficulties of learning
programming are discussed.
2.3 Learning Programming is Difficult
The terms „novice‟ and „expert‟ are relative terms; after all we are all novices in some areas and
experts in others. In the context of this thesis a novice is someone new to programming and as
such, lacks the time served skills, deep knowledge and strategies of expert programmers.
Anyone who has ever taught programming will know that for all but the best students, an
introductory course in programming is difficult. The vast amount of research and literature
surrounding this issue provides more than sufficient proof to back this claim. Over the last 25
years, national and international research has provided a plentiful amount of evidence that
demonstrates the extent to which this problem is acknowledged. A quick search of the ACM Portal
website (Association for Computing Machinery, 2008) with terms such as „novice‟, „programmer‟,
„difficult‟ and „problem‟ will make the extent of the literature clear. Furthermore, doing the same in

The Learning and Teaching of Programming Chapter 2.- Background Research
Page 12
Google.com (Google Inc., 2008) yields some 425,00 results of which most appear relevant. From
this it can be deduced that the difficulty of novice programmers is a widely acknowledged, long
standing problem of international concern.
Year on year, many of Glamorgan‟s first year programming students get discouraged when taking
their initial steps in programming due to the difficulties they face. In some cases this causes an
aversion to programming; in the extreme it can cause the student to drop the module or their
studies as a whole. If the novices‟ early experiences of the subject are negative, it can have a
detrimental effect on their confidence and subsequent ability in programming. Chalk and et al
(2003) support this view, stating, „early failure to understand key concepts in the first few weeks seems to
undermine students‟ confidence and their ability to succeed‟. Jenkins and Davy (2002) state „anyone who has
presented an introductory programming module will be all too familiar with students who appear unable to grasp the
basic concepts‟. It takes very few negative experiences at the early stages to make the student
disillusioned. Very often students show enthusiasm at the start but this decreases as barrier after
barrier emerges in the learning cycle (Dunnican, 2002). Students who have had one too many
negative experiences will often continue their studies with an aversion to programming or in the
worse case scenario drop out. Lecturers who come to supervise final year dissertations and projects
will be all to familiar with students who insist that they want to avoid programming at all costs
(Jenkins and Davy, 2002) and (Jenkins, 2001).
University of Glamorgan statistics show that approximately 31% of student‟s dropout or otherwise
fail to pass the Java based Introductory Programming Module. Robins et al (2003) state that
„programming courses are generally regarded as difficult, and often have the highest dropout rates‟. Sheard and
Hagen provide similar anecdotal evidence (Sheard and Hagen, 1998). A House of Commons report
into student retention in the UK provides statistical evidence to back these claims. In this report it
was shown that Mathematical and Computer Sciences have the lowest retention rates among all UK
undergraduates (National Audit Office, 2007). Bennedsen and Caspersen (2007) aimed to quantify
the rate of failure in computing by surveying sixty two HE institutions; the results showed an
average failure rate of 33%. Bennedsen and Caspersen suspect that the actual figures may be much
worse, as underachieving institutions were less likely to respond to their request for information.
However, even when students do complete an introductory course, many are not reaching the level
of programming ability it was designed to teach. Many authors have expressed concerns about the
abilities of their students after the first year. Bruce and McMahon (2002) provide anecdotal
evidence to support this claim, stating, „failure rates are high and the inability of students to complete small
programming tasks after the completion of introductory courses is not unusual‟. Such a scenario has also been

The Learning and Teaching of Programming Chapter 2.- Background Research
Page 13
described by (Jenkins, 2001). This is not a new issue; in 1982 Solloway et al (1982) discovered that
just 38% of computer programming students could write a simple program to average a set of
numbers. More recently a 2001 ITiCSE working group (The McCracken Group) conducted a
multi institutional study to assess the programming ability of students after the completion of a first
year programming course (McCracken. M et al, 2002). The findings demonstrated that the students‟
algorithmic problem solving skills were weak and that the tutors‟ expectations of programming
ability were far greater than what had actually been achieved by the students. Since this study a
further ITiCSE working group was formed to further investigate the difficulty of novice
programmers (Lister et al, 2004). This study focused on the novice comprehension of execution
within small programs. The results were gathered from 556 students spanning 12 institutions who
had recently or nearly completed their first semester of programming study. The study
demonstrated significant novice difficulty in the analysis and comprehension of small programs
and code fragments.(Lister et al, 2004). While a study from a single author may be dismissed as
poor teaching these large scale multi institutional studies provide compelling evidence that students
find programming difficult and are indeed falling short of expectation in even the most basic of
programming skills.
2.4 Paradigm Choice - Why Imperatives Should Be First
A modern trend in the teaching of novice programming is the objects first approach, as advocated
by authors such as Barnes, Kölling and Rosenberg (Barnes and Kölling, 2008), (Kölling and
Rosenberg, 2001). This approach centres on teaching object oriented concepts to novices right
from the beginning of their studies, rather than introducing them once the imperative and
procedural aspects had been mastered. Since the emergence and proliferation of the objects first
paradigm, researchers have developed a number of variations of this theme, for example: teaching
graphics and events first (Bruice et al, 2001), software components first (Howe et al, 2004), design
patterns first (Pecinovský et al, 2006) and GUIs first (Prolux et al, 2002).
If the students are failing to comprehend and apply even the basic imperative concepts, the viability
of teaching complex, high level topics such as object orientation, graphical user interfaces and event
handling to beginners is clearly questionable. This opinion has been expressed by other authors for
example, Winslow (1996) who states „One wonders, for example, about teaching sophisticated material to CS1
students when study after study has shown that they do not understand basic loops; more time spent on looping
problems might pay a much larger return in the long run‟. McCracken et al (2002) concluded that an objects

The Learning and Teaching of Programming Chapter 2.- Background Research
Page 14
first approach to novice programming leaves less room within the syllabus to focus on the basic
procedural and imperative fundamentals. This subsequently results in a more fragile comprehension
of the topics taught and means more time is needed before the students can competently tackle
programming problems on their own. These views are consistent with Rist (1996) who warns that
„object oriented (OO) programming is not different, it is more, because OO adds overheads such as class structure‟.
Further evidence to back this claim can be found in Ramalingham and Weidenbeck (1997) who
state „Object oriented programming has a steeper learning curve than imperatives first programming‟. Also Cooper,
Dan and Paush (2003) readily admit that object orientation adds to the complexity of teaching and
learning programming. A concise criticism of the objects first paradigm can be found in Chenglie
(2004) who considers it harmful to the development of algorithmic problem solving skills.
Given the considerable difficulty experienced by many novices, the addition of even the basic OO
concepts would only add to the difficulty and burden facing the novice. It would mean that each
concept would have to be covered more thinly and at greater pace, thus making the subject harder
to comprehend and even harder to keep up with. For most institutions such as High Schools, FE
Colleges and Universities like Glamorgan, this would almost certainly have a negative impact on a
large proportion of students and would significantly increase the likelihood of attrition and
aversion. Backing this claim, a paper by Regis (2006) entitled „Back to Basics in CS1 and CS2‟
speaks of the failure of OO first and claims that since switching back from an objects early
approach to a traditional imperative approach, there had been marked improvements in
programming skill, student satisfaction, retention and enrolment.. These views are consistent with
Chenglie (2004), who states, „the OO first paradigm has had a direct negative impact on a second year course in
data structures. Many students cannot effectively write loops or carry out other logical thinking skills due largely to a
lack of training in basic algorithms‟.
For HE institutions that cannot select from the very best students, such an approach would be
unviable and counterproductive. Such a proposition would also be unfeasible in secondary
education. This would present an even greater barrier to the unacquainted teacher who may have a
limited time span and less than adequate confidence in their ability to comprehend and teach even
the imperatives, let alone OO.
It is precisely for the reasons outlined in this section that the University of Glamorgan teaches
object orientation only once the imperative and procedural aspects of programming have been
mastered. This research takes the view that for introductory programming the objects first paradigm
creates more problems than it solves. When a large proportion of novices have difficulty grasping
even the imperative and procedural basics, the addition of OO or other advanced topics would be

The Learning and Teaching of Programming Chapter 2.- Background Research
Page 15
futile. If novice programmers are to be given the best chance of success they first need to focus
solely on mastering the imperative rudiments of the subject. This will provide a solid foundation on
which more complex concepts can be learnt. In the following section the learning of imperatives
first programming and its difficulties are discussed.
2.5 Learning Imperatives First Programming - Skills and Difficulties
In order to succeed at programming a novice must simultaneously acquire and apply many new
skills and concepts. Much of what is learnt will be entirely new to the novice and will bear little if
any relation to anything studied previously. The skills that a novice programmer studying an
imperatives first style of instruction will typically need to master can be broken down into four
main categories as follows.
A practical understanding of the imperative programming concepts and structures;
The syntax and semantics of a programming language;
o Reading code;
o Writing code;
The use of a development environment;
Problem Solving;
o Algorithmic Problem solving
o Debugging
With this many skills and concepts to learn, it is easy to conceive why novice programmers find the
subject daunting, complicated and difficult.
At college and university level, an introductory programming module will typically last one
academic year. Therefore, the pace of delivery has to be quick in order to cover all of these
concepts. Within secondary education, CS programming will have to be squeezed in alongside other
topics, leaving even less coverage time. This gives credence to many teachers‟ views that the time
required to teach the subject effectively can be better spent gaining marks in other areas of the
syllabus. Individual students will learn at different paces, meaning some students will cope, but
others will be disadvantaged. The fast pace required to fit in all the required topics will also mean
that a student who has missed a lecture may miss an important concept and thus not be able to
follow the next tutorial or lecture. Furthermore, if a student falls behind, the gap between the
concepts covered in the lecture and the reinforcing practical activities attempted in tutorials or study

The Learning and Teaching of Programming Chapter 2.- Background Research
Page 16
time will widen. This will mean that the topics conveyed in the lectures will be mostly forgotten by
the time a student gets around to tackling them, which may slow the student, putting them further
behind. Winslow (1996) characterises this scenario by stating, „there is no going back; the course appears to
behave very much as a high-speed train with no brakes‟. Without access to tutor support, good quality
course notes and the motivation to do a little extra work, the student may continue their studies
playing catch-up or fall further behind. Such a student may quickly come to the view that „they just
can't do programming‟ and lose the will to continue. Such a scenario leads to anxiety, which is a
significant attribute of the perceived difficulty of the subject as well as its high drop out rate as
discussed by (Connoly et al, 2008).
Whilst acquiring and applying their programming knowledge and skill, a novice will undoubtedly
encounter a large number of errors that will manifest themselves in various stages of the program
development process. Learning from one‟s errors is an important aspect of mastery in any
discipline. However, in comparison to other subjects (studied currently and previously) the novice
programmer will encounter an unusually large number of errors and impasses. Backing this point,
Perkins et al (1998) have said that „programming is precision intensive, therefore the number of errors made by a
novice programmer will be significantly more than in other subjects‟. The large number of errors encountered
can lead to de-motivation and anxiety which will inevitably have an impact on a beginner‟s self
confidence and efficacy in programming, as discussed by (Jenkins, 2001) and (Connoly et al, 2008).
This is another major factor contributing to the proportionally high dropout rates and sustained
aversion to the subject described by Jenkins and Connoly et al. Programming errors fall into three
main categories and are described below (in A, B and C):
A: Syntax Errors
This type of error relates to the erroneous use of programming language syntax (grammar).
Syntax errors are the most frequent error in programming and this especially true for the
novice. It is for this reason that many simplified pedagogic languages exist.
B: Run Time Errors
These errors happen during execution when a programming instruction cannot be carried out.
Some examples are, attempting to store too big a number in an integer or exceeding the bounds
of an array. Typically, these errors cause a running program to halt mid flow.

The Learning and Teaching of Programming Chapter 2.- Background Research
Page 17
C: Logic Errors
A logic error is a flaw that causes a program to behave in an unexpected and unplanned way.
The cause of these errors can often be traced back to logic errors in the program‟s design phase.
These logic errors can be due to the novice not anticipating all the sequences of execution or
more fundamental misunderstandings relating to the individual concepts used and how they
interact with each other. Logic errors can also creep in the transition between a program‟s
design and its subsequent conversion to program syntax and entry into the computer. Logic
errors tend to be hard to spot, especially for the novice; as in many cases they will not cause the
running program to halt, at least not immediately. Furthermore, fixing logic errors requires an
accurate understanding of the fundamental programming components in use, abstraction and
algorithmic problem solving skills, tracing skills (simulating execution manually), knowledge of
the debugging features in the development environment and debugging strategies.
Before any programming take place, the novice needs to gain an understanding of at least a few
imperative concepts. The imperative concepts typically learnt by the novice are discussed in the
next section.
2.5.1 The Imperative Concepts
The imperative programming concepts and structures (the constructs) are the building blocks which
underpin the functionality of all programs, regardless of paradigm or language. The goal of an
introductory programming course is to teach mastery of these constructs which are the fundamental
building blocks of any programming language. Typically the constructs covered are as follows:
Variables
Sequence o Assignment (including calculation and string manipulation) o Output (printing text to screen) o Input (input data from the keyboard )
Selection (decisional structures) o Conditional expressions and Boolean Logic o If / If Else and Else o Case statements
Iteration (looping structure) o While o For o Repeat Until
Arrays,
Functional decomposition (functions and procedures)
Basic File IO
Recursion (possibly)

The Learning and Teaching of Programming Chapter 2.- Background Research
Page 18
From these constructs, an infinite number of algorithms, data structures and programs can be
realised. It has been shown that any programming logic can be expressed using just sequence,
selection and iteration concepts (Bohm and Jacopini, 1966). Teaching the mastery of these
constructs will provide the novice with a useful and transferable set of programming skills which
include: algorithmic problem solving, program design, the translation of a problem specification
into working program, the use of a programming language and debugging skills.
It is logical to assume that a large proportion of non syntactical novice programming errors and
bugs are attributable to a misunderstanding of the semantics and general principles of one or more
of the constructs. Spohrer and Solloway (1986),(1989) demonstrated that the majority of novice
errors were not due to misconceptions about the semantics of individual constructs. These studies
indicated that the majority of errors occur for a range of reasons that relate to the skills of problem
solving and the abstraction of a program‟s requirements from the program specification or problem
to be solved. They also demonstrated that novices in general tended not to anticipate all possible
sequences of execution and had significant problems realising the interaction between the individual
constructs their programs were composed of. Similar conclusions were also reached by (Winslow,
1996), (McCracken et al, 2002), (Garner et al, 2005) and (Lister et al, 2004). These studies indicate
that the constructs are not the primary cause of difficulty. However, construct errors and
misconceptions do still present a significant problem to the novice. Since the late seventies (when
research into novice programming gathered pace) a significant number of studies have
demonstrated a number of construct based (non syntactical) errors and misconceptions. Some
prominent examples of these studies are discussed below.
Dubolay, Bayman and Mayer presented a range of misconceptions relating to the concepts of the
variable and the semantics of assignment (Du Boulay, 1988, Baymen and Mayer, 1983). Dubolay‟s
work has since been backed up by more recent studies (Jackson et al, 2005, Ma et al, 2007, Laakso
et al, 2008). The basic concepts of print and read have been shown to be problematic; Bayman
and Mayer (1983) have highlighted several issues that are relevant to screen and keyboard IO;
despite being written in 1983 their points are relevant to modern languages such as Java, C and
Visual Basic. Authors (Pea, 1986, Solloway et al, 1981, Bonar and Solloway, 1983, Roberts, 1995,
Garner et al, 2005) have demonstrated that novices can have fundamental misconceptions relating
to the semantic control flow of selection, iteration and even sequence. Spohrer, Solloway and Pope
found that bugs associated with conditional and looping structures were more prevalent than those
associated with input, output, assignment and initialisation (Spohrer et al, 1989). Other authors have
also noted that conditional statements present problems in the application of sequence, selection

The Learning and Teaching of Programming Chapter 2.- Background Research
Page 19
and iteration; such as off by one errors, infinite loops, data type mismatching, the logical operators
AND and OR, and confusions between equality and assignment (Ebrahimi, 1994, Ahmadzadeh et al,
2005). Sphohrer and Solloway state that some novices base their expectations of a while loop on
natural language, believing that the exit condition of a while loop applies continually rather than
once per iteration (Spohrer and Solloway, 1989). DuBolay notes that For loops are problematic
because novices fail to understand that behind the scenes the loop control variable is being updated
(Du Boulay, 1988). Arrays are also notoriously problematic for the novice and prone to a range of
language independent semantic errors and misconceptions, such as confusing the subscript with its
value and zero based array issues (Du Boulay, 1988, Garner et al, 2005). Research has also shown
that besides abstraction, functional decomposition presents a major semantic challenge to the
novice; for example passing parameters and returning values (Pillay and Jugoo, 2006, Naidoo and
Remjeeth, 2007). Recursion is also conceptually difficult and error prone, it is often used
inappropriately and can lead to such errors as infinite recursion and stack overflows (Kessler and
Anderson, 1989, Yarmish and Kopec, 2007).
Accurate comprehension of the imperative rudiments is a prerequisite of higher order programming
skills. If a novice‟s low level misunderstandings are not quickly resolved, they will negatively impact
the subsequent skills of problem decomposition, algorithm development, program comprehension
and tracing. These are skills which are known to be weak in novices (McCracken et al, 2002, Lister
et al, 2004, Fitzgerald et al, 2008). However, in the learning of these concepts novices face an
additional challenge, the programming language. Language issues are discussed in the following
section.
2.5.2 Language
To successfully utilise a programming language and write code, a novice must acquire an applied
knowledge of the constructs (listed and discussed in the previous section ) and the rules for how
they are textually and symbolically represented (the programming language). This suggests that the
conceptual mastery of the underlying concepts of sequence, selection and iteration etc is a pre-
requisite skill to the mastery of a programming language. However, often a programming language
is introduced to novices before they have developed an adequate conceptual grasp and applied
knowledge of the underlying constructs represented by the syntax. Hence, a novice has to learn
both simultaneously, resulting in great difficulty, many errors and a steep learning curve when
taking their first steps in programming.

The Learning and Teaching of Programming Chapter 2.- Background Research
Page 20
The learning of a programming language itself is not straightforward. Programming languages are
generally complex and present a significant challenge for the novice. Kelleher and Pausch (2005)
support this point, stating that, „syntax is one of the largest and most frustrating challenges for a novice
programmer‟. McIver and Conway (2000) have said that, „the syntax and semantics of a programming
language can have a profound effect on the performance of novices‟.
Syntax requires of the novice an extremely high level of precision, and certainly a much higher level
than most other academic subjects (Jenkins, 2002). It is for this reason that Perkins and et al (1998)
have described programming as a precision intensive discipline. The smallest of errors in a
program‟s syntax can render it totally worthless. The level of precision required is something
unfamiliar to novices and can be a source of much frustration and intimidation (Jenkins, 2001,
Connoly et al, 2008). The learning curve of a programming language is steep, and syntax errors are
bound to occur repeatedly. For example, the program code may include invalid language elements,
valid elements in the wrong order or missing or mistyped elements. These syntactical errors are
usually picked out by the compilation process and presented to the user in the form of error
messages which in themselves are not always easy to comprehend. Avoiding syntax errors requires
a very high attention to detail; generally programming language compilers have no tolerance for
errors.
In a three-year study, Garner, Haden and Robins (2005) discovered that minor syntactical errors
persisted as the most common cause of problems for novice programmers, in both the stronger and
weaker students throughout the duration of an introductory programming course. McIver and
Conway (2000) state, „trivial syntax errors may in fact impede learning as they distract from the fundamentals of
programming and problem solving‟. Students waste a lot of time attempting to get an otherwise logically
correct program to run because of some small syntactical misdemeanour they have not noticed.
Flowers, Curtis and James (2004) state that, „syntax errors have nothing to do with the student failing to
understand the learning objective‟. They go on to say that, „common mistakes are often repeated by students, even
after the teacher has explained the error several times‟. This indicates that syntax may in fact be a barrier to
learning programming, taking up valuable time and distracting the novice from more important and
transferable skills such as conceptual comprehension, algorithmic problem solving, and the
translation of a problem specification into working program. A heavy emphasis on syntax will mean
that much of the novices‟ efforts are focused on writing syntactically correct program statements
rather than the design of the underlying algorithm. Hence, at the end of an introductory course
many novices are not achieving the expected level of problem solving skill that the course intended
to teach (problem solving is discussed further in section 2.5.4)

The Learning and Teaching of Programming Chapter 2.- Background Research
Page 21
Java is the language used to teach an imperatives first introductory programming course at the
University of Glamorgan. It is also currently the language most commonly used to teach
introductory programming(Chalk and Fraser, 2006). Java, C and C++ are the three most mentioned
languages on the web (DedaSys LLC, 2008, TIOBE Software, 2008). Due to Java‟s syntactic
complexity its suitability for novice instruction has been brought into question. Biddle and Tempero
(1998) critique the Java and C++ programming language‟s suitability for novices and demonstrate a
range of problematic semantic and syntactic complexities. In a similar manner many other authors
have also criticised Java‟s suitability for novices for example: (Roberts, 2001, Reges, 2002,
Prendergast, 2006). Java‟s syntactical complexities prompted the ACM to create the Java Task
Force, with the aim of developing tools and libraries that alleviate some of Java‟s syntactic and
semantic burden (Roberts et al, 2006). Java‟s object oriented focus has caused some authors to
question its suitability for imperatives first programming instruction (Böszörményi, 1998, Clark et
al, 1998). However, Reges a former objects early advocate has seen significant improvements after
returning to an imperatives first programming course using Java (Reges, 2006).
For the University of Glamorgan, teaching Java provides a number of benefits. It allows for a
smooth transition from the imperative to OO concepts, as the subsequent OO programming
course also uses Java. It is well supported in both text books and on the web. It costs little to
implement, as the language and many development environments are available at no cost. Java is
also powerful and flexible enough to please the more advanced student programmers. Furthermore,
its prolific use in professional programming means students feel they are learning industry relevant
skills.
The outlined paragraphs that follow elaborate on some of the pitfalls and difficulties of using Java
within an introductory programming course.
Novice Pitfalls in Java:
One of the worst syntactic problems in Java is the main method declaration, the use of which
means instruction must gloss over many extraneous advanced topics such as static methods,
public and private methods, the meaning of void, and why we need a String array in
the brackets. This is troublesome when all the instructor wants to convey is a program to print
„hello world‟. It is also difficult to memorise, making the construction of simple programs
unnecessarily difficult for the novice.

The Learning and Teaching of Programming Chapter 2.- Background Research
Page 22
Figure 2-1 Hello World in the Java Language.
Other such problems occur when user input is required. In Java there is no simple and standard
way to take input from the keyboard. This will mean there is often a disparity between the input
methods used by the instructor and those of textbooks and online material as every author has
their own take on how it should be achieved. Three such ways are shown in figure 2-2 (methods
A to C) all of which require more than a single line of code or explicit use of at least one object
or static class. Methods A and C also require some knowledge of exception handling, requiring a
try and catch block or „throws IOException‟ to be added to the already convoluted main
method syntax; also required is an associated import statement java.io.IOException.
Because of the complexities of keyboard input, the University of Glamorgan uses a custom class
called UserInput (method D in Figure 2-2); this requires only one line of code, requiring no
exception handling and no import statements. However, this requires the use of an additional
class file, and an explanation of the dot operator and method calls, which means user input is still
unnecessarily complex. Furthermore, to avoid the need for conversion the users must remember
a range of commands to read different data types e.g. readInt, readString,
readDouble, readChar etc. Similar approaches have been used by others, for example,
(Bishop, 2000, Roberts et al, 2006) and (Flanagan, 2007).
Figure 2-2 Various User Input Syntaxes in Java
Another problem with Java is its seemingly inconsistent syntax. For example, when comparing
characters, numbers and Booleans (the primitives) one would use the standard comparison
METHOD A: Three objects and three lines of complex code. InputStreamReader in = new InputStreamReader(System.in);
BufferedReader input = new BufferedReader(in)
x = Integer.parseInt(input.readLine());
METHOD B: Two static classes and methods, one line of esoteric code x = Integer.parseInt(JOptionPane.showInputDialog(null, "Read"));
METHOD C: One object, two lines of code (Java 1.5 and above) Scanner input = new Scanner(System.in);
x= input.nexInt();
METHOD D: One static class and method, one simple line of code x = UserInput.readInt();

The Learning and Teaching of Programming Chapter 2.- Background Research
Page 23
operators. A common pitfall of novices is to think the same is true of Strings. This is not helped
by the fact that comparing strings with the equality operator is entirely valid syntax, used for
comparing object references. Another related pitfall is the novices‟ tendency to confuse the
equality operator „= =‟ with that of assignment „=‟ in the Boolean logic of control structures. In
some instances, this is also valid syntax, as assignments are permitted mid expression. Before
novices tackle control structures in Java they learn the sequential print, read and assignment
statements all of which require semicolons at the end. Novices soon reach the erroneous
conclusion that all lines of Java code require a semicolon after them. When novices begin tackling
the control structures, they are told otherwise. However, novices often forget this and place
semicolons in places they should not go as in Figure 2-3.
Figure 2-3 A Common Novice Pitfall when Learning the Control Structures in Java
However, as far as the Java compiler is concerned, the example in figure 2-3 falls within Java‟s
syntactic rules and is not picked up. When the same error occurs in Java‟s looping structures the
effect is an infinite loop. Often students do not realise the semantic impact of this semicolon or
fail to notice it, placing it there out of habit. This causes confusion and frustration as the
program does not behave as the novice expects.
Java also makes the declaration of arrays unnecessarily complex and prone to error, due to the
requirement of the keyword new (e.g., int[] scores = new int[10]). Novices
studying imperatives first programming will be unfamiliar with this requirement and often omit
this keyword which results in a relatively unhelpful syntax error. Java is also a case sensitive
language, and as a result, the likelihood of typographical errors is greatly increased. For example,
a common error of the Java novice is to type Double instead of double which can lead to a
range of unexpected semantic behaviours due to the fact that they have created an object not a
primitive. This leads one to question whether or not Java would be better without its primitives
even for imperatives first instruction.
Whether or not Java should be taught to novices is outside the scope and control of this thesis.
However, the fact remains that Java, like many other full scale languages used in introductory
programming, places a big burden on the task of programming, clouding the underlying concepts
and negatively impacting on other programming skills such as algorithm composition.
If (age > 18);
{
status = “adult”;
restrictions = 0;
}
No semicolon needed

The Learning and Teaching of Programming Chapter 2.- Background Research
Page 24
As well as Java, the syntax and semantics of several languages used in introductory programming
have been criticised. In discussing the design of novice programming systems, Payne and Myers
(1996) discuss a range of potential novice problems that occur in many different programming
languages; as do McIver and Conway (1996),(2000). When comparing the Java and C# languages,
Reges (2002) showed that despite some small improvements, much of Java‟s syntactic overhead was
prevalent in C#. Banner (2005) criticised Visual Basic.NET for not being basic enough and showed
that it contained many of Java‟s pitfalls. Nelson and Rice (2000) used Visual Basic in their
introductory programming course and found that students struggled to divide up their algorithm
between the various event procedures; Raymond and Welch (2000) expressed similar opinions. The
C language has been criticized for its confusing syntax, semantics and lack of a Boolean data type
(Dingle and Zander, 2001). C++ has also received similar criticism causing one institution to drop it
and revert back to Pascal (Becker, 2002). Pascal has come under criticism from Hamilton et al
(2000) who demonstrate the existence of several inconsistencies and pitfalls. The desire to teach
real world languages such as Java, C , C++, C# and Visual Basic.NET within introductory
programming means novices are forced to deal with a complex language at the expense of other
programming skills.
The novices‟ difficulty with syntax is generally unaided by the cryptic and misleading error messages
that most language compilers tend to present to the user. This is especially true of the language
compilers associated with professional languages such as Java, C++, C# and VB, but is also true of
languages intended for education i.e. Pascal. Professional compilers are ill matched to introductory
programming. In order to understand the technical jargon and subtle nuances of their error
messages, significant experience in programming is required. Flowers et al (2004) back this point,
stating: „students waste a great deal of time deciphering esoteric error messages and teachers expend valuable time
explaining such messages‟. As with many professional languages the compiling techniques used by the
Java compiler to check for syntax errors are not nearly as thorough as they could be. This means
that the error messages are often inaccurate, misleading or too unspecific. For example, a missing
concatenation operator from a Println statement is diagnosed as a missing closing bracket;
erroneously capitalising the first letter of reserved words such as if, while and new is
incorrectly diagnosed as a missing semi colon. Other messages such as Illegal Start of
Expression, Not A Statement, and Cannot Find Symbol are very general and
often do not reflect the precise nature of the syntax error, especially for a novice. Hristova and
colleagues (2003) have said that „Java error messages are so cryptic to students that they have a hard time simply
identifying their errors, let alone making corrections‟. For the reasons outlined in this paragraph, authors
have sought to overcome this issue by developing specialised compilers that display more accurate,

The Learning and Teaching of Programming Chapter 2.- Background Research
Page 25
jargon free error messages expressed in terms that a novice can easily understand. Three such
successful examples are Gauntlet (Flowers et al, 2004), Espresso (Hristova et al, 2003) and an
unnamed compiler extension by (Lewis and Mulley, 1998).
„Many bugs are caused by the fact that the code programmers write does not always do what it was intended to do, so
the ability to read what the code actually does, rather than what one thinks it should do, is an important
programming skill‟ (Lister et al, 2004).
The principle aim of teaching a programming language is teaching the novice to write their own
code. Typically, students are expected to acquire this skill by observing and breaking down the code
that is presented in lectures, tutorials and text books. In doing so, instructors expect students to be
able to read and comprehend such examples. The ability to read code and accurately predict its
outcome is an important skill in programming. Successful program writing requires frequent reading
and mental simulation of already written parts of the program (tracing), a skill which is also required
for debugging and maintenance. However, several authors have shown that the reading and tracing
skills of novices are weak. Lister et al (2004) demonstrated that many novices have a distinct
problem comprehending the objective of relatively small pieces of code because they have a
weakness in their ability to read and trace though the syntax of a programming language. In
addition, Fitzgeral (2008) et al, observed this weakness and discovered that a lack of tracing skill
means many novices prefer to rewrite whole sections of code to tracking down the source of error.
Lopez et al (2008) also found the tracing skills of novices to be weak, especially when the code
involved loops. The application of tracing skills is hindered by the fact that the novices‟
understanding of programming language constructs may be incomplete or fragile (Perkins and
Martin, 1986). Lister et al pointed out that code reading is a prerequisite skill of code writing and
problem solving, and as such, the inability to read code negatively impacts the preceding skills of
writing and problem solving. This is consistent with Perkins et al (1988) who noticed without
sufficient reading and tracing ability an impasse will either cause the novice to stop, be unable to
continue (without help) or cause them to make almost random haphazard changes to their code in
the hope they will stumble upon the answer.
Solloway (1986) states that among many abilities and skills, expert programmers can carry out
mental simulations of executing code and argues that such strategies should be taught to novices.
Vesa and Sajaniemi (2007) state that „generally program comprehension (code reading and tracing) is not
explicitly taught in programming education, as educators seem to suppose that reading and comprehension skill will
evolve as a side-effect of learning program writing.‟ The cognitive load of complete and correct tracing
simply exceeds the novices‟ mental capacity even though an expert could do the same tracing with

The Learning and Teaching of Programming Chapter 2.- Background Research
Page 26
no difficulties. Educators traditionally use a blackboard to track the values of several variables when
explaining example code to students. Vesa and Sajaniemi (2007) suggest that an instructor should
stress that this technique is not used for demonstration purposes only, but because memorising
several or more variable values is doomed to fail due to the limits of human cognition.
Because of the complexities and confusion associated with language, there have been numerous
attempts to overcome its impact. One approach is to produce a language subset containing only the
key elements pertinent to introductory programming. A study by DePasquale et al (2004) evaluated
a simplified development environment with a language subset of C++. The results of their study
demonstrated no significant advantage over the standard method of using the .Net studio
environment and the standard C++ language. Sub-setting excludes the language features that are
not being taught, in order to simplify the language. However, it still places a heavy reliance on the
programming language and does not address the syntactical and semantic issues that reside within
the subset. A good use of sub-setting can be found in Roberts (Roberts, 2001); here the Java
programming language is not only sub-setted but also syntactically simplified. Whilst this approach
appears potentially beneficial, no evaluation studies or follow up research has since been conducted.
McIver (1999) developed a completely independent programming language „Grail‟ solely for the
purpose of teaching programming to novices. This language was designed to cover purely the basics
whilst removing all the needless syntactic and semantic difficulties prevalent in many of the
languages used in introductory programming. In a study McIver and Conway (2000) compared the
syntax and logical errors of students using the Grail and Logo Languages. The results demonstrated
a significant decrease in the number of syntactic errors; the number of logic errors were also
positively affected but to a lesser extent. Interestingly, the study demonstrated only a slight
correlation between the number of syntactical and logical errors, demonstrating the mutual
exclusivity of these skills. As with many bespoke teaching languages, such an approach will
constrain the better students within the bounds of the language which is purposely limited and of
no real use outside the course. Furthermore, due to a lack of related text books and online material,
these students can not go beyond what is expressly taught. The concept of a language for teaching
is not a new one. Notably, Pascal (Wirth, 1971) and BASIC (Kemeny and Kurtz, 1964) are two
once popular pedagogic programming languages. In education establishments BASIC went out of
favour in the mid to late eighties due to its tendency for creating unstructured, spaghetti-like code.
The use of Pascal tapered off towards the mid to late nineties because educators required a modern
industrial strength world language such as Java that embodied the contemporary programming
practices that were emerging at the time, i.e. web based applets, graphical user interfaces, event
handling, Object Orientation, exception handling and garbage collection. Thus modern languages

The Learning and Teaching of Programming Chapter 2.- Background Research
Page 27
such as Java offer scope for a range of follow-on courses once the introductory concepts have been
mastered.
When writing program code there is another skill that the novice must master, the use of a
development environment. This is discussed in the following section.
2.5.3 Mastering the Development Environment
Another major hurdle for the novice is mastery of the development environment within which they
will be expected to program. Traditionally an introductory programming course will immerse
students in a fully featured development environment such as JDeveloper (Oracle Corporation,
2008), Eclipse (The Eclipse Foundation, 2008), Visual Studio (Microsoft Corporation, 2008) or
NetBeans (Sun Microsystems, 2008) to name but a few. Professional integrated development
environments (IDEs) are designed to help skilled software developers productively write and test
complex large scale programs. They possess a range of advanced features to improve productivity
and reduce the number of clerical errors. Professional IDEs for Java work well in advanced courses,
but they are poorly matched to introductory courses because they deluge beginning students with a
complex array of features (Reise and Cartwright, 2004). Some features such as main method
generation, auto indentation, bracket matching, code completion and code colouring, may help the
novice, but when the goal is to write and run simple programs, most other complexities are a
superfluous hindrance.
Experience at Glamorgan has shown that novice programmers have great difficulty using Oracle‟s
JDeveloper within the introductory modules. Due to its complexity the first lecture and tutorial is
almost entirely devoted to teaching the novices how to use its basic features. Over the following
weeks students spend a considerable time wrestling with the development environment when
attempting standard tasks such as creating, compiling, running and loading in program files. This is
time which could be spent focusing on programming rather than the tools designed to facilitate it.
Similar experiences have been documented by Chen and Marx (2005) who state that it takes about
three weeks of hands on exercises for students to get used to the Eclipse environment so that they
are able to use it on their own. Muller and Hosking (2003) believe that the chief difficulty faced by
novice programmers in using the Eclipse IDE is the learning curve necessary to just get started.
One approach to overcoming this difficulty is to avoid a development environment altogether.
However, Rises and Cartwright (2004) warn that students who try to learn Java using a

The Learning and Teaching of Programming Chapter 2.- Background Research
Page 28
conventional text editor and command line interface are often overwhelmed by the mechanics of
writing and running a program. Using this approach a novice may suffer the same degree of
distraction that a professional IDE would entail.
It is for the reasons outlined in the paragraphs above that many simplified pedagogic development
environments (PDEs) exist, for example: Thetis (Freud and Roberts, 1996), BlueJ (Kölling et al,
2008), Dr Java (Cartwright, 2008), Penumbra (Mueller and Hosking, 2003) to name a few. The
question of what makes a suitable development environment for novices is not an easy one to
answer, though Payne and Myres provide a very good starting point (Payne and Myers, 1996).
Studies have been conducted to compare the effects of a professional versus pedagogical
development environment on the performance of novices within an introductory programming
course. Rigby and Thompson (2005) have shown that for novice programmers a PDE is more
suitable than Professional environments. Vogts, Calitz and Greyline (2008) provided evidence to
suggest that a PDE affects the stronger students much more positively than the weaker ones, who
are only marginally affected. The authors conclude that the weaker students are hindered more by a
lack of problem solving skill than by the development environment; therefore a PDE has a less
noticeable effect on weaker students but a more noticeable effect on stronger students who possess
a higher degree of problem solving skill.
The research in this section demonstrates that professional development environments are ill
matched to novice programming. They are overly complex and take time to master; this is time
better served by learning to program especially when the time permitted to cover the subject is
limited. Simplified pedagogic development environments can help but are not the major
determining factor of programming success. For weaker students it would seem that the acquisition
of problem solving skill matters more than the simplicity of the development environment. In the
section that follows, problem solving skill is discussed further.
2.5.4 Problem Solving
In terms of programming, the term problem solving describes the transition from a problem
specification or requirement to a working computational program. In line with the author‟s
experience teaching introductory programming at Glamorgan, Westphal, Harris and Fadali (2003)
note that the transition from a problem specification through to a working syntactical solution is a
particular difficulty for novice programmers. Winslow (1996) concurs, stating that „even when the
novice knows how to solve the problem by hand, they have trouble translating the solution into an equivalent computer

The Learning and Teaching of Programming Chapter 2.- Background Research
Page 29
program‟.
Problem solving encompasses a range of skills that relate to the processes of program design.
Problem solving can be broken down into two activities, algorithmic problem solving and
debugging. Algorithmic problem solving is taking the constructs and putting them together in
meaningful and intentional ways to express a solution to a specified problem or program
requirement. Debugging is the process of finding and fixing logic, semantic and declarative errors
within the program‟s design or resultant code. Problem solving is the most transferable skill set a
novice will learn and is pertinent to programming in any language or paradigm. Fostering problem
solving skills should be the main aim of an introductory course in programming.
Problem solving can be broken down into 6 stages as follows, where stages 1 – 4 are algorithmic
problem solving and stages 5-6 are testing and debugging which are carried out repeatedly until the
problem is solved.
1. Understand the problem to be solved;
2. Break problem down into manageable pieces;
3. Design a solution;
4. Code the solution in a programming language via an IDE;
5. Determine if problem has been solved, testing;
6. Find and fix any problems, debugging ;
In the traditional programming sense, the development of effective problem solving skills is reliant
on the mastery of a range of pre-requisite skills that include.
Comprehension of the constructs their semantics and general roles;
Knowledge of how the constructs can be put together to solve problems;
Knowledge of how the constructs are represented in the language used;
The ability to read and comprehend code in order to predict its flow and outcome;
The ability to identify and solve declarative, logic and semantic errors;
The use of a development environment;
An understanding of the error messages generated by the programming system;
If the novice has not developed sufficient ability in one or more of these prerequisites, the
inevitable result will be poor problem solving ability, i.e. a cause and effect scenario.
Many authors have indicated that within and upon completion of an introductory programming
course, many students are not achieving the expected level of problem solving skill that the course
intended to teach. A study by Garner, Haden and Robins (2005) demonstrated that problems of
program design came second only to the problems of syntax and were more prominent than

The Learning and Teaching of Programming Chapter 2.- Background Research
Page 30
problems relating to the comprehension of individual language constructs. Garner, Haden and
Robins‟ view that novices have significant problems with program design concurs with Sohporer
and Soloway (1989) who claim that student misconceptions about the programming language are
not as widespread or as troublesome as believed. They believe many problems arise from structure
composition problems stating, „students have difficulties in putting all the pieces together.‟. Winslow (1996)
reached a similar conclusion: „Study after study has shown that students have no trouble generating syntactically
valid statements once they understand what is needed. The difficulty is knowing where and how to combine statements
to generate the desired result.‟ Howell (2003) went as far as to say, „„Students no longer master problem solving
skills, as they are no longer emphasized in elementary education. Students have become so weak in the development of
learning strategies and problem solving skills that it adversely affects independent and meaningful learning in all
disciplines‟. This supports the notion that students have a deficiency in their problem solving skills.
McCraken et al (2002) gained further evidence to back this claim. In a large scale multi-institutional
study they assessed the knowledge of students who had completed a CS1 level course in computer
science. The results suggested that students had achieved knowledge of the implementation and
syntax of programming, but lacked the necessary skill needed to abstract a problem into a solution.
This point is also backed up by Robins et al (2003) who provide a comprehensive review of
research related to the current problems of learning and teaching programming. In this report they
conclude that the difference between effective and ineffective novices relates to strategies they
employ when applying their programming knowledge. Lahtinen et al (2005) also concur with these
points, stating that the biggest problem for novice programmers is not in understanding basic
concepts but in learning to apply them. McIver and Conway (2000) state that this may be because
novices are forced to deal with syntax and the individual elements of their algorithms, sometimes to
the exclusion of the broader picture of the problem at hand. While the results of one isolated study
could be put down to poor tuition, the large number of concurring studies provides sufficient
evidence to back the claim that problem solving is a key weakness of novices.
Within introductory programming the development of problem solving skills is often
overshadowed by the complexities of the development environment, the programming language
and the novices‟ sloppy approach to programming. More often than not novices do not approach
their day to day (non assignment based) programming activities via the analysis, design, code, and
test methodology even though instructors and text books stress the importance of this approach.
The natural tendency of the novice is to focus on a coding by trial and error style, skipping the
analysis and design phases, diving straight into the coding, before thinking the problem thorough
and planning a solution (Perkins et al, 1988). Subsequently the development environment and
language forces the programmer to wrestle with the syntax before gaining any feedback on the

The Learning and Teaching of Programming Chapter 2.- Background Research
Page 31
efficacy of the ad-hock algorithm they are trying to implement. This creates an unbalanced focus on
syntax and overshadows the problem solving process. This approach is made more difficult by the
novices‟ fragile and incomplete comprehension of the constructs and how they interact; this makes
decomposing solutions directly into code prohibitively difficult. Furthermore the students‟ general
weaknesses in reading and comprehending code means they have immense difficulty predicting the
outcome of what they have written making their algorithms susceptible to error and difficult to
debug.
Debugging requires the same prerequisite skill set as algorithmic problem solving, therefore it is
logical to assume that those with weak algorithmic problem solving skills have weak debugging
skills. Ahmadzadeh et al (2005) studied the debugging skills of approximately 200 students and
discovered that good programmers are not necessarily good debuggers. In this study only 40% of
the good programmers demonstrated good debugging skills; the weaker programmers did much
worse. A study by Fitzgerald et al (2008) also studied debugging ability by presenting novices with
error seeded code. The results of the study demonstrated that finding the error was more difficult
than fixing it and concurred with the premise that tracing skills are weak. This demonstrates that
overall the students‟ have achieved a very varied level of debugging mastery. Like Amedzadeh this
study also showed that good programmers are not necessarily good debuggers and generally poor
programmers are not good debuggers.
Perkins et al (1988) have shown that effective programming and debugging rely on one‟s ability to
predict the outcome of code. Lister et al (2004) say that „instructors need to place greater emphasis on
simulation as part of the process of writing code.‟ This is in agreement with earlier work by Solloway (1986)
which concluded that mental simulation skills should be explicitly taught to novices. Solloway went
on to suggest that underlying abstractions of programming must be made explicit. More recently
Robins, Rountree and Rountree (2003) expressed similar opinions suggesting that instruction
should focus not only on the learning of new language features, but also on the combination and
use of those features, especially the underlying issue of basic program design.
From the research reviewed in this section, it is clear that problem solving skill is deficient in a large
proportion of novice programmers and that this is a long standing issue of global concern. Various
authors have shown that students have difficulties anticipating how to put all the pieces together to
solve programming problems. However, this deficiency is also attributable to a cause and effect
relationship between problem solving and its pre-requisite skills. If one or more of these
prerequisite skills is deficient, the inevitable result is poor problem solving ability.

The Learning and Teaching of Programming Chapter 2.- Background Research
Page 32
McCracken et al (2002) state „it is the student‟s rote knowledge rather than their skills that enabled them to
successfully complete a first year course in programming‟. This supports the view that the novice‟s
programming ability is largely due to memorisation of code „recipies‟ rather than applied problem
solving skill and a proper comprehension of the underlying abstractions. The novices‟ sloppy ad
hock coding approach to programming, coupled with the deficiencies in their tracing ability makes
it very difficult for them to realise the underlying abstractions of programming, as they are
distracted by complexities of code when trying to formulate their ideas. Furthermore if they have an
inadequate comprehension of the underlying abstractions, how are they supposed to develop
tracing skills? By getting the students to think more about the underlying abstractions and the
interaction between program components it is logical to assume their problem solving abilities may
be enhanced. It is this aim that forms the backbone of this thesis.
2.6 Chapter Summary and Conclusions
Many students are enrolling on technical computing courses at HE level with little or no prior
experience of programming. Prior work conducted at the university shows that very few former
secondary school students are taking technically oriented computing courses prior to enrolment.
However, even in technically oriented secondary school subjects such as computer science,
programming tuition in secondary education is often avoided or taught to a very poor standard. The
primary cause of this appears to be the technical expertise of the teaching staff, but also the limited
time in which they have to cover the subject effectively, coupled with its relatively low contribution
to the overall assessment grades.
Because the students‟ level of programming expertise cannot be guaranteed, like most universities,
Glamorgan teaches all first year computing students programming from the ground up. However,
for all but the most innately skilled, programming is an extremely difficult subject to master. In
taking their first steps in the subject, a novice must contend with many new things: the
development environment, the syntax and semantics of a programming language, an understanding
of programming concepts and any paradigm specifics. They also need problem solving skills and
strategies in order to solve programming problems effectively. It is clear that novices are burdened
by having to learn so many new things at once. This, coupled with the subject‟s precision intense
nature, is leading to an overwhelming perception of incapability and uphill struggle in a large
proportion of novices. The addition of object orientation would further add to this burden. This is

The Learning and Teaching of Programming Chapter 2.- Background Research
Page 33
the reason why Glamorgan chooses not to adopt the objects first approach.
Several authors have demonstrated that of all programming skills, problem solving appears to be
the most prominent weakness of novice programmers. Not only do novices find it difficult putting
all the imperative pieces together; they also have a difficulty abstracting a program‟s requirements or
problem specification into a working program. While the lack of problem solving skill has been
highlighted as the most prominent difficulty, its cause is in part attributable to the deficiencies in
skills which are prerequisites of problem solving.
Several authors have demonstrated the existence of misconceptions in the novices‟ understanding
of the variables, assignment, keyboard input, screen output, conditions, decisions, loops, array,
methods and recursion. Obviously, if knowledge of these concepts is flawed, the inevitable result is
a difficulty in utilising them to solve problems. These misconceptions will also negatively impact on
the ability to predict the outcome of code and are therefore also a contributory factor in the
novices‟ generally poor tracing skill.
Whilst syntax has also been highlighted as an initial difficulty for novices, the novices‟ tendency to
dive straight into coding means their difficulty with syntax overshadows the development of other
skills. Often novices begin coding before they have properly conceptualised the concepts they are
trying to utilise. Also, because too much time is spent wrestling with the syntax, less energy is spent
considering the problem at hand and the solution they aim to achieve. Another factor adding to this
difficulty is the complexity of the development environment. A complex professional environment
will not only intimidate the novice, the mechanics of using it will further distract attention away
from problem solving, and the underlying abstractions of programming.
Authors have concluded that the ability to read, understand and trace though code is a prerequisite
skill of writing code. However, multiple authors have shown that in general the code reading and
tracing skills of the novice are prohibitively underdeveloped. Deficiencies in these skills are another
contributory factor of poor problem solving ability, as novices are unable to validate or debug the
code they have written. It is for this reason that several authors recommend that code reading,
simulation and tracing skills need to be explicitly taught, as they are not being learnt as a side effect
of program writing.
To improve the development of problem solving skill,s the emphasis of programming needs to be
shifted from the syntax to the underlying algorithm, the abstractions of programming, and how the
imperative pieces fit together. Why should the syntax of a programming language predominate the

The Learning and Teaching of Programming Chapter 2.- Background Research
Page 34
teaching of programming? Remembering where to put a semi colon in Java does not lead to
enhanced problem solving ability. By reducing complications of the development environment, the
impact of writing complex and often confusing syntax the novice can focus their attention on the
abstractions of programming and the issues of basic program design. Novices also need to be
taught to read code, if they are to properly apply it in solving programming problems, learn from
the code of others and debug the programs they are attempting to write.
This background research suggests that this shift of focus should bring about an improvement in
the problem solving skills, self-efficacy and all around competence in the programming abilities of
novices. Languages and development environments come and go, but mastery of the imperatives
and problem solving will offer transferable skills pertinent to programming in any paradigm or
language and provide a solid foundation from which to graduate on to more complex topics.
----------------------------------------------------------------

Mental Models, Learning Styles and Program Visualisation Chapter 3 – Visualisation
Page 35
Chapter 3 Visualisation
Visualisation
Mental Models, Learning Styles and Program Visualisation
3.1 Introduction
Chapter 2 highlighted the problems, conceptual difficulties and skill deficiencies that novice
programmers‟ face, during and upon conclusion of an imperatives first introductory programming
course. This section moves on to discuss some of the possible solutions for overcoming these
difficulties; in particular it focuses on the importance of mental models, learning styles and
visualisation.
Section 3.1 begins by discussing the importance of mental models. Section 3.2 discusses learning
styles and how programming, a largely textual activity, may be difficult for learners who prefer to
take onboard new information visually. Section 3.3 shows how graphical visualisation may help the
novice form accurate mental models and increase their knowledge of program composition,
execution and the fundamental concepts of assignment, variables, sequence selection and iteration.
Section 3.4 then justifies why the structured flowchart may be an appropriate visualisation for
novice programmers studying a structured language such as Java or Visual Basic. This chapter then
ends with a critical review of 14 systems considered most relevant to show how others have used
flowcharts to aid novices in learning programming.
3.2 Mental Models
Mental models are conceptual representations of objects, events and systems and the structural
relationship between those objects, events and systems. They comprise of small scale working
models of reality or abstract concepts that are formed in the human mind and used to support
reasoning and prediction activities. Mental models are used to realise and envisage the location,
structure, function and outcome of objects, events or systems and their associated phenomena. A
good overview of mental models and their implications can be found in (Gentner, 2002).

Mental Models, Learning Styles and Program Visualisation Chapter 3 – Visualisation
Page 36
As an example of a mental model, imagine you were telling a friend about a fantastic meal you
recently had at a restaurant. They might assume that you were met at the door by a host or hostess,
seated, presented with a menu, your order was taken and then after a while were presented with the
meal you ordered earlier. They assume these details, and others, that were never actually mentioned
because they have a mental model of how restaurants operate.
In computer programming, appropriate mental models would be conceptual knowledge of the
computer and the semantics of the programming language features, that is, the parts, functions and
interactions involved in executing programs. Examples include the concepts of sequence, selection
and iteration, as well as the semantics of assignment, expression analysis, the changing state of
variables and the effect each program statement has on a program‟s data.
Several authors have acknowledged the importance of mental models in the comprehension of
programming and other technical computing subjects.
„Programming is a highly cognitive activity that requires the programmer to develop abstract representations of a
process in the form of logical structures. […] Having a well-developed and accurate mental model may affect the
success of a novice programmer in an introductory programming course, […] helping students develop good mental
models should remain a goal in introductory programming courses.‟ (Ramalingham et al, 2004)
Shih and Alessi (1994) point out that the attainment of these mental models enables experienced
programmers to accurately predict how the computer will execute a program, what the results will
be, and whether the program will successfully accomplish its goal. It‟s logical to assume that the
possession of such models would improve on the novices‟ general weaknesses in problem solving
and tracing ability.
At Glamorgan experience has shown that the weaker programming students have an inability to
describe accurately and articulately the function of key program features and how they interact with
each other. Perkins et al (1988) have stated that novices lack the mental models of the language,
primitives, and the sorts of programming plans that can be built out of those primitives, therefore
students experience immense difficulty decomposing problems directly into code. Ramalingham,
LaBelle and Weidenbeck (2004) conducted a study into mental models and their effect on
programming ability; the study demonstrated that a well developed and appropriate mental model
directly affects course performance and also increases self efficacy, another key element in course
performance. Kessler and Anderson (1989) studied their students‟ ability to write recursive and
iterative programs and state that „the possession of an adequate mental model of the functionality of

Mental Models, Learning Styles and Program Visualisation Chapter 3 – Visualisation
Page 37
programming is a pre-requisite of learning to program‟. While recursion is not a basic topic, it does
demonstrate that appropriate mental models are required across the entire spectrum of
programming concepts. In an overview of programming pedagogy Winslow (1996) also
acknowledges the importance of mental models stating that „mental models are crucial to building
understanding.‟
Gentner (2002) is keen to point out that the mental models formed by an individual are not always
accurate or appropriate and as a result can lead to incorrect assumption, belief or prediction. To
illustrate an example of how a mismatched mental model may form, lets go back to the restaurant
analogy. Imagine the meal you were talking about was eaten in a buffet restaurant. Your friend‟s
mental model of how that restaurant operates doesn‟t match the actual situation. They have over
generalised and as your description unfolds it causes confusion or misconception until (or unless)
they realise you were talking about a buffet, in which they modify their original model to include the
concept of a buffet.
Gentner goes on to state the importance of creating materials that minimise the chances of
triggering inappropriate or inaccurate mental models. This is commensurate with the views of
Winslow (1996), who states that „models of control, data structures, data representation, program design, and the
problem domain are all important. If the instructor omits them, the students will make up their own models of
dubious quality.‟ Ma, Roper and Wood (2007) provide quantative evidence to demonstrate that
novices often form incorrect mental models. In their study they demonstrated that upon
completion of an introductory course, one third of students possessed an unviable model of
assignment by value (non object oriented assignment). The results of their study showed that when
students develop appropriate mental models, they perform significantly better in the course
examination and programming tasks than those with a non-viable mental model. This finding
corresponds with the earlier work by Baymen and Mayer (1983) who demonstrated a range of
misconceptions in the novices comprehension of programming structures and concepts of the
BASIC programming language involving input, output, decisions and assignment. In their
conclusions Baymen and Mayer recommend that explicit training be given so that students can
form appropriate mental models regarding the underlying mechanics of the language features and
program design. Ben-Ari (2002) also concurs with these points recommending teachers guide their
students in the construction of a viable model so that new situations can be interpreted in terms of
the model and correct responses formulated. Solloway (1986) believes to help tracing skills, novices
should be presented with a model of execution and suggests that mental simulation strategies
should be explicitly taught.

Mental Models, Learning Styles and Program Visualisation Chapter 3 – Visualisation
Page 38
Authors have also shown that the semantics of looping structures such as the while loop are
unintuitive and prone to triggering subtle inaccuracies in the mental models formed by the novice
programmer (Roberts, 1995, Ben-Ari, 1996). By providing the novice with accurate models of the
various looping structures it is logical to assume that misconception can be prevented or at least
remedied.
The studies referenced in this sub section reveal how important it is that novice programmers
develop appropriate working mental models of the key programming concepts and how they
function. Students who have not developed mental models or who have been allowed to develop
inappropriate mental models may be significantly disadvantaged. This may be a key factor in the
weak tracing and problem solving skills of novice programmers and the inability of some students
to compose effective programs or describe accurately the function of key program features.
Another factor is learning style, which is discussed in the next section.
3.3 Learning Styles
There are multiple ways in which a student may accommodate and comprehend new information,
for example, by seeing, hearing, reading, discussing, doing or by reflection and logical reasoning
(deduction) to name a few. Learning style theorists generally agree that every student has preferred
ways in which they can accommodate new information more effectively; these preferred ways of
learning are referred to as learning styles. How much is learnt by a student is governed by their
native ability, prior preparation and experience but also by the compatibility between the students‟
favoured learning style(s) and the style of instruction. Learning style theorists also generally agree
that students will learn at their best when the style of instruction is compatible with their favoured
learning style. Where mismatches exist students can become inattentive or bored and will disengage
with the learning activity (Felder and Silverman, 1988). Students whose learning styles are
compatible with the teaching style of a course instructor tend to retain information longer, apply it
more effectively, and have more positive post-course attitudes toward the subject than do their
counterparts who experience learning/teaching style mismatches (Felder, 1993).
There are a large number of theories concerning learning styles, each define and categorise learning
styles in different ways for example (Myers and Briggs, 1995), (Kolb, 1984), (Honey and Mumford,
1992), (Dunn and Dunn, 1993) and (Felder and Silverman, 2002). These examples are just a few of
the many theories relating to learning styles. These categorisations are known by the term learning

Mental Models, Learning Styles and Program Visualisation Chapter 3 – Visualisation
Page 39
style inventories or learning style models (LSM‟s from here in). A LSM commonly referred to in
the pedagogical research of science, engineering and computing literature is that of Felder and
Silverman (2002), which from here in will be referred to as the FSLSM. The way in which this
FSLSM is categorised is very relevant to engineering and technical computing subjects such as
programming. Furthermore, its authors have provided practical advice on how to accommodate a
variety of learning styles within the teaching repertoire of a subject such as introductory computer
programming. It is for this reason that the FSLSM has been utilised in the research presented in this
thesis.
The most recent 2002 publication of the FSLSM distinguishes between teaching and learning styles,
dividing each into 4 dimensions. Every learning style dimension has 2 poles and a corresponding 2
poled teaching style. The dimensions and poles of the FSLM are shown in figure 3-1 below.
Figure 3-1. The Felder Silverman LSM.
For each learning style dimension a learner can be said to have a preference towards one pole or
another; though sometimes the preference is equal and the learner is said to be balanced. Learning
potential is maximised when for each dimension the style of instruction (teaching style) aligns with a
student‟s learning style preferences. Overall, the Felder and Silverman model gives a possibility of
16 (24) unique learning style combinations that may be declared; for example, sensory / visual / active
/ sequential is one and intuitive/verbal/ reflective/ global is another.
The interest of this thesis is in using the input dimension only, to classify learners as having a visual,
balanced or verbal learning style. Therefore, the other learning styles and dimensions of the FSLSM
will not be covered. However, detailed descriptions of all learning styles and how they can best be
taught can be found in (Felder and Silverman, 2002).
Dimensions Dimensions
Poles Poles

Mental Models, Learning Styles and Program Visualisation Chapter 3 – Visualisation
Page 40
Along the input dimension, every learner can be said to have a preference towards the visual, verbal
or both presentational styles when accommodating new information. A brief description of these
two preferences is given below.
Visual Learners
Visual learners remember what they see better than what they read or hear. They like
pictures, diagrams, flowcharts, time lines, hands on activities and practical demonstrations.
Verbal Learners
Verbal learners are more able to retain and recall more of what they read and hear. They get
a lot out of discussion and from explaining things to others.
A learner‟s visual versus verbal persuasion is measured by a score which can fall anywhere from -11
up to 11. A score of -11 would indicate an extreme visual learner, a score of 11 would indicate an
extreme verbal learner, and a score of between -1 to 1 would indicate a learner with a very balanced
preference. A score of 3 or 5 would indicate a moderately verbal learner but one who was not
completely adverse to a visual presentational style. The scores for each learning style dimension are
derived by administering a learner with the Solomon Felder index of learning styles (ILSQ)
questionnaire (Soloman and Felder, 2002). Figure 3-2 below illustrates the principle of this visual
verbal continuum
Figure 3-2. An Example of The Visual /Verbal Dimension Continuum
This learning styles classification is used in chapter 9 of this thesis when evaluating the product of
this research „Progranimate‟ and its effect on visual, balanced or verbal students.
3.3.1 Visual Verbal Learning Styles Distribution
To investigate the typical distribution of the visual versus verbal learning style preferences of
undergraduate novice programmers, the results from four computing and programming studies
have been combined and averaged. The results are shown in table 3-1. In each study the learning
styles of at least 97 undergraduate novice programmers have been analysed using the ILSQ.

Mental Models, Learning Styles and Program Visualisation Chapter 3 – Visualisation
Page 41
Table 3-1. Visual Verbal Learning Style Distributions
[1] = (Layman et al, 2002) [2] = (Thomas et al, 2002) [3] = (Viola et al, 2007) [4] = (Da Silva et al, 2007)
The figures presented above demonstrate a relative consistency between the studies and
demonstrate that on average 84% of students have a bias towards the visual style of input. These
results are very similar to those presented by Felder and Spurlin (2005), whose meta study looked at
the figures from a large range of learning style studies concerning undergraduate engineers. Though
indicative, the results shown above do not paint the true picture, as they do not show the learners
who are balanced, that are having a similar preference to both visual and verbal poles. Felder and
Spurlin‟s paper showed the results from several studies whose statistics did differentiate between
those with a clear bias and those with a balanced learning style. The results of the studies referenced
by Felder and Spurlin have been averaged and are presented below.
Table 3-2. Multi Institutional Results from Felder and Spurlin
Again these figures show a very significant bias towards the visual pole of the input dimension.
There are 40% more visual learners than verbal, many are balanced and few are verbal. From the
data of table 3-1 and table 3-2 it can be seen that there is not an even distribution amongst the two
visual and verbal poles, a clear bias exists.
3.3.2 Traditional Instruction May Not Favour Visual Learners
To ensure all students have maximised learning potential, programming tuition must benefit both
styles when presenting information to novice programmers. From the data of tables 3-1 amd 3-2 it
is clear that a significant mismatch is occurring between the predominantly textual (verbal)
representation of computer programs and the visual learning styles of most students.
Thomas at al (2002) correlated learning styles and performance within an introductory
programming course. The results of this study demonstrated that some learning style combinations
performed better than others. In particular, learners with a verbal style consistently outperformed

Mental Models, Learning Styles and Program Visualisation Chapter 3 – Visualisation
Page 42
their visual counterparts. Gomez et al (2007) studied remedial students and demonstrated that
visual learners performed poorly when the programming instruction was purely textual and did not
contain figures or graphs. The visual learners of the Gomez study were better at expressing their
intentions visually rather then via the text of a programming language or pseudo code. Conversely
the verbal learners were more able to present solutions textually.
If the concepts of introductory programming are predominantly represented textually via the
programming language and pseudo code, then the majority of students are being placed at a
disadvantage, as most are visual learners. Furthermore, if instruction does not contain diagrams or
graphs, how then may visual learners form effective mental models? The logical answer to this
question is, with difficulty. By presenting the programming concepts both visually and textually and
in equal measure, students across the continuum of the verbal / visual dimension will benefit. This
is where the visualisation of programming can play a key role.
3.4 Dynamic Visualisation of Programming
In the domain of programming the term „visualisation‟ can encompass many things, some of which
are irrelevant or outside the scope of this thesis. Therefore, before proceeding any further, it is
important to define the meaning of „Visualisation‟ within the context of this thesis.
Visualisation concerns the graphical (or semi graphical) representation of information in order to
assist human comprehension of, and reasoning about, that information (Petre and de Quincey,
2006). It does not refer to so called visual languages such as Visual Basic and Visual C++ etcetera;
these centre on the production of graphical user interfaces but do not visualise the mechanics of
programming. In the context of this thesis, visualisation relates to the presentation of computer
programming with the aim of enhancing novice comprehension.
Visualisations can be static or dynamic animated entities; a dynamic visualisation has the added
benefit of visualising the behaviour of a program in real time, whereas a static one leaves this to the
imagination of the viewer. A detailed meta analysis of the impact of static versus animated pictures
has shown that animations have practical and positive implications for the design of instructional
material (Hoffler and Leutner, 2007). Furthermore, as pointed out in section 3.1, novices must be
guided in the formation of an accurate mental model; if left to form their own mental models they
are often of dubious quality. It is logical to suppose a dynamic model of execution will do more to
fortify the formation of accurate and effective mental models than a static visualisation will (i.e. a

Mental Models, Learning Styles and Program Visualisation Chapter 3 – Visualisation
Page 43
static flowchart versus an animated flowchart). Reinforcing this supposition, various authors have
evidenced the positive benefit of dynamic visualisations, for example (Kann et al, 1997, Smith and
Webb, 2000, Ma et al, 2008)
A visualisation can also be categorised as passive or interactive. Passive visualisations systems are by
and large un-engaging, simply requiring the user to sit and watch. Early examples of this are in the
videos „An Example of L6 Programming‟ (Knowleton, 1966) and „Sorting out sorting‟ (Beacker,
1981). Interactive visualisation systems actively engage the user in the learning activity. In the
context of programming, an interactive visualisation allows the user to control the computational
processes that the visualisation presents with immediate and direct effect. This could be in
constructing their own animation, providing alternate data sets, or as simple as providing features
such as play, stop, rewind and pause. Computer based interactive visualisations became viable
towards the second half of the nineteen eighties due to the increased availability and capability of
classroom computers. One well known tool of this period is BALSA (Brown and Sedgewick, 1984).
Computer based visualisations that are static offer no real advantage over printed text. Computer
based visualisations that are passive offer no benefit over films and video. To use the benefits of a
computer to maximum effect, a computer based visualisation should be interactive and engaging.
Hundhausen (2002) has demonstrated that visualisation systems that engage the user in active
learning have a 50% higher success rate than passively engaging ones. This study is discussed
further in section 3.3.2.1.
3.4.1 Program Visualisation and Algorithm Animation
Two terms commonly associated with visualisation and the learning of programming are Program
Visualisation and Algorithm Animation (also known as Algorithm Visualisation). Early research
into computer based visualisation (of the late 1980‟s) tended to use these terms interchangeably.
However, as time has progressed and the discipline matured, authors generally accept that these
terms have two distinct meanings.
Program visualisation refers to a way of presenting the components and structures (i.e. assignments,
decisions and loops) of a program visually; in either static or dynamic form, via the use of computer
based graphical displays. A program visualisation may comprise mainly of graphics, but can also
comprise of an enhanced textual representation too. For example, the highlighted execution of
code is one form of visualisation; dynamic or static flowcharts are another. In loose terms program

Mental Models, Learning Styles and Program Visualisation Chapter 3 – Visualisation
Page 44
visualisation can even extend to pretty-printed code. Program visualisation is used to visualise
either the construction or execution (and sometimes both) of a program. The domain of program
visualisation is precisely that with which novices have difficulty, i.e. program construction and
comprehension. Therefore, program visualisation is very relevant to the difficulties faced by novice
programmers and will remain the central focus of this thesis.
The other form of visualisation is algorithm animation. This category of visualisation is concerned
with visualising high level algorithms such as sorting, searching, shortest path analysis or other
complex non-novice programming procedures. Algorithm animation is achieved by representing the
data structure directly or by employing the use of a metaphor contextualised in the domain of the
algorithm in use. The animation is then applied to this representation of the data structure to show
its transitional state during the execution of the algorithm. Generally, this category of visualisation is
more concerned with the outcome of a program in relation to a relevant dataset or data structure,
rather than the visualisation of the individual assignments, decisions and loops the algorithm is
composed of. This type of visualisation assumes that such fundamental knowledge already exists in
the mind of the viewer. Because of this, algorithm animation is largely unsuitable for the complete
novice programmer who has yet to fully comprehend the mechanics of assignment, looping and
decisions etcetera. As discussed in chapter 2, the novices‟ difficulty with programming lies mainly
in problem solving, the formation of syntactically correct code, comprehending the flow of
execution, conceptualising the semantics of individual components and understanding how they
interact to form higher level programming concepts. Algorithm animation cannot provide any
feedback until a syntactically valid program has been coded and therefore does not aid the process
of program composition very well.
To further demonstrate the distinction between program visualisation and algorithm animation,
screenshots of two program visualisations and two algorithm visualisations are presented in figure
3-3.
Based on the two outlined distinctions of visualisation, it is clear that program visualisation is more
appropriate than algorithm animation when teaching complete beginners. Therefore, in this thesis
the focus will be on program visualisation and not algorithm animation. However, in research,
many of the usability, design and efficacy issues affecting algorithm animation are very pertinent to
the development and design of program visualisations. Also, some systems relevant to program
visualisation occasionally incorporate the use of algorithm animation features. Therefore, while
program visualisation is the focus of this thesis, relevant research relating to algorithm animation
shall not be excluded from discussion.

Mental Models, Learning Styles and Program Visualisation Chapter 3 – Visualisation
Page 45
Program Visualisation Algorithm Animation
A Raptor Program[1] A Scratch Program [2] Dijksta‟s Shortest Path [3] Bubble Sort [4]
[1]= (Carlisle et al, 2005), [2] (Maloney et al, 208) , [3] (King and Kiena, 1996), [4] (Gosling and Harrison, 2002)
Figure 3-3. Program Visualisation and Algorithm Animation
As mentioned previously in section 2.3, the focus of this thesis is on the imperatives first (non OO)
approach to introductory programming. However, much of this research is relevant for visualising
the logic that may reside within an OO method or procedure. In the next subsection the mixed
successes of visualisation tools are discussed.
3.4.2 The Mixed Success of Visualisation and Animation
Many authors have voiced their support for program visualisation and animation. Tudoreanu (2003)
states that „visualization holds great potential for conveying information about the state and behaviour of a running
program‟. Levy, Ben-Ari and Uronen (2001) state „the main benefit of animation is that it offers a concrete
model of execution that all but the best students need in order to understand algorithms and programming‟.
Researchers Baldwin and Kiljis (2000) state that „through the presence of visualisation, an accurate mental
model can be developed if novices use an interface incorporating graphics‟. Westphal, Harris and Fadali (2003)
have stated that, „without use of diagrams or flowcharts, it is difficult for beginners, even with pseudo code, to
communicate the flow of a program. For example, the next instruction to follow may not always be obvious from
reading pseudo code.‟
Backing this anecdotal support, various studies have provided empirical evidence to suggest that
carefully designed computer based visualisations can help the novice programmer form accurate
and useful mental models, improve on problem solving, increase self efficacy, and benefit a wide
range of other programming skills. Recent work by Ma et al (2008) has shown that visualisations
play an important role in fostering viable and effective mental models of assignment, putting right

Mental Models, Learning Styles and Program Visualisation Chapter 3 – Visualisation
Page 46
nearly all of the unviable models and ill-conceived notions that the participants of the study had
initially demonstrated. A study undertaken by Kann, Linderman, and Heller (1997) has shown
promising results in the use of animation within the teaching of programming. Their study was
conducted on second semester computer science undergraduates who had recently studied to the
level of recursion. The study showed significant improvements in ability and self efficacy against
students who were not exposed to algorithm animation. A study by Smith and Webb (2000)
demonstrated that a low level program visualisation tool was enthusiastically embraced, positively
influencing the mental models and tracing skills (the authors called this desk checking) of the
study‟s participants. Carlisle et al (2005) evaluated a flowchart based programming environment
called Raptor against programming in Ada and MatLab. When given the choice 95% of students
chose to answer the examination questions using Raptor over Ada or MatLab. Improvements were
achieved by students using Raptor in all primary programming concepts except arrays.
The research outlined in the paragraph above shows that visualisation can be an effective and
helpful tool to aid the novice programmer in learning subject. However, despite the large body of
author support and numerous empirical successes there have been a number of instances where
visualisation has been unsuccessful or had no significant effect on the students‟ abilities
(Hundhausen et al, 2002, Kannusmäki et al, 2004, Blackwell and Green, 1999). Hundausen et al
analysed various visualisation tools demonstrating an overall failure rate of 61%. It is clear that
visualisation can work, but it is not a silver bullet; the mere presence of a visualisation tool is not a
guarantee for increased learning and comprehension, a considerable number of systems have failed
to produce significant improvements. Just why have some visualisations succeeded and other failed?
This question is discussed in the next sub section.
3.4.3 Factors that Affect the Success of Visualisation
In the design of visualisation aids, a pertinent question to ask is, why are some visualisations
effective and others not? In answering this question, some of the pitfalls of visualisation may be
identified and avoided.
3.4.3.1 Learner Engagement and Interactivity
Hundhausen and colleagues (2002) conducted a meta analysis of 24 algorithm visualisation systems
and showed that of these systems only 11 (46%) had proven significantly beneficial. A further

Mental Models, Learning Styles and Program Visualisation Chapter 3 – Visualisation
Page 47
analysis revealed that of the beneficial systems, all but one actively engaged the viewer in one or
more of the following activities:
Constructing their own dataset for the visualisation;
Answering strategically chosen questions about the algorithm;
Making predictions regarding future algorithm behaviour;
Programming the algorithm to be visualised;
A similar study by Grissom, McNally and Naps (2003) measured the effect of varying levels of
engagement with JHAVÉ, a code visualisation and algorithm animation tool. The subjects of the
study were split into three groups; one group did not see any visualisations, a second group saw
visualisations in a lecture presented and controlled by the instructor but not in tutorials and a third
group saw the visualisations in the lecture and interacted with them in their tutorials on their
workstations. Measurement was gained by conducting pre and post tests on the three groups. The
results are presented in Figure 3-4 and indicate that those who engaged with the visualisation
environment showed the most improvement, and those who were not exposed to visualisation
showed the least improvement.
Figure 3-4. Results From Grissom et al
These studies indicate that visualisations can be effective, but in the use of such systems, more is
learnt when visualisation is compounded by active learning and engagement. Therefore, it can be
concluded that interactivity is an important element in learner comprehension and subsequently the
success of a visualisation system.
3.4.3.2 Cognitive Economy
Tudoreanu (2003) provides several interesting points about the design of effective visualisation
tools and why some visualisations are ineffective. He demonstrates that cognitive economy is
critical if a visualisation is to be effective. On the one hand, animations have the potential to free
internal cognitive resources. However, if the visualisation requires the user to perform additional

Mental Models, Learning Styles and Program Visualisation Chapter 3 – Visualisation
Page 48
tasks or handle information unrelated to the problem at hand, it will consume additional cognitive
resources; this results in similar performance advantages to having no visualisation at all. From
Tudoreanu‟s research, four key points can be made about the design of effective visualisations.
Visual Relevance
If the visualisation does not relate directly to the problem domain, the user must expend
additional cognitive effort to recognise the relationship between the visualisation and the
problem domain. Additional cognitive effort will also be expended if the visualisation contains
additional information unrelated to the problem domain. For example, a flowchart used for
control systems in novice electrical engineering would by and large be unsuited to novice
programmers. The notation used would most probably not map cleanly to the domain of
programming and contain additional information unrelated to programming. It is for similar
reasons that Blackwell and Green discovered that the metaphor they employed did not increase
the usability of a visual language. They found that extra cognitive resources were required to
map between the problem domain and the metaphor; this made the visualisation ineffective
(Blackwell and Green, 1999). Therefore when visualising a concept, it is best to represent it as
directly as possible, minimising any extraneous distractions.
Omitting Information
To be cognitively efficient a visualisation must reduce the amount of data the viewer has to
mentally store. Whilst being careful to avoid extraneous information, omitting relevant
information can have the effect of increasing the information that the user must store and
process mentally, thus decreasing cognitive economy. Tudoreanu has shown that providing
relevant textual cues, values and legends in a visualisation is helpful at reducing cognitive load.
Learning Curve
If the visual representation is unknown the visualisation will be perceived as a set of randomly
changing shapes, colours and values. Thus additional cognitive effort will be required to learn
and make sense of the various states the visualisation presents and how this maps to the
problem domain. Because this necessitates additional learning, it significantly reduces the
immediate benefit of the visualisation. Leveraging the users‟ prior knowledge may ensure that
visualisation syntax is easily understood and minimises the learning curve of the visualisation.
Two studies into the effectiveness of the Jelliot semantic visualisation system demonstrated
limited success (Ben-Bassat Levy et al, 2001, Kannusmäki et al, 2004). In the earlier 2001 study
the authors concluded that the interpretation of the animation itself must be explicitly taught.

Mental Models, Learning Styles and Program Visualisation Chapter 3 – Visualisation
Page 49
Most probably, the learning curve required by the visualisation was a major contributing factor
in the limited success of the tool.
Environment Simplicity
Visualization may be of little use if packaged within an environment that requires the user to
handle extraneous additional information or perform tasks unrelated to the problem domain, as
this will increasing cognitive load. Such a scenario may occur when a novice programmer uses
visualisation tools of a complex development environment.
Mayer and Moreno (2003) also discuss cognitive economy and put forward several ways to increase
cognitive economy in the design of multimedia learning systems. Meyer and Moreno show that in
the design of multimedia learning systems, optimal learning will only occur when the amount of
information that the learner must hold in working memory is minimised. An example of where
working memory can be overloaded is when related verbal and visual material is displayed
separately. Imagine a computer based tutorial conveying the principles of a steam engine. If the
tutorial has both textual and diagrammatic descriptions, the user will most probably want to relate
the textual description to the diagram. However, if the two descriptions are not displayed
concurrently, the user must switch between the two views or scroll, whilst holding the premise of
the last read paragraph and their place within the text in working memory. This will consume
valuable cognitive resources needed for comprehension. A similar situation may apply to a
programming environment that chooses to utilise both a visual and verbal representation of the
same program (i.e. flowcharts and code); if the two representations are not displayed concurrently
and the user wished to relate one to the other they will have to switch between the two views,
which will consume additional cognitive resources.
3.4.3.3 The Impact on Teaching Staff
An aspect crucial to the success of a visualisation tool that is often overlooked in relevant literature
is the teacher. The success of a visualisation tool depends not only on its educational efficacy but
also the instructors who may or may not choose to integrate it within their teaching activities. A
visualisation tool will less likely be adopted if from the instructors‟ perspective, the visualisation
technology incurs too much overhead to make it worthwhile. Naps et al (2003a) pointed out that
that there is a disconnect between the intuitive belief that visualisation enhances a students learning
and the willingness and ability of instructors to deploy it in their teaching. The experience gained
during the research of this thesis has demonstrated that instructors (from secondary school through

Mental Models, Learning Styles and Program Visualisation Chapter 3 – Visualisation
Page 50
to HE level) are often unwilling to embrace new tools. Naps and colleagues provide valuable
insight, stating that a key impediment to the adoption of visualisations by instructors is the time to
learn, install and develop visualisations and then integrate them into a course. Therefore, when
developing pedagogic tools, one should be mindful of this. This was a weakness of the BALSA
algorithm visualisation and animation tool. Though purported to be very successful at assisting the
learner, setting up an animation required a considerable investment in time and effort from the class
instructor (Brown and Sedgewick, 1984).
Based on the findings of earlier work (Naps et al, 2003b) and other relevant research, Naps (Naps et
al, 2003a) listed a number of top impediments to the adoption of visual tools by teachers:
Interestingly, in the top eight issues identified, time was a key factor. This included the time to:
Find a relevant visualisation tool;
Download the tool (which may incur a fee);
Install the tool (which may include contacting relevant technicians etc);
Learn how to use the tool effectively;
Develop visualisations and associated materials to use with the tool;
Adapt and integrate into course the visualisation tool and associated materials;
Teach Students how to use the visualisation tools;
Maintain and upgrade the tool and ensure compatibility with computer system changes;
Other factors highlighted in the research of Naps were issues of platform independence and course
integration.
Platform Independence
If a system was developed for a particular platform e.g. a PC with Windows, it precludes its use
on other systems e.g. Linux PCs or Apple Macintoshes. The problem can also be more subtle,
such as compatibility with different versions of an operating system, or if online, different web
browsers. A system deployed on an independent platform such as Java or Flash can overcome
this issue.
Integration Issues
How easy is it to incorporate the visualisation tool without completely overhauling the course
material? Is there a discrepancy between notation used in the visualisation and with existing
learning materials? Is it the notation supported in text books or other resources? There are
many different implementations of a particular algorithm e.g. quicksort; can the tool easily

Mental Models, Learning Styles and Program Visualisation Chapter 3 – Visualisation
Page 51
support the different implementations that might be used? If the answer to these questions is
no, then most likely a visualisation will not be utilised.
Usefully, Naps et al also provides practical and intuitive advice on how these potential impediments
may be addressed, for further reading see (Naps et al, 2003a).
The work outlined in this subsection indicates that the key barrier to the adoption of visualisation
by teachers / lectures is the time and effort required to integrate it within their teaching practices.
3.5 Flowcharts an Effective Visualisation For Novice Programmers
A flowchart is a type of chart that uses a graphical representation to describe the detailed logic of a
process or set of rules. In the domain of programming, flowcharts have been typically used to
visualise and communicate the design of programs, algorithms and procedures by visually depicting
the concepts of sequence, selection and iteration they are composed of. This section discusses why
flowcharts are an excellent form of visualisation for novices.
Flowcharts can be easily understood with little or no prior training. This small learning curve is due
in part to the simplicity of their notation; any program can be expressed using only five basic
flowcharting symbols (see Figure 3-5 below). Furthermore, flowcharts are in use in our day to day
lives and in other disciplines such as science and mathematics; therefore, it is likely that a student
learning programming for the first time will have some degree of familiarity with flowcharts.
Therefore, flowcharts can be considered very cognitively efficient.
Flowcharts are designed to aid program composition, comprehension and the transition from
problem specification through to syntactical solution; skills that in general have been shown to be
weak in novice programmers. They are also very appropriate in a lecture setting and allow the
instructor to convey and discuss the concepts of sequence selection and iteration and how they are
implemented within a program or algorithm without the distraction of language syntax. Flowcharts
also stand a better chance of being seen and comprehended by those students sitting towards the
back of a lecture theatre; whereas lines of programming language syntax maybe harder to make out,
especially for dyslexic learners.

Mental Models, Learning Styles and Program Visualisation Chapter 3 – Visualisation
Page 52
Figure 3-5. The Simplicity of Flowchart Notation
Section 3.1 demonstrated that the formation of accurate mental models is a crucial factor in the
novices‟ comprehension of programming. Students can form inappropriate or misleading mental
models if not guided in the formation of an appropriate and accurate one. Therefore, within the
teaching of programming, it is important to incorporate instructional aides that minimise the
likelihood of triggering inappropriate mental models. A flowchart can provide the novice with an
accurate and useful visual metaphor of a program and the semantics of individual components it is
composed of. Therefore, flowcharts are useful instructional aides for promoting the formation of
accurate, appropriate and useful mental models of program logic.
While flowcharts may not be ideal for modelling the large and complex programs of professional
programmers, they are very appropriate for modelling and visualising relatively small scale
procedures, simple programs and the foundational imperative programming concepts for novice
programmers of all programming paradigms (even OO). Flowcharts allow the novice to envisage
the flow of execution, the semantics of the conditional structures (i.e. if, if else, while, for
etc) and how the individual pieces of a program interact to form higher level concepts, whilst
limiting the syntactic overheads of a programming language. Westphal et al (2003) point out that
„without the use of diagrams or flow charts, it is difficult for beginners, even with pseudo code to communicate the flow
of a program. For example, the next instruction to follow may not always be obvious from reading pseudo code.‟
Furthermore, pseudo code is a purely textual representation and thus may not adequately benefit
learning styles with a preference towards the visual style of input. Ziegle and Crews (1998) studied
the utility of flowcharts for novice use and found that in comparison to structured code, the
flowchart offered significant benefits with respect to solution accuracy, time to completion, and
subject confidence. Khalife (2006) successfully used flowcharts to alleviate the conceptual and
Starter / Terminator Process or Instruction
Input or Output Decisional Branching Point
Lines of Flow Between Components

Mental Models, Learning Styles and Program Visualisation Chapter 3 – Visualisation
Page 53
syntactic difficulties novices face during their initial experiences with programming. This allowed
initial instruction to focus on problem solving and program comprehension, and as a result, the
students receiving this instruction performed better in examinations.
Flowcharts also benefit from being widely supported in programming related educational text
books to emphasise the nature of the control structures used in programming, stereotypical
examples of their use and algorithmic concepts that employ them. Two such examples are Deitel
and Deitel‟s popular „How to Program‟ series of programming books (Deitel and Deitel, 2009) and
O‟Reilly‟s Head First Java (Sierra and Bates, 2005).
3.5.1 Other Related Techniques
With the rise of structured programming, the use of flowcharts almost became a taboo subject
(Lindsay, 2002). More structured programming techniques aimed to replace the flowchart with
other documentation techniques such as Jackson Structure Diagrams (JSD) (Jackson, 1975), Nassi
Sheiderman Diagrams (NSD) (Nassi and Shneiderman, 1973), and pseudo code. However, the
usefulness of the flowchart was re-acknowledged when it later resurfaced in Unified Modelling
Language (UML) under the guise of the Activity Diagram.
It could be argued that UML activity diagrams are a more appropriate and modern representation.
Activity diagrams bear a close visual and functional resemblance to the traditional flowchart and
offer advanced features that surpass the capability of the standard flowchart notation, such as
stereotyping, swim-lanes and split and join. These features are not needed by novices who are
producing only simple single threaded programs. Therefore, within the scope of novice
programming, the activity diagram has no functional or visual advantage over the traditional
flowchart.
In visualising the flow of execution, NSD and Pseudo code are largely textual representations
offering little visual advantage over indented computer code. The boxes, lines of flow and arrows of
flowcharts make very apparent the order of execution, the next instruction to follow and the fact
that each statement is carried out one at a time. Experience at Glamorgan has shown that novices
do not find the conventions of JSDs as intuitive as the flowchart. Often novices blur the
conventions of JSD with flowcharts, drawing subsequent processes by progressing down the page
rather than traversing across. Also JSD diagrams do little to visualise the semantics of loops and

Mental Models, Learning Styles and Program Visualisation Chapter 3 – Visualisation
Page 54
decisions. Therefore, within the scope of novice imperative programming the flowchart is
considered the most appropriate visual notation for beginning programmers.
Experimental Psychologist David Scanlan (1989) conducted a study in which he compared the
performance of structured flowcharts and pseudo code as an aid to program comprehension. The
results showed that in comparison to pseudo code, the structured flowchart is a more effective and
efficient aid to the programmer. The subjects made significantly fewer errors, had significantly more
confidence, spent significantly less time answering questions and needed to look at the algorithm far
less when using structured flowcharts. The study also showed that as the complexity of the
algorithms grew, so did the benefit of flowcharts over pseudo code. Scanlan also discussed several
potential flaws in earlier influential studies that rebuked the flowchart. For example, Sheneiderman
et al (1977) were criticised for their use of unstructured flowcharts and for not considering response
time as measure of efficacy.
3.5.2 Flowcharts and Structured Programming
A key criticism of flowcharts is that they do not enforce a structured approach to programming,
and as such, promote the use of unconditional jumps (i.e GOTO statements), resulting in spaghetti
logic and the creation of incomprehensible, un-maintainable program code.
The flowchart on the left of figure 3-6 represents the bubble sort algoritm and is unstructured. It
breaks the key rule of structured programming, i.e. every control structure should have only one
entry and exit point. If this flowchart was translated literally, one could not avoid the use of
unconditional jumps. Not only are unconditional jumps considered bad practice, many modern
languages such as Java do not support them. Because of its unstructured design, it does not
translate directly into structured code without significant re-interpretation, something a novice may
find difficult and a prohibitive additional burden. It could be argued that this flowchart could be
drawn more tidily. However, this evidences another failing of unstructured flowcharts, as drawing
this algorithm tidily and clearly may take several attempts especially for a novice. Therefore an
unstructured flowchart may be considered cognitively inefficient. The problem here lies not in the
use of flowchart notation, or flowcharts as a whole; rather it is the unstructured way it is drawn.
By obeying the key rule of structured programming, that every structure has only one entry and exit
point, flowcharts can easily communicate a well defined and structured program. Subsequently, the

Mental Models, Learning Styles and Program Visualisation Chapter 3 – Visualisation
Page 55
transition from flowchart to structured code will be more apparent, requiring less reinterpretation.
This should make the novice‟s transition from problem specification through to resultant structured
code much simpler and more cognitively efficient. The flowchart on the right of figure 3-6
represents a structured version of the bubble sort algorithm. This structured flowchart is much
clearer than the unstructured one. It is also easier to distinguish loops from decisions and therefore
much more cognitively efficient.
An Unstructured Bubble Sort Flowchart A Structured Bubble Sort Flowchart
Figure 3-6. Unstructured and Structured Bubble Sort Flowcharts
From this it can be concluded that to map an unstructured flowchart to resultant structured code
introduces unnecessary cognitive burden for the novice programmer. However, this problem can be
alleviated by adhering to simple structured flowcharting conventions, making flowcharts very
appropriate for modelling the programs intended for structured programming languages.
3.5.3 Dynamic Flowcharts
The capability of modern computers means that a visualisation such as the flowchart no longer
needs to be static. A computer based visualisation of a flowchart can be used to animate the
dynamic nature of a computer program, its flow of execution, the changing state of program
variables and the interactivity between program components. An executable flowchart is a

Mental Models, Learning Styles and Program Visualisation Chapter 3 – Visualisation
Page 56
significant improvement over static flowcharts which leave this process largely up to the mind of
the viewer. Because of this, a dynamic flowchart is more likely to trigger the formation of
appropriate and accurate mental models of execution and decrease the chances of conceptual
inaccuracies. A dynamic flowchart also has better cognitive efficiency, as the viewer does not need
to manually keep track of the state of program data, thus minimising the amount of information the
learner has to hold in working memory or write down.
Not only can a dynamic flowchart be used to visualise program execution, it can also be dynamically
constructed. A criticism of flowcharts is that they are hard to update; as new ideas and
modifications are added, a traditional flowchart needs to be completely redrawn. To a large extent
this is also true of computer based graph drawing systems such as Visio (Microsoft Corporation,
2009), whereby adding or removing items requires the existing diagram to be significantly
rearranged by the user. This can take time and makes the flowchart a less than compelling design
methodology. However, a computer based visualisation of a flowchart can overcome this
requirement by tidily restructuring and redrawing a flowchart automatically as items are added or
removed (auto structuring). A program that allows the novice to construct a program visually via a
flowchart based representation will provide the novice with an effective mental model of the
constructs and how they can be composed whilst reducing syntactic overheads. This will place a
greater emphasis on the underlying abstractions of programming, problem solving and program
composition i.e. how the pieces fit together to form a solution to a problem or specification. The
dynamic execution of a flowchart will allow the novice to evaluate the appropriateness of their
solutions, gain a deeper understanding of the programs they have composed and foster a mental
model of program execution.
The product of this thesis (discussed in Chapter 4) employs a dynamic flowchart to great effect,
visualising both program construction and execution. The use of dynamic flowcharts as aids to
novice programming has recently received attention from a number of authors, some of whom
published work during the research and development stages of this thesis. In the section that
follows, a review of relevant systems is given. Then in section four the central product of this
research „Progranimate‟ is introduced.
3.6 Review of Relevant Systems
Since the early explorations into computer based visualisations of programming such as BALSA
(Brown and Sedgewick, 1984) a large number of graphical visualisation systems have been

Mental Models, Learning Styles and Program Visualisation Chapter 3 – Visualisation
Page 57
developed. Research was especially active during the early millennium due to the increased
capability of the average computer; even today new systems are cropping up on a very regular basis.
A quick search of the ACM portal website (Association for Computing Machinery, 2008) with the
keywords “Novice” and “Visualisation” will reveal the extent of this research. Clearly, there are
many more systems than can be effectively covered within the bounds of this thesis. Therefore, this
section will only discuss programming systems directly relevant to the focus of this thesis,
flowcharts, problem solving, program comprehension and imperatives first novice programming.
Recently, there has been an increasing development and utility of flowchart based programming
environments aimed at novices. A search of relevant literature and the internet has revealed
fourteen related systems developed from 1992 onwards. Of the systems discussed in this section,
seven were developed during the research of this thesis.
The systems were reviewed by downloading and testing them (when available) and by reading
relevant literature (when available). Three of the systems reviewed have not featured in academic
literature, but were available via the internet. Only five of the fourteen systems were publicly
available on the internet; others were retrieved by contacting the respective authors. However,
despite correspondence, some systems could not be obtained; for these systems the review relied
solely on information and images gained from published research.
The fourteen systems reviewed in this section are covered in chronological order. Each review
contains a small screen shot of the application, larger examples can be found in appendix A which
accompanies this chapter.
3.6.1 BACCII (Calloni, 1992, Calloni and Bagert, 1994, Calloni and Bagert, 1999)
Ben A Calloni Coding for Iconic Interface (BACCI) is a Microsoft (MS) Windows based application
designed for teaching programming. BACCI allows the user to express a program in an iconic
flowchart like form. In doing so, it aims to focus the user on algorithm development rather than
syntactical correctness.
Though structured, the flowchart notation of BACCI does not conform to standard flowcharting
conventions; its layout is composed of proprietary icons, not standard flowchart notation. This
proprietary notation means that BACCI is not in line with the flowcharting notation commonly
used in textbooks. This also means it can not teach conventional (and therefore transferable)

Mental Models, Learning Styles and Program Visualisation Chapter 3 – Visualisation
Page 58
program design methodologies. The benefit of using standard flowchart notation is the small
learning curve (due to notational simplicity) and the likelihood of novice pre-exposure. However, a
non standard notation will initially require additional learning and interpretation. Therefore, it will
not be cognitively efficient and distract the novice from the learning of programming.
BACCII does not provide any feature to execute its program. Instead BACCII converts its
flowcharts into syntactically correct C++, Pascal or Fortran code which can only be viewed or
executed by using an additional programming environment. This makes it difficult for the novice to
relate the flowchart to the resultant code. The lack of execution features means that BACCI does
not provide novices with a model of execution in code or flowchart form. Nor can it support the
development of program testing, debugging and tracing skills.
The authors of BACCII have shown that its utility within an introductory programming course
enhances the students‟ conceptual understanding and results in higher academic scores (Calloni and
Bagert, 1994). In 1999 the authors expressed an intention to go commercial with BACCI (Calloni
and Bagert, 1999); despite this it does not appear to be openly available on the web.
Figure 3-7. The various elements of BACCI and a sample of its generated code
3.6.2 FLINT - (Ziegle and Crews, 1999)
The Flowchart Interpreter (FLINT) is an MS Windows based system for teaching algorithm design,
testing and debugging and is designed for a syntax free introduction to programming. FLINT uses
flowchart notation and Jackson Structure Diagrams to focus the novice on algorithmic problem
solving and a top down design methodology. Users of FLINT must first construct a structure
diagram to outline the key functionality of the problem. Each node of the structure diagram then
represents a process which must be defined by the user in the form of a structured flowchart. This

Mental Models, Learning Styles and Program Visualisation Chapter 3 – Visualisation
Page 59
approach means that novices must be exposed to functional decomposition before the basics of
sequence, selection and iteration have been mastered.
The flowcharting features of FLINT support the use of variables, assignment, output (print),
input (read), Selection (if else only), Loops (while loop only) and procedures. Flint
employs a rudimentary use of colour in its flowchart notation. However, this colour is not used to
differentiate between the decision and looping structures (which all use diamonds of the same
proportion and colour) which could cause them to be confused with each other.
FLINT also supports the visual execution of its programs where each diagrammatic component and
any variables used are highlighted in turn as they are executed, the speed of which can be adjusted
by the user or stepped though at the users control. This feature is particularly useful and facilities a
higher degree of program comprehension and the development of debugging strategies.
One major drawback of FLINT is that it offers only a visual representation of a program; there are
no features to view a program in a textual form. While the tool may benefit students with a visual
learning style (the majority), those with a verbal (textual) style are less affected. Also, by delaying the
exposure to syntax, the learning curve of syntax is not minimised but postponed. Students using the
tool will have no support in learning to simulate the execution of code. The absence of code also
means that the programs constructed cannot be taken to another environment where this support
may be given.
FLINT has been empirically evaluated by one of its authors (Crews, 2001). The results of this study
demonstrate that the early use of a flowchart based programming environment by novices has a
positive effect on the novices‟ understanding of programming logic and program composition skills,
compared with a control group that were taught traditionally. Flint is not readily available on the
internet. Communication with one of FLINT‟s authors (Uta. Zeigler via email) indicated that any
further development of this tool was unlikely.
Figure 3-8. Various images of FLINT’s user interface

Mental Models, Learning Styles and Program Visualisation Chapter 3 – Visualisation
Page 60
3.6.3 Empirica Control - (Lavonen et al, 2002)
Empirica control (EC) is an MS Windows based visual programming platform designed primarily
for technology education. Students can use EC‟s visual tools to construct programs for controlling
simple electronic systems, as well as to show a graphical representation of program execution via a
flowchart like control flow diagram. Empirica control is shown in figure 3-9.
Users of EC construct a program by first selecting options from a palette of tools and then by
double clicking the area of the control flow diagram where they wish the new component to be
inserted; this makes for very easy program construction. Each added component can then be right
clicked where parameters may be set. Once constructed, a program can be visually executed; this is
achieved via a moving ball indicating the flow of execution within the control flow diagram. EC can
handle output, input, decisions loops, and a range of features for interacting with external devices.
To exploit its full functionality an additional piece of hardware is required. EC‟s programs can then
be used to measure temperature, electrical current, ph or control electronic devices such as motors
and lights via various outputs.
EC‟s authors assert that it is useful for teaching programming; a closer inspection reveals that it has
several problems that make it unsuitable for this purpose. The notation of its flowcharts relates
closely to electronic engineering and thus does not map cleanly to programming like a standard
flowchart. The semantics of EC‟s controls are very unlike the programming languages a novice will
eventually use. Both the loop or decision structures are incapable of handling Boolean expressions;
the decision structure will only work with a single key press or via input provided by external
electronic devices; the loop structure can only loop a predetermined number of times which cannot
be adjusted programmatically. Also, while it is possible to assign one variable to another, it appears
not to support mathematical expressions.
The limitations of EC significantly restrict the range of programs that can be built. Furthermore the
programs that can be built do not possess the semantics of a typical programming language. From
this it can be concluded that EC may be suitable for teaching the programming of control systems,
but not for teaching the basics of algorithm design in relation to the traditional programming
concepts of sequence, selection and iteration. While the tool has received positive empirical
evaluation, these studies relate only to the teaching of control systems logic rather then
programming (Lavonen et al, 2001, Lavonen et al, 2002) .

Mental Models, Learning Styles and Program Visualisation Chapter 3 – Visualisation
Page 61
Figure 3-9. Empirica Control
3.6.4 FlowChart Interpreter - (Atanasova and Hristova, 2003)
The flowchart interpreter (FCI, not to be confused with FLINT) has been developed at the
University of Rousse in Bulgaria and is shown in figure 3-10. FCI employs a black and white
flowchart that is constructed by the user from a palette of primitive shapes and lines. As each
flowchart piece is added, the user enters an appropriate expression (i.e. conditional arguments,
assignment statements, or a variable) which is checked for syntactic correctness. If successful, the
flowchart is updated with the addition of the new flowchart component or structure. In the case of
an error, immediate feedback is presented to the user via a popup message box.
Once constructed, a program can be executed visually or non visually. The flow of execution is
visualised by outlining each flowchart instruction as it is carried out. Execution can be carried out
automatically from start to end or manually where the user initiates each step. During animation the
values of variables are displayed in a table to the left; this table also serves to display the changed
state of program data after the program has executed. The animation features provide a concrete
model of execution whilst allowing the novice to practice testing and debugging skill.
Because FCI‟s programs are constructed via primitive shapes (i.e. rectangle, diamond, parallelogram,
lines, arrows and text) users can construct a wide range of non procedural programs utilising
variables, output, input, decisions and loops. This means the user must spend considerable time
manually restructuring and tidying the flowcharts rather than focusing on problem solving and the
concepts of programming. Also, this allows for the creation of unstructured flowcharts, which as

Mental Models, Learning Styles and Program Visualisation Chapter 3 – Visualisation
Page 62
discussed earlier, do not translate easily to a structured programming language. As the flowcharts of
the FCI are in black and white, it is difficult to differentiate between the parallelograms of the input
and output and the diamonds of decisions and loops, as the function each flowchart shape is not
clearly marked. This increases the tools cognitive load, as the user must expend more effort
deducing their purpose. FCI also offers no way to present a program in a textual form. This does
not benefit verbal learners and serves only to defer the learning curve of syntax rather than reduce
it. A literature search has indicated that no published or widely available empirical research has
evaluated the effectiveness of FCI.
Figure 3-10. The Flowchart Interpreter
3.6.5 Raptor - (Carlisle et al, 2004, Carlisle et al, 2005)
Raptor was developed for the United Stares Air force academy as a programming aid for their
„Introduction to Computing‟ course which is offered to all students. Raptor is an MS Windows
based application; its user interface is shown in figure 3-11. The aim of Raptor is to develop
problem solving ability whilst avoiding the problems of syntax. Raptor is in many ways similar to
Atanasova and Hristova‟s FCI which allows the user to construct and execute black and white
flowcharts. However, a key difference is that programs are constructed and auto-structured by
dragging and dropping complete structures onto the flowchart (rather than individual shapes, lines
and arrows); the flowchart then tidily redraws itself without intervention from the user, which
improves cognitive efficiency by retaining the users‟ focus on the programming task rather than the
construction of flowcharts. This also ensures that the rules of structured programming cannot be
broken. Other improvements are Raptor‟s support for procedures and arrays. Raptor also offers a
library of inbuilt procedures that can be used to perform IO with text files, determine the data types
of variables and draw simple 2D graphics.

Mental Models, Learning Styles and Program Visualisation Chapter 3 – Visualisation
Page 63
The latest 2007 version also aims to support the translation of its flowcharts into code, supporting
the Ada, C++, C# and Java languages as well as the creation of standalone executable programs.
However, the programs of Raptor are not strongly typed (variables and arrays are not initialised or
given a data type); therefore the generated code omits the data types, initial values and sizes of
arrays, substituting them with a „??‟ place holder. This problem affects declarations, method
parameters and return types, meaning the generated code is syntactically incorrect and not
executable without significant manual modification in an external environment. Another problem is
that the arrays of Raptor are not zero indexed (they start at element one); therefore the algorithms
modelled by Raptor are incompatible with the semantics of the Java, C++ and C# code it
generates. This means that the generated code never uses element zero of an array, which
exacerbates the potential for misconceptions relating to array element numbering. The generated
code is placed in an external file which cannot be viewed or executed by Raptor; one must use an
additional programming environment. This makes it difficult for the novice to relate the flowchart
to the resultant code, but more importantly means that Raptor cannot assist in the development of
code tracing skills. The lack of inbuilt code viewing and execution features coupled with the
syntactic omissions and semantic inconsistencies significantly negates the potential of Raptor‟s code
generation features. An example of a Raptor‟s user interface and the code that it generates is shown
in figure 3-11.
The results of evaluation studies have shown that Raptor brought about an increase of
approximately 4% in scores of assessed problem solving exercises, compared with students using
their own choice of traditional flowcharts or the Ada or Matlab languages (Carlisle et al, 2004,
Carlisle et al, 2005). Raptor is currently available at no cost via the internet.
Figure 3-11. RAPTOR and an example of its generated code

Mental Models, Learning Styles and Program Visualisation Chapter 3 – Visualisation
Page 64
3.6.6 The SFC Editor - (Watts, 2004)
The Structured Flowchart Editor (SFC) is an MS Windows based application and has been
developed at Sonoma State University in California. Like many other environments reviewed in this
section, the SFC utilises line drawn black and white flowcharts. Like the other environments such as
Raptor, SFC utilises auto structuring in its flowchart construction. However, a key difference is that
commands and control structures are added by clicking a flowchart insertion point and selecting an
option from a popup menu, whilst Raptor and others use a drag and drop palette approach. SFC
supports the use of sequential commands(assignment, input, output), selective structures (if, if
then else and case) , looping structures (while, repeat, for and exit loop),
procedures and comments, which is more than any other system reviewed so far.
SFC can also generate C++ style or generic pseudo code automatically as items are added to the
flowchart. SFC improves on other flowchart and code generating environments, as the code and
flowchart are presented on screen side by side. This means that the SFC can simultaneously benefit
both visual and verbal learners. Selecting a flowchart component causes the relevant line of code to
be highlighted. This is a particularly useful feature and allows the user to see how each flowchart
component relates to the generated code. However, this synchronization is not bidirectional; it is
not possible to select a line of code and have the relevant flowchart component highlight, therefore
the potential of this feature is not fully utilised.
A major drawback of the SFC is that it provides no feature to run the programs it models and so
cannot provide the novice with an accurate model of program execution. This means that the code
generated must be copied to an additional environment. Also, because the code generated is pseudo
code (all be it with the possibility of C++ like syntax), it will need significant modification to be
usable within a programming environment. Another problem is that the SFC does not validate the
syntax entered into its structures and components, and therefore does not provide feedback
regarding the correctness of the program they have written.
While the side by side synchronous display of flowcharts and code is potentially useful, the lack of
execution features, syntactic validation and a proper language means its support is limited. It cannot
foster tracing skill or help overcome syntactic difficulties and conceptual inaccuracies. Currently, no
empirical research can be found that evaluates the effectiveness of the SFC.

Mental Models, Learning Styles and Program Visualisation Chapter 3 – Visualisation
Page 65
Figure 3-12. The SFC Editor
3.6.7 Visual Logic -- (Crews and Murphy, 2004, Crews, 2009)
Visual logic (VL) is another MS Windows based application, originally provided as an
accompaniment to an introductory programming text book (Crews and Murphy, 2004). A newer
version of VL authored in 2007 is currently being sold commercially online for a fee of
approximately £50 (Crews, 2009). A demo version can be accessed free of charge which amongst
other restrictions, prevents saving of programs. Figure 3-13 shows VL and its generated code.
VL allows users to construct and execute structured flowcharts. It features variables, arrays,
assignment, input, output, selection, iteration, procedures and simple 2D graphics commands.
Flowchart construction is achieved via a menu of selectable options which appear when a valid line
of flow is right mouse clicked. The flowcharts of visual logic are very clear and well laid out; auto
structuring features ensure constant structural integrity without burdening the user. All of the
flowchart components are the same colour (with exception to the start and end components).
However, clear distinctions have been made between loops and decisions and the parallelograms of
the input and output by their differing graphical form. A minor drawback is that Boolean data types
are not supported by assignment expressions; this limits the scope of VL‟s programs but not
significantly. A problem also exists which prevents anything other than a literal value to be used
when assigning array elements, this significantly limits the scope of VL‟s array handling features.
VL can execute its flowcharts; two options exist, standard non-visual and manually stepped visual.
There are no features for automatically animating a program; therefore visual execution requires
many repetitive mouse clicks, especially with loops. Visualised execution is carried out by
highlighting the shadow of each flowchart component in turn rather than the whole component or

Mental Models, Learning Styles and Program Visualisation Chapter 3 – Visualisation
Page 66
its surrounding area, which makes spotting the current instruction difficult. VL also contains a
simple and effective variable watcher window; this displays the changing state of variables and
arrays during stepped execution. This means VL can provide the novice with a real time visual
model of flowchart execution and can also help teach debugging skill.
A prominent feature of VL is its ability to translate its flowcharts into a VB.Net project or VB6 and
Pascal files. However, as with some of the other code generating environments, the resultant code
is entirely separated from the application and can only be executed and viewed in an external
environment. This makes it difficult for the novice to relate the flowchart to the resultant code; it
also does nothing to aid code tracing skills. The code generated possesses many of the same
problems as Raptor in that the data types are missing from variable declarations and procedures.
Also missing from VL‟s code is the declaration of arrays. This means that the code generated can
not be executed without significant modification; as with Raptor this negates its effectiveness.
To evaluate VL‟s use in the classroom Mark Hall (2007) conducted a basic student evaluation
questionnaire. The results of the questionnaire indicate that programming students found the tool
easy to use, enjoyable, and helpful in their programming activity.
Figure 3-13. Visual Logic and a sample of its generated code
3.6.8 The Iconic Programmer - (Chen and Morris, 2005)
The Iconic Programmer (IP) is a collaboration between two Canadian academic institutions. IP is a
flowchart based programming environment that allows the novice to build executable flowcharts
from which static code can be generated (see Figure 3-14). Like many of the other tools discussed
in this section, IP is purely MS windows based.

Mental Models, Learning Styles and Program Visualisation Chapter 3 – Visualisation
Page 67
IP uses auto structuring in its flowchart construction features; insertion points can be clicked,
causing a popup menu to appear. Via this menu the users define program components which are
then automatically added to the flowchart. IP aims to eradicate the need for entering syntax by
employing a menu and button driven system. However, in practice this appears to have made IP
visually complex. A user may get overwhelmed by the large number of options, buttons, dropdown
menus and input fields presented in its expression builders (see figure 3-14). In handling expression
errors the user receives no error feedback, other than the default windows beep, which will lead to
frustration and confusion. It also seems impossible to work with non numeric data types except in
conditional structures. This significantly limits the scope of programs that can be built with the IP.
IP‟s flowcharts are coloured, but only in red and black; this offers no advantage over the black and
white flowcharts. Therefore, it is difficult to distinguish one type of component from another,
especially with a loop and branch structures. This problem is exacerbated by the flowchart
components only displaying generalised notions of their behaviour; for example, declaration,
perform math, print output, get input. On no occasion do the flowchart components display their
true functionality i.e. x = x + y or Print x. The decisional structures loop and branch will
also only ever display a single relational operator rather than the whole expression. To view the
function of a component, the user must click it to inspect its expression builder, which means the
user cannot get an immediate overview of a program‟s core functionality. This will have the effect
of increasing the number of things the novice will have to hold in working memory and is therefore
not cognitively efficient. Another problem relating to the decisional structures is that the true and
false paths are not marked and could therefore cause confusion. These drawbacks seriously negate
the effectiveness of IP‟s flowcharts at communicating the algorithm being modelled. IP uses
background colour to identify the scope of nested structures. This is helpful to IP because in an
attempt to maximise screen space the layout of its flowcharts is not as straightforward as they could
be. Without this feature the boundaries of each structure would not be as obvious to the novice.
The tool also has the ability to visually execute its flowcharts. This is achieved by highlighting each
of the flowchart components in turn. Users can manually step through each instruction, or
automatically run the program from start to end. However, the speed controls are limited; normal
speed runs at approximately two instructions per second, and slow speed runs at approximately one
instruction per second. Both of these speeds are much too fast for effective comprehension to take
place, rendering the run feature largely unusable. Another execution related problem is that the area
used for the output and input commands is also used to display the changing state of variables.
Therefore, the print commands and changes in variable state get lost amongst each other as the

Mental Models, Learning Styles and Program Visualisation Chapter 3 – Visualisation
Page 68
program generates lines and lines of output in rapid succession. These two visualisations should
have been made distinct, rather than combined.
A potentially useful feature is IP‟s ability to translate the flowchart into English Pseudo code, Java,
Turing or C++. However, IP cannot execute this code and offers no synchronicity between the
generated code and the flowchart. The generated program is detached from the main application
appearing in its own frame which vanishes from view the moment the application is clicked. This
makes it difficult for the user to map the pieces of the flowchart to the generated code, especially as
the flowchart components do not display expressions. One redeeming feature is that IP‟s code
generation improves on those of Raptor, SFC and visual logic in that the code generated is
syntactically correct and can be executed with no modification. However, IP cannot do anything
with the code; it offers no synchronicity between the code and the flowchart (like the SFC does)
and therefore cannot help in developing code tracing skills. A literature search has revealed no
empirical research that evaluates the use of IP.
Figure 3-14. The Iconic Programmer
3.6.9 Dev Flowcharter - (Domagala, 2006)
DevFlowcharter (DF) is a small, non academic open source tool designed for MS Windows. DF
allows users to construct structured flowcharts from which Pascal code can be generated. DF
handles variables, assignment, decisions (if, if else and case) and Loops (for, while and
repeat), but not arrays or procedures. As with some other reviewed systems, programs are built

Mental Models, Learning Styles and Program Visualisation Chapter 3 – Visualisation
Page 69
via a menu driven system. Right mouse clicking a line of flow causes a menu of components and
structures to appear; the user selects an option and defines an associated expression which updates
and auto structures the flowchart without user intervention. As with other environments, this
retains the focus on programming rather than the constant rearrangement of flowchart features. In
its default state the flowcharts of DF are black and white; however, the program settings allow the
user to assign colours to the various flowchart shapes. This is potentially beneficial but flawed as
the diamonds of the While, Until or If structures cannot be distinctly coloured. This means
the user could still confuse the decision and looping structures (see Figure 3-15). Although the
flowcharts of DF are always structured, the way in which they are laid out means the boundaries of
the structure is not clear (see Figure 3-15). This problem could have been averted by visually
marking the ends of each structure.
The tool is capable of compiling the Pascal code it generates, providing an additional Pascal
compiler is installed. However, the programs of DF cannot be executed in either the flowchart or
code views. Executing the code involves the use of an additional development environment which
serves to increase the number of things the novice must learn. Also, like other environments
discussed in this review, the code is entirely separated from the DF application, with no
synchronicity between it and the flowchart. Therefore, DF cannot help with the development of
code tracing skills and makes it difficult for a novice to relate the code to the flowchart. A search
revelled there is no public information concerning the evaluation of DF.
Figure 3-15. Dev Flowcharter

Mental Models, Learning Styles and Program Visualisation Chapter 3 – Visualisation
Page 70
3.6.10 An Unnamed Application - (Arai and Yamazaki, 2006)
Masayuki Arai and Tomomi Yamazaki of Teikyo University Japan have taken a radically different
approach in the deployment of their flowchart based program visualisation system. Like other
systems, they employ executable flowcharts and code; however, this application is deployed as a
web based client server application. The web based client server approach makes the application
platform independent and accessible to any operating system equipped with a modern web browser.
This is an improvement on the other systems reviewed, most of which are platform dependant. In
subsection 3.4.2 it was stated that visualization may be of little use if packaged within an
environment that requires the user to handle extraneous additional information or perform tasks
unrelated to the problem domain, as this has the effect of increasing cognitive load. Embedding the
learning aid within a browser means many of the onscreen options are unrelated to the task at hand,
i.e. programming. Also, the tool bars and visual features of the browser leave less room for the
flowchart application, its tools and program workspace.
Aria and Yamazaki‟s environment is capable of displaying both code and flowchart side by side.
Program execution is achieved on a manual step by step basis only. However, execution is bi-
directional, going both forwards and backwards. During execution both the flowchart and code
views are synchronised. This allows the user to see a direct link between the flowchart and the code.
It also provides the user with a model of execution in both code and flowchart form which will aid
the development of tracing skills.
A large drawback to this tool is that it can only visualise instructor created problems. The creation
of programs for animation requires significant effort and technical knowledge of the system, C++
and a special notation that must be inserted in the program code being visualised. Also, whilst Ari
and Yamazuki‟s system can provide a visual and verbal model of execution it cannot support the
novice in overcoming the difficulties of program construction. Another rather obvious drawback to
this tool is its language; the application contains predominately Japanese text which prevents it use
in English speaking universities such as Glamorgan.
A literature search has revealed that no published or widely known empirical research has been
conducted to evaluate Arai and Yamazaki „s online environment. This environment also does not
appear to be widely available. Arai and Yamazaki‟s environment is shown below in Figure 3-16.

Mental Models, Learning Styles and Program Visualisation Chapter 3 – Visualisation
Page 71
Figure 3-16. Ari and Yamazaki’s Web Based Flowcharting Application
3.6.11 B# - (Greyling et al, 2006)
B# (Be Sharp) was developed by a team of researchers at the University of Port Elizabeth and has
been designed for the use in MS Windows. B# users construct a structured flowchart from which
syntactically correct code is generated in Pascal. B# employs auto structuring in its flowchart
construction features. Users drag various options from a palette onto the intended location of the
flowchart. As items are added, the user defines associated parameters which are syntactically
checked, and any errors are presented to the user. Once a component or structure is successfully
added to the flowchart, the associated Pascal code is then automatically generated and the flowchart
restructured and redrawn. Because B# will only generate Pascal, it is largely unsuitable for
introductory courses like those of Glamorgan that use other languages such as Java.
B# allows users to see the correlation between a flowchart and code as they are presented side by
side. This is further assisted by a synchronised highlighting feature. Selecting a flowchart
component causes the relevant line of code to highlight (but not the other way). B# also provides a
visualised program execution. This is achieved by highlighting each flowchart components and
associated line of code as it is executed. Simultaneously, B# displays inputs, outputs and the
changing state of variables as they happen. This means B# provides a graphical and textual model
of execution. Each step of execution is invoked by an onscreen button, but animation cannot be
carried out automatically. Therefore visualised execution involves many repetitive mouse clicks,
especially with loops. B# uses a proprietary flowchart notation that is not in line with the standard
notation commonly found in textbooks and online material. Therefore B# does not teach
conventional (and therefore transferable) program design methodologies.

Mental Models, Learning Styles and Program Visualisation Chapter 3 – Visualisation
Page 72
The authors have provided empirical evidence to demonstrate the effectiveness of the tool
(Greyling et al, 2006). The results showed the abilities of novice programmers improved
significantly when they used B#, compared with students using a traditional code only environment.
However, B# does not appear to be readily available on the internet, which will restrict any
potential benefits the tool has to offer.
Figure 3-17. The B# Iconic Programming Environment
3.6.12 Pro guide - (Areias and Mendes, 2007)
ProGuide (PG) is a flowchart based problem solving aid designed for the Windows operating
system. It has been developed at the University of Coimbra in Portugal. PG focuses on the creation
of executable flowcharts for expressing solutions to a library of inbuilt programming problems. The
central aim of PG is to provide guidance in the novices‟ transition from problem specification to a
program solution. PG is shown below in figure 3-18.
PG supports the use of assignment, input, output, decisions and looping and like other tools is able
to animate the flowchart programs constructed within its workspace. Like other environments PG
uses a menu driven auto structuring approach to flowchart construction. This retains the user‟s
focus on the task at hand rather than the constant rearrangement and tidying of a flowchart. Like
many of the other tools discussed in this review of systems, PG does not employ the use of colour
to distinguish between the flowchart elements and structures.
The authors of PG note the benefit of one to one tuition. A unique feature of PG is that it aims to
emulate the support given by a class tutor by supporting the novice in their reasoning activities.
While this feature is useful, one key drawback to PG is that its use is constrained only to its inbuilt
collection of programming activities and is thus unable to support the open ended development of

Mental Models, Learning Styles and Program Visualisation Chapter 3 – Visualisation
Page 73
programs. Furthermore the creation of new problems is complex and definitely outside the ability
of the average novice programmer.
PG supports the visualised execution of its flowcharts, which provides a concrete model of
execution and allows the users to validate the correctness of the programs they build. However, PG
does not present its programs in a textual form. This also means that PG does not favour students
with a predominantly verbal learning style or aid in the development of code tracing skills.
Furthermore, delaying exposure to code will only defer the learning curve of syntax rather than
reduce it. This prevents the novice from seeing how the flowchart solutions translate into actual
program code. Therefore PG does not provide complete support in the transition from problem
specification though to syntactic solution.
Although a number of English and Portuguese papers have been written by PG‟s authors, a
literature search has indicated there are no publicly available evaluation results for PG.
Figure 3-18. The ProGuide Environment
3.6.13 Using Microworlds Pro (Glezou and Gridoriadou, 2007)
Katrana Glezou and Maria Gridoriadoi from the University of Athens in Greece have developed an
interactive and flowchart based tutorial for teaching the if and if else structures to learners
aged approximately 14 years old. The tutorial consists of 5 pages and was authored in the
multimedia authoring software MicroWords Pro (Logo Computer Systems Inc, 2009); it therefore
benefits from being usable on both the MS Windows and Macintosh operating systems. An
example page from this tutorial can be found in figure 3-19.

Mental Models, Learning Styles and Program Visualisation Chapter 3 – Visualisation
Page 74
Glezou and Grodoriadou have created a tutorial rather than a programming environment.
However, this tutorial incorporates some useful features that surpass other flowchart visualisation
systems discussed earlier. Throughout the tutorial, flowcharts play a key role in conveying the
concepts of sequence and selection. Of particular interest are tutorial pages two and four which
present simple flowchart programs employing the use of if and if else structures. In these
pages the programs are presented using side by side multiple representational forms, consisting of: a
verbal description, pseudo code, flowcharts and the logo language. These 4 representations animate
the execution of the modelled program in synchronisation. This feature is particularly useful as it
allows the novice to see the semantics of the structures and how the flowchart relates to the
program description and resultant code. Also, its multi modal presentation means multiple learning
styles (verbal and visual) may be equally affected.
The use of this tutorial has been combined with a simple teaching pedagogy designed to fit one
hour of classroom instruction. Glezou and Gridoriadoi‟s research indicates that an interactive
tutorial incorporating flowcharts is an appropriate and motivating mechanism for teaching
programming concepts to a younger audience. A drawback to this approach is that novices can only
follow the path of the tutorial; it is not possible for the user to implement their own programs using
this multi-representational presentation. Also, the Logo language is not used to teach programming
at Glamorgan and is thus unsuitable for our students. A final rather obvious drawback is language,
as the tool‟s user interface is in Greek, which will not suit English speakers.
Anecdotal evidence from the authors indicates that the students‟ response to the tutorial was
positive, resulted in increased motivation and significant gains in the students‟ ability to answer test
questions. However, other than the anecdotal evidence stated in Glezou and Gridoriadoi‟s research
paper (Glezou and Gridoriadou, 2007) an empirical evaluation of this work has not been
conducted or is not publicly available.
Figure 3-19. Glezou and Gridoriadoi’s Interactive Tutorial

Mental Models, Learning Styles and Program Visualisation Chapter 3 – Visualisation
Page 75
3.6.14 Code Visual to Flowchart - (FateSoft, 2009)
The last system of this review is a commercial product, Code Visual to Flowchart (CVF) by Fatesoft
(shown in figure 3-20). The central feature of CVF is the conversion of program code into
flowcharts, with the aim of helping programmers understand and document source code. As each
line of code is entered into CVF‟s text editor, the flowchart view auto updates, presenting the
program visually. However, it is not possible to generate code by constructing the flowchart. This
approach does little to minimise the overheads of syntax, meaning the focus of the programming
activity will not be entirely devoted to problem solving. This code first then create flowchart
approach to programming visualisation will reinforce sloppy programming habits by encouraging
the hacking out of programs without careful forethought and planning.
CVF presents its flowcharts and code side by side, which are synchronised via highlighting; clicking
a line of code causes a relevant flowchart component to highlight and vice versa. This is particularly
useful, as it allows the user to see how the flowchart and code relate to one another. CVF also has
the ability to export its flowcharts to any Microsoft Office application, including Visio. It is thus is a
useful documentation tool. The free demo version prevents nesting of more than three levels, a
restriction which is lifted when a licence is purchased. CVF cannot execute the programs it models,
therefore it cannot provide the novice with a concrete model of execution. It also does not check
for syntax errors, which for a code driven system makes program composition unnecessarily
difficult and open to miscomprehension.
CVF‟s inability to construct programs via flowcharts, its lack of execution features and its lack of
syntax error checking means that the tool cannot provide a model of execution, promotes a sloppy
approach to programming and does little to overcome the syntactic overheads of programming. It
is therefore not suitable for the novice. CVF is a commercial venture, its roots are not founded in
academia. Because of this CVF has not received any formal evaluation. Also, despite its perceived
benefit, there are no indications of its use within an educational setting.
Figure 3-20. Code Visual to Flowchart

Mental Models, Learning Styles and Program Visualisation Chapter 3 – Visualisation
Page 76
3.6.15 Review of Systems Discussion
Table 3-3 below provides an overview and comparison of the reviewed system‟s features.
Table 3-3. A Comparison of the Reviewed Systems
Feature BACCII FLINT EC FCI Raptor SFC VL IP DF A&Y B# PG G&G CVF
Year Published 1992 1999 2002 2003 2004 2004 2004 2005 2006 2006 2006 2007 2007 2009
Flowchart * * * * * * * * * * * * * *
Flowchart based programming * * * * * * * * * * *
Flowchart generates code * * * * * * *
Structural rules enforced * * * * * * * * * * * *
Colour used to fully differentiate
components and structures *
* * *
Code * * * * * * * * * *
Code based Programming *
Code generates flowchart *
Generated code compiles
without modification *
* * *
Code and Flowchart Displayed
Concurrently.
* * *
* *
Synchronised highlighting of
flowcharts and code
1/2 1/2
* *
Synchronised Visual Execution
of Flowcharts and code
*
*
Non visual execution * *
Visual execution * * * * * * * * * *
Variable inspector * * * * * * * *
Strongly typed * * * * * *
Error feedback * * * * * * * * * * * *
Java support * * * *
Variables * * * * * * * * * * * * * *
Sequence * * * * * * * * * * * * * *
Selection * * * * * * * * * * * * * *
Iteration * * * * * * * * * * * * *
Arrays * * * * *
Procedures * * * * *
Empirically Evaluated * * * * *
Associated Pedagogy * * *
OS Dependency Win Win Win Win Win Win Win Win Win Any Win Win Win/
Mac Win
As the focus of this thesis is on the use of flowcharts as a visual aid to programming, all of the
systems covered are flowchart oriented. The fourteen systems reviewed demonstrate that the use of
dynamic executable flowcharts is viewed by several authors to be an effective approach for teaching
novices programming. However, despite this only five of the reviewed systems have empirical
evidence to demonstrate their efficacy.
All but three of the reviewed systems support the creation of programs via user constructed
dynamic flowcharts. A criticism of hand drawn flowcharts is that they need to be redrawn every

Mental Models, Learning Styles and Program Visualisation Chapter 3 – Visualisation
Page 77
time an amendment is made; computer based flowcharting environments can overcome this
problem via auto structuring. However, computer based flowcharts have been criticised because the
amount of available screen space means only small programs can be displayed as a whole on the
screen; larger programs will necessitate scrolling, which prevents the overall picture from being
seen. However, the resolution of computer graphics hardware and screen sizes are now much better
than they were 10 years ago, meaning this is increasingly becoming less of a problem especially for
programs of the size novices will be expected to create.
One of the reviewed systems (CVF) generates flowcharts from code (but not the other way
around); whilst this approach provides a visual model of the written program, it does not overcome
the syntactical overheads of programming. Systems that translate flowcharts to code give the
novices exposure to a textual representation, but reduce the burden of syntax and therefore allow
the novice to focus on problem solving and the conceptual mastery of the underlying concepts of
variables, sequence, selection and iteration. Systems that do not support code only defer the
difficulty of syntax. Code generating systems can help provide a gentler, less daunting introduction
to syntax. Only seven of the systems reviewed have the capability to generate code from a user
constructed flowchart (BACCII, Raptor, SFC, VL,IP, B# and DF). Of these six systems only SFC
and B# support the concurrent side by side presentation of flowcharts and code. The other
systems generate code (some not very well) but place the results in a separate text file that is
unconnected with the flowcharting environment. Therefore, in order to relate the flowchart to the
code, the user must switch between the two representations, holding the invisible one in working
memory. This consumes valuable cognitive resources that should be focused on comprehending the
underlying principles of programming. Furthermore, in the systems that do not incorporate their
generated code, there exists no feature (such as highlighting) to emphasise the relationship between
the pieces of the flowchart and the lines of code generated. The user must deduce this relationship
themselves which could lead to misunderstandings, conceptual errors and subsequently ill-founded
mental models.
An environment that provides both a visual and textual model of execution will help foster a more
complete model of execution and teach by example the tracing of code. The work of Glezou and
Gridoriadou has shown that presenting a program in both visual and verbal forms, side by side and
in synchronisation is a useful aid to comprehension. Unfortunately, their environment does not
support the open ended development of programs. Whilst SFC allows flowchart based
programming, code generation and the side by side presentation of flowcharts and code, it cannot
execute its programs. B# does support the side by side visual and verbal presentation of a program,
allows for open ended development and visualised execution. However, it does not adopt a

Mental Models, Learning Styles and Program Visualisation Chapter 3 – Visualisation
Page 78
standard flowcharting convention or support the generation of languages other than Pascal. It is
also not platform independent and so is restricted to users with access to Windows based PCs only.
Currently, there are no environments (other than the one detailed in this thesis) that can offer
programming via standard flowcharting conventions, code generation, side by side presentation of
flowcharts and code and an animated model of execution in both visual and textual forms.
Furthermore, there are no platform independent tools for composing programs; the only platform
independent system reviewed allows execution of programs pre-created by a knowledgeable tutor
with a good grasp of C++. At the University of Glamorgan Java is taught to our novices; therefore
a visualisation system that supports the generation of Java syntax would be useful. However, of the
4 systems that manage to achieve this only raptor offers open ended flowchart based programming.
However, Raptor‟s generated Java code contains many omissions, is entirely separate from the
application and cannot be executed without an external environment.
This research aimed to develop a platform independent application that offers standard flowchart
based programming, concurrent visual and verbal presentation of programs, code generation in Java
and other languages, together with an animated visual and verbal model of execution. This provides
a gentle introduction to syntax and a greater level of support in the development of problem solving
skills, tracing skills, and conceptual comprehension of the imperatives of programming. Such a
feature set surpasses the support available in the reviewed systems of this chapter. The central
product of this thesis „Progranimate‟ achieved these features and many more. Progranimate is
introduced and discussed in chapter 4.
3.7 Chapter Summary and Conclusions
Chapter 2 highlighted the novices‟ key difficulties as problem solving, conceptual understanding,
tracing, and the transition from problem specification through to syntactical solution. Chapter 3
(this chapter) discussed how visualisation can help overcome these problems.
It started by discussing why mental models are crucial to building understanding in programming
and showed that students who have not developed a mental model, or have developed an unviable
one, are significantly disadvantaged. It was concluded that the lack of an appropriate mental model
is a factor in the conceptual difficulties and weak problem solving and tracing skills of novice
programmers. Therefore, the formation of accurate mental models should be a key goal of an
introductory programming course.

Mental Models, Learning Styles and Program Visualisation Chapter 3 – Visualisation
Page 79
Another factor in a novice‟s comprehension of programming is their learning style. The research
discussed showed that when mismatches exist between the style of instruction and a learner‟s
preferred learning style, less learning occurs. Research has shown that in programming instruction
there is a mismatch between the predominantly textual representations of programming and the
majority of students‟ visual learning preferences. Only the minority of learners have a verbal (textual
and aural) preference which means that typical programming instruction favours the minority. A
solution to this is to present programs both textually and visually to equal measure; this way both
the visual and verbal learners are equally favoured and the learning potential is maximised for all.
This is one of many ways visualisation can help the novice programmer.
Visualisation can provide the novice with an accurate mental model of the imperative programming
concepts, whilst addressing the needs of visual learners. A dynamic visualisation has the benefit of
being editable and capable of conveying the dynamic nature of a running program. Thus,
visualisation can help the novice develop a working mental model and therefore a better
understanding of programming. However, the presence of visualisation is not a guarantee of
increased learning, as a large number of systems have been ineffective. It was shown that
visualisations which actively engage learners have a much higher success rate than those the learner
passively watches. Cognitive economy is also important; if the visualisation consumes additional
cognitive resources it will be ineffective. To maximise efficacy a visualisation must be directly
relevant, quick and easy to learn, minimise load on working memory and the amount of extraneous
information that must be learnt. Leveraging the learners‟ existing knowledge is one way to reduce
the learning curve of a visualisation. An additional aspect crucial to the success of a visualisation is
its impact on teaching staff that may or may not choose to integrate it within their repertoire. To
encourage its adoption and integration within teaching, the need for additional work should be
minimised or eliminated.
This thesis advocates dynamic flowcharts as an effective visual aid to the learning of programming.
Flowcharts have a small learning curve and can be easily understood with little or no prior training.
They focus on the basic imperatives of sequence, selection and iteration whilst emphasising
program composition and the flow of execution. This allows the novice to focus on overcoming
conceptual difficulties and the development of problem solving skills whilst minimising the impact
of a complex programming language such as Java. Flowcharts also benefit from being widely
supported in existing programming literature. A criticism of flowcharts is that they are hard to
update and need redrawing every time an amendment is made. Another is that they encourage the
use of unconditional jumps and spaghetti logic. However, by enforcing the simple structural rule
that every control structure has only one entry and exit point, a flowchart will remain structured. A

Mental Models, Learning Styles and Program Visualisation Chapter 3 – Visualisation
Page 80
computer based flowchart can overcome both these criticisms, by automatically restricting
flowcharts without user intervention and by ensuring the basic rule of structured programming is
not broken. Therefore, a computer based flowchart maybe an effective visual representation with
which the novices can build programs, minimise the overheads of syntax and focus on problem
solving.
Whilst a flowchart visualisation may help a novice learn programming, an entirely visual system may
have the effect of alienating the verbal learners. Presenting a program both visually and textually (in
equal measure) overcomes this issue. Furthermore, a visual only system will remove the overheads
of syntax, but will not lessen the impact of syntax when it is eventually introduced to the novice.
Systems that generate code, but do not require the novice to write code will provide a gentle
introduction to the syntax of a programming language whilst retaining focus on problem solving,
the flow of execution and comprehension of the underlying fundamentals.
The capability of modern computers means that a flowchart can be dynamic and thus provide a
visual real time model of execution. In addition to being a problem solving aid and model of
program composition, dynamic flowcharts can be used teach mental simulation strategies as
recommended by various authors in chapter 2. They can also demonstrate the semantics of each
programming concept how they interact to form higher level algorithmic concepts. This will also
help prevent the novices from forming misconceptions of the imperative concepts.
A review of fourteen systems considered most relevant to this research shows that many authors
believe flowcharts to be an effective representation for learning the basics of programming. Whilst
these systems possessed useful features in isolation, their other features were either limited, or
poorly designed; no one system has brought these good ideas together in one system.
The central product of this research is Progranimate, a visual (flowchart) and verbal (code) aid for
learning the introductory imperative concepts common to all programming languages.
Progranimate is a platform independent application that offers an animated model of execution,
flowchart programming, code generation, a concurrent visual and verbal representation and much
more. Its range of features and deployment methods greatly surpass the supportive capability and
convenience of existing environments. Progranimate is introduced in the following section (section
4).

A Visual and Verbal Aid for Novice Programmers Chapter 4 – Progranimate
Page 81
Chapter 4 Progranimate
Progranimate
A Visual and Verbal Aid for Novice Programmers
4.1 Introduction
Chapter 2 identified that for various reasons novice programmers often have gaps and flaws in their
conceptual understanding of the imperative programming concepts. It also identified that novices
have significant weaknesses in their ability to trace though and predict the outcome of even small
and simple passages of program code. These are pre-requisite skills of problem solving and
debugging. If the component skills of problem solving and debugging are not being mastered, it
should come as no surprise that novice programmers experience great difficulty composing
solutions to simple programming problems. This chapter introduces the central product of this
research, Progranimate, a flowchart and code based dynamic and visual programming aid for novice
programmers. It has been designed to help novice programmers overcome the difficulties
associated with problem solving and its component skills.
Progranimate was conceived, developed and refined using a blend of formal and action research
methodologies. This research resulted in various successive revisions of Progranimate and
culminated in version 3.5, as discussed in this chapter. The development methodology is covered in
chapter 6. The evolution of Progranimate though successive trials is covered in chapter 7.
4.2 Overview of Progranimate
Progranimate improves on existing flowchart based learning environments by combining multiple
forms of program presentation (side by side standard flowcharts and code) with program creation
features and the synchronised animation of flowcharts and code.
Progranimate allows the user to focus most of their attention on algorithmic problem solving and
the underlying abstractions of programming. This has been achieved by eliminating the necessity of
writing complex and confusing program code and by reducing the learning curve associated with

A Visual and Verbal Aid for Novice Programmers Chapter 4 – Progranimate
Page 82
professional development environments. These distractions can inhibit fundamental understanding
and cloud the problem solving processes at the heart of programming.
Progranimate focuses on using automatically restructured flowcharts to develop computer
programs from which syntactically correct program code is generated in a range of selectable
languages. It allows the user to construct a wide range of programs involving variables, arrays, data
types, assignment, decisions and loops. It is these basics that underpin the development of
programming logic in all languages, even object oriented ones. The aim is to provide the user with
an accurate visual and textual mental model of the programming structures whilst greatly
simplifying the mechanics of program construction. The side by side presentation of the visual and
textual program representations enables the user to draw a correlation between the flowchart and
code representations of a program. This relationship is further emphasised by the two program
views highlighting in synchronisation when their individual program features are clicked.
Progranimate provides the facility to animate its programs. Animation is achieved by highlighting in
turn each step of execution in both the flowchart and code representations. During animation the
effect each program statement has on any variables and array elements used is visualised in a set of
tables called the inspectors. This aims to provide a concrete model of execution and clarify the
semantics of each program construct (and this prevent misconception), whilst fostering tracing
skills.
Progranimate is a platform independent system written in Java. It is therefore capable of running on
any operating system that has installed the Java Runtime Environment (Sun Microsystems, 2009b).
It also requires no installation and is launched over the web via Java Webstart technologies (Sun
Microsystems, 2009d). This means that to start Progranimate all a user need do is follow a web link
contained within Progranimate‟s website (Scott, 2009b). Progranimate then appears to the user as if
it were a locally installed application, external to the web browser that initiated it. This removes the
necessity of installation and updates when Progranimate is used in schools, colleges and universities.
Removing these barriers to its use maximises the potential audience that could benefit from
Progranimate. It also means Progranimate can be easily and consistently accessed in the classroom
or at home.

A Visual and Verbal Aid for Novice Programmers Chapter 4 – Progranimate
Page 83
4.3 The User Interface - Designed for Novice Use
As discussed in chapter 2, professional development environments are ill matched to introductory
programming. Their vast visual and functional complexity greatly increases cognitive load and can
overwhelm and intimidate the novice. Progranimate‟s user interface has been designed to minimise
these problems by being visually and functionally simple, consistent and uncluttered, yet flexible
and pleasing to the eye. This has made Progranimate easy to use and quick to learn and ensures it
adds a minimal cognitive overhead to the programming activities conducted within it.
An image of Progranimate‟s user interface with all its features and constructs enabled is shown
below in figure 4-1. However, Progranimate can be simplified further by turning off unneeded
features, and hiding constructs that have not yet been learnt. The various features and constructs
can also be enabled or disabled by the user at anytime. The features and constructs visible can also
be pre-specified in parameters so that when Progranimate loads in on the user‟s computer, only the
needed features are visible. These parameters are contained in a launching file (discussed further in
section 4.9) which Progranimate reads upon starting. Four examples of this further simplification
are shown in figure 4-2.
Figure 4-1. The Progranimate Environment with All Its Features Visible

A Visual and Verbal Aid for Novice Programmers Chapter 4 – Progranimate
Page 84
Figure 4-2. Further Simplifications of Progranimate
Figure 4-3. The Six Main Parts Progranimate’s User Interface
Progranimate‟s user interface is split into various distinguishable parts, each of which can be hidden
or enabled via Progranimate‟s view menu option. These distinct parts are highlighted in figure 4-3
and are described briefly below.

A Visual and Verbal Aid for Novice Programmers Chapter 4 – Progranimate
Page 85
Workspace (flowcharts and code)
The workspace contains the flowchart and code representations of a program. A user is able to
construct a program by interacting with either the flowchart or the code.
Palette
The palette provides a list of programming concepts and structures that can be selected and added
into the programs contained in the workspace. It also contains edit and delete controls for program
constructs, variables and arrays.
Inspectors
The variable and array inspectors are used to visualise program variables and arrays. At runtime they
visualise the changing state of program data as each step of visual execution is carried out.
Toolbar
This provides access to the most commonly used features of Progranimate, such as saving, loading,
visual execution and scaling of the flowchart.
Menu
This provides access to Progranimate‟s less frequently used features and controls which ensures
Progranimate‟s interface remains simple and clutter free. The file menu provides options for loading,
saving and printing. It also contains a link to the advanced settings panel which can be used to
customise Progranimate. The edit menu provides undo, copy, cut and paste facilities. The view menu
can be used to show and hide various user interface elements shown in figure 4-3. The code generation
menu is used to select the programming language in use, as well as to adjust the font size, style and
code commenting of the code view. Finally the help menu provides access to user documentation.
The IO Console
Used at runtime this popup dialog handles the output of print statements and the user input from
the keyboard. An example of the IO console can be seen in the bottom centre of figure 4-1.
Component Info
Finally the component info screen displays information about the currently selected component
such as its type and any associated expressions.

A Visual and Verbal Aid for Novice Programmers Chapter 4 – Progranimate
Page 86
4.4 A Visual and Textual Representation of Programming
Progranimate‟s program visualisation features are split into three views: the flowcharts, the
generated code and the inspectors for visualising variables and arrays. By presenting its programs
and animated execution features both visually (flowchart) and textually (program code),
Progranimate aims to benefit students with visual, balanced and verbal learning styles (learning
styles were discussed in section 3.3). Furthermore, Progranimate allows users to construct a
program by interacting with either the flowcharts or code. For example, a verbal learner may wish
to turn off the flowchart view entirely, and a visual learner may wish to turn off the code (see figure
4-2). Doing so will not restrict the programming features and capabilities of Progranimate.
However, Progranimate‟s main strength is in having both visualisations displayed at once, that way
an extremely visual learner can strengthen their verbal programming skills by using the visual
flowchart to make the meaning of the code more apparent. The introduction of each programming
concept visually via Progranimate, coupled with the code presentation, aims to prepare visual
learners for engagement with a code only programming environment, whilst clarifying the concepts
for users of all learning styles.
The relationship between the flowchart and code is emphasised by displaying the code and the
flowchart side by side and by synchronising the highlighting of the two representations in
construction and at runtime. The hypothesis of this design is that the intuitiveness of the flowchart
should make the code easier to understand, thus making underlying abstractions and function of the
code clearer to the novice. It also provides a run time model in both the visual and textual program
representations which aims to foster tracing skill.
Figure 4-4 shows these three visualisations and how their relationship with each other is emphasised
via Progranimate‟s bi-directional synchronised highlighting features. The three visualisations within
Progranimate are discussed in the following three subsections.
Figure 4-4. Bi-directional Synchronised Highlighting of the Flowchart, Code and Inspectors

A Visual and Verbal Aid for Novice Programmers Chapter 4 – Progranimate
Page 87
4.4.1 The Flowcharts
As discussed in section in 3.5, structured flowcharts are an ideal way to represent computer
programs to novices. They can be understood with little prior training, and can make clear the
underlying concepts that are often clouded by a programming language such as Java or VB.
Furthermore, their visual nature should appeal to visual learners and so help address the learning
style mismatch of programming courses that predominantly present programming textually.
Progranimate‟s flowcharting features were designed with the background research of chapter 3 in
mind. For this reason the flowcharts of Progranimate always conform to the rules of structured
programming, i.e. every control structure has only one entry and exit point. This rule cannot be
broken by the user. In comparison to unstructured notation a structured flowchart will make the
relationship between the flowcharts and code more apparent (discussed previously section 3.4.2).
This relationship is further emphasised by the flowcharts and code being situated side by side and
by Progranimate‟s synchronised highlighting features. When a piece of the flowchart is clicked,
relevant line(s) of code are also highlighted and vice versa; these features are shown in figure 4-4. A
flowchart should be easier to read than complex computer code of a language such as Java or VB,
especially as novices tend to write code badly. By aligning and synchronising the two views, the
readability and intuitiveness of the flowcharts can be used to make the meaning of the code more
apparent. This aims to help the novice to learn how to read and trace though code. As is discussed
later in 8, the intuitiveness of the flowcharts meant that thirteen year old novices could take their
first steps in programming after roughly 30 minutes of instruction. Furthermore, the opinions of
the pupils suggested that they were learning to understand the code despite only being instructed on
the meaning of the flowchart.
A unique feature of Progranimate is that it uses both colour and text to differentiate between all of
its different component and structure types. Whilst other systems have used coloured flowcharts,
colour has not been used to differentiate between the diamonds of loops and decisions, so at first
glance they could easily be confused. Therefore Progranimate‟s use of coloured flowchart notation
(demonstrated in figure 4-5) is a significant improvement on other systems. The flowchart notation
of Progranimate is based on a subset of the BSI4850 flowchart notation standard (British Standards
Institute, 1987). Using standards compliant notation ensures that when novices learn the notation
of Progranimate‟s flowcharts they are learning transferable skills. Furthermore, it is this notation
that predominates the flowchart notation of programming text books and online learning material.
However, in BSI flowchart notation a parallelogram represents data of no specific source rather
than input and output. BSI4850 has no generic symbol for output or input. There are separate

A Visual and Verbal Aid for Novice Programmers Chapter 4 – Progranimate
Page 88
symbols for output to screen, output to printer, manual input, punch cards and tape. To keep the
notation simple, Progranimate uses the parallelogram to represent input and output. This is a
common convention adopted in most textbooks and online materials. Another addition is that
circles are also used to mark the boundaries of each structure; this is useful especially when nesting
structures. The systems in the literature review do not do this, which can make the boundaries of
the structures represented in their flowcharts unclear and thus increase the likelihood of
misconception and error. These slight derivations from BSI4850 means Progranimate‟s flowcharts
are composed of only five basic shapes: square, circle, diamond, parallelogram, and stadium (not
including links) which aims make them easy to learn, comprehend and memorise.
Defaults Sequence
Start Terminate Print Read Assign
Selection Iteration
If If_Else While For
Figure 4-5. The Flowchart Components and Structures
Progranimate‟s flowcharting features facilitate auto structuring. This means the user simply has to
choose a component or structure and then decide where it will go. The flowchart will then
automatically and consistently restructure itself to tidily accommodate the new construct without
intervention from the user. Auto structuring is also used when deleting, cutting, or pasting program
constructs. The structures if, if else, while and for can be nested in any valid combination
and to any level, though obviously too much nesting is bad practice and should be discouraged.
Auto structuring allows the novice to focus on programming rather than the constant tidying and
restructuring of flowcharts which has been a long standing criticism of flowcharts (Shneiderman et
al, 1977). Figure 4-6 demonstrates an example Progranimate‟s nesting flexibility.
On the far right of Progranimate‟s toolbar a slider marked scale is provided. This allows the user to
set the scale the flowchart is drawn at (0.1 to 300%). This allows the novice to zoom into parts of
the flowchart to view its details or zoom out to fit an entire program on one screen. The flowcharts

A Visual and Verbal Aid for Novice Programmers Chapter 4 – Progranimate
Page 89
of Progranimate may also be printed or saved in popular image file formats. This makes
Progranimate useful as a documentation aid. As an example of this, the image in figure 4-6 was
generated by Progranimate. This image also serves to demonstrate Progranimate‟s nesting
capabilities.
Figure 4-6. Progranimate’s nesting capabilities.

A Visual and Verbal Aid for Novice Programmers Chapter 4 – Progranimate
Page 90
4.4.2 The Generated Code
Chapter 2 identified that a programming language such as Java can present a significant barrier to
the novices‟ mastery of programming and impinge on the development of more crucial and
transferable programming skills such as comprehension of the imperative concepts, tracing skills
and problem solving. Novices tend not to write well structured and indented code, making their
code hard to read and thus learn from, which exacerbates code related difficulties. Subsequently,
they also experience difficulty reading, simulating and predicting the outcome of even small code
passages. As discussed in chapter 2, reading and understanding code is a pre-requisite skill of
writing it, but the reading skills of novices tend to be weak. Therefore, code reading needs more
attention, and the elements of this skill should be learnt before code writing is performed by the
novice.
Whilst reducing the impact of code writing, Progranimate does not eliminate its presence. To avoid
any exposure to program code would do nothing to help overcome code reading weaknesses, nor
would it reduce the impact and steep learning curve of a programming language. The generated
code also means Progranimate can present programs in a way that is in tune with both visual
(flowchart) and verbal (code) learning styles.
Progranimate aims to facilitate a gentle introduction to code and syntax rules whilst retaining a
primary focus on the underlying concepts and problem solving aspects of imperative programming.
Therefore, it does not require users to enter code directly into Progranimate as they would with a
standard development environment. All the user needs to do is decide where in the flowchart or
code a construct should go, then enter an associated expression; the rest is generated from
templates. As each variable, array, component or structure is added, edited or removed, syntactically
correct code is automatically regenerated, indented and refreshed without any intervention from the
user. This gives the novice exposure to a clear well written examples of program code whilst
minimising the overheads of writing it. It also eliminates the possibility of erroneous syntax because
errors are picked when the expressions of program constructs are defined. Therefore, syntax errors
cannot work their way into the resultant generated code which is always correct.
Whilst a novice will eventually produce compliable code, it is often indented poorly and
inconsistently, if at all. Consequently, their poorly indented code is hard to read, comprehend and
modify. This clouds the underlying concepts they are trying to learn and utilise and is a potential
source of misconception and confusion. Unpicking this messy code consumes a lot of cognitive
resources and makes the learning experience less effective. Enforcing good indenting habits is one

A Visual and Verbal Aid for Novice Programmers Chapter 4 – Progranimate
Page 91
public class Graduation
{
public static void main(String[] args)
{
int grade = 57;
if (grade >= 70 )
{
System.out.println("1st Class");
}//End If
else
{
if (grade >= 60 )
{
System.out.println("Two One");
}//End If
else
{
if (grade >= 50 )
{
System.out.println("Two Two");
}//End If
else
{
if (grade > 40 )
{
System.out.println("Third");
}//End If
else
{
System.out.println("Fail");
}//End Else
}//End Else
}//End Else
}//End Else
}//End Main
}//End Class
Figure 4-7. The Generated Code
of many goals within an introductory course. However,
standard development environments do very little to
encourage correct indentation. The code generated by
Progranimate is automatically indented and therefore
very readable. This serves as a good example of well
written code and helps the novice realise the positive
impact that proper indentation has on readability. The
regular use of Progranimate by novices will repeatedly
expose them to well formed, properly indented code.
The intention is that this will be habit forming.
The default language of Progranimate is Java. However,
Progranimate is able to generate its code in a range of
selectable languages that currently includes: Java, Visual
Basic.Net and Visual Basic 6. These languages were
chosen as they are commonly used to teach
programming in Universities, Colleges and Secondary
Schools. Therefore, the potential audience for the tool
is broadened. Progranimate also supports syntactically
simplified visions of these languages called „Pseudo
Java‟ and „Simple Code‟, though these aren‟t covered
within this thesis. Because Progranimate‟s code
generation features are template driven, adding extra
languages at a later date will be a relatively simple
undertaking. Its template driven nature also means that
it is possible to translate a constructed program from
one language to another, a feature not seen in other
systems. To translate the current program to another
language the user merely needs to select a different language in the code generation menu; the
program is then instantly updated.
The code generation menu also provides a range of features relevant to the generation of code.
Besides language selection there are features to adjust the font size, font style, and the level of
commenting in the generated code (none, basic or advanced), which adjusts the level of detail
contained in the comments. Figure 4-7 shows an example of the Java code that is generated by

A Visual and Verbal Aid for Novice Programmers Chapter 4 – Progranimate
Page 92
Progranimate. In this example the commenting level has been set to basic. The code of
Progranimate can also be exported to file so that it can be used in other environments. This allows
Progranimate to function as a test bed so that its users can try ideas out and utilise the code in
whatever other environment they normally utilise in their programming courses. At Glamorgan
Progranimate was used alongside the BlueJ programming environment.
4.4.3 The Inspectors – Designed to aid Tracing
Tracing requires the mental simulation of execution and requires of
the programmer to keep track of a program‟s data. However, due to
the limits of human cognition keeping track of these values without a
manually written table or computer aided debugging tools is almost
impossible, even for an accomplished programmer. Chapter 2
demonstrated that novices have a weakness in their tracing ability and
so need support in their mastery of this skill. Coupled with the
animation of flowcharts and code, Progranimate‟s inspectors aim to
help with this.
The inspectors are basically two tables that are used to hold the
program variables, arrays and their values. Once a variable or array has
been added to a program it will appear in the inspectors. There are two
inspectors in Progranimate, one for variables and one for arrays; these
are shown in figure 4-8. To maximise user interface simplicity, the
array inspector is not shown unless one or more arrays have been
defined.
The inspectors come into play at run time where they visualise the
effect the program has on its data as each step of execution is
performed. During runtime when a variable‟s or an array element‟s value gets updated it is coloured
red for emphasis. Like the flowchart, the highlighting of inspector variables and arrays is
synchronised with the code. Clicking a variable or array in the inspector will cause it and the
relevant line of code to highlight and vice versa. This allows the novice to relate the visual concepts
presented in the inspectors to the code, which otherwise may be more difficult for the novice to
understand and a source of misconception, especially with arrays.
Figure 4-8. The Variable
and Array Inspectors

A Visual and Verbal Aid for Novice Programmers Chapter 4 – Progranimate
Page 93
For the novice, arrays are notoriously problematic and prone to a range of misconceptions and
errors. Common problems include confusing an element‟s value with its subscript, or violating the
bounds of an array. Often students take time to realise that with the zero based arrays, an array of
length 10 consists of elements 0 to 9 not 1 to 10. The array inspector aims to help overcome these
problems by making the nature of arrays apparent. For example, because the array inspector
visualises the length of an array and the index values of each element, it is very apparent that an
array of length 7 is made up of elements 0 to 6; this is shown in figure 4-8. Also because of this the
user should be less likely to violate the bounds of an array. Even if they do, the animation features
of Progranimate make it clear what error has occurred and why. Additionally, because the inspector
makes the index of each element clear the idea of the subscript being used to access these elements
is clear, and can be explained easily by a tutor.
For information on defining variables and arrays see the next section which discusses program
construction.
4.5 Program Construction – Problem Solving Focused
Section 2.4.4 showed that the problem solving skills of novice programmers are weak during and
even after an introductory course in programming. Several authors have pointed out that the
novices‟ key programming difficulty lies in knowing where and how to combine program constructs
to achieve a desired outcome. The overheads of the programming language and complex
development environments distract the novice from developing this skill. It is because of these
overheads that various authors, referenced in section 2.4.4, suggest that more attention needs to be
paid to problem solving and the underlying abstractions of programming.
Via code generation Progranimate‟s program creation features minimise the impact of writing code,
and via auto structuring, the overheads of constant flowchart maintenance. Programs can be
constructed by inserting complete commands and structures (selected via a palette) into either the
flowchart, or code representations. All the user needs to do is define an associated expression. Both
the flowchart and code views then update and restructure themselves simultaneously. This allows
the novice to focus almost all of their attentions on understanding the underlying abstractions and
how they can be combined and utilised in solving programming problems. Furthermore, program
construction can then suit both the visual and verbal learning styles.
The evaluation studies discussed later in the thesis have shown that with Progranimate the learning

A Visual and Verbal Aid for Novice Programmers Chapter 4 – Progranimate
Page 94
curve of program construction is very small, whether it is being used by secondary school pupils or
university students. One evaluation in particular (discussed later in chapter 8) showed that thirteen
and fourteen year old secondary school pupils could use Progranimate in a self guided problem
solving context after roughly thirty minutes of instruction.
This section aims to demonstrate how simple the process of program construction is by providing a
brief overview of the methods involved. However, very detailed information can be found in
Progranimate‟s online manual (Scott, 2009a).
4.5.1 Beginning a Program
When Progranimate begins the user is presented with an empty program showing no variables, no
arrays, only the start and end flowchart components and the class and main method descriptions (or
non Java equivalents) in the code. This is termed Progranimate‟s default state. The default program
name is Untitled, but this can be changed by editing the start component of the flowchart, or
the first line of code. This process is shown in figure 4-9 and can be conducted at anytime to
rename a program within Progranimate‟s workspace. This figure is a clear example of how the
flowcharts of Progranimate can be used to make clear the central purpose of Java‟s otherwise
complex and intimidating code.
Figure 4-9. Naming a Program
At any time the user can clear the current program to start again from scratch. This is achieved by
clicking the new button on the tool bar. Once the button is clicked the user is prompted to enter a
program name and if it is valid, Progranimate resets to its default state but with a new name.
When entered, the program name is validated in accordance with the rules of the selected language.
Should any errors occur, the user is presented with a clearly written error message which precisely
reflects the cause of the problem. For example, if Java was the selected language and the user

A Visual and Verbal Aid for Novice Programmers Chapter 4 – Progranimate
Page 95
entered the program name as 1stGrade, Progranimate would display „Program or class names cannot
start with a numeric character‟. The user would then have to type another name. By obeying the rules of
the selected language precisely Progranimate aims not to be a source of misconception.
4.5.2 Defining Variables and Arrays
One of the first processes in program construction is to define the key variables or arrays you
intend it to work with.
In its variable and array handling features Progranimate supports the use of integer, double,
char, string and Boolean data types. These data types are sufficient for modelling any
number of novice level programs. Throughout Progranimate the data types are displayed using the
nomenclature for the currently selected language, for example, int in Java but integer in VB.
This ensures that Progranimate is completely consistent with the languages it supports and not a
source of misconception.
4.5.2.1 Variables
Adding variables within a program is easy. The user first needs to click the variable button from the
palette. This will cause the variable definition dialog (figure 4-10) to pop up where the variable can
be defined. The variable definition panel has three fields: name, type and value. Firstly, the
variable‟s name must be entered in accordance with the naming conventions of the currently
selected language. For example, in Java this means a variable should begin with a lower case letter,
and consist of only letters, numbers or the underscore. Secondly the user must select one of the
data types via a drop down list. Thirdly and optionally the user can also choose to initialise the
variable with a value. During the definition state any errors are picked up and displayed to the user
beneath the relevant field. Progranimate has been designed so that errors are presented in plain
easily understood English using terms relevant to the novices level of experience. In doing so it
aims to prevent much of the confusion associated with the errors of standard programming systems
and language compilers. An example of the definition dialog‟s error handling features can be seen in
figure 4-11
Once the add button has been pressed and the fields validated, the generated code is automatically
updated with the variables declaration; the variable also appears in the inspector. Variable

A Visual and Verbal Aid for Novice Programmers Chapter 4 – Progranimate
Page 96
declarations do not appear in the flowchart, as they play no part in visualising the flow of execution.
An example of how the code and inspectors relate can be seen in figure 4-12
Figure 4-10. The variable definition dialog
Figure 4-11. Variable Definition Error handling
Figure 4-12. The Inspector Variables and Related Declarations
4.5.2.2 Arrays
Creating an array is almost as simple as creating a variable. The user first needs to click the array
button from the palette. At this point they are then presented with the array definition dialog (see
Figure 4-13). The naming conventions and data type selection are identical to standard variables.
Once a name and data type have been chosen, the user can either specify the size of the array (in
which an empty array of the entered size is created), or they can enter comma separated values (in
which the size is determined by how many values have been entered). As with variables, any errors
are picked up and presented to the user beneath the relevant fields using accurate and clearly written
error messages appropriate to the novice‟s level of experience. Because the errors appear below the
relevant field, and not via a popup dialog that can be simply dismissed, the user does not have to
memorise the error message whilst looking for the cause. This aims to make the error handling
features of the definition panels cognitively efficient. Examples of these errors are shown in figure
4-14.
Once an array has been created it will appear in the array inspector and the generated code, but not
in the flowchart. To maintain application simplicity the array inspector remains invisible until at
least one array has been defined.

A Visual and Verbal Aid for Novice Programmers Chapter 4 – Progranimate
Page 97
When the value field is left empty the code view will update to declare the array. The inspector will
also update to show an array of the entered size consisting of empty elements. When the value field
contains comma separated values the program code will update to declare the array and initialise its
values. The inspector will also update to show a new array containing the entered values within its
elements. Figure 4-15 demonstrates how the arrays appear in both the code and the inspector. Like
variables arrays do not appear within the flowcharts.
Figure 4-13. Array Definition Dialog Figure 4-14. Array Definition Dialog Errors
Figure 4-15. Program Arrays in the Inspector and in Code
4.5.3 Adding Components and Structures to a Program
In Progranimate users can construct a program by interacting with either the flowchart or code
views. This means programs can be constructed with just the code, just the flowchart or both
flowchart and code visible. However, by design Progranimate‟s main strength is in having both
views visible.
In constructing programs Progranimate supports the use of print, read (from keyboard),
Assignment, if, if else, while and for. These imperative concepts are common to almost
all modern programming languages; they will support the construction of any number of novice
level programs. An applied knowledge of these imperative concepts will offer transferable skills
pertinent to programming in any language and will serve as a solid foundation upon which more
complex topics may be learnt.

A Visual and Verbal Aid for Novice Programmers Chapter 4 – Progranimate
Page 98
To add a program construct the user simply selects one from the palette on the left of the user
interface. The user must then choose a place where the new construct will be inserted by clicking
the mouse in either the code or flowchart. If the chosen location is invalid, the user is informed via
a clearly worded error message that pops up. If the location chosen is valid, the user is then
prompted via a component definition dialog (see figure 4-17 for examples ) to enter an associated
expression. The expression required varies depending on the construct selected. A description of
each construct and the expressions permitted can be found in section 4.7. Once entered the user
selects ok; the expression is then validated against the syntax rules of the currently selected
language. If the expression is found to be valid the flowchart and code are automatically and tidily
updated to accommodate the new construct (auto structuring). If the expression is found to be
invalid then the user is informed of their error directly beneath the input field where the error
occurred.
The error messages have been designed to be an accurate description of the error, written using
clear wording relevant to the novices‟ level of programming experience. As with the variable and
array definition dialogs the error messages appear below the field where the error occurred. This
helps the user pinpoint the source of the error and means that they do not have to memorise the
error message whilst looking for the cause, as would be the case if popups were used. This aims to
make the error handling features of the construct definition dialogs cognitively efficient. Examples
of the definition dialogs errors are shown in figure 4-18. Because errors are picked up as each
construct is defined, the generated code and the flowchart will always be syntactically correct. This
ensures that the programs presented by Progranimate are not a source of misconception.
Another way in which cognitive efficiency has been ensured is by employing a consistent functional
and visual design across all definition panels. This reduces the learning curve of Progranimate,
allowing the novice to focus on programming.
Progranimate aims to make the mechanics of program construction as simple as possible. This
allows the user to focus on problem solving and the underlying abstractions of programming, rather
than the mechanics of program construction, be it writing code or constantly re-arranging a
flowchart. To illustrate the simplicity of program construction a diagram is shown on the next page
(Figure 4-16). To fit it on a single page this image has been scaled down. A larger example of this
diagram and others, from the program construction section can be found in appendix B.
.

A Visual and Verbal Aid for Novice Programmers Chapter 4 – Progranimate
Page 99
Figure 4-16. An Example of Program Construction

A Visual and Verbal Aid for Novice Programmers Chapter 4 – Progranimate
Page 100
Figure 4-17. Definition Dialogs for the Assign, While and For Constructs
Figure 4-18. Definition Dialog Error Handling
4.5.4 Creating Partially Complete Programs for Problem Solving by Others
For an instructor it may be desirable to create partially complete programs which are to be
completed by the learner. When defining program constructs it is possible to leave the expression
fields empty. Leaving expressions empty causes validation to be disabled, unless specified otherwise
in the advanced settings.
This provides the possibility for creating and saving partially complete programs that the learners
must load in and complete. Learners can then be tasked with completing the program by entering
the missing parameters or flowchart pieces either from supplied unordered lists or from the
knowledge gained in previous programming activities or instruction. This possibility is used in
Progranimate‟s associated teaching pedagogy and by the online problem solving activities that utilise
this pedagogy (see chapter 5).
4.6 Program Animation
Tracing involves mentally simulating the execution of a program; this requires an understanding of
the interaction between program statements and program variables and their effect on the flow of
execution. The background research presented in chapter 2 has shown that the tracing skills of
novices are weak. This lack of tracing skills prevents the novice from accurately comprehending

A Visual and Verbal Aid for Novice Programmers Chapter 4 – Progranimate
Page 101
and predicting the outcome of even simple programs. If novices
cannot read and comprehend code, it will inevitably impact on
their ability to write and debug programs. Furthermore, this will
inhibit their ability to learn from the code of others (i.e. tutors
and textbooks), or revise the code they have written themselves.
As was also discussed in chapter 2, several authors have stated
that tracing skills need to be specifically taught to novices.
Via the synchronous animated execution of flowcharts and code
and the inspectors, Progranimate can run the programs created
within its workspace. These animated execution features aim to
demonstrate the flow of execution, the semantics of each
programming construct and their interaction with the program
variables, arrays and each other. These features provide the
novice with a real time model of program execution and aim to
teach tracing skills by demonstration.
Animation is achieved by synchronously highlighting each step of
execution in the code and flowcharts. Changes in program
variables and array elements are shown in the inspectors by
highlighting the changed data in red, as shown in figure 4-19.
During animation when conditional structures are reached, their
conditions are evaluated and the flow of execution is diverted
appropriately. When assignment components are reached their
expressions are evaluated and the inspectors are updated.
At run time input and output is facilitated via the IO console.
This allows the output of print commands and input to be
read from the keyboard. The console offers similar run time
experience to a traditional command line driven program. The
console displays the history of previous output and input
commands via a vertically scrollable text field. This gives a user a
run time record of what has been entered and output previously.
It is a significant improvement on environments that use a popup
dialog for input and output where the information is only
Figure 4-19. The Inspectors at
Run Time
Figure 4-20. Program output via
the IO console

A Visual and Verbal Aid for Novice Programmers Chapter 4 – Progranimate
Page 102
displayed momentarily. This also means that Progranimate can be used to output tabular data and
multiple lines of formatted text; this extends its programming flexibility over the other systems
covered in the review of systems. Examples of the IO console and its tabular output are shown in
figure 4-20.
Figure 4-21. The Animation Controls
The animation controls (figure 4-21) are contained within the tool bar and facilitate the following
features.
Run:
This button starts the animation.
Step:
This button allows users to run though the program one step at a time.
Pause:
This button stops the animation on the currently animated flowchart component and line of
code. The animation can be re-started again by clicking pause again.
Stop:
This button stops the animation and allows the user to continue with creation or editing of the
flowchart. When stop is pressed the program variables are reset to what they were before
animation began.
Speed Slider:
This slider controls the speed of animation, 1 is slowest and 10 is fastest. At its fastest speed
Progranimate carries out each step of execution in approximately one tenth of a second. At it‟s
slowest each instruction is carried out at approximately 30 second intervals.
Besides providing a model of execution, by clearly and accurately visualising the semantics of each
programming construct, the animation feature also aims to prevent the formation of conceptual
errors. As the pace of execution is entirely controlled by the users, they will have adequate time to
observe, comprehend and reflect on the effects of each program step. Appendix B section B
provides a visual example of animation; though it is better to see it for yourself in Progranimate
which can be accessed at its website (Scott, 2009b).

A Visual and Verbal Aid for Novice Programmers Chapter 4 – Progranimate
Page 103
4.7 The Concepts and Structures Implemented by Progranimate
This subsection provides a little more detail on the concepts and structures (constructs) and their
associated expressions that can be used in constructing programs within Progranimate. Its primary
aim is to explain how the programming constructs implemented by Progranimate are used to help
overcome the difficulties of novice programmers.
Progranimate has been designed to support a novice‟s first steps in imperative programming; the set
of constructs modelled by it reflect this. Currently Progranimate supports the use of variables,
arrays, assignments, print, read, if , if else, while loops and for loops. In the future
more advanced concepts such as case statements and functional decomposition may be
incorporated. However, it was decided that before developing more advanced programming
features, the efficacy of the current programming constructs needed to be assured. It is this
assurance process that provides the evaluation section of this thesis (see chapters 8 and 9). In any
case, an applied knowledge of the constructs currently implemented offers a transferable skill set
applicable to any language and solid foundation on which more complex topics can be learnt.
In this section each of the constructs implemented and how they are designed to help the novice
are discussed in turn. Following this, information on the data types, operators and commends
implemented and the expressions possible is provided.
4.7.1 Start and Terminate
The start and terminate components do not appear in the palette and are generated by default as the
first and last components of any program.
Writing the class descriptor and main method in Java (and equivalents in other languages) is an
overhead to even the simplest of programming tasks. Progranimate overcomes this problem by
generating this code automatically. The start and terminate components form the flowchart
equivalent of class and method declarations and the code which marks their boundaries.
Progranimate emphasises this relationship by the synchronised highlighting of flowcharts and code.
Figure 4-22 shows how the highlighting of the flowchart and code is linked. This allows the novice
to make sense of this esoteric code without having to worry about its full meaning; they can simply
conceptualise it as start and terminate and concentrate more on building the program.

A Visual and Verbal Aid for Novice Programmers Chapter 4 – Progranimate
Page 104
The start and end components will provide the foundation for any new program; additional
components are then placed between them. The start component and its associated code are also
used to name a program; this process has been described previously in sub section 4.5.1.
Flowchart Java Visual Basic.NET
public class Untitled
{
public static void main(String[] args) {
}//End Main
}//End Class
Module Untitled
Sub Main
End Sub'Main
End Module'Untitled
Figure 4-22. The correlation between the Start and Terminate components and their code equivalents
4.7.2 Print
The print component is typically one of the first programming constructs a novice will use, i.e.
„hello world‟. However, the syntax used to represent this concept in Java, and to a lesser extent VB,
is unnecessarily complex. Progranimate overcomes this problem making the print command as
easy to use as it should be. When creating a print all the user needs to do is enter the expression
to be printed, the rest is generated automatically.
At run time, the print component will evaluate an associated expression and display the result in
the IO console as it is executed. The print component is able to handle any expression which is
permissible under the rules of the currently selected language and falls within subset of operators
data types, and commands implemented by Progranimate. Entered expressions could be as simple
as a literal string i.e. “Hello World”. Also possible are multiple strings using a concatenation
operator i.e. “Hello” + name. Expressions can also consist of a singular variable such as X.
They can also be mathematical expressions involving more than one variable such as X + Y *
Z. Complex expressions using brackets and array elements are also permitted.
Besides the entry of an expression to print, the print component definition dialog contains
options for print or println (Write or Writeln in VB). This allows print statements to
be made with a new line. The println option displays the string then creates a new line; any
subsequent printing will then begin on a new line. The print option just displays the string; any

A Visual and Verbal Aid for Novice Programmers Chapter 4 – Progranimate
Page 105
subsequent printing will be displayed directly after the last printed character. This is in line with the
semantics of the command line print commands in the languages modelled. By facilitating this
capability the flexibility of Progranimate is increased. Furthermore, it allows the print instruction
to be modelled in its entirety and thus offers greater support to the novice.
An example of the print component and its associated generated Java or Visual Basic code is
shown below.
Flowchart Java Visual Basic.NET
System.out.println("Hello" + name); Console.WriteLine ("Hello" & name)
System.out.print("Hello"); Console.Write ("Hello")
Figure 4-23. The code generated by the Print component
4.7.3 Read
In Java code taking input from the keyboard for assignment to a variable is not a simple task, as
there is no easy and standard way to do it. The inbuilt methods for achieving this are syntactically
intricate and involve between two to three lines of code as discussed previously in section 2.5.2 and
shown in figure 2-2. It is for these reasons that many instructors have written their own libraries for
handling this process. Progranimate overcomes this problem with its code generation features. All a
user needs to do is decide where the read should go, state which variable or array element they
wish the keyboard entry to go in to, and the rest is automatically taken care of. This makes reading
data from the keyboard a simple process that can be covered within the first hour of instruction
along with print and assignment. This means that within a novice‟s first programming lesson
they can begin to build meaningful programs and begin to think about algorithmic problem solving.
The evaluation studies discussed in chapters 8 and 9 have shown that when using Progranimate this
is possible with both university students and secondary pupils aged 13 and above.
At run time, the read component takes input from the keyboard via the IO console. At this time,
animation is halted until data is typed into the console and either the enter key or the on screen
enter button is pressed. The entered data is then validated and if ok assigned to the specified
variable or array element. Entering invalid data (e.g a String when an int is required) does not cause

A Visual and Verbal Aid for Novice Programmers Chapter 4 – Progranimate
Page 106
the program to crash; the user is informed of their mistake and prompted to re-enter. Once the
entered data has been validated, execution continues.
The read component can only take one variable or array element. Expressions are not permitted
in a read component unless the expression forms the array‟s subscript, for example:
anArray[x+(2*y)].
In its generation of the Java read syntax Progranimate supports the BufferedReader, JOptionPane
and Scanner classes. Progranimate also supports the text class provided with the introductory
programming book Java Gently (Bishop, 2000). These four methods are shown in figure 4-24. The
syntax used for reading in Java can be set in the code generation tab of the advanced settings panel
which can be accessed via the file menu. This increases the likelihood that the read syntax of
Progranimate can be aligned with an instructors pre-existing course material and associated
syntactic nomenclature. However, because many instructors develop their own bespoke solutions,
anticipating and supporting them all is currently impractical.
Figure 4-24 demonstrates how the various read components are represented in the flowchart and
various code forms.
Flowchart Java Visual Basic.NET
METHOD A: InputStreamReader in = new InputStreamReader(System.in);
BufferedReader input = new BufferedReader(in)
name = Integer.parseInt(input.readLine());
METHOD B: name = Integer.parseInt(JOptionPane.showInputDialog(null, "Read"));
METHOD C: Scanner input = new Scanner(System.in);
name= input.nexInt();
METHOD D: x = Text.readInt("");
name = Console.ReadLine()
Figure 4-24. The code generated by the Read component
4.7.4 Assign
The background research in section 2.4.1 demonstrates that novices possess a range of

A Visual and Verbal Aid for Novice Programmers Chapter 4 – Progranimate
Page 107
misconceptions relating to the semantics of assignment. Progranimate aims to provide an accurate
model of assignment in its visual execution features.
The assignment component is used to assign the value of an expression into a variable or array
element, providing the expression result is compatible with the data type of the variable to which it
is being assigned. Expressions can be as simple as specifying a literal value i.e. x = 1, or by
assigning one variable/array element to another i.e. x = y. However, Progranimate facilitates the
use of much more complex expressions which when evaluated will conform to the selected
languages rules of operator precedence. Examples of the types of expression permitted by the
assignment component are shown below in figure 4-25 using the Java language syntax.
Figure 4-25. Example Assignment Expressions
When the assign component is executed at run time, the assignment expression is evaluated then
assigned to the relevant variable or array element. The changes to program data are then displayed
in the variable or array inspector. This provides a novice with an insight to the semantics of the
assignment and execution which aims to prevent the formation of inaccurate mental models. Figure
4-26 shows how the Assignment component is represented in flowchart and code form.
Flowchart Java Visual Basic.NET
X = X + 1 X = X + 1
Figure 4-26. The Code Generated by the Assign Component
4.7.5 The Control Structures – If, If_Else, While and For
There are many novice difficulties and errors associated with the control structures used in
programming (i.e. decisions and loops). Frequently occurring Java syntax errors or misdemeanours
include incorrect indentation, misplaced semicolons and misplaced block delimiting brackets or
Examples:
X = Y
X = X + 1
X = X + n[5]
X = Y * (Z+2) – 3
n[x] = n[x] + score;
message = “Your account balance is £” + bal + “p”
canDrinkBeer = age >= 18 && beerCount <= 10

A Visual and Verbal Aid for Novice Programmers Chapter 4 – Progranimate
Page 108
keywords. These such errors have been averted by the code generation features of Progranimate.
The user always gets to see the control structures they create properly indented and consistently
structured; the intention is that this will be habit forming. This also makes the code easier to read
and thus learn from, compared with the messy code novices often write themselves.
In composing control structures, the conditional expressions they contain also present problems.
Common novice mistakes include, off by one errors, data type mismatching, confusion resulting
from the use of logical operators such as AND and OR, and confusions between the equity and
assignment operators. Progranimate minimises the impact of these errors as they are picked up
when the component is being defined, thus they never get through the resultant program code.
In its execution features Progranimate aims to make the semantics of the structures, the flow of
execution and their associated conditional logic very apparent. This makes it easier for the novice to
realise boundary values and thus spot the logic errors in their program designs.
The control structures currently supported by Progranimate are if, if else, while and for.
These structures are common to most programming languages, an applied knowledge of them is
useful for programming in almost any language. These structures are discussed further in the
following four subsections.
4.7.5.1 If
Progranimate‟s if structure is a precise model of the if structures found in almost all third
generation programming languages. Like all Progranimate‟s control structures, it must contain a
Boolean expression that is entered when it is created.
At run time, the if structure directs the flow of execution down one of two paths, based on the
evaluated result of the expression it contains. In the flowchart view the two paths are marked clearly
with the letters T (for true) and F (for false). The false path has no equivalent in the code view,
therefore the flowchart makes visually apparent the notion that the if structure is stepped over
when its condition evaluates to false. This is one of many examples where a flowchart makes clear
semantics not otherwise visually apparent in the code.
Components and sub structures that reside within the if‟s structure can be placed only within the
true path. When interacting with the flowchart, attempting to a add component to the false path of

A Visual and Verbal Aid for Novice Programmers Chapter 4 – Progranimate
Page 109
a standard If will cause a placement error to be generated and displayed.
Figure 4-27 demonstrates how the flowchart and code correlate with respect to Progranimate‟s
highlighting feature. As with all of Progranimate‟s control structures, the flowchart notation uses a
circular end to clearly mark the boundary of the structure.
Flowchart Java Visual Basic
if ( x >= 5)
{
System.out.println (“Hello”);
}
If x >= 5
Console.Writeline(“Hello”);
End If
Figure 4-27. How the Flowchart and Code of the If structure Relate to Each Other.
4.7.5.2 If Else
Progranimate‟s implementation of the if else structure is a precise model of the if then
else then structures commonly found in most programming languages. Like the other control
structures the if else is associated with a Boolean condition when it is first created.
At run time, the if else structure directs the flow of execution down one of two paths, based on
the evaluated result of the expression it contains. In the flowchart view the two paths are marked
clearly with the letters T (for true) and F (for false). Unlike the if structure the if else
represents the true and false paths in both the flowchart and code. Components and substructures
can also be placed on both paths.
To show the user how the if and else sections of the code relate to the flowchart, the if
else structure employs an enhanced highlighting feature. For this structure the left and right sides
of the flowchart diamond and end are liked to different lines of code. Clicking the right side of the
diamond causes its right edge to thicken and its associated if ….. line of code to highlight and vice
versa. Clicking on the left side of the diamond causes its left edge to thicken and its associated
else line of code to highlight and vice versa. A similar behaviour is associated with the structure
ends, whereby the left and right side of the if else‟s flowchart end is linked with different lines

A Visual and Verbal Aid for Novice Programmers Chapter 4 – Progranimate
Page 110
of code. This description may sound complex, but in practice it is very simple and intuitive. Figure
4-28 demonstrates the enhanced highlighting of the if else structure.
Figure 4-28. How the Flowchart and Code of the If_Else Structure Relate to Each Other.
4.7.5.3 While Loop
For novice programmers learning loops presents a significant cognitive challenge especially when
nesting them. Commonly many novice errors stem from the conditional logic they contain, such as
infinite loops or off by one boundary errors which cause one too many or one too few loops. The
visualised execution of loops and the changing state of control variables in the inspector aims to
makes apparent the semantic nature of looping structures and their effect on program flow. This
aims to help the novice foster effective and accurate mental models of looping.
The while control structure is the first of two looping structures implemented in Progranimate.
Like the if and if else structures, the while structure is associated with a Boolean expression
during its definition. Its role is to continually re-direct the flow of control though a set of
components or sub structures, until the expression that controls it evaluates to false. Progranimate‟s
implementation of this control structure provides a precise model of this process.
Progranimate‟s implementation of the while loop is designed to address some of the
misconceptions that novices can form about this structure. Compared with program code,
Progranimate‟s flowchart representation of the while loop conveys much more information
about its semantic nature. For example, in code the loop and exit paths are not shown, which leaves
the semantic nature of the while loop vulnerable to misconception. Coupled with Progranimate‟s

A Visual and Verbal Aid for Novice Programmers Chapter 4 – Progranimate
Page 111
animation features, its while loop implementation demonstrates that the condition is evaluated
once per loop and not continually, which as discussed in chapter 2 is a misconception some novices
can form. Figure 4-29 demonstrates the relationship between the flowchart and code
representations of the while loop and how they are linked for synchronised highlighting.
Flowchart Java Visual Basic
while (x < 10)
{
x = x + 1;
}//End While
While x < 10
x = x + 1
End While
Figure 4-29. The While Loop Representation in the Flowchart and Code Views and How they Relate.
4.7.5.4 For Loop
The For control structure is the second and final looping structure implemented by Progranimate.
The for loop differs from the while loop in that it requires multiple expressions. This is
because in addition to having a loop condition, a for loop initialises and updates a control variable.
DuBolay notes that For loops are problematic because novices fail to understand that behind the
scenes the loop control variable is being updated (Du Boulay, 1988). The author‟s personal
experience in teaching has also shown that the intricacy of the for loop also presents a syntactic as
well as semantic challenge and is prone to a range of misconceptions.
Unlike the other control structures implemented by Progranimate, the for loop differs greatly
between languages such as Java and VB. Progranimate‟s for loop implementation aims to provide
a precise model of both styles of for loop. Figure 4-31 demonstrates these differences and shows
how the code and flowchart are visually linked via Progranimate‟s highlighting feature. Java‟s for
loop is characterized by its three-parameter loop control expression (initialise, condition, update).
This type of for loop is found in nearly all languages such as Java which share a common heritage
with the C programming language. The syntactic and semantic intricacy of Java‟s for loop syntax
makes it prone to error and misconception. For example, when writing Java for loops novices

A Visual and Verbal Aid for Novice Programmers Chapter 4 – Progranimate
Page 112
often get the required order of the parameters mixed up, misinterpret the boundaries of its
condition or the order the parameters are evaluated. Progranimate has been designed to overcome
these coding problems via its code generation features and for loop definition dialogs.
The definition panel for Java‟s for loop splits the entry of the loop parameters into three separate
entry fields labelled: control variable, condition and increment. The order of the parameter entry
fields aims to reinforce the order they appear within Java code. Furthermore, the definition panel
feature makes it impossible to get the order wrong, as any errors are picked up and presented to the
user before the for structure can be added to the program. Progranimate also eliminates other
common declarative errors, as the rest of the for loop syntax i.e. semicolons, brackets and
keywords are generated automatically. Due to the differing syntax and semantics of the Visual Basic
for loop, a different style of definition panel is used when this language is selected. The two
different definition panels for the for loop are shown below in figure 4-30.
Progranimate‟s implementation of the for loop aims to prevent semantic misconception as the
viewer gets to see what goes on behind the scenes. As with the while loop, the flowchart
visualisation of the for loop conveys more information about the nature of loops by displaying the
loop and exit paths, something the code alone does not make apparent. The visual execution of
for loops in Progranimate also aims to make the semantics of this structure clear by showing
when its expressions are used and how they influence the program variables and the flow of
execution.
Figure 4-30. The For Loop Definition Dialogs for Java and Visual Basic

A Visual and Verbal Aid for Novice Programmers Chapter 4 – Progranimate
Page 113
Java Visual Basic
Flowchart Code Flowchart Code
For ( i = 0; i <= 100 ; i = i + 1)
{
System.out.println (i);
}
For x = 0 to 100
Console.writeln(x)
Next
Figure 4-31. The Flowchart and Code Representation of the For Looping Structure in Java and Visual Basic
4.7.6 Construct Expression Handling
The range of expressions that can be associated with the constructs is very diverse. They are
restricted only by the subset of data types, operators, commands and symbols implemented by
Progranimate and by the grammar and syntax rules of the selected language. The data types,
operators, symbols and commands implemented in Progranimate‟s expression handling features are
shown in tables 4-1 to 4-5. Examples of various expressions and the constructs they are compatible
with are provided in table 4-6.
Table 4-1. The Data Types
Java / VB VB Description
int Integer A whole number i.e. 1245
double Double A decimal value i.e. 43.21
char Char A single character i.e. „a‟
String String A string of characters i.e. “Mike”
boolean Boolean A true or false boolean value.
Table 4-2. General Operators, Commands and Symbols
Java / VB VB Description
= = Assignment
+ & Concatenate
.length .length The lengh of an array
( ) ( ) Brackets
[ ] ( ) Aray element reference brackets
/t N/A Tab
/n N/A New line
/ N/A Esape character for when quotes and
double quotes are needed in strings

A Visual and Verbal Aid for Novice Programmers Chapter 4 – Progranimate
Page 114
Table 4-3. Arithmetic Operators
Java / VB Description
+ Add
- Subtract
* Multiply
/ Divide
% Modulus
Table 4-4. Relational Operators
Java Visual Basic.Net Description
> > Greater
< < Less
>= >= Greater or Equal
<= <= Less or Equal
== = Equal
!= <> Not Equal
Table 4-5. Logical Operators
Java Visual Basic.Net Description
&& AND And
|| OR Or
^ XOR Exclusive Or
Table 4-6. Example Expressions
Java Visual Basic.Net Usage
X = X + 1 X = x + 1 Assignment
value = (x*2) + (y*2) value = (x*2) + (y*2) Assignment
nA[x+1] = average / scores.length nA(x+1) = average / scores.length Assignment
x = nA[ y + (x*2)] x = nA( y + (x*2)) Assignment
“Hello” + name “Hello” & name print
“First name: “ +fn+ “Last name” + ln “First name “ & fn & “Last name” & ln Print
“Average ” + (total /scores.length) “Average” + (total / scores.length) Print
aValue aValue Read / Print
anArray[ x ] anArray( x ) Read / Print
x <= anArray.length x <= anArray.length Condition
age >= 18 && age <= 65 age >= 18 AND age <= 65 Condition
(height >= 4.6 || age >= 18) && x > 5 (height >= 4.6 OR age >= 18) AND X > 5 Condition
names[x+1] .equals( “Mike Watkins”) names(x+1) = “Mike Watkins” Condition
4.8 Error Handling
As discussed in section 2.5.2 one of the problems associated with the novice use of professional
development environments and professional language compilers are the error messages generated
by them. The error messages presented by these systems have been designed with professionals in
mind and use far too much technical jargon that is beyond the novices‟ level of programming
knowledge. Furthermore, the error messages generated by these systems are often inaccurate,
misleading or not specific and require significant re-interpretation and background knowledge to
realise the root cause of the error.

A Visual and Verbal Aid for Novice Programmers Chapter 4 – Progranimate
Page 115
Progranimate‟s error handling features aim to overcome many of the difficulties associated with the
novice use of professional programming systems. All of the error messages generated and presented
by Progranimate aim to use simple terms relevant to the novices‟ level of expertise. This aims to
help the novice realise the true source of error and guide them in making the necessary corrections.
The errors of Progranimate can be split into five distinct types: placement errors, syntax and
semantic errors, path testing errors, and run time errors; these are discussed in the sections that
follow.
4.8.1 Placement Errors
Placement errors occur during program construction when a user attempts to add a construct to an
invalid location within the flowchart or code. For example, if a user attempts to add a component
below the terminator, on the false path of a standard if structure, or on the exit and loop
paths of a while or for loop a relevant error is displayed. Placement Errors also occur when a
user attempts to edit or delete something which is not editable or deletable such as the start and
terminate components or flowchart links. Like all errors, these are written so as not to confuse
the novice
4.8.2 Syntax and Semantic Errors
Professional programming environments will not pick errors up on a line by line basis; instead they
present the novice with long lists of often cryptic errors only when they press the compile button.
This can be very de-motivating. Progranimate does not allow this to happen, any syntax errors are
picked up as and when expressions are entered during the definition of constructs, variables and
arrays. These error messages appear in the definition dialogs below the relevant text field where the
error exists. They aim to pinpoint the source of error clearly, precisely and in words relevant to the
novices‟ level of programming expertise. A construct, variable or array cannot be added if errors are
found in the expression entered; a novice may then fix the cause of the error or close the dialog and
continue with something else. This error handling mechanism coupled with the code generation
features ensures that the code displayed by Progranimate is always syntactically correct.
Table 4-7 demonstrates the simplicity and clarity of the error messages produced when entering
invalid expressions in Progranimate against the set of declarations given in Figure 4-32.

A Visual and Verbal Aid for Novice Programmers Chapter 4 – Progranimate
Page 116
Figure 4-32. Example data set for expression error examples
Table 4-7. Expression error examples
Expression Error generated Construct
x = d + 1 Variable d has not been created yet and is not in the inspector. Assign
a = z * 2 The expression generated a double result. It cannot be assigned to a Boolean
variable.
Assign
x + 2 * y An assignment statement needs to have an assignment operator (one of these = )
as the second part of an expression.
Assign
x = x +( y*3 A right bracket is missing. Assign
nZ[x] = 4 The array nZ does not exist. Assign
x = y + 2 The assignment operator is not permitted in Print, While or If statements. Print
x @ y + 2 The symbol „@‟ is not recognised as valid code for the Java language. Print
Hello" + x A double quote is missing from this expression. Print
nA[x Check that a bracket or quote is not missing. Print
2 You cannot use a value for a read. It must be a variable. Read
x + z A read value can only have one variable. Read
nA[b] The index of array nA is invalid. See below for details:
The expression within the array‟s brackets does not result in an integer.
Read
x >= b The types String and int are not compatible for comparison with each other. Conditional
x => b The symbol => is not recognised as valid code for the Java language. Conditional
y >= \ \ is not recognised as valid code for the Java language. Conditional
y * x The result must be a Boolean when constructing conditional expressions. Conditional
££SC "& @#! ££ is not recognised as valid code for the Java language. Conditional
4.8.3 Path Testing to Prevent the use of Undeclared and Un-initialised Variables
A common novice programming error is to attempt to use undeclared variables in their program
code. Progranimate prevents this from happening. A variable cannot be used in an expression
unless it has been declared; doing so will cause an error which informs the user that the variable has
not been declared. Also, variables and arrays cannot be removed from the inspector and code
declaration if they are referenced in a program; attempting to do so will raise an error. A user must
first remove all references to that variable within the program. Also when renaming a variable or an
array in the inspectors, all program references to it are also updated with the new name. This
functionality prevents programs from using undeclared variables and arrays.
Another common error made by novices is to use a declared variable before it has been initialised.
In the early stages of programming study this may stem from the novices not realising the
int x = 0;
int y;
double z = 3.3;
boolean a = false;
String b;
char c = 'M';
int[] nA = new int[10];

A Visual and Verbal Aid for Novice Programmers Chapter 4 – Progranimate
Page 117
sequential nature of computer programs. Later in the novice‟s study of programming this error can
occur because the novice has assigned an initial value within a structure such as a while or if and
attempts to reference it outside this structure, i.e. they have failed to realise a variable‟s scope. In
many instances novices fail to envisage all possible sequences of execution and experience
confusion when such an error is detected by the compiler. In Progranimate before a program can
be executed every path execution is analysed. This checks that there is no possible path of execution
that results in a variable being used before it has been initialised. Any errors are presented to the
user and execution is prevented. Thus the novice must inspect their code or flowchart and trace the
execution path to realise where the error has occurred. The synchronicity between the flowchart
and code aims to make this process easier and help develop tracing skills. An example of this error
is shown below. Future revisions to Progranimate will aim to visualise this path analysis process,
though this will not be covered in this research.
Figure 4-33. Example path testing error
4.8.4 Run time Errors
Run time errors occur during the visual execution of a program when due to bad program design
the semantic rules of the selected language have been broken. For example, when an assignment
causes a variable to exceed its maximum or minimum permitted value, or when the bounds of an
array have been exceeded. When a runtime error occurs execution stops and the user is presented
with an error dialog. An example of the run time error dialog is shown in figure 4-34. Like the other
error types care has been taken to ensure they are clear and meaningful to a novice.
Figure 4-34. A run time error for exceeding an arrays bounds

A Visual and Verbal Aid for Novice Programmers Chapter 4 – Progranimate
Page 118
4.9 Web based access and integration
One clear advantage that Progranimate has over other novice flowchart based programming
environments is its web integration and deployment features. As Progranimate was developed in the
Java language, it can be delivered to the user via the Java Web Start (Sun Microsystems, 2009d) or
Java Applet (Sun Microsystems, 2009a) deployment methods. This allows the environment to be
launched by any online computer with Internet access and Java 1.5. or greater. This deployment
method removes the problems associated with installation and updates. This makes it possible to
access the same environment in and out of the classroom with ease and ensures the end users
always get the latest version. This web based access also reduces the impact of program bugs. When
errors are detected, corrections can be promptly made, then uploaded to the web server and
automatically propagated to users when they next launch Progranimate.
4.9.1 Web Start Deployment
When deployed via Java Web Start (JWS) Progranimate is launched via a hyperlink link contained
within a webpage. Clicking the link causes Progranimate to load into the client computer, appearing
as if it were a regular stand-alone application installed locally. This link is provided within
Progranimate‟s websie (Scott, 2009b) and is shown in figure 4-35.
Figure 4-35. The web link for launching Progranimate

A Visual and Verbal Aid for Novice Programmers Chapter 4 – Progranimate
Page 119
The web link refers to a JNLP (Java Network Launching Protocol) launch file which is located on
the web server. This file contains a pointer to Progranimate‟s program files which are also hosted
on the web server. It also contains several parameters which can be used to customise Progranimate
in many ways. These parameters allow the Webmaster to control many of Progranimate‟s features
such as the selected programming language, level of complexity, and what visualisation features and
controls are enabled. This file can also contain a link to a program file stored on the server, allowing
the environment to automatically load ready made programs, examples or programming exercises as
it is launched. This auto load feature has been used in Progranimate‟s associated problem solving
pedagogy to load up partially completed problems that the user must complete. This pedagogy is
discussed further in chapter 5. The creation of JNLP launch files and parameters within it are
covered in Progranimate‟s manual (Scott, 2009a).
As discussed in section 3.3.3.2, a visualisation contained within an environment that requires the
user to handle extraneous additional information or perform tasks unrelated to the problem detracts
cognition away from the task at hand (learning programming). Visual environments packaged
within a web browser could suffer from this problem. Furthermore, the browser‟s own features
steal valuable screen space from the visualisation tool. The JWS launching method means the end
user gets the benefit of web based platform independence without the overheads of a web browser.
In this respect JWS applications have the same benefits as locally hosted applications. The
launching times for Progranimate are quick and take roughly 30 to 40 seconds on a user‟s first visit,
but considerably less thereafter due to web caching on the client computer.
4.9.2 Applet Deployment
Progranimate‟s applet deployment allows its dynamic visualisations and animations to be viewed
within a web page. The applet has full access to any of the visual elements and features available to
the standalone JWS deployment. In this mode of deployment it is possible to utilise all or a
selection of Progranimate‟s visual features. For example, it is possible to show a simple flowchart or
code only visualisation with simple controls for run, pause, step and stop. This form of deployment
can be used to visualise key concepts and examples within a web based tutorial environment. Figure
4-36 shows examples of how Progranimate can be utilised within a web page.
The applet and JWS deployment makes Progranimate ideal as the centre piece of an online tutorial
covering the imperative concepts of introductory programming. Within each tutorial page
Progranimate makes it possible to visualise and animate the semantics of the programming

A Visual and Verbal Aid for Novice Programmers Chapter 4 – Progranimate
Page 120
concepts under discussion; this will help the novice develop an accurate working model of the
concepts whilst minimising the potential for miscomprehension. Via JWS deployments tutorial
pages can then link to full screen examples or relevant programming problems.
Though the applet deployment methods have been fully developed, this thesis focuses on the use
and evaluation of Progranimate via its JWS deployment methodology. The development of a
complete online tutorial and evaluation of the applet deployment approach is beyond the scope of
this thesis and has been reserved for further work.
Figure 4-36. Examples of applet deployment
4.9.3 The Progranimate Website.
The Progranimate programming environment has been coupled to a dedicated website:
www.glam.ac.uk/progranimate/ (Scott, 2009b). The website offers access to Progranimate via its
JWS and Applet deployment methods, installation links for the Java run time, information about
Progranimate, user documentation, example programs, links to various evaluation materials and
contact information. It also offers a range of 28 programming activities spread over 8 gender

A Visual and Verbal Aid for Novice Programmers Chapter 4 – Progranimate
Page 121
neutral themes that cover sequence, selection, iteration and arrays. Each programming activity is
currently available in one of three languages Java, Visual Basic.NET and Visual Basic 6. These
problems are built arround an associated problem solving pedagogy. This pedagogy and the
programming problems are discussed in more detail in chapter 5. As an example two of the
websites pages are shown in appendix B section D.
The Progranimate website is intended for public use and places no restrictions on access to
Progranimate and the associated programming problems. This has made performing evaluation
activities at other institutions very straightforward, as their computer technicians were not tasked
with pre-installing Progranimate. In almost all cases the required Java Run Time was also pre-
installed therefore Progranimate deployment in other institutions entailed minimal overheads.
Google analytics statistics (Google Inc, 2009) has shown that between 25th of May and the 25th of
June 2009 the website has received 1,055 page views mostly from within the UK, but also the USA,
and to a lesser extent several, other countries.
4.10 Chapter Summary and Conclusions
This chapter introduced the main product of this thesis, „Progranimate‟, a flowchart and code based
programming environment to address the many issues of the novice programmer. A central aim of
its design is to allow the novice to focus on the underlying concepts of programming and the
development of problem solving skills whilst minimising the complexity of the development
environment and the overheads of writing code. Specifically, Progranimate employs flowchart and
code based program construction to provide a visual and textual model of programming whilst
minimising the complexities of writing and structuring code.
However, Progranimate does not overcome code writing difficulty by avoiding it all together; it
aims to provide a gentler introduction to program code in order to reduce rather than defer the
steep learning curve of program code. Progranimate‟s flowcharts are more intuitive easier to read
than complex computer code of a language such as Java or VB. By aligning and synchronising the
flowcharts and code via highlighting, the readability and intuitiveness of the flowcharts aims to
make the meaning of the code more apparent. Furthermore, Progranimate‟s code presentation
provides the novice with exposure to consistent, well formed and syntactically correct code that is

A Visual and Verbal Aid for Novice Programmers Chapter 4 – Progranimate
Page 122
perfectly indented. The code of Progranimate will be easier to read (and thus learn from) than the
poorly structured and indented code a novice would most likely write themselves. In this respect it
is hoped that Progranimate can pass on good programming habits to the novices.
The animation features of Progranimate have been designed to provide the novice with an accurate
model of program execution in flowchart and code form. This feature is enhanced by the variable
and array inspectors and the synchronous highlighting of flowcharts and code. These features aim
to make the semantics of each programming construct, and the program as a whole clearer. This
aims to enable the novice to foster an accurate understanding of program execution in both the
visual and code representations and thus improve their tracing and debugging skills.
Besides making the underlying abstractions of programming clearer, the flowchart and code
presentation, construction and animation features aim to present programming in a way that
satisfies both visual and verbal learning styles to an equal extent. Furthermore, for the visual
learners, Progranimate may be used to strengthen their verbal skills in relation to programming.
This will help them learn from standard non visual programming environments more effectively.
A review of systems (see section 3.6) has indicated that amongst flowchart based programming
environments for novices, Progranimate is unique. There are currently no platform independent
applications offering unrestricted flowchart based programming and none that offer Progranimate‟s
range of supportive features. Progranimate is also closely coupled with a dedicated website offering
free unrestricted access to it, without the need for installation. The website also contains a range of
fun, gender neutral contextual programming activities to use with Progranimate (these are covered
in chapter 5). Very few of the reviewed systems have a dedicated website, and none offer learning
activities or the level of web integration offered by Progranimate.
Table 4-8 further emphasises the improvements that Progranimate makes on existing systems by
comparing its feature set against the other applications covered in the review of systems. Though
this table does not include all of Progranimate‟s features, it is very clear that Progranimate offers
many more features and a greater level of support for the novice than the other relevant
flowcharting systems reviewed.

A Visual and Verbal Aid for Novice Programmers Chapter 4 – Progranimate
Page 123
Table 4-8. Comparing Progranimate with other relevant systems
Feature BACCII FLINT EC FCI Raptor SFC VL IP DF A&Y B# PG G&G CVF Prograni
mate
Year Published 1992 1999 2002 2003 2004 2004 2004 2005 2006 2006 2006 2007 2007 2009 2005-09
Flowchart * * * * * * * * * * * * * * *
Flowchart based programming * * * * * * * * * * * *
Flowchart generates code * * * * * * * *
Structural rules enforced * * * * * * * * * * * * *
Colour used to fully differentiate
components and structures *
* * *
*
Code * * * * * * * * * * *
Code based Programming *
Code generates flowchart *
Generated code compiles without
modification *
* * *
*
Code and flowchart displayed
Concurrently.
* * *
* * *
Language translation *
Synchronised highlighting of
flowcharts and code
1/2 1/2
* * *
Synchronised visual execution of
Flowcharts and code
*
* *
Non visual execution * *
Visual execution * * * * * * * * * * *
Variable inspector * * * * * * * * *
Strongly typed * * * * * * *
Error feedback * * * * * * * * * * * * *
Java support * * * * *
Variables * * * * * * * * * * * * * * *
Sequence * * * * * * * * * * * * * * *
Selection * * * * * * * * * * * * * * *
Iteration * * * * * * * * * * * * * *
Arrays * * * * * *
Procedures * * * * *
Empirically evaluated * * * * * *
Associated pedagogy * * * *
Web integration * * *
Associated dedicated website * * * * *
Online activities *
OS dependency Win Win Win Win Win Win Win Win Win Indepe
ndent Win Win
Win/
Mac Win
Indepe
ndent

A Pedagogy for Learning with Progranimate Chapter 5 – A Problem Solving Scaffolding Pedagogy
Page 124
Chapter 5 A Problem Solving Scaffolding Pedagogy
A Problem Solving Scaffolding Pedagogy
A Pedagogy for Learning with Progranimate
5.1 Introduction
This chapter introduces a pedagogy designed specifically for teaching the imperative concepts and
problem solving skills of programming via Progranimate. This pedagogy utilises a range of
contextual programming activities covering the concepts of sequence, selection, iteration and arrays.
This pedagogy is underpinned by the theories of scaffolding support and the zone of proximal
development.
5.2 Instructional Scaffolding
The metaphorical term scaffolding was originally coined by cognitive psychologists David Wood,
Jerome Bruner and Gail Ross (Wood et al, 1976) whose work paralleled and built upon the earlier
social development theories of Lev Vygotsky (Daniels, 1996).
In the context of learning, instructional scaffolding represents the helpful guidance and assistance
given to a learner when being introduced to new tasks, concepts and skills. This supportive scaffold
is used to assist the learner in the completion of tasks that they could not otherwise do entirely by
themselves. To facilitate optimised learning potential, this supportive scaffolding is gradually
removed as the learner becomes competent and knowledgeable in the application of a particular
concept, task or skill. Eventually, the aim is for the student to be self-sufficient and capable of
handling the task, skill or concept without any supportive scaffolding. In this context, the
supportive structure is defined as adult guidance or peer collaboration. However, in this
technological age, the supportive structure may also encompass computer-aided instruction.
While the theories of instructional scaffolding have been generally oriented towards the instruction
of younger children, this research hypothesises that scaffolding theories are appropriate for
introducing the imperative programming concepts to all ages of learner.

A Pedagogy for Learning with Progranimate Chapter 5 – A Problem Solving Scaffolding Pedagogy
Page 125
5.3 The Zone of Proximal Development
The zone of proximal development (ZPD) is a concept developed by Lev Vygotsky (Daniels, 1996).
The ZPD is the mid point between what a learner can do without help and what they can‟t do
unless complete (or almost complete) assistance is given. For optimal learning, the tutor (or
supportive instructional environment) should teach towards the mid point of the ZPD. Teaching
too far ahead of the students abilities may overwhelm them. Teaching too close to their current
ability will decrease the amount achieved by the student, which may also have negative motivational
repercussions, for example the learner may become bored and inattentive. In either case, straying
too far from the mid point of the ZPD will decrease the amount learnt. Figure 5-1 below aims to
illustrate the theory behind the zone of proximal development.
Figure 5-1. The Zone or Proximal Development
At all times the instructor (or instructional environment) must provide the minimum amount of
support required for the learner to complete the task or understand and apply a concept. As the
learner gains competence, the level of support (instructional scaffolding) can be reduced through a
series of activities which encompass the task or concept to be learnt. The eventual goal is for the
learner to gain self sufficient competence without the aid of any supportive scaffolding.
Every student learns at their own pace; while one student may progress though a set of activities
quickly, another may not. Therefore, within reasonable limits, learners need to be allowed to
progress at their own rate. Pedagogy based on the theories of scaffolding and the ZPD can cater for
the students‟ abilities on an individual basis. This would be more effective than attempting to find
the middle ground (a one size fits all pace of delivery) for all learners in an instructional group; as
this would inhibit the abilities of the stronger and weaker students of a class.

A Pedagogy for Learning with Progranimate Chapter 5 – A Problem Solving Scaffolding Pedagogy
Page 126
5.4 A Scaffolding Pedagogy
The theories of scaffolding support and the ZPD have been utilised in the development of a
program solving pedagogy for use with Progranimate. The pedagogy is used to gently introduce one
by one the basic imperative concepts of sequence, selection iteration and arrays in a problem
solving context.
The pedagogy is designed to be reiterated once or more times for each imperative programming
concept or scenario in which the concepts can be deployed. For example, when teaching decisions
or loops an instructor may pass through the pedagogy multiple times. Once for a straightforward
use of an If, once again for the basic nesting of an If and possibly a third time for multiple levels
of nesting. For the remainder of this chapter the tutor and instructional environment will be
referred to collectively as the instructor. With each iteration of the pedagogy it is important not to
introduce too many new and complex topics at once. For example, introducing both loops and
decisions for the first time in a single iteration of the pedagogy could lead to cognitive overload.
The pedagogy can be used as a supplement to more traditional modes of instruction; for example,
when introducing new concepts and ideas. It can also be used to introduce a learner to basic ideas
of imperative programming and problem solving.
This cyclic scaffolding pedagogy has been split up into four key steps labelled A to D. These four
stages provide the continuum between concept introduction to independent problem solving skill,
in which the novice will gain an accurate comprehension and applied understanding of the concept
being introduced. These four steps are discussed below.
A. Concept Usage and Demonstration
An imperative programming construct is introduced, discussed and visualised using the
Progranimate programming environment. This gives the novices both a visual and textual model of
the concept being learnt. The animation features of Progranimate reinforce an understanding of
program flow and the semantics of the concepts in both the visual and code representations. This
aims to promote comprehension and prevent the formation of misconceptions. In this stage various
scenarios should be presented to show the novices how the concepts can be utilised. This stage may
also include the demonstration of composite programming concepts involving more than one
construct, such as nesting of decisions, nesting of loops, or the concept of the read ahead while
loop. These composite concepts would be typically introduced via a second pass through the
pedagogy rather than when then individual concepts are first introduced, as this could lead to

A Pedagogy for Learning with Progranimate Chapter 5 – A Problem Solving Scaffolding Pedagogy
Page 127
cognitive overload. This stage is carried out by a knowledgeable tutor who should actively involve
the audience by asking leading questions such as, „what will happen when I run the program?‟, „how
many times will this loop?‟, or „what happens when I enter this value?‟
B. Fully Supported Problem Solving
This stage is broken down into two sub stages which both encompass fully supported problem
solving. Stage B1 involves class wide tutor lead support and stage B2 worksheet guided support. A
tutor can choose to conduct either stage B1 or B2 or both. Conducting both stages is worthwhile
when the learners are completely new to Progranimate and programming or when the topic to be
covered is considered particularly challenging. In both stages, the animation features are used with
the aim of increasing the novice‟s understanding of program statement flow and behaviour,
demonstrating how the program pieces interact to arrive at a desired outcome
B1. Tutor Guided Problem Solving
Using Progranimate, solutions to simple programming problems (that use the concept being
learnt) are presented to the class via a projector. During this presentation, each novice sits at a
classroom computer loaded with Progranimate, which is launched via its website. Solutions to
these posed problems are developed in a step-by-step process in collaboration with the whole
class who copy the actions of the tutor. During this stage the novices should be involved in
discussing and suggesting potential solution ideas. This ensures that learners actively engage in
the learning process and are thus more likely to remember what has been discussed.
B2. Worksheet Guided Problem Solving
Ideally the pedagogy stage B2 worksheets are designed to follow stage B1. However, they may
be conducted in place of stage B1 if a tutor presentation is not conducted. The benefits of the
B2 worksheets are that they allow learners to go at their own pace. The B2 worksheets have not
been designed to merely pose a problem and give the solution, but to also impart the problem
solving skills needed to arrive at the solution. For example, how the problem description can
be used to identify the names and types of program variables, what program constructs are
needed and their order. Also, this activity is a useful way to gently introduce the learners to
Progranimate‟s user interface and how it is used for program construction. The worksheets also
serve as written reminder of Progranimate‟s functionality; the student can look back on them
when encountering difficulty in subsequent exercises. Stage B2 worksheets are much longer
than the other stage‟s problem solving worksheets, as more guidance is given. Typically they are

A Pedagogy for Learning with Progranimate Chapter 5 – A Problem Solving Scaffolding Pedagogy
Page 128
split into six pages as follows: Step 1 – Problem Description , Step 2 – Starting Progranimate, Step 3 –
Naming the Program, Step 4 – Defining the variables, Step 5 - Building the program, Step 6 – Running
and Testing the program.
C. Reducing Problem Solving Support
This stage involves novices applying the tool through a series of approximately four sub-stages,
where at each step the supportive scaffolding provided is gradually reduced.
C1. Fill in the Blanks With Parameter List
In stage C1, the novices are presented with a problem description and a partially complete
program solution in Progranimate‟s workspace. In this partially complete solution, the structure
of the program is complete, but for some or all of the program constructs their parameters and
expressions are missing. From a supplied but unordered list of parameters, the novices need to
decide which constructs the parameters should go in to fulfil the problem specification. The
novice can also be supplied with a table of test data with which they must validate their
solution. This promotes the skills of testing, debugging and tracing ones programs.
C2. Fill in the Blanks Without Parameter List
Stage C2 again presents a similar problem, or one that builds on the solution to the previous
task. Again, some or all of the parameters are missing from the program constructs. However,
this time no list of parameters is given. The novices must decide for themselves what the
parameters are and where they go. Again the novices can be supplied with a table of test data
with which they can validate their solution. In designing a set of problem solving exercises
based on this pedagogy, stage C2 is optional. Depending on the activity, it may be more logical
to go from sub-stage C1 straight to sub-stage C3.
C3. Extend Existing Program with a List of Constructs and Variables
In stage C3 the novices are given a problem specification that tasks them with extending the
functionality of the program constructed in the previous task. For this activity the learner is told
what additional constructs, parameters and variables are needed but not where they go, he or
she must decide this for themselves. Again the learner can be supplied with a table of test data
with which they can validate their solution. This stage may also be repeated whereby the second
time the required additional functionality and the challenge is increased.

A Pedagogy for Learning with Progranimate Chapter 5 – A Problem Solving Scaffolding Pedagogy
Page 129
C4. Extend Existing Program without a List of Constructs and Variables
In the final stub-stage the novices are tasked with extending the functionality of the previous
program yet further. However, this time they are not told what additional constructs, variables
and parameters are needed; they must strive to work this out entirely for themselves. Again, the
novices can optionally be provided with a table of test data with which they are to validate their
solutions. This stage may also be repeated whereby the second time the required additional
functionality and level of challenge is increased.
D. Unassisted Problem Solving
In this stage, the users are presented with one or two similar problems of incremental difficulty.
This time the users are given just a problem description and a blank canvas. The users have to solve
the problem from the ground up, with minimal assistance from the tutor. As with the previous
stage, the provision of test data is an optional extra which will allow the novices to validate their
solutions.
For a single concept or set of related concepts, once a learner has had the chance to pass though
pedagogy stages A to D at least once, they will have had the opportunity to focus on gaining an
applied knowledge of the concepts covered and how they are utilised in programs and problem
solving. Via visualisation and animation, they will have had a better chance of developing an
accurate, working mental model of the concepts being learnt. Via Progranimate‟s code generation,
they will have experience of how they are represented in code. At this point a learner can pass
though the pedagogic model again for the next concept to be introduced. Bear in mind that a single
iteration of this pedagogy is used for introducing a programming concept to novices, and only when
instructional time is limited should this pedagogy be used in isolation. For more thorough
instruction and practice (when time permits), the novice should follow each iteration of the
pedagogy by utilising the concept in a standard code only environment via a more traditional set of
tutorial tasks. After this they can progress to the next concept and iteration of the pedagogy. This
will give the novice practice in writing code and aims to ensure that the learner does not become
reliant on Progranimate. This together with the pedagogy will ensure that all of the component
skills of problem solving and programming are given much more equal prominence. The aim is to
provide the novice with a well rounded skill set, rather than one aspect of programming taking
undue prominence, i.e. too much time spent wrestling with the syntax.
Once an iteration of the pedagogy is complete, the novices will pass through it again to cover the
next programming concept. Each pass through should build on and leverage the novices prior

A Pedagogy for Learning with Progranimate Chapter 5 – A Problem Solving Scaffolding Pedagogy
Page 130
knowledge gained in previous iterations. This aims to reinforce recently gained knowledge and
prevent it from becoming fragile and largely forgotten. Figure 5-2 below provides a visual overview
of this cyclic pedagogy.
Figure 5-2. An Overview of the Cyclic Scaffolding Based Pedagogy
Although each cycle of this pedagogy is shown as a waterfall approach there is some flexibility in
how programming activities can progress though this pedagogic model. For example it is possible
to skip stage C2, jumping directly from stage C1 to stage C3. It is also possible to repeat any stage,
for example stage C4 may be performed twice on consecutive tasks. However, in doing so it is
important that successive activities present either an increased challenge or lower the level of
support given (or both). One concept may also span two iterations of this pedagogy, in which case
in the first iteration stage D may be omitted and in the second iteration stages A or B. This is useful
when the concept being introduced is complex. It is also useful during the initial sequential stages of
instruction when the users will typically be new to programming and need more time to get a feel
for the basic concepts, Progranimate and the problem solving activities. This pedagogy has been
applied to a range of online programming activities which are discussed in the following section.

A Pedagogy for Learning with Progranimate Chapter 5 – A Problem Solving Scaffolding Pedagogy
Page 131
5.5 Online Pedagogic Problem Solving Activities
The pedagogy described in the previous section has been applied to a range of online problem
solving exercises for use with Progranimate. The problems cover the concepts of sequence
(variables, assignment, print and read), selection (if and if else), iteration (while and
for loops) and finally arrays.
The problem solving exercises have been divided into activity packs. Each pack covers an individual
programming concept and encompasses a single iteration of the cyclic pedagogy stages A to D.
Besides aiming to teach the imperative programming concepts, each activity pack has been carefully
designed to be interestingly contextualised, gender neutral and fun. The problem packs encompass
themes such as ordering food from a take away, buying theme park tickets, calculating wages,
handling a VIP guest list and building scoring systems for Olympic events such as gymnastics and
diving to name but a few. These contexts are aimed to be relevant to both secondary school pupils
and students of higher education. This will allow the novice users to hook the concepts being learnt
onto their pre-existing knowledge and experiences. A key consideration in the design of these
problems is gender neutrality. The aim is to make Progranimate and its problems equally inviting to
both females and males. Therefore, stereotypically masculine themes such as football, fishing and
cars have been avoided. In order to provide increased motivation, the activities also incorporate the
use of light humour such as wordplay on well known brands and celebrities.
Currently, the Progranimate website (Scott, 2009b) hosts an ever growing number of problem
solving activities that currently stands at 8 activity packs, which overall encompass 28 individual
problem solving activities. Each activity pack is currently available in the Java, VB.NET and VB6.0
languages. Table 5-1 below provides an overview of the eight contextual problem solving packs.
From looking at the list, it should become clear that there are no problems focusing on the if
else or for structures and fewer problems on loops and decisions in general. The current set of
activities serves as a proving ground for the pedagogy, additional activity packs will be developed at
a later date.

A Pedagogy for Learning with Progranimate Chapter 5 – A Problem Solving Scaffolding Pedagogy
Page 132
Table 5-1. The Problem Solving Activity Packs
Theme Description Stages Conceptual Focus
Themed around a sweet shop, this exercise has been designed to get the user used to problem solving and using Progranimate. It guides the user through the development of a solution to a simple programming problem.
B Sequence Print, Read, Assignment Variables
A set of problems based around a fast-food takeaway. These problems are designed to convey the sequential aspects of programming.
C1,C3,C
4
Sequence Print, Read, Assignment Variables
This set of five progressive sequence based programming problems is themed around an the feeding of animals in an imaginary animal shelter called the Cardiff Animal Shelter.
C1,C3,C
4, D
Sequence Print, Read, Assignment Variables
A set of four problems based around a fictional theme park called Walley World. These problems introduce the concepts of selection and focus on ticket issuing systems and ride height allowance.
C1,C3,
C4, C4,
D
Selection If
A set of four programming problems themed around a fictional supermarket called Insanesbury‟s and the wages one might earn working there. The problems introduce the concepts of looping into the program solutions. Later problems combine the concepts of looping and nesting (of loops and decisions).
C1, C3,
C4, C4,
C4.
Itteration While
To introduce arrays and Progranimate‟s array handling features, this problem is based around a backstage VIP guest list.
B Arrays
The creation of menu and payment systems for a Chinese takeaway. The problems introduce the use of 1D arrays.
C1, C3,
C4, C4,
C4
Arrays
Scoring systems for various Olympic events. These problems cover arrays. Later activities employ a simple sorting mechanism.
C1, C3,
C4, C2,
& D
Arrays
5.5.1 The Activity Pack Worksheets
Most activity packs contain between three to five problem solving worksheets which form stages C
to D of the pedagogy. In addition to these, introductory worksheets are provided and make up
stage B2 of the pedagogy. There are no worksheets for steps A and B1, as this is performed by the
tutor. Before accessing an online worksheet the user can select a language to take it in. Currently,
the website permits Java, VB.NET and VB6. Language selection is shown below in figure 5-3. Also
provided in each worksheet are links to word equivalents of the online problems, so that a student
or tutor may print them out. The stage B2 worksheets are self explanatory and need no
explanation. However, the stage C worksheets are slightly more complex and so are discussed and
demonstrated in the following subsection. Examples of the stage B2 and C worksheets can be
found in appendix C of this thesis.

A Pedagogy for Learning with Progranimate Chapter 5 – A Problem Solving Scaffolding Pedagogy
Page 133
Figure 5-3. Selecting a Language in an Activity Pack Page

A Pedagogy for Learning with Progranimate Chapter 5 – A Problem Solving Scaffolding Pedagogy
Page 134
5.5.1.1 Step C1 & C2 Worksheets
In problems C1 and C2 users are tasked with completing a partially complete solution, where the
program structure is complete, but some or all of the expressions or parameters are missing. These
worksheets utilise hyper linking and Progranimate‟s web integration features to automatically load
Progranimate with the partially complete solution. On these worksheets the image of a partially
complete solution is clickable. This causes Progranimate to start up and automatically load in the
same partially complete problem, which the user must complete. An example of a C1 hyperlinked
worksheet is shown below in figure 5-4.
Figure 5-4. A Typical Stage C1 Problem Worksheet
Problem
Description
Clicking the image
launches Progranimate
with the same
unfinished program
Missing
parameters
(unordered)
Test data for
user validation
(optional)

A Pedagogy for Learning with Progranimate Chapter 5 – A Problem Solving Scaffolding Pedagogy
Page 135
5.5.1.2 Step C3 Worksheets
In step C3 the learners are tasked with extending the functionality of the previous program. They
are told what additional variables, constructs and parameters are needed, but not where they go.
These and subsequent worksheets do not contain hyper linking to partially complete problems, as
the user should have Progranimate open with their solution to the previous task loaded in. An
example of a step C3 worksheet is shown below in figure 5-5.
Figure 5-5. A Typical Stage C3 Worksheet
Problem
description
Additional
variables and
constructs
required.
Unordered list
of parameters
and expressions
Test data for
validation
(optional)

A Pedagogy for Learning with Progranimate Chapter 5 – A Problem Solving Scaffolding Pedagogy
Page 136
5.5.1.3 Step C4 Worksheets
In step C4 worksheets the learners are tasked with extending the functionality of the previous
problem, but without any guidance. These worksheets contain only a problem description and
optional test data and not a list of variables, constructs or parameters. An example of a stage C4
worksheet is shown on the left of figure 5-6.
5.5.1.4 Step D Worksheets
In step D worksheets, learners are tasked with building a program from the ground up. As with step
C4 worksheets, these contain only a problem description and optional test data for validation. An
example of a stage D worksheet is shown on the right of Figure 5-6 below.
The worksheets presented in this section and others are presented in full scale in appendix C.
Problem
Description
Test data
Figure 5-6. Typical Steps C4 and D Worksheets

A Pedagogy for Learning with Progranimate Chapter 5 – A Problem Solving Scaffolding Pedagogy
Page 137
5.6 Pedagogy Use
As was discussed in chapter 3, even a good visualisation tool will seldom be used if it is treated as a
stand alone system and not integrated within the teaching routine and learning resources of a class.
With this in mind, Progranimate and its pedagogy will be most effective when integrated with a
courses teaching repertoire. Below are three ways in which this pedagogy coupled with
Progranimate may be usefully integrated within the teaching of programming.
Firstly, it can be used alongside traditional instruction, when new programming concepts are
introduced to learners. As each new programming concept is introduced, the novice can pass
though the pedagogy one or two times, to gain a good comprehension of the concept being learnt.
The flowchart and code representations of Progranimate will then provide the novice with a visual
and verbal model of the concept. The animation features will provide the novice with a working
semantic model of the concept, which aims to help prevent the formation of conceptual
inaccuracies. The problem solving activities of the pedagogy aim to focus the novice on the
problem solving nature of programming, and thus strengthen the skills which are known to be weak
and underdeveloped in novices. As test data can optionally be provided with each activity, this
forces the novice to analyse the validity of the solution they have come up with. The aim of this is
to promote the skills of debugging which include the ability to read, simulate and trace though the
execution of a program, skills which are also known to be weak. Once Progranimate has provided a
feel for the concept and how it may be used within a program and problem solving, a learner is then
tasked with utilising the concepts in a traditional code only programming environment via more
traditional tutorial tasks. This weaning process ensures that the students do not become reliant on
Progranimate and gives them important practice in writing code. Once the next programming
construct or concepts are introduced, the students will then pass through the pedagogy again, and
as before, be weaned onto a standard code only environment. Progranimate has been trialled in this
context at the University of Glamorgan, the results of which are discussed in chapter 9.
Secondly, within regular instruction it may be used in a remedial context. When a learner is
encountering difficulty with a particular concept, they can then turn to Progranimate and its
relevant pedagogic problems. This will help them gain a visual, textual and functional model of the
concept they are trying to learn and may help clear any up conceptual inaccuracies. Also, if students
have missed a lecture, an iteration of this pedagogy with a particular concept also provides a very
convenient and expedient way to catch up and fill in any potential gaps in their knowledge. This
activity can be supported by providing access to ready made learning materials and programming
problems for use within Progranimate. It could also be administered in a one to one student teacher

A Pedagogy for Learning with Progranimate Chapter 5 – A Problem Solving Scaffolding Pedagogy
Page 138
scenario when a novice‟s difficulty is severe. All of these approaches are currently utilised at the
University of Glamorgan for students experiencing difficulty.
Thirdly, it may also be used to provide an effective but quick introduction to programming in
situations where there is precious time to cover the subject, such as in the high school. In this
situation, Progranimate will convey the most important and transferable aspects of programming
and provide a motivating context for further study of the subject in subsequent school years or at a
higher education level. In this capacity Progranimate has been trialled with high school pupils, the
results of which are presented in chapter 8.
5.7 Chapter Summary and Conclusions
This chapter introduced a pedagogy designed specifically to assist the teaching of the imperatives
first approach to programming. The pedagogy is underpinned by the theories of scaffolding support
and the zone of proximal development. This pedagogy has been coupled with a range of contextual,
fun and gender neutral programming activities designed for use with Progranimate.
In particular, the pedagogy and its worksheets aim to focus the user on developing problem solving
skill, the ability to think abstractly in terms of algorithms and on the transition from problem
specification to resultant program. It also has a strong focus on debugging and tracing. It aims to
strengthen these skills as a side effect of watching Progranimate‟s visualised execution and by using
it (via the test data of the worksheets) to validate the appropriateness of their solutions. Coupled
with this, Progranimate‟s animation aims to provide the novice with a visual and textual mental
model of the imperative concepts in action, to promote a higher degree of comprehension whilst
minimising the potential for misconception.

Formal and Action Research Methods Chapter6 – Methodology
Page 139
Chapter 6
Methodology
Research, Development, and Evaluation Methods
6.1 Introduction
This chapter outlines the research, development and evaluation methods used in defining, refining
and evaluating Progranimate, its associated website, pedagogy and programming problems. It begins
by outlining the development methodology used, then discusses the design of and rationale behind
the evaluation processes used in the following chapters of this thesis.
6.2 Research and Development Methodology
The research that underpins the need, functionality, features and pedagogy of Progranimate
followed a formal research paradigm the outcomes of which form chapters 2, 3 and the first two
sections of chapter 5 of this thesis. Once a preliminary version of Progranimate was developed, the
continual development, evaluation and refinement of its features engaged more with an iterative
action research paradigm. Using this approach Progranimate, the scaffolding pedagogy,
programming problems and website underwent a continual process of evaluation and refinement
which is documented in the remaining chapters of this thesis. Figure 6-1 demonstrates visually the
iterative nature of the action research methodology used.
Figure 6-1. The Blend of Formal and Action Research Methodologies Used
Action research is an umbrella term defining a wide range of agile research practices combining
diagnosis, action, and reflection, in which the researcher is an active participant in the problem
domain. The primary rationale for action research is the notion that those closest to the problem

Formal and Action Research Methods Chapter6 – Methodology
Page 140
are in the best possible position to identify and work towards a solution. In the context of this
thesis, those closest to the problem being addressed are the teachers and learners of programming.
Because the researcher of this thesis is an active participant in teaching programming, the action
research paradigm was seen as an appropriate methodology for the continual research,
development, evaluation and improvement of Progranimate, the scaffolding pedagogy,
programming problems and the associated website. By using an iterative action research based
methodology, the work presented in this thesis has undergone a process of continual improvement
which has been shaped by the opinions, observations and abilities of both learners and teachers of
programming and by the researcher‟s own experiences in teaching programming. Detailed and well
written descriptions of action research and its implications can be found in Cohen et al (2007a) and
McNiff (1988).
The initial development focused on proof of concept to indicate the potential of continued work on
the idea. Subsequent developments evolved various successive versions, the development of which
was informed though evaluation and feedback by targeted user groups. Early usability research
identified the need for easy deployment and for a teaching and learning pedagogy to serve as a
framework for engagement with Progranimate. This has made Progranimate a bundled package for
the learning and teaching of imperative programming and associated problem solving skills in both
schools and university. This continual process of evaluation and refinement has culminated in what
is now Progranimate version 3.5 as introduced previously in chapter 4 and which is used in the
latter evaluation activities of chapters 8 and 9. The diagram below provides an overview of
Progranimate‟s evolution within the formal and action research methodologies used.
Figure 6-2. The Iterative Development of Progranimate via Formal and Action Research

Formal and Action Research Methods Chapter6 – Methodology
Page 141
6.3 Evaluation Methodology
Originally, this research intended to focus on novice programmers at a University Level. However,
soon into the action research phases of this work, an opportunity to use Progranimate with
secondary school pupils arose. From study 2, coupled with the focus groups held at the university
with secondary school teachers of ICT and CS (University of Glamorgan, 2007), it became apparent
Progranimate may be suitable for secondary school pupils. For these reasons the scope of the thesis
aims was extended to include novice programming at university and secondary school levels.
Likewise, the evaluation studies were also targeted at a wider age range, encompassing school pupils
aged 13-17, secondary school teachers, further education college students and degree level
university students (see table 6-1 for a further breakdown). It was felt that if Progranimate was
found to be usable and effective with secondary school pupils, there was a good chance it would
also work at the university level, but much less so the other way around. It was for this reason that
Progranimate‟s efficacy at a pre university level (studies 2 to 7 ) was assured before finally returning
the studies to the original target audience of university students in study 8. Over all the studies, 383
distinct evaluators contributed to at least one of the data gathering techniques used in the
evaluations. A breakdown of this is shown in table 6-1.
Table 6-1. Evaluation Groups
Study Participants Participants
1 Mixed year university students aged 18+ 6
2 School pupils ages 16 to17 12
3 College students ages 16 to 17 32
4 School and college teachers 8
5 School pupils aged 15 to 17 32
6 School pupils aged 13 to 15 41
7 Secondary school teachers 10
8 First year university students aged 18+ 242
Total 383
The approaches taken by the studies of this thesis were as follows:
Test the evaluators‟ problem solving improvements during their exposure to Progranimate, the pedagogy and associated programming activities (school and college studies only),
Observe the users engaging with Progranimate, the pedagogy and programming activities to gain indications of usability and efficacy, and the strategies students employ in using them.
Provide a questionnaire for the evaluators after exposure to Progranimate etcetera to gain their attitudes towards usability and efficacy.
Interview users about usability and efficacy during or after exposure to Progranimate.
Discover the impact Progranimate‟s introduction within teaching has on student grades and the module pass rate at Glamorgan University.
Additional approaches considered and not used were Control and Study Groups and Pre and Post Testing which are discussed in section 6.3.4.

Formal and Action Research Methods Chapter6 – Methodology
Page 142
6.3.1 What Evaluation Data was Collected, How and Why?
As with any computer based learning environment, the evaluation of Progranimate has two key
aspects. Firstly, a consideration in the evaluation of any software application is usability, which
Jacob Nielsen (2003) defines as a quality attribute that assesses how easy user interfaces are to use.
Secondly and of most importance, the learning effectiveness (efficacy) needs to be assessed to
discover if Progranimate is educationally beneficial to novice programmers and if it meets the aims
of this thesis. Every study conducted aimed to gain both usability and efficacy information.
However, as the studies progressed and Progranimate was gradually refined, the emphasis of the
evaluations focused more on efficacy and less on usability.
6.3.1.1 Usability Data
Ascertaining the usability of Progranimate is of utmost importance, as any failings will have an
inevitable impact on one‟s ability to learn from it. For this reason the evaluation activities put
significant energy into discovering any potential usability problems and correcting them in
subsequent improvements to Progranimate. The usability data the evaluations were directed
towards discovering fall under five general areas of interest: ease of use, reliability, error handling,
enjoyment, and finally website related questions. These usability areas were used to establish the
focus of the usability studies and what kinds of questions needed to be addressed by them. These
and their rationale are discussed under five appropriately named headings below. It is important to
note that not all these questions were defined at the same time. Some were added as new features
were developed, or when previous evaluations discovered particular problems that new
developments aimed to deal with.
Ease of use:
Is Progranimate easy to use and therefore a minimal overhead to programming, i.e. can users easily
and quickly accomplish their intended tasks such as program construction, amendment and
execution, even on their first exposure to it? Any problems with ease of use will impact on
Progranimate‟s cognitive economy (see section 3.4.3.2 ) making it less educationally beneficial. For
example, if the users have great difficulty in constructing and executing programs in Progranimate,
their cognitive energies will be focused on the mechanics of Progranimate and not programming.
With these points in mind, the key „ease of use‟ questions asked in the various evaluation studies
were:

Formal and Action Research Methods Chapter6 – Methodology
Page 143
Is the user interface design clear, consistent and appropriate for the inexperienced user?
Is it easy to use and quick to learn even on a novice‟s first exposure?
Is constructing and amending programs quick and easy to achieve?
Can the user focus on programming with minimal distractions from the environment?
Are the execution features clear and easy to use?
Reliability
An important consideration in the design of any software system is reliability, and in Progranimate
this is especially so. Any errors in the user interface, or in the underlying implementation could be a
source of misconception for the novice. For example, if subtle errors were made in its evaluation of
expressions, the flow of execution may be diverted inappropriately, the data output may be
inaccurate, or malformed expressions may go undetected. The users also need to be able to
complete their tasks with a high degree of speed and responsiveness from the user interface. Failure
to achieve this may lead to a degree of user dissatisfaction (Rushinek and S, 1986), which may
impact on their continued willingness to engage with Progranimate. Therefore, the key reliability
areas addressed by the evaluations include:
What bugs exist in Progranimate?
Does Progranimate function in a correct and consistent manner by design?
Does it model the languages implemented precisely?
Is the user interface speedy and responsive?
Error Handling
The correct handling of errors is very important in an e-learnng system. Firstly, novices by their
definition are prone to making many mistakes; secondly they will need support in understanding
what errors they have made and how to correct them; thirdly, a misdiagnosis of the users‟ mistakes
would represent a source of misconception. Therefore, the key error handling questions included
the following.
Are the users informed when every error happens?
Are the error messages a correct diagnosis of the problem that has occurred?
Are the error messages clear and easy enough for a novice to understand?
Can any mistakes be corrected easily?
Enjoyment
Linked to usability is enjoyment; if Progranimate is seen as enjoyable to use, then it is logical to
assume that students will be more motivated to engage with it and reap its potential benefits. Fun

Formal and Action Research Methods Chapter6 – Methodology
Page 144
can have a positive effect on the learning process by inviting intrinsic motivation, suspending one's
social inhibitions, reducing stress, and creating a state of relaxed alertness (Bisson and Luckner,
1996). Therefore, when learning is fun and motivating, one‟s potential for learning is enhanced.
Also, if the users enjoy using Progranimate, then it is likely that they will be more motivated to
engage with it and gain the benefits it may bring them. Therefore, measuring the levels of
enjoyment experienced by the various user groups was of significant importance to Progranimate‟s
success. For these reasons the following questions needed to be addressed.
Do the users enjoy constructing and executing programs?
Do the users enjoy tackling the problem solving tasks?
Website and Online Problem Solving Tasks
It was important to gain some usability indications regarding Progranimate‟s website. This was
intended to discover if the current design is a suitable foundation upon which to undertake further
research and development. As the programming problems are hosted on Progranimate‟s website,
these also fall under this topic. Therefore, the evaluations addressed the following website related
questions.
Is the website easy to get to?
Is it easy for users to navigate though the website?
Are the pages and programming problems clearly laid out and easy to use and read?
Can Progranimate be accessed easily and quickly in and out of the university network where
Progranimate is hosted?
6.3.1.2 Efficacy Data
The efficacy data sought by the evaluation activities was targeted at discovering if Progranimate, the
pedagogy and programming activities can address the thesis aims set out in the introduction.
Obviously, no one evaluation study could address all these aims; therefore this was achieved by
targeting the evaluation activities at various different user groups. Below, each aim is restated under
four separate headed sections. Within each section is a description of and rationale for the data
sought by the evaluation studies. These were intended to address each aim and show how this data
links back to the issues discussed in chapters 2 and 3.

Formal and Action Research Methods Chapter6 – Methodology
Page 145
Aim 1:- To help novices overcome their problem solving and related skill deficiencies and comprehension problems in learning programming.
As highlighted in chapter two, a lack of problem solving skill is a distinct problem of novice
programmers. Effective problem solving ability is the culmination of several prerequisite skills
which by themselves are often difficult and prone to misconception by novices. Therefore, novices
not only need support in improving their problem solving ability, but also in mastering the
knowledge and skills that are prerequisites of it. This difficulty is made worse by the fact that
novices tend to dive straight into the coding and therefore spend a disproportionate amount of time
wrestling with the syntax, leaving other skills lacking attention. Therefore, to help novices improve,
more emphasis needs to be placed on the skills that are not syntax related. Overcoming the
problems discussed above was a primary motive behind Progranimate‟s creation. Therefore, the
most pressing aim of the evaluations was to establish if Progranimate had achieved this fully,
partially or not at all.
At the university level, it was expected that Progranimate would be of most benefit to those
students having difficulty in their studies of programming. It was important to measure how
Progranimate benefited students of different ability levels. From this it can be ascertained whether
Progranimate, the pedagogy and programming problems meet their original aims in helping less
proficient students. This will also reveal if the implications are greater i.e. Progranimate is an aid to
students of other ability levels and not just those who struggle.
To ascertain how Progranimate benefits its users, it is important to know if it helps with all, some
or none of the concepts and skills it is designed to support. This can identify where improvements
need to be made. It can also determine whether extending the number of concepts implemented is
worthwhile.
Whilst the students may see Progranimate as beneficial (or not) it is important to see how these
benefits compare with that provided by the existing learning support available to the students. This
will establish if integrating Progranimate within the teaching of Programming is worthwhile for a
tutor
Another feature of Progranimate‟s design was to address the mismatch between the computing
students‟ predominantly visual learning preferences and the predominantly verbal (textual and
spoken) teaching style of programming (see section 3.2). This aimed to be achieved by appealing
equally to both styles via its interlinked and synchronised presentation of user constructible
flowcharts and code. Therefore, there was an obvious need to evaluate this aim. This analysis of

Formal and Action Research Methods Chapter6 – Methodology
Page 146
learning styles was targeted at the university evaluations only, as they a contained greater number of
participants and ran over a much longer period than any other study.
With the above paragraphs in mind to evaluate this aim the fivee questions below were addressed in
the evaluation activities.
Does Progranimate as a whole and its features (i.e. flowcharts, code, animated execution etc)
help novices overcome their conceptual difficulties, knowledge of run time processes and
syntax?
Can Progranimate focus the novice on problem solving and does it improve problem solving
skill?
Is Progranimate helpful in all, some or none of the Programming concepts and skills it aims to
support?
How does Progranimate compare against existing learning resources, development systems and
help available to the students?
Can Progranimate address the mismatch between the computing students‟ predominantly
visual learning preferences and the predominantly verbal (textual and spoken) teaching style of
programming?
Aim 2:- By improving student ability increase the pass rates and grades of students studying introductory programming at Glamorgan
A straightforward and effective way to evaluate Progranimate‟s efficacy in improving student ability
is to analyse how it impacted module marks. This process can be conducted by comparing the
grades and pass rates of the introductory programming module in the years Progranimate was and
was not used (see sections 6.3.2.4 and 9.5.9 for more detail). Therefore this aim asks the following
question:
At the university level, it was expected that Progranimate would be of most benefit to those
students having difficulty in their studies of programming. It was important to measure how
Progranimate benefited students of different ability levels. From this it can be ascertained whether
Progranimate, the pedagogy and programming problems meet their original aims in helping less
proficient students. This will also reveal if the implications are greater i.e. Progranimate is an aid to
students of other ability levels and not just those who struggle.

Formal and Action Research Methods Chapter6 – Methodology
Page 147
Does Progranimate‟s integration within teaching improve the pass rates and module marks of a
Java based imperatives first introduction to programming course?
What ability levels (if any) are affected by Progranimate and which are affected the most?
Aim 3:- To provide an effective and motivating way to introduce programming to secondary school pupils.
As discussed in chapter 2 the quality of programming tuition in secondary schools varies greatly,
and in many instances it is avoided altogether, even in GSCE and A-Level computer science
subjects. If programming is not being represented well, how can school pupils make informed
choices about studying the subject further? Furthermore, poor teaching of the subject may depict
computer programming (and computing in general) as a boring subject and thus, as far as continued
study and interest is concerned, do more harm than good. Therefore, the evaluation of
Progranimate‟s efficacy in relation to secondary pupils needs to encompasses two key themes,
learning effectiveness and motivation. This can be summarised by the following two questions
which were used to focus the data gathering methodologies of the secondary school studies.
Are Progranimate, its features, associated pedagogy and programming activities effective in
introducing programming and problem solving to secondary school pupils?
Are Progranimate, its features, associated pedagogy and programming activities a fun and
motivating way to introduce programming in secondary schools?
Aim 4:- To make teaching programming in secondary schools a more appealing option for teachers and thus less likely avoided.
Related to the previous aim, this aim addresses the impact of Progranimate, the pedagogy and
associated programming activities on the secondary school teacher. As discussed in chapter 2, the
reasons for the poor quality and often avoided introduction of programming in secondary schools
are the skills, confidence and time of the teacher. Therefore, even if proven to be effective in
teaching school pupils, a tool such as Progranimate will less likely be adopted if from the teachers‟
perspective, it requires too much additional work and a degree of expertise they do not possess.
Therefore, an additional goal in the design of Progranimate, its pedagogy and programming
activities was to make teaching programming a more attractive and convenient option for teachers.
For this reason, the attitudes of the teachers regarding both Progranimate‟s efficacy and its potential
impact on them were sought. For the reasons outlined above, the data sought by evaluating the
teachers aimed to address the following four themes:

Formal and Action Research Methods Chapter6 – Methodology
Page 148
Do the teachers consider Progranimate to be an effective and motivating way to teach
programming in secondary schools?
Do the teachers feel they have the skills and confidence to teach programming via
Progranimate and the programming activities of the scaffolding pedagogy?
Do the teachers feel teaching programming via Progranimate, the pedagogy and programming
problems is within the capabilities of the secondary school ICT/Computing teacher?
How do Progranimate, the pedagogy and programming problems impact the workload of the
teacher, and is this workload a barrier to its use?
6.3.2 How was the Data Collected?
This section presents an overview and rationale for the methodologies used gain the evaluation data
(discussed in the previous section) from the various studies presented in this thesis. Also discussed
are the reasons why „pre and post test‟ and „study and control group‟ style evaluations were not used
in the evaluation activities of this thesis.
For each and every study presented in this thesis, both subjective (opinion based) and objective
(fact based) data was gathered to evaluate Progranimate. Whilst a study may provide objective data
that shows Progranimate is beneficial to a novice‟s programming skill, research has shown that user
adoption and usage of an IT innovation is ultimately determined by their attitudes towards it
(Venkatesh and Davis, 1996) Therefore, if the target audience are largely disinclined to use
Progranimate, it cannot be considered effective, as any potential benefits it may bring will be lost.
For this reason it is important to gather the users‟ attitudes towards the Progranimate, the pedagogy
and programming problems in addition to the objective data. In any case, asking the users is an
effective way to discover not only if Progranimate is helpful but also why. Below a brief overview
and rationale for data gathering techniques used is provided. More technical information into the
mechanics of these methods can be found within each study.
6.3.2.1 Questionnaires
To gain subjective information regarding all aims of this thesis, questionnaires were employed in all
of the studies presented. They were seen as an attractive option because once set up, they are a

Formal and Action Research Methods Chapter6 – Methodology
Page 149
quick and relatively unobtrusive way to gain efficacy data regarding the users‟ attitudes, preferences,
expectations and levels of satisfaction. With questionnaires it is also relatively straightforward to
process and analyse the numerical data gained.
The questionnaires employed within the studies of this thesis utilised a combination of closed and
open question styles. Closed questions provide the range of responses from which the evaluator
must choose. Closed questions are useful because they are very amenable to statistical treatment and
analysis, comparisons can easily be made across groups of respondents and they are quicker to
process than word data (Cohen et al, 2007b). Therefore, where measurement is sought, a closed
question is appropriate for gaining the quantitative data. However, a questionnaire comprising of
entirely closed questions does not allow for unanticipated responses, which subsequently constrains
the data gained only to the response options considered prior to the evaluation. This leaves a risk
that the questionnaire may miss important data not anticipated.
An open ended question requires a written response. Open questions are useful when all the
possible responses cannot be anticipated. This may lessen the risk of missing crucial data relevant to
the question text, as the respondents are free to write anything they feel is relevant. However, open
ended questions take significantly longer to respond too, rely somewhat on the eloquence of the
respondent and may result in irrelevant or redundant data(Cohen et al, 2007b). They are also take
much longer to process than quantitative closed questions and are not so amenable to statistical
analysis, correlation and comparison.
The majority of questionnaires used in the evaluations employed a mix of both open and closed
question styles. However, where the evaluations used interviews as an additional data gathering
technique, the questionnaires consisted almost entirely of closed questions.
Likert
Likert questions (also known as rating scales) are a type of closed question and the most common
question style used in this research. They very useful devices for the researcher, as they build in a
degree of sensitivity and differentiation of response in a quantifiable way (Cohen et al, 2007b).
Likert questions pose statements and a range of response options which consist of related verbs or
adjectives which indicate strength of feeling towards the statement along a continuum, for example
see table 6-2 .

Formal and Action Research Methods Chapter6 – Methodology
Page 150
Table 6-2. Example Likert Questions
I like it when my lecturers use diagrams when they present
ideas that are new to me. (tick one response)
Disagree
Strongly Disagree Undecided Agree
Agree
Strongly
[__] [__] [__] [__] [__]
In my studies of programming the JDeveloper
programming environment is… (tick one response)
Very
Unhelpful Unhelpful Helpful
Very
Helpful
[__] [__] [__] [__]
In the top example of table 6-2 the statement is worded so that a response of “Strongly Agree”
indicates a positive reply. It is possible to negate the questions so that a response of “Strongly
Disagree” is positive. However, it has been recommend that negatively oriented questions should
not be used as they cause have a greater tendency to confuse or remain unanswered, especially
when in combination with positively worded questions (Oppenheim, 1992). Therefore, the use of
negatively worded questions has been avoided in this research.
Once all the responses have been collected, the average score per question is calculated by scoring
each question response in a range from 0 to 4 where: strongly disagree = 0, disagree = 1,
undecided = 2, agree = 3 and strongly agree = 4. To make the results more meaningful and
comparable with questions of other scales, the responses are first averaged and then normalised as a
percentage of the maximum possible average score. In this example if we had 100 respondents, the
maximum score would be 400. Therefore, to create a normalised average for the question the
following formula is used :
In this example a 5 point scale (0 to 4) was used, which results in a mid point (2) indicating
neutrality. However, the Likert questions can use other scales, for example 0 to 3 in the second
example of table 6-2, or 0 to 7 when a more fine grained analysis is required. In this example there
is an even number of response options; in this case the mid-point neutral response is not possible.
This means the respondent cannot sit on the fence; the respondent is forced to choose one way or
the other. Both an even and odd number of responses were used in the evaluation studies, though
within a single questionnaire an odd and even number of Likert responses were not mixed.
Where responses to related questions need to be compared, then using the above approach it is also
possible to rank the responses for example in order of respondents‟ preferences. For more detailed
information on the Likert style questionnaire see (Preece et al, 2007a) or (Cohen et al, 2007b).
(un-normalised average * 100)
(number of respondents * highest scoring category)
normalised average =

Formal and Action Research Methods Chapter6 – Methodology
Page 151
Multiple Choice
Multiple choice questions (MCQs) are another example of a closed question. MCQs pose a question
statement and require the respondent to select one option (and sometimes more) from a range of
discrete (i.e. non-overlapping) response choices. This style of question is useful for grouping the
respondents and for measuring response frequencies. Two examples of this question style are
provided in table 6-3.
Table 6-3 Example Multiple Choice Questions
How many times did you use Progranimate without being asked to do so? (tick one response only)
[__] 0 [__] 1-3 [__] 4-6 [__] 7-10 [__] > 10
Which programming concepts did you use in Progranimate? (tick as many as applicable)
[__]Variables [__]Arrays [__]Print [__]Read [__]Assign [__] If [__]If_Else [__]While [__]For
Cohen et al (2007b) warns that care must be taken with this question style as words are inherently
ambiguous, meaning wordy response options may be interpreted differently from one person to
another. To avoid this problem, when this question style was employed, the response categories
were worded simply and used a maximum of two words. Dillman et al (2003) note that the order of
the response items can be a cause of respondent bias, as items earlier in the list can have a greater
weight than those later on. They note that this ordering effect is particularly strong in online
questionnaires and when questioning the respondent‟s uninformed beliefs, for example: “Which of
the following describe the town you live in”. The questionnaires used in this research were paper based.
The multiple choice questions avoided questioning any uninformed beliefs in all but one question1.
Therefore the ordering effect was a negligible issue in the MCQs used in this research.
Dichotomous Questions
This style of question is formatted similarly to an MCQ except that it consists of two opposing
responses, for example: yes and no or male and female. Like any closed question, this style of
question is very amenable to statistical analysis. The responses can also be used as a filter, to group
the evaluator, or to provide alternate paths through the questionnaire, i.e. if no go to question 4.
An example of this question format is provided below.
Table 6-4. Example Dichotomous Question
Have you done any programming before [__] Yes [__] No
1 This multiple choice question (university study Q17) comprised of only three options, so the ordering effect was
negligible. 2 This was useful for identification purposes when the recording were transcribed so that correlations with the

Formal and Action Research Methods Chapter6 – Methodology
Page 152
Open Question
The open question format is useful when all the possible response options cannot be anticipated or
for when the exact nature of the questionnaire is exploratory. For example “What did you like most
about the whole experience of using Progranimate and solving the problems?” or at the end of a questionnaire
“Please leave here any other comments you feel are important”. Following the questions, the respondent is
given the space to write as much or as little as they feel is necessary (within a reasonable limit). This
enables a questionnaire to capture unanticipated data that might otherwise have gone unnoticed, or
clarify the significance of data that might otherwise have been considered unimportant or irrelevant.
A drawback to this style of question is that it takes the evaluator much more time and thought to
complete, which often leads to a refusal to complete them. Therefore, they should be used sparingly
(Cohen et al, 2007b). For this reason the number of open ended questions was restricted.
Hybrid Open and Close Question
In the smaller scale studies, i.e. all but the university studies, a hybrid blend of both closed and open
question styles was used. This consisted of a closed question (such as Likert, MCQ, Dichotomous)
and beside space where the respondent could also add any comments if they wished. These hybrid
questions were designed to enable the questionnaires to pick up a greater number of unanticipated
responses than questionnaires consisting mostly of closed questions. The evaluators were never
expected to fill in every hybrid comments section. They were only expected to use them when they
had something relevant to say that could not be gained by their closed response. In practice this
worked well, with most evaluators filling in at least one of the hybrid comments areas with useful
information. These comments can be found in the appendixes relating to each study where hybrid
questions were used. Two examples of these hybrid question styles are shown below.
Table 6-5. Two examples of the Hybrid Questions Used.
Q Programming is something that interests me. Comments:
Disagree Strongly
[__]
Disagree
[__]
Undecided
[__]
Agree
[__]
Agree Strongly
[__]
Q
Do you or any colleagues teach any computer programming at your school (at any level)? [__] Yes [__] No
If not please tell us why?

Formal and Action Research Methods Chapter6 – Methodology
Page 153
6.3.2.2 Interviews
In addition to the questionnaire, three of the studies (study 3 – college students, studies 4 and 8
school teachers) employed a semi-structured interviewing technique to gain data that can address
the aims of this thesis. The interview is a flexible tool for providing more detailed and qualitative
data than can be achieved via a questionnaire. The interviewer can make full use of the responses of
the interviewees to alter the interview questions or clarify particular points when needed. This
contrasts with a questionnaire where changes cannot be made once the questionnaire has been
delivered (Borg and Gall, 1989a). Also, the exploratory nature of the interview means that much
more unanticipated data can be gathered, which can for example: identify difficulties, gain
suggestions for improvement, influence the design of future studies, or highlight other issues not
envisaged.
The semi-structured interview is one in which the interviewer can use interview questions from a
pre-planned and structured schedule of questions. This schedule can be used to guide the discussion
and ensures a reasonable level of consistency from one interview to the next. However, the
interviewer is not bound by this schedule. When a particular question elicits some interesting data,
the interviewer is free to probe deeper, asking questions not pre-planned that aim to provide further
insight into interesting issues not anticipated in the schedule. For more detailed information on this
interview technique see Preece, Sharp and Rogers (2007a).
As with any interview, care must be taken on how the questions are phrased, or else this could bias
a response. Cohen et al (2007c) suggest that it is important not to presuppose an answer, as the
interviewees‟ tendency to be agreeable can distort the findings. For example: “You enjoyed that
didn‟t you?” would be supposition but “Did you enjoy that?” would not. Interviewees can tend to
hold back useful information if they believe it puts them in a bad light, it may offend the
interviewer or it is not what the interviewer wants to hear, i.e. „actually, your idea really does not
work‟. This issue is called the response effect and is discussed further in (Borg and Gall, 1989c).
Whist this problem is unavoidable, it is possible to minimise its effects. Therefore, care was taken to
brief the interviewees that negative responses are as useful as positive ones and that this was the
most effective way they could contribute to improving the ideas presented to them. Care was also
taken to give the evaluators plenty of time to get their points across, as a rushed interview would
not be relaxed and would reduce both the quantity and quality of the data gained.
In line with the recommendations of (Robson, 2002), the interviews were conducted by using the
following 5 steps.

Formal and Action Research Methods Chapter6 – Methodology
Page 154
1. Introduction:
The researcher introduced himself, and explained why he was conducting the interview, what kind
of data it aims to capture and how this data would be used. At this time the interviewees were
informed that their identities would only be known by the researcher, and that when then the data
was presented their anonymity would be ensured. The interviewees were then informed that the
interview would be recorded on audio tape and that if anyone wanted to opt out, they could do so
now or at any time during the interview. The interviewers were then told that in providing
responses to the questions to be as frank and honest as possible about their own skills and
opinions. Also, they were told that negative responses are as useful as positive ones and that this
was the most effective way that they could contribute to improving the ideas presented to them.
2. Warm-up:
The audio tape recoding process was initiated, and the evaluators were informed. To help the
evaluators feel comfortable with the interview process, the first two or three questions were
designed to be easy and gentle in their inquisitive nature. For example, interviewees were asked to
state their names2, if they had enjoyed visiting the university, if the evaluation experience was fun,
and if they were ready proceed.
3. Main Questions:
The main questions were asked by following the interview schedule and probing further as was
needed; the questions started off gently but gradually moved on to slightly more probing
questions. Alongside the audio recordings, notes were taken regarding any gestures made, for
example: question 5, John Doe pointing at the flowchart. This enabled the transcribing process to
put the responses in context. This overcomes the problem of an audio recording filtering out the
important non verbal communicative aspects of the interview, which is a criticism of Mishler
(1986).
4. Cool Down:
The aim of the warm down is to defuse any tensions that may have arisen in the interview
process. As the main questions were not confrontational in nature, a warm down as described by
Robson (2002) was not required, though the last one or two questions were intentionally easier.
2 This was useful for identification purposes when the recording were transcribed so that correlations with the
questionnaire responses could be made if needed

Formal and Action Research Methods Chapter6 – Methodology
Page 155
5. Closing Session
Finally, the evaluators were thanked for their time and patience in attending the evaluation session
and in conducting the interview. The end of the interview was clearly stated, and the audio
recorder was visibly switched off.
6.3.2.3 Observation
The distinctive feature of observation is that it enables the researcher the opportunity to gather
„live‟ data from naturally occurring situations(Cohen et al, 2007d). Observation is a useful data
gathering technique at any stage during the development a product such as a software application.
Early in design, observation can be used to understand a user‟s needs with regard to the
application‟s usability and feature set; in later stages of development it may be used to investigate
how well a product supports the tasks and goals is was designed for (Preece et al, 2007b).
Observational data gathering was conducted in all but the secondary school teacher evaluations
(studies 4 and 7, due to interviewing and limited time), to support or refute the findings of the other
feedback mechanisms. Prominent and interesting observations were recorded on note paper during
each evaluation session or tutorial. After, they were transcribed more formally to a research diary or
computer based document. These observations were correlated with the questionnaire responses to
help gain insight into the opinions gained. However, many observations were also useful in
themselves, as can be found throughout the results sections of the studies and in particular study 8
(university students) which provided significant opportunities for observational data gathering.
The observational approach taken was an unstructured one, the reasons for which are as follows.
Structured observation takes much time to prepare, but the data analysis is fairly rapid as the
categories for observation have already been decided. However, this approach operates within the
agenda of the researcher and hence might neglect unanticipated phenomena which may be
important. On the other hand, the unstructured approach operates within the agenda of
participants and is therefore more responsive to unexpected phenomena (Preece et al, 2007a). As
the anticipated phenomena were already being captured by the other data gathering methods, it was
thought that the structured approach may be largely redundant. For more detail on structured and
unstructured observation see (Cohen et al, 2007d).

Formal and Action Research Methods Chapter6 – Methodology
Page 156
The observations aimed to capture following:
The strategies the users were employing in utilising Progranimate (when not prompted to do so),
The learning curve of Progranimate,
Any difficulties and confusion associated with the students use of Progranimate, the pedagogy or problems,
Program bugs, typographical errors, and website related issues,
The time taken for the whole class to web launch Progranimate,
By interacting with the users when using Progranimate, gain immediate observational and verbal indications about the benefits it provides a novice programmer.
To summarise, this process was discovering unanticipated information regarding Progranimate‟s
usability and educational benefit that may have been missed via the other data gathering
methodologies.
6.3.2.4 Problem Solving Ability Monitoring
In line with aim one of this thesis, this process aims to provide objective indications that
Progranimate is a benefit to the abilities of novice programmers. So far all the data gathering
techniques discussed gain largely subjective data. This data gathering mechanism aims to gather
objective, quantitative data to measure the effect Progranimate, the pedagogy and the problem
solving activities have on the users‟ problem solving skills. To gather this data two basic methods
were used in the evaluation studies, monitoring of task completion times and monitoring of the
number of problems solved per session. These data gathering methodologies were used in studies
3,5 and 6 (school pupils and college students). They were not employed in the university study
because it was decided that as the students were contributing to the research in other ways, they
needed to focus on learning programming and not on providing data for this research. A brief
summary and rationale for the two approaches used is provided below. More detailed information
can be found in each relevant study.
Task Completion Times
Measuring the improvement in task completion times of learners engaging with problem solving
activities has been demonstrated as an appropriate way to establish the efficacy of a learning aid
or pedagogical approach, for example (Warnalulasooriya et al, 2007, Hearrington, 2009).

Formal and Action Research Methods Chapter6 – Methodology
Page 157
In the evaluation of Progranimate, the pedagogy and associated programming problems, time
taken to solve problems was also used as evidence of learning efficacy. The methodology used
was to gain both the start and finish times of each evaluator as they engaged in a range of
problem solving tasks of the scaffolding pedagogy by using Progranimate. Via the scaffolding
pedagogy, each successive problem increases the level of difficulty whilst decreasing the level of
support provided. Therefore, the efficacy of Progranimate and the pedagogy is established or
refuted by monitoring changes in completion times.
Task Completion Rates
Monitoring of the number of problems completed per lesson is another way in which to
evidence increased learning. If the number of problems solved per lesson by the students (on
average) increases, this can be taken as evidence of learning efficacy, i.e. Progranimate and the
pedagogy have improved the students‟ problem solving skills or the level of motivation.
However, this can only be conducted on evaluation activities that run over more than one
evaluation session. This approach was used in study 3 (college students) only, because it was the
only non university study to run over more than a single session.
A drawback to both these approaches is that it is impossible to attribute the efficacy to either
Progranimate or the pedagogy. Whilst this omission is acknowledged, to achieve such an analysis is
both difficult and time consuming. Four study groups would be needed: 1) Progranimate and
traditional instruction, 2) scaffolding pedagogy and traditional development environment, and 3)
both the scaffolding pedagogy and Progranimate 4) traditional instruction and development
environment. To achieve this analysis, care is also needed to ensure that the four groups consist of
participants with roughly the same level of education, experience and ability. Therefore, using four
groups from four different schools may not achieve this. It would also not be practical or ethical to
split university 100 or so students of a programming course into four groups. This would require
four different tutorial styles, and ensuring the same students turned up to the same tutorial slot each
week, which would be impossible to guarantee. Also, this may disadvantage certain student groups,
and therefore this approach would not gain ethical approval.
However, such a study is viable when the 4 groups involve a very large number of volunteers, i.e. if
each group was made up of 3 high school classes and possibly student volunteers. This would even
out the differences between the groups. However, this would require multiple evaluation sessions
(4*3) which in practice could only be achieved over a long period. Within the time span required to
develop, refine and evaluate Progranimate (i.e. within the expected completion duration of PhD

Formal and Action Research Methods Chapter6 – Methodology
Page 158
research at Glamorgan ) such an elaborate study could not be planned and conducted. However, it
may be an avenue for post doctoral work where the constraints of time are not an issue. Therefore,
to determine the potential worthiness of conducting such an exhaustive study, an indication of the
efficacy of Progranimate and the pedagogy first needs to be sought. This is what the evaluation
methodology discussed in this section aims to achieve.
6.3.2.5 Grade Analysis
In line with aim two of this thesis, this process aimed to discover if Progranimate was improving
the abilities, pass rates and grades of the students who were using it. It also aimed to address one
aspect of aim one, namely which abilities are impacted by and view Progranimate most favourably.
This process was conducted with the Glamorgan students only, as issues outside the control of this
research prevented the release of student data from the other institution involved in the university
studies (Manchester University UMIST campus).
This analysis involved comparing the marks and pass rates of students during and prior to the years
in which Progranimate was used. This can be achieved with a good degree of certainty because in all
the years analysed during and prior to Progranimate‟s introduction, the first year programming
course utilised the same programming language and syllabus.
During the period reviewed, the entry requirements for Glamorgan did increase slightly, but only by
12 UCAS points (6%) each year from 2005 to 2009. Given that an A grade at A-Level is worth 120
entry points and an E grade is worth 40 points, this difference is considered negligible compared
with the grade changes seen in the years Progranimate was used. Also, during the period analysed
there was a change of module leadership; however, this happened two years prior to Progranimate‟s
introduction and is therefore not a factor influencing the module results in the years Progranimate
was used. Therefore, using the methodology outlined above, the following question addresses aim
two.

Formal and Action Research Methods Chapter6 – Methodology
Page 159
6.3.3 Summary of Evaluation Data and Gathering Techniques
Table 6-6 summarises the key evaluation criteria, and data gathering techniques used to address this criteria.
Table 6-6 Summary of Evaluation Criteria and Data Gathering Techniques
No Thesis Aim Evaluation Criteria Gathering Techniques Studies
1
Usability Is Progranimate usable with respect to novice programmers
Questionnaire Observation
Interview
All
2 Usability Is Progranimate easy to use?
3 Usability Is Progranimate reliable and responsive?
4 Usability Does Progranimate handle user errors well?
5 Usability Do the users enjoy using Progranimate, and its associated learning materials
6 Usability Is the website and programming problems usable with respect to novice programmers?
3 and up
7 1 Is Progranimate (as a whole) helpful in supporting the novices‟ learning of Programming?
Questionnaire
Observation
Interview
All
8 1 Are the flowcharts helpful in supporting the students‟ learning of programming?
2 and up
9 1 Is the code generation helpful in supporting the students‟ learning of Programming?
3 and up
10 1 Are the animation features useful in supporting the students‟ learning of Programming?
2 and up
11 1 Does Progranimate focus on problem solving and assist the development of problem solving skill?
Task Completion Times
Task Completion Rates
Observation
3,5,6
12 1 Is Progranimate helpful in all, some or none of the Programming concepts and skills it aims to support?
Questionnaire 8
13 1 How does Progranimate compare against existing learning resources, development systems and help available to the students?
Questionnaire 8
14 1 Can Progranimate address the mismatch between the computing students‟ predominantly visual learning preferences and the predominantly verbal (textual and spoken) teaching style of programming?
Questionnaire + Learning Styles Diagnosis
8
15 2 Does Progranimate‟s integration within teaching improve the pass rates and module marks of a Java based imperatives first introduction to programming course?
Grade Analysis 8
16 2 What ability levels (if any ) are affected by Progranimate? Questionnaire + Gade Analysis
8
17 3 Are Progranimate, its features, associated pedagogy and programming activities effective in introducing programming and problem solving to secondary school pupils?
Questionnaire Observation Interview
4,5,6,7
18 3 Are Progranimate, its features, associated pedagogy and programming activities a fun and motivating way to introduce programming in secondary schools?
Questionnaire Observation
Interview
4,5,6,7
19 4 Do the teachers consider Progranimate to be an effective and motivating way to teach programming in secondary schools?
Questionnaire
Interview
4,7
20 4 Do the teachers feel they have the skills and confidence to teach programming via Progranimate and the programming activities of the scaffolding pedagogy?
4,7
21 4 Do the teachers feel teaching programming via Progranimate, the pedagogy and programming problems is within the capabilities of the secondary school ICT/Computing teacher?
7
22 4 How do Progranimate, the pedagogy and programming problems impact the workload of the teacher, and is this workload a barrier to its use?
7

Formal and Action Research Methods Chapter6 – Methodology
Page 160
6.3.4 Control and Study Groups and Pre and Post Testing
This subsection discusses Control and Study Groups and Pre and Post Testing evaluation
approaches and provides justification for their non-use.
6.3.4.1 Control and Study Groups
A common approach when evaluating the benefit of some treatment, be it a crop fertiliser,
medicine, teaching pedagogy or educational tool is the „controlled experiment‟ (Weiss, 1998)
involving control and study groups. For example, in the context of Progranimate‟s evaluation with
university students, this type of study could be characterised as follows. The study consists of two
groups; a control group receives a traditional mode of programming instruction, and a study group
receives the same approach but with the addition of Progranimate and its pedagogy in lectures and
tutorials. At the end, both groups are tested for their knowledge and ability, and conclusions are
drawn on which approach resulted in a better performance from the students. When such a study
commences, care must be taken to ensure minimal differences exist between the populous of the
control and study groups, so as not to bias the results. Therefore, both groups should on average
have similar educational backgrounds and abilities and be studying at a similar scholastic level. This
can be achieved by randomly assigning participants between the groups. During the study
instructional variances between the two groups should be minimal, with exception to the addition
of Progranimate and the scaffolding pedagogy in the study group‟s instruction. All groups must
cover the same syllabus, utilise comparable tutorial programming tasks and be taught by the same
individuals. This will minimise any instructional variances between the two groups which could bias
the results. After a period of instruction, the control and study groups are then tested, and the
benefits of Progranimate are evaluated by differences in the knowledge and abilities of the two
groups. For this reason, it is not possible to compare and contrast the differences between a control
and study group if each is at different academic levels, for example HND and degree introductory
programming course students or two classes, each at different institutions. To minimise the
differences between the study and control groups, they must be taken from one class, or multiple
classes must be split evenly over the control and study groups.
Whilst such a controlled approach may seem attractive, it does raise some ethical problems when
used to evaluate educational approaches within non voluntary instruction. For example, if
Progranimate transpired to be harmful towards the students‟ educational development, then the
study group would be disadvantaged. Conversely, if Progranimate transpired to be very
educationally beneficial, then the control group would be disadvantaged. This is a form of non-

Formal and Action Research Methods Chapter6 – Methodology
Page 161
maleficence and breaks the British Educational Research Association‟s (BERA) ethical guidelines
for educational research, which state:
“Researchers must take steps to minimize the effects of design that advantage or are perceived to advantage one group
of participants over others e.g. in an experimental or quasi-experimental study in which the treatment is viewed as a
desirable intervention and which by definition is not available to the control or comparison group respectively.”
(BERA, 2004)
For this reason, such an approach would struggle to gain ethical approval. However, to overcome
this problem one could spread such a study over two academic years where year 1 forms the control
group and year 2 the study group. Due to the expected completion times of PhD research in UK
institutions such as Glamorgan and the extent of development required by Progranimate (and
associated contributions) such an approach was impractical to research and pre-arrange.
Furthermore, it was felt that there was too many risks associated with this approach which could
have affected its validity. For instance, there were so many unforeseen and uncontrollable outside
variables that could have affected the intake of students between the two years, for example
changes in government policy and agenda, changes in entry requirements or those of competing
universities and funding changes. At this time the university was also debating changing the first
year programming language, which would have nullified the study. However, it transpired that the
changed between the years were negligible; this allowed a retrospective analysis of the student
grades and pass rates in the years prior to and during Progranimate‟s integration with teaching.
An additional way around this problem is to use a crossover design where after a period of
instruction and subsequent testing, the control and study groups reverse roles for a second period
of instruction and subsequent testing. However, in the context of this research, the concepts
covered in the second period of instruction are more complex. Thus, the learning curve required to
use Progranimate would be steeper in the second period of instruction. Therefore, the participants
of the second phase may be more reluctant to learn and adopt it in their studies. Another threat to
the validity of a crossover study in learning would be that of the maturation effect, i.e. changes in
the learners‟ abilities and confidence over time. For example, if Progranimate proved to be
significantly beneficial in the early stages of instruction, the baseline of the two groups would be
different as the study entered its second phase. Therefore, in the context of this research a
crossover design would bias the results of a study by causing differences between the two groups.
Another way around all these issues is to rely solely on volunteer students from other subjects.
However, those likely to volunteer would tend to be the more studious types; therefore the results
would not represent the reality of a typical programming course. One could argue that the

Formal and Action Research Methods Chapter6 – Methodology
Page 162
„controlled experiment‟ approach would not have raised ethical problems in the studies conducted
with school pupils. However, the sample sizes of each study were too small for reliable comparisons
to be made between two groups. The innate abilities of one or two students would skew the
findings, meaning results could not be depended upon to represent the reality. Also, as discussed
previously, differences in the educational practices of each school could be a source of bias.
For the reasons outlined in this section, a control and study group („controlled experiment‟)
evaluation methodology was rejected.
6.3.4.2 Pre and Post Tests
Another approach to assessing the efficacy of instructional aids and pedagogies are pre and post
tests (Clarke, 1999). In this form of experiment, efficacy information is obtained by testing the skills
and knowledge of the evaluation participants before and after being exposed to the instructional aid
or pedagogy under study. This type of study is often conducted with control and study groups. As
far as this work is concerned, this approach would entail the same preventative problems associated
with control and study groups discussed previously.
However, this type of study does not have to rely on control and study groups; it can be conducted
with a single group to deduce whether or not an instructional aid or pedagogy has resulted in
increased learning and to what extent, this approach is discussed in (Cohen et al, 2007e, Borg and
Gall, 1989b) and for example, utilised by (Stubbs, 2001). This could not be conducted in the
schools evaluations, as the sessions were too short to permit pre-testing, learning and post testing.
At the university level Progranimate was used in tandem with existing teaching practices over a long
period. A Pre and post test will not reveal if any increases in knowledge or ability were the result of
Progranimate‟s introduction or existing teaching practices, unless a control group is used, which for
reasons outlined previously was not a path taken by this research. Retrospectively it was possible
to compare the grades and pass rates of students in the years Progranimate was and was not used.
This analysis made it possible to determine if grade and pass rate changes were attributable to
Progranimate, as there were no other significant changes to the introductory programming module
(other than Progranimate) or its student body in the years analysed.
For the reasons outlined in this section a pre and post test style of evaluation was not adopted.

Formal and Action Research Methods Chapter6 – Methodology
Page 163
6.4 Chapter Summary and Conclusions
This chapter documented the key features, rationale and methodology of the developmental and
evaluative practices used in the initial conception, construction, improvement and evaluation of
Progranimate to what is now version 3.5 as discussed in chapter 4.
The chapter began by outlining the formal and iterative action research paradigms used and why
they were appropriate for this work. By using this research and developmental approach, the work
presented in this thesis has undergone a continual process of improvement which has been shaped
by the teaching experiences of the researcher and the various evaluation studies documented in the
chapters that follow.
Originally, the target audience for this research was novice programmers at the university level.
However, in addition to this, the initial phases of the action research process highlighted
Progranimate‟s potential as an effective and motivating way to introduce programming in secondary
schools. For this reason the original thesis aims and evaluation scope were extended to encompass
all levels of novice programming from the secondary school up to first year university students.
Also included in this consideration were the secondary school teachers of IT who may or may not
choose to adopt Progranimate and the pedagogy within their teaching repertoire.
Once the development methodology and target audience of this work had been discussed, section
6.3.1 turned attention towards the data sought by the evaluation process and how this was targeted
at the four thesis aims. Section 6.3.2 then discussed the various data methodologies that aimed to
address the key questions discussed in section 6.3.1, and why it was important to gain both
subjective opinion and objective facts when evaluating usability and efficacy. Also discussed are the
numerous reasons why the evaluation approach taken in this thesis did not utilise a control and
study group or pre and post test methodologies. These reasons include ethical problems, maturation
effects, the complexity required to ensure a high degree of validity and the time constraints within
which this research was conducted. However, the approach taken aimed to gain strong indications
of Progranimate‟s potential benefit in order to investigate the potential of conducting such a
complex study. If it transpired that Progranimate was of not significant benefit, such an elaborate
and time consuming study would represent a significant waste of resources.
The next section documents the evolution of Progranimate from conception to though various
successive studies and subsequent versions of Progranimate, the pedagogy, associated programming
problems and website.

Formal and Action Research Methodologies Chapter7 – Development and Evolution
Page 164
Chapter 7 How Progranimate was Developed and Refined
Development and Evolution
Progranimate’s Development & Preliminary Evaluation
7.1 Introduction
The section documents the evolution of Progranimate from the initial conception and subsequent
prototype, through the iterative process of action research which lead to the most recent versions of
Progranimate, the pedagogy, associated problem solving tasks and website.
Discussed are the evaluation studies one to four, which are considered the preliminary studies. Via
an iterative process of action research (discussed in the previous chapter) these studies were used to
refine the ideas of the initial prototype (v1.0) though five developmental phases, each a single
iteration of the action research approach taken. The early studies focused on gaining usability data
to influence improvements in the design and function of the user interface. As the studies
progressed and the evaluation activities became more elaborate, attention was paid more to gaining
indications of efficacy. This was achieved via subjective and objective means as rationalised in
chapter 6. This lead to the development of five successive versions of Progranimate (v1.0, v2.0,
v2.5, v3.0 and v3.5) and a refinement of the scaffolding pedagogy, associated programming
activities, and website. This process lead to versions 3.0 and 3.5 which were used in the full scale
evaluation studies (five to eight) of the following chapters 8 and 9.
7.2 Phase 1 - Initial Development and Conception - Progranimate V1.0
The first version of Progranimate was developed purely as a proof of concept system and served as
an indication of feasibility and worthiness of conducting further work on the idea.
Progranimate was originally conceived as a drag and drop or point and click visual flowcharting
tool. This design was based on the hypothesis that a simplified flowchart based programming
environment would allow the novice to focus on problem solving and comprehension of the
imperative programming concepts and their semantics. The original intended audience for this tool
was the University‟s foundation and first year students when taking their first steps in programming.

Formal and Action Research Methodologies Chapter7 – Development and Evolution
Page 165
An early conceptual design of Progranimate is shown in figure 7-1. From this original design idea a
list of requirements were drawn up that defined the initial feature set and the design of its user
interface. These requirements are presented in table 7-1.
Figure 7-1. An Early Conceptual Design of Progranimate
Table 7-1.The Initial Requirements Definition
Functional Requirements Non Functional Requirements Flowchart construction:
Allow the user to create flowcharts from various symbols and
structures that represent the imperative programming concepts
of print, read, assignment, if, if_else and while.
Ease of Use:
The user interface should have a small learning
curve so that the user can focus on the problem at
hand.
Animated Executable Flowcharts:
A program should facilitate the visual execution of a program,
visually animating the flow of execution though the flowchart
whilst facilitating input and output and displaying the changing
state of variables.
Visual Simplicity:
The user interface should be visually uncluttered
and un-intimidating.
Variable Inspection:
Any variable used within the diagram should be declared within
a variable inspection window. This will enable the variables‟
change of state to be observed when the program is in action.
Platform Independence:
The proposed system should be platform
independent making it accessible to as many users
as possible.
Saving and Loading:
It should be possible to save and load programs.
Responsiveness:
The system needs to perform its functions in an
efficient manner.
Edit and Deletion:
It should be possible to edit and delete the program
components and variables.
Enjoyable:
Users should find programming in the proposed
system an enjoyable experience.
Simplified Error Messages:
The error messages should be presented using terms relevant to
the novices level of experience.
An Aid to the Novice:
Most importantly, the environment needs to aid
the novice in learning programming.
This and subsequent versions of Progranimate were developed using the Java language. Java was
chosen due to its platform independence, the high level of technical support available online and in
books, and because the language and its associated development environments could be obtained
for free. Other platform independent languages such as Adobe‟s Flash (Adobe Systems Inc, 2009)

Formal and Action Research Methodologies Chapter7 – Development and Evolution
Page 166
are not free to developers and are quite costly. A drawback to using Java is its relatively slow
execution speed (compared to compiled languages such as C); however, the execution speed of Java
was more than adequate for an environment of this nature.
In the development of this initial pilot version, all of the functional requirements mentioned in table
7-1 were met and even exceeded. As this version was developed only as a proof of concept, the tool
had restrictions in comparison with later versions. For example, no code generation, only simple
expressions were permitted in the constructs, control structures could not be nested, there was no
undo feature and negative numbers were not handled.
Figure 7-2. Progranimate Version 1.0 from Phase 1
7.3 Study One - Preliminary Evaluation with V1.0
In order to assess the feasibility and worthiness of conducting further work on Progranimate, a
simple evaluation exercise was conducted. The results of this study are documented in the following
research paper (Scott et al, 2006) and discussed briefly below. The purpose of this study was to
provide rudimentary indications of usability and efficacy:
Usability was determined though the intuitiveness and ease of use of the application, taking
into account the type of user this tool is aimed at;
Effectiveness was evaluated by assessing the programming tool against its goal of being an
aid to a novice‟s understanding of the basic imperative programming principles;

Formal and Action Research Methodologies Chapter7 – Development and Evolution
Page 167
To evaluate these two aspects, the outcomes of the study were related to seven key questions:
Is the programming tool easy to use and quick to learn?
Does it handle user errors well?
Is it enjoyable to use?
Is this tool helpful in understanding the basics of computer programming?
Is the tool effective?
Is the tool reliable and responsive?
What improvements and changes need to be made?
7.3.1 The Participants
The evaluators consisted of six first year undergraduate students from the University of Glamorgan.
They all had a basic understanding in the use of modern GUI driven desktop computers such as
those employing MS Windows, but none had any previous experience with programming. Though
six evaluators is a very small group, a study conducted by Jakob Nielsen and Kate Landaur
(Nielsen and Landuar, 1993) demonstrated that using six evaluators should result in approximately
90% of the usability problems being detected. In any case, the aim of the study was to serve only as
a rough indication that the design was useable and that continued work on the idea was worthwhile.
7.3.2 Evaluation Method
The evaluation was conducted by exposing the evaluators to the system for approximately 30
minutes each. The evaluations were conducted in an informal setting one evaluator at a time.
Following basic instruction in how to use the tool and a few programming concepts, the
participants were asked to solve some simple programming problems (see appendix D). Feedback
was then gained in the form of a four point Likert style questionnaire that posed questions the
respondents could either agree or disagree with. Each statement is worded so that a response of
“Strongly Agree” indicates a positive reply. The average score per question was then calculated by
scoring each question response in a range from 0 to 3 where strongly disagree = 0, disagree = 1,
agree = 2 and strongly agree = 3. To make the results more meaningful, each result has also been
calculated as a percentage of the maximum possible average score. Sharp, Rogers and Preece are a
useful source for more information on the Likert style questionnaire (Preece et al, 2007a).

Formal and Action Research Methodologies Chapter7 – Development and Evolution
Page 168
7.3.3 Results
The responses to this questionnaire have been averaged (Ave) and are also shown as a percentage
of the maximum possible average of 4 (Ave%). These are shown below in table 7-2. To assess the
feedback gained, the responses have been related to the seven aspects posed earlier.
Table 7-2. Evaluation Results for Study One
Q Question Ave % Ave Median StDev 0 1 2 3
1 Its very clear to you what this program does 77.8 2.33 2 0.52 0 0 4 2
2 The program is easy to use and understand 66.7 2.0 2 0.63 0 1 4 1
3 The program performs its functions in a correct manner 88.9 2.67 3 0.52 0 0 2 4
4 The program performs it functions in an efficient manner 88.9 2.67 3 0.52 0 0 2 4
5 User errors are handled adequately 72.2 2.17 2 0.41 0 0 5 1
6 The error messages are meaningful and helpful 66.7 2.0 2 0.00 0 0 6 0
7 The program does or would have helped in your understanding of
computer programming
77.8 2.33 2 0.52 0 0 4 2
8 The use of animation furthers your understanding more than a
static flowchart would.
83.3 2.5 3/2 0.55 0 0 3 3
9 The user interface design is appropriate for an inexperienced user 88.9 2.67 3 0.52 0 0 2 4
10 The program does what it set out to do. 88.9 2.67 3 0.52 0 0 2 4
11 Further development of this tool is worthwhile 66.7 2.00 2 0.63 0 1 4 1
12 The Programming tool is enjoyable to use 72.2 2.17 2 0.75 0 1 3 2
0-24% (0) = Strongly Disagree 25-49% (1) = Disagree 50-74% (2) = Agree 75-100% (3) = Strongly Agree
Is this programming tool easy to use and quick to learn? (Q2 and Q9)
The averages of 67% and 89% demonstrated an overall positive response, but one that indicated
some room for improvement. Observation demonstrated that some of the participants were slightly
confused about where to click when adding constructs to the flowchart, but only initially. In this
version of Progranimate, new components are added by clicking on the component above its
intended position. Subsequent evaluation exercises discussed later in this thesis have demonstrated
no urgent need to change this mechanism.
Does it handle user error well? (Q5 and Q6)
Further evaluation is needed, but these initial findings show that Progranimate was intuitive to use
and not prone to error. Few errors were encountered, and most participants experienced none.
Is the program enjoyable to use (Q12)
Most evaluators agreed that they enjoyed using Progranimate, some strongly so.
Is this tool helpful in understanding the basics of computer programming? (Q 7 and Q8)
On the whole, the evaluators felt Progranimate helped their understanding of programming, with
the animation features being particularly helpful.

Formal and Action Research Methodologies Chapter7 – Development and Evolution
Page 169
Does the tool do what it set out to achieve? (Q1 and Q10)
The evaluators agreed that Progranimate‟s purpose is clear; it is intuitive and meets their
expectations.
Speed and Responsiveness (Q4)
Observations and the responses to question four demonstrated Progranimate was speedy and
responsive.
What improvements and Changes need to be Made? (Q11)
The responses to Q11 show that the evaluators feel that continued work on Progranimate is
worthwhile. Progranimate‟s functionality was limited, and several initial improvements were
suggested and noted down for further investigation in the next development cycle. For example,
the need for an undo feature became apparent. An evaluator stated that Progranimate was too plain
looking. Another suggestion was that the values of the speed control should be revered, so that ten
is fastest and one slowest.
7.3.4 Study One Conclusions
This study served only to indicate the feasibility of developing Progranimate further. The outcomes
demonstrate that even in its early stage of development, Progranimate was enjoyable and perceived
as intuitive and helpful in the learning of programming. However, the tool is limited in several
areas, and the study did show some improvements were required. The positive results of this study
demonstrated that Progranimate had potential, and further work was worthwhile.
7.4 Phase 2 - Progranimate Version 2.0
This section details the enhancements made to Progranimate in research and development phase
two and the results of a subsequent evaluation study.
7.4.1 Phase 2 Improvements
Whilst the preliminary version demonstrated the viability of Progranimate, there were several
limitations which limited its scope for modelling a wide range of programs. For example, the
control structures could not be nested; the range of expressions permitted within the constructs was

Formal and Action Research Methodologies Chapter7 – Development and Evolution
Page 170
limited to a maximum of two operators, and negative numbers were not handled. The program also
lacked an undo feature and application resizing caused undesirable visual side effects. Version 2.0
was designed as an enhancement to the existing program code of version 1.0. It aimed to address
its limitations and introduce several new features, implemented as a result of additional formal
research.
7.4.1.1 Nesting of Structures
A high priority enhancement was enabling the nesting of structures. The nesting of loops and
decisions is known to be conceptually challenging for novices. The auto structuring algorithm was
completely overhauled. This permitted the structures of Progranimate to be nested in any valid
combination and to an infinite level. This significantly broadened Progranimate‟s scope, allowing it
to model many more algorithms and concepts.
7.4.1.2 Code Generation and Visual Synchronisation
As discussed in Chapter 2, novices tend not to write well structured and indented code, making
their code hard to read and thus learn from. They also experience difficulty reading, simulating and
predicting the outcome of even small code passages. Authors have said the ability to read and
understand code is a pre-requisite skill of writing it and therefore needs more attention. It was felt
that the absence of program code in Progranimate would do nothing to help overcome coding
weaknesses, nor would it reduce the impact and steep learning curve of code when introduced.
Therefore, code generation was incorporated to help the novice in the mastery of reading and
understanding program code.
For phase 2, the generation features were restricted to Java code and a simplified version of Java to
evaluate the potential of this idea. The intuitiveness of the flowcharts and their visual
synchronisation with the code (via highlighting) aimed to make the meaning of the code more
apparent. The animation of flowcharts and code also aimed to fortify the novices‟ knowledge of the
semantics of the code.
7.4.1.3 Flowchart Improvements
For version 2.0 several improvements to the flowchart notation were made as follows:

Formal and Action Research Methodologies Chapter7 – Development and Evolution
Page 171
Previously the print and read components used a rounded box. As of version 2.0 they are
represented by a parallelogram to unify Progranimate‟s notation with that commonly found in
textbooks and online;
The function command was renamed to assign; this is more in keeping with its purpose, which
is expression analysis and assignment;
The control structures were also remodelled to simplify their layout, making them clearer and
easier to comprehend;
The flowchart pieces were given a more intuitive colour scheme: Green for start, red for
terminate and cyan for assign.
One of the criticisms of the preliminary evaluation was the plain look of Progranimate. As a
first step to improving the appearance of Progranimate the flowchart pieces were given fade
effect which aims to enhance its visual appeal;
7.4.1.4 Handling Negatives
Progranimate‟s expression handling and variable inspection features were extended, enabling
Progranimate to handle negative numbers properly. From this version on, the number ranges
permitted in Progranimate‟s data types have been designed to mimic precisely the conventions of
the languages it implements. Not doing this could prove to be a source of misconception; it would
also mean the generated code may behave differently when taken to a standard IDE.
7.4.1.5 Undo Feature
In the preliminary evaluation, the need for an undo feature was observed. For version 2.0 this
feature was subsequently incorporated as a simple and uncomplicated one command undo.
7.4.1.6 Additional Menus
With the addition of code generation, an additional code generation menu option was added to
facilitate the adjustment of font style, font size, and code commenting. The view menu was also
added to allow the user to hide or show various aspects of Progranimate‟s user interface. This
allows the user to free up screen space and further simplify the interface.

Formal and Action Research Methodologies Chapter7 – Development and Evolution
Page 172
7.4.1.7 Reversal of Speed Slider Values
Influenced by the findings of the preliminary study, the values on the animation speed control were
reversed; 10 became fastest and 1 slowest.
7.4.2 Study Two - High School Pupils with V2.0
Another preliminary study was conduced to re-evaluate Progranimate in light of the changes that
had been made. The main focus of this study was to evaluate usability; however, some initial
indications of efficacy were also obtained. Unlike the previous study this was conducted in a more
formal classroom setting, and involved a larger number of evaluators (twelve) who were using
Progranimate simultaneously instead of one at a time.
7.4.2.1 Participants
The participants of this study were twelve secondary school pupils aged between sixteen and
seventeen years of age (nine girls and three boys) from local schools. All evaluators were taking
computer related studies at school and had expressed an interest in computing at HE level. The
majority of the evaluators (eight out of the twelve) had no programming experience, though four
indicated a prior knowledge of the basic imperative concepts.
7.4.2.2 Evaluation Method
The study was conducted by exposing the participants to the programming tool for approximately
one hour. During this time the evaluation group were introduced to Progranimate, guided though
the solution of two simple example problem solving exercise, then given three problems of
increasing complexity to solve. Problem one was sequential in nature, problem two utilised an if
structure and problem three featured nested Ifs; these activities are shown in appendix D. It is
worth noting that these problem solving activities used do not relate to the problem solving
pedagogy as discussed in chapter 5, which at the time of this study was not yet developed. The
evaluators received guidance from the class instructor as and when they required it. The time
requirements of the introduction, example problem and questionnaire filling in at the end meant
that the time spent solving the problems was approximately forty minutes. Not all evaluators
completed the third exercise, but all got to either complete or try exercise two and a third got to try

Formal and Action Research Methodologies Chapter7 – Development and Evolution
Page 173
or complete exercise three.
7.4.2.3 Feedback
Feedback was gained by observation and via the responses to a questionnaire consisting of sixteen
Likert style questions. The questions posed statements that the evaluators could either agree or
disagree with. The responses were measured via a five point scale where strongly disagree scored
zero and strongly agree scored four. Unlike the previous study, the evaluators were allowed an
undecided response which scored two. Also contained on the questionnaire were spaces for
comments below each question and space for stating any difficulties encompassed in solving the
problems. To provide more meaningful statistics, the responses to the questions have been
converted to a percentage of the maximum possible average response of four and are shown in
table 7-3.
7.4.2.4 Results
The results of the evaluation questionnaire are presented below.
Table 7-3. Evaluation Results for Study Two with Version 2.0
Q Question Summary Ave% St Dev% Mode% Median% 0 1 2 3 4
1 I have done programming before 35.42 48.22 0 0.00 7 1 0 0 4
2 Programming is difficult 39.58 19.82 50 50.00 1 4 6 1 0
3 The problems were hard to solve 18.75 21.65 25 25.00 5 6 0 1 0
4 I enjoyed solving the problems with the programming tool 91.67 16.28 100 100.00 0 0 1 2 9
5 I found the tool easy to use and understand 85.42 12.87 75 75.00 0 0 0 7 5
6 The tool was speedy and responsive 35.42 31.00 0 37.50 4 2 3 3 0
7 The error messages helped me when I got something wrong 72.92 22.51 50 75.00 0 0 5 3 4
8 The tool helped me understand programming 75.00 23.84 75 75.00 0 1 2 5 4
9 The tool made the programming concepts easier to understand 75.00 23.84 50 75.00 0 0 5 2 5
10 Flowcharts are useful for designing computer programs and
sharing ideas 77.08 19.82 75 75.00 0 0 3 5 4
11 The flowcharts helped me understand the behaviour of a
computer program 62.50 31.08 50 62.50 1 1 4 3 3
12 I understood the relationship between the flowchart and code 81.25 21.65 100 87.50 0 0 3 3 6
13 The animations helped me develop a solution 56.25 32.20 50 50.00 2 0 5 3 2
14 The tool is suitable for beginners 81.25 25.89 100 100.00 0 2 1 0 9
15 I would like to use this program at my school 89.58 16.71 100 100.00 0 0 1 3 8
16 Could this tool be greatly improved in any way 43.75 24.13 50 50.00 2 1 7 2 0 0=[0-19% Strong Disagreement] 1 =[20– 39 Disagreement] 2=[40-59% Undecided] 3=[60-79% Agreement] 4=[80-100% Strong Agreement]
Is the Progranimate easy to use and quick to learn? (Q2, Q5 &Q14)
Observations and question responses showed Progranimate as easy to use, quick to learn and
having a very small learning curve.

Formal and Action Research Methodologies Chapter7 – Development and Evolution
Page 174
Is it enjoyable to use? (Q4 & 15)
Progranimate was found to be enjoyable to use and enhanced pupil motivation towards
programming.
Does it handle user error well? (Q7)
As with study one, Progranimate was found to be intuitive and not error prone, despite the new
features. As a result, relatively few error messages were encountered by the evaluators.
Is the tool reliable and responsive? (Q6)
Several stability and performance issues occurred during the study. However, these problems were
not fatal, and the evaluation proceeded.
Is the tool helpful in understanding the basics of programming? (Q8 & Q9)
Progranimate was found to be helpful with positive indications of its efficacy being gained, though
further work is needed to assure this finding.
Are the flowcharts of Progranimate an effective visualisation for novices? (Q10,Q11 & 12)
The responses shown the flowcharts were helpful in program design and understanding program
behaviour. The flowchart and code synchronisation was seen as particularly effective.
Are the Animation features helpful? (Q13)
The animation features were affected by Progranimate‟s stability problems. For those able to use
this feature successfully, it was viewed positively, but further investigation is needed.
What improvements and changes need to be made? (Q16)
Much of the feedback related to the stability problems. However, some useful suggestions regarding
Progranimate‟s usability were received as follows:
In Progranimate v2.0 there were two sets of edit and delete buttons on screen (one for
variables, the other for constructs); this caused confusion when following instructions.
A couple of students noted that the mechanism for editing and deleting variables (click a
construct then the relevant button) was unintuitive and should be reversed.
The pupil‟s teacher suggested that the capability to print out the flowchart would be useful.

Formal and Action Research Methodologies Chapter7 – Development and Evolution
Page 175
7.4.2.5 Study Two Conclusions
The main intention of this study was to evaluate the usability of Progranimate in light of the recent
changes and to gain initial indications of efficacy.
Two prominent findings that emerged from this study were that the evaluators found Progranimate
easy and enjoyable to use. It has a small learning curve, allowing its users to concentrate on the
tasks at hand soon after its introduction. These findings proved a turning point for this research,
indicating that Progranimate may be suited to a wider age range than the original target audience,
first year undergraduates. Also interesting were the high levels of enjoyment, coupled with the fact
that 75% of the evaluators were female. This is significant because females have been and continue
to be under represented in technical computing subjects , tend to lack confidence in their ability and
are generally less fascinated by computers than their male counterparts (Carter and Jenkins, 1999).
In evaluating individual features, the results indicate that the synchronised highlighting of code and
flowchart was effective. Though not instructed about the meaning of the generated code it, it may
have been useful to ask the evaluators if they gained any understanding of it. Clearly more questions
needed to be asked and were in later studies. In questioning the efficacy of Progranimate‟s
flowcharting and animation features, the results were positive but in some aspects hampered by the
stability problems. The simplified error handling features were also analysed; however, though they
were rated positive overall, it transpired that most users never even encountered errors. This
indicated that Progranimate was not error prone, at least at the level of complexity encompassed
within the study.
The study highlighted the need for several improvements, most notably in stability and
performance. Some stability problems were realised and eliminated shortly before the evaluation,
but unfortunately, the updated version could not be installed in time. It could credibly be argued
that these problems skewed the results; however, communication with the evaluators and the
comments they left indicated that they were able to overlook this shortcoming in their responses to
questions not related to performance and reliability.
Ignoring the stability and performance issues, these results show that Progranimate coupled with its
new features is usable and effective. Even with this increased functionality, Progranimate‟s learning
curve remains small.

Formal and Action Research Methodologies Chapter7 – Development and Evolution
Page 176
7.5 Phase 3 - Progranimate Version 2.5
Whilst the evaluation of Progranimate version 2.0 demonstrated some success, it clearly
demonstrated a need to improve its stability and performance. Besides major advances in stability
and performance, Progranimate version 2.5 was the culmination of many other improvements and
new features. Of particular note was the development of an associated scaffolding pedagogy, an
associated website and mechanisms for deploying Progranimate over the internet. To date, version
2.5 incorporated more major changes than any other version.
7.5.1 Phase 3 Improvements
In this section are listed the improvements made to Progranimate version 2.5.
7.5.1.1 Stability and Performance Improvements
One of the first changes to take place was improvements in the stability and performance of
Progranimate, by optimising and redesigning several aspects of its underlying implementation. This
optimisation process brought about ten fold improvements in speed and faultless stability
throughout Progranimate, whilst reducing its size of the code base by 20%.
7.5.1.2 Single Dimension Arrays
Arrays and the algorithms that use them are a widely acknowledged conceptual challenge for
novices. They are prone to several misconceptions and are therefore an important feature to include
in a supportive environment for novice programmers. The addition of array handling significantly
increased the range of programs that could be developed and modelled in Progranimate. It was
decided to limit these features to 1-D arrays until the efficacy of this feature could be assured. The
handling of 2-D arrays is considered outside the scope of this thesis.
To visualise the changing state of arrays at run time the inspector needed to be modified to handle
arrays whilst maintaining application simplicity. After careful research and planning, two
interchangeable designs were implemented; a table (default) and a tree based view. These are shown
in section c of appendix B. The enhanced inspector aimed to maintain Progranimate‟s simplicity
and thus does not show the array inspector until one or more arrays have been defined.

Formal and Action Research Methodologies Chapter7 – Development and Evolution
Page 177
7.5.1.3 Enhanced Expression Handling
Progranimate‟s expression handling features are used to validate and evaluate the expressions that
are associated with the constructs when they are defined and at run time when they are executed.
Prior to Progranimate version 2.5 the expressions permitted within Progranimate were limited. For
example, only one variable could be printed at a time, expressions were limited to two operators
(not including assignment), did not allow the use of parentheses and did not fully obey the rules of
precedence. Furthermore, some normally valid but less common combinations were not permitted.
As the code generation had been implemented, it was important that Progranimate obeyed the
semantics of the language generated as precisely as possible. Failing to do so could make
Progranimate a source of misconception. It would also mean that the generated code would behave
differently in Progranimate than it would in a standard IDE, causing unnecessary confusion.
In light of Progranimate‟s limitations, the addition of code generation and array handling features,
the expression handling mechanisms were completely re-designed. The underlying implementation
now utilised more efficient and robust expression handling methodologies. This brought with it a
few new expression related features which included parentheses, array handling and a command for
retrieving the size of an array. The print command was now also more flexible, being able to take
a wide range of expressions rather than a single variable. As a result of the improved expression
analysis mechanism, Progranimate was able to support any valid expression which fell within the
scope of its data type and operator subset and the rules of the language used for code generation.
7.5.1.4 Generation of Visual Basic
Up until version 2.5, Progranimate had only supported the generation of Java code and a simplified
Java like language. However, from the inception of these features, the intention was to support
multiple languages and was therefore designed with extensibility in mind. The initial plan was to
incorporate the generation of Visual Basic.NET (VB.NET) only. However, this was extended to
cover Visual Basic 6 (VB6) due to an impending evaluation study (discussed in section 7.5.3) in
which the institution used VB6.
When VB.NET is selected as the language for generation, the entered expressions are defined and
evaluated using VB.NET syntax, commands, operators and semantic rules. Compared with Java,
VB utilises a simpler and more consistent set of commands and semantics. The addition of VB
opens Progranimate to a wider audience, particularly in pre-university institutions.

Formal and Action Research Methodologies Chapter7 – Development and Evolution
Page 178
7.5.1.5 Web Deployment Capabilities
The need for an alternative deployment mechanism became apparent in the second evaluation
study. Prior to version 2.5 Progranimate had to be installed manually on each computer. This was
time consuming and required a technician with sufficient installation privileges. It was this that
prevented a more stable version being deployed in time for the previous evaluation.
As Progranimate is deployed in Java, the requirement for installation can be circumnavigated. By
leveraging the Java Web Start (JWS) (Sun Microsystems, 2009d) and applet (Sun Microsystems,
2009a) deployment methodologies, Progranimate need never be installed, as the program files are
called from a web server and executed on users‟ computers via a hyperlink contained within a
standard webpage hosted on a standard web server. This hyperlink connects with a launching file
containing various parameters, such as selected language, any files to be loaded upon start up and
the visual appearance of Progranimate to name but a few. Progranimate then downloads and starts
as if it were a locally installed application All that is required is an installation of the Java Run-time
Environment (Sun Microsystems, 2009b), a web browser and a broadband internet connection of
approximately one megabyte per second (mbps) or more. These software technologies are prevalent
on most computers and are readily available free of charge, which maximises Progranimate‟s
potential audience. Provisional testing showed that Progranimate could be downloaded in less than
a minute, on a broadband connection of approximately 1.5 mbps. This was seen as an ideal
deployment mechanism, as program updates could be deployed instantly, and the users always got
the latest version.
7.5.1.6 Test Website
The need to deploy Progranimate over the internet meant that a website was required. An initial test
website was developed using basic HTML. The sole purpose of the website was to permit
unrestricted access to Progranimate in and out of the classroom and to alleviate installation issues
prior to evaluation activities. The website served as a proving ground for the JWS deployment
methodology and was used on and off of campus on two subsequent evaluation studies (covered in
the next section). The website was also used to host the trial version of the online activity packs as
used in a study conducted with secondary school teachers, which is documented in section 7.5.4.

Formal and Action Research Methodologies Chapter7 – Development and Evolution
Page 179
7.5.1.7 Associated Problem Solving Pedagogy
In research and development phase three, the problem solving pedagogy was conceived. The
previous evaluation study had indicated that ready made problem solving activities might be very
appropriate for introducing imperative Programming and its concepts to novices.
From an initial idea, formal research was conducted, and a pedagogy based on the theories of
scaffolding support emerged (see chapter 5 for details on a pedagogy and activity packs). Initially,
three activity packs were developed covering sequence, selection and iteration. For the initial trial
(section 7.5.3) the activity packs were provided as printouts only. Following these successful trials,
further activity packs were developed and incorporated into the Progranimate website (Scott,
2009b).
7.5.1.8 Other Improvements
User Interface Resizing
From version 2.5 on, application resizing does not cause undesirable side effects to the UI. Also,
the screen size devoted to the flowchart, code, or inspector can be proportioned by the user,
allowing larger programs to fit on one screen.
Edit and Delete Mechanism Modifications
Study two indicated that having two separate sets of edit and delete buttons caused confusion, so
the variable add, edit and delete buttons were removed from the inspector and their functionality
incorporated into the palette buttons of the same name. This simplified Progranimate further. Study
two also indicated that the edit and delete mechanisms needed modification. To edit or delete a
construct, the user must first select it, and then chose either the edit or delete button in the palette.
Some felt it should be the other way around, i.e. click the edit/delete command then the construct.
To test the viability of this idea, the mechanism was modified in line with this suggestion.
Printing of Flowcharts and Code
In light of the suggestions put forward in the previous evaluation study, Progranimate v2.5 was
provided with the capability to print both its flowcharts and code in colour.

Formal and Action Research Methodologies Chapter7 – Development and Evolution
Page 180
7.5.2 Evaluation of Progranimate Version 2.5
In light of the changes brought about by Progranimate version 2.5, two further evaluation studies
were conducted. Study three was conducted with college students and evaluates usability and
efficacy but also the then new problem solving pedagogy and online deployment. Study four was
conducted to gain the opinions of college and secondary school teachers of computing. These
studies heavily influenced the several new features and improvements which were incorporated in
Progranimate v3.0 and v3.5 and are evaluated in the next two chapters. In most of its basic
functions, Progranimate v2.5 has a similar level of functionality to the two latter versions.
Therefore, the findings of these two studies are relevant to the overall findings of the thesis.
7.5.3 Study Three - Bridgend Technical College with version 2.5
This study was conducted off campus at a local technical college. It was conducted over three
weeks with two classes participating in an hour per week. The longer duration provided an
opportunity for a more in-depth and robust evaluation with more evaluators than in previous
studies. The evaluation aimed to discover any potential problems with the use of Progranimate v2.5,
its online deployment, and the problem solving pedagogy. It was not intended as an extensive
evaluation of its educational efficacy, though many interesting findings were obtained.
7.5.3.1 Participants
The subjects of the study were 32 mixed gender students (27 males 5 females) aged 16 and 17 and
spread between two classes. The students were studying on the second year of a BTEC National
Diploma in IT Practition and had about nine months experience in the rudiments of VB6. To
protect the identity of the evaluators, their names have been abbreviated with initials. As is shown
in table 7-4, participant attendance varied from week to week, with session two having the lowest
number of attendees.
Table 7-4. Bridgend Evaluator Attendance
Attendance Total Attendance Per Week Total
One Session 8 Session1 25
Two Sessions 13 Session2 15
Three Sessions 11 Session3 25
No of Distinct Evaluators 32

Formal and Action Research Methodologies Chapter7 – Development and Evolution
Page 181
7.5.3.2 Evaluation Method:
The study was conducted over three one hour sessions spread over three weeks. This facilitated a
more elaborate and in-depth study than had been achieved previously. In the first evaluation session
the participants were given a twenty minute introduction. This included the use of Progranimate, a
brief discussion and demonstration of the constructs it supports and a collaborative walkthrough of
an example programming problem and its solution.
The participants were then expected to access Progranimate via the online link and tackle a range of
programming problems that utilised the scaffolding pedagogy (see chapter 5). The problems were
divided into three activity packs which were earlier revisions of those now hosted on
Progranimate‟s website (Scott, 2009b):
A:- McDullard‟s fast food restaurant - 3 Sequential problems;
B:- Wally World theme park - 4 Selection problems;
C:- Insanesbuy‟s supermarket - 4 Iteration problems;
It was intended for the students to tackle a different activity pack each week, where each week
would begin with a scaffolding pedagogy stage A and B introduction lead by the tutor. However, it
was clear from very early in the study that this pace of delivery would be unattainable, even for the
stronger students. Therefore, the evaluators all progressed at their own individual pace, doing as
much as they could manage. Each activity pack was accompanied by a cheat sheet. This reminded
the evaluators how the relevant constructs and expressions could be used and what the possibilities
were. An instructor was on hand to discuss the constructs, operators and commands covered in the
cheat sheets when an evaluator was ready to begin a new activity pack.
7.5.3.3 Feedback Methodology:
Feedback methods used were: observation, interviews, questionnaires and monitoring of task
completion times. By using four forms of feedback it was hoped that the results would paint a more
accurate picture of Progranimate‟s usability and educational efficacy. Furthermore, it was also
hoped that this would help clarify any otherwise conflicting or confusing results that may arise.
To monitor the achievements of the evaluators, their completion times were recorded. This was
achieved by writing the start time on each worksheet as a student began a problem. When a student
believed a problem complete an instructor would check their solution and if correct, record the
finish time. In spaces provided, the students were also encouraged to write any difficulties

Formal and Action Research Methodologies Chapter7 – Development and Evolution
Page 182
encountered or help received from the tutor or their peers.
In the final session, interviews were carried out in groups of three or four; and recorded for later
transcription and analysis. A semi-structured interview technique (Preece et al, 2007a) was used, as
this provides a preset agenda for discussion whilst allowing the students to make relevant but
unanticipated comments. The interview transcripts are available in appendix E.
In the final session a two part questionnaire was administered: part one usability and part two
efficacy. This was Likert based, containing statements the respondents could agree or disagree with.
The responses to each question were taken using a four point scale where 0 = strong disagreement
and 3 = strong agreement. For each question the responses were averaged, then converted to a
percentage of the maximum possible averaged response of three. The standard deviation, mode,
median and a combined percentage of evaluators in agreement and strong agreement (% agreed)
was calculated. This data is shown in table 7-5 and table 7-6. Each question also provided space for
the evaluators to reason their answer or provide comments not addressed by the question text.
7.5.3.4 Results
The results from the study are broken down into three sections. Subsection A evaluates usability,
subsection B evaluates Progranimate‟s efficacy and subsection C the pedagogy and the associated
programming tasks.
A) Usability of Progranimate:
To evaluate usability the results from the usability questionnaire were correlated with observations
made and the students‟ interview responses. The questionnaire results are shown in table 7-5. The
results demonstrated that in comparison to the previous and subsequent evaluation studies, the
participants were much more critical. It is believed that the evaluators‟ prior experience of VB6 and
the pure focus on algorithmic problem solving (something they were not used to and found
difficult) was a significant contributory factor in this higher level of criticism. In Visual Basic the
program code is fragmented in to various event procedures, hence the VB novice is not required to
think too much about the development of an algorithm. Therefore, for the students of this study
Progranimate was a readjustment and a very different way of programming than they were used to.

Formal and Action Research Methodologies Chapter7 – Development and Evolution
Page 183
Table 7-5. Bridgend Study Usability Questionnaire
Q Question Text Ave
Std
Dev Mode Median
%
Agreed
Distribution
0 1 2 3
1 Progranimate is easy to use 52.78 16.79 66.67 66.67 58.33 0 10 14 0
2 Progranimate is fun to use 77.78 21.23 66.67 66.67 91.67 0 2 12 10
3 My first impressions were good 48.61 25.97 66.67 66.67 54.17 3 8 12 1
4 Adding, Editing and Deleting components was easy to do 66.67 24.08 66.67 66.67 75.00 0 6 12 6
5 The expressions (code) entered when creating components was
easy to use and remember 47.22 25.85 33.33 33.33 41.67 2 12 8 2
6 Adding and editing variables was easy 61.11 25.38 66.67 66.67 70.83 1 6 13 4
7 Saving and loading programs was easy and trouble free 81.94 16.97 66.67 66.67 100.00 0 0 13 11
8 The function of each button slider and menu option etc. was very
clear to me 56.25 24.97 66.67 66.67 60.87 1 8 11 3
9 Progranimate was speedy and responsive 55.07 19.09 66.67 66.67 69.57 1 6 16 0
10 User errors are handled correctly 58.70 20.02 66.67 66.67 77.27 1 4 16 1
11 The error messages generated were meaningful and helpful 54.17 29.18 33.33 66.67 54.17 2 9 9 4
12 Progranimate functioned reliably 61.11 18.82 66.67 66.67 75.00 0 6 16 2
13 Progranimate is suitable for beginners 55.56 21.23 66.67 66.67 58.33 0 10 12 2
0-24% (0) = Strongly Disagree 25-49% (1) = Disagree 50-74% (2) = Agree 75-100% (3) = Strongly Agree
% Agreed = percentage of combined agreement and strong agreement.
Web Launching
The web launching deployment caused no problems launching in under a minute on all the students
computers. However, the URL used to access Progranimate caused problems, as it was long,
intricate and prone to typographical errors. This showed a need for a smaller dedicated URL.
Ease of Use (Q1, Q13 & Q8)
The results obtained were positive but much more modest than in previous studies in which most
participants had no programming experience. A common interview response was that VB was
easier, as they were more used to it. Some indicated that Progranimate was a significant
readjustment.
Observation showed that most of the evaluators experienced a small but evident learning curve.
Some experienced initial confusion adding and deleting flowchart components, but only needed
guiding once in this regard. The learning curve was due mostly to the programming problems which
became evident by improvements in completion times (discussed later).
Enjoyment (Q2& Q3 )
Of all usability questions, Q2 scored the highest average and percentage agreement, which indicates
Progranimate was enjoyed by the evaluators.
However, in contrast to this, the responses to Q3 and the interview responses showed that many

Formal and Action Research Methodologies Chapter7 – Development and Evolution
Page 184
students experienced initial trepidation. A correlation coefficient between average problems solved
per week and the responses to Q3 revealed no significant correlation (-0.02). This shows that the
initial trepidation felt by many evaluators was not linked to ability. This demonstrated a need to
make Progranimate more inviting.
Program Construction ( Q4, Q5, Q6 & Q7)
The responses to Q4 show that overall the mechanics of program construction and modification
were viewed as easy. However, there were some criticisms. One student remarked they had no idea
how to delete un-required items. However, once instructed in how to do this, it no longer presented
a problem. Another remarked that the palette button and flowchart component say print, but when
generated in code it says MsgBox. This has not been altered because Progranimate aims to teach
transferable skills, not language dependant terminology.
Q5 indicated that some experienced difficulty in the entry of expressions. Errors were mostly
typographical rather than logical; for example, misspelt variable names and missing operators.
Observations showed that this problem was linked with a learning curve. Generally, once an
evaluator had solved two problems, these issues subsided.
The answers to Q6 show that most believed that adding variables was easy. However, seven of the
24 respondents indicated difficulty; six of the seven did not perform well in problem solving.
Saving and loading presented no discernable problems, as evidenced by the 100% agreement of Q7.
Error Handling (Q10 & Q11)
Q10 demonstrates that most evaluators believed that Progranimate handled user errors correctly.
However, the 23% disagreement indicates that some felt improvements were needed.
The responses to Q11 show that over half of the evaluators felt the errors were meaningful and
helpful, though the modestly positive score indicated improvements were needed. The interviews
and written responses revealed that the error messages were viewed as meaningful by most and
much better than those generated by their usual environment, Visual Studio. However, some felt
they could be further simplified with even less use of technical terms.
Reliability and Performance (Q9 & Q12)
In this study observations showed that the performance and reliability problems of the previous

Formal and Action Research Methodologies Chapter7 – Development and Evolution
Page 185
study were almost eliminated. A few small bugs were discovered, but nothing that prevented
Progranimate from being used to its full extent. The responses to Q12 show that most believed
Progranimate to function reliably. The responses to Q9 indicate dissatisfaction with the
responsiveness of Progranimate, further investigation via interview and written responses revealed
that most evaluators expected it to web launch instantly rather than in 40 or so seconds. The speed
and responsiveness of Progranimate once loaded was not considered a problem by users.
B) Efficacy of Progranimate
Table 7-6 presents the statistics gained from the efficacy questionnaire. Evaluators who attended
only one session have been excluded from these results; it was felt that their lack of exposure could
skew the results gained from those with greater attendance. The results are discussed under four
headings: „Overall Efficacy‟, „Flowcharts‟, „Animation‟ and finally „Problem Solving Activities‟ and
are aligned with observations made and the evaluators written and interview responses.
Table 7-6. Efficacy Questionnaire Results
Q Question Text Ave Std Dev Mode Median
% Agreed
Distribution 0 1 2 3
1 Progranimate enabled me to understand how a program works and runs
better than before 46.97 19.68 33.33 33.33 45.45 1 11 10 0
2 Progranimate made it easier to see how the individual parts of a program
interact to achieve its purpose 53.03 16.77 66.67 66.67 59.09 0 9 13 0
3 I had problems understanding the flowcharts 36.36 25.01 33.33 33.33 31.82 5 10 7 0
4 The flowchart visualisation helped me when developing the solution 70.45 24.09 66.67 66.67 80.95 0 4 10 7
5 I preferred looking at the computer code than looking at the flowchart 57.14 31.52 33.33 66.67 54.55 2 8 7 5
6 I found the flowcharts easier to understand than the code 59.09 28.97 33.33 66.67 59.09 1 8 8 5
7 I understood the relationship between the flowchart and the code 57.58 18.35 66.67 66.67 68.18 0 7 14 1
8 If I could use flowcharts to create and animate programs in my usual
programming environment I would make use of the feature 60.61 24.42 66.67 66.67 63.64 0 8 10 4
9 Program animation is a good and useful feature 63.64 17.55 66.67 66.67 81.82 0 4 16 2
10 The animations helped me debug my code and develop a working solution 54.55 19.37 66.67 66.67 59.09 0 9 12 1
11 The variable inspector was a very useful feature 52.38 24.88 66.67 66.67 52.38 1 9 9 2
12 The tool made it easier for me program 53.97 19.65 66.67 66.67 57.14 0 9 11 1
13 Progranimate enabled me to develop correct programs faster than before 46.97 22.20 33.33 33.33 40.91 1 12 8 1
14 I feel I have learnt something by using Progranimate 51.52 26.68 33.33 33.33 45.45 1 11 7 3
15 My knowledge of programming has been strengthened by using Progranimate 46.97 19.68 33.33 33.33 45.45 1 11 10 0
16 I would recommend Progranimate to friends who wanted to learn programming 57.58 21.04 66.67 66.67 63.64 0 8 12 2
0-24% (0) = Strongly Disagree 25-49% (1) = Disagree 50-74% (2) = Agree 75-100% (3) = Strongly Agree
%Agreed = percentage of combined agreement and strong agreement.
Overall Efficacy: (Q1,Q2,Q12,Q13.Q14,Q15 & Q16)
The responses to Q1 and Q2 show that approximately half believed Progranimate helped them
conceptualise the run time nature of programming better than had been achieved previously. This is
a significant finding given that the evaluators already have nine months experience with VB.

Formal and Action Research Methodologies Chapter7 – Development and Evolution
Page 186
Similar responses were gained by Q12, Q13, Q14 and Q15 which show that roughly half of the
students felt Progranimate enhanced their programming abilities. In interviews, almost all of the
higher achievers (in the problem solving activities) expressed positive opinions along the themes of
Q12 to Q15. Correlation coefficients were calculated between the evaluators‟ problem solving
performance (average problems solved per week) and their responses to these questions. The
results appear to back up these opinions in all but Q13. These statistics are presented in table 7-7.
Table 7-7. Correlations between Q12 to Q15 Responses and Problem Solving Performance of the Evaluators
Question No: Q12 Q13 Q14 Q15
Correlation: 0.23 -0.08 0.49 0.35
The responses to question sixteen show that roughly 63% of the students would recommend
Progranimate to friends, but a prevailing sentiment expressed in the interviews was only if they had
not done VB first.
Flowcharts: (Q3,Q4,Q5, Q6 Q7, & Q8)
The responses to Q3 and Q4 show that the most students had no problems understanding the
flowcharts, and they were seen as helpful in the development of solutions to the problems. Q5 and
Q6 show the flowcharts were preferred and seen as easier to understand than the code. Similar
opinions were also expressed in the interviews. The responses to Q7 show that almost two thirds
of the students believed the relationship between the flowcharts and code was understandable and
clear. The interviews revealed that some students misunderstood this question; which may account
for the positive yet modest score. Q8 shows that almost two thirds of the students would use the
flowcharting and animation features were they available in their usual programming environment.
In light of evaluators‟ experience with VB6, the responses to this evaluation aspect suggest that the
flowcharts of Progranimate are usable, clear and easier to understand than computer code. This
demonstrates Progranimate‟s flowcharts are ideal for novices.
Animation: ( Q9, Q10, Q11)
The results obtained by Q9 show that the vast majority of students believed the animations were
helpful and worthwhile. The results of Q10 showed most also believed the animations were a useful
debugging aid. The efficacy of the animation features was also evident in the interview. Several
evaluators indicated that the step by step execution provides more insight into the workings of a
program than static code.

Formal and Action Research Methodologies Chapter7 – Development and Evolution
Page 187
The responses to Q11 show that over half felt the variable inspector was a useful feature. However,
the responses were more modest than for Q10 and Q9. This indicates that whilst the inspector was
seen as useful, the visualised execution was the most insightful feature of animation. However, in
interviews one of the higher achievers indicated unfamiliarity with the term variable inspector,
despite its prominence in discussions and the learning materials used. Therefore, many evaluators
may not have understood Q11 properly; the term may need clarifying in future studies.
C) Problem Solving Activities
This aspect looks at the problem solving exercises, their efficacy and how the evaluators performed
when solving them. This analysis was performed by looking at each evaluator‟s improvements in
completion times and the number of problems solved per session. The complete set of statistics
regarding completion times is available in appendix E. In this section, only the key findings will be
discussed. Table 7-8 shows the average number of problems completed per session by the
evaluators, grouping the results into three ability ranges: good, average and poor. The number of
problems solved overall cannot easily and clearly indicate success, as attendance varied. However,
this data (see table 7-9) does show that several evaluators underperformed, even some of those
attending three sessions, demonstrating a lack of problem solving skill.
It transpired that the evaluators‟ problem solving skills were weaker than expected. Only a couple
managed to solve more than the three problems per session that was originally envisaged. Table 7-9
shows the number of problems achieved by the evaluators, with the results grouped by attendance.
This data shows that whilst some did well, several evaluators underperformed, even some of those
attending three sessions.
Table 7-8. Average Number of Problems Solved Per Session Grouped by Ability Range

Formal and Action Research Methodologies Chapter7 – Development and Evolution
Page 188
Table 7-9. Number of Problems Solved by the Evaluators Grouped by Attendance
Attendance and Achievement
One unsurprising statistic was a link between attendance and achievement. A student was
considered an improver if they had shown improvements in their completion times or the number
of problems solved per session. The link between attendance and achievement is described below.
11 students attended all three evaluation sessions of these six were improvers.
13 students attended two evaluation sessions of these one improved.
Improvements could not be measured for students attending one session only.
Nine of the thirteen attending two sessions attended sessions one and three. Because of the lack of
attendance in week two, they would have forgotten much by week three, hence the general lack of
improvement.
Improvements in Completion Times
Table 7-10 shows that the improvers were on average showing a decrease in completion time with
each successive problem, despite the fact that the problems were increasing in complexity. This
shows Progranimate and the problem solving activities were having a very positive impact on the
problem solving skills of some evaluators. For most improvers, problem three sees the most
dramatic improvements in time, evidencing a three problem learning curve. None of the evaluators
reached activity pack C (the supermarket); it was expected that a least a few would.

Formal and Action Research Methodologies Chapter7 – Development and Evolution
Page 189
Table 7-10. Completion Times of Improvers
Abrv Name Prb A1 Prb A2 Prb A3 Prb B1 Prb B2 Prb B3 Prb B4
TG 00:02 00:05 00:10 00:09 00:30 00:01 00:10
RF 00:09 00:06 00:30 00:32 00:30 00:01
SB 00:30 00:20 00:12 00:47
JD 00:35 00:30 00:20 00:10 00:10
TB 00:37 00:35 00:05 00:07 00:10
DW 00:30 00:40 00:15
RP 00:35 00:25 00:20 00:10 00:10
Ave Time 00:25 00:23 00:16 00:19 00:18 00:01 00:10
Std Dev 00:14 00:13 00:08 00:16 00:09 00:00 00:00
No. 7 7 7 6 5 2 1
Difficulty Level
In the interviews, the students were questioned on the difficulty of the programming problems.
Feedback was obtained from 21 evaluators and resulted in a wide range of opinions. The responses
were categorised under five headings, ranging from easy to hard. They were then categorised under
three headings (good, average and poor) based on how well the students performed in the problem
solving tasks. This performance was measured in average problems solved per session. Good was
more than 1.5 problems, average was one to 1.5 problems and poor was less than one problem.
These results are shown in table 7-11.
Table 7-11. Difficulty of the Problem Solving Activities – Feedback from 21 Evaluators
Question: Did you find the problems I gave you too easy or too hard or just right?
Category Responses by ability All
Respondents Good Average Poor
Hard 0.00% 9.52% 23.81% 33.33%
A Bit Hard 0.00% 4.76% 4.76% 9.52%
Challenging (but doable) 4.76% 0.00% 0.00% 4.76%
OK 14.29% 19.05% 0.00% 33.33%
Easy 4.76% 4.76% 9.52% 19.05%
SUM 23.8% 38.1% 38.1% 100.00% Categories for Average Problems Solved Per Session: Good: > 1.5 Average >= 1 to <1.5 Poor < 1
The results show an inverse correlation between the evaluators‟ ability and their perception of
difficulty. The evaluators who viewed the problems as hard were asked how the problems could be
improved. It was suggested by two that that the wording of the instructions could be simplified and
stated more clearly. These participants were then asked if it would have been better to have
demonstrated more problems and their solutions in the introduction; they tended to agree. Some of
the weaker evaluators indicated that the increment in difficulty from their first to second problem
was too great and that this was why they never completed a second problem.

Formal and Action Research Methodologies Chapter7 – Development and Evolution
Page 190
Key difficulties in Solving the Problems
The observations and interviews revealed that the students‟ main difficulties were deciding where
the expressions and additional constructs should go. It is interesting to see that when isolated as a
problem (in pedagogy stages C1 to C3) the order of constructs and expressions are still a significant
problem for many students. This shows that despite nine months of experience with VB, the
students‟ problem solving skills were underdeveloped.
VB (especially version 6) predominantly focuses on the use of GUI widgets (buttons, text areas etc)
which are tied together by fragments of code evoked by events such as a button press. The
fragmented nature of the language does not focus the user on the development of algorithms and
process logic of non event driven programming, hence these skills are weak. Supporting this view,
many evaluators expressed the opinion that „Progranimate and its problems were a significant
readjustment‟, even though it facilitated the language they had been using for nine months.
7.5.3.5 Study three Conclusions
The performance and reliability problems experienced in the previous evaluation study have now
been overcome; Progranimate was shown to be both responsive and reliable. Its web deployment
was also effective, with exception to the URL which needs simplifying.
Despite some initial trepidation, Progranimate was found to be enjoyable and easy to use by the
college students. Along with the results of previous studies, this shows Progranimate is a motivating
way to learn programming and problem solving.
The entry of expressions presented an initial problem for some evaluators, though in general this
subsided after they had completed a second problem. These errors tended to be typographical
rather than logical. In summing up the error handling features, while many users found
Progranimate‟s error messages helpful, some (especially the lower achievers) felt they could be
further simplified.
The efficacy of the flowcharts became apparent in the study‟s findings. It transpired that despite the
evaluators‟ pre-exposure to VB, most evaluators found them easier and viewed them more than the
code. This demonstrates the intuitiveness of Progranimate‟s flowcharts. Feedback from the students
also indicated that the animation features were useful, insightful and helpful in the development and
debugging of program solutions.

Formal and Action Research Methodologies Chapter7 – Development and Evolution
Page 191
This study demonstrated that in using Progranimate and solving the problems, the evaluators were
experiencing an initial learning curve of three problems, as after this the evaluators‟ completion
times decreased significantly despite the complexity of the problems growing steadily. However,
many evaluators failed to solve more than three or more problems, highlighting serious weaknesses
in their problem solving skill, despite nine months of pre-exposure to VB6. VB (especially version
6 as taught in the college) predominantly focuses on the use of GUI widgets (buttons, text areas etc)
which are tied together by fragments of code which are evoked by events such as a button press.
This fragmented nature of VB programming may not have allowed the students to focus on the
development of algorithms and process logic, hence their problem solving skills are in general very
weak. This demonstrates a clear need for Progranimate, or a change in the way VB is taught at
Bridgend College, to focus the user at least occasionally on the development of problem solving
skill.
Considering the number of hours spent with Progranimate (three) compared to their usual
environment and the differing focus of the programming activities (purely on process logic not
GUI widgets and associated events) the findings are viewed optimistically.
7.5.4 Study Four - Secondary School and College Teachers with Version 2.5
The previous two evaluation studies demonstrated the potential for teaching novice programmers
of pre-university age (sixteen to seventeen). However, at this level, educational tools such as
Progranimate will have additional stakeholders, these being the secondary school or college
computer science teachers who may or may not choose to incorporate Progranimate within their
teaching practices. As discussed previously in section 3.3.3.3, even if proven to be effective, a tool
such as Progranimate will less likely be adopted if from the teachers‟ perspective, it incurs too much
overhead to make it worthwhile. Therefore, this study was conducted to gain the usability and
efficacy opinions of college and secondary school computer science teachers and indications about
how well it would fit with in their teaching practices and syllabuses.
7.5.4.1 Participants
The participants were eight secondary school or college teachers from South Wales (UK). All teach

Formal and Action Research Methodologies Chapter7 – Development and Evolution
Page 192
ICT or Computing at GCSE, A-Level or equivalent levels of education. Table 7-12 presents the
participant information. To protect identifies, the names of the teachers and their institutions are
abbreviated; this also ensured more honest responses. The data shows that programming tuition
and expertise varies greatly between the institutions. Informal conversations revealed that
programming confidence and ability varied from one teacher to another, even in intuitions where
programming is taught. Some were confident, while others considered themselves rusty.
Table 7-12. Secondary School Teachers Evaluation Participants
School Institution Type
Teacher Name
Teacher's Subjects IT is Main Subject
School Teaches Programming
Languages Taught GCSE A-Level
LHS School JP ICT. YES YES VBA X
LHS School JF ICT , Computing. YES YES VBA X
PC College CF
Networking,
Multimedia,
Web.
YES YES
Java, VB, JavaScript, Php, ASP, XML.
X
PC College AW Computing, IT,
Computerised Art. YES YES
VB.NET, Php, Asp,
X X
PMR School KG Computing A-Level, GCSE ICT. YES YES
Pascal , VBA. X
PCC School AP ICT. YES YES VB6 X
CS School MW ICT. YES NO n/a
YGG School GE ICT, Computing, YES NO n/a
7.5.4.2 Evaluation Method
The study duration was one hour. It began with a fifteen minute presentation about Progranimate,
its goals, design and use. The teachers were then invited to try some of the problem solving tasks.
The confident programmers were given selection and iteration problems and others the sequential
problems. As an experiment in paperless instruction, the activity packs were presented online, with
no handouts given. To gain views on the efficacy and usability, the teachers were interviewed two
at a time. They were also given a Likert scale questionnaire comprised of 14 questions. Each
question could be responded to on a scale of zero (strongly disagree) to three (agree strongly). An
undecided option was intentionally not provided. To make the results more meaningful, each
question‟s results are presented as a percentage of the maximum possible average of three. Each
question had space for further comments; this was used extensively. At the end of the questionnaire
the participants could state what they did and didn‟t like about Progranimate, its pedagogy and
problems and any other useful comments. A complete account of the written comments and
interview responses is available in appendix F.

Formal and Action Research Methodologies Chapter7 – Development and Evolution
Page 193
7.5.4.3 Usability Results
To evaluate usability the results from the questionnaire were put together with the evaluators‟
written and interview responses. The averaged results from the usability questionnaire are shown
below in table 7-13. The results are discussed under seven headings as follows: ease of ease,
enjoyment, first impressions, program construction, error handling, reliability and performance, and
finally what usability improvements need to be made.
Table 7-13. Secondary School Teachers Usability Questionnaire Results.
Q Question: Ave Std Dev Mode Median
% Agreed Rsp
Distribution
0 1 2 3
1 Progranimate is easy to use 79.17 17.25 66.67 66.67 100.00 8 0 0 5 3
2 Progranimate is fun to use 79.17 17.25 66.67 66.67 100.00 8 0 0 5 3
3 My first impressions were good 70.83 11.79 66.67 66.67 100.00 8 0 0 7 1
4 Adding, editing & deleting components was easy to do 75.00 15.43 66.67 66.67 100.00 8 0 0 6 2
5 The expressions (code) entered when creating
components was easy to use and remember 66.67 0.00 66.67 66.67 100.00 7 0 0 7 0
6 Adding and editing variables was easy 66.67 0.00 66.67 66.67 100.00 8 0 0 8 0
7 Saving and loading programs was easy and trouble free 80.95 17.82 66.67 66.67 100.00 7 0 0 4 3
8 The function of each button slider & menu option etc.
was very clear to me 75.00 15.43 66.67 66.67 100.00 8 0 0 6 2
9 Progranimate was speedy and responsive 70.83 11.79 66.67 66.67 100.00 8 0 0 7 1
10 User errors are handled correctly 57.14 16.27 66.67 66.67 71.43 7 0 2 5 0
11 The error messages generated by Progranimate were
meaningful & helpful 52.38 17.82 66.67 66.67 57.14 7 0 3 4 0
12 Progranimate functioned reliably 75.00 23.57 66.67 66.67 87.50 8 0 1 4 3
13 Progranimate is suitable for beginners 75.00 15.43 66.67 66.67 100.00 8 0 0 6 2
14 Progranimate is suitable for secondary school pupils 83.33 25.20 66.67 66.67 100.00 8 0 0 5 2
0-24% (0): Strongly Disagree 25-49% (1): Disagree 50-74% (2): Agree 75-100% (3) : Strongly Agree
% Agreed = percentage of combined agreement and strong agreement.
Ease of use. (Q1, Q8, Q13, & Q14)
There were no disagreements to any of these questions which shows that the evaluators found the
tool easy to use, clear in its functionality, and suitable for secondary school pupils with no
programming experience. The verbal comments suggested that it was suited to all secondary school
ages, but particularly ages thirteen and older.
Enjoyment (Q2).
If teachers view Progranimate and its activities as interesting, they would be more likely to adopt it
within their teaching practices. The responses to question two show the teachers found
Progranimate enjoyable. In interviews, the teachers indicated that their students would find
Progranimate interesting, and particularly so because the problem solving activities were fun.
First Impressions (Q3).

Formal and Action Research Methodologies Chapter7 – Development and Evolution
Page 194
If the users‟ first impressions of Progranimate are positive they will more likely be motivated to
engage with it. Therefore, the teachers‟ first impressions are especially important to know. The
responses to question three show that the first impressions were positive for all teachers. The
interview revealed a teacher of one of the non programming institutions had some initial
trepidation, but it was soon overcome. No indications of trepidation were received by the others.
Program Construction (Q4, Q5, Q6, Q7).
The responses to these questions indicate that the various aspects of program construction, saving
and loading were viewed as easy and presented few if any problems. The responses to question five
show that expression entry was viewed as easy but not incredibly so, which aligns with the previous
study.
It was suggested that a drag and drop or cut and paste functionality be implemented for moving
program constructs. Progranimate v2.5 required constructs to be deleted and recreated, which was
found to be laborious. It was also suggested that edits could be achieved via a double click of the
appropriate construct or variable or the current method of editing and deletion be reversed where
the construct is clicked and then the palette option. Interestingly, this functionality was switched
from the evidence gained in study two. Maybe both methods should be facilitated. A final
suggestion was to make variable names editable. Currently, this is not permitted to stop the
programs referencing undeclared variables. All of these issues were addressed in subsequent
versions of Progranimate.
Error Handling (Q10 & Q11)
The responses to these questions show the error handling features were viewed as favourable by
most, but warrant some improvements. The two negative respondents had discovered bugs which
resulted in empty error dialogs.
It was suggested that program errors detected in compilation should not stop Progranimate from
running; it should run until the error is reached. However, many logical errors may then go un-
noticed, especially when nested control structures are used. It was also suggested that the error
messages link to a webpage offering detailed information on the error. However, experience at
Glamorgan shows that long compiler errors rarely get read, let alone a whole page of information.

Formal and Action Research Methodologies Chapter7 – Development and Evolution
Page 195
Reliability and Performance. (Q9 & Q12)
Except for the discovery of one minor bug, Progranimate exhibited no stability or performance
problems. This finding is reflected in the responses to questions nine and twelve.
Other Usability Suggestions
It was suggested that palette buttons should be coloured to match their respective flowchart
components. The evaluator stated that this would make their functionality more apparent whilst
brightening up Progranimate, which one evaluator commented was too plain looking.
7.5.4.4 Efficacy Results
The efficacy findings were obtained by the semi structured interviews given to the teachers. The
transcripts of these interviews are available in appendix F.
Is Progranimate Useful to Your Pupils?
All of the teachers had very strong opinions in favour of Progranimate and its usefulness to their
pupils as a way of introducing programming and problem solving.
Is the combination of Flowcharts and Code Effective?
All respondents had positive things to say about this and particularly in regard to the flowcharts,
which they believed made programming more comprehensible.
Are the animation features useful?
The responses from the teachers were universally positive in regards to the animation features.
Cited as particularly useful was the variable inspector, which they believe provides a clear insight
into how a program works.
What do you think about the programming problems?
This question was only properly answered by four of the eight evaluators; as many took it as an
opportunity to impart recommendations for improving Progranimate. Those who did answer gave
very positive feedback, indicating the problems and pedagogy were an effective way to introduce
programming and problem solving. Some quotes are shown below.

Formal and Action Research Methodologies Chapter7 – Development and Evolution
Page 196
„I think it‟s a very good way of doing it because you are starting off very simply and you begin to think ooh, ooh I know where to put this.‟
„Building it up I think is an excellent way of doing it rather than throwing someone in at the deep end.‟
„It is something that they will relate to, so that makes it more realistic; so it‟s a nicer way.‟
It was suggested that the online worksheets impacted usability as the user had to flick between them
and Progranimate. The teachers recommended that for greater effectiveness they also be provided
as printed handouts.
Would Progranimate fit easily within a GCSE or A-level computer science based module?
An important factor in the adoption of a tool such as Progranimate is how easily it can be
integrated with teachers‟ practices and subject syllabus. The feedback gained revealed that all of the
teachers believed Progranimate would fit in well with secondary school computing subjects with a
programming element. Some comments are below.
„Yes, easily, as a starter for ten when they get a first chance at programming. It may well be more useful for projects as well where they can actually test the code before using it.‟
„Yes, it would; they find it hard a lot of our second years when they go into programming. I think this would be a benefit to them actually.‟
„We deliver mainly HE degrees and HNDs and things, it would be even useful for that initially.‟
„Having an introductory unit of programming would fit in nicely, before you start going into the Visual Basic programming language itself.‟
Would you Recommend Progranimate to others?
The response gained was a resounding and definite yes from all evaluators, for example.
It‟s a brilliant introduction to programming.
I can‟t see any problems using this in a year six primary classroom. I would like to show my wife who is a
year six teacher and IT coordinator and I think she could use that.
Cost Concerns
A concern amongst the teachers was cost. They sought assurance that Progranimate was not
eventually going to be a chargeable service, as they felt this would be a barrier to its use in schools.
Currently, there are no plans to charge for access to Progranimate.

Formal and Action Research Methodologies Chapter7 – Development and Evolution
Page 197
7.5.4.5 Study Four Conclusions
Though only an hour long and consisting of eight evaluators, the results of this study showed that
Progranimate had achieved a good level of usability. However, several useful suggestions were made
regarding modifications to improve Progranimate‟s usability. Most of these suggestions were
adopted in subsequent versions of Progranimate.
The study also showed that all of the teachers held Progranimate in high regard, considering it an
effective, motivating and interesting way to introduce programming and problem solving to
secondary school pupils. The suggestions made showed Progranimate may be suited to a wide age
range such as year nines (13 year olds) and not just at GCSE or A-Level (or equivalent).
In questioning the efficacy of Progranimate‟s individual features the teachers believed that the
combination of flowcharts and code together and the animation were effective, helpful, clear and
insightful aids to the novice‟s comprehension of programming and running computation.
This study trialled the idea of paperless worksheets, hosting them purely online with no handouts
given. It was found the constant flicking between the online worksheet and Progranimate may be a
source of frustration. It was recommended that the online worksheets be printable, to maximise
their efficacy. In the weeks following the study, this useful suggestion was implemented.
To conclude, this study has reinforced the finding of the second evaluation study (section 7.4.2)
which suggested that Progranimate may, in addition to our original target audience (university first
or foundation year students), be suited to a younger audience.
7.6 Phases 4 and 5 - Progranimate Versions 3 and 3.5
Following the previous two studies, several incremental versions of Progranimate were developed in
research and development phases four and five. To keep things simple, these improvements are
categorised under two key versions, 3.0 and 3.5. Within the bounds of this research, version 3.5 is
considered the most recent and polished version of Progranimate and was introduced in chapter 4.
Besides major improvements in the underlying structure, these versions incorporated many of the
usability improvements suggested in the previous two studies. These two versions are used in the
full scale evaluation studies detailed in chapter 8 and 9.

Formal and Action Research Methodologies Chapter7 – Development and Evolution
Page 198
7.6.1 Phase 4 - Version 3.0 Improvements
This section discusses the changes brought in with research and development phase five.
7.6.1.1 Application Restructuring
The central aim of this process was to make Progranimate more maintainable and extensible by its
original author and others who may develop and maintain it. Prior to v3.0 class structure was
inherited from the initial prototype which was developed quickly and purely as a proof of concept.
Version 2.5 consisted of 63 unorganised class files and was quickly becoming a can of worms. For
this reason, Progranimate‟s class files were reorganised into ten functional units (packages) as
shown in figure 7-3. Several class files were also rewritten, combined or split. Tried and tested
object oriented design patterns were also implemented, for example the model view controller
(MVC). Each class file was thoroughly documented using inline comments written especially for the
Javadoc documentation tool (Sun Microsystems, 2009c). This enabled Progranimate‟s code to
become self documenting, which has obvious maintenance benefits. Provided in appendix B section
E is a complete class diagram for Progranimate and descriptions of each class and package.
Figure 7-3. The Package Structure of Progranimate V3.0to V3.5
7.6.1.2 Copy Cut and Paste
The previous study highlighted the need for drag and drop or copy, cut and paste features as a
mechanism for easily moving program constructs. Cut, copy and Paste features were subsequently
implemented in version 3.0 and above. The copy, cut and paste features were placed in the edit
menu, but were also made available via a new popup menu which is accessed by right clicking any
flowchart component or line of code. When a structure is cut or copied, any internal constructs are
taken with it; when pasted, its internal constructs are pasted too. This made moving entire
structures, their internal components and nested structures achievable in just two mouse clicks,
which is far more convenient than the old method of deleting and re-creating components.

Formal and Action Research Methodologies Chapter7 – Development and Evolution
Page 199
7.6.1.3 Improvements to Edit and Delete Mechanisms
From the previous two evaluations, it because apparent that the current method for editing and
deleting program constructions and variables was for some unintuitive. Some thought the edit or
delete button should be selected first and then the program construct, whilst others wanted it the
other way around. For this reason it was decided to allow both ways to achieve the same result. It
was also recommended that edit and delete be available via a right click popup menu. As the right
click popup menu had been developed for the new copy, cut and paste features, edit and delete
were also added. These options were also incorporated in the edit drop down menu. By allowing
edit and delete operations to be carried out in multiple ways, it was hoped these features would
prove to be more intuitive.
7.6.1.4 Supporting Different Print and Read Syntax
This improvement was motivated by the fact that Java has no standard syntax for reading keyboard
input. As discussed in section 3.4.3.3, a visualisation tool will less likely be adopted if from the
instructors‟ perspective, the visualisation technology incurs too much overhead to make it
worthwhile. If Progranimate is to be adopted by teachers, its code needs to align with that of their
learning material. For this reason the Read and Print features of Progranimate were extended so
that within a single language, multiple forms of syntax are possible. From Progranimate v3.0
onwards it became possible to select the syntax used for print and read via a new set of options
in the advanced settings panel. In the Java language it is possible to choose one of four read
syntaxes (shown in figure 7-4) and in VB6 and VB.NET different read and print syntaxes i.e.
MsgBox and InputBox or Console. The syntax used can be pre-specified prior to launching via
parameters contained in the JNLP launching files or HTML applet parameters; this is discussed in
Progranimate‟s manual (Scott, 2009a) .
� Figure 7-4. Implemented Read Syntaxes in Java
METHOD A: The Scanner Class *Default*
Scanner input = new Scanner(System.in);
x= input.nexInt();
METHOD B: Text Class of Judy Bishop’s book Java Gently
x = text.readInt(“”);
METHOD C: Buffered Reader
InputStreamReader in = new InputStreamReader(System.in);
BufferedReader input = new BufferedReader(in)
x = Integer.parseInt(input.readLine());
METHOD D: A JOptionPane from the Swing library
x = Integer.parseInt(JOptionPane.showInputDialog(null, "Read"));

Formal and Action Research Methodologies Chapter7 – Development and Evolution
Page 200
7.6.1.5 A Proper Website for Progranimate
Originally, Progranimate‟s website (Scott, 2009b) served as a proving ground for the JWS
deployment methodology and was very basic. The success of the previous two evaluation activities
had proven Java Web Start to be an appropriate mechanism for deploying Progranimate on and off
the campus. For this reason it was decided to develop a much more professional looking website to
host, integrate and grow with Progranimate.
As platform independency was a key design consideration for Progranimate, the same must be
achieved by its website. The website was deployed on a standard web server and developed using a
combination of HTML, CSS, and Java Script. This has been achieved by using W3C standards,
compliant HTML mark-up and CSS (W3C, 2007, W3C, 1999) throughout the site. Previous
evaluation studies demonstrated that the URL originally used to access Progranimate was
impractical. With the re-development of the website, a more practical shorter URL was put in place
which is: http://www.glam.ac.uk/progranimate/.
Within the bounds of this research, the website was designed to provide free open access to
Progranimate, provide information about the tool, and host its online problem solving activity
packs. It was designed with extensibility in mind and in the future may incorporate interactive
tutorials and web 2.0 technologies. The intended audience for the site is university, college and
secondary school students and their tutors or lecturers. Therefore, other than access to
Progranimate and the programming problems, the website provides information about
Progranimate, the requirements for launching it, example problems, user guides, and contact
information. Figure 7-5 shows the basic structure of the website.
Figure 7-5. Website Structure

Formal and Action Research Methodologies Chapter7 – Development and Evolution
Page 201
7.6.1.6 Introductory Worksheet for Pedagogy Stage B2
In study 3 (Bridgend college) it became apparent that despite prior programming experience, many
students had under developed problem solving skills. Some found the increment in difficulty
between their first and second programming problems too great and did not complete problem
two. This demonstrated a need to lower the learning curve of both Progranimate and the problem
solving nature of the programming activities.
Originally, stage B (guided problem solving) of the scaffolding pedagogy consisted only of a tutor
lead, class based, collaborative problem solving activity. To lower the learning curve of the problem
solving activities and Progranimate, this was divided into two sub stages named B1 and B2. Stage
B1 forms the original tutor lead problem solving activity, whilst B2 follows this up with an
additional paper based guided problem solving exercise. The B2 worksheets allow students to work
alone at their own pace, familiarising themselves with Progranimate and the problem solving skills
needed to translate the problem description into a program. Pedagogy stages B1 and B2 are
discussed more detail in section 5.4
Currently, two stage B2 worksheets have been developed. The first is a sequential activity entitled
„the sweetshop‟ and is designed for a novice‟s first encounter with programming and Progranimate.
The second is entitled „The backstage pass‟ and is an array based activity. The array based activity
was designed to teach the students how to use the array handling features so they may use them in
further problem solving activities. An example of a stage B2 worksheet is provided in appendix C,
further examples can be found of Progranimate‟s website (Scott, 2009b).
7.6.1.7 Additional Programming Problems
Three new activity packs were developed and are discussed below. These can be found on
Progranimate‟s website (Scott, 2009b). Examples of the „Cardiff Animal Shelter‟ activity pack can
also be found in appendix C.
The Cardiff Animal Shelter – Sequence
A set of five sequence based programming problems is themed around the costs of feeding the
animals of an animal rescue centre. This activity pack is designed to follow on from the
previous sequential one (McDullards) and increases the challenge presented to the learner.

Formal and Action Research Methodologies Chapter7 – Development and Evolution
Page 202
The Wok-U-Like Takeaway - Arrays
Five array based problem solving activities are themed around Chinese takeaway food orders.
These exercises are intended to be used when novices are first introduced to arrays. They aim
to help the novice conceptualise arrays and realise the scenarios in which they may be useful.
Olympic Scoring Systems - Arrays
A second set of five array based activities, this time with an Olympic theme. The learners build
various event scoring systems and a medals table. This activity pack was developed to offer
more complex array based problems and usage scenarios and is therefore intended to follow on
from the „Wok-U-Like‟ activity pack. The exercises culminate in the construction of a bubble
sort based program that utilises three 1D arrays.
7.6.2 Phase 5 - Version 3.5 Improvements
This section discusses the improvements that were made in research and development phase five.
7.6.2.1 For Loop
Prior to version 3.5 Progranimate only supported one looping structure, the while loop. Besides
the while loop, an additional looping structure commonly taught to novices is the for loop.
Compared with the while loop, for loops are much more intricate and thus much more prone
to conceptual and syntactic errors. Therefore, its inclusion within Progranimate was seen as
important and included as of version 3.5. The feature is discussed in detail in section 4.7.5.4.
7.6.2.2 Error Handling Improvements
In study 3 (Bridgend college) it became apparent that the error messages of Progranimate needed
improving. The results of this study showed that the weaker students had difficulty comprehending
them, a problem that was exacerbated by their tendency to dismiss an error without taking the time
to read it properly, if at all. Prior to version 3.5 all errors were presented to users via a modal popup
alert box; two examples are shown below in figure 7-6.
Figure 7-6. Popup Error Messages.

Formal and Action Research Methodologies Chapter7 – Development and Evolution
Page 203
The problem with modal popup boxes is that when they are displayed, the underlying application
cannot be used until they have been dismissed. This means that the user must hold the error
message in working memory while they attempt to address its cause. This is a potential source of
cognitive overload, especially seeing as the errors contain terminology that the novice will be new
to, e.g. integer, string, double, operator and variable. Furthermore, with a pop up dialog it is
sometimes not clear which input field contains the source of the error which impinges on their
effectiveness.
For the reasons outlined above, Progranimate v3.5 replaced the error dialogs with an improved
error displaying mechanism. Any syntax errors discovered are displayed in red underneath the input
field where they occur. This allows the error message to persist on screen whilst the user attempts
to fix the problem. This means they no longer have to hold an error message in working memory,
thus freeing up cognitive resources. Also, the error cannot be simply dismissed as before, the
message will remain until the field has been validated. Furthermore, because the error appears
below the relevant field the user gets a better idea of what is causing it. Two examples of the
improved handling mechanism are shown in figure 7-7.
-
Figure 7-7. Improved Error Handling Mechanisms.
7.6.2.3 Renaming Variables
Prior to Progranimate version 3.5, the ability to rename variables had been inhibited. This was done
to prevent the expressions from containing undeclared variable names and thus prevent runtime or
compile time errors. In the Secondary School and College Teachers evaluation a need was
established to enable this functionality. As of Progranimate version 3.5, the renaming of variables
became possible. However, this can now be achieved safely. When a variable is renamed, all
program references to it are also updated. This prevents the situation in which a program can
contain undeclared variables.

Formal and Action Research Methodologies Chapter7 – Development and Evolution
Page 204
7.6.2.4 Making the User Interface more Colourful
A finding of both study 3 (Bridgend College) and study 4 (school and college teachers) evaluations
was the need to make Progranimate more colourful and appealing at first glance. One teacher
suggested that buttons of the palette be coloured to match the flowchart components they invoke.
Based on this idea, the palette has been visually enhanced; the palette buttons now contain coloured
icons representing their functionality.
A second enhancement was made to improve Progranimate‟s overall appearance. A blue colour
scheme was applied to complement the colours of the recently developed website and to make
Progranimate stand out from the stereotypical grey windows applications. Figure 7-8 shows how
the appearance of Progranimate v3.5 improves on its predecessor.
Version 3.0 Version 3.5
Figure 7-8. A Comparison Between the User Interfaces of Versions 3.0 and V.5
7.6.2.5 Exporting Graphics and Code to File
As of version 3.5, features were included so Progranimate‟s flowcharts could be saved as graphics
files. The graphics can be saved in high, medium or low resolution in BMP, PNG or JPG file
formats. Alongside this feature, the ability to save the code to a text file was also developed. These
features enabled Progranimate to become a documentation aide, a feature which has since been
keenly exploited by the first year programming students at Glamorgan.

Formal and Action Research Methodologies Chapter7 – Development and Evolution
Page 205
7.6.2.6 Performance Optimisations
A final enhancement to Progranimate version 3.5 was to code profile Progranimate to discover
which parts of its program code were executed most commonly and why. As a result, several
commonly executed procedures were optimised, and various redundant procedure calls were
prevented. As a result of these optimisations the flowchart was able to smoothly redraw and scale
itself in real time as the zoom slider was moved. This capability has surprising user appeal and
makes Progranimate appear effortless and responsive.
7.7 Chapter Conclusions
This chapter discussed the conception and development of Progranimate and how the results of
four preliminary evaluation activities influenced its continued evolution to what is now version 3.5.
Table 7-15 presents an overview of Progranimate‟s features and how enhancements, new features
and associated systems were applied to it through its successive versions. To show how features and
enhancements were derived, three columns are shown marked FR, AR and GI which are explained
in table 7-14 below.
From the data presented in table 7-15 it is possible to provide an overview of how Progranimate‟s
features, improvements, and associated pedagogy, activity packs and website were derived.
38 % of features were developed as a result of formal research.
36% of features were developed or enhanced as a direct result of action research.
26% of features were enhanced to improve flexibility, scope, usability or simplicity.
From this it can be concluded that the evaluation studies played a major role in improving
Progranimate‟s user interface and feature set.
Table 7-14. How Features were Derived
Letter Code Description
FR New feature as a result of formal background research
AR New feature or improvement of exiting features as a direct result of action
research i.e. the findings of evaluation studies.
GI General improvement of an existing feature to enhance Progranimate‟s
flexibility, scope, usability or simplicity.

Formal and Action Research Methodologies Chapter7 – Development and Evolution
Page 206
Table 7-15. The Feature Set and Evolution of Progranimate
Version Feature FR AR GI
V1.0
Flowchart construction X
Animated executable flowcharts X
Variable inspection X
Saving & loading X
Edit & deletion X
Simplified error handling X
V2.0
Nesting of structures X
Java Code generation & synchronisation X
Code generation menu X
View menu X
Flowchart improvements X X
Handling negative values X
Undo Feature X
Reversal of speed slider values X
V2.5
Stability and performance improvements X
1D array handling and array inspector X
Enhanced expression handling and semantics. X
VB.NET and VB6 code generation & translation X
Printing of flowcharts and code X
User interface improvements (simplified) X
Edit and delete mechanism changed X
Web deployment capabilities X
Problem solving pedagogy X X
Test website X
V3.0
Application restructuring X
Copy cut and paste X
Edit and delete mechanism changed again X
Support for different print read syntax X
Full scale website development X
Pedagogy stage B1 introductory worksheets X
Additional programming problems X
V3.5
For loops X
Enhanced error handing X
Renaming variables X
Coloured Icons on the palette X
User interface colouring X
Export graphics and text to file X
Performance optimisations X
TOTALS: 15 14 11
Originally, Progranimate‟s intended target audience was the University‟s foundation and first year
students taking their first steps in programming. However, the four evaluation activities
documented throughout this section demonstrated that Progranimate is suitable for a much wider
audience than originally envisaged. The studies show that in addition to University level novices,
Progranimate is also suitable for fifteen to seventeen-year-olds in secondary school and college.
With each successive version of Progranimate, the evaluation studies became more elaborate and
in-depth. However, across these studies there were several consistencies. Every study demonstrated
that Progranimate was enjoyable and therefore a motivating way to learn the concepts of

Formal and Action Research Methodologies Chapter7 – Development and Evolution
Page 207
programming and problem solving. Interestingly, a study comprising mostly of female evaluators
provided one of the most positive responses in this regard. Another consistency was in ease of use.
Although several improvements were suggested along the way, every study showed that
Progranimate was considered easy to use and thus a minimal overhead to programming. Another
consistent finding was evaluators‟ positive opinions of the flowcharts. Furthermore, despite having
nine months of VB6 exposure, most the Bridgend evaluators (study 3) found the flowcharts more
insightful and comprehensible than the VB6 code. The efficacy of the animation features was
evident in all but the second study (due to stability issues). The evaluators‟ responses demonstrate
that the vast majority viewed the animation features as effective in aiding both program
development and comprehension of execution.
Regarding error handing, the results of the first two studies showed that for trivial tasks
Progranimate is not error prone. Due to the increased complexity of the programming tasks and
their longer duration, the third and forth studies were able to provide a more robust evaluation of
these features. In the Bridgend college study it transpired that the stronger students found the error
messages helpful, though the weaker ones had problems understanding their full meaning. This
problem was exacerbated by the evaluators‟ tendency to close the errors without reading them
properly (if at all) and by the fact they had to hold the error in working memory due to its
appearance on a modal popup. Version 3.5 aimed to address this problem with improvements to
the error handling features; these are evaluated in chapter 8.
The Bridgend study and, to a lesser extent, the high school and college teachers evaluation
demonstrated that some users experienced some initial trepidation when first exposed to
Progranimate. Visual enhancements made to version 3.5 have aimed to address these issues and are
evaluated in chapter 8.
The Bridgend study showed that Progranimate, coupled with the problems of the scaffolding
pedagogy, can improve the problem solving skills of novices. Those who had completed more than
two individual exercises saw dramatic improvements in completion time from the third exercise
onwards, despite the incremental difficulty of the tasks. However, the weaker students found the
increment in difficulty between their first and second exercises too great and did not progress
further. With this in mind, stage B of the scaffolding pedagogy was augmented with an additional
stage to help the novices learn Progranimate and the thinking skills needed to solve the problems.
Regarding problem solving ability, the Bridgend study showed that despite the evaluators‟
significant exposure to VB6, many had underdeveloped problem solving skills. This is evidenced
by many evaluators‟ poor achievements in the problem solving tasks. It was thought that their poor

Formal and Action Research Methodologies Chapter7 – Development and Evolution
Page 208
problem solving skills were connected to the VB6‟s lack of algorithmic focus. It was concluded that
this evidenced the need for an instructional practice focusing on problem solving.
An evaluation conducted with secondary school and college teachers demonstrated that they held
Progranimate and its programming problems in high esteem, particularly in regard to the flowcharts
and animated execution. They also expressed the opinion that it would integrate quite easily within
their syllabuses and teaching practices.
The studies documented in this section served as a proving ground for Progranimate, the
scaffolding pedagogy and problem solving activities. The initial aim was to ascertain the viability of
pursuing further work. As studies progressed, the emphasis shifted to refining Progranimate. This
resulted in the latter versions of Progranimate 3.0 and 3.5 which were used in the full scale
evaluation stages of this research, as detailed in the next two chapters.

Evaluation by 13 to 17 Year Olds and Teachers of Them Chapter 8 – Secondary School Evaluations
Page 209
Chapter 8 Secondary School Evaluations
Secondary School Evaluations
Evaluation by 13 to 17 Year Olds and Teachers of Them
8.1 Introduction
The studies of the previous chapter were conducted in order to refine Progranimate to what
became Progranimate versions 3.0 and 3.5, which were used for the final evaluations of this chapter
and the next. During these evaluations it was realised that Progranimate was suited to a much wider
age range than had originally been envisaged. This lead the final evaluations down two paths,
evaluations with university students (the original target audience) and evaluation with secondary
school pupils.
This chapter focuses on evaluating the learning effectiveness of Progranimate when used in
teaching programming to secondary school pupils. It consists of three studies as follows:
Section 8.1 - Study 5 - Year 11 and year 12 (ages 15 to 17)
Section 8.2 - Study 6 - Year 9 to year 11 (ages 13 to 15)
Section 8.3 - Study 7 - Secondary School teachers of computer science and ICT
The data sought by studies 5 and 6 aims to objectively and subjectively measure the impact
Progranimate, the pedagogy and programming activities were having on the problem solving skills
of the school pupils. No pre-test was needed to ascertain the baseline of the pupils‟ programming
knowledge, as all but a very small proportion (2 students had a minimal experience) had absolutely
no prior experience of programming. The evaluators‟ subjective opinions regarding usability and
efficacy were gained via a questionnaire, the methodology and rationale of which was discussed in
section.6.3.2.1. In addition to this, the teachers were interviewed to capture unanticipated data that
could not be gained by questionnaire methods alone. Finally, observation was also used as a basis
for establishing how the evaluators were making use of Progranimate, and for clarifying some of the
questionnaire responses. An overview of the data gathering techniques in use and rationale for the
questions asked can be found previously in Chapter 6.
The findings of these studies demonstrated that Progranimate, its pedagogy and associated activities
are very well suited for introducing programming and algorithmic problem solving to secondary

Evaluation by 13 to 17 Year Olds and Teachers of Them Chapter 8 – Secondary School Evaluations
Page 210
school pupils from year nine upwards. The opinions of the secondary school teachers also backed
this data and indicated that Progranimate, coupled with its pedagogy and online problems, would fit
in well with the GCSE and A-Level computer science subjects and that this would also make
delivering programming to pupils easier, more convenient and thus more likely.
This section starts off with study five, which was conducted with pupils aged fifteen to seventeen.
In the next section study six then moves on to evaluate Progranimate with thirteen to fifteen year
olds. Finally, study seven evaluates Progranimate with a cohort of secondary school teachers from
schools from the South Wales region of the UK.
8.1.1 Evaluation Criteria
The evaluation criteria influencing the studies of this chapter is a subset of that discussed in chapter
6, placed in the context of the secondary school. The evaluation questionnaires, interviews and
observations used these criteria to guide what questions were asked and what observations were
important to this research. Below table 8-1 lists the criteria and recaps the justifications for their use
as discussed in chapter 6.
Table 8-1. Secondary School Studies Evaluation Criteria
No Thesis Aim Criteria Justification
2 1 Is Progranimate usable with respect to novice secondary school pupils?
An important evaluation consideration for any computer program is usability, as this will inevitably impact on its efficacy in assisting novice programmers. As discussed in chapter 6, the various aspects looked into are: ease of use, enjoyment, reliability and responsiveness and of Progranimate‟s website and online materials.
2 1 Is the Progranimate (as a whole) helpful in supporting the pupils‟ learning of Programming?
In evaluating efficacy, the first priority was to discover if Progranimate and its features as a whole were helping school pupils learn programming.
3 1 Are the flowcharts helpful in supporting the pupils‟ learning of programming?
Chapter 3 demonstrated that flowcharts have the potential to aid novices in learning programming. Whilst previous studies have shown they are effective with secondary school pupils, further indications were sought, especially in light of the changes made to Progranimate since these studies were conducted.
4 1 Is the code generation helpful in supporting the pupils‟ learning of Programming?
As identified in chapter 2, having novices write code before they have gained knowledge of the concepts that underlie the language means novices can spend too much time wrestling with code. Consequently they do not develop a well rounded skill set. Progranimate‟s code generation features aim to overcome this by lowering the learning curve of code by having the novices focus on its meaning before attempting to write it themselves. This criterion was devised to evaluate the impact and helpfulness of Progranimate‟s code generation features.
5 Are the animation features useful in supporting the pupils‟ learning of Programming?
As advised by the several authors referenced in chapter 2, simulation strategies need to be expressly taught to novices to help them understand execution. Progranimate‟s animation features aim to achieve this and it is what this criterion aims to assess.

Evaluation by 13 to 17 Year Olds and Teachers of Them Chapter 8 – Secondary School Evaluations
Page 211
6 1 Does Progranimate focus on problem solving and assist the development of problem solving skill?
Helping the novice to focus on and overcome their problem solving weaknesses was a key motive behind Progranimate‟s design. This criterion directs the evaluation towards establishing if this aim was met for University students at degree level.
12 3
Are Progranimate, its features, associated pedagogy and programming activities effective in introducing programming and problem solving to secondary school pupils?
The rationale for this criterion is to provide objective and subjective data to show how Progranimate, the pedagogy and associated programming activities effect the problem solving skills of inexperienced novice programmers who engage with it.
13 3
Are Progranimate, its features, associated pedagogy and programming activities a fun and motivating way to introduce programming in secondary schools?
Poor teaching of programming may depict the subject as unstimulating and uninteresting. It is important that a novices first experiences of programming are interesting and stimulating as this will encourage further study. Therefore measuring the levels of motivation and pleasure derived from Progranimate‟s use is important.
14 4
Do the teachers consider Progranimate to be an effective and motivating way to teach programming in secondary schools?
The poor quality and often avoided introduction to programming in secondary schools is largely due to the skills and confidence of the teachers. Therefore the evaluation needs to discover if Progranimate, the pedagogy and online programming problems can address these problems by making programming a more attractive and convenient option for teachers given the wide range of technical ability that exists.
15 4
Do the teachers feel they have the skills and confidence to teach programming via Progranimate and the programming activities of the scaffolding pedagogy?
16 4
Do the teachers feel teaching programming via Progranimate, the pedagogy and programming problems is within the capabilities of the secondary school ICT/Computing teacher?
17 4
How do Progranimate, the pedagogy and programming problems impact the workload of the teacher, and is this workload a barrier to its use?
Another problem impacting the introduction of programming in secondary schools is the time teachers believe they need to teach the subject effectively. Progranimate coupled with the pedagogy, and online problems has been designed to add a minimal workload on the teacher. This aims to make the interdiction of programming in schools more convenient, less time consuming and thus more likely.
8.2 Study Five - Novices Aged Fifteen to Seventeen
This study was conducted to assess the effectiveness and usability of Progranimate, its pedagogy
and online programming problems with regard to year 11 and 12 secondary school pupils. This was
measured by gaining the students opinions via questionnaire (subjective data) and by monitoring
changes in problem solving ability as they engaged with Progranimate and the problem solving
activities they were set. By including the year 11s, this study was able to assess Progranimate with a
younger audience than in previous evaluations. This evaluation study was conducted with
Progranimate version 3.0, which was the most current version at the time. The language was set to
VB.NET,as the syntax is clearer and more consistent than the other option, Java. Besides seeking
assurances of usability and efficacy, the study was also used to discover any bugs that recent
developments had introduced.

Evaluation by 13 to 17 Year Olds and Teachers of Them Chapter 8 – Secondary School Evaluations
Page 212
8.2.1 Study Participants
The participants of the study were 32 secondary school pupils. Of these, 27 provided statistical data
for the study. The others did not identify themselves on questionnaires and forms or hand them in.
Table 8-2. Evaluators Providing Data for Study Five
Participants
providing data 26
Total 15s: 5 Males: 14 Year 10s: 7
Total 16s: 11 Females: 12 Year 11s: 12
Total 17s: 10 Unknowns: 7 Further more detailed participant data can be found in appendix G section A..
8.2.2 Evaluation Method
The study was conducted on the University of Glamorgan‟s campus in a classroom consisting of
twenty networked PCs. The duration of the study was intended to be two one-hour sessions held
on consecutive days. The study was originally meant to be comprised of 15 evaluators. However,
due to a cancellation elsewhere on campus, the first session consisted of 32 pupils, 17 of whom had
not expressed an interest in programming. Consequently, in the first session most evaluators had to
work in pairs due to the number of computers available. The evaluators of the first session also
arrived 15 minutes late; this meant the initial stages of it were hurried.
The original plan was to introduce Progranimate via pedagogy stages A, B1 and B2. However, due
to the limited time available, this was condensed to a quick overview of Progranimate followed by
the provision of the stage B2 worksheet guided problem solving exercise (“The Sweet Shop”). It
was hoped that this pedagogy stage B2 worksheet would make up for the lack of a full introduction.
However, it transpired that the condensed introduction resulted in some initial confusion and
frustration for several evaluators. This suggested that the tutor lead stages of the pedagogy (A and
B1) are a crucial component of the scaffolding pedagogy and should not be avoided.
Once the evaluators had completed the pedagogy stage B2, they were tasked with completing as
many pedagogy stage C and D sequential programming exercises as possible, starting with the
„McDullards‟ activity pack then moving onto the slightly more difficult „Cardiff Animal Shelter‟
pack. All problems were accessed online but also provided as printouts. The evaluators were also
provided with a guidance sheet; informing them of the expressions possible in Progranimate‟s
sequential programming constructs. Attached to each exercise worksheet was a monitoring form to
record completion times (start time, end time), any help received (including from whom), problems
encountered and bugs discovered.

Evaluation by 13 to 17 Year Olds and Teachers of Them Chapter 8 – Secondary School Evaluations
Page 213
In the second session the evaluators continued tackling the problems of pedagogy stages C and D.
This time only the intended 15 pupils participated, all of whom arrived on time. This meant the
pupils no longer had to share computers. It also permitted the delivery of the introduction that
should have been given in session one. This appeared useful, as the session resulted in far less
confusion and difficulty being displayed by the evaluators. Many had not saved their problems from
session one so started over with the second „Cardiff Animal Shelter‟ activity pack.
At the end of the second session the 15 pupils were given a Likert based questionnaire to gain
opinions of usability and efficacy. All but one of the 15 returned their questionnaire. Each question
used a five point scale where: 0 = strongly disagree, 1 = disagree, 2 = undecided, 3 = agree and 4 =
strongly agree. The responses for each question was then averaged and calculated as a percentage of
the maximum possible average of 4. Also calculated were the percentages for agreement (strong
agreements + agreements), indecision and disagreement (strong disagreements + disagreements).
Each question provided space to add relevant comments. The last three questions allowed the
evaluators to write what they liked and disliked about the experience as well as other relevant
comments.
8.2.3 Results
The results of this study are summarised and discussed under four headings: usability, efficacy,
problem solving activities and problem solving achievement. The results from the questionnaire,
salient written comments made by the evaluators and observations made are discussed and shown
throughout these three sections. Complete results from this study can be found in appendix G.
8.2.3.1 Usability
The overall responses to the usability questions are presented in table 8-3 and discussed below
grouped under five headings.

Evaluation by 13 to 17 Year Olds and Teachers of Them Chapter 8 – Secondary School Evaluations
Page 214
Table 8-3. Study 5 High School Pupils Aged 15-17 - Questionnaire Results
Q Question Text %
Ave %
StDev %
Mode %
Median %
Agree
%
Undecided
%
Disagree Rsp
Distribution
0 1 2 3 4
1 I enjoyed using Progranimate 55.36 14.47 50 50 28.57 64.29 7.14 14 0 1 9 4 0
2 I enjoyed solving the programming problems 53.57 19.26 50 50 35.71 42.86 21.43 14 0 3 6 5 0
3 When I first saw Progranimate it looked easy to use
50.00 27.74 25 37.5 42.86 7.14 50.00 14 0 7 1 5 1
4 I found Progranimate easy to use 60.71 25.41 75 62.5 50.00 28.57 21.43 14 0 3 4 5 2
5 Progranimate was speedy and responsive in my usage of it
67.86 18.16 75 75 71.43 21.43 7.14 14 0 1 3 9 1
6 Adding program components was easy to do 66.07 21.05 75 75 71.43 14.29 14.29 14 0 2 2 9 1
7 Editing or deleting a program components was easy to do
67.86 20. 4 75.00 75 78.57 7.14 14.29 14 0 2 1 10 1
8 Adding variables was easy to do 67.86 15.28 75 75.00 64.29 35.71 0.00 14 0 0 5 8 1
9 Editing or removing variables was easy to do 62.50 116.49 75 75 64.29 14.29 21.43 14 1 2 2 7 2
10 Progranimate behaved reliably 62.50 12.97 50 62.5 50.00 50.00 0.00 14 0 0 7 7 0
11 Progranimate behaved more reliably in the second session
71.15 13.87 75 75 76.92 23.08 0.00 13 0 0 3 9 1
17 The web site was easy to use 67.86 18.16 75.00 75.00 71.43 21.43 7.14 14 0 1 3 9 1
18 Launching Progranimate was easy 76.79 11.87 75.00 75.00 92.86 7.14 0.00 14 0 0 1 11 2 0 to 24.9% [0] = Strongly Disagree 25 to 49.9.9% [1] = Disagree 50% [2] = Undecided 50.9 to 74.9% [3] Agree 75 to 100% [4] = Strongly Agree
(Strongly disagree + disagree) *100/n = % Disagree Undecided *100/n = % Undecided ( strongly agree + agree)*100/4 = % Agree
Enjoyment (Q1 and Q2)
It was anticipated that enjoyment levels would result in similar opinions to previous studies
However, the enjoyment levels were more modest than in previous studies. This is thought to be
linked to the overcrowding, late attendance and hasty introduction of the first session, as this
caused confusion for some.
Question 26 asked the evaluators to write what they liked about the whole experience. Four salient
responses are shown below. Further responses can be found in appendix G section E.
„It made me use my brain.‟
„Solving the problems.‟
„Watching the whole program when it runs and calculates the results.‟
„Learning something new‟
Ease of Use (Q3 and Q4)
A goal of Progranimate‟s user interface was to minimise the intimidation that novices feel when first
exposed to a programming environment. This trepidation was measured by question three and
showed that whilst many believed it looked easy, almost as many did not. This evidenced the need
to improve Progranimate‟s initial appeal, as had also been identified in the developmental studies
three (Bridgend college) and four (school and college teachers). This issue was addressed in
Progranimate v3.5 (see section 7.6.2) which has been used in all subsequent evaluation studies of
this thesis.

Evaluation by 13 to 17 Year Olds and Teachers of Them Chapter 8 – Secondary School Evaluations
Page 215
Question four addressed ease of use. The responses to this question compared with those of
question two showed that in practice Progranimate was easier to use than it first appeared. The
results show half of the evaluators felt Progranimate was easy to use. Had a proper introduction
been given in session one, this may have been higher.
An analysis of the responses by gender revealed that on the whole, the males believed
Progranimate easier to use than the females. What transpires from this data is that when the female
responses are taken away, the average responses are become much more positive with question
three scoring a 70.83% and question four scoring a 75%. The results of this analysis are presented
in figure 8-1.
0
1
2
3
4
5
6
7
8
Q3M Q3F Q4M Q4F
Evalu
ato
rs
S-Disagree
Disagree
Undecided
Agree
S-Agree
0.00
10.00
20.00
30.00
40.00
50.00
60.00
70.00
80.00
Q3M Q3F Q4M Q4F
% o
f m
axim
um
po
ssib
le a
verag
eAverage
Figure 8-1. Study Five - Usability Questions 3 and 4 by Gender
Program Construction (Q6, Q7, Q8, Q9)
The responses to all three of these questions show that most evaluators believed that adding editing
and deleting program constructs and variables was easy to do. This demonstrates that for most of
the pupils, Progranimate presented a minimal overhead to programming.
A few evaluators were observed having a small degree of frustration in trying to delete variables. To
prevent programs from referencing undeclared variables, it is not possible to delete a variable that is
referenced in at least one program construct. Some mistook this as a program bug, despite the
existence of an error message stating „Variables cannot be removed while they are in use elsewhere within the
program‟. In the belated introduction of session two, the students were told of this functionality, and
issues related to it subsided.

Evaluation by 13 to 17 Year Olds and Teachers of Them Chapter 8 – Secondary School Evaluations
Page 216
Reliability and Responsiveness, (Q5, Q10, Q11)
Because Progranimate v3.0 was used for the first time in this study, it was important to see how its
new features and changes impacted its stability and performance. The responses to question five
show that most students believed Progranimate to be speedy and responsive. During the study no
performance or stability issues were observed. From this it was concluded that the improvements
did not introduce performance problems.
In questioning the reliability of Progranimate, question ten gained a 50-50 split between agreement
and indecision. The reason for this was the discovery of a few prominent but uncritical bugs
affecting some students in session one (described in appendix G section H). These bugs did not
preclude Progranimate‟s use or make its use difficult. These bugs were promptly resolved and a new
version of Progranimate was deployed online for the next day‟s session. Due to the bugs, question
11 asked if Progranimate performed more reliably in the second session. The responses (71%
average and 79% agreement) aligned with observations made in which no bugs were discovered in
the second session.
Progranimate’s Website and Web Launching ( Q17 and Q18)
While the focus of this research centres on Progranimate and its pedagogy, it was thought useful to
question the usability of Progranimate‟s new website. The results show that the large majority of the
evaluators considered it easy to use. There existed no written comments regarding problems with
the website, and none were observed. This indicated that the website is fit for purpose.
Question 18 gained feedback on the web launching features and received almost total agreement
Observations showed Progranimate launching as quickly any standard application, which is due to
the on campus access (the same network as the web server). This demonstrates the efficacy of the
JWS deployment mechanism in place.
8.2.3.2 Efficacy
The overall responses to the efficacy questions are presented in table 8-4 and discussed below
grouped under three headings: flowcharts, generated code and educational benefit.

Evaluation by 13 to 17 Year Olds and Teachers of Them Chapter 8 – Secondary School Evaluations
Page 217
Table 8-4. Study 5 – Results of Efficacy Questions
Q Question Text % Ave %
StDev %
Mode %
Median %
Agree
%
Undecided
%
Disagree Rsp Distribution
0 1 2 3 4
19 The flowcharts enabled me to understand the solution being developed
62.50 28.50 75.00 75.00 57.14 28.57 14.29 14 0 2 4 7 1
20 The use of colour was beneficial 69.64 14.47 69.64 1741.07 85.71 7.14 7.14 14 0 1 1 12 0
21 I have some understanding of the code generated
51.79 1.00 75.00 50.00 42.86 28.57 28.57 14 1 3 4 6 0
22 I could easily see what bit of generated code the flowchart represented
44.64 22.31 50.00 50.00 21.43 42.86 35.71 14 1 4 6 3 0
23 I felt I had learnt something by using Progranimate
62.50 18.99 75.00 75.00 64.29 21.43 14.29 14 0 2 3 9 0
24 I would recommend using Progranimate for the learning of programming
58.93 27.74 75.00 75.00 57.14 21.43 21.43 14 1 2 3 7 1
25 I would like to use Progranimate in my school
50.00 0.88 50.00 50.00 28.57 50.00 21.43 14 1 2 7 4 0
0 to 24.9% [0] = Strongly Disagree 25 to 49.9.9% [1] = Disagree 50% [2] = Undecided 50.9 to 74.9% [3] Agree 75 to 100% [4] = Strongly Agree
(Strongly disagree + disagree) *100/n = % Disagree Undecided *100/n = % Undecided ( strongly agree + agree)*100/4 = % Agree
Flowcharts ( Q19 Q20 )
The responses to question 19 show that despite the lack of prior programming knowledge or
formal tuition (other than the programming activities), the flowcharts enabled the majority to gain a
functional understanding of the programs they were constructing. A particularly outstanding result
was gained by question 20 which analysed the benefit of using coloured flowcharts. 85% of the
evaluators believed that the use of colour on the flowcharts was beneficial.
Generated Code ( Q21 Q22 )
The evaluators did not have any prior programming experience and during the sessions were not
instructed about the meaning of VB, other than what was presented in the worksheets and syntax
guidance sheets. Despite this 43% of the evaluators believed they had gained an understanding of
the code generated. This shows that Progranimate is teaching the declarative nature of
programming largely by itself.
Question 22 asked the evaluators if they could easily see how the flowchart and code related to one
another. This was aimed at assessing Progranimate‟s synchronised highlighting features which in
studies two (secondary school pupils) and three (Bridgend college) were seen as effective. These
results contradicted those of previous, studies gaining an agreement from only 21% of the
evaluators. With the data available from this study the reason for this result remains unclear, though
it is possible that it is linked to the lack of a thorough introduction in the first session. In future
studies this feature was explicitly demonstrated to the evaluators.

Evaluation by 13 to 17 Year Olds and Teachers of Them Chapter 8 – Secondary School Evaluations
Page 218
Educational Benefit ( Q23, Q24 and Q25 )
Question 23 aimed to discover if the evaluators felt they had learnt anything by using Progranimate.
The responses show that most considered the experience educationally beneficial. Further evidence
of efficacy was achieved by the responses to question 24 which show that most of the evaluators
would recommend Progranimate to others wanting to learn programming. However, when asked by
question 25 if they would like to use Progranimate in school, the responses showed a high degree of
indecision and a small number of both agreements and disagreements. This contradicts the findings
of previous studies. Had the first session run more smoothly and been less crowded, the responses
to this question may have been more positive and in line with those of other studies.
8.2.3.3 Problem Solving Activities
This section looks at the evaluators‟ opinions of the problem solving activities. These aspects were
covered by questions 12 to 16 and are presented below.
Table 8-5. Study 5 – Results of Problem Solving Questions
Q Question Text % Ave %
StDev %
Mode %
Median %
Agree
%
Undecided
% Disagree Rsp
Distribution
0 1 2 3 4
12 The programming problems were too difficult for me 28.57 23.73 25 25 14.29 7.14 78.57 14 3 8 1 2 0
13 The programming problems were to easy for me 51.92 16.01 50 50 23.08 61.54 15.38 13 0 2 8 3 0
14 The programming problems were at the right level of difficulty for me 66.07 27.05 75 75 71.43 21.43 14.29 14 1 1 3 8 2
15 The programming problems were well laid out 60.71 23.44 75 75 57.14 21.43 21.43 14 0 3 3 7 1
16 The programming problems were written in a way I could understand 51.79 22.92 75.00 50.00 42.86 21.43 35.71 14 0 5 3 6 0
0 to 24.9% [0] = Strongly Disagree 25 to 49.9.9% [1] = Disagree 50% [2] = Undecided 50.9 to 74.9% [3] Agree 75 to 100% [4] = Strongly Agree
(Strongly disagree + disagree) *100/n = % Disagree Undecided *100/n = % Undecided ( strongly agree + agree)*100/4 = % Agree
Problem Difficulty Level (Q12 and Q13, Q14)
It is important to establish if the difficulty levels of the programming problems were at the right
level for the evaluators, i.e. within their zone of proximal development (ZPD see chapter 5). The
responses show that overall the evaluators did not consider the tasks too hard or too easy and that
the majority believed they were at the right level of difficulty for them. To support the validity of
this data, a correlation coefficient was calculated with the individual responses to questions twelve
and thirteen; this showed an inverse correlation of -0.56.
Separating the responses of the year 10s and 11s revealed there were very little differences in the
average responses gained by the two groups. A breakdown of these results is shown in table 8-6.

Evaluation by 13 to 17 Year Olds and Teachers of Them Chapter 8 – Secondary School Evaluations
Page 219
Table 8-6. Study 5 – Perceived Difficulty of Problems by School Year
Q12 Q13 Q14
Year 10 35.0 50.0 65.0
Year 11 28.1 52.7 66.6
Average: 0.86 6.9 -2.7 -1.6
From this data it can be concluded that the problems were at the right level of difficulty for the
fifteen to seventeen year old age group of this evaluation.
Problem Worksheets ( Q15 and Q16 )
In questioning the clarity and layout of the worksheets, the results of question 15, and to a greater
extent 16, indicate that some improvements may be required. However, it is believed that the design
and wording of worksheets were not the primary cause of this modest score.
Due to the lack of a full introduction in session one, the evaluators were not fully briefed on some
of the terminology and conventions used in the problem solving worksheets e.g. variable,
parameter, component, integer and double. This lead to some initial confusion and minor
frustration, as is evidenced by some of the evaluators‟ written comments (see appendix G section
G.G.A). For example. in the pedagogy stage B2 worksheet they were asked to enter the program
name as SweetShop; the evaluators were unclear if this should be entered as one or two words. A
similar problem also occurred with variable names. Also, because the worksheets would talk of
monetary values in pounds and pence, some evaluators tended to enter 0.05p and not 0.05. The
modest scores may also relate to the existence of a two small typographical errors discovered on the
McDullards 1 worksheet. These errors prevented two of the listed expressions from validating.
However, this was quickly spotted and the class informed.
Any confusion experienced with the worksheets tended to subside once the second one had been
completed. This is further evidence that Progranimate and its programming problems have a short
but nonetheless noticeable learning curve.
With a proper introduction and the absence of typographical errors, these results could have been
much higher. Evidence to back this claim can be found in subsequent studies which gained a much
higher response for these questions.

Evaluation by 13 to 17 Year Olds and Teachers of Them Chapter 8 – Secondary School Evaluations
Page 220
8.2.3.4 Problem Solving Achievement
A questionnaire can at best only provide a subjective opinion of Progranimate‟s efficacy. By
analysing the evaluators‟ performance in the problem solving tasks, it is possible to establish the
efficacy of Progranimate, its pedagogy and problem solving tasks non subjectively. Problem solving
performance statistics were gained from 23 of the 32 participants. In session one, responses were
not obtained from a few attendees, as they failed to identify themselves on the monitoring forms.
However, feedback was obtained from all participants of session two.
The evaluators‟ written comments and the observations showed, as with earlier studies, the order of
expressions and components was a challenge, despite being isolated as a problem in pedagogy
stages C1 to C3. However, this was the sole aim of these activities and demonstrates the importance
of focusing solely on this crucial component of problem solving skills.
A striking statistic that emerged from this analysis was how the average completion times for each
problem were significantly quicker than those of study three (Bridgend college). This is especially
interesting, as the evaluators of this study had no prior programming experience, whereas in study
three the evaluators had nine months experience of VB6. To demonstrate this fact, table 8-7 shows
the average, maximum and minimum completion times (in minutes) of the McDullards problems
one and two. These problems were common to both studies, and in both studies were the first
pedagogy stage C worksheets tackled. These results suggest that despite the rushed introduction in
session one, the newly introduced pedagogy stage B2 introductory worksheet (the SweetShop) had a
significant impact on the pupils‟ problem solving abilities. However, a contributory factor could be
that the students of this study were brighter or just more motivated.
Table 8-7. Comparison of Problem Completion Times Between Study Three and Five
Study SweetShop McDullards1 McDullards2
Ave Max Min Ave Max Min Ave Max Min
Study 3 Bridgend College 0:22 0:37 00:01 0:23 1:45 00:03
Study 5 (this study) 00:18 00:30 00:15 0:18 00:35 00:10 0:14 00:20 00:10
Another prominent discovery is that on average, with each successive exercise the times to
completion tended to improve, despite the complexity of the tasks increasing. This is evidence that
Progranimate and the programming activities are increasing the evaluators‟ problem solving skills.
Data to demonstrate this finding is shown in table 8-8 and figure 8-2.
This data provides further evidence of the two problem learning curve of Progranimate. As in study
3 (Bridgend college) this data provides evidence that the problem solving tasks are improving
problem solving skills once two problems have been completed. Once the introductory worksheet

Evaluation by 13 to 17 Year Olds and Teachers of Them Chapter 8 – Secondary School Evaluations
Page 221
(stage B) and the first stage C problem have been completed, the times to completion begin to
improve dramatically. Note also that the times to completion of the second session improve
significantly. The second session was less crowded; the evaluators no longer had to share their
computer and as a result were less chatty and more focused on the task. Furthermore, in the
second session the evaluators got the introduction they should have been given in the first section.
Table 8-8. Problem Completion Statistics for Study Five
Sequential Programming Problems
Session 1: data available from 22 Evaluators Session2 data available from 15 Evaluators
B -Introduction Intro Sweet Shop
C1 McDullarrds1
C3 McDullards2
C1 Animal Shelter1
C3 Animal Shelter 2
C3 Animal Shelter 3
Ave Max Min Ave Max Min Ave Max Min Ave Max Min Ave Max Min Ave Max Min
0:18 0:30 0:15 0:18 0:35 0:10 0:14 0:20 0:10 0:07 0:11 0:03 0:04 0:05 0:03 0:03 0:05 0:02
Completed 23 Completed 17 Completed 6 Completed 15 Completed 10 Completed 4
Attempted 23 Attempted 23 Attempted 14 Attempted 15 Attempted 12 Attempted 4
Figure 8-2. Problem Completion Statistics For Study Five - Bar Chart
This data shows that despite having no prior programming experience, within the two hour long
sessions, the evaluators were gaining both programming knowledge and problem solving skills.
Unfortunately, due to the time constraints, no evaluator managed to complete the pedagogy stage
C4 or D problems. However, the small times to completion of the latter problems show that given
more time, some evaluators after only two hours of instruction would soon have been ready to
graduate past the purely sequential problems.
8.2.4 Study Five Conclusions
This study evaluated Progranimate, its associated pedagogy and sequential programming activity
packs with secondary school pupils aged fifteen to seventeen from school years 11 and 12. Several
interesting findings emerged from this study; these are summarised below.

Evaluation by 13 to 17 Year Olds and Teachers of Them Chapter 8 – Secondary School Evaluations
Page 222
Firstly, it was clear that Progranimate, its pedagogy and programming problems are very well suited
to the age range of evaluators participating in this study. It was also clear that in using Progranimate
and solving the exercises, the students were learning the sequential programming concepts whilst
developing problem solving skills. This is evidenced by their decreasing completion times and by
the feedback of the questionnaire.
From the questionnaire it was apparent that that the evaluators were gaining a functional
understanding of the programs they were constructing. This was due to the intuitiveness of the
flowcharts, as the majority of evaluators agreed that they enabled them to understand the solutions
being developed. Furthermore, a large majority (86%) considered the flowchart‟s use of colour
beneficial. Rather surprisingly, despite having no programming experience or instruction in the
VB.NET language (other than the programming problems and brief but belated introduction),
almost half believed they had gained some understanding of the code generated by Progranimate.
This knowledge was acquired primarily through the evaluators‟ active engagement with
Progranimate via the problem solving tasks. This demonstrates the efficacy of Progranimate, the
pedagogy and the problem solving tasks.
Used for the first time in this study was the introductory pedagogy stage B2 worksheet (The Sweet
Shop). The efficacy of this introductory worksheet was evident in the problem completion times of
the evaluators. Despite the lack of a proper introduction or any programming experience their
completion times were quicker than those of study 3 (Bridgend college), in which the evaluators had
nine months programming experience but no introductory worksheet. However, despite this
positive result, the lack of a proper introduction caused some initial confusion and frustration in
session one, which was rectified in session two by a belated introduction. This served to
demonstrate the importance of conducting scaffolding pedagogy stages A and B1, prior to the self
guided problem solving stages. Had this been conducted, the responses to some of the
questionnaire questions may have been more positive and in line with the findings of the previous
studies.
The efficacy of the web launching features was also evident in this study. It allowed Progranimate
to be accessed quickly and allowed bug fixes to be applied with a minimal deployment overhead.
The recently re-developed website was also seen as effective and very appropriate for hosting the
online activity packs and problems.

Evaluation by 13 to 17 Year Olds and Teachers of Them Chapter 8 – Secondary School Evaluations
Page 223
8.3 Study 6: Novices Aged Thirteen to Fifteen:
A secondary school teacher in study four (section 7.5.4) stated that besides high school pupils in
years 11 and 12, Progranimate might also be suitable for year 9s (13 and 14 year olds). Following
this suggestion, an evaluation activity was arranged with a local secondary school which consisted of
pupils from years 9 and 10. This evaluation activity was conducted off campus in a class room at
Dyffyrn Comprehensive School, Port Talbot, UK.
For this evaluation activity, the evaluators were using Progranimate version 3.5, which at the time
was a recent development. Prior to this study, this version had undergone extensive testing to iron
out as many bugs as could be found.
In a similar vein to the previous study this study aimed to gain the students opinions regarding
Progranimate‟s usability, efficacy and its effect on their motivation towards programming. Also
measured were the participants changes in problem solving skill brought about by their engagement
with Progranimate and the programming problems. The results of this study were surprisingly
positive, demonstrating that Progranimate, its pedagogy and associated programming problems
were a very motivating way to introduce and teach programming and algorithmic problem solving
at this age range.
8.3.1 Participants
The participants of the study were 41 male and female secondary school pupils aged thirteen to
fifteen from years nine and ten. The participants were not hand picked; they volunteered
themselves and had a wide range of scholastic ability. This ensured that the participants of the study
represented a typical classroom demographic. Computer programming does not form part of the
year 9 and 10 computing/ICT syllabus at Dyffyrn comprehensive. Therefore, the evaluators can be
considered complete beginners at programming. A breakdown of the participants is shown in table
8-9; further details can be found in appendix H section A, that accompanies this study.
Table 8-9. Participant Information for Study 6
Year 9 Year 10 Age and Year Unidentified
Total
Boys: 9 Boys: 13 Boy 1 Boys: 23
Girls: 9 Girls: 9 Girls n/a Girls: 18
13yrs 13 14yrs 20
14 yrs 5 15yrs 2
Total 18 Total: 22 Total: 41

Evaluation by 13 to 17 Year Olds and Teachers of Them Chapter 8 – Secondary School Evaluations
Page 224
8.3.2 Study Duration
The study duration was initially meant to be an hour and a half, from 10:30 till 12:15pm (including a
fifteen minute break). However, the pupils were having so much fun that the teacher and pupils
requested the study was extended until the end of the school day at 3:00pm. This resulted in a study
duration of three hours and fifteen minutes. Most students were able to stay for the extended
period, though a few had to leave early, as their attendance was required elsewhere. A breakdown of
the day is shown in table 8-10.
Table 8-10. Study 6 Duration Breakdown
Time Period Duration
10:30 – 11:15 45 Mins
Morning Break (15 mins) 11:30 – 13:00 1hr 30 Mins
Lunch Break (1 Hour) 14:00 – 15:00 1hr
Total: 3hr 15 Mins
The school‟s normal class duration is fifty minutes; the school‟s computing teacher stated that this
is due to the short attention spans of pupils at this age and lower. The participants of this study
were engaged in the same subject (programming and problem solving) for most of the day. This
clearly demonstrates that the combination of Progranimate, its pedagogy and the problem solving
tasks is a very motivating and engaging way to teach programming in secondary schools.
8.3.3 Evaluation Method
The evaluation was conducted in a school classroom with thirty networked computers running
Windows XP. So that there were enough computers for those who wanted to work on their own, a
few evaluators chose voluntarily to work in pairs or threes. The classroom was equipped with a
teacher computer and class room projector. By conducting the session in the evaluators‟ normal
surroundings, the results may paint an accurate picture of Progranimate‟s potential efficacy.
This study made full use of Progranimate‟s associated scaffolding pedagogy and associated
problems. This is summarised below.
Stage A - Introduction
The study began by giving the participants a fifteen minute introduction to Progranimate, its
purpose, its user interface and how it can be used to develop simple programs. All of the activities

Evaluation by 13 to 17 Year Olds and Teachers of Them Chapter 8 – Secondary School Evaluations
Page 225
that the students would tackle were sequential, so this was used to teach the evaluators about the
print, read and assignment concepts and show examples of where they might be used.
Stages B1 and B2 Guided Problem Solving
This stage was split into two activities, B1 and B2. Firstly, for approximately fifteen minutes, the
evaluators were guided though two simple tutor lead problem solving activities. The tutor and class
solved the problem together as a discussion based activity. Each of the participants followed the
actions of the tutor, each developing the solution on their computers. This activity formed stage B1.
For stage B2 of the guided problem solving process, the evaluators were issued with the pedagogy
stage B2 worksheet „The Sweet Shop‟. This was intended to give a gentler introduction to
Progranimate and problem solving before the semi-assisted and unassisted problem solving
activities (that form stages C and D) were tackled.
Stages C and D – Decreasing Support
This stage comprised of the evaluators tackling the problem solving activities from the „McDullards‟
and „Cardiff Animal Shelter‟ sets of sequential programming problems. They were tasked with
completing as many as possible.
8.3.4 Evaluation Feedback Methodology
Feedback was obtained by monitoring the completion times and number of problems solved by the
participants. With each problem worksheet the evaluators were given forms to record the start and
end times, any help received from friends or the tutor and any difficulties encountered. Once an
evaluator believed they had completed the problem, the tutor would validate it and the completion
time would be recorded. A new problem was then issued with the start time recorded. These
results are discussed and summarised throughout this section; detailed results are shown in
appendix H.
As the evaluation drew to a close, the evaluators were given a Likert questionnaire of 28 questions
to gain their opinions on Progranimate and the programming problems. Each question contained a
statement the evaluators could either agree or disagree with. The responses were scored on a five
point scale where, 0 =strong disagreement, 1 =disagreement, 2 =indecision, 3 =agreement and 4 =
strong agreement. The responses to each question were then averaged and calculated as a

Evaluation by 13 to 17 Year Olds and Teachers of Them Chapter 8 – Secondary School Evaluations
Page 226
percentage of the maximum possible average of four. Also calculated were standard deviations,
median, total percentage of agreements (agree + strongly agree), total percentage of undecided
responses, and total percentage of disagreement (disagree + strongly disagree). Each question
provided space where the evaluators could write any relevant comments they felt were important.
At the end of the questionnaire were spaces where the evaluators could state what they liked and
disliked about the whole experience, add suggestions for improvement or make any other
comments they felt were important. A complete breakdown of the individual evaluators‟
questionnaire responses and written comments can be found in appendix H.
8.3.5 Results
The results of this study are divided into five sections. Firstly, section 8.3.5.1 covers usability;
section 8.3.5.2 covers efficacy; section 8.3.5.3 discusses opinions regarding problem solving tasks of
the scaffolding pedagogy; section 8.3.5.4 summarises and discusses the opinions grouped by gender
and year and finally section 8.3.5.5 looks at achievement in the problem solving tasks.
8.3.5.1 Usability
The results from the usability questionnaire are shown and discussed below, together with
observations made and the evaluators written comments.
Table 8-11. Study 6 - Usability Questionnaire Results
Q Question Text %
Ave
%
StDev
%
Median
%
Agree
%
Undecided
%
Disagree Rsp
Distribution
0 1 2 3 4
2 I enjoyed using Progranimate. 78.13 0.75 3 84.38 12.50 3.13 32 0 1 4 17 10
4 When I first saw Progranimate it looked easy to use. 60.16 29.00 3 59.38 9.38 31.25 32 1 9 3 14 5
5 When I first saw Progranimate it looked interesting. 72.66 20.44 3 75.00 18.75 6.25 32 0 2 6 17 7
6 I found Progranimate easy to use. 69.53 24.37 3 65.63 21.88 12.50 32 0 4 7 13 8
7 Progranimate was speedy and responsive in your usage of it.
71.09 19.17 3 68.75 28.13 3.13 32 0 1 9 16 6
8 Adding and Editing program components was easy to do: (I.e. Print Read and Assign etc).
74.22 18.50 3 71.88 28.13 0.00 32 0 0 9 15 8
9 Adding and Editing variables was easy to do. 75.78 20.56 3 75.00 21.88 3.13 32 0 1 7 14 10
10 Progranimate behaved reliably. 69.35 23.01 3 67.74 25.81 6.45 31 1 1 8 15 6
16 The web site was easy to use. 70.31 18.45 3 62.50 37.50 0.00 32 0 0 12 14 6
17 Launching Progranimate was easy. 72.66 19.43 3 71.88 25.00 3.13 32 0 1 8 16 7 0 to 24.9% [0] = Strongly Disagree 25 to 49.9.9% [1] = Disagree 50% [2] = Undecided 50.9 to 74.9% [3] Agree 75 to 100% [4] = Strongly Agree
Strongly disagree + disagree) *100/n = % Disagree Undecided *100/n = % Undecided ( strongly agree + agree)*100/4 = % Agree
Enjoyment ( Q2)
The averaged responses, total agreements and large number of strong agreements show that overall
the evaluators found Progranimate very enjoyable. This aligns with the observations made and the

Evaluation by 13 to 17 Year Olds and Teachers of Them Chapter 8 – Secondary School Evaluations
Page 227
evaluators‟ wish to extend the session from an hour and a half to the entire school day. To have the
evaluators engaged on the same activity for almost a whole school day demonstrates the levels of
pleasure derived from using Progranimate. Clearly, this shows that Progranimate is a very
motivating way to introduce secondary school years 9 (13 year olds) and 10 (fourteen year olds) to
programming. Further opinions regarding enjoyment can be found in results part C which discusses
the programming problems.
First Impressions (Q4 and Q5)
In previous studies. Progranimate brought about initial trepidation for some students. Progranimate
v3.5 utilised a more colourful user interface which aimed to make Progranimate more inviting and
reduce this issue. To measure the effect of this improvement, questions four and five have been
related to a similar question asked in previous studies conducted before this improvement. Table
8-12 shows questions four and five gained a more positive response compared with similar
questions asked in studies three and five. This suggests that the visual improvements made to
Progranimate v3.5 have been effective in improving the users‟ initial impressions of Progranimate.
Table 8-12. Study 6 – The Evaluators’ Initial Impressions of Progranimate V3.5
Question Text Study Evaluators’ Progranimate Version
Average Response
Q3: My first impressions were good. 3 College students aged 16 and 17 2.5 52.78%
Q3: When I first saw Progranimate it looked easy to use. 5 School pupils aged 15 to 17. 3.0 50.00%
Q4: When I first saw Progranimate it looked easy to use. 6 (this) School pupils aged 13 to 15. 3.5 60.16%
Q5 When I first saw Progranimate it looked interesting 6(this) School pupils aged 13 to 15. 3.5 72.66%
Ease of Use (Q6)
The responses gained by question six show that the majority of evaluators believed Progranimate
was easy to use and by several very much so. This averaged response for question six improves on
that of question four, which demonstrates that in practice Progranimate is even easier to use than it
looks. The responses to these questions were significantly more positive than those of similar
questions asked in other school or college based evaluations (e.g. study 3 and 4 ). This suggests that
the improvements made in Progranimate version 3.5 have resulted in improvements in ease of use.
Program Construction ( Q8, Q9)
The responses to questions eight and nine show that on the whole, the evaluators felt adding and
editing program constructs and variables was easy to do. The pupils‟ written comments and
observations made throughout the evaluation showed that the evaluators were experiencing far less
trouble entering expressions, defining variables and comprehending error messages than in previous

Evaluation by 13 to 17 Year Olds and Teachers of Them Chapter 8 – Secondary School Evaluations
Page 228
evaluations. These results suggest Progranimate v3.5 is easier to use than previous versions.
Reliability and Responsiveness (Q 10, Q7)
Observations showed that throughout the study, Progranimate was very responsive and reliable.
Only one problem occurred, and this related to a broken link within Progranimate‟s website, rather
than any fault with Progranimate. This problem prevented Progranimate from web launching from
directly within one of the online worksheets. However, this did not preclude the use of
Progranimate or the worksheet at fault. The responses to question ten confirm these observations
and show that the vast majority believed Progranimate was reliable, and there were no
disagreements. Had the broken hyperlink not occurred, the results may have been slightly higher.
Question seven gained a similar response, showing that most considered Progranimate speedy and
responsive. However, written comments suggested that some did not understand this question,
which resulted in the 28% indecision. If the question had of been clarified, the result could have
been higher.
Website and Web Launching (Q16, Q17)
Progranimate was launched simultaneously by thirty computers on and off campus network (the
web server is at the University of Glamorgan). Despite this, there were no problems or
performance issues in accessing it. All classroom computers had Progranimate load in
approximately one minute or less. This shows that JWS is an appropriate deployment mechanism
for Progranimate, limited only by the capacity of the web server that hosts it.
Question sixteen aimed to establish if the website presented any problems. It scored an average
response of 70% and a total agreement from 63%; there were no disagreements. Throughout the
study, no problems relating to the website were observed (other than the broken link). This
demonstrates that Progranimate‟s website is suitable and usable by users of this study‟s age group.
8.3.5.2 Efficacy
The efficacy of Progranimate was established by questionnaire questions one and 18 to 28. The
responses gained are shown in table 8-13 and are discussed under five headings as follows:
flowcharts, code animation, stimulating interest in programming and overall educational benefit.

Evaluation by 13 to 17 Year Olds and Teachers of Them Chapter 8 – Secondary School Evaluations
Page 229
Table 8-13. Study Six - Efficacy Questionnaire Results
Q Question Text %
Ave %
StDev %
Median %
Agree
%
Undecided
%
Disagree Rsp Distribution
0 1 2 3 4
1 Programming is something that interests me. 70.69 24.15 75 68.97 24.14 6.90 29 1 1 7 13 7
18 The flowchart representation helped me in thinking up the solutions. 74.22 18.50 3 71.88 28.13 0.00 32 0 0 9 15 8
19 The flowcharts enabled me to understand the solution being developed. 69.53 21.75 3 62.50 31.25 6.25 32 0 2 10 13 7
20 The use of colour on the flowcharts was beneficial. 71.88 25.20 3 65.63 28.13 6.25 32 1 1 9 11 10
21 The animation features helped me understand how a program worked. 68.75 17.96 3 65.63 31.25 3.13 32 0 1 10 17 4
22 I could easily see how pieces of the flowchart related to the lines of code. 71.88 17.68 3 68.75 31.25 0.00 32 0 0 10 16 6
23 I have some (even a little) understanding the code generated. 71.77 16.76 3 70.97 29.03 0.00 31 0 0 9 17 5
24 I felt I learnt something by using Progranimate and solving the problems. 75.81 17.66 3 77.42 22.58 0.00 31 0 0 7 16 8
25 Progranimate is good for the learning of Programming. 80.17 16.88 3 86.21 13.79 0.00 29 0 0 4 15 10
26 I would recommend Progranimate to friends who wanted to learn a bit about programming. 79.31 16.46 3 86.21 13.79 0.00 29 0 0 4 16 9
27 I would like Progranimate to be used in my school. 75.86 20.58 3 68.97 31.03 0.00 29 0 0 9 10 10
28 Progranimate has positively influenced my interest in Programming. 75.86 17.01 3 79.31 20.69 0.00 29 0 0 6 16 7
0 to 24.9% [0] = Strongly Disagree 25 to 49.9.9% [1] = Disagree 50% [2] = Undecided 50.9 to 74.9% [3] Agree 75 to 100% [4] = Strongly Agree
Strongly disagree + disagree) *100/n = % Disagree Undecided *100/n = % Undecided ( strongly agree + agree)*100/4 = % Agree
Flowcharts ( Q18, Q19, Q20)
The responses to these questions demonstrate that for all but a small proportion of students, the
flowcharts and their colour are an effective aid to sequential programming and problem solving for
thirteen to fifteen year olds with no programming experience. Generally for these questions, those
who disagreed or were undecided were those students who completed three or less of the problem
solving activities (the class average was four ). A correlation coefficient between problem solving
performance and the responses to these questions revealed a positive correlation of 0.54 (Q18), 0.46
(Q19) and 0.48 (Q21). Graphs for these correlations are shown in appendix H section B. This
shows that the flowcharts were considered most helpful by those achieving well in the problem
solving exercises.
Code ( Q22, Q23 )
The responses to question 23 demonstrate that despite not having detailed instruction about the VB
code generated, 71% of the evaluators believed they were gaining some understanding of it (there
were no disagreements). As with study 5 this knowledge would have been picked up purely by their
active engagement with Progranimate and by seeing how the code and flowchart pieces relate. A
similar response was gained by question 22, which asked if the evaluators could easily see how the
code and flowchart relate. This demonstrates that the side by side synchronised presentation of
flowcharts and code is an effective way to learn a programming language, especially given the age of
the evaluators. As with study 5, this provides an avenue for future study in which the evaluators

Evaluation by 13 to 17 Year Olds and Teachers of Them Chapter 8 – Secondary School Evaluations
Page 230
could be tested on their knowledge of code fragments.
Animation ( Q21)
The responses to question 21 show that 66% of the evaluators believed (some strongly so) that the
animated execution of programs furthered their understanding of how programs work. An analysis
of the individual responses has revealed a positive correlation coefficient (0.48) between the
strength of agreement to this question and performance in the problem solving activities; this
correlation is charted in appendix H section B. This demonstrates that the animation features
provide an effective model of execution which furthers a novice‟s understanding of how programs
work. Observation showed that the evaluators gained a lot of pleasure and satisfaction in watching
their solutions run and output the correct result. This result shows animation is helpful in conveying
how programs work whilst adding to the levels of fun and motivation experienced by the users.
Stimulating Interest in Programming ( Q1, Q27, Q28 )
Question one shows that at the end of the study 69% of the evaluators agreed that programming
was something that interested them and 24% (7 out of 29) strongly so. Question 28 shows that 79%
of the evaluators agreed that Progranimate positively influenced their interest in programming;
there were no disagreements. Question 27 shows that the vast majority of evaluators agreed they
would like Progranimate to be used in their school, and many strongly agreed. There were no
disagreements.
These results show that Progranimate can be an effective and motivating way to introduce
programming to thirteen to fifteen year olds in secondary schools. Given that the study was made
up of a cross section of pupils who were not hand picked, the results are very supportive towards
the use of Progranimate in secondary schools. Given that programming is often not represented
well in schools, this finding shows Progranimate may be a useful tool to stimulate interest in the
subject.
Overall Educational Benefit (Q24, Q25, Q26)
Question 24 revealed that 77% of the evaluators agreed that they learnt something by using
Progranimate, there were no disagreements. Question 25 shows that the vast majority (86%)
believed Progranimate was good for learning programming; again there were no disagreements. The
responses to question 26 were similarly positive, demonstrating that the vast majority would
recommend Progranimate to friends who wanted to learn programming. These results demonstrate

Evaluation by 13 to 17 Year Olds and Teachers of Them Chapter 8 – Secondary School Evaluations
Page 231
overwhelmingly that the students perceive Progranimate to be an effective way to be introduced to
programming.
8.3.5.3 Programming Problems
The efficacy of the programming problems is assessed by questions three and 11 to 15. These are
shown in table 8-14 and discussed under three headings below.
Table 8-14. Study 6 - Programming Problem Related Questionnaire Responses
Q Question Text %
Ave
%
StDev
%
Median
%
Agree
%
Undecided
%
Disagree Rsp Distribution
0 1 2 3 4
3 I enjoyed solving the programming problems 75.00 19.05 3 78.13 18.75 3.13 32 0 1 6 17 8
11 I enjoyed the programming problems. 74.22 20.56 3 78.13 15.63 6.25 32 0 2 5 17 8
12 I found the problems challenging. 28.13 21.77 1 3.13 34.38 62.50 32 9 11 11 1 0
13 The programming problems were at the right level difficulty for a beginner. 69.53 18.77 3 65.63 31.25 3.13 32 0 1 10 16 5
14 The programming problems were well laid out. 73.44 15.47 3 78.13 56.25 0.00 32 0 0 18 20 5
15 The programming problems were written in a way I could understand. 75.00 16.80 3 78.13 21.88 0.00 32 0 0 7 18 7
0 to 24.9% [0] = Strongly Disagree 25 to 49.9.9% [1] = Disagree 50% [2] = Undecided 50.9 to 74.9% [3] Agree 75 to 100% [4] = Strongly Agree
(Strongly disagree + disagree) *100/n = % Disagree Undecided *100/n = % Undecided ( strongly agree + agree)*100/4 = % Agree
Enjoyment (Q3, Q11)
Due to a minor oversight, questions three and eleven were almost identical. However, the results
obtained do demonstrate a consistency in the evaluators‟ responses. These two questions show that
the programming activities and the programming problems are seen as enjoyable by the vast
majority of the evaluators. For both of these questions there were only one or two disagreements.
Difficulty Level (Q12, Q13)
These questions aimed to discover if the programming problems were within the evaluators‟ zone
of proximal development (for ZPD see chapter 5). The responses to question 12 show that the
majority of evaluators did not find the problems challenging. However, this is not to say the
evaluators found them trivial, as the observations made in the session showed this not to be the
case. The responses to question 13 support these observations, showing that most evaluators
believed they were at the right level of difficulty. Given that in one class of 32 students abilities will
vary greatly, these results are seen as very positive.
Layout and Wording (Q14, Q15)

Evaluation by 13 to 17 Year Olds and Teachers of Them Chapter 8 – Secondary School Evaluations
Page 232
The responses to questions fourteen and fifteen demonstrate that the vast majority of evaluators
believed the problems were both well laid out and clearly worded. This is evidence that the
problems, irrespective of difficulty, are comprehensible and suitable for secondary school children
of years 9 and above.
8.3.5.4 Questionnaire Responses by Gender and Year
Average responses were calculated individually for the male, female, year 9 and year 10 evaluator
groups, these are shown in figure 8-3. A tabulated breakdown of the responses from each category
can be found in appendix H section B.
Although the gender issues of programming are not the focus of this thesis, the fact that that the
questionnaire responses for male and female evaluators differed could not be ignored. The results
show that the females‟ averaged responses were between 4% to 20% (12.7 average) lower than the
male responses. Females are known to be less fascinated by computers than their male counterparts
and have a tendency to underestimate their abilities (Carter and Jenkins, 1999). In any case, the
female responses are all positive and in isolation to the male responses, still evidence the efficacy
and usability of Progranimate, its problems and pedagogy. For example, question two „I enjoyed
using Progranimate‟ received an average score of 75% and a total agreement from 85% of the
females. The responses to question 28 show that 64% of the females agreed that Progranimate
positively influenced their interest in programming. This shows that Progranimate and its gender
neutral programming problems may be an effective tool in getting females more interested in
programming and the technical side of computing.
These categorised results also show that the responses from the year 9s were on average 4.7%
stronger than the year 10s, though for some questions the difference was more significant. For
example, questions 7, 11, 17, 25 and 26 there is a more than a 10% difference. The most extreme
example of this difference is in question 25, „Progranimate is good for learning programming‟,
which gained an average response of 90.91 from the year 9s and 73.61 from the year 10s. However,
the responses of both the year 9 and 10 evaluators demonstrate that Progranimate has achieved a
high level of usability and that, its pedagogy and programming problems are appropriate and
effective in teaching programming at secondary school level.

Evaluation by 13 to 17 Year Olds and Teachers of Them Chapter 8 – Secondary School Evaluations
Page 233
Figure 8-3. Study 6 - Average Questionnaire Responses Grouped by Gender and Year
8.3.5.5 Problem Solving Achievement
To provide non subjective indications of efficacy, the evaluators‟ problem solving performance was
monitored by recording completion times and rates, as detailed in the feedback methodology
subsection of this study. The results from this monitoring process are discussed below.
Were the Problem Solving Skills of the Evaluators Improved?
As the evaluation was conducted in a single session, the improvement in problem solving ability is
gauged by improvements in completion time. For each programming problem, average completion
times of all pupils were calculated. The individual completion times were then sorted fastest, to
slowest and averages calculated for the first, second and third quartiles. Maximum and minimum
completion times were also recorded. These values are displayed in the bar chart in figure 8-4.
Completion statistics for each problem are displayed in table 8-15. The statistics of figure 8-4 show
evidence of a learning curve of two to three problems for all but the best achievers, after which the
times to completion decrease despite the increase in problem complexity. For the best achievers the
times to completion remain consistently quick. This demonstrates efficacy and shows that once the
learning curve has been overcome, the problem solving skills of the evaluators are being improved
with each programming problem they tackle.
Table 8-15. Study 6 - Completion Statistics
Sweet Shop
McDullards1 McDullards2 McDullards3 Animal Shelter1
Animal Shelter2
Animal Shelter3
Animal Shelter4
Animal Shelter5
C A C A C A C A C A C A C A C A C A
30 30 23 24 19 20 15 15 12 14 9 9 8 8 1 1 0 0
C= Completed A= Attempted
0.00
10.00
20.00
30.00
40.00
50.00
60.00
70.00
80.00
90.00
100.00
1 2 3 4 5 6 7 8 9 10 11 12 13 14 15 16 17 18 19 20 21 22 23 24 25 26 27 28
Question Number
Males Females Year9s Year10s
Av
era
ge
Res
po
nse
%

Evaluation by 13 to 17 Year Olds and Teachers of Them Chapter 8 – Secondary School Evaluations
Page 234
00:00
00:10
00:20
00:30
00:40
00:50
01:00
01:10
01:20
01:30
01:40
Sweet
Shop
McD
ullar
ds1
McD
ullar
ds2
McD
ullar
ds3
Animal S
helter1
Animal S
helter2
Animal S
helter3
Animal S
helter4
Tim
e in
hou
rs a
nd m
inut
es
Min
1st Quartile
2nd Quartile
3rd Quartile
Max
Average
Figure 8-4. Completion Times for Study 6
How Did the Evaluators’ Performance Compare With Previous Studies?
A prominent statistic emerging from the study was that the completion times were on many
occasions equalling or improving on those of earlier studies. Table 8-16 compares the completion
statistics for problems common to studies three, five and this study six. Given that the evaluators of
this study are younger than in other studies, these are surprising but pleasing statistics. This
demonstrates that Progranimate, its pedagogy and problems can make programming accessible to a
wide age range upwards of thirteen years of age. This may be due in part to the usability
improvements made to Progranimate since these previous studies.
Table 8-16. Completion Statistics Studies 3, 5 and 6
Pedagogy Stage
/ Problem
Study 3 Bridgend – 16-17yrs Study 5 – 15-17yrs School Study 6 (this) 13-15yrs School
Ave Max Min Complete Attempt Ave Max Min Complete Attempt Ave Max Min Complete Attempt
B Sweet Shop Not Done 00:18 00:30 00:15 23 23 00:12 00:31 00:04 30 30
C1 McDulards1 00:22 00:37 00:23 31 32 00:18 00:35 00:10 17 23 00:18 01:40 00:02 23 24
C3 McDulards2 00:23 01:34 00:03 17 26 00:14 00:20 00:10 6 14 00:21 00:51 00:02 19 20
C4 McDullards3 00:13 00:30 00:04 12 13 Not Done 00:14 00:48 00:02 15 15
C1 Animal Shelter1 Not Done 00:07 00:11 00:03 15 15 00:13 00:45 00:03 12 14
C2 Animal Shelter2 Not Done 00:04 00:05 00:04 10 12 00:07 00:20 00:03 9 9
C3 Animal Shelter3 Not Done 00:03 00:05 00:02 4 8 00:10 00:32 00:02 8 8
C4 Animal Shelter4 Not Done n/a n/a n/a 0 1 00:13 00:13 00:13 1 1
Were there any Differences between the Male and Female Evaluators?
From the data gained, it was clear that the males were on the whole outperforming the females.
Clear evidence of improvement can be seen in all categories of the male results; however, for the
females the results seem more sporadic. Unfortunately, due to other commitments, some of the
female evaluators could not attend the extended period and so were excluded from these findings.
This meant there were nineteen males and only six females contributing to these statistics. For more
definite conclusions to be reached, more females are needed.

Evaluation by 13 to 17 Year Olds and Teachers of Them Chapter 8 – Secondary School Evaluations
Page 235
Males = 19 Evaluators attending all day Females = 6 Evaluators attending all day
19cmp
18cmp
17cmp
16cmp
12cmp
9cmp
8cmp
1cmp
00:00
00:10
00:20
00:30
00:40
00:50
Swee
t Sho
p
McD
ulla
rds1
McD
ulla
rds2
McD
ulla
rds3
Anim
al S
helte
r1
Anim
al S
helte
r2
Anim
al S
helte
r3
Anim
al S
helte
r4
Anim
al S
helte
r5
Min
1st Quartile
2nd Quartile
3rd Quartile
Max
Average
6cmp
6cmp
4cmp
3cmp
2cmp
1cmp1cmp
00:00
00:10
00:20
00:30
00:40
00:50
Swee
t Sho
p
McD
ulla
rds1
McD
ulla
rds2
McD
ulla
rds3
Anim
al S
helte
r1
Anim
al S
helte
r2
Anim
al S
helte
r3
Anim
al S
helte
r4
Anim
al S
helte
r5
Min
1st Quartile
2nd Quartile
3rd Quartile
Max
Average
Figure 8-5. Study 6 - Male Problem Statistics Figure 8-6. Study 6 - Female Problem Statistics
Where there Any Differences between the Year Tens and Year Nines?
Only those evaluators attending the full day have been used in these statistics. These are presented
in Figure 8-7 and Figure 8-8. This revealed a surprising statistic that shows the year 9s considerably
outperformed the year 10s, both in the number of problems completed (labled CMP on the chart)
and the times to completion. The year 10s show evidence of a three problem learning curve, as after
this the times to completion decrease. However, for the year 9s only a smaller learning curve is
observable for all but the slowest problem solvers. Quite why this result exists is unclear, though
given the higher questionnaire scores received by the year 9s, it seems reasonable to assume their
motivation levels were higher than those of year 10. That is not to say that the year tens were under
motivated, as they also performed very well, given the three hour duration of the study and the fact
they had no prior programming experience.
13cmp
13cmp
11Cmp
10cmp 5cmp
1cmp
1cmp
00:00
00:10
00:20
00:30
00:40
00:50
Swee
t Sho
p
McD
ulla
rds1
McD
ulla
rds2
McD
ulla
rds3
Anim
al S
helte
r1
Anim
al S
helte
r2
Anim
al S
helte
r3
Anim
al S
helte
r4
Anim
al S
helte
r5
Min
1st Quartile
2nd Quartile
3rd Quartile
Max
Average
Figure 8-7. Study 6 – Year 9 Problem Statistic Figure 8-8. Study 6 – Year 10 Problem Statistics
10cmp
10cmp
9cmp 9cmp
8cmp
8cmp
7cmp
1cmp
00:00
00:10
00:20
00:30
00:40
00:50
Swee
t Sho
p
McD
ulla
rds1
McD
ulla
rds2
McD
ulla
rds3
Anim
al S
helte
r1
Anim
al S
helte
r2
Anim
al S
helte
r3
Anim
al S
helte
r4
Anim
al S
helte
r5
Min
1st Quartile
2nd Quartile
3rd Quartile
Max
Average

Evaluation by 13 to 17 Year Olds and Teachers of Them Chapter 8 – Secondary School Evaluations
Page 236
8.3.6 Study Six Conclusions
This study involved younger evaluators than in previous studies; despite this the results gained were
some of the most positive. These findings demonstrate that Progranimate, its pedagogy and
associated programming problems are very well suited, effective and usable by male and female
secondary school pupils of year 9 (13 years of age) and older.
Despite the study being conducted outside the campus network, the results show Progranimate‟s
web launching features to be very effective, as thirty students accessed the tool simultaneously in
approximately one minute.
For this study, Progranimate v3.5 was evaluated for the first time. The usability results show that
the enhancements made to this version of Progranimate have been effective. The evaluators‟ initial
impressions of Progranimate were much more positive than in previous studies. This shows the
beautification of its user interface has had a positive effect on the users‟ first impressions.
Compared with prior studies, fewer usability problems were encountered. The evaluators appeared
to have far less difficulty with expressions, variables, program construction and editing. Given the
younger age of the evaluators one would expect more errors, not less. These results show that the
usability improvements made to Progranimate v3.5 were very effective. These improvements,
coupled with the fact that no distinct bugs were discovered, meant the evaluators could expend
their energies solely on the problem solving tasks at hand.
The efficacy results show that the evaluators believed strongly that they were learning something
from the whole experience. They also believed strongly that Progranimate was a good tool for
learning programming, that they would recommend it to friends and would like to use it in their
school. A very rewarding finding was the widespread males‟ and females‟ belief that Progranimate
had positively influenced their interest in programming. As with previous studies, the efficacy of the
flowcharts was evident. The results show that the flowcharts were seen as a very useful aid to
comprehension and problem solving, especially by those performing well in the problem solving
tasks. Similarly, animation was also seen as an aid to comprehension but also a very motivating and
rewarding activity. An intriguing finding was that the evaluators were indicating that they had
gained some understanding of the code generated, even though they had not been directly taught
about it. This shows that Progranimate may be useful for teaching a programming language besides
problem solving and fundamental comprehension. An area for further work would be to assess the
beginners‟ understanding of various code fragments after engaging with Progranimate.
In questioning the difficulty of the problem solving tasks, it became apparent that both the year 9s

Evaluation by 13 to 17 Year Olds and Teachers of Them Chapter 8 – Secondary School Evaluations
Page 237
and 10s felt the problems were at the right level of difficulty. Their questionnaire responses also
show that in general they felt the problems were well laid out and clearly worded. The problem
solving statistics show that within the three hours of the study, the evaluators made significant
achievements. In both completion times and the number of problems solved, on average the
evaluators of this study outstripped the performance of the older evaluators in study 3 (Bridgend
college aged sixteen and seventeen) and study 4 (St Martins School, aged fifteen and sixteen). The
results show that all but the best evaluators were experiencing a two to three problem learning
curve, after which the times to completion decreased steadily, despite an increase in problem
complexity. This is evidence that the problem solving skills of the evaluators were being enhanced
by engagement with Progranimate and the pedagogy.
Though gender issues are not the focus of this research it could not be ignored that the males were
performing slightly better than the females in both times to completion and improvements from
one problem to the next. Though that‟s not to say the females were not doing well; in fact both the
males and females did surprisingly well. There were also differences between the abilities of the
year nines and tens. The results showed that although both the year nines and tens did well, the year
nines outperformed the year tens. Again, motivation is thought to be the reason for this as many of
the year 9 questionnaire responses relating to enjoyment and stimulated interest were significantly
higher then those of year 10. Quite why these differences exist is outside the scope of this thesis;
however, this does show that Progranimate is making programming accessible to a younger
audience than was originally envisaged. As a result of these findings future post thesis work may test
Progranimate with an even younger audience and a similar audience through more than just the
sequential programming concepts.
In summary, the enjoyment levels experienced by the evaluators coupled with improvements in
their problem solving ability demonstrates that Progranimate is an effective and motivating tool for
introducing programming to male and female secondary school pupils from year 9 onwards. This
may be especially useful in schools where Programming is often avoided or taught poorly; it could
help to portray programming in a much more in a favourable light.

Evaluation by 13 to 17 Year Olds and Teachers of Them Chapter 8 – Secondary School Evaluations
Page 238
8.4 Study Seven: Secondary School Teachers Opinions of Progranimate
Whilst the previous two studies have shown Progranimate to be effective with school pupils, for
Progranimate to be of actual benefit their teachers need to be convinced that its incorporation
within their teaching practices is both beneficial and does not increase their workload unduly.
Therefore gaining this information is the focus of this evaluation activity.
The previous teacher evaluation (study 4 section 7.5.4) showed that all of the teachers held
Progranimate in high regard, considering it an effective, motivating and interesting way to introduce
programming and problem solving to secondary school pupils However, in study 4 the impact of
Progranimate on the teacher was not fully assessed. If a teacher believes Progranimate incurs too
much work, they will not be inclined to use it, however effective it may be on their pupils.
Therefore, the focus of this study is primarily on how Progranimate impacts the school teacher and
how it may make the delivery of introductory programming (imperatives first) easier, more
convenient and less intimidating. It also looks at efficacy and what age ranges the teachers believe
Progranimate and its problems are suitable for.
8.4.1 Participants
The participants were ten secondary school teachers from the South Wales region of the UK. For
data protection and to prevent any potential embarrassment, the teachers and their institutions are
only identified by initials. The teachers were told their feedback would be anonymous; this aims to
ensure that the responses received paint an accurate picture of their own abilities and opinions.
8.4.2 Evaluation Method
Before finding anything out about Progranimate. the participants were asked to fill in a simple
teacher and institution profiling questionnaire. This comprised of several multiple choice, multiple
response, and five point Likert based questions. A copy of this questionnaire is shown in appendix I
section E. The questions asked the teachers to rate their own programming knowledge, what
programming languages they know (if any), whether programming was taught at their school and at
what levels. They were also asked about their examination board, its syllabus and how this impacts
on the teaching of programming. These examination board questions are not discussed in this
thesis, as they are outside its scope. However, they are presented in the study‟s accompanying
appendix I section B.

Evaluation by 13 to 17 Year Olds and Teachers of Them Chapter 8 – Secondary School Evaluations
Page 239
Following the initial profiling questionnaire, the participants were given a twenty minute
PowerPoint presentation about Progranimate, its aims, its pedagogy and programming problems,
and how they might be used to introduce programming to secondary school pupils. So as not to
bias the teachers‟ opinions, they were not presented with the findings of the previous evaluation
studies.
After the presentation, the teachers were directed to open the Progranimate website, have a look
around and then launch Progranimate. They were given the pedagogy stage B2 sequential worksheet
(The sweet shop) to work though, and then handouts of the other programming problems which
they could peruse or work through.
Finally, at the end of the evaluation, the teachers were given a secondary questionnaire to gain their
perspectives on Progranimate, and the problem solving exercises. This questionnaire comprised of a
single side of A4, which consisted of 15 five point Likert questions (0 = Strongly disagree, 3=
Undecided and 4 = Strongly agree), one multiple choice question, one multiple response question
and three written response questions. This questionnaire is shown in appendix I section E.
8.4.3 Results
The results are split into two sections: First the findings from the profiling questionnaire given at
the start; second the results, from the perspectives of Progranimate questionnaire given at the end.
8.4.3.1 Teacher and Institution Profiling
Summarised responses to the profiling questionnaire are shown table 8-17. Some questions have
been omitted from these results, as they are not considered to be within the scope of this thesis.
However, a complete list of results and individual responses can be found in appendix I section B.
The results of table 8-17 show that despite only having ten evaluators, a wide range of technical
ability exists. The responses to question four show that of the ten evaluators, four did not have any
programming knowledge, and only two viewed themselves as good programmers. The rest showed
a range of ability that spanned rusty, very basic, basic and intermediate. However, with only ten
evaluators, it is difficult to say with certainty that this is indicative of the state of computing in UK
secondary schools in general. In any case, such research is outside the scope of this thesis, but
highlights an interesting avenue for future work.

Evaluation by 13 to 17 Year Olds and Teachers of Them Chapter 8 – Secondary School Evaluations
Page 240
Table 8-17. Study 7 - A Summary of the Teacher Profile Question Responses
Q Question Text RSP Yes No
1 Is Computing and/or ICT your main teaching subject?
10 9 1
Q Question Text RSP Visual Basic Java Pascal Basic PHP None
2 What programming languages do you know?
10 5 2 3 1 1 5
Q Question Text RSP Yes No
3 Do you or your colleagues teach any computer programming at your school?
10 6 4
Q Question Text RSP None Rusty Very Basic Basic Intermediate Good Advanced
4 Rate your programming knowledge 10 4 1 1 1 1 2 0
Q Question Text RSP Strongly
Disagree Disagree Undecided Agree
Strongly
Agree
%
Ave
%
Agree
%
Undecided
%
Disagree
5 I do not have the time to learn programming so that I may teach it.
10 0 2 0 4 2 68.5 75 0 25
Q Question Text RSP Year7 Year8 Year9 GCSE AS A2
8 If you answered yes to question three, at what levels does your school teach programming?
6 0 0 1 0 3 5
Q Question Text RSP VB.Net VB6 VBA
9 What programming languages are taught at your school?
5 2 2 1
Q Question Text RSP Year7 Year8 Year9 GCSE AS A2
15 At what age do you think it beneficial to teach programming to students?
8 0 0 1 4 8 7
Table 8-18. Programming Ability and Whether Programming is Taught
Q Question Text GT TER RG AT DI MP MD JM ATR GE
3 Do you or any colleagues teach any computer programming at your school (at any level)?
N N N Y Y N Y Y Y Y
4 Rate your programming knowledge using the options below? (Tick one)
None None Intermediate Good Rusty None Good None Basic Very Basic
The responses to question three show that of the ten teachers surveyed, only six come from
institutions that teach programming. As is to be expected, the individual results of table 8-18 show
that a teacher‟s programming ability directly impacts on whether or not the students learn
programming. These results showed that if a teacher can program (even if their knowledge is
minimal) then programming is more likely to be taught, providing the syllabus permits this.
The responses to question two show the teachers who can program possess knowledge of various
languages. By far the most common language was VB, which all but one of those with
programming expertise (however slight) stated they knew. Table 8-19 combines the language
statistics of this study with those of the previous teacher based evaluation (study four in section
7.5.4). The responses from study 4 consist only of secondary school teachers; college tutors have
been excluded, and there are no institutions common to both studies. This analysis shows that in
the locality of the University of Glamorgan, VB appears to be the most popular language used in
secondary schools.

Evaluation by 13 to 17 Year Olds and Teachers of Them Chapter 8 – Secondary School Evaluations
Page 241
Table 8-19. Language Knowledge of Teachers in this Evaluation and Study Four
Question Text RSP Visual Basic Java Pascal Basic PHP None
What Programming Languages do you know 16 9 2 5 1 1 7
Progranimate and the associated programming problems support VB.NET and VB6, which aligns
almost perfectly with the teachers‟ expertise and the language most commonly taught.
Progranimate supports Java too and in the future will also support Pascal (most probably by the
time this thesis is complete). By supporting all the popular teaching languages, the overheads of
incorporating it into ones‟ teaching practices will be reduced; this aims to make it a compelling
option for teachers.
Question five shows that within their working schedules, most teachers feel they do not have the
time to learn programming so they may teach it. In talking with the evaluators, the prevailing
opinion was that the study of programming would have to be undertaken on a voluntary and
unpaid basis outside of the teachers‟ normal working hours. Therefore, if teachers are to introduce
programming to their pupils, the time overheads need to be minimal. This aligns with the research
of sub section 3.4.3.3 which shows time overheads are an inhibiting factor in the adoption of
visualisation environments.
The responses to question eight show that programming is most commonly taught at the A2 level.
Significantly fewer teach it at A1 level, only one at year nine and none at GCSE level. However,
what is taught in practice does not align with the teachers‟ opinions of when they think
programming instruction would be beneficial to students. By comparing the responses of question
eight with question fifteen, it becomes apparent that teachers believe their pupils would benefit
from programming instruction at a younger age than is currently taught. Progranimate could be an
ideal candidate for filling this void. The following subsection shows that many of the teachers
concur.
8.4.3.2 Perspectives of Progranimate
The previous teacher study focused on opinions of efficacy and showed that in the teachers‟ view
Progranimate was both motivating and effective in the teaching of secondary school students. In
addition to questions of efficacy, this study asks if Progranimate could make teaching the basics of
programming a more compelling option for teachers. To evaluate these aspects, the secondary
„perspectives of Progranimate‟ questionnaire responses are related to the following six questions:

Evaluation by 13 to 17 Year Olds and Teachers of Them Chapter 8 – Secondary School Evaluations
Page 242
Do the teachers consider Progranimate and its problems to be effective?
Would Progranimate make teaching programming easier and more convenient?
Do the activity packs make teaching programming easier and more convenient?
Would Progranimate fit easily within the computing syllabus?
What ages do the teachers consider Progranimate and its problems suitable for?
What are the teachers opinions on interrogational difficulties?
In this section, these key questions are discussed individually under headings of the same name.
Within each heading, the results from the relevant questionnaire questions are shown and in some
cases correlated with responses from the profiling questionnaire asked at the start of the session.
The overall results from the perspectives questionnaire is shown below in table 8-20.
Table 8-20. Perspectives of Progranimate Questionnaire Responses
Q Question Text Ave% Ave StDev Median
%Total
Agree
%Total
Undecided
%Total
Disagree RSP
Distribution
0 1 2 3 4
1 Progranimate would be useful for teaching Programming to high school students.
90.63 3.63 0.52 4.00 100.00 0.00 0.00 8 0 0 0 3 5
2 The problem solving exercises would help high school pupils engage with problem solving.
90.63 3.63 0.52 4.00 100.00 0.00 0.00 8 0 0 0 3 5
3 Using Progranimate would teach valuable skills to a high school students.
87.50 3.50 0.76 4.00 87.50 12.50 0.00 8 0 0 1 2 5
4 Progranimate would make it easier for me to learn programming so that I may teach it.
84.38 3.38 0.74 4.00 87.50 12.50 0.00 8 0 0 1 3 4
5 It would not take long to learn Progranimate to the level where I could teach using it.
84.38 3.38 0.74 3.50 87.50 12.50 0.00 8 0 0 1 3 4
6 Progranimate would make it easy for me to teach programming.
78.13 3.13 0.64 3.00 87.50 12.50 0.00 8 0 0 1 5 2
7 Progranimate would aid someone with limited programming knowledge to teach Programming
71.88 2.88 0.64 3.00 75.00 25.00 0.00 8 0 0 2 5 1
8 The problem solving exercises are appropriate for high school students?
85.71 3.43 0.79 100.00 85.71 14.29 0.00 7 0 0 1 2 4
9 The teaching of programming via Progranimate could fit nicely within a computing syllabus.
85.71 4.00 0.53 3.00 100.00 0.00 0.00 7 0 0 0 4 3
10 Given online access, learning Progranimate and integrating it into the syllabus is something I could do without too much work.
78.57 3.14 1.21 4.00 71.43 14.29 14.29 7 0 1 1 1 4
11 WITHOUT ready made problem solving exercises and other learning materials I would find it easy to teaching programming using the tool.
46.43 1.86 1.07 2.00 28.57 42.86 28.57 7 1 1 3 2 0
12 WITH ready made problem solving exercises and other learning materials I would find it easy to teach programming using the tool.
85.71 3.43 0.53 3.00 100.00 0.00 0.00 7 0 0 0 4 3
13 WITHOUT supplied learning material etc integrating Progranimate within the syllabus would be too big a burden for me in an already busy schedule.
57.14 2.29 1.11 1.00 42.86 28.57 28.57 7 0 2 2 2 1
14
WITH supplied learning material integrating Progranimate within the syllabus would be too big a burden for me in an already busy schedule.
39.29 1.57 0.79 1.00 14.29 28.57 57.14 7 0 4 2 1 0
15
At what ages do you think it is would be possible to teach programming using Progranimate with learning material and the problem solving exercises? %
Year7 Year8 Year9 GCSE AS A2 Other RSP
1 2 3 7 7 7 0 7 14.29 28.57 42.86 100.00 100.00 100.00 0.00
16
At what ages do you think it would be beneficial teach programming using Progranimate with learning material and the problem solving exercises? (Tick as many as is applicable) %
0 0 2 6 6 6 0 7
0.00 0.00 28.57 85.71 85.71 85.71 0.00
0 to 24.9% [0] = Strongly Disagree 25 to 49.9.9% [1] = Disagree 50% [2] = Undecided 50.9 to 74.9% [3] Agree 75 to 100% [4] = Strongly Agree
0 + 1 = Total Disagreement 2 = Total Undecided 3 + 4 = Total Agreement

Evaluation by 13 to 17 Year Olds and Teachers of Them Chapter 8 – Secondary School Evaluations
Page 243
Do the Teachers Consider Progranimate and its Problems to be Effective? (Q1, Q2, Q3)
The responses to questions one and two show that all of the teachers agreed Progranimate as useful
for teaching Programming and problem solving, and most strongly so. The responses to question
three show all but one agreed (most strongly) that Progranimate would teach valuable skills to
secondary school pupils. In analysing the individual responses (table 8-21) no clear link between
the teachers‟ programming ability and their responses could be found. From these results, it can be
concluded that all the teachers viewed Progranimate as very effective, regardless of their own level
of programming expertise.
Table 8-21. Study Severn Programming Ability and Individual Responses to Questions 1 to 3
Teacher Initials Programming Skill Q1 Q2 Q3 AT Good 4 4 4
MD Good 4 3 3
RG Intermediate 4 4 4
ATR Basic 3 3 2
GE Very Basic 3 4 4
DI Rusty 4 4 4
TER None 4 4 4
GT None 3 3 3
Average 3.63 3.63 3.50
Average % of 4 90.63 90.63 87.50 [0] = Strongly Disagree [1] = Disagree [2] = Undecided [3] Agree [4] = Strongly Agree
Would Progranimate make Teaching Programming Easier and More Convenient? (Q4, Q5, Q6,Q7)
These questions were aimed at seeing if Progranimate could help teachers of all programming skill
levels teach the subject. The teachers‟ responses to these questions are correlated with their
programming ability and are shown below in table 8-22.
Table 8-22. Programming Ability and Individual Responses to Questions 4 to 7
Teacher Initials Programming Skill Q4 Q5 Q6 Q7 AT Good 4 4 3 2
MD Good 3 3 3 3
RG Intermediate 4 4 4 3
ATR Basic 4 3 3 3
GE Very Basic 3 3 3 2
DI Rusty 3 4 3 3
TER None 4 4 4 4
GT None 2 2 2 3
Average 3.38 3.38 3.13 2.88
Average % 84.38 84.38 78.13 71.88 [0] = Strongly Disagree [1] = Disagree [2] = Undecided [3] Agree [4] = Strongly Agree
The responses to question four show that the teachers believe that Progranimate would make it
easier for them to learn programming so they may teach it. The feedback gained by question five
shows that they also believe Progranimate would not take long to learn so they may teach with it.
Question six shows that the teachers believe Progranimate would make teaching programming easy.
Finally, question seven shows that the majority of the teachers also believe that Progranimate may
help a teacher with limited programming experience teach the subject..

Evaluation by 13 to 17 Year Olds and Teachers of Them Chapter 8 – Secondary School Evaluations
Page 244
These results indicate that Progranimate would make teaching programming easier and more
convenient for teachers of all programming skill levels. This demonstrates that Progranimate has
the potential to widen access to programming within secondary schools.
Do the Activity Packs Make Teaching Programming Easier and More Convenient? (Q11, Q12, Q13, Q14)
Whilst Progranimate is seen as easy to use, the responses to questions 12 to 14 show that without
the activity packs, teaching programming and integrating Progranimate within their syllabuses
would be much more difficult for the teachers. These results show that in the teachers‟ opinion the
activity packs of the scaffolding pedagogy will make teaching programming via Progranimate easier
and more convenient.
Would Progranimate Fit Easily within the Computing Syllabus? (Q9. Q10)
Another factor that would affect the amount of time and effort required to integrate Progranimate
into ones‟ teaching practices is the curriculum or syllabus requirements of the chosen examination
board. With this in mind, questions nine and ten were aimed at gauging how well Progranimate
would fit within the syllabus of technical computing subjects.
The responses to question nine shows that all of the teachers believe (43% strongly) that with
Progranimate, the teaching of programming could fit nicely within the syllabus. The responses to
question ten show that on the whole, teachers agreed strongly that given access to Progranimate,
integrating it into the syllabus is something they could do without too much work. These responses
indicate that Progranimate would not be a barrier to the introduction of programming in secondary
schools and could in fact lower the barriers the teachers feel the subject presents.
What ages Do the Teachers Consider Progranimate and its Problems Suitable For? (Q8, Q15, Q16)
Question eight asked the teachers if they felt the Programming problems were at the right level of
difficulty for their students. The results show overall a strong agreement, resulting in an average
response of 86%. The responses to question 15 show that with Progranimate and the activity packs
of the scaffolding pedagogy, all of the teachers viewed it possible to teach programming from
GCSE level and up. Three teachers thought it was possible from year 9, and one even as young as
years 7 and 8. Question 16 asked a slightly different question, aiming to gauge at what school level
the teachers thought it beneficial to teach programming via Progranimate and the activity packs.
The responses show that all but one thought it beneficial from GCSE level and up, and two from
year 9. A comparison of the responses to questions 15 and 16 with question 15 of the profiling

Evaluation by 13 to 17 Year Olds and Teachers of Them Chapter 8 – Secondary School Evaluations
Page 245
questionnaire given at the start of the evaluation reveals that Progranimate makes programming
accessible to a wider audience than the teachers believed before being exposed to Progranimate. A
table presenting this comparison is available in appendix I section D.
From these findings, it can be concluded that the majority of teachers believe Progranimate is
suitable for GCSE levels of study and up. Some even believe it can even be used at an even younger
age; this is a testament to Progranimate‟s simplicity
What are The Teachers Opinions on Interrogational Difficulties
Questions 17 and 18 required a written response. These questions aimed to establish what barriers
might prevent Progranimate‟s adoption within programming instruction. For these questions, the
teachers were asked to envisage a hypothetical scenario in which programming was now a
mandatory part of the ICT syllabus. The responses are shown in table 8-23
Table 8-23. Study 7 - Perceptions of Programming Questions 17 and 18.
Initials
Programming
Skill
Q17: In the scenario that programming is required
within the ICT syllabus what potential problems
or difficulties would you have integrating it within
your teaching repertoire?
Q18 Would integrating the teaching of programming via
Progranimate within the ICT syllabus place undue burden on
you as a teacher?
AT Good None that I can think of. No it would serve as a useful tool for Problem solving.
MD Good None.
Yes, to start with it would involve a lot of work with
other staff in the department to get it setup/started.
RG Intermediate Time constraints -contact time (with pupils). Within ICT yes.
ATR Basic No comment made No.
GE Very Basic Exercises and teacher knowledge.
Not if a scheme of work that matched the curriculum
was provided.
DI Rusty No comment made No.
TER None
With a solution such as Progranimate it would
be easier and fun for pupils. No.
These responses show a varied range of opinions exist. Some of the teachers do not foresee any
potential problems or barriers; however, some do. With the addition of further programming
problems, online programming tutorials and schemes of work that align with their syllabuses, the
overheads of introducing programming can be reduced further. This is a potential avenue for post
doctoral work.
8.4.4 Study Seven Conclusions
The previous studies five and six have shown that Progranimate is a motivating and effective way
to teach programming to high school pupils aged between 13 and 16. A previous school and college
teacher based evaluation showed that the teachers felt Progranimate was an effective and

Evaluation by 13 to 17 Year Olds and Teachers of Them Chapter 8 – Secondary School Evaluations
Page 246
motivating way to teach Programming. However, even if a tool is seen as effective, it will not be
adopted if the overheads of doing so are too great. This study was focused on discovering if
Progranimate could make teaching the basics of imperative programming a more, convenient, easier
and compelling option for teachers. However, further indications of efficacy were also gained.
The profiling questionnaire showed that of the ten teachers surveyed, not all had programming
expertise, and only two considered themselves to be good programmers. It is for these reasons that
some teachers feel they cannot teach programming, and do not have the time to learn it so they can.
This demonstrates a need to make Programming easier not only for the learner but also for the
school teacher. Progranimate, coupled with its online activity packs, can lower the overheads of
teaching introductory programming. Furthermore, most of the teachers surveyed agreed that
Progranimate would make it easier for an inexperienced teacher to learn programming so that they
may teach it. This shows that Progranimate may enable teachers to deliver programming to
secondary school pupils when they might otherwise avoid it.
The study also provided further evidence of Progranimate‟s efficacy. The results showed that the
teachers feel that Progranimate and its associated activity packs of the scaffolding pedagogy make
programming accessible to a wider audience than they originally believed before being exposed to
Progranimate.
The number of participants in this study was only ten; therefore, the findings of the profiling
questionnaire study can only be indicative of the state of programming education in the UK, and
only in the proximity of the University of Glamorgan. For more definitive results, this questionnaire
would need to be rolled out to a much larger cohort of teachers across the county. This is certainly
an avenue for further research beyond the scope of this thesis. It will also be useful to seek the
opinions of many school teachers regarding Progranimate, its problems and other future work such
as the development of online tutorials.
Another research avenue that was identified was the opinion of a couple of teachers that
Progranimate and its problems could be used on students younger than school year 9s. This is
almost certainly something that will be investigated as future post thesis work.
To briefly summarise the findings of the key questions asked by this study, the following can be
said:

Evaluation by 13 to 17 Year Olds and Teachers of Them Chapter 8 – Secondary School Evaluations
Page 247
Do the Teachers Consider Progranimate and its Problems to be Effective?
Yes.
Would Progranimate make Teaching Programming Easier and More Convenient?
Yes according to all but one evaluator who was undecided.
Do the Activity Packs Make Teaching Programming Easier and More Convenient?
Yes.
Would Progranimate Fit Easily within the Computing Syllabus?
Yes
What ages do the Teachers Consider Progranimate and its Problems Suitable For?
The predominant opinion was GCSE, AS and A2. In addition others said years 7, 8 and 9.
What are The Teachers’ Opinions on Integration Difficulties
The time required to integrate it with the current syllabus, teacher expertise and limited contact time with pupils.
8.5 Chapter Summary and Conclusions
The aim of these three evaluations was to discover if Progranimate, coupled with its pedagogy was
suitable for teaching the basic imperatives of programming to secondary school pupils of varied
ages. The results showed that Progranimate, its pedagogy and associated problems were suitable,
very motivating and effective in teaching programming and its associated skills to secondary school
pupils. A particularly interesting finding was that Progranimate, its pedagogy and associated
problems were as suitable for 13 year olds as they were for 17 year olds.
An analysis of the completion times of the pupils demonstrated that Progranimate and its pedagogy
have a small learning curve that can be overcome within one or two hours of instruction.
Improvement in completion time (generally after two problems had been completed), despite the
incremental difficulty of the problems was also evidence that Progranimate and the activities of
scaffolding pedagogy was enhancing the problem solving skills of the evaluators.
The opinions of the secondary school teachers reinforced the findings of the secondary school
pupil studies. Furthermore, the teachers were able to confirm that Progranimate, coupled with its

Evaluation by 13 to 17 Year Olds and Teachers of Them Chapter 8 – Secondary School Evaluations
Page 248
pedagogy and online problems, would fit in well with the syllabus of GCSE and A-Level computer
science subjects. They also revealed that Progranimate has the potential to make delivering
programming to pupils easier, more convenient and thus more likely.
These results show that Progranimate is ideal as a platform with which to introduce the basics of
programming to secondary school pupils from ages 13 upwards to those taking their A-level in a
computer science related subject.

The Evaluation of Progranimate by University Students Chapter 9 – University Evaluation
Page 249
Chapter 9 University Evaluation
University Evaluation
The Evaluation of Progranimate by University Students
9.1 Introduction
The aim of this study is to measure the usability and efficacy of Progranimate with respect to its use
by novice first year university students studying on an introduction to programming module. This
data was gathered by gaining the students‟ attitudes towards Progranimate via questionnaire and
interview and by observing the students‟ study habits when using it. Also analysed was the impact
that Progranimate‟s incorporation had on the grades and pass rates achieved by the students.
Finally, the study also analysed the impact of a student‟s visual, verbal or balanced learning style on
their preference towards Progranimate as a whole, and its flowchart and code program
representations. The study utilised Progranimate version 3.5 which is the most recent version of
Progranimate referred to in this thesis (introduced previously in chapter 4).
Progranimate was piloted at the University of Glamorgan and the University of Manchester
(UMIST Campus). This study was conducted with approximately 242 undergraduate degree level
students studying an imperatives first Java based introduction to programming module (though not
all 242 students contributed to the final evaluation questionnaire due to varying attendance and
attrition). In both institutions, Progranimate was used for the entirety of its feature set, over a
period of 11 or more weeks. Thus, this study was an extensive and long term evaluation into its
benefit. After this, an evaluation questionnaire was given to the students to assess Progranimate‟s
efficacy in a number of areas. The questionnaire was given at this time because the students would
have had the opportunity to use all of the programming concepts Progranimate models, and it
would be fresh in their minds.
This chapter is organised as follows. Section 9.2 sets out the evaluation criteria, a set of twelve key
questions this study aims to address. Following this, section 9.3 provides an overview of the
Glamorgan and Manchester groups and how Progranimate was integrated within the learning
processes at the respective institutions. Section 9.4 then discusses the methodology used to gather
and analyse the evaluation results. Then, in section 9.5, the results of the final questionnaire are
presented, discussed and coupled with observations made in order to provide answers to the
evaluation criteria of section 9.2. Finally, section 9.6 presents the conclusions of this chapter.

The Evaluation of Progranimate by University Students Chapter 9 – University Evaluation
Page 250
9.2 Evaluation Criteria
To evaluate Progranimate‟s use as an aid to students learning to program, the evaluation criteria
used by this study is a subset of that discussed in chapter 6 and placed in the context of students.
This excludes criteria irrelevant to student use, focusing on thesis aims 1 and 2. The evaluation
questionnaire, interviews and observations used these criteria to guide what questions were asked
and what observations were important to this research. In this chapter the feedback gained by the
various data gathering techniques used are presented in 11 sections which address each criterion.
Below table 9-1 lists the criteria and recaps the justifications for their use as discussed in chapter 6.
Table 9-1. Evaluation Criteria and Justification for them.
No Aim Criteria Justification
1
Usability
Is Progranimate usable with respect to university undergraduates?
An important evaluation consideration for any computer program is usability, as this will inevitably impact on its efficacy in overcoming the problems it was designed to overcome.
2 1 Is the Progranimate (as a whole) helpful in supporting the students‟ learning of Programming?
In evaluating efficacy, the first priority was to discover if Progranimate and its features as a whole were helping students learn programming.
3 1 Are the flowcharts helpful in supporting the students‟ learning of programming?
Chapter 3 demonstrated that flowcharts have the potential to aid novices in learning programming. Whilst previous studies have shown they are effective with secondary school pupils, this needed to ascertained in this study which involves university degree students.
4 1 Is the code generation helpful in supporting the students‟ learning of Programming?
As identified in chapter 2, having novices try write code before they have gained knowledge of the concepts that underlie the language means novices spend too much time wrestling with code and do not develop a well rounded skill set. Progranimate‟s code generation features aim to overcome this by lowering the learning curve of code by having the novices focus on its meaning before attempting to write it themselves. This criterion was devised to evaluate the impact and helpfulness of Progranimate‟s code generation features.
5 Are the animation features useful in supporting the students‟ learning of Programming?
As advised by the several authors referenced in chapter 2, simulation strategies need to be expressly taught to novices to help them understand execution. Progranimate‟s animation features aim to achieve this and it is why this criterion was written.
6 1 Does Progranimate focus on problem solving and assist the development of problem solving skill?
Helping the novice to focus on and overcome their problem solving weaknesses was a key motive behind Progranimate‟s design. This criterion directs the evaluation towards establishing if this aim was met for University students at degree level.
7 1 Is Progranimate helpful in all, some or none of the Programming concepts and skills it aims to support?
This criterion was designed to question Progranimate‟s supportive capabilities though all the programming concepts it aims to model and all the key skills it aims to support. This aimed to identify which areas need more work and if extending the functionality of Progranimate would be a worthwhile undertaking.
8 1
How does Progranimate compare against existing learning resources, development systems and help available to the students?
Whilst the students may see Progranimate as beneficial (or not) it is important to see how these benefits compare with that provided by the existing learning support available to the students. This will establish if integrating Progranimate within the teaching of Programming is worthwhile for a tutor.
9 2 Has Progranimate‟s integration with the introductory programming module improved grades?
This criterion was defined to establish if Progranimate‟s integration within teaching improves the pass rates and marks of the students who use it.
10 2 What ability levels (if any ) are affected by Progranimate?
These two criteria were specified to assess Progranimate‟s efficacy by less subjective means. This was achieved by measuring its impact on student grades and to see which abilities have been affected by it and use it the most.
11 1
Can Progranimate address the mismatch between the computing students‟ predominantly visual learning preferences and the predominantly verbal (textual and spoken) teaching style of programming?
Inline with the background research into learning styles (section 3.2), this criterion was specified to establish which learning styles (visual, verbal or balanced) benefit from Progranimate. This aimed to demonstrate if Progranimate could be used to address the disparity between the students‟ prominently visual learning styles and the predominantly textual representation of programming as was discussed in (section 3.3.2).

The Evaluation of Progranimate by University Students Chapter 9 – University Evaluation
Page 251
9.3 The Two Evaluation Groups Manchester and Glamorgan
From this point, the students of the two universities will be referred to as the Glamorgan Group
and the Manchester Group. An overview of the two groups and how Progranimate was piloted,
utilised and integrated within their teaching is given within this sub section.
9.3.1 The Glamorgan Group
The Glamorgan group consisted of 126 first year students who were enrolled on various computing
degrees. Of these, 63 students were in attendance to complete the evaluation questionnaire. The
participants were studying a mandatory imperatives-first Java based introduction to programming
module. An overview of the age and gender of the Glamorgan group students is presented below in
table 9-2.
Table 9-2. An Overview of the Glamorgan Group Student Demographic
Ave Age Max Age Min Age <21 >=21 Males Females
20.15 28 18 77.0% 23.0% 89.7% 10.3%
For the Glamorgan students, each week of instruction consisted of a one hour lecture and a two
hour tutorial session. Besides this, the students were expected to put in four hours or more of self
study time on the subject.
Besides piloting the use of Progranimate, the students were expected to code in at least one of two
traditional text only programming environments. These consisted of the simplified Java
development environment BlueJ (Kölling et al, 2008), and the much more complex industrial
strength Java development environment JDeveloper10G (Oracle Corporation, 2008). The students‟
learning materials were provided via the blackboard virtual learning environment (VLE)
(Blackboard Inc, 2009) and tutorial tasks set by the Course-Marker application (The Learning
Technology Research Group, 2009), which is an automated programming task delivery, assessment
and feedback system.
9.3.1.1 Glamorgan’s Integration of Progranimate
For the Glamorgan group, Progranimate was used for the entire duration of the first year degree
introduction to programming module, during which it was used most often in the first two thirds of
the year. The paragraphs below describe the various ways in which Progranimate was integrated
within the teaching practices of the programming course.

The Evaluation of Progranimate by University Students Chapter 9 – University Evaluation
Page 252
Progranimate was used by the tutor in tutorials to re-iterate briefly the concepts covered in the
previous lecture. This was conducted as a collaborative activity on the tutorial classroom‟s
projection screen and lasted approximately 7 to 10 minutes. During this presentation the students
were encouraged to repeat the actions of the tutor on their workstations, whilst offering solutions
to the questions asked and programming problems posed. Besides refreshing fragile knowledge,
these demonstrations aimed to teach the use of Progranimate and thus allow the students to
discover its supportive benefits. This activity represents stage A of the scaffolding pedagogy
discussed in chapter 5.
Secondly, as each new programming concept was introduced, the students were encouraged to
solve some of the relevant online problem solving activities hosted on Progranimate‟s website. This
aimed to further reinforce a working knowledge of the concepts being covered whilst allowing this
knowledge to be applied without the complications of syntax getting in the way. This, coupled with
the tutor lead demonstrations, meant that for each concept, the students had the opportunity to
pass though all stages (A to D, see section 5.4) of the scaffolding pedagogy, should they feel the
need. After each concept introduction, the students would then reinforce the knowledge gained by
progressing on to standard traditional tutorial tasks, utilising the concepts in a more traditional code
only development environment. This ensured the students did not become reliant on
Progranimate. Also as discussed in chapter 5, progressing first though the pedagogy and then onto
traditional tutorial tasks ensures the students focus their attentions on all aspects of programming,
rather than making disproportionately time consuming attempts to write code without first
focusing on the underlying abstractions and their use in problem solving.
Thirdly, throughout the year, Progranimate was also used in a remedial context, whereby if one or
more students were having comprehension problems, Progranimate was used by the tutor as a
vehicle for concept demonstration, discussion and clarification. This was administered in the
tutorials in both one to one sessions and in small groups when more than one was experiencing
difficulty. This activity would be typically centred around a single classroom workstation. Examples
of this are showing and discussing the semantics of a for loop or showing the concept of the read
ahead While loop, or nested loops that are used to solve many programming problems.
Finally, it transpired that many students were utilising Progranimate without prompting in tutorials,
during self study time and at home.

The Evaluation of Progranimate by University Students Chapter 9 – University Evaluation
Page 253
9.3.2 The Manchester Group
For the Manchester study, 116 first year undergraduate electrical engineering degree students
participated, with 36 attending to complete the final questionnaire. The participants were studying a
Java based imperatives first introduction to programming module. An overview of the age and
gender of the Manchester group students is presented below in table 9-3.
Table 9-3. An Overview of the Manchester Group Student Demographic
Ave Age Max Age Min Age <21 >=21 Males Females
19.54 27 17 83.1% 16.9 98.7% 1.3%
For the Manchester group each week of instruction consisted of a one hour lecture and two hours
of tutorials. The students were expected to put additional self guided study time into the subject.
In Manchester, Progranimate was piloted alongside the institution‟s existing methods for teaching
programming. These consisted of writing programs in a general purpose text editor, then compiling
and running them from a command line interface. The students‟ learning materials and related
course content was delivered via the WebCT VLE (Goldberg, 1997). Like the Glamorgan students
the Manchester students used the Course-Marker system for the delivery and automated assessment
of programming tasks.
9.3.2.1 Manchester’s Integration of Progranimate
In the Manchester group, Progranimate was utilised as a part of the tutorial activities for the first
eleven weeks of the course. In this time the students would cover in Java, the imperative basics of
programming up to the level of one dimensional arrays.
During this time at the start of each tutorial, the students were tasked to complete two simple
programming exercises in Progranimate. This aimed to re-iterate the concepts covered in the
previous lecture, whist providing the novices with a mental model and functional understanding of
the programming concepts and problem solving techniques (e.g. nested Ifs and read ahead While
loop) that they would use for the remainder of the tutorial and in the following weeks. This was a
guided activity which served also to teach the students how to use Progranimate so they could turn
to it for help as and when they felt the need too.
It transpired that in addition to this guided activity, the Manchester students were using
Progranimate to support their programming activities without prompting, in much the same way as
the Glamorgan students were.

The Evaluation of Progranimate by University Students Chapter 9 – University Evaluation
Page 254
9.4 Questionnaire Methodology
This subsection provides a brief overview of the question styles and methodology used in gaining
the evaluation data from the evaluation questionnaire. More detailed information regarding the
question styles in use can be found in section 6.3.2.1. A blank example of the final questionnaire
can be found in appendix J that accompanies this chapter and study.
The questionnaire contained multiple choice questions, where the respondent could choose one
from a range of response options or simply yes and no. It also contained multiple response
questions, where the respondent could tick as many response options as is applicable to them. For
the multiple choice and multiple response questions, the summed responses for each category are
presented as a percentage of the total number of evaluators responding to that response choice.
The questionnaire also used a mixture of five point and seven point Likert questions. The five
point questions are used to establish if the respondent agrees or disagrees with the question text,
whereby the response options are: 0=Strong Disagreement, to 4=Strong Agreement. The seven point
Likert questions are used to rate the effectiveness or helpfulness of Progranimate‟s features,
whereby the response options are 0= unhelpful to 6 helpful. The responses to all questions are
presented in percentage terms (100% being the maximum possible rating), with exception to the
distributions which show the actual number of respondents for each response category. The
average response for each Likert style question is calculated as a percentage of the maximum
possible average score that can be achieved. For example, in a five point Likert question, if every
respondent selected option 4 (Strongly Agree) then the average response would be 100%. For the
five point Likert questions, also shown is the percentage of agreement (strongly agree and agree
combined), indecision and disagreement (strongly disagree and disagree combined). For the seven point
Likert questions, also shown is the percentage of efficacy (helpful, somewhat helpful and a little helpful
combined), indecision, and inefficacy (unhelpful, somewhat unhelpful and a little unhelpful combined).
The final questionnaire received a total of 99 respondents. To ensure the data gained was reliable,
some evaluators‟ responses were removed. For example, four evaluators‟ responses were removed
from the five point Likert style questions because their answers across all these Likert questions
were same, indicating a lack of engagement. However, where their answers showed variance, for
example the multiple choice and multiple response questions, their responses were retained. A small
number of responses were also removed from a range of grouped and related Likert questions
because the same response was received for all questions of that group. For example, the
evaluators were asked to rate the effectiveness of each of Progranimate‟s features; a few evaluators

The Evaluation of Progranimate by University Students Chapter 9 – University Evaluation
Page 255
gave the same response for each feature. The removal of responses was carried out regardless of
how positive, negative or neutral the responses were. Also, for unknown reasons, some questions
were skipped by some evaluators. Because of this, the number of respondents (shown as RSP)
varies slightly from one question to another.
Where correlations have been made, the number of responses also varies. Of the ninety-nine
questionnaire participants, seventy eight had participated in various profiling activities, i.e. gaining
information on their learning styles and previous experience. This was because between the two
activities, the attendance varied.
In this section the results of the final questionnaire are first presented as a whole in various tables.
Then, following this, observations made during the year and questionnaire responses are used to
provide answers to the twelve evaluation criteria presented earlier in respectively titled subsections.
9.5 Results
The responses and question text of the final questionnaire are shown below in tables 8-3 to8-7
Table 9-4. Final Questionnaire - Five Point Likert Questions 1 to 14 – Efficacy and Usability
Q Question Text Rsp Ave %
Agree %
Undec %
Disagree %
Distribution
0 1 2 3 4
1 Progranimate is easy to use 95 73.42 76.84 15.79 7.37 0 7 15 50 23
2 Progranimate was enjoyable to use 95 72.63 80.00 13.68 6.32 2 4 13 58 18
3 Progranimate was useful in my studies of programming 95 70.26 70.53 21.05 8.42 1 7 20 48 19
4 Progranimate is a good support tool for novice programmers 95 83.95 87.37 10.53 2.11 0 2 10 35 48
5 The flowcharts helped me visualise solutions and algorithms in my mind.
95 74.47 77.89 15.79 6.32 2 4 15 47 27
6 Flowcharts are good problem solving aides 95 75.53 80.00 15.79 4.21 1 3 15 50 26
7 I found flowcharts useful when designing problem solutions 95 68.95 66.32 25.26 8.42 1 7 24 45 18
8 The use of colour in the flowchart visualisation made it easier to understand
93 75.27 77.17 19.57 3.26 0 3 18 49 22
9 The relationship between the code and the flowchart is very clear in Progranimate.
94 73.40 76.60 14.89 7.45 0 7 14 53 19
10
The relationship between the code and flowchart made it easier for me to translate a flowchart into code when not using Progranimate.
93 64.78 56.99 33.33 9.68 2 7 31 40 13
11 Progranimate's code visualisation demonstrated good code structure and layout.
93 73.12 79.57 18.28 2.15 0 2 17 60 14
12
The error messages generated by Progranimate were more meaningful than those returned by the java compiler or the other programming environment you use.
94 69.41 61.70 38.30 00.00 0 0 36 43 15
0 to 24.9% [0] = Strongly Disagree 25 to 49.9.9% [1] = Disagree 50% [2] = Undecided 50.9 to 74.9% [3] Agree 75 to 100% [4] = Strongly Agree (0 + 1) *100/rsp = % Disagree 2*100/rsp = % Undecided ( 3 + 4) * 100 /rsp = % Agree
Table 9-5. Final Questionnaire - Multi Option - Multi Response - Questions 15 to 19 – Usage

The Evaluation of Progranimate by University Students Chapter 9 – University Evaluation
Page 256
Q Question Text RSP 0 1-3 4-6 7-10 >10
13 How many times did you use Progranimate without being asked?
99 1.01% 32.32% 42.42% 13.13% 7.07%
14
On occasions when you used Progranimate without prompting by a tutor, on average how many minutes did you use it for?
RSP 1-5 6-10 11-15 16-20 20-30 30-45 >45
99 17.17% 19.19% 17.17% 17.17% 10.10% 12.12% 5.05%
15 Did you use Progranimate at home? RSP Yes No
98 40.82% 59.18%
16 Which programming concepts did you use in Progranimate?
RSP Variables Arrays Print Read Assign If If_Else While For
98 80.61% 45.92% 86.73% 58.16% 54.08% 70.41% 48.98% 57.14% 57.14%
17 Was the number of concepts covered by Progranimate sufficient?
RSP Not Enough About Right Too Many
97 9.28% 89.69% 1.03% Results presented as a percentage of the total number of respondents (rsp) for each category.
Table 9-6. Final Questionnaire - Seven Point Liker Questions 20a to 20n – Areas of Assistance
Q Rank Question Text : Please rate how helpful you found Progranimate with your learning of these programming aspects:
Rsp Ave %
Helpful
% Undec
%
Not
Helpful
%
Distribution
0 1 2 3 4 5 6
18a 4 Variables 78 75.21 71.79 25.64 2.56 1 0 1 20 14 18 24
18b 2 Arrays 39 76.50 76.92 23.08 0.00 0 0 0 9 8 12 10
18c 9 Assignment (For example x = y * 2) 51 72.88 70.59 27.45 1.96 1 0 0 14 10 15 11
18e 10 If 64 72.40 71.88 23.44 4.69 2 0 1 15 13 19 14
18f 7 If_Else 46 73.55 69.57 28.26 2.17 1 0 0 13 7 14 11
18g 3 For 43 75.58 76.74 18.60 4.65 1 0 1 8 8 13 12
18h 5 While 55 74.85 74.55 25.45 0.00 0 0 0 14 12 17 12
18i 13 Sequence (order of components & statements) 87 68.77 66.67 31.03 2.30 2 0 0 27 25 20 13
18j 6 The layout and structure of code 91 73.63 75.82 21.98 2.20 2 0 0 20 22 28 19
18k 12 The syntax of the programming language 91 71.25 70.33 26.37 3.30 3 0 0 24 20 27 17
18l 11 Problem solving 90 72.04 72.22 24.44 3.33 2 1 0 22 24 20 21
18m 8 Program design 87 73.18 71.26 24.14 4.60 4 0 0 21 15 23 24
18n 1 Understanding program execution (how a program runs)
92 77.54 75.00 21.74 3.26 2 0 1 20 11 26 32
Total n/a Averages and Totals for all questions 914 73.64 72.56 24.74 2.69 21 1 4 227 189 252 220 0% [0] = Not Helpful 50% [3] = Undecided 100% [6] = Very Helpful
(0 + 1 + 2) *100/rsp = Unhelpful 3*100/rsp = % Undecided ( 4 + 5 + 6) * 100 /rsp = % Helpful
Table 9-7. Final Questionnaire - Seven Point Likert Questions 21a to 21e - Evaluating Main Features
Q Rank Question Text : Rate how helpful were each of
Progranimate‟s main features in helping you improve
your programming knowledge and abilities:
Rsp Ave %
Helpful
% Undec
%
Not
Helpful
%
Distribution
0 1 2 3 4 5 6
19a 1 Flowchart 91 81.32 82.42 17.58 0.00 0 0 0 16 16 22 37
19b 2 Code generation 91 78.57 83.52 15.38 2.20 0 0 2 14 24 20 32
19c 3 Variable inspection 92 75.54 75.00 25.00 0.00 0 0 0 23 20 26 23
19e 4 Animation features 90 71.30 63.33 34.44 2.22 1 0 1 31 16 20 21
19d 5 Array inspection 88 66.29 54.55 42.05 3.41 2 1 0 37 17 16 15 0% [0] = Not Helpful 50% [3] = Undecided 100% [6] = Very Helpful
(0 + 1 + 2) *100/rsp = % Unhelpful 3*100/rsp = % Undecided ( 4 + 5 + 6) * 100 /rsp = % Helpful
Table 9-8. Final Questionnaire - Seven Point Likert Questions 22a to 22e - Comparison of Learning Aids
Q Rank Question Text : Please rate how helpful you found Progranimate with your learning of these programming aspects:
Rsp Ave %
Helpful
% Undec
%
Not
Helpful
%
Distribution
0 1 2 3 4 5 6
20a 5 WebCT / BlkBrdOnline learning material 94 74.29 77.66 15.96 6.38 3 0 3 15 27 16 30
20b 4 Lecture notes 95 76.32 76.84 18.95 4.21 2 0 2 18 20 21 32
20c 9 Text books 92 58.88 42.39 45.65 11.96 7 2 2 42 15 11 13
20d 3 Discussion wih the tutor 92 76.99 71.74 25.00 3.26 2 1 0 23 11 19 36
20e 1 Lectures 95 80.35 82.11 14.74 3.16 0 0 3 14 19 20 39
20f 7
Course Master( with Notepad or Context CX for
Manchester ) 94 67.73 67.02 15.96 17.02 5 3 8 15 21 18 24
22g 8 Examples found on the the web (outside WebCT) 92 65.58 57.61 33.70 8.70 4 1 3 31 23 10 20
22h 2 Progranimate 92 77.36 81.52 13.04 5.43 1 2 2 12 20 25 30
22i 6 BlueJ (Manchester not using) 62 70.70 64.52 22.58 12.90 4 1 3 14 7 12 21
22j 10 Jdeveloper 10G (Manchester not using) 62 52.15 41.94 30.65 27.42 10 5 2 19 12 4 10
0% [0] = Unhelpful 50% [3] = Undecided 100% [6] = Very Helpful
(0 + 1 + 2) *100/rsp = % Unhelful 3*100/rsp = % Undecided ( 4 + 5 + 6) * 100 /rsp = % Helpful

The Evaluation of Progranimate by University Students Chapter 9 – University Evaluation
Page 257
In the subsections that follow, the responses to these questions and further correlations are used to
provide answers to the evaluation criteria set out in section 9.2 of this chapter. So the reader does
not have to flick back and forth, the responses to relevant questions are repeated where discussed.
9.5.1 Is Progranimate Usable with Respect to University Students?
This evaluation aspect aims to ascertain Progranimate‟s usability with respect to use by university
students; in doing so, it provides an answer to question one of evaluation criteria.
9.5.1.1 Web Launching
Observations showed at both the Glamorgan and Manchester campuses, the students had no
problems accessing Progranimate via its web launching features. The download times even for the
Manchester students were between thirty seconds to a minute. Given that the Manchester group are
at a different campus than where Progranimate‟s web server is located, this is evidence enough that
the Java Web Start deployment method used to deploy Progranimate is appropriate and effective.
9.5.1.2 Is Progranimate easy to use?
Observation showed that the Glamorgan and Manchester students had no discernable difficulty
learning to use Progranimate demonstrated its learning curve to be very flat At Glamorgan, in the
first tutorial, Progranimate and its pedagogy allowed the students to build meaningful programs in a
problem solving context. These programs included the use of variables, assignment, calculations,
screen output (print) and keyboard input (read). This was even more remarkable, as for some
of Glamorgan‟s students, tutorial one was timetabled before the first lecture. In the years before
Progranimate‟s introduction the first tutorial was typically devoted to mastering the development
environment and producing simple programs with print statements only. The introduction of
Progranimate facilitated a giant leap forward in the number of concepts that could be conveyed and
understood in the first tutorial. This is testament to Progranimate‟s ease of use.
Question one evaluated the ease of use of Progranimate as a whole. The results gained by this
question (see table8-8) show that the vast majority of students believed Progranimate easy to use
and many strongly so. The time at which the questionnaire was administered meant the students
would have had the opportunity to use Progranimate through all of the programming concepts it

The Evaluation of Progranimate by University Students Chapter 9 – University Evaluation
Page 258
supports. This shows that overall, Progranimate and all of its programming features are very usable
with respect to novice programmers at university level.
Table 9-9. Final Questionnaire – Ease of Use Responses by all Students
Q Question Text Rsp Average
% Agree
% Undec
% Disagree
%
Distribution
0 1 2 3 4
1 Progranimate is easy to use 95 73.42 76.84 15.79 7.37 0 7 15 50 23 0 to 24.9% [0] = Strongly Disagree 25 to 49.9.9% [1] = Disagree 50% [2] = Undecided 50.9 to 74.9% [3] Agree 75 to 100% [4] = Strongly Agree
(0 + 1) *100/rsp = %a Disagree 2*100/rsp = % Undecided ( 3 + 4) * 100 /rsp = % Agree
9.5.1.3 Is Progranimate enjoyable to use?
Linked to usability is enjoyment; if Progranimate is seen as enjoyable to use, then it‟s logical to
assume that students will be more motivated to engage with it and reap its potential benefits.
It was clear that by enabling the students to build more meaningful programs early on,
Progranimate was having a noticeably positive effect on the students‟ enjoyment and motivation at
the start of the module. In addition to the first few tutorials, observations showed the students
enjoyed using Progranimate throughout the year. The students also seemed to enjoy watching the
execution of the programs they had created, especially once they had arrived at a valid solution to a
problem.
Question two gauged the levels of pleasure derived from using Progranimate. The results shown in
table 9-10 demonstrate that the vast majority of students were deriving pleasure from using
Progranimate, as is evidenced by the number of agreements and strong agreements.
Table 9-10. Enjoyment – Responses by All Students
Q Question Text Rsp Average
% Agree
% Undec
% Disagree
%
Distribution
0 1 2 3 4
2 Progranimate was enjoyable to use 95 72.63 80.00 13.68 6.32 2 4 13 58 18 0 to 24.9% [0] = Strongly Disagree 25 to 49.9.9% [1] = Disagree 50% [2] = Undecided 50.9 to 74.9% [3] Agree 75 to 100% [4] = Strongly Agree
(0 + 1) *100/rsp = % Disagree 2*100/rsp = % Undecided ( 3 + 4) * 100 /rsp = % Agree
9.5.1.4 Summary of Findings
EC1 :- Is Progranimate Usable with Respect to University Students?
Java Web Start is an appropriate and effective mechanism for deploying Progranimate.
Progranimate is easy to use, which permits the students to build interesting and relatively
complex programs in their first tutorial.
The vast majority of students are deriving pleasure from using Progranimate.

The Evaluation of Progranimate by University Students Chapter 9 – University Evaluation
Page 259
9.5.2 Do Students Find Progranimate Helpful in their Learning of Programming?
The key question of this subsection was derived via observation, and by asking the students (via
questionnaire) if they found Progranimate helpful and how often they used it.
9.5.2.1 Is Progranimate Helpful to the Students?
The students‟ perceptions of helpfulness were gained by their responses to questions three and
four, which are repeated in table 9-11. The average response for question three shows that overall,
the large majority of students agreed (many strongly so) that Progranimate was useful in their
studies of programming. The responses to question four were even more positive, providing the
highest average score and agreement of all the questions asked in this study. The responses to these
questions show that Progranimate was helpful in supporting their learning of programming by most
students.
Table 9-11. Final Evaluation - Q4 and Q5 - Helpfulness of Progranimate
Q Question Text Rsp Ave %
Agree %
Undec %
Disagree %
Distribution
0 1 2 3 4
3 Progranimate was useful in my studies of programming 95 70.26 70.53 21.05 8.42 1 7 20 48 19
4 Progranimate is a good support tool for novice programming 95 85.95 87.37 19.53 2.11 0 2 10 35 48 0 to 24.9% [0] = Strongly Disagree 25 to 49.9.9% [1] = Disagree 50% [2] = Undecided 50.9 to 74.9% [3] Agree 75 to 100% [4] = Strongly Agree
(0 + 1) *100/rsp = % Disagree 2*100/rsp = % Undecided ( 3 + 4) * 100 /rsp = % Agree
9.5.2.2 How Much Was Progranimate Used?
The efficacy of Progranimate can also be ascertained by looking at how often it was used and for
how many minutes at a time. Observations made at both the campuses showed Progranimate was
used with surprising regularity, especially at the beginning and during the weeks in which the
control structures and nesting were covered. To gain statistical information on how much
Progranimate was used, three questions were asked, the overall responses of which are shown
below in table 9-12.
Table 9-12. Final Questionnaire - How Much Was Progranimate Used – Q15, Q16 and Q17
Q Question Text RSP 0 1-3 4-6 7-10 >10
13 How many times did you use Progranimate without being asked?
99 1.01% 32.32% 42.42% 13.13% 7.07%
14 On occasions when you used Progranimate without prompting by a tutor on average how many minutes did you use it for?
RSP 1-5 6-10 11-15 16-20 20-30 30-45 >45
99 17.17% 19.19% 17.17% 17.17% 10.10% 12.12% 5.05%
15 Did you use Progranimate at home? RSP Yes No
98 40.82% 59.18% Results presented as a percentage of the total number of respondents (rsp) for each category.
These results show that Progranimate was utilised without prompting to a varying extent. Most

The Evaluation of Progranimate by University Students Chapter 9 – University Evaluation
Page 260
students used it more than once, with the majority estimating between four to six times. A smaller
number used Progranimate more than ten times, which meant some were using it in almost every
lesson and in their self study time. The use of Progranimate at home was confirmed by the
responses to question 15, which show that it motivated home study in approximately 41% of the
students. These findings show that Progranimate must have been of some benefit, or else the
majority students would not have returned to it multiple times unless prompted to do so by a tutor.
The durations for which Progranimate was used were gained by question 14. The statistics show a
wide spread of use. Whilst some only used it for between one to five minutes, many more were
using it for longer periods. This indicates that most students were giving Progranimate more than
just a cursory glance, which is further evidence of its efficacy in helping students.
9.5.2.3 Summary of Findings
EC2: Do Students Find Progranimate Helpful in their Learning of Programming?
The vast majority of evaluators agreed Progranimate was helpful in their studies and a good
number strongly so.
On average the evaluators agreed strongly that Progranimate was a good support tool for
novice programmers.
Most students were using Progranimate multiple times and for extended periods. This is also
evidence of Progranimate‟s efficacy.
9.5.3 Are the Flowcharts Helpful in Supporting the Learning of Programming
Observations and informal discussions with the pupils revealed that the flowcharts were very useful
to the students, right from the beginning of the year. A testament to the efficacy of the flowcharts is
that the first tutorial was able to cover more concepts than usual and in a problem solving context.
Informal discussions with the students revealed that the flowcharts were seen as useful for building
a rough outline of a program which could then be refined in the code view, or by exporting the
generated code to a more traditional environment. The flowcharts appeared especially useful to the
students in the weeks when they were learning and developing algorithms that required loops or the
nesting of control structures. With Progranimate‟s flowcharts, the students seemed better able to
envisage solutions to the programming tasks given in tutorials, particularly when they viewed the

The Evaluation of Progranimate by University Students Chapter 9 – University Evaluation
Page 261
task as difficult. When asked of the benefit of colour, most students said that it helped distinguish
between the parts, whereas with black and white flowcharts, the differences between loops and
decisions, inputs and outputs are less obvious. A few stated that colour made no real difference, as
they were just as clear without it.
The efficacy of Progranimate‟s flowcharts was evaluated by five Likert questions. The responses to
these questions demonstrate that overall, the students believe Progranimate‟s flowcharts and their
use of colour to be very effective. These responses are shown below in table 9-13 and table 9-14.
Table 9-13. Final Questionnaire - Helpfulness of the Flowcharts
Q Question Text Rsp Ave %
Helpful %
Neutral %
Unhelpful %
Distribution
0 1 2 3 4 5 6
19a How helpful were Progranimate‟s flowcharts in helping you improve your programming knowledge and abilities?
91 81.32 82.42 17.58 0.00 0 0 0 16 16 22 37
0% [0] = Unhelpful 50% [3] = Undecided 100% [6] = Helpful
(0 + 1 + 2) *100/rsp = %Unhelpful 3*100/rsp = % Undecided ( 4 + 5 + 6) * 100 /rsp = % Helpful
Table 9-14. Final Questionnaire - Flowchart Question Responses
Q Question Text Rsp Ave %
Agree %
Undec %
Disagree %
Distribution
0 1 2 3 4
5 The flowcharts helped me visualise solutions and algorithms in my mind.
95 74.47 77.89 15.79 6.32 2 4 15 47 27
6 The flowcharts are good problem solving aides. 95 75.53 80.00 15.79 4.21 1 3 15 50 26
7 I found the flowcharts useful when designing problem solutions
95 68.95 66.32 25.26 8.42 1 7 24 45 18
8 The use of colour in the flowchart visualisation made it easier to understand
95 75.27 77.17 19.57 3.26 0 3 18 49 22
0 to 24.9% [0] = Strongly Disagree 25 to 49.9.9% [1] = Disagree 50% [2] = Undecided 50.9 to 74.9% [3] Agree 75 to 100% [4] = Strongly Agree
(0 + 1) *100/rsp = % Disagree 2*100/rsp = % Undecided ( 3 + 4) * 100 /rsp = % Agree
The responses to question 19a show that on the whole, the students‟ knowledge and abilities were
positively influenced by the flowcharts. The most common response to this question was strong
agreement, which alone is evidence that Progranimate‟s flowcharts have been effective. There were
also no disagreements, a feat achieved by only four other questions (12, 18b, 18h, and 19c).
The responses to question five show that 77.89% of the students agreed (many strongly so) that the
flowcharts helped them visualise solutions and algorithms in their mind. This demonstrates the
flowcharts were helping the students to develop effective mental models of program composition, a
component skill of problem solving. Question six gained a very similar response which showed that
the vast majority of students agreed the flowcharts were good problem solving aids (with many
strong agreements). The feedback gained by question seven concurred with this showing that most
of the students found Progranimate‟s flowcharts useful when designing problem solutions. Finally,
question eight aimed to evaluate the benefit of using coloured flowchart notation. The average
response was one of strong agreement (>=75%) which shows that colour has made Progranimate‟s
flowcharts easier to understand.

The Evaluation of Progranimate by University Students Chapter 9 – University Evaluation
Page 262
9.5.3.1 Summary of Findings
EC3 - Are the flowcharts of Progranimate helpful in supporting the learning of programming?
On average, the flowcharts were seen as very helpful and by many very much so.
Some students had adopted a development strategy for difficult problems, whereby they would
use the flowcharts to produce a rough outline of a program that was then tweaked in code.
Most students saw the flowchart‟s use of colour as beneficial, clarifying the distinct commands
and structures represented within it.
9.5.4 Is the Code Generation Helpful in Supporting the Students Learning?
Observations of both groups showed that the code generation features were being utilised in a
variety of ways. Code generation was also used by some students to look up the syntactic form of
various language features and structures which they had forgotten. Others would develop a
program by interacting with the flowchart, but then export the generated code and refine it in a
standard development environment. Some (seemingly the more able) would start program creation
by interacting with the flowchart, but then finish off their solutions by interacting with the code,
usually for refining the expressions of the structures and commends. Occasionally, some of the
highest achievers were observed using Progranimate to look up the syntax of things they had not
yet been formally taught.
The responses to final questionnaire questions Q19b, Q9, Q10 and Q11 (table 9-15 and table 9-16
below) provide statistical evidence to illustrate the efficacy of Progranimate‟s code generation.
Table 9-15. Final Questionnaire – Seven Point Likert Code Generation Related Questions
Q Question Text Rsp Ave %
Agree %
Undec %
Disagree %
Distribution
0 1 2 3 4 5 6
19b How helpful was Progranimate's code generation in helping you improve your programming knowledge and abilities?
91 78.57 82.52 15.38 2.30 0 0 2 14 24 20 32
0% [0] = Unhelpful 50% [3] = Undecided 100% [6] = Very Helpful
(0 + 1 + 2) *100/rsp = % Unhelpful 3*100/rsp = % Undecided ( 4 + 5 + 6) * 100 /rsp = % Helpful
Table 9-16. Final Questionnaire – Five Point Likert Code Generation Related Questions
Q Question Text Rsp Ave %
Agree %
Undec %
Disagree %
Distribution
0 1 2 3 4
9 The relationship between the code and the flowchart is very clear in Progranimate.
94 73.40 76.60 14.89 7.45 0 7 14 53 19
10
The relationship between the code and flowchart made it easier for me to translate a flowchart into code when not using Progranimate.
93 64.78 56.99 33.33 9.68 2 7 31 40 13
11 Progranimate's code visualisation demonstrated good code structure and layout.
93 73.12 79.57 18.28 2.15 0 1 7 60 7
0 to 24.9% [0] = Strongly Disagree 25 to 49.9.9% [1] = Disagree 50% [2] = Undecided 50.9 to 74.9% [3] Agree 75 to 100% [4] = Strongly Agree
(0 + 1) *100/rsp = % Disagree 2*100/rsp = % Undecided ( 3 + 4) * 100 /rsp = % Agree

The Evaluation of Progranimate by University Students Chapter 9 – University Evaluation
Page 263
The responses to question 19b show that the vast majority of students considered the code
generation features to be improving their knowledge and programming abilities by gaining an
overall strong agreement. The responses to question 11 show that on the whole, the students
believe the code generated by Progranimate represents well written and well structured code.
In Progranimate the relationship between the flowcharts and code is emphasised by the
synchronised highlighting features. The aim was to allow the novices to relate the individual pieces
of the more intuitive flowchart representation to individual pieces of the more obscure, less
intuitive and less memorable code representation. The responses to question nine show that
regarding this feature, the vast majority of evaluators considered this relationship to be very clear by
gaining an overall agreement. Question ten shows this feature assisted most novices in developing
the skills needed to translate a flowchart into code outside of Progranimate.
9.5.4.1 Findings Summary
EC4: Is the code generation helpful in supporting the students‟ learning of programming?
The code generation features were seen as helpful and used in a variety of ways.
o To focus on the problem, not the language
o To work on the program details i.e. expressions (higher achiever),
o To look up the syntactic form of language features
o To get ahead of what was expressly taught (higher achiever)
The code is viewed by the students as well written.
The visualised relationship between code and flowchart was clear and useful to the students.
9.5.5 Are the Animation Features Useful in Supporting the Students Learning?
Observations of both groups showed animation was used regularly by the majority of students. It
was used to great effect by the class tutor to demonstrate a range of situations in which nested
loops and decisions could be used. However, observations also indicated that some students were
using Progranimate, but not its animation features. An informal discussion with these students
revealed that they felt Progranimate‟s combination of flowchart and code was alone sufficient to
gain an insight into how the program would run.
Statistical evidence regarding the efficacy of Progranimate‟s animation features was gained by

The Evaluation of Progranimate by University Students Chapter 9 – University Evaluation
Page 264
questions 18n, 19c, 19d and 19e of the final questionnaire. These questions also evaluate the
variable and array inspectors, as they form a crucial part of Progranimate‟s animated execution. The
overall responses to these questions are presented below in table 9-17.
Table 9-17. Final Questionnaire - Animation Related Questions
Q Question Text Rsp Ave %
Agree %
Undec %
Disagree %
Distribution
0 1 2 3 4 5 6
18n Please rate how helpful you found Progranimate with understanding program execution (How a program runs)
92 77.54 75.00 21.74 3.26 2 0 1 20 11 26 32
19e How helpful were Progranimate's animation features in helping you improve your programming knowledge and abilities?
90 71.30 63.33 34.44 2.22 1 0 1 31 16 20 21
19c How helpful was Progranimate's variable inspector in helping you improve your programming knowledge and abilities
91 75.54 75.00 25.00 0.00 0 0 0 23 20 26 23
19d How helpful was Progranimate's array inspector in helping you improve your programming knowledge and abilities
88 66.29 54.55 42.05 3.41 2 1 0 37 17 16 15
% [0] = Unhelpful 50% [3] = Undecided 100% [6] = Very Helpful
(0 + 1 + 2) *100/rsp = % Unhelpful 3*100/rsp = % Undecided ( 4 + 5 + 6) * 100 /rsp = % Helpful
The responses to question 19e show a clear majority viewed the animation features as helpful in
improving their knowledge and abilities. Further evidence was gained in responses to question 18,
which show that for the majority of students, Progranimate provided a very effective model of
execution. The responses to question 19c show that many also found the variable inspection
features helpful. The results for question 19d show that many of the evaluators were also benefited
by the array inspection features, but less so than for the standard variable inspector. This is to be
expected as by the time arrays are studied the majority of students would need less support.
However, despite this it was clear that the array inspector was viewed as a helpful feature.
These results show that as a whole the students believe the animation features are useful in
supporting their learning of programming and by a fair number very much so.
9.5.5.1 Summary of Findings
EC5 - Are the animation features useful in supporting the students learning of programming?
As a whole the animation features are helpful in supporting the students‟ knowledge of program
execution, especially in regard to the variable inspector which keeps track of variables.
9.5.6 Does Progranimate Focus on Problem Solving and Assist the development of
Problem Solving Skill?
Because the students of Glamorgan and Manchester were encouraged to embrace Progranimate

The Evaluation of Progranimate by University Students Chapter 9 – University Evaluation
Page 265
early on, they quickly learned to appreciate and utilise Progranimate as a problem solving tool. Its
problem solving focus was evident from the first tutorial, which as mentioned previously, was able
to engage the students in meaningful problem solving activity. Without prompting from the tutor,
many students were turning to Progranimate when reaching an impasse, or when starting a tutorial
task they saw as challenging. The students were using the flowcharts to construct a rough solution
to the various standard programming problems (non scaffolding pedagogy) they were set in their
tutorials. They would then use the code view or a standard development environment to refine the
generated code into the final program. This usage was not reserved for the first few weeks; this
usage persisted up until and for some students even beyond their study of one dimensional arrays
and after the final questionnaire was administered.
Evidence to support Progranimate‟s efficacy as a problem solving aid was also gained by questions
five, six and seven. These questions were discussed earlier in relation to flowcharts but are also
relevant to problem solving. Also shown are questions 18m and 18l of the final questionnaire (not
discussed previously), these also evidence Progranimate‟s problem solving efficacy.
Table 9-18. Final Questionnaire - Five Point Likert Problem Solving Questions
Q Question Text Rsp Ave %
Agree
%
Undec
%
Disagree
%
Distribution
0 1 2 3 4
5 The flowcharts helped me visualise solutions and algorithms in my mind. 95 74.47 77.89 15.79 6.32 2 4 15 47 27
6 The flowcharts are good problem solving aides. 95 75.53 80.00 15.79 4.21 1 3 15 50 26
7 I found the flowcharts useful when designing problem solutions 95 68.95 66.32 25.26 8.42 1 7 24 45 18 0 to 24.9% [0] = Strongly Disagree 25 to 49.9.9% [1] = Disagree 50% [2] = Undecided 50.9 to 74.9% [3] Agree 75 to 100% [4] = Strongly Agree
(0 + 1) *100/rsp = %a Disagree 2*100/rsp = % Undecided ( 3 + 4) * 100 /rsp = % Agree
Table 9-19. Final Questionnaire - Seven Point Likert Problem Solving Questions
Q Rank Question Text : Please rate how helpful you found Progranimate with your learning of these programming aspects:
Rsp Ave %
Agree %
Undec %
Disagree %
Distribution
0 1 2 3 4 5 6
18m 8 Program Design 87 73.18 71.26 24.14 4.60 4 0 0 21 15 23 24
18l 11 Problem solving 90 72.04 72.22 24.44 3.33 2 1 0 22 24 20 21 % [0] = Unhelpful 50% [3] = Undecided 100% [6] = Very Helpful
(0 + 1 + 2) *100/rsp = % Unhelpful 3*100/rsp = % Undecided ( 4 + 5 + 6) * 100 /rsp = % Helpful
The responses to all five questions show firm agreements and opinions of helpfulness have been
reached. Questions five, six and seven show that on average, the students believe the flowcharts:
helped them visualise solutions in their mind, were good problem solving aides and were useful in
designing problem solutions. Clearly, these results show the majority of students believe
Progranimate‟s flowcharts are having a positive impact on problem solving ability and associated
skills such as the development of mental models. Questions 18m and 18l relate to the problem
solving efficacy of Progranimate as a whole. The responses to these questions show that
Progranimate was viewed as a helpful problem solving and program design tool by the vast majority
of students, and by some very much so.

The Evaluation of Progranimate by University Students Chapter 9 – University Evaluation
Page 266
9.5.6.1 Summary of Findings
EC6 -Does Progranimate Focus on Problem Solving and Assist the development of problem solving skill?
Progranimate‟s small learning curve allows students to quickly focus on problem solving aspects
of programming from even their first hour of instruction.
Progranimate is seen by the vast majority of students as an effective problem solving aid; some
rated it as highly effective.
As a problem solving aid Progranimate is useful for more than just the first few weeks of study.
9.5.7 Does Progranimate Help Students with all the Concepts and skills it is
Designed to Support?
Although very useful in introducing novice students to the basics of variables, assignment, printing
and keyboard input, Progranimate was useful for more than just the first few weeks of study. From
watching students in tutorials, it was clear that Progranimate was assisting students in every
programming concept that it implemented. In particular, Progranimate was seen as very useful
when introducing and conveying the concepts of decisions, loops, nesting and arrays. It was also
useful in demonstrating common algorithms that utilise these programming concepts. Furthermore,
even though Progranimate does not support 2D arrays, it was used to great effect to demonstrate to
students how nested for loops can be used to pass though every element of a two dimensional
array. This was achieved by replacing the array accessing statements with print lines for column and
row.
In support of these observations, the overall responses gained by questions 18a to 18n provide
statistical evidence that Progranimate was helpful in assisting the students in learning all of the
programming concepts it implements. For convenience, the students‟ responses to questions 18a to
18n are repeated below in table 9-20. As shown, each concept received more than a handful of „very
helpful‟ responses (option 6) and overall gained an average response indicating helpful or very
helpful.
These results are not a result of a few enthusiastic students rating everything as a six, as where the
respondents showed no variance in their responses to questions 20o to 20l, they were omitted
(however positive). Nor are the negative responses the result of a few pessimistic students

The Evaluation of Progranimate by University Students Chapter 9 – University Evaluation
Page 267
repeatedly rating things lowly. In all but one case, those with negative responses to a question gave
positive responses to other questions. To further ensure the validity of the responses, where an
evaluator had indicated they had not used a particular feature (via question sixteen shown in Table
9-5 on page 255) their responses were removed for that feature. It is for this reason the number of
respondents vary from one question to another.
Table 9-20. Final Questionnaire - What Skills and Concepts does Progranimate Assist
Q20 Rank Question Text : Please rate how helpful you found Progranimate with your learning of these programming aspects:
Rsp Ave
% Helpful
% Undec
% Unhelpful
%
Distribution
0 1 2 3 4 5 6
18n 1 Understanding program execution (how a program runs) 92 77.54 75.00 21.74 3.26 2 0 1 20 11 26 32
18b 2 Arrays 39 76.50 76.92 23.08 0.00 0 0 0 9 8 12 10
18g 3 For 43 75.58 76.74 18.60 4.65 1 0 1 8 8 13 12
18a 4 Variables 78 75.21 71.79 25.64 2.56 1 0 1 20 14 18 24
18h 5 While 55 74.85 74.55 25.45 0.00 0 0 0 14 12 17 12
18j 6 The layout and structure of code 91 73.63 75.82 21.98 2.20 2 0 0 20 22 28 19
18f 7 If_Else 46 73.55 69.57 28.26 2.17 1 0 0 13 7 14 11
18m 8 Program Design 87 73.18 71.26 24.14 4.60 4 0 0 21 15 23 24
18c 9 Assignment (For example x = y * 2) 51 72.88 70.59 27.45 1.96 1 0 0 14 10 15 11
18e 10 If 64 72.40 71.88 23.44 4.69 2 0 1 15 13 19 14
18l 11 Problem solving 90 72.04 72.22 24.44 3.33 2 1 0 22 24 20 21
18k 12 The syntax of the programming language 91 71.25 70.33 26.37 3.30 3 0 0 24 20 27 17
18i 13 Sequence (order of components and statements) 87 68.77 66.67 31.03 2.30 2 0 0 27 25 20 13
Total n/a Averages and Totals for all questions 914 73.64 72.56 24.74 2.69 21 1 4 227 189 252 220 0% [0] = Unhelpful 50% [3] = Undecided 100% [6] = Very Helpful
(0 + 1 + 2) *100/rsp = % Unhelpful 3*100/rsp = % Undecided ( 4 + 5 + 6) * 100 /rsp = % Helpful
9.5.7.1 Summary of Findings
EC7: Is Progranimate helpful in all the skills and concepts it aims to support?
On average, Progranimate was seen as helpful in learning all of the programming concepts and
skills that it has been designed to support.
9.5.8 How Does Progranimate Compare Against Existing Learning Recourses,
Development Systems and Help Available to Students?
Question 20 compared Progranimate‟s efficacy as an aid to learning programming against all the
other learning resources available to the students. As the Manchester and Glamorgan groups were
using different programming environments and VLEs and because the teaching styles may differ
between institutions, their responses from each institution are presented separately. In table 9-21 are
the Glamorgan group‟s responses, and in table 9-22 are the Manchester group‟s. The results are
ranked in order of most helpful to least helpful. This is not to say that the resources in last place
were unhelpful, just less helpful than those ranked above it.

The Evaluation of Progranimate by University Students Chapter 9 – University Evaluation
Page 268
The varying respondent statistics for each question were due to some evaluators missing out
questions. The reasons for this are not clear, but as they were small in number, they do not detract
from the overall findings.
Table 9-21. Glamorgan Students Rating the Helpfulness of the Learning Resources Available to Them
Q Rank Question Text : Please rate how helpful you found Progranimate with your learning of these programming aspects:
Rsp Ave %
Helpful
% Undec
% Unhelpful
%
Distribution
0 1 2 3 4 5 6
20d 1 Discussion wih the tutor 62 83.33 83.87 14.52 1.61 1 0 0 9 9 11 32
20e 2 Lectures 62 82.53 82.26 16.13 1.61 0 0 1 10 9 13 29
20h 3 Progranimate 62 75.81 77.42 14.52 8.06 1 2 2 9 13 13 22
20b 4 Lecture notes 62 73.12 66.13 27.42 6.45 2 0 2 17 10 9 22
20a 5 Blackboard online learning material 62 71.51 72.58 19.35 8.06 3 0 2 12 18 8 19
20i 6 BlueJ 62 70.70 64.52 22.58 12.90 4 1 3 14 7 12 21
20g 7
Examples found on the the web (outside of Blackboard)
61 66.39 57.38 32.79 9.84 2 1 3 20 13 8 14
20f 8 Course master and its activities 62 66.13 61.29 19.35 19.35 4 2 6 12 12 8 18
20c 9 Text books 60 56.39 40.00 45.00 15.00 7 0 2 27 11 4 9
20j 10 Jdeveloper 10G 62 52.15 41.94 30.65 27.42 10 5 2 19 12 4 10 0% [0] = Unhelpful 50% [3] = Undecided 100% [6] = Very Helpful
(0 + 1 + 2) *100/rsp = % Unhelpful 3*100/rsp = % Undecided ( 4 + 5 + 6) * 100 /rsp = % Helpful
Table 9-22. Manchester Students Rating the Helpfulness of the Learning Recourses Available to Them
Q Rank Question Text : How helpful were each of these learning / programming aides in your understanding of programming:
Rsp Ave %
Helpful
% Undec
% Unhelpful
%
Distribution
0 1 2 3 4 5 6
20b 1 Lecture notes 33 82.32 96.97 3.03 0.00 0 0 0 1 10 12 10
20h 2 Progranimate 30 80.56 90.00 10.00 0.00 0 0 0 3 7 12 8
20a 3 WebCT online learning material 32 79.69 87.50 9.38 3.13 0 0 1 3 9 8 11
20e 4 Lectures 33 76.26 81.82 12.12 6.06 0 0 2 4 10 7 10
20f 5 Course Master with Notepad or similar text editor
32 70.83 78.13 9.38 12.50 1 1 2 3 9 10 6
20g 7 Examples found on the the web (outside of WebCT)
31 63.98 58.06 35.48 6.45 2 0 0 11 10 2 6
20d 8 Discussion with the tutor 30 63.89 46.67 46.67 6.67 1 1 0 14 2 8 4
20c 9 Text books 32 63.54 46.88 46.88 6.25 0 2 0 15 4 7 4 0% [0] = Unhelpful 50% [3] = Undecided 100% [6] = Very Helpful
(0 + 1 + 2) *100/rsp = % Unhelpful 3*100/rsp = % Undecided ( 4 + 5 + 6) * 100 /rsp = % Helpful
For the Glamorgan group, Progranimate rated as the third most effective learning resource behind
discussions with the tutor and lectures. It is interesting that Progranimate was rated above lecture
notes and the online learning material contained within the Blackboard VLE, both of which are
very comprehensive. Interesting also, is that Progranimate was rated above BlueJ which is a
simplified development environment for novice use. Of no surprise was Oracle‟s JDeveloper 10G
coming in last place; this is a fully featured professional development environment that most
students tried, but eventually dropped in favour of the more simple and less demanding BlueJ.
For the Manchester group, Progranimate was rated the second most effective learning resource
behind lecture notes. This result was very surprising and shows that for the Manchester group the
students believed Progranimate played a significant part in furthering their knowledge and abilities.
Progranimate was ranked above many of the things that one would expect to be most helpful

The Evaluation of Progranimate by University Students Chapter 9 – University Evaluation
Page 269
elements of the course, e.g. discussion with the tutor, lectures and the electronic learning material
contained within the VLE.
The results gained from both institutions show that the students hold Progranimate in high regard
and considered it more helpful than many of the other more traditional learning resources and help
available to them. These results are much more positive than was envisaged and suggest
Progranimate has contributed significantly to improving the students‟ abilities and knowledge.
9.5.8.1 Summary of Findings
EC8: How Does Progranimate Compare against Existing Learning Resources, Development Systems and Help Available to Students
The students held Progranimate in high regard and considered it more helpful than many of the
other more traditional learning resources and help available to them.
9.5.9 Has Progranimate’s Integration with the Introductory Programming Module
Improved Grades?
To discover if at Glamorgan Progranimate‟s integration with the introductory programming module
has been effective, the students‟ grades have been compared with those of the previous five years.
The results of this analysis are shown below in figure 9-1. For brevity within this chapter, the grade
categories are referred to by letter (A to D and F for bonded pass or fail) rather than the traditional
academic marking categories of first, two-one, two-two and third etc.
The results show that for the academic year of 2008/09 (when Progranimate was integrated) that
the pass rate increased significantly, as did the percentage of students getting A and B grades. In line
with this, the percentage of students failing or getting a bonded pass (grade F) has decreased
significantly. Given that over these five years the programming language, and topics covered within
the introductory module have not changed, this indicates Progranimate‟s integration has been very
effective.
Furthermore, as can also be seen in figure 9-1, the academic year of 2007/08 also resulted in some
improvements, particularly in pass rates. In this year Progranimate (though in an evolutionary state)
was used informally with students who were experiencing conceptual difficulties on the module.
Although its use was not widespread, the data below shows a drop in the percentage of D and F

The Evaluation of Progranimate by University Students Chapter 9 – University Evaluation
Page 270
grades but rises in the percentage of A, B and C grades. This indicates that even in this capacity,
Progranimate‟s use was effective.
51.85
61.11
51.85
62.93
83.93
0.00
10.00
20.00
30.00
40.00
50.00
60.00
70.00
80.00
90.00
2004-05 2005-06 2006-07 2007-08 2008-09
% N
um
ber
of
Stu
den
ts
Grade A
Grade B
Grade C
Grade D
Grade F
Pass Rate
Figure 9-1 - Grade Improvements in the Years Progranimate was Used
9.5.9.1 Summary of Findings
EC9: Does the use of Progranimate Improve Grades?
In the years that Progranimate was used and especially when integrated within teaching the
module, the pass rate has risen, as has the number of students getting As and Bs.
9.5.10 Does Progranimate benefit All Abilities or Only one Particular Group?
To achieve this analysis, the students‟ final marks for the introduction to programming module
were obtained. These marks are used in this thesis not to identify the outcomes of any particular
student but to anonymously correlate the utility of Progranimate with the students‟ grades. Only the
marks of students who engaged in at least one assessed activity (i.e. coursework or test) and had not
withdrawn prior to commencement of the module have been included in this analysis. This enables
this analysis to show how Progranimate benefited those who engaged with the module and ensures
those who did not engage do not skew the results. For brevity within this chapter, the grade
categories are referred by letter (A to D and F for bonded pass or fail) rather than the traditional
academic marking categories of first, two-one, two-two and third etc. The overall module marks
for the Glamorgan students and grading criteria in use are presented in table 9-23
Table 9-23. Overall Module Marks for the Introduction to Programming Module

The Evaluation of Progranimate by University Students Chapter 9 – University Evaluation
Page 271
Grade Categories Grades Categories Used
in this Thesis Grade Criteria % of students
1st A Mark >= 70% 32.38
2:1 B Mark >= 60 % 20.95
2:2 C Mark >= 50% 19.05
3rd D Mark >= 40% 16.19
Bonded Pass or Fail F <= 40% 11.43
Figure 9-2 provides a breakdown of the responses to question thirteen (How many times did you use
Progranimate without being asked to do so?) by the different grade groups. Figure 9-3 also shows a
breakdown of the responses to question four (Progranimate was helpful in my studies of Programming) by
grade group. The results of this analysis show that all grade groups were benefiting from
Progranimate, but on average more so the grade C and D students. The results show the grade F
students were not utilising Progranimate as much as their grade C and D counterparts.
Unfortunately for the grade F group a lack of engagement is commensurate with their typical study
habits, however this group was small. Interestingly, the results revealed that many of the A grade
students were using Progranimate to a significant extent, and some more than ten times. It also
transpired that the majority of the A grade students found Progranimate helpful in their studies of
programming.
These results show that Progranimate is of benefit to students of all ability levels, and should not be
considered as a purely remedial aid. Therefore, Progranimate is a useful accompaniment to a
university level, imperatives first, introduction to programming course.
0.00
5.56
0.00 0.00 0.00
41.67
22.22
9.09
16.67
50.00
29.17
55.56
36.36
33.33
16.67
5.56
18.1816.67
12.5011.11
36.36
33.33
0.00
25.00 25.00
0.00
10.00
20.00
30.00
40.00
50.00
60.00
GradeA GradeB GradeC GradeD GradeF
% R
esp
on
ses 0
1 to 3
4 to 6
7 to 10
10 or More
Figure 9-2. Q15 - How Many Times did you use Progranimate without Being Asked? –by Grade Group

The Evaluation of Progranimate by University Students Chapter 9 – University Evaluation
Page 272
0.0
0
0.0
0
0.0
0
0.0
0
0.0
08.0
0
17.6
5
0.0
0
16.6
7
0.0
0
24.0
0
23.5
3
10.0
0
0.0
0
0.0
0
52.0
0
41.1
8 50.0
0
50.0
0
100.0
0
16.0
0
17.6
5
40.0
0
33.3
3
0.0
0
0.00
10.00
20.00
30.00
40.00
50.00
60.00
70.00
80.00
90.00
100.00
A n(25) B n(17) C n(10) D n(6) F n(3)
Grade Groups n = number of respondants
% o
f R
esp
on
den
ts
Strongly Disagree
Disagree
Undecided
Agree
Strongly Agree
Figure 9-3. Q3 Progranimate was useful in my studies of Programming –by Grade Group
9.5.10.1 Summary of Findings
Q10: Does Progranimate benefit All Abilities or Only one Particular Group?
It seems that the weaker students are more inclined to use Progranimate, as would be expected.
Progranimate is of benefit to all abilities and should not be considered as purely a remedial aid.
Those who need the most support are benefiting most from Progranimate.
9.5.11 Does Progranimate Favour the Visual, Balanced or Verbal Learning Styles?
To discover the impact of learning styles on the students‟ preferences towards Progranimate, the
Glamorgan and Manchester students were administered with a subset of the Solomon Felder index
of learning styles (ILSQ) questionnaire (Soloman and Felder, 2002). This was administered at the
beginning of the academic year, so the students‟ responses could not be influenced by their use of
Progranimate or other learning materials. The ILSQ was used to divide the students into three
groups: visual, balanced or verbal based on their scores across the input dimension, as follows:
Visual < 3, Balanced -3 to + 3 and Verbal > 3. A diagram demonstrating this categorisation is shown
in figure 9-4. A description of how these scores are derived can be found in (Felder and Spurlin,
2005).
Figure 9-4. Visual / Verbal / Balanced Learning Styles Classification of the Participants
The results of the learning styles questionnaire are presented below in table 9-24. These results
show that the visual learning style is by far the most prominent, the balanced style second most

The Evaluation of Progranimate by University Students Chapter 9 – University Evaluation
Page 273
prominent and the verbal style least prominent. These distributions are similar to those discussed in
section 3.3.1 which covers the background research into learning styles. The results of this learning
styles questionnaire will be used to answer question eleven of the evaluation criteria: Does
Progranimate favour all visual, balanced and verbal learning styles or one group in particular?
Table 9-24. Learning Style Distributions of the Participants
RSP Visual% Balanced% Verbal%
172 70.02% 22.81% 7.18%
The results of the learning styles analysis are discussed under three headings as follows. General
efficacy looks at the benefit of the tool as a whole. Flowchart Representation looks at the benefit of
Progranimate‟s flowcharting features. Finally, Code Representation looks at the benefit of
Progranimate‟s code generation and presentation features.
9.5.11.1 General Efficacy
The general efficacy of Progranimate was questioned by final questionnaire question four
(Progranimate was useful in my studies of programming) . Figure 9-5 (below) presents the average responses
for both these questions by the visual, balanced and verbal learning styles groups. The results show
that in regard to perceptions of usefulness, there was a negligible difference between the responses
of the visual and verbal groups, both of which were positive. However, the responses of the
balanced group were ten percent lower. In conjecture, it could be suggested that in having the
benefit of visual and verbal capabilities, the balanced learners required Progranimate‟s support less.
Despite this, the results show that all three groups were in agreement. This suggests that as a whole,
Progranimate favours all visual, balanced and verbal learning styles but more the visual and verbal.
74.36
64.42
75.00
0.00
10.00
20.00
30.00
40.00
50.00
60.00
70.00
80.00
90.00
100.00
Q3 - Useful in my Studies
%A
vera
ge R
esp
on
se
Visual n(39)
Balanced n(26)
Verbal n(6)
Figure 9-5. The General Efficacy of Progranimate by Visual, Balanced and Verbal Learning Style Groups

The Evaluation of Progranimate by University Students Chapter 9 – University Evaluation
Page 274
9.5.11.2 Flowchart Representation
The efficacy of Progranimate‟s flowcharting features was also analysed by learning style. For this
process, the responses to questions five to eight were examined and grouped by visual, balanced
and verbal style. The results of this analysis are shown in figure 9-6.
76.92
81.25
71.79
78.85
70.1972.12
68.27
74.0075.00
66.67
54.1758.33
0.00
10.00
20.00
30.00
40.00
50.00
60.00
70.00
80.00
90.00
100.00
Q5 Helped me Visualise
Solutions?
Q6 Good Problem Solving
Aids?
Q7 Usefull when Desining
Your Solutions?
Q8 - Better with colour?
% A
vera
ge R
esp
on
se
Visual n(39)
Balanced n(26)
Verbal n(6)
Figure 9-6. Flowchart Questions Six to Nine by Learning Style
It was expected that in this analysis the differences between the visual and verbal learning styles
would be prominent. As is presented above in figure 9-6, this was the case. This data shows that the
visual learners had the strongest preference for the flowcharts, whilst overall the verbal learners had
a more moderate (but still positive) preference. In particular, the use of colour was particularly
favoured by the visual learners, which resulted in a 20% higher average response compared with the
verbal learners‟ response. An exception to this clear visual preference was in the responses to
question five, in which the visual and verbal learners had almost an equal response. In conjecture, a
reason for this could be, the verbal learners needed more support in visualising solutions, whilst for
the visual learners, it was more in line with their way of processing information. This could explain
the similarity in the visual and verbal responses to this question.
From the results presented above, it can be concluded that although visual learners are more likely
to benefit from flowcharts, the balanced and verbal learners were also benefiting, but on average to
a lesser extent.
9.5.11.3 Code Representation
The efficacy of Progranimate‟s code generation features was also analysed by learning style. For
this, the responses to questions nine, ten and 19b were grouped by the respondents‟ visual,

The Evaluation of Progranimate by University Students Chapter 9 – University Evaluation
Page 275
balanced or verbal learning style. The results of this analysis can be found on the following page in
Figure 9-7.
79.27
73.7276.67
69.23
75.00
83.33 83.33 83.33
76.28
0.00
10.00
20.00
30.00
40.00
50.00
60.00
70.00
80.00
90.00
100.00
19b Improved my Knowledge and
Abilities
Q9Relationship Between Flowchart
and Code Clear?
Q10 Demonstrates Good Code
Structure and Layout?
% A
ve
rag
e R
es
po
ns
e
Visual n(42)
Balanced n(25)
Verbal n(6)
Figure 9-7. Code Generation Questions Q19b, Nine and Ten
It was expected that in this analysis, the verbal learners would produce higher average responses
than the visual and balanced learners. The results above show that these expectations were correct,
and in all three questions the verbal learners provided a higher average response than the visual
ones. However, the difference is not large, 4.0%, 7.05% and 9.61% in order of appearance. Despite
the differences, these results show that the code generation features were on average viewed as
beneficial by all three learning style groups.
9.5.11.4 Summary of Findings
EC11: Does Progranimate Favour the Visual, Balanced or Verbal Learning Styles?
As a whole, Progranimate favours all visual, balanced and verbal learning styles but more so the
visual and verbal.
Progranimate‟s flowchart representation benefits all learning styles but mostly the visual.
Progranimate‟s code representation benefits all learning styles but mostly the verbal.
9.6 Chapter Summary and Conclusions
This chapter evaluated Progranimate‟s efficacy with its original target audience, undergraduate first
year students who were taking their first steps in programming. The study was conducted at two
academic instructions, where Progranimate‟s use was piloted within their Java based imperatives

The Evaluation of Progranimate by University Students Chapter 9 – University Evaluation
Page 276
first introduction to programming courses. Unlike previous evaluations, this study was conducted
over a much longer period and consisted of many more evaluators (242 students with 99
respondents in the final questionnaire). This allowed the efficacy of Progranimate‟s entire feature
set to be investigated as well as the more long term benefits of using Progranimate when learning
programming.
The results of this study have shown that as with the secondary school and college pupils of
previous studies, Progranimate is also appropriate for introducing first year university students to
programming. The results of the questionnaire align with observations made at both the Glamorgan
and Manchester campuses. These results show that Progranimate is simple to use and has a shallow
learning curve. A result of its simplicity is that it allows the novice to focus on the problem solving
aspects of programming and comprehension of the fundamental concepts of imperative
programming, whilst minimising the distractions of the development environment and the
overheads of writing complex precision intense code. Furthermore, this simplicity means the first
tutorial can cover much more than just „hello world‟ and the simple use of variables. Progranimate
facilitates the use of variables, screen output, keyboard input, assignment and calculation within the
first tutorial. This was also achieved in a problem solving context that the students found interesting
and motivating. This number of concepts and the problem solving focus could not be achieved in
the first tutorial using a standard development environment.
Observations showed that the students had developed various strategies for working with
Progranimate. Students would commonly use Progranimate‟s flowcharts to build a rough solution
outline that they would later refine using the code. Students were also using Progranimate to look
up the form of code and as a way to learn the semantics and practical application of key
programming concepts.
The questionnaire aimed to evaluate the students‟ opinions of Progranimate‟s efficacy in helping
them learn programming. The results of the study show that the large majority of students believed
Progranimate was helpful, and more so than many other learning resources available to them. The
results also showed that Progranimate was assisting the students in learning all of the programming
concepts that it facilitates. For this reason, it maybe fruitful to increase the number of concepts
implemented by Progranimate, to include additional control structures and incorporate functional
decomposition.
In assessing the effect of visual, balanced or verbal learning styles on the students‟ preference
towards Progranimate, it transpired that all learning styles were benefiting from Progranimate as a

The Evaluation of Progranimate by University Students Chapter 9 – University Evaluation
Page 277
whole. It transpired that Progranimate‟s flowchart representation also benefits all learning styles,
but slightly more so the visual learners. In line with this, the code representation was also seen as
beneficial by all students, but slightly more so by the verbal learners. From this, it can be concluded
that Progranimate is of benefit to all learning styles and does not disadvantage any visual, balanced
or verbal group.
On average. the weaker students seem to be benefiting from Progranimate the most, which is to be
expected. However, the results of this study showed that Progranimate was an advantage to
students of all levels, including some of the highest achievers. For this reason, Progranimate should
not be thought of as a purely remedial aid, but a useful accompaniment to the standard teaching
practices and one that benefits students of all ability levels.
As a result of this study, Progranimate has continued to be used in the Java based introductory
programming courses at both the Glamorgan and Manchester Umist campuses.

Using Flowcharts, Code and Animation in Novice Programming Chapter 10 – Summary and Conclusions
Page 278
Chapter 10 Summary and Conclusions
Summary and Conclusions
The overall goal of this research was to bring about improvements in the abilities of novice
programmers taking their first steps in programming. The initial focus was on improving the skills
and abilities (and subsequently grades) of our universities undergraduates. However, it became
apparent that Progranimate was also suited to secondary school pupils who were subsequently
incorporated into this research. It also attracted interest from the University of Manchester (UMIST
campus) which collaborated in the evaluation activities.
The main research question asked by this thesis was: can side by side user constructed structured
flowchart and code program representations and animated execution of them bring about
improvements in the general comprehension and problem solving skills of novice programmers
taking their first steps in an imperatives first introduction to programming?
To address this question this thesis has put forward Progranimate, a unique simplified development
environment to assist novices in learning programming via the imperatives first approach to
instruction. The core aim of its development was to allow the novice to focus on gaining an
accurate mental model and conceptual understanding of the underlying concepts of programming
and execution, whilst developing stronger problem solving skills. This has been achieved by utilising
interactivity, dynamic structured and coloured flowcharts, generated code in a range of possible
languages, and animated execution of both the visual and textual program representations.
Progranimate is coupled to a website where it may be readily accessed free of change. Its Java Web
Start deployment methodology also means installation is not required. This has enabled
Progranimate to be accessed in and out of the classroom and any institution with the minimum of
fuss.
In Progranimate the user can construct a wide range of programs involving variables, arrays, data
types, assignment, Boolean logic, decisions and loops. An applied knowledge of these concepts
offers a transferable skill set pertinent to any programming language or paradigm. Progranimate‟s
auto-structured flowchart based programming features allow novices to focus their attentions on
problem solving, conceptual understanding and the underlying abstractions of programming, rather
than wrestling with the programming language and learning the development environment. The use
of coloured flowchart notation allows the novices to clearly distinguish between the various

Using Flowcharts, Code and Animation in Novice Programming Chapter 10 – Summary and Conclusions
Page 279
notational features; therefore loops and decisions, input and output cannot easily be confused as
they may with black and white notation. Its visual execution of flowcharts and code provide the
novice with a mental model of the flow of execution and code tracing. This also serves to
demonstrate the precise semantics of the individual programming concepts, thereby minimising the
potential for misconception. Progranimate‟s code generation features give students support in the
learning of a programming language, but not at the expense of developing a more well-rounded skill
set. This is achieved by the side by side presentation of flowcharts and code, and the synchronised
highlighting of them. This makes underlying the meaning of the code more apparent. This provides
a significant advantage over flowchart only, or code only development environments, or those
visual systems where the generated code is un-dynamic, not executable and entirely separate from
the flowchart visualisation. Because Progranimate supports code generation in a variety of
languages, and, within those languages a range of different syntaxes (i.e. various ways of printing
and reading in Java and VB), its potential audience is maximised. Because Progranimate does not
rely on syntactic knowledge, the first programming tutorial can cover much more than „hello world‟.
With Progranimate a novice‟s first hour of programming tuition can involve problem solving, using
variables, output (Print), input (Read), and calculations (assignment) which gets the novice off to a
much more motivating start in the subject.
This thesis also put forward a scaffolding pedagogy designed to assist novice programmers in the
development of problem solving skill. The pedagogy is underpinned by the theories of scaffolding
support and the zone of proximal development. This pedagogy has been coupled with a range of
contextual, fun, and gender neutral programming activities designed for use with Progranimate.
To measure the overall success of this research, five objectives and four key aims were specified in
the introductory chapter. In sections 10.1 and 10.2 that follow, these objectives and aims are aligned
with the actual outcomes of this research and demonstrate that the aims and objectives were
successfully addressed. Section 10.3 clarifies the contributions to the field of novice programming
that this research has brought about. Section 10.4 states the ongoing and future directions of this
research. Finally section 10.5 concludes with the final remarks.
10.1 How the Objectives Were Met
The headed paragraphs below demonstrate how the objectives defined in the introduction were met
by this research.

Using Flowcharts, Code and Animation in Novice Programming Chapter 10 – Summary and Conclusions
Page 280
1. To research the precise nature of the difficulties and skill deficiencies novices have
when learning programming.
To discover how best to help novice programmers this research began by investigating the precise
nature of the difficulties that novice programmers face in learning programming. The findings of
this process were discussed in chapter 2 of this thesis. In particular, a lack of problem solving skill is
highlighted as prominent weakness of novice programmers. The background research showed that
effective problem solving is the culmination of several prerequisite skills. Because novices can and
commonly do have various problems in their mastery of any one of these pre-requisite skills, the
inevitable result is poor problem solving ability. This problem is exacerbated by the use of
professional development environments and languages never intended for teaching. Consequently,
a novice will spend a disproportionate amount of time wrestling with the grammar rules of the
language and the complexity of the programming environment, leaving other skills underdeveloped.
Therefore, this thesis acknowledges the need to develop a more balanced skill set within
introductory programming.
2. To research the potential of visualisation and how the use of dynamic structured
flowcharts may be effective in aiding the conceptual understanding and problem solving
skills of novice programmers.
To discover the potential of visualisation, chapter 3 looked at mental models, learning styles and
visualisation. It demonstrated the potential that dynamic interactive and structured flowcharts have
in helping novices develop conceptual knowledge and problem solving skill. This research laid the
foundations upon which Progranimate‟s flowchart visualisation was devised.
3. Critically review past and current flowchart based visualisation systems and
environments aimed at novice programmers and improve on the state of the art.
Chapter 3 also critically reviewed past and current flowchart visualisation systems aimed at novice
programmers. This showed that the features and supportive capabilities of Progranimate greatly
surpassed that of any system constructed before and during this research.
4. Using a blend of action research and formal research methodologies, develop,
evaluate and refine a structured flowchart and code based visualisation aid and associated
pedagogy that assists novices in learning programming and its associated skills.
From the findings of the formal research methods as documented in chapters 2 and 3, an initial

Using Flowcharts, Code and Animation in Novice Programming Chapter 10 – Summary and Conclusions
Page 281
prototype was specified and created. Using a blend of action and formal research paradigms
(described in chapter 6), Progranimate was refined though various successive versions and
subsequent evaluations to what is version 3.5 of Progranimate (the most current at the time of
writing). Coupled to Progranimate is a scaffolding pedagogy and associated problem solving
activities which were also developed as part of this process. Like Progranimate, these can be readily
and freely accessed via Progranimate‟s accompanying website.
5. To evaluate the use of the visualisation aid and pedagogy with high school and
university level novice programmers.
The continual user focused development process has resulted in a visual programming
environment, a scaffolding pedagogy and associated problem solving activities with a high degree of
usability and supportive capability, as is documented in the various evaluation studies of chapters 8
and 9. In total, Progranimate has been successfully evaluated in eight studies, and the pedagogy
four. The evaluations covered a wide range of potential end users as shown in table 10-1. With all
studies combined, Progranimate has been evaluated by 383 users, which is a particular strength of
this thesis.
Table 10-1. Study Participants
Study Participants Students
1 Mixed year university students aged 18+ 6
2 School pupils ages 16 to17 12
3 College students ages 16 to 17 32
4 8 School and college teachers 8
5 School pupils aged 15 to 17 32
6 School pupils aged 13 to 15 41
7 Secondary school teachers 10
8 First year university students aged 18+ 242
Total 383
10.2 How the Aims Were Met
The headed paragraphs below demonstrate how the four key aims defined in the introduction were
met by this research.
1. To help novices overcome their problem solving and related skill deficiencies and
comprehension problems in learning programming
The university evaluation studies have shown that the side by side presentation of coloured
structured flowcharts, program code and animated execution helps novices overcome their

Using Flowcharts, Code and Animation in Novice Programming Chapter 10 – Summary and Conclusions
Page 282
conceptual difficulties, knowledge of run time processes and syntax. It was expected that
Progranimate would be of benefit to the weaker students, as was found to be the case. However,
rather surprisingly it seems that some of the most able students were also taking advantage of
Progranimate, particularly in regards to code generation. The results also showed that Progranimate
was to a varying extent assisting the students in learning all of the programming concepts that it
facilitates. It also transpired that a student‟s visual, balanced or verbal learning style does have some
positive effect on their preference towards either the flowchart (visual) or code (verbal)
representations. However, as Progranimate supports both a visual and verbal representation of
programs, overall it favours both learning styles.
The schools and college evaluation studies have shown that Progranimate coupled with the
scaffolding pedagogy allows the complete novice to quickly focus on problem solving and in doing
so brings about very noticeable improvements in problem solving skill.
Table 10-2 shows how Progranimate‟s supportive features and pedagogy have addressed the
difficulties novices have in mastering problem solving and its various pre-requisite skills.
Table 10-2. How Progranimate and the Pedagogy Assist the Development of Problem Solving Skills
Problem Solving Skills Features of Progranimate
Comprehension of the constructs, their semantics and general roles. Flowcharts and Animation.
Knowledge of how the constructs can be put together to solve problems. Flowcharts and engagement with Progranimate and the pedagogy
Knowledge of how the constructs are represented in the language used. Code Generation
The ability to read and comprehend code in order to predict its flow and outcome.
Code Generation, Flowcharts, Synchronised Highlighting and Animation.
The use of a development environment. Progranimate removes the impact of the development environment allowing the user to concentrate on programming.
An understanding of the error messages generated by the programming system.
Simplified Error Messages.
The ability to identify logic and semantic errors. Animation and engagement with Progranimate and the pedagogy
The ability to solve logic and semantic errors. Animation and engagement with Progranimate and the pedagogy
2. By improving student ability, increase the pass rates and grades of students studying
introductory programming at Glamorgan
The evaluation data obtained from the University of Glamorgan (presented in chapter 9) shows that
in the years Progranimate was integrated with teaching, over all there have been marked
improvements in the pass rates, and grades of students studying the degree level introduction to
programming module. It has been effective for students of all abilities, but particularly those having
difficulties with programming and needing extra support.

Using Flowcharts, Code and Animation in Novice Programming Chapter 10 – Summary and Conclusions
Page 283
3. To provide an effective and motivating way to introduce programming to secondary
school pupils.
The data obtained from the secondary school evaluations of chapter 8 has shown that
Progranimate, its scaffolding pedagogy and associated programming problems are a effective and
motivating tools for introducing programming to secondary school pupils from years 9 (age 13)
right up to A-Level (ages 16 to 17).
4. To make teaching programming in secondary schools a more appealing option for
teachers and thus less likely avoided.
The secondary school teachers surveyed believed that Progranimate coupled with the pedagogy and
programming problems would make teaching programming easier and more convenient for them.
They also considered Progranimate, the pedagogy and programming problems as an effective and
motivating way to teach programming to a wide age range of pupils. From this it can be concluded
that Progranimate coupled with its pedagogy and associated programming problems was successful
in making programming a more appealing option for teachers.
10.3 Contributions of this Research
This research work resulted in four contributions to novice programming which include:
1. A unique, freely accessible, online, visual, dynamic, interactive, flowchart and generated
code based programming environment that surpasses the capabilities of current flowchart
based aids for novices.
2. A scaffolding pedagogy that has been shown to focus on and enhance problem solving skill.
3. Coupled to the pedagogy, a set of 28 fun, gender-neutral problem solving tasks, online and
freely available to anyone with an internet connection.
4. Extensive evaluations conducted with a wide age range to show that Progranimate, its
pedagogy and online problem solving tasks have been effective in increasing comprehension
and the development of problem solving and associated skills.

Using Flowcharts, Code and Animation in Novice Programming Chapter 10 – Summary and Conclusions
Page 284
10.4 Current and Future Work
Progranimate continues to be used in the Glamorgan and Manchester UMIST campuses within the
introductory programming modules, especially within the first semester. It also is used extensively
in Glamorgan‟s schools outreach activities to promote the study of programming at HE level. The
pupils‟ and students‟ feedback is still being used to influence the continual enhancement of
Progranimate, its associated learning materials and website.
As a direct result of the work conducted for this research project, the University of Glamorgan
secured funding and equipment worth $100,000 USD from Hewlett Packard under their 2009
Innovation in Education Grant Initiative (Hewlett Packard, 2009). A key feature of this grant was
the supplement of 22 HP convertible tablet PCs and $10,000 to be used in Progranimate‟s
development, evaluation, educational and outreach activities.
Currently, the tablets PCs are being used with Progranimate in offering informal remedial catch-up
classes to help address the failure and dropout rates in our university‟s degree and HND level
introductory programming courses. In the near future, the tablets will also be used with
Progranimate in providing further programming workshops to secondary school pupils and their
teachers, with the aim of stimulating interest in the study of programming at HE level. Also planned
are training sessions for local high school teachers in programming, best practices for teaching
programming, and the use of Progranimate. This work aims to address the under-representation of
programming in the high school and may be conducted in cooperation with the computing at
school initiative (Computing at School, 2010) which recently expressed an interest in Progranimate.
The tablets will also be used in Progranimate‟s development and evaluation activities, especially in
regards to utilising touch screen and stylus technology.
The success of Progranimate both at university and secondary school levels has shown that the
continued work on the Progranimate environment is worthwhile. During this research, several ideas
surfaced which may prove to be useful additions to Progranimate‟s feature set.
Future improvements will be undertaken to increase the number of programming concepts
implemented by Progranimate. In the short term, the number of control structures implemented
will be increased to incorporate Until and Do While loops. Also planned is the Case
selection structure which is a notoriously intricate structure, prone to syntax error and
misconception. A simplified 2D graphics library and canvas has been suggested. This would allow
Progranimate to be used in the construction of simple computer based art and possibly games,

Using Flowcharts, Code and Animation in Novice Programming Chapter 10 – Summary and Conclusions
Page 285
which could be a particularly motivating context for programming, especially with a younger
audience. Recent teaching experience at Glamorgan has also shown that the syntax and semantics
of Java methods are a significant problem for novices. The viability of incorporating functional
decomposition and multiple classes will be considered. It is expected that this will be a significant
undertaking which may require significant planning and restructuring of Progranimate‟s underlying
implementation.
Currently, Progranimate‟s website boasts 28 individual pedagogic programming problems spread
over eight activity packs, covering sequence, selection, iteration and arrays. Now that the activity
packs and their associated pedagogy have been demonstrated as effective, the number of problems
hosted on the site will increase. Mechanisms for the submission and sharing of programming
problems by tutors are also a possibility, and may be incorporated within future ideas for
Progranimate‟s website.
As discussed in chapter 4, Progranimate‟s web integration features make it ideal as the centrepiece
to an online tutorial covering the imperatives of programming. This may prove to be a significant
area of future research which could incorporate web 2.0 technologies, interactive learning materials
and problem solving tasks. An online tutorial utilising web 2.0 technologies could incorporate
agents to monitor the users‟ abilities, this would allow novices to take alternate paths through the
lessons with individualised teaching plans based on ability. Such a system would offer a great deal of
support for novice programmers and also for secondary school teachers, for whom knowledge and
confidence in the subject is a barrier to the introduction of programming.
10.5 Final Remarks
The evaluation results of this thesis have shown Progranimate, its pedagogy and online activities to
be very effective in supporting the novice programmer in their study of programming, development
of conceptual understanding, and problem solving skill.

Using Flowcharts, Code and Animation in Novice Programming References
Page 286
REFERENCES
ADOBE SYSTEMS INC (2009),Adobe Flash CS4 Professional, San Jose - CA - USA, [Accessed24/09/2009]
http://www.adobe.com/products/flash/.
AHMADZADEH, M., ELLIMAN, D. & HIGGINS, C.,(2005),An Analysis of Patterns of Debugging Among Novice
Computer Science Students, ACM SIGCSE Bulletin, 37,3,ACM,New York - NY - USA,84-88.
ARAI, M. & YAMAZAKI, T.,(2006),Design of a Learning Support System to Aid Novice Programmers in Obtaining
the Capability of Tracing,6th International Conference on Advanced Learning Technologies, Washington D.C. - USA, IEE
Computer Society, pp 396-398.
AREIAS, C. & MENDES, A.,(2007),A Tool to Help Students Develop Programming Skills, International Conference on
Computer Systems and Technologies, Ruse - Bulgaria, ACM, 1-7.
ASSOCIATION FOR COMPUTING MACHINERY (2008),The ACM Portal, Association for Computing Machinery,
New York - NY - USA,Access,Date,portal.acm.org.
ATANASOVA, G. & HRISTOVA, P.,(2003),Flow Chart Interpreter: An Environment for Software Animation
Representation, International Conference On Computer Systems and Technologies, Ruse - Bulgaria, ACM, pp 453-458.
BALDWIN, L. & KULJIS, J.,(2000),Visualisation Techniques for Learning and Teaching Programming, Journal of
Computing and Information Technology, Volume 8,4,University of Zagreb - Computing Centre, Zagreb - Croatia, pp 285-291.
BARNES, D. & KÖLLING, M. (2008),Objects First With Java - A Practical Introduction Using Blue-J - 4th Ed, Prentice Hall
/ Pearson Education, Upper Saddle River - NJ - USA, ISBN: 10: 0-13-606086-2.
BAYMEN, P. & MAYER, R.,(1983),A diagnosis of beginning programmers' misconceptions of BASIC programming
statements, Communications of the ACM, 26, 9, ACM, New York - NY - USA, pp 667-670.
BEACKER, R.,(1981),Sorting Out Sorting (Presented at ACM SIGGRAPH 83),IN Secondary, BEACKER, R.,(Ed.
Sorting Out Sorting, Morgan Kaufman, USA.
BECKER, K.,(2002),Back to Pascal But Not Backwards, Journal for Computing Sciences in Colleges, 18,2,Consotium for
Computing in Colleges, Chicago - IL - USA, pp 17-28.
BEN-ARI, M.,(1996),Structured Exits Not Loops, ACM SIGCSE Bulletin, 29,3, ACM, New York - NY - USA,5 pp 1-
59.
BEN-ARI, M.,(2002),From Theory to Experiment to Practice in CS Education -Keynote Speech,2ns Annual
Finish/Baltic Sea Conference on Computer Science, Koli Finland, University of Joensuu, pp 4-8.
BEN-BASSAT LEVY, R., BEN-ARI, M. & PEKKA, U.,(2001),An Extended Experiment With Jelliot 2000,in
Proceedings of the First International Program Visualization Workshop, Porvoo - Finland, University of Joensuu, pp131-140.
BENNEDSEN, J. & CASPERSEN, M.,(2007),Failure Rates in Introductory Programming, ACM SIGCSE Bulletin,
39,1, ACM, Ney York - NY - USA, pp32-44.
BERA (2004),Revised Ethical Guidelines for Educational Research, British Educational Research Association
(BERA),Macclesfield - UK, [Accessed 29/08/2010] http://www.bera.ac.uk/files/guidelines/ethica1.pdf.
BIDDLE, R. & TEMPERO, E.,(1998),Java Pitfalls for Beginners, ACM SIGCSE Bulletin, 30,3, ACM, New York - NY -
USA, pp 48-53.
BISHOP, J. (2000),Java Gently 3rd Edition, Addison Wesley, New York - NY - USA, ISBN 0201710501.

Using Flowcharts, Code and Animation in Novice Programming References
Page 287
BISSON, C. & LUCKNER, J.,(1996),Fun in Learning: The Pedagogical Role of Fun in Adventure Education.
Perspectives, Journal of Experimental Education, 19,2, Association for Experimental Education, Boulder - CO - USA, pp
108-120.
BLACKBOARD INC (2009),The Blackboard Virtual Learning Environment, Blackboard Inc, Washington D.C - USA,
[Accessed 31/11/2009] http://www.blackboard.com/.
BLACKWELL, A. & GREEN, T.,(1999),Does Metaphor Increase Visual Language Usability?, ,IEEE Symposium on
Visual Languages, IEEE Computer Society, Tokyo - Japan, pp 246-253
BOHM, C. & JACOPINI, G.,(1966),Flow Diagrams - Turing Machines and Languages with only two Formation Rules,
Communications of the ACM, 9,5,ACM,New York - NY - USA, pp 366-371.
BONAR, J. & SOLLOWAY, E.,(1983),Uncovering Principles of Novice Programming,10th ACM SIGACE SIGPLAN
Symposium on Principles of Programming Languages, Austin - TX - USA, pp 10-13.
BORG, W. & GALL, M.,(1989a),Advantages and Disadvantages of the Interview, IN Educational Research, Longman,
White Plains - NY - USA, ISBN 08013-03346, pp446-448
BORG, W. & GALL, M.,(1989b), Experimental Designs: One-Group Pretest-Posttest Design, IN Educational Research,
Longman, White Plains - NY - USA, ISBN: 08013-03346, pp670-673
BORG, W. & GALL, M.,(1989c),Response Effect, IN Educational Research, Longman, White Plains - NY - USA, ISBN
08013-03346, pp 448-450.
BÖSZÖRMÉNYI, L.,(1998),Why Java is Not My Favourite First Course Language, Software Concepts and Tools,
19,3,Springer,Berlin - Germany, pp 141-146.
BRENNER, N.,(2005),Visual Basic.NET - One Teachers Experience, Journal of Computing Sciences in Colleges,
21,2,Consortium for Computing Sciences in Colleges, Washington DC - USA, pp 89-95.
BRITISH STANDARDS INSTITUTE,(1987),BS 4058:19875: Specification For Data Processing Flowchart Symbols
Rules and Conventions. British Standards Institute, London - UK..
BROWN, M. & SEDGEWICK, R.,(1984),A System for Algorithm Animation, 11th Annual Conference on Computer
Graphics and Interactive Techniques (SIGGRAPH 84), Minneapolis, MN - USA, ACM, pp 177-187.
BRUCE C & MCMAHON C,(2002),Contemporary Developments in Teaching and Learning Introductory
Programming: Towards a Research Proposal, Queensland University of Technology, Queensland AUS, [Accessed
29/09/2009] http://eprints.qut.edu.au/3232/1/3232.pdf
BRUICE, K., DANYLUK, A. & MURTAGH, T.,(2001),A Library to Support Graphics Based Object First Approach
in CS1,ACM SIGCSE Bulletin, 33,1, ACM, New York - NY - USA, pp 6-11.
CALLONI, B.,(1992),An Iconic Syntax Directed Windows Environment for Teaching Procedural Programming,
Masters Thesis, Department of Computer Science, Texas Tech University, Lubbock - TX - US.
CALLONI, B. & BAGERT, D.,(1994),Iconic Programming vs Textual Programming: Which is a better Learning
Environment? ,Proceedings of the 25th SIGCSE Technical Symposium on Computer Science Education, Phoenix - AZ - USA,
ACM, pp 188-192.
CALLONI, B. & BAGERT, D.,(1999),Teaching Programming Concepts Using an Icon-Based Software Design Tool,
IEEE Transactions on Education, 42,4,IEEE,Washington D.C. - USA, pp 14-21.
CARLISLE, M., WILSON, T., HUMPHRIES, J. & HADFIELD, S.,(2004),RAPTOR: Introducing Programming To
Non-Majors With Flowcharts, Journal of Computing Sciences in Colleges, 19,4,Consortium for Computing Sciences in
Colleges, Washington DC - USA, pp 52-61.

Using Flowcharts, Code and Animation in Novice Programming References
Page 288
CARLISLE, M., WILSON, T., HUMPHRIES, J. & HADFIELD, S.,(2005),RAPTOR: A Visual Programming
Environment for Teaching Algorithmic Problem Solving, ACM SIGCSE Bulletin, 37,1, ACM, New York - NY - USA,
pp 176-180.
CARTER, J. & JENKINS, T.,(1999),Gender and Programming: What's Going On?, ACM SIGCSE Bulletin, 31,3, ACM,
New York - NY - USA, pp 1-4.
CARTER. J,(2001),What they think - Students Preconceptions of Computing .International Conference on Engineering
Education,, Oslo - Norway, World Scientific and Engineering Academy and Society (WSEAS), pp 4-9.
CARTWRIGHT, R. (2008),Dr Java, Rice University, Houston - TX - USA, [Accessed 28/11/2008] www.drJava.org.
CHALK, B. & FRASER, K.,(2006),A Survey on the Teaching of Introductory Programming in Higher Education,
Proceedings of the 11th Java in the Internet Curriculum Conference, London - UK, The Higher Education Academy,
CHALK. P, PICKARD. P, BOYLE. T, BRADLEY. C, JONES. R & K., F.,(2003),Improving Pass Rates in
Introductory Programming, Fourth Annual LTSN ICS Conference, Galway - Ireland, Information and Computer Sciences
Higher Education Academy, pp 7-10.
CHEN, S. & MORRIS, S.,(2005),Iconic Programming For Flowcharts, Java, Turing, ETC, Conference on Innovation and
Teaching Computer Science Education (ITiCSE), Caparica - Portugal, ACM, pp 104-107.
CHEN, Z. & MARX, D.,(2005),Experiences with Eclipse IDE in Programming Courses, Journal for Computing Sciences in
Colleges, 21,2,Consortium for Computing Sciences on Colleges, Chicago - IL - USA, pp 104-113.
CHENGLIE, H.,(2004),Rethinking Objects First, Education and Information Technologies, 9,3,Kluwer Academic Publishers
/ Springer, Netherlands, pp 209-219.
CHPC,(2006),Investigation into the decline in BSc Computing/IT Applications to British Universities, Council of
Professors and Heads of Computing (CPHC), [Accessed 01/06/2009] http://www.cphc.ac.uk/docs/cphc-admissions-
trends-report.pdf.
CLARK, D., MCNISH, C. & ROYLE, G.,(1998),Java as a Teaching Language - Opportunities Pitfalls and Solutions,3rd
Australasian Conference on Computer Science Education, ACM, Queensland - Australia, pp 173-178.
CLARKE, A.,(1999), Experimental Design, IN Evaluation Research, Sage Publications, London - UK, ISBN 0-7619-5094,
pp 42-44.
COHEN, L., MANION, L. & MORRISON, K.,(2007a),Chapter 14 - Action Research, IN Research Methods in Education
6th Edition, Routlege, New York - NY - USA, ISBN: 0-415-36878-2, pp 298-313.
COHEN, L., MANION, L. & MORRISON, K.,(2007b),Chapter 15 - Questionnaires, IN Research Methods in Education
6th Edition, Routlege, New York - NY - USA, ISBN: 0-415-36878-2, pp 317-348.
COHEN, L., MANION, L. & MORRISON, K.,(2007c),Chapter 16 - Interviews, IN Research Methods in Education 6th
Edition, Routlege, New York - NY - USA, ISBN: 0-415-36878-2, pp 349-383.
COHEN, L., MANION, L. & MORRISON, K.,(2007d),Chapter 18 - Observation, IN Research Methods in Education 6th
Edition, Routlege, New York - NY - USA, ISBN: 0-415-36878-2, pp 396-413.
COHEN, L., MANION, L. & MORRISON, K.,(2007e),A Pre-Experimental Design: The one group pretest-post-test,
IN Research Methods in Education 6th Edition, Routlege, New York - NY - USA, ISBN: 0-415-36878-2, pp 282-383.
COMPUTING AT SCHOOL (2010),Computing at Schools - Education - Engage - Encourage, Computing at School,
Cambridge - UK, [Accessed 02/03/2010] http://www.computingatschool.org.uk..
CONNOLY, C., MURPHY, E. & MOOR, S.,(2008),Programming Anxiety Amongst Computing Students - A Key in
the Retention Debate, Accepted for future publication in IEEE Transactions on Education, IEEE, Washington DC - USA, pp
52-56.

Using Flowcharts, Code and Animation in Novice Programming References
Page 289
COOPER, S., DANN, W. & PAUSH, R.,(2003),Teaching Objects First Introductory Computer Science, In Proceedings
of the 34th SIGCSE Technical Symposium on Computer Science Education (SIGCSE'03), New York - NY - USA, ACM Press,
pp 191-195.
CREWS, T.,(2001),Using a Flowchart Simulator in a Introductory Programming Course, Western Kentucky University,
Bowling Green - KY - USA, [Accessed 29/08/2009] http://www.cstc.org/data/resources/213/Visual.pdf.
CREWS, T. (2009),Visual Logic, PGS Systems, Bowling, Green - KY - USA, [Accessed 29/08/2009
,http://www.visuallogic.org/.
CREWS, T. & MURPHY, C. (2004),Programming Right From Start With VisualBasic., Prentice Hall, Upper Saddle River -
NJ - USA, ISBN 0131085797.
DA SILVA, L., MARCELINO, M. & MENDES, A.,(2007),The Impact of Learning Styles in Introductory
Programming Learning, International Conference on Engineering Education, Coimbra - Portugal ,International Network for
Engineering Education and Research,[Accessed 31/10/2009] http://icee2007.dei.uc.pt/proceedings/papers/432.pdf.
DANIELS, H.,(Ed.) (1996),An Introduction to Vygotsky, Routledge, London - UK, ISBN 0-415-12865-X.
DEDASYS LLC (2008), LangPop - Programming Language Popularity, DedaSys LLC, Oregon - USA, ,[Accessed
29/11/2008] www.langpop.com.
DEITEL AND DEITEL (2009), The Deitel and Deitel 'How to Program' Range of Programming Books, Prentice
Hall,Upper Saddle River - NJ - USA, [Accesed 29/10/2009],http://www.prenhall.com/deitel/.
DEPASQUALE, P., LEE, J. & PÉREZ-QUIÑONES , M.,(2004),Evaluation of Subsetting Programming Language
Elements in a Novice's Programming Environment, ACM SIGCSE Bulletin, 36,1, ACM, New York - NY - USA, pp
260-265.
DILLMAN, D., SMYTH, J., CHRISTIAN, L. & STERN, M.,(2003),Multiple Answer Questions in self administered
surveys - the use of check-all-that-apply and force-choiced question formats, American Statistical Association Conference, San
Francisco - CA - USA, American Statistical Association.
DINGLE, A. & ZANDER, C.,(2001),Assessing the Ripple Effect of CS1 Language Choice, Journal for Computing Sciences
in Colleges, 16,2,Consotium for Computing Sciences in Colleges, Chicago - IL, pp 95-104.
DOMAGALA, M. (2006),DevFlowcharter,SourseForge.NET, [Accessed 29/11/2009]
http://sourceforge.net/projects/devflowcharter/.
DU BOULAY, B.,(1988),Some Difficulties of Learning to Program, IN SOLLOWAY, E. & SPOHRER,
J.(Eds.),Studying the Novice Programmer, Lawrence Erlbaum Associates, Hillsdale - NJ - USA,0-8058-0002-6.
DUNN, R. & DUNN, K. (1993),Teaching Secondary Students Though Their Individual Learning Styles, Allyn and Bacon,
Heedham Heights - MA - USA, ISBN: 10-0205133088.
DUNNICAN, E.,(2002),Making the analogy: Alternative delivery techniques for first year programming, Proceedings from
the 14th Workshop on the Psychology of Programming Interest Group ,PPIG, Uxbridge - UK, pp 89-99.
EBRAHIMI, A.,(1994),Novice Programmer Errors: Language Constructs and Plan Composition, International Journal of
Human Computer Studies, 41,4,Academic Press, Duluth - MN - USA, pp 457-481.
FATESOFT (2009),Code Visual to Flowchart, FateSoft, Eden Prairie - NM - USA, [Accessed 29/10/2009]
http://www.fatesoft.com/s2f/.
FELDER, R.,(1993),Reaching the Second Tier: Learning and Teaching Styles in College Science Education, Journal of
College Science Teaching, 23,3, Taylor Francis, London - UK, pp 286-290.
FELDER, R. & SILVERMAN, L.,(1988),Learning and Teaching Styles in Engineering Education, Engineering Education,
78,7, pp 674-681.

Using Flowcharts, Code and Animation in Novice Programming References
Page 290
FELDER, R. & SILVERMAN, L.,(2002),Learning and Teaching Styles in Engineering Education (Revised with Preface
in 2002), North Carolina State University, NC - USA, [Accessed 26/09/2008]
www4.ncsu.edu/unity/lockers/users/f/felder/public/Papers/LS-1988.pdf.
FELDER, R. & SPURLIN, J.,(2005),Applications Reliability and Validity of the Index of Learning Styles, Engineering
Education, 21,1,Tempus Publications, London - UK, pp103-112.
FITZGERALD, S., LEWANDOWSKI, G., MCCAULEY, R., MURPHY, L., SIMON, B., LYNDA, T. & ZANDER,
C.,(2008),Debugging : Finding, Fixing and Flailing - A Multi Institutional Study of Novice Debuggers, Computer Science
Education, 18,2,Taylor - Francis, London - UK, pp 63-84.
FLANAGAN, M. (2007),KeyboardInput Class: Input From the Keyboard, University College London, London - UK,
[Access 2/12/2008],http://www.ee.ucl.ac.uk/~mflanaga/java/KeyboardInput.html.
FLOWERS, T., CARVER, C. & JACKSON, J.,(2004),Empowering Students and Building Confidence in Novice
Programmers Through Gauntlet,34th ASEE / IEEE Frontiers in Education Conference, Savannah -GA- USA, IEEE, pp: 3-
13.
FREUD, S. & ROBERTS, E.,(1996),Thetis: an ANSI C Programming Environment Design for Introductory Use,ACM
SIGCSE Bulletin, 28,1, ACM, New York - NY - USA, pp 300-305.
GARNER, S., HADEN, P. & ROBINS, A.,(2005),My Program is Correct But It Doesn't Run, Proceedings of the 7th
Australasian Computing Education Conference,, Newcastle - NSW - Australia, Australasian Computing Society, pp173-180.
GENTNER, D.,(2002),Mental Models Psychology of, IN SMELSER, N. & BATES, P.(Eds.),International Encyclopaedia of
the Social Behavioural Sciences, Elsevier Science, Oxford - UK, pp 9683-9687.
GLEZOU, K. & GRIDORIADOU, M.,(2007),A Novel Didactical Approach Of The Decision Structure for Novice
Programmers, EuroLogo 2007, Bratislava - Slovak Republic, Comenious University, [Accessed 02/04/2009]
http://www.di.unito.it/~barbara/MicRobot/AttiEuroLogo2007/proceedings/P-Glezou.pdf.
GOLDBERG, M.,(1997),WebCT and First Year: Student Reaction to and Use of a Web-Based Resource in First Year
Computer Science, ACM SICGCE Bulletin, 29,3,ACM,New York - NY - USA, pp 127-129.
GOLDSTEIN, G.,(1997),Information technology in English Schools: A Commentary on Inspection Findings 1995-
1996,.NCET/OFSTED, London - UK.
GOMES, A., SANTOS, A., CARMO, L. & MENDES, A.,(2007),Learning Styles in an E-Learning Tool, Conference on
Engineering Education,, Coimbra - Portugal, International Network for Engineering Education and Research, [Accessed
02/02/2010] http://www.ineer.org/Events/ICEE2007/papers/410.pdf.
GOOGLE INC (2009),Google Analytics, Google Inc, Mountain View - CA - USA, [Accessed 06/05/2010]
http://www.google.com/analytics/.
GOOGLE INC. (2008),The Google Search Engine, Mountain View - CA - USA, [Accessed 06/05/3020]
www.google.com.
GOSLING, J. & HARRISON, J.,(2002),Bubble Sort Animation, Sorting Algorithms, Algorithm Animation, The
University of British Columbia, [Accessed 11/02/2009] http://www.cs.ubc.ca/~harrison/Java/sorting-demo.html.
GREYLING, J., CILLERS, C. & CALITZ, A.,(2006),B# The Development and Assessment of an Iconic Programming
Tool for Novice Programmers,7th International Conference on Information Technology Based Higher Education and Training,
Ultimo - NSW - Australia, IEEE, pp 376-375.
GRISSOM, S., MCNALLY, M. & NAPS, T.,(2003),Algorithm Visualisation in CS Education: Comparing Levels of
Student Engagement,, ACM Symposium on Software Visualisation, New York - NY - USA, ACM Press, pp 97-94.
HAGAN, D. & MARKHAM, S.,(2000),Does it help to have some programming experience before beginning a
computing degree program, Fifth Annual SGCSE / SIGCUE ITiCSE, Conference on the Innovation and Technology in

Using Flowcharts, Code and Animation in Novice Programming References
Page 291
Computer Science Education,, Helsinki - Finland, ACM, pp25-28.
HALL, M.,(2007),Back to Basics: Using Flowcharts in the Classroom, Midwest Instruction and Computing Symposium, Grand
Forks - ND - USA, University of North Dakota, [Accessed 28/04/2009] http://www.micsymposium.org/apache2-
default/mics_2007/papers/Hall.pdf.
HAMILTON, D., MURTAGH, J. & RICHARD, Z.,(2000),Programming Language Impacts on Learning, ACM
SIGAda Letters, 20,3, ACM, New York - NY - USA, pp 12-20.
HEARRINGTON,(2009),Learning Efficiency and Efficacy in a Multi-User Virtual Environment, National Educational
Computing Conference, Eugene - OR - USA, International Society for Technology in Education,
HEWLETT PACKARD (2009),HP Innovation in Education Grant Initiative Hewlett Packard, Palo Alto - CA - USA,
[Accessed 23/02/2010] http://h41111.www4.hp.com/globalcitizenship/uk/en/philanthropy/INNOVATION.html.
HIGHER EDUCATION STATISTICS AGENCY,(2007), Widening participation of under-represented groups (tables
T1, T2), Performance Indicators, Statistical, [Accessed 07/08/2009]
http://www.hesa.ac.uk/index.php/content/view/1174/141.
HOFFLER, T. & LEUTNER, D.,(2007),Instructional Animation Versus Static Pictures, Learning and Instruction,
17,6,Elsevier,Orlando - FL - USA, pp 722-739.
HONEY, P. & MUMFORD, A. (1992),Manual of Learning Styles (3rd Edition),Peter Honey, Maidenhead - UK.
HOWE, E., THORNTON, M. & BRUCE, W.,(2004),Components First Approach to CS1/CS2: Principles and
Practice, ACM SIGCSE Bulletin, 36,1, ACM, New York - NY - USA, pp 291-296.
HOWEL, K.,(2003),First Computer Languages, Journal of Computing Sciences in Colleges,, 18,4,Consortium for Computing
in Small Colleges, USA, pp 317-330.
HRISTOVA, M., MISRA, A., RUTTER, M. & MERCURI, R.,(2003),Identifying and Correcting Java Programming
Errors, ACM SIGCSE Bulletin, 35,1, ACM, New York - NY - USA, pp 153-157.
HUNDHAUSEN, C., DOUGLAS, S. & STASKO, J.,(2002),Meta-Study of Algorithm Visualization Effectiveness,
Journal of Visual Languages and Computing, 13,3, Elsevier, Oxford - UK, pp 259-290.
JACKSON, J., COBB, M. & CARVER, C.,(2005),Identifying Top Java Errors for Novice Programmers, ASEE/IEEE
Frontiers in Education Conference, Indianapolis - IN - USA, IEEE, pp 24-27.
JACKSON, M. (1975),Principles of Program Design, Academic Press, Orlando - FL - USA, ISBN: 0123790506.
JENKINS, T.,(2001),The Motivation of Students Programming, Masters Thesis, Computer Science, The University of
Kent at Canterbury, Cantebury - UK.
JENKINS, T.,(2002),On The Difficulty of Learning to Program,3rd Annual Conference on LSTN - ICS, The Higher
Education Academy - Information and Computer Sciences, Loughborough, pp 53-59.
JENKINS, T. & DAVY, J.,(2002),Diversity and Motivation in Introductory Programming, Innovation in Teaching and
Learning Information and Computer Sciences, 1,1,Higher Education Academy - Information and Computing Sciences,
[Accessed 29/09/2008] http://www.ics.heacademy.ac.uk/italics/issue1/tjenkins/003.PDF.
KANN, C., LINDERMAN, R. & HELLER, R.,(1997),Integrating Algorithm Animation into a Learning Environment,
Computers and Education, 28,4, Elsevier Science, Oxford - UK, pp 223-229.
KANNUSMÄKI, O., MORENO, A., NIKO, M. & ERKKI, S.,(2004),What a Novice Wants: Students Using Program
Visualisation in a Distance Programming Course, Third Visualisation Workshop, University of Warwick - UK, ACM, pp
126-134.

Using Flowcharts, Code and Animation in Novice Programming References
Page 292
KELLEHER, C. & PAUSCH, R.,(2005), Lowering the Barriers to Programming : A Taxonomy of Programming
Environments and Languages for Novice Programmers, ACM computing Surveys (CSUR), 27,2,ACM,New York - USA,
pp 83-144.
KEMENY, J. & KURTZ, T. (1964),Basic Instruction Manual, Dartmouth College - Computation Center, Hanover - NH -
USA,
KESSLER, C. & ANDERSON, J.,(1989), Learning the Flow of Control: Recursive and Iterative Procedures IN
SOLLOWAY, E. & SPOHRER, J.(Eds.),Studying the Novice Programmer, Lawrence Erlbaum Associates, Hillsdale - NJ -
USA, ISBN: 0-8058-0002-6.
KHALIFE, J.,(2006), Threshold for the Introduction of Programming: Providing Learners with a Simple Computer
Model, 28th International Conference on Information Technology, Bhubaneswar, India, IEEE,7 pp 1-76.
KING, L. M. & KIENA, S.,(1996), Dijkstra's Algorithm (an animation of), Computational Graph Theory with
Combinatronica, Algorithm Animation, Stony Brook, [Accessed 11/02/2009]
http://www.cs.sunysb.edu/~skiena/combinatorica/animations/dijkstra.html.
KNOWLETON, K.,(1966), Bell Telephone Laboratories Low-Level Linked List Language. 16 mm black and white
sound film, .An Example of L[6] Programming Technical Information Library - Bell Laboratories, USA.
KOLB, D. (1984),Experimental Learning: Experience as the Source of Learning and Development, Prentice Hall,Englewood Cliffs
- NJ - USA.
KÖLLING, M., QUIGG, B. & ROSENBERG, J. (2008), BlueJ, The Interactive Java Environment ,University of Kent
and Deakin University, London - UK, [Accessed 28/11/2008] http://bluej.org.
KÖLLING, M. & ROSENBERG, J.,(2001), Guidelines for Teaching Object Orientation With Java, ACM SIGCSE
Bulletin, 33,3, ACM, New York - NY - USA, pp 33-37.
KUMWENDA. B, RAUCHAS. S & SANDERS. I,(2006), The Effect of Prior Programming Experience in a Scheme-
Based Breadth First Curriculum at WITS,ACM SIGCSE Bulletin, 38,3, ACM, New York - NY - USA, pp 326-333.
LAAKSO, M., LAURI, M., KORHONEN, A., REJALA, T., KAILA, E. & SALAKOSKI, T.,(2008), Using the Role of
Variables to Enhance Novices' Debugging Work, Issues in Informing Science and Information Technology, 5,Informing Science
Institute, Santa Rosa - CA - USA,281-297.
LAHTINEN, E., ALA-MUTKA, K. & JÄRVINEN, H.-M.,(2005),A Study of the Difficulties of Novice Programmers,
ACM SIGCSE Bulletin, 37,3, ACM, New York - NY - USA, pp14-19.
LAVONEN, J., MEISALO, V. & LATTU, M.,(2001),Problem Solving with an Icon Oriented Programming Tool: A
Case Study in Technology Education, The Journal of Technology Education, 12,2, Virginia Tech, Blacksburg - VA - USA, pp
21-34.
LAVONEN, J., MEISALO, V., LATTU, M. & SUTINEN, E.,(2002), Concretising the Programming task: a Case Study
in a Secondary School, Computers and Education, 40,2,Elsevier Science, Oxford - UK, pp 115-135.
LAYMAN, L., CORNWELL, T., WILLIAMS, L. & OSBOURNE, J.,(2002),Personality Profiles and Learning Styles of
Advanced Undergraduate Computer Science Students, Unpublished Technical Report, North Carolina State University,
Raleigh - NC - USA.
LEWIS, S. & MULLEY, G.,(1998),A Comparison Between Novice and Experienced Compiler users in a Learning
Environment, ACM SIGCSE Bulletin, 30,3,ACM,New York - NY - USA, pp 157-161.
LINDSAY, M.,(2002),Goto Considered Harmful and other Programmers' Taboos,12th Workshop of the Psychology of
Programming Interest Group, Cosenza - Italy, PPIG, pp 171-180.

Using Flowcharts, Code and Animation in Novice Programming References
Page 293
LISTER, R., ADAMS, E., FITZGERALD, S., FONE, W., HAMER, J., LINDHOLM, M., MCCARTNEY, R.,
MOSTRÖM, M. E., SANDERS, K., SEPPÄLÄ, O., SIMON, B. & THOMAS, L.,(2004), A Multi-National Study of
Reading and Tracing Skills in Novice Programmers, SIGCSE Bulletin 36,4,A CM, New York - NY - USA,pp 119-150.
LOGO COMPUTER SYSTEMS INC (2009), Microworlds Pro,Logo Computer Systems Inc, Highgate Springs - VT,
[Accessed 03/04/2009] http://www.microworlds.com/solutions/mwpro.html.
LOPEZ, M., WHALLEY, J., ROBINS, P. & LISTER, R.,(2008), Relationships Between Reading, Tracing and Writing
Skills in Introductory Programming, Proceedings of the fourth international Workshop on Computing Education Research, Sydney -
Australia, ACM, pp 101-113.
MA, L., FERGUSON, J., ROPER, M. & MURRAY, W.,(2007), Investigating the Viability of Mental Models Held by
Novice Programmers,38th ACM Technical Symposium on Computer Science Education, Covington - KY - USA,ACM,499-503.
MA, L., FERGUSON, J., ROPER, M. & ROSS, I.,(2008), Using Cognitive Conflict and Visualisation to Improve
Mental Models Held By Novice Programmers, ACM SIGCSE Bulletin, 40,1,ACM,New York - NY - USA,342-347.
MALONEY, J., PEPPLER, K., KAFAI, Y., RESNICK, M. & RUSK, N.,(208), Programming Through Choice: Urban
Youth Learning Programming With Scratch, ACM SIGCSE Bulletin, 40,1, ACM, New York - NY - USA, pp 367-372.
MAYER, R. (1988), Teaching and Learning Computer Programming - Multiple Research Perspectives,,Lawrence Erlbaum
Associates, Hillsdale - NJ - USA, ISBN: 0-8058-0073-5.
MAYER, R. & MERINO, R.,(2003), Nine Ways to Reduce Cognitive Load in Multimedia Learning, Educational
Psychologist, 38,1,Lawerence Erlbaum Associates, Philadelphia - PA - USA, pp 43-52.
MCBRIDE, N. (2008), The State of A-Level Computing, British Computing Society, Swindon - UK, [Accessed
25/10/2008] http://www.bcs.org/server.php?show=ConWebDoc.19144.
MCCRACKEN, M., ALMSTRUM, V., DIAZ, D., GUZDIAL, M., HAGEN, D., KOLIKANT, Y., LAXER, C.,
THOMAS, L., UTTING, I. & WILUSZ, T.,(2002), A Multi-National, Multi-Institutional Study of Assessment of
Programming Skills of First-year CS Student, SIGCSE Bulletin, 33,4, ACM Press ,New York - USA, pp 125-140.
MCCRACKEN. M, ALMSTRUM. V, DIAZ. D, GUZDIAL. M, HAGEN. D, KOLIKANT. Y, LAXER. C,
THOMAS. L, UTTING. I & T, W.,(2002), A Multi-National, Multi-Institutional Study of Assessment of Programming
Skills of First-year CS Student, SIGCSE Bulletin, 33,4, ACM Press, New York - USA, pp 125-140.
MCIVER, L. & CONWAY, D.,(1996), Seven Deadly Sins of Introductory Programming Language Design, International
Conference on Software Engineering Education and Practice, IEEE Computer Society, Washington DC - USA, pp 309-317.
MCIVER, L. & CONWAY, D.,(1999), GRAIL : A Zeroth Programming Language, International Conference on Computing
in Education (ICCE99), Chung Li - Taiwan, APSCE, pp 43-51.
MCIVER, L. & CONWAY, D.,(2000), The Effect of Programming Language on Error Rates of Novices,,12th Workshop
of the Psychology of Programming Interest Group (ICCE99), Cozenza - Italy, Psychology of Programming Interest Group,
pp192-193.
MCNIFF, J. (1988),Action Research Principles and Practice, Routlege, New York - NY - USA, ISBN 0-415-09096-2.
MICROSOFT CORPORATION (2008),Microsoft Visual Studio Development System, Microsoft Corporation,
Redmond - WA - USA, [Accessed 27/11/2008] http://msdn.microsoft.com/en-gb/vstudio/products/default.aspx.
MICROSOFT CORPORATION (2009), Visio 2007,Microsoft Corporation, Redmond - WA - USA, [Accessed
09/03/2009]http://office.microsoft.com/en-us/visio/default.aspx.
MISHLER, E. (1986),Research Interviewing: Context and Narative, Harvard University Press, Cambridge - MA - USA, ISBN:
9780674764613.

Using Flowcharts, Code and Animation in Novice Programming References
Page 294
MUELLER, F. & HOSKING, A.,(2003), Penumbra: An Eclipse Plug-in for Introductory Programming,2003 OOPSLA
Workshop on Eclipse Technology Exchange, Anaheim - CA - USA, ACM, pp 65-69.
MYERS, P. & BRIGGS, I. (1995), Gifts Differing: Understanding Personality Type, ,Davies Black, Mountain View - CA -
USA, ISBN: 0-89106-074-X.
NAIDOO, R. & REMJEETH, S.,(2007), Errors Made By Students In A Computer Programming Course, Computer
Science and IT Education Conference 2007, Balaclava - Mauritius - Seychelles, Informing Science Institute, pp449-461.
NAPS, T., RÖßLING, G., ANDERSON, J., COOPER, S., DANN, W., FLEISHER, R., KOLDEHOFE, B.,
KORHONEN, A., MARJA, K., LESKA, C., MALMI, L., MCNALLY, M., RANTAKOKKO, J. & ROSS, R.,(2003a),
Evaluating the Educational Impact of Visualisation, ACM SIGCSE Bulletin, 35,4, ACM, New York - NY - USA, pp
124-137.
NAPS, T., RUDOLF, F., MC NALLY, M., RÖßLING, G., HUNDHAUSEN, C., RODGER, S., VIKI, A.,
KORHONEN, A., VELAZQUES, A., DANN, W. & MALMI, L.,(2003b), Exploring the Role of Visualisation and
Engagement in Computer Science Education, ACM SIGCSE Bulletin, 35,2, ACM, New York - NY - USA, pp 131-152.
NASSI, I. & SHNEIDERMAN, B.,(1973),Flowchart Techniques for Structured Programming, ACM SIGPLAN, 8,8,
ACM, New York - NY - USA, pp 12-26.
NATIONAL AUDIT OFFICE,(2007), Staying the course: the retention of students on higher education courses,
.National Audit Office ,London - UK, Document HC616.
NELSON, M. & RICE, D.,(2000), Introduction to Algorithms and Problem Solving,30th ASEE / IEEE Frontiers in
Education Conference, Volume SC2, Kansas City - MO - USA, IEEE, pp .16-21.
NIELSEN, J. (2003), Usability 101: Introduction to Usability, Nielsen Norman Group, Freemont CA - USA,[Accessed
04/08/2010] http://www.useit.com/alertbox/20030825.html.
NIELSEN, J. & LANDUAR, K.,(1993),A Mathematical Model of the Finding of Usability Problems, The SIGCHI
Conference on Human Factors in Computing Systems, Amsterdam - Holland,ACM,206-213.
OPPENHEIM, A. (1992), Questionnaire Design - Interviewing and Attitude Measurement, Pinter, London UK,1855670445.
ORACLE CORPORATION (2008), Oracle JDeveloper - Official Home Page, Oracle Corporation, Redwood Shores -
CA - USA, [Accessed 04/08/2010] http://www.oracle.com/technology/products/jdev/index.html.
PAYNE, J. & MYERS, B.,(1996), Usability Issues in the Design of Novice Programming Systems, School of Computer
Science Technical Report Carnegie Mellon University, Pittsburgh - USA, [Accessed 29/10/2009]
http://web.cs.cmu.edu/~pane/ftp/CMU-CS-96-132.pdf.
PEA, R.,(1986), Language Independent Conceptual "Bugs" in Novice Programming, Journal of Educational Computing
Research, 2,1, Baywood Publishing Company, New York - NY - USA, pp 25-26.
PECINOVSKÝ, R., PAVLÍČKOVÁ, J. & PAVLÍČEK, L.,(2006), Let's Modify the Objects First Approach Into
Design Patterns First, ACM SIGCSE Bulletin, 38,3, ACM, New York - NY - USA, pp: 188-193.
PERKINS, D., HANCOCK, C., HOBBS, R., MARTIN, F. & SIMMONDS, R.,(1988),Conditions of Learning In
Novice Programmers, IN SOLLOWAY, E. & SPOHRER, J.(Eds.),Studying the Novice Programmer, Lawrence Erlbaum
Associates, Hillsdale - NJ - USA, ISBN: 0-8058-0002-6.
PERKINS, D. & MARTIN, F.,(1986), Fragile Knowledge and Neglected Strategies in Novice Programmers, IN
SOLOWAY, E. & IYENGAR, S.(Eds.),Empirical Studies of Programmers, Ablex,Norwood - NJ - USA, ISBN:0-89391-
388-X.
PERKINS, D., SCHWARTZ, S. & SIMMONDS, R.,(1998), Teaching and Learning Programming, IN MAYER,
R.,(Ed.)Teaching and Learning Computer Programming - Multiple Research Perspectives, Lawrence Erlbaum Associates, ISBN: 0-
8058-0073-5.

Using Flowcharts, Code and Animation in Novice Programming References
Page 295
PETRE, M. & DE QUINCEY, E.,(2006), A Gentle Overview of Software Visualisation, PPIG Newsletter
2006,Psychology of Programming Interest Group (PPIG),Salford - UK, [Accessed 31/01/2008]
http://www.ppig.org/newsletters/2006-09/1-overview-swviz.pdf.
PILLAY, N. & JUGOO, V.,(2006), An Analysis of the Errors Made by Novice Programmers in a First Course in
Procedural Programming in Java, Southern African Computer Lecturers Association Conference (SACLA06), Cape Town -
South Africa, Southern African Computer Lecturers Association, pp 11-22.
PREECE, J., ROGERS, Y. & SHARP, H.,(2007a), Data Gathering - Interviews, IN Interaction Design Beyond Human
Computer Interaction 2nd Ed, John Wiley and Sons, Chichester - UK, ISBN: 978-0-470-186.
PREECE, J., ROGERS, Y. & SHARP, H.,(2007b), Data Gathering - Observation, IN Interaction Design Beyond Human
Computer Interaction 2nd Ed, John Wiley and Sons, Chichester - UK, ISBN: 978-0-470-186.
PRENDERGAST, M.,(2006), Teaching Introductory Programming to IS Students: Java Problems and Pitfalls, Journal of
Information Technology Education, 5,Informing Science Institute, Santa Rossa - CA - USA, pp 491-516.
PROLUX, V., RAAB, J. & RASALA, R.,(2002), Objects From The Beginning With GUIs, ACM SIGCSE Bulletin, 34,3,
ACM, New York - NY - USA, pp 65-70.
QUALIFICATIONS AND CURRICULUM AUTHORITY (2007), What is ICT - Information and Communication
Technology, Qualifications and Curriculum Authority, London - UK, [Accessed 05/08/2008]
http://www.qca.org.uk/qca_14168.aspx.
RAMALINGHAM, V., LABELLE, D. & WEIDENBECK, S.,(2004), Self Efficacy and Mental Models in Learning to
Program, SIGCSE Bulletin, 36,3,A CM, New York - NY - USA, pp 171-176.
RAMALINGHAM, V. & WEIDENBECK, S.,(1997), An Empirical Study of Novice Program Comprehension in the
Imperative & OO Styles, 7th Workshop on Empirical Studies of Programmers, Alexandria - VA - USA, ACM Press, pp 124-
139.
RAYMOND, D. & WELCH, D.,(2000), Integrating information technology and programming in a freshmen computer
science course, 30th ASEE/IEEE Frontiers in Education Conference, IEEE, Kansas City - MO - USA, pp 71-77.
REGES, S.,(2002), Can C# Replace Java in CS1 and CS2, ACM SIGCSE Bulletin, 34,3, ACM, New York - NY - USA,
pp 4-9.
REGES, S.,(2006), Back to Basics in CS1 and CS2,ACM SIGCSE Bulletin, 38,1, ACM, New York - NY - USA, pp 293-
298.
REISE, C. & CARTWRIGHT, R.,(2004), Taming a Professional IDE for the Classroom,35th SIGCSE Technical
Symposium on Computer Science Education, 36,1, ACM, New York - NY - USA, pp 156-161.
RIGBY, P. & THOMPSON, S.,(2005), Study of Novice Programmers Using Eclipse and Guild, OOPSLA Workshop on
Eclipse Technology Exchange,, San Diego - CA - USA, ACM, pp 105-110.
RIST, R.,(1996), Teaching Eiffel as a First Language,9th Journal of Object-Oriented Programming 1,SIGS Publications Inc,
New York - NY- USA, pp 30-41.
RIST, R.,(1996), Teaching Eiffel as a First Language,9th Journal of Object-Oriented Programming 1,SIGS Publications Inc,
New York - NY- USA, pp 30-41.
ROBERTS, E.,(1995), Loop Exits and Structured Programming - Reopening The Debate, ACM SIGCSE Bulletin, 27,1,
ACM, New York - NY - USA, pp 268-273.
ROBERTS, E.,(2001), An Overview of Mini Java, ACM SIGCSE Bulletin, 33,1, ACM, New York - NY - USA, pp 1-5.
Using Flowcharts, Code and Animation in Novice Programming References
Page 296
ROBERTS, E., BRUCE, K., CUTLER, R., CROSS, J., GRISSOM, S., KLEE, K., RODGER, S., TREES, F.,
UTTING, I. & YELLIN, F. (2006), ACM Java Task Force, ACM, New York - NY - USA, Accessed [17/11/2008]
http://jtf.acm.org/rationale/index.html.
ROBINS, A., ROUNTREE, J. & ROUNTREE, N.,(2003),Learning and teaching programming: A review and
discussion, Computer Science Education, 13,2, Routledge, Oxford - UK, pp 137-172.
ROBSON, C. (2002), Real World Research 2nd Edition, Blackwell Publishing, Oxford - UK, ISBN: 0631213058.
RUSHINEK, A. & S, R.,(1986), What makes users happy, Communications of the ACM, 29,7, ACM, New York - NY -
USA, pp 594-598.
SACKMAN. H,(1970), Exploratory Studies With Programmers IN Man-Computer Problem Solving, Auerbach Inc, New
York - NY - USA.
SCANLAN, D.,(1989), Structured Flowcharts Outperform Pseudocode: An Experimental Comparison, IEEE Software,
6,5,IEEE,Washington D.C. USA, pp 28-36.
SCOTT, A.,(2009a), Progranimate User Manual for Prototype Version 3.5,User Manual, University of Glamorgan,
Pontypridd, [Accessed 29/09/2009]
http://www.comp.glam.ac.uk/pages/staff/asscott/progranimate/docs/ProgranimateUserManual-3,5-v2.doc.
SCOTT, A. (2009b),The Progranimate Website, University of Glamorgan, Pontypridd - UK [Accessed 29/08/2010]
www.glam.ac.uk/progranimate.
SCOTT, A., AYRES, D. & WATKINS, M.,(2006), Animated Flowcharts as an Aid to Learning Programming,10th Java
in the Internet Curriculum Conference, London Metropolitan University - London - UK, The Higher Education Academy,
pp12-16.
SHEARD, J. & HAGEN, D.,(1998), Our Failing Students: A Study of a Repeat Group, Proceedings of the 6th Annual Joint
Conference Integrating Technology into Computer Science Education, ACM Press, Dublin - Ireland, pp 223-227.
SHEIL, B.,(1981),The Psychological Study of Programming, ACM computing Surveys, 13,1, ACM Press, New York -
NY - USA, pp 101-120.
SHIH, Y.-F. & ALESSI, S.,(1994), Mental Models and Transfer of Learning in Computer Programming, Journal of
Research on Computing in Education, Volume 26,2,International Society for Technology in Education, Washington D.C. -
USA, pp: 154-176.
SHNEIDERMAN, B., MAYER, R., MCKAY, D. & HELLER, P.,(1977), Experimental Investigations of the Utility of
Detailed Flowcharts in Programming, Communications of the ACM, 20,6, ACM, New York - NY - USA, pp373-281.
SIERRA, K. & BATES, B. (2005), Headfirst Java ,O'Reilly, Sebastopol - CA - USA,0596009208.
SMITH, P. & WEBB, G.,(2000), The Efficacy of a Low Level Program Visualisation Tool for Teaching Programming
Concepts to Novice C Programmers, Journal of Educational Computing Research, 22,2, Baywood Publishing, Amityville - NY
- USA pp ,187-215.
SOLLOWAY, E.,(1986), Learning to Program = Learning to Construct Mechanisms and Explanations, Communications
of the ACM, 29,9, ACM, New York - NY - USA, pp 850-859.
SOLLOWAY, E., BONAR, J., BARTH, P., RUBIN, E. & WOOLF, B.,(1981), Programming and Cognition Why Your
Students Write Those Crazy Programs, Proceedings of the National Educational Computing Conference, pp 206-220.
SOLLOWAY, E. & IYENGAR, S. (1986), Empirical Studies of Programmers, Ablex Publishing Corporation, Norwood -
NJ - USA, ISBN 0-89391-388-X.
SOLLOWAY. E, EHRLICH. K, BONAR. J & GEENSPAN. J,(1982),What do novices know about programming?, IN
Directions in Human-Computer Interactions, Ablex Inc, Norwood, NJ pp 27-53.

Using Flowcharts, Code and Animation in Novice Programming References
Page 297
SOLLOWAY. E & SPOHRER. J(Eds.) (1988),Studying the Novice Programmer, Lawrence Erlbaum Associates, Hillsdale -
NJ - USA, ISBN: 0-8058-0002-6.
SOLOMAN, B. & FELDER, R. (2002), Index of Learning Styles Questionnaire, North Carolina State University,
Raleigh - NC - USA, [Accessed 29/09/2008] http://www.engr.ncsu.edu/learningstyles/ilsweb.html.
SPOHRER, J. & SOLLOWAY, E.,(1986), Analyzing High Frequency Bugs In Novice Programs, IN
SHNEIDERMAN. B & E, S.(Eds.),Empirical Studies Of Novice Programmers, Ablex Publishing Corp, Norwood - NJ -
USA, ISBN: 0-89391-388-X.
SPOHRER, J. & SOLLOWAY, E.,(1989),Novice Mistakes: Are Folk Wisdoms Correct?, IN SOLLOWAY, E. &
SPOHRER, J.(Eds.),Studying the Novice Programmer, Lawrence Erlbaum Associates, Hillsdale - NJ - USA, ISBN: 0-8058-
0002-6.
SPOHRER, J., SOLLOWAY, E. & POPE, E.,(1989),A Goal Plan Analysis of Buggy Pascal Programs, IN
SOLLOWAY, E. & SPOHRER, J.(Eds.),Studying the Novice Programmer, Lawrence Erlbaum, Hillsdale - NJ - USA, ISBN:
ISBN: 0-8058-0002-6.
STUBBS, G.,(2001),The Derivation, Implementation and Evaluation of a Model for CBL Specification and Design,
PhD Thesis, School of Computing and Mathematics, University of Glamorgan, Pontypridd - UK.
SUN MICROSYSTEMS (2008),Welcome to NetBeans, Sun Microsystems, Santa Clara - USA, [Accessed 27/11/2008]
http://www.netbeans.org/index.html.
SUN MICROSYSTEMS (2009a),Java Applets, Sun Microsystems, Santa Clara - USA, [Accessed 27/04/2009]
,http://java.sun.com/applets/.
SUN MICROSYSTEMS (2009b),The Java Runtime Environment, Sun Microsystems, Santa Clara - USA, [ Accessed
27/04/2009 ] http://www.java.com/en/download/index.jsp.
SUN MICROSYSTEMS (2009c) ,Javadoc Tool,Sun Microsystems, Santa Clara - USA, [Accessed 27/04/2009]
http://java.sun.com/j2se/javadoc/index.jsp.
SUN MICROSYSTEMS (2009d),What is Java Webstart Software and How is it Launched?, Sun Microsystems, Santa
Clara - USA, [Accessed 27/04/2009] http://java.com/en/download/faq/java_webstart.xml.
THE ECLIPSE FOUNDATION (2008),Eclipse.org Home Page, The Eclipse Foundation, Ottawa - Ontario - Canada,
[Accessed 27/04/2009] http://www.eclipse.org/.
THE LEARNING TECHNOLOGY RESEARCH GROUP (2009), CourseMarker (formerly Course Master and
Ceilidh), Nottingham University, Nottingham - UK, [Accessed 31/11/2009]
http://www.cs.nott.ac.uk/~cmp/cm_com/index.html.
THOMAS, L., RATCLIFFE, M., WOODBURY, J. & JARMAN, E.,(2002), Learning Styles and Performance in the
Introductory Programming Sequence, Special Interest Group on Computer Science Education, Cincinnati - KY - USA, pp 33-
37.
TIOBE SOFTWARE (2008), TIOBE Programming Community Index for November 2008,TIOBE Software,
Eindhoven - The Netherlands, [Access18/11/2008]
http://www.tiobe.com/index.php/content/paperinfo/tpci/index.html.
TUDOREANU, M.,(2003), Designing Effective Programming Visualisation Tools For Reducing a Users Cognitive
Effort, ACM Symposium on Software Visualisation, San Diego - CA - USA, ACM, pp 105-213.
UNIVERSITY OF GLAMORGAN,(2007), University of Glamorgan Annual A-Level Conference for Computing /
ICT - Pupils and Teachers, Faculty of Advanced Technology - University of Glamorgan, Pontypridd - UK.
VENKATESH, V. & DAVIS, F.,(1996), A Model of Antecedents of Perceived Ease of Use: Development and Test,
Decision Sciences, 27,3, John Wiley and Sons, Malden - MA - USA, pp 451-481.

Using Flowcharts, Code and Animation in Novice Programming References
Page 298
VENTURA. P & B, R.,(2004),Wanted: CS1 Students - No Experience Required, SIGCSE 04, ACM, New York, NY -
USA, pp 240-244.
VESA, V. & SAJANIEMI, J.,(2007), Factors in Novice Programmers Poor Tracing Skills, ACM SIGCSE Bulletin,
39,3,ACM,New York - NY - USA,236-241.
VIOLA, S., GRAF, S., KINSHUK & TOMMASO, L.,(2007), Investigating Relationships within the Index of Learning
Styles, International Journal of Interactive Technology and Smart Education, 1,4,7-18.
VOGTS, D., CALITZ, A. & GREYLINE, J.,(2008),Comparison of the effects of Professional and Pedagogical
Program Development Environments on Novice Programmers, Proceedings of the 2008 Annual Research Conference Of The
South African Institute of Computer Scientists and Information Technologies on IT Research in Developing Countries: Riding The Wave of
Technology, Wilderness - South Africa, ACM, pp 286-296.
W3C (1999),HTML 4.01 Specification, World Wide Web Consortium,, Cambridge - Massachusetts - USA, [Accessed
20/07/2009] http://www.w3.org/TR/html401/.
W3C (2007),Cascading Style Sheets - Level2 - CSS2 Specification, World Wide Web Consortium / Massachusetts
Institute of Technology, Cambridge - Massachusetts - USA,[ Accessed 20/07/2009]http://www.w3.org/TR/2007/CR-
CSS21-20070719/.
WARNALULASOORIYA, R., PALAZZO, D. & PRITCHARD, D.,(2007),Journal of Experimental Analysis of Behaviour,
88,1,Society for the Experimental Analysis of Behaviour, Bloomington - IA - USA, pp 103-113.
WATKINS, M., STOCKING, S. & SCOTT, A.,(2008),Taking the University to Schools,9th Annual Conference on the
Teaching of Computing, Liverpool, The Higher Education Academy, pp15-20.
WATTS, T.,(2004),The SFC Editor A Graphical Tool for Algorithm Development, Journal for Computing Sciences in
Colleges, Volume 20,2,Consortium for Computing Sciences in Colleges ,Chicago - IL - USA, pp73-85.
WEISS, C.,(1998),The Randomised Experiment, IN Evaluation 2nd Edition, Prentice Hall ,Upper Saddle River - NJ -
USA, ISBN: 0-13-309725-0.
WESTPHAL, B., HARRIS, F. & FADALI, M.,(2003),Graphical Programming: A Vehicle For Teaching Computer
Problem Solving,33rd ASEE / IEEE Frontiers in Education Conference, Bolder - CO - USA, IEEE, pp 23-27.
WINSLOW, L.,(1996),Programming Pedagogy - A Psychological Overview,, SIGCSE Bulletin, 28,3,ACM Press, New
York - NY- USA, pp: 17-22.
WIRTH, N.,(1971),The Programming Language Pascal, Acta Informatica, 1,Springer Verlag, Düsseldorf - Germany, pp
63-92.
WOOD, D., BRUNER, J. & ROSS, G.,(1976),The Role of Tutoring in Problem Solving, Journal of Child Psychology,
17,2,Pergamon Press, London - UK, pp 89-100.
YARMISH, G. & KOPEC, D.,(2007),Revisiting Novice Programmer Errors,, ACM SIGSCE Bulletin, 39,2, ACM, New
York - NY - USA, pp 131-138.
ZIEGLE, U. & CREWS, T.,(1998), The Flowchart Interpreter for Introductory Programming,28th Annual Frontiers in
Education Conference., 1, Tempe - AZ - USA,IEEE Computer Society, pp 307-312.
ZIEGLE, U. & CREWS, T.,(1999), An Integrated Development Tool for Teaching and Learning How to Program,
ACM SIGCSE Bulletin, 31,1,ACM,New York - NY - USA, pp276-280.

Flowcharts, Code and Animation in Novice Programming Appendices– A-I
- 299 -
APPENDICES
Contents APPENDIX A – Reviewed Systems ............................................................................................................ 301
A.A BACCI 1992 (Calloni 1992, Calloni ahd Bagart 1994,1999) ........................................................... 302
A.B FLINT 1999 (Ziegle and Crews, 1999).............................................................................................. 303
A.C Empirica Control 2002 (Lavonen et Al., 2002) ................................................................................. 304
A.D Flowchart Interpreter 2003 (Atanasova and Hristova 2003) .............................................................. 305
A.E Raptor 2004 (Carlisle et al.,2004, Carlisle et al., 2005) ..................................................................... 306
A.F The SFC Editor 2004 (Watts, 2004) .................................................................................................. 307
A.G Visual Logic 2004 (Crews and Murphy, 2004, Crews, 2009) ........................................................... 308
A.H The Iconic Programmer 2005 (Chen and Morris, 2005) .................................................................... 309
A.I Dev Flowcharter 2006 (Domagala, 2006) .......................................................................................... 310
A.J Unnamed Application 2006 (Arai and Yamazaki) ............................................................................. 311
A.K B# 2006 (Greyling et al., 2006) ......................................................................................................... 312
A.L Pro Guide 2007 (Areias and Mendes, 2007) ...................................................................................... 313
A.M Using Microworlds Pro 2007 (Glezou and Gridoriadou, 2007) ........................................................ 314
A.N Code to Visual Flowchart (FateSoft, 2009) ....................................................................................... 315
APPENDIX B – Progranimate Images and Class Structure ........................................................................ 316
B.A Illustrated Examples of Program Creation ......................................................................................... 317
B.B Illustrated Example of Animation ...................................................................................................... 321
B.C The Variable and Array Inspectors .................................................................................................... 323
B.D Images of Progranimate‟s Website .................................................................................................... 324
B.E Progranimate Package and Class Structure ........................................................................................ 325
APPENDIX C Example Programming Problems ........................................................................................ 331
C.A Pedagogy Stage B2 Worksheet Example ........................................................................................... 332
C.B Pedagogy Stage C and D Worksheets Examples ............................................................................... 337
APPENDIX D Study 1 and 2 Exercises ....................................................................................................... 342
D.A Study 1 Materials ............................................................................................................................... 343
D.B Study 2 Materials ............................................................................................................................... 344
APPENDIX E – Study 3 - Bridgend Evaluation ......................................................................................... 345
E.A Full Usability Questionnaire Results ................................................................................................. 346
E.A.A Usability Questionnaire Comments: ......................................................................................... 347
E.A.B Usability Questionnaire Results Grouped by Attendance: ....................................................... 349
E.B Full Efficacy Questionnaire Results .................................................................................................. 350
E.B.A Efficacy Questionnaire Comments ........................................................................................... 351
E.B.B Efficacy Questionnaire Results Grouped by Attendance: ........................................................ 352
E.C Complete Problem Statistics: ............................................................................................................. 353
E.C.A Complete List of Problem Comments: ..................................................................................... 355
E.D Complete Interview Transcripts ......................................................................................................... 358
APPENDIX F Study 4 – Secondary School and College Teachers ............................................................. 374
F.A Participant Information ...................................................................................................................... 375
F.B Interview Transcripts ......................................................................................................................... 375
F.C Questionnaire Written Comments ...................................................................................................... 383

Flowcharts, Code and Animation in Novice Programming Appendices– A-I
- 300 -
APPENDIX G – STUDY 5 - Novices Ages Fifteen to Seventeen ............................................................... 385
G.A Detailed Participant Information ........................................................................................................ 386
G.B Full Results From Usability Questions ............................................................................................. 387
Usability Question Comments: .................................................................................................................... 388
G.C Full Results From Efficacy Questions .............................................................................................. 389
G.C.A Efficacy Question Comments: .................................................................................................. 389
G.D Full Results From Problem Solving Activity Questions ................................................................... 390
G.D.A Problem Solving Activity Question Comments: ...................................................................... 390
G.E Full Results from Open Ended Questions: ......................................................................................... 391
G.F Full Results from With Indecisions Omitted ..................................................................................... 393
G.G Complete Problem Statistics and Written Comments: ....................................................................... 394
G.G.A Complete List of Problem Comments: ..................................................................................... 395
G.H A List of Bugs Discovered and Fixed as a Result of this Study: ....................................................... 400
APPENDIX H – STUDY 6: Novices Aged 13 to 15 ................................................................................... 401
H.A Detailed Participant Information ........................................................................................................ 402
H.B Full Questionnaire Results ................................................................................................................. 403
H.B.A Questionnaire Responses for all evaluators .............................................................................. 403
H.B.B Questionnaire Responses for Males Only ................................................................................ 404
H.B.C Questionnaire Responses for Females Only ............................................................................. 405
H.B.D Questionnaire Responses for Year 9‟s Only ............................................................................. 406
H.B.E Questionnaire Responses for Year 10‟s Only ........................................................................... 407
H.B.F Averaged Questionnaire Responses Shown By Group Bar Chart ............................................ 408
H.B.G A Correlation Between Q19 and Performance in the Problem Solving Activities ................... 409
H.B.H A Correlation Between Q19 and Performance in the Problem Solving Activities ................... 409
H.B.I A Correlation between Q21 and Performance in the Problem Solving Activities:................... 410
H.B.J Written Comments Left in the Questionnaire Comments Section. ........................................... 410
H.C Complete Problem Statistics and Written Comments: ....................................................................... 414
H.C.A Completion Statistics for Male and Female Evaluators. ........................................................... 415
H.C.B Completion Statistics for Year Nine and Year Ten Evaluators ................................................ 416
H.C.C Complete List of Problem Comments: ..................................................................................... 417
APPENDIX I – STUDY 7: Secondary School Teachers Opinions ............................................................ 421
I.A Participant Information ...................................................................................................................... 422
I.B Profiling Questionnaire Results ......................................................................................................... 422
I.B.A Summarised Results ................................................................................................................. 422
I.B.B Individual Responses ................................................................................................................ 423
I.C Perspectives of Progranimate Questionnaire Results ......................................................................... 425
I.D Views on Suitable Ages for Programming Instruction at the start and end of the study .................... 426
I.E Questionnaire Printouts for Study Seven. .......................................................................................... 427
I.E.A Profiling Questionnaire Printout ............................................................................................... 427
I.E.B Perspectives of Progranimate Questionnaire Printout .............................................................. 428
APPENDIX J Study 8 – University Evaluation .......................................................................................... 429
J.A The Study 8 Questionnaire ................................................................................................................. 429

Flowcharts, Code and Animation in Novice Programming Appendix A– Reviewed Systems
- 301 -
APPENDIX A – Reviewed Systems
CONTENTS
A.A BACCI 1992 (figure 12) .................................................................................................................... 302
A.B FLINT 1999 (figure 13) ..................................................................................................................... 303
A.C Empirica Control 2002 (figure 14) ..................................................................................................... 304
A.D Flowchart Interpreter 2003 (figure 15) .............................................................................................. 305
A.E Raptor 2004 (figure 16) ..................................................................................................................... 306
A.F The SFC Editor 2004 (figure 17) ....................................................................................................... 307
A.G Visual Logic 2004 (figure 18) ............................................................................................................ 308
A.H The Iconic Programmer 2005 (figure 19) .......................................................................................... 309
A.I Dev Flowcharter 2006 (figure 20) ..................................................................................................... 310
A.J Unnamed Application 2006 (figure 21) ............................................................................................. 311
A.K B# 2006 (figure 22) ............................................................................................................................ 312
A.L Pro Guide 2007 (figure 23) ................................................................................................................ 313
A.M Using Microworlds Pro 2007 (figure 24) ........................................................................................... 314
A.N Code to Visual Flowchart 2009 (figure 25) ....................................................................................... 315
DESCRIPTION: This appendix provides the screenshots of the reviewed systems in a larger scale than could be
achieved within section 3.6 of the thesis. The images are listed in chronological order which is the
same order they appear in the thesis.

Flowcharts, Code and Animation in Novice Programming Appendix A– Reviewed Systems
- 302 -
A.A BACCI 1992 (Calloni 1992, Calloni ahd Bagart 1994,1999)
Figure A-1 BACCI

Flowcharts, Code and Animation in Novice Programming Appendix A– Reviewed Systems
- 303 -
A.B FLINT 1999 (Ziegle and Crews, 1999)
Figure A-2. Flint

Flowcharts, Code and Animation in Novice Programming Appendix A– Reviewed Systems
- 304 -
A.C Empirica Control 2002 (Lavonen et Al., 2002)
Figure A-3. Empirica Control

Flowcharts, Code and Animation in Novice Programming Appendix A– Reviewed Systems
- 305 -
A.D Flowchart Interpreter 2003 (Atanasova and Hristova 2003)
Figure A-4. Flowchart Interpreter

Flowcharts, Code and Animation in Novice Programming Appendix A– Reviewed Systems
- 306 -
A.E Raptor 2004 (Carlisle et al.,2004, Carlisle et al., 2005)
Figure A-5. Raptor

Flowcharts, Code and Animation in Novice Programming Appendix A– Reviewed Systems
- 307 -
A.F The SFC Editor 2004 (Watts, 2004)
Figure A-6. The SFC Editor

Flowcharts, Code and Animation in Novice Programming Appendix A– Reviewed Systems
- 308 -
A.G Visual Logic 2004 (Crews and Murphy, 2004, Crews, 2009)
Figure A-7. Visual Logic

Flowcharts, Code and Animation in Novice Programming Appendix A– Reviewed Systems
- 309 -
A.H The Iconic Programmer 2005 (Chen and Morris, 2005)
Figure A-8. The Iconic Programmer

Flowcharts, Code and Animation in Novice Programming Appendix A– Reviewed Systems
- 310 -
A.I Dev Flowcharter 2006 (Domagala, 2006)
Figure A-9. Dev Flowchater

Flowcharts, Code and Animation in Novice Programming Appendix A– Reviewed Systems
- 311 -
A.J Unnamed Application 2006 (Arai and Yamazaki)
Figure A-10. An Unnamed Application by A & Y

Flowcharts, Code and Animation in Novice Programming Appendix A– Reviewed Systems
- 312 -
A.K B# 2006 (Greyling et al., 2006)
Figure A-11. B#

Flowcharts, Code and Animation in Novice Programming Appendix A– Reviewed Systems
- 313 -
A.L Pro Guide 2007 (Areias and Mendes, 2007)
Figure A-12. Proguide

Flowcharts, Code and Animation in Novice Programming Appendix A– Reviewed Systems
- 314 -
A.M Using Microworlds Pro 2007 (Glezou and Gridoriadou, 2007)
Figure A-13. Using Microworlds Pro

Flowcharts, Code and Animation in Novice Programming Appendix A– Reviewed Systems
- 315 -
A.N Code to Visual Flowchart (FateSoft, 2009)
Figure A-14. Code to Visual Flowchart

Flowcharts, Code and Animation in Novice Programming Appendix B– Progranimate Images & Class Structure
- 316 -
APPENDIX B – Progranimate Images and Class Structure
CONTENTS
B.A Illustrated Examples of Program Creation ......................................................................................... 317
B.B Illustrated Example of Animation ...................................................................................................... 321
B.C The Variable and Array Inspectors .................................................................................................... 323
B.D Progranimate Package and Class Structure ........................................................................................ 325 DESCRIPTION: This appendix aims to show visual examples of program construction and animation. The images
are enlargements of the program construction and animation strip diagrams shown in chapter 4.

Flowcharts, Code and Animation in Novice Programming Appendix B– Progranimate Images & Class Structure
- 317 -
B.A Illustrated Examples of Program Creation
To illustrate the process of program construction, the processes shown in the diagrams will solve
the problem outlined below. The images contained in the examples are larger versions of those
displayed in chapter 4 of the main thesis body.
In this example, the process of problem solving is broken down into three parts, each composed
as a strip diagram, as follows:
1. Naming the program;
2. Adding the variables;
3. Adding the program constructs and their expressions;
o 3A
Add a print,
Ad a read,
Ad an If_Else
o 3B
Nest an If_Else
Finishing off
Problem Description:
Construct a program that prompts the user to input their age, then reads input of age from the keyboard. Based on the age entered, the program should output the following:
For ages 0 -12 output: Child
For ages 13 – 17 output: Teenager
For ages 18 or more output: Adult
Hint: This will require the use of nested IF_Else structures.

Flowcharts, Code and Animation in Novice Programming Appendix B– Progranimate Images & Class Structure
- 318 -
1
2

Flowcharts, Code and Animation in Novice Programming Appendix B– Progranimate Images & Class Structure
- 319 -
3a

Flowcharts, Code and Animation in Novice Programming Appendix B– Progranimate Images & Class Structure
- 320 -
3b

Flowcharts, Code and Animation in Novice Programming Appendix B– Progranimate Images & Class Structure
- 321 -
B.B Illustrated Example of Animation
This section illustrates the animation of the program created in the previous section. Each step of
execution is shown in the following 16 images.

Flowcharts, Code and Animation in Novice Programming Appendix B– Progranimate Images & Class Structure
- 322 -

Flowcharts, Code and Animation in Novice Programming Appendix B– Progranimate Images & Class Structure
- 323 -
B.C The Variable and Array Inspectors
The images in this section show the two types of variable/ array inspectors supported by
Progranimate. One is a table based view and the other is tree based. The tree view benefits from
being able to display more variables and arrays on screen at one time, but is slightly less clear than
the table view.
Table View Tree View

Flowcharts, Code and Animation in Novice Programming Appendix B– Progranimate Images & Class Structure
- 324 -
B.D Images of Progranimate’s Website
Two images of of Progranimate’s website. The website can be found at the following URL:
http://www.glam.ac.uk/progranimate

Flowcharts, Code and Animation in Novice Programming Appendix B– Progranimate Images & Class Structure
- 325 -
B.E Progranimate Package and Class Structure
This section shows the overall class and package structure of Progranimate.
The diagram below represents the package structure of Progranimate v3.5, which is the most
recent version at the time this thesis had been written. The page that follows is a fold out section
that shows the entire class and package structure of Progranimate, which is fairly vast.
Within Progranimate’s class structure are multiple occurrences of Model View Controller (MVC)
pattern and other common object oriented design patterns. For example, the Control class has the
role of controller, the program constructs and Program Variables are the model and the Code View and
Flowchart view form the view.
After the fold out class diagram, a brief description of each package and classes of Progranimate is
provided. They are alphabetised into package order and for ease of reference have colours that
help match them up with the fold out class and package diagram.
Progranimate Overall Package Structure

Flowcharts, Code and Animation in Novice Programming Appendix B– Progranimate Images & Class Structure
- 326 -
Code Generation
This package handles everything to do with the code of Progranimate. It manages the displaying of code; it also implements the sub packages(see compiler and language translator packages) for generating the code in a variety of languages and a compiler package for expression analysis.
Class Description
CodeLine Represents and contains a line of code within the code view this may be a print, read, assign, or the top or bottom half of a control structure. The CodeLine object contains a reference to which flowchart component the CodeLine object represents.
CodePanel The panel which holds the various lines of code that the user sees on screen.
CodeView Forms a controller interface between the rest of the application and the code lines and code panel. This is achieved by managing a list of codeLine objects which are then passed to the CodePanel for displaying.
Compiler
This package handled the expression analysis for the whole of Progranimate. It is used to validate a user entered expression during program construction. At run time it also evaluates expressions, causing the program variables to update.
Class Description
ExpressionAnalyser Evaluates and validates expressions using the rules defined in the CodeTranslator classes.
SimpleCompiler Gets a list of program components and variables from the Workspace control class and one by one, passes them to the expression analyser to check for errors. It also translates the program components, expressions and variables from one language implementation to another using the code translator classes. Performs other checks such as looking for the use of uninitialized variables.
Control
This package consists of only a single class. The class has the role of controller and maintains a list of the ProgramComponents objects which form the data model for Progranimate’s programs. User interactions are passed to this class from the FlowchartView, CodeView, and ProgramVariables packages. The control class then invokes the relevant calls and commands to update the flowchart, and code appropriately. It also handles the visualised execution by firing each step of executions at a predetermined interval, whilst handling all the interactions between the ExpresisonAnalyser and the CodeGeneration and FlowchartView, CodeView and ProgramVariables packages.
Class Description
Workspace The central controller of Progranimate. program handling features.

Flowcharts, Code and Animation in Novice Programming Appendix B– Progranimate Images & Class Structure
- 327 -
FlowchartGraphics
A set of classes that extend from one abstract graphic class. Each sub class represents a different visual element of the flowchart. For example, the lines of flow, the print parallelogram and its internal text, the diamonds of the loops and decisions and the start and terminate components.
Class Description
AssignGraphic Draws the assign component and its text.
EndForGraphic Draws the circle representing the end of a for loop.
EndIf_ElseGraphic Draws the circle representing the end of an if_else structure.
EndIf_Graphic Draws the circle representing the end of an if structure.
EndWhileGraphic Draws the circle representing the end of a while loop.
ForGraphic Draws the diamond, links and text of the for loop.
Graphic A graphical component all graphic classes extend. Implements the basic features common to all graphics objects.
If_ElseGraphic Draws the diamond, links and text of the If_Else structure.
IfGraphic Draws the diamond, links and text of the If structure.
Link…..Graphic Multiple classes that draws the various types of flow lines.
PrintGraphic Draws the parallelogram and text of the print component.
ReaderGraphic Draws the parallelogram and text of the read component.
StarterGraphic Draws the stadium shape and text of the starter component.
TerminatorGraphic Draws the stadium shape and text of the terminator component.
WhileGraphic Draws the diamond, links and text of the while loop.
Flowchart View
The flowchart view receives the list of ProgramComponents from the Workspace controller and displays them on screen as a flowchart.
Class Description
View Consists of a panel that arranges the multiple instances of the FlowchartGrapgics objects in to a grid formation. This represents the flowchart the user sees. The class also receives user interaction with the flowchart and notifies the Workspace controller accordingly.
GPTool
This packag forms the entry point of the application. The application class contains a panel within which is the Progranimate user interface. This panel than can be either displayed in a standard application window (Standard_Container) or an applet (Applet_Container) within a web page. So to launch Progranimate, either the Standard_Container or Applet_Container classes can be called.
Class Description
Application A panel containing the Progranimate user interface.
Applet_Container An Applet that contains the Application panel.
Standard_Container An application window that contains the Application panel.

Flowcharts, Code and Animation in Novice Programming Appendix B– Progranimate Images & Class Structure
- 328 -
Help
This package contains or links to the help documentation of Progranimate.
Class Description
AboutScreen A dialog box providing author contact and copyright information.
HelpManual Uses an application frame which displays Progranimate’s manual which is written in HTML.
Language Translator
A set of classes which define the syntax rules, symbols, commands and semantics of various languages. Each class is capable of generating lines of syntax for the various programming constructs implemented by Progranimate
Class Description
CodeTranslator An abstract class that all language implementations extend.
Java Translator Implements a subset of the Java language.
VisualBasicTranslator Implements a subset of the VisualBasic.NET language.
VisualBasic6Translator Implements a subset of the VisualBasic 6 language.
….. There are many other language implementations possible.
MainGUI
A package that consists of all of Progranimate’s non program related user interface features.
Class Description
Console Forms the IO console of Progranimate.
ComponentDefinition Forms the various definition panels that are used to define components such as the Print, Read, Assign and If etc.
ComponentIfo Forms the component info panel that displays data about the currently selected component. Appears below the workspace.
Menus The drop down menu options that appear at the top of Progranimate’s user interface. The handling for the menu selections is managed by the CurrentSettings class of the Settings package.
Palette The palette of programming components seen on the left of Progranimate’s user interface. It handles button clicks and tells the workspace controller class of the last palette button pressed.
ToolBar Defines the tool bar that is positioned above the workspace. The handling of its buttons and controls is managed by CurrentSettings class of the Settings package.

Flowcharts, Code and Animation in Novice Programming Appendix B– Progranimate Images & Class Structure
- 329 -
Program Components:
This package forms the core data model behind the programs of Progranimate and utilises the composite design pattern.
Class Description
Assign An assignment component type which consists of a single assignment expression.
Components Forms the abstraction of all program components, which extend from this class.
Comp Represents a component that can have child components. All components that can have child components extend from this class.
For Defines the for loop component which contains multiple expressions i.e. initialise, condition and update.
If Defines the If or If_Else component which contains a single Boolean expression.
Leaf All components that have no children extend from this class.
Link Defines a link component, can be used to represent any type of link.
Print Defines a print component and contains one expression.
Read Defines a read component which contains a reference to only one program variable or array element.
Starter Defines the starter component and is used to store the program name
Terminator Defines the terminator component which marks the end of the program.
While Defines the while loop component and can contain one Boolean expression.
ProgramVariables
This package forms the data structure, controlling classes and visual presentation of the program variables.
Class Description
ArrayEditor Creates the dialog box used for defining and editing arrays.
ArrayTable Defines and displays an array inspector with a table based layout. It also handles user interaction which gets delegated to the VariableConroller class.
ProgramArrays Defines the data type that represents an array in Progranimate, i.e. the name, data type and a list of elements.
ProgramVariables Defines the data type that represents an single program variable.
VariableController Forms the controlling class for the ProgramVariables package. Receives commands from the Workspace controller. Handles user interaction with the variable inspector and passes commands over to the Workspsce controller class.
VariableEditor Creates the dialog box used for defining and editing variables.
VariableTable Defines and displays the variable inspector with a table style layout. It also handles user interaction which gets delegated to the VariableController class.
VariableTree Defines and displays a variable and array inspector with a tree based layout. It also handles user interaction which gets delegated to the VariableConroller class.
VariableView The panel which contains either the VariableTable and ArrayTable or the VariableTree type variable/array inspectors.

Flowcharts, Code and Animation in Novice Programming Appendix B– Progranimate Images & Class Structure
- 330 -
Settings
The package stores and manages all of Progranimate’s settings.
Class Description
CurrentSettings Stores and controls access to all of Progranimate’s settings. Also implements event handlers for the Menu and ToolBar of the MainGUI package.
SettingsPanel Forms the settings panel which is used to set many of the advanced settings of progranimate.
Utilities
This package consists of three helper classes which have roles in various parts of Progranimate and do not fit in any particular package.
Class Description
Memento Maintains a copy of the program and variable data so that any changes made to a program or its variables can be undone.
ProgramHelper Contains a library of procedures that are used commonly throughout many classes in Progranimate.
Serialiser The mechanisms for saving and loading program data and settings to and from file.

Flowcharts, Code and Animation in Novice Programming Appendix C– Example Programming Problems
- 331 -
APPENDIX C Example Programming Problems
CONTENTS
A.A Pedagogy Stage B2 Worksheet Example ........................................................................................... 332
A.B Pedagogy Stage C and D Worksheets Examples ............................................................................... 337
DESCRIPTION: This appendix provides the example worksheets from the online activities that encompass the
problem solving pedagogy, as discussed in chapter 5. Shown is a pedagogy stage B2 introductory
worksheet and one activity pack consisting of five problems that form pedagogy sages C1 to D.
To see more worksheets and activity packs visit Progranimate’s website (Scott, 2009b);
http://www.glam.ac.uk/Progranimate.

Flowcharts, Code and Animation in Novice Programming Appendix C– Example Programming Problems
- 332 -
C.A Pedagogy Stage B2 Worksheet Example
The following five pages show and example of a pedagogy stage B2 worksheet, designed to
introduce new programmers to Progranimate and problem solving.

Flowcharts, Code and Animation in Novice Programming Appendix C– Example Programming Problems
- 333 -

Flowcharts, Code and Animation in Novice Programming Appendix C– Example Programming Problems
- 334 -
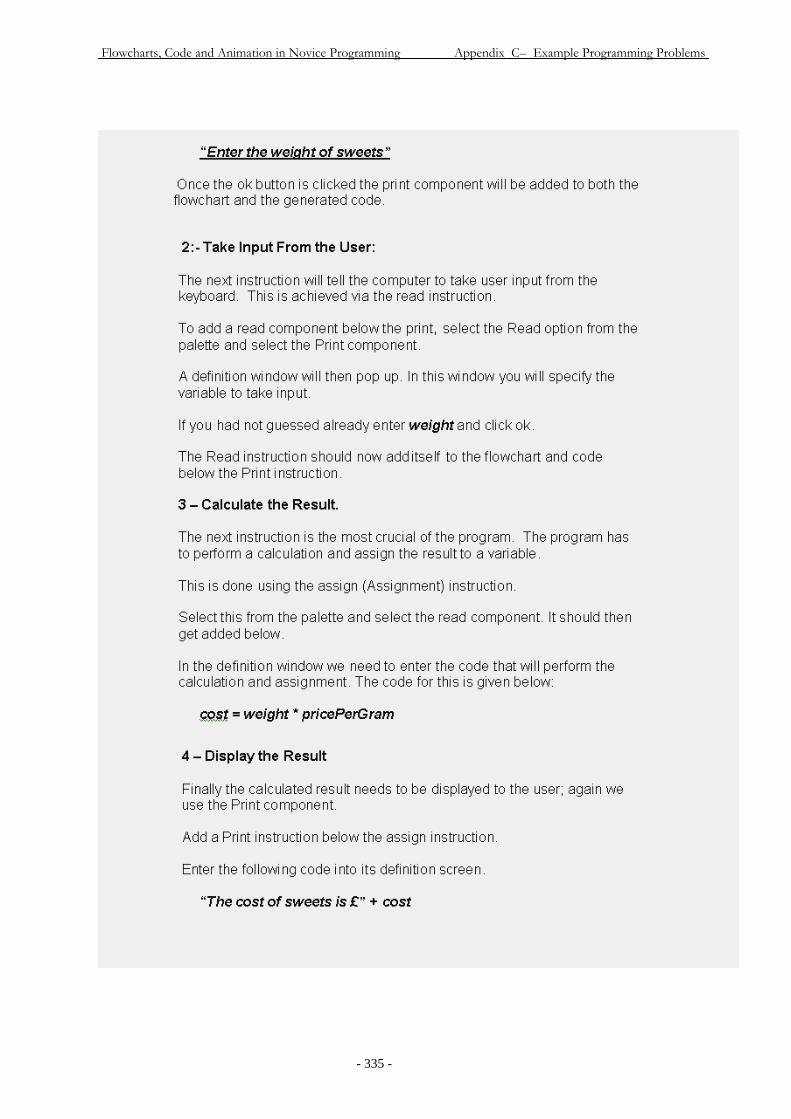
Flowcharts, Code and Animation in Novice Programming Appendix C– Example Programming Problems
- 335 -

Flowcharts, Code and Animation in Novice Programming Appendix C– Example Programming Problems
- 336 -

Flowcharts, Code and Animation in Novice Programming Appendix C– Example Programming Problems
- 337 -
C.B Pedagogy Stage C and D Worksheets Examples
In this section are example of the stage C and D worksheets of the problem solving pedagogy
from the Cardiff Animal Shelter Activity pack.

Flowcharts, Code and Animation in Novice Programming Appendix C– Example Programming Problems
- 338 -

Flowcharts, Code and Animation in Novice Programming Appendix C– Example Programming Problems
- 339 -

Flowcharts, Code and Animation in Novice Programming Appendix C– Example Programming Problems
- 340 -

Flowcharts, Code and Animation in Novice Programming Appendix C– Example Programming Problems
- 341 -

Flowcharts, Code and Animation in Novice Programming Appendix D– Study 1 and 2 Exercises
- 342 -
APPENDIX D Study 1 and 2 Exercises
CONTENTS
D.A Study 1 Materials ............................................................................................................................... 343
D.B Study 2 Materials ............................................................................................................................... 344 DESCRIPTION: This appendix provides examples of the programming exercises provided to the evaluators of
Progranimate study 1, which evaluated version 1.0 and study 2, which evaluated version 2.0.

Flowcharts, Code and Animation in Novice Programming Appendix D– Study 1 and 2 Exercises
- 343 -
D.A Study 1 Materials
For evaluation study 1, after being shown how to use Progranimate v1.0 and walked though the
construction of a simple program, the evaluators were tasked with solving one simple
programming problem as follows:
Progranimate Evaluation Exercise From what you have learnt when shown how to use Progranimate, use the programming tool to construct a simple program to solve the following two problems: Problem 1
Write a program to calculate the area of a square by taking in two values from the
user, calculate the answer, and display the result.
Problem 2
Mrs Smith sells apples at £0.27p each. Write a program to prompt the user for
how many apples they want, take input of a quantity and then output the total
cost.
Please feel free to ask questions and take your time over the solution.

Flowcharts, Code and Animation in Novice Programming Appendix D– Study 1 and 2 Exercises
- 344 -
D.B Study 2 Materials
For evaluation study 2, after being shown how to use Progranimate and walked though the
construction of a simple program, the evaluators were tasked with solving three simple
programming problems. The problems cover selection and decisions (If structures). They were
designed to evaluate Progranimate’s (v2.0) nesting capabilities, which at the time of the study were
new.
Progranimate Evaluation Exercises
You have now been shown how to use Progranimate and completed some example programs with the teacher. Now put what you have learnt into practice by producing programs to solve these programming problems.
Problem One (in 2 parts)
Part one Using Progranimate create a program that prompts the user to enter and age and displays the number of years they have until retirement, given that the age of retirement is 65. Part Two In the U.K. the retirement age for men and women is different. Men retire at 65 and women at 60. Think about how we can handle this by extending the program further and then develop a solution.
Problem Two (if time permits) Create a program that prompts the user to input an age. The program then calculates and displays the classification for that age based on the ranges below.
Classification Age Range
Baby 0-2
Child 3 -12
Teenager 13 - 17
Adult 18 - 65
Pensioner 65 +

Flowcharts, Code and Animation in Novice Programming Appendix E– Study 3: Bridgend Evaluation
- 345 -
APPENDIX E – Study 3 - Bridgend Evaluation
CONTENTS
E.A Full Usability Questionnaire Results ................................................................................................. 346
E.A.A Efficacy Questionnaire Comments: .......................................................................................... 347
E.A.B Usability Questionnaire Results Grouped by Attendance: ....................................................... 349
E.B Full Efficacy Questionnaire Results .................................................................................................. 350
E.A.C Efficacy Questionnaire Comments ........................................................................................... 351
E.A.D Efficacy Questionnaire Results Grouped by Attendance: ........................................................ 352
E.C Complete Problem Statistics: ............................................................................................................. 353
E.A.E Complete List of Problem Comments: ..................................................................................... 355
E.D Complete Interview Transcripts ......................................................................................................... 358
DESCRIPTION: This appendix provides all of the information retrieved in the first Bridgend Evaluation. It is
organised into sub sections A to D.
Section A provides the statistics gained from the usability questionnaire which includes: the Likert
responses of each evaluator; the written responses of the evaluators where given and finally the
questionnaire results grouped by attendance.
Section B provides the statistics gained from the efficacy questionnaire which includes: the Likert
responses of each evaluator; the written responses of the evaluators where given and finally the
questionnaire results grouped by attendance.
Section C contains a complete list of completion and attempt statistics for the problem solving
activities. Written on the back of every problem solving worksheet was space for the evaluators to
leave comments on any difficulties they encountered and any help received either from friends or
the tutor. These written responses were very insightful and so are also included in this section.
Also included are graphs for the correlation between the number of problems solved per session
and the students’ responses to usability questions one and eight as discussed in section 3.6.10 part
D of the first Bridgend college usability study.
Section D contains complete transcripts from the tape recorded semi structured interviews
conducted in the last week of the evaluation. These have been included because they are very
insightful and worth a read and because they are regularly referred to in section 3.6.10.
For data protection, where particular evaluators are mentioned, their names have been abbreviated
to two or three letter codes.

Flowcharts, Code and Animation in Novice Programming Appendix E– Study 3: Bridgend Evaluation
- 346 -
E.A Full Usability Questionnaire Results
Q1: Progranimate is easy to use. Q2: Progranimate is fun to use . Q3: My first impressions were good. Q4: Adding, Editing and Deleting components was easy to do. Q5: The expressions (code) entered when creating components was easy to use and remember. Q6: Adding and editing variables was easy. Q7: Saving and loading programs was easy and trouble free. Q8: The function of each button slider and menu option etc. was very clear to me. Q9: Progranimate was speedy and responsive. Q10: User errors are handled correctly. Q11: The error messages generated by Progranimate were meaningful and helpful. Q12: Progranimate functioned reliably. Q13: Progranimate is suitable for beginners.
A Complete Table Usability Questionnaire Responses
Evaluator Q1 Q2 Q3 Q4 Q5 Q6 Q7 Q8 Q9 Q10 Q11 Q12 Q13
TG 2 3 1 1 1 2 2 3 2 2 1 2 1
NS 2 2 2 2 0 2 2 1 2 2 2 2 1
RF 2 2 1 1 2 3 3 1 2 2 1 3 2
LJ 2 2 2 3 3 2 3 2 2 2 3 2 3
CL 1 2 2 2 1 2 2 1 2 2 1 3 3
CS 1 2 2 2 1 2 2 1 2 2 2 1 2
SLD 1 3 2 2 1 1 3 2 2 2 1 2 2
AM 2 2 2 1 1 1 2 2 2 2 1 2 2
SD 2 3 1 2 2 1 2 2 2 2 2 2 2
SA 1 3 1 2 1 2 2 1 2 2 1 1 1
NB 2 2 1 2 0 2 2 3 1 0 0 2 1
LJS 2 3 2 3 2 2 3 2 2 2 3 2 2
SB 2 2 0 2 1 2 3 2 0 1 3 1 2
LL 1 1 1 1 1 1 2 1 2 1 2 2 1
CE 1 1 0 3 1 1 3 1.5 1 1.5 0 1 1
MT 2 2 2 3 2 2 3 1 2 1 2 2 1
JD 2 3 0 2 1 2 2 2 1 2 2 2 2
TB 2 3 1 3 2 3 3 3 2 2 3 2 2
JE 1 2 1 1 2 2 2 0 2 n 1 1 1
DW 1 2 2 2 2 2 3 2 2 2 2 1 1
AM 1 3 3 2 1 3 3 2 1 2 1 2 1
BE 2 3 2 3 1 3 3 2 1 1 2 2 2
IB 1 2 2 1 2 0 2 2 1 2 2 2 2
RP 2 3 2 2 3 1 2 1 3 1 2 2
Average 1.58 2.33 1.46 2.00 1.42 1.83 2.46 1.69 1.65 1.76 1.63 1.83 1.67
StDev 0.50 0.64 0.78 0.72 0.78 0.76 0.51 0.75 0.57 0.60 0.88 0.56 0.64
Mode 2 2 2 2 1 2 2 2 2 2 1 2 2
Median 2 2 2 2 1 2 2 2 2 2 2 2 2
% Average 52.78 77.78 48.61 66.67 47.22 61.11 81.94 56.25 55.07 58.70 54.17 61.11 55.56
% StdDev 16.79 21.23 25.97 24.08 25.85 25.38 16.97 24.97 19.09 20.02 29.18 18.82 21.23
%Mode 66.67 66.67 66.67 66.67 33.33 66.67 66.67 66.67 66.67 66.67 33.33 66.67 66.67
%Median 66.67 66.67 66.67 66.67 33.33 66.67 66.67 66.67 66.67 66.67 66.67 66.67 66.67

Flowcharts, Code and Animation in Novice Programming Appendix E– Study 3: Bridgend Evaluation
- 347 -
E.A.A Usability Questionnaire Comments:
Q1 Comments – Progranimate is easy to use LJ: It was fiddly at times. LL: VB is easy. JD: At the start I found it quite difficult, but now I understand what I’m doing and find it easier as I progress. TB: I think its quite easy to use. JE: It is not clear how to use.
Q2 Comments – Progranimate is fun to use LL: Its boring.
Q3 Comments – My first impressions were good LJ: Design of the program made it easy to use. JD: I did not want to do it, but now I’m starting to like using it as I have a better understanding. TB: I didn’t like the program at the beginning, I thought it was hard. JE: I’ve no idea how to delete unneeded items.
Q4 Comments – Adding, editing and deleting components was easy to do? LJ: The components were easy to use. LL: It’s much harder than VB. CE: Everything. JD: I didn’t understand how to use them at first, but using this program now, I know how to use them.
Q5 Comments – The expressions (code) entered when creating components was easy to use and remember JD: I wouldn’t remember them off by heart, but I’d understand them by looking and reading them.
Q6 Comments – Adding and editing variables was easy? LL: In VB it gives you a list. TB: It was just the click of a button.
Q7 Comments – Saving and loading programs was easy and trouble free TB: It was easy to do.
Q8 Comments – The function of each button and slider and menu option etc was very clear to me CE: 50/50. JD: I know exactly what they were by their name.

Flowcharts, Code and Animation in Novice Programming Appendix E– Study 3: Bridgend Evaluation
- 348 -
Q9 Comments – Progranimate was speedy and responsive LL: Slow to load from internet. JD: It takes a while to load but once on it’s fast.
Q10 Comments – User errors are handled correctly CE: 50/50 didn’t get much chance. JE: I don’t know.
Q11 Comments – The error messages generated by Progranimate were meaningful and helpful. JD: Told me exactly what was wrong with the program. TB: They said what you had done wrong.
Q12 Comments – Progranimate functioned reliably No comments made
Q13 Comments – Progranimate is suitable for beginners LL: Quite hard to use. JD: Yes, with a bit of help and information needed.

Flowcharts, Code and Animation in Novice Programming Appendix E– Study 3: Bridgend Evaluation
- 349 -
E.A.B Usability Questionnaire Results Grouped by Attendance:
All Evaluators % Actual Values
Q Average Std Dev Mode Median Average Std Dev Mode Median 1 56.67 16.10 66.67 66.67 1.70 0.48 2.00 2.00
2 86.67 17.21 100.00 100.00 2.60 0.52 3.00 3.00
3 44.44 29.59 33.33 33.33 1.33 0.89 1.00 1.00
4 61.11 23.92 66.67 66.67 1.83 0.72 2.00 2.00
5 48.48 17.41 33.33 33.33 1.45 0.52 1.00 1.00
6 70.00 24.60 66.67 66.67 2.10 0.74 2.00 2.00
7 86.67 17.21 100.00 100.00 2.60 0.52 3.00 3.00
8 66.67 22.22 66.67 66.67 2.00 0.67 2.00 2.00
9 53.33 23.31 66.67 66.67 1.60 0.70 2.00 2.00
10 60.00 14.05 66.67 66.67 1.80 0.42 2.00 2.00
11 60.00 26.29 33.33 66.67 1.80 0.79 1.00 2.00
12 66.67 22.22 66.67 66.67 2.00 0.67 2.00 2.00
13 63.33 18.92 66.67 66.67 1.90 0.57 2.00 2.00
Evaluators Attending Two or More Sessions % Actual Values
Q Average Std Dev Mode Median Average Std Dev Mode Median 1 52.17 16.90 66.67 66.67 1.57 0.51 2.00 2.00
2 78.26 21.58 66.67 66.67 2.35 0.65 2.00 2.00
3 49.28 26.34 66.67 66.67 1.48 0.79 2.00 2.00
4 66.67 24.62 66.67 66.67 2.00 0.74 2.00 2.00
5 49.28 24.35 33.33 33.33 1.48 0.73 1.00 1.00
6 60.87 25.92 66.67 66.67 1.83 0.78 2.00 2.00
7 82.61 17.03 66.67 66.67 2.48 0.51 2.00 2.00
8 54.35 23.69 66.67 66.67 1.63 0.71 2.00 2.00
9 56.06 18.93 66.67 66.67 1.68 0.57 2.00 2.00
10 61.36 15.76 66.67 66.67 1.84 0.47 2.00 2.00
11 56.52 27.40 33.33 66.67 1.70 0.82 1.00 2.00
12 60.87 19.21 66.67 66.67 1.83 0.58 2.00 2.00
13 56.52 21.17 66.67 66.67 1.70 0.63 2.00 2.00
Evaluators Attending Three Or More Sessions
% Actual Values
Q Average Std Dev Mode Median Average Std Dev Mode Median 1 56.67 16.10 66.67 66.67 1.70 0.48 2.00 2.00
2 86.67 17.21 100.00 100.00 2.60 0.52 3.00 3.00
3 44.44 29.59 33.33 33.33 1.33 0.89 1.00 1.00
4 61.11 23.92 66.67 66.67 1.83 0.72 2.00 2.00
5 48.48 17.41 33.33 33.33 1.45 0.52 1.00 1.00
6 70.00 24.60 66.67 66.67 2.10 0.74 2.00 2.00
7 86.67 17.21 100.00 100.00 2.60 0.52 3.00 3.00
8 66.67 22.22 66.67 66.67 2.00 0.67 2.00 2.00
9 53.33 23.31 66.67 66.67 1.60 0.70 2.00 2.00
10 60.00 14.05 66.67 66.67 1.80 0.42 2.00 2.00
11 60.00 26.29 33.33 66.67 1.80 0.79 1.00 2.00
12 66.67 22.22 66.67 66.67 2.00 0.67 2.00 2.00
13 63.33 18.92 66.67 66.67 1.90 0.57 2.00 2.00

Flowcharts, Code and Animation in Novice Programming Appendix E– Study 3: Bridgend Evaluation
- 350 -
E.B Full Efficacy Questionnaire Results
Q1: Progranimate enabled me understand how a program works and runs better than before. Q2: Progranimate made it easier to see how the individual parts of a program interact to achieve its purpose. Q3: I had problems understanding the flowcharts. Q4: The flowchart visualisation helped me when developing the solution. Q5: I preferred looking at the computer code than looking at the flowchart. Q6: I found the flowcharts easier to understand than the code . Q7: I understood the relationship between the flowchart and the code. Q8: If I could use flowcharts to create and animate programs in my usual programming environment I would make use of the feature. Q9: Program animation is a good and useful feature. Q10: The animations helped me debug my code and develop a working solution. Q11: The variable inspector was a very useful feature. Q12: The tool made it easier for me program. Q13: Progranimate enabled me to develop correct programs faster than before. Q14: I feel I have learnt something by using Progranimate. Q15: My knowledge of programming has been strengthened by using Progranimate. Q16: I would recommend Progranimate to friends who wanted to learn programming.
Evaluators Q1 Q2 Q3 Q4 Q5 Q6 Q7 Q8 Q9 Q10 Q11 Q12 Q13 Q14 Q15 Q16
TG 2 1 1 2 3 1 2 2 2 1 0 1 1 2 2 2
NS 2 1 2 1 1 2 2 1 2 1 2 2 2 1 1 2
RF 2 2 1 2 2 1 3 1 2 2 1 2 2 2
LJ 2 2 2 2 3 1 2 1 2 2 3 2 1 3 2 2
CL 1 2 0 2 1 3 1 2 2 2 1 1 1 1 1 3
CS 1 2 2 1 2 2 2 2 2 1 1 1 1 1 1 2
SLD 1 1 0 3 0 3 2 3 2 2 1 1 1 1 1 1
AM 2 1 1 2 1 2 2 2 2 1 2 2 1 1 1 2
SD 2 2 1 3 1 3 2 2 2 2 2 2 2 2 2 2
SA 0 2 1 1 2 1 1 1 2 1 2 2 1 2 2 2
NB 0 2 2 1 3 3 1 2 1 2 1 0 3
LJS 1
SB 1 2 0 3 2 2 2 3 1 1 2 2 2 1 2 1
LL 1 1 2 2 3 1 1 1 1 1 1 1 1 1 1 1
CE 1 1 1 1 1 1 1 1 1 1 1 1 1 1 1 1
MT 1 2 2 2 1 2 2 2 3 2 1 2 2 1 1 1
JD 2 2 0 3 1 3 2 3 3 2 2 2 2 2 2 2
TB 2 2 0 3 0 3 2 2 2 2 2 3 3 2 3
JE 1 2 2 3 2 2 2 2 2 2 2 2 2 2 2 2
GL 3
DW 2 1 1 2 3 2 2 1 2 2 1 1 2 1 1 1
AM 1 1 1.5 2 1 1 2 2 1 1 1 2 2 1 1
BE 1 2 1 2 2 0 2 2 2 2 2 2 1 0 0 1
IB 1 1 1 2 3 1 1 1 1 2 2 1 0 1 1 2
RP 2 2 2 3 1 2 1 3 2 3 1 3 1 3 2 2
Average 1.35 1.59 1.13 2.11 1.65 1.83 1.78 1.78 1.91 1.65 1.55 1.64 1.41 1.52 1.35 1.78
StDev 0.65 0.50 0.76 0.71 0.93 0.89 0.60 0.74 0.53 0.57 0.74 0.58 0.67 0.79 0.65 0.67
Mode 1 2 1 2 1 1 2 2 2 2 1 2 1 1 1 2
Median 1 2 1 2 2 2 2 2 2 2 1.5 2 1 1 1 2
% Average 44.93 53.03 37.68 70.29 55.07 60.87 59.42 59.42 63.64 55.07 51.52 54.55 46.97 50.72 44.93 59.42
% StdDev 21.58 16.77 25.23 23.55 31.15 29.56 19.99 24.53 17.55 19.09 24.62 19.37 22.20 26.34 21.58 22.38
%Mode 33.33 66.67 33.33 66.67 33.33 33.33 66.67 66.67 66.67 66.67 33.33 66.67 33.33 33.33 33.33 66.67
%Median 33.33 66.67 33.33 66.67 66.67 66.67 66.67 66.67 66.67 66.67 50.00 66.67 33.33 33.33 33.33 66.67

Flowcharts, Code and Animation in Novice Programming Appendix E– Study 3: Bridgend Evaluation
- 351 -
E.B.A Efficacy Questionnaire Comments
Question 1 Comments – Progranimate enabled me to understand how a program works and runs better than before. TB: It shows the program clearly. Question 3 Comments – Progranimate made it easier for me to see how the individual parts of a program interact to achieve its purpose. TB: I thought they were easy to understand.
Question 4 Comments – I had problems understanding the flow charts. TB: When I saw the flowchart it gave me a better idea how to solve it.
Question 8 Comments – If I could use flowcharts to create and animate programs in my u programming environment I would make use of this feature. JD: I understand the flowcharts more than coding. TB: I think its clearer than code.
Question 9 Comments – Program animation is a good and useful feature. JD: You have a better understanding with images than words.
Question 11 Comments – The variable inspector was a very useful feature. RF: Don’t know what it is. JD: Whenever I have done something wrong it would let me know. GL: You could see them clearly if you wanted to use them.
Question 12 Comments – The tool made it easier for me to program. JD: Instead of writing out each piece of code the program did it for you.
Question 13 Comments – Progranimate enabled me to develop correct programs faster then before. JD: If I used VB then it would have taken a lot longer, but this is 10 times faster when you understand what you are doing. TB: I completed the problems quite quick once I knew what I was doing.
Question 16 Comments – I would recommend Progranimate to friends who wanted to learn programming. SLD: Only if they have not used VB before. TB: I enjoyed it.

Flowcharts, Code and Animation in Novice Programming Appendix E– Study 3: Bridgend Evaluation
- 352 -
E.B.B Efficacy Questionnaire Results Grouped by Attendance:
All Evaluators
% Actual Values
Q Average Std Dev Mode Median Average Std Dev Mode Median 1 44.93 21.58 33.33 33.33 1.35 0.65 1 1
2 53.03 16.77 66.67 66.67 1.59 0.50 2 2
3 37.68 25.23 33.33 33.33 1.13 0.76 1 1
4 70.29 23.55 66.67 66.67 2.11 0.71 2 2
5 56.06 31.15 33.33 66.67 1.65 0.93 1 2
6 60.87 29.56 33.33 66.67 1.83 0.89 1 2
7 59.42 19.99 66.67 66.67 1.78 0.60 2 2
8 59.42 24.53 66.67 66.67 1.78 0.74 2 2
9 63.64 17.55 66.67 66.67 1.91 0.53 2 2
10 55.07 19.09 66.67 66.67 1.65 0.57 2 2
11 51.52 24.62 33.33 50.00 1.55 0.74 1 1.5
12 54.55 19.37 66.67 66.67 1.64 0.58 2 2
13 46.97 22.20 33.33 33.33 1.41 0.67 1 1
14 50.72 26.34 33.33 33.33 1.52 0.79 1 1
15 44.93 21.58 33.33 33.33 1.35 0.65 1 1
16 59.42 22.38 66.67 66.67 1.78 0.67 2 2
Evaluators Attending Two or More Sessions % Actual Values
Q Average Std Dev Mode Median Average Std Dev Mode Median 1 46.97 19.68 33.33 33.33 1.41 0.59 1 1
2 53.03 16.77 66.67 66.67 1.59 0.50 2 2
3 36.36 25.01 33.33 33.33 1.09 0.75 1 1
4 70.45 24.09 66.67 66.67 2.11 0.72 2 2
5 57.14 31.52 33.33 66.67 1.68 0.95 1 2
6 59.09 28.97 33.33 66.67 1.77 0.87 1 2
7 57.58 18.35 66.67 66.67 1.73 0.55 2 2
8 60.61 24.42 66.67 66.67 1.82 0.73 2 2
9 63.64 17.55 66.67 66.67 1.91 0.53 2 2
10 54.55 19.37 66.67 66.67 1.64 0.58 2 2
11 52.38 24.88 66.67 66.67 1.57 0.75 2 2
12 53.97 19.65 66.67 66.67 1.62 0.59 2 2
13 46.97 22.20 33.33 33.33 1.41 0.67 1 1
14 51.52 26.68 33.33 33.33 1.55 0.80 1 1
15 46.97 19.68 33.33 33.33 1.41 0.59 1 1
16 57.58 21.04 66.67 66.67 1.73 0.63 2 2
Evaluators Attending Three Sessions % Actual Values
Q Average Std Dev Mode Median Average Std Dev Mode Median 1 53.33 17.21 66.67 66.67 1.60 0.52 2 2
2 56.67 16.10 66.67 66.67 1.70 0.48 2 2
3 16.67 17.57 33.33 16.67 0.50 0.53 1 0.5
4 83.33 17.57 66.67 83.33 2.50 0.53 2 2.5
5 50.00 36.00 66.67 50.00 1.50 1.08 2 1.5
6 70.00 36.68 100.00 83.33 2.10 1.10 3 2.5
7 66.67 15.71 66.67 66.67 2.00 0.47 2 2
8 70.00 24.60 66.67 66.67 2.10 0.74 2 2
9 66.67 15.71 66.67 66.67 2.00 0.47 2 2
10 60.00 14.05 66.67 66.67 1.80 0.42 2 2
11 45.83 24.80 66.67 50.00 1.38 0.74 2 1.5
12 51.85 17.57 66.67 66.67 1.56 0.53 2 2
13 53.33 23.31 33.33 50.00 1.60 0.70 1 1.5
14 50.00 28.33 66.67 50.00 1.50 0.85 2 1.5
15 50.00 23.57 66.67 66.67 1.50 0.71 2 2
16 60.00 26.29 66.67 66.67 1.80 0.79 2 2

Flowcharts, Code and Animation in Novice Programming Appendix E– Study 3: Bridgend Evaluation
- 353 -
E.C Complete Problem Statistics:
Correlation Between the Average Number of Problems Per Week and Responses to Usability Q1

Flowcharts, Code and Animation in Novice Programming Appendix E– Study 3: Bridgend Evaluation
- 354 -
0
0.5
1
1.5
2
2.5
3
TGNS RF LJ CL
CSSLD AM SD SA NB
LJS
SB LL CE MT
EM JD TB JEDWAM
N BE IB RP
Ave Pobs Per Wk
Q1 Score
Correlation Between the Average Number of Problems Per Week and Responses to Usability Q8
0
0.5
1
1.5
2
2.5
3
3.5
1 3 5 7 9 11 13 15 17 19 21 23
Probs Per Sesion
Responce
Correlation: 0.31
Correlation:- 0.08
probs
response
session

Flowcharts, Code and Animation in Novice Programming Appendix E– Study 3: Bridgend Evaluation
- 355 -
E.C.A Complete List of Problem Comments:
E.C.A.A Problem 1A Comments:
Did you have any problems completing this task? If so what were they? MJ: I did not know where one line of code went. LJ: Nothing difficult but needed to know what code went where. RF: The only problem was one of the times of code was confusing to actually input since the variable was wrong . **he spotted a typographical error which was soon fixed and the class made aware** CL: Did not understand what we had to do. CS: Yes, I found it hard creating the code. SLD: I had some difficulties because I didn’t know what commands to use. ME: A tad bit. SD: I found the program was really hard to navigate at first, but it was ok. SDS: No, I helped the team. AM: Understanding how to correctly tackle some of the questions, e.g. how to code the program. SA: Didn’t know how to use the program. LJS: No, I found it easy to complete. NB: No, the program was quite easy to use. SB: I did not understand it at first and the teacher went over it for me to understand better, it went well after that. CE: How to use the program. EM: It started as difficult but after realising what I actually needed to did it was much easier. I found it easier to understand and complete the problem when treated like a real situation. JD: Yes I didn’t understand what had to go where. TB: Yes I got confused where each piece of the code had to go. JE: I got lost in some parts. GL: When editing variables I did not remember what variable type was selected originally when the variable was defined. DW: Yes, I didn’t understand what the task was about. I didn’t know what to input into the program. DWS: I didn’t fully understand the problem. I got lost, I didn’t understand the sheet. DM: No, the program was quite easy to use. AMN: I attempted the problem but time was limited. RP: I didn’t fully understand and needed some help off friends, but that was partly because I was not in last week. Un-named Sheet: The program was quite easy to use. Did you require any help from friends? If so what did they help with? MJ: Yes, I asked where one part of code went. LJ: Needed help with last line of code. RF: I asked where one line of code went. CL: Yes, they had to explain to me what to do. CS: Yes, they helped me with the code. SLD: Yes, to insert a component from the command button in the right place. AM: They helped with the code for my program and where the component went. SA: What some of the buttons do. LJS: Yes, editing it. JD: Yes, I needed help with what to do. TB: Yes, where the code had to go. JE: No, none of us knew what to do. DW: Yes, inputs and position of components. DM: I did require a little help, but it was a simple mistake. AMN: Yes, LL next to me was very good at understanding this problem. BE: Yes, the assigns were in the wrong order. RP: Yes, most of it, but in the end I was OK.

Flowcharts, Code and Animation in Novice Programming Appendix E– Study 3: Bridgend Evaluation
- 356 -
Did you get any help from the tutor or teaching staff? MJ: Needed the right part of the code. CL: Yes, he had to explain to me what to do and what to type in to complete the task. SLD: The teacher explained the task to make the task easier. AM: With the programming in general. SA: With programming in general. SB: Yes, I did to understand it better. CE: How to use the program. EM: He told me to treat it as a real problem where people are talking. JD: Yes, I needed help with what to do. TB: Yes, he helped me in the end as I was still confused. JE: Yes, #Teacher Name# pointed us in the right direction. GL: Doing an edit to the components. Order of the processes. DW: Yes, where the order of the Prints and Reads had to go. DWS: #Teacher Name# told me a bit. DM: No, I did not require any further help. Other notes: EM: Very good program makes programming much simpler.
E.C.A.B Problem 1B Comments:
Did you have any problems completing this task? If so what were they? LJ: Knowing what order to put what first. TG: Confusion over a variable. RF: Not really it just needed some thought. CS: I had problems knowing which code went where. ME: Problem solving issues. SB: Names. EM: I ran out of time, I was ok with the problem. I think ten more minutes I would have completed the problem. JD: I didn’t understand what to do. TB: The code. I found the task was easy to complete. GL: Got confused where each piece of the code had to go. BE: Yes just to help put the assigns in order. Did you require any help from friends? If so what did they help with? LJ: Help with a line of code. CS: Yes, they helped me with the code. ME: To sort out some of the variables. SB: Yes, to put the names in the right order. JD: I didn’t ask this time. GL: Yes, where the code had to go. Did you get any help from the tutor or teaching staff? JD: I didn’t ask this time. GL: Yes, he helped me in the end, as I was still confused.
E.C.A.C Problem 1C: Comments
Did you have any problems completing this task? If so what were they? LJ: I did not know how to lay out the program. TG: A slight confusion adding a new total variable, was easily resolved.

Flowcharts, Code and Animation in Novice Programming Appendix E– Study 3: Bridgend Evaluation
- 357 -
JD: I found it easier to do this time. TB: I found the problems were easier the more you do. AMN: I had no difficulties completing the task. RP: No, I found it quite easy this time, as I understood it better now. Did you require any help from friends? If so what did they help with? LJ: Yeah, I had some help from friends. RF: Just checked my program out against someone else’s. JD: No, I didn’t need help from anyone. AMN: No help was needed. Did you get any help from the tutor or teaching staff? JD: No, I didn’t need help from anyone. AMN: No help was needed.
E.C.A.D Problem 2A Comments
Did you have any problems completing this task? If so what were they? TG: I was not sure if the first If_Else command could replace the first assign component. RF: Understanding the assign placement was confusing. SB: Doing the If but it worked out. JD: No, I understood what to do. TB: Not really, the only problem I had was inputting the ‘Assign’ component between the If statement. RP: No, it was easy. Did you require any help from friends? If so what did they help with? TG and I worked on the problem. JD: I had a little help but understood what to do once I got going. RP: A little help with the assign part. Did you get any help from the tutor or teaching staff? RF: We asked about some assign components and their placement in the program. SB: Yes, only to check I was doing it right. JD: No, I didn’t.
E.C.A.E Problem 2B Comments
Did you have any problems completing this task? If so what were they? TG: Confusion with putting If statements within If statements RF: Yes, I found Ifs within Ifs difficult. Did you require any help from friends? If so what did they help with? TG: Yes, helped each other work out the problem stated above. RF: Yes, I needed someone else for this task, sharing ideas. Did you get any help from the tutor or teaching staff?

Flowcharts, Code and Animation in Novice Programming Appendix E– Study 3: Bridgend Evaluation
- 358 -
E.C.A.F Problem 2C Comments
Did you have any problems completing this task? If so what were they? Did you require any help from friends? If so what did they help with? Did you get any help from the tutor or teaching staff?
E.D Complete Interview Transcripts
Group1 Class1
Three Students: CL, SLD, AM
Did you enjoy using Progranimate?
CL: It was all right, it wasn‟t easy I suppose but all right.
SLD: I did enjoy it but it was quite hard to understand.
AM: It was all right but I found it a bit hard I did.
How did you find the problems I gave you, were they too hard or too easy?
CL: To hard, I just didn‟t know any of it, I didn‟t understand it or nothing. Too hard.
SLD: When I did the code it was quite hard, but when the processes were shown on each of the pictures it helped me a little
bit to do the code. The pictures helped me.
AM: I found some of the code a bit hard, but the flowchart helped me a bit, to understand more.
Did you find the experience boring in any way? Please be honest.
CL: No it was interesting, but because I have used VB I wouldn‟t want to use that one (Progranimate). If I hadn‟t used VB
in the beginning, I‟d use that one.
SLD: It‟s an experience, but I enjoyed it.
AM: I found it reasonably good, but I would prefer to do VB.
Is there any particular reason?
AM: Well I started with VB last year, and I‟m much more familiarised with it.
Did you find using the tool easy?
CL: No I just found the whole program hard, I just didn‟t know what was what, I didn‟t understand it.
SLD: In some coding you have to write a variable and some variables I don‟t know, so I got a bit confused.
So you had problems with the variables?
SLD: Yes.
And was that referencing the variables in the code?
SLD: Yes.

Flowcharts, Code and Animation in Novice Programming Appendix E– Study 3: Bridgend Evaluation
- 359 -
AM: Reasonably easy but like I said, because I use VB I am more familiar with that (VB) compared to this (Progranimate),
but this was pretty laid out as you can see.
It must have taken you a while to get the hang of the VB environment; was Progranimate any quicker to learn than the VB
environment?
AM: You could say, yeah.
Are you all in agreement with that?
All: Yeah.
Did you have any particular difficulties when using Progranimate, was there any one thing that stuck out as being particularly
difficult?
CL: The variables, I didn‟t know what to put in for the variables.
When you say variables, do you mean constructing the assignment statements?
CL: Yeah, what you had on the sheet that we had to put in I didn‟t understand it.
SLD: I didn‟t know what assign meant on the picture. **Points to assign component on screen and the button**
Do you have any ideas what we should call it?
SLD: No.
AM: As I got back to saying, I‟m used to VB. It was, you could say, clearly laid out apart from maybe variables like CL
said.
The problems you has to solve with the tool did you find those difficult at all? **Asked again**
CL: Yeah they were all right but the wording was not right for me, I needed it in simpler terms a little bit.
AM: I found that the instructions could be more clearly stated out on the paper.
How could they be improved do you reckon?
CL: I think they should be worded differently, like easier.
SLD: I‟m not to sure, the putting in order of what the code should be.
AM: I found the instructions were not clearly laid out, but I found them quite difficult to understand you know.
To much to take it all in sort of thing.
Can you think of a way I could have delivered the problems better? Would it have been better for me to demonstrate a few
more problems on the board first.
SLD: Yeah. It could help.
AM: Either with the white board or the smart board, yeah. It could help a bit.
Do you do a lot of problem solving of this nature in here?
AM: Not in this particular room, but in other rooms we do, yeah.
SLD: We do them in VB.
Do you get similar types of problems?
All: Yeah.
AM: In our teacher‟s lessons there is a presentation he does on the board. Before he tells us, he used to
anyway when we started at the course.
Can you give me some examples of the types of problems that you would get from the teacher?
AM: With IF statements, you get problems with if statements and there‟s other ones.
SLD: Like changing the background colour behind a command button.

Flowcharts, Code and Animation in Novice Programming Appendix E– Study 3: Bridgend Evaluation
- 360 -
Would these problems be put into any context, put into a kind of theme like I did? Or would they be straight
programming problems with no theme? For example, problems relating to a school, hospital or a fast food
restaurant?
CL: We have had themes, because we had the football one and seaside. They are put in themes for us.
When using the tool did you find the error messages that came up were good enough?
CL: Some were, but some were not easy to understand. They should be more simpler to understand.
Did you find that they gave you any clue as to what was wrong?
CL: Not at the start no.
SLD: The messages should say exactly what‟s wrong with the program.
Did you think they weren‟t doing that?
SLD: No.
AM: I found them maybe difficult to understand like SLD said, but I suppose they were all right. You could
maybe improve them by making them clearer.
Were they less cryptic than the ones in the Visual Basic environment?
AM: Ah yeah,
All: Yes.
SLD: It was a bit easier than Visual Basic.
AM: Visual Basic is a really technical language you know, really really technical.
Did you have any problems understanding the flowcharts on the screen?
CL: That‟s easier than VB because that can go step by step, you can see what‟s happening.
SLD: The flowcharts were easy but didn‟t know what some of the tools mean. So once I got it down and you explain it to
me I know roughly what it means.
AM: The flowcharts, I thought it was a good idea, but it helped me a bit maybe more than VB did. It was a pretty good
idea, yeah.
SLD: It ran though the commands, it was a lot easier than VB. When VB runs it doesn‟t show what is actually happening to
the program.
AM: It gives to a bit of a description of what‟s happening. When it is running it gives you a demonstration.
When developing your solutions to the problems what did you look at most, the flowcharts or the code?
CL: The flowchart.
SLD: The flowchart as well.
AM: Both really, looking across the split screen there.
What about during animation, when the program was running were you looking more at the flowcharts or code then?
CL: Um… probably the flowchart.
SLD: Both.
AM: Most of the time the flowchart, but occasionally the code.
Would you now use flowcharts to solve your own programming problems? Drawing them down like Progranimate does?
CL: Yeah I would it‟s easier to understand.
SLD: Yes I would use flowcharts yeah.
AM: I don‟t know, not really. I would like to understand it a little more before I used it.
Do you think that you have learnt anything from using the tool?

Flowcharts, Code and Animation in Novice Programming Appendix E– Study 3: Bridgend Evaluation
- 361 -
CL: Yeah a bit, not much. I understand VB more than this. If I was going back to this in a couple of weeks I wouldn‟t
know where to start again.
SLD: Yeah, I understood a little bit, but I understand more VB because I have been doing it for a longer period of time.
Had I have started with this I would have probably have known more.
AM: I understand VB a bit more than this because of the experience I have had with VB. It was reasonably easy to
understand.
Has Progranimate improved your programming abilities in any way?
CL: No I don‟t think so.
SLD: Some of the variables, have helped me with VB. So it helped me a little bit.
AM: I have to put my hands up no not really no. Not at all, that‟s just unfortunate but there you go.
Do you think that by using the tool your problem solving skills have increased?
All: Not really no.
Would you recommend the use of this tool to friends who wanted to learn programming?
CL: Yeah as beginners but not if they‟d been doing VB and then gone onto this.
SLD: Yeah I would its good for beginners, but if they had used VB before no I wouldn‟t.
AM: Yeah if for amatures that haven‟t used any programming language at all. I would recommend it to them but not the
people that are using programming software already; only to novices.
**END OF INTERVIEW**
Group 2- Class 1
Three Students: NS, SD and CS,
Did you enjoy using Progranimate?
NS: To be honest, no.
SD: It was all right.
CS: Yeah it was all right.
Did you find the problems I gave you too hard or too easy?
NS: The first one was easy, but then the other ones were hard. I‟m not the really maths genius type.
SD: In between.
CS: The first one was easy but the second one was too hard.
Do you get problems of this nature in the normal stuff you do with #Teacher Name#?
NS: Oh yeah definitely I get confused every day. I just sit there looking at the screen trying to figure out what‟s up.
Just to clarify, I mean problems like the ones I gave you?
N: He gives us some, I don‟t know, my mind‟s just blurred up at the moment.
SD: I don‟t know.
CS: Yeah, we often get similar things to this.

Flowcharts, Code and Animation in Novice Programming Appendix E– Study 3: Bridgend Evaluation
- 362 -
Were you bored by the whole experience, please be honest with me?
NS: The first twenty minutes was all right, but then after that my mind couldn‟t work. It was absolutely boring.
SD: It‟s not boring. *Laughing at N:*
NS: Well, I didn‟t really get it, did I. The boxes and the clicking, I ain‟t a real genius, am I.
SD: I thought it was quite straightforward actually.
CS: It was really different from programming.
Did you find Progranimate easy to use?
NS: Yeah, I found it really easy to use to solve the problems, but after that I just got confused.
SD: Easy yeah, but not really easy.
C: It‟s ok I thought some of it was quite hard, but it was ok.
Which bits did you think were hard?
CS: You‟d click a button and it wouldn‟t to what you want sometimes.
Did you have any specific difficulties when using Progranimate? Was there any large or regular problems?
NS: No not really.
SD: Nope.
CS: No.
When you got things wrong, were the error messages meaningful and correct? Did they direct you to the cause of the error.
N: Yes it did, and it was helpful yeah.
SD: Yeah the same.
CS: Yeah.
Would you say that this feature is better than the Visual Basic environment that you are used to?
All: Yeah.
Did you have any problems understanding the flowcharts?
NS: Which one is the flowchart?
** I Point to the flowchart on NSs screen**
NS: No, the flowchart was easy. I found the flowchart easier than the code.
CS: Yeah, it was quite clearer than normal programming.
SD: Yeah. ** Agreeing with Chris**
When using Progranimate did you focus more on the flowcharts or the code?
NS: The flowchart. It was always in my eye, I did not look at the code one bit.
SD: The flowchart.
CS: I was looking at the code and the flowchart.
Would you use flowcharts to solve your own problems or problems that #Teacher Name# gave you?
NS: Being honest, if I thought it would help me I would use the flowchart to do it.
SD: It depends on what kind of work it is.

Flowcharts, Code and Animation in Novice Programming Appendix E– Study 3: Bridgend Evaluation
- 363 -
CS: Yeah, it all depends as some could be to hard for it and some could be easy.
Do you feel you learnt anything from using Progranimate?
NS: No, its just the same as programming to me. It confused the hell out of me like it normally does.
SD: I did, yeah.
CS: No, I didn‟t.
Has the tool made you think about programming differently in any way?
NS: Oh yeah.
In what respect?
NS: That it‟s not really that hard. If you put your mind to it you can really get onto stuff, but to me its just
programming, not one of my best subjects.
SD: I just thought it was the same as Visual Basic.
CS: Yeah, the same.
Would you recommend using Progranimate to any of your friends who wanted to learn programming?
SD: Yeah this one first before Visual Basic.
NS: For beginners yeah. If I‟d have used it at the beginning I‟d have liked using it, but because I started using Visual Basic
I just found it hard. To other people though, yeah.
CS: Yeah the same, because for beginners its easy but for us it’s hard to get used to it.
**End Of Interview**
Group 3 – Class 1
Three Students: LJ, RF, TG *** Three very competent students***
Did you enjoy using Progranimate?
LJ: Yeah it was good to use.
RF: I think it was all right but since I have already used VB I think it was a bit confusing in places.
TG: It was something different from VB, but seeing as I have used VB already I think it was a bit of a readjustment.
What did you think about the problems I gave you to solve, did you find them to hard or to easy?
LJ: It was ok; the flowcharts helped you a bit as well with the programming.
RF: I thought the first few problems were really easy.
TG: Yeah, the first ones were easy but they did get a bit more challenging towards the end.
Now be honest, were you bored in any way by the experience?
LJ: Not really,
RF: It was at the beginning but once you got in to the harder problems and actually think about them, it got better then.
TG: Yeah same here, the first ones were a bit too simple I think, but once they got a bit more complicated it was quite
enjoyable.

Flowcharts, Code and Animation in Novice Programming Appendix E– Study 3: Bridgend Evaluation
- 364 -
Did you find Progranimate easy to use?
LJ: Yeah.
RF: On the whole it was pretty easy to use.
TG: Yeah, pretty simple, there are a few things that could be changed about it, but it‟s pretty easy to use.
Did you find it hard to solve the problems with the tool?
LJ: Yeah it was pretty easy.
RF: Yeah it was quite easy with the tool.
TG: It‟s probably a lot simpler than using VB to be honest.
Now when you got things wrong, did you find Progranimate gave you a relevant error message?
LJ: Yeah,
RF: To be honest, I didn‟t read the error messages that much, but the ones I did read it told me that there was something
wrong with the variable or the variable did not exist.
TG: Yeah same here, they did get confusing sometimes with big words.
Were the error messages of Progranimate more accurate and helpful than the errors of Visual Basic?
TG: Yeah, but as Ray said, I don‟t really read them, I just try to fix the problem myself.
Did you have any problems understanding the flowcharts?
LJ: No, they were easy to use.
RF: The flowcharts were quite easy because they went through step by step as well.
TG: It was nice and simple compared to always looking at code, it was colourful and attractive to look at.
When developing your solutions and using the tool did you focus on the flowcharts or the code more?
TG: The flowcharts probably because the code it was just sort of happening without even thinking about it, so you just
pieced together the flowchart and the codes done for you.
RF: Yeah, it was the same thing, once you knew what order and what the flowchart tools did you did not look at the code;
the code was just made.
LJ: Yeah the same the flowcharts.
Would you use flowcharts again to solve your own programming problems or problems that #Teacher Name# gave you?
LJ: Yeah.
RF: I would alongside the code yeah, but I still like to keep the code because if it was in VB, I would still like to be able to
refer to the code, I‟m used to it.
TG: Yeah, probably the same, but I‟d like to jump into things too much to be honest. I‟d probably just skip the flowcharts
and just head straight into the code.
Has the tool made you think about programming any differently?
RF: No not really, it kind of has in as much as you can visualise more how the code is running through things, but no, I
refer to the code more than anything else.
TG: I‟d probably refer to the code, but it‟s changing the aspect. I‟d probably use variables a lot more now because it does
help you understand those.
Do you find it has increased your confidence in programming in any way?
LJ: Yeah. The program‟s much easier to use than VB.
RF: Yeah, I‟d say the same, it is easier to use in places but since I‟m used to VB I find VB quite easy as well.
TG: Yeah, pretty much the same here I think.

Flowcharts, Code and Animation in Novice Programming Appendix E– Study 3: Bridgend Evaluation
- 365 -
Would you recommend Progranimate to beginners that wanted to learn programming?
TG: Yeah probably, but I wouldn‟t like myself I have used VB for a long time. From the start though it would probably be
a lot easer.
LJ: Yeah the same,
RF: Yeah the same,
**End of Interview**
Group 1 – Class 2
Three Students: TB, JD, PR.
Did you enjoy using Progranimate?
All: Yes
JD: At the start I didn‟t , I hated it.
TB: No, I didn‟t like it at the start.
But you have got to grips with it now?
TB: Yeah, it‟s easy.
JD: Yeah.
Did you find the problems too easy or too hard?
TB: Some of them were hard, but some of them were easy, because I didn‟t know how to do it (referring to the early
problems).
You had trouble at the beginning, getting started. Then it just clicked with you, I noticed that.
TB: I didn‟t like it at all at the start, but yeah.
JD: Yeah, I feel the same.
RP: And me.
Were you bored by the experience in any way?
TB: No, at the start I was because I didn‟t like it, but its fun now.
JD: And me too.
Did you find the tool easy to use?
TB: I do now yeah.
JD: Yeah, I find it easier,
RP: I do now, I didn‟t at the start.
Were there any particular difficulties you had, was there anything that gave you lots of trouble?
TB: At the beginning I did not know where to put the components.
The order of the components?
TB: Yes.

Flowcharts, Code and Animation in Novice Programming Appendix E– Study 3: Bridgend Evaluation
- 366 -
Did you find it hard to solve the problems with the tool?
All: No.
Would you have found it a lot harder to solve these problems in Visual Basic?
TB: Not really no because I have used it more.
Are you quite good at Visual Basic?
TB: At some things yes.
JD: Yeah same with me.
RP: And me.
When you got things wrong were the error messages useful and understandable?
JD: I understood them yeah, because it just told you.
And were they pretty accurate in their descriptions of the problem?
JD: Yeah,
TB: I don‟t know I didn‟t read them.
JD: Well you misspelled something and it told you.
TB: Oh yeah, so yeah.
Did you have any problems understanding the flowcharts?
TB: No, I think they are easy.
JD: Yeah, I understand them, yeah.
RP: No, they are easy.
Did you find it easy to see the relationship between the flowcharts and the code?
TB: Pardon? (TB did not understand the question)
**As time was precious I felt I had no time to restate the question **
When developing your solutions did you focus more on the code or flowcharts?
JD: The flowcharts.
RP: Yeah the flowcharts.
Did you ignore the code completely?
TB: No.
So you looked at it a bit?
TB: Yes.
Would you use flowcharts again to solve other problems?
TB: JD: Yes.
Have you used them up till now?
All: No.
JD: No, it was the first time.
If the Teacher gave you a problem to solve without using Progranimate, would you use flowcharts to help develop the
solution? Say for example drawing them on paper.
All: Yeah.

Flowcharts, Code and Animation in Novice Programming Appendix E– Study 3: Bridgend Evaluation
- 367 -
Before using the tool did you realise the usefulness of flowcharts?
All: No.
TB: At the beginning, I thought it wasn‟t because it didn‟t look nothing like Visual Basic.
JD: Yeah, you understand now what the program‟s doing.
Did you feel that you had learnt anything from using Progranimate?
TB: Flowcharts.
JD: Yeah, how to do flowcharts.
JD: What type to put in like double, variable and everything like that.
TB: Once you do one problem you get the grips of what you have to put in each component.
Has using Progranimate improved your general programming abilities in any way?
TB: Yeah a little bit, but there is different code in Visual Basic to what we use.
JD: Yeah, the same really.
RP: Yeah the same.
Did your confidence in programming improve compared to when using Visual Basic?
TB: Yeah, once I know how to do one problem I can do them now easily. Whereas in Visual Basic it is harder.
JD: I don‟t know how I feel. In this yes, but I suppose I have the same confidence in both of them, but I‟ve grown more
confident in this. Since my first lesson I didn‟t want to come back.
So the learning curve of Progranimate is a lot less than Visual Basic?
JD: Yes, it‟s a lot easier to understand now.
RP: Yeah I feel my confidence got better in this one but not in Visual Basic.
Would you recommend the use of Progranimate to friends who wanted to learn programming?
TB: Yes,
JD: Yeah, I would.
RP: Yeah and me I would.
***End of Interview.***
Group 2 – Class 2
Four students: BE, DWS, MT, IB,
Did you enjoy using Progranimate?
BE: Not really.
No? you found it boring?
BE: Yes.
DW: It was all right.
MT: Yeah, it was all right.
IB: It‟s all right.

Flowcharts, Code and Animation in Novice Programming Appendix E– Study 3: Bridgend Evaluation
- 368 -
Did you find the problems I gave you, too easy or too hard?
BE: The were a bit hard.
Were they harder than the problems you usually get?
BE: About the same, but I normally know what I‟m doing.
DW: Not bad, for the first ones, trying the program.
MT: The first one‟s quite easy. I haven‟t done the other ones though, so I don‟t know about them.
IB: I thought the first ones were easy, but I didn‟t get any further.
Were you bored in any way by the whole experience? Please be honest.
BE: Not really.
DW: A bit.
MT: It‟s something different.
IB: A little bit.
Irrespective of the programming did you find using Progranimate simple?
BE: Yeah it was all right like.
DW: I got used to it after a while.
MT: Yeah,
IB: No, I couldn‟t get the hang of it.
Did you find it hard solving the problems with the tool, would you have found it any easier in Visual Basic?
BE: Probably.
Is that because you are more familiar with the Visual Basic environment?
BE: Yeah probably, but just because I do more Visual Basic.
Cast your minds back to the learning curve you had with Visual Basic, compared with Progranimate was the learning curve
steeper?
BE: I don‟t know.
MT: Visual Basic takes longer I think, to learn.
So given the time you had spent with Progranimate.
MT: This ones easier.
IB: I‟d have said Visual Basic was easier.
When you got things wrong and Progranimate came up with error messages were these relevant, did you know what they meant and
did they point you in the right direction?
BE: Yeah.
DW: Yeah.
MT: No, not all the time.
Can you site any particular examples?
MT: Yeah, when you use a number over a thousand it was coming up with this weird code.
IB: Yes, it was all right.

Flowcharts, Code and Animation in Novice Programming Appendix E– Study 3: Bridgend Evaluation
- 369 -
Did you have any problems understanding the flowcharts on the screen?
BE: No.
DW: A bit, at the start but not so much any more.
MT: No, they were reasonable.
IB: No, it was all right.
When using Progranimate did you find yourself focusing more on the flowcharts or the code?
BE: Code.
DW: The flowcharts.
MT: Flowchart.
IB: The code.
Now would you use Flowcharts again to solve your own problems? Say if you were given a problem by #Teacher Name#, you were
not using Progranimate but given a pen and a paper to solve a programming problem?
BE: Probably not.
DW: Yeah probably.
MT: I wouldn‟t use them.
IB: I wouldn‟t use them.
Do you feel you have learnt anything from using this tool?
BE: No.
DW: Yeah, a bit.
MT: I‟m not sure, I don‟t know.
IB: No, not really.
Would you recommend the Progranimate tool to any of your friends that wanted to learn programming?
BE: No.
Why is that? Is it too boring or is there another reason?
BE: I dunno its just….. (BE pauses), No.
DW: Probably if they hadn‟t used Visual Basic before.
MT: Yes, to beginners definitely.
IB: Yeah, if somebody had not used Visual Basic.
*** End of Interview.***
Group 3 – Class 2
Three Students: JE, CE:, SB:
Did you enjoy using Progranimate?
JE: Not really.

Flowcharts, Code and Animation in Novice Programming Appendix E– Study 3: Bridgend Evaluation
- 370 -
CE: No, not really.
SB: Yeah and no.
Did you find the problems I gave you to solve, to easy, to hard or just right?
JE: The questions on the sheet really threw me, so I did not really know what I was doing.
CE: I was just plainly confused.
SB: Easy, too easy.
So you were confused by the problems we gave you?
CE: Well I could do them in VB easily. Its just the way you want me to type it into your program is just a bit
confusing for me. Its just like… argh… really.
Now in any way were you bored by the whole experience and solving the problems.
JE: Well I have to virtually say yes, as it is like a Friday afternoon and the last lesson and I‟m tired anyway, so (shrugs).
CE: Well I agree with him, but I was not in last week, so I didn‟t spend as much time as anyone else.
SB: Yeah I was because I just sat there done it, completed it and had to sit there for the rest of the day doing nothing like.
So it was boring for me.
CE: **Laughing at SB** You only sat there for about five minutes.
Did you find Progranimate easy to use?
JE: No, No not for me, I‟m not a programming master anyway, so, I don‟t know.
SB: Yeah I did, too easy again.
Was there any particular aspect you found hard to understand?
JE: Basically all of it.
CE: I tried doing my own little program when I was waiting for the next sheet and it just wouldn‟t work at all. I
was trying to do a simple yes, no answer like „How Are You‟, just being bored as I am and it wouldn‟t work.
What bits would not work?
CE: Well I tried doing a read function to come up and read it. I don‟t know, I was doing it so it would bring it up
on the screen and say “How are you?” yes or no, and have an If function underneath it and then it kept on saying
something about variable or something wasn‟t included in it. I tried different ways but it kept on saying
something‟s not included, something‟s not included, something‟s not included.
It won‟t let you define the argument if the variables you are wishing to use are not in the inspector, maybe that is
the problem. We will take a look at this problem in a moment if I get some time.
Was there any one thing that stood out as being particularly difficult or confusing?
JE: The whole lot.
CE: I‟ve only done two, and they‟re all right so.
SB: The last one got to me with the If, but after that I learnt it, it was easy.
Now when you got things wrong and Progranimate came up with an error message, were these meaningful and helpful, were you
pointed in the right direction?
JE: I didn‟t manage to get to any error so I just don‟t know.
CE: It just kept coming up with something I didn‟t have a clue what it was.
Did you feel you were blasted by error messages?
CE: Yeah.

Flowcharts, Code and Animation in Novice Programming Appendix E– Study 3: Bridgend Evaluation
- 371 -
SB: Now when an error came up it just came up, it didn‟t say do this or do that. It would just come up with a little thing.
What little thing, the message would say what?
SB: You haven‟t put it in, something like that it says.
CE: Then basically it told you what to do *(Disputing what SE said)*.
SB: Yeah but at the end of the day what could you put in? Its not telling you to put the minus in, it‟s not telling
you to put that in, its just saying that you haven‟t got some function in it.
Did you have any problems understanding the flowcharts?
JE: Yes.
Are you more of a textual thinker than a visual thinker?
JE: Yes, I would say so.
CE: It confused me for a moment, print and read I didn‟t know which was which. Print prints to the screen, what does Read
do?
Read reads input from the keyboard into a variable.
CE: I had problems understanding it.
SB: It was easy again. This is just easy for me, the thing all over.
Could you see the relationship between the flowchart and the code? What I mean by this is did you see the link between the flowchart
components on the left and the lines of code on the right?
SB: What do you mean now?
SB: Well, the print component says MsgBox, and the read component says something else. They don‟t relate to the code at
all. **This was said after the interview and recording has completed but was inserted here as it was relevant**.
There was confusion here. Time was running tight, so the questions had to move on.
Did you feel you had learnt anything from the use of the tool?
JE: Absolutely not.
CE: Not really, sorry.
SB: Yeah.
Can you give me any insight into what you believe you have learnt?
SB: I just learnt how to leant a different program, but I still prefer VB.
Has Progranimate made you think any differently about programming?
SB: Yeah, it has a little bit, but I‟d rather go back to what I have been taught the first time round.
I think the problem for you folks was that you had already covered the basics, so for many of you using the tool was taking
a step back. Do you agree?
SB: Yeah,
CE: The thing is they do not give you any visual thing of it, you know a click box, this, this, this. This only does
systems like chips, and chippies and input boxes so you can only say stuff. It doesn‟t actually give you the ability
to design. Can you play games on it? You can‟t can you?
Well you can‟t do graphical games, but that was not the intention, we were trying to focus the user on the basics
of If statements and While loops. You can learn all the graphical stuff later once you have a good grasp of the
important basics.
CE: Don‟t you think it‟s going to cause people problems when they actually go on to make VB. They will be
used to writing simple things to come up with a program. When they actually come to program in VB they will
have to be taught it all again.

Flowcharts, Code and Animation in Novice Programming Appendix E– Study 3: Bridgend Evaluation
- 372 -
**I then explained the benefits that I believe Progranimate will bring to the novice**
Do you think Progranimate improved your problem solving abilities?
SB: Yeah. I think it has because it just that little different thinking of it; It has.
Do you think you will be able to transfer this to Visual Basic?
SB: Yeah I think I could actually.
Would you recommend Progranimate to friends who wanted to learn programming?
SB: Yes, but if they had already learnt it on some sort of a program then don‟t. Only if they have never done any
programming before.
JE: Yeah.
***End of Interview***
Group 4 – Class 2
Two Students: AMN and LL.
Did you enjoy using Progranimate?
AMN: At first yeah, but then I missed a lesson then. To come back in when I felt that everyone had been using the
flowcharts any everything I found it hard to catch back up on.
LL: It was all right, a little bit boring.
Did you find the problems I gave you too easy or too hard?
AMN: The first few were all right, but obviously they get harder then and I did struggle towards the end.
LL: They were all right.
Were you bored by the whole experience in any way?
AMN: Not really no.
LL: No, not really no.
Did you find the program easy to use?
AMN: No. I find VB easier to use.
Were there any particular things you found difficult?
AMN: Most of it towards the end, it was too complicated and I weren‟t sure where to put what. But then that
probably again from missing a lesson.
Irrespective of the programming what about the tool itself, was that easy?
AMN: Yeah, it was the best thing about it. It was really easy to use the tool bar.
LL: The same.
Did you have any particular difficulties using the tool? Was there any one or two things that stood out?
AMN: It was just something like putting.. putting. I know what I have to do it‟s just putting it where.
So you had trouble with the order of the components?
AMN: Yeah.

Flowcharts, Code and Animation in Novice Programming Appendix E– Study 3: Bridgend Evaluation
- 373 -
Did you find it hard to solve the problems using the tool?
LL: A little bit.
AMN: The first few were all right, but it got harder then, and I started to struggle.
Which problem did you get to?
AMN: I finished number one and number two. They were both fine they were.
When you got things wrong did you find that the error messages were helpful in any way?
AMN: I didn‟t have anything wrong.
You didn‟t get any error messages?
AMN: No.
LL: I didn‟t get any either.
Did you have any problems understanding the flowcharts?
AMN: I weren‟t here last week so I didn‟t see the flowcharts.
No, the flowcharts have always been on your screen, they are the graphics on the left of your screen. This is a flowchart
representing the program you have constructed.
AMM: Ah yes, No problems at all.
LL: No, no problems.
When you were programming and developing your solutions to the problems did you look at the code or the flowchart more?
LL: The flowcharts.
AMN: Yeah, the same.
When solving your own problems, irrespective of the tool, if your teacher gave you programming problems to solve with only pen
and paper, would you use flowcharts to help you develop the solution?
AMN: I‟m not sure, I don‟t know, maybe yeah.
LL: Probably not.
Do you feel you have leant anything from using the tool?
AMN: Yeah, I‟d say, I understood it at the start but towards the end it got too much for me because, I came in the first
lesson, I came in the third and people who were in the second had finished number three and so I just didn‟t have a clue
what was going on towards the end.
Would you recommend Progranimate to any of your friends that wanted to learn programming?
AMN: Yeah I would, yeah. It was good, good fun. I suppose that if I had been using it a little longer it would get easier and
easier all the time.
**End of Interview**

Flowcharts, Code and Animation in Novice Programming Appendix F – Study 4: School and College Teachers
- 374 -
APPENDIX F Study 4 – Secondary School and College Teachers
CONTENTS
D.A Participant Information ...................................................................................................................... 375
D.B Interview Transcripts ......................................................................................................................... 375
D.C Problem Comments ............................................................................................................................ 383
DESCRIPTION: This appendix provides all of the information retrieved from study four not presented in the body
of the thesis. This study was conducted on the university campus with teachers of computing
subjects from Secondary Schools and colleges local to the University of Glamorgan. It is
organised into sub sections A to D.
Section A: Contains participant information.
Section B: Provides the complete transcripts of the interviews held with the teachers
Section C: A complete list of comments as left on the questionnaires.

Flowcharts, Code and Animation in Novice Programming Appendix F – Study 4: School and College Teachers
- 375 -
F.A Participant Information
The participants of the study were eight secondary school teachers from South Wales (UK)
schools and colleges located within the proximity of the University of Glamorgan. For data
protection the institutions are not identified and the teachers’ names are abbreviated to initials.
The Participants Providing Data For The Evaluation School Institution
Type Teacher Name
Teacher's Subjects IT is Main Subject
School Teaches Programming
Languages Taught GCSE A-Level
LHS School JP ICT. YES YES VBA X
LHS School JF ICT , Computing. YES YES VBA X
PC College CF Networking, Multimedia, Web.
YES YES
Java, VB, JavaScript, Php, ASP, XML.
X
PC College AW Computing, IT, Computerised Art.
YES YES VB.NET, Php, Asp,
X X
PMR School KG Computing A-Level, GCSE ICT. YES YES
Pascal , VBA. X
PCC School AP ICT. YES YES VB6 X
CS School MW ICT. YES NO n/a
YGG School GE ICT, Computing, YES NO n/a
F.B Interview Transcripts
Interview One:
Teacher1 : JP School 1: LHS
Teachers2: JF. School2 : LHS
What were your initial impressions of Progranimate?
JF: Initially I think I was a bit scared, but I’m now well into it. JP: Yeah, I think it’s really good. I’m actually looking forward to getting it into school now.
So do you think Progranimate would be useful to your school and pupils?
JF: Very much so yes. JP: Yeah, definitely.
You don’t teach programming at your school do you?
JF: No JP: We do VBA.

Flowcharts, Code and Animation in Novice Programming Appendix F – Study 4: School and College Teachers
- 376 -
Do you think Progranimate is a more suitable environment than what is used for VBA?
JF: Well we use Excel with VBA and Access databases. This would give them more of the programming concept for teaching them how to program. I think this is a better tool to do it with.
What did you think of the website?
JF: Very nice, very clean, very easy to navigate. JP: Yeah the same.
I know you have not had the time to see many of the programming problems, but what are your impressions
of what you have seen so far?
JF: What the burgers and chips things? I think it’s a very good way of doing it because you are starting off very simply and you begin to think ooh, ooh I know where to put this. Building it up I think is an excellent way of doing it rather than throwing someone in at the deep end. JP: It is something that they will relate to, so that makes it more realistic; so it’s a nicer way. Do you think your pupils might find this boring in any way?
JP: Well I think with this they will get to grips with programming and most probably want to then delve a bit deeper. So by the time they get to the point they feel confident, they possibly would want to try and hard code anyway. So that’s fine. JF: I don’t think they will get bored really. Did you have any difficulties using the tool?
JF: Well we had to think about a few things, but between the two of us we did it. JP: Well that’s learning isn’t it. That’s why it’s positive because it does get you thinking, its not all there for you. It’s actually giving you step by step instructions, but giving you an opportunity to think and put things together. Do you think using flowcharts and code together is a formula for good learning?
JF: Definitely, actually just sort of slotting them in makes them understand what things go first, like the print, the read. I think it’s very good actually. What about the animation features? Do you think they are useful?
JF: Yes, very good because you can see which code is identifying to which command. Would you recommend this tool to other people?
JF: Yes. JP: Yeah, definitely. JF: Is there going to be any costs thrown in later on with this tool? Study Facilitator: I cannot say for definite but most probably not. There are no plans to begin charging for Progranimate.

Flowcharts, Code and Animation in Novice Programming Appendix F – Study 4: School and College Teachers
- 377 -
Interview Two:
Teacher1: KG School 1: PMR
Teacher2: AW School 2: PC
What were your initial impressions of Progranimate?
KG: Good, easy to use, clear on the screen. You can scale it in and out to see what you;re doing, which is useful instead of having to scroll up and down. AW: Easy to use, very clear visually, quite easy to know what to do. Once it was demonstrated, it was fine. Do you think Progranimate will be useful to your school and your pupils?
KG: Yes, it’s a visual way of learning, and as you mentioned before, a lot of kids are visual learners. At the moment trying to get it from a static book, trying to get them to read through programs is not working; it’s very difficult. A lot of the programming environments that are out there are very expensive. We tend to use simple free stuff off of the web, but it doesn’t have the visual aspect that this has. AW: Yes, at lower levels definitely, for the complete beginners. What did you think of the Progranimate web site? What did you think of the experience it presented?
KG: Clear, standard, nothing too difficult or out of the ordinary. It was easy to follow step by step. Progression was there as well in the tasks. AW: Yeah, the same, I agree it was quite easy to use. What did you think of the programming problems?
KG: I have a couple of points on the editing and deleting; It’s not totally intuitive. I’m used to windows environments where a right click gives you options for editing ect. I also wanted to do something on the code side, but you have to go back to the other side to go and do it. Clicking on the edit button and then the item you want to edit, to me that’s the wrong way round because the stuff I do. I’d rather click on the component and then click the edit button. Study Facilitator: Maybe I should make this bidirectional so both will work. KG: Or maybe a right click menu would be useful, as a lot of users would be so used to using Windows environments that it’s intuitive to click and get options coming up. Even if it’s only some of the edit options. AW: The ability to be able to drag and drop would be ideal, because it is modular you should be able to just drag and drop, so if you want things in a different order you can just drag them. Study Facilitator: Well, I’m considering putting in cut and paste options. AW: Another thing, I just want to put in a Print or and If statement for example, and I’ve changed my mind, I can’t cancel it. Study Facilitator Well you can delete it and add it in again, but I see your point.
** Noticed a bug whereby you cannot close a definition window without clicking ok. Clicking the X causes it to come back up. ** AW: I also do agree that most people select what you want to do first. So you click on one of the items and then delete or edit.

Flowcharts, Code and Animation in Novice Programming Appendix F – Study 4: School and College Teachers
- 378 -
KG: Step through, for example you have a message box that does not have anything in it. When you do a step through it won’t run as the flowchart is not complete. In Visual Basic you can do a debug and it will run through until it hits a problem. So if you have a large amount of code it’s difficult to know exactly where you have gone wrong, without having to read through it all. ** Noticed a bug a run time error seems to result in a blank error dialogue**
Do you think your pupils will find Progranimate boring in any way?
KG: No, not on a basic level to get them started in programming. AW: It all depends on the examples you use, and the examples that you have created are quite interesting. Do you think Progranimate would easily fit within the curriculum of an A-Level / GCSE computer science
type module?
KG: Yes, easily. As a starter for ten, when they get a first chance at programming. They get a bit of background, they get on it and use it. It would be very useful. It may well be more useful for projects as well where they can actually test the code before using it. AW: We deliver mainly HE degrees and HNDs and things. It would be even useful for that initially. Do you perceive any potential problems with the use of Progranimate?
KG: It’s only a technical one where you have to make sure that Java has been installed on all the PCs. So it’s a site
wide thing we would have to do, get the technician to go round and make sure he installs the latest version of Java.
AW: No, it should just work straight off.
Did you have any difficulties using the tool, other than what you have already mentioned?
KG: Apart from the edit and delete buttons and component selection being in the wrong order nothing. AW: Apart from not being able to jiggle things around and a few usability things already mentioned, generally it was really easy to use. Do you think the animation features were useful?
AW: Yes, especially the variable inspector window that changed the values of the variables as you ran through it, that was quite nice. KG: Yeah, I agree. Do you think that the duality of flowcharts and code reinforces a better understanding of the basics of
programming?
KG: Yes. AW: Yeah, definitely. Would you recommend this tool to other people?
KG: Yes. AW: Definitely.

Flowcharts, Code and Animation in Novice Programming Appendix F – Study 4: School and College Teachers
- 379 -
Interview 3
Teacher 1: CF School1: PC
Teacher 2: AP School2: PCC
What were your initial impression of Progranimate?
CF: Easy, good interface, and fun I think. I enjoyed using it. CP: Easy for the novice user. A lot of people are put off by the syntax and the semantics, and when you’re talking about variables they’re put off, but they can clearly see what happens with this. Do you think Progranimate would be useful to your school and pupils?
CF: Yes, without a doubt. CP: Definitely. Is Progranimate any better or worse than the environments you currently use to teach programming?
CF: I think anything that can give additionally has got to be better. Otherwise, it’s very much us standing at the front, people sitting at their own user areas, just following what we are doing. They can interact with this and play with it, which also gives them a chance to be doing something. If it’s a large class, we have to split ourselves into twenty four. Some people are just stuck they’re doing nothing at all. CP:I think it will be useful to use this before you bring in the actual programming language like Visual Basic. Like a pre course even before they start the A-Level course, as a bridging project. What did you think of the Progranimate website? Did you think, it was good, bad, or do you have any other
comments?
CF: It’s difficult remembering back to that now that I have been playing with the program. Yea, I’d say it was good. CP: Useful with demonstrations, obviously if people have not got the software at home they can easily download it and use it straight away. So yeah, very useful. What did you think of the programming problems? I know you did not have the time to see them all, but
what were your impressions?
CF:I was going in and making errors, and just trying to find out how easy it was to put them right. One thing, I didn’t find it very easy to move things around the flow diagram very easily. If you wanted the option to change the order, this does not seem possible. CP: I thought the animation controls were very useful because the pupils would be able to see exactly what is being put into the variables and see it happen on the screen as well. So yes, it’s very useful to visualise what is happening in the program. CF: It would be nice to see more code on screen. **Demonstrated the code text size and the turning of of the variable inspector to see more code.**

Flowcharts, Code and Animation in Novice Programming Appendix F – Study 4: School and College Teachers
- 380 -
Do you think your pupils will find Progranimate and the online experience boring in any way?
CF: Only if they were totally de-motivated, no I don’t think so. CP: No, I think the problems that you set, initially are achievable and they can progress at their own pace rather than trying to keep up with the class. They can work at their own pace at home, at school. CF: I also thought it was nice having those buttons with names because very often I used to find when I was teaching it that they could not remember if it was an If or whatever, and that gives them another starter for ten. Do you think that Progranimate could fit easily within the curriculum of the GCSE / A-level computer
science module or class?
CF: Yes, they find it hard a lot of our second years when they go into programming. I think this would be a benefit to them actually.
Do you think it would fit within the curriculum quite well?
CF: Yes, it would.
CP: As I mentioned before, having an introductory unit of programming would fit in nicely, before you start
going into the Visual Basic programming language itself. Especially now as they are cutting our hours, we’re
having ten percent taken off, so anything like this is going to help them.
Did you have any difficulties using Progranimate?
CF: Not considering the short space of time we had, that was just getting familiar with the program. Do you think the duality of flowcharts and code reinforces a better understanding of programming?
CF: Yeah, I like that aspect; it was visual, it was there, you could see it. Sometimes just a screen full of code can be pretty hard. CP: Again the animation control and the step feature, you can break it down into individual steps and go through the program. So do you think the animation features were useful?
CP: Yes, because it can clearly break the program up into individual elements. What I found useful, when you are reading in the variables it’s coming up in the variable inspector, you can see exactly what is being stored where and how it all works. Would you recommend Progranimate to other teachers?
CF: Yes definitely. CP: Yes.

Flowcharts, Code and Animation in Novice Programming Appendix F – Study 4: School and College Teachers
- 381 -
Interview 4
Teacher1: GE School: YGG,
Teacher2: MW School: CS,
What were your initial impressions of Progranimate?
GE: Easy to access, it loaded up pretty quick, it looked obvious to me what it was. MW: Easy to use, basic, pretty easy to follow. Do you think Progranimate would be useful to your school and your pupils?
GE: Yes, I can’t see why not. We don’t teach programming, so I’d use it for a separate club, like a lunch time club or something like that. But yeah, I don’t see why not, I think the kids would enjoy using it. MW: Same with us, we don’t teach programming at the moment, but some of the kids are asking about it, so maybe key stage three year nine, it would be useful for that. What did you think of the website? Do you think the online experience it presented was good?
MW: Yeah, the web site was good, very kid friendly. GE: It needs a bit of polish, it needs to be a bit more professional. I like the web site there is nothing wrong with it but the Logo looks very blocky. I like the picture there (points to the montage picture on the first page). It does seem a bit basic, and some of the links did not work, but I’m only assuming it was a demo website. What did you think of the programming problems?
GE: Fine, if I was teaching this I would not have the pupils flicking between the web pages, personally as a teacher I’d make my own worksheets. Study Facilitator: You would give them a hand out? GE: Basically yes. One of the things I have written on the questionnaire is a teacher resource pack. That would be great if you had that, even if we had to buy them to fund the development of the free program I probably would purchase a teacher development pack. Yeah, definitely. MW: Exactly the same opinion with that one. Do you think your pupils might find Progranimate boring in any way?
GE: At the beginning maybe, when you are doing the chalk and talk and the initial this is what this does and what this button does. Maybe the two lessons getting to know the program would be boring. But, when you say right, here’s your task, here’s your problem go away and solve it you have two hours to do it, they’d get more into it. There would be an element of competition in the class and that’s always fun. MW: The thing I would like to see more of is the colours there (points to flowchart component) being the same colour buttons along there (points to palette). This would be easier for the kids to know what’s what when it moves over. It would be nice to double click on the flowchart components to edit them.

Flowcharts, Code and Animation in Novice Programming Appendix F – Study 4: School and College Teachers
- 382 -
Do you think the kids at your school would find this interesting or boring?
MW: A little more colour on the screen just to initially grab their attention, then yes they’d enjoy it. Would Progranimate easily fit within the curriculum of an A-Level or GCSE course in computing?
MW: Not for us. We do DIDAS and there is no programming whatsoever in it. GE: I can’t see it. At the moment the GCSE course we teach, we teach WJEC there is no programming in there whatsoever. When I did GCSE back in 1990 something there was programming. Study Facilitator: Do you think there should be programming in there? GE: Definitely, I’m one of those people who believes that programming needs to be done from an early age, if we’re to get more people into it. MW: At the moment you jump them into an A-Level computing when really what you are teaching is key stage three computing to A-Level students. GE: It’s the same with GCSE, the GCSE course work is spreadsheets, databases, word processing, and desktop publishing. There is no programming, we maybe do macro’s depending on the level of the pupil or level of the class. Even that is automated, hence we don’t et right into macros. I’d do this, like I say in a separate club; I’m always pushing the WJEC to re-introduce things. But as for A-Level we use Excell in year 12 and probably access next year and we will be using Visual Basic for Applications. Would you recommend Progranimate to others?
GE: Yes. MW: It’s a brilliant introduction to programming GE: I can’t see no problems using this in a year six primary classroom. I would like to show my wife who is a year six teacher, and IT coordinator and I think she could use that. GE: It reminds me very much of the lego robotics invention kit and the software that came with that. Also FlowAll, a program called FlowAll, a very similar flowchart way of programming but obviously at a cost. I think that’s what’s going to get it into schools the fact that it does not cost, but to raise development funds I’d buy a teacher pack. MW: Even if it was something like ten or twenty pounds, but say £250 you would turn them down straight away, because that’s your budget for the year gone.

Flowcharts, Code and Animation in Novice Programming Appendix F – Study 4: School and College Teachers
- 383 -
F.C Questionnaire Written Comments
Q4: Adding editing and deleting components was easy to do
AW: Yes, although moving things around was not easy.
KG: Agree, but not intuitive to click edit before item
MW: Would be nice to double click on Icons to edit them
Q6: Adding and editing variables was easy
AW: Adding variables though Print etc (shortcut) would be confusing.
KG: See Q4.
AP: Could not change a variable name.
Q7: Saving and loading programs was easy and trouble free
GE: A version for our intranet would be cool. Even a self contained application.
Q8: The function of each button slider and menu option etc. was very clear to me
GE: Could be improved with tool tips.
Q9: Progranimate was Speedy and Responsive
GE: I like the speed slider.
Q10: User Errors are Handled Correctly
KG: No Debug –Step-through until error found. When error is found it just will not run.
Q11: The error messages generated by Progranimate were meaningful and helpful
AW: Some errors did not show errors or debugging messages. *A bug discovered*
GE: Syntax errors need to be better explained. Maybe though a link to a web site.
Q12: Progranimate functioned reliably
GE: A couple of typographical errors.

Flowcharts, Code and Animation in Novice Programming Appendix F – Study 4: School and College Teachers
- 384 -
Q15: Can you think of any way to improve Progranimate?
CF: As per the interview: See more code, adjust the flowchart for editing.
AW: Drag and drop.
KG: Components – include diagrams on buttons. Edit – right or double click. Copy and paste option
AP: Solutions to the problems provided for any pupils who get stuck, at least for the introductory exercises.
MW: Make colourful background (skin) to appeal to KS3 and 4. Drag and drop components.
GE: A teacher option to print flowcharts for wall displays (this is implemented, teacher unaware).
A teacher resource pack in both English and Welsh – including posters and worksheets.
Launch a development forum so that people can pass on ideas and discuss.
Simple and Advanced interface editing modes (this is implemented, teacher unaware).
A collection of downloadable programs developed by users.
A user manual (available online, teacher informed).
Q16: Was there anything about Progranimate you didn’t like
AP: Could not see the code all on one screen (teacher informed of code font size option).
MW: Error messages need a link to a trouble shooting document.
GE: The fact it was launched off the website. Why not make it an application from the computer (re-iterated reasons
for web deployment, versioning, maintenance etc).
Q17: Any Other Comments
AP: Would like handout with exercises. Possibly have a link to load it into word and printed off (excellent idea).

Flowcharts, Code and Animation in Novice Programming Appendix G – Study 5: Novices Aged 15 to 17
- 385 -
APPENDIX G – STUDY 5 - Novices Ages Fifteen to Seventeen
CONTENTS
G.A Detailed Participant Information ........................................................................................................ 386
G.B Full Results From Usability Questions ............................................................................................. 387
G.C Full Results From Efficacy Questions .............................................................................................. 389
G.D Full Results From Problem Solving Activity Questions ................................................................... 390
G.E Full Results from Open Ended Questions: ......................................................................................... 391
G.F Full Results from With Indecisions Omitted ..................................................................................... 393
G.G Complete Problem Statistics and Written Comments: ....................................................................... 394
G.H A List of Bugs Discovered and Fixed as a Result of this Study: ....................................................... 400
DESCRIPTION: This appendix provides all of the information retrieved from study five. This study was conducted on the university campus with secondary school pupils aged 15 to 17 (years ten and eleven). It is organised into sub sections A to D. Section A provides a full breakdown of the participants of the study. For data protection the names are abbreviated to initials. Section B provides the full questionnaire responses for the usability questions of the questionnaire including any written responses. Section C provides the full questionnaire responses for the efficacy questions including any written responses. Section D provides the full questionnaire responses for the problem solving activity questions including any written responses. Also included is a graph showing the inverse correlation between questions 12 and 13. Section E provides all the written responses made in the open ended questions of the questionnaire. Section F provides a summarised set of questionnaire results but with the undecided responses omitted. Section G provides a complete list of the problem completion statistics for each evaluator. Also included are the evaluators’ written remarks made on the comments areas of the problem worksheets. For data protection, where particular evaluators are mentioned, their names have been abbreviated to initials.

Flowcharts, Code and Animation in Novice Programming Appendix G – Study 5: Novices Aged 15 to 17
- 386 -
G.A Detailed Participant Information
Throughout the two sessions of the study, there were 32 attending students. Of these twenty six identified themselves on the forms and questionnaires and thus were able to provide data for the study. For the six who did not provide data, this was due to the team working arrangements of the first session, whereby their name was not put on their groups sheet. The table below lists the students that were able to provide data. For data protection, each participant is identified by their initials.
The Participants Providing Data For The Evaluation Initials Age Gender School Year
AJ 15 M 10
BC 16 F 11
BL 15 F 10
CL 17 F 11
CP 16 M ??
CU 16 M ??
CF 17 M 11
DJ 16 M 11
GP 17 M 11
JB 17 F 11
KW 16 F 10
KE 15 F 10
LJ 16 F 10
MB 16 F ??
MH 17 M 11
NH 16 M ??
NW 17 F` 11
OV 17 M 11
RC 16 M ??
RD 17 F 11
RE 16 F ??
RL 16 M ??
RW 17 M 11
SR 15 M 10
TJ 17 M 11
VS 15 F 10
Participants providing
data 26
Total 15s: 5 Males: 14 Year 10s: 7
Total 16s: 11 Females: 12 Year 11s: 12
Total 17s: 10 Unknowns: 7

Flowcharts, Code and Animation in Novice Programming Appendix G – Study 5: Novices Aged 15 to 17
- 387 -
G.B Full Results From Usability Questions
Q1: I enjoyed using Progranimate. Q2: I enjoyed solving the programming problems. Q3: When I first saw Progranimate it looked easy to use. Q4: I found Progranimate easy to use. Q5: Progranimate was speedy and responsive in my usage of it. Q6: Adding program components was easy to do. Q7: Editing and deleting program components was easy to do. Q8: Adding variables was easy to do. Q9: Editing and deleting variables was easy to do. Q10: Progranimate behaved reliably. Q11: Progranimate behaved more reliably in the second session Q17 The Progranimate website was easy to use. Q13: Launching Progranimate was easy.
Questionnaire Responses
Evaluator Q1 Q2 Q3 Q4 Q5 Q6 Q7 Q8 Q9 Q10 Q11 Q17 Q18
AJ 3 2 3 3 2 3 3 3 3 2 3 3 3
BC 2 2 1 1 2 3 2 3 2 2 2 3
BL 3 3 4 4 3 2 1 2 0 3 3 3 4
CL 1 1 1 2 3 2 3 2 3 2 3 2 3
CF 2 2 3 2 3 3 3 3 3 3 3 3 3
DJ 2 2 3 3 3 4 4 4 4 2 3 3 2
GP 2 1 3 4 3 3 3 3 3 3 2 3 3
JB 3 3 1 1 3 3 3 2 3 3 3 3 3
KW 2 2 1 2 3 3 3 3 3 2 2 3 3
KE 2 2 1 1 1 1 1 3 1 2 3 3 3
LJ 3 3 1 2 2 1 3 2 4 3 2 4 4
NW 2 3 1 3 4 3 3 3 3 3 4 2 3
OV 2 1 3 3 3 3 3 2 1 3 3 1 3
RW 2 3 2 3 3 3 3 3 2 2 3 3 3
Average 2.21 2.14 2.00 2.43 2.71 2.64 2.71 2.71 2.50 2.50 2.85 2.71 3.07
StDev 0.58 0.77 1.11 1.02 0.73 0.84 0.83 0.61 1.16 0.52 0.55 0.73 0.47
Mode 2 2 1 3 3 3 3 3 3 2 3 3 3
Median 2 2 1.5 2.5 3 3 3 3 3 2.5 3 3 3
% Average 55.36 53.57 50.00 60.71 67.86 66.07 67.86 67.86 62.50 62.50 71.15 67.86 76.79
% Stdev 14.47 19.26 27.74 25.41 18.16 21.05 20.64 15.28 29.01 12.97 13.87 18.16 11.87
% Mode 50 50 25 75 75 75 75 75 75 50 75 75 75
%Median 2 2 1.5 2.5 3 3 3 3 3 2.5 3 3 3
%Agree 28.57 35.71 42.86 50.00 71.43 71.43 78.57 64.29 64.29 50.00 76.92 71.43 92.86
%Undecided 64.29 42.86 7.14 28.57 21.43 14.29 7.14 35.71 14.29 50.00 23.08 21.43 7.14
%Disagree 7.14 21.43 50.00 21.43 7.14 14.29 14.29 0.00 21.43 0.00 0.00 7.14 0.00
0 to 24.9% [0] = Strongly Disagree 25 to 49.9.9% [1] = Disagree 50% [2] = Undecided 50.9 to 74.9% [3] Agree 75 to 100% [4] = Strongly Agree
0 + 1 = Total Disagreement 2 = Total Undecided 3 + 4 = Total Agreement

Flowcharts, Code and Animation in Novice Programming Appendix G – Study 5: Novices Aged 15 to 17
- 388 -
Usability Question Comments:
Q1 Comments – I enjoyed using Progranimate LJ: It was a good challenge. Q2 Comments – I enjoyed solving the programming problems LJ: It made me use my brain; maybe more instructions. Q6 Comments – Adding program components was easy to do KE: It got a bit confusing with the Print buttons and boxes. I didn’t know whether to press the read/assign button or the box after selecting the button. Q9 Comments – Editing or removing variables was easy to do KE: They would not delete. Q10 Comments – Progranimate behaved reliably KE: Sometimes it gave the wrong answer. Q11 Comments – Progranimate performed more reliably in the second session GP: Same in both.

Flowcharts, Code and Animation in Novice Programming Appendix G – Study 5: Novices Aged 15 to 17
- 389 -
G.C Full Results From Efficacy Questions
Q19: The flowcharts enabled me to understand the solution being developed. Q20: The use of colour was beneficial. Q21: I have some understanding of the code generated. Q22: I could easily see what bit of generated code the flowchart represented. Q23: I felt I had learnt something by using Progranimate. Q24: I would recommend using Progranimate for the learning of programming. Q25: I would like to use Progranimate in my school.
Questionnaire Responses
Evaluator Q19 Q20 Q21 Q22 Q23 Q24 Q25
AJ 2 2 1 1 3 3 2
BC 3 3 1 2 3 2 1
BL 4 3 3 1 3 4 3
CL 2 3 2 2 1 0 0
CF 1 3 2 0 3 3 3
DJ 3 3 2 2 2 3 3
GP 3 3 3 3 3 3 2
JB 3 3 3 3 3 2 2
KW 3 3 1 2 3 2 2
KE 2 1 0 1 1 1 1
LJ 1 3 3 1 2 3 2
NW 3 3 3 3 3 3 3
OV 2 3 3 2 3 1 2
RW 3 3 2 2 2 3 2
Average 2.5 2.79 2.07 1.79 2.5 2.36 2
StDev 0.85 0.58 1 0.89 0.76 1.08 0.88
Mode 3 3 3 2 3 3 2
Median 3 3 2 2 3 3 2
% Average 62.5 69.6 51.8 44.6 62.5 58.9 50
% Stdev 21.4 14.5 24.9 22.3 19 27 21.9
% Mode 75 75 75 50 75 75 50
%Median 75 75 50 50 75 75 50
%Agree 57.1 85.7 42.9 21.4 64.3 57.1 28.6
%Undecided 28.6 7.14 28.6 42.9 21.4 21.4 50
%Disagree 14.3 7.14 28.6 35.7 14.3 21.4 21.4
0 to 24.9% [0] = Strongly Disagree 25 to 49.9.9% [1] = Disagree 50% [2] = Undecided 50.9 to 74.9% [3] Agree 75 to 100% [4] = Strongly Agree
0 + 1 = Total Disagreement 2 = Total Undecided 3 + 4 = Total Agreement
G.C.A Efficacy Question Comments:
Q19 Comments – The flowcharts enabled me to understand the solution being developed KE: I don’t understand the read, print, assign.

Flowcharts, Code and Animation in Novice Programming Appendix G – Study 5: Novices Aged 15 to 17
- 390 -
G.D Full Results From Problem Solving Activity Questions
Q12: The programming problems were too difficult for me. Q13: The programming problems were too easy for me. Q14: The programming problems were at the right level of difficulty for me. Q15: The programming problems were well laid out. Q16: The programming problems were written in a way I could understand.
Questionnaire Responces
Evaluator Q12 Q13 Q14 Q15 Q16
AJ 1 2 3 3 3
BC 1 1 3 1 1
BL 0 3 4 4 3
CL 3 2 3 2 3
CF 1 2 3 1 2
DJ 1 2 3 3 1
GP 0 3 3 3 3
JB 0 2 2 3 3
KW 1 2 3 3 3
KE 2 1 2 2
LJ 3 1 2 2 1
NW 1 2 4 3 1
OV 1 2 0 1 2
RW 1 3 3 3 1
Average 1.14 2.08 2.64 2.43 2.07
StDev 0.95 0.64 1.08 0.94 0.92
Mode 1.00 2.00 3.00 3.00 3.00
Median 1.00 2.00 3.00 3.00 2.00
% Average 28.57 51.92 66.07 60.71 51.79
% Stdev 23.73 16.01 27.05 23.44 22.92
% Mode 25.00 50.00 75.00 75.00 75.00
%Median 25.00 50.00 75.00 75.00 50.00
%Agree 14.29 23.08 71.43 57.14 42.86
%Undecided 7.143 61.54 14.29 21.43 21.43
%Disagree 78.57 15.38 14.29 21.43 35.71
G.D.A Problem Solving Activity Question Comments:
* No comments left *

Flowcharts, Code and Animation in Novice Programming Appendix G – Study 5: Novices Aged 15 to 17
- 391 -
A correlation Coefficient Between the Responses of Question Twelve. To establish the reliability of the results, a correlation coefficient was calculated between the responses of questions twelve and thirteen. The results provided a strong inverse correlation of – 0.56, this demonstrates the relative reliability of the evaluators’ responses. A graph is shown below.
Correlation Between Questions Twelve and Thirteen
0
1
2
3
4
AJ BC BL CL CF DJ GP JB KW LJ NW OV RW
Q12
Q13
G.E Full Results from Open Ended Questions:
Q26 Comments – What did you like about the whole experience of using Progranimate and solving the problems? BC: Good when I understood what was going on. BL: It wasn’t hard to use but still allowed me to use complex features. CL: The easy problems, not the hard ones. CF: Watching the whole program when it runs and calculates the results. JB: Learning something new. KW: Simply trying something new. LJ: It made me use my brain. NW: It was ok. RW: Solving the problems.

Flowcharts, Code and Animation in Novice Programming Appendix G – Study 5: Novices Aged 15 to 17
- 392 -
Q26 Comments – What did you dislike about the whole experience of using Progranimate and solving the problems? BC: Not explained well. BL: At first I found the program quite difficult. It could have been explained more on the first sheet. CL: Most of it. CF: The information sheet (cheat sheet) was not very informative. JB: Some parts weren’t explained. KW: Difficult to grasp at first. LJ: The instructions were unclear. NW: Not much. RW: Nothing.

Flowcharts, Code and Animation in Novice Programming Appendix G – Study 5: Novices Aged 15 to 17
- 393 -
G.F Full Results from With Indecisions Omitted
The table below represents the questionnaire responses with the undecided opinions omitted.
Q Question Text Ave% Ave StDev Mode Median Total
Agreement Total
Disagreement Rsp 0 1 2 3
1 I enjoyed using Progranimate 60.00 1.80 0.45 2.00 2.00 80.00 20.00 5 0 1 4 0
2 I enjoyed solving the programming problems 54.17 1.63 0.52 2.00 2.00 62.50 37.50 8 0 3 5 0
3 When I first saw Progranimate it looked easy to use 51.28 1.54 0.66 1.00 1.00 46.15 53.85 13 0 7 5 1
4 I found Progranimate easy to use 63.33 1.90 0.74 2.00 2.00 70.00 30.00 10 0 3 5 2
5 Progranimate was speedy and responsive in my usage of it 66.67 2.00 0.45 2.00 2.00 90.91 9.09 11 0 1 9 1
6 Adding program components was easy to do 63.89 1.92 0.51 2.00 2.00 83.33 16.67 12 0 2 9 1
7 Editing or deleting a program component was easy to do 64.10 1.92 0.49 2.00 2.00 84.62 15.38 13 0 2 10 1
8 Adding variables was easy to do 62.96 1.89 0.33 2.00 2.00 100.00 0.00 3 0 0 3 0
9 Editing or removing variables was easy to do 61.11 1.83 0.83 2.00 2.00 75.00 25.00 12 1 2 7 2
10 Progranimate behaved reliably 66.67 2.00 0.00 2.00 2.00 100.00 0.00 7 0 0 7 0
11 Progranimate behaved more reliably in the second session 70.83 2.13 0.35 2.00 2.00 100.00 0.00 10 0 0 9 1
12 The programming problems were too difficult for me 30.77 0.92 0.64 1.00 1.00 15.38 84.62 13 3 8 2 0
13 The programming problems were to easy for me 73.33 2.20 1.10 3.00 3.00 60.00 40.00 5 0 2 3 0
14 The programming problems were at the right level of difficulty for me 63.89 1.92 0.79 2.00 2.00 83.33 16.67 12 1 1 8 2
15 The programming problems were well laid out 60.61 1.82 0.60 2.00 2.00 72.73 27.27 11 0 3 7 1
16 The programming problems were written in a way I could understand 51.52 1.55 0.52 2.00 2.00 54.55 45.45 11 0 5 6 0
17 The web site was easy to use 66.67 2.00 0.45 2.00 2.00 90.91 9.09 11 0 1 9 1
18 Launching Progranimate was easy 71.79 2.15 0.38 2.00 2.00 100.00 0.00 13 0 0 11 2
19 The flowcharts enabled me to understand the solution being developed 66.67 2.00 0.50 2.00 2.00 80.00 20.00 10 0 2 7 1
20 The use of colour was beneficial 64.10 1.92 0.28 2.00 2.00 100.00 0.00 2 0 0 2 0
21 I have some understanding of the code generated 50.00 1.50 0.71 2.00 2.00 60.00 40.00 10 1 3 6 0
22 I could easily see what bit of generated code the flowchart represented 54.17 1.63 1.19 1.00 1.00 100.00 0.00 1 0 0 1 0
23 I felt I had learnt something by using Progranimate 60.61 1.82 0.40 2.00 2.00 81.82 18.18 11 0 2 9 0
24 I would recommend using Progranimate for the learning of programming 57.58 1.73 0.79 2.00 2.00 72.73 27.27 11 1 2 7 1
25 I would like to use Progranimate in my school 47.62 1.43 0.79 2.00 2.00 57.14 42.86 7 1 2 4 0
60.17 1.81 0.58 1.92 1.92 76.84 23.16 9.28 8 52 155 17
AVERAGES TOTALS

Flowcharts, Code and Animation in Novice Programming Appendix G – Study 5: Novices Aged 15 to 17
- 394 -
G.G Complete Problem Statistics and Written Comments:

Flowcharts, Code and Animation in Novice Programming Appendix G – Study 5: Novices Aged 15 to 17
- 395 -
G.G.A Complete List of Problem Comments:
Introductory B1 - Problem Comments: The Sweet Shop
Did you have any problems completing this task? If so what were they? KE, BL, VS: We got confused about which button to press in step 4. JB: In step four – point four I had to understand the task described, also an explanation of the components and what they do would help. TJ To take input from the user. CL: Progranimate was a bad name, long and confusing. The word ‘SweetShop’in step 2 whether to have a space or not (between the words). Defining variables was awkward with the PPG variable it says 0.05p but Progranimate says you are wrong when you enter in ‘p’.When displaying the result it didn’t work first time. RD: No. Text gets hidden and not all can be seen in the flowchart. RL Started in the wrong language; went back and adjusted it. RE: I got slightly confused when it asked to input a weight of price. Overall I find this very confusing, it needs to be made simpler to understand, create some shortcuts, what are the components along the side. AJ: When I typed in weight of the sweets the message false come up so I had to start again. MB: Complicated program name. Confusion over defining variables section. Displaying the result did not work first time and Progranimate was hard to start up in the first place. DJ: When I typed in the weight of the sweets it came up with false below, so I had to start the program again. LJ: I got a bit confused on step four, number four. I think the instructions weren’t as clear as they need to be on that one step, but other than that it was good. Could use more colour and maybe a picture. Complex words need to be simpler. What are the different languages at the start?
Did you require any help from friends? If so what did they help with? KE, BL, VS: To be able to open the program. TJ: To take input from the user, I didn’t know what to click on. I clicked on Print and then Read in the side bar, but I was supposed to click on the one in the flowchart. CP: Yes, what to click on for one bit when you had to click on read. CL: Loads, about the spaces and how to fix at the end because ours wouldn’t work (the running).
RL: To see why it would start with the wrong language. RE: With opening the program and some of the components. MB: Yes, how to do the last section running the program, as ours wouldn’t work. LJ: With opening the program.

Flowcharts, Code and Animation in Novice Programming Appendix G – Study 5: Novices Aged 15 to 17
- 396 -
Did you get any help from the tutor or teaching staff? CL: Yes as above. NH: When running the program I imputed a #unreadable word# number which does not work as well as whole numbers. RE: Yes, to check the program was running correct, as it seemed wrong. MB: Same as above. Also little spelling problems, such as: is ‘SweetShop’ one word or two? LJ: Just to check it at the end to make sure it was correct.
Problem 1A Comments: McDullards 1
Did you have any problems completing this task? If so what were they? KE, BL, VS: Didn’t know which box to write each part of the list in. The sheet didn’t exactly say what to write in each box.
The information on the sheet did not correspond with the info in the computer program. ( They spotted a typographical error). JB: Yes, a few mistakes on the sheet, it needs to be more clear that you need to type ‘TotalCost’ and not just cost as indicated on the front of the sheet. Also it needs to be mentioned that you don’t need to type ‘;’ at the end of the expression and + is actually ‘&’. (This student spotted all the typographical errors). TJ: A typo that caused me to change ‘cost = qtyChips * Chips’ to ‘totalCost = qtyChips * priceChips’. RW, MH: The sheet was different to what was on the screen. So it made it more complicated to add in the data. CP: Didn’t know where anything went. CL: It would not open first time. It did not tell us to click VisualBasic.Net. So it should have been clearer. How many portions, should have a ? because it is a question. Do you have spares in words, we don’t know? You also cannot copy/cut it would make it a lot easier. In the assign sum it missed out the word total on the words ‘totalCost +….’ It also missed out price, i.e. it should have been priceChips not price on the sheet. NH: If you do not input the correct data text then it will not recognise it. It rounds down the total cost. RD: Yes calculation was incorrect again not all text can be seen. NW: The instructions were vague. The software is fairly unusual to what we are used to. RL: Getting two chips for £1.97. RE: It’s too confusing, I couldn’t understand the instructions and there was a mistake. AJ: The sheet gave us the wrong equation. It doesn’t give figures over £1000. MB: At first we could not open the program because it was not clear what to do. Guide was misleading and had many mistakes, was rather confusing. The session took a long time and didn’t even work when we had finished. We clicked run but it didn’t run, didn’t save either. RC: Instructions were confusing.

Flowcharts, Code and Animation in Novice Programming Appendix G – Study 5: Novices Aged 15 to 17
- 397 -
SR: Wrong equations. DJ: The sheet gave us the wrong equations to type in. So we had to keep typing different things in each one. (Evaluators is talking about typographical errors) OV: Took a while to change name of variables. CF: Yes, there was a typing error on the instructions, leading to a few mistakes being made. LJ: I didn’t understand the instructions. Even when we asked for help it still came out wrong. I didn’t complete the program; I found it too complicated.
Did you require any help from friends? If so what did they help with? KE, BL, VS: The problem stated previously for this problem.
They showed us why our info wasn’t being allowed and explained that we had to use the info on the screen as the sheet was wrong. CP: Didn’t know where anything went. CL: Loads. NW: Yes, worked together on the same computer. RE: The instructions, We couldn’t understand it. AJ: Tell us that the equation on the sheet was wrong. MB: Everything. RC: Shared computer. SR: Telling me the right equation. LJ: Yes, but they didn’t know what to do either.
Did you get any help from the tutor or teaching staff? KE, BL, VS: The problem stated previously for this problem. CP: Didn’t know where anything went. CL: Loads. NH: Finding which quotes goes where, too complex. RE: Everything. MB: Everything. CF: The tutor noticed the typing error.
LJ: Yes, but the program output the wrong data. (A bug was discovered).

Flowcharts, Code and Animation in Novice Programming Appendix G – Study 5: Novices Aged 15 to 17
- 398 -
Other Comments: LJ: There should have been an introduction at the start of the exercise explaining exactly what everything was and to give us some tips.
Problem 1B Comments: McDullards 2
Did you have any problems completing this task? If so what were they? KE, BL, VS: Wouldn’t let us delete anything. Would have been easier to start over again rather than adding to the one we have just done. JB: Yes, understanding what to enter into the expressions in order to that each the answer and order the expressions go. TJ: Typo, changed ‘cost = chips + burger’ to ‘cost = totalBurger + totalChips’. RW, MH: Yes the information wasn’t the same as the information on the screen which took us a while to figure out the correct formula. CP: Where some parameters went. SR: Cannot delete variables. BC: Putting the right formulas in the right places.
Did you require any help from friends? If so what did they help with? No comments made
Did you get any help from the tutor or teaching staff? No comments made
Problem 2A: Comments: Cardiff Animal Shelter 1
Did you have any problems completing this task? If so what were they? CF: Didn’t understand the instructions very well. KW: Yes, where to use spaces and capitals.
Did you require any help from friends? If so what did they help with? BL: Yes, confusion with some formulas. KW: Yes, basic errors accidental.

Flowcharts, Code and Animation in Novice Programming Appendix G – Study 5: Novices Aged 15 to 17
- 399 -
Did you get any help from the tutor or teaching staff?
No comments made
Problem 2B Comments: Cardiff Animal Shelter 2
Did you have any problems completing this task? If so what were they? LJ: Nothing, except there was a bug.
Did you require any help from friends? If so what did they help with? No comments made
Did you get any help from the tutor or teaching staff? BL: Saving the program. (a bug made saving programs more difficult than usual) KE: Saving the exercise. (a bug made saving programs more difficult than usual) LJ: Yes, because of the bug. (a bug made saving programs more difficult than usual)
Problem 2C Comments: Cardiff Animal Shelter 3
No comments made
Problem 2D Comments: Cardiff Animal Shelter Comments
No comments made

Flowcharts, Code and Animation in Novice Programming Appendix G – Study 5: Novices Aged 15 to 17
- 400 -
G.H A List of Bugs Discovered and Fixed as a Result of this Study:
During this evaluation three bugs were spotted in session one. These problems did not preclude the use of Progranimate or make its use significantly more difficult. These bugs are described below.
Dead Links on the Web Sever,
A web server error meant that the first McDullards online worksheet would not
hyperlink to Progranimate and load in the partially completed problem. For this reason
the evaluators had to use the standard launching mechanism and build the skeleton
program themselves.
Occasional Miscalculation
Three of the students experienced Progranimate producing incorrect calculations where
it would either round down inappropriately or produce an incorrect mathematical
result. A further two students experienced the console outputting false when what
should have been printed was a String.
Occasional Problems Running Programs
A final bug appeared which prevented two users from running programs in
Progranimate. They were told that one or more components had missing parameters;
however, the programs appeared to be correct and executable. This was solved by
saving the program, restarting Progranimate and reloading the program in.

Flowcharts, Code and Animation in Novice Programming Appendix H – Study 6: Novices Aged 13 to 15
- 401 -
APPENDIX H – STUDY 6: Novices Aged 13 to 15
CONTENTS
H.A Detailed Participant Information ......................................................................................................................... 402
H.B Full Questionnaire Results .................................................................................................................................. 403
H.B.A Questionnaire Responses for all evaluators .............................................................................................. 403
H.B.B Questionnaire Responses for Males Only ................................................................................................. 404
H.B.C Questionnaire Responses for Females Only ............................................................................................. 405
H.B.D Questionnaire Responses for Year 9‟s Only ............................................................................................. 406
H.B.E Questionnaire Responses for Year 10‟s Only ........................................................................................... 407
H.B.F Averaged Questionnaire Responses Shown By Group Bar Chart ............................................................ 408
H.B.G A Correlation Between Q19 and Performance in the Problem Solving Activities .................................... 409
H.B.H A Correlation Between Q19 and Performance in the Problem Solving Activities .................................... 409
H.B.I A Correlation between Q21 and Performance in the Problem Solving Activities: ................................... 410
H.B.J Written Comments Left in the Questionnaire Comments Section. ........................................................... 410
H.C Complete Problem Statistics and Written Comments: ........................................................................................ 414
H.C.A Completion Statistics for Male and Female Evaluators. ........................................................................... 415
H.C.B Completion Statistics for Year Nine and Year Ten Evaluators................................................................. 416
H.C.C Complete List of Problem Comments: ..................................................................................................... 417
DESCRIPTION: This appendix provides all of the information retrieved from study five. This study was conducted on the university campus with secondary school pupils aged fifteen to seventeen (years ten and eleven). It is organised into sub sections A to D. Section A contains detailed information regarding the participants’ age, gender and school year. Section B shows the questionnaire statistics divided into various groups and presented in table and graph form. Provided are graphs for the correlations mentioned in the results section of study six (section 8.1.2). Also provided in this section are all the written responses for the questionnaire questions. The written responses are very insightful and worth a read. Section C provides the complete problem statistics for this study. They are shown for every participating evaluator and also divided into male, female, year nine and year tens. The results are shown in tabular and graph form. Finally is a list of all the written comments the evaluators left on their problem worksheets. The written responses are very insightful and worth a read. For data protection, where particular evaluators are mentioned, their names have been abbreviated to initials.

Flowcharts, Code and Animation in Novice Programming Appendix H – Study 6: Novices Aged 13 to 15
- 402 -
H.A Detailed Participant Information
The table below shows is a breakdown of the age, gender and academic year of the students participating in study six. For data protection each participant is identified by their initials.
The Participants Providing Data For The Evaluation Initials Age Gender School Year
AH 14 M 10
AB 13 M 9
AJ 14 M 10
AS 14 F 10
AW 15 M 10
AHN 14 M 10
BD 14 F 10
BP 14 F 10
CB 14 F 10
CG 14 M 9
CH 13 M 9
CW 14 M 10
DC 13 M 9
DD 13 F 9
DN 13 F 9
DR 14 F 10
DRR 14 M 9
DN 13 F 9
EC 14 F 10
EG 14 M 10
HC 15 F 10
JW 13 M 9
JP 14 M 10
JDW 13 F 9
JM 14 M 10
LG 13 F 9
NM 14 F 10
NR 13 M 9
PD 13 F 9
RC 14 F 9
RB 13 F 9
RM 14 M 10
RMY 14 M 10
RS 14 M 10
RBR 14 M 9
SB 14 M 9
SD 13 F 9
SJ 14 M 10
ST 14 M 10
TM 13 M 9
ZM 14 F 10
Participants providing
data 41
Total 15s: 2 Males: 23 Year 9s: 19
Total 14s: 25 Females: 18 Year 10s: 22
Total 13s: 15

Flowcharts, Code and Animation in Novice Programming Appendix H – Study 6: Novices Aged 13 to 15
- 403 -
H.B Full Questionnaire Results
H.B.A Questionnaire Responses for all evaluators
Q Question Text Ave% Ave StDev Mode Median Total
Agreement Total
Undecided Total
Disagreement Rsp
Distribution
0 1 2 3 4
1 Programming is something that interests me.
70.69 2.83 24.15 75 75 68.97 24.14 6.90 29 1 1 7 13 7
2 I enjoyed using Progranimate. 78.13 3.13 0.75 3 3 84.38 12.50 3.13 32 0 1 4 17 10
3 I enjoyed solving the programming problems
75.00 3.00 19.05 3 3 78.13 18.75 3.13 32 0 1 6 17 8
4 When I first saw Progranimate it looked easy to use.
60.16 2.41 29.00 3 3 59.38 9.38 31.25 32 1 9 3 14 5
5 When I first saw Progranimate it looked interesting.
72.66 2.91 20.44 3 3 75.00 18.75 6.25 32 0 2 6 17 7
6 I found Progranimate easy to use. 69.53 2.78 24.37 3 3 65.63 21.88 12.50 32 0 4 7 13 8
7 Progranimate was speedy and responsive in your usage of it.
71.09 2.84 19.17 3.00 3 68.75 28.13 3.13 32 0 1 9 16 6
8
Adding and editing program components was easy to do: (I.e. Print Read and Assign etc).
74.22 2.97 18.50 3 3 71.88 28.13 0.00 32 0 0 9 15 8
9 Adding and editing variables was easy to do.
75.78 3.03 20.56 3 3 75.00 21.88 3.13 32 0 1 7 14 10
10 Progranimate behaved reliably. 69.35 2.77 23.01 3 3 67.74 25.81 6.45 31 1 1 8 15 6
11 I enjoyed the programming problems. 74.22 2.97 20.56 3 3 78.13 15.63 6.25 32 0 2 5 17 8
12 I found the problems challenging. 28.13 1.13 21.77 2 1 3.13 34.38 62.50 32 9 11 11 1 0
13
The programming problems were at the right level of difficulty for a beginner.
69.53 2.78 18.77 3 3 65.63 31.25 3.13 32 0 1 10 16 5
14 The programming problems were well laid out.
73.44 2.94 15.47 3 3 78.13 56.25 0.00 32 0 0 18 20 5
15 The programming problems were written in a way I could understand.
75.00 3.00 16.80 3 3 78.13 21.88 0.00 32 0 0 7 18 7
16 The web site was easy to use. 70.31 2.81 18.45 3 3 62.50 37.50 0.00 32 0 0 12 14 6
17 Launching Progranimate was easy. 72.66 2.91 19.43 3 3 71.88 25.00 3.13 32 0 1 8 16 7
18 The flowchart representation helped me in thinking up the solutions.
74.22 2.97 18.50 3 3 71.88 28.13 0.00 32 0 0 9 15 8
19
The flowcharts enabled me to understand the solution being developed.
69.53 2.78 21.75 3 3 62.50 31.25 6.25 32 0 2 10 13 7
20 The use of colour on the flowcharts was beneficial.
71.88 2.88 25.20 3 3 65.63 28.13 6.25 32 1 1 9 11 10
21 The animation features helped me understand how a program worked.
68.75 2.75 17.96 3 3 65.63 31.25 3.13 32 0 1 10 17 4
22 I could easily see how pieces of the flowchart related to the lines of code.
71.88 2.88 17.68 3 3 68.75 31.25 0.00 32 0 0 10 16 6
23 I have some (even a little) understanding the code generated.
71.77 2.87 16.76 3 3 70.97 29.03 0.00 31 0 0 9 17 5
24
I felt I learnt something by using Progranimate and solving the problems.
75.81 3.03 17.66 3 3 77.42 22.58 0.00 31 0 0 7 16 8
25 Progranimate is good for the learning of Programming.
80.17 3.21 16.88 3 3 86.21 13.79 48.28 29 14 0 4 15 10
26
I would recommend Progranimate to friends who wanted to learn a bit about programming.
79.31 3.17 16.46 3.00 3 86.21 13.79 0.00 29 0 0 4 16 9
27 I would like Progranimate to be used in my school.
75.86 3.03 20.58 3 3 68.97 31.03 0.00 29 0 0 9 10 10
28 Progranimate has positively influenced my interest in programming.
75.86 3.03 17.01 3 3 79.31 20.69 0.00 29 0 0 6 16 7
71.25 2.85 19.17 5.54 5.50 69.85 25.43 7.67 31.36 27 40 224 415 197
AVERAGES TOTALS 0 to 24.9% [0] = Strongly Disagree 25 to 49.9.9% [1] = Disagree 50% [2] = Undecided 50.9 to 74.9% [3] Agree 75 to 100% [4] = Strongly Agree
0 + 1 = Total Disagreement 2 = Total Undecided 3 + 4 = Total Agreement

Flowcharts, Code and Animation in Novice Programming Appendix H – Study 6: Novices Aged 13 to 15
- 404 -
H.B.B Questionnaire Responses for Males Only
Q Question Text Ave% Ave StDev Mode Median Total
Agreement Total
Undecided Total
Disagreement Rsp
Distribution
0 1 2 3 4
1 Programming is something that interests me. 77.63 3.11 21.88 75 75 78.95 15.79 5.26 19 0 1 3 8 7
2 I enjoyed using Progranimate. 80.26 3.21 0.85 3 3 84.21 10.53 5.26 19 0 1 2 8 8
3 I enjoyed solving the programming problems. 81.58 3.26 16.33 3 3 89.47 10.53 0.00 19 0 0 2 10 7
4 When I first saw Progranimate it looked easy to use. 66.25 2.65 29.55 3 3 65.00 15.00 20.00 20 1 3 3 8 5
5 When I first saw Progranimate it looked interesting. 75.00 3.00 21.46 3 3 75.00 20.00 5.00 20 0 1 4 9 6
6 I found Progranimate easy to use. 73.68 2.95 22.78 3 3 78.95 10.53 10.53 19 0 2 2 10 5
7 Progranimate was speedy and responsive in your usage of it. 75.00 3.00 18.63 3.00 3 84.21 10.53 5.26 19 0 1 2 12 4
8
Adding and editing program components was easy to do: (I.e. Print Read and Assign etc). 77.63 3.11 18.44 3 3 78.95 21.05 0.00 19 0 0 4 9 6
9 Adding and editing variables was easy to do. 77.63 3.11 20.23 3 3 84.21 10.53 5.26 19 0 1 2 10 6
10 Progranimate behaved reliably. 73.68 2.95 26.97 3 3 78.95 10.53 10.53 19 1 1 2 9 6
11 I enjoyed the programming problems. 80.26 3.21 19.68 3 3 89.47 5.26 5.26 19 0 1 1 10 7
12 I found the problems challenging. 23.68 0.95 22.78 0 1 0.00 36.84 63.16 19 8 4 7 0 0
13
The programming problems were at the right level of difficulty for a beginner. 72.37 2.89 20.23 3 3 73.68 21.05 5.26 19 0 1 4 10 4
14 The programming problems were well laid out. 78.95 3.16 15.05 3 3 89.47 42.11 0.00 19 0 0 8 12 5
15 The programming problems were written in a way I could understand. 78.95 3.16 17.21 3 3 84.21 15.79 0.00 19 0 0 3 10 6
16 The web site was easy to use. 72.37 2.89 20.23 3 3 63.16 36.84 0.00 19 0 0 7 7 5
17 Launching Progranimate was easy. 78.95 3.16 19.12 3 3 89.47 5.26 5.26 19 0 1 1 11 6
18 The flowchart representation helped me in thinking up the solutions. 80.26 3.21 17.83 3 3 84.21 15.79 0.00 19 0 0 3 9 7
19
The flowcharts enabled me to understand the solution being developed. 75.00 3.00 22.05 3 3 73.68 21.05 5.26 19 0 1 4 8 6
20 The use of colour on the flowcharts was beneficial. 73.68 2.95 26.97 3 3 78.95 10.53 10.53 19 1 1 2 9 6
21 The animation features helped me understand how a program worked. 76.32 3.05 15.53 3 3 84.21 15.79 0.00 19 0 0 3 12 4
22 I could easily see how pieces of the flowchart related to the lines of code. 77.63 3.11 16.45 3 3 84.21 15.79 0.00 19 0 0 3 11 5
23 I have some (even a little) understanding the code generated. 77.78 3.11 16.91 3 3 83.33 16.67 0.00 18 0 0 3 10 5
24
I felt I learnt something by using Progranimate and solving the problems. 80.26 3.21 15.77 3 3 89.47 10.53 0.00 19 0 0 2 11 6
25 Progranimate is good for the learning of Programming. 87.50 3.50 15.46 4 4 94.44 5.56 0.00 18 0 0 1 7 10
26
I would recommend Progranimate to friends who wanted to learn a bit about programming. 86.11 3.44 15.39 4.00 3.5 94.44 5.56 0.00 18 0 0 1 8 9
27 I would like Progranimate to be used in my school. 80.56 3.22 20.21 4 3 77.78 22.22 0.00 18 0 0 4 6 8
28 Progranimate has positively influenced my interest in programming. 80.56 3.22 16.17 3 3 88.89 11.11 0.00 18 0 0 2 10 6
75.70 3.03 18.93 5.57 5.55 79.32 16.03 5.78 18.89 11 20 85 254 165
AVERAGES TOTALS 0 to 24.9% [0] = Strongly Disagree 25 to 49.9.9% [1] = Disagree 50% [2] = Undecided 50.9 to 74.9% [3] Agree 75 to 100% [4] = Strongly Agree
0 + 1 = Total Disagreement 2 = Total Undecided 3 + 4 = Total Agreement

Flowcharts, Code and Animation in Novice Programming Appendix H – Study 6: Novices Aged 13 to 15
- 405 -
H.B.C Questionnaire Responses for Females Only
Q Question Text Ave% Ave StDev Mode Median Total
Agreement Total
Undecided Total
Disagreement Rsp
Distribution
0 1 2 3 4
1 Programming is something that interests me. 57.50 2.30 23.72 75 62.5 50.00 40.00 10.00 10 1 0 4 5 0
2 I enjoyed using Progranimate. 75.00 3.00 0.58 3 3 84.62 15.38 0.00 13 0 0 2 9 2
3 I enjoyed solving the programming problems 65.38 2.62 19.20 3 3 61.54 30.77 7.69 13 0 1 4 7 1
4 When I first saw Progranimate it looked easy to use. 50.00 2.00 25.00 3 2 46.15 7.69 46.15 13 0 6 1 6 0
5 When I first saw Progranimate it looked interesting. 67.31 2.69 18.78 3 3 69.23 23.08 7.69 13 0 1 3 8 1
6 I found Progranimate easy to use. 63.46 2.54 26.25 2 2 46.15 38.46 15.38 13 0 2 5 3 3
7 Progranimate was speedy and responsive in your usage of it. 65.38 2.62 19.20 2.00 2 46.15 53.85 0.00 13 0 0 7 4 2
8
Adding and editing program components was easy to do: (I.e. Print Read and Assign etc). 69.23 2.77 18.13 3 3 61.54 38.46 0.00 13 0 0 5 6 2
9 Adding and editing variables was easy to do. 73.08 2.92 21.56 2 3 61.54 38.46 0.00 13 0 0 5 4 4
10 Progranimate behaved reliably. 62.50 2.50 13.06 2 3 50.00 50.00 0.00 12 0 0 6 6 0
11 I enjoyed the programming problems. 65.38 2.62 19.20 3 3 61.54 30.77 7.69 13 0 1 4 7 1
12 I found the problems challenging. 34.62 1.38 19.20 1 1 7.69 30.77 61.54 13 1 7 4 1 0
13
The programming problems were at the right level of difficulty for a beginner. 65.38 2.62 16.26 2 3 53.85 46.15 0.00 13 0 0 6 6 1
14 The programming problems were well laid out. 65.38 2.62 12.66 3 3 61.54 76.92 0.00 13 0 0 10 8 0
15 The programming problems were written in a way I could understand. 69.23 2.77 14.98 3 3 69.23 30.77 0.00 13 0 0 4 8 1
16 The web site was easy to use. 67.31 2.69 15.76 3 3 61.54 38.46 0.00 13 0 0 5 7 1
17 Launching Progranimate was easy. 63.46 2.54 16.51 2 2 46.15 53.85 0.00 13 0 0 7 5 1
18 The flowchart representation helped me in thinking up the solutions. 65.38 2.62 16.26 2 3 53.85 46.15 0.00 13 0 0 6 6 1
19
The flowcharts enabled me to understand the solution being developed. 61.54 2.46 19.41 2 2 46.15 46.15 7.69 13 0 1 6 5 1
20 The use of colour on the flowcharts was beneficial. 69.23 2.77 23.17 2 2 46.15 53.85 0.00 13 0 0 7 2 4
21 The animation features helped me understand how a program worked. 57.69 2.31 15.76 2 2 38.46 53.85 7.69 13 0 1 7 5 0
22 I could easily see how pieces of the flowchart related to the lines of code. 63.46 2.54 16.51 2 2 46.15 53.85 0.00 13 0 0 7 5 1
23 I have some (even a little) understanding the code generated. 66.07 2.64 15.83 3 3 57.14 42.86 0.00 14 0 0 6 7 1
24
I felt I learnt something by using Progranimate and solving the problems. 68.75 2.75 18.84 2 3 58.33 41.67 0.00 12 0 0 5 5 2
25 Progranimate is good for the learning of Programming. 68.18 2.73 11.68 3 3 72.73 27.27 0.00 11 0 0 3 8 0
26
I would recommend Progranimate to friends who wanted to learn a bit about programming. 68.18 2.73 11.68 3.00 3 72.73 27.27 0.00 11 0 0 3 8 0
27 I would like Progranimate to be used in my school. 68.18 2.73 19.66 2 3 54.55 45.45 0.00 11 0 0 5 4 2
28 Progranimate has positively influenced my interest in programming. 68.18 2.73 16.17 3 3 63.64 36.36 0.00 11 0 0 4 6 1
64.45 2.58 17.32 5.04 4.77 55.30 39.95 6.13 12.57 2 20 141 161 33
AVERAGES TOTALS 0 to 24.9% [0] = Strongly Disagree 25 to 49.9.9% [1] = Disagree 50% [2] = Undecided 50.9 to 74.9% [3] Agree 75 to 100% [4] = Strongly Agree
0 + 1 = Total Disagreement 2 = Total Undecided 3 + 4 = Total Agreement

Flowcharts, Code and Animation in Novice Programming Appendix H – Study 6: Novices Aged 13 to 15
- 406 -
H.B.D Questionnaire Responses for Year 9’s Only
Q Question Text Ave% Ave StDev Mode Median Total
Agreement Total
Undecided Total
Disagreement Rsp
Distribution
0 1 2 3 4
1 Programming is something that interests me. 75.00 3.00 21.32 100 75 66.67 33.33 0.00 12 0 0 4 4 4
2 I enjoyed using Progranimate. 83.93 3.36 0.74 4 3.5 85.71 14.29 0.00 14 0 0 2 5 7
3 I enjoyed solving the programming problems 78.57 3.14 19.26 3 3 78.57 21.43 0.00 14 0 0 3 6 5
4 When I first saw Progranimate it looked easy to use. 55.36 2.21 34.22 1 2.5 50.00 7.14 42.86 14 1 5 1 4 3
5 When I first saw Progranimate it looked interesting. 73.21 2.93 18.25 3 3 71.43 28.57 0.00 14 0 0 4 7 3
6 I found Progranimate easy to use. 75.00 3.00 27.74 4 3 71.43 14.29 14.29 14 0 2 2 4 6
7 Progranimate was speedy and responsive in your usage of it. 76.79 3.07 18.25 3.00 3 78.57 21.43 0.00 14 0 0 3 7 4
8
Adding and editing program components was easy to do: (I.e. Print Read and Assign etc). 75.00 3.00 21.93 4 3 64.29 35.71 0.00 14 0 0 5 4 5
9 Adding and editing variables was easy to do. 78.57 3.14 21.61 4 3 71.43 28.57 0.00 14 0 0 4 4 6
10 Progranimate behaved reliably. 69.23 2.77 20.80 3 3 69.23 23.08 7.69 13 0 1 3 7 2
11 I enjoyed the programming problems. 80.36 3.21 17.48 3 3 85.71 14.29 0.00 14 0 0 2 7 5
12 I found the problems challenging. 23.21 0.93 22.92 0 1 0.00 35.71 64.29 14 6 3 5 0 0
13
The programming problems were at the right level of difficulty for a beginner. 69.64 2.79 17.48 3 3 64.29 35.71 0.00 14 0 0 5 7 2
14 The programming problems were well laid out. 75.00 3.00 16.98 3 3 78.57 57.14 0.00 14 0 0 8 8 3
15 The programming problems were written in a way I could understand. 78.57 3.14 16.57 3 3 85.71 14.29 0.00 14 0 0 2 8 4
16 The web site was easy to use. 71.43 2.86 21.61 2 3 57.14 42.86 0.00 14 0 0 6 4 4
17 Launching Progranimate was easy. 78.57 3.14 19.26 3 3 78.57 21.43 0.00 14 0 0 3 6 5
18 The flowchart representation helped me in thinking up the solutions. 75.00 3.00 21.13 4 3 66.67 33.33 0.00 15 0 0 5 5 5
19
The flowcharts enabled me to understand the solution being developed. 71.43 2.86 25.68 4 3 57.14 35.71 7.14 14 0 1 5 3 5
20 The use of colour on the flowcharts was beneficial. 71.43 2.86 29.18 4 3 64.29 28.57 7.14 14 1 0 4 4 5
21 The animation features helped me understand how a program worked. 69.64 2.79 22.31 3 3 64.29 28.57 7.14 14 0 1 4 6 3
22 I could easily see how pieces of the flowchart related to the lines of code. 67.86 2.71 20.64 2 2 50.00 50.00 0.00 14 0 0 7 4 3
23 I have some (even a little) understanding the code generated. 75.00 3.00 17.68 3 3 76.92 23.08 0.00 13 0 0 3 7 3
24
I felt I learnt something by using Progranimate and solving the problems. 80.77 3.23 20.80 4 3 76.92 23.08 0.00 13 0 0 3 4 6
25 Progranimate is good for the learning of Programming. 90.91 3.64 12.61 4 4 100.00 0.00 0.00 11 0 0 0 4 7
26
I would recommend Progranimate to friends who wanted to learn a bit about programming. 88.64 3.55 17.19 4.00 4 90.91 9.09 0.00 11 0 0 1 3 7
27 I would like Progranimate to be used in my school. 81.82 3.27 22.61 4 4 72.73 27.27 0.00 11 0 0 3 2 6
28 Progranimate has positively influenced my interest in programming. 81.82 3.27 19.66 4 4 81.82 18.18 0.00 11 0 0 2 4 5
73.99 2.96 20.21 6.64 5.61 69.96 25.93 5.38 13.43 8 13 99 138 123
AVERAGES TOTALS 0 to 24.9% [0] = Strongly Disagree 25 to 49.9.9% [1] = Disagree 50% [2] = Undecided 50.9 to 74.9% [3] Agree 75 to 100% [4] = Strongly Agree
0 + 1 = Total Disagreement 2 = Total Undecided 3 + 4 = Total Agreement

Flowcharts, Code and Animation in Novice Programming Appendix H – Study 6: Novices Aged 13 to 15
- 407 -
H.B.E Questionnaire Responses for Year 10’s Only
Q Question Text Ave% Ave StDev Mode Median Total
Agreement Total
Undecided Total
Disagreement Rsp
Distribution
0 1 2 3 4
1 Programming is something that interests me. 67.65 2.71 26.17 75 75 70.59 17.65 11.76 17 1 1 3 9 3
2 I enjoyed using Progranimate. 73.53 2.94 0.75 3 3 82.35 11.76 5.88 17 0 1 2 11 3
3 I enjoyed solving the programming problems 72.22 2.89 18.96 3 3 77.78 16.67 5.56 18 0 1 3 11 3
4 When I first saw Progranimate it looked easy to use. 63.89 2.56 24.59 3 3 66.67 11.11 22.22 18 0 4 2 10 2
5 When I first saw Progranimate it looked interesting. 72.37 2.89 21.88 3 3 78.95 10.53 10.53 19 0 2 2 11 4
6 I found Progranimate easy to use. 65.28 2.61 21.25 3 3 61.11 27.78 11.11 18 0 2 5 9 2
7 Progranimate was speedy and responsive in your usage of it. 66.67 2.67 19.17 3.00 3 61.11 33.33 5.56 18 0 1 6 9 2
8
Adding and editing program components was easy to do: (I.e. Print Read and Assign etc). 73.61 2.94 15.98 3 3 77.78 22.22 0.00 18 0 0 4 11 3
9 Adding and editing variables was easy to do. 73.61 2.94 20.06 3 3 77.78 16.67 5.56 18 0 1 3 10 4
10 Progranimate behaved reliably. 69.44 2.78 25.08 3 3 66.67 27.78 5.56 18 1 0 5 8 4
11 I enjoyed the programming problems. 69.44 2.78 21.96 3 3 72.22 16.67 11.11 18 0 2 3 10 3
12 I found the problems challenging. 31.94 1.28 20.66 1 1 5.56 33.33 61.11 18 3 8 6 1 0
13
The programming problems were at the right level of difficulty for a beginner. 69.44 2.78 20.21 3 3 66.67 27.78 5.56 18 0 1 5 9 3
14 The programming problems were well laid out. 72.22 2.89 14.57 3 3 77.78 50.00 0.00 18 0 0 9 12 2
15 The programming problems were written in a way I could understand. 72.22 2.89 16.91 3 3 72.22 27.78 0.00 18 0 0 5 10 3
16 The web site was easy to use. 69.44 2.78 16.17 3 3 66.67 33.33 0.00 18 0 0 6 10 2
17 Launching Progranimate was easy. 68.06 2.72 18.80 3 3 66.67 27.78 5.56 18 0 1 5 10 2
18 The flowchart representation helped me in thinking up the solutions. 72.22 2.89 16.91 3 3 72.22 27.78 0.00 18 0 0 5 10 3
19
The flowcharts enabled me to understand the solution being developed. 68.06 2.72 18.80 3 3 66.67 27.78 5.56 18 0 1 5 10 2
20 The use of colour on the flowcharts was beneficial. 72.22 2.89 22.51 3 3 66.67 27.78 5.56 18 0 1 5 7 5
21 The animation features helped me understand how a program worked. 68.06 2.72 14.36 3 3 66.67 33.33 0.00 18 0 0 6 11 1
22 I could easily see how pieces of the flowchart related to the lines of code. 75.00 3.00 14.85 3 3 83.33 16.67 0.00 18 0 0 3 12 3
23 I have some (even a little) understanding the code generated. 69.44 2.78 16.17 3 3 66.67 33.33 0.00 18 0 0 6 10 2
24
I felt I learnt something by using Progranimate and solving the problems. 72.22 2.89 14.57 3 3 77.78 22.22 0.00 18 0 0 4 12 2
25 Progranimate is good for the learning of Programming. 73.61 2.94 15.98 3 3 77.78 22.22 0.00 18 0 0 4 11 3
26
I would recommend Progranimate to friends who wanted to learn a bit about programming. 73.61 2.94 13.48 3.00 3 83.33 16.67 0.00 18 0 0 3 13 2
27 I would like Progranimate to be used in my school. 72.22 2.89 18.96 3 3 66.67 33.33 0.00 18 0 0 6 8 4
28 Progranimate has positively influenced my interest in programming. 72.22 2.89 14.57 3 3 77.78 22.22 0.00 18 0 0 4 12 2
69.28 2.77 18.01 5.50 5.50 69.79 24.84 6.36 17.96 5 27 125 277 74
AVERAGES TOTALS 0 to 24.9% [0] = Strongly Disagree 25 to 49.9.9% [1] = Disagree 50% [2] = Undecided 50.9 to 74.9% [3] Agree 75 to 100% [4] = Strongly Agree
0 + 1 = Total Disagreement 2 = Total Undecided 3 + 4 = Total Agreement

Flowcharts, Code and Animation in Novice Programming Appendix H – Study 6: Novices Aged 13 to 15
- 408 -
H.B.F Averaged Questionnaire Responses Shown By Group Bar Chart
0.00 20.00 40.00 60.00 80.00 100.00
1
2
3
4
5
6
7
8
9
10
11
12
13
14
15
16
17
18
19
20
21
22
23
24
25
26
27
28
Qu
esti
on
s
Average Responce %
Year10s
Year9s
Females
Males
Average Response %

Flowcharts, Code and Animation in Novice Programming Appendix H – Study 6: Novices Aged 13 to 15
- 409 -
H.B.G A Correlation Between Q19 and Performance in the Problem Solving Activities
A correlation of 0.54 was achieved by performing a correlation coefficient between the responses to question 18 and the number of problems solved by each evaluator. This is shown in the chart below.
Correlation between Q18 and Number of Problems Solved = 0.54
0
1
2
3
4
5
6
7
8
9
AH AB AS AW AHN BP CG CH CW DR DN EC HC JW JP
JWD JM NM NR PD RB RM RMY RS RBR SB SJ ST TM ZM
Evaluator Initials
Resp
onse
/ Nu
mbe
r of P
robl
ems
Probs Solved
Q19
Responce
H.B.H A Correlation Between Q19 and Performance in the Problem Solving Activities
A correlation of 0.46 was achieved by performing a correlation coefficient between the responses to question 19 and the number of problems solved by each evaluator. This is shown in the chart below.
Correlation between Q19 and Number of Problems Solved = 0.46
0
1
2
3
4
5
6
7
8
9
AH AB AS AW AHN BP CG CH CW DR DN EC HC JW JP
JWD JM NM NR PD RB RM RMY RS RBR SB SJ ST TM ZM
Evaluator Initials
Resp
onse
/ Nu
mbe
r of P
robl
ems
Probs Solved
Q19
Responce
Q18

Flowcharts, Code and Animation in Novice Programming Appendix H – Study 6: Novices Aged 13 to 15
- 410 -
H.B.I A Correlation between Q21 and Performance in the Problem Solving Activities:
A correlation of 0.48 was achieved by performing a correlation coefficient between the responses to question 21 and the number of problems solved by each evaluator. This is shown in the chart below.
Correlation between Q21 and Number of Problems Solved = 0.48
0
1
2
3
4
5
6
7
8
9
AH
AB
AS
AW
AH
N
BP
CG CH
CW DR
DN
EC
HC
JW JP
JWD JM NM NR
PD
RB
RM
RM
Y
RS
RB
R
SB SJ
ST
TM ZM
Evaluator Initials
Res
pons
e / N
umbe
r of
Pro
blem
s
Probs Solved
Q21
Responce
H.B.J Written Comments Left in the Questionnaire Comments Section.
The red text shows responses from the females. The blue text shows responses from the males. Q1 Comments – Programming is something that interest me, AH: Very Fun. EC: It was interesting figuring things out. ST: I would like to do something with computers as a job. ZM: I don’t find it interesting.
Q2 Comments – I enjoyed using Progranimate. AH: It was fun. AS: It made me think and ask more questions. EC: It was fun. ST: I will download at home. ZM: It does not interest me
Q3 Comments – I enjoyed solving the problems. AH: They were fun. AS: It got on my nerves after a while, because sometimes it would not work. EC: It was the harder things which made it more fun. NM: It got harder each time and more confusing. ZM: It got on my nerves.

Flowcharts, Code and Animation in Novice Programming Appendix H – Study 6: Novices Aged 13 to 15
- 411 -
Q4 Comments – When I first saw Progranimate it looked easy to use. AH: It looked hard. AS: Yeah, it looked simple but it wasn’t. ZM: It did not look complicated. Q5 Comments – When I first saw Progranimate it looked interesting. AS: It had a nice opening page and good name, but it was a trick. NM: Yeah, it looked simple but it wasn’t. ZM: It did not look complicated. Q6 Comments – I found Progranimate easy to use. AS: Understanding it! (response was disagree 1) ASN: The whole thing. (response was agree 3) NM: It got a bit confusing. NR: The boxes (response was 1 disagree) RC: I couldn’t always get the icons to work. ZM: It wasn’t hard, but it wasn’t easy. Q7 Comments – Progranimate was speedy and responsive in your usage of it. AS: What’s that mean? NM: It was something I needed to go on more to get used to. Q8 Comments – Adding and editing program components was easy to do (i.e. Print, Read & Assign atc). AS: Sometimes I got them wrong, hard then. DR: There were certain parts of the course I found quite difficult, but I understood at the end. Q9 Comments – Adding and editing variables was easy to do AS: Nothing, it was easy. DR: Sort of. Q10 Comments –Progranimate behaved reliably. AS: It sometimes confused me when it flashed up pop-up messages. Q11 Comments – I enjoyed the programming problems/ AS: They weren’t problems as such. EC: I enjoyed it because it was figuring things out, and on the computer. NM: The problems got a bit hard. Q13 Comments – The programming problems were at the right difficulty level for a begginer.

Flowcharts, Code and Animation in Novice Programming Appendix H – Study 6: Novices Aged 13 to 15
- 412 -
DR: Could have been easier. JM: Except Animal Shelter problem four, Weekly Food Bill. Q14 Comments – The programming problems were well laid out. DR: Could have been easier. Q15 Comments – The programming problems were written in way I could understand. DR: Not really. Q16 Comments – The website was easy to use. DR: It was all right. Q17 Comments – Launching Progranimate was easy. DR: Only due to the machine I was using as it had strong protection on it which would not allow it to load (DR is talking of the partially complete problems not loading). Q20 Comments – The use of colour on the flowcharts was beneficial. DRR: The colour does not really make a difference. Q30 Comments – What did you like about the whole experience of using Progranimate and solving the problems. AH: Doing the problems AB: I enjoyed the program. I reckon it should be used in all schools and on all servers. AS: It really tackles your mind. AW: Solving the problems was fun. BP: I liked being able to solve the problem while also seeing how it linked in with the chart. CG: I enjoyed using the variables and having a fun and educating experience. CW: It was interesting. I liked the way each step was nice and little. DR: I liked the Chip Shop ideas etc. DRR: I liked the different programming problems. EC: Figuring things out. HC: I thought it was fun and it was at the right level of difficulty. JP: Solving the problems. JM: Learning how to create the program. NM: It had clear instructions to follow. NR: It was fun and I enjoyed it. RM: Helping others. RS: Everything.

Flowcharts, Code and Animation in Novice Programming Appendix H – Study 6: Novices Aged 13 to 15
- 413 -
SJ: Just missing lessons. TM: It was fun and easy. ZM: Different. Q31 Comments –What did you dislike whole experience of using Progranimate and solving the problems. AH: Nothing. AW: Nothing. BP: The problems were too similar. DR: The codes. DRR: The difficulty was quite hard. HC: Nothing. JP: Nothing. JM: When SJ kept messing about. NM: It did get a bit confusing sometimes. RM: When it did not work. RMY: Nothing. SJ: It was hard. ST: It was challenging. TM: No, I did not dislike it. ZM: No interested. Q32 Comments – Do you have any suggestions for improving Progranimate? DR: Make it easier to understand. DRR: Yes, use more animation and make it look more fun. NM: Have step to step instructions for beginners. NR: Yes. ?? SJ: Make it easier. ST: Errors on website. Q33 Comments –Please leave any other comments here:. AW: Progranimate was fun and I hope to use it in the near future. NM: Overall a good program. RM: Well organised, it was a shame when it does not work (loading the partially complete problems). TM: I wish I could do it again.

Flowcharts, Code and Animation in Novice Programming Appendix H – Study 6: Novices Aged 13 to 15
- 414 -
H.C Complete Problem Statistics and Written Comments:
Complete Problem Statistics For All Evaluators

Flowcharts, Code and Animation in Novice Programming Appendix H – Study 6: Novices Aged 13 to 15
- 415 -
H.C.A Completion Statistics for Male and Female Evaluators.
For these statistics only those evaluators in attendance for the whole day have been included. The data is presented in graph and tabular form.
Male and Female Completion Statistics in Tabular Form Pedagogy Stage /
Problem Males = 19 Evaluators Females = 6 Evaluators
Ave Min 1st Qrtle
2nd Qrtle
3rd Qrtle
Max Complete Attempt Ave Min 1st Qrtle
2nd Qrtle
3rd Qrtle
Max Complete Attempt
B Sweet Shop 00:11 00:04 00:08 00:10 00:15 00:17 19 19 00:10 00:07 00:08 00:10 00:12 00:15 6 6
C1 McDullards1 00:19 00:02 00:07 00:14 00:21 00:31 18 18 00:15 00:07 00:10 00:13 00:20 00:25 6 6
C3 McDullards2 00:19 00:02 00:06 00:17 00:33 00:51 17 17 00:27 00:10 00:17 00:27 00:37 00:45 4 4
C4 McDullards3 00:13 00:02 00:05 00:09 00:15 00:48 16 16 00:26 00:12 00:15 00:19 00:22 00:26 3 3
C1 Animal Shelter1
00:13 00:03 00:04 00:08 00:14 00:45 12 14 00:07 00:04 00:04 00:05 00:08 00:10 2 2
C2 Animal Shelter2
00:07 00:03 00:04 00:06 00:10 00:20 9 9 00:06 00:06 00:06 00:06 00:06 00:06 1 1
C3 Animal Shelter3
00:10 00:02 00:05 00:06 00:11 00:32 8 8 00:05 00:05 00:05 00:05 00:05 00:05 1 1
C4 Animal Shelter4
00:13 00:13 00:13 00:13 00:13 00:13 1 1 0 0
D Animal Shelter5
0 0 0 0
Male and Female Completion Statistics in Graph Form
Males = 19 Evaluators Females = 6 Evaluators
19cmp
18cmp
17cmp
16cmp
12cmp
9cmp
8cmp
1cmp
00:00
00:10
00:20
00:30
00:40
00:50
Swee
t Sho
p
McD
ulla
rds1
McD
ulla
rds2
McD
ulla
rds3
Anim
al S
helte
r1
Anim
al S
helte
r2
Anim
al S
helte
r3
Anim
al S
helte
r4
Anim
al S
helte
r5
Min
1st Quartile
2nd Quartile
3rd Quartile
Max
Average
6cmp
6cmp
4cmp
3cmp
2cmp
1cmp1cmp
00:00
00:10
00:20
00:30
00:40
00:50
Swee
t Sho
p
McD
ulla
rds1
McD
ulla
rds2
McD
ulla
rds3
Anim
al S
helte
r1
Anim
al S
helte
r2
Anim
al S
helte
r3
Anim
al S
helte
r4
Anim
al S
helte
r5
Min
1st Quartile
2nd Quartile
3rd Quartile
Max
Average
Study 6 - Male Problem Statistics Study 6 - Female Problem Statistics

Flowcharts, Code and Animation in Novice Programming Appendix H – Study 6: Novices Aged 13 to 15
- 416 -
H.C.B Completion Statistics for Year Nine and Year Ten Evaluators
For these statistics only those evaluators in attendance for the whole day have been included. The data is presented in graph and tabular form.
Year 9 and Year 10 Completion Statistics in Tabular Form Pedagogy Stage /
Problem Males = 19 Evaluators Females = 6 Evaluators
Ave Min 1st Qrtle
2nd Qrtle
3rd Qrtle
Max Complete Attempt Ave Min 1st Qrtle
2nd Qrtle
3rd Qrtle
Max Complete Attempt
B Sweet Shop 00:09 00:04 00:08 00:09 00:10 00:15 10 10 00:12 00:06 00:10 00:13 00:16 00:17 13 13
C1 McDulards1 00:11 00:02 00:07 00:12 00:17 00:21 10 10 00:16 00:02 00:10 00:17 00:22 00:31 13 13
C3 McDulards2 00:11 00:02 00:05 00:09 00:11 00:33 9 9 00:29 00:02 00:20 00:35 00:39 00:51 11 11
C4 McDullards3 00:11 00:03 00:05 00:05 00:14 00:32 9 9 00:17 00:02 00:06 00:15 00:20 00:45 10 10
C1 Animal Shelter1
00:12 00:03 00:04 00:07 00:13 00:45 8 8 00:15 00:04 00:04 00:10 00:13 00:45 5 7
C2 Animal Shelter2
00:8 00:03 00:03 00:07 00:10 00:20 8 8 00:06 00:06 00:06 00:06 00:06 00:06 1 1
C3 Animal Shelter3
00:11 00:05 00:05 00:06 00:12 00:32 7 7 00:02 00:02 00:02 00:02 00:02 00:02 1 1
C4 Animal Shelter4
00:13 00:13 00:13 00:13 00:13 00:13 1 1 0 0
D Animal Shelter5
0 0 0 0
Year 9 and Year 10 Completion Statistics in Graph Form
10cmp
10cmp
9cmp 9cmp
8cmp
8cmp
7cmp
1cmp
00:00
00:10
00:20
00:30
00:40
00:50
Swee
t Sho
p
McD
ulla
rds1
McD
ulla
rds2
McD
ulla
rds3
Anim
al S
helte
r1
Anim
al S
helte
r2
Anim
al S
helte
r3
Anim
al S
helte
r4
Anim
al S
helte
r5
Min
1st Quartile
2nd Quartile
3rd Quartile
Max
Average
13cmp
13cmp
11Cmp
10cmp 5cmp
1cmp
1cmp
00:00
00:10
00:20
00:30
00:40
00:50
Swee
t Sho
p
McD
ullard
s1
McD
ullard
s2
McD
ullard
s3
Animal S
helte
r1
Animal S
helte
r2
Animal S
helte
r3
Animal S
helte
r4
Animal S
helte
r5
Min
1st Quartile
2nd Quartile
3rd Quartile
Max
Average
Study 6 – Year 9 Problem Statistics Study 6 – Year 10 Problem Statistics

Flowcharts, Code and Animation in Novice Programming Appendix H – Study 6: Novices Aged 13 to 15
- 417 -
H.C.C Complete List of Problem Comments:
H.C.C.A Introductory B1 - Problem Comments: The Sweet Shop
Did you have any problems completing this task? If so what were they? CG: No, I found this task easy to understand. EG, RS: We didn’t really have any difficulties, apart from a small mistake where we typed on weight instead of cost. Although, this was fixed easily. RBR: No, I didn’t have any problems with this software. It was really easy in fact and I would like to use this program. PD, LG: Understanding the complicated words in the instructions. TM, RM: We got stuck on when we got to putting in the weight of sweets, but we done it in the end. SB: No, I got along fine.
Did you require any help from friends? If so what did they help with? CB , BD: Once, missed out a quote. AH: Yes, the end Print Line. AHN: They helped me with the second but when you have to press Read then Printline. RBR: No, the booklet helped me in what to do. PD, LG: They helped with spelling. DRR, JW: My partner helped while I read it outland tested it.
Did you get any help from the tutor or teaching staff? ZM: Yes, but only one thing. The assign thing unit. CB , BD: Once, missed out a quote. DR: The part when one or two of the popups occurred, but nothing as such. AS: Yes, but only one thing, the assign thing.

Flowcharts, Code and Animation in Novice Programming Appendix H – Study 6: Novices Aged 13 to 15
- 418 -
H.C.C.B Problem 1A Comments: McDullards 1
Did you have any problems completing this task? If so what were they? BP: At the start the program would not load correctly. CG: I had a slight difficulty with ensuring all things, e.g. double quotes. AS: Yes, just the read part. EG, RS: We forgot to type in the quantity of chips, so our program did not work at first. AHN: The program didn’t work. RB, DN, SD: Yes, we got mixed up a little bit. RBR: No, this software is easy to use. I found this task quite easy and fun, and I recommend it. The guide was really simple to follow as well. PD, LG: We couldn’t load Progranimate. TM, RMY: I got confused with what to do. CW: To begin with the program would not load up, but after re-loading and starting from scratch I completed it.
Did you require any help from friends? If so what did they help with? CB , BD: Yes, helped us complete it. AS: No, I helped them. DRR, JW: My friend helped while I read it out lound tested it.
Did you get any help from the tutor or teaching staff? BP: They helped me reload Progranimate so that it worked correctly. AS: Just the Read part. EG,RS: We asked the teacher what we had missed off. AHN: They helped me run the flowchart and helped me run the program. CW: Yes, the program was not starting and we had to re-load it.

Flowcharts, Code and Animation in Novice Programming Appendix H – Study 6: Novices Aged 13 to 15
- 419 -
H.C.C.C Problem 1B Comments: McDullards 2
Did you have any problems completing this task? If so what were they? CG: Yes, some of my assigns had not been altered from the first one. AW: Couldn’t add up the sums. RBR: No, I had a little help from my friend to show me what to write, but that was the only difficulty. TM, RMY: Yes, trying to add the two together. SB: Sorting out the assignments and placing things in the right order.
Did you require any help from friends? If so what did they help with? RBR: Some words to write in the assign. DRR, JW: My friend read out the things. Did you get any help from the tutor or teaching staff? HC: I got the thing the wrong way round, which got me confused, and the tutor helped me. CG: Yes, I needed some help as I didn’t know my assigns were wrong. AHN: They helped me how to assign. AW: Adding up the sums.
H.C.C.D Problem 1B Comments: McDullards 3
Did you have any problems completing this task? If so what were they? RBR: Where to add the assign and read. TM, RMY: It was all done easy. SB: No, I now understand how to expand the program.
Did you require any help from friends? If so what did they help with? DRR, JW: My friend read out the things. Did you get any help from the tutor or teaching staff?

Flowcharts, Code and Animation in Novice Programming Appendix H – Study 6: Novices Aged 13 to 15
- 420 -
No comments made.
H.C.C.E Problem 2A: Comments: Cardiff Animal Shelter 1
No comments made.
H.C.C.F Problem 2B Comments: Cardiff Animal Shelter 2
No comments made.
H.C.C.G Problem 2C Comments: Cardiff Animal Shelter 3
Did you have any problems completing this task? If so what were they? TM:There was no trouble, it was hard to see if it was working. Did you require any help from friends? If so what did they help with? No comments made. Did you get any help from the tutor or teaching staff?
No comments made
H.C.C.H Problem 2D Comments: Cardiff Animal Shelter 4 Comments
Did you have any problems completing this task? If so what were they? TM: It was hard to get the money right. Did you require any help from friends? If so what did they help with? No comments made Did you get any help from the tutor or teaching staff?
No comments made

Flowcharts, Code and Animation in Novice Programming Appendix I – Study 7: Secondary School Teachers
- 421 -
APPENDIX I – STUDY 7: Secondary School Teachers Opinions
CONTENTS
D.A Participant Information ...................................................................................................................... 422
D.B Profiling Questionnaire Results ......................................................................................................... 422
Summarised Results .................................................................................................................................... 422
Individual Responses ................................................................................................................................... 423
D.C Perspectives of Progranimate Questionnaire Results ......................................................................... 425
D.D Questionnaire Printouts for Study Seven. .......................................................................................... 427
Profiling Questionnaire Printout .................................................................................................................. 427
Perspectives of Progranimate Questionnaire Printout ................................................................................. 428
DESCRIPTION: This appendix provides all of the information retrieved from study seven. This study was conducted on the university campus with teachers from secondary schools local to the University of Glamorgan (years ten and eleven). It is organised into sub sections A to D. Section A contains participant information, within which the participants’ names have been abbreviated for data protection and to safeguard any potential embarrassment. Section B shows the results from the profiling questionnaire including those that were not included in the main body of the thesis for study seven. In this section is displayed the summarised results of each study and the individual responses from each evaluator. Section C provides the complete results from the perspectives of Progranimate questionnaire. In this section are the responses from each evaluator included the average response, total agreement, indecision and disagreement displayed as a percentage. Section D contains printouts of the two questionnaires given to the teachers of this study.

Flowcharts, Code and Animation in Novice Programming Appendix I – Study 7: Secondary School Teachers
- 422 -
I.A Participant Information
The participants of the study were ten secondary school teachers from South Wales (UK) schools located within the proximity of the University of Glamorgan. For data protection, the institutions are not identified, and the teachers’ names are abbreviated to initials.
The Participants Providing Data For The Evaluation Initials
AT
ATR
DI
GE
GT
MD
RG
TER
Participants Providing Data 10
I.B Profiling Questionnaire Results
Contained in this section are the summarised and individual responses from the profiling questionnaires given to the teachers at the beginning of the evaluation session. Some of the questions shown in this section were not included within the thesis, in particular the exam board related questions.
I.B.A Summarised Results
Summary of Teacher Related Questions from the Profiling Questionnaire
Q Question Text RSP Yes No
1 Is Computing and/or ICT your main teaching subject?
10 9 1
2 What programming languages do you know?
RSP VB Java Pascal Basic PHP None
10 5 2 3 1 1 5
4 Rate your programming knowledge.
RSP None Rusty VB Basic Intermediate Good Advanced
10 1 1 1 1 1 2 0
5
I do not have the time to learn programming so that I may teach it.
RSP Strongly Disagree Disagree Undecided Agree
Strongly Agree
Averaged %
Agree %
Undecided %
Disagree %
10 0 2 0 4 2 55% 60% 0% 20%
13
In computing subjects roughly what percentage of the students are female?
RSP Year7 Year8 Year9 Year10 GCSE AS A2
8 50.00% 50.00% 50.00% 42.00% 44.00% 33.00% 33.83%
14
Do you think programming should be taught to high school students studying ICT?
RSP Yes No
6 4 2
15
At what age do you think it beneficial to teach programming to students (tick as many as necessary).
RSP Year7 Year8 Year9 GCSE AS A2
8 0 1 4 8 7 0

Flowcharts, Code and Animation in Novice Programming Appendix I – Study 7: Secondary School Teachers
- 423 -
Summary of Institution Related Questions from the Profiling Questionnaire
Q Question Text RSP Yes No
3 Do you or your colleagues teach any computer programming at your school?
0 4 6
6 At what levels does your school offer the following computing related subjects (tick as many as necessary)
RSP Subject Year7 Year8 Year9 GCSE AS A2
9 ICT 8 8 8 8 8 8
Computing 0 0 0 0 4 4
8 If you answered yes to question three, at what levels does your school teach programming?
RSP Year7 Year8 Year9 GCSE AS A2
6 0 1 0 3 5 0
9 What programming languages are taught at your school? RSP VB.NET VB6.0 VBA Java Pascal C C# Basic
5 2 2 1 0 0 0 0 0
Summary of Examination Board Related Questions from the Profiling Questionnaire
Q Question Text RSP WJEC EDEXCEL
7 What examination board does your school use for computing? 9 7 2
10 Does the syllabus of the examination board make it difficult to include programming in the curriculum?
RSP Yes No
8 4 4
11 At what levels is the teaching of Programming mandatory within your examination board's ICT / Computing syllabus?
RSP GCSE AS A2
7 0 3 4
12 At what levels can the teaching of programming be accommodated within your examination boards ICT / Computing syllabus?
RSP GCSE AS A2
8 0 7 7
I.B.B Individual Responses
Individual Responses to Teacher Related Questions from the Profiling Questionnaire
Q Question Text GT TER RG AT DI MP MD JM ATR GE
1 Is Computing and/or ICT your main teaching subject? Y Y Y Y Y N Y Y Y Y
2 What programming language(s) do you know? None None VB, Pascal
VB, Pascal, Basic None None
VB, Java PhP None
Pascal, VBA
VBA, Java
4 Rate your programming knowledge using the options below (Tick one) None None Intermediate Good Rusty None Good None Basic
Very Basic
5 I do not have the time to learn programming, so that I may teach it. Disagree
Strongly Agree Agree Agree
Strongly Agree Agree Agree Disagree
14 Do you think programming should be taught to high school students studying ICT? Y Y N Y N Y
15
At what age do you think it beneficial to teach programming to students? (tick as many as necessary)
GCSE, AS, A2 AS
GCSE, AS, A2
GCSE, AS, A2 AS, A2 AS. A2 AS, A2
Y9, GCSE, AS, A2

Flowcharts, Code and Animation in Novice Programming Appendix I – Study 7: Secondary School Teachers
- 424 -
Individual Responses to Institution Related Questions from the Profiling Questionnaire Q Question Text GT TER RG AT DI MP MD JM ATR GE
3
Do you or any colleagues teach any computer programming at your school (at any level)? N N N Y Y N Y Y Y Y
6
At what levels does your school offer the following computing related subjects: (Tick as many as necessary)
ICT:
Y7,Y8, Y9, GCSE, AS, A2
Y7,Y8, Y9, GCSE
Y7,Y8, Y9, GCSE, AS,A2
Y7,Y8, Y9, GCSE, AS, A2
Y7,Y8, Y9, GCSE, AS, A2
Y7,Y8, Y9, GCSE, AS, A2
AS, A2
Y7,Y8, Y9, GCSE, AS, A2
Y7,Y8, Y9, GCSE, AS, A2
Computing: None None None A2, AS AS, A2 None AS, A2 AS, A2 None
8
If you answered yes to question 3, please tell us at what levels your school teaches programming? (Tick as many as necessary) AS, A2 AS, A2 A2
AS, A2 AS, A2 Y9, A2
9
What programming language(s) are taught at your school? VB6 VB.NET VB6 VB6 VB.NET
13
In computing subjects roughly what percentage of the students are female in each year? (fill as many as poss)
Y7: 50% Y8: 50% Y9, :50% AS: 70% A2: 40%
AS: 20% A2: 10%
GCSE: 40% AS: 30% A2: 30%
GCSE: 50% AS: 40 % A2: 50%
Y7: 50% Y8: 50% Y9, :50% GCSE: 40% AS: 33% A2: 33%
Y7: 50% Y8: 50% Y9, :50% GCSE:50% AS: 40% A2: 40%
Individual Responses to Examination Board Related Questions from the Profiling Questionnaire Q Question Text GT TER RG AT DI MP MD JM ATR GE
7 What examination board does your school use for computing? EdExcel N/A N/A WJEC WJEC WJEC EdExcel WJEC WJEC
10 Does the syllabus of the examination board make it difficult to include programming in the curriculum? Y N Y N N Y Y N
11
At what level is the teaching of Programming mandatory within your examination board’s ICT / Computing syllabus? (Tick as many as necessary) None None None
AS, A2 AS, A2 None A2 None AS,A2 None
12
At which levels can the examination boards ICT / Computing syllabus accommodate the teaching of programming? (Tick as many as necessary) AS. A2 AS, A2 N/A AS,A2 AS, A2 AS, A2 AS, A2 AS, A2

Flowcharts, Code and Animation in Novice Programming Appendix I – Study 7: Secondary School Teachers
- 425 -
I.C Perspectives of Progranimate Questionnaire Results
Contained in this section are the teacher evaluators’ individual responses to the perspectives of Progranimate Questionnaire. The standard deviation and median for each question is shown in the main body of the thesis for study seven. The averaged response, total agreement, indecision and disagreement are shown as a percentage as described in the legend below the table.
Individual Responses to the Perspectives of Progranimate Questionnaire Questions 1 to 14
Q Question Text AT ATR DI GE GT MD RG TER Average Agree Undecided Disagree
1
Progranimate would be useful for teaching Programming to high school students. 4 3 4 3 3 4 4 4 90.63% 100.00% 0.00% 0.00%
2
The problem solving exercises would help high school pupils engage with problem solving. 4 3 4 4 3 3 4 4 90.63% 100.00% 0.00% 0.00%
3
Using Progranimate would teach valuable skills to a high school students. 4 2 4 4 3 3 4 4 87.50% 87.50% 12.50% 0.00%
4
Progranimate would make it easier for me to learn programming so that I may teach it. 2 3 4 4 3 3 4 4 84.38% 87.50% 12.50% 0.00%
5
It would not take long to learn Progranimate to the level where I could teach using it. 4 3 4 3 2 3 4 4 84.38% 87.50% 12.50% 0.00%
6 Progranimate would make it easy for me to teach programming. 3 3 3 3 2 3 4 4 78.13% 87.50% 12.50% 0.00%
7
Progranimate would aid someone with limited programming knowledge to teach Programming. 2 3 3 2 3 3 3 4 71.88% 75.00% 25.00% 0.00%
8
The problem solving exercises are appropriate for high school students. 3 2 4 4 3 4 4 85.71% 85.71% 14.29% 0.00%
9
The teaching of programming via Progranimate could fit nicely within a computing syllabus. 3 3 4 3 3 4 4 85.71% 100.00% 0.00% 0.00%
10
Given online access, learning Progranimate and integrating it into the syllabus is something I could do without too much work. 4 2 4 3 1 4 4 78.57% 71.43% 14.29% 14.29%
11
WITHOUT ready made problem solving exercises and other learning materials I would find it easy to teaching programming using the tool. 3 2 0 1 2 3 2 46.43% 28.57% 42.86% 28.57%
12
WITH ready made problem solving exercises and other learning materials I would find it easy to teach programming using the tool. 3 3 4 3 3 4 4 85.71% 100.00% 0.00% 0.00%
13
WITHOUT supplied learning material etc integrating Progranimate within the syllabus would be too big a burden for me in an already busy schedule. 1 2 2 1 3 3 4 57.14% 42.86% 28.57% 28.57%
14
WITH supplied learning material integrating Progranimate within the syllabus would be too big a burden for me in an already busy schedule. 1 2 3 3 1 1 1 42.86% 28.57% 14.29% 57.14%
0 to 24.9% [0] = Strongly Disagree 25 to 49.9.9% [1] = Disagree 50% [2] = Undecided 50.9 to 74.9% [3] Agree 75 to 100% [4] = Strongly Agree
0 + 1 = Total Disagreement 2 = Total Undecided 3 + 4 = Total Agreement

Flowcharts, Code and Animation in Novice Programming Appendix I – Study 7: Secondary School Teachers
- 426 -
Individual Responses to the Perspectives of Progranimate Questionnaire Questions 15 and 15 Q Question Text AT ATR DI GE GT MD RG TER
Q15
At what ages do you think it would be possible to teach programming using Progranimate with learning material and the problem solving exercises? (Tick as many as necessary)
GCSE, AS, A2
GCSE, AS, A2
Y7, Y8, Y9, GCSE, AS, A2
Y9, GCSE, AS, A2
GCSE, AS, A2
GCSE, AS, A2
Y8, Y9, GCSE, AS, A2
Q16
At what ages do you think it would be beneficial to teach programming using Progranimate with learning material and the problem solving exercises?
GCSE, AS, A2 GCSE
GCSE, AS, A2
Y9, GCSE, AS, A2
Y9, GCSE, AS, A2 AS, A2
GCSE, AS, A2
Individual Written Responses to the Perspectives of Progranimate Questionnaire Questions 17 and 18 Q Question Text Eval Written Response.
17
In the scenario that programming is required within the ICT syllabus, what potential problems or difficulties would you have integrating it within your teaching repertoire?
AT None that I can immediately think of.
GE Exercises and teacher knowledge.
MD None.
RG Time constraints - contact time.
TER With a solution such as Progranimate it would be easier and fun for pupils.
18
Would integrating the teaching of programming via Progranimate within the ICT syllabus place undue burden on you as a teacher?
AT No, it would serve as a useful tool for problem solving.
ATR No.
DI No.
GE Not if a scheme of work that matched the curriculum was provided.
MD Yes to start with it would involve a lot of work with other staff in the department to get it setup/started.
RG Within ICT - Yes
TER No.
I.D Views on Suitable Ages for Programming Instruction at the start and end of the study
The table below compares the ages at which the teachers view it beneficial to teach programming to students before and after their exposure to Progranimate. Those in red ink are those who’s original opinions were exceeded.
Opinions of School Levels Suitable for Programming Instruction at the Start end End of the Evaluation
Teacher
Initials
Profiling Questions
Q15: At what age do you think it beneficial to teach programming to students?
Perspectives of Progranimate
Q15 At what ages do you think it would be possible to teach programming using Progranimate with learning material and the problem solving exercises?
Perspectives of Progranimate Q16: At what ages do you think it would be beneficial to teach programming using Progranimate with learning material and the problem solving exercises?
AT GCSE, AS, A2 GCSE, AS, A2 GCSE, AS, A2
MD AS, A2 GCSE, AS, A2 GCSE
RG GCSE, AS, A2 GCSE, AS, A2 AS, A2
ATR AS,A2 GCSE, AS, A2 GCSE, AS, S2
GE Year9, GCSE, AS, A2 Year9, GCSE, AS, A2 Year9, GCSE, AS, A2
DI AS, A2 Year7, Year8, Year 9, GCSE, AS, A2 GCSE, AS, A2
TER AS Year8, Year9 GCSE, AS, A2 GCSE, AS, A2

Flowcharts, Code and Animation in Novice Programming Appendix I – Study 7: Secondary School Teachers
- 427 -
I.E Questionnaire Printouts for Study Seven.
I.E.A Profiling Questionnaire Printout

Flowcharts, Code and Animation in Novice Programming Appendix I – Study 7: Secondary School Teachers
- 428 -
I.E.B Perspectives of Progranimate Questionnaire Printout

Flowcharts, Code and Animation in Novice Programming Appendix J – Study 8 – University Evaluations
- 429 -
APPENDIX J Study 8 – University Evaluation
Description: This section contains a copy of the questionnaire that was given out to the Glamorgan and Manchester students of study 8. As all the relevant information was presented in chapter 9, no additional statistics are provided in this section.
J.A The Study 8 Questionnaire

Flowcharts, Code and Animation in Novice Programming Appendix J – Study 8 – University Evaluations
- 430 -