Using fish landing sites and markets information towards ...
12
Fish Manag Ecol. 2019;26:141–152. wileyonlinelibrary.com/journal/fme | 141 © 2019 John Wiley & Sons Ltd 1 | INTRODUCTION Fisheries occupy a significant place in the socio-economic devel- opment of many countries (Aura et al., 2018; Njiru, Aura & Okechi, 2018; Woodhead, Abernethy, Szaboova & Turner, 2018). For ex- ample, Kenya’s fisheries sector contributes about 4.7% of the country’s Gross Domestic Product (GDP) (Mulatu, Oel, Odongo & van der Veen, 2018). Total fishery and aquaculture production is about 186,700 t, with 83% coming from inland capture fisheries (FAO, 2016). The marine sub-sectors have an annual potential of between 150,000 and 300,000 t (KMFRI, unpublished data). The marine capture fisheries are composed of coastal and nearshore artisanal, semi-industrial and offshore industrial fisheries. The local coastal communities exploit artisanal and semi-industrial fisheries while the industrial fisheries are exploited by foreign fishing com- panies (Fisheries Bulletin, 2016). Uganda’s major fishery is from Lake Victoria located in its 43% portion of the entire lake, whereas Kenya has only 6% and Tanzania 51% (Njiru et al., 2012). Uganda’s total Received: 17 September 2018 | Revised: 5 December 2018 | Accepted: 21 December 2018 DOI: 10.1111/fme.12334 ORIGINAL ARTICLE Using fish landing sites and markets information towards quantification of the blue economy to enhance fisheries management Christopher Mulanda Aura 1 | Chrisphine S. Nyamweya 1 | James M. Njiru 2 | Cyprian Odoli 1 | Safina Musa 3 | Zachary Ogari 1 | Richard Abila 4 | Raphael Okeyo 1 | Robert Oketch 1 1 Kenya Marine and Fisheries Research Institute, Kisumu, Kenya 2 Kenya Marine and Fisheries Research Institute, Mombasa, Kenya 3 Kenya Marine and Fisheries Research Institute, Kisii, Kenya 4 International Fund for Agricultural Development of the UN, Rome, Italy Correspondence Christopher Mulanda Aura, Kenya Marine and Fisheries Research Institute, Kisumu, Kenya. Emails: [email protected]; [email protected] Abstract Fisheries management uses important fish market information and information from Communication Technology (ICT) to improve fish trade by identifying inefficiencies, inequity and post-harvest losses. The current study reports fisheries output using ICT at major landing sites and markets in Kenya and Uganda from the Kenya Marine and Fisheries Research Institute (KMFRI) Enhanced Fish Market Information Service (EFMIS) database for 2009 – 2017. Catch assessment survey data validated the use of market data in drawing conclusions. Regional Frame Survey data provided infor- mation before EFMIS, enabling comparisons of fish trade costings. The average quan- tity of fish traded in Kenya depended on seasons of active lake fishing, which occurs in January – March and August – October, while Uganda had an irregular pattern associated with fish trade throughout the year. The quantity of fish traded weekly depended on the average price of fish. Lower sales margins during the EFMIS project showed the merits of information sharing using ICT platforms for efficient and equi- table fish trade. Such evaluation of fish market information is useful in fish trade policy formulation and for fisheries management and ecological sustainability in rural and peri-urban communities. KEYWORDS blue economy, fisheries, information and communication technology, landing site, management, market
-
Upload
khangminh22 -
Category
Documents
-
view
0 -
download
0
Transcript of Using fish landing sites and markets information towards ...

Fish Manag Ecol. 2019;26:141–152. wileyonlinelibrary.com/journal/fme | 141© 2019 John Wiley & Sons Ltd
1 | INTRODUC TION
Fisheries occupy a significant place in the socio- economic devel-opment of many countries (Aura et al., 2018; Njiru, Aura & Okechi, 2018; Woodhead, Abernethy, Szaboova & Turner, 2018). For ex-ample, Kenya’s fisheries sector contributes about 4.7% of the country’s Gross Domestic Product (GDP) (Mulatu, Oel, Odongo & van der Veen, 2018). Total fishery and aquaculture production is about 186,700 t, with 83% coming from inland capture fisheries
(FAO, 2016). The marine sub- sectors have an annual potential of between 150,000 and 300,000 t (KMFRI, unpublished data). The marine capture fisheries are composed of coastal and nearshore artisanal, semi- industrial and offshore industrial fisheries. The local coastal communities exploit artisanal and semi- industrial fisheries while the industrial fisheries are exploited by foreign fishing com-panies (Fisheries Bulletin, 2016). Uganda’s major fishery is from Lake Victoria located in its 43% portion of the entire lake, whereas Kenya has only 6% and Tanzania 51% (Njiru et al., 2012). Uganda’s total
Received:17September2018 | Revised:5December2018 | Accepted:21December2018DOI: 10.1111/fme.12334
O R I G I N A L A R T I C L E
Using fish landing sites and markets information towards quantification of the blue economy to enhance fisheries management
Christopher Mulanda Aura1 | Chrisphine S. Nyamweya1 | James M. Njiru2 | Cyprian Odoli1 | Safina Musa3 | Zachary Ogari1 | Richard Abila4 | Raphael Okeyo1 | Robert Oketch1
1Kenya Marine and Fisheries Research Institute, Kisumu, Kenya2Kenya Marine and Fisheries Research Institute, Mombasa, Kenya3Kenya Marine and Fisheries Research Institute, Kisii, Kenya4International Fund for Agricultural Development of the UN, Rome, Italy
CorrespondenceChristopher Mulanda Aura, Kenya Marine and Fisheries Research Institute, Kisumu, Kenya.Emails: [email protected]; [email protected]
AbstractFisheries management uses important fish market information and information from Communication Technology (ICT) to improve fish trade by identifying inefficiencies, inequity and post- harvest losses. The current study reports fisheries output using ICT at major landing sites and markets in Kenya and Uganda from the Kenya Marine and Fisheries Research Institute (KMFRI) Enhanced Fish Market Information Service (EFMIS) database for 2009 – 2017. Catch assessment survey data validated the use of market data in drawing conclusions. Regional Frame Survey data provided infor-mation before EFMIS, enabling comparisons of fish trade costings. The average quan-tity of fish traded in Kenya depended on seasons of active lake fishing, which occurs in January – March and August – October, while Uganda had an irregular pattern associated with fish trade throughout the year. The quantity of fish traded weekly depended on the average price of fish. Lower sales margins during the EFMIS project showed the merits of information sharing using ICT platforms for efficient and equi-table fish trade. Such evaluation of fish market information is useful in fish trade policy formulation and for fisheries management and ecological sustainability in rural and peri- urban communities.
K E Y W O R D S
blue economy, fisheries, information and communication technology, landing site, management, market

142 | AURA et Al.
annual production is about 217,000 t valued at US$ 72,468 million (http://www.fao.org/fi/oldsite/FCP/en/UGA/body.htm). Lakes and reservoirs are recognised as important income and employment generators in both nations, as they stimulate the growth of a number of subsidiary industries, and are a source of cheap and nutritious food besides being a foreign exchange earner. More importantly, fisheries are a source of livelihoods for a large section of an eco-nomically backward population in rural and peri- urban communities (Gangadhar, 2011; Njiru et al., 2018).
Inland and marine ecosystems sustain more than 70 million peo-ple in most parts of Kenya, Uganda and Tanzania through fisheries, transport, water for domestic, agricultural and industrial uses. The endowment of the East African region with rich fisheries resources presents myriad opportunities for economic and social transforma-tion of the local people. The majority of this target population is from rural communities who rely mainly on mobile phones to access mar-ket information (Abila et al., 2012; Aura et al., 2017, 2018). Market information is a key factor influencing sellers and buyers’ decisions and choices in the market regarding what, quantity, price, and when and where to sell or buy, which could help further quantify the ac-tual value of aquatic resources under the “Blue Economy” concept. Communication facilities and relevant knowledge such as market information are vital to the initiation of policies to support fair com-petition in local and global markets (Aura et al., 2018). Information on prices and availability can be shared across fisheries value chains, diminishing the exploitation of smaller or otherwise disadvantaged rural populations, such as women, who play a dominant role in post- harvest fisheries trade and processing by middlemen, while reducing wastage and volatility of fish prices (Gangadhar, 2011).
However, such market information is not readily available to most small- scale producers in both coastal and inland fisheries, thus giv-ing undue advantage to those with access to information (Agboola, Azizul, Rasidi & Said, 2018). Intermediaries higher up the fish value chain tend to have greater access to market information, conse-quently taking advantage of producers at the lower end (Kambewa, van Tilburg & Abila, 2007). Globally, fisheries market information loopholes and the resulting inequities in the commodity value chain are being addressed through Information and Communication Technology (ICT) systems.
For example, in many countries such as Sri Lanka, Japan and The Netherlands, ICT is widely used in applications relevant to fisheries such as Global Positioning Systems (GPS) for navigation and loca-tion finding, mobile phones for trading, information exchange and emergencies, Satellite Remote Sensing (RS) for fishery forecasting and culture site selection, and radio for communication with fishers (Wimalasena, Dahanayaka & Amaralal, 2016). Currently, NetFish is a worldwide programme for development of a mobile phone applica-tion for fisheries data collection (http://netfish.org/). ABALOBI is a mobile application suite and programme that is aimed at social jus-tice and poverty alleviation in the small- scale fisheries chain (http://abalobi.info/). It has transformed South Africa in the way knowledge is produced, improved stewardship of marine resources, and resil-ience in the wake of climate change. Additionally, in South Africa, the
Blue Venture programme has been applied to nurture and sustain locally led marine conservation (https://blueventures.org/).
In East Africa, the Enhanced Fish Market Information Service (EFMIS) project has been ongoing since 2009. EFMIS is an ICT pilot project based on mobile phones, which is being implemented in Kenya and Uganda and with possibilities of upscaling to other East African countries. It is a system for generating, packaging and disseminating essential market information from fish landing sites around the lakes and marine sources and markets in major urban areas across the participating countries. Currently, through mobile phones, the aim of EFMIS programme is to indicate the landings in terms of species and prices at beaches and markets. This is to ensure that fishers can locate where wholesalers are paying the best prices and boat crews can cut deals while at sea.
Thus, to realise sustainable socio- economic development under the “Blue Economy” concept in fisheries rural communities in East Africa and other global artisanal fishing regions, there is need to evaluate pol-icies for accessing and quantification of fish marketing information by rural communities using ICT. The assessment will help in determining the benefits and the lessons to be learnt from ICT projects such as the EFMIS in artisanal fishing communities as a decision support tool in fisheries marketing, management and policy formulation. Therefore, the current study aimed at highlighting values needed for quantifica-tion of fisheries output using fish market information in East Africa, to identify gaps for fish food and by- products for policy formulations from the major fisheries in lead landing and market sites as a case study. This information will be useful in driving the “Blue Economy” concept for fisheries management and ecological sustainability.
2 | METHODS
2.1 | Study area
The major landing sites and markets in Kenya and Uganda involved in the EFMIS project are shown in Figure 1. Unlike Kenya, Uganda mainly relies on inland fisheries because it is land- locked. Natural water bodies cover some 42,000 km2, or about 18% of Uganda’s total area, and fisheries play a critical role as a foundation of subsistence and commercial livelihoods. Lake Victoria is by far the largest and eco-nomically most important of the national fisheries. However, other large lakes, including George, Edward, Albert, and Kyoga, along with the River Nile and a great variety of minor lakes around each of the large lakes, swamps and streams, also contribute to the annual na-tional catch (http://www.fao.org/fi/oldsite/FCP/en/UGA/body.htm).
Inland fisheries are the most important fisheries in Kenya, with L. Victoria dominating fish production, contributing over 80% of the total fish landings (KMFRI, unpublished data). Besides Lake Victoria, other freshwater fish sources include lakes Turkana, Baringo, Jipe, Naivasha, several dams and rivers spread across the country collec-tively producing 3% of total fish production and with a surface area of 18,029 km2. Marine and aquaculture fisheries constitute 4% and 1%, respectively, of the fish landed (FAO, 2016). Kenya’s Exclusive Economic Zone (EEZ) covers 200 nautical miles from the coastline

| 143AURA et Al.
(FAO, 2009). The marine fishery mostly operates within a narrow continental shelf confined to a small strip of 2.5 to 3.0 nautical miles (Samoilys, Maina & Osuka, 2011). Kenya’s marine coastline is about 640 km long covering an area of about 83,603 km2 (Newell, 1959). The coastal region of Kenya has approximately 3.3 million inhabi-tants. The economy of these communities depends mainly on arti-sanal fishing, small- scale farming, livestock husbandry, subsistence forestry and small businesses. Although the inland and marine re-sources provide many opportunities for economic growth and re-duction of poverty, their unsustainable management has contributed to the degradation of the resource base as a result of high human population pressure (Government of Kenya Report, 2012). The small- scale fisheries of Kenya and Uganda contribute the greatest proportion of the catches and employ the highest number of fishers.
2.2 | Sourcing of data
Data spanning 2009–2017 were sourced from catch assessment sur-veys as well as from the EFMIS database of Kenya and Uganda. Both countries use similar standard operating procedures (SOPs) for various
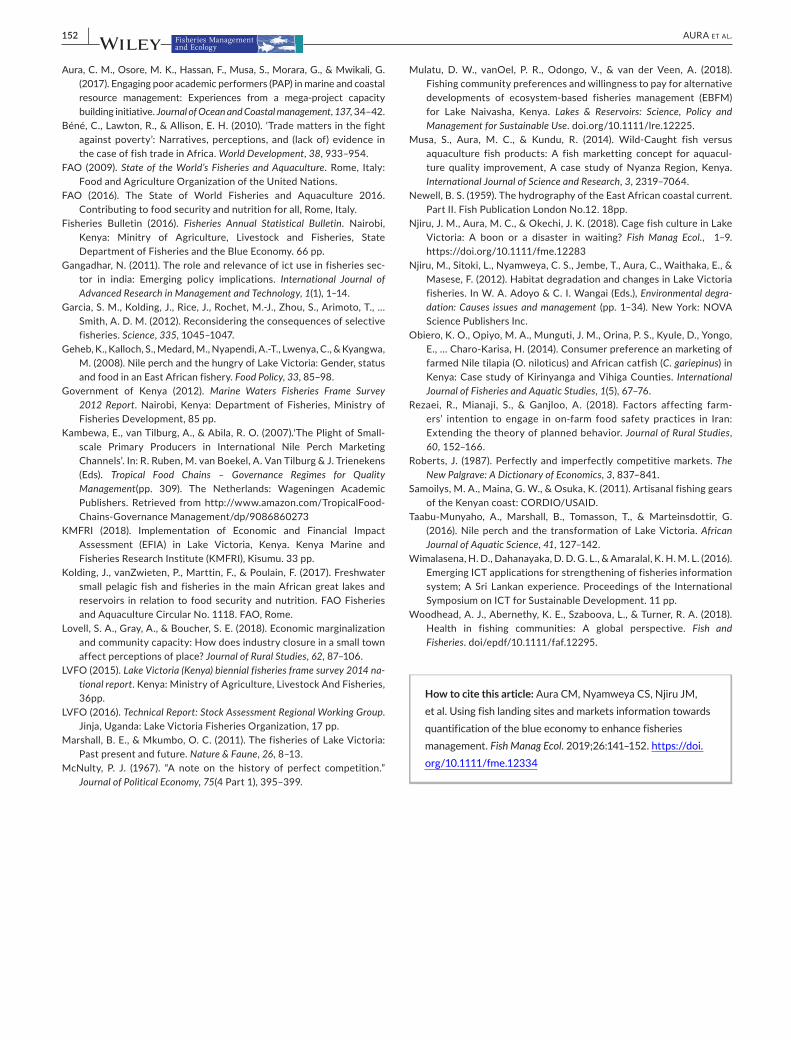
data platforms, such as EFMIS, catch assessment and frame surveys. The EFMIS system consists of three broad phases: data recording, cod-ing and transmission from landing sites and markets to the data centre; a central database for recording the information; and an automated query response system (Figure 2). Data are recorded once or twice a day at each of the landing sites and markets and relayed by phone Short Message Service (SMS) in a coded format to a data centre based at KMFRI in Kisumu County, Kenya. The data are then synthesised and packaged into a database in a format that fishers, fish traders, coop-eratives and other consumers can access them in real time (daily, by the hour), whenever needed. To obtain the information, a user has to send a query by SMS to the data centre from a mobile phone through a dedicated number (short code) and gets an automatic response within 10 s. The system is active for 24 hours every day and can be accessed from any part of the region where there is a cellular network.
EFMIS aims to enhance fish trade and incomes for the fisher com-munity through improved access to market information (Abila et al., 2011, 2013). Market information is also disseminated through monthly electronic bulletins, posters, brochures and pamphlets. The EFMIS model offers the potential to be adapted for application in other
F IGURE 1 Major fish landing sites and markets in Kenya and Uganda in East Africa under the ICT project, Enhanced Fish Market Information Service (EFMIS) [Colour figure can be viewed at wileyonlinelibrary.com]

144 | AURA et Al.
small- scale fisheries for effective relaying of fish marketing informa-tion to potential clients and thus aiding “Blue Economic Growth.”
Lake Victoria Fisheries Frame Surveys cost data were corroborated in the study to enhance the fish market information. Frame surveys pro-vide information on the facilities and services at landing sites and the composition, magnitude and distribution of fishing effort to guide de-velopment and management of the fisheries resources of Lake Victoria. The survey is a complete census of craft, gear, costs and fishers oper-ating in the lake and all landing sites facilities and services. The activ-ity is coordinated by the Lake Victoria Fisheries Organization (LFVO) secretariat together with a Regional Working Group (RWG) on Frame Surveys and by National Working Groups (NWG) at the national level. Trained enumerators undertake data collection using standardised questionnaires. Data are archived in the East African fish database.
2.3 | Data analyses
Microsoft Excel, SPSS version 21.0 (SPSS Inc., Chicago, IL, USA) and R version 3.5.1 (R Core Team) software were used for statistical analy-ses. Data were entered and cleaned in Microsoft Excel 2016, then exported to SPSS version 25 and R (packages psych and doBy) for analysis and development of tables and graphs. Measures of propor-tion and variation were used to evaluate the fish prices at landing sites and inland markets and compared per country. Cost of marketing fish and the quantities of fish landed and sold at landing sites were also
assessed through frequency measures, averages (means per annum or per month) and central tendencies, and comparisons and relationships gauged using regression analysis. Unevenly distributed data were log- transformed to achieve normality. Lake Victoria Frame Surveys and catch assessment data were incorporated with EFMIS data to esti-mate the effect of EFMIS data in Kenya and Uganda.
3 | RESULTS
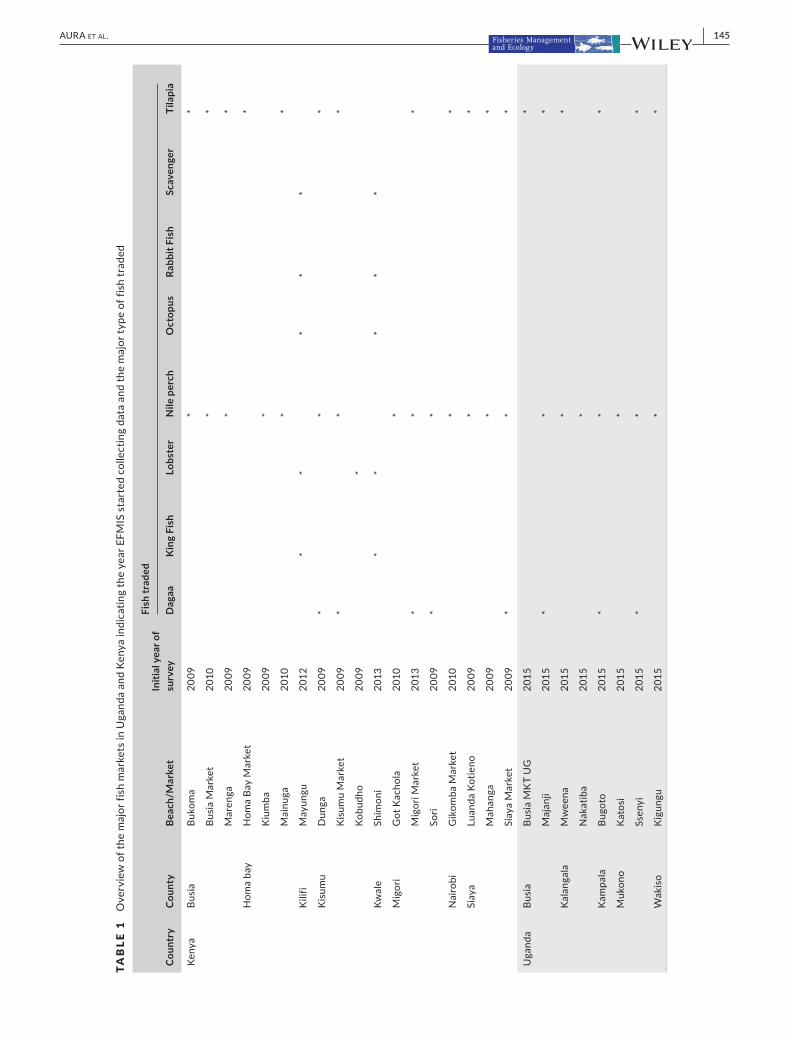
Nile perch Lates niloticus L., (21 major markets) and Nile tilapia Oreochromis niloticus L. (18 major markets) were dominant in most markets (Table 1).
In both Kenya and Uganda, there was no significant difference (p > 0.05; r2 < 0.50) between the catch assessment survey data (Non- EFMIS CAS) and market data (EFMIS CAS) during the EFMIS period (Figure 3). The average quantity of fish traded in Kenya had two annual peaks in January – March and August – October (Figure 4). The average quantity traded in Uganda had an irregular peak- pattern with most quantity traded occurring in 2016 in February – May and July – October. However, there was a significant weak correlation (p = 0.01; r2 < 0.50) between the quantity of fish traded versus the price of fish per kg (Figure 5).
Mayungu at the Kenya coast ($ 4.93/kg), Homa Bay Market, Kenya ($ 3.98/kg), Gikomba market, Kenya ($ 3.48/kg) and Kigungu,
F IGURE 2 Schematic representation of the flow of fish market information implemented under the Enhanced Fish Market Information Service (EFMIS) project in Kenya and Uganda. Data centre is at Kenya Marine and Fisheries Research Institute (KMFRI), Kisumu, Kenya
| 145AURA et Al.
TABLE 1
Ove
rvie
w o
f the
maj
or fi
sh m
arke
ts in
Uga
nda
and
Keny
a in
dica
ting
the
year
EFM
IS s
tart
ed c
olle
ctin
g da
ta a
nd th
e m
ajor
type
of f
ish
trad
ed
Coun
try
Coun
tyBe
ach/
Mar
ket
Initi
al y
ear o
f su
rvey
Fish
trad
ed
Dag
aaK
ing
Fish
Lobs
ter
Nile
per
chO
ctop
usRa
bbit
Fish
Scav
enge
rTi
lapi
a
Keny
aBu
sia
Buko
ma
2009
**
Busi
a M
arke
t20
10*
*
Mar
enga
2009
**
Hom
a ba
yH
oma
Bay
Mar
ket
2009
*
Kiu
mba
2009
*
Mai
nuga
2010
**
Kili
fiM
ayun
gu20
12*
**
**
Kis
umu
Dun
ga20
09*
**
Kis
umu
Mar
ket
2009
**
*
Kobu
dho
2009
*
Kwal
eSh
imon
i20
13*
**
**
Mig
ori
Got
Kac
hola
2010
*
Mig
ori M
arke
t20
13*
**
Sori
2009
**
Nai
robi
Gik
omba
Mar
ket
2010
**
Siay
aLu
anda
Kot
ieno
2009
**
Mah
anga
2009
**
Siay
a M
arke
t20
09*
**
Uga
nda
Busi
aBu
sia
MK
T U
G20
15*
Maj
anji
2015
**
*
Kal
anga
laM
wee
na20
15*
*
Nak
atib
a20
15*
Kam
pala
Bugo
to20
15*
**
Muk
ono
Kat
osi
2015
*
Ssen
yi20
15*
**
Wak
iso
Kig
ungu
2015
**

146 | AURA et Al.
Uganda ($ 3.13/kg) exhibited the highest average prices of fish (Figure 6a). Markets or landing sites with the lowest fish prices per kg included Dunga, Sori (Kenya) and Bugoto (Uganda). Fish traders and factory agents’ sale prices for small- sized fish were between $ 2.26/kg and $ 2.40/kg with factory agents receiving the highest prices in Uganda and fish traders received the highest prices in Kenya (Figure 6b). Prices of medium- sized fish ranged between $ 2.92/kg and $ 3.47/kg, with factory agents receiving higher prices than fish traders, and highest prices being in Kenya. Prices of large- sized fish were on average $ 4.50/kg in Kenya and $ 3.99/kg in Uganda.
The average quantity of fish traded was highest in Ssenyi (Uganda, 7.7 t), Busia Market (Uganda, 2.5 t), Gikomba market (1.5 t) and
Kigungu (Uganda, 1.4 t) (Figure 7). The lowest quantities traded were in non- transition and non- consumer market zones and landing sites.
In Kenya, lobster ($ 11.06/kg) emerged as the most expensive item traded, followed by kingfish ($ 3.02/kg), both marine (Figure 8a). Tilapia and Nile perch were the most expensive fish in Uganda (Figure 8b) as well as the most expensive inland fish in Kenya. Although Rastrineobola argentea (Pellegrin), locally known as dagaa, was the least valued fish traded in both countries, it was the most abundant by quantity (163.70 t), followed by tilapia (42.62 tons) and Nile perch (20.72 t).
The proportion of fresh fish traded in both Kenya (83.5%) and Uganda (79.9%) was higher than processed products (< 21.0%) (Table 2a). Additionally, the sales margin for the processing agent
F IGURE 3 Relationship between total quantity of catch assessment survey data (Non- EFMIS CAS) and market data (EFMIS) in t/yr in (a) Kenya, and (b) Uganda

| 147AURA et Al.
F IGURE 4 Relationship between the average monthly price of fish (US$/kg), average quantity of fish traded (t/month) from August 2009 (start of EFMIS) until December 2016 in (a) Kenya, and (b) Uganda
F IGURE 5 Scatter plots showing the relationship between price of fish per kg and quantity of fish traded in the landing sites and markets in (a) Kenya, and (b) Uganda

148 | AURA et Al.
and fish trader before the EFMIS project was lower than after the project across Kenya and Uganda and at the regional level (Table 2b).
4 | DISCUSSION
The perfectly competitive market model which is traditionally used in economics to attain efficiency and equity (Roberts, 1987) was tested. The model presupposes and entails an economically efficient alloca-tion of resources (Rezaei, Mianaji & Ganjloo, 2018). In this case, each trader maximises profits by equating the given price to its marginal cost. This is based on the assumption that competitive prices correctly reflect both consumer demand and the cost of resources. Thus, large
variations in sales margins could reflect exploitation of the fishers in rural communities by middlemen. An efficient market will establish prices that relate transport, processing and storage costs, respec-tively, to the provision of services in space, form and time (Mulatu et al., 2018). For the blue economy and investment in fisheries to thrive, and for improved policy formulation for management, compe-tition should ensure that prices and marketing margins fully reflect the costs of resources used (McNulty, 1967).
It is hypothesised that ICT systems should aim to ensure that mar-ket information is a key factor influencing sellers and buyers’ decisions and choices in the market. However, such information is not readily available for rural communities in agriculture and fisheries, thus giv-ing undue advantage to those with access to information (Kambewa
F IGURE 6 Relationships between the Kenyan and Ugandan prices of fish for (a) landing sites and markets, and the average price per fish, (b)landingsitesandmarketsaccordingtofishsizes(1US$≡100Kshs≡3731Ushs)

| 149AURA et Al.
F IGURE 7 The average quantity of fish traded in the major landing sites and markets in Kenya and Uganda between the conception of EFMIS in August 2009 to January 2017
F IGURE 8 The relationship between fish species traded and the average price per kg and the average quantity traded (tonnes) in (a) Kenyan, and (b) Ugandan major fish landing sites and markets

150 | AURA et Al.
et al., 2007). The use of mobile phones comes in handy to comple-ment traditional ICTs, such as radio, television and newspapers and face to face extension services in rural communities. Notably, Africa has the fastest- growing mobile phone market worldwide, which is al-ready being applied in many ways for profitable and non- profitable ventures. The penetration of the mobile phone is far greater than that of the Internet in Africa, especially in rural areas, making it one of the most accessible communication tools for fish trade (Abila et al., 2012).
The existing gaps in fish trade are identified with the need for the development of policies geared towards sustainable use of fish-eries resources among rural populations. It is vital that fishers should adopt practices that are consistent with their existing principles, val-ues and beliefs. To overcome this gap, it is suggested that future studies and implementation approaches could focus on fish trade policy formulations.
Lack of significant variations (p > 0.05; r2 = 0.50) in both coun-tries between the catch assessment survey data (Non- EFMIS CAS) and market data (EFMIS CAS) during the period studied validated the use of EFMIS data in drawing conclusions in the current study. Inland fish species were the most traded in Kenya and Uganda mar-kets, which could be attributed to freshwater fish species dominat-ing the East African markets, of which Lake Victoria accounts for over 80% of production. These figures indicate that the fisheries resources of Lake Victoria make significant contributions to the local and national economies of the Partner States (Marshall & Mkumbo, 2011). Moreover, freshwater biodiversity plays a substantial role in supporting the livelihoods of rural and poor communities. Fifty- six million people in the developing world are involved in small- scale freshwater fisheries and in Sub- Saharan Africa, fish are a key source of nutrition and income for much of the rural population (Béné, Lawton & Allison, 2010).
Nile perch (21 major markets) was the most traded fish. Much of the lake’s economic contribution to the region’s fisheries comes from the Nile perch. It generates significant foreign exchange, estimated at over 60% of the total fisheries contribution in the lake, and provides employment and income for millions of people within and outside the region. The 2016 frame survey report indicated that over 50% of fishing craft and people in Lake Victoria target Nile perch (LVFO, 2015). This makes this species the single most significant driver of Lake Victoria’s fisheries. This is evident from the various efforts and measures taken to address threats posed to the fishery (LVFO, 2016).
Nile tilapia emerged as the second most traded fish with 18 major markets symptomatic of consumer preference for it (Musa, Aura & Kundu, 2014; Obiero et al., 2014). Lack of infrastructure and profes-sionalism along such dominant fish value chains as those of Nile perch and Nile tilapia reduce the product quality and increase risk and op-erating costs, as well as fish bio- wastes and discards (Kolding, van Zwieten, Marttin & Poulain, 2017). Notably, it is the lack of drive and innovation on fish bio- wastes that has caused the fisheries sector to be under- estimated and under- valued; necessitating a policy of low investment by rural populations and industry (KMFRI, 2018).
The two annual peaks in January–March and August–October (Figure 4) experienced during fish trade in Kenya correspond to rainy and dry seasons in Lake Victoria, which constitute the bulk of the re-gional fishery (LVFO, 2016; Njiru et al., 2018). Thus, the quantity of fish traded may depend strongly on fish production rather than the price of fish at the landing site or market, which could account for the weak dependency between quantities of fish traded versus the price of fish per kg (Figure 5). The continuous fish trade in Uganda and across the border with Kenya may have caused the fish trade to be active through-out the year (LVFO, 2016). In this case, fish trader’s and factory agent’s sales prices for small- sized fish ($ 2.26 and $ 2.40) enabled factory agents to receive the highest prices in Uganda, and fish traders received the highest prices in Kenya (Figure 6b). This adds credence to fishers’ information that factory prices in Kenya were low, leading to factory agents to sell fish in Uganda where factory prices were higher. Medium- sized fish prices ($ 2.92–$ 3.47) enabled factory agents to receive the highest prices compared with fish traders, with the highest prices being in Kenya. A similar scenario was noted for large- sized fish prices that prompted increased fish trade in Uganda throughout the year.
The study noted that transitional and consumer markets for goods and services recorded high fish prices per kg. Such areas in-clude Mayungu at the Kenya coast ($ 4.93/kg), Homa Bay Market, Kenya ($ 3.98/kg), Gikomba market, Kenya ($ 3.48/kg) and Kigungu, Uganda ($ 3.13/kg). Similarly, the average quantity of fish traded was highest in such zones which included Ssenyi (Uganda, 7.7 t), Busia Market (Uganda, 2.5 t), Gikomba market (1.5 t) and Kigungu (Uganda, 1.4 t). Transitional and consumer market zones are known to have a history of business transactions whose sales margins tend to benefit go- betweens due to their proximity to external markets and influ-ence (KMFRI, 2018; Lovell, Gray & Boucher, 2018). The opposite is true for non- transitional and non- consumer markets or landing sites
(a)
State Kenya Uganda Regional
Processed [Proportion (%)] 1062377 (16.5) 13794869 (20.09) (18.30)
Fresh [Proportion (%)] 1062377 (83.5) 13794869 (79.91) (81.71)
(b)
Actor type Before After Before After Before After
Processing agent 0.7 0.5 0.6 0.4 1 0.4
Fish trader 0.9 0.8 0.5 0.3 1.15 0.5
TABLE 2 The Kenyan and Ugandan landing sites/market indicating (a) the state at which fish is sold in quantity (tonnes) and proportion (in brackets), and (b) average monthly sales margin of a processing agent and fish trader (in USD $) before (2002–2008) and during (2009–2017) EFMIS project period. Margins for 2002- 2008 were calculated based on Frame Survey data that is conducted bi- annually in the lake region

| 151AURA et Al.
which included Dunga, Sori (Kenya) and Bugoto (Uganda) that re-corded the lowest fish prices per kg.
Tilapia and Nile perch emerged as the most expensive inland fish in both Kenya and Uganda. Catches are sold and traded in both domestic and export markets (Geheb et al., 2008). Dagaa was the least valued fish but leads in terms of weight of landed fish. Dagaa is fished for both domestic and regional markets, and the driver of the harvest is for production of animal feeds and human food. This species is primarily harvested for human food but quality is often reduced due to post- harvest conditions and as a result much of the catch ends up being used in animal feed factories (LVFO, 2016). Dagaa is now considered an essential staple for food and nutritional security. When used for animal feed, it is primarily in average to rich households, as these have the equipment for agriculture or aqua-culture. However, harvesting of this species is at night by men from poorer households and provides employment for women in fish processing and trade in rural and marginalised communities (Taabu- Munyaho, Marshall, Tomasson & Marteinsdottir, 2016). Small in-digenous fish species such as dagaa, although more abundant and productive, are viewed as a low- value commodity that is mostly re-duced to fishmeal, oil and used in animal feed (Garcia et al., 2012). Policy information and implementation should focus on innovative rethinking of the food security discourse by focusing on the nutri-tional value of dagaa and other small indigenous fish species.
The proportion of fresh fish traded in both Kenya (83.5%) and Uganda (79.9%) was higher than processed fish (<21.0%) (Table 2a). This is linked, at present, to many fishers operating on behalf of fish processing factories and agents that supply them with equipment, such as nets and outboard engines that allows them to fish further afield. As a result, these fishermen are obliged to sell their catches to the factories (at a market price fixed by the factory traders) to pay back for the equipment. This creates an unequal relationship between fishers and factories and results in an unequal distribution of income (Geheb et al., 2008). Therefore, the sales margin for the processing agent and fish trader experiences variations. The current study noted lower sales margins during EFMIS project than before; a situation ac-corded to the merits of information sharing using ICT platforms in fish trade to enhance fisheries management and ecological sustainability.
5 | CONCLUSIONS
The aim of this paper was to examine pre- requisites for quanti-fication of fisheries output using fish market information in East Africa to draw lessons for policy formulations from the major fish-eries landing and market sites to enhance fisheries management and rural blue economies. The use of market information data herein was validated by comparison with catch assessment sur-vey data. Inland fishes were the traded more than marine prod-ucts, with Nile perch and tilapia leading in the trade due to high catches and importance of the fishery. Both fishes dominate the fishery in terms of livelihoods value. Dagaa was the least valued fish in both countries though it is now considered an essential
staple for food and nutritional security. The study noted that the quantity of fish traded depended more strongly on fish produc-tion than the price of fish at the landing site or market. Therefore, policy reviews should target social, economic and legal barriers that often inhibit sustainable fish production for improved small- scale fishers’ livelihoods, which limit their food and income secu-rity. At the same time, the guidelines could streamline fish trade in non- transitional, transitional and consumer market zones, for the equity of the fish traders, agents and middlemen. The cur-rent study noted lower sales margins during EFMIS project than before the project which was indicative of the advantages of ICT platforms in rural communities for use in fish trade. Furthermore, the study recommends the application of EFMIS in catch and stock assessment surveys due to closer linkages in data collec-tion methodologies.
ACKNOWLEDG MENTS
The data herein was sourced from Enhanced Fish Market Information Service (EFMIS) project that was initially supported through a grant under the Facility for Africa Challenge Fund programme. This is a re-gional technical cooperation programme supported by the International Labour Organization (ILO) and the Department for International Development (DFID). An up- scaled phase of the project has been supported by European Union (EU) from March 2011. The EU fund-ing is under the Assistance to Micro and Small Enterprises Programme (ASMEP) in support of the Private Sector Development Strategy.
ORCID
Christopher Mulanda Aura https://orcid.org/0000-0001-9590-9652
R E FE R E N C E S
Abila, R. O., Ojwang, W., Othina, A., Lwenya, C., Oketch, R., & Okeyo, R. (2011). Enhancing fish marketing through ICT – Experiences of EFMIS project in Lake Victoria. FAO Fisheries and Aquaculture Report No. 990. FIPM/R990. FAO, Rome. Pp 243-252. Retrieved from http://www.fao.org/docrep/017/i3093b/i3093b.pdf
Abila, R. O., Ojwang, W., Othina, A., Lwenya, C., Oketch, R., & Okeyo, R. (2012). Using ICT for fish marketing: the EFMIS model in Kenya. Technical Report. 17 pp. https://doi.org/10.3362/2046-1887.2013.005
Abila, R. O., Ojwang, W., Othina, A., Lwenya, C., Oketch, R., & Okeyo, R. (2013). Using ICT for fish marketing: the EFMIS model in Kenya. Food Chain Journal Vol. 3, No. 1. Practical Action Publishing, Warwickshire, UK. Retrieved from http://practicalaction.meta-press.com/content/f300828j376 g1124/
Agboola, O. P., Azizul, M. F., Rasidi, M. H., & Said, I. (2018). The cultural sustainability of traditional market place in Africa: A new research agenda. Journal of Rural Studies, 62, 87–106.
Aura, M. C., Nyamweya, C., Njiru, J. M., Musa, S., Ogari, Z., & Wakwabi, E. (2018). Exploring the demarcation requirements of fish breeding sites to balance the management and conservation needs of the lake ecosystem. Fisheries Management and Ecology. https://onlinelibrary.wiley.com/doi/pdf/10.1111/fme.12311.
152 | AURA et Al.
Aura, C. M., Osore, M. K., Hassan, F., Musa, S., Morara, G., & Mwikali, G. (2017). Engaging poor academic performers (PAP) in marine and coastal resource management: Experiences from a mega- project capacity building initiative. Journal of Ocean and Coastal management, 137, 34–42.
Béné, C., Lawton, R., & Allison, E. H. (2010). ‘Trade matters in the fight against poverty’: Narratives, perceptions, and (lack of) evidence in the case of fish trade in Africa. World Development, 38, 933–954.
FAO (2009). State of the World’s Fisheries and Aquaculture. Rome, Italy: Food and Agriculture Organization of the United Nations.
FAO (2016). The State of World Fisheries and Aquaculture 2016. Contributing to food security and nutrition for all, Rome, Italy.
Fisheries Bulletin (2016). Fisheries Annual Statistical Bulletin. Nairobi, Kenya: Minitry of Agriculture, Livestock and Fisheries, State Department of Fisheries and the Blue Economy. 66 pp.
Gangadhar, N. (2011). The role and relevance of ict use in fisheries sec-tor in india: Emerging policy implications. International Journal of Advanced Research in Management and Technology, 1(1), 1–14.
Garcia, S. M., Kolding, J., Rice, J., Rochet, M.-J., Zhou, S., Arimoto, T., … Smith, A. D. M. (2012). Reconsidering the consequences of selective fisheries. Science, 335, 1045–1047.
Geheb, K., Kalloch, S., Medard, M., Nyapendi, A.-T., Lwenya, C., & Kyangwa, M. (2008). Nile perch and the hungry of Lake Victoria: Gender, status and food in an East African fishery. Food Policy, 33, 85–98.
Government of Kenya (2012). Marine Waters Fisheries Frame Survey 2012 Report. Nairobi, Kenya: Department of Fisheries, Ministry of Fisheries Development, 85 pp.
Kambewa, E., van Tilburg, A., & Abila, R. O. (2007).‘The Plight of Small-scale Primary Producers in International Nile Perch Marketing Channels’. In: R. Ruben, M. van Boekel, A. Van Tilburg & J. Trienekens (Eds). Tropical Food Chains – Governance Regimes for Quality Management(pp. 309). The Netherlands: Wageningen Academic Publishers. Retrieved from http://www.amazon.com/TropicalFood-Chains-Governance Management/dp/9086860273
KMFRI (2018). Implementation of Economic and Financial Impact Assessment (EFIA) in Lake Victoria, Kenya. Kenya Marine and Fisheries Research Institute (KMFRI), Kisumu. 33 pp.
Kolding, J., vanZwieten, P., Marttin, F., & Poulain, F. (2017). Freshwater small pelagic fish and fisheries in the main African great lakes and reservoirs in relation to food security and nutrition. FAO Fisheries and Aquaculture Circular No. 1118. FAO, Rome.
Lovell, S. A., Gray, A., & Boucher, S. E. (2018). Economic marginalization and community capacity: How does industry closure in a small town affect perceptions of place? Journal of Rural Studies, 62, 87–106.
LVFO (2015). Lake Victoria (Kenya) biennial fisheries frame survey 2014 na-tional report. Kenya: Ministry of Agriculture, Livestock And Fisheries, 36pp.
LVFO (2016). Technical Report: Stock Assessment Regional Working Group. Jinja, Uganda: Lake Victoria Fisheries Organization, 17 pp.
Marshall, B. E., & Mkumbo, O. C. (2011). The fisheries of Lake Victoria: Past present and future. Nature & Faune, 26, 8–13.
McNulty, P. J. (1967). “A note on the history of perfect competition.” Journal of Political Economy, 75(4 Part 1), 395–399.
Mulatu, D. W., vanOel, P. R., Odongo, V., & van der Veen, A. (2018). Fishing community preferences and willingness to pay for alternative developments of ecosystem-based fisheries management (EBFM) for Lake Naivasha, Kenya. Lakes & Reservoirs: Science, Policy and Management for Sustainable Use. doi.org/10.1111/lre.12225.
Musa, S., Aura, M. C., & Kundu, R. (2014). Wild- Caught fish versus aquaculture fish products: A fish marketting concept for aquacul-ture quality improvement, A case study of Nyanza Region, Kenya. International Journal of Science and Research, 3, 2319–7064.
Newell, B. S. (1959). The hydrography of the East African coastal current. Part II. Fish Publication London No.12. 18pp.
Njiru, J. M., Aura, M. C., & Okechi, J. K. (2018). Cage fish culture in Lake Victoria: A boon or a disaster in waiting? Fish Manag Ecol., 1–9. https://doi.org/10.1111/fme.12283
Njiru, M., Sitoki, L., Nyamweya, C. S., Jembe, T., Aura, C., Waithaka, E., & Masese, F. (2012). Habitat degradation and changes in Lake Victoria fisheries. In W. A. Adoyo & C. I. Wangai (Eds.), Environmental degra-dation: Causes issues and management (pp. 1–34). New York: NOVA Science Publishers Inc.
Obiero, K. O., Opiyo, M. A., Munguti, J. M., Orina, P. S., Kyule, D., Yongo, E., … Charo-Karisa, H. (2014). Consumer preference an marketing of farmed Nile tilapia (O. niloticus) and African catfish (C. gariepinus) in Kenya: Case study of Kirinyanga and Vihiga Counties. International Journal of Fisheries and Aquatic Studies, 1(5), 67–76.
Rezaei, R., Mianaji, S., & Ganjloo, A. (2018). Factors affecting farm-ers’ intention to engage in on- farm food safety practices in Iran: Extending the theory of planned behavior. Journal of Rural Studies, 60, 152–166.
Roberts, J. (1987). Perfectly and imperfectly competitive markets. The New Palgrave: A Dictionary of Economics, 3, 837–841.
Samoilys, M. A., Maina, G. W., & Osuka, K. (2011). Artisanal fishing gears of the Kenyan coast: CORDIO/USAID.
Taabu-Munyaho, A., Marshall, B., Tomasson, T., & Marteinsdottir, G. (2016). Nile perch and the transformation of Lake Victoria. African Journal of Aquatic Science, 41, 127–142.
Wimalasena, H. D., Dahanayaka, D. D. G. L., & Amaralal, K. H. M. L. (2016). Emerging ICT applications for strengthening of fisheries information system; A Sri Lankan experience. Proceedings of the International Symposium on ICT for Sustainable Development. 11 pp.
Woodhead, A. J., Abernethy, K. E., Szaboova, L., & Turner, R. A. (2018). Health in fishing communities: A global perspective. Fish and Fisheries. doi/epdf/10.1111/faf.12295.
How to cite this article: Aura CM, Nyamweya CS, Njiru JM, et al. Using fish landing sites and markets information towards quantification of the blue economy to enhance fisheries management. Fish Manag Ecol. 2019;26:141–152. https://doi.org/10.1111/fme.12334