Using Dividing Wall Columns (DWC) in LNG Production
107
Using Dividing Wall Columns (DWC) in LNG Production deviding wall column, double dividing wall column, prefractionator arrangement, Petlyuk column, NGL recovery, distillation Roohollah Ashrafian Natural Gas Technology Supervisor: Even Solbraa, EPT Co-supervisor: Efstathios Skouras-Iliopoulos, Statoil Knut Arild Maråk, Statoil Department of Energy and Process Engineering Submission date: June 2014 Norwegian University of Science and Technology
-
Upload
khangminh22 -
Category
Documents
-
view
0 -
download
0
Transcript of Using Dividing Wall Columns (DWC) in LNG Production

Using Dividing Wall Columns (DWC) in LNG Productiondeviding wall column, double dividing wall
column, prefractionator arrangement,
Petlyuk column, NGL recovery, distillation
Roohollah Ashrafian
Natural Gas Technology
Supervisor: Even Solbraa, EPTCo-supervisor: Efstathios Skouras-Iliopoulos, Statoil
Knut Arild Maråk, Statoil
Department of Energy and Process Engineering
Submission date: June 2014
Norwegian University of Science and Technology

Roohollah Ashrafian
Using Dividing Wall Columns (DWC) in LNG
Production
Supervisor: Even Solbraa
Research Advisors: Efstathios Skouras-Iliopoulos and Knut Arild Maråk
Trondheim, June 2014
Ma
ster
Th
esis
NT
NU
No
rweg
ian
Un
iver
sity
of
Sci
ence
an
d T
ech
no
log
y
Fac
ult
y o
f E
ng
inee
ring
Sci
ence
and
Tec
hn
olo
gy
Dep
artm
ent
of
En
erg
y a
nd
Pro
cess
En
gin
eeri
ng

1
Preface
This study was carried out within the supervision of Even Solbraa and technically supported by
Statoil center in Research, development and Innovation (RDI) in Rotvoll-Trondheim office.
My main word of thank goes to my supervisor Even Solbraa. I would like to thank him for
giving me many detailed instructions on my thesis.
I would also like to thank Ivar Haloversen who gave me a lot of information about DWC design
and shared generously his great experiences.
And finally I would like to thank professor Olav Boland and all the department personnel who
provide me the relevant environment for working academically during this master program.
This section would not be complete without thanking all beloved persons in my life who have
been always a great motive to proceed.

2

3
Abstract
The Dividing Wall Columns (DWC) distillation has attracted growing interest for fractionation
of multicomponent mixture due to reduction of energy consumption, auxiliary equipment and
space within fractionation process. Recent developments of the process show considerable
energy saving, up to 30%-40%, compared to conventional fractionation schemes. The objective
of this thesis is to introduce DWC configurations, governing equations and applications in LNG
and gas processing as well as explanation of different methods and processes for industrial
production of LNG and LPG. In addition, a consistent and fair comparison between conventional
fractionation schemes and two types of DWC i.e. Kaibel and multi-partitioned (Sergant DWC)
with respect to energy consumption and other parameters have been conducted. The evaluation
was done using Aspen HYSYS simulation program version 7.3 for a typical natural gas feed
specification. The study indicates beneficial DWC utilization in terms of energy consumption,
auxiliary equipment and duties of condensers and reboilers. Simulation results show energy
consumption in LPG extraction process using “Kaibel“ DWC about 31% less than conventional
fractionation scheme while “multi-partitioned” configuration of DWC is even better and it can
save energy up to 37%.

4
5
Norwegian University Department of Energy
of Science and Technology and Process Engineering
EPT-M-2013
MASTER THESIS
for
Stud.techn. Roohollah Ashrafian
Spring 2013
“Using Dividing Wall Columns (DWC) in LNG production”
Bruk av Dividing Wall Columns (DWC) i LNG-produksjon.
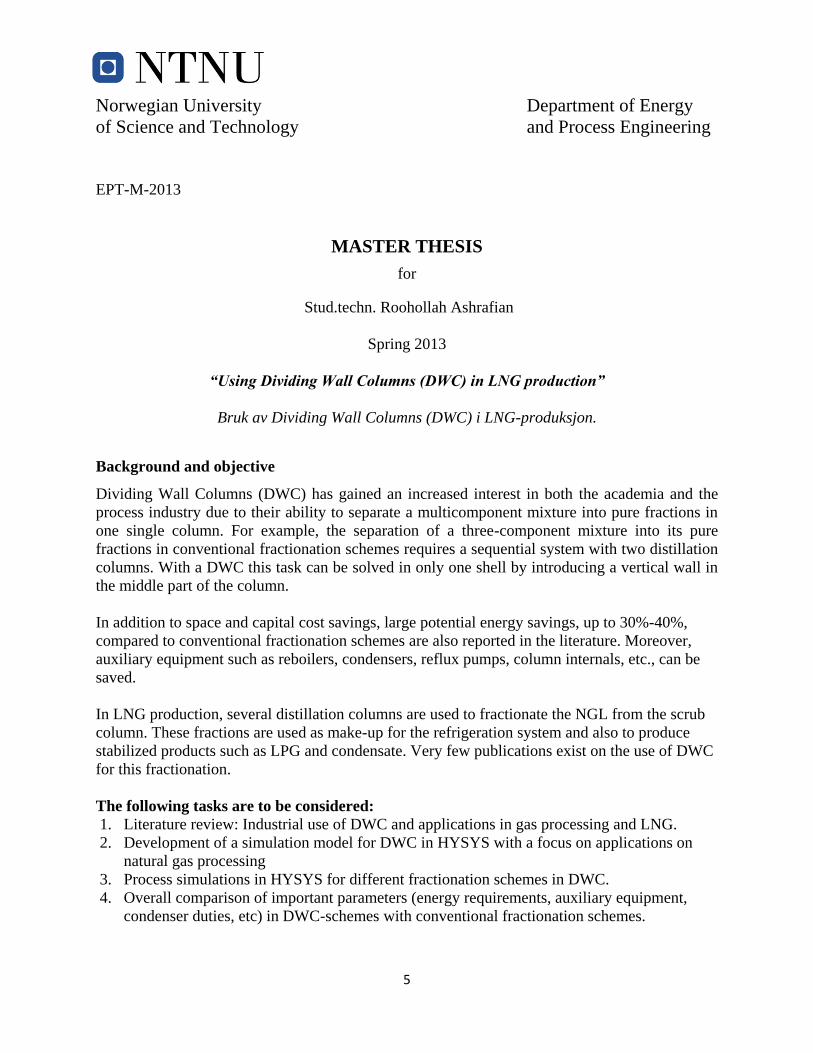
Background and objective
Dividing Wall Columns (DWC) has gained an increased interest in both the academia and the
process industry due to their ability to separate a multicomponent mixture into pure fractions in
one single column. For example, the separation of a three-component mixture into its pure
fractions in conventional fractionation schemes requires a sequential system with two distillation
columns. With a DWC this task can be solved in only one shell by introducing a vertical wall in
the middle part of the column.
In addition to space and capital cost savings, large potential energy savings, up to 30%-40%,
compared to conventional fractionation schemes are also reported in the literature. Moreover,
auxiliary equipment such as reboilers, condensers, reflux pumps, column internals, etc., can be
saved.
In LNG production, several distillation columns are used to fractionate the NGL from the scrub
column. These fractions are used as make-up for the refrigeration system and also to produce
stabilized products such as LPG and condensate. Very few publications exist on the use of DWC
for this fractionation.
The following tasks are to be considered:
1. Literature review: Industrial use of DWC and applications in gas processing and LNG.
2. Development of a simulation model for DWC in HYSYS with a focus on applications on
natural gas processing
3. Process simulations in HYSYS for different fractionation schemes in DWC.
4. Overall comparison of important parameters (energy requirements, auxiliary equipment,
condenser duties, etc) in DWC-schemes with conventional fractionation schemes.

6

7
Table of Contents
Preface .......................................................................................................................................................... 1
Abstract ......................................................................................................................................................... 3
Nomenclature ................................................................................................................................................ 9
1 Introduction ........................................................................................................................................ 10
Aim of the study .......................................................................................................................... 10 1.1
2 Industrial Background ........................................................................................................................ 13
LNG Production .......................................................................................................................... 13 2.1
2.1.1 Cascade refrigeration Process ............................................................................................. 13
2.1.2 Mixed Refrigerant Process .................................................................................................. 15
2.1.3 Precooled Mixed Refrigerant Process ................................................................................. 16
2.1.4 Future Developments .......................................................................................................... 18
LPG extraction and its business case for an LNG plant .............................................................. 20 2.2
2.2.1 Turbo-expander LPG recovery ........................................................................................... 21
2.2.2 Integrated LPG Extraction and LNG Process ..................................................................... 24
DWC Background and Industrial Applications .......................................................................... 26 2.3
3 Theory and Literature Review ............................................................................................................ 29
Multi-component distillation ....................................................................................................... 29 3.1
3.1.1 Column Arrangements ........................................................................................................ 29
Divided Wall Column (DWC) .................................................................................................... 34 3.2
3.2.1 DWC Configuration for three component separation ......................................................... 34
3.2.2 DWC Configuration for four component separation........................................................... 35
3.2.3 Other configurations ........................................................................................................... 36
VLE Equilibrium ........................................................................................................................ 36 3.3
Flash Calculations ....................................................................................................................... 40 3.4
DWC Design Procedures ............................................................................................................ 42 3.5
3.5.1 Heuristic Rules for DWC Design ........................................................................................ 43
3.5.2 Minimum number of stages (Fenske Equation) .................................................................. 44
3.5.3 Minimum Reflux Ratio (Underwood Equation) ................................................................. 45
3.5.4 Feed Location ...................................................................................................................... 46
3.5.5 Vmin Diagram Method ......................................................................................................... 46
4 Methodology and Results ................................................................................................................... 48

8
Conventional Fractionation model development (Base Case) .................................................... 48 4.1
4.1.1 Column Performance Parameters ........................................................................................ 48
4.1.2 Simulation Results for Conventional method: .................................................................... 52
Demethanizer and Kaibel DWC ................................................................................................. 53 4.2
4.2.1 C3 Withdrawal tray location ............................................................................................... 55
4.2.2 LPG Withdrawal tray location ............................................................................................ 55
4.2.3 Liquid flow rate ratio at both sides of Kaibel DWC ........................................................... 56
4.2.4 C2 flow rate ......................................................................................................................... 56
4.2.5 C3 flow rate ......................................................................................................................... 57
4.2.6 LPG flow rate ...................................................................................................................... 57
4.2.7 Final Result for Kaibel Model ............................................................................................ 58
Multi-partitioned DWC (Sargent arrangement) .......................................................................... 59 4.3
4.3.1 C3 product withdrawing tray .............................................................................................. 61
4.3.2 LPG product withdrawing tray ........................................................................................... 61
4.3.3 Liquid flow rate ratio at both sides of Sergent DWC .......................................................... 61
4.3.4 Vapor flow rate ratio at both side of Sergent DWC ............................................................ 62
4.3.5 Final Result For Multi-partitioned (Sergent) DWC Model ................................................. 63
5 Conclusion and Fyrther Study ......................................................................................................... 64
6 References: ......................................................................................................................................... 65
7 Appendices ......................................................................................................................................... 67
Main Workbook Profile Report for NGL Fractionation Model (Base case) ............................... 68 7.1
DC1 column Profile Report for NGL Fractionation Model (Base case) ..................................... 74 7.2
DC2 column Profile Report for NGL Fractionation Model (Base case) ..................................... 76 7.3
DC3 column Profile Report for NGL Fractionation Model (Base case) ..................................... 78 7.4
Main Workbook Profile Report for Kaibel DWC Model ........................................................... 80 7.5
DC1 Column Profile Report for Kaibel DWC Model ................................................................ 82 7.6
DWC Column Profile Report for Kaibel DWC Model ............................................................... 84 7.7
Main Workbook Profile Report for Multi-Partitioned DWC Model .......................................... 91 7.8
DWC Column Profile Report for Multi-Partitioned DWC Model .............................................. 92 7.9

9
Nomenclature
Abbreviations
APCI Air Products & Chemicals Inc.
CDWC Conventional Divided Wall Columns
DMR Dual Mixed Refrigerant
DWC Divided Wall Columns
FLNG Floating Liquefied Natural Gas
HHV High Heat Value
J-T Joule Thomson
LNG Liquefied Natural Gas
LPG Liquefied Petroleum Gas
MCHE Main Cryogenic Heat Exchanger
NG Natural Gas
PRICO Single Mixed Refrigerant Process
RVP Reid Vapor Pressure
Latin letters
b Flow Rates at Bottom of the Column
d Flow Rates at Distillate
H Specific Enthalpy Vapor Phase
h Specific Enthalpy Liquid Phase
F Feed Flow
K Vapor-Liquid Equilibrium Constant
L Liquid Flow
N Number of Stages
P Total System Pressure
q heat flow into, or removal from, the stage
S Side Stream
V Vapor Flow
x Mole Fraction of Component “i” in the Liquid Streams
Greek letters
α Average Relative Volatility
ϕ Vapor Fugacity Coefficient
y Mole Fraction of Component I In Vapor
f Standard State Fugacity of the Pure Liquid
γ Liquid Phase Activity Coefficients
Subscripts
i component index
n any stage, numbered from the top of the column
x mole fraction of component i in the liquid streams
y mol fraction component i in the vapor streams
z mole fraction of component i in the feed stream

10
1 Introduction
Process industries like refineries, petrochemical and chemical plants have a great contribution in
energy consumption as fuel. A great proportion of this energy is involved in separation and
purification processes among which distillation is the most widely used one. Energy
consumption through distillation becomes so important because almost 3% of the total energy
consumption of the world is consumed in distillation towers. In addition high energy demands
and prices justify working on developing methods and process equipment which are more energy
efficient [1].
Divided Wall Columns (DWC), with less energy consumption and capital expenditure are good
alternatives for processes using conventional distillation columns. Briefly speaking, the
following benefits could be achieved by using DWCs instead of conventional columns wherever
applicable [2]:
Energy saving
Capital cost saving by reducing quantity of equipment (a train of columns replaced by
one , less reboiler and condenser)
Less plot area and shorter piping and electrical lines which make it relevant for offshore
applications
Less flare load and as a result smaller flare system
Aim of the study 1.1
In this study the following objectives are considered to be addressed:
1. A comprehensive literature review covering industrial use of DWC and its application in
gas processing and LNG.
2. Development of a simulation model for DWC in HYSYS with a focus on applications on
natural gas processing
3. Process simulations in HYSYS for different fractionation schemes in DWC.
4. Overall comparison of important parameters (energy requirements, auxiliary equipment,
condenser duties, etc) in DWC-schemes with conventional fractionation schemes.
11
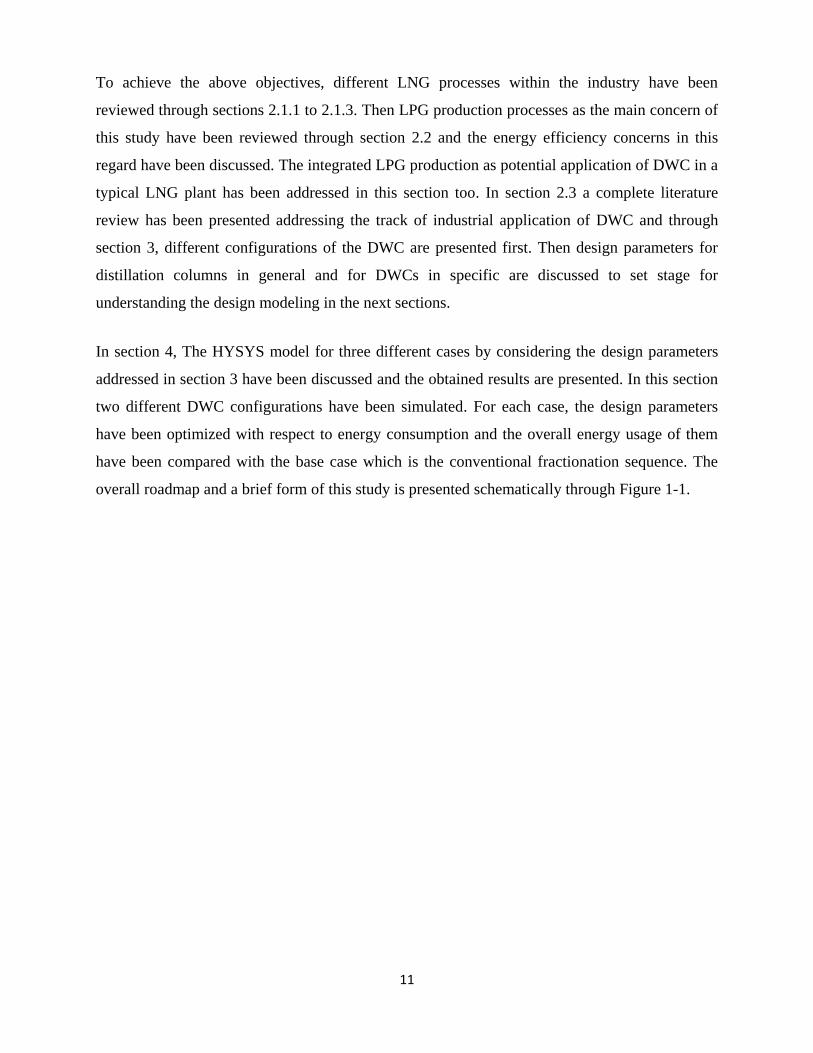
To achieve the above objectives, different LNG processes within the industry have been
reviewed through sections 2.1.1 to 2.1.3. Then LPG production processes as the main concern of
this study have been reviewed through section 2.2 and the energy efficiency concerns in this
regard have been discussed. The integrated LPG production as potential application of DWC in a
typical LNG plant has been addressed in this section too. In section 2.3 a complete literature
review has been presented addressing the track of industrial application of DWC and through
section 3, different configurations of the DWC are presented first. Then design parameters for
distillation columns in general and for DWCs in specific are discussed to set stage for
understanding the design modeling in the next sections.
In section 4, The HYSYS model for three different cases by considering the design parameters
addressed in section 3 have been discussed and the obtained results are presented. In this section
two different DWC configurations have been simulated. For each case, the design parameters
have been optimized with respect to energy consumption and the overall energy usage of them
have been compared with the base case which is the conventional fractionation sequence. The
overall roadmap and a brief form of this study is presented schematically through Figure 1-1.

12
Figure 1-1: The overall methodology and roadmap in this study
Simulation Results
Optimization by heat loads
DWC flowsheet
design
Fractionation flowsheet
design
Problem
Statement
Industrial Apps &
Literature Review
Distillation
Theory
Multi-comp
distillation
DWC
configurations
DW
C d
esign
pa
ram
eters
Co
lum
n
des
ign
pa
ram
eters
LNG
Production
Techniques
LPG
Production
Techniques
Design Challenges

13
2 Industrial Background
In this section different methods and processes for industrial production of LNG and LPG are
discussed and the cases for development of DWC as a new method for application in these
industries are addressed.
LNG Production 2.1
The reduced volume of Liquefied Natural Gas makes it a great alterative for transporting natural
gas resources to the market. There are typically two types of main LNG liquefaction plants:
1. Base load plants: that are large scale liquefaction facilities
2. Peak-shaving plants: smaller scale facilities which are operating at some parts of the
year to compensate for the peak loads.
The design objective of base load facilities is the thermodynamic efficiency of the plant while
the minimum capital expenditures are the main design driver for peak-shaving plants.
To liquefy natural gas and converting it to LNG; cryogenic temperatures are required. To
achieve these temperatures three main liquefaction processes are common in the industry [3, 4]:
Cascade Refrigeration Process
Mixed refrigerant Process
Precooled Mixed Refrigerant Process.
These three main processes are briefly described in the next subsections.
2.1.1 Cascade refrigeration Process
This process which is currently in place by several plants worldwide is basically involves three
refrigeration systems through each of them there exist two or three levels of evaporation pressure
using multistage compressors. As a result the natural gas liquefies through eight or nine

14
temperature levels by using three different refrigerants which are propane, ethylene and methane.
Figure 2-1 shows a simple schematic of the cascade process. First, the feed goes through
pretreatment processes then feed gas is cooled to a temperature of around –32°C through a
propane refrigeration cycle. In this cycle, the propane refrigerant is condensed at high pressure,
using either air or water cooling. The J-T expansion valve then completely vaporizes the
refrigerant to cool down gas as well as the methane refrigerant. In addition this cycle is
responsible to condense partially the ethylene refrigerant used in the subsequent refrigeration
level. The propane vapor then recompressed back to complete the cycle.
In the ethylene cycle, similar mechanism takes place to cool down the temperature of the gas to -
96°C. It should be noted that this cycle is responsible to condense methane refrigerant after
precooling within the propane cycle. Finally, the high-pressure methane refrigerant in the third
cycle followed by the throttling expansion through a J-T valve liquefies the gas to a temperature
down to –163°C.
Figure 2-1: Cascade Refrigeration Process

15
Cascade process has the following advantages:
It is simple from operational point of view.
Better control over pure-component refrigerants.
However, this process has also some disadvantages compared to precooled mixed-refrigerant
processes [3-5]:
Lower thermodynamic efficiencies
Higher compression power and more fuel gas consumption rates
Complicate compressor and driver selection and maintenance requirements due to
unequal distribution of horsepower loads among the three refrigeration cycles
2.1.2 Mixed Refrigerant Process
Instead of using three different refrigerant cycles, this process simply uses a single mixed
refrigerant mainly composed of nitrogen, methane, ethane, propane, butane and pentane. In this
process natural gas is cooled through a gliding temperature. The whole process design aims to
match the boiling curve of the refrigerant with the cooling curve of the natural gas.
Figure 2-2: Single Mixed Refrigerant Process (PRICO)

16
Figure 2-2 shows a typical schematic of Prico process as one of the most common simple mixed
refrigerant plants. It could be seen that very close temperature approaches are achievable within
the cold box of this process. Figure 2-3 shows the T-Q diagram for the above typical Prico
process.
Figure 2-3: Temperature-Enthalpy diagram of Prico process
2.1.3 Precooled Mixed Refrigerant Process
Propane precooled mixed refrigerant process (C3MR) is the most widely used LNG production
process which is licensed by Air Products & Chemicals Inc (APCI). C3MR is actually a
combination of the cascade and mixed refrigerant processes through which the natural gas feed is
precooled by a multi stage pure propane cycle first down to -30°C. This precooling leads to
condensing heavier hydrocarbons including LPG components which are separated by scrub
column and sent to the fractionation trains. After precooling, the gas liquefies within the Main
Cryogenic Heat Exchanger (MCHE) which is a special large spiral wound heat exchanger. The
MCHE uses a mixed refrigerant system.

17
Figure 2-4: C3MR Process
In C3MR process, the C3 cycle load should be high enough to support cooling of both feed gas
as well as MR. As a result, this process is limited for production rates up to 5 MTPA. To increase
the production capacity, a Nitrogen Brayton cycle could be added to the end of C3MR to form
the three cycle process of AP-XTM with a capacity of almost 8 MTPA. Figure 2-5 illustrates a
schematic block diagram for this process [6].
Figure 2-5: The AP-XTM Process

18
Shell has introduced another process which is called Dual Mixed Refrigerant (DMR). This
process has two refrigeration cycles which have their own refrigerants. The first cycle is for
precooling through two parallel heat exchangers and the second cycle is for the liquefaction
process. The block diagram of this process is shown through Figure 2-6.
Figure 2-6: Shell DMR Process
This process mainly differs from C3MR in its precooling section through which better power
control over compression loads and higher efficiency compression operation would be possible.
In addition, the temperature of the precooling portion of the process could be lowered because
the critical point constraint imposed by pure propane in C3MR doesn’t exist [4, 7].
Although there are several other processes this report is limited to the above processes to get the
concept of whole LNG liquefaction process and having a better sense of common equipment
used in these processes. Within the next section the need for offshore LNG production and the
process alternatives for it are discussed.
2.1.4 Future Developments
Almost one-third of the gas reserves in the world are located offshore which requires to be
brought onshore for further processing into LNG product. Traditional onshore LNG plants
usually require a platform based process facility to dehydrate condition and compress feed gas
according to long distance pipeline specifications. Then a large scale onshore LNG plant with a
special harbor for accommodating special LNG vessels was needed. As it could be perceived the

19
whole scheme requires huge amount of capital expenditures. To become agile in responding to
the market demand, the concept of Floating LNG (FLNG) emerges recently. The following
advantages of this concept make it worth to analyze more:
Less capital costs by eliminating the need for platform, pipeline and harbor
Less environmental impact
Mobility to new locations in the case of depleted reservoir
To select the relevant liquefaction process for FLNGs several factors should be taken into
consideration. Main constraints for these facilities include deck space limitations and the
challenge of marine movements. So, FLNGs require simpler processes comparing to onshore
land-based LNG plants. Considering all of these factors two main criteria are key players in
selecting relevant process for FLNGs:
Compactness and;
Efficiency
Considering compactness requirement, simple MR processes like Prico is relevant while
considering efficiency leading to DMR process. In their paper Lee and Long proposed cycles
basically with combination of MR and DMR process. In their proposals a single MR separates
into heavy liquid and light vapor (HK,LK) by a separator. Then these two refrigerants have their
own refrigeration role separately within the heat exchanger. They proposed process is depicted
through Figure 2-7 [4, 6, 7].
Figure 2-7: The proposed process for FLNG
20
LPG extraction and its business case for an LNG plant 2.2
There are several reasons that justify the LPG extraction in a typical LNG plant. The followings
are the most important reasons for design and implementing such a plant [8]:
To adjust the heating value of the LNG product specifications
To remove heavier components which might freeze during the liquefaction process
To produce valuable LPG products for sale as a separate product
To supply the main liquefaction process with refrigerant make-ups
The produced LNG needs to be complied with the heating value specifications. This means that
for lower HHV specifications deep LPG component (ethane, propane and butane) extraction is
required while for higher HHV specifications, lighter LPG component extraction is required. The
other alternative to reduce HHV is adding nitrogen to the produced LNG. The investigations
done by McCartney have shown that LPG extraction in the LNG production line will increase
the total compression power requirements. However because of the LPG products the production
rate would be increased, the LPG extraction technology plays a vital role to make it
economically viable at least from energy consumption point of view. [9]
There are different process alternatives to extract LPG components among which two major
schemes are common in LNG plants. The first scheme is based on a turbo-expander process
which is implemented upstream of the main LNG liquefaction process [8]. The second extraction
scheme is integrated with natural gas liquefaction by using a so called scrub column. Figure 2-8
shows a block diagram for these two different LPG extraction schemes in a typical LNG plant. A
brief description of these two process alternatives are discussed in the next sections and the
advantages of integrated approach are also mentioned.

21
Figure 2-8: LPG recovery schemes in a typical LNG plant
2.2.1 Turbo-expander LPG recovery
To achieve higher recoveries of ethane and propane components, lower cryogenic separation
temperatures are required than that achievable by using propane refrigeration cycles. In order to
get to these low temperatures, a combined process of expansion and cooling could be used. The
following three methods can be deployed to achieve this goal:
J-T expansion
Turbo-expander
Mechanical refrigeration
Among these options turbo-expander process has the most usage among the gas processing
facilities. The extent of ethane recovery is related to the following factors which should be taken
into consideration:
The amount of existing inert gases in the feed
The HHV specification for the residual gas

22
As it could be guessed, in the case of some existing inert gases in the feed, less deep extraction
of ethane is required to compensate for increasing the HHV of the sales gas. Turbo-expander
process offers higher efficiencies by using isentropic expansion across turbine compared to J-T
process.
Generally, the feed gas goes through the turbo-expander and uses the gas pressure for
refrigeration. Turbo-expansion of gas will lead to recovery of some useful work which could be
used to run the compression system for recompressing the residual gas. The isentropic nature of
expansion across a typical turbo-expander leads to less refrigeration temperatures compared to a
J-T valve expansion. A flow diagram for a turbo-expander plant is shown through Figure 2-9. It
could be seen that the feed and dried gas is chilled by the residual gas. Sometimes mechanical
refrigeration is provided to complement the gas cooling process. Then the chilled gas is fed to
the cold separator where hydrocarbon liquids are separated and isenthalpically expanded by a J-T
valve and then fed back into the middle of the demethanizer. The vapor phase coming out of the
cold separator goes through the expander and isentropically expanded. Then it flows to the top
portion of the demethanizer. As mentioned above, isentropic expansion will lead to lower
temperatures compared to isenthalpic expansion. Hence, the vapor which expanded by expander
goes to the top of the demethanizer.
Figure 2-9: Upstream turbo-expander LPG extraction

23
In addition to being a recovery limit, the need for running this plant at critical conditions imposes
instability problems from operational point of view. The ethane recovery for this configuration is
limited up to 80%. To increase recovery, low temperatures must be achieved by overcoming to
the above limitations. The following modifications have been made to conventional turbo-
expander plants to achieve this goal:
Residue Recycle: through which a portion of the residue gas after recompression to
pipeline pressure goes through feed heat exchanger. Then after full condensation recycled
back to the demethanizer tower providing more refrigeration. As a result higher Ethane
recovery would be achieved.
Gas Subcooled Process: through which a portion of the gas from the cold separator sent
to the overhead exchanger and fully condensed with the overhead stream. Then this
stream is flashed and recycled to the top of the demethanizer as the reflux.
In both of these modifications the amount of Ethane recovery enhancement is dependent on the
amount of reflux. Figure 2-10 and Figure 2-11 show the expander plant with these two
modifications schematically [3, 10].
Figure 2-10: Turbo-expander with Residue Recycle

24
Figure 2-11: Turbo expander with Gas Subcooled Process
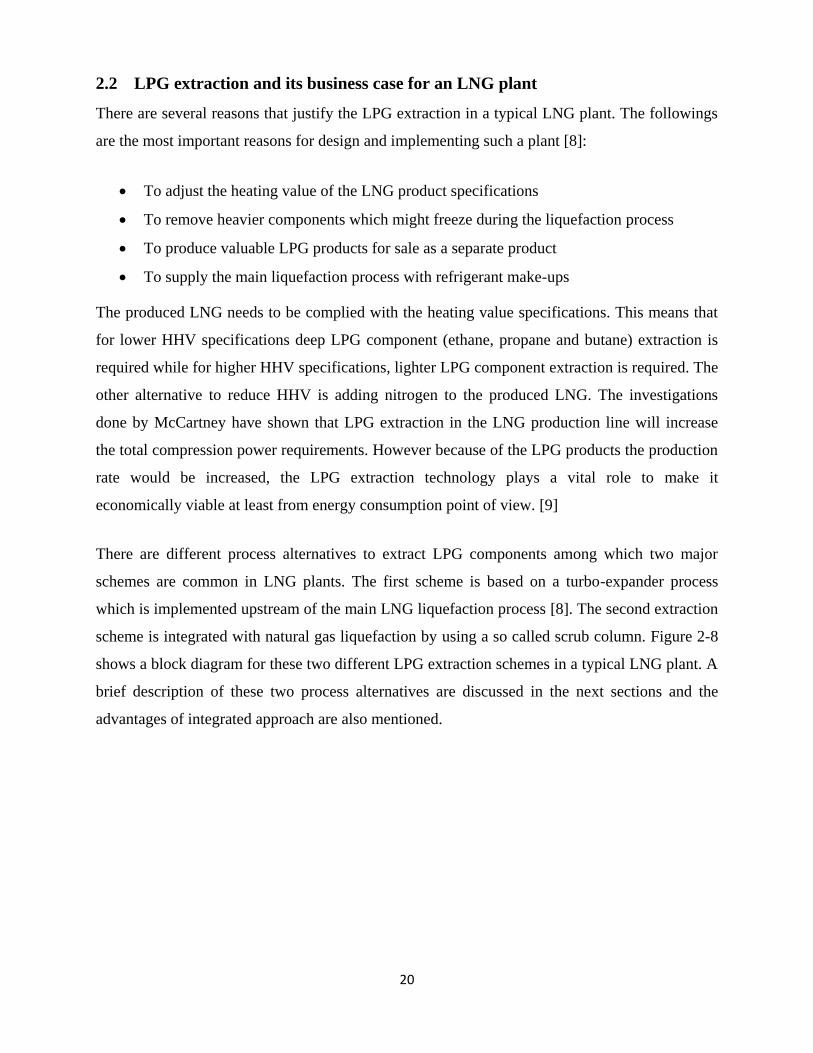
2.2.2 Integrated LPG Extraction and LNG Process
Changing world markets toward NGL as well as increasing demand for LNG as an emerging
source of energy synergistically increase the motivation towards integrated process approach.
Furthermore, almost all natural gas components have higher condensation temperatures
compared to methane. So, from technical point of view they could be liquefied within the main
LNG liquefaction process. This is a basic overview of integration of NGL recovery with LNG
liquefaction process. This recovery method is a form of integrated scrub column process which is
operable at feed pressure of the main LNG liquefaction plant. The main characterization of this
process is its capability to retain high pressure for efficient LNG liquefaction process.
Figure 2-12 shows schematically the integrated LPG extraction processes [11, 12].
25
Figure 2-12: Integrated LPG extraction process in an LNG plant
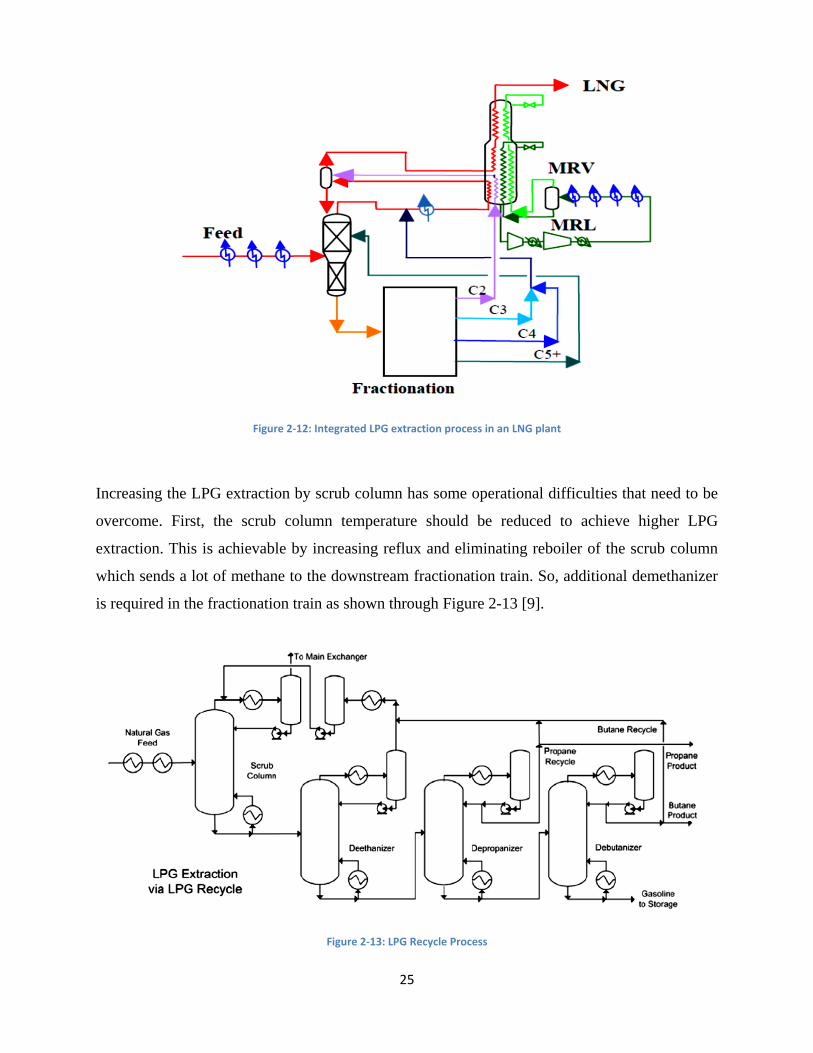
Increasing the LPG extraction by scrub column has some operational difficulties that need to be
overcome. First, the scrub column temperature should be reduced to achieve higher LPG
extraction. This is achievable by increasing reflux and eliminating reboiler of the scrub column
which sends a lot of methane to the downstream fractionation train. So, additional demethanizer
is required in the fractionation train as shown through Figure 2-13 [9].
Figure 2-13: LPG Recycle Process

26
Increasing LPG extraction by lowering column temperature is limited to the critical conditions of
the overhead mixtures. Furthermore, increased extraction of propane and butane makes the
overhead mixture leaner. As a result, the critical pressure reduced and the scrub column should
operate at lower pressure which leads to less efficient liquefaction. To cope with this problem an
ethane stream is recycled back to the scrub column resulting in retaining higher critical pressures
up to 55 bar. If further extraction is required a recycle of C5+ could also be fed into the column.
By deploying these techniques a recovery of 95% of the LPG components can be achieved.
The integrated process approach gets more consideration in the industry. Elliot D. et al has
discussed the following advantages for this process[8, 12]:
Less combined capital and operating costs by avoiding duplication of refrigeration duties
and equipment as well as common utility usage
Higher thermodynamic efficiency leading to reduce specific power consumption
The opportunity to improving the overall project economy by early production of NGL
recovery before commissioning of LNG plant
Operational flexibility in switching between ethane recovery and ethane rejection modes
Higher recovery of LPG and aromatic components
DWC Background and Industrial Applications 2.3
The fully thermally coupled systems of distillation columns are among interested process
industry issues from several years ago. DWC idea was first presented through a patent by Wright
(1949) considering the thermal coupling concept. Then, Petyluk et al. (1965) developed it for
separation of ternary mixtures and Petlyuk column introduced. Afterwards, high energy prices
as well as the global interest to reduce both capital and operating costs derived many researches
to evolve the concept of fully thermally coupled distillation systems from energy saving point of
view[13].
The following stories about the industrial application and development of DWCs has been
quoted by Premkumar (2008).

27
It is announced by Kaibel G. (1988) and European Chemical News (ECN, 1995) that
DWC was used first by BASF AG at 1985 and it had successfully installed and operated
more than 30 such columns.
As per M.W. Kellog Limited press release, 11 September 1998, M.W. Kellog Limited in
association with BP (later known as BP Amoco), successfully installed a divided wall
column at BP’s Coryton refinery, UK
A divided wall column have been developed by Sumitomo Heavy Industries Co. together
with Kyowa Yuka, as per Parkinson G. (1998)
The world’s largest divided wall tray column constructed by Linde AG for Sasol at 1999,
with 107 m height and 5m in diameter
DWCs could be applied in a wide range of applications. They are suitable for separation of
mixtures three or multi component mixtures. Figure 2-14 shows the increasing trend in DWC
applications in the chemical industry.
Figure 2-14: Number of reported industrial DWCs over years [14]
Initial application of DWCs were restricted to final distillations through which the medium
boiling component was the main component and should be separated from low fractions of light
and heavy components. Over the years its applications elaborated in such a fast pace that DWCs

28
were used to produce highest purity grades. These applications are as hydrocarbons, alcohols,
aldehydes, ketones, acetals, amines, etc. In addition, DWCs could be used in azeotropic,
extractive and reactive distillation.
The range of products is wide. It covers hydrocarbons, alcohols, aldehydes, ketones, acetals,
amines and others. Obviously there are no restrictions with respect to the type of chemicals. The
industrial applications of DWC were reviewed by Yildirim et al. Most of the applications (116
out of 125) are for ternary separations. Based on this article, there are few applications of DWCs
for more than three component mixtures which were conducted by BASF SE and UOP.
Table 2-1 and Table 2-2 list a number of industrial applications of DWCs for ternary and multi
component systems respectively.
Table 2-1: Industrial application of DWCs for ternary systems
Table 2-2: DWC application for more than three component mixtures
This history track shows an increasing interest in using DWCs in process industries [13-15].

29
3 Theory and Literature Review
Having good understanding of the basic principles of distillation would be helpful to optimum
application of it through industrial functions. In this section multicomponent distillation and
divided wall column (DWC) arrangements are introduced first. Then basic distillation theory and
the governing equations are addressed and design procedures are described.
Multi-component distillation 3.1
Industrial application of distillation usually involves multi-component mixtures which need to be
separated into salable products. So, distillation theory also needs to be analyzed for multi-
component systems. The design of a distillation column for a multicomponent process is much
more complex than a binary system through which fixing one component will lead to fixed
composition of the other. In this kind of distillation top and bottom products could not be
specified independent of each other. So, top and bottom products are separated by putting some
limits of two key components between which we intend the separation to occur. The component
that is intended to be out of the bottom product is called light key and the one that is intended to
be out of top product is called heavy key component. [16]
One feature of multicomponent distillation is that it needs more than two distillation columns to
achieve the separation. The general rule is that lighter components than the product should be
removed first. Then in the second column, the product will be separated from the heavier
components. As a rule, if the feed has N components and complete separation of each
component needed, then N-1 column would be required to achieve this separation.[16]
As the number of components increases, number of possible column arrangements increase
dramatically. It is obvious that the best alternative is the best economically viable option during
its lifecycle. However, the designer could use heuristic rules to select optimum arrangement:
3.1.1 Column Arrangements
Different column arrangements have been developed to reduce both energy and cost demands of
conventional distillation. In this section both simple and complex arrangements are described in
a brief way. Figure 3-1 shows schematically these various configurations

30
Figure 3-1: Different column arrangements for distillation process
In multicomponent distillation, at least two distillation columns are required to achieve a pure
product specification. Common simple conventional configurations with well-known industry
records are as follows:
Direct Sequence: In this arrangement the light components are separated first. Through
the next columns the heavier components are then separated.
Indirect Sequence: In this arrangement the sequence of separation is against the above
one.
Distributed Sequence: Through this arrangement combined splits of light and heavy
components go through consecutive columns.
Column arrangements
Simple
Direct sequence
Indirect sequence
Distributed sequence
Complex
Side rectifier &
Side stripper
Pre-fractionator
Petyluk Divided Wall
Column

31
Figure 3-2: Simple column configuration[13]
Different simple column configurations are depicted in Figure 3-2 for a typical 3-component
separation process. Simple configurations have some thermal inefficiency. Schultz et al has
investigated this inefficiency in his article.
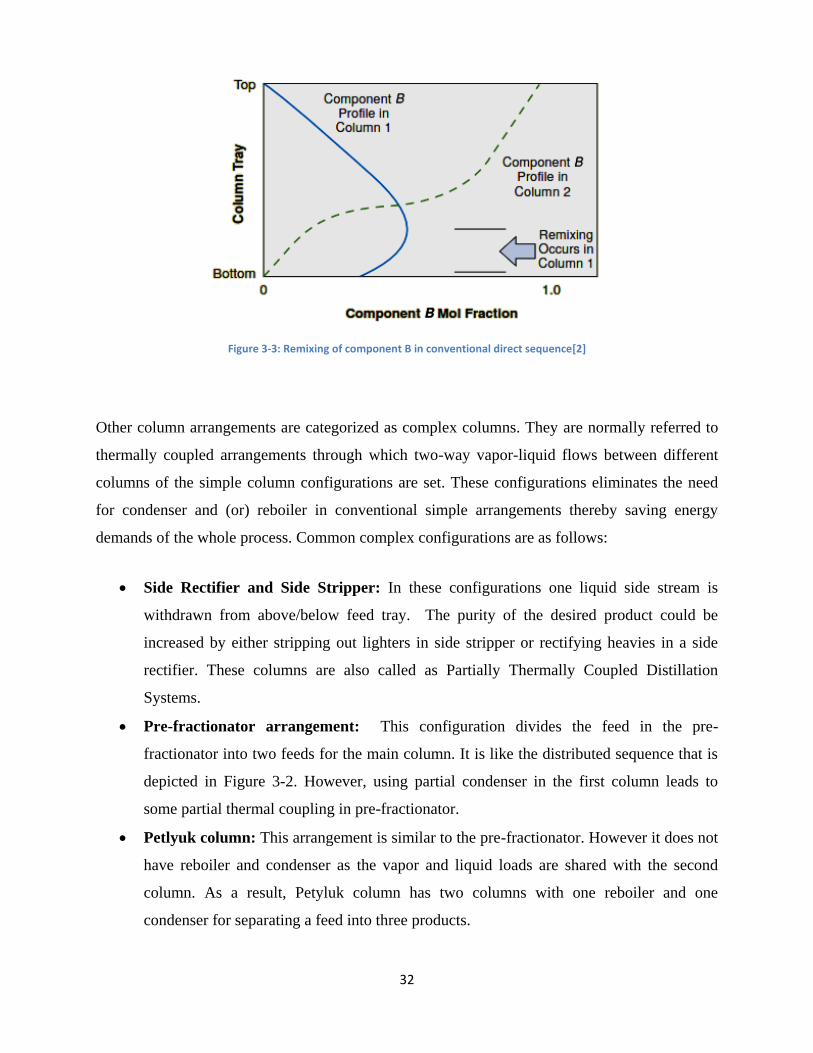
Concentration profile for component B in the first column of direct sequence configuration is
shown through Figure 3-3. It could be seen that B reaches into its highest purity in some tray
near the bottom. Then because it is not separated within first column it starts to dilution because
of increase in concentration of component C. The process of dilution and remixing with C makes
this column configuration less efficient from energy point of view[2, 13].
32
Figure 3-3: Remixing of component B in conventional direct sequence[2]
Other column arrangements are categorized as complex columns. They are normally referred to
thermally coupled arrangements through which two-way vapor-liquid flows between different
columns of the simple column configurations are set. These configurations eliminates the need
for condenser and (or) reboiler in conventional simple arrangements thereby saving energy
demands of the whole process. Common complex configurations are as follows:
Side Rectifier and Side Stripper: In these configurations one liquid side stream is
withdrawn from above/below feed tray. The purity of the desired product could be
increased by either stripping out lighters in side stripper or rectifying heavies in a side
rectifier. These columns are also called as Partially Thermally Coupled Distillation
Systems.
Pre-fractionator arrangement: This configuration divides the feed in the pre-
fractionator into two feeds for the main column. It is like the distributed sequence that is
depicted in Figure 3-2. However, using partial condenser in the first column leads to
some partial thermal coupling in pre-fractionator.
Petlyuk column: This arrangement is similar to the pre-fractionator. However it does not
have reboiler and condenser as the vapor and liquid loads are shared with the second
column. As a result, Petyluk column has two columns with one reboiler and one
condenser for separating a feed into three products.

33
Divided Wall Column: All the concepts in Petyluk column extends into one column
which is divided wall column.
Figure 3-4 shows schematically different complex configurations for a typical three component
separation process..
Figure 3-4: Complex column configuration[13]

34
Divided Wall Column (DWC) 3.2
In Petlyuk and Divided Wall Column configurations there is a sharp split between A and C in the
pre-fractionator column and B are distributed between overhead and bottom of the column. As a
result the fraction of B that could be separated in the pre-fractionator could be set by design
process by which up to 30% of energy savings could be achieved. The main reason for such
energy efficiency is due to remixing avoidance of internal streams which is described in 3.1.1.
[2, 13, 14, 17].
3.2.1 DWC Configuration for three component separation
Yildrim et al, has categorized three component DWCs into two different groups. The first type
which are called Conventional Divided Wall Columns (CDWC), are originally the first DWC
which patented by Wright. In this category, the dividing wall, feed and side streams are almost
located in the middle of the column. Figure 3-5 (a) shows a typical basic CDWC. Figure 3-5 (b)
and (c) show other CDWCs through which dividing wall is installed in the bottom or overhead
section of the shell respectively and are patented by Monro [14].
Figure 3-5: Basic types of DWCs
In second category, dividing wall could be moved from the middle of the shell towards the wall.
It also could have diagonal shapes as shown through Figure 3-6 (a), (b) and (c).

35
Figure 3-6: Shape and position of the dividing wall
3.2.2 DWC Configuration for four component separation
DWC could also be applied for separating more than three components. Basic DWC that are
designed for separating four component mixtures are shown through Figure 3-7. Figure (a)
schematically shows Kaibel column through which the separation takes place with a single
dividing wall. This configuration is simpler but thermally inefficient. Figure (b) shows Sergent
arrangement which is more thermally efficient by column by using three dividing walls.
However there is no report addressing its industrial application.
Figure 3-7: DWC for separating four component mixtures

36
3.2.3 Other configurations
Other configurations especially for four component separation could be possible. Agrawal
arrangement and its top view are depicted through Figure 3-8 (a) and (b) while top view of
triangular wall structures is depicted through Figure 3-8 (c).
Figure 3-8: Agrawal arrangement (a,b) and triangular wall structure (c)
VLE Equilibrium 3.3
Through the following sections basic thermodynamic equations and design parameters for both
conventional and DWC columns are addressed. This section is the basis for all the calculations
that are required for design purposes. However the level of detail and rigorousness of the
formulas are restricted to the scope of this study.
For each individual component of the mixture thermodynamic vapor-liquid equilibrium is
defined as the following equation through which f represent component fugacity.
3-1

37
Fugacity could be perceived as escaping tendency and could be expressed as a coefficient of
pressure as shown through Equations 3-1and 3-2 [18].
3-2
And for liquid phase:
3-3
Where P=total system pressure
ϕi=vapor fugacity coefficient
yi=mole fraction of component I in vapor
=standard state fugacity of the pure liquid
=liquid phase activity coefficients
Combining Equations 3-2 and 3-3 into equation 3-1 and then rearranging the formula leads to the
following equation which is the basis for all vapor-liquid equilibrium calculations.
3-4
The ratio of K-values of two components measures their relative volatility:
⁄
⁄
3-5
Large relative volatilities show larger differences in boiling points and better separation.

38
A distillation column could be perceived as a series of vapor-liquid equilibrium stages. The
concept of equilibrium stage is graphically shown through Figure 3-9 [19].
Figure 3-9: Equilibrium stage concept[19]
The following steps show a general step by step approach to design a distillation column:
1. By specifying the product specification determine the extent of required separation
2. Select the operating conditions and operating pressure
3. Determine which contacting mechanism is going to be used
4. Select the number of equilibrium stages and the amount of reflux
5. Do the sizing of the column and determine the real number of stages
6. Design all the required internals for the column
7. Complete the mechanical design and fittings for the column internals
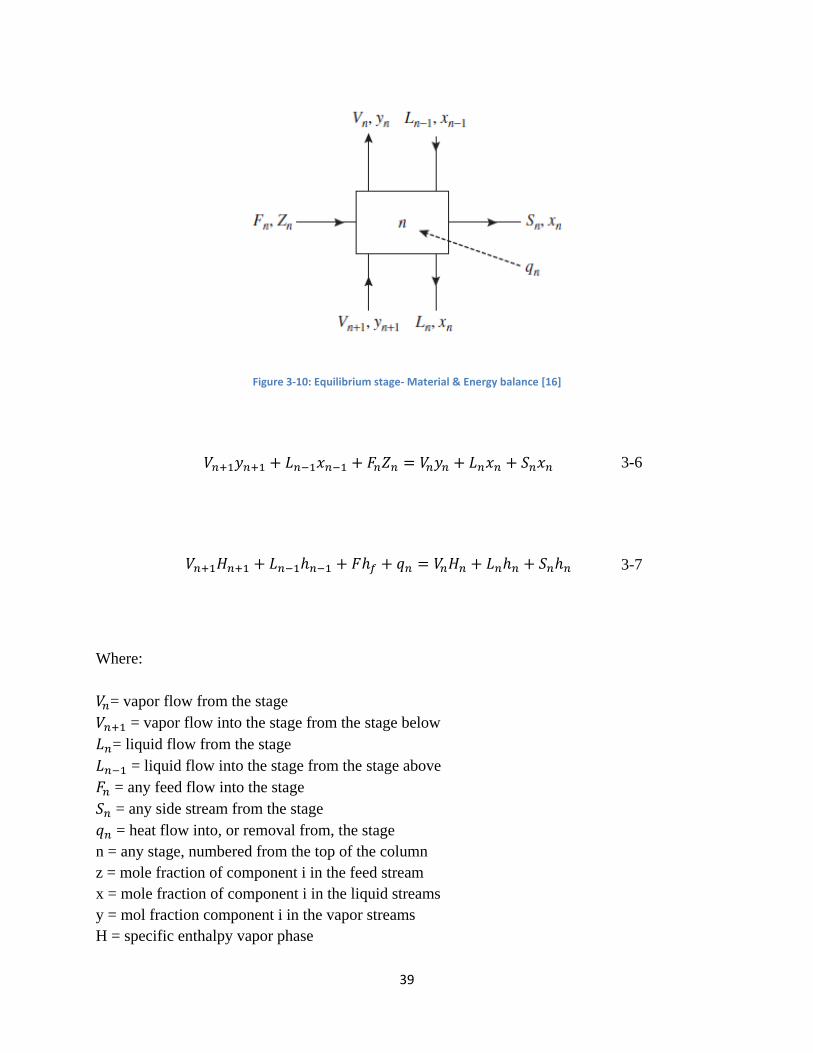
In the process of distillation, material and energy balance could be set over each equilibrium
stage.
39
Figure 3-10: Equilibrium stage- Material & Energy balance [16]
3-6
3-7
Where:
= vapor flow from the stage
= vapor flow into the stage from the stage below
= liquid flow from the stage
= liquid flow into the stage from the stage above
= any feed flow into the stage
= any side stream from the stage
= heat flow into, or removal from, the stage
n = any stage, numbered from the top of the column
z = mole fraction of component i in the feed stream
x = mole fraction of component i in the liquid streams
y = mol fraction component i in the vapor streams
H = specific enthalpy vapor phase
40
h = specific enthalpy liquid phase
= specific enthalpy feed (vapor + liquid)
Another equation that is helpful to specify the design of a distillation process is the summation
equation:
∑ ∑ 3-8
The four equations 3-43-5, 3-6, 3-7 and 3-8 form the basis for solving the design problem for
each stage as well as condenser and reboiler in a distillation column.
Bubble point and dew point calculations are important for estimating the temperature of the
condenser and reboiler. So, by definition these temperatures could be obtained by iteration
through application of the following equations:
Bubble point: ∑ ∑ 3-9
Dew point: ∑ ∑
3-10
Flash Calculations 3.4
In a typical flash process, a feed containing vapor and liquid phases would be allowed to be
separated. The purpose of this kind of calculation is to evaluate the composition of each
individual phase. In a distillation column the following items are main applications of flash
calculations:
To determine the condition of the feed

41
To determine the flow of vapor from reboiler or condenser
Figure 3-11 shows graphically a typical flash process. The material and energy balance for this
process will lead to equations 3-11 and 3-12 [16].
Figure 3-11: Flash distillation
3-11
3-12
Using equilibrium constant equations will make the above equations in a more useful form of
equations
∑
[ ]
3-13

42
∑
[
]
3-14
For designing a distillation column some variables need to be specified. The first variable is feed
rate which is usually fixed by preliminary design. The other variable which is fixed by early
design is column pressure. Generally distillation is happening better at lower pressures because
at low pressures relative volatility is higher. However, there should be always a compromise to
set column pressure high enough to save energy consumption in reboiler and condenser. Then,
number of stages above and below the feed should be specified. At this stage specifying two
other independent variables will define the column completely. For example by specifying reflux
ratio and boil-up ratio or reflux ratio and distillate rate then there would be a fixed distillate and
bottom composition for given column feed. Specifying these pairs could be continued to
composition of two key components in distillate or bottom and then getting to a required reflux
rate, boil-up rate or flow rate. That would be the same way for recovery or purity of a component
in the products[16].
There are several graphical and simple methods for designing distillation columns for binary
systems among which Lewis-Sorel and McCabe-Thiele methods could be named. In the
following section the design for DWC by using multicomponent distillation design techniques
are discussed in more detailed.
DWC Design Procedures 3.5
For designing a DWC, number of degree of freedom is larger than its conventional counterparts.
Assuming a three component mixture which is going to be separated by conventional two
column sequence, one could notice that every column could be designed independent of the
other. It avoids DWC design methods to be straightforward as conventional ones and might be
the reason for more conservative acceptance within the industry. The followings are design
parameters for a typical three component separation by a Kaibel DWC and are shown
schematically through Figure 3-12 [20]:

43
Number of stages in 6 different stages
Liquid split ratio
Vapor split ratio
Reflux ratio
Heat load of the reboiler
Side-product flow rate
Figure 3-12: Design parameters for a 3-component separation by DWC
The design procedure for DWC is similar to conventional columns at initial steps. It requires
defining the column arrangement and determining the operating pressure as well as selecting a
thermodynamic VLE model. The next steps for designing DWCs imply more complexity which
has been tried to be addressed within the next subsections of this chapter [20].
3.5.1 Heuristic Rules for DWC Design
Like designing conventional columns there are some heuristic rules applicable for designing of
DWCs which could be used as initial estimates for simulations:
Design a conventional column system as a base case (i.e. a three-column system)
The total number of stages for DWC could be calculated as 80% of the total stages for
conventional system.

44
The dividing wall could be placed at the middle third of the column (i.e. 33-66% H)
The internal flow rates within the DWC could be established as 70% of the total duties of
condenser or reboiler in conventional sequence.
Equal vapor and liquid splits could be used as initial estimates.
It is clear that these rules are just to help initial convergence of the DWC model and a lot of
adjustment and optimization might be required to achieve optimum design [17].
In the next section, some shortcut methods are described to calculate stage and reflux
requirements of multicomponent distillations. These methods are mostly applicable for
hydrocarbon applications through oil and gas industry and are based on the constant relative
volatility assumption. These methods could also be used for DWC design calculations.
3.5.2 Minimum number of stages (Fenske Equation)
Fenske equation is used to calculate the minimum number of stages needed at total reflux. This
equation is as follows:
[ ]
[
]
3-15
Where xi/xr is the ratio of each component i concentration to the concentration of a reference one
r, and the suffixes d and b refers to the distillate and the bottoms, Nmin is the minimum number of
stages needed at total reflux conditions. αi is the average relative volatility of the component i
compared to the reference component r.
As the separation in multicomponent distillation is specified by key components 3-15 could be
rearranged as:

45
[
] [
]
3-16
Where αLK is the average relative volatility of light key to the heavy key component and xLK and
xHK are light and heavy key component concentrations. The relative volatility is calculated by
geometric mean value of volatility at top and bottom temperatures. To have these temperatures
an initial estimate of the composition is needed which makes Fenske equation a trial and error
way of calculating minimum number of stages. The following formula developed by Winn to
estimate the number of stages at total reflux condition [16]:
[ ]
3-17
Where d and b denoted to flow rates at distillate and bottom of the column.
3.5.3 Minimum Reflux Ratio (Underwood Equation)
The Underwood equation is used to calculate the minimum reflux ratio for multicomponent
distillation. This equation is as follows:
∑
3-18
Where xi,d is the concentration of component i in the distillate at the reflux ratio and θ is the root
of the following equation:
∑
3-19

46
Where xi,f is the concentration of component i in the feed and q is the feed condition defined in
the McCabe-Thiele method.
3-20
Like Fenske equation, geometric average of relative volatilities at temperatures of top and
bottom of the column is used. To do that an estimate of the top and bottom compositions is
required for which Fenske equation could be used. A better estimate is to replace the number of
stages in equation 3-17 by Nmin/0.6 which is a more realistic number of stages [16].
3.5.4 Feed Location
There is an empirical equation developed by Kirkbride to determine the feed location:
[ ] [(
)(
)(
)
] 3-21
where Nr is the number of stages above the feed, Ns is the number of stages below the feed, xf,HK
and xf,LK are concentrations of the heavy and light keys in the feed, xd,HK and xb,LK are
concentrations of the heavy and light keys in the distillate and bottom products.
3.5.5 Vmin Diagram Method
This method is a simple graphical method presented by Halvorsen and Skogstad and graphically
shows the minimum energy by vapor flow. This method is founded on Underwoods equation and
assumes constant molar flow, infinite number of stages, constant relative volatilities. The Vmin
could be calculated by using underwood equation with the following input parameters:
Feed composition
Feed quality expressed by liquid fraction

47
K-values and,
Product purities
As stated above this method assumes infinite number of stages and this could be achieved
roughly by establishing the number of stages for simulation equal to 4Nmin which Nmin could be
calculated by Fenske equation as presented through Equations 3-15 3-16. This method could
describe the transfer of liquid and vapor through each part of the DWC. The main basis for this
method is that the minimum vapor flow that is needed to separate a mixture of n components into
its n pure products corresponds to the same flow required to separate the most difficult split. This
basis is shown as the highest peak in the diagram associated with the method (Vmin diagram).
The Vmin diagram shows the vapor flow rate above the feed (V/F) versus the net flow of the top
product (D/F) per unit of feed. Figure 3-13 is a typical Vmin diagram for a ternary system ABC. It
shows how feed components are distributed to the top and bottom products in a simple
distillation column without side streams and with infinite stage[17, 19].
Figure 3-13: Vmin diagram of a ternary system

48
4 Methodology and Results
In this section the method for simulating both conventional fractionation and DWC are
developed for a typical industrial application for NGL recovery and LPG production.
Conventional Fractionation model development (Base Case) 4.1
As described in section 2.2.2, integrated LPG extraction is one of the modt widely used
techniques in LNG plants. The bottom product from the scrub column in the integrated NGL
recovery scheme goes into fractionation stages to achieve further separation. This NGL is
fractionated by heating and passing through a series of distillation towers (fractionators) which
separation takes place mainly with differing boiling points of the various NGL components [21].
As discussed through section 2.2.2 and depicted through Figure 2-13, a demethanizer is required
to remove all the methane coming through the scrub column bottom.
4.1.1 Column Performance Parameters
To analyze the performance of a distillation column the following variables are considered [22]:
Component fractions and recoveries
Product temperature
Condenser and reboiler duties
The rates of overhead and bottom products determines the light and heavy key components for
each distillation stage in the train [22]
It should be noted that changing the reflux ratio would change the composition of those products
that are near the key components. It means that both much heavier and lighter components than
key components would be less sensitive to reflux ratio changes. The split location might be
changed by changing the distillate rate. This would be happened by changing of light and heavy
key components. It is obvious that the condenser and reboiler heat duties will change
significantly by varying reflux ratio due to heat load variation. The temperature of the product is
also insensitive to changing reflux ratio by keeping the product rate constant. So, the
composition of light and heavy key components could be fine-tuned by changing reflux ratio

49
without affecting the product temperature in a great way. Generally speaking, product rates have
more effects on the column performance than reflux ratio [22].
The depropanizer has three different products. The top product is mainly propane which could be
used both for sale and refrigerant make-up. The second product is LPG which is mainly propane
and butane and could be extracted as a side draw stream from the depropanizer column. The
third product is condensates which is mainly C5+ components and is regarded as natural gasoline.
The specifications that are used to simulate depropanizer are presented in Table 4-1 .
Depropanizer is called DC3 here in this report.
Table 4-1: DC3 product specifications
Specification Value
C3 mole fraction @ top product 0.95
Max C5+ mole fraction @ LPG product 0.02
RVP @ Condensate product (bar) 0.68
Operating pressure (bar) 11
Number of trays 40
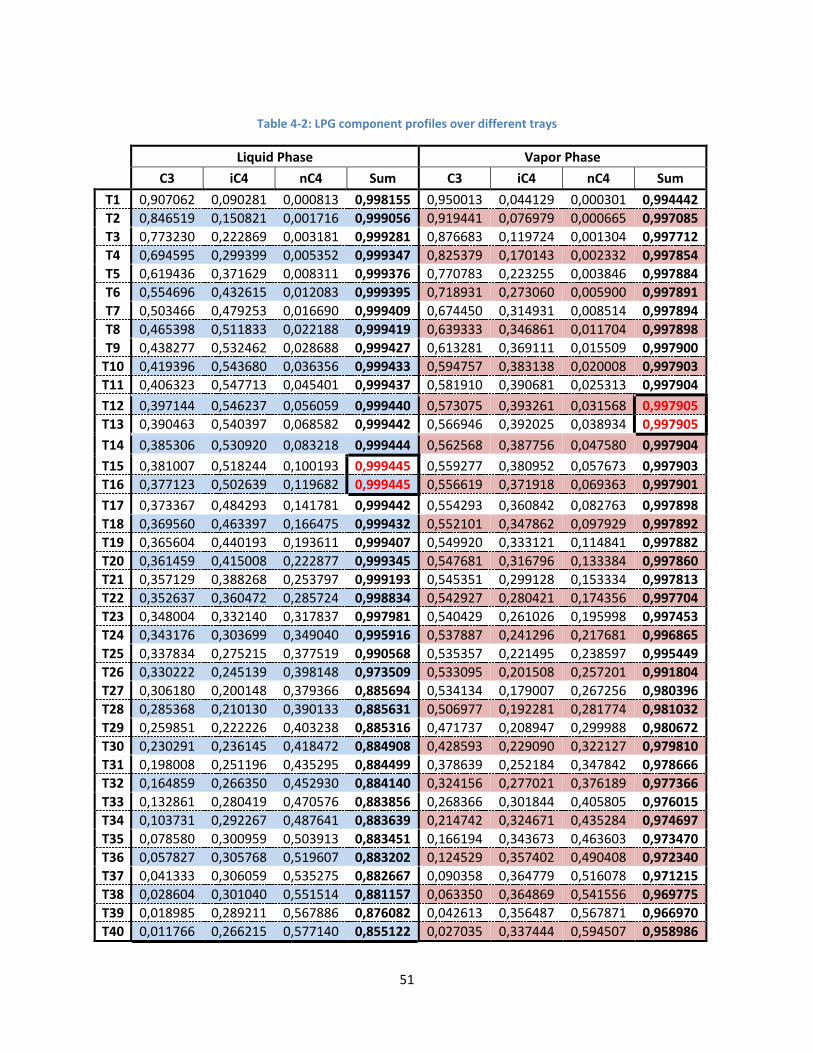
To simulate this column, it is decided to set up the column with its top and bottom specifications
first. Then the composition of propane, iso-butane and n-butane were investigated through all the
trays to find the best tray for drawing the LPG product with maximum amount of LPG
components. The result of this investigation is presented through Table 4-2. Tray number 14
was chosen to draw LPG product from DC3 column.
The addition of side draw product to the column increase degree of freedom to 3 comparing to
DC2 and DC1 columns which have 2 degrees of freedom. The following independent variables
are selected to converge the column:
Reflux ratio
Propane (C3) mole fraction at distillate product
LPG product rate
Condensate product also requires to be adjusted in its vapor pressure to be storable at
atmospheric tanks and usable as a blending component in gasoline. As Reid vapor pressure
(RVP) of the condensate increases, more hydrocarbons could be emitted into the environment.

50
So, its RVP is usually regulated by local environmental standards [23]. The mole fraction
specification of C5+ in LPG product and bottom product RVP are adjusted simultaneously by
changing both reflux ratio and LPG product molar rate. A spreadsheet logical unit operation was
used to monitor the C5+ mole fraction while changing variables. Figure 4-1 shows the flow
datasheet for simulating conventional method of NGL recovery and LPG extraction.
Figure 4-1: Conventional fractionation model using HYSYS for NGL recovery
51
Table 4-2: LPG component profiles over different trays
Liquid Phase Vapor Phase
C3 iC4 nC4 Sum C3 iC4 nC4 Sum
T1 0,907062 0,090281 0,000813 0,998155 0,950013 0,044129 0,000301 0,994442
T2 0,846519 0,150821 0,001716 0,999056 0,919441 0,076979 0,000665 0,997085
T3 0,773230 0,222869 0,003181 0,999281 0,876683 0,119724 0,001304 0,997712
T4 0,694595 0,299399 0,005352 0,999347 0,825379 0,170143 0,002332 0,997854
T5 0,619436 0,371629 0,008311 0,999376 0,770783 0,223255 0,003846 0,997884
T6 0,554696 0,432615 0,012083 0,999395 0,718931 0,273060 0,005900 0,997891
T7 0,503466 0,479253 0,016690 0,999409 0,674450 0,314931 0,008514 0,997894
T8 0,465398 0,511833 0,022188 0,999419 0,639333 0,346861 0,011704 0,997898
T9 0,438277 0,532462 0,028688 0,999427 0,613281 0,369111 0,015509 0,997900
T10 0,419396 0,543680 0,036356 0,999433 0,594757 0,383138 0,020008 0,997903
T11 0,406323 0,547713 0,045401 0,999437 0,581910 0,390681 0,025313 0,997904
T12 0,397144 0,546237 0,056059 0,999440 0,573075 0,393261 0,031568 0,997905
T13 0,390463 0,540397 0,068582 0,999442 0,566946 0,392025 0,038934 0,997905
T14 0,385306 0,530920 0,083218 0,999444 0,562568 0,387756 0,047580 0,997904
T15 0,381007 0,518244 0,100193 0,999445 0,559277 0,380952 0,057673 0,997903
T16 0,377123 0,502639 0,119682 0,999445 0,556619 0,371918 0,069363 0,997901
T17 0,373367 0,484293 0,141781 0,999442 0,554293 0,360842 0,082763 0,997898
T18 0,369560 0,463397 0,166475 0,999432 0,552101 0,347862 0,097929 0,997892
T19 0,365604 0,440193 0,193611 0,999407 0,549920 0,333121 0,114841 0,997882
T20 0,361459 0,415008 0,222877 0,999345 0,547681 0,316796 0,133384 0,997860
T21 0,357129 0,388268 0,253797 0,999193 0,545351 0,299128 0,153334 0,997813
T22 0,352637 0,360472 0,285724 0,998834 0,542927 0,280421 0,174356 0,997704
T23 0,348004 0,332140 0,317837 0,997981 0,540429 0,261026 0,195998 0,997453
T24 0,343176 0,303699 0,349040 0,995916 0,537887 0,241296 0,217681 0,996865
T25 0,337834 0,275215 0,377519 0,990568 0,535357 0,221495 0,238597 0,995449
T26 0,330222 0,245139 0,398148 0,973509 0,533095 0,201508 0,257201 0,991804
T27 0,306180 0,200148 0,379366 0,885694 0,534134 0,179007 0,267256 0,980396
T28 0,285368 0,210130 0,390133 0,885631 0,506977 0,192281 0,281774 0,981032
T29 0,259851 0,222226 0,403238 0,885316 0,471737 0,208947 0,299988 0,980672
T30 0,230291 0,236145 0,418472 0,884908 0,428593 0,229090 0,322127 0,979810
T31 0,198008 0,251196 0,435295 0,884499 0,378639 0,252184 0,347842 0,978666
T32 0,164859 0,266350 0,452930 0,884140 0,324156 0,277021 0,376189 0,977366
T33 0,132861 0,280419 0,470576 0,883856 0,268366 0,301844 0,405805 0,976015
T34 0,103731 0,292267 0,487641 0,883639 0,214742 0,324671 0,435284 0,974697
T35 0,078580 0,300959 0,503913 0,883451 0,166194 0,343673 0,463603 0,973470
T36 0,057827 0,305768 0,519607 0,883202 0,124529 0,357402 0,490408 0,972340
T37 0,041333 0,306059 0,535275 0,882667 0,090358 0,364779 0,516078 0,971215
T38 0,028604 0,301040 0,551514 0,881157 0,063350 0,364869 0,541556 0,969775
T39 0,018985 0,289211 0,567886 0,876082 0,042613 0,356487 0,567871 0,966970
T40 0,011766 0,266215 0,577140 0,855122 0,027035 0,337444 0,594507 0,958986

52
4.1.2 Simulation Results for Conventional method:
After all three distillation towers are converged to get to the required product specifications; the
molar flows shown in Table 4-3 are obtained:
Table 4-3: Product molar flow and specifications in conventional model
Stream Name C1 C2 C3 LPG
Molar flow 182 135.9 157.8 293
Mole fraction 0.97 0.95 0.95 0.98
Component molar flow 176.54 129.1 149.9 287.1
As the main concern of this study is energy consumption of the condensers and reboilers, the
heat duties obtained from this simulation are shown through Table 4-4.
Table 4-4: Energy consumption for the conventional fractionation model (Base case)
Tower Name T100 DC2 DC3 Total Duty
(KW)
Condenser duty (KW) 969.6 2378 2812 6169.6
Reboiler duty (KW) 1891 2568 1940 6399
The Hysys produced reports for this simulation case are presented through Appendices 7.1
to 7.4.

53
Demethanizer and Kaibel DWC 4.2
In this section the whole fractionation process which described in section 4.1, is simulated by a
combination of demethanizer and a Kaibel DWC with Aspen Hysys 7.3. Methane is separated
from the feed at the first conventional column. Then the rest of the separation will take place in
DWC arrangement as seen in Figure 4-2. As DWC is not a predefined unit operation in Hysys, it
is tried to simulate it using conventional tower arrangement equivalent to DWC. Finally, our
interested parameter which is the total energy consumption are optimized with respect to process
variables and compared to the conventional method.
Figure 4-3 shows the flowsheet for the arrangement of towers by which a Kaibel DWC is
modeled in Hysys.
Figure 4-2: The combination of demethanizer and Kaibel DWC

54
Figure 4-3: Sub flowsheet for Kaibel DWC in Hysys model
Table 4-5 shows the purity and the flow rate of products obtained by this method:
Table 4-5: Product molar flow and specifications in Kaibel model
Stream Name C1 C2 C3 LPG
Molar flow 182 133.7 170 290.4
Mole fraction 0.97 0.95 0.85 0.96
Component molar flow 176.5 127 144.5 278.8
As the main concern of this study is energy consumption of the condensers and reboilers, the
heat duties obtained from this simulation are shown through Table 4-6.
Table 4-6: Energy consumption for the Kaibel model
Tower Name DC1 DWC Total
Condenser duty (KW) 969.6 3092 4061.6
Reboiler duty (KW) 1891 3764 5655

55
The following paragraphs are dealing with optimizing the energy consumption by changing
variables like product withdrawal location and flow rate ratio in both sides of DWC.
4.2.1 C3 Withdrawal tray location
The energy consumption for reboiler and condenser of the combined demethanizer and Kaibel
column are evaluated with respect to location of propane withdrawal as a product. The results are
shown through Table 4-7.
Table 4-7: Tray location for C3 withdrawal in terms of minimum energy consumption
Tray Number 8 9 10 11 12,13 14 15 16 17
DC1 Condenser duty
969.6 969.6 969.6 969.6 969.6 969.6 969.6 969.6 969.6
DC1 reboiler duty 1891 1891 1891 1891 1891 1891 1891 1891 1891
DWC condenser duty
3022 3014 3010 3007 3006 3008 3011 3016 3023
DWC reboiler duty 3690 3682 3677 3675 3674 3676 3679 3684 3691
Total Duty (KW) 9572.6 9556.6 9547.6 9542.6 9540.6 9544.6 9550.6 9560.6 9547.6
4.2.2 LPG Withdrawal tray location
After locating the proper tray for withdrawal of propane the same task done for LPG tray
location. As it could be seen through Table 4-8, tray number 33 is the optimum location for LPG
extraction in terms of minimum energy consumption.
Table 4-8: Tray location for LPG withdrawal in terms of minimum energy consumption
Tray Number 29 30 31 32 33 34 35 36 37
DC1 Condenser duty
969.6 969.6 969.6 969.6 969.6 969.6 969.6 969.6 969.6
DC1 reboiler duty 1891 1891 1891 1891 1891 1891 1891 1891 1891
DWC condenser duty
3013 3004 2999 2997 2997 3000 3006 3017 3035
DWC reboiler duty 3684 3675 3670 3668 3667 3669 3674 3682 3697
Total Duty (KW) 9557.6 9539.6 9529.6 9525.6 9524.6 9529.6 9540.6 9559.6 9592.6

56
4.2.3 Liquid flow rate ratio at both sides of Kaibel DWC
The Kaibel DWC is optimized with respect to the ratio of the liquid flow rates at both sides of
DWC. To do this optimization, all other parameters except liquid flow ratios are kept as constant.
Then by varying this ratio the energy consumption evaluated. The results are shown through
Table 4-9.
Table 4-9: The effect of liquid flow ratio on the energy consumption of the Kaibel model
Liquid ratio 0.9 0.8 0.7 0.69 0.68 0.67
DC1 Condenser duty
969.6 969.6 969.6 969.6 969.6 969.6
DC1 reboiler duty 1891 1891 1891 1891 1891 1891
DWC condenser duty
3217 2821 2611 2605 2605 2609
DWC reboiler duty 3893 3480 3210 3198 3192 3192
Total Duty (KW) 9970.6 9161.6 8681.6 8663.6 8657.6 8661.6
4.2.4 C2 flow rate
The flow rate of ethane in the product extracted from condenser is varied to check its effect on
the energy consumption of the whole process.
Table 4-10: Effect of C2 flow rate on energy consumption
C2 flow rate 130 129 128 127 126 125 124
DC1 Condenser duty
969.6 969.6 969.6 969.6 969.6 969.6 969.6
DC1 reboiler duty 1891 1891 1891 1891 1891 1891 1891
DWC condenser duty
2822 2617 2605 2605 2613 2626 2643
DWC reboiler duty 3470 3218 3198 3192 3195 3205 3219
Total Duty (KW) 9152.6 8695.6 8663.6 8657.6 8668.6 8691.6 8722.6
As it could be seen through Table 4-10 at flow rate of 127 kmol/hr the minimum energy
consumption is achieved.

57
4.2.5 C3 flow rate
The flow rate of propane product is varied to check its effect on the energy consumption of the
whole process.
Table 4-11: The effect of C3 flow rate on energy consumption
C3 flow rate 145 146 147 148
DC1 Condenser duty
969.6 969.6 969.6 969.6
DC1 reboiler duty 1891 1891 1891 1891
DWC condenser duty
2605 2651 2701 2753
DWC reboiler duty 3192 3248 3307 3370
Total Duty (KW) 8657.6 8759.6 8868.6 8983.6
As it could be seen through Table 4-11 at flow rate of 145 kmol/hr the minimum energy
consumption is achieved.
4.2.6 LPG flow rate
The flow rate of LPG product is varied to check its effect on the energy consumption of the
whole process.
Table 4-12: The effect of LPG flow rate on energy consumption
LPG flow rate 280 281 282 283 284 285
DC1 Condenser duty
969.6 969.6 969.6 969.6 969.6 969.6
DC1 reboiler duty 1891 1891 1891 1891 1891 1891
DWC condenser duty
2582 2586 2610 2636 2663 2690
DWC reboiler duty 3166 3168 3198 3229 3261 3295
Total Duty (KW) 8608.6 8614.6 8668.6 8725.6 8784.6 8845.6

58
As it could be seen through Table 4-12 at flow rate of 280 kmol/hr the minimum energy
consumption is achieved.
4.2.7 Final Result for Kaibel Model
By considering all the above optimization which is taken with respect to energy consumption,
the following results shown in Table 4-13 for this case are obtained.
Table 4-13: Final summary results for Kaibel DWC model
Stream Name C1 C2 C3 LPG
Molar flow 182 133.7 163.1 297.2
Mole fraction 0.97 0.95 0.889 0.942
Component molar flow 176.5 127 145 280
Total Condenser dyty 3552
Total reboiler duty 5057
Total Duty (KW) 8609
The results in the above table prove that the energy consumption of the combination of the
demethanizer and Kaibel DWC uses less energy. The Total energy consumption in base case is
12559 KW while it goes down to 8609 kw in the Kaibel DWC method. The usage of this new
arrangement shows clearly 31.4 % energy saving. The Hysys produced reports for this
simulation case are presented through Appendices 7.57.7.

59
Multi-partitioned DWC (Sargent arrangement) 4.3
As described in section 3.2.2, the Sergent arrangement is considered as a more thermally coupled
configuration for DWC designs. As there is no reported application of this arrangement through
the available literature, the last part of the simulation study focuses on energy optimization for
this configuration. Figure 4-4 shows a typical schematic for multi-partitioned DWC and the
products from which we are going to extract.
This tower includes three walls which divide the whole tower into nine different separation units.
The main goal for this kind of division is to increase the separation units and decrease the energy
usage by deploying just one set of reboiler and condenser. This will happen through decreasing
the remixing effect of components that are described through section 3.1.1.
Figure 4-4: Multi-component DWC

60
As the whole process will be achievable with just one tower instead of three towers in the
conventional case, there is also a potential to decrease the capital cost. This saving in capital cost
could be analyzed in early study of a typical project to evaluate the best technology relevant for
the prospect plant.
To simulate this tower each individual section was considered as a single tower then different
sections thermally coupled by connecting their liquid and vapor streams. Figure 4-5 shows the
arrangement corresponding to this type of DWC simulated using Aspen Hysys 7.3..
Figure 4-5: Multi-Partitioned DWC arrangement simulated in Aspen Hysys 7.3
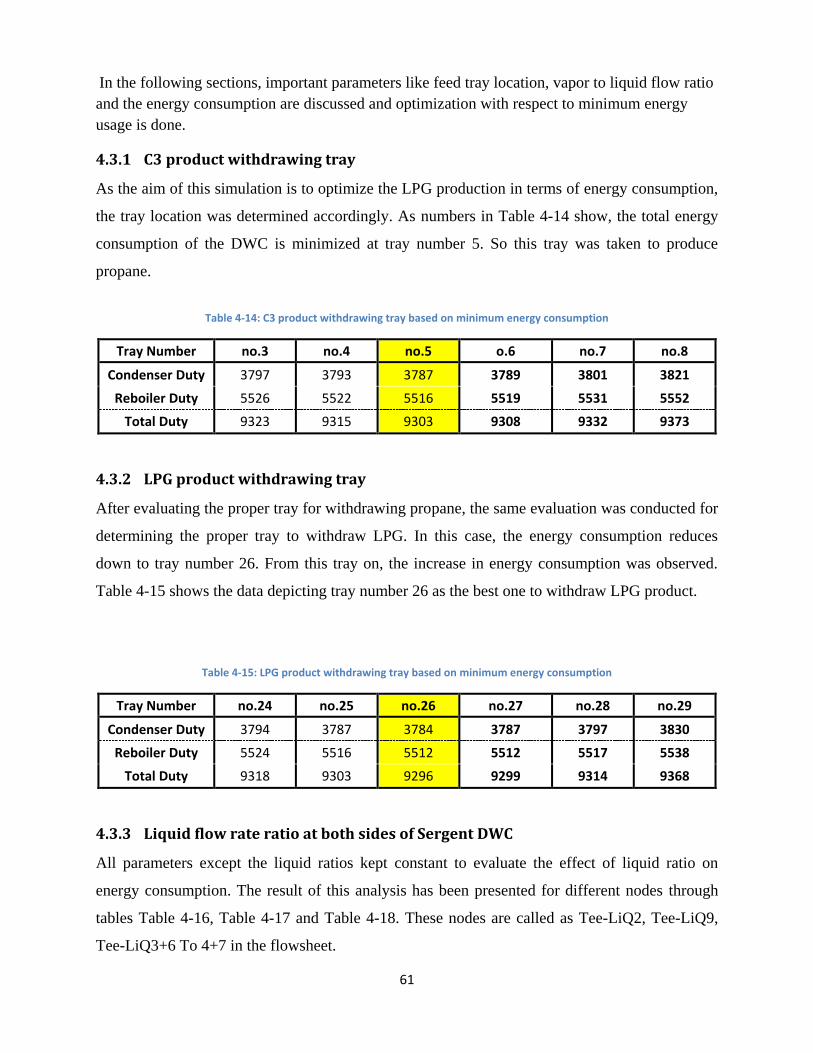
61
In the following sections, important parameters like feed tray location, vapor to liquid flow ratio
and the energy consumption are discussed and optimization with respect to minimum energy
usage is done.
4.3.1 C3 product withdrawing tray
As the aim of this simulation is to optimize the LPG production in terms of energy consumption,
the tray location was determined accordingly. As numbers in Table 4-14 show, the total energy
consumption of the DWC is minimized at tray number 5. So this tray was taken to produce
propane.
Table 4-14: C3 product withdrawing tray based on minimum energy consumption
Tray Number no.3 no.4 no.5 o.6 no.7 no.8
Condenser Duty 3797 3793 3787 3789 3801 3821
Reboiler Duty 5526 5522 5516 5519 5531 5552
Total Duty 9323 9315 9303 9308 9332 9373
4.3.2 LPG product withdrawing tray
After evaluating the proper tray for withdrawing propane, the same evaluation was conducted for
determining the proper tray to withdraw LPG. In this case, the energy consumption reduces
down to tray number 26. From this tray on, the increase in energy consumption was observed.
Table 4-15 shows the data depicting tray number 26 as the best one to withdraw LPG product.
Table 4-15: LPG product withdrawing tray based on minimum energy consumption
Tray Number no.24 no.25 no.26 no.27 no.28 no.29
Condenser Duty 3794 3787 3784 3787 3797 3830
Reboiler Duty 5524 5516 5512 5512 5517 5538
Total Duty 9318 9303 9296 9299 9314 9368
4.3.3 Liquid flow rate ratio at both sides of Sergent DWC
All parameters except the liquid ratios kept constant to evaluate the effect of liquid ratio on
energy consumption. The result of this analysis has been presented for different nodes through
tables Table 4-16, Table 4-17 and Table 4-18. These nodes are called as Tee-LiQ2, Tee-LiQ9,
Tee-LiQ3+6 To 4+7 in the flowsheet.
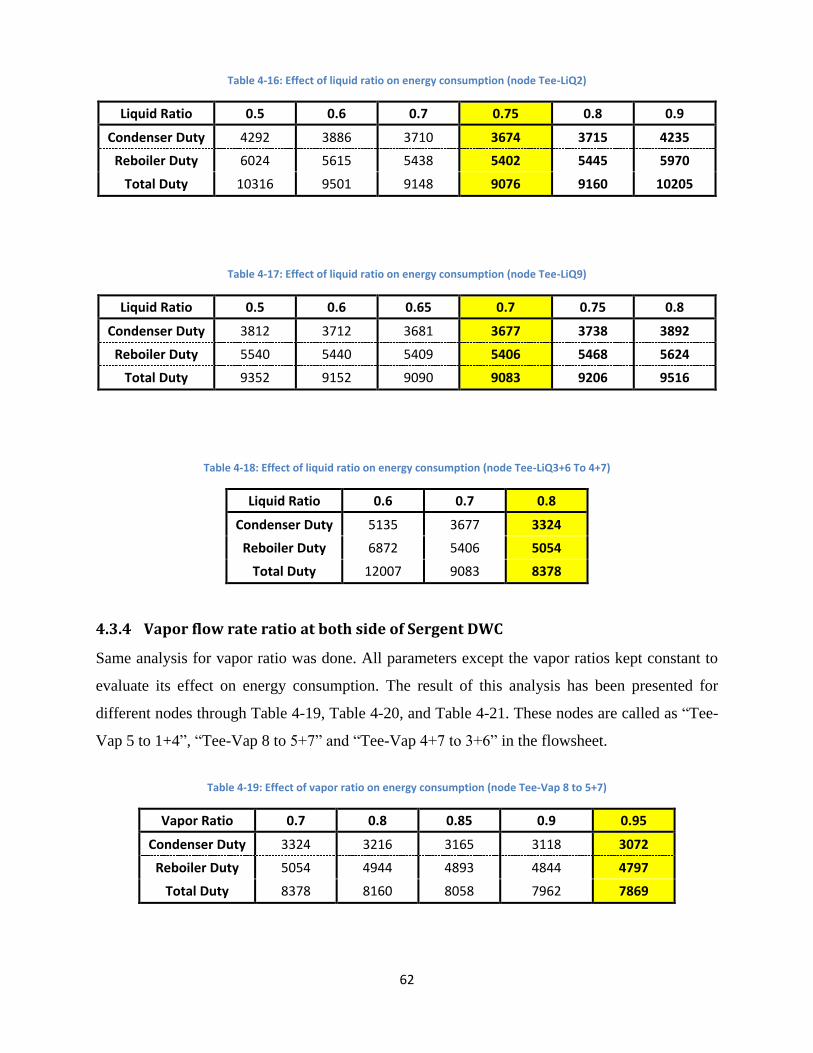
62
Table 4-16: Effect of liquid ratio on energy consumption (node Tee-LiQ2)
Liquid Ratio 0.5 0.6 0.7 0.75 0.8 0.9
Condenser Duty 4292 3886 3710 3674 3715 4235
Reboiler Duty 6024 5615 5438 5402 5445 5970
Total Duty 10316 9501 9148 9076 9160 10205
Table 4-17: Effect of liquid ratio on energy consumption (node Tee-LiQ9)
Liquid Ratio 0.5 0.6 0.65 0.7 0.75 0.8
Condenser Duty 3812 3712 3681 3677 3738 3892
Reboiler Duty 5540 5440 5409 5406 5468 5624
Total Duty 9352 9152 9090 9083 9206 9516
Table 4-18: Effect of liquid ratio on energy consumption (node Tee-LiQ3+6 To 4+7)
Liquid Ratio 0.6 0.7 0.8
Condenser Duty 5135 3677 3324
Reboiler Duty 6872 5406 5054
Total Duty 12007 9083 8378
4.3.4 Vapor flow rate ratio at both side of Sergent DWC
Same analysis for vapor ratio was done. All parameters except the vapor ratios kept constant to
evaluate its effect on energy consumption. The result of this analysis has been presented for
different nodes through Table 4-19, Table 4-20, and Table 4-21. These nodes are called as “Tee-
Vap 5 to 1+4”, “Tee-Vap 8 to 5+7” and “Tee-Vap 4+7 to 3+6” in the flowsheet.
Table 4-19: Effect of vapor ratio on energy consumption (node Tee-Vap 8 to 5+7)
Vapor Ratio 0.7 0.8 0.85 0.9 0.95
Condenser Duty 3324 3216 3165 3118 3072
Reboiler Duty 5054 4944 4893 4844 4797
Total Duty 8378 8160 8058 7962 7869

63
Table 4-20: Effect of vapor ratio on energy consumption (node Tee-Vap 5 to 1+4)
Vapor Ratio 0.45 0.47 0.5
Condenser Duty 3072 3088 3171
Reboiler Duty 4797 4812 4891
Total Duty 7869 7900 8062
Table 4-21: Effect of vapor ratio on energy consumption (node Tee-Vap 4+7 to 3+6)
Vapor Ratio 0.1 0.2
Condenser Duty 3073 3072
Reboiler Duty 4799 4797
Total Duty 7872 7869
4.3.5 Final Result For Multi-partitioned (Sergent) DWC Model
By considering all the above optimization which is taken with respect to energy consumption,
the following results shown in for this case are obtained.
Table 4-22: Final summary results for multi-component DWC
Stream Name C1+C2 C3 LPG
Molar flow 305.3 150 315.7
Mole fraction 1 0.89 0.973
Component molar flow 305.3 133.5 307.17
Total Condenser dyty 3072
Total Reboiler duty 4797
Total Duty (KW) 7869
The results in Table 4-22 shows the energy consumption of the multi-partitioned DWC uses less
energy. The Total energy consumption in base case is 12559 KW while it goes down to 7869 in
this kind of DWC design. The usage of this new arrangement shows clearly a 37.3 % energy
saving which is even a better performance compared to Kaibel column. This result is in
conformance with the literature predictions addressed in section 3.2.2 confirming the better
thermally coupling of Sergent DWC with respect to Kaibel. The Hysys produced reports for this
simulation case are presented through Appendices 7.17.87.9.

64
5 Conclusion and Fyrther Study
The defined tasks in the project description have been tracked to achieve the desired results.
Literatures have been reviewed in order to present methods and theories about LNG production.
The methods of fractionation of natural gas feed for extracting of NGL have been discussed too.
More in detail divided wall column (DWC) distillation configurations and governing equations
have been described.
As described in sections 4.2 and 4.3Figure 4-2 two types of DWC configuration model, Kaibel
and multi-partitioned, are simulated by HYSYS process modelling software for LPG extraction
in a typical LNG production plant. The simulation addresses and evaluates the energy
consumption of the unit with alternative technology usage. The improvement potentials and
energy savings have been presented by optimizing HYSYS models and the results obtained for
DWC cases are compared to base case which is the conventional fractionation distillation
sequence.
The benefit in terms of energy consumption with equal conditions in LPG extraction process
depends on the total duty of distillation’s condenser and reboiler. With equal conditions and LPG
product specifications, the utilization of the Kaibel and multi-partitioned DWC distillation
reduced the energy consumption by 31.4 % and 37.3 %, respectively. The results obtained by
this study confirm in a well manner the energy savings which was predicted by the study
proposal and literatures.
There are potentials works which need further academic and industrial works. The economic
viability of employing this technology in practical industrial applications is dependent both on
the capital and operational costs. The main focus of this study is to evaluate the operational
savings due to changing the technology while the mechanical and constructability of such a
design should also be reviewed very carefully to consider its capital costs. Then, a plant operator
has enough decision making tools at hand to evaluate the life cycle cost of the technology to be
used. So, CFD analysis of the mechanical design for DWC could be a potential work to go ahead
more. In addition more mathematical and rigorous models could be applied to reinsure the
validity of the results obtained in this study. Furthermore as discussed in section 2.1.4, the
offshore application of DWCs for processing facilities and specially FLNG vessels could be
evaluated.

65
6 References:
1. Masoumi, M. and S. Kadkhodaie, Optimization of Energy Consumption in Sequential
Distillation Column.
2. Schultz, M.A., et al., Reduce costs with dividing-wall columns. Chemical engineering
progress, 2002. 98(5): p. 64-71.
3. GPSA, GPSA Engineeing Databook, 2004.
4. Jostein Pettersen, Even Solbraaa, and O. Boland, Natural Gas Technology TEP 4185
Compendium2012: NTNU Department of Process and Energy Engineering.
5. Micheal D. Tusiani, G.S., LNG A Non-Technical Guide2007: PennWell Corporation.
6. Lee, S., N.V.D. Long, and M. Lee, Design and optimization of natural gas liquefaction
and recovery processes for offshore floating liquefied natural gas plants. Industrial &
Engineering Chemistry Research, 2012. 51(30): p. 10021-10030.
7. Eldemerdash, U., Technology Review of Natural Gas Liquefaction Processes. Journal of
Applied Sciences, 2011.
8. Pettersen, J., Natural gas liquifaction- TEP08 Gas processing and LNG lecture notes.
2012.
9. Coyle, D., F. Felix, and C. Durr. Natural gas specification challenges in the LNG
industry. in 15th International Conference and Exhibition on Liquefied Natural Gas,
Barcelona, Spain. 2007.
10. Arthur J. Kidnay and W. Parrish, Fundamentals of natural gas processing2006: CRC
Press.
11. Spilsbury, C., et al., Evolution of Liquefaction Technology for today’s LNG business, 7
Journess Scientifiques et Techniques, November 2006. Oran, Algeria.
12. Elliot, D., et al. Benefits of integrating NGL extraction and LNG liquefaction technology.
in 2005 AIChE Spring National Meeting, Conference Proceedings, 2005 AIChE Spring
National Meeting, Conference Proceedings. 2005.
13. KUMAR, R.P., Retrofitting industrial, conventional column systems to petyluk/divided
wall columns. 2008.
14. Yildirim, Ö., A.A. Kiss, and E.Y. Kenig, Dividing wall columns in chemical process
industry: A review on current activities. Separation and Purification Technology, 2011.
80(3): p. 403-417.
15. Kaibel, B., et al., Unfixed dividing wall technology for packed and tray distillation
columns. Distillation Absorption, 2006. 152: p. 252e66.
16. Towler, G.P. and R.K. Sinnott, Chemical Engineering Design: Principles, Practice, and
Economics of Plant and Process Design2013: Elsevier.

66
17. Kiss, A.A., Advanced Distillation Technologies: Design, Control and Applications2013,
New York: Wiley. 1 online resource (415 s.).
18. Wilson, I.D., Encyclopedia of separation science2000: Academic Press.
19. Halvorsen, I.J., Minimum energy requirements in complex distillation arrangements,
2001, Norwegian University of Science and Technology.
20. Dejanović, I., L. Matijašević, and Ž. Olujić, Dividing wall column—a breakthrough
towards sustainable distilling. Chemical Engineering and Processing: Process
Intensification, 2010. 49(6): p. 559-580.
21. Mokhatab, S. and W.A. Poe, Handbook of natural gas transmission and processing2012:
Gulf Professional Pub.
22. Khouri, F.M., Multistage Separation Process2005: CRC Press.
23. Khanmohammadi, A. and K. Mohammadbeigy, STUDYING OF THE EFFECTIVENESS
PARAMETERS FOR CONDENSATE STABILIZATION. Petroleum & Coal, 2007. 49(1):
p. 67-71.

67
7 Appendices
This section includes the report of the simulation models addressing material and energy
balances and column profiles. The following reports are presented:
Main Workbook Profile Report for NGL Fractionation Model (Base case)
DC1 column Profile Report for NGL Fractionation Model (Base case)
DC2 column Profile Report for NGL Fractionation Model (Base case)
DC3 column Profile Report for NGL Fractionation Model (Base case)
Main Workbook Profile Report for Kaibel DWC Model
DC1 Column Profile Report for Kaibel DWC Model
DWC Column Profile Report for Kaibel DWC Model

68
Main Workbook Profile Report for NGL Fractionation Model (Base case) 7.1

69

70

71

72

73

74
DC1 column Profile Report for NGL Fractionation Model (Base case) 7.2

75

76
DC2 column Profile Report for NGL Fractionation Model (Base case) 7.3

77
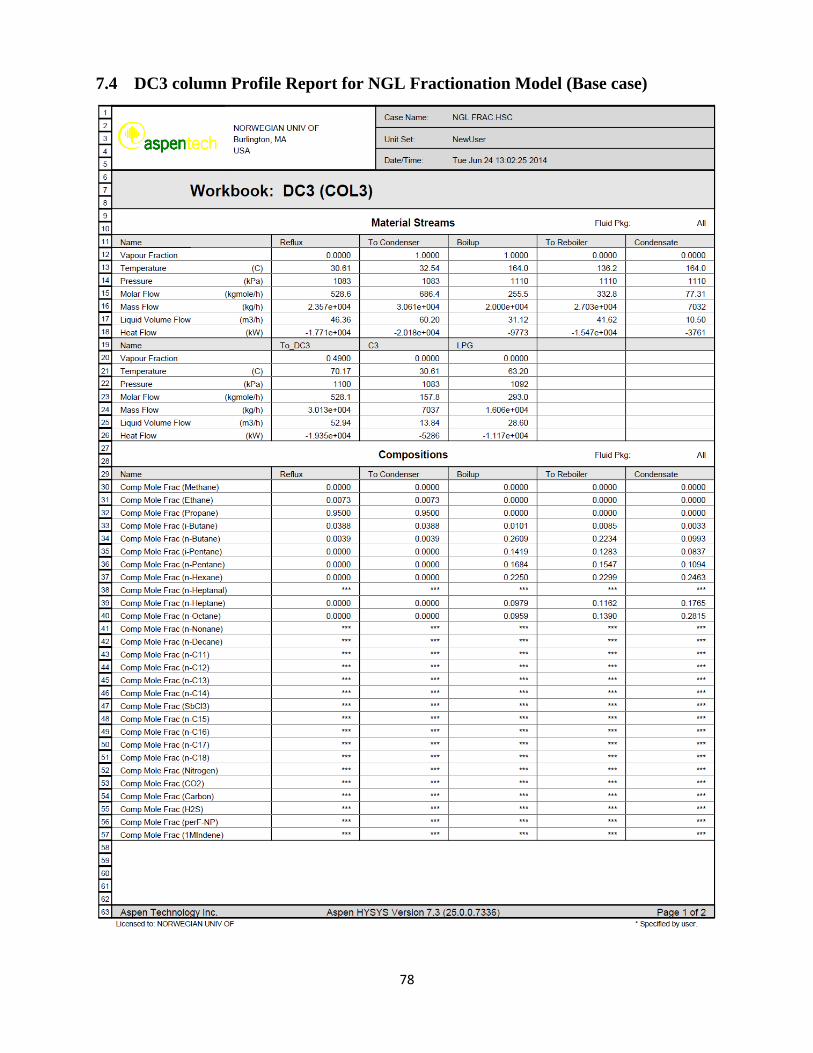
78
DC3 column Profile Report for NGL Fractionation Model (Base case) 7.4

79

80
Main Workbook Profile Report for Kaibel DWC Model 7.5
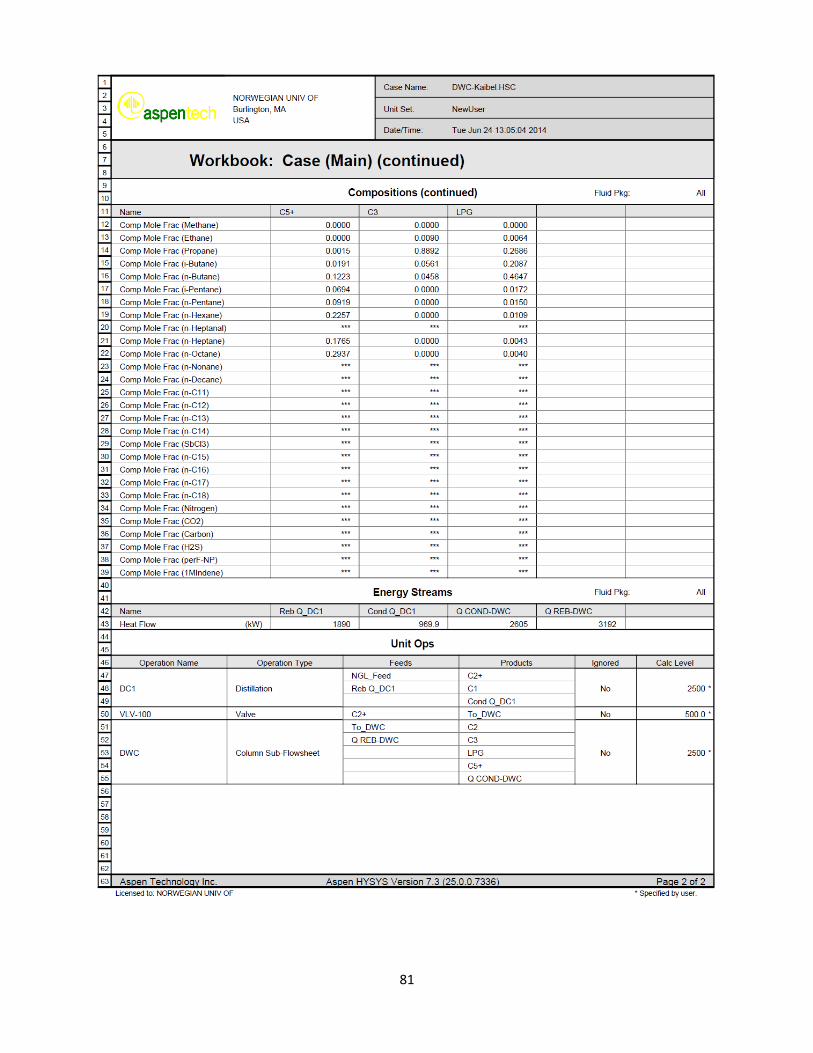
81
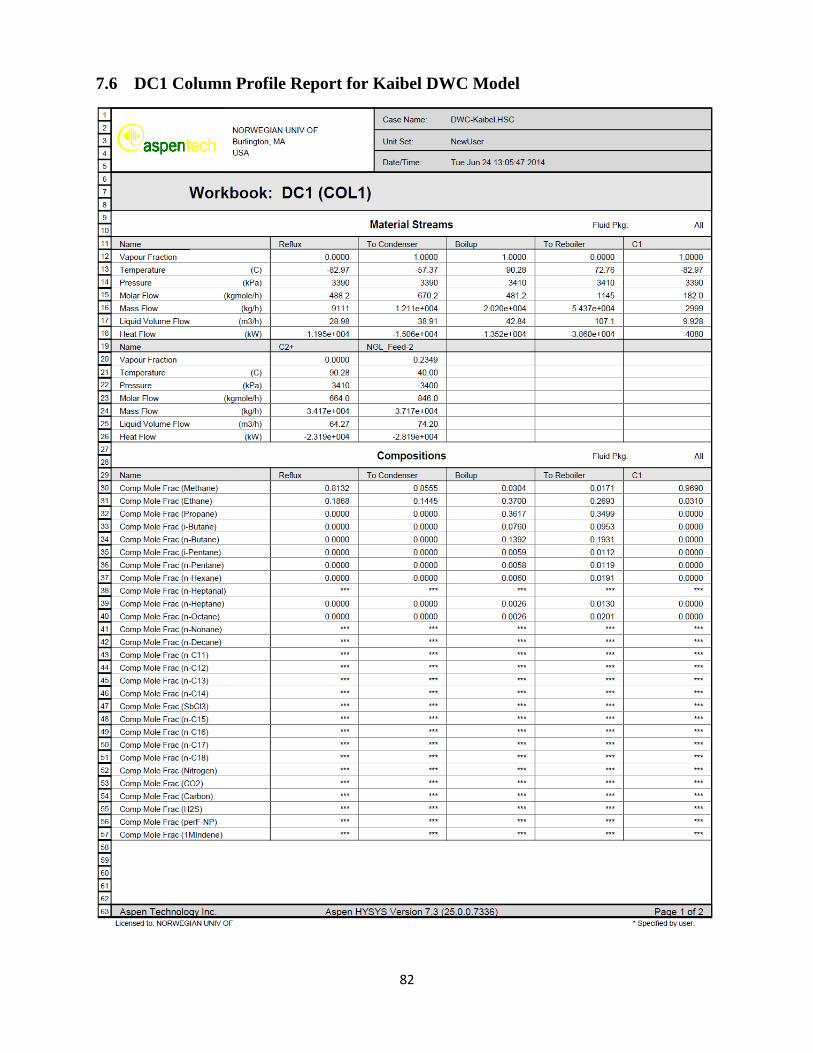
82
DC1 Column Profile Report for Kaibel DWC Model 7.6

83

84
DWC Column Profile Report for Kaibel DWC Model 7.7

85

86

87

88

89

90

91
Main Workbook Profile Report for Multi-Partitioned DWC Model 7.8

92
DWC Column Profile Report for Multi-Partitioned DWC Model 7.9

93

94

95

96

97

98

99

100

101

102

103

104