Using array-comparative genomic hybridization to define molecular portraits of primary breast...
12
ONCOGENOMICS Using array-comparative genomic hybridization to define molecular portraits of primary breast cancers S-F Chin 1 , Y Wang 1 , NP Thorne 1 , AE Teschendorff 1 , SE Pinder 1,2 , M Vias 1 , A Naderi 1 , I Roberts 3 , NL Barbosa-Morais 1,4 , MJ Garcia 1 , NG Iyer 1,6 , T Kranjac 1 , JFR Robertson 5 , S Aparicio 1,7 , S Tavare´ 1 , I Ellis 5 , JD Brenton 1 and C Caldas 1 1 Cancer Genomics Program, Department of Oncology, Hutchison/MRC Research Centre, University of Cambridge, Cambridge, UK; 2 Department of Histopathology, Addenbrookes Hospital, Cambridge, UK; 3 Cancer Cell Unit, Hutchison/MRC Research Centre, Cambridge, UK; 4 Institute of Molecular Medicine, Lisbon, Portugal; 5 Departments of Histopathology and Surgery, Breast Unit, Nottingham City Hospital NHS Trust and University of Nottingham, UK We analysed 148 primary breast cancers using BAC-arrays containing 287 clones representing cancer-related gene/loci to obtain genomic molecular portraits. Gains were detected in 136 tumors (91.9%) and losses in 123 tumors (83.1%). Eight tumors (5.4%) did not have any genomic aberrations in the 281 clones analysed. Common (more than 15% of the samples) gains were observed at 8q11–qtel, 1q21–qtel, 17q11–q12 and 11q13, whereas common losses were observed at 16q12–qtel, 11ptel–p15.5, 1p36–ptel, 17p11.2– p12 and 8ptel–p22. Patients with tumors registering either less than 5% (median value) or less than 11% (third quartile) total copy number changes had a better overall survival (log-rank test: P ¼ 0.0417 and P ¼ 0.0375, respec- tively). Unsupervised hierarchical clustering based on copy number changes identified four clusters. Women with tumors from the cluster with amplification of three regions containing known breast oncogenes (11q13, 17q12 and 20q13) had a worse prognosis. The good prognosis group (Nottingham Prognostic Index (NPI) p3.4) tumors had frequent loss of 16q24–qtel. Genes significantly associated with estrogen receptor (ER), Grade and NPI were used to build k-nearest neighbor (KNN) classifiers that predicted ER, Grade and NPI status in the test set with an average misclassification rate of 24.7, 25.7 and 35.7%, respectively. These data raise the prospect of generating a molecular taxonomy of breast cancer based on copy number profiling using tumor DNA, which may be more generally applicable than expression microarray analysis. Oncogene (2007) 26, 1959–1970. doi:10.1038/sj.onc.1209985; published online 25 September 2006 Keywords: breast cancer; array-CGH; amplification; deletion Introduction Breast cancer is the most common malignancy in women when skin cancers are excluded. Morphology and surgical staging are used to derive prognostic classifiers such as the Nottingham Prognostic Index (NPI), widely used in the UK and Europe (Elston and Ellis, 1991), but subject to limitations such as observer variability (Gilchrist et al., 1985). Large-scale expression analyses using either complementary DNA (cDNA) or oligonu- cleotide arrays have been utilized to obtain gene signatures and there is emerging evidence that this approach can be used to classify breast tumors into different prognostic groups. Expression signatures correlated with estrogen receptor (ER), and ERBB2 status have also been described (Perou et al., 2000; Sorlie et al., 2001; van‘t Veer et al., 2002). Arrays can also be used to measure DNA copy number alterations. Several studies using such arrays have now shown that DNA copy number changes correlate with gene expres- sion (Pollack et al., 2002; Heidenblad et al., 2005; Kim et al., 2005). Moreover, nonrandom physical clusters of genes with correlated expression in invasive ductal breast cancers have been described and some of these gene clusters coincide with loci found to be frequently altered at the copy number level in breast cancers (Reyal et al., 2005). This suggests the potential use of copy number profiling as an alternative to, or in combination with, expression analysis to subtype breast cancers. Cytogenetic methods, including conventional com- parative genomic hybridization (CGH), have revealed chromosomal regions that are frequently altered in breast tumors (Kallioniemi et al., 1994; Tirkkonen et al., 1998). Some of these regions contain known tumor suppressor genes (TSG), for example, TP53 and oncogenes, for example, ERBB2, but target genes for other regions have yet to be identified. Conventional CGH is limited by a 5–10 Mb resolution (Forozan et al., 1997), is time consuming and requires karyotyping expertise. Array-based CGH combines the resolution of fluorescent in situ hybridization (FISH) (i.e. gene level) with the whole genome screening capacity of conventional CGH, thereby allowing the analysis of Received 29 March 2006; revised 11 July 2006; accepted 25 July 2006; published online 25 September 2006 Correspondence: Professor C Caldas, Oncology, Hutchison/MRC Research Centre, University of Cambridge, Hills Road, Cambridge, Cambridgeshire CB2 2XZ, UK. E-mail: [email protected] 6 Current address: Singapore General Hospital, Outram Road, Singapore. 7 Current address: BC Cancer Research Center, 675 West 10th Avenue, Vancouver, BC, V5L 1L3. Oncogene (2007) 26, 1959–1970 & 2007 Nature Publishing Group All rights reserved 0950-9232/07 $30.00 www.nature.com/onc ONCOGENOMICS
-
Upload
independent -
Category
Documents
-
view
1 -
download
0
Transcript of Using array-comparative genomic hybridization to define molecular portraits of primary breast...

ONCOGENOMICS
Using array-comparative genomic hybridization to define molecular
portraits of primary breast cancers
S-F Chin1, Y Wang1, NP Thorne1, AE Teschendorff1, SE Pinder1,2, M Vias1, A Naderi1,I Roberts3, NL Barbosa-Morais1,4, MJ Garcia1, NG Iyer1,6, T Kranjac1, JFR Robertson5,S Aparicio1,7, S Tavare1, I Ellis5, JD Brenton1 and C Caldas1
1Cancer Genomics Program, Department of Oncology, Hutchison/MRC Research Centre, University of Cambridge, Cambridge, UK;2Department of Histopathology, Addenbrookes Hospital, Cambridge, UK; 3Cancer Cell Unit, Hutchison/MRC Research Centre,Cambridge, UK; 4Institute of Molecular Medicine, Lisbon, Portugal; 5Departments of Histopathology and Surgery, Breast Unit,Nottingham City Hospital NHS Trust and University of Nottingham, UK
We analysed 148 primary breast cancers using BAC-arrayscontaining 287 clones representing cancer-related gene/locito obtain genomic molecular portraits. Gains were detectedin 136 tumors (91.9%) and losses in 123 tumors (83.1%).Eight tumors (5.4%) did not have any genomic aberrationsin the 281 clones analysed. Common (more than 15% of thesamples) gains were observed at 8q11–qtel, 1q21–qtel,17q11–q12 and 11q13, whereas common losses wereobserved at 16q12–qtel, 11ptel–p15.5, 1p36–ptel, 17p11.2–p12 and 8ptel–p22. Patients with tumors registering eitherless than 5% (median value) or less than 11% (thirdquartile) total copy number changes had a better overallsurvival (log-rank test: P¼ 0.0417 and P¼ 0.0375, respec-tively). Unsupervised hierarchical clustering based on copynumber changes identified four clusters. Women withtumors from the cluster with amplification of three regionscontaining known breast oncogenes (11q13, 17q12 and20q13) had a worse prognosis. The good prognosis group(Nottingham Prognostic Index (NPI) p3.4) tumors hadfrequent loss of 16q24–qtel. Genes significantly associatedwith estrogen receptor (ER), Grade and NPI were used tobuild k-nearest neighbor (KNN) classifiers that predictedER, Grade and NPI status in the test set with an averagemisclassification rate of 24.7, 25.7 and 35.7%, respectively.These data raise the prospect of generating a moleculartaxonomy of breast cancer based on copy number profilingusing tumor DNA, which may be more generally applicablethan expression microarray analysis.Oncogene (2007) 26, 1959–1970. doi:10.1038/sj.onc.1209985;published online 25 September 2006
Keywords: breast cancer; array-CGH; amplification;deletion
Introduction
Breast cancer is the most common malignancy in womenwhen skin cancers are excluded. Morphology andsurgical staging are used to derive prognostic classifierssuch as the Nottingham Prognostic Index (NPI), widelyused in the UK and Europe (Elston and Ellis, 1991),but subject to limitations such as observer variability(Gilchrist et al., 1985). Large-scale expression analysesusing either complementary DNA (cDNA) or oligonu-cleotide arrays have been utilized to obtain genesignatures and there is emerging evidence that thisapproach can be used to classify breast tumors intodifferent prognostic groups. Expression signaturescorrelated with estrogen receptor (ER), and ERBB2status have also been described (Perou et al., 2000;Sorlie et al., 2001; van‘t Veer et al., 2002). Arrays canalso be used to measure DNA copy number alterations.Several studies using such arrays have now shown thatDNA copy number changes correlate with gene expres-sion (Pollack et al., 2002; Heidenblad et al., 2005; Kimet al., 2005). Moreover, nonrandom physical clusters ofgenes with correlated expression in invasive ductalbreast cancers have been described and some of thesegene clusters coincide with loci found to be frequentlyaltered at the copy number level in breast cancers (Reyalet al., 2005). This suggests the potential use of copynumber profiling as an alternative to, or in combinationwith, expression analysis to subtype breast cancers.
Cytogenetic methods, including conventional com-parative genomic hybridization (CGH), have revealedchromosomal regions that are frequently altered inbreast tumors (Kallioniemi et al., 1994; Tirkkonen et al.,1998). Some of these regions contain known tumorsuppressor genes (TSG), for example, TP53 andoncogenes, for example, ERBB2, but target genes forother regions have yet to be identified. ConventionalCGH is limited by a 5–10 Mb resolution (Forozan et al.,1997), is time consuming and requires karyotypingexpertise. Array-based CGH combines the resolutionof fluorescent in situ hybridization (FISH) (i.e. genelevel) with the whole genome screening capacity ofconventional CGH, thereby allowing the analysis of
Received 29 March 2006; revised 11 July 2006; accepted 25 July 2006;published online 25 September 2006
Correspondence: Professor C Caldas, Oncology, Hutchison/MRCResearch Centre, University of Cambridge, Hills Road, Cambridge,Cambridgeshire CB2 2XZ, UK.E-mail: [email protected] address: Singapore General Hospital, Outram Road,Singapore.7Current address: BC Cancer Research Center, 675 West 10th Avenue,Vancouver, BC, V5L 1L3.
Oncogene (2007) 26, 1959–1970& 2007 Nature Publishing Group All rights reserved 0950-9232/07 $30.00
www.nature.com/onc
ON
CO
GE
NO
MIC
S

DNA copy number alterations in clinical samples(Pinkel et al., 1998).
In this report, we used a commercially available arraycontaining 287 clones printed in triplicate to profile 148primary breast cancers from a cohort of patients witha median age of 58 years, 68% being postmenopausaland ER positive, and with median clinical follow up of11 years.
Results
Overview of genomic changes in breast tumorsWe found that 136 breast tumors (91.9%) had at leastone gain and 123 tumors (83.1%) had at least one loss.Only eight tumors (5.4%) did not have any copy numberaberrations. The median number of gains per tumorwas eight clones (range: 0–60, s.d.¼ 13.7) and themedian number of losses was six clones (range: 0–66,s.d.¼ 15.9).
An overall assessment of total copy number aberra-tions in each tumor was determined by calculating thepercentage of clones out of the 281 analysed withalterations. In this assessment, the tumors were classifiedinto three groups, designated low (o5% changes),intermediate (5–11% changes) and high (>11%changes; Supplementary Figure 1), where 5 and 11%are the median and third quartile of percentage of copynumber aberrations across tumors. The majority of thetumors (55.4%) belonged to the low group and 22.3%were classified into the high group. This contrasted withwhat we observed in cell lines where the medianpercentage of copy number changes was 24% and morethan 56% (27/48) had greater than 24% of changes(data not shown).
We used the Fisher’s exact test to compare themorphological phenotypes of the groups of tumorsbased on the number of copy number aberrations(Table 1). A correlation with histological grade wasfound when comparing the group with low copy numberchanges (o5%) vs all others (P¼ 0.028).
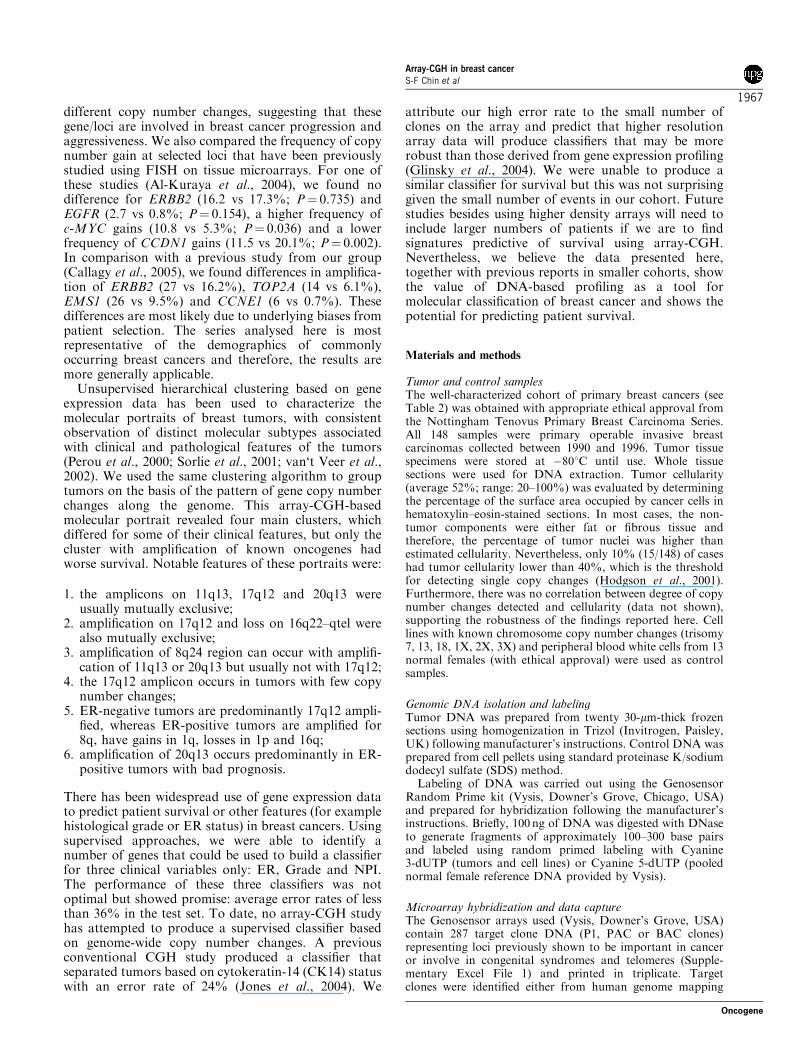
Kaplan–Meier survival analysis showed that theoverall survival of the patients in the high copy numberchange group was worse than that for the remainingcases (hazard ratio (HR)¼ 1.83 with 95% confidenceinterval (CI): 0.94–3.56; log rank P¼ 0.0375). Survivalof the combined group of high and intermediate changeswas also worse (HR¼ 1.95 with 95% CI: 1.01–3.73; logrank P¼ 0.047) (Figure 1; top row). Multivariateanalysis using a Cox proportional hazards model andstepwise regression was performed including the varia-bles grade, size, stage, ER status and copy numberaberrations (percentage). Copy number aberrations(percentage), treated both as a continuous and dichot-omous variable, was an independent predictor of overallsurvival, along with grade and stage (SupplementaryTable 1A). For dichotomized analysis, cutoffs at 5%(median) and at 11% (third quartile) gave significantP-values (P¼ 0.042 and P¼ 0.003, respectively) for copynumber aberrations in the multivariate Cox propor-tional hazards model. This result was not affected by
whether patients received adjuvant endocrine therapy(results not shown).
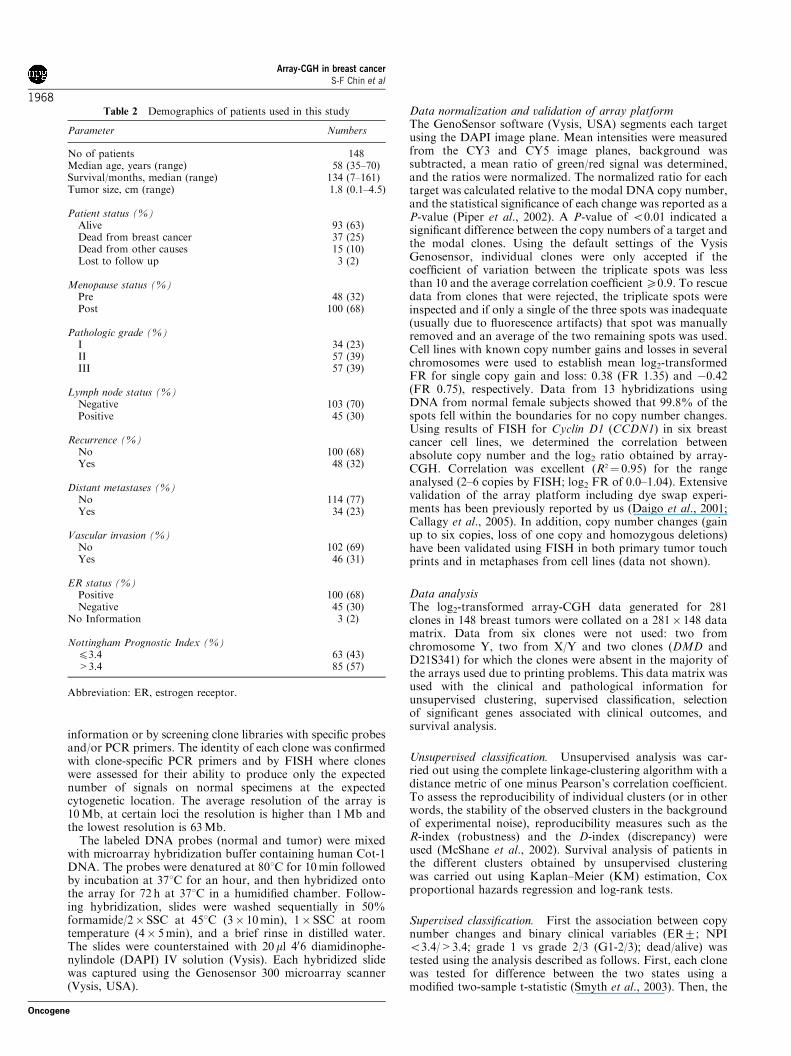
In total, 3876 copy number changes were detected:1866 (48%) gains and 2020 (52%) losses (Supplemen-tary Excel File 2). For each clone, we calculated thenumber of tumors for which there was gain or loss andsummarized it as a percentage of the 148 tumors studied(Figure 2a). To highlight the most frequently alteredregions, we set a threshold of 15% and this identifiedchromosomal loci with known oncogenes and TSG.This was not surprising as the array we used containsmostly genes that have been previously shown to bealtered in cancers. Chromosomal regions (more thanone clone showing gain/loss as highlighted in Figure 2b)that were most commonly gained were 8q11–qtel (sevenclones, range 11–33%), 1q21–qtel (seven clones, range7–36%), 17q11–q12 (four clones, range 11–18%) and11q13 (five clones, range 8–15%). The most commonlosses were found at 16q12–qtel (six clones, range7–35%), 11p15.5–ptel (three clones, range 16–19%),1p36–ptel (three clones, range 4–18%), 17p11.2–p12(four clones, range 9–19%) and 8p22–ptel (five clones,range 8–18%).
We identified novel aberrations at the telomeric endsof chromosome 1p and 1q, 5p, 11p and 16q. The clonesthat were most frequently deleted mapped to 16qtel(43.9%) (identified by marker stSG30213) and to16q24.3 (43.2%; containing FANCA). The clonesmost frequently gained were SHGC-18290 (31.8%)at 1qtel and EXT1 (31.8%) at 8q24. The only clonethat did not register any changes was PDGFRA,localized on 4q12.
Amplification (fluorescence ratios (FR)X1.6; log2 FRX0.67) of at least one of the known breast canceroncogenes was observed in 55 tumors: ERBB2 (24/148,
Table 1 Clinical information of the tumor groups segregated by totalgenomic changes
Clinical parameters Tumor subgroups P-value
o 5% >5% Fisher’s exact test
Samples 82 (55.4%) 66 (44.6%)
NPI scorep3.4 40 (48.8%) 23 (34.8%) 0.097>3.4 42 (51.2%) 43 (65.2%)
GradeI+II 57 (69.5%) 34 (51.5%) 0.028
III 25 (30.5%) 32 (48.5%)
Distant metastasisNo 66 (80%) 48 (72.7%) 0.33Yes 16 (20%) 18 (27.3%)
ERNegative 27 (33%) 18 (27.3%) 0.48Positive 53 (64.6%) 47 (71.2%)NI 2 (2.4%) 1 (1.5%)
Abbreviations: ER, estrogen receptor; NI, no information and casesexcluded from analysis; NPI, Nottingham Prognostic Index.
Array-CGH in breast cancerS-F Chin et al
1960
Oncogene

16.2%), CCDN1 (17/148, 11.5%), C-MYC (16/148,10.8%) and ZNF217 (10/148, 6.8%). These tumorstended to have poor prognostic features: grade 2/3 (52/55) and high NPI (46/55). Co-amplification of two ormore of these oncogenes was uncommon: 13 tumors(8.8%) showed co-amplification of two (most commonERBB2 and ZNF217 in four cases), two tumors (1.3%)showed co-amplification of three and no tumors hadsimultaneous amplification of all four. We also notedthat for all these genes, there were several cases withhigh level amplification (FR X3.0; log2 FR X1.58).
Other genes that registered high level amplifications(FR>3), similar to those observed with known breastcancer oncogenes, in at least one case were: EGFR(7p12), CDK4 (12q13), FGFR2 (10q26), HTR1B (6q13),DMBT1 (10q26), AKT1 (14q32), MYB (6q22), MDR1(7q21), GLI (12q13), YES1 (18p11), HRAS (11p15),TK1 (17q23.2-q25.3) and DCC (18q21.3). The precise
mapping and gene content of all the high levelamplifications, as well as other copy number changesdetected, is beyond the scope of this study given the lowdensity of the array used.
Comparison with a published array-CGH data setNessling et al. (2005) reported a study using an arraywith 422 clones to analyse 31 formalin-fixed, paraffin-embedded advanced breast cancers with lymph nodeinvolvement. We identified 50 loci that were similar inboth studies (clones were matched by gene content orgenomic location based on Genome Assembly NCBI35)and performed a t-test to check if the differences in theobserved percentage of gains/losses were statisticallydifferent. Of these clones, the difference observed in22 (44%) was not statistically significant. Significantdifferences were found in 28 (56%) clones, where 25showed gains and three showed losses.
all othersCluster 1
p value = 0.135
0
0.2
0.4
0.6
0.8
1.0
Pro
babili
ty o
f S
urv
ival
all othersCluster 3
p value = 0.0429
all othersCluster 2
p value = 0.983
all othersCluster 4
p value = 0.805
othersc-MYC gains/amplifications
p-value = 0.45
othersCCND1gains/amplifications
p-value = 0.112othersERBB2 gains/amplifications
p-value = 0.151othersZNF217 gains/amplifications
p-value = 0.00629
Kaplan-Meier Survival Curves: Oncogene Amplification
Kaplan-Meier Survival Curves: Clusters from Unsupervised Hierachical Clustering
Kaplan-Meier Survival Curves: Genomic Changes
0
0.2
0.4
0.6
0.8
1.0
Pro
babili
ty o
f S
urv
ival
50 100 1500
Months
50 100 1500
Months
50 100 1500Months
50 100 1500Months
50 100 1500
Months50 100 1500
Months50 100 1500
Months50 100 1500
Months
Months
Per
cent
Sur
viva
l
0
0.2
0.4
0.6
0.8
1.0
50 100 1500
< 11% genomic changes
> 11% genomic changes
p value = 0.0375
Survival of 148 breast cancer patients
50 100 1500Months
0
0.2
0.4
0.6
0.8
1.0
Survival of 148 breast cancer patients
< 5% genomic changes
> 5% genomic changes
p value = 0.0417
Perc
ent of S
urv
ival
Figure 1 Kaplan–Meier plots generated for different genomic parameters. Top panels: Overall survival of 148 breast tumors based onpercentage of genomic changes (left, tumors with less than 5% changes vs remainder and right, tumors with less than 11% changes vsremainder). Middle panels: overall survival analysis of 148 tumors based on the four clusters generated from unsupervised clustering(refer to Figure 3). Bottom panels: overall survival analysis of 148 tumors based on the gains/amplifications in 8q24, 11q13, 17q12 and20q13.
Array-CGH in breast cancerS-F Chin et al
1961
Oncogene

1QTEL10SHGC18290AKT3TGFB2PTGS2(COX2)LAMC2WI5663,WI1341
1Q21-1Q
TE
L
U11829SHGC31110PTK2MYCEXT1E2F5MOS
8Q24
PAK1GARPEMS1FGF4,FGF3CCND1 11Q
13
TOP2ATHRAERBB2(HER2)PPARBP(PBP) 17Q
12
TNFRSF6B(DCR3)
CYP24ZNF217(ZABC1)
STK6(STK15)
PTPN1CSE1L(CAS)
MYBL2NCOA3(AIB1) 20Q
13
log2ratio
> 1 0.68-1 0.35-0.68 -0.35-0.35 <-0.35
Common regions of gains observed in >15% of samples
stSG30213FANCALZ16CDH13FRA16DCDH1
16Q13-16Q
TE
L
1PTEL06CDC2L1(p58)PRKCZ
1PTE
L
CDKN1C(p57)HRASINS
11PTE
L
Common regions of losses observed in > 15% of samples
b
Per
cent
age
of g
enom
ic c
hang
es
a
-50%
-40%
-30%
-20%
-10%
0%
10%
20%
30%
40%
Chromosome1 2 3 4 5 6 7 8 9 10 11 12 1716151413 18 19 20 21 X22
17P11.2-P12
D17S125, D17S61D17S1296, D17S1523LLGL1FL1, TOP3A
D8S504D8S596
CTSBPDGRL
8PTE
L-P22
Array-CGH in breast cancerS-F Chin et al
1962
Oncogene

The clones that showed significant differences mayreveal genes/loci that are associated with progression,especially when more than one clone within the samechromosomal band was found to be statisticallydifferent, suggesting that this difference did not occurby chance alone. Using this criterion, the most strikingloci with higher frequency of gains in advanced tumorswere 12q12–q15 with five clones (WNT1, CDK2, GLI,CDK4 and MDM2), 8q24 with two clones (c-MYC andPTK2), 17q12 with two clones (PPARBP and ERBB2)and 20q13 with two clones (NCOA3 and MYBL2).There was only one locus, 11q22–23, with two clones(ATM and MLL) registering more losses in advancedtumors.
Unsupervised hierarchical clustering based on profilingof copy number changes reveals molecular portraits ofbreast cancerWe binned the copy number changes into discretelog2-transformed FR intervals to represent the genecopy number changes (binning criteria: >1¼ high levelamplifications; 0.68–1.0¼ amplifications; 0.35–0.68¼gains; �0.35 to 0.35¼ no changes; o�0.35¼ loss) asdiscrete events instead of as continuous, and used thesebinned log2 values to generate a ‘pseudo’-heat map inessence similar to the heat maps used in expressionstudies. The tumors were grouped using unsupervisedhierarchical clustering based on the similarity of thecopy number changes, whereas the 281 cloneswere ordered according to their cytogenetic location(Figure 3).
Four main clusters were identified, with reasonablereproducibility (robustness indices: 45% for cluster1, 73% for cluster 2, 71% for cluster 3 and 55% forcluster 4).
Cluster 1 (red) encompassed 57 tumors, of which 28cases belonged to the low copy number change group(28/57). The most common aberrations in tumorsbelonging to this cluster were: loss of at least one cloneon 16q (37/57) and gain of at least one clone on 1q (29/57). These tumors were mostly ER positive, grades1/2,in the low NPI group (p3.4) and most had no distantmetastases (76%). Within cluster 1, two smallersubclusters were defined: subcluster A (6/57), showing8p loss, 8q gains, 16p gains and 16q loss; and subclusterB (13/57) with a relatively larger number of changes.The overall survival of patients in both subclusters wasnot different from the rest (P¼ 0.745).
Cluster 2 (magenta) was the smallest in number (10)but these tumors had the highest number of clonesregistering gains/losses (median¼ 80.5). In addition,these tumors had quite distinct copy number changes:7p gain, 9p loss, 11p gain, 20p gain and Xp loss. Therewere also specific loci changes: loss of BMI1 (10p13),gains of GLI (12q13), D13S25 (13q14), AKT1 (14q32),
YES1 (18p11) and DCC (18q21). Surprisingly, given thenumber of chromosomal aberrations, these tumorstended to be of lower grade (1/2) and ER positive buthad mixed NPI.
Cluster 3 (green) includes 35 tumors, most withamplification in one of three chromosomal regionsknown to harbor breast cancer oncogenes: 11q13,17q12 and 20q13. The most interesting observationwithin cluster 3 was that tumors tended to be grouped insubclusters of mutually exclusive amplification at eachof the three loci: subcluster C (7/35), with amplificationof 11q13 (CCDN1, FGF4, EMS1, GARP and PAK1);subcluster D (7/35), with amplification of 20q12–qtel(NCOA3, MYBL2, CSE1L, PTPN1, STK6, ZNF217and CYP24) and subcluster E (21/35), with amplifica-tion of 17q12–21 (PPARBP, ERBB2, THRA andTOP2A). Survival analysis showed that patients incluster 3 have worst overall survival compared to allthe other patients (HR¼ 1.98 with 95% CI: 1.01–3.9;log-rank P¼ 0.0429; Figure 1; middle row). This pooroutcome was not surprising as most of these tumorswere of histological grade 3 (69%) and 34% of thepatients developed distant metastases during follow-up.To access the relationship between clinical variablessuch as grade, size, stage and ER status and cluster 3(with gains in 11q13, 17q12 and 20q13), a multivariateCox proportional hazards model (Supplementary Table1B) with stepwise regression and interaction termsbetween variables was used. Cluster 3 was found to bea predictor of overall survival (P¼ 0.02) together withgrade (P¼ 0.0001) and stage (P¼ 0.001), but there was asignificant interaction between membership in cluster 3and tumor grade (P¼ 0.02). Cluster 3 is, therefore, not atruly independent prognostic variable.
Most tumors with 17q12 amplification (subcluster D)did not appear to have many other major genomicalterations: 47% (18/38) had less than 5% of total copynumber changes. In this subcluster, tumors were mostlyER negative with poorer prognostic features (NPI>3.4and grade2/3) and there was a higher proportion ofpremenopausal women (41%). The survival of thesepatients tended to be shorter, but this was notstatistically significant (P¼ 0.151; Figure 1, bottomrow). Tumors with amplification of either 11q13 or20q12–q13 genes were grouped in two separate sub-clusters within cluster 3. Both subclusters containedtumors with more than 5% total copy number changes.Tumors in both subclusters appeared to have similarfeatures: there was a predominance of ER positive andhigh grade tumors, but only cases with 20q13 amplifica-tion had significantly shorter overall survival (HR¼ 2.85with 95% CI: 1.30–6.24; log rank P¼ 0.00629; Figure 1;bottom row). However, Cox regression multivariateanalysis showed that 20q13 amplification was not anindependent predictor of overall survival, when tumor
Figure 2 (a) Global view of copy number gain and loss in 148 breast tumors. The frequency of changes (gain ’ plotted above 0 andloss � plotted below 0) observed is represented as bars at each of the genomic positions of the BAC clones. A threshold line of 15% wasset to identify chromosomal regions with common changes. (b) Heat map of the clones within chromosomal regions registering changesin more than 15% of the samples.
Array-CGH in breast cancerS-F Chin et al
1963
Oncogene

grade, stage, size and ER status were also considered(Supplementary Table 1C).
In contrast to the other three oncogenes present incluster 3, tumors with gains in the fourth known breastcancer oncogenic locus, 8q24 (EXT, C-MYC andPTK2), do not belong to a single, discreet cluster butare present in all four main clusters. Gains in 8q24 donot occur as an isolated event and indeed, most of thesetumors (40/55; 73%) have more than 5% genomicchanges.
Cluster 4 (blue) contained 46 tumors. Commonalterations in this cluster were gains on 1q and losseson 1p, 11p, 16q, 17p and chromosome 22. There was norelationship with ER status, grade and NPI.
To analyse the relationship between gain/loss ofindividual clones in relation to the total number ofchanges in each tumor, we ranked the tumors accord-ing to their total genomic changes (SupplementaryFigure 1). The main findings in tumors with less than1% copy number changes were gain of 1q and loss of16q. This suggests these two alterations occur together
as an early event in tumor development, assuming acorrelation between progression and increase in geneticaberrations. Alternatively, these tumors are differentfrom more aggressive tumors and develop along adifferent genomic pathway. These tumors were mostlyER positive and were classified in the good NPI group.In tumors with total copy number changes between 1and 5%, amplification of 17q12 and gains in 8q24occurred in addition to changes on 1q (gains) and 16q(losses). In the remaining tumors with more than 5%copy number changes, 1p loss, 8p loss, 11p loss, 11q13gains and 20q13 gains were common. Interestingly,certain changes were only observed in tumors with>20% genomic changes: gains on 5p, 14qtel, 20p andchromosome X; and losses on 6p, 17p, chromosome 19,20qtel and chromosome 22.
Supervised classification using genes filtered bysignificance analysisAn important application of microarray technologyin cancer is class prediction where classifiers can be
Pat
ient
s
log2ratio
> 1 0.68-1 0.35-0.68 -0.35-0.35 <-0.35
1 2 3 4 5 6 7 8 9 10 11 12 1314 15 16 17 18 19 20 21 22 X ER
GR
AD
EN
PIChromosome
A B C D E
Figure 3 Unsupervised hierarchical clustering of 148 breast tumors. Each column represents a clone and each row a tumor. Adendrogram shows the clustering of tumors based on their genomic aberrations. An enlarged version of the dendrogram is depicted atthe bottom left with five groups (a–e) highlighted. On the right, the bars represent the clinical features of each tumor: ER negative &,ER positive ’, Grade 1þ 2 &, 3 ’, NPI low &, NPI high ’. The heat map represents the fluorescence ratios (test/reference) on alog2 scale as shown at the bottom bar (red, loss; green, gain; white, no change).
Array-CGH in breast cancerS-F Chin et al
1964
Oncogene

constructed that may reliably indicate subtype, inva-siveness potential, expected progression and the besttreatment strategy. To build our classifiers, we identifiedgenes that were most closely associated with clinicalphenotypes. Based on a modified two-sample t-test foreach gene, 10000 permutations of each clinical groupingof tumors were performed to test the significance of theobserved t-statistic. Only genes that have a falsediscovery rate (FDR) of less than 10% (q-valueo0.1)were selected. We found a minimum of 10 genes fulfilledthe criteria defined in the significance analysis for eachof three clinical variables. These were Grade (1þ 2 vs 3)with 61 genes (Figure 4), ER (positive vs negative) with36 genes and NPI (NPIp3.4 vs NPI>3.4) with 31 genes(data not shown). Only eight genes were common for thethree clinical variables and these were from only twochromosomal loci: 16q22–qtel (CDH1, CDH13, LZ16,FANCA and 16qtel013) and 17q12–21 (PPARBP,ERBB2 and THRA). Surprisingly, genes on the 11q13amplicon did not feature among those found to besignificantly different statistically.
Using the genes selected from the significance analysisand leave-one-out cross-validation on the trainingset, we built KNN classifiers for predicting ER,histological grade and NPI on test samples. The average
misclassification rates (over multiple runs) for ER,Grade and NPI on test samples were 24.7, 25.7 and35.7%, respectively, in comparison to 18.3, 21.2 and30.1% on the training set (through the leave-one-outcross-validation).
Discussion
In this study we used array-CGH to evaluate the copynumber changes in 148 well-characterized breast cancerswith a minimum of 5 years follow-up. We also examinedthe associations between genomic alterations andclinical phenotype of the tumors. Recently, severalarray CGH studies in breast cancer have been published(Naylor et al., 2005; Fridlyand et al., 2006; Stange et al.,2006), but our study is the largest breast cancer setstudied to date. The main limitation of our study wasthe lower genomic density of the arrays used ascompared to the other studies. Despite this limitation,we observed a similar pattern of genomic changesoccurring in at least 5% of our samples with thepreviously published conventional and array-CGHstudies (Kallioniemi et al., 1994; Tirkkonen et al.,1998; Roylance et al., 1999; Cingoz et al., 2003; Loo
Grade Genes
/Loc
i
Chrom
osom
e
EXT1 8q24MYC 8q24
PTK2 8q24-qterPTPN1 20q13
NCOA3(AIB1) 20q12
TPD52L2 20qtelTNFRSF6B 20q13
10QTEL006 10ptelSHGC-44253 10ptelGATA3 10p15PPARBP 17q12
THRA 17q11ERBB2 17q12
ARHGAP8 22q13
NF2 22q12
CDH13 16q2416QTEL013 16qtel
stSG30213 16qtelLZ16 16q24
CDH1 16q22FANCA 16q24
GABRB3 15q11D15S11 15q11D1S214 1p36
OCRL1 Xq26
DBCCR1 9q33
APC 5q21D17S125 17p12
DHFR,MSH3 5q11
MOS 8q11SHGC-31110 8qTel
ZNF217 20q13
STK6(STK15) 20q13CYP24 20q13
MYBL2 20q13CSE1L 20q13
EMP2 16p13
GSCL 22q11ARSA 22qtel
CSF1R 5q33
TERC 3q26EIF5A2 3q26
BMI1 10p13
RPS6KB1 17q23TK1 17q23
SHGC5557 12ptelD6S311 6q23stSG42796 19ptelD10S1260 10p13
PIK3CA 3q26
SHGC18290 1qtelXIST Xq13
D9S166 9p12
TSC1 9q34D4S2930 4qtel
NIB1408 5qtel
PDGRL 8p22CTSB 8p22D8S596 8ptelD8S504 8ptel
D10S249 10p15
log2ratio> 10.68-10.35-0.68-0.35-0.35<-0.35
31+2
Figure 4 Hierarchical clustering of tumors using the 61 genes from the grade k-nearest neighbor classifier. Fluorescence ratios aredepicted as in Figure 3.
Array-CGH in breast cancerS-F Chin et al
1965
Oncogene

et al., 2004; Naylor et al., 2005; Fridlyand et al., 2006;Stange et al., 2006). In addition, the low resolution ofthe platform did not hinder our ability to generateimportant novel observations about patterns of genomicalterations in human breast cancers. Studies that havelooked at a greater number of samples used Southernblotting (Chin et al., 2001; Maass et al., 2002) and FISH(Al-Kuraya et al., 2004) but analysed significantly fewergenes. It is perhaps more important that the patientcohort used in our study is more representative of theusual clinical presentation of breast cancer (mostly post-menopausal, ERþ , small size and lymph node negative)and was of a sufficient size to allow for meaningfulcorrelations with clinical and pathological characteris-tics. This sharply contrasts with the studies that usedhigher density arrays, which included small patientnumbers (Stange et al.) or very selected patient cohortswith clinically very aggressive tumors (for example inFridlyand et al., 30/55 patients died during follow-upand 34/55 were lymph node positive and in Naylor et al.,33/46 were large/lymph node positive and 42% Her2þ ),precluding the type of robust correlative analysis that wewere able to do.
Aneuploidy is a frequent event in breast cancers(Wenger et al., 1993) and reflects genomic instability. Inour cohort, we found about one-half of the cases hadless than 5% genomic changes and this group had betterclinical outcome. We also observed that the concurrentgain of 1q and loss of 16q occurred in tumors with arelatively stable genome, suggesting that this may bean early event. This would correlate with cytogeneti-cally described changes as translocation involvingboth chromosomes 1 and 16 and isochromosome 1q(Tsarouha et al., 1999). These tumors in our series hadgood prognostic features and were usually ER positive,as previously described (Rennstam et al., 2003; Looet al., 2004; Fridlyand et al., 2006).
In cases with higher number of genomic changes,gains in 8q24 and 17q12 were evident although theserarely occurred together. Other alterations such as losseson 1p and gains in known oncogenic regions were alsoobserved. There were changes that were only observedwhen the total genomic changes were >20%, suggestingthese are events, which only occur in an unstablegenome. These findings argue against a linear progres-sion of accumulation of genomic aberrations. Tumorswith different amounts and combinations of genomicaberrations probably originated from different cellpopulations (for example, luminal vs basal) andprogress by accumulation of distinct genomic events atdifferent rates of accumulation reflecting underlyinggenomic instability and clonal selection.
Gains of 1q, 8q and loss of 16q were the mostfrequent alterations occurring in more than 30%tumors. At 1q, the clone most frequently gained wasRP1-407H12, containing the marker SHGC-18290 andseveral olfactory receptor genes. On chromosome 8q,the clone most frequently gained was surprisingly notc-MYC but EXT1. The distance between both genes isapproximately 10 Mb, suggesting two separate ampli-cons. EIF3S3, located approximately 1Mb proximal to
EXT1 but not present on our arrays, has been suggestedto be the true target of these amplifications since it wasconsistently overexpressed in breast and prostate can-cers (Nupponen et al., 2000). There appear to be twoseparate regions of loss on 16q: one around CDH1(which encodes E-cadherin) on 16q22 and anotherspanning 16q24–tel. The clone on 16q24–qtel mostfrequently lost was RP11-133L7, which contains markerstSG30213, AFG3L1, MC1R, TUBB3, KIAA1049,SPIRE2 and the growth-arrest-specific protein 8(GAS8) gene. AFG3L1 is a human homolog of familygene 3-like 1, which encodes a mitochondrial ATP-dependent zinc metalloprotease and recently has beensuggested to be a target of estrogen (Wang et al., 2004).Variants of the melanocortin-1 receptor gene (MC1R)have been associated with melanoma risk and progres-sion (Landi et al., 2005). The GAS protein family isthought to be modulators of cell cycle progression andsurvival but no association with breast carcinogenesishas yet been established. Another clone on 16q that wasfrequently lost was RP11-368I7, which contains severalgenes namely FANCA, ZFP276, RPL13, CDK10, SPG7,DPEP1 and CPNE7. The role of the Fanconi anemia(FA) proteins in breast cancer has been activelyinvestigated in recent years. FA proteins, includingFANCA, are required in a DNA damage responsepathway and current data indicate that FA is a centralnode in a complex nuclear and cytoplasmic network oftumor suppressor and genome stability pathways(Bogliolo et al., 2002). Owing to the low resolution ofthe arrays used here, we recognize that the identity ofthe true targets of some of these copy number changes isyet to be firmly determined.
Besides gains and losses involving genes previouslyimplicated in breast cancer, we identified novel loci. Theshort arm of chromosome 5 showed gains at 5p15 andlosses at 5ptel. Gains on 5p12–14 have been observedbut no target genes have yet been identified (Tirkkonenet al., 1998; Korsching et al., 2004). Two clonescontaining markers D5S23 and D5S2064, the cytoge-netically identified critical region for the Cri-du-chatsyndrome, were frequently gained. We noticed frequentloss of a single clone of the telomeric end of chromo-some 5 containing marker C84C11/T3. The loss of 5ptelin breast cancer has not been reported previously. Wefound frequent gains of a single clone at 20p, CTC-334G22, which contains the JAG1 gene that functions asa ligand for multiple Notch receptors and is involved inthe mediation of Notch signaling. This may mediateestradiol-induced angiogenesis (Soares et al., 2004) andis frequently observed in epithelial-to-mesenchymaltransitions in advanced carcinogenesis (Zavadil et al.,2004). Other reports have identified low frequency gainsof 20p in breast cancer (James et al., 1997; Guntheret al., 2001). Again identifying the true target of theseevents will require the use of higher density arrays.
When our data were compared with a publiclyavailable array-CGH study of advanced breast cancers,which used custom arrays comprising 422 mappedgenomic sequences (Nessling et al., 2005), 56% of the50 clones that were ‘genomic overlaps’ had significantly
Array-CGH in breast cancerS-F Chin et al
1966
Oncogene
different copy number changes, suggesting that thesegene/loci are involved in breast cancer progression andaggressiveness. We also compared the frequency of copynumber gain at selected loci that have been previouslystudied using FISH on tissue microarrays. For one ofthese studies (Al-Kuraya et al., 2004), we found nodifference for ERBB2 (16.2 vs 17.3%; P¼ 0.735) andEGFR (2.7 vs 0.8%; P¼ 0.154), a higher frequency ofc-MYC gains (10.8 vs 5.3%; P¼ 0.036) and a lowerfrequency of CCDN1 gains (11.5 vs 20.1%; P¼ 0.002).In comparison with a previous study from our group(Callagy et al., 2005), we found differences in amplifica-tion of ERBB2 (27 vs 16.2%), TOP2A (14 vs 6.1%),EMS1 (26 vs 9.5%) and CCNE1 (6 vs 0.7%). Thesedifferences are most likely due to underlying biases frompatient selection. The series analysed here is mostrepresentative of the demographics of commonlyoccurring breast cancers and therefore, the results aremore generally applicable.
Unsupervised hierarchical clustering based on geneexpression data has been used to characterize themolecular portraits of breast tumors, with consistentobservation of distinct molecular subtypes associatedwith clinical and pathological features of the tumors(Perou et al., 2000; Sorlie et al., 2001; van‘t Veer et al.,2002). We used the same clustering algorithm to grouptumors on the basis of the pattern of gene copy numberchanges along the genome. This array-CGH-basedmolecular portrait revealed four main clusters, whichdiffered for some of their clinical features, but only thecluster with amplification of known oncogenes hadworse survival. Notable features of these portraits were:
1. the amplicons on 11q13, 17q12 and 20q13 wereusually mutually exclusive;
2. amplification on 17q12 and loss on 16q22–qtel werealso mutually exclusive;
3. amplification of 8q24 region can occur with amplifi-cation of 11q13 or 20q13 but usually not with 17q12;
4. the 17q12 amplicon occurs in tumors with few copynumber changes;
5. ER-negative tumors are predominantly 17q12 ampli-fied, whereas ER-positive tumors are amplified for8q, have gains in 1q, losses in 1p and 16q;
6. amplification of 20q13 occurs predominantly in ER-positive tumors with bad prognosis.
There has been widespread use of gene expression datato predict patient survival or other features (for examplehistological grade or ER status) in breast cancers. Usingsupervised approaches, we were able to identify anumber of genes that could be used to build a classifierfor three clinical variables only: ER, Grade and NPI.The performance of these three classifiers was notoptimal but showed promise: average error rates of lessthan 36% in the test set. To date, no array-CGH studyhas attempted to produce a supervised classifier basedon genome-wide copy number changes. A previousconventional CGH study produced a classifier thatseparated tumors based on cytokeratin-14 (CK14) statuswith an error rate of 24% (Jones et al., 2004). We
attribute our high error rate to the small number ofclones on the array and predict that higher resolutionarray data will produce classifiers that may be morerobust than those derived from gene expression profiling(Glinsky et al., 2004). We were unable to produce asimilar classifier for survival but this was not surprisinggiven the small number of events in our cohort. Futurestudies besides using higher density arrays will need toinclude larger numbers of patients if we are to findsignatures predictive of survival using array-CGH.Nevertheless, we believe the data presented here,together with previous reports in smaller cohorts, showthe value of DNA-based profiling as a tool formolecular classification of breast cancer and shows thepotential for predicting patient survival.
Materials and methods
Tumor and control samplesThe well-characterized cohort of primary breast cancers (seeTable 2) was obtained with appropriate ethical approval fromthe Nottingham Tenovus Primary Breast Carcinoma Series.All 148 samples were primary operable invasive breastcarcinomas collected between 1990 and 1996. Tumor tissuespecimens were stored at �801C until use. Whole tissuesections were used for DNA extraction. Tumor cellularity(average 52%; range: 20–100%) was evaluated by determiningthe percentage of the surface area occupied by cancer cells inhematoxylin–eosin-stained sections. In most cases, the non-tumor components were either fat or fibrous tissue andtherefore, the percentage of tumor nuclei was higher thanestimated cellularity. Nevertheless, only 10% (15/148) of caseshad tumor cellularity lower than 40%, which is the thresholdfor detecting single copy changes (Hodgson et al., 2001).Furthermore, there was no correlation between degree of copynumber changes detected and cellularity (data not shown),supporting the robustness of the findings reported here. Celllines with known chromosome copy number changes (trisomy7, 13, 18, 1X, 2X, 3X) and peripheral blood white cells from 13normal females (with ethical approval) were used as controlsamples.
Genomic DNA isolation and labelingTumor DNA was prepared from twenty 30-mm-thick frozensections using homogenization in Trizol (Invitrogen, Paisley,UK) following manufacturer’s instructions. Control DNA wasprepared from cell pellets using standard proteinase K/sodiumdodecyl sulfate (SDS) method.
Labeling of DNA was carried out using the GenosensorRandom Prime kit (Vysis, Downer’s Grove, Chicago, USA)and prepared for hybridization following the manufacturer’sinstructions. Briefly, 100 ng of DNA was digested with DNaseto generate fragments of approximately 100–300 base pairsand labeled using random primed labeling with Cyanine3-dUTP (tumors and cell lines) or Cyanine 5-dUTP (poolednormal female reference DNA provided by Vysis).
Microarray hybridization and data captureThe Genosensor arrays used (Vysis, Downer’s Grove, USA)contain 287 target clone DNA (P1, PAC or BAC clones)representing loci previously shown to be important in canceror involve in congenital syndromes and telomeres (Supple-mentary Excel File 1) and printed in triplicate. Targetclones were identified either from human genome mapping
Array-CGH in breast cancerS-F Chin et al
1967
Oncogene
information or by screening clone libraries with specific probesand/or PCR primers. The identity of each clone was confirmedwith clone-specific PCR primers and by FISH where cloneswere assessed for their ability to produce only the expectednumber of signals on normal specimens at the expectedcytogenetic location. The average resolution of the array is10 Mb, at certain loci the resolution is higher than 1 Mb andthe lowest resolution is 63 Mb.
The labeled DNA probes (normal and tumor) were mixedwith microarray hybridization buffer containing human Cot-1DNA. The probes were denatured at 801C for 10 min followedby incubation at 371C for an hour, and then hybridized ontothe array for 72 h at 371C in a humidified chamber. Follow-ing hybridization, slides were washed sequentially in 50%formamide/2� SSC at 451C (3� 10min), 1� SSC at roomtemperature (4� 5min), and a brief rinse in distilled water.The slides were counterstained with 20ml 406 diamidinophe-nylindole (DAPI) IV solution (Vysis). Each hybridized slidewas captured using the Genosensor 300 microarray scanner(Vysis, USA).
Data normalization and validation of array platformThe GenoSensor software (Vysis, USA) segments each targetusing the DAPI image plane. Mean intensities were measuredfrom the CY3 and CY5 image planes, background wassubtracted, a mean ratio of green/red signal was determined,and the ratios were normalized. The normalized ratio for eachtarget was calculated relative to the modal DNA copy number,and the statistical significance of each change was reported as aP-value (Piper et al., 2002). A P-value of o0.01 indicated asignificant difference between the copy numbers of a target andthe modal clones. Using the default settings of the VysisGenosensor, individual clones were only accepted if thecoefficient of variation between the triplicate spots was lessthan 10 and the average correlation coefficient X0.9. To rescuedata from clones that were rejected, the triplicate spots wereinspected and if only a single of the three spots was inadequate(usually due to fluorescence artifacts) that spot was manuallyremoved and an average of the two remaining spots was used.Cell lines with known copy number gains and losses in severalchromosomes were used to establish mean log2-transformedFR for single copy gain and loss: 0.38 (FR 1.35) and �0.42(FR 0.75), respectively. Data from 13 hybridizations usingDNA from normal female subjects showed that 99.8% of thespots fell within the boundaries for no copy number changes.Using results of FISH for Cyclin D1 (CCDN1) in six breastcancer cell lines, we determined the correlation betweenabsolute copy number and the log2 ratio obtained by array-CGH. Correlation was excellent (R2¼ 0.95) for the rangeanalysed (2–6 copies by FISH; log2 FR of 0.0–1.04). Extensivevalidation of the array platform including dye swap experi-ments has been previously reported by us (Daigo et al., 2001;Callagy et al., 2005). In addition, copy number changes (gainup to six copies, loss of one copy and homozygous deletions)have been validated using FISH in both primary tumor touchprints and in metaphases from cell lines (data not shown).
Data analysisThe log2-transformed array-CGH data generated for 281clones in 148 breast tumors were collated on a 281� 148 datamatrix. Data from six clones were not used: two fromchromosome Y, two from X/Y and two clones (DMD andD21S341) for which the clones were absent in the majority ofthe arrays used due to printing problems. This data matrix wasused with the clinical and pathological information forunsupervised clustering, supervised classification, selectionof significant genes associated with clinical outcomes, andsurvival analysis.
Unsupervised classification. Unsupervised analysis was car-ried out using the complete linkage-clustering algorithm with adistance metric of one minus Pearson’s correlation coefficient.To assess the reproducibility of individual clusters (or in otherwords, the stability of the observed clusters in the backgroundof experimental noise), reproducibility measures such as theR-index (robustness) and the D-index (discrepancy) wereused (McShane et al., 2002). Survival analysis of patients inthe different clusters obtained by unsupervised clusteringwas carried out using Kaplan–Meier (KM) estimation, Coxproportional hazards regression and log-rank tests.
Supervised classification. First the association between copynumber changes and binary clinical variables (ER7; NPIo3.4/>3.4; grade 1 vs grade 2/3 (G1-2/3); dead/alive) wastested using the analysis described as follows. First, each clonewas tested for difference between the two states using amodified two-sample t-statistic (Smyth et al., 2003). Then, the
Table 2 Demographics of patients used in this study
Parameter Numbers
No of patients 148Median age, years (range) 58 (35–70)Survival/months, median (range) 134 (7–161)Tumor size, cm (range) 1.8 (0.1–4.5)
Patient status (%)Alive 93 (63)Dead from breast cancer 37 (25)Dead from other causes 15 (10)Lost to follow up 3 (2)
Menopause status (%)Pre 48 (32)Post 100 (68)
Pathologic grade (%)I 34 (23)II 57 (39)III 57 (39)
Lymph node status (%)Negative 103 (70)Positive 45 (30)
Recurrence (%)No 100 (68)Yes 48 (32)
Distant metastases (%)No 114 (77)Yes 34 (23)
Vascular invasion (%)No 102 (69)Yes 46 (31)
ER status (%)Positive 100 (68)Negative 45 (30)
No Information 3 (2)
Nottingham Prognostic Index (%)p3.4 63 (43)>3.4 85 (57)
Abbreviation: ER, estrogen receptor.
Array-CGH in breast cancerS-F Chin et al
1968
Oncogene

observed t-statistic was tested for significance against the nullhypothesis of no difference between the two statuses using apermutation method (10 ,000 random permutations were done)to assign a P-value to the observed t-statistics. The P-valueswere then transformed into q-values based on Storey andTibshirani, 2003 (2003). A q-value cutoff of 0.1 (equivalent to afalse discovery rate (FDR) of 10%) was used to select genessignificantly associated with clinical variables. The q-value is ameasure of significance in terms of FDR rather than the FPR(false positive rate).
The k nearest neighbor (KNN) classifier was implementedusing the genes selected as a result of the significance analysis.The148 breast tumors were randomly divided into a trainingset which included 80% of the tumors (118 samples), and a testset with 20% of the tumors (30 samples). The optimal number(k) of nearest neighbors used in the classifier was determined insuch a way that for a given value of k, we calculated theprediction error rate by the leave-one-out cross-validation onthe training set. The optimal k, which gives the lowestprediction error rate, was chosen. It ranged from 1 to 6 in
our case. The optimal number of genes used to build KNNclassifier was determined likewise by the above procedure,which ranges from 30 to 60 in our study. The KNN classifierswere then used to predict clinical variables such as ER, Gradeand NPI on the test set.
Abbreviations
NPI, Nottingham Prognostic Index; ER, estrogen receptor;HR, hazard ratio.
Acknowledgements
We thank Vysis for providing all the reagents and TeresaRuffalo for technical help. The work was funded by CancerResearch UK. NLB-M was supported by Fundacao para aCiencia e a Tecnologia, Portugal (Fellowship SFRH/BD/2914/2000).
References
Al-Kuraya K, Schraml P, Torhorst J, Tapia C, Zaharieva B,Novotny H et al. (2004). Prognostic relevance of geneamplifications and coamplifications in breast cancer. CancerRes 64: 8534–8540.
Bogliolo M, Cabre O, Callen E, Castillo V, Creus A, Marcos Ret al. (2002). The Fanconi anaemia genome stability andtumour suppressor network. Mutagenesis 17: 529–538.
Callagy G, Pharoah P, Chin SF, Sangan T, Daigo Y,Jackson L et al. (2005). Identification and validation ofprognostic markers in breast cancer with the complementaryuse of array-CGH and tissue microarrays. J Pathol 205:388–396.
Chin SF, Wang Q, Puisieux A, Caldas C. (2001). Absence ofrearrangements in the BRCA2 gene in human cancers. Br JCancer 84: 193–195.
Cingoz S, Altungoz O, Canda T, Saydam S, Aksakoglu G,Sakizli M. (2003). DNA copy number changes detected bycomparative genomic hybridization and their associationwith clinicopathologic parameters in breast tumors. CancerGenet Cytogenet 145: 108–114.
Daigo Y, Chin SF, Gorringe KL, Bobrow LG, Ponder BA,Pharoah PD et al. (2001). Degenerate oligonucleotideprimed-polymerase chain reaction-based array comparativegenomic hybridization for extensive amplicon profiling ofbreast cancers: a new approach for the molecular analysisof paraffin-embedded cancer tissue. Am J Pathol 158:1623–1631.
Elston CW, Ellis IO. (1991). Pathological prognostic factors inbreast cancer. I. The value of histological grade in breastcancer: experience from a large study with long-term follow-up. Histopathology 19: 403–410.
Forozan F, Karhu R, Kononen J, Kallioniemi A,Kallioniemi OP. (1997). Genome screening by comparativegenomic hybridization. Trends Genet 13: 405–409.
Fridlyand J, Snijders AM, Ylstra B, Li H, Olshen A, Segraves Ret al. (2006). Breast tumor copy number aberration phe-notypes and genomic instability. BMC Cancer. 6: 96.
Gilchrist KW, Kalish L, Gould VE, Hirschl S, Imbriglia JE,Levy WM et al. (1985). Interobserver reproducibility ofhistopathological features in stage II breast cancer. AnECOG study. Breast Cancer Res Treat 5: 3–10.
Glinsky GV, Higashiyama T, Glinskii AB. (2004). Classifica-tion of human breast cancer using gene expression profiling
as a component of the survival predictor algorithm. ClinCancer Res 10: 2272–2283.
Gunther K, Merkelbach-Bruse S, Amo-Takyi BK, Handt S,Schroder W, Tietze L. (2001). Differences in geneticalterations between primary lobular and ductal breastcancers detected by comparative genomic hybridization.J Pathol 193: 40–47.
Heidenblad M, Lindgren D, Veltman JA, Jonson T,Mahlamaki EH, Gorunova L et al. (2005). Microarrayanalyses reveal strong influence of DNA copy numberalterations on the transcriptional patterns in pancreaticcancer: implications for the interpretation of genomicamplifications. Oncogene 24: 1794–1801.
Hodgson G, Hager JH, Volik S, Hariono S, Wernick M,Moore D et al. (2001). Genome scanning with array CGHdelineates regional alterations in mouse islet carcinomas.Nat Genet 29: 459–464.
James LA, Mitchell EL, Menasce L, Varley JM. (1997).Comparative genomic hybridisation of ductal carcinomain situ of the breast: identification of regions of DNAamplification and deletion in common with invasive breastcarcinoma. Oncogene 14: 1059–1065.
Jones C, Ford E, Gillett C, Ryder K, Merrett S, Reis-Filho JSet al. (2004). Molecular cytogenetic identification of sub-groups of grade III invasive ductal breast carcinomas withdifferent clinical outcomes. Clin Cancer Res 10: 5988–5997.
Kallioniemi A, Kallioniemi OP, Piper J, Tanner M, Stokke T,Chen L et al. (1994). Detection and mapping of amplifiedDNA sequences in breast cancer by comparative genomichybridization. Proc Natl Acad Sci USA 91: 2156–2160.
Kim YH, Girard L, Giacomini CP, Wang P, Hernandez-Boussard T, Tibshirani R et al. (2005). Combined micro-array analysis of small cell lung cancer reveals alteredapoptotic balance and distinct expression signatures ofMYC family gene amplification. Oncogene 25: 130–138.
Korsching E, Packeisen J, Helms MW, Kersting C, Voss R,van Diest PJ et al. (2004). Deciphering a subgroup of breastcarcinomas with putative progression of grade duringcarcinogenesis revealed by comparative genomic hybridisa-tion (CGH) and immunohistochemistry. Br J Cancer 90:1422–1428.
Landi MT, Kanetsky PA, Tsang S, Gold B, Munroe D,Rebbeck T et al. (2005). MC1R, ASIP, and DNA repair in
Array-CGH in breast cancerS-F Chin et al
1969
Oncogene

sporadic and familial melanoma in a Mediterraneanpopulation. J Natl Cancer Inst 97: 998–1007.
Loo LW, Grove DI, Williams EM, Neal CL, Cousens LA,Schubert EL et al. (2004). Array comparative genomichybridization analysis of genomic alterations in breastcancer subtypes. Cancer Res 64: 8541–8549.
Maass N, Rosel F, Schem C, Hitomi J, Jonat W, Nagasaki K.(2002). Amplification of the BCAS2 gene at chromosome1p13.3–21 in human primary breast cancer. Cancer Lett 185:219–223.
McShane LM, Radmacher MD, Freidlin B, Yu R, Li MC,Simon R. (2002). Methods for assessing reproducibility ofclustering patterns observed in analyses of microarray data.Bioinformatics 18: 1462–1469.
Naylor TL, Greshock J, Wang Y, Colligon T, Yu QC,Clemmer V et al. (2005). High resolution genomic analysis ofsporadic breast cancer using array-based comparativegenomic hybridization. Breast Cancer Res 7: R1186–R1198.
Nessling M, Richter K, Schwaenen C, Roerig P, Wrobel G,Wessendorf S et al. (2005). Candidate genes in breast cancerrevealed by microarray-based comparative genomic hybri-dization of archived tissue. Cancer Res 65: 439–447.
Nupponen NN, Isola J, Visakorpi T. (2000). Mapping theamplification of EIF3S3 in breast and prostate cancer. GenesChromosomes Cancer 28: 203–210.
Perou CM, Sorlie T, Eisen MB, van de Rijn M, Jeffrey SS,Rees CA et al. (2000). Molecular portraits of human breasttumours. Nature 406: 747–752.
Pinkel D, Segraves R, Sudar D, Clark S, Poole I, Kowbel Det al. (1998). High resolution analysis of DNA copy numbervariation using comparative genomic hybridization tomicroarrays. Nat Genet 20: 207–211.
Piper J, Stegenga S, Pestova E, Marble H, Lucas M, Wilber Ket al. (2002). An objective method for detecting copy numberchange in CGH microarray experiments. Proceedings of theThird Euroconference on Quantitative Molecular Cytoge-netics. Rosenon, Stockholm, Sweden 4–6 July 2002; Rosenon,Stockholm, Sweden, pp 109–114.
Pollack JR, Sorlie T, Perou CM, Rees CA, Jeffrey SS,Lonning PE et al. (2002). Microarray analysis reveals amajor direct role of DNA copy number alteration in thetranscriptional program of human breast tumors. Proc NatlAcad Sci USA 99: 12963–12968.
Rennstam K, Ahlstedt-Soini M, Baldetorp B, Bendahl PO,Borg A, Karhu R et al. (2003). Patterns of chromosomalimbalances defines subgroups of breast cancer with distinctclinical features and prognosis. A study of 305 tumorsby comparative genomic hybridization. Cancer Res 63:8861–8868.
Reyal F, Stransky N, Bernard-Pierrot I, Vincent-Salomon A,de Rycke Y, Elvin P et al. (2005). Visualizing chromo-somes as transcriptome correlation maps: evidence of
chromosomal domains containing co-expressed genes – astudy of 130 invasive ductal breast carcinomas. Cancer Res65: 1376–1383.
Roylance R, Gorman P, Harris W, Liebmann R, Barnes D,Hanby A et al. (1999). Comparative genomic hybridizationof breast tumors stratified by histological grade reveals newinsights into the biological progression of breast cancer.Cancer Res 59: 1433–1436.
Smyth GK, Yang YH, Speed T. (2003). Statistical issues incDNA microarray data analysis. Methods Mol Biol 224:111–136.
Soares R, Balogh G, Guo S, Gartner F, Russo J, Schmitt F.(2004). Evidence for the notch signaling pathway on therole of estrogen in angiogenesis. Mol Endocrinol 18:2333–2343.
Sorlie T, Perou CM, Tibshirani R, Aas T, Geisler S, Johnsen Het al. (2001). Gene expression patterns of breast carcinomasdistinguish tumor subclasses with clinical implications. ProcNatl Acad Sci USA 98: 10869–10874.
Stange DE, Radlwimmer B, Schubert F, Traub F, Pich A,Toedt G et al. (2006). High-resolution genomic profilingreveals association of chromosomal aberrations on 1q and16p with histologic and genetic subgroups of invasive breastcancer. Clin Cancer Res. 12: 345–352.
Storey JD, Tibshirani R. (2003). Statistical significancefor genomewide studies. Proc Natl Acad Sci USA 100:9440–9445.
Tirkkonen M, Tanner M, Karhu R, Kallioniemi A,Isola J, Kallioniemi OP. (1998). Molecular cytogenetics ofprimary breast cancer by CGH. Genes Chromosomes Cancer21: 177–184.
Tsarouha H, Pandis N, Bardi G, Teixeira MR, Andersen JA,Heim S. (1999). Karyotypic evolution in breast carcinomaswith i(1)(q10) and der(1;16)(q10;p10) as the primarychromosome abnormality. Cancer Genet Cytogenet 113:156–161.
van‘t Veer LJ, Dai H, van de Vijver MJ, He YD, Hart AA,Mao M et al. (2002). Gene expression profiling predictsclinical outcome of breast cancer. Nature 415: 530–536.
Wang DY, Fulthorpe R, Liss SN, Edwards EA. (2004).Identification of estrogen-responsive genes by complemen-tary deoxyribonucleic acid microarray and characteriza-tion of a novel early estrogen-induced gene: EEIG1. MolEndocrinol 18: 402–411.
Wenger CR, Beardslee S, Owens MA, Pounds G, Oldaker T,Vendely P et al. (1993). DNA ploidy, S-phase, and steroidreceptors in more than 127,000 breast cancer patients. BreastCancer Res Treat 28: 9–20.
Zavadil J, Cermak L, Soto-Nieves N, Bottinger EP. (2004).Integration of TGF-beta/Smad and Jagged1/Notch signal-ling in epithelial-to-mesenchymal transition. EMBO J 23:1155–1165.
Supplementary Information accompanies the paper on the Oncogene website (http://www.nature.com/onc).
Array-CGH in breast cancerS-F Chin et al
1970
Oncogene