Molecular Portraits of Cancer Evolution and Ecology
269
Molecular Portraits of Cancer Evolution and Ecology Dhruva Biswas University College London and The Francis Crick Institute PhD Supervisor: Charles Swanton A thesis submitted for the degree of Doctor of Philosophy University College London August 2020
-
Upload
khangminh22 -
Category
Documents
-
view
0 -
download
0
Transcript of Molecular Portraits of Cancer Evolution and Ecology

Molecular Portraits of Cancer Evolution and Ecology
Dhruva Biswas
University College London
and
The Francis Crick Institute
PhD Supervisor: Charles Swanton
A thesis submitted for the degree of
Doctor of Philosophy
University College London August 2020

2
Declaration
I Dhruva Biswas confirm that the work presented in this thesis is my own. Where
information has been derived from other sources, I confirm that this has been
indicated in the thesis.

3
Abstract
Research on the molecular lesions that drive cancers holds the translational
promise of unmasking distinct disease subtypes in otherwise pathologically
identical patients. Yet clinical adoption is hindered by the reproducibility crisis for
cancer biomarkers.
In this thesis, a novel metric uncovered transcriptional diversity within
individual non-small cell lung cancers, driven by chromosomal instability. Existing
prognostic biomarkers were confounded by tumour sampling bias, arising from this
diversity, in ~50% of patients assessed.
An atlas of consistently expressed genes was derived to address this diagnostic
challenge, yielding a clonal biomarker robust to sampling bias. This diagnostic
based on cancer evolutionary principles maintained prognostic value in a meta-
analysis of >900 patients, and over known risk factors in stage I disease, motivating
further development as a clinical assay.
Next, in situ RNA profiles of immune, fibroblast and endothelial cell subsets
were generated from cancerous and adjacent non-malignant lung tissue. The
phenotypic adaptation of stromal cells in the tumour microenvironment undermined
the performance of existing molecular signatures for cell-type enumeration.
Transcriptome-wide analysis delineated ~10% of genes displaying cell-type-specific
expression, paving the way for high-fidelity signatures for the accurate digital
dissection of tumour ecology.
Lastly, the impact of branching, Darwinian evolution on the detection of epistatic
interactions was evaluated in a pan-cancer analysis. The clonal status of driver
genes was associated with the proportion of significant epistatic findings in 44-78%
of the cancer-types assessed. Integrating the clonal architecture of tumours in
future analyses could help decipher evolutionary dependencies.
This work provides pragmatic solutions for refining molecular portraits of
cancer in the light of their evolutionary and ecological features, moving the needle
for precision cancer diagnostics.

4
Impact Statement
Lung cancer is the leading cause of global cancer mortality. Surgical resection
alone in non-small cell lung cancer is considered curative for the majority of
patients with stage I disease. However, around a third of stage I cancers return
after surgery. A genomic test to distinguish between high- and low-risk lung
tumours could help identify patients that might receive benefit from adjuvant
therapy. This has proved difficult, in part because cancer is an evolving disease,
with a patchwork of different cells making up each individual tumour. With existing
tests, sampling two sites of the same tumour could yield two completely different
results depending on where the biopsy needle is placed. In this thesis, a novel
genomic test was developed to solve this problem. Combining an understanding of
cancer evolution with machine learning approaches, the test identified high-risk
stage I patients that were missed using known risk factors, warranting further
development as a clinical assay.
The licensing of immunotherapy drugs for lung cancer patients has given
rise to another diagnostic challenge, as durable responses are only seen in ~20%
of patients with advanced lung cancer. A molecular measure of immune infiltration
within tumours could predict patient responses. Yet existing biomarkers fall short of
clinical-grade accuracy. In this work, detailed molecular profiles of immune cells
were generated from lung cancer patients. These profiles varied between
cancerous and adjacent non-malignant lung tissue, which impacted the
performance of some existing immune infiltration metrics. Moreover, discriminating
molecular signals unique to each individual cell-type could be identified, paving the
way for robust ecological biomarkers.
Computational approaches can illuminate core evolutionary dependencies
between alterations in cancers. However, these methods may be biased to focus
on ancestral events, occurring early in the life history of a tumour. This thesis
confirmed that existing methods tended to overlook branching signals of on-going
evolution. Addressing this bias could help define evolutionary bottlenecks that
might be therapeutically targetable.
Overall, the results of this thesis demonstrate how an understanding of the
evolutionary and ecological behaviours of lung tumours can be taken to the clinic.

5
Acknowledgements
I am enormously grateful to my primary supervisor, Prof Charlie Swanton, for
funding, supporting, and mentoring my studies. Thank you Charlie for giving me the
opportunity to train as a scientist within the fantastic environment of the Cancer
Evolution & Genome Instability lab and the wider TRACERx consortium. I am also
indebted to Prof Javier Herrero and the team at the Bill Lyons Informatics Centre
for patiently dispensing bioinformatics knowledge over the past four years.
During my PhD I have had the good fortune to collaborate fruitfully with a number
of scientists across London and around the globe. In particular, I am deeply
appreciative of Dr Nicolai J Birkbak, Dr Nicholas L McGranahan, Dr Rachel
Rosenthal, Dr Yin Wu, and Dr Mihaela Angelova for sharing their valuable time and
expertise so generously. I am grateful to them and also Aśka Przewrocka and
Lewis Au for help proofreading this thesis.
It has been my privilege to work between two world-class scientific laboratories, the
UCL Cancer Institute and the Francis Crick Institute, an operation smoothly
managed by Sharon Vanloo. Moreover, as a proud student of the UCL MBPhD
programme, I am thankful for guidance from Prof Áine Burns, Carolyn Cohen, Prof
Raymond MacAllister and Susan Beesley. I also owe a great deal to scientific
mentors from my undergraduate medical studies, especially to the late, great Prof
Roger Carpenter.
As in all things, I am grateful to my family for their patience, counselling, and fierce
support. Instilling the value of education through example early in my life, and
continuing to prescribe aphorisms as required:
उ"यमेन (ह *स,यि.त काया23ण न मनोरथैः ।
न (ह सु<त=य *सहं=य ?@वशि.त मुखे मगृाः ।।

6
Table of Contents
Abstract 3 Impact Statement ............................................................................................... 4 Acknowledgements ........................................................................................... 5 Table of Contents ............................................................................................... 6 Table of figures ................................................................................................ 10 List of tables... .................................................................................................. 13 Abbreviations ................................................................................................... 14 Chapter 1.Introduction .................................................................................... 17
1.1 Introduction ............................................................................................ 17 1.2 Molecular portraits of cancer ................................................................ 18
1.2.1 Tumour stage is an imperfect predictor of survival risk ...................... 18 1.2.2 A brief history of molecular oncology ................................................. 21 1.2.3 The cancer biomarker problem .......................................................... 25
1.3 Darwinian evolution in cancer .............................................................. 32 1.3.1 Intra-tumour heterogeneity as a substrate for evolution ..................... 32 1.3.2 Clonal diversity as a prognostic biomarker ........................................ 35 1.3.3 Mechanisms of cancer genome evolution .......................................... 36 1.3.4 Evolutionary constraints ..................................................................... 37
1.4 Tumour sampling bias of molecular biomarkers ................................ 40 1.4.1 Tumour sampling bias confounds molecular diagnostics ................... 40 1.4.2 Emerging tissue-based solutions ....................................................... 43
1.5 Cancer ecology ....................................................................................... 47 1.5.1 Immune contexture as a diagnostic scheme ...................................... 48 1.5.2 Environment-mediated drug resistance ............................................. 52 1.5.3 Immunoediting .................................................................................... 53
1.6 Outline of the thesis ............................................................................... 55 1.6.1 Summary of background information ................................................. 55 1.6.2 Thesis aims ........................................................................................ 57
Chapter 2.Data & Methods .............................................................................. 58 2.1 Introduction ............................................................................................ 58 2.2 Data .......................................................................................................... 58
2.2.1 TRACERx multi-region NSCLC cohort ............................................... 58 2.2.2 TCGA ................................................................................................. 61 2.2.3 Uppsala II NSCLC cohort ................................................................... 62 2.2.4 Microarray NSCLC cohorts ................................................................ 62 2.2.5 MET500 .............................................................................................. 63 2.2.6 Pan-cancer prognostic score datasets ............................................... 63 2.2.7 Single-cell RNA-Seq datasets ............................................................ 64
2.3 Bioinformatics analyses ........................................................................ 64 2.3.1 Statistical analysis .............................................................................. 64 2.3.2 Gene expression analysis .................................................................. 65 2.3.3 Mutual exclusivity analysis ................................................................. 66
2.4 Experimental methods ........................................................................... 67 2.4.1 Ex vivo purification of lung stromal cell-types .................................... 67

7
2.4.2 Stromal cell isolation .......................................................................... 67 2.4.3 Cell sorting and RNA extraction ......................................................... 68 2.4.4 RNA-Sequencing ............................................................................... 69
Chapter 3.RNA intra-tumour heterogeneity: mechanisms and clinical impact .......................................................................................... 70
3.1 Introduction ............................................................................................ 70 3.2 A measure of RNA intra-tumour heterogeneity ................................... 72
3.2.1 Multi-region RNA-Sequencing ............................................................ 72 3.2.2 Defining RNA-ITH .............................................................................. 74 3.2.3 Dependence on multi-region sampling, clinicopathological and
immune correlates .............................................................................. 78 3.3 RNA heterogeneity reflects chromosomal instability ......................... 84
3.3.1 Genetic correlates of RNA-ITH .......................................................... 84 3.3.2 Linking chromosomal instability, gene dosage, and prognosis .......... 86
3.4 Tumour sampling bias confounds molecular biomarkers ................. 88 3.4.1 Literature search for LUAD prognostic signatures ............................. 88 3.4.2 Quantifying the sampling bias of RNA-Seq-based prognostic
signatures ........................................................................................... 89 3.4.3 Quantifying sampling bias of prognostic signatures invariant of RNA
profiling technology ............................................................................ 93 3.5 Conclusions ............................................................................................ 97
3.5.1 Summary of findings .......................................................................... 97 3.5.2 Future work ........................................................................................ 99
Chapter 4.Designing molecular biomarkers in the light of cancer evolution ................................................................................................... 100
4.1 Introduction .......................................................................................... 100 4.2 The status quo for molecular prognostication in lung cancer ........ 101
4.2.1 The curse of dimensionality for RNA biomarkers ............................. 101 4.2.2 Factors limiting the clinical adoption of prognostic signatures in lung
cancer .............................................................................................. 103 4.3 Defining clonal transcriptomic signals in lung cancer ..................... 105
4.3.1 Global analysis of RNA heterogeneity ............................................. 105 4.3.2 Defining RNA heterogeneity quadrants ............................................ 107 4.3.3 An RNA heterogeneity quadrant driven by clonal chromosomal gains
early in tumour evolution .................................................................. 110 4.4 Characterizing the biological and prognostic properties of clonal
transcriptomic signals in lung cancer ................................................ 112 4.4.1 Homogeneously expressed genes are enriched for cell proliferation
pathways .......................................................................................... 112 4.4.2 Individual homogeneously expressed genes are enriched for robust
survival associations ........................................................................ 114 4.4.3 The selection of clonal genes in biomarker design improves
performance ..................................................................................... 118 4.4.4 Random signatures built from homogeneously expressed genes
harbour cross-cohort prognostic significance ................................... 122 4.5 A biomarker based on cancer evolutionary principles associates
with lung cancer mortality ................................................................... 124

8
4.5.1 Development of a clonal, prognostic, expression biomarker ............ 124 4.5.2 Validation as a clinically informative biomarker ................................ 128 4.5.3 Benchmark performance against published signatures ................... 134 4.5.4 Biological underpinning .................................................................... 135 4.5.5 Tumour sampling bias ...................................................................... 139
4.6 Prognostic relevance of homogeneously expressed genes across cancer types ......................................................................................... 141
4.6.1 Pan-cancer analysis ......................................................................... 141 4.7 Conclusions .......................................................................................... 144
4.7.1 Summary of findings ........................................................................ 144 4.7.2 Future work ...................................................................................... 146
Chapter 5.In silico dissection of the tumour microenvironment ............... 147 5.1 Introduction .......................................................................................... 147 5.2 RNA deconvolution of the tumour microenvironment ..................... 148
5.2.1 Anatomy of an RNA-based TME enumeration tool .......................... 148 5.2.2 Limitations of existing tools .............................................................. 151 5.2.3 Cell-type reference profiles .............................................................. 152 5.2.4 Enumeration methods ...................................................................... 153
5.3 RNA profiling of stromal cells from lung cancer patients ................ 155 5.3.1 Ex vivo purification of 15 TME cell subsets ...................................... 155 5.3.2 Genome-wide RNA profiling of isolated cell-types ........................... 158 5.3.3 Global expression profiles reflect cell-type of origin ......................... 160
5.4 Tissue-specific signals of stromal cells in the lung tumour microenvironment ................................................................................ 162
5.4.1 Global tissue differences .................................................................. 162 5.4.2 Tissue differences specific to individual T-cell subsets .................... 164 5.4.3 Tissue context may influence the expression of canonical cell-type
markers ............................................................................................ 166 5.5 Cell-type-specific expression profiles for lung stroma .................... 169
5.5.1 Genome-wide similarity analysis of cell-type expression profiles .... 169 5.5.2 Derivation of marker genes specific to individual stromal cell-types 170
5.6 Conclusions .......................................................................................... 173 5.6.1 Summary of findings ........................................................................ 173 5.6.2 Future work ...................................................................................... 175
Chapter 6.Evolutionary dependencies ......................................................... 177 6.1 Introduction .......................................................................................... 177 6.2 Deciphering epistatic interactions in cancer genomes .................... 178
6.2.1 Combinatorial patterns of mutations in cancer ................................. 178 6.2.2 Computational tools for the systematic identification of epistatic
interactions in cancer NGS datasets ................................................ 179 6.2.3 Hypothesis: mutation clonality may be an unaddressed confounding
factor for ME detection ..................................................................... 182 6.3 The clonal status of driver genes associates with the proportion of
significant findings in mutual exclusivity analyses .......................... 185 6.3.1 Classifying mutation clonality and mutual exclusivity in driver genes
185

9
6.3.2 The tendency of a gene to be clonally mutated correlates with the proportion of significant findings in mutual exclusivity analyses ...... 188
6.3.3 The effect of recurrent mutation and associated power to detect mutual exclusivity ............................................................................. 191
6.4 Conclusions .......................................................................................... 193 6.4.1 Summary of findings ........................................................................ 193 6.4.2 Future work ...................................................................................... 194
Chapter 7.Discussion .................................................................................... 196 7.1 Novel findings in this thesis ................................................................ 196 7.2 Alternative approaches and future directions ................................... 198
7.2.1 Is single-cell resolution required? ..................................................... 198 7.2.2 Overcoming the curse of dimensionality for RNA biomarkers .......... 199 7.2.3 Reaching the limits of precision oncology: individualised and
hierarchical risk prediction ................................................................ 200 7.2.4 Multi-omic classifiers ........................................................................ 201 7.2.5 Pan-cancer applicability ................................................................... 202 7.2.6 Charting lethal, metastatic trajectories ............................................. 203 7.2.7 Moving from diagnostics to therapeutics .......................................... 203
7.3 Conclusion ............................................................................................ 204 Chapter 8.Appendix ....................................................................................... 205
8.1 Peer-reviewed publications authored during the PhD ...................... 205 8.1.1 First author publications ................................................................... 205 8.1.2 Co-author publications ..................................................................... 206 8.1.3 Consortium author publications ........................................................ 207
Reference List ................................................................................................ 209

10
Table of figures
Figure 1-1 Tumour stage as an anatomical biomarker ........................................... 19
Figure 1-2 Charting the molecular landscape of cancer ......................................... 23
Figure 1-3 Sampling and reconstructing the life history of a tumour ...................... 34
Figure 1-4 Emerging tissue-based solutions to the sampling bias problem ........... 45
Figure 1-5 Immune contexture ............................................................................... 50
Figure 1-6 Cancer biomarkers: past, present and future ........................................ 56
Figure 3-1 TRACERx lung RNA-Seq cohort ........................................................... 73
Figure 3-2 Strategy to calculate intra-tumour RNA heterogeneity scores at the
patient- and gene-level ........................................................................................... 75
Figure 3-3 Alternative metrics for RNA-ITH ............................................................ 76
Figure 3-4 RNA clustering concordance scores ..................................................... 77
Figure 3-5 Dependence of patient-level RNA-ITH scores on multi-region sampling
................................................................................................................................ 79
Figure 3-6 Down-sampling analysis of patient-level RNA-ITH scores .................... 80
Figure 3-7 RNA-ITH by tumour stage and histology ............................................... 81
Figure 3-8 RNA-ITH by immune infiltration and tumour purity ................................ 83
Figure 3-9 Genetic correlates of RNA-ITH ............................................................. 85
Figure 3-10 RNA-ITH associations with subclonal chromosomal copy-number
changes and prognosis .......................................................................................... 87
Figure 3-11 Published LUAD prognostic signatures ............................................... 89
Figure 3-12 Tumour sampling bias for prognostic signature from Shukla et al ...... 90
Figure 3-13 Prognostic information for prognostic signature from Shukla et al ...... 91
Figure 3-14 Tumour sampling bias for prognostic signature from Li et al .............. 92
Figure 3-15 Tumour sampling bias for prognostic signature from Kratz et al ......... 94
Figure 3-16 Tumour sampling bias for prognostic signatures from nine studies .... 95
Figure 3-17 Chromosomal instability associates with RNA-ITH, giving rise to
tumour sampling bias ............................................................................................. 98
Figure 4-1 Approaches to designing gene-expression biomarkers for lung cancer
.............................................................................................................................. 102
Figure 4-2 Analysis of the most variably expressed genes in TRACERx ............. 106
Figure 4-3 Inter-tumour RNA heterogeneity scores .............................................. 108
11
Figure 4-4 RNA heterogeneity quadrants ............................................................. 109
Figure 4-5 Genomic underpinning of RNA heterogeneity quadrants .................... 111
Figure 4-6 Pathway analysis of RNA heterogeneity quadrants ............................ 113
Figure 4-7 Analysis of published prognostic signatures by RNA heterogeneity
quadrant ............................................................................................................... 115
Figure 4-8 Reproducible survival association of published prognostic genes by
RNA heterogeneity quadrant ................................................................................ 117
Figure 4-9 Conventional and clonal prognostic signature design and performance
.............................................................................................................................. 119
Figure 4-10 Cross-cohort performance of random signatures .............................. 123
Figure 4-11 ORACLE signature design: gene selection and parameter tuning .... 125
Figure 4-12 Reproducible survival association of ORACLE ................................. 129
Figure 4-13 Prognostic value of ORACLE beyond existing clinicopathological risk
factors ................................................................................................................... 131
Figure 4-14 Prognostic value of ORACLE in LUAD patients with stage I disease 133
Figure 38 Testing performance of a published RNA-Seq signature ..................... 134
Figure 4-16 ORACLE as a cancer cell expression signature ............................... 136
Figure 4-17 ORACLE as a molecular correlate for tumour aggressiveness ......... 138
Figure 4-18 Tumour sampling bias of ORACLE ................................................... 140
Figure 4-19 Survival association of RNA heterogeneity quadrants across cancer
types ..................................................................................................................... 142
Figure 5-1 Anatomy of an RNA-based TME enumeration tool. ............................ 149
Figure 5-2 FACS gating strategy for T-cell subsets .............................................. 156
Figure 5-3 FACS gating strategy for other leucocyte subsets .............................. 157
Figure 5-4 FACS gating strategy for non-immune stromal cell subsets ............... 157
Figure 5-5 Expression of cell surface marker genes used for FACS .................... 159
Figure 5-6 Global transcriptomic analysis ............................................................ 161
Figure 5-7 Pathway differences between normal and cancerous lung ................. 163
Figure 5-8 Transcriptomic profiles of tumour infiltrating T-cells ............................ 165
Figure 5-9 Impact of tissue source on performance of TME marker genes ......... 168
Figure 5-10 Pairwise correlation analysis of the transcriptomic landscape for
stromal cell-types .................................................................................................. 169
Figure 5-11 Candidate cell-type-specific marker genes ....................................... 171

12
Figure 5-12 Outline of the analysis of stromal cell-types from lung tissue ........... 174
Figure 6-1 The detection of combinatorial patterns in cancer genomics datasets 180
Figure 6-2 Hypothesis: existing ME detection tools may be biased to detect
interactions between clonally mutated genes ....................................................... 183
Figure 6-3 Classifying mutation clonality and mutual exclusivity in driver genes . 186
Figure 6-4 Correlating the tendency of a gene to be clonally mutated with the
proportion of significant findings in mutual exclusivity analyses ........................... 189
Figure 6-5 Analysis of nine cancer-types indicates the significant findings of ME
detection tools tend to clonally mutated drivers .................................................... 190
Figure 6-6 The effect of recurrent mutation .......................................................... 192
Figure 6-7 Schematic overview of the processes used to examine the correlation
between mutation clonality and ME detection ...................................................... 193

13
List of tables...
Table 1 ORACLE signature .................................................................................. 126

14
Abbreviations
APOBEC apolipoprotein B mRNA editing enzyme catalytic polypeptide-like
AIC akaike information criterion
ALL acute lymphoblastic leukemia
AML acute myeloid leukemia
BAF b-allele frequency
BIC bayesian information criterion
BLCA bladder urothelial carcinoma
BRCA breast invasive carcinoma
CCF cancer cell fraction
CIN chromosomal instability
CLL chronic lymphocytic leukemia
CO co-occurrence
COAD colon adenocarcinoma
CPI checkpoint inhibitor
DEG differentially expressed gene
DLBLC diffuse large b-cell lymphoma
DMSO dimethyl sulfoxide
DNA deoxyribonucleic acid
ECM extracellular matrix
EDTA ethylenediaminetetraacetic acid
EMDR environment-mediated drug resistance
FACS fluorescence-activated cell sorting
FBS fetal bovine serum
GBM glioblastoma
ICGC international cancer genome consortium
IFN interferon
IHC immunohistochemistry
Indel small insertion/deletion
ITH intra-tumour heterogeneity
logR log-ratio

15
LOH loss-of-heterozygosity
LUAD lung adenocarcinoma
LUSC lung squamous cell carcinoma
ME mutual exclusivity
MHC major histocompatibility complex
MMR mismatch repair
NGS next-generation sequencing
NK natural killer (cells)
NSCLC non-small-cell lung cancer
ORACLE outcome risk associated clonal lung expression
OS overall survival
PBS phosphate-buffered saline
PCA principal component analysis
PCAWG pan-cancer analysis of whole genomes
PFS progression-free survival
READ rectum adenocarcinoma
RNA ribonucleic acid
RNA-ITH transcriptomic intra-tumour heterogeneity
RPMI roswell park memorial institute (culture medium)
RT-PCR reverse transcription polymerase chain reaction
RTK receptor tyrosine kinase
SCNA somatic copy number aberration
scRNAseq single-cell rna-seq
SKCM skin cutaneous melanoma
SNP single nucleotide polymorphism
SNV single nucleotide variant
STAD stomach adenocarcinoma
TCGA the cancer genome atlas
TCR t-cell receptor
TIL tumour infiltrating lymphocyte
TMB tumour mutational burden
TME tumour micro-environment
TNF tumour necrosis factor

16
TNM tumour-node-metastasis
TPM transcripts per million
UCEC uterine corpus endometrial carcinoma
UMAP uniform manifold approximation and projection
VAF variant allele frequency
WES whole exome sequencing
WGS whole-genome sequencing
WHO world health organization

Chapter 1 Introduction
17
Chapter 1. Introduction
1.1 Introduction
The transformation of normal healthy cells into malignant cancers involves the
acquisition of somatic alterations, re-wiring the signalling pathways that govern
cellular proliferation and homeostasis (Hahn and Weinberg, 2002). In the words of
Peyton Rous, “tumours destroy man in a unique and appalling way, as flesh of his
own flesh which has somehow been rendered proliferative, rampant, predatory and
ungovernable” (Rous, 1967).
Over the past two decades, research on the molecular lesions that drive cancers
has begun to translate into improved patient outcomes (Collins and Varmus, 2015).
Yet there is a substantial disparity between the research and labour investment in
molecular oncology over the last two decades and clinically validated molecular
markers (Kumar-Sinha and Chinnaiyan, 2018). In the context of diagnostics, this
mismatch has been referred to as the “cancer biomarker problem” (Sawyers,
2008).
In this chapter I give an overview of the current landscape for molecular biomarkers
in oncology, and explore in detail the emerging evidence on the potential roles of
two frontiers in the future development of molecular biomarkers: cancer evolution
and ecology (Maley et al., 2017; Zahir et al., 2020).

Chapter 1 Introduction
18
1.2 Molecular portraits of cancer
Over the past two decades, oncological diagnosis in solid cancers has moved from
a taxonomy based on tissue-type (lung cancer, breast cancer, etc) to a more
precise approach integrating indicators of patient or tumour biology (biomarkers)
(Sawyers, 2008). Prognostic biomarkers predict survival time from diagnosis to
death, helping to stratify patients for surgical resection and (neo)adjuvant
treatment. Alternatively, predictive biomarkers estimate the benefit for a specific
therapy, helping choose between treatment options (Ballman, 2015).
In this section, I first outline the utility and limitations of tumour staging as a widely
adopted prognostic biomarker. A brief history of molecular oncology is then
provided, illustrating how technological advancements have led to an explosion in
understanding of cancer as a genetic disease. Lastly, I give an overview of the
promise and pitfalls of the emerging landscape of molecular biomarkers in the
delivery of precision oncology.
1.2.1 Tumour stage is an imperfect predictor of survival risk
Tumour staging criteria capture the anatomic extent of disease at diagnosis.
Classification is typically made according to the tumour-node-metastasis (“TNM”)
scheme: T- primary tumour invasiveness and size, N – involvement of regional
lymph nodes, M – presence of distant metastasis. TNM staging is prognostic, and
is widely used as a biomarker to plan cancer treatment; to illustrate the scheme for
non-small-cell lung cancer (NSCLC) is shown (Figure 1-1). Early-stage patients are
considered low-risk, and surgical resection of the primary tumour is often curative.
By contrast, late-stage patients are typically stratified for surgery and (neo)adjuvant
chemotherapy, or palliative care in the presence of metastases in organs distant
from the primary tumour (with the exception of a few cancer-types, such as
advanced melanoma, where cures are now possible in stage IV disease).

Chapter 1 Introduction
19
Figure 1-1 Tumour stage as an anatomical biomarker The Tumour-Node-Metastasis (TNM) system for staging classifies cancer patients according to the anatomical extent of disease. A, The assessment of TNM stage is illustrated for four NSCLC patients, brief descriptions (with TNM breakdown) from left-right: stage I (T1N0M0) patient with small (<3cm) primary tumour; stage II (T2N0M0) patient with a larger (3-5cm) primary tumour; stage III (T2N2M0) patient with two ipsilateral lymph node metastases; stage IV (T2N0M1b) patient with a single extrathoracic metastasis to the brain. Colour scheme highlights primary tumour (red), lymph node metastasis (green), and distant metastasis (blue). B, Relationship between TNM stage and overall survival in NSCLC. Kaplan-Meier curve adapted from (Goldstraw et al., 2016).
While Denoix first proposed the TNM scheme in 1946 (Denoix, 1946), widespread
adoption was not immediate. In lung cancer a practical TNM scheme was not
available until 1974, when Mountain and colleagues assessed the “force of
mortality” for TNM combinations using data from more than 2,000 lung cancer
patients (Mountain et al., 1974). Moreover, TNM staging schemes are continually
revised to provide greater specificity in classification. In Mountain’s original TNM
scheme for lung cancer, the “T” descriptor classified patients as “T1” if the primary

Chapter 1 Introduction
20
tumour diameter was <3cm (Mountain et al., 1974). This was later updated and
split into “T1a” (<2cm) and “T1b” (2-3cm) (Goldstraw et al., 2007), and recently
further sub-divided into “T1a” (<1cm), “T1b” (1-2cm) and “T1c” (2-3cm) categories
(Goldstraw et al., 2016). In melanoma, the anatomical metric itself was revised.
Initially, the diameter of the melanoma was used to estimate prognosis (Lehman et
al., 1966), but this measure was later found to be an unreliable predictor and
replaced by “Breslow’s depth”, measured from the surface of the skin to the
deepest component of the melanoma (Breslow, 1970).
In spite of these revisions, tumour stage is an imperfect predictor of survival risk, as
patients with the same TNM class can have markedly different clinical outcomes.
The heterogeneity of end results within stage groupings can confound patient
stratification, resulting in under- or over-treatment. In lung cancer, surgical
resection alone was considered curative for stage I patients (using TNM version 7
criteria), but approximately 30% of stage I patients died within 5 years of diagnosis
(Goldstraw et al., 2007), indicating this patient sub-group may be under-treated.
Indeed, a meta-analysis of 5 trials of adjuvant chemotherapy by the Lung Adjuvant
Cisplatin Evaluation group suggested a lack of treatment benefit in stage IA lung
cancer (Pignon et al., 2008). A sub-group analysis of an adjuvant chemotherapy
trial found a marginal benefit from chemotherapy in stage IB lung tumours >4cm in
diameter (Strauss et al., 2008). The TNM classification for lung cancer was revised
accordingly for the 8th version (Goldstraw et al., 2016), yet under-treatment remains
a substantial problem (Sangha et al., 2010; Vargas and Harris, 2016). Early-stage
breast cancer patients face the opposite problem of over-treatment, as the marginal
survival benefit afforded by chemotherapy is outweighed by substantial treatment
morbidity (van’t Veer and Bernards, 2008). In a meta-analysis by the Early Breast
Cancer Trialists’ Collaborative Group, the majority of patients with small (<2cm)
node-negative estrogen receptor positive (ER+) breast tumours <2cm received
adjuvant chemotherapy, despite a survival benefit of less than 4% over 10 years
follow-up (Early Breast Cancer Trialists’ Collaborative Group, 2005).
Overall, there is a clinical need for novel biomarkers where current
clinicopathological diagnoses fail to stratify patients with sufficient precision. Well-

Chapter 1 Introduction
21
developed and validated molecular assays could support personalized therapy
decisions.
1.2.2 A brief history of molecular oncology
“The revolution in cancer research can be summed up in a single sentence: cancer is, in essence, a genetic disease.”
Bert Vogelstein & Kenneth W Kinzler (Vogelstein and Kinzler, 2004)
Somatic mutations in cancer genes contribute to tumourigenesis (Vogelstein and
Kinzler, 2004). Oncogenes are typically involved in processing extracellular growth-
stimulatory signals, and are activated in tumours by gain-of-function mutations,
yielding a constitutive proliferation signal. On the other hand, tumour suppressor
genes constrain deleterious cell proliferation. Loss-of-function mutations in tumour
suppressor genes liberate cancers from growth suppression; canonically, “two-hits”
are required to inactivate a tumour suppressor gene (Knudson, 1971). Major
categories of somatic mutations include point mutations, involving subtle intragenic
changes affecting crucial amino acid residues that regulate the activity of the gene
product, and somatic copy number aberrations (SCNAs), involving chromosomal
gain or loss events.
As early as 1890, Boveri and von Hansemann described chromosomal
abnormalities in their studies of dividing cancer cells, leading them to suggest that
malignant behaviour may be driven by altered hereditary material (Boveri, 1914;
von Hansemann, 1890). The first description of a genetic change leading to
malignant transformation was provided almost a century later, with careful sleuthing
identifying a HRASG12V point mutation as the oncogene activation event in human
bladder cancer cells (Reddy et al., 1982; Tabin et al., 1982). This ushered in a new
era of research aimed at uncovering the molecular determinants of cancer.
The discovery of cancer genes was a focus of early molecular studies (Futreal et
al., 2004). Techniques used in the search for cancer genes included mutational
screens that could either explore small sections of the genome at high-resolution,
enabling the discovery of BRAF and PIK3CA as oncogenes in human cancer for

Chapter 1 Introduction
22
example (Davies et al., 2002; Samuels et al., 2004), or the entire genome at low-
resolution, permitting the quantification of mutation rate (on average 90 out of
>13000 protein-coding genes in a cohort of breast and colorectal tumours (Sjöblom
et al., 2006; Wood et al., 2007)). By the mid-2000s, a draft census of the genes and
pathways commonly altered in cancer had been assembled (Vogelstein and
Kinzler, 2004).
The initial sequencing of the human genome in 2001 (Lander et al., 2001; Venter et
al., 2001) was seen as another turning point for cancer research (Dulbecco, 1986).
The advent of massively parallel “next-generation” sequencing (NGS) technologies
for DNA and RNA sequencing provided high-throughput methods to survey entire
cancer genomes and transcriptomes at single-base resolution (Bentley et al., 2008;
Z. Wang et al., 2009). Indeed, by the end of the decade several proof-of-concept
studies demonstrated the potential for NGS analyses in cancer research:
identifying novel mutations and rearrangements at base-pair resolution (Campbell
et al., 2008b; Ley et al., 2008); delineating mutational profiles of tobacco
carcinogens and transcription-coupled DNA repair (Pleasance et al., 2010);
establishing how the aberrant transcription of cancer driver pathways can be linked
to the underlying somatic alterations (Jones et al., 2008).
Over the last decade, the coordinated sequencing of thousands of cancer genomes
has led to an explosion in molecular knowledge about human cancers (Garraway
and Lander, 2013). Much of this work has been undertaken by multi-centre
consortium studies, including The Cancer Genome Atlas (TCGA) (Blum et al.,
2018), the International Cancer Genome Consortium (ICGC) (The International
Cancer Genome Consortium, 2010), and the Pan-Cancer Analysis of Whole
Genomes (PCAWG) consortium (The ICGC/TCGA Pan-Cancer Analysis of Whole
Genomes Consortium, 2020) (Figure 1-2). The availability of data from large-scale
cancer genome projects was accompanied by the development of a slew of
software tools, providing algorithms to detect somatic alterations in DNA and RNA
sequences (Cieślik and Chinnaiyan, 2018; Ding et al., 2014). Making these
datasets available to scientific community as rapidly as possible was a core
principle of several consortia, accelerating the pace of cancer genomics research.

Chapter 1 Introduction
23
Importantly, these cancer NGS studies provided a wealth of data to develop
molecular biomarkers.
Figure 1-2 Charting the molecular landscape of cancer A, Potential molecular markers of cancer highlighted on the central dogma of molecular biology. B, Timeline of large-scale cancer next-generation sequencing projects: The Cancer Genome Atlas (TCGA); the International Cancer Genome Consortium (ICGC) “25K initative” and Pan-Cancer Analysis of Whole Genomes (PCAWG) consortium; Genomics England 100,000 (100K) genomes project; Genomics Evidence Neoplasia Information Exchange (GENIE) project by the American Association for Cancer Research. Major findings from cancer NGS studies include defining the frequency of somatic
alterations. Contrary to the prior assumption that cancer genomes would harbor a
uniform mutation rate, analysis of exome-sequencing data from TCGA revealed
point mutation frequencies vary more than 1000x between cancer types, with the

Chapter 1 Introduction
24
average number of mutations per exome as low as one in pediatric cancers
(rhabdoid tumour, median=0.1/Mb; medulloblastoma, median=0.3/Mb) to hundreds
in melanoma and lung tumours (median=12.9/Mb) (Lawrence et al., 2014). A
similar variation was found for SCNA burden between cancer types, with the
average number of SCNA ranging from <10 in myeloproliferative disorders to >120
in dedifferentiated liopsarcoma (Beroukhim et al., 2010).
Defining a comprehensive catalogue of cancer genes is another key question for
cancer genomics, particularly the distinction between “driver” mutations, that are
causally implicated in oncogenesis and confer a growth advantage on the cancer
cell, from “passenger” mutations, that do not contribute to cancer development and
simply accumulate over the life history of a tumour (Stratton et al., 2009). Defining
drivers as genes recurrently altered at a higher mutation frequency than
background, Kandoth and colleagues detected 127 significantly mutated genes in a
study of >3000 cancer exomes from TCGA (Kandoth et al., 2013). Subsequently,
the PCAWG consortium has discovered driver events in the non-coding parts of the
genome (Rheinbay et al., 2020). Amongst other applications, studying patterns of
driver mutations can provide molecular evidence to underpin clinical understanding
of disease. For example, TCGA studies have supported the distinction of
oesophageal cancer as two disease subtypes (The Cancer Genome Atlas
Research Network, 2017), shown colon and rectal tumours constitute a single type
of cancer (The Cancer Genome Atlas Network, 2012), and found molecular
similarities between breast and ovarian tumours (Cancer Genome Atlas Network,
2012; The Cancer Genome Atlas Research Network, 2011).
The genome-wide characterization of mutational processes can lead to the
discovery of novel causative forces in cancer. Analysing >7000 tumours from
TCGA, Alexandrov and colleagues deciphered 20 mutational signatures, many of
which could be linked to established endogenous (e.g. DNA damage repair) or
exogenous (e.g. smoking, ultraviolet light exposure) mutagens, while several had
an unknown aetiology (Alexandrov et al., 2020). A recent in vitro study reported
that exposing a cell line to aristolochic acid gave rise to the same mutational
signature seen in renal and hepatic cancers in parts of the world where the

Chapter 1 Introduction
25
aristolochia plant grows (Kucab et al., 2019). This provides a framework for
“molecular epidemiology”, wherein linking mutational signatures to causal agents
can inform public health initiatives (Nangalia and Campbell, 2019).
Analyses of cancer transcriptomes have revealed the prevalence of somatic
alterations at the RNA level, such as TCGA analyses of alternative splicing (Kahles
et al., 2018) or driver fusion events (Gao et al., 2018). A PCAWG study deciphered
the genetic underpinning of RNA alterations in tumours, demonstrating SCNA as
the main driving force (Calabrese et al., 2020).
1.2.3 The cancer biomarker problem
“The major cancer discovery in my lifetime is that cancer isn’t one thing, but rather it’s many things. … Whatwe thought were maybe 10 or 15 unique diseases were really hundreds of diseases, and they each had their own epidemiology and risk factors, and would respond differently to therapies.”
Ned Sharpless, Director of the US National Cancer Institute (Zaromytidou, 2020)
Molecular biomarkers are the foundation of improving diagnostic precision in
cancer (Vargas and Harris, 2016). Proof-of-concept studies have shown molecular
profiling can complement current histology-based classification, delineating cancers
into prognostic risk groups (van ’t Veer et al., 2002), or sensitivity to genome or
immune targeted therapies (Paez et al., 2004; Taube et al., 2012). Yet, for
successful translation to clinical practice, a biomarker must make a clinically
informative distinction between patients, and perform reliably across independent
patient cohorts. The slow progress towards developing prognostic or predictive
indicators that fulfil these criteria has been referred to as the “cancer biomarker
problem” (Sawyers, 2008).
1.2.3.1 Molecularly defined risk groups
Early genome-wide studies of cancer transcriptomes leveraged DNA microarray
technology to uncover molecular heterogeneity in otherwise pathologically identical

Chapter 1 Introduction
26
patients. This transcriptional diversity could be used to recover established clinical
classes, for example Golub and colleagues demonstrated that unsupervised
clustering separated transcriptional profiles from acute leukemia patients into the
known acute myeloid leukemia (AML) and acute lymphoblastic leukemia (ALL)
subtypes of disease (Golub et al., 1999). A landmark analysis by Perou and
colleagues revealed that breast cancer encompassed four transcriptional subtypes
with distinct biological features (ER+; ER- basal-like; ER- Erb-B2+; ER- normal
breast) (Perou et al., 2000), demonstrating the potential to discover novel
molecular subtypes of disease. Similarly, Alizadeh and colleagues discovered two
molecularly distinct forms of diffuse large B-cell lymphoma (DLBLC), corresponding
to distinct stages of B-cell differentiation (Alizadeh et al., 2000). Importantly, the
molecular classification of DLBLC patients associated with significantly different
survival outcomes, independent of an established clinical risk factor (international
prognostic indicator score), indicating the discovery of transcriptional subtypes with
distinct clinical phenotypes could be applied to construct prognostic tests.
The clinical adoption of RNA-based prognostic tests (prognostic signatures) in
breast cancer provides a model for the use of molecular diagnostics to improve
patient outcomes. For example, the OncotypeDx test is a 21-gene RT-PCR assay
developed to estimate recurrence-risk in ER+ breast cancer patients (Paik et al.,
2004), that has been validated in prospective trials of >10,000 patients (Sparano et
al., 2018). Other clinically approved prognostic signatures for breast cancer include
the 70-gene MammaPrint test (van ’t Veer et al., 2002) and the 50-gene PAM50
assay (Parker et al., 2009). The uptake of these prognostic signatures by
oncologists over the last decade has been associated with a steep and persistent
decline in the use of systemic chemotherapy (Kurian et al., 2017), helping to
reduce over-treatment in early-stage breast cancer (Katz et al., 2018).
However, there remains a general apprehension in the field about the utility of
expression signatures as biomarkers. Meta-analyses of prognostic signatures have
found their prognostic capacity can be explained by confounding due to a tumour’s
subtype or clinicopathological profile (Tofigh et al., 2014), or have shown that
carefully crafted signatures can be out-performed by randomly generated

Chapter 1 Introduction
27
signatures (Tang et al., 2017; Venet et al., 2011). These studies serve as examples
of the prevailing sentiment of disappointment in current RNA-based biomarkers,
and the need for stable and reproducible prognostic signatures to encourage
clinical uptake.
1.2.3.2 Drugging molecular targets in the cancer genome
Genome-driven oncology holds the promise of leveraging the molecular
characterization of cancers to establish targets that serve as predictive biomarkers
for therapeutic intervention (Hyman et al., 2017). First-generation inhibitors of the
EGFR gene (gefitinib and erlotinib) initially received clinical approval for use in
NSCLC without restrictions. However, only a subset of NSCLC patients responded
to these EGFR-inhibitors (EGFRi). A series of sequencing studies established that
activating mutations (exon 19 deletion or L858R point mutation) in the EGFR gene
predicted sensitivity to EGFR inhibition (Lynch et al., 2004; Paez et al., 2004; Pao
et al., 2004). The approval of EGFR inhibitor usage was revised with EGFR-mutant
as a predictive biomarker. Other early successes of drugs targeted to the cancer
genome include trastuzumab for HER2-amplified breast tumours (Slamon et al.,
2009), and imatinib for chronic myeloid leukemia patients with a BCR-ABL fusion
(Druker et al., 2001).
A further accomplishment of the genome-driven oncology era is the rational design
of strategies to overcome resistance to targeted drugs. On-target mutation is a
common resistance mechanism in EGFR-mutant NSCLC patients receiving
erlotinib or gefitinib therapy, with a substitution of threonine at the “gatekeeper”
amino acid 790 to methionine (T790M) observed in >50% of patients after disease
progression (Kobayashi, 2005). A third-generation EGFR inhibitor (osimertinib) was
manufactured to selectively inhibit both sensitizing and resistance (T790M)
mutations in EGFR. Compared to standard-of-care platinum therapy, osimertinib
improved overall survival by 6 months in EGFR-mutant NSCLC patients that had
progressed on erlotinib/gefitinib therapy (Mok et al., 2017). Osimertinib was also
recently reported to out-perform erlotinib/gefitinib as first-line therapy for EGFR-
mutant NSCLC patients (Ramalingam et al., 2020). An understanding of cancer

Chapter 1 Introduction
28
pathways provided a strategy to overcome signalling bypass resistance through
combination therapy. For example, in BRAF-mutant colorectal cancers, inhibition of
the MAPK pathway through doublet (BRAFi + MEKi) or triplet (BRAFi + MEKi +
EGFRi) therapy lead to significantly more durable responses than mono-therapy
(BRAFi only) (Kopetz et al., 2019).
Yet there is a general sentiment that, despite substantial research investments,
molecular targeted agents have not yet realised the full promise of genome-driven
oncology (Tannock and Hickman, 2016). This can be partly explained by the fact
that most cancers lack mutations in readily “druggable” genes, such as kinase
oncogene alterations, indicating that the early successes of single kinase inhibitor
therapy may only benefit a small proportion of all cancer patients (Greenman et al.,
2007). A retrospective cross-sectional study of US patients with cancer evaluated
patient eligibility for 31 targeted drugs, estimating that in 2018 only 8.3% of
metastatic cancer patients would have been eligible for genome-targeted therapy
(Marquart et al., 2018). It is possible that innovative trial design may increase this
proportion in the near future. The recently reported National Lung Matrix Trial
screened >5000 patients with advanced NSCLC using NGS, finding that 36.7% of
patients were molecularly eligible for entry into the umbrella trial testing 8 different
targeted drugs (Middleton et al., 2020). However, a substantial increase in the
number of cancer patients eligible for targeted drug therapies will likely require
novel approaches to widen the druggable repertoire.
Synthetic lethality, in which the inhibition of one of a pair of genes is compatible
with cell viability but the loss-of-function of both genes leads to cell death, may
provide an alternative means to develop cancer-specific cytotoxic agents (Kaelin,
2005). For example, cancer cells harbouring mutations in BRCA1/2 genes are
defective in the homologous recombination pathway of DNA repair. Such BRCA-
mutant cancer cells were found to be exquisitely sensitive to poly(adenosine
diphosphate-ribose) polymerase inhibitors (PARPi) (Farmer et al., 2005). A number
of clinical trials followed, demonstrating the clinical benefit of PARPi therapy in
BRCA-mutant tumours of ovarian, breast, pancreatic, and prostate histologies
(Audeh et al., 2010; Fong et al., 2009; Kaufman et al., 2015; Tutt et al., 2010).

Chapter 1 Introduction
29
Overall, the recent clinical approval of PARPi for BRCA-mutant cancers provides a
proof-of-concept that synthetic lethal interactions can be translated into cancer
therapies (Lord and Ashworth, 2017). This underscores the need to better
understand epistatic interactions between cancer genes.
1.2.3.3 Sensitivity to immune checkpoint blockade
The normal function of immune checkpoint molecules involves regulating the
amplitude of the immune response, to maintain peripheral self-tolerance and shield
against tissue damage (Quezada and Peggs, 2013). For example, T-cells requires
both antigen binding to the T-cell receptor (McIntyre and Allison, 1983) (signal 1)
and CD28 co-stimulation (Harding et al., 1992) (signal 2) for licensing to specifically
kill target cells. Some checkpoints operate centrally in lymphoid organs, such as
the cytotoxic T lymphocyte antigen 4 (CTLA4) molecule that is involved in the co-
stimulatory activation of naïve and memory T-cells. Others operate in peripheral
tissues, including the programmed cell death 1 (PD1) molecule that limits T-cell
activity, conferring an exhaustion phenotype in antigen-specific T-cells. Cancers
leverage these checkpoints to co-opt immune inhibitory pathways. For example,
temporary blockade of CTLA4 reduced tumour growth in murine models of cancer,
suggesting a mechanism to “release the brakes” of the immune system to fight
cancer (Leach et al., 1996).
Over the last decade, a molecular understanding of these immune evasion
mechanisms has led to the development of checkpoint inhibitor (CPI) therapy.
Phase III trials of a CTLA4-inhibitor (ipilimumab) reported it was the first ever drug
to improve overall survival in patients with metastatic melanoma, with complete or
partial responses recorded in 6-11% of patients (Hodi et al., 2010). Similarly, early
phase I trials of drugs blocking the PD1/PDL1-axis showed responses in ~20% of
patients with advanced NSCLC, melanoma, or renal cancer (Brahmer et al., 2012;
Topalian et al., 2012). While a minority of patients exhibited remarkably durable
responses to CPI, the large number of non-responders indicated a need for
predictive biomarkers of CPI sensitivity (Nishino et al., 2017).

Chapter 1 Introduction
30
The inflamed tumour hypothesis suggests that checkpoint expression reflects the
presence of anti-tumour immunity (exhausted tumour-specific T-cells), so should
positively correlate with CPI response (Taube et al., 2012). In a multi-cancer phase
I study of PDL1 inhibitor, immunohistochemical (IHC) staining for PDL1 in baseline
samples revealed significantly higher expression levels in responders (Herbst et al.,
2014), supporting the inflamed tumour hypothesis. Subsequently, a consistent
positive association between PDL1 expression and objective response rate has
been confirmed by a number of trials (Sacher and Gandhi, 2016). In particular, on
the basis of the KEYNOTE trials (Garon et al., 2015; Herbst et al., 2016), a clinical
assay of PDL1 expression received clinical approval for use in stratifying NSCLC
patients for pembrolizumab therapy (a monoclonal anti-PD1 antibody).
Tumour mutation burden (TMB) is another biologically-motivated predictor of CPI
sensitivity. The underlying hypothesis is that TMB generates somatic neo-epitopes,
inducing a natural anti-tumour immune response that might be augmented by
checkpoint blockade (Schumacher and Hacohen, 2016). Analyses of whole-exome
sequencing (WES) data revealed that high mutational load correlated with
sustained clinical benefit in two melanoma cohorts treated with a CTLA4-inhibitor
(Snyder et al., 2014), and a NSCLC cohort treated with a PD1-inhibitor (Rizvi et al.,
2015), providing proof-of-concept. An affordable clinical assay for TMB has been
developed, estimating the genome-wide measure from targeted sequencing of ~3%
of the coding genome (Frampton et al., 2016).
Remarkably, a trial of PD1-inhibitor therapy in Mismatch Repair (MMR) deficient
tumours across 12 cancer types reported radiographic responses in 53% of
patients (Le et al., 2017). This led to the clinical approval of PD1-inhibitor therapy
as a “tissue agnostic” drug in all MMR deficient cancers, regardless of histology,
exemplifying the potential utility of molecular markers to select cancer treatment.
Yet both checkpoint expression and TMB are imperfect biomarkers of CPI
sensitivity, with clinical responses observed in biomarker-negative patients (PDL1
expression <1%, TMB) (Garon et al., 2015; Samstein et al., 2019). Additional

Chapter 1 Introduction
31
mechanism-driven biomarkers are required to advance the field of precision
immune-oncology (Havel et al., 2019; Topalian et al., 2016).
1.2.3.4 Summary
Molecular biomarkers have substantial translational promise, with some startling
clinical applications. However, these pale in comparison to the research and labour
investment in molecular oncology over the last two decades (Kumar-Sinha and
Chinnaiyan, 2018). Several limitations of existing molecular biomarkers have been
described in this section.
In the remainder of this chapter, I will explore two frontiers for refining molecular
biomarkers: evolutionary and ecological features of cancer (Maley et al., 2017).

Chapter 1 Introduction
32
1.3 Darwinian evolution in cancer
1.3.1 Intra-tumour heterogeneity as a substrate for evolution
Darwin’s famous “I think” phylogenetic tree depicted the origin of many species
from a single common ancestor. In 1976, Peter Nowell first proposed that the
same, branching pattern of evolution might be observed in the genetic material of
cancer cells (Nowell, 1976). He suggested “acquired genetic lability permits
stepwise selection of variant sublines and underlies tumour progression”. Within a
decade, Gloria Heppner defined intra-tumour heterogeneity (ITH) as “tumour cell
differences [that] are believed to be due to differences in cell lineage (ie due to
presence of distinctly different subpopulations capable of breeding true)” (Heppner,
1984).
In the 1970s, several murine studies described extensive intra-tumoural phenotypic
variation, and hinted at a genetic origin. Sectioning mouse sarcomas into four equal
regions, Håkansson et al discovered the regions from some tumours differed
significantly in sensitivity to cytostatic drugs (Håkansson and Tropé, 1974). Fidler et
al observed large variation in metastatic potential between cell lines derived from a
single murine melanoma, with the average number of pulmonary tumour
metastases generated by intravenous injection ranging from 3.5 to more than 500
(Fidler and Kripke, 1977). In a similar experiment, Dexter et al found in vitro
differences in morphology and growth patterns between cell lines isolated from a
single murine mammary tumour (Dexter et al., 1978). Importantly, karyotypic
analysis revealed very significant differences in the modal chromosome numbers of
each cell line (range=39-130), and that the parental tumour contained the full
spectrum of karyotypes observed, suggesting the inheritance of genotypic
heterogeneity. Overall these murine studies helped provide evidence for intra-
tumoural variation in genetic and phenotypic properties.
In a small cohort of chronic lymphocytic leukemia (CLL) patients (n=22), Campbell
et al performed massively parallel pyro-sequencing of the IGH locus to delineate
cancer phylogenies (Campbell et al., 2008a). This study demonstrated that NGS
studies of single tumour biopsies represent a snapshot of cancer evolution,

Chapter 1 Introduction
33
permitting the timing of specific genomic aberrations (Figure 1-3). “Clonal”
mutations are present in every cancer cell, so are thought to occur early in the life
history of a tumour, forming the trunk of evolutionary tree. By contrast, “subclonal”
mutations are present in a fraction of cancer cells, so form the branches of the tree.
The presence of Nowell’s “variant sublines” (Nowell, 1976), or malignant
subclones, has since been demonstrated in multiple cancer-types. In a pan-cancer
analysis of WES data from ~2,700 tumours across 9 TCGA cancer-types,
McGranahan and colleagues discovered that cancer driver genes tended to be
clonally mutated relative to other genes, for example VHL in kidney cancer,
CDKN2A in lung cancer, and TP53 across cancer-types (McGranahan et al., 2015).
Recently, Dentro and colleagues found evidence of distinct subclonal expansions in
95% of samples from a pan-cancer whole-genome sequencing (WGS) dataset of
>2,600 tumours from the PCAWG study (Dentro et al., 2020).
Yet single-region sampling is vulnerable to the “illusion of clonality”, wherein a
somatic alteration appears to be present in every cell from one tumour biopsy, but
may actually be absent in other regions of the same tumour (Figure 1-3). This can
be overcome by multi-region sampling strategies. Bhandari and colleagues
estimated that single-region sampling typically detected <50% of the cancer cell
populations identified by multi-region sequencing in a prostate cancer dataset
(Bhandari et al., 2018). In a cohort of patients with lung cancer, 76% of mutations
classified as subclonal using multi-region WES could have appeared to be clonal if
single-region sampling had been used (Jamal-Hanjani et al., 2017).
Both single- and multi-region sequencing approaches share the restrictions of
single time-point analyses, such as limited resolution of early clonal events at
tumour initiation (Greaves, 2015). To some extent, this can be addressed by
innovative approaches to analysis. For example, the REVOLVER tool applied
transfer learning to multi-region WES data from a cohort of lung cancer patients,
inferring that clonal CDKN2A mutations tend to precede clonal alterations in TP53
(Caravagna et al., 2018). NGS profiling of pre-invasive lesions provides a definitive

Chapter 1 Introduction
34
molecular archaeology, revealing that 51% of mutations in lung adenocarcinoma
(LUAD) precursor lesions were subclonal (X. Hu et al., 2019).
Figure 1-3 Sampling and reconstructing the life history of a tumour A, Graphical representation of clonal evolution in the life history of a tumour. The founding clone (blue) gives rise to subclones (brown and purple). One subclone (purple) gives rise to disseminated disease (“metastasis”), prior to clinical detection and surgical resection of the primary tumour. The other subclone acquires a resistance mutation on-therapy, engendering a drug-resistant subclone (green). B, The impact of tissue sampling strategy on reconstruction of tumour phylogenies. The primary tumour from A is shown at the point of diagnosis and surgical resection (left); the tumour contains multiple spatially separated subclones, and three potential biopsy sites are indicated (white circles). Single-region sampling, and inferences about mutation clonality, allows

Chapter 1 Introduction
35
partial reconstruction of the tumour’s phylogenetic tree (middle). However, single-region sampling under-samples the heterogeneity present in non-sampled parts of the tumour, and is also vulnerable to the “illusion of clonality”. Multi-region sampling gives a broader view of heterogeneity across the entire tumour and, in this simplified example, permits reconstruction of the tumour’s full phylogenetic tree.
1.3.2 Clonal diversity as a prognostic biomarker
Rare subclones, present at diagnosis, have been shown to harbour mechanisms of
therapy resistance, and seed relapse in leukemias (Ding et al., 2012; Roche-
Lestienne et al., 2003), colorectal cancer (Diaz Jr et al., 2012; Misale et al., 2012)
and medulloblastoma (Morrissy et al., 2016). Evidence for a “lethal” subclone with
metastatic potential has also been observed in multiple cancer-types (Kim et al.,
2015; Yachida et al., 2010; Yates et al., 2015). Yet branching, Darwinian selection
is not the only possible explanation for the co-existence of multiple subclones
(Greaves, 2015). Williams and colleagues defined a “null model” of ITH, finding a
power law for neutral evolution fitted 36% of ~900 cancers across 14 cancer-types
(Williams et al., 2016). The authors suggested this might indicated a “big bang”
architecture of neutral tumour evolution, with clonal selection complete in the first
cancer cell, and the subsequent accumulation of passenger mutations engendering
non-functional ITH.
Clonal diversity has also been linked with clinical outcomes. In CLL, Landau and
colleagues linked the presence of subclonal driver events with poor survival
outcome in a discovery cohort of 18 longitudinal samples, then validated this
association in an validation cohort (n=149 samples), showing this evolutionary
metric remained significant in multivariate analysis with established risk factors
(Landau et al., 2013). Three separate pan-cancer analyses of 1,100-4,700 tumours
from the TCGA study quantified ITH, using either PyClone (Andor et al., 2016;
Morris et al., 2016) or mutant-allele tumour heterogeneity (MATH) scores
(Noorbakhsh et al., 2018), and described significant survival associations in a
subset of cancer-types. However, Reiter and colleagues conducted a meta-

Chapter 1 Introduction
36
analysis of several multi-region cancer datasets, concluding that subclonal driver
mutations were non-functional and not prognostic (Reiter et al., 2019). Moreover,
clinical development of ITH as a prognostic biomarker is complicated by the need
for multi-region sequencing for accurate estimation (Abécassis et al., 2019), and
the algorithmic challenges of subclonal reconstruction (Salcedo et al., 2020). In
summary, multiple challenges must still be overcome for the direct usage of ITH as
a prognostic biomarker
1.3.3 Mechanisms of cancer genome evolution
As part of his proposal that cancer is an evolutionary disease, Nowell speculated
that “acquired genetic lability permit[ted] stepwise selection of variant sublines and
underlies tumour progression” (Nowell, 1976). This “genetic lability” has been
observed in across cancer-types, fuelling mutational diversification and ITH.
Genetic instability operating at the level of single nucleotide variations (SNVs) can
drive subclonal diversification, shaping clinical outcomes. In gliomas, large
increases in the number of somatic mutations was discovered after treatment with
alkylating agents (temozolomide), and associated with the inactivation of a
mismatch repair gene (MSH6) (Hunter et al., 2006). A similar branching pattern of
evolution post- temozolomide treatment in glioblastomas was enriched in
responders to PD1-inhibitor therapy (Zhao et al., 2019). The APOBEC
(apolipoprotein B mRNA editing enzyme catalytic polypeptide-like) mutational
signature was over-represented in subclonal mutations in treatment-naïve NSCLC
tumours (de Bruin et al., 2014; Jamal-Hanjani et al., 2017), and was enriched in a
treatment-resistant clone from a patient who died of metastatic disease. Thus the
accelerated accumulation of SNV can underpin “micro-evolutionary” events in
cancer genomes (McGranahan and Swanton, 2017).
Large-scale chromosomal alterations underlie “macro-evolution” in cancer
(McGranahan and Swanton, 2017). Chromosomal instability (CIN), a dynamic state
involving SCNAs in whole or parts of chromosomes, leads to inter-cellular
variability in chromosomal number and structure (McGranahan et al., 2012). CIN is

Chapter 1 Introduction
37
caused by mechanisms including defective mitotic checkpoints, impaired non-
homologous end joining, and telomere dysfunction (Maser and DePinho, 2002).
Karyotypic diversity provides a substrate for Darwinian tumour evolution, allowing
the emergence of rare cells with increased fitness (for example, amplifications in
core proliferation genes (Endesfelder et al., 2014)), and convergence on favourable
karyotypes (Laughney et al., 2015). In NGS studies, CIN has consistently
associated with poor prognosis (McGranahan et al., 2012). Carter and colleagues
developed an RNA-measure of CIN, identifying 70 genes with expression
associated with aneuploidy (Carter et al., 2006). This “CIN70” signature included
regulators of replication and chromosome segregation (AURKA, AURKB, NEK2,
H2AFX, CDC20, ZWINT, CCNB1, CCNB2), and correlated with survival in several
datasets. Recently, a WES-based measure of CIN was developed using a multi-
region dataset of patients with NSCLC, quantifying the extent of spatially separated
SCNA changes, and associated with worse disease-free survival (Jamal-Hanjani et
al., 2017). In bacteria, high levels of genetic instability can lead to “mutational
meltdown” (Lynch et al., 1993). Along the same lines, applying the CIN70 signature
to >2000 tumours, Birkbak and colleagues observed that the quartile of tumours
with highest CIN paradoxically had improved survival outcomes compared to the
second-highest quartile (Birkbak et al., 2011).
Overall, micro- and macro-evolutionary mechanisms have been observed to foster
ITH and increase proliferation advantage across several cancer-types. CIN also
holds promise as a prognostic biomarker, if a robust metric can be derived and
clinically validated (McGranahan and Swanton, 2017). Bakhoum and colleagues
have also suggested CIN as a predictive marker for therapy response, stratifying
low-CIN tumours with low adaptability for genome-targeted drugs, and applying
cytotoxic therapies to high-CIN tumours that tend towards genomic catastrophe
(Bakhoum and Landau, 2017).
1.3.4 Evolutionary constraints
“Throw up a handful of feathers, and all must fall to the ground according to definite laws. But how simple is this problem compared to the action and reaction of the innumerable plants and animals which have determined, in

Chapter 1 Introduction
38
the course of centuries, the proportional numbers and kinds of trees now growing on the old Indian ruins.”
Charles Darwin (Darwin, 1859)
In the belief that sequential selection “is not completely random”, Nowell proposed
that “certain similarities are acquired by different tumours as they progress”
(Nowell, 1976). Yet mutations accumulate randomly, and can have variable fitness
effects in different contexts (Sidow and Spies, 2015). Resolving evolutionary
dependencies in cancer is an important frontier for precision oncology (Lipinski et
al., 2016).
In cancer, parallel evolution is defined as recurrent alterations in the same driver
gene in spatially separated regions of an individual tumour. Observations of parallel
evolution suggest the existence of evolutionary constraints (McGranahan and
Swanton, 2017). In a landmark multi-region study, Gerlinger and colleagues
assessed genetic ITH in four renal tumours (Gerlinger et al., 2012). Multiple distinct
and spatially separated mutations were observed in driver genes (SETD2, PTEN,
and KDM5C) within a single tumour, suggesting convergent phenotypic evolution.
Subsequently, in a larger cohort of patients with ccRCC (n=101), parallel evolution
at the SNV-level was detected in 13% of tumours, typically involving SETD2, BAP1,
and PTEN driver genes (Turajlic et al., 2018). Parallel evolution can also occur at
the SCNA level. This phenomenon was observed in >60% of NSCLC tumours,
including amplifications in CDK4, FOXA1, and BCL11A (Jamal-Hanjani et al.,
2017). Parallel evolution has been reported in multiple other cancer-types,
including glioma (Francis et al., 2014; Johnson et al., 2014), oesophageal
adenocarcinoma (Murugaesu et al., 2015), and CLL (Yeh et al., 2017). Overall, this
suggests a finite set of genetic routes for evolving tumours.
The evolutionary fitness of a new mutation may be influenced by the net effect of
preceding mutations. In a study of patients with myeloproliferative neoplasms,
Ortmann and colleagues established that the mutational order of TET2 and JAK2
mutations was associated with expansion of different cell-types, different
expression profiles, and distinct clinical outcomes (Ortmann et al., 2015). A recent
multi-region study of renal cancers discovered PBRM1 mutations tended to

Chapter 1 Introduction
39
precede SETD2 alterations (Mitchell et al., 2018). Such tendencies for driver
mutations to be acquired in a particular order has also been identified in colorectal
cancer (Cross et al., 2018; Sottoriva et al., 2015), and prostate cancer (Gerhauser
et al., 2018).
The finding of parallel and ordered mutational events within cancer NGS datasets
supports the existence of constraints to cancer evolution. In future, it is possible
that this knowledge could be therapeutically exploited. Predicting the resistance
genotype and the probability of disease progression (Lipinski et al., 2016), or
targeting evolutionary constraints in a “checkmate” therapeutic strategy wherein an
evolving tumour has no avenue of escape (McGranahan and Swanton, 2017).

Chapter 1 Introduction
40
1.4 Tumour sampling bias of molecular biomarkers
“… the most remarkable feature in the natural history of [the Galapagos] archipelago; it is that the different islands to a considerable extent are inhabited by a different set of beings … I never dreamed that islands, about fifty or sixty miles apart, and most of them in sight of each other, formed of precisely the same rocks, placed under a quite similar climate, rising to a nearly equal height, would have been differently tenanted; but we shall soon see that this is the case.”
Charles Darwin (Darwin, 1845)
Studies of ITH reveal a similar pattern in cancer to Darwin’s observations of
species diversity in the Galapagos archipelago. This gives rise to the problem of
tumour sampling bias. Single-site needle biopsy sampling is currently used as the
standard protocol for diagnostic testing, regardless of the biomarker modality
(genetic, transcriptomic, epigenetic or proteomic), typically sampling less than 1%
of the primary tumour mass (Litchfield et al., 2020). Diagnostic biopsies can
therefore be confounded by spatio-genomic heterogeneity within individual
tumours, as molecular testing might yield completely different results depending on
where the biopsy needle is placed (Boutros, 2015; Swanton, 2012; Yap et al.,
2012). Moreover, the move to minimally invasive sampling techniques, which yield
less biopsy tissue for diagnosis (McCall and Dry, 2019), indicates sampling bias will
only become a larger problem in the future.
In this section I review the confounding effect of tumour sampling bias on the
performance of molecular biomarkers. I will also highlight emerging solutions that
could help clinicians better place – or go beyond – the biopsy needle.
1.4.1 Tumour sampling bias confounds molecular diagnostics
1.4.1.1 Prognostic biomarkers
Flow cytometry studies of intra-tumour variability provided early evidence that
sampling bias could confound DNA-based prognostic biomarkers. Assessing DNA
ploidy status as a potential prognostic factor, Petersen and colleagues obtained 6-
10 spatially separated biopsies from each of a small series of colorectal tumours

Chapter 1 Introduction
41
(n=6 patients), discovering mixed populations of near-diploid and hyperploid cancer
cells in 83% (5/6) of tumours (Petersen et al., 1979). This was the first report
showing that such “mosaic” cellular composition may be a common phenomenon in
cancers, leading the authors to suggest that a single biopsy may not be
representative of the whole tumour. In a larger series of breast tumours (214
samples from n=44 patients), Beerman and colleagues estimated that only taking
one sample would have wrongly classified a tumour as diploid in 30% of cases,
writing that the underestimation of ITH may account for disagreement in the
literature about the prognostic value of DNA ploidy (Beerman et al., 1991). A multi-
cancer analysis (>1,400 samples from 140 tumours of breast, gastrointestinal and
melanoma histologies) of several potential prognostic biomarkers measured by flow
cytometry concluded that the intra-tumour variability observed was so high that all
single-site testing should be abandoned, and that the use of molecular biomarkers
would not be possible until the way the tumour is sampled or prepared for
laboratory testing was changed (Barranco et al., 1994). The unexpected degree of
intra-tumoural RNA variation, revealed by early multi-region transcriptomic profiling
studies, suggested that ITH might also bias RNA-based prognostic biomarkers
(Blackhall et al., 2004).
In recent years, multi-region studies have quantified tumour sampling bias for a
number of state-of-the-art prognostic biomarkers. Boutros and colleagues
examined the ITH of candidate DNA-based prognostic biomarkers in 5 prostate
cancer patients, finding all yielded different predictions depending on which tumour
region was analysed (Boutros et al., 2015); for example, NKX3-1 was deleted in
two of five regions from one tumour. In a small cohort of clear-cell renal carcinoma
tumours (n=10 patients), Gerlinger and colleagues reported that 9p SCNA loss and
BAP1 mutations were heterogeneous in all cases identified (Gerlinger et al., 2014).
In the same cohort, Gulati and colleagues reported a similar result for an RNA-
based prognostic measure, finding the “ccA” risk signature was heterogeneously
expressed in 80% (8/10) of tumours (Gulati et al., 2014). Applying the OncotypeDx
test to a large multi-region cohort of ER+ breast tumours (181 samples from 71
patients), Gyanchandani and colleagues found risk classification varied depending
on biopsy site in 25% (18/71) of tumours (Gyanchandani et al., 2016). This

Chapter 1 Introduction
42
indicated that even clinically approved assays might be vulnerable to tumour
sampling bias.
1.4.1.2 Predictive biomarkers for genome-targeted therapy
In describing cancer as a disease of clonal evolution, Nowell proposed “one could
hope to eradicate the clone and effect a cure” by targeting a mutation arising
occurring “at the time of the initial neoplastic change” (Nowell, 1976). Diagnostic
samples can be used to identify mutations occurring early (clonal) or late
(subclonal) in tumour evolution through analyses of mutation clonality. Clonal
somatic alterations, which are present in every cancer cell, can then be prioritised
for therapeutic targeting (Yap et al., 2012). However, this scheme could be
undermined by genetic ITH, giving rise to sampling bias in predictive biomarkers for
genome-targeted therapy.
Sampling bias could arise if the drug target itself is heterogeneously distributed
through the primary tumour. An analysis of WES data from 9 TCGA cancer-types
discovered that almost every gene linked with a targeted therapy approach was
subclonally mutated in at least one tumour (McGranahan et al., 2015). Taking
EGFRi in LUAD as a canonical example, 14% (3/21) of druggable mutations were
subclonal in this analysis, in line with an earlier study describing ITH of EGFR
exon-19 deletion in a multi-region set of clinical samples (Sakurada et al., 2008).
Genetic ITH of the target may also be a concern for emerging “tissue-agnostic”
drugs. For example, 5% (4/74) of patients recruited in the SUMMIT basket trial
harboured subclonal HER2 mutations, and none of these patients were responders
to HER kinase inhibitor therapy (Hyman et al., 2018).
Pre-treatment samples could also contain a drug resistance mechanism as a minor
subclone, evading detection in single-sample diagnostic testing, yet rapidly giving
rise to primary resistance. Prior to first-generation EGFRi therapy
(gefitinib/erlotinib), a subset of lung adenocarcinoma patients harboured on-target
(EGFR T790M) or signalling bypass (MET amplifications) resistance mutations,

Chapter 1 Introduction
43
and this group of patients was significantly enriched in non-responders to therapy
(Inukai et al., 2006; Turke et al., 2010).
1.4.1.3 Patient stratification for immunotherapy
ITH has also been reported in clinically-approved markers of CPI response.
Topalian and colleagues quantified PDL1 expression (percentage positive tumour
cells) by immunohistochemical analysis in pre-treatment samples (61 samples from
42 patients) as part of a multi-cancer phase I trial of PD1-inhibitor therapy.
(Topalian et al., 2012). 75% (9/12) of patients with data available for multiple
malignant samples exhibited variable PDL1 expression between biopsy sites.
Heterogeneous expression of PDL1 might naturally be expected, as this checkpoint
is reactively induced in cells neighbouring the site of a CD8+ T cell infiltrate, so
would display lower expression in T-cell sparse tumour regions (Ribas and Hu-
Lieskovan, 2016). McGranahan and colleagues have shown ITH of neoantigens is
pervasive in NSCLC, and that response to CPI is better modelled by a combination
of neoantigen burden and clonality than by either predictor alone (McGranahan et
al., 2016). In a CTLA4-inhibitor trial in patients with melanoma, Riaz and colleagues
corroborated the finding that an ITH-cutoff improved upon TMB-based prediction of
response (Riaz et al., 2017). Lastly, RNA-based predictive biomarkers for CPI also
exhibit substantial sampling bias. In a multi-region RNA-Seq dataset of NSCLC
tumours, discordant rates were 33% and 44% for the IPRES and TIDE signatures
respectively (Hugo et al., 2016; Jiang et al., 2018; Rosenthal et al., 2019).
1.4.2 Emerging tissue-based solutions
Overcoming ITH as a confounding factor for biomarker applications may improve
the estimation of survival risk and CPI response. Sampling is effectively bypassed
in melanoma, as the whole tumour is taken for clinical assessment (Breslow, 1970;
Lehman et al., 1966). However, this is impractical for routine clinical use in most
solid cancer-types. Here I discuss emerging approaches to address the sampling
bias problem (Figure 1-4).

Chapter 1 Introduction
44
Pooling multiple biopsies for each tumour is a way to minimize artefacts from
tumour heterogeneity. If multi-biopsy sampling is required, how many regions of an
individual tumour should be sampled? Conducting bootstrap resampling in a multi-
biopsy dataset of a DNA-based prognostic metric, Barranco and colleagues
estimated that at least 3 sites should be biopsied per tumour to achieve a 90%
probability for a stable prognostic read-out (Barranco et al., 1994). Similarly,
Blackhall and colleagues ran a confidence interval analysis on a multi-region RNA
dataset of NSCLC tumours, recommending that biopsies should be pooled from at
least four biopsies per tumour (Blackhall et al., 2004). In a more recent empirical
analysis, Turajlic and colleagues calculated ITH saturation gradients in a multi-
region cohort of renal tumours, discovering that 2 biopsies would detect 50% of
driver mutations, and 7 biopsies would recover 75% of drivers (Turajlic et al.,
2018). Formal analyses, based on a mathematical model of tumour heterogeneity,
might provide an alterative means to estimate the number of biopsies required for
pooling (Opasic et al., 2019).
The entire tumour can be blended, then a single molecular test applied to a single
aliquot of the homogenize mixture. Joung and colleagues provided proof-of-
concept for this approach in a multi-cancer analysis of a small number of tumours
(Joung et al., 2016). More recently, Litchfield and colleagues quantified the
accuracy of the method on a larger scale (Litchfield et al., 2020). This elegant
solution is caveated by the need for access to the bulk tumour, requiring
modification of current pathology workflows, and the homegenization of tumour
samples runs the risk of dilution of the individual test results (Fuhr et al., 1991).
An alternative method is to filter for genes that are stably expressed across all
tumour regions, therefore allowing estimation of a whole tumour expression value
from a single biopsy in routine clinical use. Obtaining RNA data for 33 biopsies
from 11 patients with cervival cancer, Bachtiary and colleagues found that the 7.6%
(1,536/20,000) of expressed genes with lowest transcriptomic ITH allowed
estimation of a representative whole tumour expression value from a single biopsy
(Bachtiary et al., 2006). The authors concluded that a useful prognostic marker
should both correlate with patient outcome and be homogenously expressed, to

Chapter 1 Introduction
45
eliminate tumour sampling bias as a confounding variable. However, prior to this
thesis, a practical implementation of this “clonal biomarker” solution was not
available.
Figure 1-4 Emerging tissue-based solutions to the sampling bias problem A, The sampling bias problem is illustrated for a lung tumour. Here, a prognostic biomarker classifiers tumour regions (R1-6) as high- (red) or low-risk (blue). It can be seen that the diagnostic biopsy (labelled triangle) samples from only one tumour region. Therefore the read-out of molecular risk for this patient will depend entirely on where the biopsy needle is placed. B, Four strategies to

Chapter 1 Introduction
46
mitigate sampling bias are tabulated, comparing their tissue and cost requirements. C, Sampling and testing “all” (n) tumour regions bypasses the sampling problem, however is the most expensive in terms of tissue and technology costs. D, A multi-biopsy strategy, sampling “some” regions (four regions have been suggested for lung cancer), brings down the cost while tending to capture intra-tumour variability. E, “Blend” the entire tumour, and apply one test to an aliquot from the homogenized mixture. This strategy has the same cost as testing a diagnostic biopsy, however requires pathology access to the full tumour. F, In theory, the “clonal” strategy is the most economical, providing a stable molecular read-out from a single diagnostic biopsy.

Chapter 1 Introduction
47
1.5 Cancer ecology
“Tumors: wounds that do not heal”
Harold Dvorak (Dvorak, 1986)
In the late 1950s, Burnet and Thomas proposed the cancer immunosurveillance
hypothesis, suggesting that adaptive immunity inhibits cancer development
(Burnet, 1957; Thomas, 1982). Confirming this hypothesis required the generation
of immune-compromised in vivo models. In 2001, two studies demonstrated that
interferon (IFN)-γ receptor-deficient or RAG2-deficient mice developed tumours
more rapidly and with greater frequency than immunocompetent mice (Kaplan et
al., 1998; Shankaran et al., 2001). Evidence that the tumour genome is antigenic
was first provided by Boon and Schreiber in the 1980s, identifying neo-epitopes
and suggesting that this could drive cancer immunity (Boon, 1983; Torre-Amione et
al., 1990). Through the 1990s, the molecular identification of tumour neoantigens
was performed by several groups (Monach et al., 1995; Topalian et al., 1992; van
der Bruggen et al., 1991). The phases by which the tumour genome can elicit T-cell
mediated clearance has been described as the “cancer immunity cycle” (Chen and
Mellman, 2017). Within this scheme, tumours can be classified into one of three
immune profiles: “immune desert”, lacking T-cells in both parenchyma and stroma
due to deficits in cancer antigen presentation or T-cell activation; “immune
excluded”, with stromal cells forming nests around cancer cells, preventing T-cell
trafficking and infiltration; “immune inflamed”, with T-cells in close proximity to
tumour cells, capable of cancer cell recognition and killing. Immune evasion is now
an established hallmark of cancer (Hanahan and Weinberg, 2011).
Stromal cells in the tumour microenvironment (TME) also have a role in sustaining
and enabling the acquisition of cancer hallmarks (Hanahan and Coussens, 2012).
In 1986, Dvorak summarised the generation of an activated TME, describing
tumours as “wounds that do not heal” (Dvorak, 1986). The co-conspiratorial
behaviour of stromal cells can shield cancer cells from cytotoxic and genome-
targeted therapies.

Chapter 1 Introduction
48
In this section, I discuss the influence of the cellular components of the TME on
clinical outcomes.
1.5.1 Immune contexture as a diagnostic scheme
To link the lymphoid and myeloid immune components of solid tumours with clinical
outcomes, Fridman and colleagues provided the “immune contexture” framework
(Fridman et al., 2017). This classifies tumours according to the density,
composition, functional state and organization of immune infiltration. Here I give an
overview of literature supporting the relevance of the immune contexture to cancer
prognosis and sensitivity to immunotherapy.
1.5.1.1 Density
Extensive evidence links the density of tumour infiltrating lymphocytes (TILs) with
patient survival (Figure 1-5). Classification of the presence of TILs in primary
melanomas as “brisk”, “nonbrisk” or “absent” through histopathology review
revealed the presence of TILs to be a significant prognostic factor independent of
established risk factors (thickness and mitotic rate) (Clemente et al., 1996). Using
IHC to stain and quantify subsets of TILs at higher granularity, Pagès et al reported
high levels of effector memory (CD8+CD45R0+) T-cells was an independent
predictor of overall survival in a large cohort of colorectal tumours (n=956) (Pagès
et al., 2005). Further spatial classification of TILs revealed intra-epithelial, but not
stromal, TIL density was associated with improved overall survival for CD8+ T-cells
in oesophageal cancer (Schumacher et al., 2001) and for CD3+ T-cells in ovarian
cancer (Zhang et al., 2003). Sato et al built on the latter result, noting that intra-
epithelial CD8+ T-cells correlated with improved survival in ovarian cancer, but
neither intra-epithelial nor stromal CD4+ TILs were prognostic (Sato et al., 2005).
Examining cell-type ratios, they unearthed that intra-epithelial CD8+/CD4+ ratio
had a significant association with improved prognosis, suggesting that the immune-
suppressive effects of CD4+ TILs can limit the beneficial anti-tumour impact of
CD8+ TILs, underlining the need for a nuanced understanding of the relationship
between TIL density and prognosis. In addition, several authors have suggested

Chapter 1 Introduction
49
schemes to integrate TIL density with PDL1 expression to refine prediction of CPI
sensitivity (Teng et al., 2015; Zhang and Chen, 2016).
1.5.1.2 Organisation
In a seminal paper, Galon and colleagues performed immunostaining of colorectal
tumours (n=415), classifying the T-cells as located in the centre of tumours (CT) or
at the invasive margin (IM) (Galon et al., 2006). Their analysis demonstrated that
the density and location of immune cells in colorectal tumours associated with
survival outcomes more strongly than TNM staging (Figure 1-5). Subsequent work
developed the “immunoscore” as a diagnostic scheme incorporating the type,
density, and location of immune cells (Galon et al., 2013). An international
consortium is currently validating the IHC-based clinical assay (Galon et al., 2014).
The binary CT/IM classification may be further refined in future. For example, a
recent immunofluorescence analysis of kidney tumours, linked the organisation of
stem-like CD8+ T-cells in intra-tumoural “antigen-presenting niches” to improved
progression-free survival (Jansen et al., 2019).

Chapter 1 Introduction
50
Figure 1-5 Immune contexture The immune contexture provides a scheme to classify tumours according to the density, organisation, functional state, and composition of the TME. Here four tumours are shown to illustrate how this multi-dimensional scheme can provide a nuanced portrait of cancer ecology. Using density as a metric of CD8+ T-cell infiltration, the two central tumours appear identical. However, the integration of spatial information in the form of T-cell organisation reveals the left-middle tumour is immune excluded, with stromal nests shielding the cancer cells from T-cells, and might require the inhibition of fibroblast-secreted factors for effective immune clearance. By contrast, the right-middle tumour is immune inflamed, with T-cells in close proximity with cancer cells. Further classifying CD8+ T-cells as T-effector (PD1-low) or T-exhausted (PD1-high) shows that the middle-right tumour is infiltrated by checkpoint-expressing T-cells that might respond well to checkpoint blockade immunotherapy. Lastly, profiling the composition of other cells present in the TME, identifies that the left two tumours do not contain dendritic cells, and might require treatment using immune adjuvants to enhance the function of antigen-presenting cells.

Chapter 1 Introduction
51
1.5.1.3 Functional state
The characterization of T-cell “quality” reveals that only a subset of TILs is typically
responsible for tumour recognition potential. RNA-Seq analysis of TILs sourced
from NSCLC tumours (n=11) discovered that the subset of PD1-high TILs had
higher T-cell receptor (TCR) clonality, and upregulated cell cycle and division
pathways, suggesting antigenic stimulation (Thommen et al., 2018). The presence
of the subset of PD1-high cells was strongly predictive for CPI response and
survival in a small anti-PD1 treated cohort (n=21 stage IV NSCLC patients).
Similarly, the presence of a subset of CD8+ T-cells, with a clonally expanded TCR
repertoire and displaying an exhausted tissue-resident memory phenotype, was
associated with overall survival in head and neck cancer (Duhen et al., 2018). A
single-cell RNA-Seq (scRNAseq) study of >6,000 T-cells isolated from breast
tumours verified significant heterogeneity in TIL population (Savas et al., 2018).
Features of tissue-resident memory differentiation correlated better with improved
survival than CD8 expression alone. Moreover, this signature was enriched in
responders to PD1-inhibitor therapy in an external dataset of melanoma patients.
Overall, these analyses highlight the importance of qualitative differences in CD8+
T-cell subsets for predicting clinical outcomes (Figure 1-5).
1.5.1.4 Composition
The cellular composition of the TME, beyond T-cells, influences the immune
response and can shape clinical outcomes. For example, in NSCLC CD8+ T-cells,
M1 macrophages and tertiary lymphoid structures, have been associated with good
prognosis (Dieu-Nosjean et al., 2008; Goc et al., 2014; Ohri et al., 2009), whereas
T-regs and M2 macrophages have been associated with poor survival outcomes
(Hirayama et al., 2012; O’Callaghan et al., 2015). Moreover, a study of syngeneic
hypermutated gliomas indicated resistance to CTLA4-inhibitor therapy was driven
by macrophages (Aslan et al., 2020). In a PDL1-inhibitor trial of patients with
metastatic urothelial cancer, non-responders were enriched for fibroblast-secreted
TGF-β signalling, contributing to immune exclusion (Mariathasan et al., 2018). The

Chapter 1 Introduction
52
cellular composition of the TME can potentially be leveraged for the rational design
of combination immunotherapies (Figure 1-5) (Smyth et al., 2016).
1.5.2 Environment-mediated drug resistance
The TME can play an active role in determining responses to genome-targeted
therapies. Abnormal adhesion to the extracellular matrix (ECM) can re-wire
signalling pathways within cancer cells, including response to drug therapy. In a
cohort of patients with small-cell lung cancer (n=16), tumours with an extensive
fibronectin matrix had significantly shorter overall survival, and adherence to the
integrin ECM protein inhibited the apoptotic response of cancer cells to
chemotherapy (Sethi et al., 1999). Similarly, ECM reorganisation and collagen VI
over-expression was observed in cisplatin-resistant ovarian tumours (Sherman-
Baust et al., 2003). An in vitro experiment of a breast cancer cell line co-cultured
with fibroblasts demonstrated exceptional protection to dual targeted therapy
(EGFRi + HERi), which was abrogated by the removal of the ECM component
hyaluronic acid (Marusyk et al., 2016).
Factors secreted by stromal cells can underlie drug resistance. Screening 35 anti-
cancer drugs against in vitro co-cultures, formed of 45 cancer cell lines with 23
stromal cell-types, revealed that 65% (15/23) of stromal cell-types were associated
with environment-mediated drug resistance (EMDR) (Straussman et al., 2012).
Focussing on resistance to BRAFi in a melanoma cancer cell line, Straussman and
colleagues identified stromal HGF expression conferred resistance. In a similar
screen of 41 kinase-addicted cancer cell lines, treated with targeted therapies,
receptor tyrosine kinase (RTK) ligands (HGF, FGF, NRG1 and EGF) broadly
rescued cell viability (Wilson et al., 2012). Drug-induced damage in stromal cells
can trigger re-wiring of cancer cells. Treating primary prostate fibroblasts with
genotoxic drugs, Sun and colleagues observed that WNT16B secretion was
induced in response to DNA damage (Sun et al., 2012). Similarly in colorectal
cancer, chemotherapy-treated fibroblasts secreted IL-17A, increasing the renewal
and invasion of colorectal cancer stem cells (Lotti et al., 2013).

Chapter 1 Introduction
53
EMDR can also be driven by immune cell subsets. In a mouse model of
gastrointestinal stromal tumours, a KIT inhibitor reduced tumour cell expression of
Ido, inducing the activation of CD8+ T-cells and apoptosis of T-regs (Balachandran
et al., 2011). In a cohort of patients with gastrointestinal stromal tumours (n=36),
sensitive tumours had a greater ratio of intra-tumoural CD8+ T-cells to T-reg cells,
and this correlated with IDO protein expression. In BRAF-mutant melanoma,
treatment with BRAFi/MEKi induced macrophage proliferation and secretion of TNF
(tumour necrosis factor)-α, fostering drug resistance (Smith et al., 2014).
Overall, multiple components of the TME can support the evolution of resistance
mutations in drug-sensitive cancer cells, by providing a safe haven for the
emergence of minimal residual disease during therapy (Meads et al., 2009).
1.5.3 Immunoediting
An evolving tumour has multiple roads to immune freedom. A previous section has
mentioned microenvironmental mechanisms, including the induction of an
exhausted T-cell phenotype, and the recruitment of stromal cells to exclude
cytotoxic immune cells from the TME (1.5.1). Here, I discuss cell-intrinsic
mechanisms of escape from immune-surveillance.
Robert Schreiber proposed the cancer immunoediting hypothesis to explain the
dual role of the immune system, initially acting as an external tumour suppressor
then actively sculpting the tumour to facilitate acquisition of the immune evasion
hallmark (Schreiber et al., 2011). First the elimination phase, in which lymphocytes
and IFN- γ collaborate to selectively destroy cancer cells, as an extrinsic
mechanism of tumour suppression. Then the equilibrium phase, wherein cancer
cells can survive under immune surveillance, but in a restricted capacity. And lastly
the escape phase, involving the immune-mediated selection and outgrowth of
tumour subclones with decreased immunogenicity, and an abrogation of the
immune response.
Cancer NGS datasets have revealed signals of immunoediting in human tumours.

Chapter 1 Introduction
54
Rooney and colleagues developed a novel metric to quantify the depletion of
neoantigens in a pan-cancer analysis of data from TCGA (Rooney et al., 2015).
First they estimated the observed ratio (“O”) of neoantigens, by dividing the number
of predicted MHC (major histocompatibility complex)-binding point mutations from
the total number of non-synonymous point mutations. Then this was compared with
an expected ratio (“E”), using a null model calculated from the rate of synonymous
point mutations. Using this “O:E” metric, Rooney and colleagues detected
neoantigen depletion in 35% (7/20) of the datasets assessed, with the most
substantial depletion observed in colorectal cancer and clear-cell kidney cancer. In
a separate analysis of TCGA data, Davoli and colleagues reported that high SCNA
tumours had less neoantigen editing (increased O:E ratio), suggesting aneuploidy
decreases immune selective pressure, possibly by decreasing the relative
concentration of neoantigens and altering flux through the proteasome (Davoli et
al., 2017). Applying the O:E metric to paired primary-metastasis samples from two
patients with colorectal cancer, Angelova and colleagues observed that highly
immune infiltrated metastatic samples tended to undergo neoantigen depletion
(Angelova et al., 2018). Moreover, longitudinal sampling pre- and post-treatment
has shown neoantigen loss under the selective pressure of immunotherapies,
including adoptive T-cell treatment (Verdegaal et al., 2016) or CPI drugs
(Anagnostou et al., 2017).
In future, classifying tumours according to the quality of individual neoantigens, or
by immunoediting phase, might help reduce the risk of tumour escape by editing of
vital immunogenic signals (McGranahan and Swanton, 2019; Schumacher and
Schreiber, 2015).

Chapter 1 Introduction
55
1.6 Outline of the thesis
1.6.1 Summary of background information
Molecular biomarkers hold the translational promise of unmasking distinct disease
subtypes beyond clinical descriptors such as tumour TNM staging. Recent
examples include a TNM-“Biology” scheme for prognostication in lung cancer
(Kratz et al., 2019), or a TNM-“Immune” classification incorporating the
immunoscore into colorectal cancer diagnosis (Galon et al., 2014). Yet clinical
adoption is hindered by the reproducibility crisis for cancer biomarkers (Sawyers,
2008).
Refining molecular biomarkers in the light of the evolutionary and ecological
features of cancer (Maley et al., 2017) may help overcome these challenges
(Figure 1-6). Specific knowledge gaps in the literature, which preclude this goal,
include:
1) An understanding of the mechanisms underlying non-genetic ITH,
specifically the link between genetic and transcriptional diversity within
individual tumours;
2) A solution to the diagnostic challenge of tumour sampling bias that is
compatible with existing pathology workflows;
3) A strategy to characterize the immune contexture of tumours with clinical-
grade accuracy;
4) Approaches for the systematic discovery of evolutionary constraints,
specifically whether mutational timing is considered in analyses of epistatic
interactions between genes.

Chapter 1 Introduction
56
Figure 1-6 Cancer biomarkers: past, present and future A, Traditional indicators of clinical outcomes include tumour staging, which was widely adopted in the 1940s, and still universal today despite being an imperfect predictor of survival risk (see 1.2.1). B, The advent of molecular oncology has moved the needle for cancer diagnostics, identifying novel markers of clinical outcomes encoded in the cancer genome or the tumour microenvironment. However, exciting research biomarkers typically fail to be clinically adopted (see 1.2.3). In this thesis, cancer evolutionary (C) and ecological (D) principles will be incorporated into existing approaches to molecular biomarker design.

Chapter 1 Introduction
57
1.6.2 Thesis aims
To pursue the hypothesis that integrating evolutionary and ecological features
could improve the performance of molecular cancer diagnostics, four studies were
conducted in this thesis:
1) The level of transcriptional diversity within individual NSCLC tumours was
quantified, using a novel metric. This measure was related to mechanisms of
cancer genome evolution, and sampling bias for existing prognostic biomarkers.
2) To address the sampling bias problem, a homogeneous expression biomarker
was derived and validated.
3) Molecular profiles of stromal cell subsets were generated from patients with
NSCLC. This dataset revealed phenotypic adaptation in the TME and paved the
way for high-fidelity cell-type-specific signatures.
4) The impact of branching clonal architecture on the detection of epistatic
interactions was assessed in a pan-cancer analysis
This work aims to provide pragmatic ways to refine molecular portraits of cancer,
towards realising their full translational potential.

Chapter 2 Materials and Methods
58
Chapter 2. Data & Methods
2.1 Introduction
Deciphering cancer genomes through an evolutionary or ecological lens may move
the needle for molecular diagnostics, as discussed in the previous chapter. In this
chapter I describe the bioinformatics and experimental methods used in this thesis.
First, an overview is provided of the pre-processed DNA and RNA datasets
accessed. Second, the bioinformatics methods used for analysis are outlined.
Lastly, the experimental methods used to isolate and RNA profile
microenvironmental cell-types from lung tissue are described.
2.2 Data
2.2.1 TRACERx multi-region NSCLC cohort
Tumour samples and clinicaldata were collected from 100 patients with NSCLC
enrolled in the TRACERxLung study and subjected to complete surgical resection
with curative intent (Jamal-Hanjani et al., 2017).The TRACERx study (accession
code: NCT01888601) is sponsored by University College London (UCL/12/0279)
and has been approved by an independent research ethics committee
(13/LO/1546).
2.2.1.1 Whole exome sequencing
Processing of WES was performed by Gareth A Wilson, Nicholas McGranahan,
Nicolai J Birkbak, and Thomas BK Watkins. Exome capture was performed on 1-
2μg of DNA isolated from genomic libraries with median insert size of 190bp for
each tumour and matched germline sample. A customized Agilent Human All
Exome V5 kit was used according to the manufacturer’s protocol. Samples were
100bp paired-end multiplex sequenced on the Illumina HiSeq 2500 and HiSeq
4000 at the Advanced Sequencing Facility at The Francis Crick Institute. The
median sequencing depth was 431 (range 83-986) for tumour regions and 415
(range 107-765) for matched germline.

Chapter 2 Materials and Methods
59
Raw paired-end sequencing reads were aligned to hg19, including all contigs,
obtained from the GATK bundle (v2.8) using bwa mem (bwa-0.7.8). Files from the
same patient region were cleaned, sorted, merged, and duplicate reads removed
using Picard tools (v1.107). SAMtools mpileup (0.1.19) was used to find non-
reference positions in tumour and germline samples. Bases with low phred score
(<20) or reads with low mapping quality scores (<20) were removed. Somatic
variants were identified using VarScan2 somatic (v2.3.6) and extracted using
VarScan2 processSomatic (Koboldt et al., 2012). All SNV calls were filtered for
false positives using VarScan2’s fpfilter.pl script. All indel (small insertion/deletion)
calls in reads classified by VarScan2 as “high confidence” were kept for
downstream filtering. Additionally, MuTect (v1.1.4) was used to identify SNVs
(Cibulskis et al., 2013). These variants were filtered according to the filter
parameter “PASS”. To avoid false positive variant calls, additional filter steps were
taken. Variants called by both VarScan2 and MutTect were considered true
positives if the variant allele frequency (VAF) was >2%. If the variant was only
identified by VarScan2, a VAF of >5% was required. Furthermore, the sequencing
depth in each region was required to be >=30 and >=5 sequence reads had to
support the call. To ensure the variant was not a germline event, the number of
reads containing the variant in the germline data had to be <5 and VAF <=1%. To
utilize the multi-region sequencing aspect of the cohort, individual mutations called
across each region from the same tumour were compared. The threshold for
detection of a somatic variant in one tumour region was reduced to VAF >=1% if
the same variant had been detected at the VAF>=5% in another tumour region
from the same tumour. Indels were filtered using the same parameters as SNVs,
except >=10 reads had to support the variant call and the region had to have a
sequencing depth >=50. All variants were annotated using Annovar (Wang et al.,
2010) and COSMIC (v75).
Varscan2 copynumber was run to generate copy number data from paired tumour-
normal samples, which produced per-region log-ratio (logR) values, that were
subsequently GC corrected (Koboldt et al., 2012). Homozygous and heterozygous
single nucleotide polymorphisms (SNPs) were identified from the germline sample
using Platypus (v0.8.1) (Rimmer et al., 2014). The B-allele frequency (BAF) of each

Chapter 2 Materials and Methods
60
SNP was calculated as the proportion of the reads at that position that contained
the variant base. The logR and BAF values were used with ASCAT (v2.3) (Loo et
al., 2010) in order to generate segmented allele-specific copy number data, purity,
and ploidy estimates. Gene-level amplifications were called if the log2(mean gene
copy number/ploidy) was >1. Gene-level deletions were called if the log2(mean
gene copy number/ploidy) was <-1. To determine genome-wide copy-number gain
and loss, copy-number data foreach sample were divided by the sample mean
ploidy, then log2 transformed. Gain and loss were defined as log2[2.5/2] and
log2[1.5/2], respectively. Gene-level clonal copy-number gain and loss were
defined as all regions from an individual tumour showing either gain or loss, in the
same direction. Gene-level subclonal copy-number gain and loss were defined as
at least one region (but not all regions) from an individual tumour showing copy-
number gain or loss. Only subclonally gained or lost copy-number segments were
used to analyze the effect of copy-number alterations on gene expression. To
ensure proper copy-number variation, only samples with an absolute copy-number
difference of 0.5 ona log2 scale were included. Tumour purity was also quantified
using ASCAT (Loo et al., 2010).
To estimate whether mutations were clonal or subclonal, a modified version of
PyClone was used (Roth et al., 2014). For each mutation, an observed cancer cell
fraction (CCF, obsCCF) and a phylogenetic CCF (phyloCCF), which took into
consideration any subclonal copy number events potentially altering the CCF, was
calculated. Mutations were clustered using PyClone Dirichlet process clustering
2.2.1.2 RNA sequencing
RNA-Seq processing was performed by Nicolai J Birkbak and Rachel Rosenthal.
RNA was extracted from the TRACERx 100 cohort using a modification of the
AllPrep kit (Qiagen), as previously described (Jamal-Hanjani et al., 2017), and RNA
integrity was assessed by TapeStation (Agilent Technologies). Of the cohort of 100
TRACERx tumours, RNA samples of sufficient quality (RNA integrity score ≥ 5)
were obtained for 174 regions from 68 tumours, and were sent to the Oxford
Genomics Centre for whole-RNA (RiboZero- depleted) paired-end sequencing. Of

Chapter 2 Materials and Methods
61
these, at least two regions were available from 48 tumours, yielding the TRACERx
RNA M-Seq cohort.
Alignment was performed using the STAR package (Dobin et al., 2013) (version
2.5.2b), to map reads to the human genome (GRCh37/hg19). Transcript
expression was quantified using the RSEM package (Li and Dewey, 2011) (version
1.3.0) to generate count and transcript per million (TPM) expression values. An
expression filter was applied, keeping genes with an expression value of at least 1
TPM in at least 20% (30/156) of tumour samples in the TRACERx multi-region
RNA-Seq dataset. In total, 16,286 genes were filtered out of the 25,343 unique
genes outputted by RSEM. Lastly, a variance stabilizing transformation was applied
to counts from filtered genes using the DESeq2 package (Love et al., 2014)
(version 1.14.1), assuming a negative binomial distribution for count values, to
output homoscedastic and library size-normalized count values.
2.2.2 TCGA
2.2.2.1 RNA-Seq data for NSCLC patients
Pre-processed RNA-Seq and clinical data were downloadedfor 959 patients with
NSCLC (469 lung adenocarcinoma, LUAD; plus 490 lung squamous cell
carcinoma, LUSC) enrolled in the TCGA research network lung trials (The Cancer
Genome Atlas Research Network, 2014, 2012) using the TCGA2STAT package
(Wan et al., 2016) (version 1.2). An expression filter was applied, keeping genes
with at least 0.5 counts per million in at least two tumour samples, before
normalized count values were obtainedfor filtered genes using a variance-
stabilizing transformation from the DESeq2 package (Love et al., 2014) (version
1.14.1).
2.2.2.2 Whole exome sequencing data for nine cancer-types
Processing of WES was performed by Saioa López. Whole exome-sequencing
data was accessed from the TCGA data portal for 3,545 patients from nine major
cancer-types. From the TCGA repository, raw.bam files were downloaded and
processed through the TRACERx pipeline (Jamal-Hanjani et al., 2017). BWA-MEM

Chapter 2 Materials and Methods
62
was used to align the reads to the reference genome (hg19). Platypus (Rimmer et
al., 2014) was used for SNP calling on the germline, and Varscan2 (Koboldt et al.,
2012) and MuTect (Cibulskis et al., 2013) for somatic mutation calling. Functional
annotation of genomic variants was performed using ANNOVAR (Wang et al.,
2010). Purity, ploidy and copy number profiles of tumour cells were obtained with
ASCAT (Loo et al., 2010), using the matching germline data. Mutations in regions
of loss-of-heterozygosity (LOH) were timed as early or late based on the mutation
and major allele copy number. Following a conservative approach, early mutations
were considered as those with a mutation copy number ≥1.75 and a major allele
copy number ≥1.75. Mutations were classified as late if they had a mutation copy
number of ≤1.25 and major allele copy number of ≥1.75. Clonal mutations that
could notbe timed were classified as unknown. Mutations were defined as
mutations in LOH if the minor allele copy number was <0.25.
2.2.3 Uppsala II NSCLC cohort
Pre-processed Uppsala RNA-Seq and clinical data were downloaded for 170
patients with NSCLC (103 LUAD plus 67 LUSC) enrolled in the Uppsala NSCLC II
cohort (Djureinovic et al., 2016) from the Gene Expression Omnibus (accession
code: GSE81089). ENSEMBL gene IDs were converted to HUGO Gene
Nomenclature Committee IDs using the biomaRt package (Durinck et al., 2009)
(version 2.30.0), and maximum values were selected for multi-mapping probes.
Genes identified as lowly expressed in the TRACERx RNA-Seq dataset were
filtered, then a variance-stabilizing transform was applied using the DESeq2
package (Love et al., 2014) (version 1.14.1) to output normalized count values.
Additional clinical information was provided in private communication with the
authors; this included adjuvant treatment status, patient age, World Health
Organization (WHO) performance status, smoking status, patient gender and Ki67
staining.
2.2.4 Microarray NSCLC cohorts
Microarray data (.RMA files) and clinical data were downloaded from the Gene
Expression Omnibus for four patient cohorts: 442 patients with LUAD enrolled by
Shedden et al. (Shedden et al., 2008) (GSE68465); 85 patients with LUAD enrolled

Chapter 2 Materials and Methods
63
by Rousseaux et al. (Rousseaux et al., 2013) (GSE30219); 147 patients with LUAD
enrolled by Okayama et al. (Okayama et al., 2012) (GSE31210); and 127 patients
with LUAD enrolled by Der et al. (Der et al., 2014) (GSE50081). Affy IDs were
mapped to HUGO Gene Nomenclature Committee IDs, and the ‘best’ probe was
selected using the Jetset package (Li and Dewey, 2011) (version 3.4.0).
2.2.5 MET500
Stefan Boeing performed alignment and transcript counting for the MET500 RNA-
Seq data. Gene expression data were downloaded via dbGaP (accession number:
phs000673.v2.p1.) for metastatic samples from patients in the MET500 cohort
(Robinson et al., 2017) with LUAD primary tumours and RNA-Seq data available (n
= 8). Alignment was performed using the STAR package (Dobin et al., 2013)
(version 2.5.2) to map reads to the human genome (Ensembl GRCh38-release-89).
Transcript expression was quantifiedusing the RSEM package (Li and Dewey,
2011) (version 1.3.0) to generate count expression values. Normalized count
values were obtained using a variance-stabilizing transformation from the DESeq2
package (Love et al., 2014) (version 1.14.1).
2.2.6 Pan-cancer prognostic score datasets
2.2.6.1 PRECOG
Pan-cancer gene-wise prognostic values were downloaded from the PRECOG
resource (http://precog.stanford.edu). Gentles et al. (Gentles et al., 2015) had
applied univariate Cox regression to microarray data from ~18,000 tumours across
39 cancer types, quantifying gene-wise survival associations as z scores (a |z|
score > 1.96 is equivalent to a two-sided P < 0.05).
2.2.6.2 Human Pathology Atlas.
As part of the Human Protein Atlas effort (www. proteinatlas.org/pathology), Uhlen
et al. (Uhlen et al., 2017) had calculated gene-wise survival associations as log-
rank P values for RNA-Seq datasets from 17 different cancer types. The pan-
cancer gene-wise prognostic values were downloaded as supplementary table 6
from the original publication.

Chapter 2 Materials and Methods
64
2.2.7 Single-cell RNA-Seq datasets
2.2.7.1 Lambrechts et al
Lambrechts et al. (Lambrechts et al., 2018) performed single-cell RNA-Seq on
52,698 cells sourced from five patients with NSCLC, then defined seven clusters of
stromal cell genes and provided a per-cluster expression measure for every gene.
Gene-wise relative expression levels were downloaded as supplementary
information from the original publication.
2.3 Bioinformatics analyses
2.3.1 Statistical analysis
All statistical tests were performed in R (version 3.3.1).No statistical methods were
used to predetermine sample size. All statistical tests were two-sided, unless
otherwise stated.
2.3.1.1 Correlation analysis
Testsinvolving correlations were performed using cor.test with either Spearman’s
method or Pearson’s method, as specified. Tests involving comparisons of
distributions were performed using wilcox.test or t.test, as stated.
2.3.1.2 Survival analysis
Hazardratios and P values were calculated using the survival package
(https://CRAN.R- project.org/package=survival; version 2.41.3), through univariate
ormultivariate Cox regression analyses, as stated. Kaplan–Meier plots were
generated using the survminer package (https://CRAN.R-
project.org/package=survminer; version 0.4.2). Meta-analysis was performed using
the rmeta package (https://CRAN.R-project.org/package=rmeta; version 3.0).

Chapter 2 Materials and Methods
65
2.3.2 Gene expression analysis
2.3.2.1 Clustering
Hierarchical clustering was performed using complete linkage and Euclidean
distance, with the ward.D2 setting in the “hclust” function in the R package stats.
Principal component analysis (PCA) was performed using the “prcomp” function
from the stats R package. Uniform Manifold Approximation and Projection (UMAP)
was performed using the umap R package (McInnes et al., 2018).
For pairwise correlation analysis, using the Spearman correlation coefficient, first a
correlation matrix of Spearman’s rho was calculated between all samples. Then
correlations were converted to a distance metric (1 – ρ). Lastly hierarchical
clustering was performed (Lance–Williams dissimilarity update formula, average
linkage). The resulting dendrogram tree of clustering similarities was constructed
using the neighbor-joining approach in the ape package in R (Paradis et al., 2004),
based on pairwise Spearman correlational distances between samples.
2.3.2.2 Differential expression analysis
Differential expression analysis was performed on raw counts from RSEM using
the DESeq2 package (Love et al., 2014) (version 1.14.1). Genes were considered
to be expressed differentially by any comparison when the DESeq2 analysis
resulted in an adjusted P value (Benjamini–Hochberg method) less than 0.05 and
an absolute fold change larger than 2.
2.3.2.3 Pathway analysis
Pathway enrichment analysis was performed using the ReactomePA package (Yu
and He, 2016) (version 1.24.0). Significance was evaluated based on a Bonferroni-
adjusted P value < 0.01.
2.3.2.4 Gene set variation analysis
Pathway analyses were performed on the 50 hallmark pathways described in the
Broad molecular signature database (Subramanian et al., 2005). To assign

Chapter 2 Materials and Methods
66
pathway activity estimates to cell-types, I applied the gene set variation analysis
(GSVA) package (Hänzelmann et al., 2013) using standard settings.
2.3.2.5 TME cell-type enumeration
The gene-lists for four marker-gene-based TME scoring methods were accessed
from the original publications as follows:
• From Rooney et al, Supplementary Table 1c signature genes (Rooney et al.,
2015);
• From Davoli et al, Supplementary Table 4d (Davoli et al., 2017);
• From Danaher et al, Supplementary Table 4 selected markers (Danaher et
al., 2017);
• From Bindea et al, Supplementary Table 3 qPCR geners (Bindea et al.,
2013).
2.3.3 Mutual exclusivity analysis
2.3.3.1 TCGA mutation filtering
From TCGA WES data (see 2.2.2.2), nonsense and missense mutations were
selected for use in downstream analysis. Specifically, all mutations with
‘Variant_Classification’ of 3Flank, 3UTR, 5Flank, 5UTR, Frame_Shift_Del,
Frame_Shift_Ins, In_Frame_Del, In_Frame_Ins, Intron, Nonstop_Mutation, RNA,
Silent, Splice_Site, and Translation_Start_Site were removed. Mutations were
further subsetted to candidate driver genes. For this purpose, a pan-cancer driver
list issued by Bailey and colleagues was used (Bailey et al., 2018). From
Supplementary Table 1 of the original publication, genes annotated as “PANCAN”
were selected, yielding a list of 200 oncogenes and tumour suppressor genes.
2.3.3.2 TiMEx and DISCOVER
Point mutation data were arranged in a binary patient-by-gene format for input to
mutual exclusivity detection tools. Pairwise gene-gene mutual exclusivities were
tested using DISCOVER (Canisius et al., 2016) and TiMEx (Constantinescu et al.,
2016); significance was defined as a P-value < 0.05.

Chapter 2 Materials and Methods
67
2.4 Experimental methods
2.4.1 Ex vivo purification of lung stromal cell-types
A cohort of patients with treatment-naïve lung cancer underwent surgical resection
with curative intent in the TRACERx study and at the University of Edinburgh.
Following surgical resection, tumour and paired non-malignant tissue materials
excess to clinical diagnosis requirements were processed in the research lab to
yield single-cell suspensions of stromal cells. TRACERx donors (n=23 NSCLC
patients) were 17 LUAD cases, 5 LUSC cases and 1 other histology. University of
Edinburgh donors (n=5 NSCLC patients) were 4 LUAD cases, and 1 LUSC case.
2.4.2 Stromal cell isolation
Stromal cells were isolated from lung tissue samples using a standard tissue
processing assay, as follows. The sample was placed in a 60mm petri dish, and
Collagenase (Gibco cat No. 17018029) and DNAse (Roche/Sigma cat No.
10104159001) were added in plain RPMI. The sample was cut into the smallest
possible pieces (2-3 mm) using sterile scalpels. Tissue chunks and remaining
media were transferred into a GentleMACS tube (Milteni cat No. 130-096-334),
which was loaded onto a GentleMACS cell dissociator machine with heated cuffs.
The GentleMACS machine incubated and mixed the sample: rapid mixing for 30
secs, then heating at 37 C for 1 hour with constant slow mixing. Next, the sample
was transferred to another tube via a 70um cell strainer, and washed with 5mL
complete cRPMI (only 2% FBS) to make a single cell suspension. The single-cell
suspension was transferred to a 15ml centrifuge tube, under laid with 3ml Ficoll
(Human Ficoll-Paque Plus (GE)/ VWR cat No. 17-1440-03) and centrifuged (at 750
g for 10 minutes, no brake). The buffy coat was collected and transferred to a new
15ml tube, then washed by topping up to 10-15mls with cRPMI. Isolated cells were
centrifuged at 400g for 5 minutes, and resuspended in 3 mls cRPMI. The aliquot
was transferred into a cryotube with freezing media (90% FBS and 10% DMSO;
Sigma, HybriMax cat No D2650-100ML), then frozen at -80 C.

Chapter 2 Materials and Methods
68
2.4.3 Cell sorting and RNA extraction
Cells were thawed and washed twice in PBS before staining with the Zombie NIR
live-dead exclusion kit on ice as per manufacturer instructions
(https://www.biolegend.com/en-us/products/zombie-nir-fixable-viability-kit-8657).
FACS (fluorescence-activated cell sorting) panel master-mixes were then added
directly and cells stained for 20 minutes on ice before 2 washes with ice-cold FACS
buffer (PBS + 2% FBS + 2mM EDTA) and sorting directly into cell lysis buffer (0.8%
v/v Triton-X/H2O) in the presence of 2U/ul RNase inhibitor.
Three multiparameter panels were used for FACS. The antibodies used in each
panel are listed below.
Panel 1: PD1 [BV421], (Biolegend); CD45RA [BV510], (Biolegend); CD45 [BV605],
(Biolegend); CD25 [BV650], (Biolegend); CD27 [BV785], (Biolegend); Vδ1 [FITC],
(Thermo); CD3 [PerCP-Cy5.5], (Biolegend); Vδ2 [PE], (Biolegend); CD4 [PE-
Dazzle-594], (Biolegend);TCRgd [PE-Cy7], (Biolegend);CD103 [APC],
(Biolegend);CD8 [AF700], (Biolegend);Zombie NIR Live-Dead [APC-Cy7],
(Biolegend).
Panel 2: CD11c [BV421], (Biolegend);CD16 [BV510], (Biolegend);CD45 [BV605],
(Biolegend);CD11b [BV650], (Biolegend);CD15 [FITC], (Biolegend);CD3 [PerCP-
Cy5.5], (Biolegend);HLA-DR [PE], (Biolegend);CD14 [PE-Cy7], (Biolegend);CD56
[APC], (Biolegend);CD19 [AF700], (Biolegend);Zombie NIR Live-Dead [APC-Cy7],
(Biolegend).
Panel 3: CD31 [BV421], (Biolegend);CD33 [BV510], (Biolegend);CD45 [BV605],
(Biolegend);CD90 [BV650], (Biolegend);CD15 [FITC], (Biolegend);EpCAM [PerCP-
Cy5.5], (Biolegend);PDGFRb [PE], (Thermo);E-Cadherin [PE-Cy7],
(Biolegend);FAP [APC], (R&D);CD3 [AF700], (Biolegend);Zombie NIR Live-Dead
[APC-Cy7], (Biolegend).

Chapter 2 Materials and Methods
69
Following FACS, RNA was extracted from the sorted cell-types using RNeasy Plus
Micro Kit (Qiagen).
2.4.4 RNA-Sequencing
RNA samples were sent to the Oxford Genomics Centre for Smart-Seq2 library
preparation (Picelli et al., 2014) and whole-RNA (RiboZero depleted) paired-end
sequencing. Stefan Boeing performed alignment and transcript counting. Alignment
was performed using the STAR package (Dobin et al., 2013) version 2.5.2b to map
reads to the human genome (GRCh37/hg19). Transcript expression was quantified
using the RSEM package (Li and Dewey, 2011) version 1.3.0 to generate TPM
expression values.

Chapter 3 Results
70
Chapter 3. RNA intra-tumour heterogeneity: mechanisms and clinical impact
3.1 Introduction
The phenotype of a cancer cell is defined through its transcriptome, which is
sculpted by genetic and epigenetic events. Multi-region RNA profiling studies have
described widespread transcriptomic intra-tumour heterogeneity (RNA-ITH) across
cancer types (Bachtiary et al., 2006; Barranco et al., 1994; Blackhall et al., 2004;
Gyanchandani et al., 2016; Lee et al., 2018; Morrissy et al., 2017; Suda et al.,
2018). How the cancer transcriptome is shaped by genetic ITH, and the broader
implications of RNA-ITH for biomarker discovery, has received little attention to
date.
Early microarray studies demonstrated a mechanistic link between aneuploidy and
gene expression changes in human cancers (Pollack et al., 2002; Tonon et al.,
2005), with karyotype abnormalities giving rise to corresponding alterations in gene
dosage. This correspondence has been further substantiated by recent
proteogenomic characterization (Sinha et al., 2019; Vasaikar et al., 2019), and a
recent pan-cancer analysis of paired RNAseq and WGS data from 1,000 tumours
confirmed SCNAs to be the predominant genetic event, driving 17% of RNA
variation (Calabrese et al., 2020). While the mechanisms of cancer genome
evolution are broadly characterized (see 1.3.3), its relation to transcriptional
diversity within individual tumours is less well-studied. Exploring the genomic
determinants of RNA-ITH may shed light on “functional heterogeneity” – what
proportion of the cancer genome is ancestral, versus encoding transcriptionally
active events. In 1984, Heppner speculated that this might be a complex
relationship, with a “gulf between genotype and phenotype of a cell”, the latter
being an “emergent property” of the direct and pleiotropic actions of many genes
(Heppner, 1984). This could also aid prioritization of events “hard-wired” in tumour
evolution for therapeutic targeting (Morrissy et al., 2017; Rosenthal et al., 2019).

Chapter 3 Results
71
The transcriptional read-out of a tumour can also serve as a clinically informative
molecular portrait (see 1.2.3.1). In breast cancer, for example, prognostic gene
expression signatures have received clinical approval for use discriminating ER+
node-negative patients at high versus low-risk of recurrence (Paik et al., 2004;
Parker et al., 2009; van ’t Veer et al., 2002). Unfortunately, the success of breast
cancer biomarkers is not the general pattern. For example in lung cancer, several
published prognostic gene expression signatures have failed to validate when
tested in independent patient cohorts, and have been criticized for limited clinical
utility beyond current practice standards (Subramanian and Simon, 2010a; Vargas
and Harris, 2016).
A spatially heterogeneous transcriptome can give rise to the diagnostic challenge
of tumour sampling bias, wherein a molecular biomarker yields different predictions
of clinical outcome for the same tumour depending on where the biopsy needle is
placed (see 1.4.1). Given that genetic ITH is pervasive in NSCLC, with a third of
mutations and up to half of chromosomal copy-number changes occurring
subclonally (Jamal-Hanjani et al., 2017), RNA-ITH may be a substantial
confounding factor for the discovery of robust molecular biomarkers in lung cancer.
In this chapter I leveraged the largest cohort of lung cancer patients with paired
multi-region exome- and RNA-seq data explored to date to investigate the causes,
consequences and clinical implications of RNA-ITH. I defined a measure for RNA-
ITH, perform a detailed dissection of its genomic determinants, and assessed its
clinical impact by quantifying the prevalence of tumour sampling bias in lung
cancer.
The results presented in this chapter forms sections of a first-author paper
published during this thesis (Biswas et al., 2019).

Chapter 3 Results
72
3.2 A measure of RNA intra-tumour heterogeneity
3.2.1 Multi-region RNA-Sequencing
Tracking Non-Small-Cell Lung Cancer Evolution through Therapy (TRACERx) is a
prospective cohort study (ClinicalTrials.gov number, NCT01888601) targeting
enrollment of 842 patients with primary NSCLC. Multi-region and longitudinal
tumour sampling is performed on treatment-naïve NSCLC tumours, recruited from
one of thirteen sites in the UK. A primary study aim is to define the relationship
between intra-tumour heterogeneity and clinical outcomes in early-stage NSCLC
(Jamal-Hanjani et al., 2014).
Previously, the results from analysis of WES data from the first 100 NSCLC
patients enrolled in the TRACERx study had been published (Jamal-Hanjani et al.,
2017). From this 100-patient cohort, paired RNA-Seq data was generated where
sample quality allowed. After excluding tumour regions with insufficient RNA quality
(RNA Integrity Number < 5), and including tumours with at least two regions to
analyse, there were 156 tumour regions from 48 TRACERx patients (Figure 3-1).
This multi-region RNA-sequencing cohort (median: 3 regions per tumour; range: 2-
7) was comprised of a mixture of NSCLC histologies: 28 LUAD patients (stage I =
15, stage II = 6, stage III = 7); 14 LUSC patients (stage I = 7, stage II = 6, stage III
= 1); 6 other histology patients (stage I = 2, stage II = 2, stage III = 2).

Chapter 3 Results
73
Figure 3-1 TRACERx lung RNA-Seq cohort Bar plot showing the patient composition of the TRACERx RNA-Seq dataset (n=48 NSCLC patients). TNM tumour stage and adjuvant treatment status (colour) is indicated for LUAD (left panel), LUSC (middle) and other (right) histologies.

Chapter 3 Results
74
3.2.2 Defining RNA-ITH
In order to characterize the mechanisms driving RNA heterogeneity within
individual tumours, I developed gene-level and patient-level metrics for RNA-ITH.
RNA-ITH was quantified using the multi-region RNA-Seq dataset from TRACERx
(156 regions, 48 NSCLC patients). I defined RNA-ITH as follows (Figure 3-2). For a
particular gene (e.g. EDC4) the standard deviation in expression values (count
data, normalised using a variance stabilizing transform) between tumour regions is
calculated for each individual tumour (e.g. patient CRUK003 has 7 regions with
RNA-Seq data available). This yielded values of RNA-ITH that were specific to
individual patients and genes (e.g. ECD4 in CRUK003 has σg,p = 0.075). These
values can then be summarised by taking the median value, either for each gene to
calculate a gene-level RNA-ITH score (e.g. ECD4 has σg = 0.096), or for each
patient giving a patient-level RNA-ITH score (e.g. CRUK004 has σp = 0.483).
Gene-level RNA-ITH scores can then be compared, for example ECD4 (σg = 0.096)
has a lower value than PROM1 (σg = 1.38), indicating ECD4 tends to have a more
uniform expression profile between regions sampled from individual TRACERx
tumours. This suggests ECD4 may be less subject to sampling bias than PROM1,
with potential implications for the design of robust molecular biomarkers. Similarly,
patient-level RNA-ITH scores can also be compared, for example CRUK004 (σp =
0.483) has a higher value than CRUK001 (σp = 0.135). It may be of interest to rank
tumours according to RNA-ITH status. The clinicopathological or genomic forces
driving differing levels of RNA heterogeneity between patients may then be
explored.

Chapter 3 Results
75
Figure 3-2 Strategy to calculate intra-tumour RNA heterogeneity scores at the patient- and gene-level Gene- and patient-specific scores of RNA-ITH (middle, table) were calculated using multi-region RNA-Seq data from the TRACERx cohort (left, bar plots). These scores could then be summarised by gene (right, frequency distribution plots) or by patient (bottom, frequency distribution plots).
While standard deviation has been used previously to quantify RNA-ITH (Morrissy
et al., 2017), other methods have also been applied (Bachtiary et al., 2006;
Blackhall et al., 2004). I considered alternative measures to capture RNA variability
within tumours (Figure 3-3) in the cohort of TRACERx LUAD patients (n=28 LUAD
patients, 89 tumour regions, stage I-III). I found strong correlation between gene-
level RNA-ITH values calculated using standard deviation and either median
absolute deviation (Rs=0.965, P<0.001) or the coefficient of variation (Rs=0.956,
P<0.001).

Chapter 3 Results
76
Figure 3-3 Alternative metrics for RNA-ITH Gene-level RNA-ITH scores, calculated using the standard deviation per tumour then summarised across the cohort, were correlated with alternative RNA-ITH measures: mediation absolute deviation (A) or coefficient of variation (B). Spearman correlation was performed in LUAD patients from the TRACERx cohort (n=28).
I also considered an alternative approach for quantifying RNA-ITH based on
unsupervised hierarchical clustering. Using multi-region RNA-Seq data from
TRACERx tumours (89 regions, 28 LUAD patients, stage I-III), a clustering method
developed by Gyanchandani and colleagues (Gyanchandani et al., 2016) was
applied to calculate gene-level metrics for RNA-ITH (Figure 3-4A). For each
expressed gene (14,009 genes) hierarchical clustering (Manhattan distance, Ward
method) of all tumour regions across the TRACERx cohort was performed. The
proportion of patients with tumour regions assigned to the same cluster was
extracted and plotted for increasing numbers of clusters, from 2 (the minimum
dendrogram cut-point) to 28 (the total number of patients in the cohort). The plotted
curves for each gene varied markedly, taking CKMT2 for example, there was a
sharp decrease to zero in the proportion of patients with all regions clustering
together. By contrast, for HOXC11 the decline in clustering concordance was less
steep, and plateaued at half the patients with all tumour regions in the same
cluster. To capture this variability, gene-level clustering concordance was scored
as the integral of the curve, yielding clustering concordance scores for all
expressed genes (Figure 3-4B).

Chapter 3 Results
77
Figure 3-4 RNA clustering concordance scores Clustering concordance scores calculated in TRACERx. A, For each gene a curve is calculated for the number of patients with all regions in the same cluster against the number of clusters (2-28 clusters). Curves for five genes (minimum=CKMT2, lower quartile=CYSLTR2, median=MCM2, upper quartile=MFSD1, maximum=HOXC11) are shown. B, The summarised clustering concordance scores for all genes, with the five genes from (a) highlighted in red.
Overall, the RNA-ITH metric calculated using standard deviation correlated well
with scores generated using either median absolute deviation or coefficient of
variation. Therefore standard-deviation-based scores were used as the primary
metric for RNA-ITH in subsequent analyses. The clustering concordance score
offered an alternative approach to quantifying RNA-ITH, and was used as a
secondary metric on rare occasions as stated.

Chapter 3 Results
78
3.2.3 Dependence on multi-region sampling, clinicopathological and immune correlates
Previous studies of genetic ITH have described a positive association between
number of regions sampled for an individual tumour and the level of measured ITH
(Gerlinger et al., 2014; Turajlic et al., 2018). This can give rise to the “illusion of
clonality”, wherein mutations may falsely appear ubiquitous due to under-sampling.
Conversely, it is unclear whether measured ITH saturates at a certain number of
sampled regions. The TRACERx cohort of NSCLC patients (156 regions, 48
patients, stage I-III) provided a rich multi-region dataset (median: 3 regions per
patient, range: 2-7 regions) to explore how RNA-ITH estimates for an individual
tumour tracks with the number of regions sequenced.
Simply plotting measures of RNA-ITH against the number of regions sequenced
suggested that the patient-level estimates of RNA-ITH scaled with the number of
regions sequenced (Figure 3-5).

Chapter 3 Results
79
Figure 3-5 Dependence of patient-level RNA-ITH scores on multi-region sampling Correspondence between the number of tumour regions sequenced per tumour and RNA-ITH.
To see how the RNA-ITH estimate for a particular tumour would have impacted by
sampling fewer regions, and evaluate whether this leveling-off point held true for
individual tumours, I performed a down-sampling analysis (Figure 3-6). For a given
tumour (e.g. CRUK0029), one to N biopsies was sampled (N is the total number of
biopsies available for that tumour, e.g. N for CRUK0029 = 7 regions). RNA-ITH
scores were then calculated for all possible combinations of tumour regions (e.g.
for CRUK0029, an RNA-ITH score was calculated for every 2-region combination,
every 3-region combination, and so forth, until a single score was calculated using
all 7 regions available). This analysis indicated that estimates of RNA-ITH tend to
increase with multi-region sampling, plateauing at around four regions sampled per
tumour.

Chapter 3 Results
80
Figure 3-6 Down-sampling analysis of patient-level RNA-ITH scores Scatter-plots showing for a individual tumours (each panel), the down-sampled RNA-ITH scores (y-axis) plotted against the number of regions sampled (x-axis). The lines depict the mean (red line) and standard deviation (blue lines) values. The analysis was conducted for each patient in the TRACERx cohort (n=48 NSCLC patients): one to N regions was sampled and this subset of regions was used to calculate RNA-ITH; this procedure was repeated for all possible subgroups.

Chapter 3 Results
81
Analyses linking RNA-ITH to genetic drivers in the TRACERx cohort (156 regions,
48 NSCLC patients, stage I-III) may be biased if interacting terms, such as tumour
stage or purity, go unaccounted. To identify potential confounding factors, I
assessed the dependence of patient-level RNA-ITH scores on clinicopathological
and immune features. RNA-ITH did not significantly associate with tumour stage or
histology (Figure 3-7).
Figure 3-7 RNA-ITH by tumour stage and histology Examining the dependence of RNA-ITH by tumour stage (A) or histology (V). All group-wise comparisons were did not attain significance (P<0.05). Statistical significance was tested with a two-sided Wilcoxon signed-rank test.
Tumour immune infiltration was scored using an RNA-Seq-based method,
described by Danaherand colleagues (Danaher et al., 2017). RNA-ITH did not
significantly associate with the level of immune infiltration measured for any of the
22 defined subsets (Figure 3-8A). Tumour purity was also quantified using WES
data from TRACERx tumours, using the ASCAT method (Loo et al., 2010), and did
not significantly associate with RNA-ITH (Figure 3-8B). Taken together, these data
imply clinical features and tumour cellular composition were not substantive
confounding factors in my estimation of patient-level RNA-ITH scores. An
alternative approach, taking a random-effect model per sample, could have been
used to incorporate sample-specific purity effects.

Chapter 3 Results
82
Overall, these results highlight the benefit of multi-region sequencing for
uncovering spatial heterogeneity in gene expression, and indicate the estimates of
RNA-ITH were not biased by clinical or immune parameters.

Chapter 3 Results
83
Figure 3-8 RNA-ITH by immune infiltration and tumour purity RNA-ITH scores correlated with immune infiltration scores for 16 cell-types generated from RNA-Seq data using a method developed by Danaher and colleagues (A), and tumour purity inferred from WES data using ASCAT (B). Spearman correlation was performed in the TRACERx cohort (n=48 NSCLC patients).

Chapter 3 Results
84
3.3 RNA heterogeneity reflects chromosomal instability
3.3.1 Genetic correlates of RNA-ITH
I examined the genetic determinants of RNA-ITH by accessing the published
results from WES analyses of the first 100 NSCLC patients enrolled in the
TRACERx study (327 regions, 100 NSCLC patients) (Jamal-Hanjani et al., 2017),
then exploring dependencies in the subset of TRACERx tumours with multi-region
RNA-Seq data available (156 regions, 48 NSCLC patients, stage I-III).
Briefly, SNVs were detected using a consensus of VarScan2 and MuTect calls. The
burden of point mutations was calculated per patient as the total number of non-
synonymous SNVs across all tumour regions. SNVs were also classified as clonal
or subclonal through PyClone clustering, and patient-level summaries of SNV-ITH
were calculated (fraction of subclonal SNVs). RNA-ITH was not associated with
either point mutation burden (Figure 3-9A, Rs=0.23, P=0.12) or mutational
heterogeneity (Figure 3-9B, Rs=0.27, P=0.068).
Segmented allele-specific copy-number states were called using VarScan2 and
ASCAT tools. The overall burden of copy number aberrations was defined as the
proportion of the genome deviating from the tumour ploidy status, calculated as the
average across tumour regions (weighted genome integrity index, wGII). SCNAs
were classified as clonal if present across all regions from each tumour, or
subclonal if absent in at least one region, permitting generation of patient-level
estimates of SCNA-ITH (fraction of subclonal SCNAs). Intriguingly, copy-number
ITH, a proxy measure for chromosome instability, was correlated with RNA-ITH
(Figure 3-9C, Rs=0.54, P=0.00014). By contrast, a static measure of the copy
number aberration burden was not associated with RNA-ITH (Figure 3-9D,
Rs=0.26, P=0.077).
Overall, this suggests “functional” ITH of lung cancer transcriptomes positively
correlates with dynamic and ongoing chromosomal instability, rather than karyotype
complexity per se.

Chapter 3 Results
85
Figure 3-9 Genetic correlates of RNA-ITH The association of RNA-ITH with genetic measures was investigated: non-synonymous mutation burden (A), mutational ITH (B), whole genome integrity index (C), copy-number ITH (D). Spearman correlation was performed in the TRACERx cohort (n=48 NSCLC patients).

Chapter 3 Results
86
3.3.2 Linking chromosomal instability, gene dosage, and prognosis
To dissect the relationship between copy-number ITH and RNA-ITH in greater
detail, I tested whether gene expression tracks subclonal copy-number state at the
level of individual SCNAs.
Mining the WES data, genes with a heterogenous SCNA profile between regions of
an individual tumour were classified as subclonal copy-number gains or losses.
Expression levels for subclonal SCNAs were then compared between copy-number
aberrant and non-aberrant tumour regions. Overall 118,943 paired SCNA and RNA
values were identified in TRACERx (143 regions from 44 NSCLC tumours with
ASCAT data). This analysis revealed SCNA gains or losses distinct to tumour
regions were linked with corresponding alterations in gene expression (Figure
3-10A, P < 2.2 × 10⁻¹⁶).
Analyses of WES data from 100 TRACERx patients reported elevated SCNA-ITH
associates with increased risk of recurrence or death in NSCLC (Jamal-Hanjani et
al., 2017). To explore whether RNA-ITH could mirror and provide a functional read-
out for SCNA-ITH, I investigated its prognostic association in the reduced cohort of
48 TRACERx patients with multi-region RNA-Seq data. However, while patients
with elevated RNA-ITH tended to have poorer disease-free survival outcomes –
with visible splitting of Kaplan-Meier survival curves – this relationship was non-
significant (Figure 3-10B, P=0.094).
Altogether, these data support the hypothesis that RNA-ITH may reflect dynamic
chromosomal instability, the transcribing of heterogeneous aneuploidy karyotypes
into functional ITH, and the selection of subclonal DNA copy-number events.

Chapter 3 Results
87
Figure 3-10 RNA-ITH associations with subclonal chromosomal copy-number changes and prognosis A, Subclonal SCNAs were identified in the TRACERx cohort (n=44 NSCLC tumours with ASCAT calls available) and compared with gene expression. B, Percentages of TRACERx patients who were disease-free according to whether the patients had a high RNA-ITH (above the median) or a low RNA-ITH (below the median) score.

Chapter 3 Results
88
3.4 Tumour sampling bias confounds molecular biomarkers
3.4.1 Literature search for LUAD prognostic signatures
To explore patterns of gene expression associated with patient survival in the light
of inter- and intra-tumour RNA heterogeneity, I performed a literature search to
identify published lung cancer prognostic signatures. Early attempts to derive a
prognostic signature for lung cancer patients treated NSCLC as a homogenous
group (Boutros et al., 2009; Chen et al., 2007; Lau et al., 2007; Wigle et al., 2002;
Zhu et al., 2010). However, most modern approaches, recognising histology is a
potential confounding factor, have focussed on LUAD as the most common NSCLC
subtype. Accordingly I restricted the scope of the study to LUAD prognostic
signatures.
I searched the PubMed database to find literature reporting LUAD prognostic
signatures (Bunn et al., 2014; Subramanian and Simon, 2010a; Zhu et al., 2009).
The text and supplementary tables for each article were manually reviewed.
Signatures developed from genome-wide RNA profiling studies and correlated with
patient survival were considered for inclusion. Critically, if the full gene-list was not
completely specified, then it could not be taken forward for subsequent analysis,
and many signatures were excluded on this basis. As gene names change over
time, several were updated to match the latest HUGO nomenclature to ensure fair
comparison and integration with the TRACERx RNA-Seq dataset.
The literature search identified nine signatures from studies published between
2001 and 2017 (Figure 3-11). Each signature was comprised of 31 genes on
average, though this varied greatly from a four-gene signature (Shukla et al., 2017)
to a 97-gene signature (Beer et al., 2002). A range of RNA technologies had been
used for signature derivation, including six microarray signatures (Beer et al., 2002;
Bianchi et al., 2007; Garber et al., 2001; Krzystanek et al., 2016; Raz et al., 2008;
Wistuba et al., 2013), two RNA-Seq signatures (Bailiang Li et al., 2017; Shukla et
al., 2017), and one qPCR signature (Kratz et al., 2012) identified. Two of these
signatures are available as commercial assays (Zheng and Bueno, 2015), namely

Chapter 3 Results
89
the “Pervenio Lung RS” (Kratz et al., 2012) and “Myriad MyPlan” signatures
(Wistuba et al., 2013).
Figure 3-11 Published LUAD prognostic signatures Bar plot showing the number of genes for each of nine published signatures, plotted in order of publication year. Bars are coloured by the technology used for gene expression profiling in the respective study.
3.4.2 Quantifying the sampling bias of RNA-Seq-based prognostic signatures
I determined the prevalence of sampling bias for RNA-Seq based prognostic
signatures using RNA-Seq data from the cohort of TRACERx LUAD patients (89
tumour regions, 28 LUAD patients, stage I-III).
For the four-gene signature described by Shukla et al (Shukla et al., 2017), model
coefficients from the original publication were applied to TPM data from the multi-
region TRACERx study. A risk-score was calculated for every tumour region, then
the risk thresholds defined in the original publication were used to stratify tumour
regions as either high- or low-risk. Lastly, stratification of patients into more precise
disease subtypes was attempted. If all regions from an individual tumour exhibited
concordant risk classification, patients were labelled as concordant low- or high-

Chapter 3 Results
90
risk; alternatively, patients were labelled as “discordant” if different regions from the
same tumour were classified as harbouring distinct profiles of molecular risk.
Discordant risk classification was observed in 43% of the TRACERx cohort (12/28
LUAD patients), indicating sampling bias was a substantial unaddressed
confounding factor for this signature, potentially limiting its clinical application
(Figure 3-12).
Figure 3-12 Tumour sampling bias for prognostic signature from Shukla et al Molecular risk-scores were calculated in multi-region tumours from the TRACERx cohort (n=28 LUAD patients), using the RNA-Seq signature described by Shukla et al. Risk-scores for all tumour regions is shown for each individual patient (A), and summarised as percentages of patients across the cohort (B). Tumours are classified as concordant low (blue), discordant (gray), or concordant high (red).
Indeed, the high- and low-risk patient stratifications outputted by the signature from
Shukla et al were not informative for prognostication in the TRACERx cohort
(Figure 3-13), though the small number of patients tempers this result. This result
was independent of whether discordant risk tumours were classified based on the
minimum, maximum, or median scoring tumour region, or excluded completely.

Chapter 3 Results
91
Figure 3-13 Prognostic information for prognostic signature from Shukla et al Using the RNA-Seq signature described by Shukla and colleagues, TRACERx tumours (n=28 LUAD patients) were classified as concordant low risk (n=11), discordant (n=12), and concordant high risk (n=5). Prognostic ability was assessed for concordant high- and low-risk tumours, with the discordant tumours classified according to their minimum risk score (A), maximum risk score (B), median risk score (C), or excluded (D). Kaplan-Meier survival curves, statistical significance was tested with a two-sided log-rank test.

Chapter 3 Results
92
The same analysis was conducted for the signature described by Li and colleagues
(Bailiang Li et al., 2017), an RNA-Seq signature that estimates survival risk based
on “immune-related gene pairs”. The 40-gene signature was applied to TRACERx
TPM data, using the median risk-score as the threshold to classify tumour regions.
This revealed discordant classification in 29% of the TRACERx cohort (8/28 LUAD
patients), providing further evidence for the limited clinical utility of existing
signatures (Figure 3-14).
Figure 3-14 Tumour sampling bias for prognostic signature from Li et al Molecular risk-scores were calculated in multi-region tumours from the TRACERx cohort (n=28 LUAD patients), using the RNA-Seq signature described by Li et al. Risk-scores for all tumour regions is shown for each individual patient (a), and summarised as percentages of patients across the cohort (b). Tumours are classified as concordant low (blue), discordant (gray), or concordant high (red).
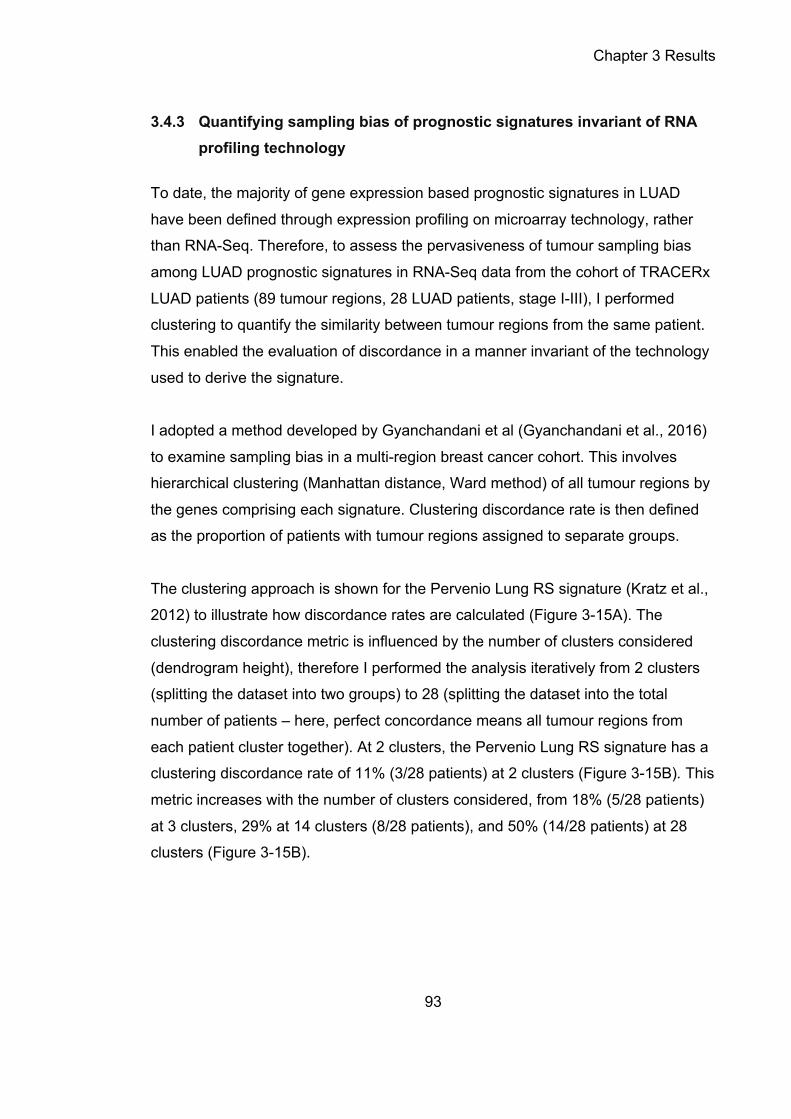
Chapter 3 Results
93
3.4.3 Quantifying sampling bias of prognostic signatures invariant of RNA profiling technology
To date, the majority of gene expression based prognostic signatures in LUAD
have been defined through expression profiling on microarray technology, rather
than RNA-Seq. Therefore, to assess the pervasiveness of tumour sampling bias
among LUAD prognostic signatures in RNA-Seq data from the cohort of TRACERx
LUAD patients (89 tumour regions, 28 LUAD patients, stage I-III), I performed
clustering to quantify the similarity between tumour regions from the same patient.
This enabled the evaluation of discordance in a manner invariant of the technology
used to derive the signature.
I adopted a method developed by Gyanchandani et al (Gyanchandani et al., 2016)
to examine sampling bias in a multi-region breast cancer cohort. This involves
hierarchical clustering (Manhattan distance, Ward method) of all tumour regions by
the genes comprising each signature. Clustering discordance rate is then defined
as the proportion of patients with tumour regions assigned to separate groups.
The clustering approach is shown for the Pervenio Lung RS signature (Kratz et al.,
2012) to illustrate how discordance rates are calculated (Figure 3-15A). The
clustering discordance metric is influenced by the number of clusters considered
(dendrogram height), therefore I performed the analysis iteratively from 2 clusters
(splitting the dataset into two groups) to 28 (splitting the dataset into the total
number of patients – here, perfect concordance means all tumour regions from
each patient cluster together). At 2 clusters, the Pervenio Lung RS signature has a
clustering discordance rate of 11% (3/28 patients) at 2 clusters (Figure 3-15B). This
metric increases with the number of clusters considered, from 18% (5/28 patients)
at 3 clusters, 29% at 14 clusters (8/28 patients), and 50% (14/28 patients) at 28
clusters (Figure 3-15B).

Chapter 3 Results
94
Figure 3-15 Tumour sampling bias for prognostic signature from Kratz et al Discordance rate measured in TRACERx (n=28 LUAD patients) using the qPCR signature described by Kratz et al. A, The dendrogram and heatmap (top) use the expression profiles of the genes-list forming the prognostic signature (middle) to cluster tumour regions (bottom). Patients with tumour regions assigned to

Chapter 3 Results
95
discordant clusters are highlighted (right, bar plots) and calculated as a percentage of all patients from the cohort (middle, pie charts), for a range of clusters (2, 3, 14, 28). B, The fraction of patients with all tumour regions assigned to the same cluster is taken to indicate discordance, and iteratively calculated from 2 to 28 clusters. Dashed vertical lines mark the discordance scores for a range of clusters (2, 3, 14, 28).
I extended the clustering approach to the 9 published LUAD prognostic signatures
identified by the literature search. Discordance rates were calculated for each
signature from 2 to 28 clusters. At 28 clusters the median clustering discordance
rate was 50% (15.5/28 LUAD tumours, range = 18-82%), indicating that half the
tumour regions would be vulnerable of incorrect risk stratification due to sampling
bias (Figure 3-16).
Figure 3-16 Tumour sampling bias for prognostic signatures from nine studies Discordance scores were calculated for nine prognostic signatures in TRACERx (n=28 LUAD patients) using the hierarchical clustering approach. Dashed vertical lines mark the discordance scores for a range of clusters (2, 3, 14, 28).

Chapter 3 Results
96
Taken together, these data suggest sampling bias is a prevalent problem amongst
published prognostic signatures, which may contribute to the low validation rate of
gene expression signatures.

Chapter 3 Results
97
3.5 Conclusions
3.5.1 Summary of findings
The studies of NSCLC patients from the TRACERx study in this chapter have
demonstrated the utility of multi-region sequencing to measure RNA-ITH,
uncovered chromosomal instability as a major underlying mechanism, and
identified tumour sampling bias as a substantial unaddressed challenge for
biomarker discovery in lung cancer (Figure 3-17).
I explored the relationship between aneuploidy and gene dosage heterogeneity at
the level of individual chromosomes, observing gene expression has a 50%
correlation with copy number at the gene level, consistent with previous
observations in human cancer (Pollack et al., 2002; Tonon et al., 2005).
Importantly, this relationship held for cases where SCNA is altered subclonally in
the multi-region dataset. To the best of my knowledge, the transcription of
heterogeneous chromosomal states into functional ITH has not previously been
described in the literature.
The in-depth evaluation of nine published LUAD prognostic signatures revealed
these are subject to significant sampling bias, exhibiting a 50% discordance rate on
average, whereby different regions from the same tumour may be classified as
harbouring distinct profiles of molecular risk. This result greatly expands on a
recent multi-region microarray study of 10 NSCLC patients, reporting discordance
rates of 10-70% for two published NSCLC prognostic signatures (Lee et al., 2018).
In summary, the evidence presented here suggests RNA-ITH correlates with
chromosomal instability and may confound single-biopsy driven biomarker
approaches if unaddressed. Having established that existing signatures may be
limited by sampling bias, I proceed to study the impact of controlling RNA-ITH on
biomarker performance in the next chapter.

Chapter 3 Results
98
Figure 3-17 Chromosomal instability associates with RNA-ITH, giving rise to tumour sampling bias A, In TRACERx, multiple regions are sampled from each individual tumour (marked as R1-R4). The genomic profile of the tumour is shown for a single high-risk prognostic gene (gray). The chromosomal state (“DNA”, gray star), and the corresponding transcriptional read-out (“RNA”, gray transcripts) are indicated. Gene expression signatures score the RNA profile of a tumour biopsy as high-risk (three red regions) or low-risk (one blue region). Only one biopsy is taken for diagnosis in the routine clinical setting (indicated by dashed triangle). This tumour is vulnerable to sampling bias, as the diagnostic biopsy (circle) is taken

Chapter 3 Results
99
from the sole low-risk region. B, A diagnostic tumour biopsy is taken and tested using a prognostic gene expression signature (1), which classifies patients into more precise disease subtypes based on estimated survival risk (2), and helps to inform clinical decision-making (3). While useful in distinguishing high-risk (red) from low-risk (blue) patients, prognostic signatures are confounded by tumour sampling bias (gray), leading to a sub-optimal treatment and follow-up strategy.
3.5.2 Future work
The novel metric developed for RNA-ITH in this chapter was based on the standard
deviation in expression values between multiple regions sampled from an individual
tumour. Future analyses may further hone this RNA-ITH metric, possibly through
explicitly modeling expression levels as a function of spatial coordinates as
described by the SpatialDE tool (Svensson et al., 2018). In addition, my analyses of
RNA-ITH did not incorporate cis-effects (gene expression scales proportional to
copy-number) or trans-effects (gene expression scales disproportionately with
copy-number, typically due to targeting by transcription factors). The inclusion of
this information may further refine the mechanistic linkage between CIN and RNA-
ITH.
While mutation clonality can be inferred from single-sample WES data, using
PyClone for example (Roth et al., 2014), it has been speculated that it would be
difficult to infer RNA-ITH without multi-region RNA-Seq data (Alizadeh et al., 2015).
Yet the extraction of allele-specific expression, using tools such as phASER (Castel
et al., 2016) or Texomer (Wang et al., 2019), may provide a means to quantify
RNA-ITH using single-samples.
The extent to which tumour stromal and immune components influences the
measurement of RNA-ITH from bulk sequencing data is unclear. Accounting for
sample-specific purity could partially address this problem (see 3.2.3). In future, a
definitive solution may be provided by deconvolving cancer from stromal gene
expression in bulk samples (discussed further in section 5.2 of this thesis).

Chapter 4 Results
100
Chapter 4. Designing molecular biomarkers in the light of cancer evolution
4.1 Introduction
Lung cancer is the leading cause of global cancer mortality (Siegel et al., 2019) and
represents a high impact area for precision medicine strategies to improve patient
outcomes (Vargas and Harris, 2016). For the majority of NSCLC patients, adjuvant
chemotherapy remains the first-line therapy of choice (Pignon et al., 2008). As
such, decision-making over adjuvant therapy is informed by prognostic biomarkers.
NSCLC patients are currently stratified for chemotherapy on the basis of TNM
staging (Goldstraw et al., 2016). However, TNM stage is an imperfect predictor, as
patients diagnosed with the same disease stage can have markedly different
clinical outcomes (see 1.2.1). Integrating diagnostic criteria with molecular
correlates of tumour aggressiveness, such as gene expression signatures, may
improve risk prediction in NSCLC, meeting an urgent clinical need (Subramanian
and Simon, 2010a; Vargas and Harris, 2016).
Studies across cancer types have revealed that ITH, which gives rise to the
diagnostic challenge of tumour sampling bias, may preclude the development of
robust prognostic assays from single tumour biopsies (Gerlinger et al., 2012; Gulati
et al., 2015, 2014; Gyanchandani et al., 2016; Lee et al., 2018; Tofigh et al., 2014).
Indeed, in the previous chapter, two RNA-Seq-based prognostic signatures for
LUAD displayed a discordant molecular read-out in 29% and 43% of tumours
(Figure 3-12, Figure 3-14).
In this chapter I set out to address the confounding effects of RNA-ITH in biomarker
derivation, with the aim of providing a pragmatic solution to tumour sampling bias,
and stratifying tumours into groups with distinct evolutionary fates and clinical
outcomes.
The results presented in this chapter forms sections of a first-author paper
published during this thesis (Biswas et al., 2019).

Chapter 4 Results
101
4.2 The status quo for molecular prognostication in lung cancer
4.2.1 The curse of dimensionality for RNA biomarkers
A fundamental challenge for the derivation of prognostic signatures is feature
selection: subsetting from ~20,000 expressed genes to a small number of genes
(<100 genes) that is compatible with use on a clinical platform (Figure 4-1). Feature
selection is fundamentally difficult in such high dimensional space, as noise
predictors reduce ability to recover signal predictors (Altman and Krzywinski, 2018).
In cancer RNA datasets, over-fitting is easy and it is possible to identify numerous
equally significant signatures (Boutros et al., 2009). In NSCLC, previous supervised
solutions to this challenge have included data-driven approaches – such as simply
correlating with survival (Shukla et al., 2017) – and knowledge-based approaches,
selecting immune (Bailiang Li et al., 2017) or cell cycle progression genes (Wistuba
et al., 2013) (Figure 4-1).

Chapter 4 Results
102
Figure 4-1 Approaches to designing gene-expression biomarkers for lung cancer The design of an expression-based signature typically begins with a genome-wide RNA dataset of thousands of genes (the result of an expensive microarray or RNA-seq experiment). Feature selection (“filtering steps”) is then performed to develop a prognostic or predictive biomarker, typically 5 to 100 genes in length. These signatures are compatible with technologies such as qPCR or Nanostring that are cheaper and have a faster turnaround time, so are much better suited for routine clinical use. Previous solution to the challenge of feature selection include data-driven approaches (e.g. simple Cox regression against survival) or knowledge-based approaches (e.g. using cell cycle genes as a surrogate measure for tumour aggressiveness). Superscript numbers indicate published approaches: 1) (Beer et al., 2002; Bianchi et al., 2007; Krzystanek et al., 2016; Shukla et al., 2017). 2) (Hugo et al., 2016). 3) (Chen et al., 2016; Gubin et al., 2014). 4) (Garber et al., 2001). 5) (Kratz et al., 2012; Raz et al., 2008). 6) (Bailiang Li et al., 2017). 7) (Wistuba et al., 2013). 8) (Rooney et al., 2015). 9) (Johnson et al., 2016). 10) (Ayers et al., 2017). 11) (Jiang et al., 2018).

Chapter 4 Results
103
4.2.2 Factors limiting the clinical adoption of prognostic signatures in lung cancer
A number of factors have been suggested for consideration when developing a
prognostic signature for patients with LUAD. A primary factor is reproducibility: for
clinical use, a biomarker must validation upon testing in independent patient
cohorts (Shedden et al., 2008; Sun et al., 2008). Medical utility is another key
factor, specifically further classifying LUAD patients with stage I disease into risk-
groups has been identified as a high impact area for precision medicine
(Subramanian and Simon, 2010b; Vargas and Harris, 2016). Lastly, demonstrating
utility on routinely collected clinical samples (typically diagnostic samples are
FFPE, rather than fresh-frozen as required by NGS studies) to fast track a
molecular diagnostic test for clinical use (Zhu and Tsao, 2014).
At present, the major contender for clinical adoption in LUAD is the ‘Razor
Genomics’ signature. Over the last decade, this signature has been developed
from research study (Raz et al., 2008), through assay development (Kratz et al.,
2013), to retrospective (Kratz et al., 2012) and prospective (Woodard et al., 2018)
validation studies. A recent study suggested a “TNM-B” (B for biology) diagnostic
scheme, demonstrating how a molecular risk-score might be usefully integrated
with tumour staging in LUAD (Kratz et al., 2019).
There is a prevailing sentiment of disappointment about expression signatures as
biomarkers in LUAD. In 2010, Subramanian and colleagues reviewed 16 prognostic
signatures for NSCLC (Subramanian and Simon, 2010a). Three criteria were
assessed: appropriateness of the study protocol, whether the signature was
validated in an independent dataset, and if the signature was clinically useful
beyond current practice standards (showing risk separation in stage I, improved
predictive value above known risk factors). The authors concluded “none of the
studies succeeded in showing improvement in predictive power for gene
expression signature over and above known risk factors”. In addition, external
testing of two signatures (Chen et al., 2007; Lau et al., 2007) revealed both failed to
maintain a survival association in the sub-group of stage I patients. In a separate

Chapter 4 Results
104
meta-analysis of 42 published NSCLC prognostic signatures, Tang and colleagues
showed that less than half (18/42 signatures) performed significantly better than
randomly generated signatures (Tang et al., 2017).
Tumour sampling bias of LUAD signatures is an unaddressed confounding factor.
A multi-region microarray study of 35 tumour regions from 10 NSCLC patients,
found a previously published 6-gene prognostic signature (Boutros et al., 2009)
was discordant in 1/10 tumours, and another tested signature (Zhu et al., 2010)
was discordant in 7/10. In the previous chapter of this thesis, the sampling bias of
nine prognostic signatures for LUAD was assessed. The average discordance rate
was 50% (see 3.4); the ‘Razor Genomics’ signature (Kratz et al., 2012) was
discordant in 50% of tumours (14/28 patients). Conceivably, refining feature
selection to mitigate sampling bias might improve signature performance, and
could represent a major technical advance for the design of molecular biomarkers.

Chapter 4 Results
105
4.3 Defining clonal transcriptomic signals in lung cancer
4.3.1 Global analysis of RNA heterogeneity
A method to stratify patients by prognosis based on gene expression must exhibit
three key criteria:
1) it must exhibit sufficient diversity between patients’ tumours (high inter-
tumour heterogeneity), enabling clear stratification into distinct informative
subgroups;
2) it must be robust to sampling bias, whereby it is not heavily influenced by
diversity within tumours (low intra-tumour heterogeneity);
3) it must be reliably prognostic, demonstrated through validation in
independent cohorts.
While both the first and third criteria have previously been considered when
defining prognostic biomarkers, ensuring the stability of a transcriptomic signature
to sampling bias has not been previously been addressed in a systematic fashion,
and this may be a root cause of the low validation rate of lung cancer biomarkers
(Vargas and Harris, 2016).
To explore intra- and inter-tumour RNA heterogeneity (criteria one and two above),
I performed a global unsupervised clustering analysis in the TRACERx dataset
(156 tumour regions, 48 NSCLC patients, stage I-III). After subsetting for the 500
genes with highest variance across all patients and tumour regions, hierarchical
clustering (Euclidean distance, complete linkage) was performed.
In every case, the regions from each individual tumour clustered together,
indicating that the variation of gene expression between regions from the same
tumour was less than the variation between tumours from different patients (Figure
4-2A). A variably selected subset of genes can therefore represent each tumour
with a unique and identifiable expression profile.
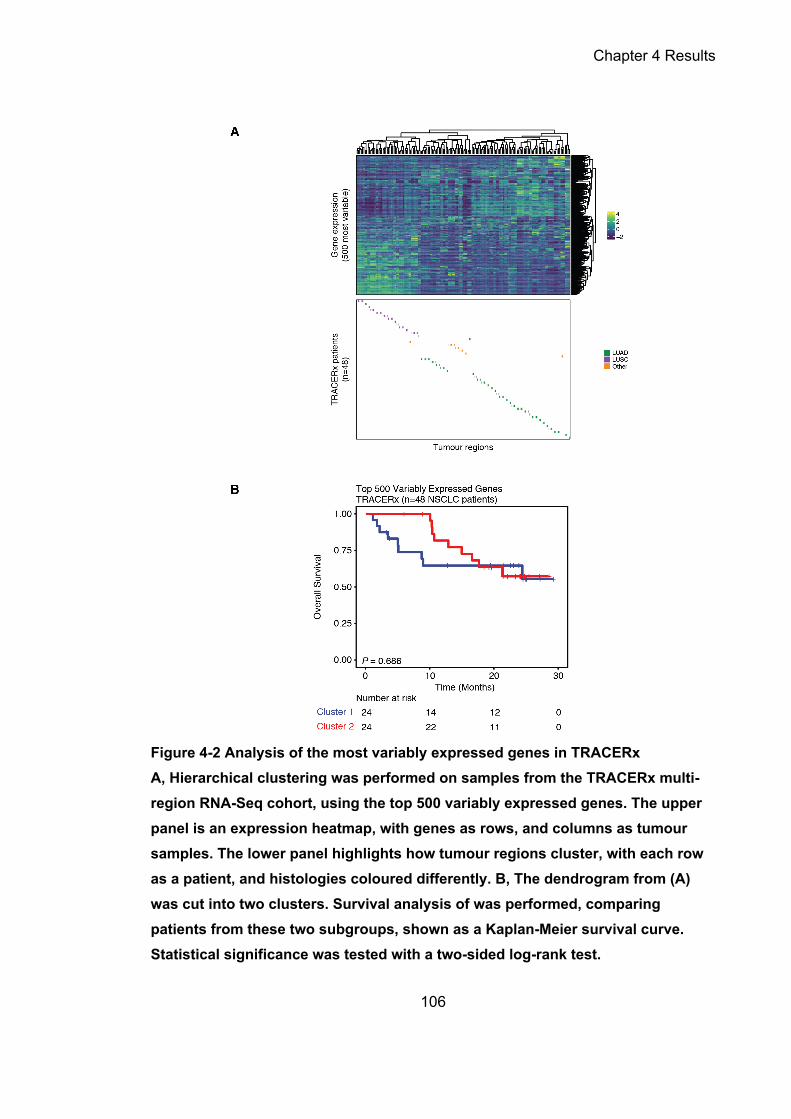
Chapter 4 Results
106
Figure 4-2 Analysis of the most variably expressed genes in TRACERx A, Hierarchical clustering was performed on samples from the TRACERx multi-region RNA-Seq cohort, using the top 500 variably expressed genes. The upper panel is an expression heatmap, with genes as rows, and columns as tumour samples. The lower panel highlights how tumour regions cluster, with each row as a patient, and histologies coloured differently. B, The dendrogram from (A) was cut into two clusters. Survival analysis of was performed, comparing patients from these two subgroups, shown as a Kaplan-Meier survival curve. Statistical significance was tested with a two-sided log-rank test.

Chapter 4 Results
107
However, while the subset of top variant genes may be robust to sampling bias,
they were not prognostic (criteria three above) in the TRACERx dataset. When
tumours were stratified into two groups based on the global clustering analysis,
there was not a significant difference in survival times between the two patient
subgroups (log-rank P = 0.686, Figure 4-2B).
Of interest, the tumour regions from the different NSCLC histologies (LUAD, LUSC,
other) largely clustered separately (Figure 4-2A). This is consistent with the distinct
clustering patterns reported by early single-sample RNA profiling studies examining
the transcriptional differences between LUAD and LUSC histologies (Bhattacharjee
et al., 2001; Takeuchi et al., 2006).
4.3.2 Defining RNA heterogeneity quadrants
In the previous chapter, RNA-ITH scores were derived based on the variance in
gene expression within individual TRACERx tumours (see 3.2.2). Here, I generated
RNA inter-tumour heterogeneity scores to identify variable molecular signals
between TRACERx patients. These two axes of RNA heterogeneity were then
paired to derive a quadrant-based scheme, with the aim of identifying robust
molecular biomarkers.
Estimates of inter-tumour RNA heterogeneity were calculated in the cohort of
LUAD patients from TRACERx (89 regions, 28 LUAD patients, stage I-III). One
region was randomly sampled per patient from the multi-region dataset, to
overcome the confounding effect of considering all regions from a tumour. This
yielded a sham single-region cohort (Figure 4-3A). From the resulting sample set,
inter-tumour heterogeneity scores were calculated per gene as the standard
deviation in expression values between patients. The process of random sampling
was repeated ten times, generating stable estimates of RNA inter-tumour
heterogeneity scores. The TCGA cohort was leveraged to confirm that repeated
random sampling of the TRACERx cohort was representative of a true single-
region cohort. A highly significant positive association (Pearson r = 0.947, P<0.001)

Chapter 4 Results
108
was observed between scores generated in each cohort (Figure 4-3B), indicating
the reproducibility of the approach taken for TRACERx.
Figure 4-3 Inter-tumour RNA heterogeneity scores A, Schematic showing how gene-wise inter-tumour RNA heterogeneity scores were generated via the random sampling of tumour regions from the multi-region TRACERx cohort (89 regions, 28 LUAD patients, stage I-III). B, Association between inter-tumour RNA heterogeneity scores calculated in TRACERx (a sham single-biopsy cohort) and TCGA (a true single-biopsy cohort).
The distributions of gene-level RNA inter- and intra-tumour heterogeneity scores
were compared (Figure 4-4A). Overall, RNA inter-tumour heterogeneity exceeds
intra-tumour heterogeneity in primary NSCLC tumours (Wilcoxon signed P < 2.2e-
16). This is in line with the global analysis of RNA heterogeneity in the previous
section (Figure 4-2A). Next, a scheme was developed to control for levels of inter-
and intra-tumour RNA heterogeneity in biomarker derivation. For each RNA
heterogeneity metric, the distribution was plotted as a density curve and bisected
by the mean, resulting in four RNA heterogeneity quadrants (Figure 4-4B):
1) low inter- and high intra-tumour heterogeneity (Q1 = 798 genes);
2) low inter- and low intra-tumour heterogeneity (Q2 = 9,642 genes);
3) high inter- and high intra-tumour heterogeneity (Q3 = 4,766 genes);
4) high inter- and low intra-tumour heterogeneity (Q4 = 1,080 genes).

Chapter 4 Results
109
Putatively, the 1,080 genes in Q4 harboured the properties of an ideal biomarker,
possessing both low RNA-ITH while remaining informative of differences between
patients.
Figure 4-4 RNA heterogeneity quadrants A, Density curves for RNA inter- and intra-tumour heterogeneity scores are shown on a log-scale. B, RNA inter-tumour (x-axis) and intra-tumour (y-axis) heterogeneity quadrants, calculated in TRACERx, plotted on the axes as density curves. The plot is divided into quadrants by the mean intra-tumour (dashed horizontal line) and mean inter-tumour (dashed vertical line) heterogeneity scores. The quadrants are numbered and coloured (Q1=red, Q2=purple, Q3=yellow, Q4=blue), with the number of genes per quadrant indicated. The RNA heterogeneity scores displayed were calculated from TRACERx LUAD patients (89 regions, 28 LUAD patients, stage I-III). RNA heterogeneity quadrants are indicated by colour: Q1 = red; Q2 = purple; Q3 = yellow; Q4 = blue.
Please note: the procedures described here were applied to TRACERx LUAD
patients (89 regions, 28 LUAD patients, stage I-III), enabling a focus on LUAD
biomarker discovery; separately all TRACERx NSCLC patients (156 regions, 48
NSCLC patients, stage I-III) were also used to generate RNA heterogeneity
quadrants, permitting genomic and biological characterization without biasing to
LUAD-specific genes.

Chapter 4 Results
110
4.3.3 An RNA heterogeneity quadrant driven by clonal chromosomal gains early in tumour evolution
Previous work has demonstrated the correspondence between gene expression
and aberrations in chromosome copy-number in human tumours (Calabrese et al.,
2020; Pollack et al., 2002; Tonon et al., 2005). In the previous chapter I showed
this correspondence held true for subclonal SCNA events in NSCLC (see 3.3.2). To
define the genetic source for RNA inter- and intra-tumour variability, here I
examined differences in copy-number states between RNA heterogeneity
quadrants derived in the TRACERx cohort (156 regions, 48 NSCLC patients, stage
I-III).
Within each individual tumour, all genes were categorized according to copy-
number state as compared to the paired germline sample (gain, loss, or no
change). If applicable, the timing of the copy-number aberration (clonal or
subclonal) was also taken into consideration. For each gene, the proportion of
tumours within the TRACERx cohort subjected to each category of copy-number
change was quantified. Lastly, each category of copy-number change was
evaluated for relative enrichment or depletion in the genes from each RNA
heterogeneity quadrant. A number of significant (Fisher’s exact P < 0.05)
associations were found between RNA heterogeneity quadrants and copy-number
status (Figure 4-5). Notably, Q4 was enriched for clonal SCNA gains (OR=1.64;
P=1.18×10⁻⁵).

Chapter 4 Results
111
Figure 4-5 Genomic underpinning of RNA heterogeneity quadrants Enrichment or depletion of specific copy-number states by RNA heterogeneity quadrant. All genes were assigned a copy-number state across all samples (clonal/subclonal gain or loss, or no change). Genes were then tested for enrichment or depletion of a specific category by RNA heterogeneity quadrant. Odds ratios are plotted on a natural log scale. Statistical significance was tested with a Fisher’s exact test. RNA heterogeneity quadrants are indicated by colour: Q1 = red; Q2 = purple; Q3 = yellow; Q4 = blue.
These data suggest Q4 genes were related to clonal SCNAs, with expression
attributable to chromosomal gains occurring early in tumour evolution. This subset
of genes, enriched for ancestrally selected copy number changes, is henceforth
referred to as either “Q4” or “homogeneously expressed” genes.

Chapter 4 Results
112
4.4 Characterizing the biological and prognostic properties of clonal transcriptomic signals in lung cancer
4.4.1 Homogeneously expressed genes are enriched for cell proliferation pathways
Assigning biological function to the different RNA heterogeneity quadrants may
help shed light on their relevance for an evolving tumour. I performed a pathway
analysis on the genes from each quadrant, using the gene-sets from the Reactome
database. The top 10 significantly (Bonferroni-adjusted P-value < 0.01) enriched
pathways for each quadrant were plotted (Figure 4-6A).
Q1 displayed no significant pathway enrichment. This may reflect the small number
of genes in this quadrant (<5% of all expressed genes, 798/16,286), limiting
statistical power to detect significantly enriched gene-sets.
Q2 was involved in mRNA splicing, transcription, and rRNA processing. As this
quadrant consists of genes with both low intra- and inter-tumour heterogeneity, a
plausible biological interpretation is that this represents a core module of “house-
keeping” genes required by every tumour and within every cancer cell.
Q3 was enriched for extracellular matrix signaling and G protein-coupled receptor
signaling pathways. This subset of genes harbour high intra- and inter-tumour
heterogeneity scores. It is possible that genes involved in extracellular matrix
signaling are up-regulated at the invasive front of particularly invasive tumours.
However, this would require separate validation incorporating spatial information.
Q4 encoded gene-sets involved in cancer cell proliferation (Figure 4-6B). Integrated
with the results from the copy-number analysis, this suggested that
“homogeneously expressed” Q4 genes reflect the selection of high-risk SCNA
gains in proliferation genes early in tumour evolution.

Chapter 4 Results
113
Figure 4-6 Pathway analysis of RNA heterogeneity quadrants A, Pathway analysis on Q4 genes using Reactome, showing the top five pathways most significantly enriched in Q4 genes (low intra-tumour heterogeneity and high inter-tumour heterogeneity). B, The top ten Reactome pathways for each RNA heterogeneity quadrant. RNA heterogeneity quadrants are indicated by colour: Q1 = red; Q2 = purple; Q3 = yellow; Q4 = blue.

Chapter 4 Results
114
4.4.2 Individual homogeneously expressed genes are enriched for robust survival associations
I reasoned that homogeneously expressed genes from RNA heterogeneity Q4 (low
intra- and high inter-tumour heterogeneity) might be more robust to sampling bias,
and yield biomarkers with superior reproducibility between patient cohorts.
Following this logic, previous biomarker studies may naturally enrich for Q4 genes
even without explicitly selecting for homogeneously expressed genes in their
derivation. Here, enrichment would be measured relative to the 7% of all expressed
genes (1,080/16,286) comprised by Q4 (Figure 4-4B).
To test this hypothesis, I individually evaluated published prognostic signatures by
RNA heterogeneity quadrant. In the previous chapter I had collated the gene-lists
of 9 published prognostic biomarkers for LUAD (275 genes in total, including 33
overlapping between multiple signatures,,see 3.4.1). Here, I observed that several
signatures appeared to be comprised of a relatively high proportion of Q4 genes
(Figure 4-7A). In particular, both signatures approved for commercially approved
prognostic assays (labelled as ‘Kratz Lancet 2012’ and ‘Wistuba CCR 2013’) were
composed of at least 25% Q4 genes. To formally test this observation, I compared
the expected distribution from all expressed genes, with the observed distribution
from the collated gene-list from the 9 signatures (Figure 4-7A). Overall, 20% of
genes from existing biomarkers fell in Q4 (54/275), a three-fold enrichment
(P=1.39e-12, Figure 4-7B).

Chapter 4 Results
115
Figure 4-7 Analysis of published prognostic signatures by RNA heterogeneity quadrant A, Bar plots showing the composition of published prognostic signatures by RNA heterogeneity quadrant, plotted in order of increasing percentage of Q4 genes (low intra- and high inter-tumour heterogeneity). B, Bar plots showing the percentage of genes expected per RNA heterogeneity quadrant (total no. genes, as indicated in Figure 1-3) versus observed (in 9 published prognostic signatures) per RNA heterogeneity quadrant. Statistical significance was tested with a two-sided Fisher’s exact test. RNA heterogeneity quadrants are indicated by colour: Q1 = red; Q2 = purple; Q3 = yellow; Q4 = blue.

Chapter 4 Results
116
To further examine the tendency of Q4 genes to provide biomarkers with superior
reproducibility, I accessed publicly available data from independent cohorts of lung
cancer patients, and analysed the prognostic performance of genes by RNA
heterogeneity quadrant. Expression and clinical information was downloaded from
five cohorts of LUAD patients with stage I-III disease (see Methods for description
of datasets): (1) TCGA (n = 469); (2) Shedden et al (n = 469); (3) Okayama et al (n
= 147); (4) Der et al (n = 127); (5) Rousseaux et al (n = 83). The expression
profiling technology for cohort 1 was RNA-Seq, and microarray was used for
cohorts 2-5.
The prognostic value of a pooled gene-list from nine published prognostic
signatures for LUAD (242 unique genes) was evaluated in the RNA-Seq dataset
from TCGA. Using Cox univariate analysis, genes from Q4 correlated with survival
significantly better than genes from other quadrants (Q2 versus Q4: P=6.5×10⁻⁸;
Q3 versus Q4: P=4.0×10⁻⁴; there were insufficient genes in Q1 for Q1 versus Q4
comparison; Figure 4-8).
Probes for the full set of 242 genes, previously defined as prognostic, could not be
recovered in every microarray dataset, hence varying numbers of genes tested in
each cohort: 85% (205/242) Shedden et al; 99% (239/242) Okayama et al; 99%
(239/242); Der et al; 99% (239/242) Rousseaux et al. In spite of the technology
differences with RNA-Seq data, the four cohorts with microarray data yielded
similarly robust associations for Q4 genes (Figure 4-8).
Overall, these analyses of the composition and reproducibility of published
signatures, in the context of RNA heterogeneity quadrants, supported the
hypothesis that Q4 genes may be enriched for robust survival associations,
providing a basis for building robust biomarkers.

Chapter 4 Results
117
Figure 4-8 Reproducible survival association of published prognostic genes by RNA heterogeneity quadrant The ability of the genes pooled from 9 published prognostic signatures to maintain prognostic value in independent cohorts of LUAD patients, assessed as the gene-wise Cox univariate P value (y-axis) stratified by RNA heterogeneity

Chapter 4 Results
118
quadrant (x-axis). A, Analysis in one RNA-Seq dataset from TCGA (n=469 LUAD patients). B, Analysis of four microarray datasets, Shedden et al, Okayama et al, Der et al, Rousseaux et al. Statistical significance was tested with a two-sided Wilcoxon signed rank sum test. * indicates a P value < 0.05, ** indicates a P value < 0.01, *** indicates a P value < 0.001. RNA heterogeneity quadrants are indicated by colour: Q1 = red; Q2 = purple; Q3 = yellow; Q4 = blue.
4.4.3 The selection of clonal genes in biomarker design improves performance
The design of prognostic biomarkers in transcriptomic datasets conventionally
involves selecting a subset of genes associated with survival, and then using a
machine learning algorithm to generate a prognostic model, outputting a gene
expression signature. Here I performed a head-to-head test, comparing published
methods against clonal gene selection, to evaluate any added benefit on biomarker
performance
A range of methods has been employed in the literature to derive prognostic
signatures in LUAD. In order to faithfully replicate published methods, a literature
search was performed for LUAD prognostic signatures in the previous chapter (see
3.4.1). Here I identified published studies with sufficient information in the Methods
of to replicate the approach taken. I opted to focus on 5 methods for conventional
biomarker design (Figure 4-9A). These were centred around the following machine
learning algorithms (Chen et al., 2007; Kratz et al., 2012; Reka et al., 2014; Shukla
et al., 2017): stepwise AIC (akaike information criterion) regression; stepwise BIC
(bayesian information criterion) regression; tree classification; random forest
regression; elastic-net (lasso) regression. In parallel, I implemented a clonal
version of each signature. The published pipeline steps were replicated, with one
alteration: selecting only Q4 genes in the prognostic model (Figure 4-9A). Each
conventional and clonal biomarker design process is described in detail below.
The TCGA RNA-Seq cohort (n = 469 patients with stage I–III LUAD) was used as
the training cohort for signature development. To evaluate the prognostic value of

Chapter 4 Results
119
each signature in an independent patient cohort for validation, the Uppsala RNA-
Seq dataset was used (n = 103 patients with stage I–III LUAD).
Figure 4-9 Conventional and clonal prognostic signature design and performance A, Biomarkers are designed using state-of-the-art signature construction methods (marked in orange), replicatedfrom Shukla et al (signature A and B),
Chen et al (signature C), Reka et al (Signature D) and Kratz et al (signature E). In parallel, the “prognostic significance” filters present in each signature construction method were substituted with “homogeneous expression” filters, generating corresponding clonal signatures (signatures A-clonal, B-clonal, C-clonal, D-clonal, and E-clonal; marked in blue). Published signature construction methods are indicated in orange; novel methods integrating clonal biomarker design are indicated in blue. All signatures are developed in TCGA LUAD patients (n=469, stage I-III) as the training dataset. B, The prognostic performance of the resulting signatures was assessed in the Uppsala RNA-Seq

Chapter 4 Results
120
dataset (n=103 patients with stage I-III) as the Cox univariate P value (y-axis), correlating the risk-score for each signature (x-axis) against overall survival.
Stepwise regression. A published method to derive a prognostic signature, based
around stepwise regression (Shukla et al., 2017), was replicated. Univariate Cox
regression analysis was conducted using all expressed genes in the training
cohort, to apply a primary filter based on the survival association of individual
genes (univariate Cox analysis P < 0.00025), identifying 108 genes. This long-list of
108 genes was used to derive a signature purely based on prognostic information,
by further subsetting for the genes with the most significant survival association
(univariate Cox analysis false discovery rate < 0.02), generating a short-list of 15
genes that were used for forward conditional stepwise (Akaike information criterion)
regression, outputting a six-gene prognostic signature (signature A); alternatively,
stepwise (Bayesian information criterion) regression outputted a three-gene
signature (signature B). In parallel, the long-list of 108 genes was also subsetted
using a ‘homogeneous expression’ filter (selecting Q4 genes using heterogeneity
scores calculated in TRACERx; n = 28 patients withstage I–III LUAD), generating
a short-list of 15 genes, then outputting a seven-gene signature using stepwise
(Akaike information criterion) regression (signature A—clonal). In addition, stepwise
(Bayesian information criterion) regression generated a six-gene signature
(signature B—clonal).
Tree classification. In two separate studies, Chen et al identified a set of 672 genes
associated with invasive activity (Chen et al., 2001), then used tree classification to
derive a prognostic signature (Chen et al., 2007). From the first study, 656 of 672
genes could be found using HUGO gene symbols. Then, replicating the method
taken in the second study, a prognostic filter was applied, short-listing 8 genes
significantly associated with survival (univariate Cox analysis P < 0.00005).
Inputted to tree classification, this generated an eight-gene prognostic signature
(signature C). In parallel, a ‘homogeneous expression’ selection step (subsetting to
Q4 genes using heterogeneity scores calculated in TRACERx; n = 28 patients with
stage I–III LUAD) was applied to the list of 656 genes associated with invasive

Chapter 4 Results
121
activity, outputting a nine-gene signature by tree classification (signature C—
clonal).
Random forest regression. Reka et al (Reka et al., 2014) used a gene-set of an
epithelial-mesenchymal transition secretory phenotype to fit a prognostic model
using random forest regression. A purely prognostic model was made by first using
the full list of 97 genes to fit a random forest model, then using the variable
importance scores to re-fit the model using the top ten highest-scoring genes,
outputting a ten-gene prognostic signature (signature D). In parallel, a
‘homogeneous expression’ selection step (subsetting to Q4 genes using
heterogeneity scores calculated in TRACERx; n = 28 patients with stage I–III
LUAD) identified nine genes, generating a nine-gene signature by random forest
regression regression (signature D—clonal).
Elastic-net (lasso) regression. In two separate studies, Kratz et al derived a
prognostic signature by pooling lists of prognostic genes and manually curating this
list to generate a shortlist of 65 cancer-related genes (Raz et al., 2008), then
applying elastic-net (lasso) regression (Kratz et al., 2012). To replicate this, a gene-
list was assembled from published LUAD prognostic signatures (249 genes) (Beer
et al., 2002; Bianchi et al., 2007; Garber et al., 2001; Kratz et al., 2012; Krzystanek
et al., 2016; Bailiang Li et al., 2017; Raz et al., 2008; Shukla et al., 2017; Wistuba
et al., 2013). Next, 56 of the 65 cancer-related genes could be recovered from the
first study (Raz et al., 2008) and was used to select genes for lasso regression,
outputting a 24-gene prognostic signature (signature E). In parallel, a
‘homogeneous expression’ selection step (subsetting to Q4 genes using
heterogeneity scores calculated in TRACERx; n = 28 patients with stage I–III
LUAD) was applied to the list of 249 genes, identifying 44 genes, and outputting a
14-gene signature by lasso regression (signature E—clonal).
For each prognostic signature, risk-scores were calculated in the validation cohort,
and correlated with overall survival. The linear models – derived using stepwise
AIC regression, stepwise BIC regression and elastic-net (lasso) regression – were
used to calculate a risk score for each patient as a linear combination of gene

Chapter 4 Results
122
expression values, weighted by regression coefficients. Similarly, a risk score for
each patient in the validation cohort for the tree models derived using tree
classification and random forest regression. Signature E-clonal (the clonal
signature derived using elastic-net regression) was the only biomarker significantly
associated with overall survival in the validation dataset (Cox univariate analysis P
< 0.05, Figure 4-9B). This underscores the limited reproducibility of conventional
prognostic biomarker design.
4.4.4 Random signatures built from homogeneously expressed genes harbour cross-cohort prognostic significance
Recent studies in breast and lung cancer have showed that a surprisingly high
percentage of randomly generated signatures maintain prognostic significance
upon testing and can even out-perform conventionally crafted biomarker design
(Tang et al., 2017; Venet et al., 2011). I examined the cross-cohort performance of
randomly derived signatures to further assess the ability of Q4 genes to
reproducibly associate with survival.
For each RNA heterogeneity quadrant, 1,000 random signatures were generated.
First 20 genes were randomly sampled from a particular RNA heterogeneity
quadrant, and then the TCGA RNA-Seq cohort (n = 469 patients with stage I–III
LUAD) was used as the training cohort for model fitting by elastic-net (lasso)
regression. The prognostic values of the randomly generated signatures were then
assessed in four microarray-based cohorts (combined: n = 801 patients with stage
I–III LUAD). Patients were classified as high- or low-risk using the median value of
the first principle component, as in the method described by Venet and colleagues
(Venet et al., 2011). The random signatures from Q4 genes maintained cross-
cohort prognostic significance better than signatures derived from other quadrants
(Figure 4-10): 56% of Q4 signatures were significant across four cohorts compared
to 0%, 0.7% and 7.3% for Q1, Q2 and Q3 genes, respectively.

Chapter 4 Results
123
Figure 4-10 Cross-cohort performance of random signatures A total of 1,000 random signatures were developed in the TCGA RNA-Seq cohort (n = 469 patients with stage I–III LUAD), derived using 20 genes randomly sampled from each RNA heterogeneity quadrant, then tested for prognostic ability across four microarray cohorts comprising patients with stage I–III LUAD (Shedden et al.: n = 442; Okayama et al.: n = 147; Der et al.: n = 127; Rousseaux et al.: n = 85).
This result further indicated that Q4 is highly enriched for genes with robust
prognostic value and may provide a superior basis for building molecular
biomarkers.

Chapter 4 Results
124
4.5 A biomarker based on cancer evolutionary principles associates with lung cancer mortality
4.5.1 Development of a clonal, prognostic, expression biomarker
Integrating clonal biomarker design with a published signature construction pipeline
based on elastic-net regression yielded a prognostic signature that out-performed
conventional methods. Moreover, even randomly selected subsets of
homogeneously expressed genes displayed a tendency to yield biomarkers with
cross-cohort prognostic associations. Based on these observations, here I inputted
homogeneously expressed genes to the elastic-net regression algorithm, to explore
the potential for novel biomarker discovery. This yielded a novel prognostic
biomarker, termed an Outcome Risk Associated Clonal Lung Expression
(ORACLE) signature. RNA-Seq data from the TCGA cohort (n = 469 patients with
stage I–III LUAD) was used as the training cohort for signature development.
Starting with all expressed genes (19,024 genes) in the TCGA cohort, four criteria
were sequentially applied to identify genes that were expressed, prognostic and
clonal (Figure 4-11A):
1) An expression cut-off was applied, filtering out genes with below-median
expression (9,512/19,024 genes), restricting noise due to the detection limits
as a standard pre-processing step (Campbell et al., 2016);
2) Genes associated with survival (Cox univariate P < 0.05) were selected
(2,023/9,512 genes), an established method in prognostic signature design
(Chen et al., 2007; Shukla et al., 2017);
3) RNA heterogeneity scores were used as a primary method of identifying
homogeneously expressed genes, selecting Q4 genes (176/2,023 genes);
4) Clustering concordance scores were used as a secondary method of
identifying homogeneously expressed genes, determining the optimum
number (90/176 genes) using ten-fold cross-validation in the training cohort
(Figure 4-11B).

Chapter 4 Results
125
Figure 4-11 ORACLE signature design: gene selection and parameter tuning A, Flow diagram illustrating the gene selection steps for ORACLE. Criteria to identify prognostic and homogeneously expressed genes, and the numberof
genes selected at each step are indicated. B, Optimization of the number of genes to select at the clustering concordance step through 10-fold cross- validation in the training cohort (TCGA, n=469 LUAD patients, stage I-III). The optimal number of genes, with the lowest cross-validation error, is shown by the vertical red line. C, The cut-off to dichotomize the ORACLE risk-score into ‘high’ and ‘low’ risk groups is optimized in the training cohort (TCGA, n=469 LUAD patients, stage I-III). The horizontal blue line indicates a log-rank P-value = 0.01 and the optimal cut-off is shown by the vertical red line. Statistical significance was tested with a two-sided log-rank test.
The 90 genes outputted by the four criteria were used to fit a prognostic model
against overall survival in the training cohort using elastic-net (lasso) regression
(Figure 4-11A). As part of the model fitting step, lasso regression performs further
feature selection, yielding a 23-gene signature with a model coefficient for each
gene. This signature was termed ORACLE (Table 1).

Chapter 4 Results
126
Gene Symbol
Model Coefficient Gene Name Description of Gene Function Published
Signature ANLN 0.058692239 Anillin Actin Binding
Protein Required for cytokinesis (cleavage
furrow) -
ASPM 0.003462241 Abnormal Spindle Microtubule Assembly Mitotic spindle regulation
Krzystanek Biomarker Res
2016, Wistuba CCR 2013
CDCA4 0.041940166 Cell Division Cycle Associated 4
Regulates cell proliferation via E2F/RB pathway -
ERRFI1 0.013237564 ERBB Receptor Feedback Inhibitor 1
Up-regulated with cell growth, negatively regulates EGFR signaling -
FURIN 0.208437458 Furin, Paired Basic
Amino Acid Cleaving Enzyme
Pro-protein convertase binding TGFβ NGF, and MMP1 amonst others. Beer Nat Med 2002
GOLGA8A -0.028493707 Golgin A8 Family Member A Maintains structure of golgi apparatus -
ITGA6 0.058464556 Integrin Subunit Alpha 6 Essential for IGF1 and IGF2 signaling -
JAG1 0.012599497 Jagged 1 Ligand for Notch signalling -
LRP12 0.038410107 LDL Receptor Related Protein 12
involved in the internalization of lipophilic molecules and/or signal transduction, may act as a tumour
suppressor
-
MAFF 0.075070616 MAF BZIP Transcription Factor F
Involved in transcriptional activation and repression -
MRPS17 0.146466169 Mitochondrial Ribosomal Protein S17 Mitochondrial protein synthesis -
PLK1 0.029842311 Polo Like Kinase 1 Ser/Thr kinase involved in cell
proliferation and cell survival; M-phase of cell cycle
Wistuba CCR 2013
PNP 0.01177481 Purine Nucleoside Phosphorylase
Involved in (de novo) nucleotide salvage pathway, which is often
interrupted by chemotherapy drugs Beer Nat Med 2002
PPP1R13L 0.062382956 Protein Phosphatase 1 Regulatory Subunit 13
Like Inhibitor of p53 -
PRKCA 0.038900124 Protein Kinase C Alpha Ser/Thr kinase involved in cell proliferation (via cell cycle) Raz CCR 2008
PTTG1 0.082889189 Pituitary Tumour-Transforming 1
Regulatory protein involved in chromosome stability, p53 pathway,
and DNA repair Wistuba CCR 2013
PYGB 0.143943497 Glycogen Phosphorylase B Regulates glycogen mobilization -
RPP25 0.019158495 Ribonuclease P And MRP Subunit P25
Component of ribonuclease P, a protein complex that generates
mature tRNA molecules by cleaving their 5-ends
-
SCPEP1 -0.00145441 Serine Carboxypeptidase 1
May be involved in vascular wall (and kidney) homeostasis -
SLC46A3 -0.031597666 Solute Carrier Family 46 Member 3
Lysosomal transmembrane protein; effective transporter of the cancer
cytotoxic drug maytansine. -
SNX7 0.133634555 Sorting Nexin 7 involved in intracellular trafficking -
TPBG 0.012242067 Trophoblast Glycoprotein
oncofetal antigen that is specific to trophoblast cells, in adults this protein is highly expressed in many tumour
cells and is associated with poor clinical outcome in numerous cancers.
Beer Nat Med 2002
XBP1 -0.121354561 X-Box Binding Protein 1 Transcription factor regulating 1)
MHCII genes and 2) ER stress during Unfolded Protein Response
-
Table 1 ORACLE signature Gene list and model coefficients for the Outcome Risk Associated Clonal Lung Expression signature. Descriptions of gene function, and references to usage in published prognostic signatures are also provided.

Chapter 4 Results
127
As a prognostic signature with an underlying linear model, ORACLE risk-scores are
calculated as a linear combination of the expression values of the 23 genes
comprising the signature, weighted by the model coefficients. To transform this
continuous risk-score into binary classifications, in order to stratify patients as high-
or low-risk, a risk-score cut-off is required. This was calculated as the median risk-
score in the training cohort among significant (log-rank P < 0.01) cut-off values
(Figure 4-11C).
Thus, a novel homogeneous expression biomarker for lung adenocarcinoma was
derived. Many of the genes are involved in cellular division and proliferation (Table
1). To the best of my knowledge, only 30% of the list of genes comprising ORACLE
(7/23 genes) has previously been used in LUAD prognostic signatures (ASPM,
FURIN, PLK1, PNP, PRKCA, PTTG1 and TPBG).

Chapter 4 Results
128
4.5.2 Validation as a clinically informative biomarker
The validation of a prognostic biomarker should ideally include demonstrating
reproducible survival associations in at least one external dataset (preferably
several) and demonstration of clinical utility, indicating prognostic value
independent of existing clinicopathological risk factors and in patient subgroups
where there is an urgent clinical need for improved stratification (Subramanian and
Simon, 2010a; Vargas and Harris, 2016).
The reproducibility and clinical utility of ORACLE was assessed. Five independent
cohorts of LUAD patients with stage I-III disease were used for signature validation:
one RNA-Seq dataset from the Uppsala cohort (n = 103); four microarray datasets
from Shedden et al (n = 469), Okayama et al (n = 147), Der et al (n = 127), and
Rousseaux et al (n = 83).
Applying the ORACLE biomarker to the RNA-Seq-based validation cohort, the
continuous risk-score displayed a highly significant survival association (Cox UVA
P=0.00474, Figure 4-12B) that out-performed the signatures derived in the previous
section (Figure 4-9B). Using the risk-score cut-off to dichotomize the cohort, the
hazard ratio between risk-groups was 3.16 (1.4–7.0, log-rank P = 0.006, Figure
4-12A), and three-year overall survival was 80% (68–94%) in the low-risk group
and 57% (46–71%) in the high-risk group.

Chapter 4 Results
129
Figure 4-12 Reproducible survival association of ORACLE A, Kaplan-Meier plot of ORACLE in the RNAseq-based validation cohort (Uppsala, n=103 LUAD patients, stage I-III). Statistical significance was tested with a two-sided log-rank test. B, Prognostic value of ORACLE assessed in a meta-analysis across five validation cohorts of patients with LUAD (n = 904 patients with stage I–III LUAD). Univariate Cox analysis was performed in one RNA-Seq dataset (Uppsala) and four microarray datasets (Shedden et al.,Okayama et al., Der et al. and Rousseaux et al.). Hazard ratios with a 95%
confidence interval are shown for each cohort and are plotted on a natural log scale. The diamond indicates the hazard ratio for the meta-analysis of the five validation cohorts.

Chapter 4 Results
130
To investigate concordance across multiple cohorts, I conducted a meta-analysis of
the prognostic value of ORACLE in the RNA-Seq-based validation cohort and four
further microarray datasets. Only 19/23 genes in the ORACLE signature could be
recovered from microarray probe sets (ASPM, CDCA4, FURIN, GOLGA8A, ITGA6,
JAG1, LRP12, MAFF, MRPS17, PLK1, PNP, PPP1R13L, PRKCA, PYGB,
SCPEP1, SLC46A3, SNX7, TPBG and XBP1). This was expected to impair
signature performance in the microarray cohorts, yet ORACLE maintained
prognostic value in three out of the four microarray datasets (univariate Cox
regression: P=0.002; HR=5.4 (Okayama et al. cohort); P=0.003; HR=2.9
(Rousseaux et al. cohort); P=2.3×10⁻⁸; HR=3.6 (Shedden et al. cohort); and
P=0.3, HR=1.6 (Der et al. cohort). In the meta-analysis pooling all validation
cohorts (combined: n=904 patients with stage I–III LUAD), ORACLE correlated with
mortality with a hazard ratio of 3.57 (2.94–3.54, P < 0.0001, Figure 4-12B),
indicating a survival association across multiple external datasets, and robust to
differences in expression profiling technology.
As the fully specified 23-gene prognostic model for ORACLE could be applied to
the RNA-Seq-based validation cohort, I focused on this dataset to examine the
clinical utility. Partnering with the curators of this cohort to access detailed
clinicopathological annotations, an array of prognostic risk factors were assessed:
TNM stage, adjuvant treatment status, age, WHO performance status, smoking
history, gender and Ki67 staining percentage. ORACLE maintained prognostic
significance in a multivariate analysis adjusted for these risk factors, with an
adjusted hazard ratio of 2.64 (1.15–6.05, P = 0.0216, Figure 4-13). This result
indicated ORACLE might provide additional predictive utility independent of existing
clinicopathological risk factors

Chapter 4 Results
131
Figure 4-13 Prognostic value of ORACLE beyond existing clinicopathological risk factors Prognostic value of ORACLE over known risk factors. Multivariate Cox analysis was performed in the Uppsala RNA-Seq dataset (n = 103 patients with stage I–III LUAD), incorporating the ORACLE risk score, tumour stage, adjuvant treatment status, patient age, WHO performance status, smoking status, patient gender and Ki67 staining percentage. Hazard ratios with a 95% confidence interval are shown for each predictor and are plotted on a natural log scale.

Chapter 4 Results
132
Risk stratification of stage I LUAD patients has been highlighted as an urgent
clinical need, with implications for therapeutic decision-making (Subramanian and
Simon, 2010a; Vargas and Harris, 2016). To evaluate the prognostic ability of
ORACLE in this patient subgroup, I selected stage I patients from the RNA-Seq-
based validation cohort (n = 60 patients with stage I LUAD). Sub-staging criteria,
the existing clinical marker for stage I patients (Goldstraw et al., 2016), stratified
patients into stage IA (n=42 patients) and IB groups (n=18 patients) but was not
associated with survival in this small cohort of patients (Figure 4-14). By contrast,
ORACLE high-risk (n=32 patients) and low-risk (n=28 patients) classifications did
separate stage I patients into groups with significantly different mortality outcomes
(log-rank P = 0.02, Figure 4-14). Both analyses were repeated using the recently
updated TNM version 8 staging criteria (Goldstraw et al., 2016), giving the same
result (log-rank P: sub-staging = not significant, ORACLE = 0.018; Figure 4-14).
These data suggest that ORACLE is associated with survival outcomes in patients
with stage I LUAD.
Taken together, the ORACLE biomarker showed reproducible survival associations
in a meta-analysis of more than 900 patients with microarray or RNA-Seq data
available, and provided molecular information beyond existing clinicopathological
risk factors, specifically in the subgroup of stage I LUAD patients.

Chapter 4 Results
133
Figure 4-14 Prognostic value of ORACLE in LUAD patients with stage I disease A, The ability of substaging criteria (left) versus ORACLE (right) to split patients into prognostically informative groups was tested in patients with stage I disease. Kaplan–Meier plots with log-rank P values, calculated using data from the Uppsala RNA-Seq dataset (n = 60 patients with stage I LUAD) are shown. B, The ability of substaging criteria (left) and ORACLE (right) to split patients into prognostically informative groups is tested in stage I patients using the updated TNM version 8 criteria, shown as Kaplan-Meier plots for the Uppsala RNAseq dataset (n=53 LUAD patients, stage I, TNMv8). Statistical significance was tested with a two-sided log-rank test.

Chapter 4 Results
134
4.5.3 Benchmark performance against published signatures
The ORACLE signature was checked against a published biomarker – a four-gene
RNA-Seq signature (Shukla et al., 2017) mentioned in the previous chapter (see
3.4.1) – to test whether it has better prognostic power. For this analysis the RNA-
Seq dataset from the Uppsala cohort (n = 103, stage I-III) was used as an external
validation cohort, as described in previous sections (4.4.3 and 4.5.2). Model
signature coefficients from the original publication (Shukla et al., 2017) were
applied to the validation dataset, calculating a risk-score for each tumour (Figure
15A). Correlating the risk estimates against survival, the continuous risk-score did
not exhibit a significant survival association (Cox UVA P=0.156). Moreover, using
the median risk-score as a cut-off to dichotomize the cohort, the survival times
between risk-groups were not significantly different (log-rank P = 0.1, Figure 15B).
In this cohort ORACLE risk estimates were significantly associated with overall
survival in both univariate (Figure 4-12A) and multivariate (Figure 4-13) analyses,
suggesting it may have greater prognostic power than the published signature in
this validation cohort.
Figure 15 Testing performance of a published RNA-Seq signature A published RNA-Seq signature (Shukla et al., 2017) was applied to the RNA-Seq validation dataset from Uppsala University (n=103, stage I-III). A, Expression matrix for the four genes comprising the signature (bottom) and risk-score distribution (top). B, Kaplan-Meier plot of the four-gene signature. Statistical significance was tested with a two-sided log-rank test.

Chapter 4 Results
135
4.5.4 Biological underpinning
Gene expression signatures can serve as prognostic biomarkers irrespective of
their biological meaning, though the limited interpretability of such “black box”
classifiers may discourage clinical adoption. By contrast, correlating a prognostic
signature with specific biological processes can suggest the underlying
mechanism, and help indicate the biomarker may be robustly informative (Topalian
et al., 2016). Here, I further developed the biological grounding of ORACLE,
querying whether the proposed signature is predominantly expressed on cancer
cells or stromal cells, and exploring the axes of correlation between the molecular
risk-score and clinicopathological features.
To clarify that the signature is predominantly expressed on cancer cells, correlative
analyses was performed in tumour samples from the TRACERx cohort (89 tumour
regions from 28 patients with stage I–III LUAD). Firstly, the expression of individual
ORACLE genes tracked the copy-number state at the corresponding gene locus,
with 91% (21/23) of genes exhibiting a significant (P<0.05) positive correlation
(Figure 4-16A). Next, I investigated the correlation between ORACLE risk-scores
and metrics of immune infiltration derived from bulk sequencing data in TRACERx.
There was a significant negative correlation between ORACLE risk scores and
most (11/16) immune cell subsets defined using an RNA-Seq- based metric of
immune infiltration (Danaher et al., 2017) (Figure 4-16B). A non-significant but
trending negative correlation was observed with a WES-based measure of tumour
purity (Loo et al., 2010) (Figure 4-16C). Lastly, I accessed a published single-cell
RNA-Seq dataset comprised of 52,698 stromal cells sourced from 5 NSCLC
patients (Lambrechts et al., 2018). In this scRNAseq study, Lambrechts et al had
defined clusters for seven stromal cell-types (alveolar, B cell, epithelial, fibroblast,
myeloid, T cell, and vascular). Examining the ORACLE signature in the context of
these stromal clusters, most (20/23) of the individual genes in ORACLE displayed
negligible expression levels relative to marker genes for stromal cell-types (Figure
4-16D).

Chapter 4 Results
136
Figure 4-16 ORACLE as a cancer cell expression signature A, Pearson correlations between the expression of individual ORACLE genes and copy-number state at the corresponding gene locus in the TRACERx cohort (n=28 LUAD patients, 89 tumour regions, stage I-III). Significant correlations (P<0.05, without a multiple-testing correction) are marked in red, non-significant correlations are marked in blue. B, Spearman correlations between the infiltration of immune cell subsets, calculated from RNAseq data using the method described by Danaher et al, and ORACLE risk-scores in the TCGA dataset (n=469 patients, stage I-III). C, The scatter plot shows the Spearman correlation between ORACLE risk score and tumour purity assessed from whole-exome sequencing data using ASCAT, as described by Van Loo et al, in TRACERx (n=28 LUAD patients, 84 tumour regions, stage I-III). D, Lambrechts et al performed single-cell RNAseq on 52,698 cells sourced from 5 NSCLC patients,

Chapter 4 Results
137
then defined 7 clusters of stromal cell genes and provided a per-cluster expression measure for every gene. The relative expression levels (y-axis) for each stromal cluster (coloured by cell-type, see figure legend) is plotted for all 23 genes comprising the ORACLE signature (bottom 3 rows). To aid interpretation, a marker gene for each of the 7 stromal cell clusters is also plotted (top row) for comparison: alveolar (AGER), B cell (MS4A1), epithelial (EPCAM), fibroblast (COL6A2), myeloid (CD68), T cell (CD3D), and vascular (FLT1) cell-types.
The correlation between ORACLE risk and established features of tumour
aggressiveness was assessed. In the RNA-Seq-based validation cohort, the
ORACLE risk scores tracked TNM tumour stage (Figure 4-17A). In addition, I
accessed RNA-Seq data for a set of metastatic samples seeded by primary LUAD
tumours (n=8 metastatic samples from the MET500 cohort (Robinson et al., 2017)),
finding ORACLE expression to be significantly higher relative to primary tumour
samples (Figure 4-17A). Immunohistochemical staining for Ki67, a histological
marker for cancer cell proliferation, had previously been performed in the
TRACERx cohort (Jamal-Hanjani et al., 2017), and was found to be positively
correlated with ORACLE risk-scores (Spearman’s rho = 0.44; P = 0.0000205,
Figure 4-17B).
Taken together, these data suggest that the genes comprising ORACLE are
expressed in cancer cells, may serve as a molecular read-out for tumour
aggressiveness and metastatic potential, and is more robust to the challenge of
tumour sampling bias than existing prognostic signatures.

Chapter 4 Results
138
Figure 4-17 ORACLE as a molecular correlate for tumour aggressiveness A, Boxplots showing the distribution of ORACLE risk scores by disease stage, for the Uppsala cohort (n=103 LUAD patients, stage I-III) and the MET500 cohort (n=8 metastatic samples from patients with LUAD primary tumours). Statistical significance was tested with a Wilcoxon signed rank sum test. No corrections were made for multiple comparisons. B, The scatter plot shows the Spearman correlation between Ki67 staining % and ORACLE risk-scores in the TRACERx cohort (n=28 LUAD patients, 89 tumour regions, stage I-III).

Chapter 4 Results
139
4.5.5 Tumour sampling bias
In the previous chapter, the sampling bias of published prognostic signatures for
LUAD was assessed in the multi-region RNA-Seq dataset of TRACERx LUAD
patients. The discordance rates of two RNA-Seq-based prognostic signatures was
directly quantified as 29% and 43%. Separately, a clustering metric was used to
assess the discordance of 9 published signatures (including microarray and qPCR
signatures) invariant of the expression profiling technology, revealing an average
discordance rate was 50%.
The sampling bias of ORACLE was assessed in the multi-region RNA-Seq dataset
of TRACERx LUAD patients. Only 11% of the cohort (3/28 patients) exhibited
discordant classification (Figure 4-18). This indicates ORACLE may be more robust
to the problem of sampling bias then previous approaches agnostic to RNA-ITH,
though would need to be confirmed in an external multi-region RNA-Seq validation
dataset.
It is worth considering why the clonal approach taken here did not completely
eliminate the problem of sampling bias in lung cancer. In their analysis of
expression data from >5000 breast tumours, Tofigh and colleagues suggested that
a subset of patients were “inherently difficult” due to high levels of ITH, and should
be separately classified (Tofigh et al., 2014). Along these lines, it is notable that the
three patients displaying discordant risk classification for ORACLE did not consist
of border-line samples on either side of the risk-score cut-off (Figure 4-18). Rather,
these three tumours were amongst the highest for variance in risk-score between
tumour regions, possibly indicating a higher global state of RNA-ITH.

Chapter 4 Results
140
Figure 4-18 Tumour sampling bias of ORACLE Tumour sampling bias of the ORACLE signature assessed using multi-region RNAseq data from TRACERx (n=28 LUAD patients, 89 tumour regions, stage I-III). Each point represents a single tumour region, vertical lines display the range for each patient, and patients are ordered by predicted survival risk score. Points are coloured according to the risk classification of tumour regions within a patient: concordant low-risk (blue), concordant high-risk (red), or discordant (gray).

Chapter 4 Results
141
4.6 Prognostic relevance of homogeneously expressed genes across cancer types
4.6.1 Pan-cancer analysis
The sampling bias problem for molecular biomarkers has been described in
histologies other than lung cancer, including renal, breast and prostate cancer
(Boutros et al., 2015; Gerlinger et al., 2012; Gyanchandani et al., 2016).
To explore whether clonal biomarker design may hold prognostic relevance across
other cancer types, I downloaded gene-wise prognostic values from two pan-
cancer resources:
1) Prediction of Clinical Outcomes from Genomic Profiles (PRECOG) dataset,
survival associations (z scores) calculated from 166 microarray datasets
covering 39 cancer types (Gentles et al., 2015);
2) Human Pathology Atlas, survival associations (log-rank P values) calculated
from RNA-Seq data of 17 cancer types (Uhlen et al., 2017).
RNA heterogeneity quadrants were calculated using the full TRACERx cohort with
multi-region RNA-Seq data available (156 regions, 48 NSCLC patients, stage I-III).
The proportion of genes within each quadrant that were found to give a significant
prognostic value was assessed, both pan-cancer and for individual histologies.
Assessing pan-cancer survival associations in the PRECOG dataset, Q4 genes
were significantly enriched in prognostic genes compared with all other quadrants
(Q1 versus Q4: P = 8.9 × 10⁻²⁷; Q2 versus Q4: P = 9.3 × 10⁻⁸; Q3 versus Q4: P =
1.9 × 10⁻¹⁸, Figure 4-19). In a finer-grained analysis, assessing each of the 39
histologies individually, 49% (19/39) of cancer types were significantly enriched for
prognostic genes in Q4; only one cancer type, head and neck cancer, was
significantly depleted (3% of cancer types (1/39)). Conversely, Q1 (high intra-
tumour variability and low inter-tumour variability) was significantly depleted in 56%
(22/39) of cancer types, and enriched in 0% (0/39). Both Q2 (low intra- and inter-
tumour variability) and Q3 (high intra- and inter- tumour variability) showed similar
numbers of depleted and enriched cancer types. The subset of genes in Q4 was
also prognostically relevant across several cancer-types from the Human

Chapter 4 Results
142
Pathology Atlas dataset: 35% of cancer-types (6/17) were significantly enriched for
prognostic genes, and none (0/17) were depleted.
Figure 4-19 Survival association of RNA heterogeneity quadrants across cancer types Pan-cancer prognostic scores sourced from the PRECOG database (n = 17,808 tumours from 39 malignant histologies) and evaluated in the context of RNA heterogeneity quadrants. A, Box plots showing gene-wise pan-cancer survival associations are evaluated by NSCLC RNA heterogeneity quadrant. Z scores were sourced from the PRECOG database (n = 17,808 tumours from 39 malignant histologies). A |z| score > 1.96 is equivalent to a two-sided P < 0.05. Statistical significance was tested with a two-sided t-test.B, Survival association of RNA
heterogeneity quadrants for individual cancer types. Each point corresponds to 1 out of 33 cancer types. The number of prognostically significant genes (|z| score > 1.96, equivalent to a P value < 0.05) per NSCLC RNA heterogeneity quadrant is indicated for each cancer type as non-significant (gray), significantly enriched (red; odds ratio > 1)or significantly depleted (blue; odd ratio < 1). Odds
ratios are plotted on a natural log scale. Statistical significance was tested with a two-sided Fisher’s exact test. No corrections were made for multiple comparisons.

Chapter 4 Results
143
These analyses indicated that homogeneously expressed biomarkers, derived as
such in a multi-region lung cancer dataset, displayed a significant enrichment for
prognostic genes in 35-49% of cancer types from two pan-cancer datasets

Chapter 4 Results
144
4.7 Conclusions
4.7.1 Summary of findings
The results of this chapter provide a means to address the diagnostic challenge of
tumour sampling bias in lung cancer, and possibly other histologies.
The global analysis of RNA heterogeneity revealed greater inter- than intra-tumour
RNA heterogeneity. This result is in line with results from other multi-region studies
of cancer transcriptomes. Gyanchandani et al profiled 181 samples from 71 ER+
breast tumours, finding samples clustered by patient in 86% of cases
(Gyanchandani et al., 2016). Similarly, in a small cohort of medulloblastoma
patients, Morrissy et al described that multi-region samples from 8 patients tightly
clustered together (Morrissy et al., 2017). Extending to metastatic disease, Suda et
al performed RNA profiling of 30 samples from five NSCLC patients (Suda et al.,
2018) – including primary tumours, and intra/extra-thoracic metastatic lesions –
finding all primary and metastatic samples clustered by NSCLC patient. Overall,
these analyses suggest that the subset of most variably expressed genes could
represent a molecular fingerprint unique to individual NSCLC tumours. However,
these global analyses do not incorporate prognostic information, so may not
provide a clinically informative signature.
To perform feature selection in a manner that overcame sampling bias, a core set
of genes were defined with low intra- yet high inter-tumour RNA heterogeneity that
were expressed uniformly within individual tumours, so robust to sampling bias, but
are also highly variable between tumours, so they remained informative for patient
stratification. These genes were enriched for chromosome copy-number gains
early in tumour evolution, hence were termed “homogeneously expressed”, and
was significantly enriched for genes that reproducibly maintained prognostic value
in validation datasets of lung cancer patients (five separate cohorts) and in a pan-
cancer analysis (39 cancer-types). Taken together, these data strongly suggest
that homogeneously expressed genes may be optimal candidates for the
development of biomarker assays, both in lung cancer and possibly as a general
strategy for refining biomarkers across cancer types.

Chapter 4 Results
145
In addition to defining homogeneously expressed genes, further selection of genes
associated with survival yielded a novel Outcome Risk Associated Clonal Lung
Expression (ORACLE) signature. ORACLE was discordant in 11% of LUAD
patients from the multi-region RNA-Seq cohort, which compares favorably with the
discordance rates of two RNA-Seq-based prognostic signatures of 29% and 43%.
In addition, 100% (23/23) of the ORACLE genes are homogeneously expressed,
compared with 36% (11/14) of genes from the clinically approved Razor Genomics
signature (Kratz et al., 2019). This indicates ORACLE may be more robust to the
problem of sampling bias then previous approaches agnostic to RNA-ITH.
Failure to validate in independent patient cohorts, possibly due to differences in
patient factors such as ethnicity or diet, has been highlighted as a major weakness
of previous prognostic signatures in lung cancer (Subramanian and Simon, 2010a).
ORACLE associated with survival in a meta-analysis involving 904 patients from
five independent cohorts, indicating the signature may be driven robust tumour
intrinsic features. Biomarker based classification of patients with stage I disease
has been identified as a high impact area for thoracic oncology (Subramanian and
Simon, 2010a; Vargas and Harris, 2016). ORACLE stratified stage I patients into
high- and low-risk subgroups with significantly different survival times, providing
prognostic value that substaging criteria (IA/IB) (Goldstraw et al., 2016) could not
achieve in the small cohort of patients available for this analysis (n=60).
Overall, these results describe a technical advance in the field of expression-based
prognostic prediction and provide a promising molecular biomarker with the
potential to improve diagnostic precision in lung cancer beyond the TNM staging
system if further validated as a clinical assay.

Chapter 4 Results
146
4.7.2 Future work
Whether ORACLE is exclusively expressed by cancer cells remains an outstanding
question (see section 4.5.4). Spatially resolved RNA analysis of the genes
comprising ORACLE from intact tissue – leveraging emerging technologies such as
spatial transcriptomics (Ståhl et al., 2016), STARmap (Wang et al., 2018), or Digital
Spatial Profiling (Merritt et al., 2020) – could provide an answer.
Given the rapid developments in targeted therapy and immunotherapy, in both the
metastatic disease setting and the surgical adjuvant setting, the prediction of
response to adjuvant therapy is a key question. Two expression-based predictive
biomarkers for CPI, the IPRES (Hugo et al., 2016) and TIDE (Jiang et al., 2018)
signatures, were evaluated in the TRACERx cohort revealing discordance rates of
33% and 44% respectively (Rosenthal et al., 2019). This indicates the design of
homogeneously expressed biomarkers may have wider applications outside of
global prognostication. Indeed, the published results of this chapter have been
independently cited to support the need for a clonal biomarker of CPI sensitivity
(Suda and Mitsudomi, 2020).

Chapter 5. Results
147
Chapter 5. In silico dissection of the tumour microenvironment
5.1 Introduction
The tumour microenvironment consists of the non-malignant cells present in the
tumour bulk (including fibroblasts, endothelial, and immune cells), as well as
extracellular matrix and signaling molecules. In treatment-naive lung cancer, the
cellular components of the TME have been shown to influence cancer initiation
(Mascaux et al., 2019; Pennycuick et al., 2020) and the outgrowth of immune-
evasive clones (AbdulJabbar et al., 2020; Rosenthal et al., 2019). Moreover,
signals from the lung stromal niche govern the propensity of primary tumours in
other organs to initiate pulmonary metastases (Malanchi et al., 2012). Immune
infiltration has a prognostic impact in both early- and late-stage NSCLC (Dieu-
Nosjean et al., 2008; Goc et al., 2014; Hirayama et al., 2012; O’Callaghan et al.,
2015; Ohri et al., 2009). The clinical relevance of the lung TME is further
highlighted under treatment, providing a safe haven from genome-targeted
therapies (Katayama et al., 2012; W. Wang et al., 2009), and playing a role in
determining responses to checkpoint blockade immunotherapy (Ganesan et al.,
2017; Thommen et al., 2018).
In silico dissection of the TME from bulk expression data provides an attractive
approach for quantifying the cellular composition of the stromal components of
tumours. A highly accurate computational tool could help expedite the delivery of
genomics-driven precision oncology (Dijkstra et al., 2016). In this chapter, I first
provide an overview of existing RNA-based methods for TME cell-type
enumeration. Next, I describe how global transcriptional profiles were generated for
stromal cell-types that were purified ex vivo from lung tissue. Lastly, I present
interim results from two sets of analyses. The first aims to demonstrate how
purified stromal transcriptomes might yield biological insights into phenotype
molding within the lung TME. The second suggests this dataset could provide a
foundation for deriving higher-fidelity stromal signatures, addressing some of the
shortcomings of existing computational methods.

Chapter 5. Results
148
5.2 RNA deconvolution of the tumour microenvironment
5.2.1 Anatomy of an RNA-based TME enumeration tool
There is a growing ambition to incorporate quantitative measures of TME
composition into clinical practice, using more fine-tuned descriptions than “immune-
hot” or “immune-cold”, as prognostic or predictive biomarkers (Chen and Mellman,
2017; Hirata and Sahai, 2017; Sharma et al., 2017). A major obstacle is the
difficulty in applying traditional immunophenotyping techniques like flow cytometry,
CyTOF or multiplexed IHC to clinical samples. These techniques are limited by
sample throughput, complex tissue preparation requirements and cell extraction
bias (Newman and Alizadeh, 2016). The computational deconvolution of RNA data
from bulk tumours offers a means to overcome these limitations (Newman and
Alizadeh, 2016).
Gene expression data from bulk tumours contains multiple levels of biological
heterogeneity, including variation in cell-type proportions and the differing activation
states of individual cell-types, both of which can be markedly influenced by tissue
pathology (Shen-Orr and Gaujoux, 2013). The anatomy of a typical RNA-based
cell-type enumeration tool is illustrated (Figure 5-1A). A bulk RNA admixture
(Figure 5-1B) and a reference matrix of cell-type signatures (Figure 5-1C) are both
taken as input. There are two major classes of enumeration method: enrichment
and deconvolution (Figure 5-1D). Both classes select genes from the signature
matrix to calculate cell-type-specific enumeration scores. Some tools also output
additional information, such as cell-type-specific activation states (Newman et al.,
2019) or a measure of confidence in the estimation (Newman et al., 2015).

Chapter 5. Results
149
Figure 5-1 Anatomy of an RNA-based TME enumeration tool. (A) Schematic diagram to display the computational pipeline for a typical RNA deconvolution tool: bulk tumour transcriptomes and a reference matrix of cell-type signatures are inputted to an enumeration method, outputting scores estimating the abundance of TME-cell-types. (B) Illustration of three tumours, showing how variation in stromal cellular compositions drives the transcriptional patterns observed in bulk RNA data. (C) Cartoon illustration of the gene expression heatmap for a set of TME signatures. The heatmap rows correspond to genes from cell-type signatures, and the heatmap columns are expression experiments from purified cells for each cell-type. (D) The differing outputs for two types of TME cell-type enumeration methods: “low-resolution” rankings for enrichment methods (left); “high-resolution” proportions for deconvolution methods (right).

Chapter 5. Results
150
Here I highlight a few published tools to discuss the benefits and limitations of
existing methods.
ESTIMATE. The ESTIMATE method, developed by Yoshihara and colleagues
(Yoshihara et al., 2013), uses “stromal” and “immune” gene-sets (each containing
141 genes) to quantify the abundance of broad TME cell classes. An enrichment
type method is used for enumeration, specifically single-sample GSEA. The
method works with both RNA-Seq and microarray data,
Cytolytic activity score. The cytolytic score method, developed by Rooney and
colleagues (Rooney et al., 2015), aims to capture the cytolytic activity of tumour
infiltrating immune cells from tumour RNAseq data by taking the geometric mean of
two cytolytic effectors, granzyme A (GZMA) and perforin 1 (PRF1). This is another
enrichment type method that can be applied to tumour RNA-Seq data.
CIBERSORT. The CIBERSORT tool was an early adopter of the deconvolution
class of enumeration method (Newman et al., 2015). This provided a blueprint to
translate ideas about RNA-based deconvolution from immunology into the cancer
field in 2015, and the CIBERSORT tool has since been widely used for research
applications. The cell-type reference matrix contains signatures for 22 immune cell
subsets, and was derived from public datasets of cell-types extracted from healthy
human blood. Deconvolution is performed using linear support vector regression.
The signature coefficients were derived using microarray data, which may limit
applicability to RNA-Seq datasets.
TIMER. Li and colleagues designed an alternative enumeration method relying on
deconvolution (Li et al., 2016). Here, gene-sets were derived for 6 immune subsets,
based on negative correlations with tumour purity. Constrained least-squares fitting
was the approach used for deconvolution.

Chapter 5. Results
151
5.2.2 Limitations of existing tools
Accuracy is the major limitation of existing RNA-based TME enumeration tools.
Current tools exhibit systematic error compared to “ground-truth” assays like flow
cytometry and IHC, even under ideal conditions. In an analysis of peripheral blood
mononuclear cells, comparison of CIBERSORT estimated cell-type fractions to
FACS-purified cell populations revealed poor accuracy in the identification of key
subsets such as activated memory CD4 T cells (~70%), plasma cells (~60%), and
γδ T cells (~40% accuracy) (Gentles et al., 2015; Newman et al., 2015). Error
introduced by the systematic over- or under-estimation of the infiltration of certain
cell-types might contribute to the limited clinical translation of existing tools. A
recent PD1-inhibitor trial in patients with metastatic melanoma found that
CIBERSORT did not predict CPI response (Liu et al., 2019), despite previous
studies demonstrating a clear association of intra-tumoural CD8+ T-cells with
response to CPI therapy (Edwards et al., 2018).
A minor criticism is a failure to include key cell-types or quantify cell-types at fine
granularity. For the majority of TME enumeration tools, the cell-type reference
matrix is comprised solely of immune cell-type signatures, neglecting the fibroblast
compartment for example. The fitting of an incomplete reference matrix to a bulk
RNA admixture, that contains additional cell-types, both introduces noise (Racle et
al., 2017) and restricts biological interpretation (Becht et al., 2016).
In the past, tools have also been limited by platform restrictions. For example, the
original CIBERSORT tool was developed for use with microarray data (Newman et
al., 2015), so cannot easily be applied to RNA-Seq data due to probe bias and
differences in dynamic range (Ali et al., 2016; Charoentong et al., 2017). However,
this critique has become out-dated as most recent tools are platform agnostic
(Newman et al., 2019).
Chapter 5. Results
152
5.2.3 Cell-type reference profiles
The set of cell-type reference profiles inputted to a TME enumeration tool (Figure
5-1C) is typically a matrix of genes and cell-types, which should reflect cell-type-
specific expression in the human tumour microenvironment. However, the majority
of reference profiles for existing tools were not derived using data from human
cancers. For example, CIBERSORT was developed using RNA data from immune
cells isolated from the peripheral blood and bone marrow of healthy volunteers
(Newman et al., 2015). Another method, derived by Davoli et al, trained a reference
matrix using murine immune subsets (Davoli et al., 2017). The EPIC tool is a
notable exception, which has reference profiles derived using published scRNAseq
data from human cancers (Racle et al., 2017). The CIBERSORT authors
suggested that “the most significant current limitation of CIBERSORT is the fidelity
of reference profiles ... sampling a larger expression space, for example tumour-
infiltrating immune cells, may mitigate this issue” (Newman et al., 2015).
Indeed, there is growing evidence that the molecular profile of stromal cells in
primary tumours differs from healthy tissue. Through in-depth profiling of CD8+ T-
cells from a cohort of NSCLC patients, Ganesan and colleagues established that
TILs displayed signals of increased cycling and TCR-activation relative to cells
isolated from adjacent non-malignant lung tissue, concluding that transcriptional
profiling of purified TILs might help inform clinical decision-making over the use of
CPI therapy (Ganesan et al., 2017). Similarly, Thommen and colleagues found that
TIL populations from lung tumours harboured a distinct transcriptional profile from
cells isolated from healthy blood, exhibiting up-regulated cell cycle and cell division
modules (Thommen et al., 2018).
In a meta-analysis of existing tools, Sturm and colleagues tested analytical
sensitivity to determine the limits of detection (Sturm et al., 2019). Using “pseudo-
bulk” tumours, generated by mixing known cellular proportions from single-cell
datasets, the ability of each tool to reliably detect the abundance of a particular
TME cell subset as significantly different from the background was assessed. The
best performing tool in this benchmark analysis, Xcell (Aran et al., 2017), could

Chapter 5. Results
153
detect most cell-types at >5% infiltration. This performance was attributed to the
fidelity of the Xcell reference matrix (Sturm et al., 2019).
Overall, this highlights the need to understand the difference between blood-,
healthy tissue- and TME-derived signatures. Functional changes for each cell-type
between environmental contexts may undermine the performance of existing cell-
type signatures. Moreover, multiple lines of evidence suggest that the derivation of
tumour-specific cell-type signatures will improve the fidelity of reference profiles,
potentially increasing prediction accuracy.
5.2.4 Enumeration methods
Approaches for quantifying the presence of cell subsets in heterogeneous samples
fall into two categories (Figure 5-1D): enrichment methods and deconvolution
methods (Newman and Alizadeh, 2016; Shen-Orr and Gaujoux, 2013).
Enrichment methods define marker genes, as clusters of genes enriched in specific
TME cell-types, and output low-resolution estimates of cell presence that can be
ranked. Rooney and colleagues justified the use of GZMA and PRF1 expression
levels as marker genes for immune cytotoxic activity as these genes were tightly
co-expressed in patient samples and exclusively expressed by NK (natural killer)
and T-cell subsets (Rooney et al., 2015). Davoli and colleagues developed a set of
signatures through pairwise differential expression of RNA data from the from the
ImmGen database, selecting the top 20 over-expressed genes per cell-type, then
further manually subsetting to genes specific to individual immune cell-types
(Davoli et al., 2017). Instead of geometric mean, this method is applied using
Gene-Set Enrichment Analysis (GSEA). Enrichment methods are robust to
platform-specific noise. For example, an IFN-γ signature predicting response to
PD1 blockade was originally derived using RNA-Seq data (Ayers et al., 2017), and
recently successfully validated on the NanoString nCounter platform (Cristescu et
al., 2018). However, the low-resolution enumeration outputs of marker gene
methods are of limited clinical utility. Furthermore, if marker gene expression is not

Chapter 5. Results
154
cell-type-specific, these methods can be confounded by collinear expression
between closely related cell-types.
Deconvolution methods yield high-resolution numeric estimates of cell-type
proportions. This is akin to performing in silico flow cytometry on admixed RNA
data from bulk tumours. The CIBERSORT method performs deconvolution of RNA
admixtures using support vector regression, a non-linear machine learning
algorithm that fits a regression hyperplane to as many data points as possible, with
hyperplane orientations outputted as equal to estimated cell-type proportions
(Newman et al., 2015). Machine learning algorithms could unpick subtle
transcriptomic differences, overcoming the need for exclusive cell-type-specific
expression for all genes in the reference matrix. Moreover, the CIBERSORT
deconvolution approach was able to accurately enumerate artificially generated
RNA admixtures of increasingly correlated cell-types. However, there is an ongoing
debate over the choice of deconvolution method. Li and colleagues developed
TIMER, which used linear regression-based deconvolution (Li et al., 2016), and
have argued strongly that linear methods are sufficient for the problem of TME
deconvolution (Bo Li et al., 2017; Newman et al., 2017).
Both enrichment and deconvolution approaches have been widely used in the
literature for discovery reasons, but a consensus approach and reproducibility
would be necessary for the next step towards clinical translation.

Chapter 5. Results
155
5.3 RNA profiling of stromal cells from lung cancer patients
5.3.1 Ex vivo purification of 15 TME cell subsets
A cohort of patients with treatment-naïve lung cancer underwent surgical resection
with curative intent in the TRACERx study and also at the University of Edinburgh.
Following surgical resection, tumour and paired non-malignant tissue materials
excess to clinical diagnosis requirements were processed in the research lab to
yield single-cell suspensions of stroma cells. Briefly, tumour and tissue chunks
were finely minced with sterile scalpels before digestion with DNase and
collagenase, followed by removal of dead cells by Ficoll gradient isolation. Single
cell suspensions were isolated from the Ficoll interface and frozen.
Three multiparameter panels were used for FACS to isolate 15 stromal cell-types.
The recovered cell-types can be broadly grouped into three categories, comprised
of lymphoid immune cells, myeloid immune cells, and non-immune stromal cells.
Lymphoid immune cell-types included CD8+ T-cells, CD8+PD1-high T-exhausted
cells, CD8+PD1-low T-effector cells, CD4+ T-cells, CD4+CD25+ T-regulatory cells,
two γδ T-cell subsets, B-cells and NK cells. Myeloid immune cell-types included
neutrophils, dendritic cells (DC), monocytes, and macrophages. Lastly, non-
immune stromal cells were fibroblasts, and endothelial cells.
Two multiparameter panels were used to isolate T-cell subsets and other leucocyte
subsets from TRACERx samples (Figure 5-2, Figure 5-3). The third multiparameter
panel was used to isolate fibroblasts and endothelial cells from University of
Edinburgh samples (Figure 5-4). Overall, 194 samples of stromal cell subsets were
isolated from 28 patients with NSCLC.

Chapter 5. Results
156
Figure 5-2 FACS gating strategy for T-cell subsets Representative samples demonstrating gating strategies of T-cell subsets. Purified cell-types included CD8+ T-cells, CD4+ T-cells, two γδ T-cell subsets, CD8+PD1-high T-exhausted cells, CD8+PD1-low T-effector cells, and CD4+CD25+ T-regulatory cells.
Cells
FSC-A
SSC
-A
Single cells
FSC-A
FSC
-H
ab T cells
gd T cells
TCRgd
CD
3
T cells
CD45
CD
3
CD4 T Cells
CD8 T Cells
CD4
CD
8
Vd1
Vd2
Vd2
Vd1
T effector
T exhausted
CD45RA
PD1
Treg
CD4
CD
25
T cells ab T cells
gd T cells CD8 T cells CD4 T cells
Single Cells
Live
Live-Dead
SSC
-A
Cells Live Cells

Chapter 5. Results
157
Figure 5-3 FACS gating strategy for other leucocyte subsets Representative samples demonstrating gating strategies of other leucocyte subsets. Purified cell-types included B-cells, monocytes, NK cells and DCs.
Figure 5-4 FACS gating strategy for non-immune stromal cell subsets Representative samples demonstrating gating strategies of non-immune stromal cell subsets. The purified cell-types were fibroblasts, and endothelial cells.
Non T cells OthersLive Cells
Non T cells
CD45
CD
3
B cells
Monocytes
Others
CD14
CD
19
NK cells
Non NK
CD14
CD
56
Dendritic cells
CD11b
CD
11c
Non NK
Non haematopoietic stromaLive Cells
Non haematopoietic stroma
CD45
EpC
AM
Endothelial cells
Fibroblasts
CD31
EpC
AM

Chapter 5. Results
158
5.3.2 Genome-wide RNA profiling of isolated cell-types
Following FACS, the sorted cell-types were processed using RNA extraction and a
protocol for low input amounts of RNA (Smart-Seq2 (Picelli et al., 2014)) was used
for library preparation. Genome-wide RNA expression levels were quantified
through RNA-Seq, to a depth of ~20 million reads per sample, across the 15
stromal cell subsets. For quality control prior to downstream analysis, samples
were filtered according to two quality metrics: flow cytometry (antibody staining)
and RNA-Seq (number of genes uniquely aligned). In the flow cytometry quality
control step, 16 samples were excluded (15 γδ T-cell samples, and 1 T-reg sample)
due to poor CD8+ staining. The cutoff for the number of genes uniquely aligned
was set to >3,500. In this quality control step 19 additional samples were excluded.
After quality filtering, genome-wide expression values were obtained for 159
samples from 24 patients. Of these, 87 samples originated from lung tumours and
72 from matched non-malignant lung tissue.
The expression profiles of canonical cell-type marker genes were examined to
assess the purity of cell populations isolated by FACS, and also RNA-Seq efficacy
(Figure 5-5). This was broadly reassuring, for example the cell surface glycoprotein
CD8B was exclusively expressed by the three subsets of CD8+ T-cells as would be
expected. Similarly, the genes coding for the B-cell lineage marker (CD19), and
endothelial cell lineage marker (CD31) were exclusively expressed by their
respective cell-types. The expression profiles also verified subtler FACS gating. For
example the PD1 gene (PDCD1) was expressed by both T-effector and T-
exhausted cell subsets, but at different levels reflecting the use of FACS gating
threshold. Of note, PD1 expression was also observed in neutrophils and
macrophages. A biological role for PD1 expression in tumour-associated
macrophages is becoming established, increasing with disease stage in human
cancers and impairing phagocytosis of cancer cells in a mouse model (Gordon et
al., 2017). However, while characterized in other disease settings such as infection
with tuberculosis bacteria or human immunodeficiency virus), the role of PD1-high
neutrophils in cancer is less clear. This simple analysis also revealed the potential

Chapter 5. Results
159
of unbiased transcriptomic characterization to uncover novel biology around the in
situ phenotype of stromal subsets.
Figure 5-5 Expression of cell surface marker genes used for FACS The expression of individual marker genes are plotted for lymphoid immune (purple), myeloid immune (red), and non-immune (yellow) stromal populations. Lymphoid immune subsets: CD8 T-cells (CD8B), Tex (PD1-high), Teff (PD1-low), CD4 T-cells (CD4), Treg (CD25), B cells (CD19), and natural killer cells (CD16). Myeloid immune subsets: neutrophils (CD15), dendritic cells (CD11c), monocytes and macrophages (both CD14-high). Non-immune stromal subsets: fibroblasts (CD90), endothelial cells (CD31).

Chapter 5. Results
160
5.3.3 Global expression profiles reflect cell-type of origin
To decipher transcriptional patterns between all the stromal lung samples,
unsupervised clustering algorithms were applied to their global expression profiles
(Figure 5-6). The UMAP analysis revealed cell-type of origin was a major
discriminating factor between samples, with samples from several cell-types
clustering together. This included αβ T-cells, NK cells, B-cells, neutrophils,
endothelial cells, and fibroblasts as indicated on the UMAP (Figure 5-6A-B).
Lineage restrictions for individual cell-types might be expected to have a large
bearing on global expression profiles. For example, transcriptional diversity
(measured as the total number of genes expressed by a cell) has recently been
shown to decrease during normal differentiation (Gulati et al., 2020).
By contrast, the tissue of origin had a varying influence between cell-types, as can
be seen from the PCA. Examining the means of PC1 and PC2, for each individual
cell-type, the γδ T-cell samples exhibited the clearest distinction between normal
and cancerous lung tissue (Figure 5-6C-D). To decipher subtler effects of cell-
extrinsic factors, such as hypoxia in the TME, in the next section I moved to
exploring the pathways and genes involved in tissue-specific expression profiles.

Chapter 5. Results
161
Figure 5-6 Global transcriptomic analysis Unsupervised clustering analyses of the relationship between global expression profiles for all the lung stromal cell-types assessed. UMAP shown with the colour scheme highlighting cell-type (A) or tissue (B) of origin. PCA (C) and bar plots for the means of the PC1 and PC2 values per cell-type(D).
Chapter 5. Results
162
5.4 Tissue-specific signals of stromal cells in the lung tumour microenvironment
5.4.1 Global tissue differences
To identify cell-type-specific molecular signals related to tumour infiltration, here I
analysed the transcriptomes from the 15 stromal cell-types purified from tumour
tissue and – the best control tissue available – adjacent non-cancerous lung.
For a broad insight into normal-tumour transcriptomic differences within individual
stromal cell-types, I performed a pathway analysis of the 50 hallmark gene-sets
from the Broad Molecular Signatures database (Subramanian et al., 2005). This
analysis revealed most (12/15) cell-types displayed differences in hallmark pathway
activities (Figure 5-7); no pathways were significantly altered in Vδ2 cells,
fibroblasts or endothelial cells. Interestingly, the Vδ1 subset was the cell-type with
differential activation in the greatest number of hallmark pathways, which may
reflect mounting evidence that these cells may be tissue-resident immunological
rheostats for epithelial transformation. Indeed, they are present and enriched in the
epithelium of myriad organs and can mount rapid and potent responses to
conserved molecular signals of malignant transformation (Cruz et al., 2018; Mikulak
et al., 2019; Wu et al., 2019).

Chapter 5. Results
163
Figure 5-7 Pathway differences between normal and cancerous lung Differences in pathway activities between normal or cancerous lung tissue for each stromal cell subset. The 50 hallmark gene-sets from the Broad Molecular

Chapter 5. Results
164
Signatures database were used. Significant t-values indicated for gene-sets enriched in tumour (red) or normal (blue) lung tissue.
5.4.2 Tissue differences specific to individual T-cell subsets
For an unbiased exploration of tumour-normal differences, differential expression
analysis was performed for cell-types of the T-cell compartment (Figure 5-8). This
analysis identified a number of differentially expressed genes (DEGs) by tumour
infiltrating T-cells relative to expression in normal lung: 89 DEGs in CD8+ T-cells,
116 DEGs in T-exhausted cells, 270 DEGs in T-effector cells, 87 DEGs in CD4+ T-
cells, 501 DEGs in T-regulatory cells, 208 DEGs in γδ Vδ1 T-cells, and 84 DEGs in
γδ Vδ2 T-cells.
The expression of some immune checkpoint molecules were up-regulated in the
TME, including the ligand for CTLA4 (CD80) in CD8+ T-cells, and the gene
encoding the TIM3 inhibitory receptor (HAVCR2) in T-exhausted cells (Figure
5-8A). Ganesan and colleagues have recently shown that CD8+ TILs expressed
higher levels the T-cell co-stimulatory molecule 41BB (TNFSF9), reflecting TCR-
engagement (Ganesan et al., 2017). In my analysis, I observed a similar signal
restricted to the T-effector subset of CD8+ T-cells. Tumour infiltrating T-cells also
displayed enhanced cytotoxic potential, with the upregulation of granzyme
molecules in T-exhausted (GZMM) and γδ Vδ1 (GZMA, GZMB) T-cell subsets
(Figure 5-8A & D). The over-expression of genes involved in DNA synthesis
(CDC45 in CD8+ T-cells), DNA repair (POLE2 and RAD51 in CD8+ T-cells; POLA2
in CD4+ T-cells and T-regs), and cell cycle progression (CDK1 in T-effector cells;
CDK3 in T-exhausted cells and T-regs) suggested the increased division and
activation of T-cells in the TME (Figure 5-8A-B). This unbiased analysis indicated
major changes in the gene expression landscape of CD8+ T-cells in lung tumour
tissue, broadly in line with previous findings.

Chapter 5. Results
165
Figure 5-8 Transcriptomic profiles of tumour infiltrating T-cells Volcano plots of differentially expressed genes in T-cells sourced from tumour versus normal lung tissue. Subsets of CD8+ T-cells (A), CD4+ T-cells (B), and γδ T-cells (C) are shown. Significantly differentially expressed genes are highlighted (gray): Log2 Fold Change >2, BH adjusted P-value < 0.01. T = tumour over-expression, N = normal over-expression.
T-exhausted cells are known to show impaired anti-tumour function, with cell-
intrinsic restrictions to cancer cell killing (Philip et al., 2017; Thommen et al., 2018).
Intriguingly, in my dataset, a number of neutrophil chemoattractant genes were up-
regulated in T-exhausted cells within the TME (Figure 5-8A right panel), including
members of the CXC (CXCL2, CXCL8, CXCL1, CXCL3) and interleukin (IL17C)

Chapter 5. Results
166
families of pro-inflammatory chemokines. In a previous analysis of TME cellular
composition, neutrophils were found to be the immune cell-type most adversely
associated with survival outcomes across >18,000 tumours (Gentles et al., 2015).
Therefore, this preliminary finding could indicate that “bad” T-exhausted cells might
serve a pro-tumour function in recruiting neutrophils to the TME.
An important caveat to the differential expression results presented here are the
extremely large fold-change values (Figure 5-8), particularly as a pronounced
signal differentiating normal from tumour samples was not observed in
unsupervised clustering analysis (see 5.4.1). Similar fold-change values have been
reported for sorted cell-types (Uhlen et al., 2019). However, technical artifacts
could be present. For example, there are a substantial number of zero-expressed
genes in RNA-Seq data generated from low-input RNA samples, which may
exaggerate fold-change values.
5.4.3 Tissue context may influence the expression of canonical cell-type markers
The phenotype of stromal cells might be substantially altered by cell-extrinsic
stresses operating in the TME, such as tissue hypoxia (Lambrechts et al., 2018),
increased glycolysis (Bohn et al., 2018; Rice et al., 2018), or altered ionic gradients
(Eil et al., 2016). Recent work has shown “drifts” in gene expression between
stromal cells in non-malignant and cancerous lung (Ganesan et al., 2017;
Lambrechts et al., 2018). The impact of such “drifts” on the performance of RNA-
based TME enumeration methods is currently unknown (Newman and Alizadeh,
2016).
Here I assessed four marker-gene-based TME scoring methods, developed by
Rooney et al, Davoli et al, Danaher et al, and Bindea et al (Bindea et al., 2013;
Danaher et al., 2017; Davoli et al., 2017; Rooney et al., 2015). The expression
levels of these published signatures were evaluated in my RNA-Seq dataset of ex
vivo purified lung stromal cell-types. This analysis focussed on cell-types with at
least 5 samples for both normal and tumour tissue available, to enable
Chapter 5. Results
167
comparisons. A summary metric was generated for the expression levels of each
signature, taking the geometric mean across genes specified in the gene-list. The
sample-specific scores were calculated for each cell-type, and were plotted
separately for normal and tumour samples (Figure 5-9).
In the analysis of six CD8+ T-cell signatures, scores resulting from the method
developed by Bindea et al (Bindea et al., 2013) differed significantly between
stromal cells isolated from normal versus tumour (Figure 5-9A). The Bindea CD8+
T-cell signature was based on the expression of CD8A and PRF1 genes. CD8A
might be expected to be core transcriptional features of this cell-type, whereas
PRF1 might be more subject to phenotype molding by tissue environment. The
examination of two CD4+ T-cell signatures and four NK cell signatures did not
indicate strong tissue-specificity (Figure 5-9B-C). However, evaluating six
macrophage signatures revealed the gene-list determined by Danaher et al
(Danaher et al., 2017) was relatively over-expressed in macrophages isolated from
non-malignant lung tissue relative to macrophages purified from tumour samples
(Figure 5-9D). The Danaher macrophage signature also relied on genes generally
regarded as canonical marker-genes (CD163, CD68, CD84, MS4A4A). Overall, this
analysis suggested that, in some cases, it might be useful to discriminate molecular
features invariantly linked to cell-type, regardless of tissue environment.
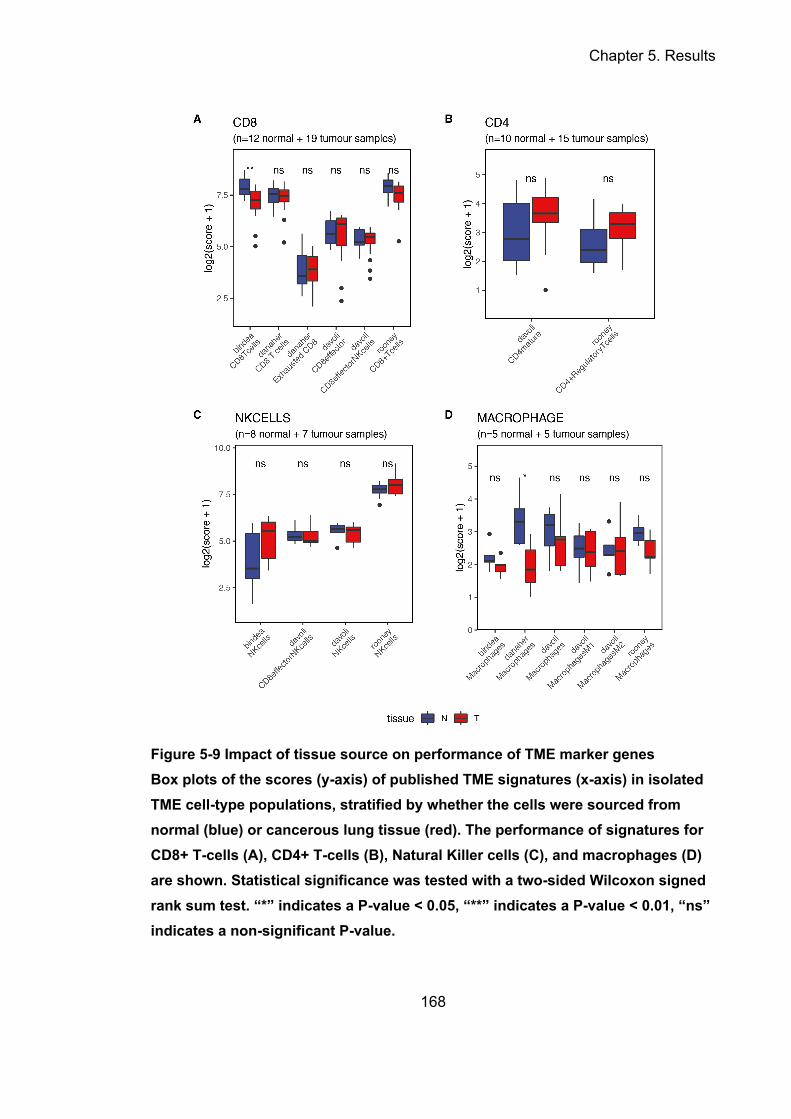
Chapter 5. Results
168
Figure 5-9 Impact of tissue source on performance of TME marker genes Box plots of the scores (y-axis) of published TME signatures (x-axis) in isolated TME cell-type populations, stratified by whether the cells were sourced from normal (blue) or cancerous lung tissue (red). The performance of signatures for CD8+ T-cells (A), CD4+ T-cells (B), Natural Killer cells (C), and macrophages (D) are shown. Statistical significance was tested with a two-sided Wilcoxon signed rank sum test. “*” indicates a P-value < 0.05, “**” indicates a P-value < 0.01, “ns” indicates a non-significant P-value.

Chapter 5. Results
169
5.5 Cell-type-specific expression profiles for lung stroma
5.5.1 Genome-wide similarity analysis of cell-type expression profiles
To further decipher the phenotypic relationships between purified lung stromal cell-
types, I calculated pairwise correlations of the transcriptomic landscape for the 15
TME cell-types, and then performed unsupervised hierarchical clustering on the
similarity measures (Figure 5-10). The correlation coefficients indicated that most of
the lymphoid immune cell-types formed a cluster of highly correlated (Rs > 0.75)
cell-types. The γδ Vδ1 and Vδ2 T-cells subsets formed the exception, clustering
instead with non-immune stromal cells (endothelial cells, fibroblasts) and
monocytes. Neutrophils and macrophages formed a separate cluster.
Figure 5-10 Pairwise correlation analysis of the transcriptomic landscape for stromal cell-types A, Heatmap showing the pairwise Spearman correlation between the transcriptomic landscape for the 15 analysed lung stromal cell subsets. B, Dendrogram showing the clustering similarities in transcriptomic landscapes between different stromal cell subsets.

Chapter 5. Results
170
5.5.2 Derivation of marker genes specific to individual stromal cell-types
To investigate the potential to derive cell-type-specific marker genes from my
dataset, the cell-type expression specificity was evaluated for each individual gene.
I adopted the method described by Uhlen et al (Uhlen et al., 2019) in their recent
Human Blood Atlas paper, which was used to derive cell-type specificity categories
for gene expression in cell-types isolated from human blood.
All genes were classified into five expression specificity categories according to the
following criteria:
1) Cell-type enriched: expression level (TPM) in a cell-type at least four times
any other cell-type
2) Group enriched: expression level (TPM) in a group of cell-types (2-10) at
least four times any other cell-type
3) Cell-type enhanced: expression level (TPM) in a group of cell-types (2-10) at
least four times the average (mean) of other cell-types
4) Low cell-type specificity: detectable expression level (TPM ≥1) in at least
one cell-type, but not elevated in any cell-type
5) Not detected: low expression level TPM (< 1) in all cell-types
The proportion of genes in each of the five specificity categories was calculated
(Figure 5-11A-B). Of all 24,372 aligned genes, more than half (59.6%,
14,535/24,372) displayed detectable but non-specific expression across the 15
stromal cell-types (group enriched). Only 10.1% (2,452/24,372) of genes were
classified as showing enriched expression unique to one of the cell-types (cell-type
enriched). Neutrophils (700), Vδ1 subset (485), and macrophages (446) had the
largest number of cell-type enriched genes. Whereas most lymphoid immune cell
subsets harboured substantially fewer cell-type enriched genes: CD8+ T-cells (3),
T-exhausted cells (20), T-effector cells (5), CD4+ T-cells (24), T-regulatory cells
(66), B-cells (38) and NK cells (9). These data were consistent with the similarity
analysis from the previous section (Figure 5-10), and highlight the challenge of
identifying robust marker genes in cell-types with a largely shared differentiation
hierarchy and close phenotypic alignment.

Chapter 5. Results
171
Figure 5-11 Candidate cell-type-specific marker genes The number of genes categorized by specificity of expression, shown as summary percentages across all 15 TME cell-types (A), and the breakdown for individual cell-types (B). Heatmaps plotting gene expression for genes (x-axis) across by cell-type (y-axis) the 15 stromal subsets (C), separated by specificity category: cell-type enriched (top left), cell enhanced (top right), group enriched (bottom left), and low cell-type specific (bottom right) genes.

Chapter 5. Results
172
Lastly, I examined whether cell-type specific genes could discriminate between
stromal subsets. Hierarchical clustering was performed on genes from four of the
expression specificity categories (Figure 5-11C). The genes from the cell-type
enriched specificity category (10.1%, 2,452/24,372) clustered together within –and
were mostly expressed uniquely by – individual stromal cell-types. This pattern of
tightly clustered modules was recapitulated, to some extent, by genes from the
group-enriched specificity category (59.6%, 14,535/24,372), with more
promiscuous expression across stromal cell subsets. By contrast, genes from the
cell-type enhanced (15.3%, 3,722/24,372) and low cell-type specificity categories
(15.0%, 3,650/24,372) were both homogeneously expressed between cell-types,
with little apparent clustering of genes. This analysis indicated that the subset of
cell-enriched genes (and possibly also the group-enriched specificity categories)
might represent core transcriptional features of individual cell-types. Such genes
could provide a foundation for the derivation of robust marker genes.

Chapter 5. Results
173
5.6 Conclusions
5.6.1 Summary of findings
In this chapter I have developed an atlas of genome-wide expression profiles for
lung stromal cell-types (Figure 5-12). The 15 cell-types profiled comprised seven
subsets of T-cells, B-cells, five subsets of the innate immune system, as well as
fibroblast and vascular cells. Overall, bulk RNA-Seq data was generated for 159
samples from 24 patients; 87 samples from lung tumours and 72 from adjacent
non-malignant lung tissue).
Preliminary analyses of tissue differences revealed the phenotypic adaptation of
stromal cells to the lung TME. For example, tumour infiltrating T-cell subsets
displayed signals of increased cell cycling and TCR-activation, consistent with
recent analyses (Ganesan et al., 2017; Lambrechts et al., 2018). In addition, the
subset of CD8+PD1-high T-exhausted cells was observed to over-express
neutrophil chemoattractants in the tumour milieu. If further validated, this could
suggest a novel pro-tumour function of the CD8+PD1-high T-exhausted cell subset,
beyond the well-characterized cell-intrinsic restrictions to cancer cell killing (Philip
et al., 2017; Thommen et al., 2018). I also assessed whether published marker
genes methods displayed “drifts” in gene expression according to tissue
environment. A CD8+ T-cell and a macrophage signature significantly differed
between stromal cells in non-malignant and cancerous lung tissue in my dataset.
This indicates, in some cases, paired tumour-normal analyses of purified stromal
cell subsets might be useful to further discriminate molecular features invariantly
linked to cell-type.
Analyses of cell-type similarities revealed the global expression profiles of several
lymphoid immune cell-types were highly correlated, underlining the challenge of
deriving marker genes robust to confounding by collinear expression between
closely related cell-types. Overall, 10% of genes were classified as showing cell-
type-specific expression unique to an individual cell-type, which could provide a
foundation for the derivation of robust marker genes.

Chapter 5. Results
174
Figure 5-12 Outline of the analysis of stromal cell-types from lung tissue A diagram illustrating the experimental and informatics workflow to analyse RNA profiles in lung stromal cell-types, sourced from tumour and adjacent non-malignant lung tissue, and to derive marker genes. The 15 cell-types listed include seven subsets of T-cells, B-cells, five subsets of the innate immune system, as well as fibroblast and vascular cells.

Chapter 5. Results
175
5.6.2 Future work
In future work, I will aim to develop a computational tool to accurately deconvolute
immune and stromal TME cell-types from bulk tumour RNAseq data. As described
in the background, a litany of tools for RNA-based TME enumeration is currently
available. The approach taken in this chapter has two major novelties over existing
methods. Firstly, the ex vivo purification of TME cell subsets in a granular and
comprehensive manner. The 15 stromal cell-types profiled here encompass major
adaptive and innate immune classes, and also rarer subsets of emerging clinical
interest such as CD8+PD1-high T-exhausted cells (Thommen et al., 2018).
Moreover, the inclusion of primary fibroblasts (both normal and cancer-associated
fibroblasts) and endothelial cells contribute towards a comprehensive molecular
map of the cells constituting the lung TME (Becht et al., 2016). Secondly, the
purification of stromal populations present in both tumour samples and adjacent
non-malignant lung tissue (the best available control) enables the discrimination of
features linked to lung-tissue residence from those related to tumour infiltration
(Ganesan et al., 2017; Lambrechts et al., 2018). The purification of cell-types
directly post digest will also help characterize the in situ phenotype of stromal cells.
To identify the optimal algorithm for TME deconvolution in the setting of high-fidelity
reference profiles, I will perform a head-to-head comparison of a number of
supervised machine learning methods, including linear least- squares regression
(Li et al., 2016), quadratic programming (Gong and Szustakowski, 2013) and
support vector regression (Newman et al., 2015). The algorithms will be trained on
pseudo-bulk tumour generated from publically available scRNAseq datasets (Sturm
et al., 2019). Orthogonal validation will be conducted leveraging a large cohort of
patients (n≥200) with tumour RNAseq data from TRACERx, and using paired H&E
counting TIL estimates and flow phenotyping to provide a ground-truth measure of
TME cell-types.
The availability of high-fidelity cell-reference profiles and an optimised enumeration
method could pave the way for accurate digital dissection of the TME, helping to
expedite the delivery of precision immune-oncology (Dijkstra et al., 2016). As

Chapter 5. Results
176
discussed in section 1.5 of this thesis, potential clinical applications include
evaluating immune contexture as a diagnostic framework and resolving the milieu
for environment-mediated drug resistance.
A particularly exciting avenue of future work would be to test the contribution of the
TME signatures to RNA-ITH, linking the results of this chapter to Chapter 3 and
Chapter 4. Recent work suggests it is likely that intra-tumoural immune variation
may influence the patient-level estimates of RNA-ITH derived in this thesis (section
3.2). Analysing multi-region RNA-Seq data from a cohort of patients with NSCLC,
Rosenthal et al discovered that 28% of patients exhibited immunologic
heterogeneity, and that these tumours tended to exhibit higher levels of genetic ITH
than tumours with uniformly low levels of immune infiltration (Rosenthal et al.,
2019). Immune ITH has also been observed within individual ovarian tumours
(Zhang et al., 2018) and between metastatic sites in patients with colorectal cancer
(Mlecnik et al., 2018, p. 201).
In addition, ascribing the contribution of different tumoural cell populations to the
expression levels of individual genes could enable further dissection of gene-level
RNA-ITH (see section 4.3). Potentially the bulk TME cell populations identified in
this chapter would be sufficient for a low-resolution analysis, for example Puchalski
et al examined “anatomic” ITH of glioblastomas by defining gene-sets
corresponding to immune-infiltrated, cellular or microvascular tumour regions
(Puchalski et al., 2018). Distinct RNA profiles for immune, stromal and cancerous
cells can also be discovered from unsupervised analysis of bulk spatial
transcriptomics data, as demonstrated in prostate tumours (Berglund et al., 2018).
Tracking gene expression down to the level of individual cancer clones is likely to
be a nuanced challenge however, which may require single-cell resolution
(discussed further in section 7.2.1). Moreover, inter-cellular RNA heterogeneity has
been reported even within TME cell populations: in breast cancer, Costa et al
identified four fibroblast subtypes, which could be distinguished based on surface
marker expression, and exhibited distinct phenotypic properties (Costa et al.,
2018).

Chapter 6 Results
177
Chapter 6. Evolutionary dependencies
6.1 Introduction
In most cancer types it is not currently possible to chart and forecast the
progression of an evolving tumour in a predictable manner. Yet several lines of
evidence hint at the existence of evolutionary constraints, including reports of
parallel evolution or conserved mutational orderings (Greaves, 2015; McGranahan
and Swanton, 2017), as discussed in the overview of literature (1.3.4).
Several computational tools have been developed to systematically detect
combinatorial patterns of mutations in cancer NGS datasets (Deng et al., 2019).
However, the design of these tools overlooks the branching clonal architecture that
characterizes most cancer genomes. This might restrict the tools’ ability to detect
epistatic interactions involving subclonal mutations, and partially explain their
limited utility in discovering core evolutionary dependencies across cancer-types
(Vandin et al., 2012).
In this chapter an overview of existing computational tools to detect epistatic
interactions in cancer genomes is provided. Their limitations are also mentioned,
including evidence from the literature that mutation clonality might represent an
unaddressed confounding factor for their use. Lastly, I analysed mutation clonality
and mutual exclusivity in driver genes across nine cancer-types, to examine
whether the clonal status of driver genes influenced the detection of epistatic
interactions.

Chapter 6 Results
178
6.2 Deciphering epistatic interactions in cancer genomes
6.2.1 Combinatorial patterns of mutations in cancer
Large-scale cancer genomics projects have helped to define a set of driver
mutations, which are causally implicated in tumourigenesis (Bailey et al., 2018;
Kandoth et al., 2013) and, in some cases, can serve as predictive biomarkers for
genome-targeted therapies (Hyman et al., 2017). Studying the combinatorial
patterns of gene mutations in cancer might further reveal functional relationships
between driver genes, and ultimately help inform clinical decision-making over
treatment (Yeang et al., 2008).
Mutations in cancer driver pathways tend to exhibit one of two mutually exclusive
(ME) patterns. “Soft” mutual exclusivity patterns, with partially overlapping
mutational events, are consistent with Darwinian evolution as cancer cells with
multiple mutations in the same cellular pathway are rarely conferred with an added
selective advantage (Yeang et al., 2008). For example, Sparks and colleagues
conducted targeted sequencing for mutations in the B-catenin pathway in a cohort
of APC-wildtype colorectal tumours, discovering that 48% of patients harboured
mutations in CTNNB1 (Sparks et al., 1998). This mutually exclusive relationship
indicated CTNNB1 mutations might have a similar phenotypic effect to APC
inactivation, and that B-catenin signalling is a core pathway in colorectal
tumourigenesis.
Alternatively, “hard” patterns of ME display little to no overlap between mutational
events, occurring when alterations to a second pathway member decreases cellular
fitness (Babur et al., 2015; Ciriello et al., 2012). Such synthetic lethal relationships
can occur within a core linear signal transduction pathway or between subunits of
an essential protein complex (Kaelin, 2005). For example, A ME interaction
between CCNE1 gene amplification and BRCA1/2 mutation was observed in the
TCGA dataset of high-grade serous ovarian cancers (Ciriello et al., 2012), and later
verified as a synthetic lethal relationship through an in vitro short-hairpin RNA
screen (Etemadmoghadam et al., 2013).

Chapter 6 Results
179
By contrast, mutations of genes from different pathways might yield additive or
even synergistic effects, so might be expected to co-occur (CO) (Yeang et al.,
2008). For example, loss of Pbrm1 cooperated with Kras in driving tumour
development in a mouse model of pancreatic cancer (Varela et al., 2011). Co-
occurring mutational patterns are also relevant for predicting response to treatment.
Pre-treatment profiling of patients with EGFR-mutant lung cancer receiving EGFRi
revealed limited responses in tumours with co-occurring alterations in cell cycle
genes (median PFS = 0.7 months in CDK4/6-altered versus 11.2 months in
CDK4/6-wildtype) (Blakely et al., 2017), and co-occurring alterations in TP53 or
RB1 was associated with acquired resistance through transformation to small-cell
carcinoma (Lee et al., 2017).
6.2.2 Computational tools for the systematic identification of epistatic interactions in cancer NGS datasets
Over the last decade the availability of large NGS datasets has allowed
development of several tools to systematically detect combinatorial patterns of
mutations. These tools can identify driver mutations, including novel genes
overlooked by frequency-based methods (Babur et al., 2015), and assign the
identified drivers to biological pathways, permitting discovery of novel tumourigenic
roles (Ciriello et al., 2012; Hua et al., 2016; Miller et al., 2011).
The MEMo (Mutual Exclusivity Modules in cancer) tool, developed by Ciriello and
colleagues, was an early success of such approaches (Ciriello et al., 2012). In
glioblastoma (GBM) samples from the TCGA pilot project, MEMo identified ME
interactions between the Rb, TP53, and RTK pathways, suggesting the
deregulation of one component in each of these core pathways relieved the
selective pressure for additional alterations. This relationship had a high “coverage”
(the number of patient samples in which at least one alteration occurred), with 74%
of the GBM patient cohort harbouring aberrations in all three pathways (Cancer
Genome Atlas Research Network, 2008). This suggested that aberrant signalling of
all three pathways might represent a core evolutionary dependency for GBM
pathogenesis

Chapter 6 Results
180
Figure 6-1 The detection of combinatorial patterns in cancer genomics datasets A, ME/CO detection tools take as input a binary mutation matrix, classifying mutations in genes (columns) as present (blue) or absent (white) for each patient (rows). B, The identification of ME/CO interactions involves the assessment of whether the overlap between genes is greater than expected by chance (indicating CO), or less (ME).
Existing tools for ME/CO detection take binary mutation matrices as input (Figure
6-1A). Using the mutation matrix, genes with more or less overlap than would be
expected by chance are detected as significant CO or ME respectively (Figure
6-1B). Tools can be classified as de novo, or requiring prior pathway information,
such as protein-protein interaction networks (Ciriello et al., 2012), pathways from
the KEGG database (Hua et al., 2016), or the results of synthetic lethal screens
(Jerby-Arnon et al., 2014). Discovering ME/CO interactions at the pathway or gene-
set level is an NP-hard problem. For example, in cancer datasets there are 108-1011
possible combinations of four genes (Vandin et al., 2012). The search methods
used to circumvent this problem, and discover significant ME/CO interactions, differ
between tools. Some tools use heuristic algorithms, such as the Markov Chain
Monte Carlo method (Leiserson et al., 2015; Vandin et al., 2012), others use a
generative probabilistic model (Constantinescu et al., 2016; Szczurek and
Beerenwinkel, 2014). Initially limited to point mutation data, recent ME/CO
detection tools can take a range of inputs, including SCNA (Mina et al., 2017) and
expression changes (Zhao et al., 2012).

Chapter 6 Results
181
Here, I used two approaches to assess ME relationships.
TiMEx. A generative probabilistic model that detects pairwise or gene-set level ME
relationships (Constantinescu et al., 2016). Viewing tumourigenesis as a dynamic
process, TiMEx models the alteration process for each gene as a Poisson process.
This enables functional relations to be inferred based on a temporal representation
of underlying mutational processes.
DISCOVER. The assumption that gene alterations across tumours are independent
and identically distributed (i.i.d) is commonly made by tests for ME/CO, including
TiMEx. Yet this assumption may be unrealistic for cancer genomics data, and might
invalidate estimates of significance. The DISCOVER (Discrete Independent
Statistic Controlling for Observation with Varying Event Rates) tool aims to address
this (Canisius et al., 2016). A Poisson-binomial model is used to estimate gene
alteration probabilities for each tumour individually, permitting different tumours to
have different mutation rates for the same gene. The DISCOVER authors
concluded that statistical tests assuming i.i.d. might over-detect CO relationships,
and under-detect ME relationships.

Chapter 6 Results
182
6.2.3 Hypothesis: mutation clonality may be an unaddressed confounding factor for ME detection
The utility of existing tools for ME detection is limited by a number of challenges,
including the low coverage of detected ME interactions. Most reported ME gene-
sets typically have far less than 100% coverage, casting doubt on their importance
for oncogenic progression. In the latest lung cancer paper from the TCGA
consortium, the RTK–Ras–Raf pathway was not altered in 15–25% of LUAD
tumours (Campbell et al., 2016). Most authors suggest technical challenges,
including measurement noise or false mutation calls, are to blame (Szczurek and
Beerenwinkel, 2014). However, Vandin and colleagues have previously speculated
that ITH between subpopulations of tumour cells could be an important source of
“false negatives” (Vandin et al., 2012). Enabling detection of subclonal ME
interactions may help increase driver pathway coverage. Indeed, existing ME
detection tools take tumour-level information (a binary mutation matrix of patients
by genes) as input, ignoring the clonal architecture of individual tumours.
I hypothesised that mutation clonality may be an unrecognised confounding factor
for ME detection (Figure 6-2). This hypothesis suggests that the presence of
subclonal mutations in separate lineages of a tumour’s phylogenetic tree, that are
mutually exclusive within the individual tumour, would wrongly be classified as co-
occurring.
There is direct evidence for such an effect. In a cohort of melanoma patients,
mutations in NRAS and BRAF exhibited a co-occurring relationship. However,
when examined at the single-cell level, the two mutated oncogenes were never
present within the same cancer cell, indicating a “hard” mutual exclusivity (Sensi et
al., 2006). Similarly, in a multi-region cohort of renal tumours BAP1 and
SETD2/PBRM1 mutations were found to co-occur at the tumour-level, yet a clone-
level analysis revealed a true ME relationship, with events in the same tumour
often occurring in spatially separated subclones (Turajlic et al., 2018).

Chapter 6 Results
183
Figure 6-2 Hypothesis: existing ME detection tools may be biased to detect interactions between clonally mutated genes Schematic diagram showing how tools for ME detection may fail to detect ME interactions between subclonal mutations. Under “biological truth” (left) the phylogenetic trees are shown for three patients (1,2,3). In the first row, each patient harbours a clonal mutation in one of three different genes (A, B, C) that, hypothetically, could be involved in the same signalling pathway. In the second row, each patient harbours subclonal mutations with the same gene altered in every branch of the tumour’s phylogenetic tree; this phenomenon is referred to as parallel evolution. Lastly, in the third row, all three genes are subclonally mutated in the branches of each individual tumour. The “binary mutation matrix” plots (middle) show how the tumour’s evolutionary history would be simplified for input to a ME detection tool, with mutations in each gene (columns) classified as present or absent at the patient-level (rows). The “detected ME gene-set” (right) reveals the impact of this simplification: true ME interactions between clonally mutated genes can be detected (top); similarly, in the rare case of parallel evolution within the same gene, ME interactions between subclonally mutated genes can also be recovered; however, if distinct genes from the same pathway are subclonally mutated within individual tumours, the ME interaction will not be detected, even though mutations may never co-occur in the same cancer cell.

Chapter 6 Results
184
My hypothesis also suggests that existing ME/CO detection tools are biased to
detect clonal mutations in driver pathways. The Dendrix algorithm has previously
identified two mutually exclusive gene sets in LUAD tumours from TCGA (Vandin et
al., 2012): the first ME gene-set consisted of EGFR, KRAS, and STK11; the second
contained TP53 and ATM. Indeed, these five genes were all classified as “early”
clonal drivers (pre-genome doubling initiating mutations or post-genome doubling
clonal mutations) in an analysis of multi-region WES data the first 100 patients from
the TRACERx lung study (Jamal-Hanjani et al., 2017).
Therefore, in this chapter I examine the influence of mutation clonality on ME
detection in a pan-cancer analysis.

Chapter 6 Results
185
6.3 The clonal status of driver genes associates with the proportion of significant findings in mutual exclusivity analyses
6.3.1 Classifying mutation clonality and mutual exclusivity in driver genes
To explore whether mutation clonality confounds ME detection, I analysed somatic
mutation data from the pan-cancer TCGA study. A focussed analysis was
performed on the nine cancer-types recently examined by Haar and colleagues in
their analysis of the mutation load artifact on the performance of ME detection tools
(Haar et al., 2019).
Saioa López ran data pre-processing steps, including variant calling and estimation
of mutation clonality. This was fully described in her recent publication (López et
al., 2020), and briefly summarised here. Whole exome-sequencing data was
accessed from the TCGA data portal for 3,545 patients from nine major cancer-
types (Figure 6-3A): bladder urothelial carcinoma (BLCA, n=384 patients), breast
invasive carcinoma (BRCA, n=643), colon adenocarcinoma (COAD, n=276), LUAD
(n=463), LUSC (n=447), rectal adenocarcinoma (READ, n=85), skin cutaneous
melanoma (SKCM, n=443), stomach adenocarcinoma (STAD, n=380), uterine
corpus endometrial carcinoma (UCEC, n=424). This data was processed through
the TRACERx bioinformatics pipeline, to which several members of the Swanton
and McGranahan labs have contributed (Jamal-Hanjani et al., 2017); see Methods
for more detail.
To test my hypothesis, I performed further filtering of somatic mutation calls.
Nonsense and missense mutations were selected for use in downstream analysis.
Mutations were further subsetted to candidate driver genes, using a pan-cancer
gene-list published by Bailey and colleagues, which consists of 200 oncogenes and
tumour suppressor genes (Bailey et al., 2018). Across the nine cancer-types,
filtering for driver genes yielded a workable number of genes for use with ME
detection tools (median=182 genes, range=139-187 genes, Figure 6-3A).

Chapter 6 Results
186
Figure 6-3 Classifying mutation clonality and mutual exclusivity in driver genes A, Overview of mutation data from nine TCGA cancer-types. The number of patients (left) and the total number of driver genes mutated (right) for each cancer-type are shown. B, The distribution of cancer cell fractions scores for commonly-mutated driver mutations in LUAD is shown for individual samples (gray points) and summarised per gene (black line). Driver genes are selected from the pan-cancer gene-list provided by Bailey et al (Bailey et al., 2018). Only commonly mutated genes (mutation present in >5% of patients) are shown here. C, Using the DISCOVER tool, the top-scoring results of pairwise mutual

Chapter 6 Results
187
exclusivity analysis in LUAD are shown (threshold for significance = qvalue < 0.05).
I first analyzed results for the LUAD cohort. Examining the CCF distributions per
gene, the median value across the cohort provided a summary metric of mutation
clonality (Figure 6-3B). The majority (58%, 106/182 genes) of the driver genes
assessed in LUAD tended to be clonally mutated, with an average CCF = 1. This
included several canonical LUAD driver genes, such as TP53, KRAS, EGFR and
STK11. Of the genes previously reported as LUAD-specific drivers in a histology-
specific analysis of the TCGA study (The Cancer Genome Atlas Research
Network, 2014), only one gene (SETD2) had a median CCF < 1.
Next a binary mutation matrix was created, classifying mutations in the set of driver
genes as present (1) or absent (0) in each LUAD patient, and inputted to the
DISCOVER tool for ME detection. Twelve gene-pairs were discovered with highly
significant ME interactions (Figure 6-3C, adjusted P-value < 0.05). The gene-set
with the highest coverage (TP53, KRAS) was present in 67.6% of patients; overall,
the median coverage across the nine ME gene-pairs was 39.5% (range=17.3-
67.6%). Of the 182 genes inputted for ME analysis, ME relationships were detected
between 13 unique genes (ASXL1, BRAF, EGFR, FAT1, GATA3, KEAP1, KMT2C,
KRAS, NF1, NIPBL, PIK3CA, STK11, TP53). Notably, KRAS was involved as one
of the partners in nine of the detected ME pairs, and three genes (EGFR, STK11,
TP53) were involved in two ME pairs. Next I adopted the method described by
Haar and colleagues (Haar et al., 2019), to calculate the percentage of the full set
of pairwise interactions of a gene that had a significant (P<0.05) ME relationship.
The KRAS gene had the highest percentage of significant findings, with a
significant ME relationship detected in 14.9% (27/181) of the potential pairwise
comparisons of driver genes. High proportions of statistically significant ME
interactions were also observed for the canonical LUAD driver genes EGFR (3.3%,
6/181) and STK11 (6.1%, 11/181). Overall, these data highlight how a handful of
driver genes can account for the majority of the ME relationships detected within a
particular histology.

Chapter 6 Results
188
6.3.2 The tendency of a gene to be clonally mutated correlates with the proportion of significant findings in mutual exclusivity analyses
The relationship between mutation clonality and the number of statistically
significant ME interactions was assessed for each gene. There was a highly
significant positive correlation between the clonality of mutations in a gene and the
proportion of significant ME interactions in LUAD (Rs=0.2, P=0.00685, Figure 6-4A
top panel). Applying the DISCOVER tool to other cancer-types, significant positive
associations were also observed in BLCA (Rs=0.224, P=0.0024, Figure 6-4A
middle panel) and UCEC (Rs=0.187, P=0.0107, Figure 6-4A bottom panel). This
correlation suggests that genes which tend to be clonally mutated are more likely to
be detected as exhibiting a ME relationship with other genes.
To test the generalizability of this finding, the same analysis was conducted using
the TiMEx tool, which uses a different underlying model and set of assumptions to
detect pairwise ME interactions (Constantinescu et al., 2016). TiMEx also identified
significant positive associations in LUAD (Rs=0.166, P=0.0251, Figure 6-4B top
panel) and BLCA (Rs=0.196, P=0.00814, Figure 6-4B middle panel), but not in
UCEC (Rs=0.0361, P=0.624, Figure 6-4B bottom panel). This demonstrates that
the influence of mutation clonality on ME detection is not specific to a particular
tool.

Chapter 6 Results
189
Figure 6-4 Correlating the tendency of a gene to be clonally mutated with the proportion of significant findings in mutual exclusivity analyses A, The proportion of statistically significant ME interactions correlated with mutation clonality. The DISCOVER tool was used to determine significant (P<0.05) ME interactions in LUAD (left), BLCA (middle) and UCEC (right), plotted

Chapter 6 Results
190
against the gene’s tendency to be clonally mutated. B, The same layout as A for the TiMEx tool.
Somatic mutation data from nine TCGA cancer-types was analysed to determine
the extent of the mutation clonality artifact. Significant positive correlations between
mutation clonality and the number of statistically significant ME interactions were
found for 78% (7/9) of cancer-types using DISCOVER, and 44% (4/9) using TiMEx
(Figure 6-5A). Overall, both ME detection tools exhibited a tendency for positive
correlations overall (DISCOVER median Rs = 0.174, range = 0.097-0.224; TiMEx
median Rs = 0.058, range = -0.123-0.200; Figure 6-5B). Taken together, this result
suggests mutation clonality might represent an unaddressed confounding factor for
the detection of significant ME interactions across cancer-types.
Figure 6-5 Analysis of nine cancer-types indicates the significant findings of ME detection tools tend to clonally mutated drivers Association between mutation clonality and the number of statistically significant ME interactions across nine TCGA cancer-types using DISCOVER and TiMEx tools for ME detection. A bar-plot highlighting individual cancer-types (A), and a box-plot showing the distribution per tool (B) show the Spearman correlation coefficient (y-axis). The colour-scheme indicates a significant (red) or non-significant (gray) correlation.

Chapter 6 Results
191
6.3.3 The effect of recurrent mutation
Mutational frequency may bias the detection of ME interactions, as recurrently
mutated genes have more power to detect mutual exclusivity (Deng et al., 2019;
Yeang et al., 2008). Subclonal mutations typically occur at much lower frequencies
than clonal mutations (Dentro et al., 2020; McGranahan et al., 2015). Here, I
conduct a simple analysis to examine whether recurrent mutation influences the
relationship between mutation clonality and ME interactions.
The distribution of mutation frequencies in driver genes were evaluated by cancer-
type (Figure 6A). As previously reported (Lawrence et al., 2013), there was wide
heterogeneity in overall mutation rates between cancer-types, and the mutation
frequency for individual driver genes varied by cancer-type as well. Therefore, to
stratify driver genes by recurrence in a histology-specific manner, mutation
frequencies were split into quartiles by cancer-type (Figure 6A). In LUAD, for
example, the top quartile (“Q4”) comprised canonical driver genes including TP53,
KRAS, STK11, and EGFR.
Next, the correlation coefficients between clonality and ME detection were re-
calculated piecewise for each mutation frequency quartile (Figure 6B). Dissecting
significant positive correlations by mutation frequency did not reveal a clear pattern
for TiMEx (BLCA Q4 significant, LUAD all quartiles non-significant, LUSC Q2
significant, READ all quartiles non-significant; Figure 6B, top row). Indeed, none of
the mutation frequency quartiles were significantly enriched for significant
correlations across all 9 cancer-types (Figure 6C, left). By contrast, using
DISCOVER, there was a trend for recurrently mutated (“Q4”) driver genes to
harbour more positive correlations between clonality and ME interactions (Q4
significant for LUAD, COAD and UCEC; all quartiles non-significant for BLCA,
LUSC, READ and STAD; Figure 6B, bottom row), and this was reflected across all
cancer-types (Q3 versus Q4: P= 0.0464; Figure 6C, right). Overall, mutation
frequency did not account for the positive correlations observed between mutation
clonality and the number of statistically significant ME interactions.

Chapter 6 Results
192
Figure 6 The effect of recurrent mutation Distribution of mutation frequencies in driver genes by cancer-type (A). Spearman correlation coefficients between mutation clonality and the number of statistically significant ME interactions, calculated piecewise for each mutation frequency quartile, are shown by cancer-type (B) and by tool (C). Statistical significance was tested with a two-sided Wilcoxon signed-rank test.

Chapter 6 Results
193
6.4 Conclusions
6.4.1 Summary of findings
In this chapter, a pan-cancer analysis was conducted to assess whether existing
ME detection tools are biased to detect interactions between clonally mutated
genes (Figure 6-7). Specifically, I evaluated the relationship between the clonal
status of driver genes and the proportion of significant ME interactions detected
using existing DISCOVER and TiMEx across nine cancer-types. Overall a tendency
for positive correlations was observed (DISCOVER median Rs = 0.174, TiMEx
median Rs = 0.058). In 44-78% of the cancer-types assessed, driver genes that
tend to be clonally mutated were more likely to be detected as exhibiting a ME
relationship with other genes.
Figure 6-7 Schematic overview of the processes used to examine the correlation between mutation clonality and ME detection Nine cancer-types from the TCGA study were included in this analysis. Mutation calls were assessed for their clonality (using cancer cell fraction) and for the presence of significant ME interactions (P < 0.05 using DISCOVER or TiMEx tools). Both axes of information were then correlated to examine the influence of mutation clonality on percentage of significant ME interactions.

Chapter 6 Results
194
6.4.2 Future work
Confounding factors – other than ITH – for the detection of ME interactions, include
cancer subtypes, gene-set imbalances and mutation frequency (Deng et al., 2019).
Resolving the effects of each factor, individually and in combination, will be
essential for robust detection of ME gene-sets. In section 6.3.3, a simple analysis
separating genes into mutation frequency categories indicated this did not account
for the positive correlations observed between mutation clonality and the number of
statistically significant ME interactions. However, the DISCOVER tool seemed
more dependent on mutation frequency than TiMEx. Broadening the set of tools
evaluated, in future analyses, could better quantify the effect of recurrent mutation
and associated power to detect ME interactions.
In my analysis of existing tools for ME detection, I classified individual driver genes
as tending to be mutated clonally or subclonally within a cancer-type, then
correlated these data with gene-wise results from ME analysis. Park and
colleagues used a different approach to investigate whether ITH might bias the
detection of ME/CO interactions (Park and Lehner, 2015). The authors
hypothesized that a cancer-type with a high level of ITH might be expected to
display a higher rate of false-positive CO interactions and false-negative ME
interactions. However, after classifying cancer-types as heterogeneous or non-
heterogeneous, Park and colleagues found that both classes had similar odd ratios
between CO and ME. The authors highlighted GBM as an illustrative example of a
highly heterogeneous cancer-type with both ME and CO interactions that were
stronger than others. The discrepancy between these results and my findings in
this thesis can be explained as follows. By performing the analysis at gene-level
resolution, my approach avoided the simplifying assumption of treating all tumours
and genes within a particular cancer-type as homogenous or heterogeneous.
Future work could address the mutation clonality artifact by inputting clone-level
information, rather than tumour-level, to ME/CO detection tools. For example, in an
analysis of multi-region mutational data from the TRACERx renal trial, Turajlic and
colleagues divided the phylogenetic trees from individual tumours into a “truncal”

Chapter 6 Results
195
lineage (containing all the clonal mutations) or “terminal” lineages (containing clonal
and subclonal mutations unique to a specific branch) (Turajlic et al., 2018). Directly
inputting truncal and terminal lineages to an existing ME/CO detection tool yielded
strikingly different results. For example, BAP1 and SETD2/PBRM1 mutations were
found to co-occur at the tumour-level, yet were ME in an analysis of terminal
lineages. An alternative solution is the direct analysis of ME/CO at the clone-level.
For example, Moore and colleagues recently developed GeneAccord as a tool to
detect pairs of mutated genes that are mutually exclusive within the clones of
tumours (Moore et al., 2018).
Assembling a set of epistatic interactions implicated in a high proportion of patients,
and involving both clonal and subclonal mutations, might help define a core set of
evolutionary dependencies. Integration of this list with mutational timing information
may further understanding of the role of driver pathways at different stages of
tumour evolution, and help identify conserved trajectories of tumour evolution.
Chapter 7. Discussion
196
Chapter 7. Discussion
7.1 Novel findings in this thesis
These studies were undertaken to evaluate the hypothesis that refining molecular
portraits of cancer in the light of their evolutionary and ecological features could
improve diagnostic prevision. Here, I briefly highlight the major original findings in
this thesis.
My analyses of multi-region RNA-Seq data from NSCLC patients from the
TRACERx study have shed light on the mechanisms and clinical impact of RNA-
ITH. A metric for RNA-ITH was proposed and compared with other possible
approaches. A paired analysis with multi-region WES data revealed the
transcription of heterogeneous chromosomal states into functional ITH, indicating
that RNA-ITH is driven by chromosomal instability. The evaluation of published
prognostic biomarkers revealed these are vulnerable to tumour sampling bias,
typically displaying a 50% discordance rate, which suggested existing single-biopsy
driven biomarker approaches may be confounded by RNA-ITH.
To address the diagnostic challenge of tumour sampling bias in lung cancer, I
explore the potential to design molecular biomarkers in the light of cancer
evolution. Homogeneously expressed genes were defined as a subset of genes
with low intra- yet high inter-tumour RNA heterogeneity, which were enriched for
chromosome copy-number gains early in tumour evolution. These genes were
enriched for signals maintaining prognostic value between independent cohorts of
patients. Therefore, a novel Outcome Risk Associated Clonal Lung Expression
(ORACLE) signature was developed from homogeneously expressed genes, which
was more robust to the problem of sampling bias than existing approaches. Indeed,
validation of ORACLE showed a reproducible survival association in a meta-
analysis of >900 patients from five independent cohorts. Moreover, ORACLE could
identify high-risk stage I patients, that were otherwise missed by known risk factors,
suggesting its medical utility. This diagnostic based on cancer evolutionary
principles is now in the next phase of clinical translation.

Chapter 7. Discussion
197
Existing methods for the in silico dissection of the tumour microenvironment hold
the promise of quantifying the immune contexture of tumours to guide clinical
decision-making, yet fall short of clinical-grade accuracy. To characterize molecular
profiles of cell-types comprising the tumour microenvironment, I performed ex vivo
purification and RNA-Seq of 15 stromal cell-types from lung tumours and adjacent
non-malignant lung tissue. The cell-types included seven subsets of T-cells, B-
cells, five subsets of the innate immune system, fibroblast and endothelial cells,
providing a holistic view of the cellular components of cancer ecology. Analysis of
tumour-normal differences revealed the phenotypic adaptation of stromal cells,
which could undermine the performance of existing computational tools for digital
tumour dissection. Furthermore, I identified a subset of genes showing cell-type-
specific expression unique to individual stromal subsets. In combination with tissue-
specific analyses, this dataset could be leveraged to identify marker genes robustly
associated with a specific cell-type, regardless of tissue context. This could pave
the way for the accurate and granular deconvolution of the cellular composition of
tumours using clinical samples, helping to expedite the delivery of precision
immune-oncology.
Using knowledge of evolutionary constraints to predict a tumour’s next evolutionary
move has implications for pro-active approaches to personalised medicine.
However, existing computational methods to systematically detect combinatorial
patterns of mutations in cancer genomics datasets overlooks the branching clonal
architecture that characterizes most cancer genomes. A pan-cancer analysis
established that existing detection tools were biased to detect epistatic interactions
between clonally mutated genes in 44-78% of the cancer-types assessed.
Overcoming this mutation clonality artifact in future analyses could help reveal
evolutionary dependencies.

Chapter 7. Discussion
198
7.2 Alternative approaches and future directions
Throughout this thesis, specific limitations and immediate next steps are discussed
in the Results on a chapter-by-chapter basis. Here, I provide a synthesis on
alternative approaches and future research avenues opened up by this thesis.
7.2.1 Is single-cell resolution required?
The analyses of RNA-Seq data conducted in this thesis were limited to quantifying
the bulk average of transcripts pooled from millions of cells. By contrast, scRNAseq
approaches enable the resolution of transcripts specific to individual cancer or
stromal cells (Kolodziejczyk et al., 2015).
In this thesis, ORACLE has been designed as a pragmatic solution to the sampling
bias problem (see 4.5.1), which can be applied to single-region biopsies in routine
pathological evaluation. However, the RNA-ITH of molecular biomarkers has been
observed at the single-cell level, potentially contributing to tumour sampling bias.
For example, through scRNAseq in a cohort of metastatic melanoma patients,
Tirosh and colleagues discovered the presence of a gene expression program
conferring RAFi/MEKi drug resistance in a minority of cancer cells, which was
absent in matched bulk RNA-Seq samples (Tirosh et al., 2016). Similarly, Patel and
colleagues observed that established GBM subtype classifiers were variably
expressed at the single-cell level across individual tumours, possibly undermining
their prognostic utility (Patel et al., 2014). It is likely that ORACLE, as a “bulk”
cancer cell proliferation signature, will be sufficient for application to “bulk” tissue
samples from diagnostic biopsy in the clinical setting. Yet an examination of inter-
cellular heterogeneity of the homogeneously expressed genes defined in this thesis
may be of interest.
For digital tumour dissection, some existing tools, such as EPIC (Racle et al.,
2017), have leveraged scRNAseq data for the development of cell-type reference
profiles. The use of scRNAseq datasets does provide high-resolution of cell-type
counts, at the cost of low cell-type granularity. In published analyses, marker-gene

Chapter 7. Discussion
199
annotation was used for unsorted scRNAseq datasets, which could identify T-cells
but not more granular subsets, such as distinguishing betweeen CD4+ and CD8+
T-cells (Lambrechts et al., 2018; Lee et al., 2020). By contrast, the FACS and bulk
RNA-seq strategy taken in this thesis (see 5.3) enabled the identification of
granular cell-types, such as subsets of T-effector (CD8+PD1-low) and T-exhausted
(CD8+PD1-high) cells. Moreover, my approach permitted the recovery of rare cell
populations that may be missed in unsorted scRNAseq studies. For example, the
CIBERSORT signature for γδ T-cells was the most vulnerable to noise (Newman et
al., 2015). In future, this could potentially be addressed using the high-fidelity RNA
profiles I have generated in this thesis.
7.2.2 Overcoming the curse of dimensionality for RNA biomarkers
The derivation of RNA biomarkers requires feature selection: subsetting from
~20,000 expressed genes to a small number of genes (<100 genes) that is
compatible with use on a clinical platform (see 4.2.1).
Prognostic signature derivation typically involves a gene selection step, then a
model fitting step using a machine learning algorithm. I have taken a simplistic
approach to both steps in this thesis, focusing instead on dissecting the impact of
clonal versus conventional gene selection on biomarker performance (see 4.4.3).
Gene selection may be further refined, for example through further sub-setting for
specific pathways, such as immune (Bailiang Li et al., 2017) or cell cycle
progression (Wistuba et al., 2013) genes. Alternatively, the balanced
representation of several pathways, to reduce information redundancy among
genes, may be achieved using systems biology (Tang et al., 2013) or blind
compression (Cleary et al., 2017) approaches.
Similarly, in identifying candidate cell-type-specific marker genes for in silico
dissection of the TME, I opted to take an approach that classified genes as cell-
type-enriched, cell enhanced, group enriched, or of low cell-type specificity (see
5.5.2). Alternative approaches adopted in the literature include pairwise differential
expression analysis, for example Davoli and collagues identified genes over-

Chapter 7. Discussion
200
expressed in a particular immune cell-type as marker genes (Davoli et al., 2017), or
deriving co-expression modules (Jiang et al., 2018).
7.2.3 Reaching the limits of precision oncology: individualised and hierarchical risk prediction
While evidence-based practice aims to improve the health of the average patient
within a disease population, precision oncology ultimately seeks to provide a
tailored approach for each individual on the basis of patient-specific biomarkers. In
deriving a homogeneous expression biomarker, several prognostic classifiers were
considered in this thesis (see 4.4.3), including linear (Kratz et al., 2012; Shukla et
al., 2017) and tree-based (Chen et al., 2007; Reka et al., 2014) machine learning
algorithms. Yet these all output population-level risk estimates and only predict a
single clinical end-point. Multi-state modeling has recently been proposed as a
more refined prognostic classification scheme to bridge the gap to individualised
risk predictions. Recent work has shown multi-state modelling can be used to
predict personalised outcomes for individual AML patients (Gerstung et al., 2017),
at the limit of precision oncology. This approach has also been used for the
discrete prediction of multiple clinical end-points in early-stage breast cancer
patients, including the risk of locoregional versus distant relapse (Rueda et al.,
2019).
Since 2002, most prognostic gene expression signatures developed for NSCLC
patients are histology-specific, in recognition of the biological differences between
LUAD and LUSC histologies. In accordance with this, ORACLE has been
developed as a LUAD-specific prognostic biomarker (see 4.5). Yet there is growing
evidence that further subtypes within LUAD may impact the significance of
candidate prognostic markers. For example, Suda and colleagues recently
described that a marker of poor prognosis in EGFR-mutant NSCLC tumours might
not be informative in NSCLC tumours with ALK fusion (Suda, 2020). The impact of
ignoring masked patient sub-groups was well described in breast cancer by Tofigh
and colleagues, who demonstrated that ER+ status confounded the prognostic
ability of published RNA markers (Tofigh et al., 2014). To overcome this, the

Chapter 7. Discussion
201
authors suggested the use of a “hybrid subtyping” scheme, which would
sequentially classify breast cancer patients based on ER mutational status, then
intrinsic subtype, and lastly a prognostic gene expression signature would be
applied. A similar scheme may be of utility to combine histological subtyping with
molecular prognostication in lung cancer.
7.2.4 Multi-omic classifiers
Commercially available prognostic biomarkers for breast (Paik et al., 2004; Parker
et al., 2009; van ’t Veer et al., 2002) or lung cancer (Zheng and Bueno, 2015) are
currently based on expression alone. However there is growing evidence
supporting the use of multi-omic biomarker schemes for prognostication. For
example, Neou and colleagues recently proposed a “pan-genomic” scheme for the
risk stratification of pituitary neuroendocrine tumours, integrating somatic
mutations, chromosomal alterations, DNA methylation, and gene expression
changes (Neou et al., 2020). Such multi-omic classifiers have also been found to
improve biomarker performance in other cancer-types, including protaste (Sinha et
al., 2019) and bladder (Lindskrog et al., 2020) cancer. Multi-omic biomarkers may
also be useful in predicting sensitivity to CPI. For example, predictive power may
be improved by combining a mutation-panel-based measure of TMB with an
expression-based measure of tumour inflammation (Cristescu et al., 2018) or TGFβ
pathway activity (Mariathasan et al., 2018).
It is possible that future analyses may identify clonal multi-omic features that could
be usefully integrated with the clonal RNA biomarkers derived in this thesis (see
4.3.2). In breast cancer, a paired analysis of genetic and transcriptomic data
revealed that certain clonal genetic events were associated with extreme changes
in transcription of interacting genes (Shah et al., 2012). Recent single-cell
epigenetic and transcriptomic studies revealed evolutionary trajectories in a mouse
model of LUAD, identifying core regulatory programs that may serve as useful
biomarkers (LaFave et al., 2020; Marjanovic et al., 2020). Therefore, it is
conceivable that future multi-omics analysis of clonal features could further improve
biomarker performance.

Chapter 7. Discussion
202
7.2.5 Pan-cancer applicability
The majority of the work in this thesis was conducted in lung cancer, which is a
high-impact area for precision medicine strategies to improve patient outcomes
(Vargas and Harris, 2016). Though it worth considering whether the results of these
analyses could be translated to other cancer-types in future work.
In this thesis, homogeneous expression biomarkers were derived in a multi-region
lung cancer cohort (see 4.3.2). A pan-cancer analysis indicated that these lung-
derived biomarkers might have prognostic value in other cancer-types (see 4.6.1).
The pan-cancer applicability of homogeneous expression biomarkers might be
biologically plausible. In my analysis, homogeneously expressed genes in lung
cancer were driven by clonal SCNA gains (see 4.3.3), and encoded modules of
cancer cell proliferation (see 4.4.1). Similarly, the early selection of modules of
cancer cell proliferation was previously established in ER+ breast cancer
(Endesfelder et al., 2014). Moreover, in an analysis of 12 TCGA cancer-types, focal
SCNAs were positively correlated with the expression of cell proliferation modules
(Davoli et al., 2017). Aneuploidy is tissue-specific and drives tissue-specific
expression (Hoadley et al., 2018; Sack et al., 2018), so it may be unlikely that the
exact 23 genes of the LUAD-specific ORACLE signature will validate across
cancer-types. However, the wider pool of 1080 homogeneously expressed genes
could drive a new wave of gene expression signatures that offer superior
reproducibility and clinical utility if validated in other cancer types.
Using stromal cells isolated from patients with NSCLC, a set of transcriptomic
profiles were derived for 15 cell subsets from the TME (see 5.3). Any cell-type
marker genes developed using this dataset might be expected to perform better in
other cancer-types than existing cell-type reference profiles derived using mouse or
human blood (Davoli et al., 2017; Newman et al., 2015). In future work, the series
of TME gene signatures would ideally be refined for individual tumour types.

Chapter 7. Discussion
203
7.2.6 Charting lethal, metastatic trajectories
NGS analyses of metastatic samples have broadened the genomic understanding
of cancer outside of the primary tumour setting (Priestley et al., 2019; Robinson et
al., 2017).
The timing of metastatic seeding adds an extra dimension to the sampling bias
problem. Recent work by Hu and colleagues in colorectal cancer has shown that
metastases can be seeded early in tumour evolution, indicating that only a subset
of the apparently “clonal” alterations in the primary tumour are shared with
metastatic sites (Z. Hu et al., 2019). In this thesis, an unpaired analysis of primary
and metastatic samples from separate cohorts suggested that ORACLE might act
as a molecular signature of metastatic potential (see 4.5.3). In future, analysis of
paired primary-metastasis samples, obtained from the same patient, could validate
this hypothesis. In addition, the definition of clonal alterations could be further
developed as occurring uniformly between primary tumour regions, and timed prior
to metastatic seeding.
Improved understanding of clonal exclusivity (see 6.2.3) could also help decipher
the trajectories of lethal, metastatic disease. In a paired analysis of primary and
metastatic tumour samples from a small cohort of colorectal cancer patients, Hu
and colleagues used CO analysis to define a module of canonical driver genes in
the primary tumour, and a novel set of gatekeeping mutations for metastatic
dissemination (Z. Hu et al., 2019). While the genomic alterations involved in the
development of primary colorectal cancers are well-defined (Vogelstein et al.,
1988), the integration of clonality information into ME/CO analyses of paired
primary-metastasis samples may be meaningful in other cancer-types.
7.2.7 Moving from diagnostics to therapeutics
Analyses of RNA-ITH in this thesis were focussed around the implications for
prognostic biomarker development. Yet RNA-ITH may be equally relevant for the
development of novel therapies. For example, in a multi-region RNA-Seq dataset of

Chapter 7. Discussion
204
brain tumours, Morrissy and colleagues established that the cell-surface targets of
immunotherapies (such as CD276, L1CAM, CD74) were heterogeneously
expressed within individual cancers (Morrissy et al., 2017). Similarly, Schafer and
colleagues used immunofluorescence staining to show that MYCN displayed RNA-
ITH in more than 40% of triple-negative breast cancers, contributing to the failure of
effective therapy for these patients (Schafer et al., 2020).
In future work, it may be worth assessing if there are any actionable targets among
the homogeneously expressed genes, specifically the SCNA alterations in
ORACLE genes (see 4.5.3). A similar analysis was recently performed by Rueda
and colleagues for the IntClust subtypes of breast cancer, finding that four tumour
subgroups were enriched for SCNA driver alterations that could be therapeutically
targeted (Rueda et al., 2019).
7.3 Conclusion
The development of robust molecular biomarkers has the potential to improve
diagnostic precision in cancer. The limited clinical translation of previous
biomarkers has been linked to their poor reproducibility and restricted medical
utility. This research has highlighted a number of ways to refine molecular portraits
of cancer in the light of their evolutionary and ecological features. These include a
novel diagnostic for lung cancer, based on cancer evolutionary principles, which
meets the criteria for further clinical development. Such an approach could harness
technologies for tumour biology-based stratification towards the delivery of
precision oncology.

Appendix
205
Chapter 8. Appendix
8.1 Peer-reviewed publications authored during the PhD
8.1.1 First author publications
8.1.1.1 Articles
1) ‘A Clonal Expression Biomarker Associates with Lung Cancer Mortality’.
Biswas, Dhruva, Nicolai J. Birkbak, Rachel Rosenthal, Crispin T. Hiley,
Emilia L. Lim, Krisztian Papp, Stefan Boeing, et al.
Nature Medicine, 7 October 2019, 1–9.
8.1.1.2 Conference abstracts
2) ‘Abstract LB258: Branching Cancer Evolution Biases the Detection of
Epistatic Interactions between Driver Mutations’.
Biswas, Dhruva, Nicolai J. Birkbak, Javier Herrero, and Charles Swanton.
Cancer Research 81, no. 13 Supplement (1 July 2021): LB258–LB258.
3) ‘5O - Using Single Cell Data to Validate the Cellular Origins of a Clonal
Expression Biomarker in Lung Cancer’
Biswas, D., N. J. Birkbak, N. McGranahan, and C. Swanton.
Annals of Oncology, Abstract Book of Molecular Analysis for Personalised
Therapy (MAP) London, UK, 7–9 November 2019, 30 (1 November 2019):
vii2.
4) ‘Abstract 2678: A Clonal Expression Biomarker Improves Prognostic
Accuracy: TRACERx Lung’.
Biswas, Dhruva, Nicolai J. Birkbak, Rachel Rosenthal, Crispin T. Hiley,
Emilia L. Lim, Krisztian Papp, Marcin Krzystanek, et al.
Cancer Research 79, no. 13 Supplement (1 July 2019): 2678–2678.

Appendix
206
8.1.1.3 Correspondences
5) ‘The Future of Liquid Biopsy’.
Biswas, Dhruva, Jane Ganeshalingam, and Jonathan C. M. Wan.
The Lancet Oncology 21, no. 12 (1 December 2020): e550.
8.1.2 Co-author publications
8.1.2.1 Reviews
6) ‘Impact of Cancer Evolution on Immune Surveillance and Checkpoint
Inhibitor Response’.
Wu, Yin, Dhruva Biswas, and Charles Swanton.
Seminars in Cancer Biology, 22 February 2021.
8.1.2.2 Articles
7) Meta-Analysis of Tumor- and T Cell-Intrinsic Mechanisms of Sensitization to
Checkpoint Inhibition’.
Litchfield, Kevin, James L. Reading, Clare Puttick, Krupa Thakkar, Chris
Abbosh, Robert Bentham, … Dhruva Biswas, et al.
Cell 0, no. 0 (27 January 2021).
8) ‘Oncogenic RAS Activity Predicts Response to Chemotherapy and Outcome
in Lung Adenocarcinoma’.
East, Philip, Gavin P. Kelly, Dhruva Biswas, Michaela Marani, David C.
Hancock, Todd Creasy, Kris Sachsenmeier, et al.
BioRxiv, 4 April 2021, 2021.04.02.437896.
9) ‘Pervasive chromosomal instability and karyotype order in tumour evolution’.
Watkins, Thomas B.K., Emilia L. Lim, Marina Petkovic, Sergi Elizalde,
Nicolai J. Birkbak, Gareth A. Wilson, … Dhruva Biswas et al.
Nature, in press.

Appendix
207
10) ‘Scalable and Robust SARS-CoV-2 Testing in an Academic Center’.
Aitken, Jim, Karen Ambrose, Sam Barrell, Rupert Beale, Ganka Bineva-
Todd, Dhruva Biswas, Richard Byrne, et al.
Nature Biotechnology, 18 June 2020, 1–4.
11) ‘The T Cell Differentiation Landscape Is Shaped by Tumour Mutations in
Lung Cancer’.
Ghorani, Ehsan, James L. Reading, Jake Y. Henry, Marc Robert de Massy,
Rachel Rosenthal, Virginia Turati, … Dhruva Biswas et al.
Nature Cancer 1, no. 5 (May 2020): 546–61.
12) ‘An Innate-like Vδ1+ γδ T Cell Compartment in the Human Breast Is
Associated with Remission in Triple-Negative Breast Cancer’.
Wu, Yin, Fernanda Kyle-Cezar, Richard T. Woolf, Cristina Naceur-
Lombardelli, Julie Owen, Dhruva Biswas, Anna Lorenc, et al.
Science Translational Medicine 11, no. 513 (9 October 2019).
13) ‘Pulmonary Venous Circulating Tumor Cell Dissemination before Tumor
Resection and Disease Relapse’.
Chemi, Francesca, Dominic G. Rothwell, Nicholas McGranahan, Sakshi
Gulati, Chris Abbosh, Simon P. Pearce, … Dhruva Biswas et al.
Nature Medicine, 7 October 2019, 1–6.
8.1.3 Consortium author publications
14) ‘Clinical Outcomes of COVID-19 in Long-Term Care Facilities for People
with Epilepsy’.
Balestrini, Simona, Matthias J. Koepp, Sonia Gandhi, Hannah M. Rickman,
Gee Yen Shin, Catherine F. Houlihan, Jonny Anders-Cannon, et al.
Epilepsy & Behavior 115 (1 February 2021): 107602.

Appendix
208
15) ‘Pandemic Peak SARS-CoV-2 Infection and Seroconversion Rates in
London Frontline Health-Care Workers’.
Houlihan, Catherine F., Nina Vora, Thomas Byrne, Dan Lewer, Gavin Kelly,
Judith Heaney, Sonia Gandhi, et al.
The Lancet 0, no. 0 (9 July 2020)
16) ‘Geospatial Immune Variability Illuminates Differential Evolution of Lung
Adenocarcinoma’.
AbdulJabbar, Khalid, Shan E. Ahmed Raza, Rachel Rosenthal, Mariam
Jamal-Hanjani, Selvaraju Veeriah, Ayse Akarca, Tom Lund, et al.
Nature Medicine, 27 May 2020, 1–9.
17) ‘Interplay between Whole-Genome Doubling and the Accumulation of
Deleterious Alterations in Cancer Evolution’
López, Saioa, Emilia L. Lim, Stuart Horswell, Kerstin Haase, Ariana
Huebner, Michelle Dietzen, Thanos P. Mourikis, et al.
Nature Genetics 52, no. 3 (March 2020): 283–93.
18) ‘Spatial Heterogeneity of the T Cell Receptor Repertoire Reflects the
Mutational Landscape in Lung Cancer’.
Joshi, Kroopa, Marc Robert de Massy, Mazlina Ismail, James L. Reading,
Imran Uddin, Annemarie Woolston, Emine Hatipoglu, et al.
Nature Medicine 25, no. 10 (October 2019): 1549–59.
19) ‘Neoantigen-Directed Immune Escape in Lung Cancer Evolution’.
Rosenthal, Rachel, Elizabeth Larose Cadieux, Roberto Salgado, Maise Al
Bakir, David A. Moore, Crispin T. Hiley, Tom Lund, et al.
Nature, 20 March 2019, 1.

Reference List
209
Reference List
AbdulJabbar, K., Raza, S.E.A., Rosenthal, R., Jamal-Hanjani, M., Veeriah, S., Akarca, A., Lund, T., Moore, D.A., Salgado, R., Al Bakir, M., Zapata, L., Hiley, C.T., Officer, L., Sereno, M., Smith, C.R., Loi, S., Hackshaw, A., Marafioti, T., Quezada, S.A., McGranahan, N., Le Quesne, J., Swanton, C., Yuan, Y., 2020. Geospatial immune variability illuminates differential evolution of lung adenocarcinoma. Nature Medicine 1–9. https://doi.org/10.1038/s41591-020-0900-x
Abécassis, J., Hamy, A.-S., Laurent, C., Sadacca, B., Bonsang-Kitzis, H., Reyal, F., Vert, J.-P., 2019. Assessing reliability of intra-tumor heterogeneity estimates from single sample whole exome sequencing data. PLOS ONE 14, e0224143. https://doi.org/10.1371/journal.pone.0224143
Alexandrov, L.B., Kim, J., Haradhvala, N.J., Huang, M.N., Tian Ng, A.W., Wu, Y., Boot, A., Covington, K.R., Gordenin, D.A., Bergstrom, E.N., Islam, S.M.A., Lopez-Bigas, N., Klimczak, L.J., McPherson, J.R., Morganella, S., Sabarinathan, R., Wheeler, D.A., Mustonen, V., Getz, G., Rozen, S.G., Stratton, M.R., 2020. The repertoire of mutational signatures in human cancer. Nature 578, 94–101. https://doi.org/10.1038/s41586-020-1943-3
Ali, H.R., Chlon, L., Pharoah, P.D.P., Markowetz, F., Caldas, C., 2016. Patterns of Immune Infiltration in Breast Cancer and Their Clinical Implications: A Gene-Expression-Based Retrospective Study. PLOS Medicine 13, e1002194. https://doi.org/10.1371/journal.pmed.1002194
Alizadeh, A.A., Aranda, V., Bardelli, A., Blanpain, C., Bock, C., Borowski, C., Caldas, C., Califano, A., Doherty, M., Elsner, M., Esteller, M., Fitzgerald, R., Korbel, J.O., Lichter, P., Mason, C.E., Navin, N., Pe’er, D., Polyak, K., Roberts, C.W.M., Siu, L., Snyder, A., Stower, H., Swanton, C., Verhaak, R.G.W., Zenklusen, J.C., Zuber, J., Zucman-Rossi, J., 2015. Toward understanding and exploiting tumor heterogeneity. Nat Med 21, 846–853. https://doi.org/10.1038/nm.3915
Alizadeh, A.A., Eisen, M.B., Davis, R.E., Ma, C., Lossos, I.S., Rosenwald, A., Boldrick, J.C., Sabet, H., Tran, T., Yu, X., Powell, J.I., Yang, L., Marti, G.E., Moore, T., Hudson, J., Lu, L., Lewis, D.B., Tibshirani, R., Sherlock, G., Chan, W.C., Greiner, T.C., Weisenburger, D.D., Armitage, J.O., Warnke, R., Levy, R., Wilson, W., Grever, M.R., Byrd, J.C., Botstein, D., Brown, P.O., Staudt, L.M., 2000. Distinct types of diffuse large B-cell lymphoma identified by gene expression profiling. Nature 403, 503–511. https://doi.org/10.1038/35000501
Altman, N., Krzywinski, M., 2018. The curse(s) of dimensionality. Nature Methods. https://doi.org/10.1038/s41592-018-0019-x
Anagnostou, V., Smith, K.N., Forde, P.M., Niknafs, N., Bhattacharya, R., White, J., Zhang, T., Adleff, V., Phallen, J., Wali, N., Hruban, C., Guthrie, V.B., Rodgers, K., Naidoo, J., Kang, H., Sharfman, W., Georgiades, C., Verde, F., Illei, P., Li, Q.K., Gabrielson, E., Brock, M.V., Zahnow, C.A., Baylin, S.B., Scharpf, R.B., Brahmer, J.R., Karchin, R., Pardoll, D.M., Velculescu, V.E., 2017. Evolution of Neoantigen Landscape during Immune Checkpoint Blockade in Non–Small Cell Lung Cancer. Cancer Discov 7, 264–276. https://doi.org/10.1158/2159-8290.CD-16-0828

Reference List
210
Andor, N., Graham, T.A., Jansen, M., Xia, L.C., Aktipis, C.A., Petritsch, C., Ji, H.P., Maley, C.C., 2016. Pan-cancer analysis of the extent and consequences of intratumor heterogeneity. Nat. Med. 22, 105–113. https://doi.org/10.1038/nm.3984
Angelova, M., Mlecnik, B., Vasaturo, A., Bindea, G., Fredriksen, T., Lafontaine, L., Buttard, B., Morgand, E., Bruni, D., Jouret-Mourin, A., Hubert, C., Kartheuser, A., Humblet, Y., Ceccarelli, M., Syed, N., Marincola, F.M., Bedognetti, D., Van den Eynde, M., Galon, J., 2018. Evolution of Metastases in Space and Time under Immune Selection. Cell 175, 751-765.e16. https://doi.org/10.1016/j.cell.2018.09.018
Aran, D., Hu, Z., Butte, A.J., 2017. xCell: digitally portraying the tissue cellular heterogeneity landscape. Genome Biol 18. https://doi.org/10.1186/s13059-017-1349-1
Aslan, K., Turco, V., Blobner, J., Sonner, J.K., Liuzzi, A.R., Núñez, N.G., Feo, D.D., Kickingereder, P., Fischer, M., Green, E., Sadik, A., Friedrich, M., Sanghvi, K., Kilian, M., Cichon, F., Wolf, L., Jähne, K., Landenberg, A. von, Bunse, L., Sahm, F., Schrimpf, D., Meyer, J., Alexander, A., Brugnara, G., Röth, R., Pfleiderer, K., Niesler, B., Deimling, A. von, Opitz, C., Breckwoldt, M.O., Heiland, S., Bendszus, M., Wick, W., Becher, B., Platten, M., 2020. Heterogeneity of response to immune checkpoint blockade in hypermutated experimental gliomas. Nat Commun 11, 1–14. https://doi.org/10.1038/s41467-020-14642-0
Audeh, M.W., Carmichael, J., Penson, R.T., Friedlander, M., Powell, B., Bell-McGuinn, K.M., Scott, C., Weitzel, J.N., Oaknin, A., Loman, N., Lu, K., Schmutzler, R.K., Matulonis, U., Wickens, M., Tutt, A., 2010. Oral poly(ADP-ribose) polymerase inhibitor olaparib in patients with BRCA1 or BRCA2 mutations and recurrent ovarian cancer: a proof-of-concept trial. Lancet 376, 245–251. https://doi.org/10.1016/S0140-6736(10)60893-8
Ayers, M., Lunceford, J., Nebozhyn, M., Murphy, E., Loboda, A., Kaufman, D.R., Albright, A., Cheng, J.D., Kang, S.P., Shankaran, V., Piha-Paul, S.A., Yearley, J., Seiwert, T.Y., Ribas, A., McClanahan, T.K., 2017. IFN-γ–related mRNA profile predicts clinical response to PD-1 blockade. J Clin Invest 127, 2930–2940. https://doi.org/10.1172/JCI91190
Babur, Ö., Gönen, M., Aksoy, B.A., Schultz, N., Ciriello, G., Sander, C., Demir, E., 2015. Systematic identification of cancer driving signaling pathways based on mutual exclusivity of genomic alterations. Genome Biology 16, 45. https://doi.org/10.1186/s13059-015-0612-6
Bachtiary, B., Boutros, P.C., Pintilie, M., Shi, W., Bastianutto, C., Li, J.-H., Schwock, J., Zhang, W., Penn, L.Z., Jurisica, I., Fyles, A., Liu, F.-F., 2006. Gene Expression Profiling in Cervical Cancer: An Exploration of Intratumor Heterogeneity. Clin Cancer Res 12, 5632–5640. https://doi.org/10.1158/1078-0432.CCR-06-0357
Bailey, M.H., Tokheim, C., Porta-Pardo, E., Sengupta, S., Bertrand, D., Weerasinghe, A., Colaprico, A., Wendl, M.C., Kim, J., Reardon, B., Ng, P.K.-S., Jeong, K.J., Cao, S., Wang, Zixing, Gao, J., Gao, Q., Wang, F., Liu, E.M., Mularoni, L., Rubio-Perez, C., Nagarajan, N., Cortés-Ciriano, I., Zhou, D.C., Liang, W.-W., Hess, J.M., Yellapantula, V.D., Tamborero, D., Gonzalez-Perez, A., Suphavilai, C., Ko, J.Y., Khurana, E., Park, P.J., Allen, E.M.V., Liang, H., Caesar-Johnson, S.J., Demchok, J.A., Felau, I., Kasapi, M., Ferguson, M.L., Hutter, C.M., Sofia, H.J., Tarnuzzer, R., Wang, Zhining,
Reference List
211
Yang, L., Zenklusen, J.C., Zhang, J. (Julia), Chudamani, S., Liu, J., Lolla, L., Naresh, R., Pihl, T., Sun, Q., Wan, Y., Wu, Y., Cho, J., DeFreitas, T., Frazer, S., Gehlenborg, N., Getz, G., Heiman, D.I., Kim, J., Lawrence, M.S., Lin, P., Meier, S., Noble, M.S., Saksena, G., Voet, D., Zhang, Hailei, Bernard, B., Chambwe, N., Dhankani, V., Knijnenburg, T., Kramer, R., Leinonen, K., Liu, Y., Miller, M., Reynolds, S., Shmulevich, I., Thorsson, V., Zhang, W., Akbani, R., Broom, B.M., Hegde, A.M., Ju, Z., Kanchi, R.S., Korkut, A., Li, J., Liang, H., Ling, S., Liu, W., Lu, Y., Mills, G.B., Ng, K.-S., Rao, A., Ryan, M., Wang, Jing, Weinstein, J.N., Zhang, J., Abeshouse, A., Armenia, J., Chakravarty, D., Chatila, W.K., Bruijn, I. de, Gao, J., Gross, B.E., Heins, Z.J., Kundra, R., La, K., Ladanyi, M., Luna, A., Nissan, M.G., Ochoa, A., Phillips, S.M., Reznik, E., Sanchez-Vega, F., Sander, C., Schultz, N., Sheridan, R., Sumer, S.O., Sun, Y., Taylor, B.S., Wang, Jioajiao, Zhang, Hongxin, Anur, P., Peto, M., Spellman, P., Benz, C., Stuart, J.M., Wong, C.K., Yau, C., Hayes, D.N., Parker, J.S., Wilkerson, M.D., Ally, A., Balasundaram, M., Bowlby, R., Brooks, D., Carlsen, R., Chuah, E., Dhalla, N., Holt, R., Jones, S.J.M., Kasaian, K., Lee, D., Ma, Y., Marra, M.A., Mayo, M., Moore, R.A., Mungall, A.J., Mungall, K., Robertson, A.G., Sadeghi, S., Schein, J.E., Sipahimalani, P., Tam, A., Thiessen, N., Tse, K., Wong, T., Berger, A.C., Beroukhim, R., Cherniack, A.D., Cibulskis, C., Gabriel, S.B., Gao, G.F., Ha, G., Meyerson, M., Schumacher, S.E., Shih, J., Kucherlapati, M.H., Kucherlapati, R.S., Baylin, S., Cope, L., Danilova, L., Bootwalla, M.S., Lai, P.H., Maglinte, D.T., Berg, D.J.V.D., Weisenberger, D.J., Auman, J.T., Balu, S., Bodenheimer, T., Fan, C., Hoadley, K.A., Hoyle, A.P., Jefferys, S.R., Jones, C.D., Meng, S., Mieczkowski, P.A., Mose, L.E., Perou, A.H., Perou, C.M., Roach, J., Shi, Y., Simons, J.V., Skelly, T., Soloway, M.G., Tan, D., Veluvolu, U., Fan, H., Hinoue, T., Laird, P.W., Shen, H., Zhou, W., Bellair, M., Chang, K., Covington, K., Creighton, C.J., Dinh, H., Doddapaneni, H., Donehower, L.A., Drummond, J., Gibbs, R.A., Glenn, R., Hale, W., Han, Y., Hu, J., Korchina, V., Lee, S., Lewis, L., Li, W., Liu, X., Morgan, M., Morton, D., Muzny, D., Santibanez, J., Sheth, M., Shinbrot, E., Wang, L., Wang, M., Wheeler, D.A., Xi, L., Zhao, F., Hess, J., Appelbaum, E.L., Bailey, M., Cordes, M.G., Ding, L., Fronick, C.C., Fulton, L.A., Fulton, R.S., Kandoth, C., Mardis, E.R., McLellan, M.D., Miller, C.A., Schmidt, H.K., Wilson, R.K., Crain, D., Curley, E., Gardner, J., Lau, K., Mallery, D., Morris, S., Paulauskis, J., Penny, R., Shelton, C., Shelton, T., Sherman, M., Thompson, E., Yena, P., Bowen, J., Gastier-Foster, J.M., Gerken, M., Leraas, K.M., Lichtenberg, T.M., Ramirez, N.C., Wise, L., Zmuda, E., Corcoran, N., Costello, T., Hovens, C., Carvalho, A.L., Carvalho, A.C. de, Fregnani, J.H., Longatto-Filho, A., Reis, R.M., Scapulatempo-Neto, C., Silveira, H.C.S., Vidal, D.O., Burnette, A., Eschbacher, J., Hermes, B., Noss, A., Singh, R., Anderson, M.L., Castro, P.D., Ittmann, M., Huntsman, D., Kohl, B., Le, X., Thorp, R., Andry, C., Duffy, E.R., Lyadov, V., Paklina, O., Setdikova, G., Shabunin, A., Tavobilov, M., McPherson, C., Warnick, R., Berkowitz, R., Cramer, D., Feltmate, C., Horowitz, N., Kibel, A., Muto, M., Raut, C.P., Malykh, A., Barnholtz-Sloan, J.S., Barrett, W., Devine, K., Fulop, J., Ostrom, Q.T., Shimmel, K., Wolinsky, Y., Sloan, A.E., Rose, A.D., Giuliante, F., Goodman, M., Karlan, B.Y., Hagedorn, C.H., Eckman, J., Harr, J., Myers, J., Tucker, K., Zach, L.A., Deyarmin, B., Hu, H., Kvecher, L., Larson, C., Mural, R.J., Somiari, S., Vicha, A., Zelinka, T., Bennett, J.,

Reference List
212
Iacocca, M., Rabeno, B., Swanson, P., Latour, M., Lacombe, L., Têtu, B., Bergeron, A., McGraw, M., Staugaitis, S.M., Chabot, J., Hibshoosh, H., Sepulveda, A., Su, T., Wang, T., Potapova, O., Voronina, O., Desjardins, L., Mariani, O., Roman-Roman, S., Sastre, X., Stern, M.-H., Cheng, F., Signoretti, S., Berchuck, A., Bigner, D., Lipp, E., Marks, J., McCall, S., McLendon, R., Secord, A., Sharp, A., Behera, M., Brat, D.J., Chen, A., Delman, K., Force, S., Khuri, F., Magliocca, K., Maithel, S., Olson, J.J., Owonikoko, T., Pickens, A., Ramalingam, S., Shin, D.M., Sica, G., Meir, E.G.V., Zhang, Hongzheng, Eijckenboom, W., Gillis, A., Korpershoek, E., Looijenga, L., Oosterhuis, W., Stoop, H., Kessel, K.E. van, Zwarthoff, E.C., Calatozzolo, C., Cuppini, L., Cuzzubbo, S., DiMeco, F., Finocchiaro, G., Mattei, L., Perin, A., Pollo, B., Chen, C., Houck, J., Lohavanichbutr, P., Hartmann, A., Stoehr, C., Stoehr, R., Taubert, H., Wach, S., Wullich, B., Kycler, W., Murawa, D., Wiznerowicz, M., Chung, K., Edenfield, W.J., Martin, J., Baudin, E., Bubley, G., Bueno, R., Rienzo, A.D., Richards, W.G., Kalkanis, S., Mikkelsen, T., Noushmehr, H., Scarpace, L., Girard, N., Aymerich, M., Campo, E., Giné, E., Guillermo, A.L., Bang, N.V., Hanh, P.T., Phu, B.D., Tang, Y., Colman, H., Evason, K., Dottino, P.R., Martignetti, J.A., Gabra, H., Juhl, H., Akeredolu, T., Stepa, S., Hoon, D., Ahn, K., Kang, K.J., Beuschlein, F., Breggia, A., Birrer, M., Bell, D., Borad, M., Bryce, A.H., Castle, E., Chandan, V., Cheville, J., Copland, J.A., Farnell, M., Flotte, T., Giama, N., Ho, T., Kendrick, M., Kocher, J.-P., Kopp, K., Moser, C., Nagorney, D., O’Brien, D., O’Neill, B.P., Patel, T., Petersen, G., Que, F., Rivera, M., Roberts, L., Smallridge, R., Smyrk, T., Stanton, M., Thompson, R.H., Torbenson, M., Yang, J.D., Zhang, L., Brimo, F., Ajani, J.A., Gonzalez, A.M.A., Behrens, C., Bondaruk, J., Broaddus, R., Czerniak, B., Esmaeli, B., Fujimoto, J., Gershenwald, J., Guo, C., Lazar, A.J., Logothetis, C., Meric-Bernstam, F., Moran, C., Ramondetta, L., Rice, D., Sood, A., Tamboli, P., Thompson, T., Troncoso, P., Tsao, A., Wistuba, I., Carter, C., Haydu, L., Hersey, P., Jakrot, V., Kakavand, H., Kefford, R., Lee, K., Long, G., Mann, G., Quinn, M., Saw, R., Scolyer, R., Shannon, K., Spillane, A., Stretch, J., Synott, M., Thompson, J., Wilmott, J., Al-Ahmadie, H., Chan, T.A., Ghossein, R., Gopalan, A., Levine, D.A., Reuter, V., Singer, S., Singh, B., Tien, N.V., Broudy, T., Mirsaidi, C., Nair, P., Drwiega, P., Miller, J., Smith, J., Zaren, H., Park, J.-W., Hung, N.P., Kebebew, E., Linehan, W.M., Metwalli, A.R., Pacak, K., Pinto, P.A., Schiffman, M., Schmidt, L.S., Vocke, C.D., Wentzensen, N., Worrell, R., Yang, H., Moncrieff, M., Goparaju, C., Melamed, J., Pass, H., Botnariuc, N., Caraman, I., Cernat, M., Chemencedji, I., Clipca, A., Doruc, S., Gorincioi, G., Mura, S., Pirtac, M., Stancul, I., Tcaciuc, D., Albert, M., Alexopoulou, I., Arnaout, A., Bartlett, J., Engel, J., Gilbert, S., Parfitt, J., Sekhon, H., Thomas, G., Rassl, D.M., Rintoul, R.C., Bifulco, C., Tamakawa, R., Urba, W., Hayward, N., Timmers, H., Antenucci, A., Facciolo, F., Grazi, G., Marino, M., Merola, R., Krijger, R. de, Gimenez-Roqueplo, A.-P., Piché, A., Chevalier, S., McKercher, G., Birsoy, K., Barnett, G., Brewer, C., Farver, C., Naska, T., Pennell, N.A., Raymond, D., Schilero, C., Smolenski, K., Williams, F., Morrison, C., Borgia, J.A., Liptay, M.J., Pool, M., Seder, C.W., Junker, K., Omberg, L., Dinkin, M., Manikhas, G., Alvaro, D., Bragazzi, M.C., Cardinale, V., Carpino, G., Gaudio, E., Chesla, D., Cottingham, S., Dubina, M., Moiseenko, F., Dhanasekaran, R., Becker, K.-F., Janssen, K.-P., Slotta-Huspenina, J., Abdel-Rahman, M.H., Aziz, D.,

Reference List
213
Bell, S., Cebulla, C.M., Davis, A., Duell, R., Elder, J.B., Hilty, J., Kumar, B., Lang, J., Lehman, N.L., Mandt, R., Nguyen, P., Pilarski, R., Rai, K., Schoenfield, L., Senecal, K., Wakely, P., Hansen, P., Lechan, R., Powers, J., Tischler, A., Grizzle, W.E., Sexton, K.C., Kastl, A., Henderson, J., Porten, S., Waldmann, J., Fassnacht, M., Asa, S.L., Schadendorf, D., Couce, M., Graefen, M., Huland, H., Sauter, G., Schlomm, T., Simon, R., Tennstedt, P., Olabode, O., Nelson, M., Bathe, O., Carroll, P.R., Chan, J.M., Disaia, P., Glenn, P., Kelley, R.K., Landen, C.N., Phillips, J., Prados, M., Simko, J., Smith-McCune, K., VandenBerg, S., Roggin, K., Fehrenbach, A., Kendler, A., Sifri, S., Steele, R., Jimeno, A., Carey, F., Forgie, I., Mannelli, M., Carney, M., Hernandez, B., Campos, B., Herold-Mende, C., Jungk, C., Unterberg, A., Deimling, A. von, Bossler, A., Galbraith, J., Jacobus, L., Knudson, M., Knutson, T., Ma, D., Milhem, M., Sigmund, R., Godwin, A.K., Madan, R., Rosenthal, H.G., Adebamowo, C., Adebamowo, S.N., Boussioutas, A., Beer, D., Giordano, T., Mes-Masson, A.-M., Saad, F., Bocklage, T., Landrum, L., Mannel, R., Moore, K., Moxley, K., Postier, R., Walker, J., Zuna, R., Feldman, M., Valdivieso, F., Dhir, R., Luketich, J., Pinero, E.M.M., Quintero-Aguilo, M., Carlotti, C.G., Santos, J.S.D., Kemp, R., Sankarankuty, A., Tirapelli, D., Catto, J., Agnew, K., Swisher, E., Creaney, J., Robinson, B., Shelley, C.S., Godwin, E.M., Kendall, S., Shipman, C., Bradford, C., Carey, T., Haddad, A., Moyer, J., Peterson, L., Prince, M., Rozek, L., Wolf, G., Bowman, R., Fong, K.M., Yang, I., Korst, R., Rathmell, W.K., Fantacone-Campbell, J.L., Hooke, J.A., Kovatich, A.J., Shriver, C.D., DiPersio, J., Drake, B., Govindan, R., Heath, S., Ley, T., Tine, B.V., Westervelt, P., Rubin, M.A., Lee, J.I., Aredes, N.D., Mariamidze, A., Lawrence, M.S., Godzik, A., Lopez-Bigas, N., Stuart, J., Wheeler, D., Getz, G., Chen, K., Lazar, A.J., Mills, G.B., Karchin, R., Ding, L., 2018. Comprehensive Characterization of Cancer Driver Genes and Mutations. Cell 173, 371-385.e18. https://doi.org/10.1016/j.cell.2018.02.060
Bakhoum, S.F., Landau, D.A., 2017. Chromosomal Instability as a Driver of Tumor Heterogeneity and Evolution. Cold Spring Harb Perspect Med 7, a029611. https://doi.org/10.1101/cshperspect.a029611
Balachandran, V.P., Cavnar, M.J., Zeng, S., Bamboat, Z.M., Ocuin, L.M., Obaid, H., Sorenson, E.C., Popow, R., Ariyan, C., Rossi, F., Besmer, P., Guo, T., Antonescu, C.R., Taguchi, T., Yuan, J., Wolchok, J.D., Allison, J.P., DeMatteo, R.P., 2011. Imatinib potentiates antitumor T cell responses in gastrointestinal stromal tumor through the inhibition of Ido. Nat Med 17, 1094–1100. https://doi.org/10.1038/nm.2438
Ballman, K.V., 2015. Biomarker: Predictive or Prognostic? JCO 33, 3968–3971. https://doi.org/10.1200/JCO.2015.63.3651
Barranco, S.C., Perry, R.R., Durm, M.E., Werner, A.L., Gregorcyk, S.G., Bolton, W.E., Kolm, P., Townsend, C.M., 1994. Intratumor Variability in Prognostic Indicators May Be the Case of Conflicting Estimates of Patient Survival and Response to Therapy. Cancer Res 54, 5351–5356.
Becht, E., Giraldo, N.A., Lacroix, L., Buttard, B., Elarouci, N., Petitprez, F., Selves, J., Laurent-Puig, P., Sautès-Fridman, C., Fridman, W.H., de Reyniès, A., 2016. Estimating the population abundance of tissue-infiltrating immune and stromal cell populations using gene expression. Genome Biology 17, 218. https://doi.org/10.1186/s13059-016-1070-5

Reference List
214
Beer, D.G., Kardia, S.L.R., Huang, C.-C., Giordano, T.J., Levin, A.M., Misek, D.E., Lin, L., Chen, G., Gharib, T.G., Thomas, D.G., Lizyness, M.L., Kuick, R., Hayasaka, S., Taylor, J.M.G., Iannettoni, M.D., Orringer, M.B., Hanash, S., 2002. Gene-expression profiles predict survival of patients with lung adenocarcinoma. Nat Med 8, 816–824. https://doi.org/10.1038/nm733
Beerman, H., Smit, V.T.H.B.M., Kluin, P.M., Bonsing, B.A., Hermans, J., Cornelisse, C.J., 1991. Flow cytometric analysis of DNA stemline heterogeneity in primary and metastatic breast cancer. Cytometry 12, 147–154. https://doi.org/10.1002/cyto.990120208
Bentley, D.R., Balasubramanian, S., Swerdlow, H.P., Smith, G.P., Milton, J., Brown, C.G., Hall, K.P., Evers, D.J., Barnes, C.L., Bignell, H.R., Boutell, J.M., Bryant, J., Carter, R.J., Keira Cheetham, R., Cox, A.J., Ellis, D.J., Flatbush, M.R., Gormley, N.A., Humphray, S.J., Irving, L.J., Karbelashvili, M.S., Kirk, S.M., Li, H., Liu, X., Maisinger, K.S., Murray, L.J., Obradovic, B., Ost, T., Parkinson, M.L., Pratt, M.R., Rasolonjatovo, I.M.J., Reed, M.T., Rigatti, R., Rodighiero, C., Ross, M.T., Sabot, A., Sankar, S.V., Scally, A., Schroth, G.P., Smith, M.E., Smith, V.P., Spiridou, A., Torrance, P.E., Tzonev, S.S., Vermaas, E.H., Walter, K., Wu, X., Zhang, L., Alam, M.D., Anastasi, C., Aniebo, I.C., Bailey, D.M.D., Bancarz, I.R., Banerjee, S., Barbour, S.G., Baybayan, P.A., Benoit, V.A., Benson, K.F., Bevis, C., Black, P.J., Boodhun, A., Brennan, J.S., Bridgham, J.A., Brown, R.C., Brown, A.A., Buermann, D.H., Bundu, A.A., Burrows, J.C., Carter, N.P., Castillo, N., Chiara E. Catenazzi, M., Chang, S., Neil Cooley, R., Crake, N.R., Dada, O.O., Diakoumakos, K.D., Dominguez-Fernandez, B., Earnshaw, D.J., Egbujor, U.C., Elmore, D.W., Etchin, S.S., Ewan, M.R., Fedurco, M., Fraser, L.J., Fuentes Fajardo, K.V., Scott Furey, W., George, D., Gietzen, K.J., Goddard, C.P., Golda, G.S., Granieri, P.A., Green, D.E., Gustafson, D.L., Hansen, N.F., Harnish, K., Haudenschild, C.D., Heyer, N.I., Hims, M.M., Ho, J.T., Horgan, A.M., Hoschler, K., Hurwitz, S., Ivanov, D.V., Johnson, M.Q., James, T., Huw Jones, T.A., Kang, G.-D., Kerelska, T.H., Kersey, A.D., Khrebtukova, I., Kindwall, A.P., Kingsbury, Z., Kokko-Gonzales, P.I., Kumar, A., Laurent, M.A., Lawley, C.T., Lee, S.E., Lee, X., Liao, A.K., Loch, J.A., Lok, M., Luo, S., Mammen, R.M., Martin, J.W., McCauley, P.G., McNitt, P., Mehta, P., Moon, K.W., Mullens, J.W., Newington, T., Ning, Z., Ling Ng, B., Novo, S.M., O’Neill, M.J., Osborne, M.A., Osnowski, A., Ostadan, O., Paraschos, L.L., Pickering, L., Pike, Andrew C., Pike, Alger C., Chris Pinkard, D., Pliskin, D.P., Podhasky, J., Quijano, V.J., Raczy, C., Rae, V.H., Rawlings, S.R., Chiva Rodriguez, A., Roe, P.M., Rogers, John, Rogert Bacigalupo, M.C., Romanov, N., Romieu, A., Roth, R.K., Rourke, N.J., Ruediger, S.T., Rusman, E., Sanches-Kuiper, R.M., Schenker, M.R., Seoane, J.M., Shaw, R.J., Shiver, M.K., Short, S.W., Sizto, N.L., Sluis, J.P., Smith, M.A., Ernest Sohna Sohna, J., Spence, E.J., Stevens, K., Sutton, N., Szajkowski, L., Tregidgo, C.L., Turcatti, G., vandeVondele, S., Verhovsky, Y., Virk, S.M., Wakelin, S., Walcott, G.C., Wang, J., Worsley, G.J., Yan, J., Yau, L., Zuerlein, M., Rogers, Jane, Mullikin, J.C., Hurles, M.E., McCooke, N.J., West, J.S., Oaks, F.L., Lundberg, P.L., Klenerman, D., Durbin, R., Smith, A.J., 2008. Accurate whole human genome sequencing using reversible terminator chemistry. Nature 456, 53–59. https://doi.org/10.1038/nature07517

Reference List
215
Berglund, E., Maaskola, J., Schultz, N., Friedrich, S., Marklund, M., Bergenstråhle, J., Tarish, F., Tanoglidi, A., Vickovic, S., Larsson, L., Salmén, F., Ogris, C., Wallenborg, K., Lagergren, J., Ståhl, P., Sonnhammer, E., Helleday, T., Lundeberg, J., 2018. Spatial maps of prostate cancer transcriptomes reveal an unexplored landscape of heterogeneity. Nature Communications 9, 2419. https://doi.org/10.1038/s41467-018-04724-5
Beroukhim, R., Mermel, C.H., Porter, D., Wei, G., Raychaudhuri, S., Donovan, J., Barretina, J., Boehm, J.S., Dobson, J., Urashima, M., Mc Henry, K.T., Pinchback, R.M., Ligon, A.H., Cho, Y.-J., Haery, L., Greulich, H., Reich, M., Winckler, W., Lawrence, M.S., Weir, B.A., Tanaka, K.E., Chiang, D.Y., Bass, A.J., Loo, A., Hoffman, C., Prensner, J., Liefeld, T., Gao, Q., Yecies, D., Signoretti, S., Maher, E., Kaye, F.J., Sasaki, H., Tepper, J.E., Fletcher, J.A., Tabernero, J., Baselga, J., Tsao, M.-S., Demichelis, F., Rubin, M.A., Janne, P.A., Daly, M.J., Nucera, C., Levine, R.L., Ebert, B.L., Gabriel, S., Rustgi, A.K., Antonescu, C.R., Ladanyi, M., Letai, A., Garraway, L.A., Loda, M., Beer, D.G., True, L.D., Okamoto, A., Pomeroy, S.L., Singer, S., Golub, T.R., Lander, E.S., Getz, G., Sellers, W.R., Meyerson, M., 2010. The landscape of somatic copy-number alteration across human cancers. Nature 463, 899–905. https://doi.org/10.1038/nature08822
Bhandari, V., Liu, L.Y., Salcedo, A., Espiritu, S.M.G., Morris, Q.D., Boutros, P.C., 2018. The Inter and Intra-Tumoural Heterogeneity of Subclonal Reconstruction. bioRxiv 418780. https://doi.org/10.1101/418780
Bhattacharjee, A., Richards, W.G., Staunton, J., Li, C., Monti, S., Vasa, P., Ladd, C., Beheshti, J., Bueno, R., Gillette, M., Loda, M., Weber, G., Mark, E.J., Lander, E.S., Wong, W., Johnson, B.E., Golub, T.R., Sugarbaker, D.J., Meyerson, M., 2001. Classification of human lung carcinomas by mRNA expression profiling reveals distinct adenocarcinoma subclasses. PNAS 98, 13790–13795. https://doi.org/10.1073/pnas.191502998
Bianchi, F., Nuciforo, P., Vecchi, M., Bernard, L., Tizzoni, L., Marchetti, A., Buttitta, F., Felicioni, L., Nicassio, F., Fiore, P.P.D., 2007. Survival prediction of stage I lung adenocarcinomas by expression of 10 genes. J Clin Invest 117, 3436–3444. https://doi.org/10.1172/JCI32007
Bindea, G., Mlecnik, B., Tosolini, M., Kirilovsky, A., Waldner, M., Obenauf, A.C., Angell, H., Fredriksen, T., Lafontaine, L., Berger, A., Bruneval, P., Fridman, W.H., Becker, C., Pagès, F., Speicher, M.R., Trajanoski, Z., Galon, J., 2013. Spatiotemporal Dynamics of Intratumoral Immune Cells Reveal the Immune Landscape in Human Cancer. Immunity 39, 782–795. https://doi.org/10.1016/j.immuni.2013.10.003
Birkbak, N.J., Eklund, A.C., Li, Q., McClelland, S.E., Endesfelder, D., Tan, P., Tan, I.B., Richardson, A.L., Szallasi, Z., Swanton, C., 2011. Paradoxical Relationship between Chromosomal Instability and Survival Outcome in Cancer. Cancer Res 71, 3447–3452. https://doi.org/10.1158/0008-5472.CAN-10-3667
Biswas, D., Birkbak, N.J., Rosenthal, R., Hiley, C.T., Lim, E.L., Papp, K., Boeing, S., Krzystanek, M., Djureinovic, D., Fleur, L.L., Greco, M., Döme, B., Fillinger, J., Brunnström, H., Wu, Y., Moore, D.A., Skrzypski, M., Abbosh, C., Litchfield, K., Bakir, M.A., Watkins, T.B.K., Veeriah, S., Wilson, G.A., Jamal-Hanjani, M., Moldvay, J., Botling, J., Chinnaiyan, A.M., Micke, P., Hackshaw, A., Bartek, J., Csabai, I., Szallasi, Z., Herrero, J., McGranahan,

Reference List
216
N., Swanton, C., 2019. A clonal expression biomarker associates with lung cancer mortality. Nat Med 1–9. https://doi.org/10.1038/s41591-019-0595-z
Blackhall, F.H., Pintilie, M., Wigle, D.A., Jurisica, I., Liu, N., Radulovich, N., Johnston, M.R., Keshavjee, S., Tsao, M.-S., 2004. Stability and Heterogeneity of Expression Profiles in Lung Cancer Specimens Harvested Following Surgical Resection. Neoplasia 6, 761–767.
Blakely, C.M., Watkins, T.B.K., Wu, W., Gini, B., Chabon, J.J., McCoach, C.E., McGranahan, N., Wilson, G.A., Birkbak, N.J., Olivas, V.R., Rotow, J., Maynard, A., Wang, V., Gubens, M.A., Banks, K.C., Lanman, R.B., Caulin, A.F., John, J.S., Cordero, A.R., Giannikopoulos, P., Simmons, A.D., Mack, P.C., Gandara, D.R., Husain, H., Doebele, R.C., Riess, J.W., Diehn, M., Swanton, C., Bivona, T.G., 2017. Evolution and clinical impact of co-occurring genetic alterations in advanced-stage EGFR-mutant lung cancers. Nature Genetics ng.3990. https://doi.org/10.1038/ng.3990
Blum, A., Wang, P., Zenklusen, J.C., 2018. SnapShot: TCGA-Analyzed Tumors. Cell 173, 530. https://doi.org/10.1016/j.cell.2018.03.059
Bohn, T., Rapp, S., Luther, N., Klein, M., Bruehl, T.-J., Kojima, N., Lopez, P.A., Hahlbrock, J., Muth, S., Endo, S., Pektor, S., Brand, A., Renner, K., Popp, V., Gerlach, K., Vogel, D., Lueckel, C., Arnold-Schild, D., Pouyssegur, J., Kreutz, M., Huber, M., Koenig, J., Weigmann, B., Probst, H.-C., Stebut, E. von, Becker, C., Schild, H., Schmitt, E., Bopp, T., 2018. Tumor immunoevasion via acidosis-dependent induction of regulatory tumor-associated macrophages. Nature Immunology 19, 1319. https://doi.org/10.1038/s41590-018-0226-8
Boon, T., 1983. Antigenic Tumor Cell Variants Obtained with Mutagens, in: Klein, G., Weinhouse, S. (Eds.), Advances in Cancer Research. Academic Press, pp. 121–151. https://doi.org/10.1016/S0065-230X(08)61034-9
Boutros, P.C., 2015. The path to routine use of genomic biomarkers in the cancer clinic. Genome Res. 25, 1508–1513. https://doi.org/10.1101/gr.191114.115
Boutros, P.C., Fraser, M., Harding, N.J., Borja, R. de, Trudel, D., Lalonde, E., Meng, A., Hennings-Yeomans, P.H., McPherson, A., Sabelnykova, V.Y., Zia, A., Fox, N.S., Livingstone, J., Shiah, Y.-J., Wang, J., Beck, T.A., Have, C.L., Chong, T., Sam, M., Johns, J., Timms, L., Buchner, N., Wong, A., Watson, J.D., Simmons, T.T., P’ng, C., Zafarana, G., Nguyen, F., Luo, X., Chu, K.C., Prokopec, S.D., Sykes, J., Pra, A.D., Berlin, A., Brown, A., Chan-Seng-Yue, M.A., Yousif, F., Denroche, R.E., Chong, L.C., Chen, G.M., Jung, E., Fung, C., Starmans, M.H.W., Chen, H., Govind, S.K., Hawley, J., D’Costa, A., Pintilie, M., Waggott, D., Hach, F., Lambin, P., Muthuswamy, L.B., Cooper, C., Eeles, R., Neal, D., Tetu, B., Sahinalp, C., Stein, L.D., Fleshner, N., Shah, S.P., Collins, C.C., Hudson, T.J., McPherson, J.D., Kwast, T. van der, Bristow, R.G., 2015. Spatial genomic heterogeneity within localized, multifocal prostate cancer. Nature Genetics 47, 736. https://doi.org/10.1038/ng.3315
Boutros, P.C., Lau, S.K., Pintilie, M., Liu, N., Shepherd, F.A., Der, S.D., Tsao, M.-S., Penn, L.Z., Jurisica, I., 2009. Prognostic gene signatures for non-small-cell lung cancer. PNAS 106, 2824–2828. https://doi.org/10.1073/pnas.0809444106
Boveri, T., 1914. Zur frage der entstehung maligner tumoren. Fischer. Brahmer, J.R., Tykodi, S.S., Chow, L.Q.M., Hwu, W.-J., Topalian, S.L., Hwu, P.,
Drake, C.G., Camacho, L.H., Kauh, J., Odunsi, K., Pitot, H.C., Hamid, O.,

Reference List
217
Bhatia, S., Martins, R., Eaton, K., Chen, S., Salay, T.M., Alaparthy, S., Grosso, J.F., Korman, A.J., Parker, S.M., Agrawal, S., Goldberg, S.M., Pardoll, D.M., Gupta, A., Wigginton, J.M., 2012. Safety and activity of anti-PD-L1 antibody in patients with advanced cancer. N. Engl. J. Med. 366, 2455–2465. https://doi.org/10.1056/NEJMoa1200694
Breslow, A., 1970. Thickness, Cross-sectional Areas and Depth of Invasion in the Prognosis of Cutaneous Melanoma. Annals of Surgery 172, 902–908.
Bunn, P.A., Hirsch, F.R., Aisner, D.L., 2014. Is There Clinical Value to Prognostic Signatures in Early-Stage NSCLC? Clin Cancer Res 20, 1727–1729. https://doi.org/10.1158/1078-0432.CCR-13-3387
Burnet, M., 1957. Cancer: a biological approach. III. Viruses associated with neoplastic conditions. IV. Practical applications. Br Med J 1, 841–847. https://doi.org/10.1136/bmj.1.5023.841
Calabrese, C., Davidson, N.R., Demircioğlu, D., Fonseca, N.A., He, Y., Kahles, A., Lehmann, K.-V., Liu, F., Shiraishi, Y., Soulette, C.M., Urban, L., Greger, L., Li, S., Liu, D., Perry, M.D., Xiang, Q., Zhang, F., Zhang, J., Bailey, P., Erkek, S., Hoadley, K.A., Hou, Y., Huska, M.R., Kilpinen, H., Korbel, J.O., Marin, M.G., Markowski, J., Nandi, T., Pan-Hammarström, Q., Pedamallu, C.S., Siebert, R., Stark, S.G., Su, H., Tan, P., Waszak, S.M., Yung, C., Zhu, S., Awadalla, P., Creighton, C.J., Meyerson, M., Ouellette, B.F.F., Wu, K., Yang, H., Brazma, A., Brooks, A.N., Göke, J., Rätsch, G., Schwarz, R.F., Stegle, O., Zhang, Z., 2020. Genomic basis for RNA alterations in cancer. Nature 578, 129–136. https://doi.org/10.1038/s41586-020-1970-0
Campbell, J.D., Alexandrov, A., Kim, J., Wala, J., Berger, A.H., Pedamallu, C.S., Shukla, S.A., Guo, G., Brooks, A.N., Murray, B.A., Imielinski, M., Hu, X., Ling, S., Akbani, R., Rosenberg, M., Cibulskis, C., Ramachandran, A., Collisson, E.A., Kwiatkowski, D.J., Lawrence, M.S., Weinstein, J.N., Verhaak, R.G.W., Wu, C.J., Hammerman, P.S., Cherniack, A.D., Getz, G., Network, C.G.A.R., Zenklusen, J.C., Zhang, J., Felau, I., Demchok, J.A., Yang, L., Wang, Z., Ferguson, M.L., Tarnuzzer, R., Hutter, C.M., Sofia, H.J., Pihl, T., Wan, Y., Chudamani, S., Liu, J., Sun, C., Naresh, R., Lolla, L., Wu, Y., Creighton, C.J., Rathmell, W.K., Auman, J.T., Balu, S., Bodenheimer, T., Hayes, D.N., Hoadley, K.A., Hoyle, A.P., Jones, C.D., Jefferys, S.R., Meng, S., Mieczkowski, P.A., Mose, L.E., Perou, C.M., Roach, J., Shi, Y., Simons, J.V., Skelly, T., Soloway, M.G., Tan, D., Wu, J., Veluvolu, U., Parker, J.S., Wilkerson, M.D., Boice, L., Huang, M., Thorne, L.B., Getz, G., Noble, M.S., Zhang, H., Heiman, D.I., Cho, J., Gehlenborg, N., Saksena, G., Voet, D., Lin, P., Frazer, S., Kim, J., Lawrence, M.S., Chin, L., Tsao, M.-S., Allison, F., Chadwick, D., Muley, T., Meister, M., Dienemann, H., Kucherlapati, R., Park, P., Bowen, J., Gastier-Foster, J.M., Gerken, M., Leraas, K.M., Lichtenberg, T.M., Ramirez, N.C., Wise, L., Zmuda, E., Stuart, J., Collisson, E., Peifer, M., Kwiatkowski, D., Campbell, J.D., Murray, B.A., Cherniack, A.D., Berger, A.H., Sougnez, C., Schumacher, S.E., Shih, J., Beroukhim, R., Zack, T.I., Gabriel, S.B., Meyerson, M., Byers, L.A., Davidsen, T., Laird, P.W., Weisenberger, D.J., Berg, D.J.V.D., Bootwalla, M.S., Lai, P.H., Maglinte, D.T., Baylin, S.B., Herman, J.G., Danilova, L., Cope, L., Crain, D.J., Curley, E., Gardner, J., Lau, K., Mallery, D., Morris, S., Paulauskis, J., Penny, R., Shelton, C., Shelton, T., Sherman, M., Yena, P., Mills, G.B., Artyomov, M.N., Schreiber, R., Govindan, R., Meyerson, M., 2016. Distinct patterns of somatic genome alterations in lung adenocarcinomas and

Reference List
218
squamous cell carcinomas. Nature Genetics 48, ng.3564. https://doi.org/10.1038/ng.3564
Campbell, P.J., Pleasance, E.D., Stephens, P.J., Dicks, E., Rance, R., Goodhead, I., Follows, G.A., Green, A.R., Futreal, P.A., Stratton, M.R., 2008a. Subclonal phylogenetic structures in cancer revealed by ultra-deep sequencing. PNAS 105, 13081–13086. https://doi.org/10.1073/pnas.0801523105
Campbell, P.J., Stephens, P.J., Pleasance, E.D., O’Meara, S., Li, H., Santarius, T., Stebbings, L.A., Leroy, C., Edkins, S., Hardy, C., Teague, J.W., Menzies, A., Goodhead, I., Turner, D.J., Clee, C.M., Quail, M.A., Cox, A., Brown, C., Durbin, R., Hurles, M.E., Edwards, P.A.W., Bignell, G.R., Stratton, M.R., Futreal, P.A., 2008b. Identification of somatically acquired rearrangements in cancer using genome-wide massively parallel paired-end sequencing. Nature Genetics 40, 722–729. https://doi.org/10.1038/ng.128
Cancer Genome Atlas Network, 2012. Comprehensive molecular portraits of human breast tumours. Nature 490, 61–70. https://doi.org/10.1038/nature11412
Cancer Genome Atlas Research Network, 2008. Comprehensive genomic characterization defines human glioblastoma genes and core pathways. Nature 455, 1061–1068. https://doi.org/10.1038/nature07385
Canisius, S., Martens, J.W.M., Wessels, L.F.A., 2016. A novel independence test for somatic alterations in cancer shows that biology drives mutual exclusivity but chance explains most co-occurrence. Genome Biol 17. https://doi.org/10.1186/s13059-016-1114-x
Caravagna, G., Giarratano, Y., Ramazzotti, D., Tomlinson, I., Graham, T.A., Sanguinetti, G., Sottoriva, A., 2018. Detecting repeated cancer evolution from multi-region tumor sequencing data. Nature Methods 15, 707–714. https://doi.org/10.1038/s41592-018-0108-x
Carter, S.L., Eklund, A.C., Kohane, I.S., Harris, L.N., Szallasi, Z., 2006. A signature of chromosomal instability inferred from gene expression profiles predicts clinical outcome in multiple human cancers. Nat Genet 38, 1043–1048. https://doi.org/10.1038/ng1861
Castel, S.E., Mohammadi, P., Chung, W.K., Shen, Y., Lappalainen, T., 2016. Rare variant phasing and haplotypic expression from RNA sequencing with phASER. Nature Communications 7, 12817. https://doi.org/10.1038/ncomms12817
Charoentong, P., Finotello, F., Angelova, M., Mayer, C., Efremova, M., Rieder, D., Hackl, H., Trajanoski, Z., 2017. Pan-cancer Immunogenomic Analyses Reveal Genotype-Immunophenotype Relationships and Predictors of Response to Checkpoint Blockade. Cell Rep 18, 248–262. https://doi.org/10.1016/j.celrep.2016.12.019
Chen, D.S., Mellman, I., 2017. Elements of cancer immunity and the cancer-immune set point. Nature 541, 321–330. https://doi.org/10.1038/nature21349
Chen, H.-Y., Yu, S.-L., Chen, C.-H., Chang, G.-C., Chen, C.-Y., Yuan, A., Cheng, C.-L., Wang, C.-H., Terng, H.-J., Kao, S.-F., Chan, W.-K., Li, H.-N., Liu, C.-C., Singh, S., Chen, W.J., Chen, J.J.W., Yang, P.-C., 2007. A Five-Gene Signature and Clinical Outcome in Non–Small-Cell Lung Cancer. NEJM 356, 11–20. https://doi.org/10.1056/NEJMoa060096

Reference List
219
Chen, J.J.W., Peck, K., Hong, T.-M., Yang, S.-C., Sher, Y.-P., Shih, J.-Y., Wu, R., Cheng, J.-L., Roffler, S.R., Wu, C.-W., Yang, P.-C., 2001. Global Analysis of Gene Expression in Invasion by a Lung Cancer Model. Cancer Res 61, 5223–5230.
Chen, P.-L., Roh, W., Reuben, A., Cooper, Z.A., Spencer, C.N., Prieto, P.A., Miller, J.P., Bassett, R.L., Gopalakrishnan, V., Wani, K., Macedo, M.P.D., Austin-Breneman, J.L., Jiang, H., Chang, Q., Reddy, S.M., Chen, W.-S., Tetzlaff, M.T., Broaddus, R.J., Davies, M.A., Gershenwald, J.E., Haydu, L., Lazar, A.J., Patel, S.P., Hwu, P., Hwu, W.-J., Diab, A., Glitza, I.C., Woodman, S.E., Vence, L.M., Wistuba, I.I., Amaria, R.N., Kwong, L.N., Prieto, V., Davis, R.E., Ma, W., Overwijk, W.W., Sharpe, A.H., Hu, J., Futreal, P.A., Blando, J., Sharma, P., Allison, J.P., Chin, L., Wargo, J.A., 2016. Analysis of Immune Signatures in Longitudinal Tumor Samples Yields Insight into Biomarkers of Response and Mechanisms of Resistance to Immune Checkpoint Blockade. Cancer Discov 6, 827–837. https://doi.org/10.1158/2159-8290.CD-15-1545
Cibulskis, K., Lawrence, M.S., Carter, S.L., Sivachenko, A., Jaffe, D., Sougnez, C., Gabriel, S., Meyerson, M., Lander, E.S., Getz, G., 2013. Sensitive detection of somatic point mutations in impure and heterogeneous cancer samples. Nature Biotechnology 31, 213. https://doi.org/10.1038/nbt.2514
Cieślik, M., Chinnaiyan, A.M., 2018. Cancer transcriptome profiling at the juncture of clinical translation. Nature Reviews Genetics 19, 93–109. https://doi.org/10.1038/nrg.2017.96
Ciriello, G., Cerami, E., Sander, C., Schultz, N., 2012. Mutual exclusivity analysis identifies oncogenic network modules. Genome Res. 22, 398–406. https://doi.org/10.1101/gr.125567.111
Cleary, B., Cong, L., Cheung, A., Lander, E.S., Regev, A., 2017. Efficient Generation of Transcriptomic Profiles by Random Composite Measurements. Cell. https://doi.org/10.1016/j.cell.2017.10.023
Clemente, C.G., Mihm, M.C., Bufalino, R., Zurrida, S., Collini, P., Cascinelli, N., 1996. Prognostic value of tumor infiltrating lymphocytes in the vertical growth phase of primary cutaneous melanoma. Cancer 77, 1303–1310. https://doi.org/10.1002/(SICI)1097-0142(19960401)77:7<1303::AID-CNCR12>3.0.CO;2-5
Collins, F.S., Varmus, H., 2015. A New Initiative on Precision Medicine. New England Journal of Medicine 372, 793–795. https://doi.org/10.1056/NEJMp1500523
Constantinescu, S., Szczurek, E., Mohammadi, P., Rahnenführer, J., Beerenwinkel, N., 2016. TiMEx: a waiting time model for mutually exclusive cancer alterations. Bioinformatics 32, 968–975. https://doi.org/10.1093/bioinformatics/btv400
Costa, A., Kieffer, Y., Scholer-Dahirel, A., Pelon, F., Bourachot, B., Cardon, M., Sirven, P., Magagna, I., Fuhrmann, L., Bernard, C., Bonneau, C., Kondratova, M., Kuperstein, I., Zinovyev, A., Givel, A.-M., Parrini, M.-C., Soumelis, V., Vincent-Salomon, A., Mechta-Grigoriou, F., 2018. Fibroblast Heterogeneity and Immunosuppressive Environment in Human Breast Cancer. Cancer Cell 0. https://doi.org/10.1016/j.ccell.2018.01.011
Cristescu, R., Mogg, R., Ayers, M., Albright, A., Murphy, E., Yearley, J., Sher, X., Liu, X.Q., Lu, H., Nebozhyn, M., Zhang, C., Lunceford, J.K., Joe, A., Cheng, J., Webber, A.L., Ibrahim, N., Plimack, E.R., Ott, P.A., Seiwert, T.Y., Ribas,

Reference List
220
A., McClanahan, T.K., Tomassini, J.E., Loboda, A., Kaufman, D., 2018. Pan-tumor genomic biomarkers for PD-1 checkpoint blockade–based immunotherapy. Science 362, eaar3593. https://doi.org/10.1126/science.aar3593
Cross, W., Kovac, M., Mustonen, V., Temko, D., Davis, H., Baker, A.-M., Biswas, S., Arnold, R., Chegwidden, L., Gatenbee, C., Anderson, A.R., Koelzer, V.H., Martinez, P., Jiang, X., Domingo, E., Woodcock, D.J., Feng, Y., Kovacova, M., Maughan, T., Jansen, M., Rodriguez-Justo, M., Ashraf, S., Guy, R., Cunningham, C., East, J.E., Wedge, D.C., Wang, L.M., Palles, C., Heinimann, K., Sottoriva, A., Leedham, S.J., Graham, T.A., Tomlinson, I.P.M., 2018. The evolutionary landscape of colorectal tumorigenesis. Nat Ecol Evol 2, 1661–1672. https://doi.org/10.1038/s41559-018-0642-z
Cruz, M.S., Diamond, A., Russell, A., Jameson, J.M., 2018. Human αβ and γδ T Cells in Skin Immunity and Disease. Front Immunol 9. https://doi.org/10.3389/fimmu.2018.01304
Danaher, P., Warren, S., Dennis, L., D’Amico, L., White, A., Disis, M.L., Geller, M.A., Odunsi, K., Beechem, J., Fling, S.P., 2017. Gene expression markers of Tumor Infiltrating Leukocytes. Journal for ImmunoTherapy of Cancer 5, 18. https://doi.org/10.1186/s40425-017-0215-8
Darwin, C., 1859. The origin of species, ed. JW Burrow. Darwin, C., 1845. Voyage of the Beagle round the world. Tess Pres, New York. Davies, H., Bignell, G.R., Cox, C., Stephens, P., Edkins, S., Clegg, S., Teague, J.,
Woffendin, H., Garnett, M.J., Bottomley, W., Davis, N., Dicks, E., Ewing, R., Floyd, Y., Gray, K., Hall, S., Hawes, R., Hughes, J., Kosmidou, V., Menzies, A., Mould, C., Parker, A., Stevens, C., Watt, S., Hooper, S., Wilson, R., Jayatilake, H., Gusterson, B.A., Cooper, C., Shipley, J., Hargrave, D., Pritchard-Jones, K., Maitland, N., Chenevix-Trench, G., Riggins, G.J., Bigner, D.D., Palmieri, G., Cossu, A., Flanagan, A., Nicholson, A., Ho, J.W.C., Leung, S.Y., Yuen, S.T., Weber, B.L., Seigler, H.F., Darrow, T.L., Paterson, H., Marais, R., Marshall, C.J., Wooster, R., Stratton, M.R., Futreal, P.A., 2002. Mutations of the BRAF gene in human cancer. Nature 417, 949–954. https://doi.org/10.1038/nature00766
Davoli, T., Uno, H., Wooten, E.C., Elledge, S.J., 2017. Tumor aneuploidy correlates with markers of immune evasion and with reduced response to immunotherapy. Science 355, eaaf8399. https://doi.org/10.1126/science.aaf8399
de Bruin, McGranahan, N., Mitter, R., Salm, M., Wedge, D.C., Yates, L., Jamal-Hanjani, M., Shafi, S., Murugaesu, N., Rowan, A.J., Grönroos, E., Muhammad, M.A., Horswell, S., Gerlinger, M., Varela, I., Jones, D., Marshall, J., Voet, T., Loo, P.V., Rassl, D.M., Rintoul, R.C., Janes, S.M., Lee, S.-M., Forster, M., Ahmad, T., Lawrence, D., Falzon, M., Capitanio, A., Harkins, T.T., Lee, C.C., Tom, W., Teefe, E., Chen, S.-C., Begum, S., Rabinowitz, A., Phillimore, B., Spencer-Dene, B., Stamp, G., Szallasi, Z., Matthews, N., Stewart, A., Campbell, P., Swanton, C., 2014. Spatial and temporal diversity in genomic instability processes defines lung cancer evolution. Science 346, 251–256. https://doi.org/10.1126/science.1253462
Deng, Y., Luo, S., Deng, C., Luo, T., Yin, W., Zhang, H., Zhang, Y., Zhang, X., Lan, Y., Ping, Y., Xiao, Y., Li, X., 2019. Identifying mutual exclusivity across cancer genomes: computational approaches to discover genetic interaction
Reference List
221
and reveal tumor vulnerability. Brief Bioinform 20, 254–266. https://doi.org/10.1093/bib/bbx109
Denoix, P., 1946. Enquête permanente dans les centres anticancéreux. Bull Inst Natl Hyg 1, 12–17.
Dentro, S.C., Leshchiner, I., Haase, K., Tarabichi, M., Wintersinger, J., Deshwar, A.G., Yu, K., Rubanova, Y., Macintyre, G., Demeulemeester, J., Vázquez-García, I., Kleinheinz, K., Livitz, D.G., Malikic, S., Donmez, N., Sengupta, S., Anur, P., Jolly, C., Cmero, M., Rosebrock, D., Schumacher, S., Fan, Y., Fittall, M., Drews, R.M., Yao, X., Lee, J., Schlesner, M., Zhu, H., Adams, D.J., Getz, G., Boutros, P.C., Imielinski, M., Beroukhim, R., Sahinalp, S.C., Ji, Y., Peifer, M., Martincorena, I., Markowetz, F., Mustonen, V., Yuan, K., Gerstung, M., Spellman, P.T., Wang, W., Morris, Q.D., Wedge, D.C., Loo, P.V., Consortium, on behalf of the P.E. and H.W.G.P., Consortium, the P., 2020. Characterizing genetic intra-tumor heterogeneity across 2,658 human cancer genomes. bioRxiv 312041. https://doi.org/10.1101/312041
Der, S.D., Sykes, J., Pintilie, M., Zhu, C.-Q., Strumpf, D., Liu, N., Jurisica, I., Shepherd, F.A., Tsao, M.-S., 2014. Validation of a Histology-Independent Prognostic Gene Signature for Early-Stage, Non–Small-Cell Lung Cancer Including Stage IA Patients. Journal of Thoracic Oncology 9, 59–64. https://doi.org/10.1097/JTO.0000000000000042
Dexter, D.L., Kowalski, H.M., Blazar, B.A., Fligiel, Z., Vogel, R., Heppner, G.H., 1978. Heterogeneity of tumor cells from a single mouse mammary tumor. Cancer Res. 38, 3174–3181.
Diaz Jr, L.A., Williams, R.T., Wu, J., Kinde, I., Hecht, J.R., Berlin, J., Allen, B., Bozic, I., Reiter, J.G., Nowak, M.A., Kinzler, K.W., Oliner, K.S., Vogelstein, B., 2012. The molecular evolution of acquired resistance to targeted EGFR blockade in colorectal cancers. Nature 486, 537–540. https://doi.org/10.1038/nature11219
Dieu-Nosjean, M.-C., Antoine, M., Danel, C., Heudes, D., Wislez, M., Poulot, V., Rabbe, N., Laurans, L., Tartour, E., de Chaisemartin, L., Lebecque, S., Fridman, W.-H., Cadranel, J., 2008. Long-Term Survival for Patients With Non–Small-Cell Lung Cancer With Intratumoral Lymphoid Structures. JCO 26, 4410–4417. https://doi.org/10.1200/JCO.2007.15.0284
Dijkstra, K.K., Voabil, P., Schumacher, T.N., Voest, E.E., 2016. Genomics- and Transcriptomics-Based Patient Selection for Cancer Treatment With Immune Checkpoint Inhibitors: A Review. JAMA Oncol 2, 1490–1495. https://doi.org/10.1001/jamaoncol.2016.2214
Ding, L., Ley, T.J., Larson, D.E., Miller, C.A., Koboldt, D.C., Welch, J.S., Ritchey, J.K., Young, M.A., Lamprecht, T., McLellan, M.D., McMichael, J.F., Wallis, J.W., Lu, C., Shen, D., Harris, C.C., Dooling, D.J., Fulton, R.S., Fulton, L.L., Chen, K., Schmidt, H., Kalicki-Veizer, J., Magrini, V.J., Cook, L., McGrath, S.D., Vickery, T.L., Wendl, M.C., Heath, S., Watson, M.A., Link, D.C., Tomasson, M.H., Shannon, W.D., Payton, J.E., Kulkarni, S., Westervelt, P., Walter, M.J., Graubert, T.A., Mardis, E.R., Wilson, R.K., DiPersio, J.F., 2012. Clonal evolution in relapsed acute myeloid leukaemia revealed by whole-genome sequencing. Nature 481, 506–510. https://doi.org/10.1038/nature10738
Ding, L., Wendl, M.C., McMichael, J.F., Raphael, B.J., 2014. Expanding the computational toolbox for mining cancer genomes. Nat Rev Genet 15, 556–570. https://doi.org/10.1038/nrg3767

Reference List
222
Djureinovic, D., Hallström, B.M., Horie, M., Mattsson, J.S.M., Fleur, L.L., Fagerberg, L., Brunnström, H., Lindskog, C., Madjar, K., Rahnenführer, J., Ekman, S., Ståhle, E., Koyi, H., Brandén, E., Edlund, K., Hengstler, J.G., Lambe, M., Saito, A., Botling, J., Pontén, F., Uhlén, M., Micke, P., 2016. Profiling cancer testis antigens in non–small-cell lung cancer. JCI Insight 1. https://doi.org/10.1172/jci.insight.86837
Dobin, A., Davis, C.A., Schlesinger, F., Drenkow, J., Zaleski, C., Jha, S., Batut, P., Chaisson, M., Gingeras, T.R., 2013. STAR: ultrafast universal RNA-seq aligner. Bioinformatics 29, 15–21. https://doi.org/10.1093/bioinformatics/bts635
Druker, B.J., Talpaz, M., Resta, D.J., Peng, B., Buchdunger, E., Ford, J.M., Lydon, N.B., Kantarjian, H., Capdeville, R., Ohno-Jones, S., Sawyers, C.L., 2001. Efficacy and safety of a specific inhibitor of the BCR-ABL tyrosine kinase in chronic myeloid leukemia. N. Engl. J. Med. 344, 1031–1037. https://doi.org/10.1056/NEJM200104053441401
Duhen, T., Duhen, R., Montler, R., Moses, J., Moudgil, T., Miranda, N.F. de, Goodall, C.P., Blair, T.C., Fox, B.A., McDermott, J.E., Chang, S.-C., Grunkemeier, G., Leidner, R., Bell, R.B., Weinberg, A.D., 2018. Co-expression of CD39 and CD103 identifies tumor-reactive CD8 T cells in human solid tumors. Nature Communications 9, 2724. https://doi.org/10.1038/s41467-018-05072-0
Dulbecco, R., 1986. A turning point in cancer research: sequencing the human genome. Science 231, 1055–1056. https://doi.org/10.1126/science.3945817
Durinck, S., Spellman, P.T., Birney, E., Huber, W., 2009. Mapping Identifiers for the Integration of Genomic Datasets with the R/Bioconductor package biomaRt. Nat Protoc 4, 1184–1191. https://doi.org/10.1038/nprot.2009.97
Dvorak, H.F., 1986. Tumors: Wounds That Do Not Heal. New England Journal of Medicine. https://doi.org/10.1056/NEJM198612253152606
Early Breast Cancer Trialists’ Collaborative Group, 2005. Effects of chemotherapy and hormonal therapy for early breast cancer on recurrence and 15-year survival: an overview of the randomised trials. The Lancet 365, 1687–1717. https://doi.org/10.1016/S0140-6736(05)66544-0
Edwards, J., Wilmott, J.S., Madore, J., Gide, T.N., Quek, C., Tasker, A., Ferguson, A., Chen, J., Hewavisenti, R., Hersey, P., Gebhardt, T., Weninger, W., Britton, W.J., Saw, R.P.M., Thompson, J.F., Menzies, A.M., Long, G.V., Scolyer, R.A., Palendira, U., 2018. CD103+ Tumor-Resident CD8+ T Cells Are Associated with Improved Survival in Immunotherapy-Naïve Melanoma Patients and Expand Significantly During Anti–PD-1 Treatment. Clin Cancer Res 24, 3036–3045. https://doi.org/10.1158/1078-0432.CCR-17-2257
Eil, R., Vodnala, S.K., Clever, D., Klebanoff, C.A., Sukumar, M., Pan, J.H., Palmer, D.C., Gros, A., Yamamoto, T.N., Patel, S.J., Guittard, G.C., Yu, Z., Carbonaro, V., Okkenhaug, K., Schrump, D.S., Linehan, W.M., Roychoudhuri, R., Restifo, N.P., 2016. Ionic immune suppression within the tumour microenvironment limits T cell effector function. Nature 537, 539–543. https://doi.org/10.1038/nature19364
Endesfelder, D., Burrell, R.A., Kanu, N., McGranahan, N., Howell, M., Parker, P.J., Downward, J., Swanton, C., Kschischo, M., 2014. Chromosomal Instability Selects Gene Copy-Number Variants Encoding Core Regulators of Proliferation in ER+ Breast Cancer. Cancer Res 74, 4853–4863. https://doi.org/10.1158/0008-5472.CAN-13-2664

Reference List
223
Etemadmoghadam, D., Weir, B.A., Au-Yeung, G., Alsop, K., Mitchell, G., George, J., Group, A.O.C.S., Davis, S., D’Andrea, A.D., Simpson, K., Hahn, W.C., Bowtell, D.D.L., 2013. Synthetic lethality between CCNE1 amplification and loss of BRCA1. PNAS 110, 19489–19494. https://doi.org/10.1073/pnas.1314302110
Farmer, H., McCabe, N., Lord, C.J., Tutt, A.N.J., Johnson, D.A., Richardson, T.B., Santarosa, M., Dillon, K.J., Hickson, I., Knights, C., Martin, N.M.B., Jackson, S.P., Smith, G.C.M., Ashworth, A., 2005. Targeting the DNA repair defect in BRCA mutant cells as a therapeutic strategy. Nature 434, 917–921. https://doi.org/10.1038/nature03445
Fidler, I.J., Kripke, M.L., 1977. Metastasis results from preexisting variant cells within a malignant tumor. Science 197, 893–895. https://doi.org/10.1126/science.887927
Fong, P.C., Boss, D.S., Yap, T.A., Tutt, A., Wu, P., Mergui-Roelvink, M., Mortimer, P., Swaisland, H., Lau, A., O’Connor, M.J., Ashworth, A., Carmichael, J., Kaye, S.B., Schellens, J.H.M., de Bono, J.S., 2009. Inhibition of poly(ADP-ribose) polymerase in tumors from BRCA mutation carriers. N. Engl. J. Med. 361, 123–134. https://doi.org/10.1056/NEJMoa0900212
Frampton, G.M., Fabrizio, D., Chalmers, Z.R., Ross, J.S., Johnson, D.B., Lovly, C.M., Sosman, J.A., Miller, V.A., Stephens, P., 2016. Assessment of tumor mutation burden from >60,000 clinical cancer patients using comprehensive genomic profiling. JCO 34, 11558–11558. https://doi.org/10.1200/JCO.2016.34.15_suppl.11558
Francis, J.M., Zhang, C.-Z., Maire, C.L., Jung, J., Manzo, V.E., Adalsteinsson, V.A., Homer, H., Haidar, S., Blumenstiel, B., Pedamallu, C.S., Ligon, A.H., Love, J.C., Meyerson, M., Ligon, K.L., 2014. EGFR Variant Heterogeneity in Glioblastoma Resolved through Single-Nucleus Sequencing. Cancer Discov 4, 956–971. https://doi.org/10.1158/2159-8290.CD-13-0879
Fridman, W.H., Zitvogel, L., Sautès–Fridman, C., Kroemer, G., 2017. The immune contexture in cancer prognosis and treatment. Nature Reviews Clinical Oncology 14, 717. https://doi.org/10.1038/nrclinonc.2017.101
Fuhr, J.E., Frye, A., Kattine, A.A., Van Meter, S., 1991. Flow cytometric determination of breast tumor heterogeneity. Cancer 67, 1401–1405. https://doi.org/10.1002/1097-0142(19910301)67:5<1401::aid-cncr2820670521>3.0.co;2-4
Futreal, P.A., Coin, L., Marshall, M., Down, T., Hubbard, T., Wooster, R., Rahman, N., Stratton, M.R., 2004. A census of human cancer genes. Nat Rev Cancer 4, 177–183. https://doi.org/10.1038/nrc1299
Galon, J., Angell, H.K., Bedognetti, D., Marincola, F.M., 2013. The Continuum of Cancer Immunosurveillance: Prognostic, Predictive, and Mechanistic Signatures. Immunity 39, 11–26. https://doi.org/10.1016/j.immuni.2013.07.008
Galon, J., Costes, A., Sanchez-Cabo, F., Kirilovsky, A., Mlecnik, B., Lagorce-Pagès, C., Tosolini, M., Camus, M., Berger, A., Wind, P., Zinzindohoué, F., Bruneval, P., Cugnenc, P.-H., Trajanoski, Z., Fridman, W.-H., Pagès, F., 2006. Type, density, and location of immune cells within human colorectal tumors predict clinical outcome. Science 313, 1960–1964. https://doi.org/10.1126/science.1129139
Galon, J., Mlecnik, B., Bindea, G., Angell, H.K., Berger, A., Lagorce, C., Lugli, A., Zlobec, I., Hartmann, A., Bifulco, C., Nagtegaal, I.D., Palmqvist, R.,

Reference List
224
Masucci, G.V., Botti, G., Tatangelo, F., Delrio, P., Maio, M., Laghi, L., Grizzi, F., Asslaber, M., D’Arrigo, C., Vidal-Vanaclocha, F., Zavadova, E., Chouchane, L., Ohashi, P.S., Hafezi-Bakhtiari, S., Wouters, B.G., Roehrl, M., Nguyen, L., Kawakami, Y., Hazama, S., Okuno, K., Ogino, S., Gibbs, P., Waring, P., Sato, N., Torigoe, T., Itoh, K., Patel, P.S., Shukla, S.N., Wang, Y., Kopetz, S., Sinicrope, F.A., Scripcariu, V., Ascierto, P.A., Marincola, F.M., Fox, B.A., Pagès, F., 2014. Towards the introduction of the ‘Immunoscore’ in the classification of malignant tumours. J. Pathol. 232, 199–209. https://doi.org/10.1002/path.4287
Ganesan, A.-P., Clarke, J., Wood, O., Garrido-Martin, E.M., Chee, S.J., Mellows, T., Samaniego-Castruita, D., Singh, D., Seumois, G., Alzetani, A., Woo, E., Friedmann, P.S., King, E.V., Thomas, G.J., Sanchez-Elsner, T., Vijayanand, P., Ottensmeier, C.H., 2017. Tissue-resident memory features are linked to the magnitude of cytotoxic T cell responses in human lung cancer. Nat Immunol 18, 940–950. https://doi.org/10.1038/ni.3775
Gao, Q., Liang, W.-W., Foltz, S.M., Mutharasu, G., Jayasinghe, R.G., Cao, S., Liao, W.-W., Reynolds, S.M., Wyczalkowski, M.A., Yao, L., Yu, L., Sun, S.Q., Caesar-Johnson, S.J., Demchok, J.A., Felau, I., Kasapi, M., Ferguson, M.L., Hutter, C.M., Sofia, H.J., Tarnuzzer, R., Wang, Z., Yang, L., Zenklusen, J.C., Zhang, J. (Julia), Chudamani, S., Liu, J., Lolla, L., Naresh, R., Pihl, T., Sun, Q., Wan, Y., Wu, Y., Cho, J., DeFreitas, T., Frazer, S., Gehlenborg, N., Getz, G., Heiman, D.I., Kim, J., Lawrence, M.S., Lin, P., Meier, S., Noble, M.S., Saksena, G., Voet, D., Zhang, Hailei, Bernard, B., Chambwe, N., Dhankani, V., Knijnenburg, T., Kramer, R., Leinonen, K., Liu, Y., Miller, M., Reynolds, S., Shmulevich, I., Thorsson, V., Zhang, W., Akbani, R., Broom, B.M., Hegde, A.M., Ju, Z., Kanchi, R.S., Korkut, A., Li, J., Liang, H., Ling, S., Liu, W., Lu, Y., Mills, G.B., Ng, K.-S., Rao, A., Ryan, M., Wang, Jing, Weinstein, J.N., Zhang, J., Abeshouse, A., Armenia, J., Chakravarty, D., Chatila, W.K., Bruijn, I. de, Gao, J., Gross, B.E., Heins, Z.J., Kundra, R., La, K., Ladanyi, M., Luna, A., Nissan, M.G., Ochoa, A., Phillips, S.M., Reznik, E., Sanchez-Vega, F., Sander, C., Schultz, N., Sheridan, R., Sumer, S.O., Sun, Y., Taylor, B.S., Wang, Jioajiao, Zhang, Hongxin, Anur, P., Peto, M., Spellman, P., Benz, C., Stuart, J.M., Wong, C.K., Yau, C., Hayes, D.N., Parker, J.S., Wilkerson, M.D., Ally, A., Balasundaram, M., Bowlby, R., Brooks, D., Carlsen, R., Chuah, E., Dhalla, N., Holt, R., Jones, S.J.M., Kasaian, K., Lee, D., Ma, Y., Marra, M.A., Mayo, M., Moore, R.A., Mungall, A.J., Mungall, K., Robertson, A.G., Sadeghi, S., Schein, J.E., Sipahimalani, P., Tam, A., Thiessen, N., Tse, K., Wong, T., Berger, A.C., Beroukhim, R., Cherniack, A.D., Cibulskis, C., Gabriel, S.B., Gao, G.F., Ha, G., Meyerson, M., Schumacher, S.E., Shih, J., Kucherlapati, M.H., Kucherlapati, R.S., Baylin, S., Cope, L., Danilova, L., Bootwalla, M.S., Lai, P.H., Maglinte, D.T., Berg, D.J.V.D., Weisenberger, D.J., Auman, J.T., Balu, S., Bodenheimer, T., Fan, C., Hoadley, K.A., Hoyle, A.P., Jefferys, S.R., Jones, C.D., Meng, S., Mieczkowski, P.A., Mose, L.E., Perou, A.H., Perou, C.M., Roach, J., Shi, Y., Simons, J.V., Skelly, T., Soloway, M.G., Tan, D., Veluvolu, U., Fan, H., Hinoue, T., Laird, P.W., Shen, H., Zhou, W., Bellair, M., Chang, K., Covington, K., Creighton, C.J., Dinh, H., Doddapaneni, H., Donehower, L.A., Drummond, J., Gibbs, R.A., Glenn, R., Hale, W., Han, Y., Hu, J., Korchina, V., Lee, S., Lewis, L., Li, W., Liu, X., Morgan, M., Morton, D., Muzny, D., Santibanez, J., Sheth, M., Shinbrot, E., Wang, L., Wang, M., Wheeler, D.A.,

Reference List
225
Xi, L., Zhao, F., Hess, J., Appelbaum, E.L., Bailey, M., Cordes, M.G., Ding, L., Fronick, C.C., Fulton, L.A., Fulton, R.S., Kandoth, C., Mardis, E.R., McLellan, M.D., Miller, C.A., Schmidt, H.K., Wilson, R.K., Crain, D., Curley, E., Gardner, J., Lau, K., Mallery, D., Morris, S., Paulauskis, J., Penny, R., Shelton, C., Shelton, T., Sherman, M., Thompson, E., Yena, P., Bowen, J., Gastier-Foster, J.M., Gerken, M., Leraas, K.M., Lichtenberg, T.M., Ramirez, N.C., Wise, L., Zmuda, E., Corcoran, N., Costello, T., Hovens, C., Carvalho, A.L., Carvalho, A.C. de, Fregnani, J.H., Longatto-Filho, A., Reis, R.M., Scapulatempo-Neto, C., Silveira, H.C.S., Vidal, D.O., Burnette, A., Eschbacher, J., Hermes, B., Noss, A., Singh, R., Anderson, M.L., Castro, P.D., Ittmann, M., Huntsman, D., Kohl, B., Le, X., Thorp, R., Andry, C., Duffy, E.R., Lyadov, V., Paklina, O., Setdikova, G., Shabunin, A., Tavobilov, M., McPherson, C., Warnick, R., Berkowitz, R., Cramer, D., Feltmate, C., Horowitz, N., Kibel, A., Muto, M., Raut, C.P., Malykh, A., Barnholtz-Sloan, J.S., Barrett, W., Devine, K., Fulop, J., Ostrom, Q.T., Shimmel, K., Wolinsky, Y., Sloan, A.E., Rose, A.D., Giuliante, F., Goodman, M., Karlan, B.Y., Hagedorn, C.H., Eckman, J., Harr, J., Myers, J., Tucker, K., Zach, L.A., Deyarmin, B., Hu, H., Kvecher, L., Larson, C., Mural, R.J., Somiari, S., Vicha, A., Zelinka, T., Bennett, J., Iacocca, M., Rabeno, B., Swanson, P., Latour, M., Lacombe, L., Têtu, B., Bergeron, A., McGraw, M., Staugaitis, S.M., Chabot, J., Hibshoosh, H., Sepulveda, A., Su, T., Wang, T., Potapova, O., Voronina, O., Desjardins, L., Mariani, O., Roman-Roman, S., Sastre, X., Stern, M.-H., Cheng, F., Signoretti, S., Berchuck, A., Bigner, D., Lipp, E., Marks, J., McCall, S., McLendon, R., Secord, A., Sharp, A., Behera, M., Brat, D.J., Chen, A., Delman, K., Force, S., Khuri, F., Magliocca, K., Maithel, S., Olson, J.J., Owonikoko, T., Pickens, A., Ramalingam, S., Shin, D.M., Sica, G., Meir, E.G.V., Zhang, Hongzheng, Eijckenboom, W., Gillis, A., Korpershoek, E., Looijenga, L., Oosterhuis, W., Stoop, H., Kessel, K.E. van, Zwarthoff, E.C., Calatozzolo, C., Cuppini, L., Cuzzubbo, S., DiMeco, F., Finocchiaro, G., Mattei, L., Perin, A., Pollo, B., Chen, C., Houck, J., Lohavanichbutr, P., Hartmann, A., Stoehr, C., Stoehr, R., Taubert, H., Wach, S., Wullich, B., Kycler, W., Murawa, D., Wiznerowicz, M., Chung, K., Edenfield, W.J., Martin, J., Baudin, E., Bubley, G., Bueno, R., Rienzo, A.D., Richards, W.G., Kalkanis, S., Mikkelsen, T., Noushmehr, H., Scarpace, L., Girard, N., Aymerich, M., Campo, E., Giné, E., Guillermo, A.L., Bang, N.V., Hanh, P.T., Phu, B.D., Tang, Y., Colman, H., Evason, K., Dottino, P.R., Martignetti, J.A., Gabra, H., Juhl, H., Akeredolu, T., Stepa, S., Hoon, D., Ahn, K., Kang, K.J., Beuschlein, F., Breggia, A., Birrer, M., Bell, D., Borad, M., Bryce, A.H., Castle, E., Chandan, V., Cheville, J., Copland, J.A., Farnell, M., Flotte, T., Giama, N., Ho, T., Kendrick, M., Kocher, J.-P., Kopp, K., Moser, C., Nagorney, D., O’Brien, D., O’Neill, B.P., Patel, T., Petersen, G., Que, F., Rivera, M., Roberts, L., Smallridge, R., Smyrk, T., Stanton, M., Thompson, R.H., Torbenson, M., Yang, J.D., Zhang, L., Brimo, F., Ajani, J.A., Gonzalez, A.M.A., Behrens, C., Bondaruk, J., Broaddus, R., Czerniak, B., Esmaeli, B., Fujimoto, J., Gershenwald, J., Guo, C., Lazar, A.J., Logothetis, C., Meric-Bernstam, F., Moran, C., Ramondetta, L., Rice, D., Sood, A., Tamboli, P., Thompson, T., Troncoso, P., Tsao, A., Wistuba, I., Carter, C., Haydu, L., Hersey, P., Jakrot, V., Kakavand, H., Kefford, R., Lee, K., Long, G., Mann, G., Quinn, M., Saw, R., Scolyer, R., Shannon, K., Spillane, A., Stretch, J., Synott, M., Thompson, J., Wilmott, J., Al-Ahmadie,

Reference List
226
H., Chan, T.A., Ghossein, R., Gopalan, A., Levine, D.A., Reuter, V., Singer, S., Singh, B., Tien, N.V., Broudy, T., Mirsaidi, C., Nair, P., Drwiega, P., Miller, J., Smith, J., Zaren, H., Park, J.-W., Hung, N.P., Kebebew, E., Linehan, W.M., Metwalli, A.R., Pacak, K., Pinto, P.A., Schiffman, M., Schmidt, L.S., Vocke, C.D., Wentzensen, N., Worrell, R., Yang, H., Moncrieff, M., Goparaju, C., Melamed, J., Pass, H., Botnariuc, N., Caraman, I., Cernat, M., Chemencedji, I., Clipca, A., Doruc, S., Gorincioi, G., Mura, S., Pirtac, M., Stancul, I., Tcaciuc, D., Albert, M., Alexopoulou, I., Arnaout, A., Bartlett, J., Engel, J., Gilbert, S., Parfitt, J., Sekhon, H., Thomas, G., Rassl, D.M., Rintoul, R.C., Bifulco, C., Tamakawa, R., Urba, W., Hayward, N., Timmers, H., Antenucci, A., Facciolo, F., Grazi, G., Marino, M., Merola, R., Krijger, R. de, Gimenez-Roqueplo, A.-P., Piché, A., Chevalier, S., McKercher, G., Birsoy, K., Barnett, G., Brewer, C., Farver, C., Naska, T., Pennell, N.A., Raymond, D., Schilero, C., Smolenski, K., Williams, F., Morrison, C., Borgia, J.A., Liptay, M.J., Pool, M., Seder, C.W., Junker, K., Omberg, L., Dinkin, M., Manikhas, G., Alvaro, D., Bragazzi, M.C., Cardinale, V., Carpino, G., Gaudio, E., Chesla, D., Cottingham, S., Dubina, M., Moiseenko, F., Dhanasekaran, R., Becker, K.-F., Janssen, K.-P., Slotta-Huspenina, J., Abdel-Rahman, M.H., Aziz, D., Bell, S., Cebulla, C.M., Davis, A., Duell, R., Elder, J.B., Hilty, J., Kumar, B., Lang, J., Lehman, N.L., Mandt, R., Nguyen, P., Pilarski, R., Rai, K., Schoenfield, L., Senecal, K., Wakely, P., Hansen, P., Lechan, R., Powers, J., Tischler, A., Grizzle, W.E., Sexton, K.C., Kastl, A., Henderson, J., Porten, S., Waldmann, J., Fassnacht, M., Asa, S.L., Schadendorf, D., Couce, M., Graefen, M., Huland, H., Sauter, G., Schlomm, T., Simon, R., Tennstedt, P., Olabode, O., Nelson, M., Bathe, O., Carroll, P.R., Chan, J.M., Disaia, P., Glenn, P., Kelley, R.K., Landen, C.N., Phillips, J., Prados, M., Simko, J., Smith-McCune, K., VandenBerg, S., Roggin, K., Fehrenbach, A., Kendler, A., Sifri, S., Steele, R., Jimeno, A., Carey, F., Forgie, I., Mannelli, M., Carney, M., Hernandez, B., Campos, B., Herold-Mende, C., Jungk, C., Unterberg, A., Deimling, A. von, Bossler, A., Galbraith, J., Jacobus, L., Knudson, M., Knutson, T., Ma, D., Milhem, M., Sigmund, R., Godwin, A.K., Madan, R., Rosenthal, H.G., Adebamowo, C., Adebamowo, S.N., Boussioutas, A., Beer, D., Giordano, T., Mes-Masson, A.-M., Saad, F., Bocklage, T., Landrum, L., Mannel, R., Moore, K., Moxley, K., Postier, R., Walker, J., Zuna, R., Feldman, M., Valdivieso, F., Dhir, R., Luketich, J., Pinero, E.M.M., Quintero-Aguilo, M., Carlotti, C.G., Santos, J.S.D., Kemp, R., Sankarankuty, A., Tirapelli, D., Catto, J., Agnew, K., Swisher, E., Creaney, J., Robinson, B., Shelley, C.S., Godwin, E.M., Kendall, S., Shipman, C., Bradford, C., Carey, T., Haddad, A., Moyer, J., Peterson, L., Prince, M., Rozek, L., Wolf, G., Bowman, R., Fong, K.M., Yang, I., Korst, R., Rathmell, W.K., Fantacone-Campbell, J.L., Hooke, J.A., Kovatich, A.J., Shriver, C.D., DiPersio, J., Drake, B., Govindan, R., Heath, S., Ley, T., Tine, B.V., Westervelt, P., Rubin, M.A., Lee, J.I., Aredes, N.D., Mariamidze, A., Chen, K., Lazar, A.J., Fields, R.C., Wendl, M.C., Tine, B.A.V., Vij, R., Chen, F., Nykter, M., Shmulevich, I., Ding, L., 2018. Driver Fusions and Their Implications in the Development and Treatment of Human Cancers. Cell Reports 23, 227-238.e3. https://doi.org/10.1016/j.celrep.2018.03.050
Garber, M.E., Troyanskaya, O.G., Schluens, K., Petersen, S., Thaesler, Z., Pacyna-Gengelbach, M., Rijn, M. van de, Rosen, G.D., Perou, C.M., Whyte,

Reference List
227
R.I., Altman, R.B., Brown, P.O., Botstein, D., Petersen, I., 2001. Diversity of gene expression in adenocarcinoma of the lung. PNAS 98, 13784–13789. https://doi.org/10.1073/pnas.241500798
Garon, E.B., Rizvi, N.A., Hui, R., Leighl, N., Balmanoukian, A.S., Eder, J.P., Patnaik, A., Aggarwal, C., Gubens, M., Horn, L., Carcereny, E., Ahn, M.-J., Felip, E., Lee, J.-S., Hellmann, M.D., Hamid, O., Goldman, J.W., Soria, J.-C., Dolled-Filhart, M., Rutledge, R.Z., Zhang, J., Lunceford, J.K., Rangwala, R., Lubiniecki, G.M., Roach, C., Emancipator, K., Gandhi, L., 2015. Pembrolizumab for the Treatment of Non–Small-Cell Lung Cancer. New England Journal of Medicine 372, 2018–2028. https://doi.org/10.1056/NEJMoa1501824
Garraway, L.A., Lander, E.S., 2013. Lessons from the Cancer Genome. Cell 153, 17–37. https://doi.org/10.1016/j.cell.2013.03.002
Gentles, A.J., Newman, A.M., Liu, C.L., Bratman, S.V., Feng, W., Kim, D., Nair, V.S., Xu, Y., Khuong, A., Hoang, C.D., Diehn, M., West, R.B., Plevritis, S.K., Alizadeh, A.A., 2015. The prognostic landscape of genes and infiltrating immune cells across human cancers. Nat Med 21, 938–945. https://doi.org/10.1038/nm.3909
Gerhauser, C., Favero, F., Risch, T., Simon, R., Feuerbach, L., Assenov, Y., Heckmann, D., Sidiropoulos, N., Waszak, S.M., Hübschmann, D., Urbanucci, A., Girma, E.G., Kuryshev, V., Klimczak, L.J., Saini, N., Stütz, A.M., Weichenhan, D., Böttcher, L.-M., Toth, R., Hendriksen, J.D., Koop, C., Lutsik, P., Matzk, S., Warnatz, H.-J., Amstislavskiy, V., Feuerstein, C., Raeder, B., Bogatyrova, O., Schmitz, E.-M., Hube-Magg, C., Kluth, M., Huland, H., Graefen, M., Lawerenz, C., Henry, G.H., Yamaguchi, T.N., Malewska, A., Meiners, J., Schilling, D., Reisinger, E., Eils, R., Schlesner, M., Strand, D.W., Bristow, R.G., Boutros, P.C., Kalle, C. von, Gordenin, D., Sültmann, H., Brors, B., Sauter, G., Plass, C., Yaspo, M.-L., Korbel, J.O., Schlomm, T., Weischenfeldt, J., 2018. Molecular Evolution of Early-Onset Prostate Cancer Identifies Molecular Risk Markers and Clinical Trajectories. Cancer Cell 34, 996-1011.e8. https://doi.org/10.1016/j.ccell.2018.10.016
Gerlinger, M., Horswell, S., Larkin, J., Rowan, A.J., Salm, M.P., Varela, I., Fisher, R., McGranahan, N., Matthews, N., Santos, C.R., Martinez, P., Phillimore, B., Begum, S., Rabinowitz, A., Spencer-Dene, B., Gulati, S., Bates, P.A., Stamp, G., Pickering, L., Gore, M., Nicol, D.L., Hazell, S., Futreal, P.A., Stewart, A., Swanton, C., 2014. Genomic architecture and evolution of clear cell renal cell carcinomas defined by multiregion sequencing. Nat. Genet. 46, 225–233. https://doi.org/10.1038/ng.2891
Gerlinger, M., Rowan, A.J., Horswell, S., Larkin, J., Endesfelder, D., Gronroos, E., Martinez, P., Matthews, N., Stewart, A., Tarpey, P., Varela, I., Phillimore, B., Begum, S., McDonald, N.Q., Butler, A., Jones, D., Raine, K., Latimer, C., Santos, C.R., Nohadani, M., Eklund, A.C., Spencer-Dene, B., Clark, G., Pickering, L., Stamp, G., Gore, M., Szallasi, Z., Downward, J., Futreal, P.A., Swanton, C., 2012. Intratumor Heterogeneity and Branched Evolution Revealed by Multiregion Sequencing. New England Journal of Medicine 366, 883–892. https://doi.org/10.1056/NEJMoa1113205
Gerstung, M., Papaemmanuil, E., Martincorena, I., Bullinger, L., Gaidzik, V.I., Paschka, P., Heuser, M., Thol, F., Bolli, N., Ganly, P., Ganser, A., McDermott, U., Döhner, K., Schlenk, R.F., Döhner, H., Campbell, P.J., 2017. Precision oncology for acute myeloid leukemia using a knowledge

Reference List
228
bank approach. Nature Genetics 49, 332–340. https://doi.org/10.1038/ng.3756
Goc, J., Germain, C., Vo-Bourgais, T.K.D., Lupo, A., Klein, C., Knockaert, S., Chaisemartin, L. de, Ouakrim, H., Becht, E., Alifano, M., Validire, P., Remark, R., Hammond, S.A., Cremer, I., Damotte, D., Fridman, W.-H., Sautès-Fridman, C., Dieu-Nosjean, M.-C., 2014. Dendritic Cells in Tumor-Associated Tertiary Lymphoid Structures Signal a Th1 Cytotoxic Immune Contexture and License the Positive Prognostic Value of Infiltrating CD8+ T Cells. Cancer Res 74, 705–715. https://doi.org/10.1158/0008-5472.CAN-13-1342
Goldstraw, P., Chansky, K., Crowley, J., Rami-Porta, Ramon, Asamura, H., Eberhardt, Wilfried E. E., Nicholson, A.G., Groome, P., Mitchell, A., Bolejack, V., Goldstraw, P., Rami-Porta, Ramón, Asamura, H., Ball, David, Beer, D.G., Beyruti, R., Bolejack, V., Chansky, K., Crowley, J., Detterbeck, F., Eberhardt, Wilfried Ernst Erich, Edwards, J., Galateau-Sallé, F., Giroux, D., Gleeson, F., Groome, P., Huang, J., Kennedy, Catherine, Kim, J., Kim, Y.T., Kingsbury, L., Kondo, H., Krasnik, M., Kubota, K., Lerut, A., Lyons, Gustavo, Marino, M., Marom, E.M., Meerbeeck, J. van, Mitchell, A., Nakano, T., Nicholson, A.G., Nowak, A., Peake, M., Rice, T., Rosenzweig, K., Ruffini, Enrico, Rusch, Valerie, Saijo, N., Schil, Paul Van, Sculier, J.-P., Shemanski, L., Stratton, K., Suzuki, K., Tachimori, Y., Thomas, C.F., Travis, W., Tsao, M.S., Turrisi, A., Vansteenkiste, J., Watanabe, H., Wu, Y.-L., Baas, P., Erasmus, J., Hasegawa, S., Inai, K., Kernstine, K., Kindler, H., Krug, L., Nackaerts, K., Pass, Harvey, Rice, D., Falkson, C., Filosso, P.L., Giaccone, G., Kondo, K., Lucchi, M., Okumura, M., Blackstone, E., Cavaco, F.A., Barrera, E.A., Arca, J.A., Lamelas, I.P., Obrer, A.A., Jorge, R.G., Ball, D., Bascom, G.K., Orozco, A.I.B., Castro, M.A.G., Blum, M.G., Chimondeguy, D., Cvijanovic, V., Defranchi, S., Navarro, B. de O., Campuzano, I.E., Vidueira, I.M., Araujo, E.F., García, F.A., Fong, K.M., Corral, G.F., González, S.C., Gilart, J.F., Arangüena, L.G., Barajas, S.G., Girard, P., Goksel, T., Budiño, M.T.G., Casaurrán, G.G., Blanco, J.A.G., Hernández, J.H., Rodríguez, H.H., Collantes, J.H., Heras, M.I., Elena, J.M.I., Jakobsen, E., Kostas, S., Atance, P.L., Ares, A.N., Liao, M., Losanovscky, M., Lyons, G., Magaroles, R., Júlvez, L.D.E., Gorospe, M.M., McCaughan, B., Kennedy, C., Íñiguez, R.M., Sorribes, L.M., Gozalo, S.N., Arriba, C.Á. de, Delgado, M.N., Alarcón, J.P., Cuesta, J.C.P., Park, J.S., Pass, H., Fernández, M.J.P., Rosenberg, M., Ruffini, E., Rusch, V., Escuín, J.S. de C., Vinuesa, A.S., Mitjans, M.S., Strand, T.E., Subotic, D., Swisher, S., Terra, R., Thomas, C., Tournoy, K., Schil, P. Van, Velasquez, M., Wu, Y.L., Yokoi, K., 2016. The IASLC Lung Cancer Staging Project: Proposals for Revision of the TNM Stage Groupings in the Forthcoming (Eighth) Edition of the TNM Classification for Lung Cancer. Journal of Thoracic Oncology 11, 39–51. https://doi.org/10.1016/j.jtho.2015.09.009
Goldstraw, P., Crowley, J., Chansky, K., Giroux, D.J., Groome, P.A., Rami-Porta, R., Postmus, P.E., Rusch, V., Sobin, L., 2007. The IASLC Lung Cancer Staging Project: Proposals for the Revision of the TNM Stage Groupings in the Forthcoming (Seventh) Edition of the TNM Classification of Malignant Tumours. Journal of Thoracic Oncology 2, 706–714. https://doi.org/10.1097/JTO.0b013e31812f3c1a

Reference List
229
Golub, T.R., Slonim, D.K., Tamayo, P., Huard, C., Gaasenbeek, M., Mesirov, J.P., Coller, H., Loh, M.L., Downing, J.R., Caligiuri, M.A., Bloomfield, C.D., Lander, E.S., 1999. Molecular Classification of Cancer: Class Discovery and Class Prediction by Gene Expression Monitoring. Science 286, 531–537. https://doi.org/10.1126/science.286.5439.531
Gong, T., Szustakowski, J.D., 2013. DeconRNASeq: a statistical framework for deconvolution of heterogeneous tissue samples based on mRNA-Seq data. Bioinformatics 29, 1083–1085. https://doi.org/10.1093/bioinformatics/btt090
Gordon, S.R., Maute, R.L., Dulken, B.W., Hutter, G., George, B.M., McCracken, M.N., Gupta, R., Tsai, J.M., Sinha, R., Corey, D., Ring, A.M., Connolly, A.J., Weissman, I.L., 2017. PD-1 expression by tumour-associated macrophages inhibits phagocytosis and tumour immunity. Nature 545, 495–499. https://doi.org/10.1038/nature22396
Greaves, M., 2015. Evolutionary Determinants of Cancer. Cancer Discov 5, 806–820. https://doi.org/10.1158/2159-8290.CD-15-0439
Greenman, C., Stephens, P., Smith, R., Dalgliesh, G.L., Hunter, C., Bignell, G., Davies, H., Teague, J., Butler, A., Stevens, C., Edkins, S., O’Meara, S., Vastrik, I., Schmidt, E.E., Avis, T., Barthorpe, S., Bhamra, G., Buck, G., Choudhury, B., Clements, J., Cole, J., Dicks, E., Forbes, S., Gray, K., Halliday, K., Harrison, R., Hills, K., Hinton, J., Jenkinson, A., Jones, D., Menzies, A., Mironenko, T., Perry, J., Raine, K., Richardson, D., Shepherd, R., Small, A., Tofts, C., Varian, J., Webb, T., West, S., Widaa, S., Yates, A., Cahill, D.P., Louis, D.N., Goldstraw, P., Nicholson, A.G., Brasseur, F., Looijenga, L., Weber, B.L., Chiew, Y.-E., deFazio, A., Greaves, M.F., Green, A.R., Campbell, P., Birney, E., Easton, D.F., Chenevix-Trench, G., Tan, M.-H., Khoo, S.K., Teh, B.T., Yuen, S.T., Leung, S.Y., Wooster, R., Futreal, P.A., Stratton, M.R., 2007. Patterns of somatic mutation in human cancer genomes. Nature 446, 153–158. https://doi.org/10.1038/nature05610
Gubin, M.M., Zhang, X., Schuster, H., Caron, E., Ward, J.P., Noguchi, T., Ivanova, Y., Hundal, J., Arthur, C.D., Krebber, W.-J., Mulder, G.E., Toebes, M., Vesely, M.D., Lam, S.S.K., Korman, A.J., Allison, J.P., Freeman, G.J., Sharpe, A.H., Pearce, E.L., Schumacher, T.N., Aebersold, R., Rammensee, H.-G., Melief, C.J.M., Mardis, E.R., Gillanders, W.E., Artyomov, M.N., Schreiber, R.D., 2014. Checkpoint blockade cancer immunotherapy targets tumour-specific mutant antigens. Nature 515, 577–581. https://doi.org/10.1038/nature13988
Gulati, G.S., Sikandar, S.S., Wesche, D.J., Manjunath, A., Bharadwaj, A., Berger, M.J., Ilagan, F., Kuo, A.H., Hsieh, R.W., Cai, S., Zabala, M., Scheeren, F.A., Lobo, N.A., Qian, D., Yu, F.B., Dirbas, F.M., Clarke, M.F., Newman, A.M., 2020. Single-cell transcriptional diversity is a hallmark of developmental potential. Science 367, 405–411. https://doi.org/10.1126/science.aax0249
Gulati, S., Martinez, P., Joshi, T., Birkbak, N.J., Santos, C.R., Rowan, A.J., Pickering, L., Gore, M., Larkin, J., Szallasi, Z., Bates, P.A., Swanton, C., Gerlinger, M., 2014. Systematic Evaluation of the Prognostic Impact and Intratumour Heterogeneity of Clear Cell Renal Cell Carcinoma Biomarkers. European Urology 66, 936–948. https://doi.org/10.1016/j.eururo.2014.06.053
Gulati, S., Turajlic, S., Larkin, J., Bates, P.A., Swanton, C., 2015. Relapse models for clear cell renal carcinoma. The Lancet Oncology 16, e376–e378. https://doi.org/10.1016/S1470-2045(15)00090-X
Reference List
230
Gyanchandani, R., Lin, Y., Lin, H.-M., Cooper, K., Normolle, D.P., Brufsky, A., Fastuca, M., Crosson, W., Oesterreich, S., Davidson, N.E., Bhargava, R., Dabbs, D.J., Lee, A.V., 2016. Intratumor Heterogeneity Affects Gene Expression Profile Test Prognostic Risk Stratification in Early Breast Cancer. Clin Cancer Res 22, 5362–5369. https://doi.org/10.1158/1078-0432.CCR-15-2889
Haar, J. van de, Canisius, S., Yu, M.K., Voest, E.E., Wessels, L.F.A., Ideker, T., 2019. Identifying Epistasis in Cancer Genomes: A Delicate Affair. Cell 177, 1375–1383. https://doi.org/10.1016/j.cell.2019.05.005
Hahn, W.C., Weinberg, R.A., 2002. Rules for Making Human Tumor Cells. New England Journal of Medicine 347, 1593–1603. https://doi.org/10.1056/NEJMra021902
Håkansson, L., Tropé, C., 1974. On the presence within tumours of clones that differ in sensitivity to cytostatic drugs. Acta Pathol Microbiol Scand A 82, 35–40.
Hanahan, D., Coussens, L.M., 2012. Accessories to the Crime: Functions of Cells Recruited to the Tumor Microenvironment. Cancer Cell 21, 309–322. https://doi.org/10.1016/j.ccr.2012.02.022
Hanahan, D., Weinberg, R.A., 2011. Hallmarks of cancer: the next generation. Cell 144, 646–674. https://doi.org/10.1016/j.cell.2011.02.013
Hänzelmann, S., Castelo, R., Guinney, J., 2013. GSVA: gene set variation analysis for microarray and RNA-Seq data. BMC Bioinformatics 14, 7. https://doi.org/10.1186/1471-2105-14-7
Harding, F.A., McArthur, J.G., Gross, J.A., Raulet, D.H., Allison, J.P., 1992. CD28-mediated signalling co-stimulates murine T cells and prevents induction of anergy in T-cell clones. Nature 356, 607–609. https://doi.org/10.1038/356607a0
Havel, J.J., Chowell, D., Chan, T.A., 2019. The evolving landscape of biomarkers for checkpoint inhibitor immunotherapy. Nature Reviews Cancer 1. https://doi.org/10.1038/s41568-019-0116-x
Heppner, G.H., 1984. Tumor heterogeneity. Cancer Res. 44, 2259–2265. Herbst, R.S., Baas, P., Kim, D.-W., Felip, E., Pérez-Gracia, J.L., Han, J.-Y., Molina,
J., Kim, J.-H., Arvis, C.D., Ahn, M.-J., Majem, M., Fidler, M.J., de Castro, G., Garrido, M., Lubiniecki, G.M., Shentu, Y., Im, E., Dolled-Filhart, M., Garon, E.B., 2016. Pembrolizumab versus docetaxel for previously treated, PD-L1-positive, advanced non-small-cell lung cancer (KEYNOTE-010): a randomised controlled trial. The Lancet 387, 1540–1550. https://doi.org/10.1016/S0140-6736(15)01281-7
Herbst, R.S., Soria, J.-C., Kowanetz, M., Fine, G.D., Hamid, O., Gordon, M.S., Sosman, J.A., McDermott, D.F., Powderly, J.D., Gettinger, S.N., Kohrt, H.E.K., Horn, L., Lawrence, D.P., Rost, S., Leabman, M., Xiao, Y., Mokatrin, A., Koeppen, H., Hegde, P.S., Mellman, I., Chen, D.S., Hodi, F.S., 2014. Predictive correlates of response to the anti-PD-L1 antibody MPDL3280A in cancer patients. Nature 515, 563–567. https://doi.org/10.1038/nature14011
Hirata, E., Sahai, E., 2017. Tumor Microenvironment and Differential Responses to Therapy. Cold Spring Harb Perspect Med 7, a026781. https://doi.org/10.1101/cshperspect.a026781
Hirayama, S., Ishii, G., Nagai, K., Ono, S., Kojima, M., Yamauchi, C., Aokage, K., Hishida, T., Yoshida, J., Suzuki, K., Ochiai, A., 2012. Prognostic Impact of CD204-Positive Macrophages in Lung Squamous Cell Carcinoma: Possible

Reference List
231
Contribution of Cd204-Positive Macrophages to the Tumor-Promoting Microenvironment. Journal of Thoracic Oncology 7, 1790–1797. https://doi.org/10.1097/JTO.0b013e3182745968
Hoadley, K.A., Yau, C., Hinoue, T., Wolf, D.M., Lazar, A.J., Drill, E., Shen, R., Taylor, A.M., Cherniack, A.D., Thorsson, Vésteinn, Akbani, R., Bowlby, R., Wong, C.K., Wiznerowicz, M., Sanchez-Vega, F., Robertson, A.G., Schneider, B.G., Lawrence, M.S., Noushmehr, H., Malta, T.M., Caesar-Johnson, S.J., Demchok, J.A., Felau, I., Kasapi, M., Ferguson, M.L., Hutter, C.M., Sofia, H.J., Tarnuzzer, R., Wang, Z., Yang, L., Zenklusen, J.C., Zhang, J. (Julia), Chudamani, S., Liu, J., Lolla, L., Naresh, R., Pihl, T., Sun, Q., Wan, Y., Wu, Y., Cho, J., DeFreitas, T., Frazer, S., Gehlenborg, N., Getz, G., Heiman, D.I., Kim, J., Lawrence, M.S., Lin, P., Meier, S., Noble, M.S., Saksena, G., Voet, D., Zhang, Hailei, Bernard, B., Chambwe, N., Dhankani, V., Knijnenburg, T., Kramer, R., Leinonen, K., Liu, Y., Miller, M., Reynolds, S., Shmulevich, I., Thorsson, Vesteinn, Zhang, W., Akbani, R., Broom, B.M., Hegde, A.M., Ju, Z., Kanchi, R.S., Korkut, A., Li, J., Liang, H., Ling, S., Liu, W., Lu, Y., Mills, G.B., Ng, K.-S., Rao, A., Ryan, M., Wang, Jing, Weinstein, J.N., Zhang, J., Abeshouse, A., Armenia, J., Chakravarty, D., Chatila, W.K., Bruijn, I. de, Gao, J., Gross, B.E., Heins, Z.J., Kundra, R., La, K., Ladanyi, M., Luna, A., Nissan, M.G., Ochoa, A., Phillips, S.M., Reznik, E., Sanchez-Vega, F., Sander, C., Schultz, N., Sheridan, R., Sumer, S.O., Sun, Y., Taylor, B.S., Wang, Jioajiao, Zhang, Hongxin, Anur, P., Peto, M., Spellman, P., Benz, C., Stuart, J.M., Wong, C.K., Yau, C., Hayes, D.N., Parker, J.S., Wilkerson, M.D., Ally, A., Balasundaram, M., Bowlby, R., Brooks, D., Carlsen, R., Chuah, E., Dhalla, N., Holt, R., Jones, S.J.M., Kasaian, K., Lee, D., Ma, Y., Marra, M.A., Mayo, M., Moore, R.A., Mungall, A.J., Mungall, K., Robertson, A.G., Sadeghi, S., Schein, J.E., Sipahimalani, P., Tam, A., Thiessen, N., Tse, K., Wong, T., Berger, A.C., Beroukhim, R., Cherniack, A.D., Cibulskis, C., Gabriel, S.B., Gao, G.F., Ha, G., Meyerson, M., Schumacher, S.E., Shih, J., Kucherlapati, M.H., Kucherlapati, R.S., Baylin, S., Cope, L., Danilova, L., Bootwalla, M.S., Lai, P.H., Maglinte, D.T., Berg, D.J.V.D., Weisenberger, D.J., Auman, J.T., Balu, S., Bodenheimer, T., Fan, C., Hoadley, K.A., Hoyle, A.P., Jefferys, S.R., Jones, C.D., Meng, S., Mieczkowski, P.A., Mose, L.E., Perou, A.H., Perou, C.M., Roach, J., Shi, Y., Simons, J.V., Skelly, T., Soloway, M.G., Tan, D., Veluvolu, U., Fan, H., Hinoue, T., Laird, P.W., Shen, H., Zhou, W., Bellair, M., Chang, K., Covington, K., Creighton, C.J., Dinh, H., Doddapaneni, H., Donehower, L.A., Drummond, J., Gibbs, R.A., Glenn, R., Hale, W., Han, Y., Hu, J., Korchina, V., Lee, S., Lewis, L., Li, W., Liu, X., Morgan, M., Morton, D., Muzny, D., Santibanez, J., Sheth, M., Shinbrot, E., Wang, L., Wang, M., Wheeler, D.A., Xi, L., Zhao, F., Hess, J., Appelbaum, E.L., Bailey, M., Cordes, M.G., Ding, L., Fronick, C.C., Fulton, L.A., Fulton, R.S., Kandoth, C., Mardis, E.R., McLellan, M.D., Miller, C.A., Schmidt, H.K., Wilson, R.K., Crain, D., Curley, E., Gardner, J., Lau, K., Mallery, D., Morris, S., Paulauskis, J., Penny, R., Shelton, C., Shelton, T., Sherman, M., Thompson, E., Yena, P., Bowen, J., Gastier-Foster, J.M., Gerken, M., Leraas, K.M., Lichtenberg, T.M., Ramirez, N.C., Wise, L., Zmuda, E., Corcoran, N., Costello, T., Hovens, C., Carvalho, A.L., Carvalho, A.C. de, Fregnani, J.H., Longatto-Filho, A., Reis, R.M., Scapulatempo-Neto, C., Silveira, H.C.S., Vidal, D.O., Burnette, A., Eschbacher, J., Hermes, B., Noss, A., Singh, R., Anderson, M.L., Castro,

Reference List
232
P.D., Ittmann, M., Huntsman, D., Kohl, B., Le, X., Thorp, R., Andry, C., Duffy, E.R., Lyadov, V., Paklina, O., Setdikova, G., Shabunin, A., Tavobilov, M., McPherson, C., Warnick, R., Berkowitz, R., Cramer, D., Feltmate, C., Horowitz, N., Kibel, A., Muto, M., Raut, C.P., Malykh, A., Barnholtz-Sloan, J.S., Barrett, W., Devine, K., Fulop, J., Ostrom, Q.T., Shimmel, K., Wolinsky, Y., Sloan, A.E., Rose, A.D., Giuliante, F., Goodman, M., Karlan, B.Y., Hagedorn, C.H., Eckman, J., Harr, J., Myers, J., Tucker, K., Zach, L.A., Deyarmin, B., Hu, H., Kvecher, L., Larson, C., Mural, R.J., Somiari, S., Vicha, A., Zelinka, T., Bennett, J., Iacocca, M., Rabeno, B., Swanson, P., Latour, M., Lacombe, L., Têtu, B., Bergeron, A., McGraw, M., Staugaitis, S.M., Chabot, J., Hibshoosh, H., Sepulveda, A., Su, T., Wang, T., Potapova, O., Voronina, O., Desjardins, L., Mariani, O., Roman-Roman, S., Sastre, X., Stern, M.-H., Cheng, F., Signoretti, S., Berchuck, A., Bigner, D., Lipp, E., Marks, J., McCall, S., McLendon, R., Secord, A., Sharp, A., Behera, M., Brat, D.J., Chen, A., Delman, K., Force, S., Khuri, F., Magliocca, K., Maithel, S., Olson, J.J., Owonikoko, T., Pickens, A., Ramalingam, S., Shin, D.M., Sica, G., Meir, E.G.V., Zhang, Hongzheng, Eijckenboom, W., Gillis, A., Korpershoek, E., Looijenga, L., Oosterhuis, W., Stoop, H., Kessel, K.E. van, Zwarthoff, E.C., Calatozzolo, C., Cuppini, L., Cuzzubbo, S., DiMeco, F., Finocchiaro, G., Mattei, L., Perin, A., Pollo, B., Chen, C., Houck, J., Lohavanichbutr, P., Hartmann, A., Stoehr, C., Stoehr, R., Taubert, H., Wach, S., Wullich, B., Kycler, W., Murawa, D., Wiznerowicz, M., Chung, K., Edenfield, W.J., Martin, J., Baudin, E., Bubley, G., Bueno, R., Rienzo, A.D., Richards, W.G., Kalkanis, S., Mikkelsen, T., Noushmehr, H., Scarpace, L., Girard, N., Aymerich, M., Campo, E., Giné, E., Guillermo, A.L., Bang, N.V., Hanh, P.T., Phu, B.D., Tang, Y., Colman, H., Evason, K., Dottino, P.R., Martignetti, J.A., Gabra, H., Juhl, H., Akeredolu, T., Stepa, S., Hoon, D., Ahn, K., Kang, K.J., Beuschlein, F., Breggia, A., Birrer, M., Bell, D., Borad, M., Bryce, A.H., Castle, E., Chandan, V., Cheville, J., Copland, J.A., Farnell, M., Flotte, T., Giama, N., Ho, T., Kendrick, M., Kocher, J.-P., Kopp, K., Moser, C., Nagorney, D., O’Brien, D., O’Neill, B.P., Patel, T., Petersen, G., Que, F., Rivera, M., Roberts, L., Smallridge, R., Smyrk, T., Stanton, M., Thompson, R.H., Torbenson, M., Yang, J.D., Zhang, L., Brimo, F., Ajani, J.A., Gonzalez, A.M.A., Behrens, C., Bondaruk, O., Broaddus, R., Czerniak, B., Esmaeli, B., Fujimoto, J., Gershenwald, J., Guo, C., Lazar, A.J., Logothetis, C., Meric-Bernstam, F., Moran, C., Ramondetta, L., Rice, D., Sood, A., Tamboli, P., Thompson, T., Troncoso, P., Tsao, A., Wistuba, I., Carter, C., Haydu, L., Hersey, P., Jakrot, V., Kakavand, H., Kefford, R., Lee, K., Long, G., Mann, G., Quinn, M., Saw, R., Scolyer, R., Shannon, K., Spillane, A., Stretch, J., Synott, M., Thompson, J., Wilmott, J., Al-Ahmadie, H., Chan, T.A., Ghossein, R., Gopalan, A., Levine, D.A., Reuter, V., Singer, S., Singh, B., Tien, N.V., Broudy, T., Mirsaidi, C., Nair, P., Drwiega, P., Miller, J., Smith, J., Zaren, H., Park, J.-W., Hung, N.P., Kebebew, E., Linehan, W.M., Metwalli, A.R., Pacak, K., Pinto, P.A., Schiffman, M., Schmidt, L.S., Vocke, C.D., Wentzensen, N., Worrell, R., Yang, H., Moncrieff, M., Goparaju, C., Melamed, J., Pass, H., Botnariuc, N., Caraman, I., Cernat, M., Chemencedji, I., Clipca, A., Doruc, S., Gorincioi, G., Mura, S., Pirtac, M., Stancul, I., Tcaciuc, D., Albert, M., Alexopoulou, I., Arnaout, A., Bartlett, J., Engel, J., Gilbert, S., Parfitt, J., Sekhon, H., Thomas, G., Rassl, D.M., Rintoul, R.C., Bifulco, C., Tamakawa, R., Urba, W., Hayward, N.,

Reference List
233
Timmers, H., Antenucci, A., Facciolo, F., Grazi, G., Marino, M., Merola, R., Krijger, R. de, Gimenez-Roqueplo, A.-P., Piché, A., Chevalier, S., McKercher, G., Birsoy, K., Barnett, G., Brewer, C., Farver, C., Naska, T., Pennell, N.A., Raymond, D., Schilero, C., Smolenski, K., Williams, F., Morrison, C., Borgia, J.A., Liptay, M.J., Pool, M., Seder, C.W., Junker, K., Omberg, L., Dinkin, M., Manikhas, G., Alvaro, D., Bragazzi, M.C., Cardinale, V., Carpino, G., Gaudio, E., Chesla, D., Cottingham, S., Dubina, M., Moiseenko, F., Dhanasekaran, R., Becker, K.-F., Janssen, K.-P., Slotta-Huspenina, J., Abdel-Rahman, M.H., Aziz, D., Bell, S., Cebulla, C.M., Davis, A., Duell, R., Elder, J.B., Hilty, J., Kumar, B., Lang, J., Lehman, N.L., Mandt, R., Nguyen, P., Pilarski, R., Rai, K., Schoenfield, L., Senecal, K., Wakely, P., Hansen, P., Lechan, R., Powers, J., Tischler, A., Grizzle, W.E., Sexton, K.C., Kastl, A., Henderson, J., Porten, S., Waldmann, J., Fassnacht, M., Asa, S.L., Schadendorf, D., Couce, M., Graefen, M., Huland, H., Sauter, G., Schlomm, T., Simon, R., Tennstedt, P., Olabode, O., Nelson, M., Bathe, O., Carroll, P.R., Chan, J.M., Disaia, P., Glenn, P., Kelley, R.K., Landen, C.N., Phillips, J., Prados, M., Simko, J., Smith-McCune, K., VandenBerg, S., Roggin, K., Fehrenbach, A., Kendler, A., Sifri, S., Steele, R., Jimeno, A., Carey, F., Forgie, I., Mannelli, M., Carney, M., Hernandez, B., Campos, B., Herold-Mende, C., Jungk, C., Unterberg, A., Deimling, A. von, Bossler, A., Galbraith, J., Jacobus, L., Knudson, M., Knutson, T., Ma, D., Milhem, M., Sigmund, R., Godwin, A.K., Madan, R., Rosenthal, H.G., Adebamowo, C., Adebamowo, S.N., Boussioutas, A., Beer, D., Giordano, T., Mes-Masson, A.-M., Saad, F., Bocklage, T., Landrum, L., Mannel, R., Moore, K., Moxley, K., Postier, R., Walker, J., Zuna, R., Feldman, M., Valdivieso, F., Dhir, R., Luketich, J., Pinero, E.M.M., Quintero-Aguilo, M., Carlotti, C.G., Santos, J.S.D., Kemp, R., Sankarankuty, A., Tirapelli, D., Catto, J., Agnew, K., Swisher, E., Creaney, J., Robinson, B., Shelley, C.S., Godwin, E.M., Kendall, S., Shipman, C., Bradford, C., Carey, T., Haddad, A., Moyer, J., Peterson, L., Prince, M., Rozek, L., Wolf, G., Bowman, R., Fong, K.M., Yang, I., Korst, R., Rathmell, W.K., Fantacone-Campbell, J.L., Hooke, J.A., Kovatich, A.J., Shriver, C.D., DiPersio, J., Drake, B., Govindan, R., Heath, S., Ley, T., Tine, B.V., Westervelt, P., Rubin, M.A., Lee, J.I., Aredes, N.D., Mariamidze, A., Stuart, J.M., Benz, C.C., Laird, P.W., 2018. Cell-of-Origin Patterns Dominate the Molecular Classification of 10,000 Tumors from 33 Types of Cancer. Cell 173, 291-304.e6. https://doi.org/10.1016/j.cell.2018.03.022
Hodi, F.S., O’Day, S.J., McDermott, D.F., Weber, R.W., Sosman, J.A., Haanen, J.B., Gonzalez, R., Robert, C., Schadendorf, D., Hassel, J.C., Akerley, W., van den Eertwegh, A.J.M., Lutzky, J., Lorigan, P., Vaubel, J.M., Linette, G.P., Hogg, D., Ottensmeier, C.H., Lebbé, C., Peschel, C., Quirt, I., Clark, J.I., Wolchok, J.D., Weber, J.S., Tian, J., Yellin, M.J., Nichol, G.M., Hoos, A., Urba, W.J., 2010. Improved Survival with Ipilimumab in Patients with Metastatic Melanoma. New England Journal of Medicine 363, 711–723. https://doi.org/10.1056/NEJMoa1003466
Hu, X., Fujimoto, J., Ying, L., Fukuoka, J., Ashizawa, K., Sun, W., Reuben, A., Chow, C.-W., McGranahan, N., Chen, R., Hu, J., Godoy, M.C., Tabata, K., Kuroda, K., Shi, L., Li, J., Behrens, C., Parra, E.R., Little, L.D., Gumbs, C., Mao, X., Song, X., Tippen, S., Thornton, R.L., Kadara, H., Scheet, P., Roarty, E., Ostrin, E.J., Wang, X., Carter, B.W., Antonoff, M.B., Zhang,

Reference List
234
Jianhua, Vaporciyan, A.A., Pass, H., Swisher, S.G., Heymach, J.V., Lee, J.J., Wistuba, I.I., Hong, W.K., Futreal, P.A., Su, D., Zhang, Jianjun, 2019. Multi-region exome sequencing reveals genomic evolution from preneoplasia to lung adenocarcinoma. Nat Commun 10, 2978. https://doi.org/10.1038/s41467-019-10877-8
Hu, Z., Ding, J., Ma, Z., Sun, R., Seoane, J.A., Shaffer, J.S., Suarez, C.J., Berghoff, A.S., Cremolini, C., Falcone, A., Loupakis, F., Birner, P., Preusser, M., Lenz, H.-J., Curtis, C., 2019. Quantitative evidence for early metastatic seeding in colorectal cancer. Nat Genet 51, 1113–1122. https://doi.org/10.1038/s41588-019-0423-x
Hua, X., Hyland, P.L., Huang, J., Song, L., Zhu, B., Caporaso, N.E., Landi, M.T., Chatterjee, N., Shi, J., 2016. MEGSA: A Powerful and Flexible Framework for Analyzing Mutual Exclusivity of Tumor Mutations. The American Journal of Human Genetics 98, 442–455. https://doi.org/10.1016/j.ajhg.2015.12.021
Hugo, W., Zaretsky, J.M., Sun, L., Song, C., Moreno, B.H., Hu-Lieskovan, S., Berent-Maoz, B., Pang, J., Chmielowski, B., Cherry, G., Seja, E., Lomeli, S., Kong, X., Kelley, M.C., Sosman, J.A., Johnson, D.B., Ribas, A., Lo, R.S., 2016. Genomic and Transcriptomic Features of Response to Anti-PD-1 Therapy in Metastatic Melanoma. Cell 165, 35–44. https://doi.org/10.1016/j.cell.2016.02.065
Hunter, C., Smith, R., Cahill, D.P., Stephens, P., Stevens, C., Teague, J., Greenman, C., Edkins, S., Bignell, G., Davies, H., O’Meara, S., Parker, A., Avis, T., Barthorpe, S., Brackenbury, L., Buck, G., Butler, A., Clements, J., Cole, J., Dicks, E., Forbes, S., Gorton, M., Gray, K., Halliday, K., Harrison, R., Hills, K., Hinton, J., Jenkinson, A., Jones, D., Kosmidou, V., Laman, R., Lugg, R., Menzies, A., Perry, J., Petty, R., Raine, K., Richardson, D., Shepherd, R., Small, A., Solomon, H., Tofts, C., Varian, J., West, S., Widaa, S., Yates, A., Easton, D.F., Riggins, G., Roy, J.E., Levine, K.K., Mueller, W., Batchelor, T.T., Louis, D.N., Stratton, M.R., Futreal, P.A., Wooster, R., 2006. A Hypermutation Phenotype and Somatic MSH6 Mutations in Recurrent Human Malignant Gliomas after Alkylator Chemotherapy. Cancer Res 66, 3987–3991. https://doi.org/10.1158/0008-5472.CAN-06-0127
Hyman, D.M., Piha-Paul, S.A., Won, H., Rodon, J., Saura, C., Shapiro, G.I., Juric, D., Quinn, D.I., Moreno, V., Doger, B., Mayer, I.A., Boni, V., Calvo, E., Loi, S., Lockhart, A.C., Erinjeri, J.P., Scaltriti, M., Ulaner, G.A., Patel, J., Tang, J., Beer, H., Selcuklu, S.D., Hanrahan, A.J., Bouvier, N., Melcer, M., Murali, R., Schram, A.M., Smyth, L.M., Jhaveri, K., Li, B.T., Drilon, A., Harding, J.J., Iyer, G., Taylor, B.S., Berger, M.F., Cutler Jr, R.E., Xu, F., Butturini, A., Eli, L.D., Mann, G., Farrell, C., Lalani, A.S., Bryce, R.P., Arteaga, C.L., Meric-Bernstam, F., Baselga, J., Solit, D.B., 2018. HER kinase inhibition in patients with HER2- and HER3-mutant cancers. Nature 554, 189–194. https://doi.org/10.1038/nature25475
Hyman, D.M., Taylor, B.S., Baselga, J., 2017. Implementing Genome-Driven Oncology. Cell 168, 584–599. https://doi.org/10.1016/j.cell.2016.12.015
Inukai, M., Toyooka, S., Ito, S., Asano, H., Ichihara, S., Soh, J., Suehisa, H., Ouchida, M., Aoe, K., Aoe, M., Kiura, K., Shimizu, N., Date, H., 2006. Presence of Epidermal Growth Factor Receptor Gene T790M Mutation as a Minor Clone in Non–Small Cell Lung Cancer. Cancer Res 66, 7854–7858. https://doi.org/10.1158/0008-5472.CAN-06-1951

Reference List
235
Jamal-Hanjani, M., Hackshaw, A., Ngai, Y., Shaw, J., Dive, C., Quezada, S., Middleton, G., de Bruin, E., Le Quesne, J., Shafi, S., Falzon, M., Horswell, S., Blackhall, F., Khan, I., Janes, S., Nicolson, M., Lawrence, D., Forster, M., Fennell, D., Lee, S.-M., Lester, J., Kerr, K., Muller, S., Iles, N., Smith, S., Murugaesu, N., Mitter, R., Salm, M., Stuart, A., Matthews, N., Adams, H., Ahmad, T., Attanoos, R., Bennett, J., Birkbak, N.J., Booton, R., Brady, G., Buchan, K., Capitano, A., Chetty, M., Cobbold, M., Crosbie, P., Davies, H., Denison, A., Djearman, M., Goldman, J., Haswell, T., Joseph, L., Kornaszewska, M., Krebs, M., Langman, G., MacKenzie, M., Millar, J., Morgan, B., Naidu, B., Nonaka, D., Peggs, K., Pritchard, C., Remmen, H., Rowan, A., Shah, R., Smith, E., Summers, Y., Taylor, M., Veeriah, S., Waller, D., Wilcox, B., Wilcox, M., Woolhouse, I., McGranahan, N., Swanton, C., 2014. Tracking genomic cancer evolution for precision medicine: the lung TRACERx study. PLoS Biol. 12, e1001906. https://doi.org/10.1371/journal.pbio.1001906
Jamal-Hanjani, M., Wilson, G.A., McGranahan, N., Birkbak, N.J., Watkins, T.B.K., Veeriah, S., Shafi, S., Johnson, D.H., Mitter, R., Rosenthal, R., Salm, M., Horswell, S., Escudero, M., Matthews, N., Rowan, A., Chambers, T., Moore, D.A., Turajlic, S., Xu, H., Lee, S.-M., Forster, M.D., Ahmad, T., Hiley, C.T., Abbosh, C., Falzon, M., Borg, E., Marafioti, T., Lawrence, D., Hayward, M., Kolvekar, S., Panagiotopoulos, N., Janes, S.M., Thakrar, R., Ahmed, A., Blackhall, F., Summers, Y., Shah, R., Joseph, L., Quinn, A.M., Crosbie, P.A., Naidu, B., Middleton, G., Langman, G., Trotter, S., Nicolson, M., Remmen, H., Kerr, K., Chetty, M., Gomersall, L., Fennell, D.A., Nakas, A., Rathinam, S., Anand, G., Khan, S., Russell, P., Ezhil, V., Ismail, B., Irvin-Sellers, M., Prakash, V., Lester, J.F., Kornaszewska, M., Attanoos, R., Adams, H., Davies, H., Dentro, S., Taniere, P., O’Sullivan, B., Lowe, H.L., Hartley, J.A., Iles, N., Bell, H., Ngai, Y., Shaw, J.A., Herrero, J., Szallasi, Z., Schwarz, R.F., Stewart, A., Quezada, S.A., Le Quesne, J., Van Loo, P., Dive, C., Hackshaw, A., Swanton, C., 2017. Tracking the Evolution of Non–Small-Cell Lung Cancer. NEJM 376, 2109–2121. https://doi.org/10.1056/NEJMoa1616288
Jansen, C.S., Prokhnevska, N., Master, V.A., Sanda, M.G., Carlisle, J.W., Bilen, M.A., Cardenas, M., Wilkinson, S., Lake, R., Sowalsky, A.G., Valanparambil, R.M., Hudson, W.H., McGuire, D., Melnick, K., Khan, A.I., Kim, K., Chang, Y.M., Kim, A., Filson, C.P., Alemozaffar, M., Osunkoya, A.O., Mullane, P., Ellis, C., Akondy, R., Im, S.J., Kamphorst, A.O., Reyes, A., Liu, Y., Kissick, H., 2019. An intra-tumoral niche maintains and differentiates stem-like CD8 T cells. Nature 576, 465–470. https://doi.org/10.1038/s41586-019-1836-5
Jerby-Arnon, L., Pfetzer, N., Waldman, Y.Y., McGarry, L., James, D., Shanks, E., Seashore-Ludlow, B., Weinstock, A., Geiger, T., Clemons, P.A., Gottlieb, E., Ruppin, E., 2014. Predicting Cancer-Specific Vulnerability via Data-Driven Detection of Synthetic Lethality. Cell 158, 1199–1209. https://doi.org/10.1016/j.cell.2014.07.027
Jiang, P., Gu, S., Pan, D., Fu, J., Sahu, A., Hu, X., Li, Z., Traugh, N., Bu, X., Li, B., Liu, J., Freeman, G.J., Brown, M.A., Wucherpfennig, K.W., Liu, X.S., 2018. Signatures of T cell dysfunction and exclusion predict cancer immunotherapy response. Nature Medicine 1. https://doi.org/10.1038/s41591-018-0136-1

Reference List
236
Johnson, B.E., Mazor, T., Hong, C., Barnes, M., Aihara, K., McLean, C.Y., Fouse, S.D., Yamamoto, S., Ueda, H., Tatsuno, K., Asthana, S., Jalbert, L.E., Nelson, S.J., Bollen, A.W., Gustafson, W.C., Charron, E., Weiss, W.A., Smirnov, I.V., Song, J.S., Olshen, A.B., Cha, S., Zhao, Y., Moore, R.A., Mungall, A.J., Jones, S.J.M., Hirst, M., Marra, M.A., Saito, N., Aburatani, H., Mukasa, A., Berger, M.S., Chang, S.M., Taylor, B.S., Costello, J.F., 2014. Mutational analysis reveals the origin and therapy-driven evolution of recurrent glioma. Science 343, 189–193. https://doi.org/10.1126/science.1239947
Johnson, D.B., Estrada, M.V., Salgado, R., Sanchez, V., Doxie, D.B., Opalenik, S.R., Vilgelm, A.E., Feld, E., Johnson, A.S., Greenplate, A.R., Sanders, M.E., Lovly, C.M., Frederick, D.T., Kelley, M.C., Richmond, A., Irish, J.M., Shyr, Y., Sullivan, R.J., Puzanov, I., Sosman, J.A., Balko, J.M., 2016. Melanoma-specific MHC-II expression represents a tumour-autonomous phenotype and predicts response to anti-PD-1/PD-L1 therapy. Nature Communications 7, 10582. https://doi.org/10.1038/ncomms10582
Jones, S., Zhang, X., Parsons, D.W., Lin, J.C.-H., Leary, R.J., Angenendt, P., Mankoo, P., Carter, H., Kamiyama, H., Jimeno, A., Hong, S.-M., Fu, B., Lin, M.-T., Calhoun, E.S., Kamiyama, M., Walter, K., Nikolskaya, T., Nikolsky, Y., Hartigan, J., Smith, D.R., Hidalgo, M., Leach, S.D., Klein, A.P., Jaffee, E.M., Goggins, M., Maitra, A., Iacobuzio-Donahue, C., Eshleman, J.R., Kern, S.E., Hruban, R.H., Karchin, R., Papadopoulos, N., Parmigiani, G., Vogelstein, B., Velculescu, V.E., Kinzler, K.W., 2008. Core Signaling Pathways in Human Pancreatic Cancers Revealed by Global Genomic Analyses. Science 321, 1801–1806. https://doi.org/10.1126/science.1164368
Joung, J.-G., Bae, J.S., Kim, S.C., Jung, H., Park, W.-Y., Song, S.-Y., 2016. Genomic Characterization and Comparison of Multi-Regional and Pooled Tumor Biopsy Specimens. PLOS ONE 11, e0152574. https://doi.org/10.1371/journal.pone.0152574
Kaelin, W.G., 2005. The Concept of Synthetic Lethality in the Context of Anticancer Therapy. Nat Rev Cancer 5, 689–698. https://doi.org/10.1038/nrc1691
Kahles, A., Lehmann, K.-V., Toussaint, N.C., Hüser, M., Stark, S.G., Sachsenberg, T., Stegle, O., Kohlbacher, O., Sander, C., Caesar-Johnson, S.J., Demchok, J.A., Felau, I., Kasapi, M., Ferguson, M.L., Hutter, C.M., Sofia, H.J., Tarnuzzer, R., Wang, Z., Yang, L., Zenklusen, J.C., Zhang, J. (Julia), Chudamani, S., Liu, J., Lolla, L., Naresh, R., Pihl, T., Sun, Q., Wan, Y., Wu, Y., Cho, J., DeFreitas, T., Frazer, S., Gehlenborg, N., Getz, G., Heiman, D.I., Kim, J., Lawrence, M.S., Lin, P., Meier, S., Noble, M.S., Saksena, G., Voet, D., Zhang, Hailei, Bernard, B., Chambwe, N., Dhankani, V., Knijnenburg, T., Kramer, R., Leinonen, K., Liu, Y., Miller, M., Reynolds, S., Shmulevich, I., Thorsson, V., Zhang, W., Akbani, R., Broom, B.M., Hegde, A.M., Ju, Z., Kanchi, R.S., Korkut, A., Li, J., Liang, H., Ling, S., Liu, W., Lu, Y., Mills, G.B., Ng, K.-S., Rao, A., Ryan, M., Wang, Jing, Weinstein, J.N., Zhang, J., Abeshouse, A., Armenia, J., Chakravarty, D., Chatila, W.K., Bruijn, I. de, Gao, J., Gross, B.E., Heins, Z.J., Kundra, R., La, K., Ladanyi, M., Luna, A., Nissan, M.G., Ochoa, A., Phillips, S.M., Reznik, E., Sanchez-Vega, F., Sander, C., Schultz, N., Sheridan, R., Sumer, S.O., Sun, Y., Taylor, B.S., Wang, Jioajiao, Zhang, Hongxin, Anur, P., Peto, M., Spellman, P., Benz, C., Stuart, J.M., Wong, C.K., Yau, C., Hayes, D.N., Parker, J.S.,

Reference List
237
Wilkerson, M.D., Ally, A., Balasundaram, M., Bowlby, R., Brooks, D., Carlsen, R., Chuah, E., Dhalla, N., Holt, R., Jones, S.J.M., Kasaian, K., Lee, D., Ma, Y., Marra, M.A., Mayo, M., Moore, R.A., Mungall, A.J., Mungall, K., Robertson, A.G., Sadeghi, S., Schein, J.E., Sipahimalani, P., Tam, A., Thiessen, N., Tse, K., Wong, T., Berger, A.C., Beroukhim, R., Cherniack, A.D., Cibulskis, C., Gabriel, S.B., Gao, G.F., Ha, G., Meyerson, M., Schumacher, S.E., Shih, J., Kucherlapati, M.H., Kucherlapati, R.S., Baylin, S., Cope, L., Danilova, L., Bootwalla, M.S., Lai, P.H., Maglinte, D.T., Berg, D.J.V.D., Weisenberger, D.J., Auman, J.T., Balu, S., Bodenheimer, T., Fan, C., Hoadley, K.A., Hoyle, A.P., Jefferys, S.R., Jones, C.D., Meng, S., Mieczkowski, P.A., Mose, L.E., Perou, A.H., Perou, C.M., Roach, J., Shi, Y., Simons, J.V., Skelly, T., Soloway, M.G., Tan, D., Veluvolu, U., Fan, H., Hinoue, T., Laird, P.W., Shen, H., Zhou, W., Bellair, M., Chang, K., Covington, K., Creighton, C.J., Dinh, H., Doddapaneni, H., Donehower, L.A., Drummond, J., Gibbs, R.A., Glenn, R., Hale, W., Han, Y., Hu, J., Korchina, V., Lee, S., Lewis, L., Li, W., Liu, X., Morgan, M., Morton, D., Muzny, D., Santibanez, J., Sheth, M., Shinbrot, E., Wang, L., Wang, M., Wheeler, D.A., Xi, L., Zhao, F., Hess, J., Appelbaum, E.L., Bailey, M., Cordes, M.G., Ding, L., Fronick, C.C., Fulton, L.A., Fulton, R.S., Kandoth, C., Mardis, E.R., McLellan, M.D., Miller, C.A., Schmidt, H.K., Wilson, R.K., Crain, D., Curley, E., Gardner, J., Lau, K., Mallery, D., Morris, S., Paulauskis, J., Penny, R., Shelton, C., Shelton, T., Sherman, M., Thompson, E., Yena, P., Bowen, J., Gastier-Foster, J.M., Gerken, M., Leraas, K.M., Lichtenberg, T.M., Ramirez, N.C., Wise, L., Zmuda, E., Corcoran, N., Costello, T., Hovens, C., Carvalho, A.L., Carvalho, A.C. de, Fregnani, J.H., Longatto-Filho, A., Reis, R.M., Scapulatempo-Neto, C., Silveira, H.C.S., Vidal, D.O., Burnette, A., Eschbacher, J., Hermes, B., Noss, A., Singh, R., Anderson, M.L., Castro, P.D., Ittmann, M., Huntsman, D., Kohl, B., Le, X., Thorp, R., Andry, C., Duffy, E.R., Lyadov, V., Paklina, O., Setdikova, G., Shabunin, A., Tavobilov, M., McPherson, C., Warnick, R., Berkowitz, R., Cramer, D., Feltmate, C., Horowitz, N., Kibel, A., Muto, M., Raut, C.P., Malykh, A., Barnholtz-Sloan, J.S., Barrett, W., Devine, K., Fulop, J., Ostrom, Q.T., Shimmel, K., Wolinsky, Y., Sloan, A.E., Rose, A.D., Giuliante, F., Goodman, M., Karlan, B.Y., Hagedorn, C.H., Eckman, J., Harr, J., Myers, J., Tucker, K., Zach, L.A., Deyarmin, B., Hu, H., Kvecher, L., Larson, C., Mural, R.J., Somiari, S., Vicha, A., Zelinka, T., Bennett, J., Iacocca, M., Rabeno, B., Swanson, P., Latour, M., Lacombe, L., Têtu, B., Bergeron, A., McGraw, M., Staugaitis, S.M., Chabot, J., Hibshoosh, H., Sepulveda, A., Su, T., Wang, T., Potapova, O., Voronina, O., Desjardins, L., Mariani, O., Roman-Roman, S., Sastre, X., Stern, M.-H., Cheng, F., Signoretti, S., Berchuck, A., Bigner, D., Lipp, E., Marks, J., McCall, S., McLendon, R., Secord, A., Sharp, A., Behera, M., Brat, D.J., Chen, A., Delman, K., Force, S., Khuri, F., Magliocca, K., Maithel, S., Olson, J.J., Owonikoko, T., Pickens, A., Ramalingam, S., Shin, D.M., Sica, G., Meir, E.G.V., Zhang, Hongzheng, Eijckenboom, W., Gillis, A., Korpershoek, E., Looijenga, L., Oosterhuis, W., Stoop, H., Kessel, K.E. van, Zwarthoff, E.C., Calatozzolo, C., Cuppini, L., Cuzzubbo, S., DiMeco, F., Finocchiaro, G., Mattei, L., Perin, A., Pollo, B., Chen, C., Houck, J., Lohavanichbutr, P., Hartmann, A., Stoehr, C., Stoehr, R., Taubert, H., Wach, S., Wullich, B., Kycler, W., Murawa, D., Wiznerowicz, M., Chung, K., Edenfield, W.J., Martin, J., Baudin, E., Bubley, G., Bueno, R., Rienzo, A.D.,

Reference List
238
Richards, W.G., Kalkanis, S., Mikkelsen, T., Noushmehr, H., Scarpace, L., Girard, N., Aymerich, M., Campo, E., Giné, E., Guillermo, A.L., Bang, N.V., Hanh, P.T., Phu, B.D., Tang, Y., Colman, H., Evason, K., Dottino, P.R., Martignetti, J.A., Gabra, H., Juhl, H., Akeredolu, T., Stepa, S., Hoon, D., Ahn, K., Kang, K.J., Beuschlein, F., Breggia, A., Birrer, M., Bell, D., Borad, M., Bryce, A.H., Castle, E., Chandan, V., Cheville, J., Copland, J.A., Farnell, M., Flotte, T., Giama, N., Ho, T., Kendrick, M., Kocher, J.-P., Kopp, K., Moser, C., Nagorney, D., O’Brien, D., O’Neill, B.P., Patel, T., Petersen, G., Que, F., Rivera, M., Roberts, L., Smallridge, R., Smyrk, T., Stanton, M., Thompson, R.H., Torbenson, M., Yang, J.D., Zhang, L., Brimo, F., Ajani, J.A., Gonzalez, A.M.A., Behrens, C., Bondaruk, J., Broaddus, R., Czerniak, B., Esmaeli, B., Fujimoto, J., Gershenwald, J., Guo, C., Lazar, A.J., Logothetis, C., Meric-Bernstam, F., Moran, C., Ramondetta, L., Rice, D., Sood, A., Tamboli, P., Thompson, T., Troncoso, P., Tsao, A., Wistuba, I., Carter, C., Haydu, L., Hersey, P., Jakrot, V., Kakavand, H., Kefford, R., Lee, K., Long, G., Mann, G., Quinn, M., Saw, R., Scolyer, R., Shannon, K., Spillane, A., Stretch, J., Synott, M., Thompson, J., Wilmott, J., Al-Ahmadie, H., Chan, T.A., Ghossein, R., Gopalan, A., Levine, D.A., Reuter, V., Singer, S., Singh, B., Tien, N.V., Broudy, T., Mirsaidi, C., Nair, P., Drwiega, P., Miller, J., Smith, J., Zaren, H., Park, J.-W., Hung, N.P., Kebebew, E., Linehan, W.M., Metwalli, A.R., Pacak, K., Pinto, P.A., Schiffman, M., Schmidt, L.S., Vocke, C.D., Wentzensen, N., Worrell, R., Yang, H., Moncrieff, M., Goparaju, C., Melamed, J., Pass, H., Botnariuc, N., Caraman, I., Cernat, M., Chemencedji, I., Clipca, A., Doruc, S., Gorincioi, G., Mura, S., Pirtac, M., Stancul, I., Tcaciuc, D., Albert, M., Alexopoulou, I., Arnaout, A., Bartlett, J., Engel, J., Gilbert, S., Parfitt, J., Sekhon, H., Thomas, G., Rassl, D.M., Rintoul, R.C., Bifulco, C., Tamakawa, R., Urba, W., Hayward, N., Timmers, H., Antenucci, A., Facciolo, F., Grazi, G., Marino, M., Merola, R., Krijger, R. de, Gimenez-Roqueplo, A.-P., Piché, A., Chevalier, S., McKercher, G., Birsoy, K., Barnett, G., Brewer, C., Farver, C., Naska, T., Pennell, N.A., Raymond, D., Schilero, C., Smolenski, K., Williams, F., Morrison, C., Borgia, J.A., Liptay, M.J., Pool, M., Seder, C.W., Junker, K., Omberg, L., Dinkin, M., Manikhas, G., Alvaro, D., Bragazzi, M.C., Cardinale, V., Carpino, G., Gaudio, E., Chesla, D., Cottingham, S., Dubina, M., Moiseenko, F., Dhanasekaran, R., Becker, K.-F., Janssen, K.-P., Slotta-Huspenina, J., Abdel-Rahman, M.H., Aziz, D., Bell, S., Cebulla, C.M., Davis, A., Duell, R., Elder, J.B., Hilty, J., Kumar, B., Lang, J., Lehman, N.L., Mandt, R., Nguyen, P., Pilarski, R., Rai, K., Schoenfield, L., Senecal, K., Wakely, P., Hansen, P., Lechan, R., Powers, J., Tischler, A., Grizzle, W.E., Sexton, K.C., Kastl, A., Henderson, J., Porten, S., Waldmann, J., Fassnacht, M., Asa, S.L., Schadendorf, D., Couce, M., Graefen, M., Huland, H., Sauter, G., Schlomm, T., Simon, R., Tennstedt, P., Olabode, O., Nelson, M., Bathe, O., Carroll, P.R., Chan, J.M., Disaia, P., Glenn, P., Kelley, R.K., Landen, C.N., Phillips, J., Prados, M., Simko, J., Smith-McCune, K., VandenBerg, S., Roggin, K., Fehrenbach, A., Kendler, A., Sifri, S., Steele, R., Jimeno, A., Carey, F., Forgie, I., Mannelli, M., Carney, M., Hernandez, B., Campos, B., Herold-Mende, C., Jungk, C., Unterberg, A., Deimling, A. von, Bossler, A., Galbraith, J., Jacobus, L., Knudson, M., Knutson, T., Ma, D., Milhem, M., Sigmund, R., Godwin, A.K., Madan, R., Rosenthal, H.G., Adebamowo, C., Adebamowo, S.N., Boussioutas, A., Beer, D., Giordano, T., Mes-Masson,

Reference List
239
A.-M., Saad, F., Bocklage, T., Landrum, L., Mannel, R., Moore, K., Moxley, K., Postier, R., Walker, J., Zuna, R., Feldman, M., Valdivieso, F., Dhir, R., Luketich, J., Pinero, E.M.M., Quintero-Aguilo, M., Carlotti, C.G., Santos, J.S.D., Kemp, R., Sankarankuty, A., Tirapelli, D., Catto, J., Agnew, K., Swisher, E., Creaney, J., Robinson, B., Shelley, C.S., Godwin, E.M., Kendall, S., Shipman, C., Bradford, C., Carey, T., Haddad, A., Moyer, J., Peterson, L., Prince, M., Rozek, L., Wolf, G., Bowman, R., Fong, K.M., Yang, I., Korst, R., Rathmell, W.K., Fantacone-Campbell, J.L., Hooke, J.A., Kovatich, A.J., Shriver, C.D., DiPersio, J., Drake, B., Govindan, R., Heath, S., Ley, T., Tine, B.V., Westervelt, P., Rubin, M.A., Lee, J.I., Aredes, N.D., Mariamidze, A., Rätsch, G., 2018. Comprehensive Analysis of Alternative Splicing Across Tumors from 8,705 Patients. Cancer Cell 0. https://doi.org/10.1016/j.ccell.2018.07.001
Kandoth, C., McLellan, M.D., Vandin, F., Ye, K., Niu, B., Lu, C., Xie, M., Zhang, Q., McMichael, J.F., Wyczalkowski, M.A., Leiserson, M.D.M., Miller, C.A., Welch, J.S., Walter, M.J., Wendl, M.C., Ley, T.J., Wilson, R.K., Raphael, B.J., Ding, L., 2013. Mutational landscape and significance across 12 major cancer types. Nature 502, 333–339. https://doi.org/10.1038/nature12634
Kaplan, D.H., Shankaran, V., Dighe, A.S., Stockert, E., Aguet, M., Old, L.J., Schreiber, R.D., 1998. Demonstration of an interferon gamma-dependent tumor surveillance system in immunocompetent mice. Proc. Natl. Acad. Sci. U.S.A. 95, 7556–7561. https://doi.org/10.1073/pnas.95.13.7556
Katayama, R., Shaw, A.T., Khan, T.M., Mino-Kenudson, M., Solomon, B.J., Halmos, B., Jessop, N.A., Wain, J.C., Yeo, A.T., Benes, C., Drew, L., Saeh, J.C., Crosby, K., Sequist, L.V., Iafrate, A.J., Engelman, J.A., 2012. Mechanisms of Acquired Crizotinib Resistance in ALK-Rearranged Lung Cancers. Science Translational Medicine 4, 120ra17-120ra17. https://doi.org/10.1126/scitranslmed.3003316
Katz, S.J., Jagsi, R., Morrow, M., 2018. Reducing Overtreatment of Cancer With Precision Medicine: Just What the Doctor Ordered. JAMA. https://doi.org/10.1001/jama.2018.0018
Kaufman, B., Shapira-Frommer, R., Schmutzler, R.K., Audeh, M.W., Friedlander, M., Balmaña, J., Mitchell, G., Fried, G., Stemmer, S.M., Hubert, A., Rosengarten, O., Steiner, M., Loman, N., Bowen, K., Fielding, A., Domchek, S.M., 2015. Olaparib monotherapy in patients with advanced cancer and a germline BRCA1/2 mutation. J. Clin. Oncol. 33, 244–250. https://doi.org/10.1200/JCO.2014.56.2728
Kim, T.-M., Jung, S.-H., An, C.H., Lee, S.H., Baek, I.-P., Kim, M.S., Park, S.-W., Rhee, J.-K., Lee, S.-H., Chung, Y.-J., 2015. Subclonal Genomic Architectures of Primary and Metastatic Colorectal Cancer Based on Intratumoral Genetic Heterogeneity. Clin Cancer Res 21, 4461–4472. https://doi.org/10.1158/1078-0432.CCR-14-2413
Knudson, A.G., 1971. Mutation and cancer: statistical study of retinoblastoma. Proc. Natl Acad. Sci. USA 68, 820–823. https://doi.org/10.1073/pnas.68.4.820
Kobayashi, S., 2005. EGFR mutation and resistance of non-small-cell lung cancer to gefitinib. N. Engl. J. Med. 352, 786–792. https://doi.org/10.1056/NEJMoa044238
Koboldt, D.C., Zhang, Q., Larson, D.E., Shen, D., McLellan, M.D., Lin, L., Miller, C.A., Mardis, E.R., Ding, L., Wilson, R.K., 2012. VarScan 2: Somatic

Reference List
240
mutation and copy number alteration discovery in cancer by exome sequencing. Genome Res. 22, 568–576. https://doi.org/10.1101/gr.129684.111
Kolodziejczyk, A.A., Kim, J.K., Svensson, V., Marioni, J.C., Teichmann, S.A., 2015. The Technology and Biology of Single-Cell RNA Sequencing. Molecular Cell 58, 610–620. https://doi.org/10.1016/j.molcel.2015.04.005
Kopetz, S., Grothey, A., Yaeger, R., Van Cutsem, E., Desai, J., Yoshino, T., Wasan, H., Ciardiello, F., Loupakis, F., Hong, Y.S., Steeghs, N., Guren, T.K., Arkenau, H.-T., Garcia-Alfonso, P., Pfeiffer, P., Orlov, S., Lonardi, S., Elez, E., Kim, T.-W., Schellens, J.H.M., Guo, C., Krishnan, A., Dekervel, J., Morris, V., Calvo Ferrandiz, A., Tarpgaard, L.S., Braun, M., Gollerkeri, A., Keir, C., Maharry, K., Pickard, M., Christy-Bittel, J., Anderson, L., Sandor, V., Tabernero, J., 2019. Encorafenib, Binimetinib, and Cetuximab in BRAF V600E–Mutated Colorectal Cancer. New England Journal of Medicine 381, 1632–1643. https://doi.org/10.1056/NEJMoa1908075
Kratz, J.R., Haro, G.J., Cook, N.R., He, J., Van Den Eeden, S.K., Woodard, G.A., Gubens, M.A., Jahan, T.M., Jones, K.D., Kim, I.-J., He, B., Jablons, D.M., Mann, M.J., 2019. Incorporation of a Molecular Prognostic Classifier Improves Conventional Non–Small Cell Lung Cancer Staging. Journal of Thoracic Oncology 14, 1223–1232. https://doi.org/10.1016/j.jtho.2019.03.015
Kratz, J.R., He, J., Van Den Eeden, S.K., Zhu, Z.-H., Gao, W., Pham, P.T., Mulvihill, M.S., Ziaei, F., Zhang, H., Su, B., Zhi, X., Quesenberry, C.P., Habel, L.A., Deng, Q., Wang, Z., Zhou, J., Li, H., Huang, M.-C., Yeh, C.-C., Segal, M.R., Ray, M.R., Jones, K.D., Raz, D.J., Xu, Z., Jahan, T.M., Berryman, D., He, B., Mann, M.J., Jablons, D.M., 2012. A practical molecular assay to predict survival in resected non-squamous, non-small-cell lung cancer: development and international validation studies. The Lancet 379, 823–832. https://doi.org/10.1016/S0140-6736(11)61941-7
Kratz, J.R., Tham, P.T., Mulvihill, M.S., Ziaei, F., Ray, M.R., Hurst, J.W., Segal, M.R., Berryman, D.M., Chu, W., He, B., Jablons, D.M., Mann, M.J., 2013. Analytical Validation of a Practical Molecular Assay Prognostic of Survival in Nonsquamous Non–Small Cell Lung Cancer. Diagnostic Molecular Pathology 22, 65–69. https://doi.org/10.1097/PDM.0b013e318273fb61
Krzystanek, M., Moldvay, J., Szüts, D., Szallasi, Z., Eklund, A.C., 2016. A robust prognostic gene expression signature for early stage lung adenocarcinoma. Biomark Res 4, 4. https://doi.org/10.1186/s40364-016-0058-3
Kucab, J.E., Zou, X., Morganella, S., Joel, M., Nanda, A.S., Nagy, E., Gomez, C., Degasperi, A., Harris, R., Jackson, S.P., Arlt, V.M., Phillips, D.H., Nik-Zainal, S., 2019. A Compendium of Mutational Signatures of Environmental Agents. Cell 177, 821-836.e16. https://doi.org/10.1016/j.cell.2019.03.001
Kumar-Sinha, C., Chinnaiyan, A.M., 2018. Precision oncology in the age of integrative genomics. Nature Biotechnology 36, 46–60. https://doi.org/10.1038/nbt.4017
Kurian, A.W., Bondarenko, I., Jagsi, R., Friese, C.R., McLeod, M.C., Hawley, S.T., Hamilton, A.S., Ward, K.C., Hofer, T.P., Katz, S.J., 2017. Recent Trends in Chemotherapy Use and Oncologists’ Treatment Recommendations for Early-Stage Breast Cancer. J Natl Cancer Inst. https://doi.org/10.1093/jnci/djx239

Reference List
241
LaFave, L.M., Kartha, V.K., Ma, S., Meli, K., Priore, I.D., Lareau, C., Naranjo, S., Westcott, P.M.K., Duarte, F.M., Sankar, V., Chiang, Z., Brack, A., Law, T., Hauck, H., Okimoto, A., Regev, A., Buenrostro, J.D., Jacks, T., 2020. Epigenomic State Transitions Characterize Tumor Progression in Mouse Lung Adenocarcinoma. Cancer Cell 38, 212-228.e13. https://doi.org/10.1016/j.ccell.2020.06.006
Lambrechts, D., Wauters, E., Boeckx, B., Aibar, S., Nittner, D., Burton, O., Bassez, A., Decaluwé, H., Pircher, A., Eynde, K.V. den, Weynand, B., Verbeken, E., Leyn, P.D., Liston, A., Vansteenkiste, J., Carmeliet, P., Aerts, S., Thienpont, B., 2018. Phenotype molding of stromal cells in the lung tumor microenvironment. Nature Medicine 1. https://doi.org/10.1038/s41591-018-0096-5
Landau, D.A., Carter, S.L., Stojanov, P., McKenna, A., Stevenson, K., Lawrence, M.S., Sougnez, C., Stewart, C., Sivachenko, A., Wang, L., Wan, Y., Zhang, W., Shukla, S.A., Vartanov, A., Fernandes, S.M., Saksena, G., Cibulskis, K., Tesar, B., Gabriel, S., Hacohen, N., Meyerson, M., Lander, E.S., Neuberg, D., Brown, J.R., Getz, G., Wu, C.J., 2013. Evolution and Impact of Subclonal Mutations in Chronic Lymphocytic Leukemia. Cell 152, 714–726. https://doi.org/10.1016/j.cell.2013.01.019
Lander, E.S., Linton, L.M., Birren, B., Nusbaum, C., Zody, M.C., Baldwin, J., Devon, K., Dewar, K., Doyle, M., FitzHugh, W., Funke, R., Gage, D., Harris, K., Heaford, A., Howland, J., Kann, L., Lehoczky, J., LeVine, R., McEwan, P., McKernan, K., Meldrim, J., Mesirov, J.P., Miranda, C., Morris, W., Naylor, J., Raymond, Christina, Rosetti, M., Santos, R., Sheridan, A., Sougnez, C., Stange-Thomann, N., Stojanovic, N., Subramanian, A., Wyman, D., Rogers, J., Sulston, J., Ainscough, R., Beck, S., Bentley, D., Burton, J., Clee, C., Carter, N., Coulson, A., Deadman, R., Deloukas, P., Dunham, A., Dunham, I., Durbin, R., French, L., Grafham, D., Gregory, S., Hubbard, T., Humphray, S., Hunt, A., Jones, M., Lloyd, C., McMurray, A., Matthews, L., Mercer, S., Milne, S., Mullikin, J.C., Mungall, A., Plumb, R., Ross, M., Shownkeen, R., Sims, S., Waterston, R.H., Wilson, R.K., Hillier, L.W., McPherson, J.D., Marra, M.A., Mardis, E.R., Fulton, L.A., Chinwalla, A.T., Pepin, K.H., Gish, W.R., Chissoe, S.L., Wendl, M.C., Delehaunty, K.D., Miner, T.L., Delehaunty, A., Kramer, J.B., Cook, L.L., Fulton, R.S., Johnson, D.L., Minx, P.J., Clifton, S.W., Hawkins, T., Branscomb, E., Predki, P., Richardson, P., Wenning, S., Slezak, T., Doggett, N., Cheng, J.-F., Olsen, A., Lucas, S., Elkin, C., Uberbacher, E., Frazier, M., Gibbs, R.A., Muzny, D.M., Scherer, S.E., Bouck, J.B., Sodergren, E.J., Worley, K.C., Rives, C.M., Gorrell, J.H., Metzker, M.L., Naylor, S.L., Kucherlapati, R.S., Nelson, D.L., Weinstock, G.M., Sakaki, Y., Fujiyama, A., Hattori, M., Yada, T., Toyoda, A., Itoh, T., Kawagoe, C., Watanabe, H., Totoki, Y., Taylor, T., Weissenbach, J., Heilig, R., Saurin, W., Artiguenave, F., Brottier, P., Bruls, T., Pelletier, E., Robert, C., Wincker, P., Rosenthal, A., Platzer, M., Nyakatura, G., Taudien, S., Rump, A., Smith, D.R., Doucette-Stamm, L., Rubenfield, M., Weinstock, K., Lee, H.M., Dubois, J., Yang, H., Yu, J., Wang, J., Huang, G., Gu, J., Hood, L., Rowen, L., Madan, A., Qin, S., Davis, R.W., Federspiel, N.A., Abola, A.P., Proctor, M.J., Roe, B.A., Chen, F., Pan, H., Ramser, J., Lehrach, H., Reinhardt, R., McCombie, W.R., Bastide, M. de la, Dedhia, N., Blöcker, H., Hornischer, K., Nordsiek, G., Agarwala, R., Aravind, L., Bailey, J.A., Bateman, A., Batzoglou, S., Birney, E., Bork, P.,

Reference List
242
Brown, D.G., Burge, C.B., Cerutti, L., Chen, H.-C., Church, D., Clamp, M., Copley, R.R., Doerks, T., Eddy, S.R., Eichler, E.E., Furey, T.S., Galagan, J., Gilbert, J.G.R., Harmon, C., Hayashizaki, Y., Haussler, D., Hermjakob, H., Hokamp, K., Jang, W., Johnson, L.S., Jones, T.A., Kasif, S., Kaspryzk, A., Kennedy, S., Kent, W.J., Kitts, P., Koonin, E.V., Korf, I., Kulp, D., Lancet, D., Lowe, T.M., McLysaght, A., Mikkelsen, T., Moran, J.V., Mulder, N., Pollara, V.J., Ponting, C.P., Schuler, G., Schultz, J., Slater, G., Smit, A.F.A., Stupka, E., Szustakowki, J., Thierry-Mieg, D., Thierry-Mieg, J., Wagner, L., Wallis, J., Wheeler, R., Williams, A., Wolf, Y.I., Wolfe, K.H., Yang, S.-P., Yeh, R.-F., Collins, F., Guyer, M.S., Peterson, J., Felsenfeld, A., Wetterstrand, K.A., Myers, R.M., Schmutz, J., Dickson, M., Grimwood, J., Cox, D.R., Olson, M.V., Kaul, R., Raymond, Christopher, Shimizu, N., Kawasaki, K., Minoshima, S., Evans, G.A., Athanasiou, M., Schultz, R., Patrinos, A., Morgan, M.J., 2001. Initial sequencing and analysis of the human genome. Nature 409, 860–921. https://doi.org/10.1038/35057062
Lau, S.K., Boutros, P.C., Pintilie, M., Blackhall, F.H., Zhu, C.-Q., Strumpf, D., Johnston, M.R., Darling, G., Keshavjee, S., Waddell, T.K., Liu, N., Lau, D., Penn, L.Z., Shepherd, F.A., Jurisica, I., Der, S.D., Tsao, M.-S., 2007. Three-Gene Prognostic Classifier for Early-Stage Non–Small-Cell Lung Cancer. JCO 25, 5562–5569. https://doi.org/10.1200/JCO.2007.12.0352
Laughney, A.M., Elizalde, S., Genovese, G., Bakhoum, S.F., 2015. Dynamics of Tumor Heterogeneity Derived from Clonal Karyotypic Evolution. Cell Rep 12, 809–820. https://doi.org/10.1016/j.celrep.2015.06.065
Lawrence, M.S., Stojanov, P., Mermel, C.H., Robinson, J.T., Garraway, L.A., Golub, T.R., Meyerson, M., Gabriel, S.B., Lander, E.S., Getz, G., 2014. Discovery and saturation analysis of cancer genes across 21 tumour types. Nature 505, 495–501. https://doi.org/10.1038/nature12912
Lawrence, M.S., Stojanov, P., Polak, P., Kryukov, G.V., Cibulskis, K., Sivachenko, A., Carter, S.L., Stewart, C., Mermel, C.H., Roberts, S.A., Kiezun, A., Hammerman, P.S., McKenna, A., Drier, Y., Zou, L., Ramos, A.H., Pugh, T.J., Stransky, N., Helman, E., Kim, J., Sougnez, C., Ambrogio, L., Nickerson, E., Shefler, E., Cortés, M.L., Auclair, D., Saksena, G., Voet, D., Noble, M., DiCara, D., Lin, P., Lichtenstein, L., Heiman, D.I., Fennell, T., Imielinski, M., Hernandez, B., Hodis, E., Baca, S., Dulak, A.M., Lohr, J., Landau, D.-A., Wu, C.J., Melendez-Zajgla, J., Hidalgo-Miranda, A., Koren, A., McCarroll, S.A., Mora, J., Lee, R.S., Crompton, B., Onofrio, R., Parkin, M., Winckler, W., Ardlie, K., Gabriel, S.B., Roberts, C.W.M., Biegel, J.A., Stegmaier, K., Bass, A.J., Garraway, L.A., Meyerson, M., Golub, T.R., Gordenin, D.A., Sunyaev, S., Lander, E.S., Getz, G., 2013. Mutational heterogeneity in cancer and the search for new cancer-associated genes. Nature 499, 214–218. https://doi.org/10.1038/nature12213
Le, D.T., Durham, J.N., Smith, K.N., Wang, H., Bartlett, B.R., Aulakh, L.K., Lu, S., Kemberling, H., Wilt, C., Luber, B.S., Wong, F., Azad, N.S., Rucki, A.A., Laheru, D., Donehower, R., Zaheer, A., Fisher, G.A., Crocenzi, T.S., Lee, J.J., Greten, T.F., Duffy, A.G., Ciombor, K.K., Eyring, A.D., Lam, B.H., Joe, A., Kang, S.P., Holdhoff, M., Danilova, L., Cope, L., Meyer, C., Zhou, S., Goldberg, R.M., Armstrong, D.K., Bever, K.M., Fader, A.N., Taube, J., Housseau, F., Spetzler, D., Xiao, N., Pardoll, D.M., Papadopoulos, N., Kinzler, K.W., Eshleman, J.R., Vogelstein, B., Anders, R.A., Diaz, L.A.,

Reference List
243
2017. Mismatch repair deficiency predicts response of solid tumors to PD-1 blockade. Science 357, 409–413. https://doi.org/10.1126/science.aan6733
Leach, D.R., Krummel, M.F., Allison, J.P., 1996. Enhancement of Antitumor Immunity by CTLA-4 Blockade. Science 271, 1734–1736. https://doi.org/10.1126/science.271.5256.1734
Lee, H.-O., Hong, Y., Etlioglu, H.E., Cho, Y.B., Pomella, V., Van den Bosch, B., Vanhecke, J., Verbandt, S., Hong, H., Min, J.-W., Kim, N., Eum, H.H., Qian, J., Boeckx, B., Lambrechts, D., Tsantoulis, P., De Hertogh, G., Chung, W., Lee, T., An, M., Shin, H.-T., Joung, J.-G., Jung, M.-H., Ko, G., Wirapati, P., Kim, S.H., Kim, H.C., Yun, S.H., Tan, I.B.H., Ranjan, B., Lee, W.Y., Kim, T.-Y., Choi, J.K., Kim, Y.-J., Prabhakar, S., Tejpar, S., Park, W.-Y., 2020. Lineage-dependent gene expression programs influence the immune landscape of colorectal cancer. Nature Genetics 1–10. https://doi.org/10.1038/s41588-020-0636-z
Lee, J.-K., Lee, J., Kim, Sehui, Kim, Soyeon, Youk, J., Park, S., An, Y., Keam, B., Kim, D.-W., Heo, D.S., Kim, Y.T., Kim, J.-S., Kim, S.H., Lee, J.S., Lee, S.-H., Park, K., Ku, J.-L., Jeon, Y.K., Chung, D.H., Park, P.J., Kim, J., Kim, T.M., Ju, Y.S., 2017. Clonal History and Genetic Predictors of Transformation Into Small-Cell Carcinomas From Lung Adenocarcinomas. JCO 35, 3065–3074. https://doi.org/10.1200/JCO.2016.71.9096
Lee, W.-C., Diao, L., Wang, J., Zhang, Jianhua, Roarty, E.B., Varghese, S., Chow, C.-W., Fujimoto, J., Behrens, C., Cascone, T., Peng, W., Kalhor, N., Moran, C.A., Weissferdt, A., Johnson, F.M., William, W.N., Swisher, S.G., Lee, J.J., Hong, W.K., Heymach, J.V., Wistuba, I.I., Futreal, P.A., Zhang, Jianjun, 2018. Multiregion gene expression profiling reveals heterogeneity in molecular subtypes and immunotherapy response signatures in lung cancer. Modern Pathology 1. https://doi.org/10.1038/s41379-018-0029-3
Lehman, J.A., Cross, F.S., Richey, D.G., 1966. Clinical study of forty-nine patients with malignant melanoma. Cancer 19, 611–619. https://doi.org/10.1002/1097-0142(196605)19:5<611::AID-CNCR2820190503>3.0.CO;2-M
Leiserson, M.D., Wu, H.-T., Vandin, F., Raphael, B.J., 2015. CoMEt: a statistical approach to identify combinations of mutually exclusive alterations in cancer. Genome Biology 16, 160. https://doi.org/10.1186/s13059-015-0700-7
Ley, T.J., Mardis, E.R., Ding, L., Fulton, B., McLellan, M.D., Chen, K., Dooling, D., Dunford-Shore, B.H., McGrath, S., Hickenbotham, M., Cook, L., Abbott, R., Larson, D.E., Koboldt, D.C., Pohl, C., Smith, S., Hawkins, A., Abbott, S., Locke, D., Hillier, L.W., Miner, T., Fulton, L., Magrini, V., Wylie, T., Glasscock, J., Conyers, J., Sander, N., Shi, X., Osborne, J.R., Minx, P., Gordon, D., Chinwalla, A., Zhao, Y., Ries, R.E., Payton, J.E., Westervelt, P., Tomasson, M.H., Watson, M., Baty, J., Ivanovich, J., Heath, S., Shannon, W.D., Nagarajan, R., Walter, M.J., Link, D.C., Graubert, T.A., DiPersio, J.F., Wilson, R.K., 2008. DNA sequencing of a cytogenetically normal acute myeloid leukaemia genome. Nature 456, 66–72. https://doi.org/10.1038/nature07485
Li, Bailiang, Cui, Y., Diehn, M., Li, R., 2017. Development and Validation of an Individualized Immune Prognostic Signature in Early-Stage Nonsquamous Non–Small Cell Lung Cancer. JAMA Oncol. https://doi.org/10.1001/jamaoncol.2017.1609

Reference List
244
Li, B., Dewey, C.N., 2011. RSEM: accurate transcript quantification from RNA-Seq data with or without a reference genome. BMC Bioinformatics 12, 323. https://doi.org/10.1186/1471-2105-12-323
Li, Bo, Liu, J.S., Liu, X.S., 2017. Revisit linear regression-based deconvolution methods for tumor gene expression data. Genome Biology 18, 127. https://doi.org/10.1186/s13059-017-1256-5
Li, B., Severson, E., Pignon, J.-C., Zhao, H., Li, T., Novak, J., Jiang, P., Shen, H., Aster, J.C., Rodig, S., Signoretti, S., Liu, J.S., Liu, X.S., 2016. Comprehensive analyses of tumor immunity: implications for cancer immunotherapy. Genome Biology 17, 174. https://doi.org/10.1186/s13059-016-1028-7
Lindskrog, S.V., Prip, F.F., Lamy, P., Taber, A., Groeneveld, C.S., Birkenkamp-Demtroder, K., Jensen, J.B., Strandgaard, T., Nordentoft, I., Christensen, E., Sokac, M., Birkbak, N.J., Maretty, L., Hermann, G.H., Petersen, A.C., Weyerer, V., Grimm, M.-O., Horstmann, M., Sjodahl, G., Hoglund, M., Steiniche, T., Mogensen, K., Reynies, A. de, Nawroth, R., Jordan, B., Lin, X., Dragicevic, D., Ward, D.G., Goel, A., Hurst, C.D., Raman, J.D., Warrick, J.I., Segersten, U., Sikic, D., Kessel, K.E.M. van, Maurer, T., Meeks, J.J., Degraff, D.J., Bryan, R.T., Knowles, M.A., Simic, T., Hartmann, A., Zwarthoff, E.C., Malmstrom, P.-U., Malats, N., Real, F.X., Dyrskjot, L., 2020. An integrated multi-omics analysis identifies clinically relevant molecular subtypes of non-muscle-invasive bladder cancer. medRxiv 2020.06.19.20054809. https://doi.org/10.1101/2020.06.19.20054809
Lipinski, K.A., Barber, L.J., Davies, M.N., Ashenden, M., Sottoriva, A., Gerlinger, M., 2016. Cancer Evolution and the Limits of Predictability in Precision Cancer Medicine. Trends Cancer 2, 49–63. https://doi.org/10.1016/j.trecan.2015.11.003
Litchfield, K., Stanislaw, S., Spain, L., Gallegos, L.L., Rowan, A., Schnidrig, D., Rosenbaum, H., Harle, A., Au, L., Hill, S.M., Tippu, Z., Thomas, J., Thompson, L., Xu, H., Horswell, S., Barhoumi, A., Jones, C., Leith, K.F., Burgess, D.L., Watkins, T.B.K., Lim, E., Birkbak, N.J., Lamy, P., Nordentoft, I., Dyrskjøt, L., Pickering, L., Hazell, Stephen, Jamal-Hanjani, M., Abbosh, C., Shiu, K.-K., Bridgewater, J., Hochhauser, D., Forster, M., Lee, S.-M., Ahmad, T., Papadatos-Pastos, D., Janes, S., Loo, P.V., Enfield, K., McGranahan, N., Huebner, A., Quezada, S., Beck, S., Parker, P., Walczak, H., Enver, T., Hynds, R., Falzon, M., Proctor, I., Sinclair, R., Lok, C., Rhodes, Z., Moore, D., Marafioti, T., Borg, E., Mitchison, M., Khiroya, R., Trevisan, G., Ellery, P., Linch, M., Brandner, S., Hiley, C., Veeriah, S., Razaq, M., Shaw, H., Attard, G., Akther, M.A., Naceur-Lombardelli, C., Manzano, L., Al-Bakir, M., Summan, S., Kanu, N., Ward, S., Asghar, U., Lim, E., Gishen, F., Tookman, A., Stone, P., Stirling, C., Furness, A., Edmonds, K., Hunter, N., Sarker, S., Vaughan, S., Mangwende, M., Pearce, K., Spain, L., Shepherd, S., Yan, H., Shum, B., Carlyle, E., Hazell, Steve, Fendler, A., Byrne, F., Yousaf, N., Popat, S., Curtis, O., Stamp, G., Toncheva, A., Nye, E., Murra, A., Korteweg, J., Sheikh, N., Josephs, D., Chandra, A., Spicer, J., Mahadeva, U., Green, A., Stewart, R., Iredale, L.-R., Mackay, T., Deakin, B., Enting, D., Rudman, S., Ghosh, S., Karapagniotou, L., Pintus, E., Tutt, A., Howlett, S., Michalarea, V., Brenton, J., Caldas, C., Fitzgerald, R., Jimenez-Linan, M., Provenzano, E., Cluroe, A., Stewart, G., Watts, C., Gilbertson, R., McDermott, U., Tavare, S., Beddowes, E.,

Reference List
245
Roxburgh, P., Biankin, A., Chalmers, A., Fraser, S., Oien, K., Kidd, A., Blyth, K., Krebs, M., Blackhall, F., Summers, Y., Dive, C., Marais, R., Gomes, F., Carter, M., Dransfield, J., Quesne, J.L., Fennell, D., Shaw, J., Naidu, B., Baijal, S., Tanchel, B., Langman, G., Robinson, A., Collard, M., Cockcroft, P., Ferris, C., Bancroft, H., Kerr, A., Middleton, G., Webb, J., Kadiri, S., Colloby, P., Olisemeke, B., Wilson, R., Tomlinson, I., Jogai, S., Ottensmeier, C., Harrison, D., Loda, M., Flanagan, A., McKenzie, M., Hackshaw, A., Ledermann, J., Sharp, A., Farrelly, L., Bridger, H., Larkin, J., Swanton, C., Alexander, N.R., Turajlic, S., 2020. Representative Sequencing: Unbiased Sampling of Solid Tumor Tissue. Cell Reports 31. https://doi.org/10.1016/j.celrep.2020.107550
Liu, David, Schilling, B., Liu, Derek, Sucker, A., Livingstone, E., Jerby-Amon, L., Zimmer, L., Gutzmer, R., Satzger, I., Loquai, C., Grabbe, S., Vokes, N., Margolis, C.A., Conway, J., He, M.X., Elmarakeby, H., Dietlein, F., Miao, D., Tracy, A., Gogas, H., Goldinger, S.M., Utikal, J., Blank, C.U., Rauschenberg, R., Bubnoff, D. von, Krackhardt, A., Weide, B., Haferkamp, S., Kiecker, F., Izar, B., Garraway, L., Regev, A., Flaherty, K., Paschen, A., Allen, E.M.V., Schadendorf, D., 2019. Integrative molecular and clinical modeling of clinical outcomes to PD1 blockade in patients with metastatic melanoma. Nat Med 25, 1916–1927. https://doi.org/10.1038/s41591-019-0654-5
Loo, P.V., Nordgard, S.H., Lingjærde, O.C., Russnes, H.G., Rye, I.H., Sun, W., Weigman, V.J., Marynen, P., Zetterberg, A., Naume, B., Perou, C.M., Børresen-Dale, A.-L., Kristensen, V.N., 2010. Allele-specific copy number analysis of tumors. PNAS 107, 16910–16915. https://doi.org/10.1073/pnas.1009843107
López, S., Lim, E.L., Horswell, S., Haase, K., Huebner, A., Dietzen, M., Mourikis, T.P., Watkins, T.B.K., Rowan, A., Dewhurst, S.M., Birkbak, N.J., Wilson, G.A., Loo, P.V., Jamal-Hanjani, M., Swanton, C., McGranahan, N., 2020. Interplay between whole-genome doubling and the accumulation of deleterious alterations in cancer evolution. Nat Genet 52, 283–293. https://doi.org/10.1038/s41588-020-0584-7
Lord, C.J., Ashworth, A., 2017. PARP inhibitors: Synthetic lethality in the clinic. Science 355, 1152–1158. https://doi.org/10.1126/science.aam7344
Lotti, F., Jarrar, A.M., Pai, R.K., Hitomi, M., Lathia, J., Mace, A., Gantt, G.A., Sukhdeo, K., DeVecchio, J., Vasanji, A., Leahy, P., Hjelmeland, A.B., Kalady, M.F., Rich, J.N., 2013. Chemotherapy activates cancer-associated fibroblasts to maintain colorectal cancer-initiating cells by IL-17A. Journal of Experimental Medicine 210, 2851–2872. https://doi.org/10.1084/jem.20131195
Love, M.I., Huber, W., Anders, S., 2014. Moderated estimation of fold change and dispersion for RNA-seq data with DESeq2. Genome Biology 15, 550. https://doi.org/10.1186/s13059-014-0550-8
Lynch, M., Bürger, R., Butcher, D., Gabriel, W., 1993. The Mutational Meltdown in Asexual Populations. J Hered 84, 339–344. https://doi.org/10.1093/oxfordjournals.jhered.a111354
Lynch, T.J., Bell, D.W., Sordella, R., Gurubhagavatula, S., Okimoto, R.A., Brannigan, B.W., Harris, P.L., Haserlat, S.M., Supko, J.G., Haluska, F.G., Louis, D.N., Christiani, D.C., Settleman, J., Haber, D.A., 2004. Activating mutations in the epidermal growth factor receptor underlying

Reference List
246
responsiveness of non-small-cell lung cancer to gefitinib. N. Engl. J. Med. 350, 2129–2139. https://doi.org/10.1056/NEJMoa040938
Malanchi, I., Santamaria-Martínez, A., Susanto, E., Peng, H., Lehr, H.-A., Delaloye, J.-F., Huelsken, J., 2012. Interactions between cancer stem cells and their niche govern metastatic colonization. Nature 481, 85–89. https://doi.org/10.1038/nature10694
Maley, C.C., Aktipis, A., Graham, T.A., Sottoriva, A., Boddy, A.M., Janiszewska, M., Silva, A.S., Gerlinger, M., Yuan, Y., Pienta, K.J., Anderson, K.S., Gatenby, R., Swanton, C., Posada, D., Wu, C.-I., Schiffman, J.D., Hwang, E.S., Polyak, K., Anderson, A.R.A., Brown, J.S., Greaves, M., Shibata, D., 2017. Classifying the evolutionary and ecological features of neoplasms. Nat Rev Cancer 17, 605–619. https://doi.org/10.1038/nrc.2017.69
Mariathasan, S., Turley, S.J., Nickles, D., Castiglioni, A., Yuen, K., Wang, Y., Kadel Iii, E.E., Koeppen, H., Astarita, J.L., Cubas, R., Jhunjhunwala, S., Banchereau, R., Yang, Y., Guan, Y., Chalouni, C., Ziai, J., Şenbabaoğlu, Y., Santoro, S., Sheinson, D., Hung, J., Giltnane, J.M., Pierce, A.A., Mesh, K., Lianoglou, S., Riegler, J., Carano, R.A.D., Eriksson, P., Höglund, M., Somarriba, L., Halligan, D.L., van der Heijden, M.S., Loriot, Y., Rosenberg, J.E., Fong, L., Mellman, I., Chen, D.S., Green, M., Derleth, C., Fine, G.D., Hegde, P.S., Bourgon, R., Powles, T., 2018. TGFβ attenuates tumour response to PD-L1 blockade by contributing to exclusion of T cells. Nature 554, 544–548. https://doi.org/10.1038/nature25501
Marjanovic, N.D., Hofree, M., Chan, J.E., Canner, D., Wu, K., Trakala, M., Hartmann, G.G., Smith, O., Kim, J., Evans, K.V., Hudson, A., Ashenberg, O., Porter, C.B.M., Bejnood, A., Subramanian, A., Pitter, K., Yan, Y., Delroy, T., Phillips, D.R., Shah, N., Chaudhary, O., Tsankov, A., Hollmann, T., Rekhtman, N., Massion, P.P., Poirier, J.T., Mazutis, L., Li, R., Lee, J.-H., Amon, A., Rudin, C.M., Jacks, T., Regev, A., Tammela, T., 2020. Emergence of a High-Plasticity Cell State during Lung Cancer Evolution. Cancer Cell 0. https://doi.org/10.1016/j.ccell.2020.06.012
Marquart, J., Chen, E.Y., Prasad, V., 2018. Estimation of the Percentage of US Patients With Cancer Who Benefit From Genome-Driven Oncology. JAMA Oncol 4, 1093–1098. https://doi.org/10.1001/jamaoncol.2018.1660
Marusyk, A., Tabassum, D.P., Janiszewska, M., Place, A.E., Trinh, A., Rozhok, A.I., Pyne, S., Guerriero, J.L., Shu, S., Ekram, M., Ishkin, A., Cahill, D.P., Nikolsky, Y., Chan, T.A., Rimawi, M.F., Hilsenbeck, S., Schiff, R., Osborne, K.C., Letai, A., Polyak, K., 2016. Spatial Proximity to Fibroblasts Impacts Molecular Features and Therapeutic Sensitivity of Breast Cancer Cells Influencing Clinical Outcomes. Cancer Res 76, 6495–6506. https://doi.org/10.1158/0008-5472.CAN-16-1457
Mascaux, C., Angelova, M., Vasaturo, A., Beane, J., Hijazi, K., Anthoine, G., Buttard, B., Rothe, F., Willard-Gallo, K., Haller, A., Ninane, V., Burny, A., Sculier, J.-P., Spira, A., Galon, J., 2019. Immune evasion before tumour invasion in early lung squamous carcinogenesis. Nature 1. https://doi.org/10.1038/s41586-019-1330-0
Maser, R.S., DePinho, R.A., 2002. Connecting Chromosomes, Crisis, and Cancer. Science 297, 565–569. https://doi.org/10.1126/science.297.5581.565
McCall, S.J., Dry, S.M., 2019. Precision Pathology as Part of Precision Medicine: Are We Optimizing Patients’ Interests in Prioritizing Use of Limited Tissue

Reference List
247
Samples? JCO Precision Oncology 1–6. https://doi.org/10.1200/PO.18.00238
McGranahan, N., Burrell, R.A., Endesfelder, D., Novelli, M.R., Swanton, C., 2012. Cancer chromosomal instability: therapeutic and diagnostic challenges. EMBO reports 13, 528–538. https://doi.org/10.1038/embor.2012.61
McGranahan, N., Favero, F., de Bruin, E.C., Birkbak, N.J., Szallasi, Z., Swanton, C., 2015. Clonal status of actionable driver events and the timing of mutational processes in cancer evolution. Sci Transl Med 7, 283ra54. https://doi.org/10.1126/scitranslmed.aaa1408
McGranahan, N., Furness, A.J.S., Rosenthal, R., Ramskov, S., Lyngaa, R., Saini, S.K., Jamal-Hanjani, M., Wilson, G.A., Birkbak, N.J., Hiley, C.T., Watkins, T.B.K., Shafi, S., Murugaesu, N., Mitter, R., Akarca, A.U., Linares, J., Marafioti, T., Henry, J.Y., Van Allen, E.M., Miao, D., Schilling, B., Schadendorf, D., Garraway, L.A., Makarov, V., Rizvi, N.A., Snyder, A., Hellmann, M.D., Merghoub, T., Wolchok, J.D., Shukla, S.A., Wu, C.J., Peggs, K.S., Chan, T.A., Hadrup, S.R., Quezada, S.A., Swanton, C., 2016. Clonal neoantigens elicit T cell immunoreactivity and sensitivity to immune checkpoint blockade. Science 351, 1463–1469. https://doi.org/10.1126/science.aaf1490
McGranahan, N., Swanton, C., 2019. Neoantigen quality, not quantity. Science Translational Medicine 11, eaax7918. https://doi.org/10.1126/scitranslmed.aax7918
McGranahan, N., Swanton, C., 2017. Clonal Heterogeneity and Tumor Evolution: Past, Present, and the Future. Cell 168, 613–628. https://doi.org/10.1016/j.cell.2017.01.018
McInnes, L., Healy, J., Melville, J., 2018. UMAP: Uniform Manifold Approximation and Projection for Dimension Reduction. arXiv:1802.03426 [cs, stat].
McIntyre, B.W., Allison, J.P., 1983. The mouse T cell receptor: structural heterogeneity of molecules of normal T cells defined by xenoantiserum. Cell 34, 739–746. https://doi.org/10.1016/0092-8674(83)90530-5
Meads, M.B., Gatenby, R.A., Dalton, W.S., 2009. Environment-mediated drug resistance: a major contributor to minimal residual disease. Nat Rev Cancer 9, 665–674. https://doi.org/10.1038/nrc2714
Merritt, C.R., Ong, G.T., Church, S.E., Barker, K., Danaher, P., Geiss, G., Hoang, M., Jung, J., Liang, Y., McKay-Fleisch, J., Nguyen, K., Norgaard, Z., Sorg, K., Sprague, I., Warren, C., Warren, S., Webster, P.J., Zhou, Z., Zollinger, D.R., Dunaway, D.L., Mills, G.B., Beechem, J.M., 2020. Multiplex digital spatial profiling of proteins and RNA in fixed tissue. Nat Biotechnol 38, 586–599. https://doi.org/10.1038/s41587-020-0472-9
Middleton, G., Fletcher, P., Popat, S., Savage, J., Summers, Y., Greystoke, A., Gilligan, D., Cave, J., O’Rourke, N., Brewster, A., Toy, E., Spicer, J., Jain, P., Dangoor, A., Mackean, M., Forster, M., Farley, A., Wherton, D., Mehmi, M., Sharpe, R., Mills, T.C., Cerone, M.A., Yap, T.A., Watkins, T.B.K., Lim, E., Swanton, C., Billingham, L., 2020. The National Lung Matrix Trial of personalized therapy in lung cancer. Nature 1–6. https://doi.org/10.1038/s41586-020-2481-8
Mikulak, J., Oriolo, F., Bruni, E., Roberto, A., Colombo, F.S., Villa, A., Bosticardo, M., Bortolomai, I., Lo Presti, E., Meraviglia, S., Dieli, F., Vetrano, S., Danese, S., Della Bella, S., Carvello, M.M., Sacchi, M., Cugini, G., Colombo, G., Klinger, M., Spaggiari, P., Roncalli, M., Prinz, I., Ravens, S., di

Reference List
248
Lorenzo, B., Marcenaro, E., Silva-Santos, B., Spinelli, A., Mavilio, D., 2019. NKp46-expressing human gut-resident intraepithelial Vδ1 T cell subpopulation exhibits high antitumor activity against colorectal cancer. JCI Insight 4. https://doi.org/10.1172/jci.insight.125884
Miller, C.A., Settle, S.H., Sulman, E.P., Aldape, K.D., Milosavljevic, A., 2011. Discovering functional modules by identifying recurrent and mutually exclusive mutational patterns in tumors. BMC Med Genomics 4, 34. https://doi.org/10.1186/1755-8794-4-34
Mina, M., Raynaud, F., Tavernari, D., Battistello, E., Sungalee, S., Saghafinia, S., Laessle, T., Sanchez-Vega, F., Schultz, N., Oricchio, E., Ciriello, G., 2017. Conditional Selection of Genomic Alterations Dictates Cancer Evolution and Oncogenic Dependencies. Cancer Cell 32, 155-168.e6. https://doi.org/10.1016/j.ccell.2017.06.010
Misale, S., Yaeger, R., Hobor, S., Scala, E., Janakiraman, M., Liska, D., Valtorta, E., Schiavo, R., Buscarino, M., Siravegna, G., Bencardino, K., Cercek, A., Chen, C.-T., Veronese, S., Zanon, C., Sartore-Bianchi, A., Gambacorta, M., Gallicchio, M., Vakiani, E., Boscaro, V., Medico, E., Weiser, M., Siena, S., Di Nicolantonio, F., Solit, D., Bardelli, A., 2012. Emergence of KRAS mutations and acquired resistance to anti-EGFR therapy in colorectal cancer. Nature 486, 532–536. https://doi.org/10.1038/nature11156
Mitchell, T.J., Turajlic, S., Rowan, A., Nicol, D., Farmery, J.H.R., O’Brien, T., Martincorena, I., Tarpey, P., Angelopoulos, N., Yates, L.R., Butler, A.P., Raine, K., Stewart, G.D., Challacombe, B., Fernando, A., Lopez, J.I., Hazell, S., Chandra, A., Chowdhury, S., Rudman, S., Soultati, A., Stamp, G., Fotiadis, N., Pickering, L., Au, L., Spain, L., Lynch, J., Stares, M., Teague, J., Maura, F., Wedge, D.C., Horswell, S., Chambers, T., Litchfield, K., Xu, H., Stewart, A., Elaidi, R., Oudard, S., McGranahan, N., Csabai, I., Gore, M., Futreal, P.A., Larkin, J., Lynch, A.G., Szallasi, Z., Swanton, C., Campbell, P.J., 2018. Timing the Landmark Events in the Evolution of Clear Cell Renal Cell Cancer: TRACERx Renal. Cell 173, 611-623.e17. https://doi.org/10.1016/j.cell.2018.02.020
Mlecnik, B., Van den Eynde, M., Bindea, G., Church, S.E., Vasaturo, A., Fredriksen, T., Lafontaine, L., Haicheur, N., Marliot, F., Debetancourt, D., Pairet, G., Jouret-Mourin, A., Gigot, J.-F., Hubert, C., Danse, E., Dragean, C., Carrasco, J., Humblet, Y., Valge-Archer, V., Berger, A., Pagès, F., Machiels, J.-P., Galon, J., 2018. Comprehensive Intrametastatic Immune Quantification and Major Impact of Immunoscore on Survival. J Natl Cancer Inst 110, 97–108. https://doi.org/10.1093/jnci/djx123
Mok, T.S., Wu, Y.-L., Ahn, M.-J., Garassino, M.C., Kim, H.R., Ramalingam, S.S., Shepherd, F.A., He, Y., Akamatsu, H., Theelen, W.S.M.E., Lee, C.K., Sebastian, M., Templeton, A., Mann, H., Marotti, M., Ghiorghiu, S., Papadimitrakopoulou, V.A., AURA3 Investigators, 2017. Osimertinib or Platinum-Pemetrexed in EGFR T790M-Positive Lung Cancer. N. Engl. J. Med. 376, 629–640. https://doi.org/10.1056/NEJMoa1612674
Monach, P.A., Meredith, S.C., Siegel, C.T., Schreiber, H., 1995. A unique tumor antigen produced by a single amino acid substitution. Immunity 2, 45–59.
Moore, A.L., Kuipers, J., Singer, J., Burcklen, E., Schraml, P., Beisel, C., Moch, H., Beerenwinkel, N., 2018. Intra-tumor heterogeneity and clonal exclusivity in renal cell carcinoma. bioRxiv 305623. https://doi.org/10.1101/305623

Reference List
249
Morris, L.G.T., Riaz, N., Desrichard, A., Şenbabaoğlu, Y., Hakimi, A.A., Makarov, V., Reis-Filho, J.S., Chan, T.A., Morris, L.G.T., Riaz, N., Desrichard, A., Şenbabaoğlu, Y., Hakimi, A.A., Makarov, V., Reis-Filho, J.S., Chan, T.A., 2016. Pan-cancer analysis of intratumor heterogeneity as a prognostic determinant of survival. Oncotarget 7, 10051–10063. https://doi.org/10.18632/oncotarget.7067
Morrissy, A.S., Cavalli, F.M.G., Remke, M., Ramaswamy, V., Shih, D.J.H., Holgado, B.L., Farooq, H., Donovan, L.K., Garzia, L., Agnihotri, S., Kiehna, E.N., Mercier, E., Mayoh, C., Papillon-Cavanagh, S., Nikbakht, H., Gayden, T., Torchia, J., Picard, D., Merino, D.M., Vladoiu, M., Luu, B., Wu, X., Daniels, C., Horswell, S., Thompson, Y.Y., Hovestadt, V., Northcott, P.A., Jones, D.T.W., Peacock, J., Wang, X., Mack, S.C., Reimand, J., Albrecht, S., Fontebasso, A.M., Thiessen, N., Li, Y., Schein, J.E., Lee, D., Carlsen, R., Mayo, M., Tse, K., Tam, A., Dhalla, N., Ally, A., Chuah, E., Cheng, Y., Plettner, P., Li, H.I., Corbett, R.D., Wong, T., Long, W., Loukides, J., Buczkowicz, P., Hawkins, C.E., Tabori, U., Rood, B.R., Myseros, J.S., Packer, R.J., Korshunov, A., Lichter, P., Kool, M., Pfister, S.M., Schüller, U., Dirks, P., Huang, A., Bouffet, E., Rutka, J.T., Bader, G.D., Swanton, C., Ma, Y., Moore, R.A., Mungall, A.J., Majewski, J., Jones, S.J.M., Das, S., Malkin, D., Jabado, N., Marra, M.A., Taylor, M.D., 2017. Spatial heterogeneity in medulloblastoma. Nat Genet 49, 780–788. https://doi.org/10.1038/ng.3838
Morrissy, A.S., Garzia, L., Shih, D.J.H., Zuyderduyn, S., Huang, X., Skowron, P., Remke, M., Cavalli, F.M.G., Ramaswamy, V., Lindsay, P.E., Jelveh, S., Donovan, L.K., Wang, X., Luu, B., Zayne, K., Li, Y., Mayoh, C., Thiessen, N., Mercier, E., Mungall, K.L., Ma, Y., Tse, K., Zeng, T., Shumansky, K., Roth, A.J.L., Shah, S., Farooq, H., Kijima, N., Holgado, B.L., Lee, J.J.Y., Matan-Lithwick, S., Liu, J., Mack, S.C., Manno, A., Michealraj, K.A., Nor, C., Peacock, J., Qin, L., Reimand, J., Rolider, A., Thompson, Y.Y., Wu, X., Pugh, T., Ally, A., Bilenky, M., Butterfield, Y.S.N., Carlsen, R., Cheng, Y., Chuah, E., Corbett, R.D., Dhalla, N., He, A., Lee, D., Li, H.I., Long, W., Mayo, M., Plettner, P., Qian, J.Q., Schein, J.E., Tam, A., Wong, T., Birol, I., Zhao, Y., Faria, C.C., Pimentel, J., Nunes, S., Shalaby, T., Grotzer, M., Pollack, I.F., Hamilton, R.L., Li, X.-N., Bendel, A.E., Fults, D.W., Walter, A.W., Kumabe, T., Tominaga, T., Collins, V.P., Cho, Y.-J., Hoffman, C., Lyden, D., Wisoff, J.H., Garvin, J.H., Stearns, D.S., Massimi, L., Schüller, U., Sterba, J., Zitterbart, K., Puget, S., Ayrault, O., Dunn, S.E., Tirapelli, D.P.C., Carlotti, C.G., Wheeler, H., Hallahan, A.R., Ingram, W., MacDonald, T.J., Olson, J.J., Van Meir, E.G., Lee, J.-Y., Wang, K.-C., Kim, S.-K., Cho, B.-K., Pietsch, T., Fleischhack, G., Tippelt, S., Ra, Y.S., Bailey, S., Lindsey, J.C., Clifford, S.C., Eberhart, C.G., Cooper, M.K., Packer, R.J., Massimino, M., Garre, M.L., Bartels, U., Tabori, U., Hawkins, C.E., Dirks, P., Bouffet, E., Rutka, J.T., Wechsler-Reya, R.J., Weiss, W.A., Collier, L.S., Dupuy, A.J., Korshunov, A., Jones, D.T.W., Kool, M., Northcott, P.A., Pfister, S.M., Largaespada, D.A., Mungall, A.J., Moore, R.A., Jabado, N., Bader, G.D., Jones, S.J.M., Malkin, D., Marra, M.A., Taylor, M.D., 2016. Divergent clonal selection dominates medulloblastoma at recurrence. Nature 529, 351–357. https://doi.org/10.1038/nature16478
Mountain, C.F., Carr, D.T., Anderson, W.A., 1974. A system for the clinical staging of lung cancer. Am J Roentgenol Radium Ther Nucl Med 120, 130–138.

Reference List
250
Murugaesu, N., Wilson, G.A., Birkbak, N.J., Watkins, T.B.K., McGranahan, N., Kumar, S., Abbassi-Ghadi, N., Salm, M., Mitter, R., Horswell, S., Rowan, A., Phillimore, B., Biggs, J., Begum, S., Matthews, N., Hochhauser, D., Hanna, G.B., Swanton, C., 2015. Tracking the Genomic Evolution of Esophageal Adenocarcinoma through Neoadjuvant Chemotherapy. Cancer Discov 5, 821–831. https://doi.org/10.1158/2159-8290.CD-15-0412
Nangalia, J., Campbell, P.J., 2019. Genome Sequencing during a Patient’s Journey through Cancer. New England Journal of Medicine 381, 2145–2156. https://doi.org/10.1056/NEJMra1910138
Neou, M., Villa, C., Armignacco, R., Jouinot, A., Raffin-Sanson, M.-L., Septier, A., Letourneur, F., Diry, S., Diedisheim, M., Izac, B., Gaspar, C., Perlemoine, K., Verjus, V., Bernier, M., Boulin, A., Emile, J.-F., Bertagna, X., Jaffrezic, F., Laloe, D., Baussart, B., Bertherat, J., Gaillard, S., Assié, G., 2020. Pangenomic Classification of Pituitary Neuroendocrine Tumors. Cancer Cell 37, 123-134.e5. https://doi.org/10.1016/j.ccell.2019.11.002
Newman, A.M., Alizadeh, A.A., 2016. High-throughput genomic profiling of tumor-infiltrating leukocytes. Current Opinion in Immunology, Vaccines * Special section: Cancer immunology: Genomics & biomarkers 41, 77–84. https://doi.org/10.1016/j.coi.2016.06.006
Newman, A.M., Gentles, A.J., Liu, C.L., Diehn, M., Alizadeh, A.A., 2017. Data normalization considerations for digital tumor dissection. Genome Biology 18, 128. https://doi.org/10.1186/s13059-017-1257-4
Newman, A.M., Liu, C.L., Green, M.R., Gentles, A.J., Feng, W., Xu, Y., Hoang, C.D., Diehn, M., Alizadeh, A.A., 2015. Robust enumeration of cell subsets from tissue expression profiles. Nat Meth 12, 453–457. https://doi.org/10.1038/nmeth.3337
Newman, A.M., Steen, C.B., Liu, C.L., Gentles, A.J., Chaudhuri, A.A., Scherer, F., Khodadoust, M.S., Esfahani, M.S., Luca, B.A., Steiner, D., Diehn, M., Alizadeh, A.A., 2019. Determining cell type abundance and expression from bulk tissues with digital cytometry. Nature Biotechnology 1. https://doi.org/10.1038/s41587-019-0114-2
Nishino, M., Ramaiya, N.H., Hatabu, H., Hodi, F.S., 2017. Monitoring immune-checkpoint blockade: response evaluation and biomarker development. Nature Reviews Clinical Oncology 14, 655. https://doi.org/10.1038/nrclinonc.2017.88
Noorbakhsh, J., Kim, H., Namburi, S., Chuang, J.H., 2018. Distribution-based measures of tumor heterogeneity are sensitive to mutation calling and lack strong clinical predictive power. Scientific Reports 8, 11445. https://doi.org/10.1038/s41598-018-29154-7
Nowell, P.C., 1976. The clonal evolution of tumor cell populations. Science 194, 23–28. https://doi.org/10.1126/science.959840
O’Callaghan, D.S., Rexhepaj, E., Gately, K., Coate, L., Delaney, D., O’Donnell, D.M., Kay, E., O’Connell, F., Gallagher, W.M., O’Byrne, K.J., 2015. Tumour islet Foxp3+ T-cell infiltration predicts poor outcome in nonsmall cell lung cancer. European Respiratory Journal 46, 1762–1772. https://doi.org/10.1183/13993003.00176-2014
Ohri, C.M., Shikotra, A., Green, R.H., Waller, D.A., Bradding, P., 2009. Macrophages within NSCLC tumour islets are predominantly of a cytotoxic M1 phenotype associated with extended survival. European Respiratory Journal 33, 118–126. https://doi.org/10.1183/09031936.00065708
Reference List
251
Okayama, H., Kohno, T., Ishii, Y., Shimada, Y., Shiraishi, K., Iwakawa, R., Furuta, K., Tsuta, K., Shibata, T., Yamamoto, S., Watanabe, S., Sakamoto, H., Kumamoto, K., Takenoshita, S., Gotoh, N., Mizuno, H., Sarai, A., Kawano, S., Yamaguchi, R., Miyano, S., Yokota, J., 2012. Identification of Genes Upregulated in ALK-Positive and EGFR/KRAS/ALK-Negative Lung Adenocarcinomas. Cancer Res 72, 100–111. https://doi.org/10.1158/0008-5472.CAN-11-1403
Opasic, L., Zhou, D., Werner, B., Dingli, D., Traulsen, A., 2019. How many samples are needed to infer truly clonal mutations from heterogenous tumours? BMC Cancer 19, 403. https://doi.org/10.1186/s12885-019-5597-1
Ortmann, C.A., Kent, D.G., Nangalia, J., Silber, Y., Wedge, D.C., Grinfeld, J., Baxter, E.J., Massie, C.E., Papaemmanuil, E., Menon, S., Godfrey, A.L., Dimitropoulou, D., Guglielmelli, P., Bellosillo, B., Besses, C., Döhner, K., Harrison, C.N., Vassiliou, G.S., Vannucchi, A., Campbell, P.J., Green, A.R., 2015. Effect of Mutation Order on Myeloproliferative Neoplasms. New England Journal of Medicine 372, 601–612. https://doi.org/10.1056/NEJMoa1412098
Paez, J.G., Jänne, P.A., Lee, J.C., Tracy, S., Greulich, H., Gabriel, S., Herman, P., Kaye, F.J., Lindeman, N., Boggon, T.J., Naoki, K., Sasaki, H., Fujii, Y., Eck, M.J., Sellers, W.R., Johnson, B.E., Meyerson, M., 2004. EGFR Mutations in Lung Cancer: Correlation with Clinical Response to Gefitinib Therapy. Science 304, 1497–1500. https://doi.org/10.1126/science.1099314
Pagès, F., Berger, A., Camus, M., Sanchez-Cabo, F., Costes, A., Molidor, R., Mlecnik, B., Kirilovsky, A., Nilsson, M., Damotte, D., Meatchi, T., Bruneval, P., Cugnenc, P.-H., Trajanoski, Z., Fridman, W.-H., Galon, J., 2005. Effector memory T cells, early metastasis, and survival in colorectal cancer. N. Engl. J. Med. 353, 2654–2666. https://doi.org/10.1056/NEJMoa051424
Paik, S., Shak, S., Tang, G., Kim, C., Baker, J., Cronin, M., Baehner, F.L., Walker, M.G., Watson, D., Park, T., Hiller, W., Fisher, E.R., Wickerham, D.L., Bryant, J., Wolmark, N., 2004. A Multigene Assay to Predict Recurrence of Tamoxifen-Treated, Node-Negative Breast Cancer. New England Journal of Medicine 351, 2817–2826. https://doi.org/10.1056/NEJMoa041588
Pao, W., Miller, V., Zakowski, M., Doherty, J., Politi, K., Sarkaria, I., Singh, B., Heelan, R., Rusch, V., Fulton, L., Mardis, E., Kupfer, D., Wilson, R., Kris, M., Varmus, H., 2004. EGF receptor gene mutations are common in lung cancers from “never smokers” and are associated with sensitivity of tumors to gefitinib and erlotinib. PNAS 101, 13306–13311. https://doi.org/10.1073/pnas.0405220101
Paradis, E., Claude, J., Strimmer, K., 2004. APE: Analyses of Phylogenetics and Evolution in R language. Bioinformatics 20, 289–290. https://doi.org/10.1093/bioinformatics/btg412
Park, S., Lehner, B., 2015. Cancer type-dependent genetic interactions between cancer driver alterations indicate plasticity of epistasis across cell types. Molecular Systems Biology 11, 824. https://doi.org/10.15252/msb.20156102
Parker, J.S., Mullins, M., Cheang, M.C.U., Leung, S., Voduc, D., Vickery, T., Davies, S., Fauron, C., He, X., Hu, Z., Quackenbush, J.F., Stijleman, I.J., Palazzo, J., Marron, J. s., Nobel, A.B., Mardis, E., Nielsen, T.O., Ellis, M.J., Perou, C.M., Bernard, P.S., 2009. Supervised Risk Predictor of Breast Cancer Based on Intrinsic Subtypes. JCO 27, 1160–1167. https://doi.org/10.1200/JCO.2008.18.1370

Reference List
252
Patel, A.P., Tirosh, I., Trombetta, J.J., Shalek, A.K., Gillespie, S.M., Wakimoto, H., Cahill, D.P., Nahed, B.V., Curry, W.T., Martuza, R.L., Louis, D.N., Rozenblatt-Rosen, O., Suvà, M.L., Regev, A., Bernstein, B.E., 2014. Single-cell RNA-seq highlights intratumoral heterogeneity in primary glioblastoma. Science 344, 1396–1401. https://doi.org/10.1126/science.1254257
Pennycuick, A., Teixeira, V.H., AbdulJabbar, K., Raza, S.E.A., Lund, T., Akarca, A.U., Rosenthal, R., Kalinke, L., Chandrasekharan, D.P., Pipinikas, C.P., Lee-Six, H., Hynds, R.E., Gowers, K.H.C., Henry, J.Y., Millar, F.R., Hagos, Y.B., Denais, C., Falzon, M., Moore, D.A., Antoniou, S., Durrenberger, P.F., Furness, A.J.S., Carroll, B., Marceaux, C., Asselin-Labat, M.-L., Larson, W., Betts, C., Coussens, L.M., Thakrar, R.M., George, J., Swanton, C., Thirlwell, C., Campbell, P.J., Marafioti, T., Yuan, Y., Quezada, S.A., McGranahan, N., Janes, S.M., 2020. Immune surveillance in clinical regression of pre-invasive squamous cell lung cancer. Cancer Discov. https://doi.org/10.1158/2159-8290.CD-19-1366
Perou, C.M., Sørlie, T., Eisen, M.B., Rijn, M. van de, Jeffrey, S.S., Rees, C.A., Pollack, J.R., Ross, D.T., Johnsen, H., Akslen, L.A., Fluge, Ø., Pergamenschikov, A., Williams, C., Zhu, S.X., Lønning, P.E., Børresen-Dale, A.-L., Brown, P.O., Botstein, D., 2000. Molecular portraits of human breast tumours. Nature 406, 747–752. https://doi.org/10.1038/35021093
Petersen, S.E., Bichel, P., Lorentzen, M., 1979. Flow-cytometric demonstration of tumour-cell subpopulations with different DNA content in human colo-rectal carcinoma. European Journal of Cancer (1965) 15, 383–386. https://doi.org/10.1016/0014-2964(79)90072-0
Philip, M., Fairchild, L., Sun, L., Horste, E.L., Camara, S., Shakiba, M., Scott, A.C., Viale, A., Lauer, P., Merghoub, T., Hellmann, M.D., Wolchok, J.D., Leslie, C.S., Schietinger, A., 2017. Chromatin states define tumour-specific T cell dysfunction and reprogramming. Nature 545, 452–456. https://doi.org/10.1038/nature22367
Picelli, S., Faridani, O.R., Björklund, A.K., Winberg, G., Sagasser, S., Sandberg, R., 2014. Full-length RNA-seq from single cells using Smart-seq2. Nat Protoc 9, 171–181. https://doi.org/10.1038/nprot.2014.006
Pignon, J.-P., Tribodet, H., Scagliotti, G.V., Douillard, J.-Y., Shepherd, F.A., Stephens, R.J., Dunant, A., Torri, V., Rosell, R., Seymour, L., Spiro, S.G., Rolland, E., Fossati, R., Aubert, D., Ding, K., Waller, D., Le Chevalier, T., 2008. Lung Adjuvant Cisplatin Evaluation: A Pooled Analysis by the LACE Collaborative Group. JCO 26, 3552–3559. https://doi.org/10.1200/JCO.2007.13.9030
Pleasance, E.D., Stephens, P.J., O’Meara, S., McBride, D.J., Meynert, A., Jones, D., Lin, M.-L., Beare, D., Lau, K.W., Greenman, C., Varela, I., Nik-Zainal, S., Davies, H.R., Ordoñez, G.R., Mudie, L.J., Latimer, C., Edkins, S., Stebbings, L., Chen, L., Jia, M., Leroy, C., Marshall, J., Menzies, A., Butler, A., Teague, J.W., Mangion, J., Sun, Y.A., McLaughlin, S.F., Peckham, H.E., Tsung, E.F., Costa, G.L., Lee, C.C., Minna, J.D., Gazdar, A., Birney, E., Rhodes, M.D., McKernan, K.J., Stratton, M.R., Futreal, P.A., Campbell, P.J., 2010. A small-cell lung cancer genome with complex signatures of tobacco exposure. Nature 463, 184–190. https://doi.org/10.1038/nature08629
Pollack, J.R., Sørlie, T., Perou, C.M., Rees, C.A., Jeffrey, S.S., Lonning, P.E., Tibshirani, R., Botstein, D., Børresen-Dale, A.-L., Brown, P.O., 2002. Microarray analysis reveals a major direct role of DNA copy number

Reference List
253
alteration in the transcriptional program of human breast tumors. PNAS 99, 12963–12968. https://doi.org/10.1073/pnas.162471999
Priestley, P., Baber, J., Lolkema, M.P., Steeghs, N., Bruijn, E. de, Shale, C., Duyvesteyn, K., Haidari, S., Hoeck, A. van, Onstenk, W., Roepman, P., Voda, M., Bloemendal, H.J., Tjan-Heijnen, V.C.G., Herpen, C.M.L. van, Labots, M., Witteveen, P.O., Smit, E.F., Sleijfer, S., Voest, E.E., Cuppen, E., 2019. Pan-cancer whole-genome analyses of metastatic solid tumours. Nature 575, 210–216. https://doi.org/10.1038/s41586-019-1689-y
Puchalski, R.B., Shah, N., Miller, J., Dalley, R., Nomura, S.R., Yoon, J.-G., Smith, K.A., Lankerovich, M., Bertagnolli, D., Bickley, K., Boe, A.F., Brouner, K., Butler, S., Caldejon, S., Chapin, M., Datta, S., Dee, N., Desta, T., Dolbeare, T., Dotson, N., Ebbert, A., Feng, D., Feng, X., Fisher, M., Gee, G., Goldy, J., Gourley, L., Gregor, B.W., Gu, G., Hejazinia, N., Hohmann, J., Hothi, P., Howard, R., Joines, K., Kriedberg, A., Kuan, L., Lau, C., Lee, F., Lee, H., Lemon, T., Long, F., Mastan, N., Mott, E., Murthy, C., Ngo, K., Olson, E., Reding, M., Riley, Z., Rosen, D., Sandman, D., Shapovalova, N., Slaughterbeck, C.R., Sodt, A., Stockdale, G., Szafer, A., Wakeman, W., Wohnoutka, P.E., White, S.J., Marsh, D., Rostomily, R.C., Ng, L., Dang, C., Jones, A., Keogh, B., Gittleman, H.R., Barnholtz-Sloan, J.S., Cimino, P.J., Uppin, M.S., Keene, C.D., Farrokhi, F.R., Lathia, J.D., Berens, M.E., Iavarone, A., Bernard, A., Lein, E., Phillips, J.W., Rostad, S.W., Cobbs, C., Hawrylycz, M.J., Foltz, G.D., 2018. An anatomic transcriptional atlas of human glioblastoma. Science 360, 660–663. https://doi.org/10.1126/science.aaf2666
Quezada, S.A., Peggs, K.S., 2013. Exploiting CTLA-4, PD-1 and PD-L1 to reactivate the host immune response against cancer. Br J Cancer 108, 1560–1565. https://doi.org/10.1038/bjc.2013.117
Racle, J., Jonge, K. de, Baumgaertner, P., Speiser, D.E., Gfeller, D., 2017. Simultaneous enumeration of cancer and immune cell types from bulk tumor gene expression data. eLife Sciences 6, e26476. https://doi.org/10.7554/eLife.26476
Ramalingam, S.S., Vansteenkiste, J., Planchard, D., Cho, B.C., Gray, J.E., Ohe, Y., Zhou, C., Reungwetwattana, T., Cheng, Y., Chewaskulyong, B., Shah, R., Cobo, M., Lee, K.H., Cheema, P., Tiseo, M., John, T., Lin, M.-C., Imamura, F., Kurata, T., Todd, A., Hodge, R., Saggese, M., Rukazenkov, Y., Soria, J.-C., 2020. Overall Survival with Osimertinib in Untreated, EGFR-Mutated Advanced NSCLC. New England Journal of Medicine 382, 41–50. https://doi.org/10.1056/NEJMoa1913662
Raz, D.J., Ray, M.R., Kim, J.Y., He, B., Taron, M., Skrzypski, M., Segal, M., Gandara, D.R., Rosell, R., Jablons, D.M., 2008. A Multigene Assay Is Prognostic of Survival in Patients with Early-Stage Lung Adenocarcinoma. Clin Cancer Res 14, 5565–5570. https://doi.org/10.1158/1078-0432.CCR-08-0544
Reddy, E.P., Reynolds, R.K., Santos, E., Barbacid, M., 1982. A point mutation is responsible for the acquisition of transforming properties by the T24 human bladder carcinoma oncogene. Nature 300, 149–152. https://doi.org/10.1038/300149a0
Reiter, J.G., Baretti, M., Gerold, J.M., Makohon-Moore, A.P., Daud, A., Iacobuzio-Donahue, C.A., Azad, N.S., Kinzler, K.W., Nowak, M.A., Vogelstein, B.,

Reference List
254
2019. An analysis of genetic heterogeneity in untreated cancers. Nat. Rev. Cancer. https://doi.org/10.1038/s41568-019-0185-x
Reka, A.K., Chen, G., Jones, R.C., Amunugama, R., Kim, S., Karnovsky, A., Standiford, T.J., Beer, D.G., Omenn, G.S., Keshamouni, V.G., 2014. Epithelial–mesenchymal transition-associated secretory phenotype predicts survival in lung cancer patients. Carcinogenesis 35, 1292–1300. https://doi.org/10.1093/carcin/bgu041
Rheinbay, E., Nielsen, M.M., Abascal, F., Wala, J.A., Shapira, O., Tiao, G., Hornshøj, H., Hess, J.M., Juul, R.I., Lin, Z., Feuerbach, L., Sabarinathan, R., Madsen, T., Kim, J., Mularoni, L., Shuai, S., Lanzós, A., Herrmann, C., Maruvka, Y.E., Shen, C., Amin, S.B., Bandopadhayay, P., Bertl, J., Boroevich, K.A., Busanovich, J., Carlevaro-Fita, J., Chakravarty, D., Chan, C.W.Y., Craft, D., Dhingra, P., Diamanti, K., Fonseca, N.A., Gonzalez-Perez, A., Guo, Q., Hamilton, M.P., Haradhvala, N.J., Hong, C., Isaev, K., Johnson, T.A., Juul, M., Kahles, A., Kahraman, A., Kim, Y., Komorowski, J., Kumar, K., Kumar, S., Lee, D., Lehmann, K.-V., Li, Y., Liu, E.M., Lochovsky, L., Park, K., Pich, O., Roberts, N.D., Saksena, G., Schumacher, S.E., Sidiropoulos, N., Sieverling, L., Sinnott-Armstrong, N., Stewart, C., Tamborero, D., Tubio, J.M.C., Umer, H.M., Uusküla-Reimand, L., Wadelius, C., Wadi, L., Yao, X., Zhang, C.-Z., Zhang, J., Haber, J.E., Hobolth, A., Imielinski, M., Kellis, M., Lawrence, M.S., Mering, C. von, Nakagawa, H., Raphael, B.J., Rubin, M.A., Sander, C., Stein, L.D., Stuart, J.M., Tsunoda, T., Wheeler, D.A., Johnson, R., Reimand, J., Gerstein, M., Khurana, E., Campbell, P.J., López-Bigas, N., Weischenfeldt, J., Beroukhim, R., Martincorena, I., Pedersen, J.S., Getz, G., 2020. Analyses of non-coding somatic drivers in 2,658 cancer whole genomes. Nature 578, 102–111. https://doi.org/10.1038/s41586-020-1965-x
Riaz, N., Havel, J.J., Makarov, V., Desrichard, A., Urba, W.J., Sims, J.S., Hodi, F.S., Martín-Algarra, S., Mandal, R., Sharfman, W.H., Bhatia, S., Hwu, W.-J., Gajewski, T.F., Slingluff, C.L., Chowell, D., Kendall, S.M., Chang, H., Shah, R., Kuo, F., Morris, L.G.T., Sidhom, J.-W., Schneck, J.P., Horak, C.E., Weinhold, N., Chan, T.A., 2017. Tumor and Microenvironment Evolution during Immunotherapy with Nivolumab. Cell 0. https://doi.org/10.1016/j.cell.2017.09.028
Ribas, A., Hu-Lieskovan, S., 2016. What does PD-L1 positive or negative mean? Journal of Experimental Medicine 213, 2835–2840. https://doi.org/10.1084/jem.20161462
Rice, C.M., Davies, L.C., Subleski, J.J., Maio, N., Gonzalez-Cotto, M., Andrews, C., Patel, N.L., Palmieri, E.M., Weiss, J.M., Lee, J.-M., Annunziata, C.M., Rouault, T.A., Durum, S.K., McVicar, D.W., 2018. Tumour-elicited neutrophils engage mitochondrial metabolism to circumvent nutrient limitations and maintain immune suppression. Nature Communications 9, 5099. https://doi.org/10.1038/s41467-018-07505-2
Rimmer, A., Phan, H., Mathieson, I., Iqbal, Z., Twigg, S.R.F., Wilkie, A.O.M., McVean, G., Lunter, G., 2014. Integrating mapping-, assembly- and haplotype-based approaches for calling variants in clinical sequencing applications. Nature Genetics 46, 912–918. https://doi.org/10.1038/ng.3036
Rizvi, N.A., Hellmann, M.D., Snyder, A., Kvistborg, P., Makarov, V., Havel, J.J., Lee, W., Yuan, J., Wong, P., Ho, T.S., Miller, M.L., Rekhtman, N., Moreira, A.L., Ibrahim, F., Bruggeman, C., Gasmi, B., Zappasodi, R., Maeda, Y.,

Reference List
255
Sander, C., Garon, E.B., Merghoub, T., Wolchok, J.D., Schumacher, T.N., Chan, T.A., 2015. Mutational landscape determines sensitivity to PD-1 blockade in non–small cell lung cancer. Science 348, 124–128. https://doi.org/10.1126/science.aaa1348
Robinson, D.R., Wu, Y.-M., Lonigro, R.J., Vats, P., Cobain, E., Everett, J., Cao, X., Rabban, E., Kumar-Sinha, C., Raymond, V., Schuetze, S., Alva, A., Siddiqui, J., Chugh, R., Worden, F., Zalupski, M.M., Innis, J., Mody, R.J., Tomlins, S.A., Lucas, D., Baker, L.H., Ramnath, N., Schott, A.F., Hayes, D.F., Vijai, J., Offit, K., Stoffel, E.M., Roberts, J.S., Smith, D.C., Kunju, L.P., Talpaz, M., Cieślik, M., Chinnaiyan, A.M., 2017. Integrative clinical genomics of metastatic cancer. Nature advance online publication. https://doi.org/10.1038/nature23306
Roche-Lestienne, C., Laï, J.-L., Darré, S., Facon, T., Preudhomme, C., 2003. A Mutation Conferring Resistance to Imatinib at the Time of Diagnosis of Chronic Myelogenous Leukemia. New England Journal of Medicine 348, 2265–2266. https://doi.org/10.1056/NEJMc035089
Rooney, M.S., Shukla, S.A., Wu, C.J., Getz, G., Hacohen, N., 2015. Molecular and Genetic Properties of Tumors Associated with Local Immune Cytolytic Activity. Cell 160, 48–61. https://doi.org/10.1016/j.cell.2014.12.033
Rosenthal, R., Cadieux, E.L., Salgado, R., Bakir, M.A., Moore, D.A., Hiley, C.T., Lund, T., Tanić, M., Reading, J.L., Joshi, K., Henry, J.Y., Ghorani, E., Wilson, G.A., Birkbak, N.J., Jamal-Hanjani, M., Veeriah, S., Szallasi, Z., Loi, S., Hellmann, M.D., Feber, A., Chain, B., Herrero, J., Quezada, S.A., Demeulemeester, J., Loo, P.V., Beck, S., McGranahan, N., Swanton, C., 2019. Neoantigen-directed immune escape in lung cancer evolution. Nature 1. https://doi.org/10.1038/s41586-019-1032-7
Roth, A., Khattra, J., Yap, D., Wan, A., Laks, E., Biele, J., Ha, G., Aparicio, S., Bouchard-Côté, A., Shah, S.P., 2014. PyClone: statistical inference of clonal population structure in cancer. Nat Methods 11, 396–398. https://doi.org/10.1038/nmeth.2883
Rous, P., 1967. The challenge to man of the neoplastic cell. Science 157, 24–28. https://doi.org/10.1126/science.157.3784.24
Rousseaux, S., Debernardi, A., Jacquiau, B., Vitte, A.-L., Vesin, A., Nagy-Mignotte, H., Moro-Sibilot, D., Brichon, P.-Y., Lantuejoul, S., Hainaut, P., Laffaire, J., Reyniès, A. de, Beer, D.G., Timsit, J.-F., Brambilla, C., Brambilla, E., Khochbin, S., 2013. Ectopic Activation of Germline and Placental Genes Identifies Aggressive Metastasis-Prone Lung Cancers. Science Translational Medicine 5, 186ra66-186ra66. https://doi.org/10.1126/scitranslmed.3005723
Rueda, O.M., Sammut, S.-J., Seoane, J.A., Chin, S.-F., Caswell-Jin, J.L., Callari, M., Batra, R., Pereira, B., Bruna, A., Ali, H.R., Provenzano, E., Liu, B., Parisien, M., Gillett, C., McKinney, S., Green, A.R., Murphy, L., Purushotham, A., Ellis, I.O., Pharoah, P.D., Rueda, C., Aparicio, S., Caldas, C., Curtis, C., 2019. Dynamics of breast-cancer relapse reveal late-recurring ER-positive genomic subgroups. Nature 1. https://doi.org/10.1038/s41586-019-1007-8
Sacher, A.G., Gandhi, L., 2016. Biomarkers for the Clinical Use of PD-1/PD-L1 Inhibitors in Non–Small-Cell Lung Cancer: A Review. JAMA Oncol 2, 1217–1222. https://doi.org/10.1001/jamaoncol.2016.0639

Reference List
256
Sack, L.M., Davoli, T., Li, M.Z., Li, Y., Xu, Q., Naxerova, K., Wooten, E.C., Bernardi, R.J., Martin, T.D., Chen, T., Leng, Y., Liang, A.C., Scorsone, K.A., Westbrook, T.F., Wong, K.-K., Elledge, S.J., 2018. Profound Tissue Specificity in Proliferation Control Underlies Cancer Drivers and Aneuploidy Patterns. Cell 173, 499-514.e23. https://doi.org/10.1016/j.cell.2018.02.037
Sakurada, A., Lara-Guerra, H., Liu, N., Shepherd, F.A., Tsao, M.-S., 2008. Tissue heterogeneity of EGFR mutation in lung adenocarcinoma. J Thorac Oncol 3, 527–529. https://doi.org/10.1097/JTO.0b013e318168be93
Salcedo, A., Tarabichi, M., Espiritu, S.M.G., Deshwar, A.G., David, M., Wilson, N.M., Dentro, S., Wintersinger, J.A., Liu, L.Y., Ko, M., Sivanandan, S., Zhang, H., Zhu, K., Yang, T.-H.O., Chilton, J.M., Buchanan, A., Lalansingh, C.M., P’ng, C., Anghel, C.V., Umar, I., Lo, B., Zou, W., Simpson, J.T., Stuart, J.M., Anastassiou, D., Guan, Y., Ewing, A.D., Ellrott, K., Wedge, D.C., Morris, Q., Loo, P.V., Boutros, P.C., 2020. A community effort to create standards for evaluating tumor subclonal reconstruction. Nat Biotechnol 38, 97–107. https://doi.org/10.1038/s41587-019-0364-z
Samstein, R.M., Lee, C.-H., Shoushtari, A.N., Hellmann, M.D., Shen, R., Janjigian, Y.Y., Barron, D.A., Zehir, A., Jordan, E.J., Omuro, A., Kaley, T.J., Kendall, S.M., Motzer, R.J., Hakimi, A.A., Voss, M.H., Russo, P., Rosenberg, J., Iyer, G., Bochner, B.H., Bajorin, D.F., Al-Ahmadie, H.A., Chaft, J.E., Rudin, C.M., Riely, G.J., Baxi, S., Ho, A.L., Wong, R.J., Pfister, D.G., Wolchok, J.D., Barker, C.A., Gutin, P.H., Brennan, C.W., Tabar, V., Mellinghoff, I.K., DeAngelis, L.M., Ariyan, C.E., Lee, N., Tap, W.D., Gounder, M.M., D’Angelo, S.P., Saltz, L., Stadler, Z.K., Scher, H.I., Baselga, J., Razavi, P., Klebanoff, C.A., Yaeger, R., Segal, N.H., Ku, G.Y., DeMatteo, R.P., Ladanyi, M., Rizvi, N.A., Berger, M.F., Riaz, N., Solit, D.B., Chan, T.A., Morris, L.G.T., 2019. Tumor mutational load predicts survival after immunotherapy across multiple cancer types. Nature Genetics 1. https://doi.org/10.1038/s41588-018-0312-8
Samuels, Y., Wang, Z., Bardelli, A., Silliman, N., Ptak, J., Szabo, S., Yan, H., Gazdar, A., Powell, S.M., Riggins, G.J., Willson, J.K.V., Markowitz, S., Kinzler, K.W., Vogelstein, B., Velculescu, V.E., 2004. High Frequency of Mutations of the PIK3CA Gene in Human Cancers. Science 304, 554–554. https://doi.org/10.1126/science.1096502
Sangha, R., Price, J., Butts, C.A., 2010. Adjuvant Therapy in Non-Small Cell Lung Cancer: Current and Future Directions. The Oncologist 15, 862–872. https://doi.org/10.1634/theoncologist.2009-0186
Sato, E., Olson, S.H., Ahn, J., Bundy, B., Nishikawa, H., Qian, F., Jungbluth, A.A., Frosina, D., Gnjatic, S., Ambrosone, C., Kepner, J., Odunsi, T., Ritter, G., Lele, S., Chen, Y.-T., Ohtani, H., Old, L.J., Odunsi, K., 2005. Intraepithelial CD8+ tumor-infiltrating lymphocytes and a high CD8+/regulatory T cell ratio are associated with favorable prognosis in ovarian cancer. PNAS 102, 18538–18543. https://doi.org/10.1073/pnas.0509182102
Savas, P., Virassamy, B., Ye, C., Salim, A., Mintoff, C.P., Caramia, F., Salgado, R., Byrne, D.J., Teo, Z.L., Dushyanthen, S., Byrne, A., Wein, L., Luen, S.J., Poliness, C., Nightingale, S.S., Skandarajah, A.S., Gyorki, D.E., Thornton, C.M., Beavis, P.A., Fox, S.B., Darcy, P.K., Speed, T.P., Mackay, L.K., Neeson, P.J., Loi, S., 2018. Single-cell profiling of breast cancer T cells reveals a tissue-resident memory subset associated with improved

Reference List
257
prognosis. Nature Medicine 24, 986–993. https://doi.org/10.1038/s41591-018-0078-7
Sawyers, C.L., 2008. The cancer biomarker problem. Nature 452, 548–552. https://doi.org/10.1038/nature06913
Schafer, J.M., Lehmann, B.D., Gonzalez-Ericsson, P.I., Marshall, C.B., Beeler, J.S., Redman, L.N., Jin, H., Sanchez, V., Stubbs, M.C., Scherle, P., Johnson, K.N., Sheng, Q., Roland, J.T., Bauer, J.A., Shyr, Y., Chakravarthy, B., Mobley, B.C., Hiebert, S.W., Balko, J.M., Sanders, M.E., Liu, P.C.C., Pietenpol, J.A., 2020. Targeting MYCN-expressing triple-negative breast cancer with BET and MEK inhibitors. Science Translational Medicine 12. https://doi.org/10.1126/scitranslmed.aaw8275
Schreiber, R.D., Old, L.J., Smyth, M.J., 2011. Cancer immunoediting: integrating immunity’s roles in cancer suppression and promotion. Science 331, 1565–1570. https://doi.org/10.1126/science.1203486
Schumacher, K., Haensch, W., Röefzaad, C., Schlag, P.M., 2001. Prognostic Significance of Activated CD8+ T Cell Infiltrations within Esophageal Carcinomas. Cancer Res 61, 3932–3936.
Schumacher, T.N., Hacohen, N., 2016. Neoantigens encoded in the cancer genome. Current Opinion in Immunology, Vaccines * Special section: Cancer immunology: Genomics & biomarkers 41, 98–103. https://doi.org/10.1016/j.coi.2016.07.005
Schumacher, T.N., Schreiber, R.D., 2015. Neoantigens in cancer immunotherapy. Science 348, 69–74. https://doi.org/10.1126/science.aaa4971
Sensi, M., Nicolini, G., Petti, C., Bersani, I., Lozupone, F., Molla, A., Vegetti, C., Nonaka, D., Mortarini, R., Parmiani, G., Fais, S., Anichini, A., 2006. Mutually exclusive NRAS Q61R and BRAF V600E mutations at the single-cell level in the same human melanoma. Oncogene 25, 3357–3364. https://doi.org/10.1038/sj.onc.1209379
Sethi, T., Rintoul, R.C., Moore, S.M., MacKinnon, A.C., Salter, D., Choo, C., Chilvers, E.R., Dransfield, I., Donnelly, S.C., Strieter, R., Haslett, C., 1999. Extracellular matrix proteins protect small cell lung cancer cells against apoptosis: A mechanism for small cell lung cancer growth and drug resistance in vivo. Nature Medicine 5, 662–668. https://doi.org/10.1038/9511
Shah, S.P., Roth, A., Goya, R., Oloumi, A., Ha, G., Zhao, Y., Turashvili, G., Ding, J., Tse, K., Haffari, G., Bashashati, A., Prentice, L.M., Khattra, J., Burleigh, A., Yap, D., Bernard, V., McPherson, A., Shumansky, K., Crisan, A., Giuliany, R., Heravi-Moussavi, A., Rosner, J., Lai, D., Birol, I., Varhol, R., Tam, A., Dhalla, N., Zeng, T., Ma, K., Chan, S.K., Griffith, M., Moradian, A., Cheng, S.-W.G., Morin, G.B., Watson, P., Gelmon, K., Chia, S., Chin, S.-F., Curtis, C., Rueda, O.M., Pharoah, P.D., Damaraju, S., Mackey, J., Hoon, K., Harkins, T., Tadigotla, V., Sigaroudinia, M., Gascard, P., Tlsty, T., Costello, J.F., Meyer, I.M., Eaves, C.J., Wasserman, W.W., Jones, S., Huntsman, D., Hirst, M., Caldas, C., Marra, M.A., Aparicio, S., 2012. The clonal and mutational evolution spectrum of primary triple-negative breast cancers. Nature 486, 395–399. https://doi.org/10.1038/nature10933
Shankaran, V., Ikeda, H., Bruce, A.T., White, J.M., Swanson, P.E., Old, L.J., Schreiber, R.D., 2001. IFNgamma and lymphocytes prevent primary tumour development and shape tumour immunogenicity. Nature 410, 1107–1111. https://doi.org/10.1038/35074122

Reference List
258
Sharma, P., Hu-Lieskovan, S., Wargo, J.A., Ribas, A., 2017. Primary, Adaptive, and Acquired Resistance to Cancer Immunotherapy. Cell 168, 707–723. https://doi.org/10.1016/j.cell.2017.01.017
Shedden, K., Taylor, J.M.G., Enkemann, S.A., Tsao, M.-S., Yeatman, T.J., Gerald, W.L., Eschrich, S., Jurisica, I., Giordano, T.J., Misek, D.E., Chang, A.C., Zhu, C.Q., Strumpf, D., Hanash, S., Shepherd, F.A., Ding, K., Seymour, L., Naoki, K., Pennell, N., Weir, B., Verhaak, R., Ladd-Acosta, C., Golub, T., Gruidl, M., Sharma, A., Szoke, J., Zakowski, M., Rusch, V., Kris, M., Viale, A., Motoi, N., Travis, W., Conley, B., Seshan, V.E., Meyerson, M., Kuick, R., Dobbin, K.K., Lively, T., Jacobson, J.W., Beer, D.G., 2008. Gene expression–based survival prediction in lung adenocarcinoma: a multi-site, blinded validation study. Nat Med 14, 822–827. https://doi.org/10.1038/nm.1790
Shen-Orr, S.S., Gaujoux, R., 2013. Computational deconvolution: extracting cell type-specific information from heterogeneous samples. Current Opinion in Immunology, Special section: Systems biology and bioinformatics / Immunogenetics and transplantation 25, 571–578. https://doi.org/10.1016/j.coi.2013.09.015
Sherman-Baust, C.A., Weeraratna, A.T., Rangel, L.B.A., Pizer, E.S., Cho, K.R., Schwartz, D.R., Shock, T., Morin, P.J., 2003. Remodeling of the extracellular matrix through overexpression of collagen VI contributes to cisplatin resistance in ovarian cancer cells. Cancer Cell 3, 377–386. https://doi.org/10.1016/S1535-6108(03)00058-8
Shukla, S., Evans, J.R., Malik, R., Feng, F.Y., Dhanasekaran, S.M., Cao, X., Chen, G., Beer, D.G., Jiang, H., Chinnaiyan, A.M., 2017. Development of a RNA-Seq Based Prognostic Signature in Lung Adenocarcinoma. J Natl Cancer Inst 109. https://doi.org/10.1093/jnci/djw200
Sidow, A., Spies, N., 2015. Concepts in solid tumor evolution. Trends in Genetics 31, 208–214. https://doi.org/10.1016/j.tig.2015.02.001
Siegel, R.L., Miller, K.D., Jemal, A., 2019. Cancer statistics, 2019. CA: A Cancer Journal for Clinicians 69, 7–34. https://doi.org/10.3322/caac.21551
Sinha, A., Huang, V., Livingstone, J., Wang, J., Fox, N.S., Kurganovs, N., Ignatchenko, V., Fritsch, K., Donmez, N., Heisler, L.E., Shiah, Y.-J., Yao, C.Q., Alfaro, J.A., Volik, S., Lapuk, A., Fraser, M., Kron, K., Murison, A., Lupien, M., Sahinalp, C., Collins, C.C., Tetu, B., Masoomian, M., Berman, D.M., Kwast, T. van der, Bristow, R.G., Kislinger, T., Boutros, P.C., 2019. The Proteogenomic Landscape of Curable Prostate Cancer. Cancer Cell 35, 414-427.e6. https://doi.org/10.1016/j.ccell.2019.02.005
Sjöblom, T., Jones, S., Wood, L.D., Parsons, D.W., Lin, J., Barber, T.D., Mandelker, D., Leary, R.J., Ptak, J., Silliman, N., Szabo, S., Buckhaults, P., Farrell, C., Meeh, P., Markowitz, S.D., Willis, J., Dawson, D., Willson, J.K.V., Gazdar, A.F., Hartigan, J., Wu, L., Liu, C., Parmigiani, G., Park, B.H., Bachman, K.E., Papadopoulos, N., Vogelstein, B., Kinzler, K.W., Velculescu, V.E., 2006. The Consensus Coding Sequences of Human Breast and Colorectal Cancers. Science 314, 268–274. https://doi.org/10.1126/science.1133427
Slamon, D.J., Leyland-Jones, B., Shak, S., Fuchs, H., Paton, V., Bajamonde, A., Fleming, T., Eiermann, W., Wolter, J., Pegram, M., Baselga, J., Norton, L., 2009. Use of Chemotherapy plus a Monoclonal Antibody against HER2 for

Reference List
259
Metastatic Breast Cancer That Overexpresses HER2. The New England Journal of Medicine. https://doi.org/10.1056/NEJM200103153441101
Smith, M.P., Sanchez-Laorden, B., O’Brien, K., Brunton, H., Ferguson, J., Young, H., Dhomen, N., Flaherty, K.T., Frederick, D.T., Cooper, Z.A., Wargo, J.A., Marais, R., Wellbrock, C., 2014. The Immune Microenvironment Confers Resistance to MAPK Pathway Inhibitors through Macrophage-Derived TNFα. Cancer Discov 4, 1214–1229. https://doi.org/10.1158/2159-8290.CD-13-1007
Smyth, M.J., Ngiow, S.F., Ribas, A., Teng, M.W.L., 2016. Combination cancer immunotherapies tailored to the tumour microenvironment. Nat Rev Clin Oncol 13, 143–158. https://doi.org/10.1038/nrclinonc.2015.209
Snyder, A., Makarov, V., Merghoub, T., Yuan, J., Zaretsky, J.M., Desrichard, A., Walsh, L.A., Postow, M.A., Wong, P., Ho, T.S., Hollmann, T.J., Bruggeman, C., Kannan, K., Li, Y., Elipenahli, C., Liu, C., Harbison, C.T., Wang, L., Ribas, A., Wolchok, J.D., Chan, T.A., 2014. Genetic Basis for Clinical Response to CTLA-4 Blockade in Melanoma. New England Journal of Medicine 371, 2189–2199. https://doi.org/10.1056/NEJMoa1406498
Sottoriva, A., Kang, H., Ma, Z., Graham, T.A., Salomon, M.P., Zhao, J., Marjoram, P., Siegmund, K., Press, M.F., Shibata, D., Curtis, C., 2015. A Big Bang model of human colorectal tumor growth. Nat. Genet. 47, 209–216. https://doi.org/10.1038/ng.3214
Sparano, J.A., Gray, R.J., Makower, D.F., Pritchard, K.I., Albain, K.S., Hayes, D.F., Geyer, C.E., Dees, E.C., Goetz, M.P., Olson, J.A., Lively, T., Badve, S.S., Saphner, T.J., Wagner, L.I., Whelan, T.J., Ellis, M.J., Paik, S., Wood, W.C., Ravdin, P.M., Keane, M.M., Gomez Moreno, H.L., Reddy, P.S., Goggins, T.F., Mayer, I.A., Brufsky, A.M., Toppmeyer, D.L., Kaklamani, V.G., Berenberg, J.L., Abrams, J., Sledge, G.W., 2018. Adjuvant Chemotherapy Guided by a 21-Gene Expression Assay in Breast Cancer. New England Journal of Medicine 0, null. https://doi.org/10.1056/NEJMoa1804710
Sparks, A.B., Morin, P.J., Vogelstein, B., Kinzler, K.W., 1998. Mutational analysis of the APC/beta-catenin/Tcf pathway in colorectal cancer. Cancer Res. 58, 1130–1134.
Ståhl, P.L., Salmén, F., Vickovic, S., Lundmark, A., Navarro, J.F., Magnusson, J., Giacomello, S., Asp, M., Westholm, J.O., Huss, M., Mollbrink, A., Linnarsson, S., Codeluppi, S., Borg, Å., Pontén, F., Costea, P.I., Sahlén, P., Mulder, J., Bergmann, O., Lundeberg, J., Frisén, J., 2016. Visualization and analysis of gene expression in tissue sections by spatial transcriptomics. Science 353, 78–82. https://doi.org/10.1126/science.aaf2403
Stratton, M.R., Campbell, P.J., Futreal, P.A., 2009. The cancer genome. Nature 458, 719–724. https://doi.org/10.1038/nature07943
Strauss, G.M., Herndon, J.E., Maddaus, M.A., Johnstone, D.W., Johnson, E.A., Harpole, D.H., Gillenwater, H.H., Watson, D.M., Sugarbaker, D.J., Schilsky, R.L., Vokes, E.E., Green, M.R., 2008. Adjuvant Paclitaxel Plus Carboplatin Compared With Observation in Stage IB Non–Small-Cell Lung Cancer: CALGB 9633 With the Cancer and Leukemia Group B, Radiation Therapy Oncology Group, and North Central Cancer Treatment Group Study Groups. JCO 26, 5043–5051. https://doi.org/10.1200/JCO.2008.16.4855
Straussman, R., Morikawa, T., Shee, K., Barzily-Rokni, M., Qian, Z.R., Du, J., Davis, A., Mongare, M.M., Gould, J., Frederick, D.T., Cooper, Z.A., Chapman, P.B., Solit, D.B., Ribas, A., Lo, R.S., Flaherty, K.T., Ogino, S.,

Reference List
260
Wargo, J.A., Golub, T.R., 2012. Tumour micro-environment elicits innate resistance to RAF inhibitors through HGF secretion. Nature 487, 500–504. https://doi.org/10.1038/nature11183
Sturm, G., Finotello, F., Petitprez, F., Zhang, J.D., Baumbach, J., Fridman, W.H., List, M., Aneichyk, T., 2019. Comprehensive evaluation of transcriptome-based cell-type quantification methods for immuno-oncology. Bioinformatics 35, i436–i445. https://doi.org/10.1093/bioinformatics/btz363
Subramanian, A., Tamayo, P., Mootha, V.K., Mukherjee, S., Ebert, B.L., Gillette, M.A., Paulovich, A., Pomeroy, S.L., Golub, T.R., Lander, E.S., Mesirov, J.P., 2005. Gene set enrichment analysis: A knowledge-based approach for interpreting genome-wide expression profiles. PNAS 102, 15545–15550. https://doi.org/10.1073/pnas.0506580102
Subramanian, J., Simon, R., 2010a. Gene Expression–Based Prognostic Signatures in Lung Cancer: Ready for Clinical Use? J Natl Cancer Inst 102, 464–474. https://doi.org/10.1093/jnci/djq025
Subramanian, J., Simon, R., 2010b. What should physicians look for in evaluating prognostic gene-expression signatures? Nat Rev Clin Oncol 7, 327–334. https://doi.org/10.1038/nrclinonc.2010.60
Suda, K., 2020. Personalized post-surgical care?—possible strategies for NSCLCs with EGFR mutation. Transl Lung Cancer Res 9, 441–445. https://doi.org/10.21037/tlcr.2020.03.32
Suda, K., Kim, J., Murakami, I., Rozeboom, L., Shimoji, M., Shimizu, S., Rivard, C.J., Mitsudomi, T., Tan, A.-C., Hirsch, F.R., 2018. Innate Genetic Evolution of Lung Cancers and Spatial Heterogeneity: Analysis of Treatment-Naïve Lesions. Journal of Thoracic Oncology 0. https://doi.org/10.1016/j.jtho.2018.05.039
Suda, K., Mitsudomi, T., 2020. Inter-tumor heterogeneity of PD-L1 status: is it important in clinical decision making? J Thorac Dis 12, 1770–1775. https://doi.org/10.21037/jtd-20-1661
Sun, Y., Campisi, J., Higano, C., Beer, T.M., Porter, P., Coleman, I., True, L., Nelson, P.S., 2012. Treatment-induced damage to the tumor microenvironment promotes prostate cancer therapy resistance through WNT16B. Nat Med 18, 1359–1368. https://doi.org/10.1038/nm.2890
Sun, Z., Wigle, D.A., Yang, P., 2008. Non-Overlapping and Non–Cell-Type–Specific Gene Expression Signatures Predict Lung Cancer Survival. JCO 26, 877–883. https://doi.org/10.1200/JCO.2007.13.1516
Svensson, V., Teichmann, S.A., Stegle, O., 2018. SpatialDE: identification of spatially variable genes. Nature Methods. https://doi.org/10.1038/nmeth.4636
Swanton, C., 2012. Intratumor Heterogeneity: Evolution through Space and Time. Cancer Res 72, 4875–4882. https://doi.org/10.1158/0008-5472.CAN-12-2217
Szczurek, E., Beerenwinkel, N., 2014. Modeling Mutual Exclusivity of Cancer Mutations. PLOS Computational Biology 10, e1003503. https://doi.org/10.1371/journal.pcbi.1003503
Tabin, C.J., Bradley, S.M., Bargmann, C.I., Weinberg, R.A., Papageorge, A.G., Scolnick, E.M., Dhar, R., Lowy, D.R., Chang, E.H., 1982. Mechanism of activation of a human oncogene. Nature 300, 143–149. https://doi.org/10.1038/300143a0

Reference List
261
Takeuchi, T., Tomida, S., Yatabe, Y., Kosaka, T., Osada, H., Yanagisawa, K., Mitsudomi, T., Takahashi, T., 2006. Expression Profile–Defined Classification of Lung Adenocarcinoma Shows Close Relationship With Underlying Major Genetic Changes and Clinicopathologic Behaviors. JCO 24, 1679–1688. https://doi.org/10.1200/JCO.2005.03.8224
Tang, H., Wang, S., Xiao, G., Schiller, J., Papadimitrakopoulou, V., Minna, J., Wistuba, I.I., Xie, Y., 2017. Comprehensive evaluation of published gene expression prognostic signatures for biomarker-based lung cancer clinical studies. Ann Oncol 28, 733–740. https://doi.org/10.1093/annonc/mdw683
Tang, H., Xiao, G., Behrens, C., Schiller, J., Allen, J., Chow, C.-W., Suraokar, M., Corvalan, A., Mao, J., White, M.A., Wistuba, I.I., Minna, J.D., Xie, Y., 2013. A 12-Gene Set Predicts Survival Benefits from Adjuvant Chemotherapy in Non–Small Cell Lung Cancer Patients. Clin Cancer Res 19, 1577–1586. https://doi.org/10.1158/1078-0432.CCR-12-2321
Tannock, I.F., Hickman, J.A., 2016. Limits to Personalized Cancer Medicine. New England Journal of Medicine 375, 1289–1294. https://doi.org/10.1056/NEJMsb1607705
Taube, J.M., Anders, R.A., Young, G.D., Xu, H., Sharma, R., McMiller, T.L., Chen, S., Klein, A.P., Pardoll, D.M., Topalian, S.L., Chen, L., 2012. Colocalization of inflammatory response with B7-h1 expression in human melanocytic lesions supports an adaptive resistance mechanism of immune escape. Sci Transl Med 4, 127ra37. https://doi.org/10.1126/scitranslmed.3003689
Teng, M.W.L., Ngiow, S.F., Ribas, A., Smyth, M.J., 2015. Classifying Cancers Based on T-cell Infiltration and PD-L1. Cancer Res 75, 2139–2145. https://doi.org/10.1158/0008-5472.CAN-15-0255
The Cancer Genome Atlas Network, 2012. Comprehensive molecular characterization of human colon and rectal cancer. Nature 487, 330–337. https://doi.org/10.1038/nature11252
The Cancer Genome Atlas Research Network, 2017. Integrated genomic characterization of oesophageal carcinoma. Nature 541, 169–175. https://doi.org/10.1038/nature20805
The Cancer Genome Atlas Research Network, 2014. Comprehensive molecular profiling of lung adenocarcinoma. Nature 511, 543–550. https://doi.org/10.1038/nature13385
The Cancer Genome Atlas Research Network, 2012. Comprehensive genomic characterization of squamous cell lung cancers. Nature 489, 519–525. https://doi.org/10.1038/nature11404
The Cancer Genome Atlas Research Network, 2011. Integrated genomic analyses of ovarian carcinoma. Nature 474, 609–615. https://doi.org/10.1038/nature10166
The ICGC/TCGA Pan-Cancer Analysis of Whole Genomes Consortium, 2020. Pan-cancer analysis of whole genomes. Nature 578, 82–93. https://doi.org/10.1038/s41586-020-1969-6
The International Cancer Genome Consortium, 2010. International network of cancer genome projects. Nature 464, 993–998. https://doi.org/10.1038/nature08987
Thomas, L., 1982. On immunosurveillance in human cancer. Yale J Biol Med 55, 329–333.
Thommen, D.S., Koelzer, V.H., Herzig, P., Roller, A., Trefny, M., Dimeloe, S., Kiialainen, A., Hanhart, J., Schill, C., Hess, C., Prince, S.S., Wiese, M.,

Reference List
262
Lardinois, D., Ho, P.-C., Klein, C., Karanikas, V., Mertz, K.D., Schumacher, T.N., Zippelius, A., 2018. A transcriptionally and functionally distinct PD-1 + CD8 + T cell pool with predictive potential in non-small-cell lung cancer treated with PD-1 blockade. Nature Medicine 1. https://doi.org/10.1038/s41591-018-0057-z
Tirosh, I., Izar, B., Prakadan, S.M., Wadsworth, M.H., Treacy, D., Trombetta, J.J., Rotem, A., Rodman, C., Lian, C., Murphy, G., Fallahi-Sichani, M., Dutton-Regester, K., Lin, J.-R., Cohen, O., Shah, P., Lu, D., Genshaft, A.S., Hughes, T.K., Ziegler, C.G.K., Kazer, S.W., Gaillard, A., Kolb, K.E., Villani, A.-C., Johannessen, C.M., Andreev, A.Y., Van Allen, E.M., Bertagnolli, M., Sorger, P.K., Sullivan, R.J., Flaherty, K.T., Frederick, D.T., Jané-Valbuena, J., Yoon, C.H., Rozenblatt-Rosen, O., Shalek, A.K., Regev, A., Garraway, L.A., 2016. Dissecting the multicellular ecosystem of metastatic melanoma by single-cell RNA-seq. Science 352, 189–196. https://doi.org/10.1126/science.aad0501
Tofigh, A., Suderman, M., Paquet, E.R., Livingstone, J., Bertos, N., Saleh, S.M., Zhao, H., Souleimanova, M., Cory, S., Lesurf, R., Shahalizadeh, S., Garcia Lopez, N., Riazalhosseini, Y., Omeroglu, A., Ursini-Siegel, J., Park, M., Dumeaux, V., Hallett, M., 2014. The Prognostic Ease and Difficulty of Invasive Breast Carcinoma. Cell Reports 9, 129–142. https://doi.org/10.1016/j.celrep.2014.08.073
Tonon, G., Wong, K.-K., Maulik, G., Brennan, C., Feng, B., Zhang, Y., Khatry, D.B., Protopopov, A., You, M.J., Aguirre, A.J., Martin, E.S., Yang, Z., Ji, H., Chin, L., DePinho, R.A., 2005. High-resolution genomic profiles of human lung cancer. PNAS 102, 9625–9630. https://doi.org/10.1073/pnas.0504126102
Topalian, S.L., Hodi, F.S., Brahmer, J.R., Gettinger, S.N., Smith, D.C., McDermott, D.F., Powderly, J.D., Carvajal, R.D., Sosman, J.A., Atkins, M.B., Leming, P.D., Spigel, D.R., Antonia, S.J., Horn, L., Drake, C.G., Pardoll, D.M., Chen, L., Sharfman, W.H., Anders, R.A., Taube, J.M., McMiller, T.L., Xu, H., Korman, A.J., Jure-Kunkel, M., Agrawal, S., McDonald, D., Kollia, G.D., Gupta, A., Wigginton, J.M., Sznol, M., 2012. Safety, Activity, and Immune Correlates of Anti–PD-1 Antibody in Cancer. New England Journal of Medicine 366, 2443–2454. https://doi.org/10.1056/NEJMoa1200690
Topalian, S.L., Hom, S.S., Kawakami, Y., Mancini, M., Schwartzentruber, D.J., Zakut, R., Rosenberg, S.A., 1992. Recognition of shared melanoma antigens by human tumor-infiltrating lymphocytes. J. Immunother. 12, 203–206.
Topalian, S.L., Taube, J.M., Anders, R.A., Pardoll, D.M., 2016. Mechanism-driven biomarkers to guide immune checkpoint blockade in cancer therapy. Nature Reviews Cancer 16, 275. https://doi.org/10.1038/nrc.2016.36
Torre-Amione, G., Beauchamp, R.D., Koeppen, H., Park, B.H., Schreiber, H., Moses, H.L., Rowley, D.A., 1990. A highly immunogenic tumor transfected with a murine transforming growth factor type beta 1 cDNA escapes immune surveillance. PNAS 87, 1486–1490. https://doi.org/10.1073/pnas.87.4.1486
Turajlic, S., Xu, H., Litchfield, K., Rowan, A., Horswell, S., Chambers, T., O’Brien, T., Lopez, J.I., Watkins, T.B.K., Nicol, D., Stares, M., Challacombe, B., Hazell, S., Chandra, A., Mitchell, T.J., Au, L., Eichler-Jonsson, C., Jabbar, F., Soultati, A., Chowdhury, S., Rudman, S., Lynch, J., Fernando, A., Stamp, G., Nye, E., Stewart, A., Xing, W., Smith, J.C., Escudero, M., Huffman, A., Matthews, N., Elgar, G., Phillimore, B., Costa, M., Begum, S.,

Reference List
263
Ward, S., Salm, M., Boeing, S., Fisher, R., Spain, L., Navas, C., Grönroos, E., Hobor, S., Sharma, S., Aurangzeb, I., Lall, S., Polson, A., Varia, M., Horsfield, C., Fotiadis, N., Pickering, L., Schwarz, R.F., Silva, B., Herrero, J., Luscombe, N.M., Jamal-Hanjani, M., Rosenthal, R., Birkbak, N.J., Wilson, G.A., Pipek, O., Ribli, D., Krzystanek, M., Csabai, I., Szallasi, Z., Gore, M., McGranahan, N., Loo, P.V., Campbell, P., Larkin, J., Swanton, C., 2018. Deterministic Evolutionary Trajectories Influence Primary Tumor Growth: TRACERx Renal. Cell 173, 595-610.e11. https://doi.org/10.1016/j.cell.2018.03.043
Turke, A.B., Zejnullahu, K., Wu, Y.-L., Song, Y., Dias-Santagata, D., Lifshits, E., Toschi, L., Rogers, A., Mok, T., Sequist, L., Lindeman, N.I., Murphy, C., Akhavanfard, S., Yeap, B.Y., Xiao, Y., Capelletti, M., Iafrate, A.J., Lee, C., Christensen, J.G., Engelman, J.A., Jänne, P.A., 2010. Preexistence and Clonal Selection of MET Amplification in EGFR Mutant NSCLC. Cancer Cell 17, 77–88. https://doi.org/10.1016/j.ccr.2009.11.022
Tutt, A., Robson, M., Garber, J.E., Domchek, S.M., Audeh, M.W., Weitzel, J.N., Friedlander, M., Arun, B., Loman, N., Schmutzler, R.K., Wardley, A., Mitchell, G., Earl, H., Wickens, M., Carmichael, J., 2010. Oral poly(ADP-ribose) polymerase inhibitor olaparib in patients with BRCA1 or BRCA2 mutations and advanced breast cancer: a proof-of-concept trial. Lancet 376, 235–244. https://doi.org/10.1016/S0140-6736(10)60892-6
Uhlen, M., Karlsson, M.J., Zhong, W., Tebani, A., Pou, C., Mikes, J., Lakshmikanth, T., Forsström, B., Edfors, F., Odeberg, J., Mardinoglu, A., Zhang, C., Feilitzen, K. von, Mulder, J., Sjöstedt, E., Hober, A., Oksvold, P., Zwahlen, M., Ponten, F., Lindskog, C., Sivertsson, Å., Fagerberg, L., Brodin, P., 2019. A genome-wide transcriptomic analysis of protein-coding genes in human blood cells. Science 366. https://doi.org/10.1126/science.aax9198
Uhlen, M., Zhang, C., Lee, S., Sjöstedt, E., Fagerberg, L., Bidkhori, G., Benfeitas, R., Arif, M., Liu, Z., Edfors, F., Sanli, K., Feilitzen, K. von, Oksvold, P., Lundberg, E., Hober, S., Nilsson, P., Mattsson, J., Schwenk, J.M., Brunnström, H., Glimelius, B., Sjöblom, T., Edqvist, P.-H., Djureinovic, D., Micke, P., Lindskog, C., Mardinoglu, A., Ponten, F., 2017. A pathology atlas of the human cancer transcriptome. Science 357, eaan2507. https://doi.org/10.1126/science.aan2507
van der Bruggen, P., Traversari, C., Chomez, P., Lurquin, C., Plaen, E.D., Eynde, B.V. den, Knuth, A., Boon, T., 1991. A gene encoding an antigen recognized by cytolytic T lymphocytes on a human melanoma. Science 254, 1643–1647. https://doi.org/10.1126/science.1840703
van ’t Veer, L.J., Dai, H., Vijver, M.J. van de, He, Y.D., Hart, A.A.M., Mao, M., Peterse, H.L., Kooy, K. van der, Marton, M.J., Witteveen, A.T., Schreiber, G.J., Kerkhoven, R.M., Roberts, C., Linsley, P.S., Bernards, R., Friend, S.H., 2002. Gene expression profiling predicts clinical outcome of breast cancer. Nature 415, 530. https://doi.org/10.1038/415530a
Vandin, F., Upfal, E., Raphael, B.J., 2012. De novo discovery of mutated driver pathways in cancer. Genome Res. 22, 375–385. https://doi.org/10.1101/gr.120477.111
van’t Veer, L.J., Bernards, R., 2008. Enabling personalized cancer medicine through analysis of gene-expression patterns. Nature 452, 564–570. https://doi.org/10.1038/nature06915

Reference List
264
Varela, I., Tarpey, P., Raine, K., Huang, D., Ong, C.K., Stephens, P., Davies, H., Jones, D., Lin, M.-L., Teague, J., Bignell, G., Butler, A., Cho, J., Dalgliesh, G.L., Galappaththige, D., Greenman, C., Hardy, C., Jia, M., Latimer, C., Lau, K.W., Marshall, J., McLaren, S., Menzies, A., Mudie, L., Stebbings, L., Largaespada, D.A., Wessels, L.F.A., Richard, S., Kahnoski, R.J., Anema, J., A.Tuveson, D., Perez-Mancera, P.A., Mustonen, V., Fischer, A., Adams, D.J., Rust, A., Chan-on, W., Subimerb, C., Dykema, K., Furge, K., Campbell, P.J., Teh, B.T., Stratton, M.R., Futreal, P.A., 2011. Exome sequencing identifies frequent mutation of the SWI/SNF complex gene PBRM1 in renal carcinoma. Nature 469, 539–542. https://doi.org/10.1038/nature09639
Vargas, A.J., Harris, C.C., 2016. Biomarker development in the precision medicine era: lung cancer as a case study. Nat Rev Cancer 16, 525–537. https://doi.org/10.1038/nrc.2016.56
Vasaikar, S., Huang, C., Wang, X., Petyuk, V.A., Savage, S.R., Wen, B., Dou, Y., Zhang, Y., Shi, Z., Arshad, O.A., Gritsenko, M.A., Zimmerman, L.J., McDermott, J.E., Clauss, T.R., Moore, R.J., Zhao, R., Monroe, M.E., Wang, Y.-T., Chambers, M.C., Slebos, Robbert J. C., Lau, K.S., Mo, Q., Ding, L., Ellis, M., Thiagarajan, M., Kinsinger, C.R., Rodriguez, H., Smith, R.D., Rodland, K.D., Liebler, D.C., Liu, T., Zhang, B., Ellis, M.J.C., Shi, Z., Zhang, B., Bavarva, J., Borucki, M., Elburn, K., Hannick, L., Thiagarajan, M., Vatanian, N., Payne, S.H., Carr, S.A., Clauser, K.R., Gillette, M.A., Kuhn, E., Mani, D.R., Cai, S., Ketchum, K.A., Thangudu, R.R., Whiteley, G.A., Paulovich, A., Whiteaker, J., Edward, N.J., Madhavan, S., McGarvey, P.B., Chan, D.W., Shih, I.-M., Zhang, H., Zhang, Z., Zhu, H., Skates, S.J., White, F.M., Mertins, P., Pandey, A., Slebos, Robert J. C., Boja, E., Hiltke, T., Kinsinger, C.R., Mesri, M., Rivers, R.C., Rodriguez, H., Stein, S.E., Fenyo, D., Ruggles, K., Levine, D.A., Oberti, M., Liu, T., McDermott, J.E., Rodland, K.D., Smith, R.D., Zimmerman, L.J., Rudnick, P.A., Snyder, M., Tabb, D.L., Zhao, Y., Chen, X., Ransohoff, D.F., Hoofnagle, A., Liebler, D.C., Sanders, M.E., Wang, Y., Davies, S.R., Ding, L., Townsend, R.R., Watson, M., 2019. Proteogenomic Analysis of Human Colon Cancer Reveals New Therapeutic Opportunities. Cell 0. https://doi.org/10.1016/j.cell.2019.03.030
Venet, D., Dumont, J.E., Detours, V., 2011. Most Random Gene Expression Signatures Are Significantly Associated with Breast Cancer Outcome. PLOS Computational Biology 7, e1002240. https://doi.org/10.1371/journal.pcbi.1002240
Venter, J.C., Adams, M.D., Myers, E.W., Li, P.W., Mural, R.J., Sutton, G.G., Smith, H.O., Yandell, M., Evans, C.A., Holt, R.A., Gocayne, J.D., Amanatides, P., Ballew, R.M., Huson, D.H., Wortman, J.R., Zhang, Q., Kodira, C.D., Zheng, X.H., Chen, L., Skupski, M., Subramanian, G., Thomas, P.D., Zhang, J., Miklos, G.L.G., Nelson, C., Broder, S., Clark, A.G., Nadeau, J., McKusick, V.A., Zinder, N., Levine, A.J., Roberts, R.J., Simon, M., Slayman, C., Hunkapiller, M., Bolanos, R., Delcher, A., Dew, I., Fasulo, D., Flanigan, M., Florea, L., Halpern, A., Hannenhalli, S., Kravitz, S., Levy, S., Mobarry, C., Reinert, K., Remington, K., Abu-Threideh, J., Beasley, E., Biddick, K., Bonazzi, V., Brandon, R., Cargill, M., Chandramouliswaran, I., Charlab, R., Chaturvedi, K., Deng, Z., Francesco, V.D., Dunn, P., Eilbeck, K., Evangelista, C., Gabrielian, A.E., Gan, W., Ge, W., Gong, F., Gu, Z., Guan, P., Heiman, T.J., Higgins, M.E., Ji, R.-R., Ke, Z., Ketchum, K.A., Lai, Z., Lei,

Reference List
265
Y., Li, Z., Li, J., Liang, Y., Lin, X., Lu, F., Merkulov, G.V., Milshina, N., Moore, H.M., Naik, A.K., Narayan, V.A., Neelam, B., Nusskern, D., Rusch, D.B., Salzberg, S., Shao, W., Shue, B., Sun, J., Wang, Z.Y., Wang, A., Wang, X., Wang, J., Wei, M.-H., Wides, R., Xiao, C., Yan, C., Yao, A., Ye, J., Zhan, M., Zhang, W., Zhang, H., Zhao, Q., Zheng, L., Zhong, F., Zhong, W., Zhu, S.C., Zhao, S., Gilbert, D., Baumhueter, S., Spier, G., Carter, C., Cravchik, A., Woodage, T., Ali, F., An, H., Awe, A., Baldwin, D., Baden, H., Barnstead, M., Barrow, I., Beeson, K., Busam, D., Carver, A., Center, A., Cheng, M.L., Curry, L., Danaher, S., Davenport, L., Desilets, R., Dietz, S., Dodson, K., Doup, L., Ferriera, S., Garg, N., Gluecksmann, A., Hart, B., Haynes, J., Haynes, C., Heiner, C., Hladun, S., Hostin, D., Houck, J., Howland, T., Ibegwam, C., Johnson, J., Kalush, F., Kline, L., Koduru, S., Love, A., Mann, F., May, D., McCawley, S., McIntosh, T., McMullen, I., Moy, M., Moy, L., Murphy, B., Nelson, K., Pfannkoch, C., Pratts, E., Puri, V., Qureshi, H., Reardon, M., Rodriguez, R., Rogers, Y.-H., Romblad, D., Ruhfel, B., Scott, R., Sitter, C., Smallwood, M., Stewart, E., Strong, R., Suh, E., Thomas, R., Tint, N.N., Tse, S., Vech, C., Wang, G., Wetter, J., Williams, S., Williams, M., Windsor, S., Winn-Deen, E., Wolfe, K., Zaveri, J., Zaveri, K., Abril, J.F., Guigó, R., Campbell, M.J., Sjolander, K.V., Karlak, B., Kejariwal, A., Mi, H., Lazareva, B., Hatton, T., Narechania, A., Diemer, K., Muruganujan, A., Guo, N., Sato, S., Bafna, V., Istrail, S., Lippert, R., Schwartz, R., Walenz, B., Yooseph, S., Allen, D., Basu, A., Baxendale, J., Blick, L., Caminha, M., Carnes-Stine, J., Caulk, P., Chiang, Y.-H., Coyne, M., Dahlke, C., Mays, A.D., Dombroski, M., Donnelly, M., Ely, D., Esparham, S., Fosler, C., Gire, H., Glanowski, S., Glasser, K., Glodek, A., Gorokhov, M., Graham, K., Gropman, B., Harris, M., Heil, J., Henderson, S., Hoover, J., Jennings, D., Jordan, C., Jordan, J., Kasha, J., Kagan, L., Kraft, C., Levitsky, A., Lewis, M., Liu, X., Lopez, J., Ma, D., Majoros, W., McDaniel, J., Murphy, S., Newman, M., Nguyen, T., Nguyen, N., Nodell, M., Pan, S., Peck, J., Peterson, M., Rowe, W., Sanders, R., Scott, J., Simpson, M., Smith, T., Sprague, A., Stockwell, T., Turner, R., Venter, E., Wang, M., Wen, M., Wu, D., Wu, M., Xia, A., Zandieh, A., Zhu, X., 2001. The Sequence of the Human Genome. Science 291, 1304–1351. https://doi.org/10.1126/science.1058040
Verdegaal, E.M.E., de Miranda, N.F.C.C., Visser, M., Harryvan, T., van Buuren, M.M., Andersen, R.S., Hadrup, S.R., van der Minne, C.E., Schotte, R., Spits, H., Haanen, J.B.A.G., Kapiteijn, E.H.W., Schumacher, T.N., van der Burg, S.H., 2016. Neoantigen landscape dynamics during human melanoma-T cell interactions. Nature 536, 91–95. https://doi.org/10.1038/nature18945
Vogelstein, B., Fearon, E.R., Hamilton, S.R., Kern, S.E., Preisinger, A.C., Leppert, M., Smits, A.M.M., Bos, J.L., 1988. Genetic Alterations during Colorectal-Tumor Development. New England Journal of Medicine 319, 525–532. https://doi.org/10.1056/NEJM198809013190901
Vogelstein, B., Kinzler, K.W., 2004. Cancer genes and the pathways they control. Nat Med 10, 789–799. https://doi.org/10.1038/nm1087
von Hansemann, D., 1890. Ueber asymmetrische Zelltheilung in epithel Krebsen und deren biologische Bedeutung. Virchow’s Arch. Path. Anat.

Reference List
266
Wan, Y.-W., Allen, G.I., Liu, Z., 2016. TCGA2STAT: simple TCGA data access for integrated statistical analysis in R. Bioinformatics 32, 952–954. https://doi.org/10.1093/bioinformatics/btv677
Wang, F., Zhang, S., Kim, T.-B., Lin, Y., Iqbal, R., Wang, Z., Mohanty, V., Sircar, K., Karam, J.A., Wendl, M.C., Meric-Bernstam, F., Weinstein, J.N., Ding, L., Mills, G.B., Chen, K., 2019. Integrated transcriptomic–genomic tool Texomer profiles cancer tissues. Nature Methods 16, 401–404. https://doi.org/10.1038/s41592-019-0388-9
Wang, K., Li, M., Hakonarson, H., 2010. ANNOVAR: functional annotation of genetic variants from high-throughput sequencing data. Nucleic Acids Res 38, e164–e164. https://doi.org/10.1093/nar/gkq603
Wang, W., Li, Q., Yamada, T., Matsumoto, K., Matsumoto, I., Oda, M., Watanabe, G., Kayano, Y., Nishioka, Y., Sone, S., Yano, S., 2009. Crosstalk to Stromal Fibroblasts Induces Resistance of Lung Cancer to Epidermal Growth Factor Receptor Tyrosine Kinase Inhibitors. Clin Cancer Res 15, 6630–6638. https://doi.org/10.1158/1078-0432.CCR-09-1001
Wang, X., Allen, W.E., Wright, M.A., Sylwestrak, E.L., Samusik, N., Vesuna, S., Evans, K., Liu, C., Ramakrishnan, C., Liu, J., Nolan, G.P., Bava, F.-A., Deisseroth, K., 2018. Three-dimensional intact-tissue sequencing of single-cell transcriptional states. Science eaat5691. https://doi.org/10.1126/science.aat5691
Wang, Z., Gerstein, M., Snyder, M., 2009. RNA-Seq: a revolutionary tool for transcriptomics. Nat Rev Genet 10, 57–63. https://doi.org/10.1038/nrg2484
Wigle, D.A., Jurisica, I., Radulovich, N., Pintilie, M., Rossant, J., Liu, N., Lu, C., Woodgett, J., Seiden, I., Johnston, M., Keshavjee, S., Darling, G., Winton, T., Breitkreutz, B.-J., Jorgenson, P., Tyers, M., Shepherd, F.A., Tsao, M.S., 2002. Molecular Profiling of Non-Small Cell Lung Cancer and Correlation with Disease-free Survival. Cancer Res 62, 3005–3008.
Williams, M.J., Werner, B., Barnes, C.P., Graham, T.A., Sottoriva, A., 2016. Identification of neutral tumor evolution across cancer types. Nat. Genet. 48, 238–244. https://doi.org/10.1038/ng.3489
Wilson, T.R., Fridlyand, J., Yan, Y., Penuel, E., Burton, L., Chan, E., Peng, J., Lin, E., Wang, Y., Sosman, J., Ribas, A., Li, J., Moffat, J., Sutherlin, D.P., Koeppen, H., Merchant, M., Neve, R., Settleman, J., 2012. Widespread potential for growth-factor-driven resistance to anticancer kinase inhibitors. Nature 487, 505–509. https://doi.org/10.1038/nature11249
Wistuba, I.I., Behrens, C., Lombardi, F., Wagner, S., Fujimoto, J., Raso, M.G., Spaggiari, L., Galetta, D., Riley, R., Hughes, E., Reid, J., Sangale, Z., Swisher, S.G., Kalhor, N., Moran, C.A., Gutin, A., Lanchbury, J.S., Barberis, M., Kim, E.S., 2013. Validation of a Proliferation-Based Expression Signature as Prognostic Marker in Early Stage Lung Adenocarcinoma. Clin Cancer Res. https://doi.org/10.1158/1078-0432.CCR-13-0596
Wood, L.D., Parsons, D.W., Jones, S., Lin, J., Sjöblom, T., Leary, R.J., Shen, D., Boca, S.M., Barber, T., Ptak, J., Silliman, N., Szabo, S., Dezso, Z., Ustyanksky, V., Nikolskaya, T., Nikolsky, Y., Karchin, R., Wilson, P.A., Kaminker, J.S., Zhang, Z., Croshaw, R., Willis, J., Dawson, D., Shipitsin, M., Willson, J.K.V., Sukumar, S., Polyak, K., Park, B.H., Pethiyagoda, C.L., Pant, P.V.K., Ballinger, D.G., Sparks, A.B., Hartigan, J., Smith, D.R., Suh, E., Papadopoulos, N., Buckhaults, P., Markowitz, S.D., Parmigiani, G., Kinzler, K.W., Velculescu, V.E., Vogelstein, B., 2007. The Genomic

Reference List
267
Landscapes of Human Breast and Colorectal Cancers. Science 318, 1108–1113. https://doi.org/10.1126/science.1145720
Woodard, G.A., Wang, S.X., Kratz, J.R., Zoon-Besselink, C.T., Chiang, C.-Y., Gubens, M.A., Jahan, T.M., Blakely, C.M., Jones, K.D., Mann, M.J., Jablons, D.M., 2018. Adjuvant Chemotherapy Guided by Molecular Profiling and Improved Outcomes in Early Stage, Non–Small-Cell Lung Cancer. Clinical Lung Cancer 19, 58–64. https://doi.org/10.1016/j.cllc.2017.05.015
Wu, Y., Kyle-Cezar, F., Woolf, R.T., Naceur-Lombardelli, C., Owen, J., Biswas, D., Lorenc, A., Vantourout, P., Gazinska, P., Grigoriadis, A., Tutt, A., Hayday, A., 2019. An innate-like Vδ1+ γδ T cell compartment in the human breast is associated with remission in triple-negative breast cancer. Science Translational Medicine 11, eaax9364. https://doi.org/10.1126/scitranslmed.aax9364
Yachida, S., Jones, S., Bozic, I., Antal, T., Leary, R., Fu, B., Kamiyama, M., Hruban, R.H., Eshleman, J.R., Nowak, M.A., Velculescu, V.E., Kinzler, K.W., Vogelstein, B., Iacobuzio-Donahue, C.A., 2010. Distant metastasis occurs late during the genetic evolution of pancreatic cancer. Nature 467, 1114–1117. https://doi.org/10.1038/nature09515
Yap, T.A., Gerlinger, M., Futreal, P.A., Pusztai, L., Swanton, C., 2012. Intratumor Heterogeneity: Seeing the Wood for the Trees. Science Translational Medicine 4, 127ps10-127ps10. https://doi.org/10.1126/scitranslmed.3003854
Yates, L.R., Gerstung, M., Knappskog, S., Desmedt, C., Gundem, G., Van Loo, P., Aas, T., Alexandrov, L.B., Larsimont, D., Davies, H., Li, Y., Ju, Y.S., Ramakrishna, M., Haugland, H.K., Lilleng, P.K., Nik-Zainal, S., McLaren, S., Butler, A., Martin, S., Glodzik, D., Menzies, A., Raine, K., Hinton, J., Jones, D., Mudie, L.J., Jiang, B., Vincent, D., Greene-Colozzi, A., Adnet, P.-Y., Fatima, A., Maetens, M., Ignatiadis, M., Stratton, M.R., Sotiriou, C., Richardson, A.L., Lønning, P.E., Wedge, D.C., Campbell, P.J., 2015. Subclonal diversification of primary breast cancer revealed by multiregion sequencing. Nat Med 21, 751–759. https://doi.org/10.1038/nm.3886
Yeang, C.-H., McCormick, F., Levine, A., 2008. Combinatorial patterns of somatic gene mutations in cancer. FASEB J 22, 2605–2622. https://doi.org/10.1096/fj.08-108985
Yeh, P., Hunter, T., Sinha, D., Ftouni, S., Wallach, E., Jiang, D., Chan, Y.-C., Wong, S.Q., Silva, M.J., Vedururu, R., Doig, K., Lam, E., Arnau, G.M., Semple, T., Wall, M., Zivanovic, A., Agarwal, R., Petrone, P., Jones, K., Westerman, D., Blombery, P., Seymour, J.F., Papenfuss, A.T., Dawson, M.A., Tam, C.S., Dawson, S.-J., 2017. Circulating tumour DNA reflects treatment response and clonal evolution in chronic lymphocytic leukaemia. Nature Communications 8, 14756. https://doi.org/10.1038/ncomms14756
Yoshihara, K., Shahmoradgoli, M., Martínez, E., Vegesna, R., Kim, H., Torres-Garcia, W., Treviño, V., Shen, H., Laird, P.W., Levine, D.A., Carter, S.L., Getz, G., Stemke-Hale, K., Mills, G.B., Verhaak, R.G.W., 2013. Inferring tumour purity and stromal and immune cell admixture from expression data. Nature Communications 4, ncomms3612. https://doi.org/10.1038/ncomms3612
Yu, G., He, Q.-Y., 2016. ReactomePA: an R/Bioconductor package for reactome pathway analysis and visualization. Mol. BioSyst. 12, 477–479. https://doi.org/10.1039/C5MB00663E

Reference List
268
Zahir, N., Sun, R., Gallahan, D., Gatenby, R.A., Curtis, C., 2020. Characterizing the ecological and evolutionary dynamics of cancer. Nature Genetics 52, 759–767. https://doi.org/10.1038/s41588-020-0668-4
Zaromytidou, A.-I., 2020. Shaping the future of cancer research at NCI. Nat Cancer 1, 7–11. https://doi.org/10.1038/s43018-019-0017-7
Zhang, A.W., McPherson, A., Milne, K., Kroeger, D.R., Hamilton, P.T., Miranda, A., Funnell, T., Little, N., Souza, C.P.E. de, Laan, S., LeDoux, S., Cochrane, D.R., Lim, J.L.P., Yang, W., Roth, A., Smith, M.A., Ho, J., Tse, K., Zeng, T., Shlafman, I., Mayo, M.R., Moore, R., Failmezger, H., Heindl, A., Wang, Y.K., Bashashati, A., Grewal, D.S., Brown, S.D., Lai, D., Wan, A.N.C., Nielsen, C.B., Huebner, C., Tessier-Cloutier, B., Anglesio, M.S., Bouchard-Côté, A., Yuan, Y., Wasserman, W.W., Gilks, C.B., Karnezis, A.N., Aparicio, S., McAlpine, J.N., Huntsman, D.G., Holt, R.A., Nelson, B.H., Shah, S.P., 2018. Interfaces of Malignant and Immunologic Clonal Dynamics in Ovarian Cancer. Cell 0. https://doi.org/10.1016/j.cell.2018.03.073
Zhang, L., Conejo-Garcia, J.R., Katsaros, D., Gimotty, P.A., Massobrio, M., Regnani, G., Makrigiannakis, A., Gray, H., Schlienger, K., Liebman, M.N., Rubin, S.C., Coukos, G., 2003. Intratumoral T cells, recurrence, and survival in epithelial ovarian cancer. N. Engl. J. Med. 348, 203–213. https://doi.org/10.1056/NEJMoa020177
Zhang, Y., Chen, L., 2016. Classification of Advanced Human Cancers Based on Tumor Immunity in the MicroEnvironment (TIME) for Cancer Immunotherapy. JAMA Oncol 2, 1403–1404. https://doi.org/10.1001/jamaoncol.2016.2450
Zhao, J., Chen, A.X., Gartrell, R.D., Silverman, A.M., Aparicio, L., Chu, T., Bordbar, D., Shan, D., Samanamud, J., Mahajan, A., Filip, I., Orenbuch, R., Goetz, M., Yamaguchi, J.T., Cloney, M., Horbinski, C., Lukas, R.V., Raizer, J., Rae, A.I., Yuan, J., Canoll, P., Bruce, J.N., Saenger, Y.M., Sims, P., Iwamoto, F.M., Sonabend, A.M., Rabadan, R., 2019. Immune and genomic correlates of response to anti-PD-1 immunotherapy in glioblastoma. Nature Medicine 25, 462–469. https://doi.org/10.1038/s41591-019-0349-y
Zhao, J., Zhang, S., Wu, L.-Y., Zhang, X.-S., 2012. Efficient methods for identifying mutated driver pathways in cancer. Bioinformatics 28, 2940–2947. https://doi.org/10.1093/bioinformatics/bts564
Zheng, Y., Bueno, R., 2015. Commercially available prognostic molecular models in early-stage lung cancer: a review of the Pervenio Lung RS and Myriad myPlan Lung Cancer tests. Expert Review of Molecular Diagnostics 15, 589–596. https://doi.org/10.1586/14737159.2015.1028371
Zhu, C.-Q., Ding, K., Strumpf, D., Weir, B.A., Meyerson, M., Pennell, N., Thomas, R.K., Naoki, K., Ladd-Acosta, C., Liu, N., Pintilie, M., Der, S., Seymour, L., Jurisica, I., Shepherd, F.A., Tsao, M.-S., 2010. Prognostic and Predictive Gene Signature for Adjuvant Chemotherapy in Resected Non–Small-Cell Lung Cancer. JCO 28, 4417–4424. https://doi.org/10.1200/JCO.2009.26.4325
Zhu, C.-Q., Pintilie, M., John, T., Strumpf, D., Shepherd, F.A., Der, S.D., Jurisica, I., Tsao, M.-S., 2009. Understanding Prognostic Gene Expression Signatures in Lung Cancer. Clinical Lung Cancer 10, 331–340. https://doi.org/10.3816/CLC.2009.n.045

Reference List
269
Zhu, C.-Q., Tsao, M.-S., 2014. Prognostic markers in lung cancer: is it ready for prime time? Transl Lung Cancer Res 3, 149–158. https://doi.org/10.3978/j.issn.2218-6751.2014.06.09