Nitrogen enrichment and the emission of nitrous oxide from streams
For Review O
nly
Using a modelling approach to evaluate two options for
improving animal nitrogen use efficiency and reducing nitrous oxide emissions on dairy farms in southern Australia
Journal: Animal Production Science
Manuscript ID: AN14436.R2
Manuscript Type: Research paper
Date Submitted by the Author: 18-Jul-2014
Complete List of Authors: Christie, Karen; University of Tasmania, Tasmanian Institute of Agriculture
Rawnsley, Richard; University of Tasmania , Harrison, Matthew; University of Tasmania , Eckard, Richard; The University of Melbourne, School of Land and Environment
Keyword: Dairy cows, Greenhouse Gases, Nitrous oxide, Protein supplements, Milk quality
http://www.publish.csiro.au/nid/72.htm
Animal Production Science
For Review O
nly
1
Using a modelling approach to evaluate two options for improving animal nitrogen use 1
efficiency and reducing nitrous oxide emissions on dairy farms in southern Australia 2
K.M. ChristieAC, R.P. RawnsleyA, M.T. Harrison
A, R.J. Eckard
B 3
4
A Tasmanian Institute of Agriculture, University of Tasmania, Burnie, Tasmania 7320, 5
Australia 6
B Department of Agriculture and Food Systems, University of Melbourne, Victoria 3010, 7
Australia. 8
9
C Corresponding author: Tasmanian Institute of Agriculture, Private Bag 3523, Burnie, 10
Tasmania 7320, Australia. Tel: +61 3 6430 4921. Fax: +61 3 6430 4959. Email address: 11
13
Short title: Dairy animal N use efficiency & N2O emissions 14
Keywords: DairyMod, dairy cows, milk protein, modelling, supplementary feeding, whole 15
farm systems 16
Page 1 of 29
http://www.publish.csiro.au/nid/72.htm
Animal Production Science
For Review O
nly
2
Abstract 17
Ruminant livestock are generally considered inefficient converters of dietary nitrogen (N) 18
into animal product. Animal nitrogen use efficiency (NUE) is a measure of the relative 19
transformation of feed N into product and in dairy systems this is often expressed as milk N 20
per unit of N intake (g milk N/100 g N intake). This study was a theoretical exercise to 21
explore the relative potential efficacy and value proposition of breeding versus feeding to 22
improve NUE, reduce urinary N excretion and associated environmental impact in pasture 23
based dairy systems. The biophysical whole farm systems model DairyMod was used across 24
three dairying regions of south-eastern Australia representing a high rainfall/cool temperate 25
climate (HRCT), a high rainfall/ temperate climate (HRT) and a medium rainfall/ temperate 26
climate (MRT) to examine the two theoretical approaches of: (1) maintaining the same 27
amount of N exported in milk from a reduced N intake and (2) increasing the amount of N 28
exported in milk for the same amount of dietary N intake. Sixteen scenarios were explored 29
for each site: four supplementary feed N (SN) concentrations (ranging from 1 to 4% N) 30
combined with four milk N (MN) concentrations (ranging from 0.50 to 0.65% N). Reducing 31
the SN concentration from 4 to 1% increased the 30-year mean model-predicted NUEs from 32
~ 16 g milk N/100 g N intake at all three sites to between 23 and 28 g milk N/100 g N intake, 33
with the least and greatest improvements in NUE occurring for the HRCT and MRT sites, 34
respectively. Corresponding to this improved NUE through reduced SN concentrations, 35
model-predicted N2O emissions declined from 3.0 to 1.3 t carbon dioxide equivalents (CO2-36
e)/ha.annum for the HRCT site, from 4.2 to 2.1 t CO2-e/ha.annum for the HRT site and from 37
4.4 to 2.1 t CO2-e/ha.annum for the MRT site; representing a decline of by between 50 and 38
57%. In contrast, increasing the MN concentration from 0.50 to 0.65% increased the 30-year 39
mean model-predicted NUEs from 17 to 22 g milk N/100 g N intake for the HRCT site, from 40
18 to 23 g milk N/100 g N intake for the HRT site and from 18 to 24 g milk N/100 g N intake 41
Page 2 of 29
http://www.publish.csiro.au/nid/72.htm
Animal Production Science
For Review O
nly
3
for the MRT site. Corresponding to the improved NUE through increased MN concentrations, 42
model-predicted N2O emissions declined from 2.3 to 2.0 t CO2-e/ha.annum for the HRCT site, 43
from 3.3 to 3.1 t CO2-e/ha.annum for the HRT site and from 3.4 to 3.2 t CO2-e/ha.annum for 44
the MRT site; representing a decline of by between 7 and 11%. These results suggest that 45
improving animal NUE to reduce associated N2O losses holds much more promise if 46
achieved through a reduction in the amount of N in supplementary feed than through 47
increasing N exported in milk. This is an important finding for the Australian dairy industry, 48
since manipulation of dietary N to better balance the energy to protein ratio would be much 49
easier to implement than manipulation of N concentration in milk through genetics. 50
Page 3 of 29
http://www.publish.csiro.au/nid/72.htm
Animal Production Science
For Review O
nly
4
Introduction 51
Ruminant livestock are generally considered limited in their ability to convert dietary N into 52
animal product, with generally less than 30% of lifetime dietary N utilised for the production 53
of meat, milk or fibre (Whitehead, 1995). Given that the concentration of N in faeces and 54
products remains relatively constant over a range of N intakes above minimum metabolic 55
requirements, excess N is predominantly excreted in urine (Whitehead, 1995). Any strategy 56
that reduces the amount of excess N being consumed and excreted by livestock will generally 57
have environmental benefits. Nitrous oxide (N2O), a greenhouse gas (GHG) with 310 times 58
the global warming potential of carbon dioxide (CO2; DCCEE, 2011), is emitted to the 59
environment through the process of denitrification, and to a lesser extent, nitrification within 60
the soil (Dalal et al., 2003; de Klein and Eckard, 2008). In addition, a proportion of N lost 61
through the volatilisation of ammonia (NH3) and the leaching/runoff of nitrate (NO3) will be 62
re-deposited onto land by rainfall or through waterways and also result in indirect N2O 63
emissions (DCCEE, 2011). 64
Animal nitrogen use efficiency (NUE) is a measure of the relative transformation of feed N 65
into product. In dairy systems, animal NUE can be expressed as milk N per unit N intake (g 66
milk N/100 g N intake). While many studies have explored the NUE of confinement feeding 67
herds (Powell et al., 2010), fewer studies have been undertaken in the pasture-based grazing 68
systems in the southern hemisphere where pasture forms a large component of the diet, with 69
supplementary feed used to fill feed deficits at times of the year when pasture supply does not 70
match animal demand (Vibart et al., 2009; Gourley et al., 2012). Gourley et al. (2011) found 71
that measured NUEs varied between 15 and 35 g N milk/ 100 g N intake across 17 farms, 72
where grazed pastures constituted the majority of the diet. They concluded that the highest 73
NUE was generally obtained at the lowest level of feed N intake. In addition, numerous 74
Page 4 of 29
http://www.publish.csiro.au/nid/72.htm
Animal Production Science
For Review O
nly
5
reviews have highlighted that improving NUEs is one pathway to reducing N2O emissions 75
from livestock (de Klein and Eckard, 2008; Eckard et al., 2010). 76
From a practical perspective , measuring N dynamics on farm is difficult, time consuming, 77
expensive and can only consider a small combination of variables (e.g. soils, climate and 78
management for a limited timeframe) (Bryant et al. 2011; Smith and Western, 2013). 79
Dynamic biophysical models provide an alternative for exploring these interactions over a 80
longer timeframe and for varying farm management practices, climates and locations. The 81
aim of this study was to use a dynamic biophysical whole-farm system model to undertake a 82
theoretical exercise to explore the relative potential efficacy and value proposition of 83
breeding versus feeding to improve NUE, reduce urinary N losses and associated N2O 84
emissions with variations in supplementary feed N (SN) concentrations and milk N (MN) 85
concentrations for dairy farms in the temperate climates of south eastern Australia. 86
87
Materials and methods 88
DairyMod 89
The biophysical model DairyMod (version 4.8.16; Johnson et al., 2008) was used to simulate 90
a 100 ha dairy farm, with animals grazing rain-fed perennial ryegrass (Lolium perenne L.) 91
pasture sward in three south eastern regions of Australia (Elliott, -41.1°N, 145.8°E, Ellinbank 92
-38.3°N, 146.0°E and Terang -38.3°N, 142.6°E). Daily weather data for each site were 93
accessed as Patched Point Datasets from the Bureau of Meteorology SILO database (Jeffrey 94
et al., 2001). The daily weather data used were rainfall (mm), minimum and maximum 95
temperature (°C), minimum and maximum relative humidity (%), total solar radiation (MJ/m2) 96
and potential evapotranspiration (mm). Simulations were run between 1st July 1901 and 30
th 97
Page 5 of 29
http://www.publish.csiro.au/nid/72.htm
Animal Production Science

For Review O
nly
6
June 2000, with the financial years 1970/71 to 1999/00 used for analysis. Over the 98
simulation period, as an annual average, the daily 30-year mean temperature at Elliott was 99
15.7°C compared to 18.5 and 18.6°C at Ellinbank and Terang, respectively. The 30-year 100
mean (range) annual rainfall was 1,220 (864 – 1,860), 1,083 (846 – 1,339) and 787 (590 – 101
1,006) mm at Elliott, Ellinbank and Terang, respectively. Based on these temperature and 102
rainfall means, the three sites of Elliott, Ellinbank and Terang are representative of and herein 103
referred to as a High Rainfall Cool Temperate (HRCT) site, a High Rainfall Temperate (HRT) 104
site and a Medium Rainfall Temperate (MRT) site, respectively. 105
DairyMod is a recognised whole farm systems-level computer based model used for analyses 106
of pasture based dairy systems in Australia and New Zealand (Cullen et al., 2008; White et al., 107
2008; Smith and Western; 2013). Several authors have compared simulated pasture 108
production estimates with measured data for the environments examined in this study, finding 109
close agreement between the model-predicted and observed values (Chapman et al. 2008a; 110
Cullen et al., 2008). Taking into consideration the many factors that can influence pasture 111
growth rates (e.g. grazing management, N fertiliser inputs), and the difficulty of accurately 112
measuring net herbage accumulation rate, it is not realistic to expect an exact match between 113
predicted and observed growth rates (Chapman et al., 2008a). Based on the model evaluation 114
statistics work of Tedeschi (2006), Cullen et al. (2008) found the r2, bias correction and mean 115
prediction error to be 0.88, 1.0 and 10.8%, respectively, for 31 modelled and observed annual 116
pasture yields across several temperate and sub-tropical environments, with varying ryegrass 117
cultivars, soils types and management systems in Australian and New Zealand. Similar 118
results have been found by other authors for some of the sites explored here giving rise to 119
confidence in DairyMod predicting dairy farm systems for south eastern Australia. 120
DairyMod includes modules for pasture growth and subsequent utilisation by grazing animals, 121
water and N dynamics, animal and plant physiology and production with a range of options 122
Page 6 of 29
http://www.publish.csiro.au/nid/72.htm
Animal Production Science

For Review O
nly
7
for pasture management, irrigation and N fertiliser application. The animal module simulates 123
animal production based on the metabolisable energy (ME) intake that is utilised for 124
maintenance, lactation, pregnancy and growth as appropriate. The module has a significant 125
role in predicting nutrient dynamics through the recycling of faeces and urine (herein referred 126
to as excreta when summed together). The user defines the proportion of animal excreta that 127
is returned to the paddock (see section titled Soil parameters, N fertiliser and animal waste 128
management). While DairyMod assumes an even distribution of excreta across paddocks, 129
this is unlikely to be the case in reality. There is also the ability to define the nutrient 130
composition of milk and this function was implemented to define the four MN concentrations 131
examined in this study (see section titled Milk N concentrations and supplementary feed N 132
concentrations). Information on how N2O emissions are estimated in DairyMod is provided 133
in the Nitrous oxide emissions section. For more model details see Johnson (2013, 134
DairyMod and the SGS Pasture Model: a mathematical description of the biophysical model 135
structure. IMJ Consultants, Dorrigo, NSW, Australia, 136
http://imj.com.au/consultancy/ModelDocumentation/ModelDocumentation.html). 137
Farm system 138
Milking herd, grazing management and supplementary feed 139
The same farm system was simulated at each site to avoid confounding comparison of results 140
between sites. The farm system was a herd calving 1st August (late winter) with a target milk 141
production of 6,500 L/cow per 300 day lactation. This amount of milk production per cow 142
was similar to regional mean values taken from the Victorian Department of Primary 143
Industries’ Dairy Industry Farm Monitor Project and Tasmanian Dairy Business of the Year 144
awards (access the Victorian data at http://www.depi.vic.gov.au/agriculture-and-145
food/dairy/business-management/farm-monitoring-dairy and the Tasmanian data at 146
Page 7 of 29
http://www.publish.csiro.au/nid/72.htm
Animal Production Science
For Review O
nly
8
http://www.tia.tas.edu.au/centres/dairy-centre/). The N concentration of the milk was an 147
experimental variable for this study and is detailed in the Milk N concentrations and 148
supplementary feed N concentrations section below. The herd rotationally grazed 20 five-149
hectare paddocks down to a biomass residual of 1.4 t dry matter (DM)/ha once the pasture 150
reached the 2.5 leaf regrowth stage or if the pasture biomass had reached 2.5 t DM/ha, grazed 151
once the pasture reach the 2.0 leaf stage of regrowth. 152
The stocking rate was intentionally set high, at 3.5 cows/ha, to ensure a demand for 153
supplementary feeding in all years. When daily pasture biomass was insufficient for daily 154
herd ME intake requirements, supplement with an ME concentration of 12.5 MJ/kg DM was 155
supplied to meet the herd’s energy demand. Supplementary feed N concentration was the 156
other experimental variable for this study and is detailed in the Milk N concentrations and 157
supplementary feed N concentrations section below. DairyMod assumes 100% utilisation of 158
all pastures grown and supplementary feed supplied to the herd (i.e. no spoilage due to 159
trampling, excreta deposition on pastures etc). 160
Soil parameters, N fertiliser and animal waste management 161
A generic clay loam soil with a bulk density value of 1.3g/ cm3 and a saturated hydraulic 162
conductivity of 2.8mm/hour was used for each site. The wilting point, field capacity and 163
saturation point of the generic clay loam were 19%, 40%, and 48% by volume, respectively, 164
with the perennial ryegrass pasture having a rooting depth of 400mm. All sites were rain-fed, 165
and given the winter-dominant rainfall pattern at all sites, N fertiliser was applied at a rate of 166
30 kg N/ha in the form of urea on the 1st of April, 1
st of May, 1
st of August, 1
st of September 167
and 1st of October every year to correspond with times of the year when response rate to the 168
N fertiliser was most likely to be maximised. This N fertilisation rate was similar to regional 169
benchmarking averages of ~ 120 to 130 kg N/ha.annum for Victorian dairy farms and ~ 170 170
Page 8 of 29
http://www.publish.csiro.au/nid/72.htm
Animal Production Science
For Review O
nly
9
kg N/ha.annum for Tasmanian dairy farms (access the Victorian data at 171
http://www.depi.vic.gov.au/agriculture-and-food/dairy/business-management/farm-172
monitoring-dairy and the Tasmanian data at http://www.tia.tas.edu.au/centres/dairy-centre/ ). 173
In addition, 90% of animal excreta were returned to the paddocks, with the remaining 10% 174
deposited in the dairy during milking. This reflects typical farm practices in Australia where 175
the time cows spend grazing pastures is maximised and is equivalent to cows spending 176
between 60 and 90 minutes a milking at the dairy and associated holding areas. To minimise 177
any inconsistency with how the remaining 10% of animal excreta deposited at the dairy could 178
be stored/managed between sites (e.g. flushed to a storage pond/lagoon system and spread at 179
a later date or flushed to a sump and spread daily through a sprinkler system on pastures), and 180
consequently alter the N2O emissions from this stored excreta, a consistent approach was 181
taken with these emissions effectively removed from the N2O estimations. Similar 182
approaches have been undertaken by others to explore N dynamics using DairyMod (e.g. 183
Smith and Western, 2013). 184
Milk N concentrations and supplementary feed N concentrations 185
Sixteen scenarios were examined for each site: four MN concentrations of 0.50, 0.55, 0.60 186
and 0.65% N, representing 3.1, 3.4, 3.8 and 4.1% milk protein, combined with four SN 187
concentrations of 1, 2, 3 and 4% N, representing 6.3, 12.5, 18.8 and 25.0% crude protein in 188
the supplement. Milk nitrogen concentrations of either 0.50 or 0.55% N are typical of 189
Holstein-Friesian cattle where increased milk volume generally results in a dilution of milk 190
protein concentrations (Robinson, 2014; 191
http://animalscience.ucdavis.edu/faculty/robinson/Articles/FullText/Pdf/Web199908.PDF). 192
In contrast MN concentrations of 0.60% N are typical of Jersey cattle, and to a lesser extent 193
Guernseys, Ayrshires and cross-bred cattle, where there is generally a decrease in milk 194
volume resulting in a higher concentration of milk protein (Robinson, 2014; 195
Page 9 of 29
http://www.publish.csiro.au/nid/72.htm
Animal Production Science
For Review O
nly
10
http://animalscience.ucdavis.edu/faculty/robinson/Articles/FullText/Pdf/Web199908.PDF). 196
The fourth 0.65% MN was included to examine an extreme level of MN concentration. 197
Long-term increases in MN concentrations are generally only possible through changes in 198
cattle breed, and to a lesser extent genetic selection within breeds, with changes in feeding 199
regimes only resulting in transitory changes in MN concentrations (Robinson, 2014; 200
http://animalscience.ucdavis.edu/faculty/robinson/Articles/FullText/Pdf/Web199908.PDF). 201
The SN concentrations of either 3 or 4% N in the current study are reflective of an all-pasture 202
diet; replacing grazed pastures with supplementary feed of a similar N concentration and 203
therefore essentially not varying the overall diet N concentration by any substantial amount. 204
In comparison the SN concentrations of 2% N reflects a pasture-based diet supplemented 205
with grain-based concentrates while the 1% SN reflects a pasture-based diet supplemented 206
with a low N concentration forage such as maize (Zea mays L) silage. 207
Nitrous oxide emissions 208
Denitrification losses are from the soil N2O pool, which is supplied either through direct 209
application of NO3 fertiliser or from the nitrification of ammonium (NH4). Ammonium 210
inputs are from organic matter breakdown (including dung decay), inputs from NH4 fertiliser 211
and urine inputs. Nitrogen in the diet is either retained in body tissue growth and milk 212
production, or is excreted. It is assumed that the milk has a fixed N concentration throughout 213
the simulations and we altered this fixed concentration to create the four MN concentrations. 214
Partitioning of N between dung and urine is related to the N concentration of the diet and 215
proportion of N that is excreted. The general behaviour of DairyMod is that the proportion of 216
excreted N in urine increases as the N content of the diet increases (Johnson et al., 2008). 217
Nitrification of NH4 is defined using a rectangular hyperbola in response to NH4 218
concentration, and is also affected by soil water status, temperature and soil microbial pools 219
Page 10 of 29
http://www.publish.csiro.au/nid/72.htm
Animal Production Science
For Review O
nly
11
(Johnson et al., 2008). The rate of denitrification is defined using a rectangular hyperbola in 220
response to soil NO3- concentration, as well as temperature and soil C status, with soil C 221
status varied through the depth of the soil profile as defined by the ratio of labile soil C in 222
each soil layer to that in the surface layer (Johnson et al., 2008). Partitioning of 223
denitrification losses between N2O and N2 is affected by water filled pore space (WFPS) 224
based on the model proposed by Granli and Bøckman (1994). Denitrification of N2O 225
commenced and ceased at a WFPS as 60 and 90%, respectively. Denitrification of N2 226
commenced at a WFPS of 80%. 227
Indirect N2O losses, which are the proportion of leached NO3 and volatilisation of NH3 being 228
converted into N2O at a later date, were estimated using an inventory approach. Several 229
studies have found consistency with the model-prediction of N leaching, volatilisation and/or 230
denitrification within DairyMod compared to measured data (Bryant et al., 2011; 231
Hoogendoorn et al., 2011; Smith and Western, 2013) giving the model credibility in 232
estimating N dynamics for pasture-based grazing systems. Simulated losses of N through 233
leaching and volatilisation were multiplied by emissions factors of 0.01 and 0.0125, 234
respectively, as used in the Australian National GHG Inventory (DCCEE, 2011). A global 235
warming potential of 310 was used to convert N2O losses to GHG carbon dioxide equivalent 236
emissions (kg CO2e; DCCEE, 2011). For more details on DairyMod see Johnson (2013, 237
DairyMod and the SGS Pasture Model: a mathematical description of the biophysical model 238
structure. IMJ Consultants, Dorrigo, NSW, Australia, 239
http://imj.com.au/consultancy/ModelDocumentation/ModelDocumentation.html). 240
Model outputs 241
Model-predicted annual data for pasture intake (t DM/ha), supplementary feed intake (t 242
DM/ha), milk production (litres/ha), N fertiliser applied (kg N/ha), N exported in milk (kg 243
Page 11 of 29
http://www.publish.csiro.au/nid/72.htm
Animal Production Science

For Review O
nly
12
N/ha), animal N intake (kg N/ha), animal excreta returned to paddocks (kg N/ha), direct N2O 244
emissions (kg CO2e/ha), leached N (kg N/ha) and volatilised N (kg N/ha) were collated for 245
each SN by MN scenario and site over the 30 year period to estimate the NUEs and N2O 246
emissions. 247
NUE and N2O emissions estimations 248
Annual NUE was determined for each of the 16 scenarios by dividing the annual total N 249
exported in milk by the annual total N consumed by the cows (g milk N / 100 g N intake) and 250
from this, a 30-year mean annual NUE was determined for each scenario and site. Thirty-251
year mean NUEs were estimated for each of the four SN concentrations by averaging the 252
mean NUEs for the four MNs within each SN concentration (e.g. average of the 30-year 253
mean NUEs of the four MNs where SN was 1%, 2% etc). The process was repeated for the 254
four MN concentrations by averaging the mean NUEs for the four SNs within each MN 255
concentration (e.g. average of the 30-year mean NUEs of the four SNs where MN was 0.50%, 256
0.55% etc). In addition, 30-year mean N2O emissions (directly as N2O and indirectly through 257
leaching and volatilisation) for each of the four SN concentrations (average of the four MNs) 258
and each of the four MN concentrations (average of the four SNs) were estimated for each 259
site using the same process as above. 260
Statistical analysis 261
Thirty-year means and standard deviations (SDs) were estimated for annual pasture 262
production and supplementary feed intakes for each site across all 16 scenarios. In addition, 263
30-year means and SDs were estimated for each of the four mean SN and MN concentration 264
scenarios with respect to N inputs (dietary N intake) and outputs (N deposited on pastures 265
from excreta, N exported in milk, N lost through denitrification, leaching, volatilisation and 266
total N2O losses) for each site. 267
Page 12 of 29
http://www.publish.csiro.au/nid/72.htm
Animal Production Science
For Review O
nly
13
Results 268
Pasture production, supplementary feed intakes, diet N intakes, animal excreta and milk 269
production 270
The simulated 30-year mean (± SD) annual pasture production was 11.6 (± 1.7), 9.4 (± 1.9) 271
and 8.3 (± 1.6) t DM/ha for the HRCT, HRT and MRT sites, respectively. These mean 272
annual pasture yields align with previous model validation studies at these sites (Cullen et al., 273
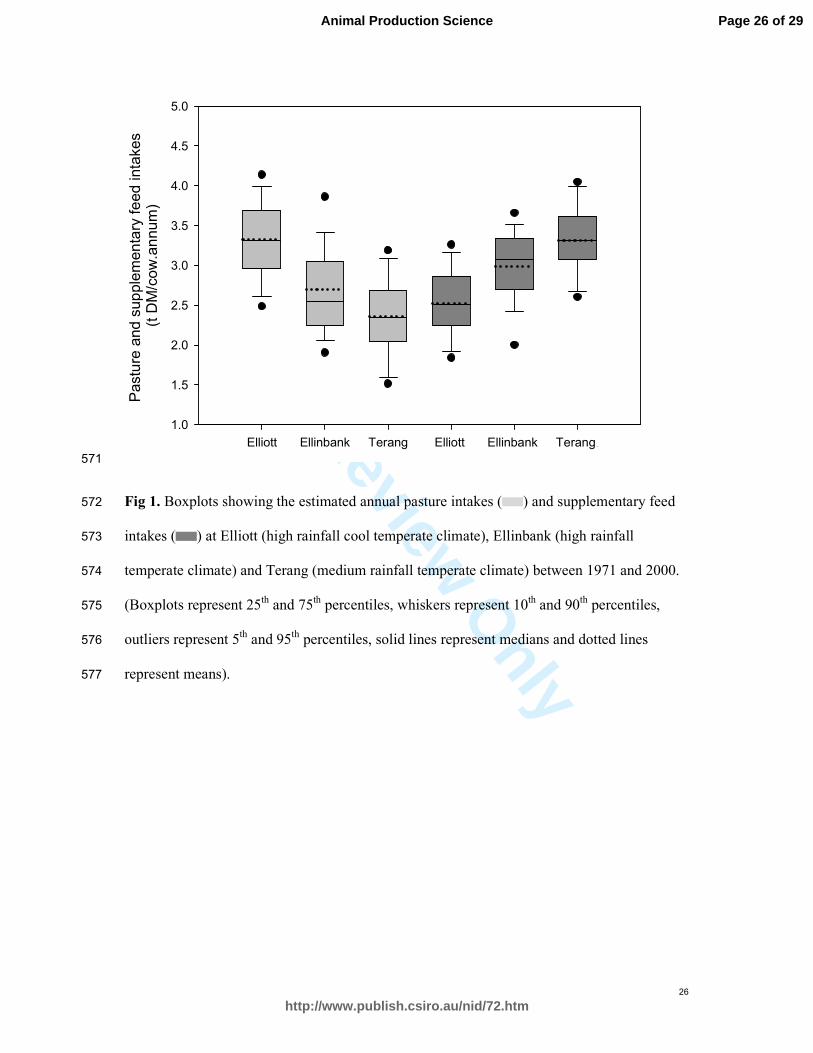
2008). On a per cow basis, the model-predicted 30-year mean pasture intakes equated to 3.3 274
(± 0.5), 2.7 (± 0.5) and 2.4 (± 0.5) t DM/cow.annum for the HRCT, HRT and MRT sites, 275
respectively (Fig 1). Due to the inter-annual variation in pasture production, the model-276
predicted 30-year mean (± SD) supplementary feed intakes were 2.2 (± 1.6), 2.8 (± 1.8) and 277
3.1 (±1.6) t DM/cow.annum for the HRCT, HRT and MRT sites, respectively (Fig 1). The 278
amount of supplementary feeding was greater than industry averages. However, this was due 279
to the high stocking rate which was specifically selected such that there was a requirement for 280
supplementary feed even for high pasture production years. The percentage of total diet 281
from supplementary feed, as a mean (± SD) of all 16 scenarios across all 30 years, were 40 (± 282
8), 50 (± 10) and 57% (± 8) for the HRCT, HRT and MRT sites, respectively. 283
Total diet N concentration varied between 3.1 and 3.3% N among the four model-predicted 284
30-year mean MN concentrations. When fed a supplement with an N concentration of 1%, 285
mean (± SD) dietary N concentrations were 2.5 (± 0.3), 2.4 (± 0.2) and 2.2 (± 0.3) % for the 286
HRCT, HRT and MRT sites, respectively (Figs 2 to 4). This increased to 4.1% N across all 287
sites when the SN concentration was increased to 4% N and was comparative to that of the 288
pasture N concentrations (Figs 2 to 4). Not dismissing the complexity of microbial N 289
dynamics within the cow, optimum concentrations of N in the diet for high-yielding dairy 290
Page 13 of 29
http://www.publish.csiro.au/nid/72.htm
Animal Production Science
For Review O
nly
14
cows fed a well-balanced diet is generally accepted within the range of 2.6 to 2.9% (Olmos 291
Colmenero and Broderick, 2006), making the 1% SN diet marginal at all three sites. 292
[Insert Figure 1 near here] 293
The model-predicted 30-year mean (± SD) annual N intakes was 539 (± 48), 483 (± 52) and 294
456 (± 49) kg N/ha for the HRCT, HRT and MRT sites, respectively, when the SN was 1%. 295
For every 1% increase in SN concentrations, the 30-year mean total diet N intakes increased 296
by ~ 90, 100 and 110 kg N/ha.annum for the HRCT, HRT and MRT sites, respectively. In 297
addition, the inter-annual variation in dietary N intakes declined considerably as SN 298
increased to 4% (Figs 2 to 4). In contrast, there was very little (< 5 kg N/ha.annum) variation 299
in the total diet N intakes across the four MN scenarios (Figs 2 to 4). 300
[Insert Figures 2 to 4 near here] 301
The overall 30-year model-predicted mean milk production across all 16 scenarios was ~ 302
6,190 litres/cow.lactation at all three sites, close to the initial target of 6,500 303
litres/cow.lactation, with little inter-annual variation within and between sites. This resulted 304
in similar amounts of N exported in milk each year, with 30-year model-predicted means of 305
108, 119, 130 and 140 kg N/ha.annum (SDs < 1 kg N/ha.annum at all three sites) when the 306
MN concentrations were 0.50, 0.55, 0.60 and 0.65%, respectively. For every 0.01% increase 307
in MN concentrations, the model-predicted 30-year mean milk N exports (averaged over the 308
four SN scenarios) increased by ~ 2.2 kg N/ha.annum. 309
As SN concentrations increased from 1 to 4%, so too did the amount of N returned to the 310
paddock in excreta. There was substantial differences in N excreta among sites when the SN 311
concentration was 1% N as shown with a model-predicted 30-year means (± SD) of 359 (± 312
45), 309 (± 49) and 285 (± 45) kg N/ha for the HRCT, HRT and MRT sites, respectively 313
Page 14 of 29
http://www.publish.csiro.au/nid/72.htm
Animal Production Science
For Review O
nly
15
(Figs 2 to 4). These results align with measured studies where intakes similar to those 314
achieved with the SN 1% diets reported above resulted in between ~ 250 and 315 g N 315
excreted/cow.day (Kebreab et al., 2011). However, once the SN concentration was either 3 316
or 4% N, there was less variation among sites in the amount of N returned to the paddock in 317
excreta, best illustrated with the 4% SN, with means (± SD) of 590 (± 13), 576 (± 13) and 318
580 (± 12) kg N/ha for the HRCT, HRT and MRT sites, respectively (Figs 2 to 4). Increasing 319
the MN concentration from 0.50 to 0.65% resulted in a reduction in N lost via excreta. 320
However this decline was relatively insignificant (around 10 kg N/ha.annum per 0.05% MN 321
increase) compared to the rate of decline in excreta N with declining SN concentrations 322
(around 70 to 100 kg N/ha.annum per 1% SN decline). 323
Nitrogen use efficiency 324
As SN concentrations increased, mean NUE decreased. In contrast, NUE increased with 325
increasing MN concentrations (Figs 2 to 4). The 30-year mean NUEs varied between 14 and 326
31 g milk N/ 100 g N intake (Figs 2 to 4). There was little difference in NUEs between sites 327
when the SN concentration was 3 or 4% (Figs 2 to 4). However, when the SN concentration 328
declined to 1%, NUE differences became more apparent, with mean NUEs (± SD) of 23 (± 3), 329
26 (± 4) and 28 (± 4) g milk N/ 100 g N intake for the HRCT, HRT and MRT sites, 330
respectively (Figs 2 to 4). 331
N lost through denitrification, leaching and volatilisation 332
When the SN was 1%, mean (± SD) nitrogen lost to the environment directly through N2O 333
denitrification was 1.1 (± 0.4), 2.3 (± 0.8) and 2.4 (± 0.6) kg N/ha for the HRCT, HRT and 334
MRT sites, respectively. As SN increased from 1 to 4% N, the amount of N lost as N2O 335
increased at all three sites but with a diminishing rate of increase. For example, for the MRT 336
site the mean N2O model-predicted to be lost to the environment was 2.4, 2.9, 3.3 and 3.5 kg 337
Page 15 of 29
http://www.publish.csiro.au/nid/72.htm
Animal Production Science

For Review O
nly
16
N/ha.annum for SNs of 1, 2, 3 and 4%, respectively. As MN increased, there was only a 338
small reduction in the amount of N lost as N2O, with a maximum difference of only 0.2 kg 339
N/ha.annum between and MN of 0.50 and 0.65%. 340
Nitrogen was also lost to the environment through leaching and, to a lesser extent, 341
volatilisation. Given that the simulated volatilisation losses were only ~ 10% of those losses 342
from leaching, only the leaching results are presented here. However, the amount of N2O 343
attributed to volatilisation losses is included in the total N2O losses presented in the NUE and 344
N2O emissions estimation section below. Similarly to N lost as N2O through denitrification, 345
the amount of N lost through leaching was the lowest for the HRCT site and greatest at the 346
MRT site. When SNs were 1%, the 30-year mean (± SD) leached N was 109 (± 52), 147 (± 347
61) and 148 (± 63) kg N/ha.annum for the HRCT, HRT and MRT sites, respectively. As SN 348
increased from 1 to 4%, the model-predicted 30-year mean leached N increased by 181, 227 349
and 257 kg N/ha for the HRCT, HRT and MRT sites, respectively. In contrast, as MN 350
increased from 0.50% to 0.65%, the 30-year mean leached N declined by between 24 and 25 351
kg N/ha across the three sites. 352
Total nitrous oxide emissions 353
Total N2O emissions, as the sum of the N2O lost directly and through the conversion of a 354
proportion of N lost through leaching and volatilisation into N2O, varied between scenarios 355
and sites. When the SN was 4% N the model-predicted 30-year mean (± SD) total N2O 356
emission was 3.0 (± 0.9), 4.2 (± 1.0) and 4.4 (± 1.1) t CO2e/ha.annum for the HRCT, HRT 357
and MRT sites, respectively (Figs 2 to 4). This declined to model-predicted 30-year mean (± 358
SD) total N2O emissions of 1.3 (± 0.5), 2.1 (± 0.6) and 2.1 (± 0.4) t CO2e/ha.annum for the 359
HRCT, HRT and MRT sites, respectively, when SN was 1% N (Figs 2 to 4). When the MN 360
concentration was 0.50% N, the model-predicted 30-year mean (± SD) total N2O emission 361
Page 16 of 29
http://www.publish.csiro.au/nid/72.htm
Animal Production Science
For Review O
nly
17
was 2.3 (± 0.9), 3.3 (± 1.1) and 3.4 (± 1.1) t CO2e/ha.annum for the HRCT, HRT and MRT 362
sites, respectively (Figs 2 to 4). This declined to 2.0 (± 0.9), 3.1 (± 1.1) and 3.2 (± 1.1) t 363
CO2e/ha.annum when the MN concentration was increased to 0.65% N (Figs 2 to 4). 364
Direct N2O emissions, as a mean of the 16 scenarios, were model-predicted as 0.39, 0.48 and 365
0.48 of total N2O emissions for the HRCT, HRT and MRT sites, respectively, with the 366
balance attributed to indirect N2O emissions associated with leaching and volatilisation. 367
These proportions are similar to those of the national inventory (DCCEE, 2011), giving 368
additional weight to the accuracy of the model’s outputs. 369
Discussion 370
Based on the assumptions inherent in DairyMod, this study suggests that decreasing dietary N 371
supply to better balance the dietary N requirements of a dairy cow leads to improvements in 372
NUE and results in greater reduction in N2O emissions than strategies that are targeting a 373
greater amount N in the animal product. In practice, improving the balance between protein 374
and energy can be achieved by several processes. The most obvious is to provide a diet that 375
matches N requirement, varying throughout the year depending on animal requirements for 376
lactation and pregnancy. However, for pasture-based systems typical of southern Australia, 377
where there can be large seasonal variations in pasture N concentrations, this is somewhat 378
more difficult to achieve (Powell et al., 2010). Options for pasture-based dairy systems 379
include selecting forage species with a higher energy to protein ratio, strategically feeding 380
animals based on changes in N concentration with plant phenology, or providing supplements 381
with a low N concentration (de Klein and Eckard, 2008). Such feeding strategies can be 382
more easily adapted in Australia’s pastures based dairy systems than longer term options such 383
as selection of dairy cows for a higher concentration of milk protein (Pablo Keim and 384
Anrique, 2011), especially given that the assumed theoretical increases in milk N 385
Page 17 of 29
http://www.publish.csiro.au/nid/72.htm
Animal Production Science
For Review O
nly
18
concentration presented here resulted in minimal estimated potential reductions in N2O 386
emissions. 387
In the current study, the 30-year mean NUEs for individual scenario were model-predicted to 388
vary between 14 and 31 g milk N/ 100 g N intake. These results are similar to measured 389
results of Gourley et al. (2012) who found that measured NUEs of 17 dairy farms located 390
throughout Victoria , including some farms located in the HRT and MTR regions explored in 391
this study, varied between 15 and 35 g milk N/ 100 g N intake. In a review of NUEs by 392
Pablo Keim and Anrique (2011), where pastures compromised the majority of the diet, 393
measured NUEs varied between 15 and 33 g milk N/ 100 g N intake. Similar measured 394
results were found by Vibart et al. (2009) with an average NUE of 24 g milk N/ 100g N 395
intake. 396
According to the definitions of varying NUE’s by Chase (2003), NUEs of < 25 g milk N/ 100 397
g N intake are considered to indicate room for substantial improvement. However, these 398
definitions by Chase (2003) were based on studies in which most cattle were involved in 399
confinement feeding practices as opposed to the majority of the diet consisting of grazed 400
pastures for dairy farms in southern Australia (Dairy Australia; 401
http://www.dairyaustralia.com.au/Animals-feed-and-environment/Feeding-and-402
nutrition/Feeding-systems.aspx). Compared to grazed pastures, confinement feeding allows 403
for more control of feed quantity and nutrient concentrations throughout the year, where the 404
energy to protein ratio can be monitored and rectified as required, the diet can be delivered in 405
smaller amounts throughout the day to increase daily dry matter intakes and milk production 406
per unit of feed intake can be maximised due to less energy being diverted to maintenance 407
and activity (Gourley et al., 2012; Powell et al., 2010). Any one of these would assist in 408
increasing the NUE of milk production for confinement feeding systems relative to grazed 409
pastures systems typical of southern Australia. 410
Page 18 of 29
http://www.publish.csiro.au/nid/72.htm
Animal Production Science

For Review O
nly
19
When the SN concentration declined from 4 to 1%, reflecting a change in overall diet N 411
concentration from 4.1% down to a low of 2.2% depending on the site. N intakes also 412
declined from approximately 790 kg N/ha.annum at all three sites to between 460 and 540 kg 413
N/ha.annum depending on the site. This corresponded with an improvement in NUE from a 414
low of 16 g milk N/ 100 g N at all three sites to a high of between 23 and 28 g milk N/ 100 g 415
N. This relationship between N intake and NUEs has been shown in measured studies 416
highlighting that any practice that better balances N intake will improve NUE (Huhtanen and 417
Hristov, 2009; Powell et al., 2010). 418
When MN concentrations increased from 0.50% to 0.65%, N intakes remained relatively 419
stable and NUEs increased from approximately 17 to 23 g milk N/ 100 g N. More 420
importantly, this increase in NUE was lower than that achieved with reducing SNs. Milk N 421
concentrations of 0.50% N returned a 30-year mean of between 71 and 73% of total N intake 422
as excreta and only declined to between 66 and 68% of total N intake as excreta when the 423
MN concentration was increased to 0.65% N. Pablo Keim and Anrique (2011) suggest that 424
increasing the amount of N exported in milk is a positive means of improving NUE to reduce 425
N2O losses. However, the reduction in N2O corresponding with improved NUEs as a 426
consequence of increased MN concentrations, resulted in 0.2 to 0.3 t CO2-e/ha.annum 427
abatement depending on the site. This was a relatively insignificant abatement compared to 428
those achieved with declining SN concentrations. 429
Due to climatic differences, pasture consumption for the HRCT site was 11.6 t DM/ha.annum 430
which was discernibly higher than the 9.4 and 8.3 t DM/ha.annum achieved for the HRT and 431
MRT sites, respectively. This affected the N balance in two ways: more of the N inputs from 432
fertiliser and excreta were converted into pasture and less supplementary feed was required. 433
Both aspects would have contributed to less N being available for loss, either directly or 434
indirectly, highlighting that maximising pasture production and pasture utilisation is the goal 435
Page 19 of 29
http://www.publish.csiro.au/nid/72.htm
Animal Production Science
For Review O
nly
20
of dairy farmers to not only better balance their herd’s feed requirements but also reduce 436
some of the environmental concerns of dairy farming. 437
Direct and indirect N2O emissions for the HRCT site were approximately half and one-third 438
those at the other two sites further confirming that converting N into pasture production 439
attributed to the reduced N2O losses for the HRCT site. The warmer soil temperatures 440
experienced at the two temperate climate sites may have also favoured increases in N2O 441
emissions relative to those at the cool temperate climate site even though the latter was 442
discernibly wetter over the winter months (Dalal et al., 2003). Therefore, for the temperate 443
climate sites the implementation of other mitigation strategies in addition to better balancing 444
of the diet’s energy to protein ratio could have some merit. Other potential strategies to 445
optimise pasture production in addition to reducing N2O emissions include management 446
practices such as improved drainage, better scheduling of irrigation events to minimise 447
through drainage and/or strategic grazing of pastures over winter to reduce soil conditions 448
conducive to N losses (de Klein and Eckard, 2008). 449
For many southern Australian dairy systems, the diets are predominantly grazed/conserved 450
pastures based on perennial ryegrass (Chapman et al., 2008a). This study has shown that the 451
introduction of some form of forage crop low in N concentration, such as maize grown for 452
silage, was advantageous in reducing N2O emissions. However, although the use of forage 453
crops to better balance the diet can be beneficial, it is critical to avoid inadvertently 454
introducing an energy deficit as some of these low N forages can also be below optimum 455
energy (e.g. sorghum (Sorghum bicolour L) and millet (Pennisetum glaucum L)), leading to a 456
compromise in milk production and subsequently increasing the NUEs. In addition, on-farm 457
adoption of forage crops is often low, as improvements in farm profitability can be minimal 458
(Chapman et al., 2008b; Rawnsley et al., 2013). In addition, their introduction could bring 459
changes to management practices for the farming system. For example, the inclusion of 460
Page 20 of 29
http://www.publish.csiro.au/nid/72.htm
Animal Production Science
For Review O
nly
21
maize silage into the diet may require specialised harvesting equipment, concreted feeding 461
areas and mixer wagons for feeding. Therefore just replacing a proportion of the diet with a 462
low N concentration forage supplement has other considerations which need to be addressed 463
beyond their ability to reduce N2O losses. 464
This study has clearly demonstrated, and supports previous findings, that adopting feeding 465
strategies to better balance the diet so that N is not supplied in excess of animal requirements 466
will most likely result in improved NUE and consequently lower N2O emissions (Powell et 467
al. , 2010; Pablo Keim and Anrique, 2011). Identifying pasture/forage species that can 468
reduce N intakes without compromising milk production and farm profitability will have 469
positive outcomes for the environment. In recent years there has been an increasing focus on 470
the use of high sugar ryegrass to improve the energy to protein ratio of the cow’s diet (Pablo 471
Keim and Anrique, 2011). The study has shown that any strategy that reduce the amount of 472
surplus N in the diet will result in improvements in NUE and consequently decrease N2O 473
emissions. This adoption of high sugar ryegrass in temperate dairying regions of Australia 474
requires further research to ascertain both the productive and environmental benefits. . 475
Conclusions 476
It is generally accepted that while there are several pathways to improve animal NUE for 477
confinement feeding of dairy cows, large uncertainty remains regarding pathways for 478
improving NUE in pasture-based dairy systems (Pablo Keim and Anrique, 2011; Gourley et 479
al., 2012). Finding approaches to achieving improvement in NUE to reduce associated N2O 480
emissions is considered critical to maintaining productivity growth whilst adhering to 481
environmental stewardship. This study explored two potential pathways for improving NUE 482
to assist in reducing N2O emissions: increasing the amount of N exported off-farm with 483
improved milk N concentrations and decreasing the overall N concentration of the diet with 484
Page 21 of 29
http://www.publish.csiro.au/nid/72.htm
Animal Production Science
For Review O
nly
22
varying supplementary feed N concentrations. Both pathways improved NUE and reduced 485
associated N2O emissions. However reducing supplementary feed N concentrations reduced 486
N losses by an order of magnitude greater than achieved by increasing milk N concentrations. 487
It is also clear that no single strategy alone will achieve the desired improvement in NUE and 488
N2O abatement; however a combination of several complementary options may hold some 489
promise for the southern Australian dairy industry. 490
Acknowledgements 491
This project was supported by the Tasmanian Institute of Agriculture, the University of 492
Melbourne and the Victorian Department of Environment and Primary Industries, through 493
funding from the Australian Government Department of Agriculture, Dairy Australia, Meat 494
and Livestock Australia and Australian Wool Innovation. 495
References 496
Bryant, J.R., Snow, V.O., Cichota, R., Jolly, B.H.; 2011. The effect of situational variability 497
in climate and soil, choice of animal type and N fertilisation level on nitrogen leaching from 498
pastoral farming systems around Lake Taupo, New Zealand. Agricultural Systems 104, 271-499
280. doi:10.1016/j.agsy.2010.11.001. 500
Chapman, D.F., Kenny, S.N., Beca, D., Johnson, I.R., 2008a. Pasture and forage crop 501
systems for non-irrigated dairy farms in southern Australia. 1. Physical production and 502
economic performance. Agricultural Systems 97, 108-125. doi:10.1016/j.agsy.2008.02.001. 503
Chapman, D.F., Kenny, S.N., Beca, D., Johnson, I.R., 2008b. Pasture and forage crop 504
systems for non-irrigated dairy farms in southern Australia. 2. Inter-annual variation in forage 505
supply, and business risk. Agricultural Systems 97, 126-138. doi:10.1016/j.agsy.2008.02.002. 506
Page 22 of 29
http://www.publish.csiro.au/nid/72.htm
Animal Production Science
For Review O
nly
23
Chase, L.E. 2003. Nitrogen utilisation in dairy cows- what are the the limits of efficiency? In: 507
Proceedings of the 65th Cornell Nutrition Conference for Feed Manufacturers. Cornell 508
University Department of Animal Sciences, Ithaca, New York, USA, pp. 233-244. 509
Cullen, B.R., Eckard, R.J., Callow, M.N., Johnson, I.R., Chapman, D., Rawnsley, R.P., 510
Garcia, S.C., White, T., Snow, V.O., 2008. Simulating pasture growth rates in Australian and 511
New Zealand grazing systems. Australian Journal of Agricultural Researc 59: 761-768. 512
doi:10.1071/AR07371. 513
Dalal, R.C., Wang, W., Robertson, G.P., Parton, W.J., 2003. Nitrous oxide emission from 514
Australian agricultural lands and mitigation options: a review. Australian Journal of Soil 515
Research 41: 165-195. doi:10.1071/SP02064. 516
DCCEE (2011) National Inventory Report 2009 – Volume 1. The Australian Government 517
Submission to the UN Framework Convention on Climate Change. Department of Climate 518
Change and Energy Efficiency, Canberra, Australia. 519
de Klein, C.A.M., Eckard, R.J., 2008. Targeted technologies for nitrous oxide abatement 520
from animal agriculture. Australian Journal of Experimental Agriculture 48: 14-20. 521
doi:10.1071/ea07217. 522
Eckard, R.J., Grainger, C., de Klein, C.A.M., 2010. Options for the abatement of methane 523
and nitrous oxide from ruminant production – a review. Livestock Science 130: 47-56. 524
doi:10.1016/j.livsci.2010.02.010. 525
Gourley, C.J.P., Aarons, S.R., Powell, J.M., 2012. Nitrogen use efficiency and manure 526
management practices in contrasting dairy production systems. Agriculture Ecosystems and 527
Environment 147: 73-81. doi:10.1016/j.agee.2011.05.011. 528
Page 23 of 29
http://www.publish.csiro.au/nid/72.htm
Animal Production Science
For Review O
nly
24
Granli, T., Bøckman, O.C., 1994. Nitrous oxide from agriculture. Norwegain Journal of 529
Agricultural Science Supplement 12: 7-128. 530
Hoogendoorn, C.J., Betteridge, K., Ledgard, S.F., Costall, D.A., Park, Z.A., Theobald, P.W., 531
2011. Nitrogen leaching from sheep-, cattle- and deer-grazed pastures in Lake Taupo 532
catchment in New Zealand. Animal Production Science 51, 416-425. doi:10.1071/AN10179. 533
Huhtanen, P., Hristov, A.N. (2009) A meta-analysis of the effects of dietary protein 534
concentration and degradability on milk protein yield and milk N efficiency in dairy cows. 535
Journal of Dairy Science 92, 3222-3232. doi:10.3168/jds.2008-1352 536
Jeffrey, S.J., Carter, J.O., Moodie, K.M., Beswick, A.R., 2001. Using spatial interpolation to 537
construct a comprehensive archive of Australia cliate data. Environmental Modelling and 538
Software 16: 309-330. 539
Johnson, I.R., Chapman, D.F., Snow, V.O., Eckard, R.J., Parsons, A.J., Lambert, M.G., 540
Cullen, B.R., 2008. DairyMod and EcoMod: biophysical pasture-simulation models for 541
Australia and New Zealand. Australian Journal of Experimental Agriculture 48: 621-631. doi: 542
10.1071/ea07133. 543
Kebreab, E., France, J., Bever, D.E., Castillo, A.R. (2001) Nitrogen pollution by dairy cows 544
and its mitigation by dietary manipulation. Nutrient Cycling in Agroecosystems 60: 275-285. 545
Olmos Colmenero, J.J., Broderick, G.A. (2006) Effect of dietary crude protein concentration 546
on milk production and nitrogen utilization in lactating dairy cows. Journal of Dairy Science 547
89: 1704-1712. Doi:10.3168/jds.S0022-0302(6)72238-X. 548
Pablo Keim, J., Anrique, R., 2011. Nutritional strategies to improve nitrogen use efficiency 549
by grazing dairy cows. Chilean Journal of Agricultural Research 71: 623-633. 550
Page 24 of 29
http://www.publish.csiro.au/nid/72.htm
Animal Production Science

For Review O
nly
25
Powell, J.M., Gourley, C.J.P., Rotz, C.A., Weaver, D.M., 2010. Nitrogen use efficiency: A 551
potential performance indicator and policy tool for dairy farms. Environmental Science & 552
Policy 13: 217-228. doi:10.1016/j.envsci.2010.03.007. 553
Rawnsley, R.P., Chapman, D.F., Jacobs, J.L., Garcia, S.C., Callow, M.N., Edwards, G.R., 554
Pembleton, K.P., 2013. Complementary forages- integration at a whole-farm level. Anim. 555
Prod. Sci. 53:976-987. doi:10.1071/AN12282. 556
Smith, A.P., Western, A.W., 2013. Predicting nitrogen dynamics in a dairy farming 557
catchment using systems synthesis modelling. Agricultural Systems 115, 144-154. 558
doi:10.1016/j.agsy.2012.08.006. 559
Tedeschi, L.O., 2006. Assessment of the adequacy of mathematical models. Agricultural 560
Systems 89, 225-247. doi:10.1016/j.agsy.2005.11.004. 561
Vibart, R.E., Koolaard, J., Barrett, B.A., Pacheco, D., 2009. Exploring the relationships 562
between plant chemical composition and nitrogen partitioning in lactating dairy cows fed 563
ryegrass-based diets. Proceedings of the New Zealand Society of Animal Production 69, 188-564
195. 565
White, T.A., Johnson, I.R., Snow, V.O., 2008. Comparison of outputs of a biophysical 566
simulation model for pasture growth and composition with measured data under dryland and 567
irrigated conditions in New Zealand. Grass and Forage Science 63, 339-349. 568
doi:10.1111/j.1365-2494.2008.00635.x. 569
Whitehead, D.C. 1995. Grassland nitrogen. CAB International: Wallingford, UK. 570
Page 25 of 29
http://www.publish.csiro.au/nid/72.htm
Animal Production Science
For Review O
nly
26
571
Fig 1. Boxplots showing the estimated annual pasture intakes ( ) and supplementary feed 572
intakes ( ) at Elliott (high rainfall cool temperate climate), Ellinbank (high rainfall 573
temperate climate) and Terang (medium rainfall temperate climate) between 1971 and 2000. 574
(Boxplots represent 25th and 75
th percentiles, whiskers represent 10
th and 90
th percentiles, 575
outliers represent 5th and 95
th percentiles, solid lines represent medians and dotted lines 576
represent means). 577
Elliott Ellinbank Terang Elliott. Ellinbank. Terang.
Pasture and supplementary feed intakes
(t DM/cow.annum)
1.0
1.5
2.0
2.5
3.0
3.5
4.0
4.5
5.0
Page 26 of 29
http://www.publish.csiro.au/nid/72.htm
Animal Production Science
For Review O
nly
27
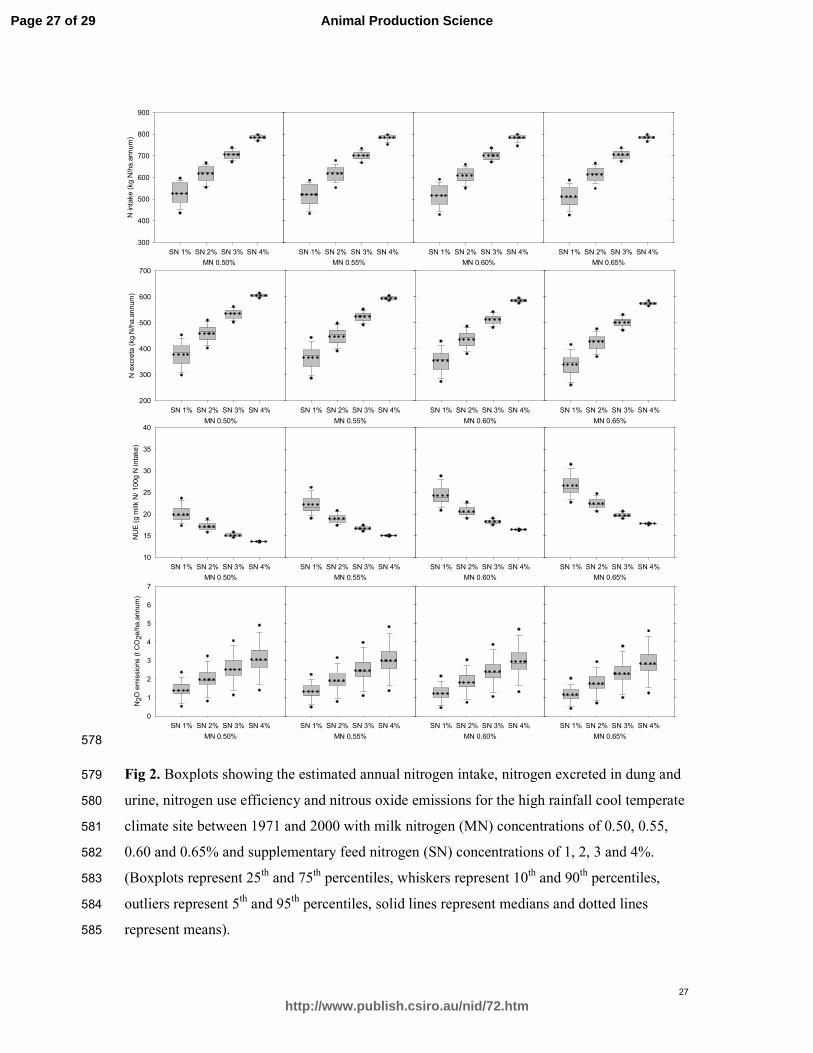
578
Fig 2. Boxplots showing the estimated annual nitrogen intake, nitrogen excreted in dung and 579
urine, nitrogen use efficiency and nitrous oxide emissions for the high rainfall cool temperate 580
climate site between 1971 and 2000 with milk nitrogen (MN) concentrations of 0.50, 0.55, 581
0.60 and 0.65% and supplementary feed nitrogen (SN) concentrations of 1, 2, 3 and 4%. 582
(Boxplots represent 25th and 75
th percentiles, whiskers represent 10
th and 90
th percentiles, 583
outliers represent 5th and 95
th percentiles, solid lines represent medians and dotted lines 584
represent means). 585
MN 0.50%
SN 1% SN 2% SN 3% SN 4%
N intake (kg N/ha.annum)
300
400
500
600
700
800
900
MN 0.55%
SN 1% SN 2% SN 3% SN 4%
MN 0.60%
SN 1% SN 2% SN 3% SN 4%
MN 0.65%
SN 1% SN 2% SN 3% SN 4%
MN 0.50%
SN 1% SN 2% SN 3% SN 4%
N excreta (kg N
/ha.annum)
200
300
400
500
600
700
MN 0.55%
SN 1% SN 2% SN 3% SN 4%
MN 0.60%
SN 1% SN 2% SN 3% SN 4%
MN 0.65%
SN 1% SN 2% SN 3% SN 4%
MN 0.60%
SN 1% SN 2% SN 3% SN 4%
MN 0.50%
SN 1% SN 2% SN 3% SN 4%
NUE (g m
ilk N/ 100g N
intake)
10
15
20
25
30
35
40
MN 0.55%
SN 1% SN 2% SN 3% SN 4%
MN 0.65%
SN 1% SN 2% SN 3% SN 4%
MN 0.60%
SN 1% SN 2% SN 3% SN 4%
MN 0.50%
SN 1% SN 2% SN 3% SN 4%
N2O emissions (t CO2e/ha.annum)
0
1
2
3
4
5
6
7
MN 0.55%
SN 1% SN 2% SN 3% SN 4%
MN 0.65%
SN 1% SN 2% SN 3% SN 4%
Page 27 of 29
http://www.publish.csiro.au/nid/72.htm
Animal Production Science
For Review O
nly
28
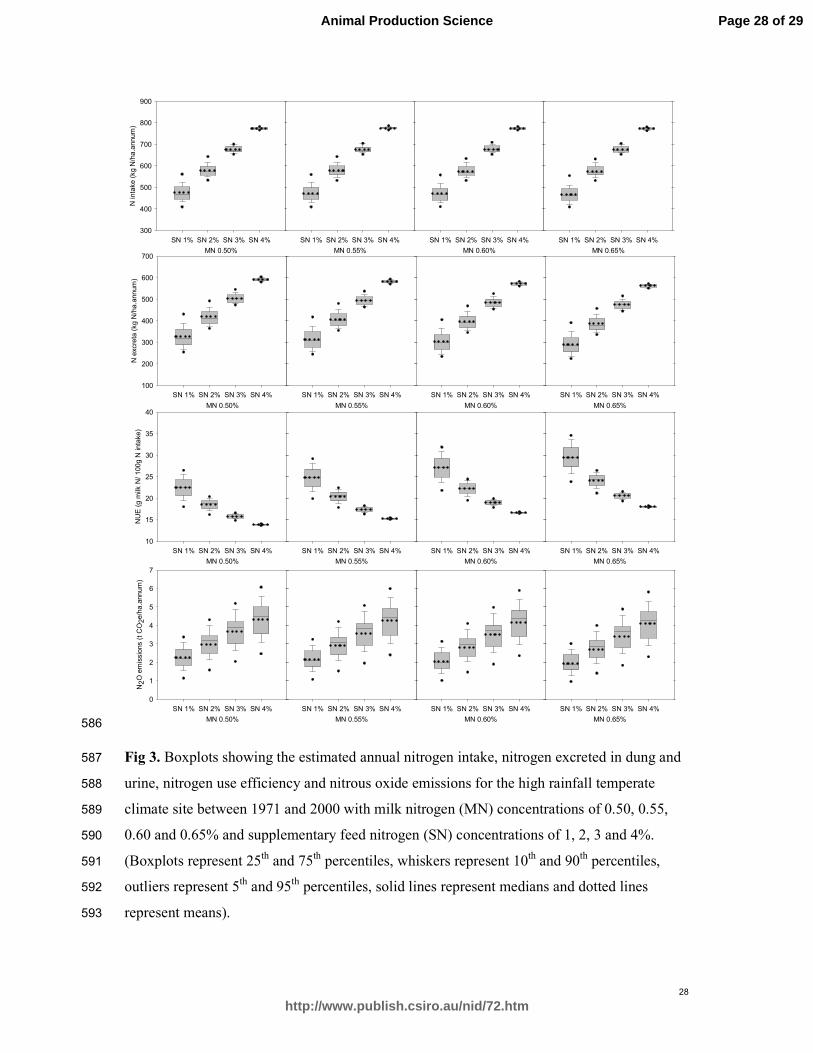
586
Fig 3. Boxplots showing the estimated annual nitrogen intake, nitrogen excreted in dung and 587
urine, nitrogen use efficiency and nitrous oxide emissions for the high rainfall temperate 588
climate site between 1971 and 2000 with milk nitrogen (MN) concentrations of 0.50, 0.55, 589
0.60 and 0.65% and supplementary feed nitrogen (SN) concentrations of 1, 2, 3 and 4%. 590
(Boxplots represent 25th and 75
th percentiles, whiskers represent 10
th and 90
th percentiles, 591
outliers represent 5th and 95
th percentiles, solid lines represent medians and dotted lines 592
represent means). 593
MN 0.55%
SN 1% SN 2% SN 3% SN 4%
MN 0.60%
SN 1% SN 2% SN 3% SN 4%
MN 0.65%
SN 1% SN 2% SN 3% SN 4%
MN 0.50%
SN 1% SN 2% SN 3% SN 4%
N intake (kg N/ha.annum)
300
400
500
600
700
800
900
MN 0.50%
SN 1% SN 2% SN 3% SN 4%
N excreta (kg N/ha.annum)
100
200
300
400
500
600
700
MN 0.55%
SN 1% SN 2% SN 3% SN 4%
MN 0.60%
SN 1% SN 2% SN 3% SN 4%
MN 0.65%
SN 1% SN 2% SN 3% SN 4%
MN 0.60%
SN 1% SN 2% SN 3% SN 4%
MN 0.55%
SN 1% SN 2% SN 3% SN 4%
MN 0.65%
SN 1% SN 2% SN 3% SN 4%
MN 0.50%
SN 1% SN 2% SN 3% SN 4%
NUE (g m
ilk N
/ 100g N intake)
10
15
20
25
30
35
40
MN 0.60%
SN 1% SN 2% SN 3% SN 4%
MN 0.55%
SN 1% SN 2% SN 3% SN 4%
MN 0.65%
SN 1% SN 2% SN 3% SN 4%
MN 0.50%
SN 1% SN 2% SN 3% SN 4%
N2O emissions (t CO2e/ha.annum)
0
1
2
3
4
5
6
7
Page 28 of 29
http://www.publish.csiro.au/nid/72.htm
Animal Production Science
For Review O
nly
29
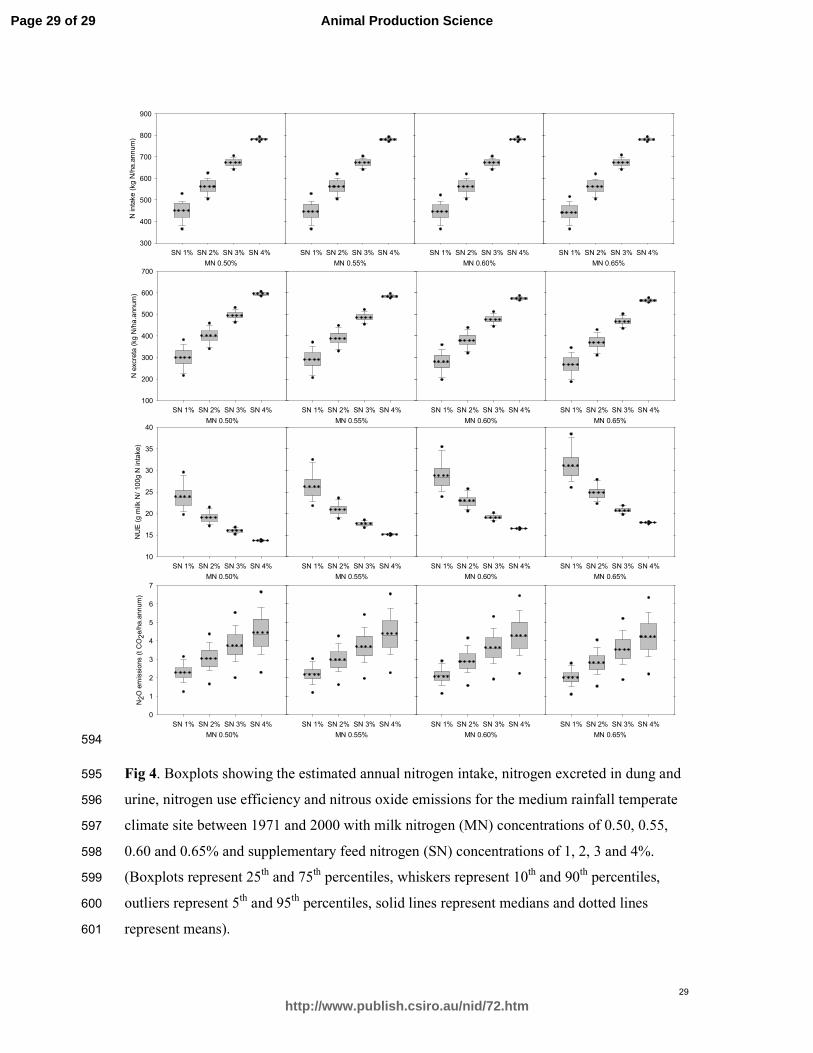
594
Fig 4. Boxplots showing the estimated annual nitrogen intake, nitrogen excreted in dung and 595
urine, nitrogen use efficiency and nitrous oxide emissions for the medium rainfall temperate 596
climate site between 1971 and 2000 with milk nitrogen (MN) concentrations of 0.50, 0.55, 597
0.60 and 0.65% and supplementary feed nitrogen (SN) concentrations of 1, 2, 3 and 4%. 598
(Boxplots represent 25th and 75
th percentiles, whiskers represent 10
th and 90
th percentiles, 599
outliers represent 5th and 95
th percentiles, solid lines represent medians and dotted lines 600
represent means). 601
MN 0.60%
SN 1% SN 2% SN 3% SN 4%
MN 0.50%
SN 1% SN 2% SN 3% SN 4%
N2O emissions (t CO2e/ha.annum)
0
1
2
3
4
5
6
7
MN 0.55%
SN 1% SN 2% SN 3% SN 4%
MN 0.65%
SN 1% SN 2% SN 3% SN 4%
MN 0.50%
SN 1% SN 2% SN 3% SN 4%
N excreta (kg N
/ha.annum)
100
200
300
400
500
600
700
MN 0.55%
SN 1% SN 2% SN 3% SN 4%
MN 0.60%
SN 1% SN 2% SN 3% SN 4%
MN 0.65%
SN 1% SN 2% SN 3% SN 4%
MN 0.60%
SN 1% SN 2% SN 3% SN 4%
MN 0.50%
SN 1% SN 2% SN 3% SN 4%
NUE (g m
ilk N/ 100g N intake)
10
15
20
25
30
35
40
MN 0.55%
SN 1% SN 2% SN 3% SN 4%
MN 0.65%
SN 1% SN 2% SN 3% SN 4%
MN 0.50%
SN 1% SN 2% SN 3% SN 4%
N intake (kg N
/ha.annum)
300
400
500
600
700
800
900
MN 0.55%
SN 1% SN 2% SN 3% SN 4%
MN 0.60%
SN 1% SN 2% SN 3% SN 4%
MN 0.65%
SN 1% SN 2% SN 3% SN 4%
Page 29 of 29
http://www.publish.csiro.au/nid/72.htm
Animal Production Science
Copyright © 2022 FDOKUMEN