A surrogate model based on feature selection techniques and ...

Uc
AH
a
ARRA
KSTSCS
1
otwIoTrd
(
0h
Accident Analysis and Prevention 61 (2013) 23– 32
Contents lists available at ScienceDirect
Accident Analysis and Prevention
journa l h om epage: www.elsev ier .com/ locate /aap
se of speed profile as surrogate measure: Effect of traffic calming devices onrosstown road safety performance
na Tsui Moreno ∗, Alfredo Garcíaighway Engineering Research Group (HERG), Universitat Politècnica de València, Camino de Vera, s/n, 46071 Valencia, Spain
r t i c l e i n f o
rticle history:eceived 29 November 2011eceived in revised form 5 September 2012ccepted 23 October 2012
eywords:urrogate safety measureraffic calmingpeed profileonsistencypeeding
a b s t r a c t
Urban road safety management is usually characterized by the lack of sufficient, good quality crash dataand low budgets to obtain it even though many traffic accidents occur there. For example, 54 percent ofroad crashes in Spain take place in urban areas, and 10 percent of urban fatal crashes occur on crosstownroads, which are rural roads that traverse small communities. Traffic calming measures (TCMs) are oftenimplemented on these parts of rural roads that traverse small communities in order to reduce both thefrequency and severity of crashes by lowering speeds, but evaluation of their effectiveness has beenlimited. The objective of this study was to develop a methodology using continuous speed profiles toevaluate the safety effectiveness of TCMs on crosstown roads as part of an integrated system in theabsence of historical data. Given the strong relationship between speed and crash experience, safetyperformance can be related to speed. Consequently, speed can be used indirectly as a surrogate safetymeasure in the absence of crash and speed data.
Two indexes were defined in this study as surrogate safety measures based on the continuous speedprofile: Ra and Ea. Ra represents the absolute accumulated speed variations relative to the average speedand is inversely related to accumulated speed uniformity; and Ea represents the accumulated speedvariations above the speed limit and is directly related to accumulated speeding. Naturalistic data werecollected using GPS trackers for 12 scenarios with different TCM spacings. Then, the indexes were appliedto individual observed speed profiles (individual analysis) as well as the operating speed profile (globalanalysis). The values obtained from individual and global analysis were statistically different. Spacing
lower than 110 m, which was found optimal from previous research, did not allow drivers to modifytheir speeds as the accumulated speed uniformity was quite similar regardless of the average operatingspeed; and, accumulated speeding was also minimized. Consequently, the scenarios where the TCMswere implemented according to the technical criteria presented a better design quality. On the otherhand, age and gender differences did not seem to affect the average speeds or the accumulated speeduniformity and accumulated speeding.. Introduction
Improving road safety in both urban and rural areas is a majorbjective of the Spanish Traffic Agency (Spanish General Direc-orate of Traffic). In 2010 in Spain, 54 percent of severe road crashes,hich includes injury and fatal crashes, took place in urban areas.
n crosstown roads, 10 percent of urban fatalities took place innly 1.3 percent of severe urban crashes (Dirección General de
ráfico, 2011). Crosstown roads are the parts of two-lane ruraloads which traverse small populated areas. Consequently, mostrivers are through-traffic and need to be able to adapt from rural to∗ Corresponding author. Tel.: +34 963877374; fax: +34 963877379.E-mail addresses: [email protected] (A.T. Moreno), [email protected]
A. García).
001-4575/$ – see front matter © 2012 Elsevier Ltd. All rights reserved.ttp://dx.doi.org/10.1016/j.aap.2012.10.013
© 2012 Elsevier Ltd. All rights reserved.
urban driving conditions. Crosstown roads are common in Europeand they are characterized by low-medium traffic volumes (annualaverage daily traffic between 500 and 8000 vehicles per day), whichresults in a relatively low number of crashes. However, Spanishtraffic databases usually lack reliable data so traditional urban roadsafety management based on road crashes and fatalities may notbe the most appropriate approach due to a lack of crash data ofstatistical significance.
Surrogate safety measures based on roadway characteristics areoften defined in order to indirectly assess road safety managementwhere historical crash data are limited or unavailable. On ruralhighways, the relationship between consistency and safety level
was ascertained (Polus and Mattar-Habib, 2004; Polus et al., 2005).Some authors developed surrogate measures related to speed vari-ations and crash rates on rural roads. The definition of the surrogatemeasures varied from difference between pre-crash and normal
2 nalysi
cot(pcsrocLtueysfstaoruClmarTpsTum
ess1ecrchen(iwsssc
pPtubtwsGoba
4 A.T. Moreno, A. García / Accident A
ondition traveling speeds (Solomon, 1964) to standard deviationf speeds (Garber and Gadiraju, 1989; Aljanahi et al., 1999) orhe difference between the operating speed and the mean speedLave, 1985; Rodriguez, 1990). Lamm and Choueiri (1995) pro-osed two criteria: the operating speed difference between twoonsecutive elements and the difference between the operatingpeed and the design speed. This second criterion was incorpo-ated into the Interactive Highway Safety Design Model (IHSDM)f the Federal Highway Administration (2010) in the design-onsistency module. Cafiso et al. (2007) used the measures ofamm and Choueiri to assess two-lane rural road consistency onhe Italian road network. However, the former surrogate meas-res are calculated in one specific location rather than along anntire section. Polus and Mattar-Habib (2004) introduced anal-sis of the operating speed profile to evaluate consistency andafety level. Their main hypothesis was that improved speed uni-ormity along a roadway section resulted in better quality and lesstrain in driving, thus improving safety. They defined two consis-ency measures: the relative area bounded by the speed profilend the average weighted speed (Ra) and the standard deviationf the operating speeds (�). As design consistency increased, crashates were shown to decrease significantly. Both consistency meas-res provided an assessment of consistency similar to Lamm andhoueiri. However, Polus and Mattar-Habib’s measures were calcu-
ated for the entire segment under research, and their consistencyodel was based on operating speed prediction models on curves
nd tangents as well as estimated acceleration and decelerationates to complete the operating speed profile. Similarly, Camacho-orregrosa et al. (2013) developed a consistency model thatresents the relationship between the crash data and the operatingpeed measures of several two-lane rural road segments in Spain.heir variables were obtained from operating speed profiles builttilizing the operating speeds and the deceleration/accelerationodels.In urban areas, such as crosstown roads, operating speed mod-
ls are fewer than for two-lane rural roads. In fact, only a fewtudies developed operating speed models for low-speed urbantreets (Poe et al., 1996, 1998; Fiztpatrick et al., 1997; Bonneson,999; Poe and Mason, 2000; Fitzpatrick et al., 2001, 2003; Wangt al., 2006). Poe et al. (1996) concluded that access and land useharacteristics influenced operating speed. A regression model car-ied out by Poe et al. (1998) showed that alignment and trafficontrol explained a large part of the speed variation, although aigh correlation between both variables was detected. Fitzpatrickt al. (2003) found that posted speed limits were the most sig-ificant variable for both curve and tangent sections. Wang et al.2006) used in-vehicle GPS technologies to determine the operat-ng speed on urban streets. They found that the operating speed
as influenced by the number of lanes; the roadside object den-ity; the density of T-intersections; the presence of raised curbs,idewalks, and on-street parking; and land use. However, notudies to date have developed a correlation between speed andrashes.
If one considers the previous speed models, the operating speedrofile of a crosstown road could be estimated and evaluated usingolus measures. However, the speeding problem along rural roadshat pass through populated areas is usually handled in Europe bysing traffic calming measures (TCMs). TCMs only affect speedsecause most of the drivers on the route are through-traffic. Fur-hermore, possible detours to local streets with lower speed limitsould lead to higher delays as the travel distance is increased, the
peeds are reduced, and the merge priority to the rural road is lost.
iven that TCMs involve traffic control in only one location, specificperating speed models should be considered. Several studies haveeen conducted to evaluate the effectiveness on speed reductionnd operating speed by individual TCMs; and the results of theses and Prevention 61 (2013) 23– 32
studies have been summarized in several publications (Departmentfor the Environment, Transport and the Regions, 2000; Elvik et al.,2009; Ewing and Brown, 2010; Federal Highway Administration,2009; Transportation Research Board, 2011).
TCM acceleration and deceleration rates also have beenassessed. Barbosa et al. (2000) studied mean acceleration anddeceleration rates by the types of measures based on continu-ous speed profiles. The deceleration rates varied from −0.25 to−0.82 m/s2, while the acceleration rates were set between 0.24and 0.50 m/s2. Therefore, the implementation of TCMs usuallyproduced an irregular speed profile with frequent, unnecessarydecelerations and accelerations. Studies showed that the spacingbetween TCMs was a key factor on speed reduction (Ewing et al.,1996; Ewing, 1999; Barbosa et al., 2000; Cottrell et al., 2006; Torreset al., 2010; Bassani et al., 2011; Moreno et al., 2011). Hence, most ofthe guidelines and recommendations to date propose the geome-try for TCMs and their optimal spacing to reduce speeding in urbanareas; and the assessment of TCMs implemented along a segmenttherefore is often characterized by average speed reduction ratherthan the consistency of the resulting speed profile or accumulatedspeeding along the segment. Moreover, the uniformity of a speedprofile on a calmed crosstown road has never been assessed.
Some authors (Poe et al., 1998; Freedman, 1999; Park andSaccomanno, 2006), on the other hand, mentioned that the use ofaggregate statistics fails to recognize the probability distributionof the individual observed values. The apparent improvement inexplaining the variation of the parameter is shown by the aggrega-tion speed data, which may reduce the individual extreme valuesand overestimate the consistency and safety level. Therefore, indi-vidual speed profiles should be examined. Individual observationsmay not be available to practitioners, however, in order to deter-mine design quality. Consequently, aggregate values also should beanalyzed in order to find out if the difference between the individualand aggregate values is statistically significant.
Crosstown roads with adequate TCMs separated with optimalspacing would result in a more uniform speed profile and there-fore a more consistent design, which would likely lead to safercrosstown roads in the same way as rural highways. This paperexplores continuous speed profiles obtained from naturalistic driv-ing to evaluate safety performance on calmed crosstown roads.
2. Objectives
The aim of this research was to develop a methodology usingcontinuous speed profiles to evaluate the safety effectiveness oftraffic calming measures (TCMs) on crosstown roads.
The main objectives of the research were as follows: (1) toobserve the behavior and characteristics of drivers in 12 differ-ent scenarios by using GPS trackers; (2) to define two indexes assurrogate safety measure; (3) to apply the surrogate measures toindividual observed speed profiles and aggregated operating speedprofiles; and (4) to analyze the measures’ values depending onthe crosstown road characteristics, such as speed limit, operatingspeed, or traffic calming density. Moreover, the influences of driverage and gender on the proposed indexes also were evaluated. Italso should be noted that this approach considered TCMs as anintegrated system along an entire crosstown road rather than asisolated measures.
3. Field study
3.1. Site selection
For the research, six crosstown roads were selected. Five of thesites had TCMs installed while the sixth location had no TCMs. The
nalysis
fimtrl((h
wtacwtoTtrfisabsovw
T1cAttswcbIwdscc
cwr
TS
A.T. Moreno, A. García / Accident A
rst five crosstown roads were selected according to the recom-endations from a previous road safety study, taking into account
he annual average daily traffic (AADT), the length of the crosstownoad (L), and the type of TCMs. The selected towns were: Albalat dea Ribera (3609 inhabitants); Chelva (1683 inhabitants); Genovés2826 inhabitants); Quatretonda (2472 inhabitants); and Llutxent2538 inhabitants). The TCMs included 16 speed tables, five speedumps and one roundabout (Moreno et al., 2011).
The sixth location was Belgida (723 inhabitants). No TCMsere initially installed on Belgida’s crosstown road. Two pedes-
rian crossings were located on a tangent section. The communitysked the authorities to install TCMs to reduce speeding along therosstown road. The road safety project was implemented in stages,hich allowed deducing the individual effect of different TCMs on
he continuous speed profile: one speed hump; two speed tables;ne speed bump; one chicane; and one set of dragon’s teeth. TheCMs were implemented from the center of the crosstown road tohe extremes: the first measures were located in the middle of theoad while the last measures were at the entrance gates of the traf-c calming plan (first TCM of a crosstown road). A total of sevencenarios were considered: (0) no TCMs; (1) southern speed tablend speed hump construction; (2) northern speed table and speedump installation; (3) chicane construction; (4) dragon’s teeth con-truction; (5) northern speed table removal; and (6) stage 5 afterne year. Consequently, a total of 12 different scenarios (five obser-ations and seven experimentations) with different TCM densitiesere observed.
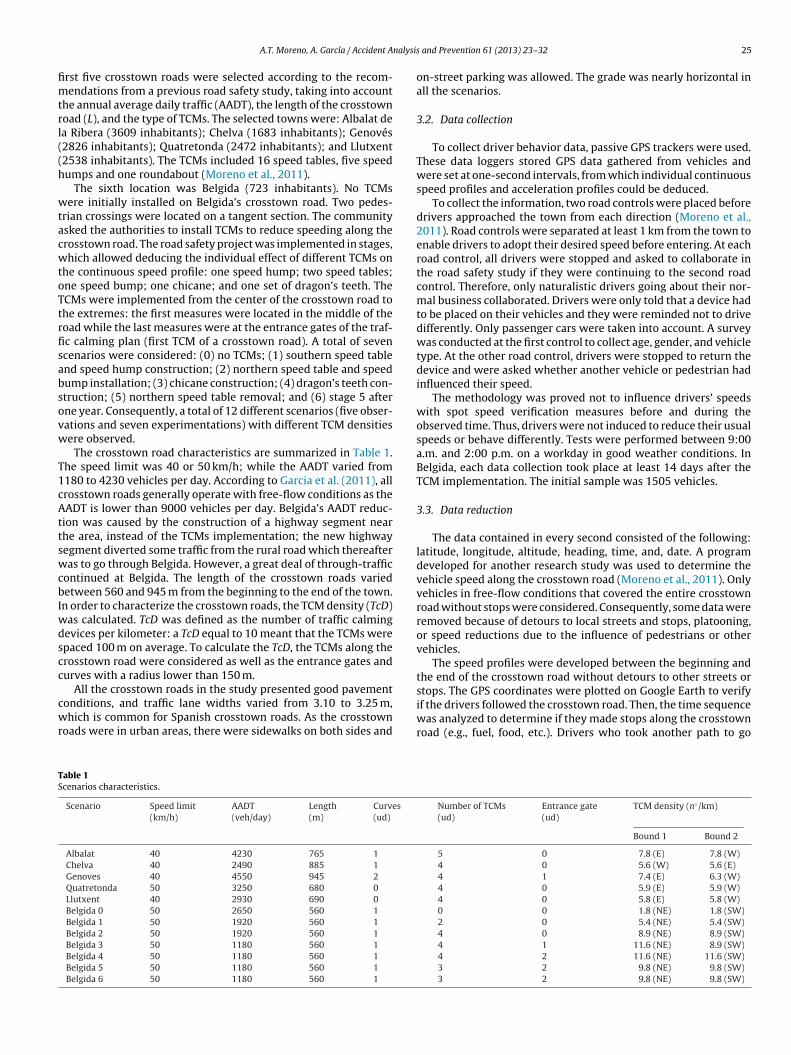
The crosstown road characteristics are summarized in Table 1.he speed limit was 40 or 50 km/h; while the AADT varied from180 to 4230 vehicles per day. According to Garcia et al. (2011), allrosstown roads generally operate with free-flow conditions as theADT is lower than 9000 vehicles per day. Belgida’s AADT reduc-
ion was caused by the construction of a highway segment nearhe area, instead of the TCMs implementation; the new highwayegment diverted some traffic from the rural road which thereafteras to go through Belgida. However, a great deal of through-traffic
ontinued at Belgida. The length of the crosstown roads variedetween 560 and 945 m from the beginning to the end of the town.
n order to characterize the crosstown roads, the TCM density (TcD)as calculated. TcD was defined as the number of traffic calmingevices per kilometer: a TcD equal to 10 meant that the TCMs werepaced 100 m on average. To calculate the TcD, the TCMs along therosstown road were considered as well as the entrance gates andurves with a radius lower than 150 m.
All the crosstown roads in the study presented good pavementonditions, and traffic lane widths varied from 3.10 to 3.25 m,hich is common for Spanish crosstown roads. As the crosstown
oads were in urban areas, there were sidewalks on both sides and
able 1cenarios characteristics.
Scenario Speed limit(km/h)
AADT(veh/day)
Length(m)
Curves(ud)
Albalat 40 4230 765 1
Chelva 40 2490 885 1
Genoves 40 4550 945 2
Quatretonda 50 3250 680 0
Llutxent 40 2930 690 0
Belgida 0 50 2650 560 1
Belgida 1 50 1920 560 1
Belgida 2 50 1920 560 1
Belgida 3 50 1180 560 1
Belgida 4 50 1180 560 1
Belgida 5 50 1180 560 1
Belgida 6 50 1180 560 1
and Prevention 61 (2013) 23– 32 25
on-street parking was allowed. The grade was nearly horizontal inall the scenarios.
3.2. Data collection
To collect driver behavior data, passive GPS trackers were used.These data loggers stored GPS data gathered from vehicles andwere set at one-second intervals, from which individual continuousspeed profiles and acceleration profiles could be deduced.
To collect the information, two road controls were placed beforedrivers approached the town from each direction (Moreno et al.,2011). Road controls were separated at least 1 km from the town toenable drivers to adopt their desired speed before entering. At eachroad control, all drivers were stopped and asked to collaborate inthe road safety study if they were continuing to the second roadcontrol. Therefore, only naturalistic drivers going about their nor-mal business collaborated. Drivers were only told that a device hadto be placed on their vehicles and they were reminded not to drivedifferently. Only passenger cars were taken into account. A surveywas conducted at the first control to collect age, gender, and vehicletype. At the other road control, drivers were stopped to return thedevice and were asked whether another vehicle or pedestrian hadinfluenced their speed.
The methodology was proved not to influence drivers’ speedswith spot speed verification measures before and during theobserved time. Thus, drivers were not induced to reduce their usualspeeds or behave differently. Tests were performed between 9:00a.m. and 2:00 p.m. on a workday in good weather conditions. InBelgida, each data collection took place at least 14 days after theTCM implementation. The initial sample was 1505 vehicles.
3.3. Data reduction
The data contained in every second consisted of the following:latitude, longitude, altitude, heading, time, and, date. A programdeveloped for another research study was used to determine thevehicle speed along the crosstown road (Moreno et al., 2011). Onlyvehicles in free-flow conditions that covered the entire crosstownroad without stops were considered. Consequently, some data wereremoved because of detours to local streets and stops, platooning,or speed reductions due to the influence of pedestrians or othervehicles.
The speed profiles were developed between the beginning andthe end of the crosstown road without detours to other streets or
stops. The GPS coordinates were plotted on Google Earth to verifyif the drivers followed the crosstown road. Then, the time sequencewas analyzed to determine if they made stops along the crosstownroad (e.g., fuel, food, etc.). Drivers who took another path to goNumber of TCMs(ud)
Entrance gate(ud)
TCM density (n◦/km)
Bound 1 Bound 2
5 0 7.8 (E) 7.8 (W)4 0 5.6 (W) 5.6 (E)4 1 7.4 (E) 6.3 (W)4 0 5.9 (E) 5.9 (W)4 0 5.8 (E) 5.8 (W)0 0 1.8 (NE) 1.8 (SW)2 0 5.4 (NE) 5.4 (SW)4 0 8.9 (NE) 8.9 (SW)4 1 11.6 (NE) 8.9 (SW)4 2 11.6 (NE) 11.6 (SW)3 2 9.8 (NE) 9.8 (SW)3 2 9.8 (NE) 9.8 (SW)

26 A.T. Moreno, A. García / Accident Analysis and Prevention 61 (2013) 23– 32
speed
td
totdvtecwtttcsofitsni
fltt
4
mfiscjht
Ra is defined as the normalized relative area (per unit length)bounded between the speed profile and the average speed line.The measure can be applied to individual speed profiles or to theoperating speed profile. The first step was to calculate the average
Fig. 1. 25 Individual
hrough the community were discarded as well as the stoppedrivers.
As far as the road controls, the vehicles whose drivers agreedo participate in the study were delayed at least two minutes inrder to give them enough free space ahead. As stated, the AADT ofhe rural roads generally was not high; and if some platooning wasetected on the road controls, the test was stopped until the trafficolume was lower. In this way, the research team tried to assurehe free-flow conditions. However, it was possible for drivers toncounter slower vehicles along the segment between the trafficontrols. To overcome this problem, the individual speed profilesere examined, including the rural road sections before and after
he crosstown road. The individual speed profiles were plotted onhe same graph as the speed percentiles (15, 30, 50, 70 and 85). Ifhe individual speed profile was “normal”, it was between two per-entiles of the whole segment or with slight variations. Individualpeed profiles that were in a high percentile and varied from thatne to a lower one and maintained it (i.e., 85–30) were meant tond a slower vehicle and be influenced by the platoon; therefore,hat individual speed profile was removed. Further, if the individualpeeds were locally reduced on one section but the percentiles didot present a speed reduction, only those vehicles were influenced
n that section and they were removed.Nearly 30% of the initial sample was discarded due to non-free-
ow conditions, detours, or stopping. Fig. 1 shows an example ofhe observed speed profile of 25 vehicles obtained from the GPSrackers in Genoves’ scenario.
. Surrogate measures
Two indexes were defined in this study as surrogate safetyeasures based on the continuous speed profile: Ra and Ea. The
rst measure evaluates accumulated speed uniformity while theecond measure assesses accumulated speeding along the entire
rosstown road. Accumulated speed uniformity is not sufficientustification to consider good design quality if the speed level isigher than the design speed; thus, both measures should be usedo determine design quality. Fig. 2 represents the concept.profiles of Genoves.
Fig. 2. Speed profile and surrogate measures of Belgida 5 – NW: (a) accumulatedspeed uniformity and (b) accumulated speeding.

nalysis
sbwaTE
R
w
btpawwibt
E
w
scsc
5
ranua
•
•
so
A.T. Moreno, A. García / Accident A
peed of the speed profile along the crosstown road. Then, the areasounded between the speed profile and the average speed line (Ari)ere obtained (Fig. 2a). The consistency measure is the sum of the
bsolute value of the areas divided by the length of the segment (L).herefore, Ra is reversely related to accumulated speed uniformity.q. (1) can be applied.
a =∑
Ari
L(1)
here:
Ra: relative area measure of uniformity (m/s) – speeds should bemeasured in m/s∑
Ari: sum of areas (absolute values) bounded between the speedprofile and the average speed (m2/s)L: crosstown road length (m).
Ea is the normalized relative area (per unit length) boundedetween the speed profile values higher than the speed limit andhe speed limit line. The measure can be applied to individual speedrofiles or to an operating speed profile. Given the speed limit, thereas bounded between the speed profile and the speed limit lineere determined. Only the areas above the speed limit line (Aei)ere considered in the measure (Fig. 2b). The accumulated speed-
ng was calculated applying Eq. (2) as the sum of the areas dividedy the length of the segment (L). Consequently, Ea is directly relatedo accumulated speeding.
a =∑
Aei
L(2)
here:
Ea: relative area measure of speeding (m/s) – speeds should bemeasured in m/s∑
Aei: sum of areas bounded between the speed profile and thespeed limit where speed is higher than speed limit (m2/s)L: crosstown road length (m)
The proposed measures were calculated based on a continuouspeed profile rather than individual speed differentials betweenonsecutive elements and provide an evaluation of accumulatedpeed uniformity and accumulated speeding along the wholerosstown road under study.
. Results and analysis
As the type and number of TCMs varied on the same crosstownoad depending on the traffic bound, each bound was considereds a different site. Consequently, 24 sites were analyzed in 12 sce-arios. At each site, the average speed, the accumulated speedniformity, and the accumulated speeding were calculated. Twopproaches were considered:
Individual speed profile analysis (individual analysis). From eachindividual speed profile, the average speed, the accumulatedspeed uniformity, and the accumulated speeding were calculated.Afterwards, the 85th percentile of each distribution was deduced(Vmp85, Rap85, Eap85).Operating speed profile analysis (global analysis). The averagespeed, the accumulated speed uniformity, and the accumulatedspeeding of the operating speed profile were calculated (Vmv85,Rav85, Eav85).
All the variables needed to be normally distributed among theites in order to fulfill the assumptions of the statistical tests. More-ver, the individual speed profile values of the variables also needed
and Prevention 61 (2013) 23– 32 27
to be distributed as a normal distribution on each site. The proba-bility plot, skewness, and kurtosis were analyzed in each case.
The average speeds at all the sites were normally distributed.From each normal distribution, the 85th percentile was calculated(average individual speed – Vmp85). Then, the average individualspeed among the sites was tested and found to be normally dis-tributed. The probability plot, skewness, and kurtosis values werewithin the limits of a normal distribution. The average speeds of theoperating speed profile of each site then were obtained (Vmv85).The average operating speed among the sites was also normallydistributed.
The Ra was calculated for each individual speed profile alongthe crosstown roads, except for Belgida, which was 0 because of theabsence of TCMs. Then, the accumulated speed uniformity valueswere checked and found to be normally distributed on each site.The results indicate that the Ra was distributed as a normal dis-tribution on each site. Then, the 85th percentile of the individualaccumulated speed uniformity was calculated for each site (indi-vidual accumulated speed uniformity – Rap85). The distribution ofindividual uniformity among the sites was found to be normallydistributed. Subsequently, the accumulated speed uniformity of theoperating speed profile of each site was obtained (global accumu-lated speed uniformity – Rav85) and all were found to be distributedas a normal distribution among sites.
Accumulated speeding was evaluated using Ea, which is theindex directly related to accumulated speeding. Eq. (2) was appliedto all the individual speed profiles. Then, it was verified if the indi-vidual accumulated speeding values were distributed as a normaldistribution on each site. It was determined that the individualaccumulated speeding values did not follow a normal distribution;and the variable consequently was transformed to the square rootof the accumulated speeding, which was normally distributed oneach site. Therefore, the variable under analysis was calculated asthe square root of the accumulated speeding (Ea0.5). From eachnormal distribution of Ea0.5, the 85th percentile was calculated(individual accumulated speeding – Ea0.5
p85). From each operat-ing speed profile, the accumulated speeding was calculated andthen transformed to its square root (global accumulated speeding– Ea0.5). The transformed global accumulated speeding was dis-tributed as a normal distribution among sites.Table 2 summarizesthe results.
5.1. Average speed
Average speed reduction is a common performance measure oftraffic calming plans. The traditional analysis compares the averagespeed before and after the TCM’s implementation. This first anal-ysis was carried out in this study to determine the overall trafficperformance on the evaluated sites.
The average speed results are shown in Table 2. Vmp85 waslower than Vmv85 at all the sites. To determine whether the differ-ence between Vmv85 and Vmp85 was significant, a pairwise analysiswas carried out. The results of the t-test of the difference betweenthe values on each site indicated that the differences were statis-tically significant (t-statistic = −8.87456, p-valuet-statistic = 0.00000;
= 5%). Consequently, Vmv85 was systematically higher than Vmp85.Aggregation of the individual speed data into the operating speedresulted in a higher value of average speed as the individual speedprofiles distribution was not considered. However, the global andindividual values were close to each other.
An ANOVA test then was executed to verify if the average
individual speeds had an equal average value among the sites.The results (F-statistic = 62.71; dg = 1002; p-valueF-statistic = 0.0000;= 5%) indicated that the average individual speeds had a differentaverage value depending on the site.

28 A.T. Moreno, A. García / Accident Analysis and Prevention 61 (2013) 23– 32
Table 2Average speed, uniformity, and speeding results.
Site Speed limit (km/h) Tc density (units/km) Vm (km/h) Ra (m/s) Ea (m/s)
Vmv85 Vmp85 Rav85 Rap85 Ea0.5v85 Ea0.5
p85
Albalat-W 40 7.8 40.68 38.82 1.31 1.68 0.87 0.75Albalat-E 40 7.8 41.71 40.27 1.08 1.68 0.90 0.94Belgida 0-SW 50 1.8 60.43 58.10 2.98 3.68 1.79 1.68Belgida 0-NE 50 1.8 64.53 63.62 3.18 3.64 2.06 2.06Belgida 1-SW 50 5.4 53.98 54.79 3.72 4.18 1.55 1.55Belgida 1-NE 50 5.4 55.95 53.26 4.04 4.05 1.65 1.49Belgida 2-SW 50 8.9 48.33 44.58 2.94 3.36 1.14 1.08Belgida 2-NE 50 8.9 48.42 45.98 3.27 3.72 1.22 1.22Belgida 3-SW 50 8.9 44.66 43.56 2.17 2.53 0.81 0.82Belgida 3-NE 50 11.6 43.42 41.80 1.30 1.86 0.33 0.40Belgida 4-SW 50 11.6 45.27 43.49 2.33 2.67 0.88 0.79Belgida 4-NE 50 11.6 44.43 41.88 1.29 1.93 0.36 0.40Belgida 5-SW 50 9.8 48.51 46.77 2.06 2.45 0.95 0.96Belgida 5-NE 50 9.8 46.79 45.05 0.98 1.88 0.42 0.47Belgida 6-SW 50 9.8 50.94 49.74 2.33 2.59 1.24 1.14Belgida 6-NE 50 9.8 48.84 47.83 1.08 1.79 0.65 0.70Chelva-E 40 5.6 42.97 41.35 1.33 1.72 1.07 1.05Chelva-W 40 5.6 43.10 41.30 1.54 2.06 1.13 1.06Genoves-W 40 6.3 40.06 38.47 1.51 2.01 0.87 0.85Genoves-E 40 7.4 42.35 40.95 1.69 2.13 1.07 1.04Llutxent-W 40 5.8 45.50 43.90 0.98 1.52 1.25 1.20Llutxent-E 40 5.8 43.61 43.14 1.25 1.63 1.10 1.07Quatretonda-W 50 5.9 51.40 50.00 2.02 2.41 1.11 1.03
4
ffa
ovsamtta(T(˛
otas
V
V
w
ttlc
c
Quatretonda-E 50 5.9
As the assumptions of the multiple regression analysis wereulfilled, a forward-selection multiple regression analysis was per-ormed to determine the variables that influenced the globalverage speed (Vmv85) and the individual average speed (Vmp85).
The most important variable that influenced the averageperating speed among the sites was the posted speed limit (p-aluemodel = 0.0003; p-valuevlim = 0.0090; = 5%, r2
adj= 46%). The
peed limit was usually defined by the crosstown road alignment,nd the traffic calming measure type and geometry was often deter-ined by the speed limit. Given this common relationship among
he speed limit, the crosstown road alignment, and the TCMs type,he average speed analysis, which depends on the speed limit,lso included the crosstown road alignment and the TCM type. Eq.3) shows the prediction model of the average operating speed.hen, traffic calming density (TcD) was introduced in the modelp-valuemodel = 0.0000; p-valuevlim = 0.0000; p-valueTcD = 0.0000;
= 5%, r2adj
= 77%). Eq. (4) shows the prediction model dependingn both the speed limit and the TcD. As observed, the higher theraffic calming density is, the lower the average operating speed is,nd the higher the speed limit is, the higher the average operatingpeed is.
mv85 = 18.488 + 0.600 · Vlim r2adj = 46% (3)
mv85 = 15.547 + 0.871 · Vlim − 1.194 · TcD r2adj = 77% (4)
here:
Vmv85: average operating speed (km/h)Vlim: speed limit (km/h).TcD: traffic calming density (number/km).
On the other hand, the average operating speed was comparedo the speed limit; and only crosstown roads with a TcD higherhan 9 presented an average operating speed lower than the speed
imit. Thus, traffic calming density was determined a key factor inontrolling the average operating speed and accumulated speeding.Individual analysis showed similar results with loweroefficient of determination. The models are given in Eq. (5)
8.06 45.82 2.10 2.66 0.89 0.82
(p-valuemodel = 0.0011; p-valuevlim = 0.0011; = 5%, r2adj
= 39%).and Eq. (6) (p-valuemodel = 0.0000; p-valuevlim = 0.0000; p-valueTcD = 0.0001; = 5%, r2
adj= 72%).
Vmp85 = 18.111 + 0.573 · Vlim r2adj = 39% (5)
Vmp85 = 14.965 + 0.863 · Vlim − 1.278 · TcD r2adj = 72% (6)
where:
Vmp85: average individual speed (km/h)Vlim: speed limit (km/h)TcD: traffic calming density (number/km).
5.2. Accumulated speed uniformity
The uniformity of the speed profile along the entire calmedcrosstown road was assessed by using the index Ra, which isinversely related to the accumulated speed uniformity. The resultsare summarized in Table 2.
The global and individual values were compared; and the globalaccumulated speed uniformity was always lower than individualaccumulated speed uniformity. The results of the t-test on the vari-able Rav85 − Rap85 indicated that the difference was statisticallysignificant (t-statistic = 12.4673, p-valuet-statistic = 0.00000 = 5%).The operating speed profile was obtained as the aggregated valueof the individual speeds, section to section. Consequently, the vari-ability of the individual speed distribution was being lost throughdata aggregation in a single descriptive value. Thus, the uniformityof the operating speed profile had better results than the uniformityof the individual speed profile, and its corresponding Ra was statis-tically lower, which statistically confirms the previous hypothesis(Poe et al., 1998; Freedman, 1999; Park and Saccomanno, 2006).
An ANOVA test analyzed whether the individuals Ra averagevalue in each site were equal. Statistical differences among the
average values of Ra were found (F-statistic = 76.10; dg = 862; p-valueF-statistic = 0.0000; = 5%).Multiple regression assumptions were verified, and a forward-selection multiple regression analysis then was carried out on the

nalysis and Prevention 61 (2013) 23– 32 29
ga
uE5r
tlvimtas
R
R
w
rtT6wrarsbatCacdr
avMqsgaBac
avmifcr
u
Table 3Thresholds for the determination of design uniformity quality.
Global accumulated speed uniformity Design quality
A.T. Moreno, A. García / Accident A
lobal accumulated speed uniformity (Rav85) and the individualccumulated speed uniformity (Rap85).
The parameter which better explained the accumulated speedniformity variation was the average operating speed. As seen inq. (7) (p-valuemodel = 0.0001; p-valuevlim = 0.0001; = 5%, r2
adj=
3%) and Eq. (8) (p-valuemodel = 0.0000; p-valuevlim = 0.0000; = 5%,2adj
= 55%). The higher the average operating speed was, the higherhe Ra was. Therefore, higher average operating speeds causedower accumulated speed uniformity for both the global and indi-idual analyses. As stated before, the average operating speed wasnfluenced by the TCM type and the speed limit. A lower unifor-
ity within the profile may be caused by a lower consistency inhe implemented TCMs that may have caused drivers to acceler-te and decelerate more aggressively; hence, the inconsistency ofpeeds on the entire crosstown road was higher.
av85 = −5.277 + 0.155 · Vmv85 r2adj = 53% (7)
ap85 = −4.157 + 0.141 · Vmv85 r2adj = 55% (8)
here:
Vmv85: average operating speed (km/h)Rav85: global accumulated speed uniformity (m/s)Rap85: individual accumulated speed uniformity (m/s).
TcD was also included in the multiple regression model. Theesults indicated that the values should be grouped depending onhe traffic calming density. Therefore, three groups were created.he first group contained the crosstown roads with a TcD lower than
unit/km, which meant that the average spacing between the TCMsas longer than 170 m. The second group was formed by crosstown
oads with TcDs between 6 and 9 unit/km, which included aver-ge spacing from 110 m to 170 m. The third group was crosstownoads with TcDs higher than 9 unit/km and corresponded to optimalpacing according to Garcia et al. (2011). Valid regression modelsetween the accumulated speed uniformity and the average oper-ting speed were found for the first and second groups. However,he p-value of the model for the third group was higher than 0.05.onsequently, no statistical relationship was found between theverage operating speed and the accumulated speed uniformity onrosstown roads with spacing lower than 110 at 95% level of confi-ence. Thus, drivers could not significantly vary their speed, whichesulted in better uniformity regardless of their speed.
On the other hand, global Ra values tended to accumulateround 1.5 m/s; and the lowest values were near 1.0 m/s. Globalalues over 2.0 m/s represented high operating speeds. Polus andattar-Habib (2004) determined thresholds of design consistency
uality based on the design qualities of nine two-lane highwayegments and the results of a sensitivity analysis. To consider aood consistency quality, the Ra should be lower than 1 m/s while
Ra higher than 2 m/s was categorized as poor consistency quality.etween both thresholds, the consistency was defined as accept-ble. The thresholds proposed by Polus and Mattar-Habib wereorrelated then to safety.
Based on the traffic calming qualities of the 22 sites considered,nd using engineering judgment based on the observed conflicts inideos, two preliminary thresholds were proposed to define unifor-ity quality along the crosstown roads. Both thresholds are shown
n Table 3. They are similar to the thresholds that can be estimated
rom this initial assessment of accumulated speed uniformity inalmed crosstown roads. It should be noted that Ra was inverselyelated to accumulated speed uniformity.The best of the observed sites could not be categorized as goodniformity design with the Polus thresholds.
Good Acceptable Poor
Ra (m/s) Ra < 1.5 1.5 ≤ Ra ≤ 2.0 Ra > 2.0
5.3. Accumulated speeding
Accumulated speeding was evaluated using the square root ofthe accumulated speeding index (Ea0.5) as shown in Table 2. Globalaccumulated speeding (Ea0.5
v85) and individual accumulated speed-ing (Ea0.5
p85) were similar to each other regardless of the site. First,
a t-test on the variable Ea0.5v85 − Ea0.5
p85 was carried out to determinewhether the difference between both values was statistically signif-icant. The results of the t-test indicated that the difference betweenthose values was statistically significant (t-statistic = −2.08462, p-valuet-statistic = 0.049499; = 5%).
Secondly, an ANOVA test was carried out to determineif the average values of accumulated speeding among thesites were equal. The results indicated that the averagevalues were statistically different (F-statistic = 1685; dg = 862; p-valueF-statistic = 0.0000; = 5%).
Thirdly, forward-selection multiple regression analysis wasexecuted to identify the influence of the variables on global accu-mulated speeding (Ea0.5
v85) and individual accumulated speeding(Ea0.5
p85). The assumptions of the multiple regression analysis werefulfilled.
The most significant variable on global accumulated speed-ing was the traffic calming density (p-valuemodel = 0.0003;p-valueTcD = 0.0003; = 5%, r2
adj= 46%). As Ea0.5
v85 was directlyrelated to accumulated speeding, and lower spacing betweenTCMs reduced accumulated speeding (Eq. (9)). Then, the aver-age operating speed was introduced on the model of Eq. (10)(p-valuemodel = 0.0000; p-valuevlim = 0.0032; p-valueTcD = 0.0001;
= 5%, r2adj
= 64%). The accumulated speeding increased as the aver-age operating speed increased.
Ea0.5v85 = 1.817 − 0.105 · TcD r2
adj = 46% (9)
Ea0.5v85 = 0.116 + 0.035 · Vmv85 − 0.105 · TcD r2
adj = 64% (10)
where:
Ea0.5v85: global accumulated speeding (m/s)
TcD: traffic calming density (number/km)Vmv85: average operating speed (km/h)
Similar results were obtained on the individual accu-mulated speeding analysis. The models are given in Eq.(11) (p-valuemodel = 0.0004; p-valueTcD = 0.0004; = 5%, r2
adj=
47%) and Eq. (12) (p-valuemodel = 0.0000; p-valuevlim = 0.0033; p-valueTcD = 0.0001; = 5%, r2
adj= 63%).
Ea0.5p85 = 1.817 − 0.105 · TcD r2
adj = 47% (11)
Ea0.5p85 = 0.157 + 0.032 · Vmv85 − 0.085 · TcD r2
adj = 63% (12)
where:
Ea0.5p85: individual accumulated speeding (m/s)
TcD: traffic calming density (number/km)Vmv85: average operating speed (km/h)
30 A.T. Moreno, A. García / Accident Analysi
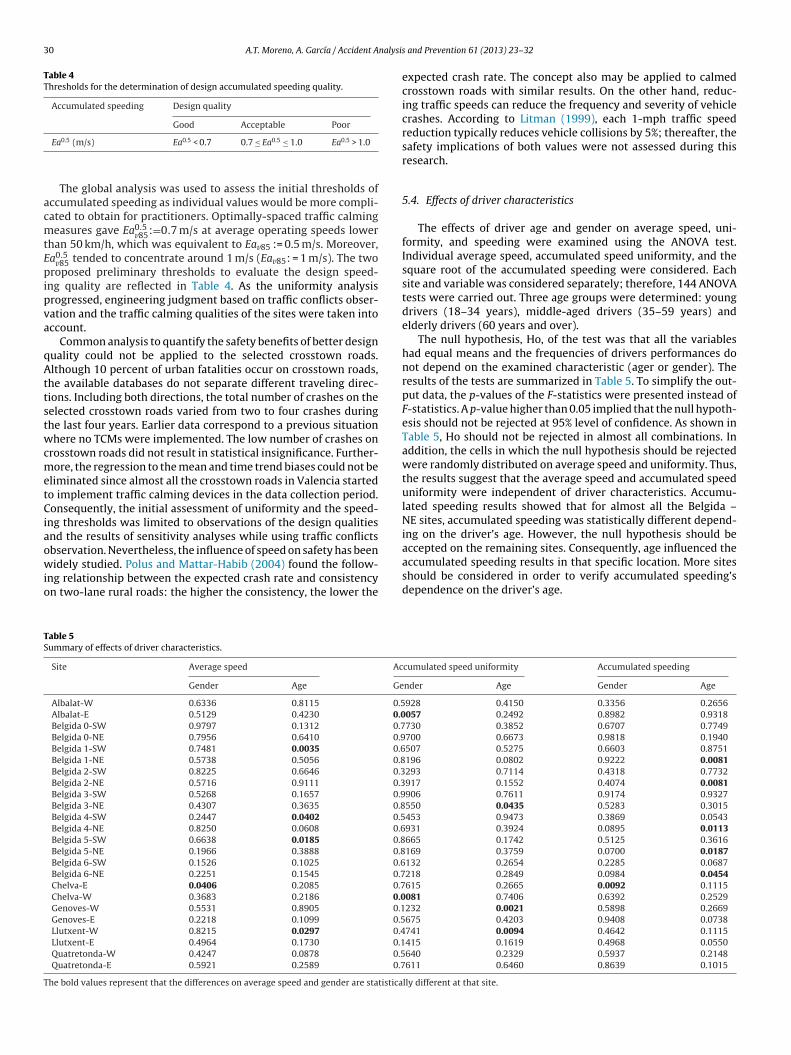
Table 4Thresholds for the determination of design accumulated speeding quality.
Accumulated speeding Design quality
Good Acceptable Poor
acmtEpipva
qAttstwcmetCiaowio
accepted on the remaining sites. Consequently, age influenced the
TS
T
Ea0.5 (m/s) Ea0.5 < 0.7 0.7 ≤ Ea0.5 ≤ 1.0 Ea0.5 > 1.0
The global analysis was used to assess the initial thresholds ofccumulated speeding as individual values would be more compli-ated to obtain for practitioners. Optimally-spaced traffic calmingeasures gave Ea0.5
v85:=0.7 m/s at average operating speeds lowerhan 50 km/h, which was equivalent to Eav85 := 0.5 m/s. Moreover,a0.5
v85 tended to concentrate around 1 m/s (Eav85: = 1 m/s). The tworoposed preliminary thresholds to evaluate the design speed-
ng quality are reflected in Table 4. As the uniformity analysisrogressed, engineering judgment based on traffic conflicts obser-ation and the traffic calming qualities of the sites were taken intoccount.
Common analysis to quantify the safety benefits of better designuality could not be applied to the selected crosstown roads.lthough 10 percent of urban fatalities occur on crosstown roads,
he available databases do not separate different traveling direc-ions. Including both directions, the total number of crashes on theelected crosstown roads varied from two to four crashes duringhe last four years. Earlier data correspond to a previous situationhere no TCMs were implemented. The low number of crashes on
rosstown roads did not result in statistical insignificance. Further-ore, the regression to the mean and time trend biases could not be
liminated since almost all the crosstown roads in Valencia startedo implement traffic calming devices in the data collection period.onsequently, the initial assessment of uniformity and the speed-
ng thresholds was limited to observations of the design qualitiesnd the results of sensitivity analyses while using traffic conflictsbservation. Nevertheless, the influence of speed on safety has been
idely studied. Polus and Mattar-Habib (2004) found the follow-ng relationship between the expected crash rate and consistencyn two-lane rural roads: the higher the consistency, the lower the
able 5ummary of effects of driver characteristics.
Site Average speed Ac
Gender Age Ge
Albalat-W 0.6336 0.8115 0.5Albalat-E 0.5129 0.4230 0.0Belgida 0-SW 0.9797 0.1312 0.7Belgida 0-NE 0.7956 0.6410 0.9Belgida 1-SW 0.7481 0.0035 0.6Belgida 1-NE 0.5738 0.5056 0.8Belgida 2-SW 0.8225 0.6646 0.3Belgida 2-NE 0.5716 0.9111 0.3Belgida 3-SW 0.5268 0.1657 0.9Belgida 3-NE 0.4307 0.3635 0.8Belgida 4-SW 0.2447 0.0402 0.5Belgida 4-NE 0.8250 0.0608 0.6Belgida 5-SW 0.6638 0.0185 0.8Belgida 5-NE 0.1966 0.3888 0.8Belgida 6-SW 0.1526 0.1025 0.6Belgida 6-NE 0.2251 0.1545 0.7Chelva-E 0.0406 0.2085 0.7Chelva-W 0.3683 0.2186 0.0Genoves-W 0.5531 0.8905 0.1Genoves-E 0.2218 0.1099 0.5Llutxent-W 0.8215 0.0297 0.4Llutxent-E 0.4964 0.1730 0.1Quatretonda-W 0.4247 0.0878 0.5Quatretonda-E 0.5921 0.2589 0.7
he bold values represent that the differences on average speed and gender are statistica
s and Prevention 61 (2013) 23– 32
expected crash rate. The concept also may be applied to calmedcrosstown roads with similar results. On the other hand, reduc-ing traffic speeds can reduce the frequency and severity of vehiclecrashes. According to Litman (1999), each 1-mph traffic speedreduction typically reduces vehicle collisions by 5%; thereafter, thesafety implications of both values were not assessed during thisresearch.
5.4. Effects of driver characteristics
The effects of driver age and gender on average speed, uni-formity, and speeding were examined using the ANOVA test.Individual average speed, accumulated speed uniformity, and thesquare root of the accumulated speeding were considered. Eachsite and variable was considered separately; therefore, 144 ANOVAtests were carried out. Three age groups were determined: youngdrivers (18–34 years), middle-aged drivers (35–59 years) andelderly drivers (60 years and over).
The null hypothesis, Ho, of the test was that all the variableshad equal means and the frequencies of drivers performances donot depend on the examined characteristic (ager or gender). Theresults of the tests are summarized in Table 5. To simplify the out-put data, the p-values of the F-statistics were presented instead ofF-statistics. A p-value higher than 0.05 implied that the null hypoth-esis should not be rejected at 95% level of confidence. As shown inTable 5, Ho should not be rejected in almost all combinations. Inaddition, the cells in which the null hypothesis should be rejectedwere randomly distributed on average speed and uniformity. Thus,the results suggest that the average speed and accumulated speeduniformity were independent of driver characteristics. Accumu-lated speeding results showed that for almost all the Belgida –NE sites, accumulated speeding was statistically different depend-ing on the driver’s age. However, the null hypothesis should be
accumulated speeding results in that specific location. More sitesshould be considered in order to verify accumulated speeding’sdependence on the driver’s age.
cumulated speed uniformity Accumulated speeding
nder Age Gender Age
928 0.4150 0.3356 0.2656057 0.2492 0.8982 0.9318730 0.3852 0.6707 0.7749700 0.6673 0.9818 0.1940507 0.5275 0.6603 0.8751196 0.0802 0.9222 0.0081293 0.7114 0.4318 0.7732917 0.1552 0.4074 0.0081906 0.7611 0.9174 0.9327550 0.0435 0.5283 0.3015453 0.9473 0.3869 0.0543931 0.3924 0.0895 0.0113665 0.1742 0.5125 0.3616169 0.3759 0.0700 0.0187132 0.2654 0.2285 0.0687218 0.2849 0.0984 0.0454615 0.2665 0.0092 0.1115081 0.7406 0.6392 0.2529232 0.0021 0.5898 0.2669675 0.4203 0.9408 0.0738741 0.0094 0.4642 0.1115415 0.1619 0.4968 0.0550640 0.2329 0.5937 0.2148611 0.6460 0.8639 0.1015
lly different at that site.
nalysis
6
nr(thsbHv
sawTtublqotalt
Scnevitwtmaccvuss9
Teslluomsprloqaowip
A.T. Moreno, A. García / Accident A
. Conclusions
Crosstown roads are rural roads that go through small commu-ities so most drivers are through-traffic and need to adapt fromural to urban driving conditions quickly. Traffic calming measuresTCMs) are often implemented on crosstown roads to reduce bothhe frequency and severity of crashes. The effectiveness of TCMsas been commonly assessed by means of speed reduction. Theafety implications of traffic calming plans are analyzed generallyased on before–after studies or the Empirical Bayes (EB) method.owever, Spanish crosstown roads are characterized by low trafficolume, which leads to a relatively low number of crashes.
Given the lack of data, surrogate safety measures based onpeed are needed similar to the successful consistency measurespplied to two-lane rural roads. Two surrogate indexes of safetyere defined in this study based on the continuous speed profile.
he first index, Ra, reflects the accumulated absolute uniformity ofhe speed profile, and it is reversely related to accumulated speedniformity. It is calculated as the relative normalized area boundedetween the speed profile and the average speed line. Neverthe-
ess, speed uniformity is not sufficient to guarantee good designuality; speeds should be moderated as well. Consequently, a sec-nd index was needed. The second index, Ea, is directly related tohe accumulated speeding. It is defined as the relative normalizedrea between the speed profile values higher than the posted speedimit and the posted speed limit line. Consequently, only areas overhe posted speed limit line are considered.
The two surrogate measures were applied on 24 different sites.ix crosstown roads were selected; and five of them had trafficalming measures implemented. The sixth crosstown road wasot calmed however, and on this site, a traffic calming plan wasxecuted in five stages. The step-by-step implementation allowedarying the traffic calming density along the crosstown road. Thenitial scenario and the situation one year after the last implemen-ation stage were evaluated. Consequently, 12 different scenariosith different types and locations of TCMs were observed. Con-
inuous speed profiles collected under naturalistic conditions fromore than 1500 different drivers were analyzed. Average speed,
ccumulated speed uniformity, and accumulated speeding werealculated for each vehicle at each site. Two approaches wereonsidered: individual analysis and global analysis. The individualalue was calculated as the 85th percentile of the individual val-es of one site. The global value was calculated from the operatingpeed of the site. Even though global and individual values wereimilar, they were statistically different at a level of confidence of5%.
The indexes varied depending on the crosstown roads’ TCMs.raffic calming density was found to be a key parameter toxplaining both the average operating speed and the accumulatedpeeding variability: the higher traffic calming density was, theower the average operating speed was, and the lower the accumu-ated speeding was. On the other hand, both the accumulated speedniformity and the accumulated speeding depended on the averageperating speed, which was influenced by the crosstown road align-ent, the speed limit, and the type of TCM. As the average operating
peed increased, so did the Ra and Ea indexes. Thus, the speedrofile was less uniform and speeding was higher. However, theelationship between the average operating speed and the accumu-ated speed uniformity was found to be statistically not significantn crosstown roads with spacing similar to optimal (110 m). Conse-uently, once the optimal traffic calming density was achieved, theccumulated speed uniformity was not dependent on the average
perating speed because the capability of drivers to vary speedsas much reduced; therefore, the accumulated speed uniformityndex was similar. Hence, practitioners first should determine theroper type and geometry of TCMs depending on the crosstown
and Prevention 61 (2013) 23– 32 31
road design speed in order to achieve an operating speed similarto the speed limit and decrease speeding; the TCMs then should belocated with spacing similar to the optimal to maximize accumu-lated speed uniformity.
The influences of driver age and gender on the variables alsowere evaluated. No statistical significance of age and gender on thevariables was found. Therefore, it was concluded that the drivercharacteristics in this study did not appear to affect the averagespeed, accumulated speed uniformity, or accumulated speeding.
This paper presented an initial safety performance assessmentof calmed crosstown roads based on continuous speed profilesobtained from naturalistic driving. The design quality evaluationwas based on two surrogate measures: Ra and Ea, which representaccumulated speed uniformity and accumulated speeding along anentire calmed crosstown road. The initial thresholds to determinequality design were proposed based on the global observed valuesof accumulated speed uniformity and accumulated speeding. Thisapproach considered TCMs for the first time as part of an integratedsystem rather than as isolated or segregated measures. Furtherdevelopment of the safety implications of the surrogate measures isneeded in order to calibrate the design quality thresholds of the Raand Ea indexes. Additional crosstown road observations and speedprofile estimations from speed models with different TCM typesand spacings also will be beneficial to the development of this safetyperformance measure.
Acknowledgements
The authors would like to thank the Center for Studiesand Experimentation of Public Works (CEDEX) of the SpanishMinistry of Public Works that subsidized the research (PT-2007-052-23/APM). We also wish to thank the Infrastructure andTransportation Department, General Directorate of Public Works,Valencian Government, Spain, and the Ministry of the Interior, Gen-eral Directorate of Traffic, Spain, for their cooperation during datacollection.
References
Aljanahi, A.A.M., Rhodes, A.H., Metcalfe, A.V., 1999. Speed, speed limits and roadtraffic accidents under free flow conditions. Accident Analysis and Prevention31, 161–168.
Barbosa, H.M., Tight, M.R., May, A.D., 2000. A model of speed profiles for trafficcalmed roads. Transportation Research Part A: Policy and Practice (32), 103–123.
Bassani, M., Dalmazzo, D., Riviera, P.P., 2011. Field investigation on the effect onoperating speed caused by trapezoidal humps. In: Proceedings of the 90th TRBAnnual Meeting, Washington, DC, USA.
Bonneson, J.A., 1999. Side friction and speed as controls for horizontal curve design.Journal of Transportation Engineering 6, 125.
Cafiso, S., La Cava, G., Montella, A., 2007. Safety index for evaluation of two-lanerural highways. Transportation Research Record 2019, 136–145.
Camacho-Torregrosa, F.J., Perez-Zuriaga, A.M., Campoy-Hungria, J.M., Garcia-Garcia,A., 2013. New geometric design consistency model based on operatingspeed profiles for road safety evaluation. Accident Analysis and Prevention,http://dx.doi.org/10.1016/j.aap.2012.10.001.
Cottrell, W., Kim, N., Martin, P., Perrin Jr., H.J., 2006. Effectiveness of traffic manage-ment in Salt Lake City, Utah. Journal of Safety Research 37, 27–41.
Department of the Environment, Transport and the Regions, 2000. New Directionsin Speed Management: A Review of Policy, Rotherham.
Dirección General de Tráfico, 2011. Las Principales Cifras de la Siniestralidad Vialen Espana 2010, Madrid.
Elvik, R., Vaa, T., Hoye, A., Soresen, M., 2009. The Handbook of Road Safety Measures.Emerald Group Publishing Limited, United Kingdom.
Ewing, R., Heflin, C., Deanna, M.B., Porter, D.R., 1996. Best Development Practices.Planners Press, Chicago.
Ewing, R., 1999. Traffic Calming: State of the Practice. Institute of TransportationEngineers.
Ewing, R., Brown, S.J., 2010. U.S. Traffic Calming Manual. American Planning Asso-ciation.
Federal Highway Administration, 2009. Engineering Countermeasures for Reduc-ing Speeds: A Desktop Reference of Potential Effectiveness. Federal HighwayAdministration, Washington, DC, USA.
Federal Highway Administration, 2010. Interactive Highway Safety Design Model.Federal Highway Administration, Washington, DC, USA.

3 nalysi
F
F
F
F
G
G
L
L
L
M
P
2 A.T. Moreno, A. García / Accident A
iztpatrick, K., Shamburger, C.B., Kraemmes, R.A., Fambro, D.B., 1997. Operatingspeed on suburban arterial curves. Transportation Research Record 1579, 89–96.
itzpatrick, K., Carlson, P., Brewer, M., Wooldridge, M., 2001. Design factors thataffect driver speed on suburban streets. Transportation Research Record 1751,18–25.
itzpatrick, K., Carlson, P., Brewer, M.A., Wooldridge, M.D., 2003. Design Speed,Operating Speed, and Posted Speed Practices. National Cooperative HighwayResearch Program (NCHRP) Report 504.
reedman, D.A., 1999. Ecological inference and the ecological fallacy. InternationalEncyclopedia of the Social and Behavioral Sciences 6, 4027–4030.
arcia, A., Torres, A.J., Romero, M.A., Moreno, A.T., 2011. Traffic microsimulationstudy to evaluate the effect of type and spacing of traffic calming devices oncapacity. Procedia Social and Behavioral Sciences 16, 270–281.
arber, N.J., Gadiraju, R., 1989. Factors affecting speed variance and its influence onaccidents. Transportation Research Record 1212, 64–71.
amm, R., Choueiri, E., 1995. The relationship between highway safety and geo-metric design consistence: a case study. In: Road Safety in Europe And StrategicHighway Research Program (SHRP), Lille, France, September 1994.
ave, C.A., 1985. Speeding, coordination, and the 55 mph limit. The American Eco-nomic Review 75, 1159–1164.
itman, T., 1999. Benefits, Costs and Equity Impacts. Victoria Transport Policy Insti-tute.
oreno, A.T., Garcia, A., Romero, M.A., 2011. Speed table evaluation and speedmodeling in cross-town roads. Transportation Research Record 2203, 85–93.
ark, Y., Saccomanno, F., 2006. Evaluating speed consistency between successiveelements of a two-lane rural highway. Transportation Research Part A: Policyand Practice (40), 375–385.
s and Prevention 61 (2013) 23– 32
Poe, C.M., Tarris, J.P., Mason, J.M., 1996. Relationship of operating speed to roadwaygeometric design speeds. Pennsylvania Transportation Institute.
Poe, C., Tarris, J.P., Mason Jr., J.M., 1998. Operating speed approach to geometricdesign of low-speed urban streets. In: Proceedings of the International Sympo-sium on Highway Geometric Design Practices, Boston, MA, USA.
Poe, C.M., Mason, J.M., 2000. Analyzing influence of geometric design on operatingspeeds along low-speed urban streets; mixed-model approach. TransportationResearch Record 1737, 18–25.
Polus, A., Mattar-Habib, C., 2004. New consistency model for rural highwaysand its relationship to safety. Journal of Transportation Engineering 130 (3),286–293.
Polus, A., Pollatschek, M.A., Mattar-Habib, C., Jarroush, J., 2005. An enhanced, inte-grated design-consistency model for both level and mountainous highways andits relationship to safety. Road & Transport Research Journal 14 (4), 13–16.
Rodriguez, R.J., 1990. Speed, speed dispersion and the highway facility rate. SouthernEconomy Journal October, 349–356.
Solomon, D., 1964. Accidents on Main Rural Highways Related to Speed, Driver, andVehicle. U.S. Department of Transportation/Federal Highway Administration,Washington, DC, USA.
Torres, A.J., García, A., Romero, M.A., 2010. Efecto de la Tipología y la Separación delos Elementos Moderadores de la Velocidad sobre la Funcionalidad del Tráfico.In: Proceedings of the IX Congreso de Ingeniería del Transporte, Madrid.
Transportation Research Board, 2011. Speed Reduction Techniques for Rural High-to-Low Speed Transitions, NCHRP Synthesis 412.
Wang, J., Dixon, K.K., Li, H., Hunter, M.P., 2006. Operating speed model for low speedurban tangent streets based on in-vehicle GPS data. Transportation ResearchRecord 1961, 24–33.
Copyright © 2022 FDOKUMEN