Use of plasma proteins as solubilizing agents in in vitro permeability experiments: Correction for...
16
Use of Plasma Proteins as Solubilizing Agents in In Vitro Permeability Experiments: Correction for Unbound Drug Concentration Using the Reciprocal Permeability Approach KASIRAM KATNENI, SUSAN A. CHARMAN, CHRISTOPHER J.H. PORTER Department of Pharmaceutics, Victorian College of Pharmacy, Monash University, Melbourne, Victoria 3052, Australia Received 6 October 2006; revised 16 November 2006; accepted 7 December 2006 Published online in Wiley InterScience (www.interscience.wiley.com). DOI 10.1002/jps.20877 ABSTRACT: The purpose of the present study was to explore the applicability of the reciprocal permeability approach to correct for changes in thermodynamic activity when in vitro permeability data are generated in the presence of plasma proteins. Diazepam (DIA), digoxin (DIG), and propranolol (PRO) permeability was assessed in the presence of bovine serum albumin (BSA) and bovine a-1-acid glycoprotein (AAG). The reciprocal permeability approach was subsequently employed to calculate the true permeability coefficient (Papp corr ) and the operational protein association constant (nK a ). For BSA binding, good agreement was observed between the Papp corr values and Papp values obtained in the absence of protein. For PRO and AAG, where binding affinity was high, deviation in the reciprocal permeability plots was evident suggesting ligand depletion at low drug/high protein concentrations. Bidirectional DIG permeability data in the presence of either BSA or AAG indicated that nether protein had an effect on the efflux transporters involved in DIG permeability. The data suggest that plasma proteins can be utilized in permeability experiments with no adverse effects on transporter function and that the reciprocal permeability approach can be used to correct permeability data for changes in unbound drug concentration. ß 2007 Wiley-Liss, Inc. and the American Pharmacists Association J Pharm Sci 97:209–224, 2008 Keywords: absorption; permeability; in vitro models; intestinal epithelia; protein binding; solubility; P-glycoprotein INTRODUCTION Assessment of the intestinal permeability of lipophilic drugs is often complicated by drug pre- cipitation from the transport buffer and adsorp- tion to the surfaces of the screening apparatus. 1–3 One strategy that can circumvent these issues is to incorporate surfactants, such as Tweens or Pluronics, into transport buffers to promote solubilization and reduce adsorption. 4–6 Although the use of surfactants is effective in reducing drug loss and improving mass balance, they also bring about changes in thermodynamic activity and require that permeability data are corrected for the free drug concentration in order to provide true permeability estimates. Commonly, free drug concentrations are measured directly using equi- librium dialysis. 7–9 Alternatively, the free drug concentration may be calculated indirectly via a knowledge of the micellar association constant (K a ) (which can be derived using equilibrium solubility studies 10 ), and an understanding of the relationship between the micellar surfactant con- centration, K a , and the free drug concentration. Correspondence to: Christopher J.H. Porter (Telephone: þ61-3-9903-9649; Fax: þ61-3-9903-9583; E-mail: [email protected]) Journal of Pharmaceutical Sciences, Vol. 97, 209–224 (2008) ß 2007 Wiley-Liss, Inc. and the American Pharmacists Association JOURNAL OF PHARMACEUTICAL SCIENCES, VOL. 97, NO. 1, JANUARY 2008 209
Transcript of Use of plasma proteins as solubilizing agents in in vitro permeability experiments: Correction for...

Use of Plasma Proteins as Solubilizing Agents in In VitroPermeability Experiments: Correction for Unbound DrugConcentration Using the Reciprocal Permeability Approach
KASIRAM KATNENI, SUSAN A. CHARMAN, CHRISTOPHER J.H. PORTER
Department of Pharmaceutics, Victorian College of Pharmacy, Monash University, Melbourne, Victoria 3052, Australia
Received 6 October 2006; revised 16 November 2006; accepted 7 December 2006
Published online in Wiley InterScience (www.interscience.wiley.com). DOI 10.1002/jps.20877
Correspondeþ61-3-9903-964E-mail: chris.po
Journal of Pharm
� 2007 Wiley-Liss
ABSTRACT: The purpose of the present study was to explore the applicability of thereciprocal permeability approach to correct for changes in thermodynamic activity whenin vitro permeability data are generated in the presence of plasma proteins. Diazepam(DIA), digoxin (DIG), and propranolol (PRO) permeability was assessed in the presenceof bovine serum albumin (BSA) and bovine a-1-acid glycoprotein (AAG). The reciprocalpermeability approach was subsequently employed to calculate the true permeabilitycoefficient (Pappcorr) and the operational protein association constant (nKa). For BSAbinding, good agreement was observed between the Pappcorr values and Papp valuesobtained in the absence of protein. For PRO and AAG, where binding affinity was high,deviation in the reciprocal permeability plots was evident suggesting ligand depletion atlow drug/high protein concentrations. Bidirectional DIG permeability data in thepresence of either BSA or AAG indicated that nether protein had an effect on the effluxtransporters involved inDIG permeability. The data suggest that plasma proteins can beutilized in permeability experiments with no adverse effects on transporter function andthat the reciprocal permeability approach can be used to correct permeability datafor changes in unbound drug concentration. � 2007 Wiley-Liss, Inc. and the American
Pharmacists Association J Pharm Sci 97:209–224, 2008
Keywords: absorption; permeability; i
n vitro models; intestinal epithelia; proteinbinding; solubility; P-glycoproteinINTRODUCTION
Assessment of the intestinal permeability oflipophilic drugs is often complicated by drug pre-cipitation from the transport buffer and adsorp-tion to the surfaces of the screening apparatus.1–3
One strategy that can circumvent these issues isto incorporate surfactants, such as Tweens orPluronics, into transport buffers to promote
nce to: Christopher J.H. Porter (Telephone:9; Fax: þ61-3-9903-9583;[email protected])
aceutical Sciences, Vol. 97, 209–224 (2008)
, Inc. and the American Pharmacists Association
JOURNAL OF P
solubilization and reduce adsorption.4–6 Althoughthe use of surfactants is effective in reducing drugloss and improving mass balance, they also bringabout changes in thermodynamic activity andrequire that permeability data are corrected forthe free drug concentration in order to providetrue permeability estimates. Commonly, free drugconcentrations are measured directly using equi-librium dialysis.7–9 Alternatively, the free drugconcentration may be calculated indirectly via aknowledge of the micellar association constant(Ka) (which can be derived using equilibriumsolubility studies10), and an understanding of therelationship between the micellar surfactant con-centration, Ka, and the free drug concentration.
HARMACEUTICAL SCIENCES, VOL. 97, NO. 1, JANUARY 2008 209

210 KATNENI, CHARMAN, AND PORTER
However, free drug concentrations or free fractiondata obtained using independent methods areprone to errors since the solubilizing conditionsemployed in a solubility experiment do notnecessarily reflect the conditions present duringa permeability experiment where endogenouscompounds inevitably leach from tissues or cellsand compete for micellar drug solubilizationsites.11
In an attempt to overcome this latter issue, ourgroup has recently described an approach (thereciprocal permeability approach) which enablesfree fraction correction of permeability datausing a Ka value obtained directly from perme-ability data generated at a minimum of threedifferent surfactant concentrations.11 Althoughthis approach allows for relatively facile determi-nation of corrected permeability data in thepresence of a solubilizing agent, the use ofsurfactants to enhance drug solubilization iscomplicated by their potential impact on perme-ability via mechanisms unrelated to solubiliza-tion. Recent studies have shown that severalsurfactants including polysorbate 80, CremophorEL, vitamin E TPGS and certain Poloxamers mayalter intestinal permeability, at least in vitro, viainhibition of drug transporter function.7,8,10,12,13
In these studies, most attention has been directedtowards the ability of surfactants to inhibitapically mediated P-glycoprotein (P-gp) efflux,thereby enhancing drug absorption.10,13–15 It isincreasingly apparent, however, that certainsurfactants may inhibit transporters situated onboth the apical and basolateral membranes lead-ing to attenuation of both uptake and efflux13,16
which in turn significantly complicates datainterpretation.
The incorporation of plasma proteins intotransport buffers offers an alternative mechanismfor the improvement of mass balance during theconduct of permeability experiments, without theconfounding effects on transporter function.17,18
Plasma proteins may also be employed in in vitropermeability experiments in an attempt to createmore physiologically relevant models.19–22 Plasmaproteins may be added to the transport buffers ineither the serosal chamber alone (when attempt-ing to more accurately mimic mucosal to serosaldrug absorption across the enterocyte into theplasma) or both chambers (when evaluating, e.g.,drug transport from the plasma across the blood–brain barrier).20,23,24 Being the most abundantprotein in plasma (with concentrations rangingfrom 35 to 50mgmL�1 or 0.5 to 0.75mM), albumin
JOURNAL OF PHARMACEUTICAL SCIENCES, VOL. 97, NO. 1, JANUARY 2008
is commonly used for this purpose.1,17,20,22,25
However, a-1-acid glycoprotein (AAG), which istypically present in plasma at concentrationsranging from 0.4 to 1.0% w/v, has also beenemployed for its ability to bind basic drugs.26,27
Whilst these approaches have the potential tomore accurately reflect in vivo conditions and atthe same time improve mass balance and reducenonspecific binding, a mechanism by which theresulting data can be quickly and accuratelycorrected for thermodynamic activity (whenprotein is included in the donor chamber) andimportantly, an understanding of any limitationsto this approach, is lacking from the literature.
In the current study, we examined the potentialfor plasma proteins to decrease drug precipitationand nonspecific adsorption during permeabilityassessment, and at the same time, reduce the riskof changes to transporter function when comparedwith the use of surfactants for the same purpose.More specifically, we have examined whetherthe reciprocal permeability approach, previouslydeveloped to correct for changes in thermody-namic activity in the presence of surfactants, maybe applied to permeability data obtained in thepresence of plasma proteins. Two commonly usedplasma proteins, albumin and AAG, and twopassive permeability markers, diazepam (DIA)and propranolol (PRO),28,29 were utilized in thesestudies. In addition, the possible effect of plasmaproteins on efflux transporters was exploredusing digoxin (DIG), a well-known substrate forP-gp.13,14,30
MATERIALS AND METHODS
Materials
[Methyl-3H]-diazepam, L-[4-3H]-propranolol, [3H(G)]-digoxin, and D-[1-14C]-mannitol (MAN) wereobtained from Perkin Elmer Life and AnalyticalSciences (Boston, MA). Bovine serum albumin(BSA) and bovine AAG were purchased fromSigma-Aldrich (St. Louis, MO). Water wasobtained from a Milli-Q water purification system(Millipore Corporation, Bedford, MA). All otherreagents were of analytical grade.
Drugs, Plasma Proteins, and Experimental Design
Albumin and AAG were selected for use in thesestudies as they are the proteins most prevalent inplasma and are responsible for a significant
DOI 10.1002/jps

USE OF PLASMA PROTEINS AS SOLUBILIZING AGENTS 211
proportion of the total plasma protein binding ofdrugs.27 BSA and bovine AAG were used as theyare less expensive than the human equivalentsand are more commonly employed in in vitropermeability studies.1,20,22 The drugs examinedwere selected on the basis of their transportmechanisms and plasma protein binding profiles.DIA and PRO were chosen as markers of passivetranscellular diffusion,28,29 whereas DIG wasutilized as a known substrate for active transportor efflux processes including P-gp.13,14,30 DIA,DIG, and PRO also bind to albumin to varyingdegrees and PRO is known to have greater affinityfor AAG.31–34 In the case of PRO, the (S)-L-isomerwas used to avoid any variations due to enantio-selective binding.35,36 MAN was used as a markerfor passive paracellular transport and impor-tantly, does not appreciably bind to plasmaproteins.17 Permeability studies were performedin both the absorptive (mucosal to serosal, M–S)and secretory (serosal to mucosal, S–M) directionin order to explore the use of plasma proteins inboth the mucosal and serosal chambers andthe applicability of the reciprocal permeabilityapproach in both cases.
Table 1. Concentrations of BSA and AAG used in thePermeability Experiments
BSA AAG
% w/v 10�5 Ma % w/v 10�5 Mb
0.005 0.07 0.005 0.120.01 0.15 0.01 0.240.05 0.73 0.02 0.480.1 1.45 0.05 1.190.5 7.25 0.1 2.381.0 14.5 0.2 4.762.0 72.5 0.5 11.9
aCalculated using BSA molecular weight¼69 kDa.57bCalculated using AAG molecular weight¼42 kDa.58
Tissue Preparation and Mounting
All animal studies were performed in accordancewith the guidelines of the Australian and NewZealand Council for the Care of Animals inResearch and Teaching and the study protocolwas approved by the institutional animal experi-mentation ethics committee. Tissue preparationand mounting was performed as described pre-viously.44 Briefly, fasted male Sprague–Dawleyrats (275–325 g) were anesthetized with 5%isoflurane and approximately 15 cm of jejunumwas removed. A glass rod was inserted down thelength of the segment and the tissue was rapidlystripped of its serosal muscle layers. An incisionwas made along the length of the mesentericborder and segments of tissue were mounted inside-by-side diffusion chambers (Navicyte, Sparks,NV). Modified Krebs bicarbonate ringer (KBR)buffer (6 mL) was immediately added to bothmucosal and serosal chambers.45 The modifiedKBR contained 147.2 mM Naþ, 5.1 mM Kþ,1.25 mM Ca2þ, 1.2 mM Mg2þ, 115.2 mM Cl�,15 mM HCO�3 , 0.1 mM H2PO
�4 , 1.8 mM HPO2�
4 ,1.2 mM SO2�
4 , 11.5 mM D-glucose, 4.9 mML-glutamate�, 4.9 mM pyruvate�, and 5.4 mMfumerate2�. The diffusion chambers were then
DOI 10.1002/jps JOUR
placed in a manifold and the temperature main-tained at 378C using a circulating water bath.Constant bubbling of oxygen and carbon dioxide(95% O2/5% CO2) through the buffer allowed formixing and pH maintenance at 7.4.
DIA, PRO, and DIG Transport Studiesand Sample Analysis
Bidirectional studies were conducted to demon-strate the potential utility of proteins in bothabsorptive and secretory studies. The M–Spermeability studies for DIA and PRO wereconducted in the absence and presence of varyingBSA concentrations (0.005–1.0% w/v for DIA and0.1–1.0% w/v for PRO) in the donor chamber. Inthe case of PRO, M–S permeability studies werealso conducted in the presence of varying AAGconcentrations (0.005–0.5% w/v) in the donorchamber (equivalent molar concentrations ofBSA and AAG used in permeability experimentsare specified in Table 1. In addition, permeabilitystudieswere conducted in the absence and presenceof varying concentrations of BSA (0.05–1.0% w/v)or AAG (0.05–0.5% w/v) in the donor chamberusing DIG, a P-gp substrate, to explore the use ofplasma proteins with substrates for efflux trans-porters. In contrast to DIA and PRO, the majorityof studies for DIG were conducted in the S–Mdirection as the high secretory Papp of DIGallowed for more facile monitoring of the possiblechanges to permeability resulting from decreasedunbound fraction or transporter inhibition. Toexplore the effect of proteins on efflux transpor-ters, however, further studies were conducted forDIGwith protein (0.5%w/v BSA or 0.5%w/v AAG)
NAL OF PHARMACEUTICAL SCIENCES, VOL. 97, NO. 1, JANUARY 2008

212 KATNENI, CHARMAN, AND PORTER
in either the donor (M–S only) or receptor (M–Sand S–M) chamber. In all cases, control conditions(KBR buffer with no protein) were maintained inthe opposite chamber (donor or receptor).
Permeability studies in the presence of BSAwere initiated by adding 0.5 mCi of radiolabeleddrug (equivalent to 0.97, 3.41, and 3.55 nM,respectively, for DIA, PRO, and DIG) to the donorchamber (mucosal for M–S and serosal for S–M).Additional DIA studies were also performed in thepresence of 20 mMunlabeled compound in order toconfirm the applicability of this approach athigher drug concentrations. Permeability studiesfor PRO in the presence of AAG were conductedat three different concentrations (0.34, 3.4, and34 nM) and this was achieved by the use of 0.05,0.5, or 5.0 mCi of radiolabeled PRO, respectively.Initial and final donor samples (200 mL each) werecollected at 5 and 180 min, and receptor sampleswere collected at 30 min intervals for 180 min.Samples were collected into 5 mL scintillationvials to which 1 mL scintillation cocktail (Stars-cint, Perkin Elmer Life and Analytical Sciences)was added. All samples were briefly vortexed andradioactivity quantified using a Tricarb 2000CAliquid scintillation counter (Packcard Bioscience,Meridian, CT). Accurate analysis of permeabilitydata obtained using radiolabeled markers requir-es that metabolism is minimal. Whilst literatureprecedents suggest limited intestinal metabolismof DIA,37 PRO,38–41 and DIG,42,43 this was alsoconfirmed experimentally for DIA by analysis ofthe final receptor chamber samples generated forexperiments in the presence of 20 mM unlabeledDIA. Samples were analyzed by LCMS and, inagreement with the literature, intact DIA com-prized greater than 95% of the total radiolabelpresent.
Effect of BSA and AAG on Epithelial Integrity
To assess the possible effects of BSA and AAG onthe integrity of the intestinal epithelium, thebidirectional permeability of the paracellularintegrity marker, MAN, was examined. M–Sand S–M transport studies were conducted usingradiolabeled mannitol (14C-MAN, 0.5 mCi equiva-lent to 1.5 mM) in the presence and absence of BSA(2.0% w/v) and AAG (0.5% w/v) in either themucosal or serosal buffer. Sample collection,processing and quantification were performed asdescribed for DIA, PRO, and DIG.
JOURNAL OF PHARMACEUTICAL SCIENCES, VOL. 97, NO. 1, JANUARY 2008
Data Analysis
Apparent Permeability, Papp
Measured or uncorrected apparent permeabilitycoefficients (Pappuncorr) were calculated from theflux data for each compound into the receptorchamber using Eq. (1):
Pappuncorrðcm sec�1Þ ¼ dX=dt
AC0(1)
where dX/dt is the amount transported intothe receptor chamber with respect to time(nmol sec�1), C0 is the initial total concentrationof drug in the donor chamber (free plus proteinbound), and A is the surface area available fordiffusion (1.78 cm2).
Correction of the Permeability Data forthe Unbound Fraction
In the presence of protein in the donor chamberand where drug–protein binding is significant,utilization of the total drug concentration inEq. (1) leads to an underestimation of the truePapp, since only unbound drug is available fortransport across the membrane. Under thesecircumstances, Pappuncorr data can be correctedfor the free drug concentration to obtain the truepermeability coefficient (Pappcorr), if the unboundfraction ( Fu) is known as shown in Eq. (2):
Pappcorr ¼Pappuncorr
Fu¼ Pappuncorr
Dt
Du(2)
In a previous publication, we have shown thatin the presence of surfactant, and where non-saturable drug solubilization occurs above thecritical micelle concentration (CMC), linearincreases in solubilized drug with increases inthe surfactant concentration are apparent andpermeability data obtained under solubilizingconditions may be corrected for free drug con-centrations using an approach termed the reci-procal permeability approach.11
In the current investigation, essentially thesame approach has been applied to drug–proteininteractions, rather than drug solubilization insurfactantmicelles. Since themechanism of drug–protein binding differs from that of micellarsolubilization, an examination of the underlyingassumptions associated with linear drug binding(i.e. linear increases in protein bound drug withincreases in protein concentration), is necessaryto evaluate the applicability of the reciprocalpermeability approach. This is described below.
DOI 10.1002/jps

USE OF PLASMA PROTEINS AS SOLUBILIZING AGENTS 213
Protein Drug Binding Equilibria
The stoichiometric or stepwise binding model is ageneralized model which may be used to describeprotein–ligand binding interactions.46 At a givenprotein concentration, a lipophilic molecule ordrug (ligand) is said to exist in equilibriumbetween the free (Du) and bound forms (PDn) asdescribed by the following equilibrium:
Du þ nPu ! PDn (3)
where nPu is the concentration of free (unbound)drug binding sites. Under these circumstancestotal drug concentration (Dt) is:
Dt ¼ Du þ PDn (4)
and the total concentration of drug binding siteson the protein (nPt) is:
nPt ¼ nPu þ PDn (5)
Based on the law ofmass action, the equilibriumbetween free and bound drug can be described bythe following relationship where Ka is the drug–protein binding or association constant47:
Ka ¼PDn
DunPu(6)
Rearrangement of Eq. (6) for PDn gives:
PDn ¼ KaDunPu (7)
Combining Eqs. (4) and (7) gives a linearrelationship between Dt and nPu as shown inEq. (8):
Dt ¼ Du þ ðDuKanPuÞ (8)
Eq. (8) can be rearranged to give Eq. (9):
Dt ¼ Duð1þ KanPuÞ (9)
The fraction unbound ( Fu), which is the ratio ofDu toDt, can therefore be obtained by rearrangingEq. (9) to give:
Fu ¼Du
Dt¼ 1
1þ KanPu(10)
In general, practical application of the aboveequation is not possible as in most cases theunbound protein concentration (Pu) and thenumber of binding sites (n) are not known.However, when the total protein is significantlyin excess of the ligand concentration, the unboundprotein concentration (Pu) approximates the totalprotein concentration (Pt), in which case thefraction unbound can be obtained as a function of
DOI 10.1002/jps JOUR
total protein concentration (Eq. (11))26:
Fu ¼1
1þ nKaPt(11)
For a given drug, when drug–protein binding islinear, Fu may therefore be estimated at a givenprotein concentration using Eq. (11) and a knowl-edge of nKa. Combination of Eqs. (2) and (11) givesan expression (Eq. (12)) which is essentiallyidentical to that previously described for solubi-lization by surfactants11:
1
Pappuncorr
¼ 1
Pappcorr
½1þ nKaPt� (12)
Further rearranging of Eq. (12) provides a linearrelationship:
1
Pappuncorr
¼ PtnKa
Pappcorr
� �þ 1
Pappcorr
(13)
Based on Eq. (13), a plot of 1/Pappuncorr versus Pt
allows estimation of Pappcorr from the Y-intercept(1/Pappcorr) and subsequent estimation of nKa
from the slope (nKa/Pappcorr) without the need foran indirect estimation of nKa.
Thismodel assumes a single class of binding siteand in the absence of information regarding thebinding stoichiometry, derives an indication ofnKa only, that is an operational protein associa-tion constant. This is sufficient for the purpose ofcorrection of total drug concentrations for freefraction, and where Eq. (11) is valid (i.e. underconditions of linear protein binding), the valuesfor the aggregate term nKa can be substituteddirectly into Eq. (11) to calculate Fu underdifferent protein concentrations.
RESULTS
Effect of BSA and AAG on Tissue Integrity
To assess the potential effect of BSA and AAG onthe integrity of the intestinal epithelium, thepermeability of the paracellular integrity marker,MAN, was monitored using the same conditionsemployed for DIA, DIG, and PRO studies. ThePapp data (mean�SD; n¼ 4) of MAN obtained inthe presence of 2.0% w/v BSA and 0.5% w/v AAGin the mucosal chamber were 12.2� 2.2 and11.0� 1.9� 10�6 cm sec�1 for M–S and 15.3� 1.1and 13.6� 1.6� 10�6 cm sec�1 for S–M, respec-tively. When the same protein concentrationswere added to the serosal chamber, MANPapp values were 11.9� 2.0 and 10.5� 2.8�
NAL OF PHARMACEUTICAL SCIENCES, VOL. 97, NO. 1, JANUARY 2008

214 KATNENI, CHARMAN, AND PORTER
10�6 cm sec�1 for M–S and 14.2� 1.2 and15.0� 2.1� 10�6 cm sec�1 for S–M in the presenceof BSA and AAG, respectively. Comparison ofthese results with MAN control M–S and S–MPapp data (11.9� 3.0 and 14.3� 2.9� 10�6 cmsec�1, respectively) suggests that neither proteinhad an adverse effect on the integrity of ratjejunum, in accordance with previous observa-tions with Caco-2 cell monolayers.17
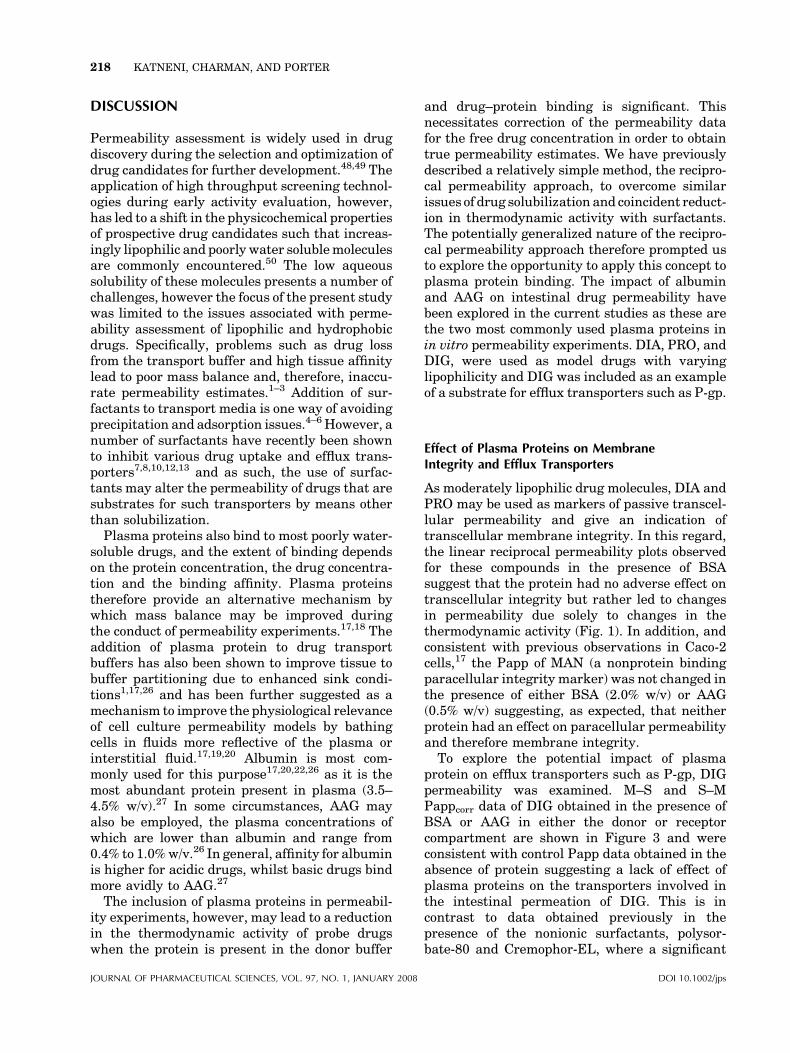
Figure 1. Reciprocal permeability plots for DIA,PRO, and DIG. The solid line represents the linearregression (r2> 0.99 in all cases) of the reciprocal Pappat varying BSA concentrations. The nKa and Pappcorrdata, obtained from the slope and intercept respectively,are summarized in Table 2. Data is mean�SD of n¼3–4 observations.
DIA, PRO, and DIG Permeability in thePresence of Varying BSA
Uncorrected (Pappuncorr) Papp data (M–S for DIAand PRO; S–M for DIG) decreased with increasesin the concentration of BSA in the donor chamber(data not shown) suggesting that drug bindingto BSA led to a reduction in both the free drugconcentration and the effective permeability.Applying the relationship described in Eq. (13),and constructing plots of the reciprocal of theuncorrected Papp data (1/Pappuncorr) againstthe total molar BSA concentration in the donorchamber, resulted in the generation of a series oflinear relationships for all compounds. These dataare shown in Figure 1 for studies conducted withtrace quantities of radiolabel. DIA studies werealso repeated in the presence of 20 mM unlabeledDIA to confirm the applicability of the method athigher drug concentrations. Essentially identicaldata to that described in Figure 1 were obtained(data not shown). The linearity of these datasuggested compliance with Eq. (13) and supportsthe assumption that the decrease in permeabilitywas due to decreased thermodynamic activity andthat protein binding was linear over the BSAconcentration range studied. Pappcorr was obtain-ed by extrapolation of the reciprocal Papp plots tozero protein concentration and gave values of53.2� 10�6 and 52.6� 10�6 cm sec�1 for DIA(at 0.97 nM and 20 mM, respectively), 35.8�10�6 cm sec�1 for PRO and 28.9� 10�6 cm sec�1
for DIG (Tab. 2). Operational protein associationconstants (nKa) obtained from the slope of therespective reciprocal Papp plots are also given inTable 2 and were used to calculate the unboundfraction ( Fu) for DIA, PRO, and DIG at varyingdonor BSA concentrations using Eq. (11) (Tab. 3).Individual DIA, PRO, and DIG Pappuncorr datawere subsequently corrected for the free drugfraction to obtain the true Papp (Pappcorr, datanot shown) using Eq. (2) and all values wereconsistent with data obtained by extrapolation
JOURNAL OF PHARMACEUTICAL SCIENCES, VOL. 97, NO. 1, JANUARY 2008 DOI 10.1002/jps

Table 2. Summary of nKa, Extrapolated Pappcorr (from the Y-Intercept of the Reciprocal Permeability Plot) andPappcontrol (Papp Obtained Experimentally under Protein Free Conditions) Data for DIA, DIG, and PRO
Compound Papp Data Protein Dta
nKa (104 M�1) Papp (10�6 cm sec�1)
This Study Literature Values Pappcontrol Extrapolated Pappcorr
Diazepam M–S BSA 0.97 nM 1.09 0.7� 0.02b 52.9� 2.5 53.220 mM 1.087 52.6
Digoxin S–M BSA 3.55 nM 0.17 0.09c 28.8� 3.5 28.9Propranolol M–S BSA 3.4 nM 0.20 0.14–0.17d 35.9� 4.1 35.8
M–S 0.34 nM 20.4 ND 28.9M–S AAG 3.4 nM 20.7 11–40e 35.9� 4.1 34.8M–S 34 nM 10.9 ND 27.9
aDt is total drug concentration.bData generated with BSA using fluorescence spectroscopy.32cData generated with HSA using equilibrium dialysis.33dData generated with HSA using capillary zone electrophoresis.34eData generated with human AAG using equilibrium dialysis.36,59,60
ND, not determined.
USE OF PLASMA PROTEINS AS SOLUBILIZING AGENTS 215
(extrapolated Pappcorr, Tab. 2). The Pappcorr ofDIA, PRO, and DIG obtained by both correctionand extrapolation methods were also consistentwith control data obtained experimentally in theabsence of protein (Pappcontrol, Tab. 2).
PRO Permeability in the Presence of AAG
For DIA, PRO and DIG, the binding affinities toBSA were relatively low ranging from approxi-mately 0.2 to 1.0� 104 M�1 (Tab. 2). To furtherexamine the impact of protein binding on drugpermeability and the applicability of the recipro-
Table 3. Calculated Fraction Unbound ( Fu) Data for DIA
BSA/AAG Concentration (% w/v)
DIA
0.97 nM
nKa (104 M�1)b: 1.09
0.005 0.990.01 0.980.05 0.920.1 0.860.5 0.551.0 0.38
aFu data calculated as per Eq. (11) using the nKa obtained by fitbnKa obtained from the slope of respective reciprocal permeabiliND¼Not determined as permeability was not monitored at thesNA¼Not applicable as Pappuncorr at these AAG concentrations
DOI 10.1002/jps JOUR
cal permeability approach, additional studieswere conducted with PRO which displays muchhigher binding affinity to AAG than to BSA. In thefirst instance, experiments were conducted usinga range of AAG concentrations (0.005–0.5% w/v)and an identical PRO concentration to that emp-loyed in the BSA experiments (3.4� 10�9 M).Further studies were subsequently conducted toexamine the possibility of complexities in thebinding relationship (and therefore nonlinearbinding) using 10-fold lower (0.34� 10�9 M) and10-fold higher (34� 10�9 M) PRO concentrations.Reciprocal permeability plots were subsequentlyconstructed (Fig. 2, Panels A–C). In contrast to the
, DIG, and PRO at Varying Protein Concentrations
Fraction Unbound ( Fu) Dataa
BSA AAG
DIG PRO PRO
20 mM 3.6 nM 3.4 nM 3.4 nM
3 1.087 0.17 0.20 20.7
2 ND ND ND 0.8024 ND ND ND 0.6707 0.927 0.988 ND 0.2894 0.864 0.976 0.972 NA9 0.559 0.890 0.873 NA8 0.388 0.802 0.775 ND
ting the Pappuncorr data to Eq. (13).ty plots.e protein concentrations.deviated from the reciprocal Papp plot.
NAL OF PHARMACEUTICAL SCIENCES, VOL. 97, NO. 1, JANUARY 2008

216 KATNENI, CHARMAN, AND PORTER
data obtained in the presence of BSA, thereciprocal permeability plots for PRO were onlylinear at low AAG concentrations, and deviatedsignificantly from linearity at high AAG concen-trations (Fig. 2, open circles). In all cases, similardeviations from linearity were apparent at higherprotein concentrations, however a clear trend wasevident such that the point at which deviation
JOURNAL OF PHARMACEUTICAL SCIENCES, VOL. 97, NO. 1, JANUARY 2008
occurred increased from 11.9� 10�6 to 23.8� 10�6
to 47.6� 10�6 M AAG at PRO concentrations of0.34, 3.4, and 34� 10�9 M, respectively. Interest-ingly, at the highest PRO concentration (34�10�9 M, Fig. 2, Panel C), the Papp data at thelowest AAG concentrations (1.19� 10�6 and 2.38�10�6 M) also appeared to deviate from the recipro-cal permeability relationship.
In an attempt to obtain nKa and Pappcorr datafor PRO in the presence of AAG, the M–SPappuncorr data in the linear region of therespective reciprocal permeability plots wereevaluated. The values for nKa obtained from thelinear regions of Figure 2 were 20.4� 104 M�1,20.7� 104 M�1, and 10.9� 104 M�1 and theextrapolated Pappcorr values obtained from theintercepts were 28.9� 10�6, 34.8� 10�6, and27.9� 10�6 cm sec�1, respectively at PRO con-centrations of 0.34, 3.4 and 34� 10�9 M (Tab. 2).At each PRO concentration, the unbound fraction( Fu) at different donor AAG concentrations wassubsequently calculated using the nKa dataobtained (data at 3.4� 10�9 M PRO is listed inTab. 3). Using these Fu values, theM–S Pappuncorrdata were corrected for the free drug to obtainPappcorr data (Tab. 4). As expected, at all PROconcentrations, the M–S Pappcorr data calculatedat AAG concentrations in the nonlinear range ofthe reciprocal Papp plot significantly deviatedfrom the Pappcontrol data (35.9� 4.1� 10�6 cm sec�1)obtained in the absence of protein (data notshown). In contrast, Pappcorr data in the linearregion of the plots in Figure 2 were relativelyconsistent across the AAG concentrations in thatrange (Tab. 4) and with Pappcontrol at all PROconcentrations. Whilst large deviations in theM–S Pappcorr data of PRO were not evident acrossvarying PRO concentrations, the data obtained at3.4� 10�9 M PRO was in closest agreement withPappcontrol.
Figure 2. Reciprocal permeability plots of PRO attotal drug concentrations (Dt) of 0.34� 10�9 M (Panel A),3.4� 10�9 M (Panel B), and 34� 10�9 M (Panel C).The dotted line represents the regression (r2> 0.99 inall cases) of the reciprocal M–S Pappuncorr data at AAGconcentrations where binding of PRO appears to belinear (*). The nKa and Pappcorr, obtained from theslope and intercept of the linear region respectively,are summarized in Table 2. The Pappuncorr data thatappeared to deviate from the reciprocal permeabilityrelationship (*) were excluded from nKa estimations.Data is shown as mean�SD of n¼ 3–4 observations. Insome cases error bars are obscured by the symbols.
DOI 10.1002/jps

Table 4. CorrectedM–S Permeability Data (Pappcorr)for PRO at Varying Donor AAG and PROConcentrations
AAG (10�5 M)
PRO M–S Pappcorr (10�6 cm sec�1)a
PRO Concentration (10�9 M)
0.34 3.4 34
0.12 28.6� 0.75 36.2� 2.59 NA0.24 29.4� 1.33 34.8� 4.30 NA0.48 29.2� 3.93 34.3� 2.97 28.3� 1.231.19 NA 35.3� 4.32 27.5� 0.672.38 NA NA 28.1� 2.634.76 NA NA NA
11.9 NA NA NA
Data represent mean�SD of n¼ 3–4 observations.NA¼Data outside the linear region of the reciprocal per-
meability plot.aM–S Pappcorr data of PRO at varying AAG were obtained
by correcting Pappuncorr data observed at different PRO con-centrations using nKa derived from the respective reciprocalpermeability plots.
USE OF PLASMA PROTEINS AS SOLUBILIZING AGENTS 217
Effect of BSA and AAG on Efflux Transporters
To examine the potential effect of plasma proteinson transporters such a P-gp, bidirectional DIGpermeability experiments were conducted in the
Figure 3. The effect of BSA (0.5%w/v) and Aacross excised rat jejunum. Papp data obtaincorrected for the free fraction (using the nKa ofpermeability plot) to obtain Pappcorr. The Pappno correction for free drug as limited binding3–4 observations. Mucosal BSA and AAG are dand serosal BSA and AAG are denoted as sBS
DOI 10.1002/jps JOUR
absence and presence of 0.5% w/v BSA and AAG.TheM–S and S–MPappuncorr data of DIG obtainedin the presence BSA in the donor chamber werecorrected for the free drug fraction using the nKa
value taken from the reciprocal permeabilityplot (Fig. 1) as per Eq. (11). In the presence ofincreasing concentrations of AAG, no change inpermeability was detected suggesting a lack ofaffinity of DIG for AAG (data not shown). As aresult, DIG Papp data obtained in the presence of0.5% w/v AAG in the donor chamber needed nocorrection. M–S and S–M Papp data for DIGobtained in the presence of 0.5% w/v BSA or AAGin the serosal and mucosal chambers, respec-tively, was also utilized without correction sinceprotein was present only in the receptor chamber.Papp data obtained in presence of protein in eitherthe donor or receptor chambers was subsequentlycompared with control data (i.e., the Papp dataobtained in the absence of plasma protein) toevaluate whether an effect of protein on effluxtransporter function was evident. The data inFigure 3 suggest that both BSA and AAG werefound to have no effect on DIG transport regard-less of inclusion in either mucosal or serosalbuffers.
AG (0.5%w/v) on the permeability of DIGed with BSA in the donor chamber wereDIG for BSA derived from the reciprocaldata of DIG obtained with AAG requiredwas apparent. Data is mean�SD of n¼enoted asmBSA andmAAG, respectively,A and sAAG, respectively.
NAL OF PHARMACEUTICAL SCIENCES, VOL. 97, NO. 1, JANUARY 2008
218 KATNENI, CHARMAN, AND PORTER
DISCUSSION
Permeability assessment is widely used in drugdiscovery during the selection and optimization ofdrug candidates for further development.48,49 Theapplication of high throughput screening technol-ogies during early activity evaluation, however,has led to a shift in the physicochemical propertiesof prospective drug candidates such that increas-ingly lipophilic and poorly water solublemoleculesare commonly encountered.50 The low aqueoussolubility of these molecules presents a number ofchallenges, however the focus of the present studywas limited to the issues associated with perme-ability assessment of lipophilic and hydrophobicdrugs. Specifically, problems such as drug lossfrom the transport buffer and high tissue affinitylead to poor mass balance and, therefore, inaccu-rate permeability estimates.1–3 Addition of sur-factants to transport media is one way of avoidingprecipitation and adsorption issues.4–6However, anumber of surfactants have recently been shownto inhibit various drug uptake and efflux trans-porters7,8,10,12,13 and as such, the use of surfac-tants may alter the permeability of drugs that aresubstrates for such transporters by means otherthan solubilization.
Plasma proteins also bind to most poorly water-soluble drugs, and the extent of binding dependson the protein concentration, the drug concentra-tion and the binding affinity. Plasma proteinstherefore provide an alternative mechanism bywhich mass balance may be improved duringthe conduct of permeability experiments.17,18 Theaddition of plasma protein to drug transportbuffers has also been shown to improve tissue tobuffer partitioning due to enhanced sink condi-tions1,17,26 and has been further suggested as amechanism to improve the physiological relevanceof cell culture permeability models by bathingcells in fluids more reflective of the plasma orinterstitial fluid.17,19,20 Albumin is most com-monly used for this purpose17,20,22,26 as it is themost abundant protein present in plasma (3.5–4.5% w/v).27 In some circumstances, AAG mayalso be employed, the plasma concentrations ofwhich are lower than albumin and range from0.4% to 1.0%w/v.26 In general, affinity for albuminis higher for acidic drugs, whilst basic drugs bindmore avidly to AAG.27
The inclusion of plasma proteins in permeabil-ity experiments, however, may lead to a reductionin the thermodynamic activity of probe drugswhen the protein is present in the donor buffer
JOURNAL OF PHARMACEUTICAL SCIENCES, VOL. 97, NO. 1, JANUARY 2008
and drug–protein binding is significant. Thisnecessitates correction of the permeability datafor the free drug concentration in order to obtaintrue permeability estimates. We have previouslydescribed a relatively simple method, the recipro-cal permeability approach, to overcome similarissues of drug solubilization and coincident reduct-ion in thermodynamic activity with surfactants.The potentially generalized nature of the recipro-cal permeability approach therefore prompted usto explore the opportunity to apply this concept toplasma protein binding. The impact of albuminand AAG on intestinal drug permeability havebeen explored in the current studies as these arethe two most commonly used plasma proteins inin vitro permeability experiments. DIA, PRO, andDIG, were used as model drugs with varyinglipophilicity and DIG was included as an exampleof a substrate for efflux transporters such as P-gp.
Effect of Plasma Proteins on MembraneIntegrity and Efflux Transporters
As moderately lipophilic drug molecules, DIA andPRO may be used as markers of passive transcel-lular permeability and give an indication oftranscellular membrane integrity. In this regard,the linear reciprocal permeability plots observedfor these compounds in the presence of BSAsuggest that the protein had no adverse effect ontranscellular integrity but rather led to changesin permeability due solely to changes in thethermodynamic activity (Fig. 1). In addition, andconsistent with previous observations in Caco-2cells,17 the Papp of MAN (a nonprotein bindingparacellular integrity marker) was not changed inthe presence of either BSA (2.0% w/v) or AAG(0.5% w/v) suggesting, as expected, that neitherprotein had an effect on paracellular permeabilityand therefore membrane integrity.
To explore the potential impact of plasmaprotein on efflux transporters such as P-gp, DIGpermeability was examined. M–S and S–MPappcorr data of DIG obtained in the presence ofBSA or AAG in either the donor or receptorcompartment are shown in Figure 3 and wereconsistent with control Papp data obtained in theabsence of protein suggesting a lack of effect ofplasma proteins on the transporters involved inthe intestinal permeation of DIG. This is incontrast to data obtained previously in thepresence of the nonionic surfactants, polysor-bate-80 and Cremophor-EL, where a significant
DOI 10.1002/jps

USE OF PLASMA PROTEINS AS SOLUBILIZING AGENTS 219
effect on transporter function was evident, pre-cluding facile examination of intrinsic perme-ability in the presence of surfactants.13 Theseobservations highlight the potential utility ofplasma proteins as solubilizing agents duringthe permeability assessment of compounds wheretransporter involvement is suspected, a conceptillustrated by the linear reciprocal permeabilityplots obtained for DIG in the presence of BSA(Fig. 1).
DIA, PRO, and DIG Permeability in thePresence of BSA
The Pappuncorr of DIA, PRO, and DIG decreasedwith increase in the concentration of BSA in thedonor compartment. The linearity of the recipro-cal permeability plots of DIA, PRO, and DIG(Fig. 1) suggest that permeability alteration wassolely governed by changes in the thermodynamicactivity and that the binding of these drugs to BSAwas linear across the concentration range used.This allowed estimation of the operational proteinassociation constants (nKa) and Pappcorr from theslope and intercept of the respective reciprocalpermeability plots (Tab. 2). The nKa data for DIA,PRO, and DIG were in close agreement with thevalues reported in the literature for BSA or HSA(Tab. 2). The consistency between the extrapo-lated Pappcorr data for DIA, PRO, and DIG(obtained from the intercept of the respectivereciprocal Papp plots) and the correspondingPappcontrol data obtained in the absence of protein(Tab. 2) indicates that the reciprocal permeabilityapproach is suitable for estimating true perme-ability when plasma proteins are incorporated inthe donor buffer. It should be noted that thecurrent analysis is based on the assumption thatthermodynamic activity is reduced by proteinbinding and that the reduction in activity isreflected in the equilibriumKa value. However,Ka
is a composite measure of the ratio of the ‘‘on’’ and‘‘off’’ drug–protein binding rate constants. Underthese circumstances the rate of ‘‘replenishment’’ ofthe free drug fraction available to permeate acrossthemembrane, could be limited by the rate of drugdissociation from the protein (the ‘‘off’’ rate). In thecurrent analysis, the assumption has been madethat the rates of drug–protein association anddissociation are sufficiently short relative to therates of drug uptake into the membrane thatpermeability is not limited by the rate of drugdissociation from the protein, but rather by the
DOI 10.1002/jps JOUR
extent (i.e., the equilibrium position). The con-sistency of the Pappcorr data obtained suggeststhat this was the case, but it is possible that incases where the rates of drug binding are parti-cularly slow that this could present a limitation topermeability.
Classical protein binding theory suggests thatfor linear increases in bound drug to occur withincreases in protein concentration, that boththe ligand and protein concentration shouldbe less than Kd (the drug–protein dissociationconstant).51,52 Kd (the reciprocal of Ka) is theconcentration of ligand at which 50% of the avail-able binding sites on the protein are occupied.51–53
Since the basic binding models (Eqs. (10) and (11))assume that the total protein concentrationapproximates the free protein concentration, itis apparent that when ligand concentrationssignificantly exceed Kd, issues of protein satura-tion may occur and conversely, where proteinconcentration significantly exceedsKd, linearity ofbinding may become limited by the availableconcentration of ligand (ligand depletion).51,52
Protein saturation and ligand depletion aretherefore unlikely to be significant for drugs withlow to moderate affinity for plasma proteins (102–104 M�1) as the Kd for drug binding is likely to behigh relative to drug and protein concentration.However, issues may arise for drugs with highbinding affinity (105–107 M�1) where the Kd isexpected to be low and potentially of a similarmagnitude to either the protein or drug concen-tration.47
The consistency of this rationale with theobserved linearity of the reciprocal permeabilityplots of DIA, PRO, and DIG with BSA (whichindicates linearity in drug–protein binding underthese conditions) may be explained by examina-tion of the ratios of Pt and Dt to the calculated Kd
(taken as the reciprocal of the operationalassociation constant, nKa). These ratios arepresented in Table 5 and show that Dt/Kd ratiosof DIA, PRO, and DIG were all significantly lessthan 1.0 suggesting that protein saturation wasunlikely to be an issue at the drug concentrationsused. Similarly, Pt/Kd ratios were less than 1.0(except for DIA at the highest BSA concentration(145� 10�6 M) where the ratio was �1.6) furthersuggesting that issues of ligand depletion wereunlikely, thereby providing a justification for thelinearity of the plots based on Kd. In the case ofDIA, DIG, and PRO binding to albumin (andpresumably therefore other drugs where Kd islikely to be greater than Pt or Dt), it is apparent
NAL OF PHARMACEUTICAL SCIENCES, VOL. 97, NO. 1, JANUARY 2008

Table
5.
Ligand(D
t)andProtein
(Pt)Con
centration
sEmployed
inDIA
,PRO,andDIG
Permea
bilityStudieswithBSAandAAG
andtheApparentProtein
Dissociation
Con
stants
(Kd)Calculatedfrom
theReciprocalPermea
bilityPlots
Com
pou
nd
Protein
Kd(10�6M)a
Dt(10�9M)
Pt(10�6M)
Dt/KdRatio(�
103)
Pt/KdRatio
Linea
rReg
ionb
Non
linea
rReg
ionc
Linea
rReg
iond
Non
linea
rReg
ione
Diazepam
BSA
92
0.97
0.72–145
NAf
0.01
0.008–1.57
NAf
20�103
217
Digox
inBSA
588
3.55
7.25–145
NAf
0.006
0.012–0.25
NAf
Propranolol
BSA
500
3.4
14.5–145
NAf
0.007
0.029–0.29
NAf
AAG
4.89
0.34
1.19–4.76
11.9–119
0.069
0.243–0.97
2.43–24.3
AAG
4.83
3.4
1.19–11.9
23.8–119
0.71
0.246–2.46
4.92–24.6
AAG
9.17
34
4.76–23.8
47.6–119
3.7
0.51–2.59
5.19–12.9
Dt/KdandPt/Kdare
tabulatedto
serveasindicators
oflikelylinea
rbindingconditions.
aObtained
from
nKausingtherelation
ship
Kd¼1/nKa.
bRangeof
protein
concentration
sin
thelinea
rregionof
thereciprocalpermea
bilityplot.
c Rangeof
protein
concentration
sin
thenon
linea
rregionof
thereciprocalpermea
bilityplot.
dRangeof
ratios
calculatedusingprotein
concentration
sin
thelinea
rregionof
thereciprocalpermea
bilityplot.
e Rangeof
ratios
calculatedusingprotein
concentration
sin
thenon
linea
rregionof
thereciprocalpermea
bilityplot.
f NA¼Not
applicable
asallthedata
wasin
thelinea
rrange.
JOURNAL OF PHARMACEUTICAL SCIENCES, VOL. 97, NO. 1, JANUARY 2008
220 KATNENI, CHARMAN, AND PORTER
that the reciprocal permeability approach provid-es a relatively simple mechanism for the correc-tion of permeability data for drug protein binding.Importantly, this approach avoids many of thepractical complexities associated with directevaluation of the extent of drug–protein bindingof poorly water-soluble, lipophilic compoundsusing methods such as equilibrium dialysis orultrafiltration. In this regard, attempts were madeto directly measure the free drug concentrationof DIA in the donor chambers of permeabilityexperiments using ultrafiltration (Ultrafree1-MC,Millipore Corporation). In all cases, however (andconsistent with previous studies54,55), the genera-tion of accurate data was limited by significant(>70%) loss of drug via adsorption to the filtrationapparatus. Previous studies using surfactantshave also demonstrated that the solubilizing con-ditions present in the donor chambers of perme-ability experiments may be different to theconditions prevailing during indirect assessmentsof the extent of binding using, for example,equilibrium solubility measurements.11 The reci-procal permeability approach therefore providesparticular practical advantage where facile mea-surement of free drug concentration is not possiblevia traditional means.
PRO Permeability in the Presence of AAG
Further studies were conducted incorporating ahigh affinity ligand-protein pair to probe potentialnonlinearity issues. PRO and AAGwere chosen asPRO has a high affinity for AAG (Tab. 2). TheM–Spermeability of PRO was studied in the presenceof increasing concentrations of AAG and over a100-fold range of ligand concentrations to explorethe possible issues of nonlinear protein binding. Incontrast to the observations made with DIA, PRO,and DIG in the presence of BSA, the reciprocalpermeability plots for the M–S Pappuncorr of PROin the presence of AAG deviated significantly fromlinearity at all three drug concentrations (Fig. 2,Panel A–C). Deviation was primarily evident athigh AAG concentrations and the protein con-centrations at which deviation became apparentincreased with increasing ligand concentration.These trends are consistent with ligand depletionat high protein concentrations leading to non-linear PRO-AAG binding. Conversely, at thehighest PRO concentration and lowest AAG con-centrations, deviation was also evident and mayhave indicated the onset of protein saturation.
DOI 10.1002/jps

USE OF PLASMA PROTEINS AS SOLUBILIZING AGENTS 221
Binding models which account for the complex-ities of ligand depletion and protein saturationhave been previously described,47,51,52 but requirean exact knowledge of the drug–protein bindingaffinity and binding stoichiometry (rather thanthe composite operational binding constant, nKa
determined here). As such, attempts to utilizethese relationships to describe the changes indrug free fraction over both linear and nonlinearbinding regions of the current plots by substitu-tion of the nKa (obtained from the linear bindingregion) into nonlinear (protein depletion or liganddepletion) binding relationships were not success-ful. Drug binding data (and especially nonlinearbinding models) are complicated further in thepresence of more than one class of binding sites (inaddition to binding stoichiometries other than 1:1at each site), and these binding patterns are notuncommonwith AAG. As such further attempts toapply the current approach to nonlinear bindingsituations were not pursued.
The operational binding constant (nKa) of PROfor AAG, however, could be estimated using thePappuncorr data in the linear region of thereciprocal permeability plot and was at leastbroadly consistent with the data in the literature(Tab. 2). Interestingly, the current data suggestthat the nKa of PRO for AAG appeared to decreaseat the highest PRO concentration indicatingdecreased affinity. In this regard, two classes ofdrug binding sites, with low and high bindingaffinities have been previously reported for PRObinding to AAG.31,56 One explanation for thechange in apparent binding affinity observed inthe current study is therefore the possibility ofnegative cooperativity between the two sites athigh PRO concentration, although further datawould be required to confirm this possibility.
The nonlinearity observed for PRO binding toAAG was further examined by calculating the Pt/Kd and Dt/Kd ratios for each PRO concentrationusing the respective nKa values determined fromlinear regression of the reciprocal permeabilityplots. Pt/Kd ratios at the protein concentrations inthe linear region were, in general, below 1.0 undermost protein/drug conditions although at thehighest protein concentrations in the linearregion, values significantly above 1.0 were evi-dent, indicating the onset of a transition fromlinear to nonlinear binding. As expected, in thenonlinear region of the reciprocal permeabilityplots, Pt/Kd ratios were significantly above 1.0with values ranging from 2.4 to 24.6 across thePRO and protein concentrations consistent with
DOI 10.1002/jps JOUR
ligand depletion.Dt/Kd ratios were less than unityat all PRO concentrations suggesting that proteindepletion was unlikely.
Selection of Appropriate Ligandand Protein Concentrations
Dt/Kd and Pt/Kd ratios serve as useful indicators ofthe potential for ligand depletion and proteinsaturation and could therefore be used to guideselection of the appropriate concentrations of drugand protein. Whilst the value of Kd may not beknown a priori, it seems likely (particularly fordrug binding to albumin where typical Kd valuesare greater than 50 mM) that linear binding willbe evident in most cases, assuming drug concen-trations are relatively low. For higher affinitybinding interactions (such as those commonlyobserved with AAG), deviations from conditions oflinear binding aremore likely, especially at higherprotein concentrations and under these conditionscare must be taken when interpreting reciprocalpermeability plots.
SUMMARY AND CONCLUSION
This study highlights the potential applicabilityof the reciprocal permeability approach for thecorrection of permeability data obtained in thepresence of plasma proteins. The approach alsoallows for estimation of nKa, the operationalprotein association constant. Reciprocal perme-ability plots for DIA, PRO, and DIG with BSAsuggested linear protein binding for these lowaffinity ligand–protein combinations and there-fore good applicability of the reciprocal perme-ability approach. However, in the case of thehigher affinity binding between PRO and AAG,deviation in the reciprocal permeability plots wasevident suggestive of nonlinear protein bindingwith ligand depletion likely occurring at highprotein concentration. Nonetheless, even for thehigh affinity binding pair, the reciprocal perme-ability approach was suitable for the correctionof permeability data under conditions of linearbinding.
Finally, M–S and S–M DIG permeability dataobtained in the presence of BSA or AAG suggesta lack of effect of these plasma proteins on thetransporters involved in the bidirectional trans-port of DIG. Together, the results suggest thatplasma proteins, such as albumin and AAG, can
NAL OF PHARMACEUTICAL SCIENCES, VOL. 97, NO. 1, JANUARY 2008

222 KATNENI, CHARMAN, AND PORTER
be utilized in permeability experiments to bothimprove mass balance, and provide more physio-logically relevant conditions, without affecting thefunctionality of drug transporters present oneither the apical or basolateral enterocyte mem-brane (a problem inherent in the use of surfac-tants to achieve the same end). Whilst the use ofplasma proteins in the donor chamber of perme-ability experiment leads to a change in thermo-dynamic activity, this may be corrected for usingthe reciprocal permeability approach assuminglinear protein binding.
ABBREVIATIONS
MAN m
JOURNAL OF PHA
annitol
DIA d iazepam DIG d igoxin PRO p ropranolol BSA b ovine serum albumin AAG a -1-acid glycoprotein (orosomucoid) Dt t otal drug (ligand) concentrationthat is, free (Du)þ bound (PDn)
nPt t otal concentration of drug bindingsites on protein that is, free (nPu)þbound (PDn)
Fu u
nbound or free drug fraction Ka a ssociation constant (micellar/protein) nKa a pparent protein association constant Kd p rotein dissociation constant (actual¼1/Ka; apparent¼ 1/nKa)
Papp a pparent permeability coefficient Pappuncorr P app obtained in the presence ofprotein and calculated using totaldrug concentration in the donor (i.e.,Papp not corrected for free fraction)
Pappcorr P
app obtained via correction ofPappuncorr for the free fraction orvia extrapolation of the Pappuncorrto zero surfactant concentration(Y-intercept on reciprocal Papp plot)Pappcontol P
app obtained experimentally in theabsence of proteinACKNOWLEDGMENTS
Funding from the Victorian College of Pharmacy(International Postgraduate Research Scholar-ship) and Monash University (Monash Graduate
RMACEUTICAL SCIENCES, VOL. 97, NO. 1, JANUARY 2008
Scholarship) is gratefully acknowledged for scho-larship support to KK.
REFERENCES
1. Krishna G, Chen K, Lin C, Nomeir AA. 2001. Per-meability of lipophilic compounds in drug discoveryusing in-vitro human absorption model, Caco-2. IntJ Pharm 222:77–89.
2. Unger JK, Kuehlein G, Schroers A, Gerlach JC,Rossaint R. 2001. Adsorption of xenobiotics to plas-tic tubing incorporated into dynamic in vitro sys-tems used in pharmacological research--limits andprogress. Biomaterials 22:2031–2037.
3. Palmgren JJ, Monkkonen J, Korjamo T, HassinenA, Auriola S. 2006. Drug adsorption to plastic con-tainers and retention of drugs in cultured cellsunder in vitro conditions. Eur J Pharm Biopharm64:369–378.
4. Rege BD, Yu LX, Hussain AS, Polli JE. 2001. Effectof common excipients on Caco-2 transport of low-permeability drugs. J Pharm Sci 90:1776–1786.
5. Saha P, Kou JH. 2000. Effect of solubilizing exci-pients on permeation of poorly water-soluble com-pounds across Caco-2 cell monolayers. Eur J PharmBiopharm 50:403–411.
6. Lindberg BF, Andersson KE. 1991. Adsorption ofatrial natriuretic peptide to different materials: Afactor influencing results of in vitro experiments?Pharmacol Toxicol 68:276–281.
7. Nerurkar MM, Ho NF, Burton PS, Vidmar TJ,Borchardt RT. 1997. Mechanistic roles of neutralsurfactants on concurrent polarized and passivemembrane transport of a model peptide in Caco-2cells. J Pharm Sci 86:813–821.
8. Shono Y, Nishihara H, Matsuda Y, Furukawa S,Okada N, Fujita T, Yamamoto A. 2004. Modulationof intestinal P-glycoprotein function by cremophorEL and other surfactants by an in vitro diffusionchamber method using the isolated rat intestinalmembranes. J Pharm Sci 93:877–885.
9. Tamura S, Ohike A, Ibuki R, Amidon GL, Yama-shita S. 2002. Tacrolimus is a class II low-solubilityhigh-permeability drug: The effect of P-glycoproteinefflux on regional permeability of tacrolimus in rats.J Pharm Sci 91:719–729.
10. Yu L, Bridgers A, Polli J, Vickers A, Long S, Roy A,Winnike R, Coffin M. 1999. Vitamin E-TPGSincreases absorption flux of an HIV protease inhi-bitor by enhancing its solubility and permeability.Pharm Res 16:1812–1817.
11. Katneni K, Charman SA, Porter CJH. 2006.Permeability assessment of poorly water solublecompounds under solubilizing conditions: The reci-procal permeability approach. J Pharm Sci 95:2170–2185.
DOI 10.1002/jps

USE OF PLASMA PROTEINS AS SOLUBILIZING AGENTS 223
12. Miller DW, Batrakova EV, Kabanov AV. 1999.Inhibition of multidrug resistance-associated pro-tein (MRP) functional activity with pluronic blockcopolymers. Pharm Res 16:396–401.
13. Katneni K, Charman SA, Porter CJH. 2007.Impact of cremophor-EL and polysorbate-80 ondigoxin permeability across rat jejunum: Delinea-tion of thermodynamic and transporter relatedevents using the reciprocal permeability approach.J Pharm Sci 96:280–293.
14. Zhang H, Yao M, Morrison RA, Chong S. 2003.Commonly used surfactant, Tween 80, improvesabsorption of P-glycoprotein substrate, digoxin, inrats. Arch Pharm Res 26:768–772.
15. Varma MV, Panchagnula R. 2005. Enhanced oralpaclitaxel absorption with vitamin E-TPGS: Effecton solubility and permeability in vitro, in situ and invivo. Eur J Pharm Sci 25:445–453.
16. Rege BD, Kao JP, Polli JE. 2002. Effects of nonionicsurfactants on membrane transporters in Caco-2cell monolayers. Eur J Pharm Sci 16:237–246.
17. Neuhoff S, Artursson P, Zamora I, Ungell AL. 2006.Impact of extracellular protein binding on passiveand active drug transport across caco-2 cells.Pharm Res 23:350–359.
18. Artursson P. 1990. Epithelial transport of drugs incell culture. I: A model for studying the passivediffusion of drugs over intestinal absorptive(Caco-2) cells. J Pharm Sci 79:476–482.
19. Saha P, Kou JH. 2002. Effect of bovine serumalbumin on drug permeability estimation acrossCaco-2 monolayers. Eur J Pharm Biopharm 54:319–324.
20. Yamashita S, Furubayashi T, Kataoka M,Sakane T, Sezaki H, Tokuda H. 2000. Optimizedconditions for prediction of intestinal drug perme-ability using Caco-2 cells. Eur J Pharm Sci 10:195–204.
21. Sawada GA, Barsuhn CL, Lutzke BS, HoughtonME, Padbury GE, Ho NF, Raub TJ. 1999. Increasedlipophilicity and subsequent cell partitioningdecrease passive transcellular diffusion of novel,highly lipophilic antioxidants. J Pharmacol ExpTher 288:1317–1326.
22. Cross SE, Anissimov YG, Magnusson BM, RobertsMS. 2003. Bovine–serum–albumin-containing re-ceptor phase better predicts transdermal absorp-tion parameters for lipophilic compounds. J InvestDermatol 120:589–591.
23. Youdim KA, Avdeef A, Abbott NJ. 2003. In vitrotrans-monolayer permeability calculations: Oftenforgotten assumptions. Drug Discov Today 8:997–1003.
24. Ho NFH, Raub TJ, Burton PS, Barsuhn PL, AdsonA, Audus KL, Borchardt RT. 2000. Quantitativeapproaches to delineate passive transport mechan-isms in cell culture monolayers. New York: MercelDekker. 102:219–316.
DOI 10.1002/jps JOUR
25. Aungst BJ, Nguyen NH, Bulgarelli JP, Oates-LenzK. 2000. The influence of donor and reservoir addi-tives on Caco-2 permeability and secretory trans-port of HIV protease inhibitors and other lipophiliccompounds. Pharm Res 17:1175–1180.
26. Sawada GA, Ho NF, Williams LR, Barsuhn CL,Raub TJ. 1994. Transcellular permeability of chlor-promazine demonstrating the roles of protein bind-ing and membrane partitioning. Pharm Res 11:665–673.
27. Shargel L, Yu BCA. 1993. Applied biopharmaceu-tics and pharmacokinetics. 3rd edition. Norwalk,Connecticut: Appleton & Lange. pp 594–595.
28. Stephens RH, Tanianis-Hughes J, Higgs NB, Hum-phrey M, Warhurst G. 2002. Region-dependentmodulation of intestinal permeability by drug effluxtransporters: In vitro studies in mdr1a(S/S) mouseintestine. J Pharmacol Exp Ther 303:1095–1101.
29. Cogburn JN, Donovan MG, Schasteen CS. 1991.A model of human small intestinal absorptive cells.1. Transport barrier. Pharm Res 8:210–216.
30. Rautio J, Humphreys JE, Webster LO, Balakrish-nan A, Keogh JP, Kunta JR, Serabjit-Singh CJ,Polli JW. 2006. In vitro p-glycoprotein inhibitionassays for assessment of clinical drug interactionpotential of new drug candidates: A recommenda-tion for probe substrates. Drug Metab Dispos 34:786–792.
31. Johansen AK, Willassen NP, Sager G. 1992. Fluor-escence studies of beta-adrenergic ligand binding toalpha 1-acid glycoproteinwith 1-anilino-8-naphtha-lene sulfonate, isoprenaline, adrenaline and pro-pranolol. Biochem Pharmacol 43:725–729.
32. Dufour C, Dangles O. 2005. Flavonoid-serumalbumin complexation: Determination of bindingconstants and binding sites by fluorescence spectro-scopy. Biochim Biophys Acta 1721:164–173.
33. Lukas DS, De Martino AG. 1969. Binding of digi-toxin and some related cardenolides to humanplasma proteins. J Clin Invest 48:1041–1053.
34. Ding Y, Zhu X, Lin B. 1999. Investigation of asso-ciation parameters of basic drugs to human serumalbumin by capillary zone electrophoresis/frontalanalysis. Se Pu 17:58–60.
35. Hanada K, Ohta T, Hirai M, Arai M, Ogata H. 2000.Enantioselective binding of propranolol, disopyra-mide, and verapamil to human alpha(1)-acid glyco-protein. J Pharm Sci 89:751–757.
36. Brunner F, Muller WE. 1987. The stereoselectivityof the ‘single drug binding site’ of human alpha1-acid glycoprotein (orosomucoid). J Pharm Phar-macol 39:986–990.
37. Hansen T, Borlak J, Bader A. 2000. CytochromeP450 enzyme activity and protein expression inprimary porcine enterocyte and hepatocyte cultur-es. Xenobiotica 30:27–46.
38. Agoram B, Woltosz WS, Bolger MB. 2001. Predict-ing the impact of physiological and biochemical
NAL OF PHARMACEUTICAL SCIENCES, VOL. 97, NO. 1, JANUARY 2008

224 KATNENI, CHARMAN, AND PORTER
processes on oral drug bioavailability. Adv DrugDeliv Rev 50:S41–S67.
39. Lo MW, Effeney DJ, Pond SM, Silber BM, Riegel-man S. 1982. Lack of gastrointestinal metabolism ofpropranolol in dogs after portacaval transposition.J Pharmacol Exp Ther 221:512–515.
40. Mills PC, Siebert GA, Roberts MS. 2004. A model tostudy intestinal and hepatic metabolism of propra-nolol in the dog. J Vet Pharmacol Ther 27:45–48.
41. Shand DG, Rangno RE. 1972. The disposition ofpropranolol. I. Elimination during oral absorptionin man. Pharmacology 7:159–168.
42. Caldwell JH, Caldwell PB, Murphy JW, BeachlerCW. 1980. Intestinal secretion of digoxin in the rat.Augmentation by feeding activated charcoal. Nau-nyn Schmiedebergs Arch Pharmacol 312:271–275.
43. Liu S, Tam D, Chen X, Pang KS. 2006. P-glycopro-tein and an unstirred water layer barring digoxinabsorption in the vascularly perfused rat smallintestine preparation: Induction studies with preg-nenolone-16alpha-carbonitrile. Drug Metab Dispos34:1468–1479.
44. Johnson BM, Charman WN, Porter CJ. 2002. An invitro examination of the impact of polyethyleneglycol 400, Pluronic P85, and vitamin E d-alpha-tocopheryl polyethylene glycol 1000 succinate on P-glycoprotein efflux and enterocyte-based metabo-lism in excised rat intestine. AAPS Pharm Sci 4:E40.
45. Ungell AL, Andreasson A, Lundin K, Utter L. 1992.Effects of enzymatic inhibition and increased para-cellular shunting on transport of vasopressin ana-logues in the rat. J Pharm Sci 81:640–645.
46. Wan H, Ostlund A, Jonsson S, Lindberg W. 2005.Single run measurements of drug–protein bindingby high-performance frontal analysis capillary elec-trophoresis and mass spectrometry. Rapid Com-mun Mass Spectrom 19:1603–1610.
47. Wright JD, Boudinot FD, Ujhelyi MR. 1996. Mea-surement and analysis of unbound drug concentra-tions. Clin Pharmacokinet 30:445–462.
48. Di L, Kerns EH. 2003. Profiling drug-like propertiesin discovery research. Curr Opin Chem Biol 7:402–408.
49. Stoner CL, Cleton A, Johnson K, Oh DM, Hallak H,Brodfuehrer J, Surendran N, Han HK. 2004. Inte-
JOURNAL OF PHARMACEUTICAL SCIENCES, VOL. 97, NO. 1, JANUARY 2008
grated oral bioavailability projection using in vitroscreening data as a selection tool in drug discovery.Int J Pharm 269:241–249.
50. Lipinski CA, Lombardo F, Dominy BW, Feeney PJ.2001. Experimental and computational approachesto estimate solubility and permeability in drugdiscovery and development settings. Adv Drug DelivRev 46:3–26.
51. Copeland RA. 2000. Enzymes: A practical Introduc-tion to structure, mechanism and data analysis.2nd ed. New York: Wiley-VCH, Inc. pp 76–108.
52. Kenakin T. 1997. Pharmacologic analysis of drug-receptor interaction. 3rd edition. Philadelphia, NewYork: Lippincott-Raven Publishers. pp 255–256.
53. Connors KA. 2002. Thermodynamics of pharm-aceutical systems: An introduction for students ofpharmacy. Hoboken, NJ: John Wiley & Sons, Inc.pp 237–257.
54. Lee KJ, Mower R, Hollenbeck T, Castelo J, JohnsonN, Gordon P, Sinko PJ, Holme K, Lee YH. 2003.Modulation of nonspecific binding in ultrafiltrationprotein binding studies. Pharm Res 20:1015–1021.
55. Taylor S, Harker A. 2006. Modification of the ultra-filtration technique to overcome solubility andnon-specific binding challenges associated withthe measurement of plasma protein binding ofcorticosteroids. J Pharm Biomed Anal 41:299–303.
56. Gillis AM, Yee YG, Kates RE. 1985. Binding of anti-arrhythmic drugs to purified human alpha 1-acidglycoprotein. Biochem Pharmacol 34:4279–4282.
57. Antonov YA,Wolf BA. 2005. Calorimetric and struc-tural investigation of the interaction betweenbovine serum albumin and high molecular weightdextran in water. Biomacromolecules 6:2980–2989.
58. Tamura K, Yatsu T, Itoh H, Motoi Y. 1989. Isola-tion, characterization, and quantitative measure-ment of serum alpha 1-acid glycoprotein in cattle.Nippon Juigaku Zasshi 51:987–994.
59. Chauvelot-Moachon L, Tallet F, Durlach-Misteli C,Giroud JP. 1988. Delipidation of alpha 1-acid gly-coprotein. Propranolol binding to this glycoproteinand its modification by extracted material and exo-genous lipids. J Pharmacol Methods 20:15–28.
60. Primozic S, McNamara PJ. 1985. Effect of the sia-lylation state of alpha 1-acid glycoprotein on pro-pranolol binding. J Pharm Sci 74:473–475.
DOI 10.1002/jps