Fingerprint Recognition using MATLAB Graduation project Acknowledgement
Use of mineral magnetic measurements to fingerprint suspendedsediment sources: approaches and techniques for data analysis
J. Waldena,*, M.C. Slatteryb, T.P. Burtc
aSchool of Geography and Geology, University of St Andrews, Purdie Building, North Haugh,St Andrews KY16 9ST, UK
bDepartment of Geography, East Carolina University, Geenville, NC 27858-4353, USAcDepartment of Geography, University of Durham, Science Laboratories, South Road, Durham DH1 3LE, UK
Received 23 September 1996; accepted 2 June 1997
Abstract
Three analytical approaches, qualitative, statistical and quantitative, are evaluated when applied tomineral magnetic data to identify the relative sediment source contributions to suspended sedimentloads within a small catchment system. The qualitative and statistical analyses provide usefulinformation in their own right but, in addition, indicate the feasibility of quantitative sediment sourceascription using a sediment unmixing model based upon a linear programming algorithm. Thecriteria for such modelling are considered and the model formulation outlined. Model testing andinitial output suggest that, under certain conditions, unmixing models have considerable potential forthe quantification of suspended sediment source contributions. Qualitative and statistical analysesprovide a subjective means to judge the quality of the model output. A number of limitations withinthe approach are identified and some possible solutions to these limitations suggested.q 1997Elsevier Science B.V.
Keywords:Suspended sediments; Environmental magnetism; Sediment sources; Modelling
1. Introduction
Information concerning suspended sediment sources is an essential prerequisite inattempts to elucidate linkages within the sediment delivery system between the fieldand the river. One approach (e.g. Oldfield et al., 1979; Walling et al., 1979; Caitcheon,1993) has involved the use of mineral magnetic analyses to provide a compositional
0022-1694/97/$17.00q 1997 Elsevier Science B.V. All rights reservedPII S0022-1694(97)00078-4
Journal of Hydrology 202 (1997) 353–372
* Corresponding author. e-mail: [email protected]
fingerprint by which catchment sources can be compared with suspended sediments inorder to investigate the likely sources for the latter.
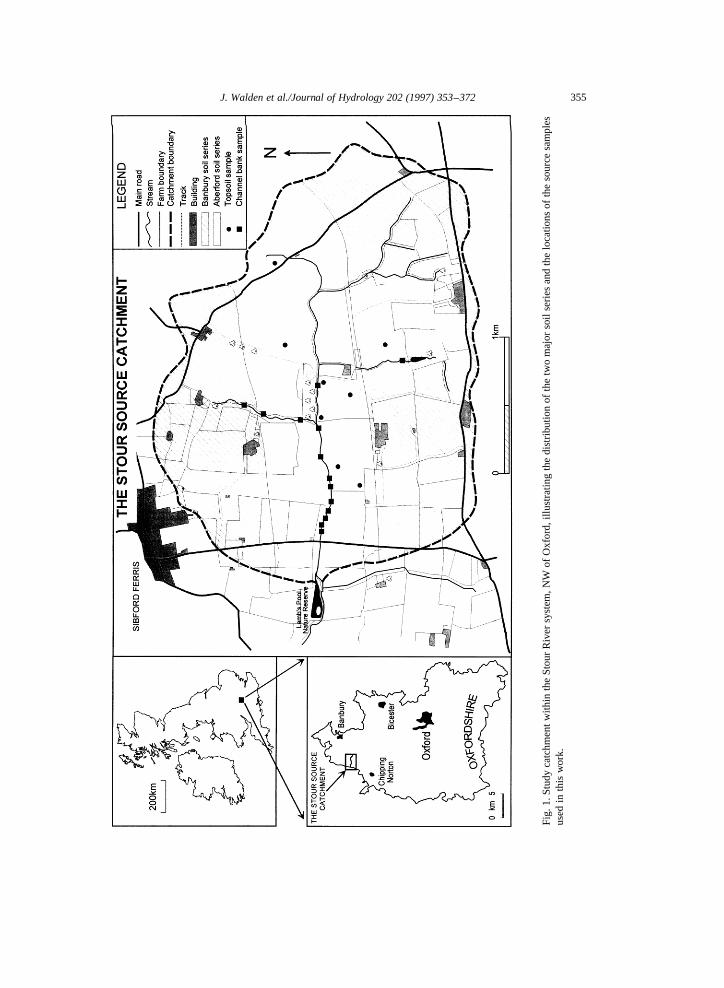
Slattery (1994) and Slattery et al. (in preparation) present results for such a study in asmall catchment of the River Stour, north Oxfordshire (Fig. 1). Field observation indicatedthat erosion of cultivated fields provides an important source of suspended sediment to theRiver Stour. Slattery et al. (in preparation), after suitable data analysis, focus upon theinterpretation of the magnetic data to examine the relative contributions from slopesources and channel erosion, and how these various sediment source areas change bothwithin and between individual storm events. The approaches used in the data analysis arethemselves of general interest and could be applied in other settings. Therefore, whilesome discussion of the environmental context will be made here, the data analysis tech-niques themselves and the computational steps involved form the focus of this paper.
1.1. Field setting
The study catchment (Fig. 1) has a drainage area of 6.2 km2, NW of Oxford and is aheadwater of a tributary to the Warwickshire Avon. Two major soil series are presentwithin the catchment, the Aberford and the Banbury Series (Jarvis et al., 1984) and the vastmajority of the catchment consists of cultivated land. Field observation and mineralmagnetic data summarised later suggested that three potential sediment source groupscan be identified: Aberford series topsoils; Aberford series channel bank material; and,either topsoils or channel bank material from the Banbury soil series (which could not bedistinguished magnetically). Representative field samples were collected from each ofthese potential sources. In addition, suspended sediment samples were collected using aRock and Taylor automatic pump sampler over a period of some 12 months along withrainfall and discharge readings (Slattery, 1994).
1.2. Mineral magnetic analysis
A series of standard mineral magnetic measurements (Thompson and Oldfield, 1986)including magnetic susceptibility (x), frequency dependent susceptibility (x fd), and iso-thermal remanence magnetisation (IRM) acquisition in magnetic fields between 20 and1000 mT were made on the field samples. Particle size analysis of the suspended sedimentsamples showed that material coarser than 63mm (4f) was almost totally absent, suggest-ing that sand grade material from the catchment was not being transported as suspendedload into the stream network. Magnetic analysis on the sediment sources was thereforeperformed only on material finer than 63mm. Analysis of size-specific magnetic properties(separated using the method of Walden and Slattery, 1993) for the three sources showedthat the differences in their respective particle size distributions had little influence on theirmagnetic properties, although this is accommodated in the modelling procedure.
The mineral magnetic data were analysed in three ways. A qualitative analysis, usinggraphical techniques and the ‘standard’ interpretations given in the literature (e.g. Thompsonand Oldfield, 1986; Maher, 1988; Oldfield, 1991) was followed by a statistical approach,using multivariate techniques (e.g. Oldfield and Clark, 1990; Walden et al., 1992) in orderto provide a more quantitative and, hopefully, objective analysis. Finally, the data were
354 J. Walden et al./Journal of Hydrology 202 (1997) 353–372
Fig
.1.S
tudy
catc
hmen
tw
ithin
the
Sto
urR
iver
syst
em,N
Wof
Oxf
ord,
illus
trat
ing
the
dist
ribut
ion
ofth
etw
om
ajor
soil
serie
san
dth
elo
catio
nsof
the
sour
cesa
mpl
esus
edin
this
wor
k.
355J. Walden et al./Journal of Hydrology 202 (1997) 353–372

subjected to an unmixing model (e.g. Thompson, 1986; Yu and Oldfield, 1989, 1993;Walden et al., 1993; Walling et al., 1993; Lees, 1994) which attempts to quantify theproportions of each catchment source to the suspended sediment samples based upon theirrespective magnetic properties.
This three-stage data analysis procedure has been the subject of a detailed review byLees (1994). She identified both the major advantages and limitations of the use ofmagnetic measurements for sediment source ascription in a range of sedimentary settingsbut these did not include a suspended sediment system such as that studied in this paper.Many of the conclusions drawn from her work are, however, applicable to such a systemand will be considered here.
2. Criteria for successful quantification of sediment sources
In the context of attempts to quantify sediment source contributions using magneticdata, Lees (1994) summarised the prerequisites for successful unmixing of sedimentsources:
2.1. Definition of potential source material types
It is critical to achieve optimal identification and definition of the source materialproperties as these represent the ‘end members’ of the model and strongly influence theeventual proportions of each source type ascribed to the sediment sample. This issue has anumber of implications.
1. Field sampling needs to be organised appropriately to enable intra- and inter-sourcevariation to be fully quantified (Lees, 1994).
2. Selection of the magnetic parameter values (e.g. mean) to represent each ‘end-member’(source) is critical. Sensitivity of the model output to changes in the properties used torepresent the sources should be considered to provide some idea of model reliability.
3. For successful modelling, the suspended sediment samples must have properties whichlie wholly within the range of behaviour displayed by the values chosen to represent thesources. Errors in source definition, chemical alteration during transport or size selec-tive transport of different sources may influence this.
2.2. Maximum number of source material types and data dimensionality
Lees (1994) suggests that when using magnetic parameters for source modelling only asmall number (three or four) of source types can realistically be used as magnetic para-meters are generally only sensitive to one, two or possibly three ‘dimensions’ (e.g. ironmineral concentrations, types and grain size). This restricts modelling to systems where itis environmentally sensible to identify only three or four end-members for the modellingprocess. Where possible, parameters sensitive to magnetic grain size (x fd or anhystereticremanent magnetization (xARM)) or combining magnetic with other geochemical ormineralogical analyses could be considered to increase the dimensionality of the data
356 J. Walden et al./Journal of Hydrology 202 (1997) 353–372
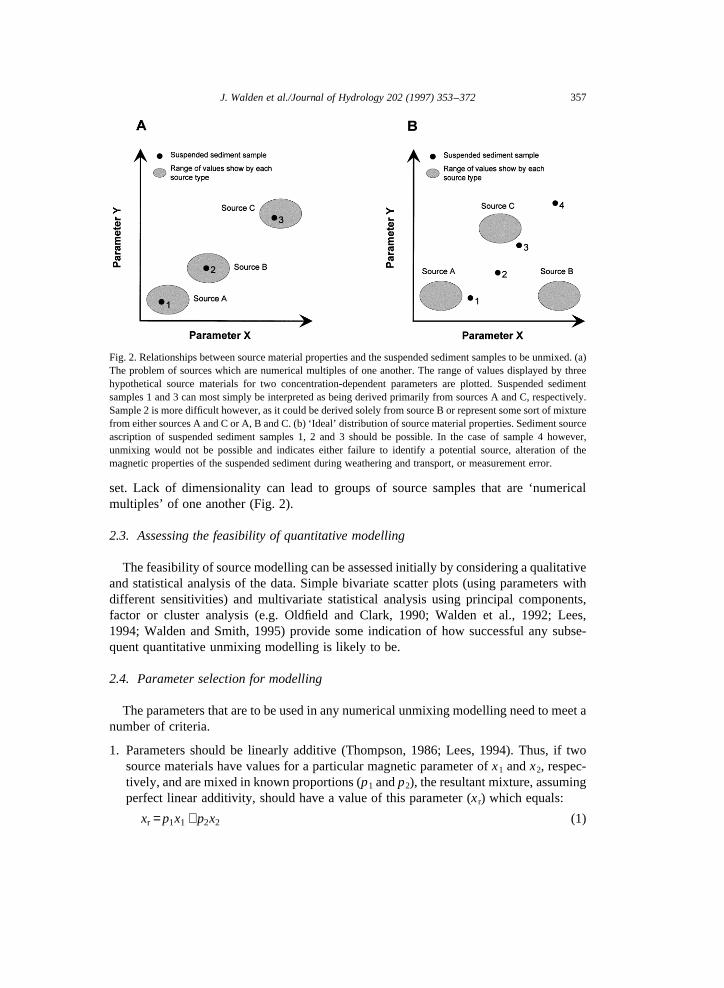
set. Lack of dimensionality can lead to groups of source samples that are ‘numericalmultiples’ of one another (Fig. 2).
2.3. Assessing the feasibility of quantitative modelling
The feasibility of source modelling can be assessed initially by considering a qualitativeand statistical analysis of the data. Simple bivariate scatter plots (using parameters withdifferent sensitivities) and multivariate statistical analysis using principal components,factor or cluster analysis (e.g. Oldfield and Clark, 1990; Walden et al., 1992; Lees,1994; Walden and Smith, 1995) provide some indication of how successful any subse-quent quantitative unmixing modelling is likely to be.
2.4. Parameter selection for modelling
The parameters that are to be used in any numerical unmixing modelling need to meet anumber of criteria.
1. Parameters should be linearly additive (Thompson, 1986; Lees, 1994). Thus, if twosource materials have values for a particular magnetic parameter ofx1 andx2, respec-tively, and are mixed in known proportions (p1 andp2), the resultant mixture, assumingperfect linear additivity, should have a value of this parameter (xr) which equals:
xr =p1x1 +p2x2 (1)
Fig. 2. Relationships between source material properties and the suspended sediment samples to be unmixed. (a)The problem of sources which are numerical multiples of one another. The range of values displayed by threehypothetical source materials for two concentration-dependent parameters are plotted. Suspended sedimentsamples 1 and 3 can most simply be interpreted as being derived primarily from sources A and C, respectively.Sample 2 is more difficult however, as it could be derived solely from source B or represent some sort of mixturefrom either sources A and C or A, B and C. (b) ‘Ideal’ distribution of source material properties. Sediment sourceascription of suspended sediment samples 1, 2 and 3 should be possible. In the case of sample 4 however,unmixing would not be possible and indicates either failure to identify a potential source, alteration of themagnetic properties of the suspended sediment during weathering and transport, or measurement error.
357J. Walden et al./Journal of Hydrology 202 (1997) 353–372
This equation can be expanded to include additional sources and multiple variablesusing linear programming algorithms (e.g. Simplex algorithm, Thompson, 1986). Suchtechniques are commonly used in operational research (Taha, 1992). An iterative searchis made to discover what combination of source material proportions minimises thedifference between the modelled magnetic properties and the observed (measured)properties of a particular suspended sediment sample.
2. Difficulties can occur when linearly additive parameters used in the model vary byorders of magnitude. Parameters with large values may therefore dominate the model(which is attempting to minimise differences between the modelled properties and theactual properties of the sediment sample) although ‘weighting’ certain parameters canhelp overcome this problem.
3. Qualitative data analysis
Table 1 summarises the magnetic properties for the three types of catchment sourcematerials (Slattery, 1994). Unfortunately, in this study, reliable measurement ofx fd wasnot possible given the low mass of many of the suspended sediment samples.
Fig. 3 plots x (roughly proportional to the concentration of ferrimagnetic mineralspecies) vs. hard IRM (sensitive to the concentration of antiferromagnetic species). Thesamples from the three source material types plot as separate clusters and it appears thatthe assemblages of magnetic minerals within the sources show some measurable differ-ences. Less encouragingly, Fig. 3 does suggest that the distribution of the three sourcetypes is closer to that shown in Fig. 2(a) than the ‘ideal’ shown in Fig. 2(b). This situationis likely to exist in many (the majority?) of natural field settings and while Fig. 3 does notsuggest these sources are pure ‘numerical multiples’, this problem may need furtherconsideration in any subsequent modelling.
The vast majority of the suspended sediment samples (classified into ‘non-storm’ and
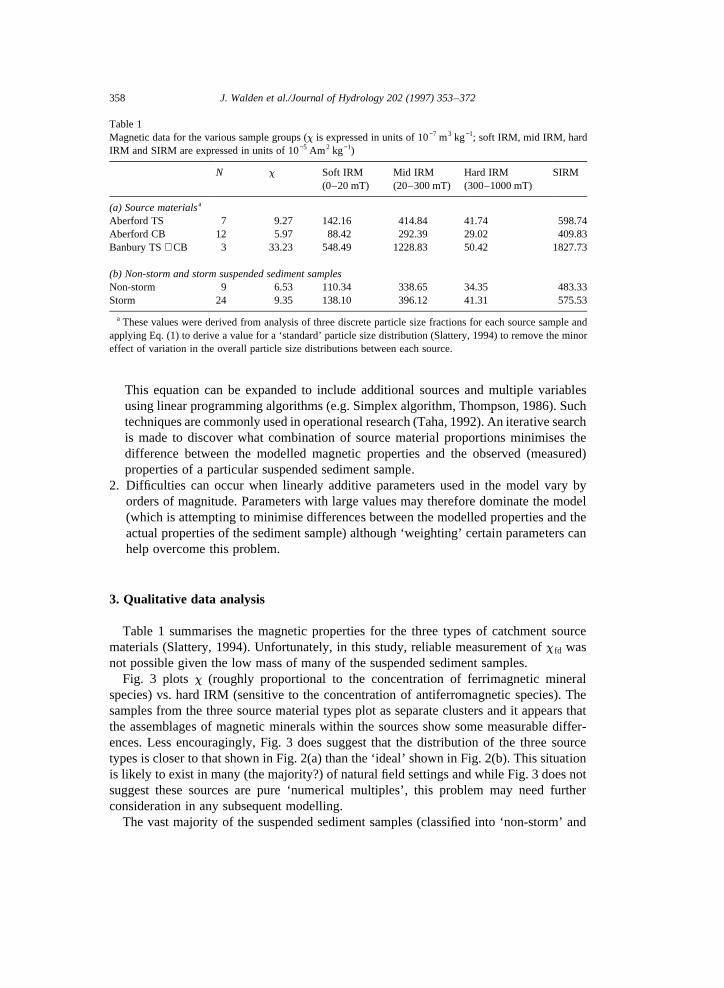
Table 1Magnetic data for the various sample groups (x is expressed in units of 10−7 m3 kg−1; soft IRM, mid IRM, hardIRM and SIRM are expressed in units of 10−5 Am2 kg−1)
N x Soft IRM Mid IRM Hard IRM SIRM(0–20 mT) (20–300 mT) (300–1000 mT)
(a) Source materialsa
Aberford TS 7 9.27 142.16 414.84 41.74 598.74Aberford CB 12 5.97 88.42 292.39 29.02 409.83Banbury TS+ CB 3 33.23 548.49 1228.83 50.42 1827.73
(b) Non-storm and storm suspended sediment samplesNon-storm 9 6.53 110.34 338.65 34.35 483.33Storm 24 9.35 138.10 396.12 41.31 575.53
a These values were derived from analysis of three discrete particle size fractions for each source sample andapplying Eq. (1) to derive a value for a ‘standard’ particle size distribution (Slattery, 1994) to remove the minoreffect of variation in the overall particle size distributions between each source.
358 J. Walden et al./Journal of Hydrology 202 (1997) 353–372
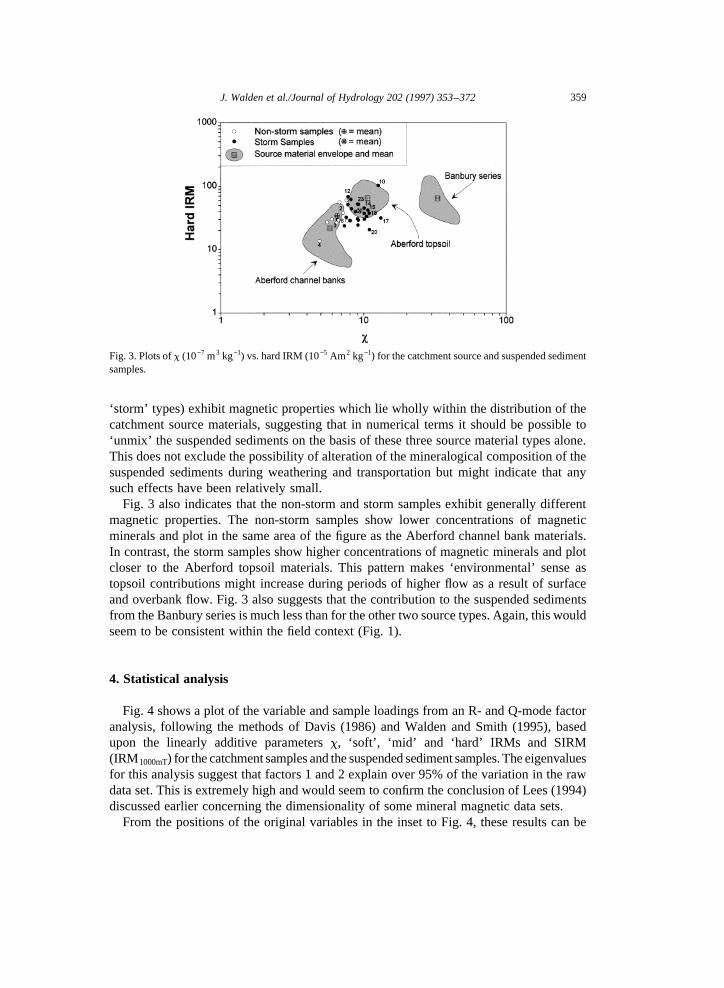
‘storm’ types) exhibit magnetic properties which lie wholly within the distribution of thecatchment source materials, suggesting that in numerical terms it should be possible to‘unmix’ the suspended sediments on the basis of these three source material types alone.This does not exclude the possibility of alteration of the mineralogical composition of thesuspended sediments during weathering and transportation but might indicate that anysuch effects have been relatively small.
Fig. 3 also indicates that the non-storm and storm samples exhibit generally differentmagnetic properties. The non-storm samples show lower concentrations of magneticminerals and plot in the same area of the figure as the Aberford channel bank materials.In contrast, the storm samples show higher concentrations of magnetic minerals and plotcloser to the Aberford topsoil materials. This pattern makes ‘environmental’ sense astopsoil contributions might increase during periods of higher flow as a result of surfaceand overbank flow. Fig. 3 also suggests that the contribution to the suspended sedimentsfrom the Banbury series is much less than for the other two source types. Again, this wouldseem to be consistent within the field context (Fig. 1).
4. Statistical analysis
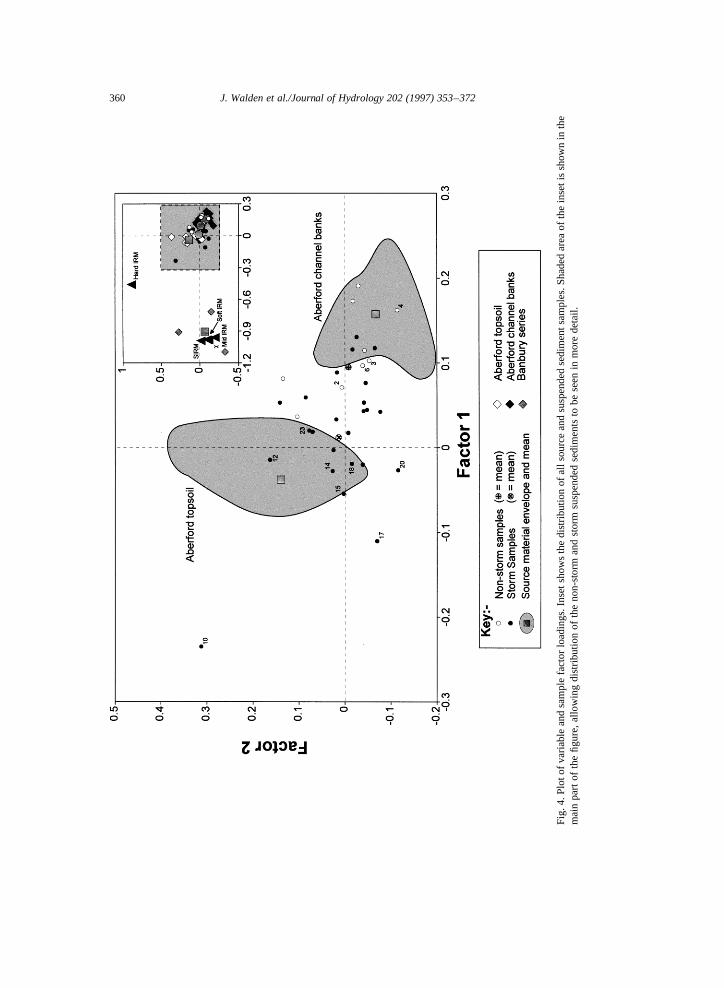
Fig. 4 shows a plot of the variable and sample loadings from an R- and Q-mode factoranalysis, following the methods of Davis (1986) and Walden and Smith (1995), basedupon the linearly additive parametersx, ‘soft’, ‘mid’ and ‘hard’ IRMs and SIRM(IRM 1000mT) for the catchment samples and the suspended sediment samples. The eigenvaluesfor this analysis suggest that factors 1 and 2 explain over 95% of the variation in the rawdata set. This is extremely high and would seem to confirm the conclusion of Lees (1994)discussed earlier concerning the dimensionality of some mineral magnetic data sets.
From the positions of the original variables in the inset to Fig. 4, these results can be
Fig. 3. Plots ofx (10−7 m3 kg−1) vs. hard IRM (10−5 Am2 kg−1) for the catchment source and suspended sedimentsamples.
359J. Walden et al./Journal of Hydrology 202 (1997) 353–372
Fig
.4.P
loto
fvar
iabl
ean
dsa
mpl
efa
ctor
load
ings
.Ins
etsh
ows
the
dist
ribut
ion
ofal
lsou
rce
and
susp
ende
dse
dim
ents
ampl
es.S
hade
dar
eaof
the
inse
tis
show
nin
the
mai
npa
rtof
the
figur
e,al
low
ing
dist
ribut
ion
ofth
eno
n-st
orm
and
stor
msu
spen
ded
sedi
men
tsto
bese
enin
mor
ede
tail.
360 J. Walden et al./Journal of Hydrology 202 (1997) 353–372
interpreted as follows: factor 1 is controlled by overall concentrations of magnetic mineralswhereas factor 2 is more influenced by ‘hard’ IRM and therefore reflects antiferromagneticmineral concentrations. The main part of Fig. 4 shows the centre of this factor space in anexpanded form. As in Fig. 3, the Aberford channel bank and topsoil sources form twodistinct clusters of samples, suggesting that they can be distinguished on the basis of thefive magnetic parameters used in this analysis. The majority of the non-storm and stormsuspended sediment samples plot within this same area on the factor diagram. Again, thenon-storm samples show a closer affinity to the channel bank source materials and thestorm samples to the topsoil source materials. Given the relatively large distance in factorspace between the suspended sediment samples and the Banbury series source samples itcan be inferred that this source makes less contribution to the sediment load of the streamsystem.
5. Conclusions from the qualitative and statistical analyses
The qualitative and statistical examination of the magnetic data suggest that the sourcematerials and the suspended sediment samples meet an acceptable number (if not all) ofthe criteria discussed by Lees (1994) and summarised earlier. Importantly:
1. The three source material types possess magnetic behaviours which can be distin-guished using linearly additive parameters;
2. The majority of the suspended sediment samples display magnetic behaviour whichlies within the range of behaviours exhibited by the three source types.
Figs. 3 and 4 suggest at least two potential problems with these data for quantitativesediment source ascription, as follows.
1. Between-group variation in magnetic properties may lack some dimensionality (Fig. 3).This issue may influence the effectiveness with which certain suspended sedimentsamples can be unmixed.
2. Within-group variation in the magnetic properties of the three source types is clearlypresent. As a single value (for each magnetic parameter) has to be selected to representthe properties of each source in any unmixing model, some decision has to be made asto what that value should be. While mean values would seem the most obvious choice,the model’s sensitivity to the parameter values chosen needs to be tested.
A number of ‘environmental’ conclusions can also be drawn from these initial quali-tative and statistical analyses.
1. Given that the magnetic properties of the majority of the suspended sediment sampleslie within the range of properties displayed by the three source material types, it mightbe possible to infer that all the major source types have been identified and that nomajor mineralogical alteration of the suspended sediments is occurring during theweathering and transportation processes.
2. Source contributions do vary under different flow conditions with Aberford channelbank material dominating in most low flow (non-storm) periods but with increasing
361J. Walden et al./Journal of Hydrology 202 (1997) 353–372
contributions from Aberford topsoil during high flow (storm) events. This is consistentwith field observation (Slattery, 1994).
3. The strongly magnetic Banbury Series source only makes a minor contribution to thesuspended sediment load. This is consistent with the location of the source within thecatchment (Fig. 1) and field observation.
6. Model formulation and use
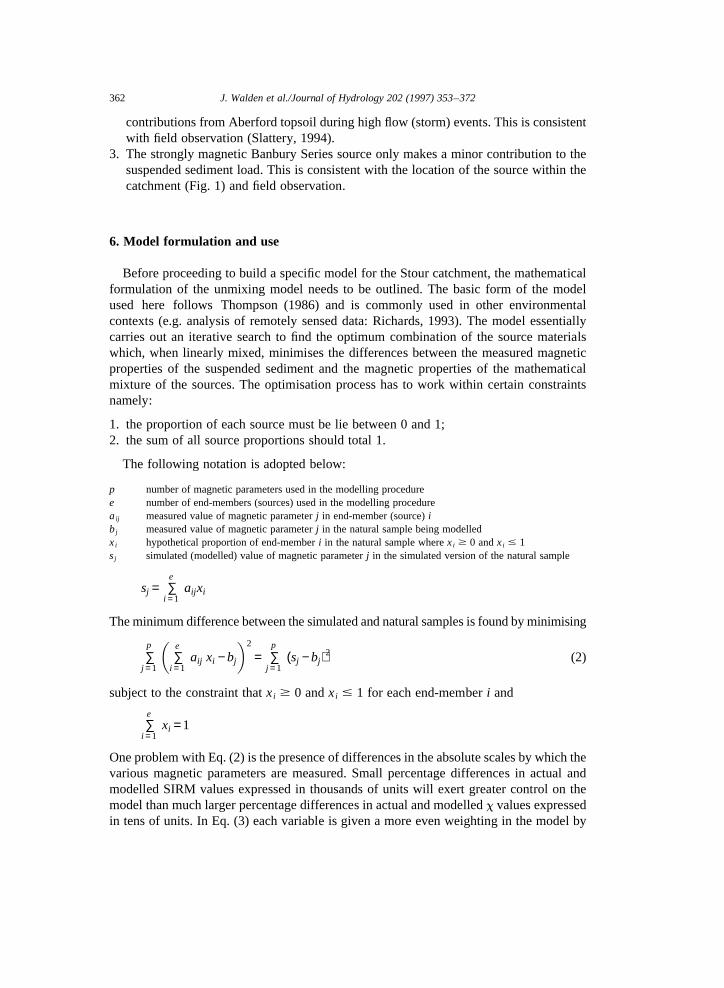
Before proceeding to build a specific model for the Stour catchment, the mathematicalformulation of the unmixing model needs to be outlined. The basic form of the modelused here follows Thompson (1986) and is commonly used in other environmentalcontexts (e.g. analysis of remotely sensed data: Richards, 1993). The model essentiallycarries out an iterative search to find the optimum combination of the source materialswhich, when linearly mixed, minimises the differences between the measured magneticproperties of the suspended sediment and the magnetic properties of the mathematicalmixture of the sources. The optimisation process has to work within certain constraintsnamely:
1. the proportion of each source must be lie between 0 and 1;2. the sum of all source proportions should total 1.
The following notation is adopted below:
p number of magnetic parameters used in the modelling proceduree number of end-members (sources) used in the modelling procedureaij measured value of magnetic parameterj in end-member (source)ibj measured value of magnetic parameterj in the natural sample being modelledxi hypothetical proportion of end-memberi in the natural sample wherexi $ 0 andxi # 1sj simulated (modelled) value of magnetic parameterj in the simulated version of the natural sample
sj = ∑e
i =1aij xi
The minimum difference between the simulated and natural samples is found by minimising
∑p
j =1∑e
i =1aij xi −bj
� �2
= ∑p
j =1(sj −bj)2 (2)
subject to the constraint thatxi $ 0 andxi # 1 for each end-memberi and
∑e
i =1xi =1
One problem with Eq. (2) is the presence of differences in the absolute scales by which thevarious magnetic parameters are measured. Small percentage differences in actual andmodelled SIRM values expressed in thousands of units will exert greater control on themodel than much larger percentage differences in actual and modelledx values expressedin tens of units. In Eq. (3) each variable is given a more even weighting in the model by
362 J. Walden et al./Journal of Hydrology 202 (1997) 353–372
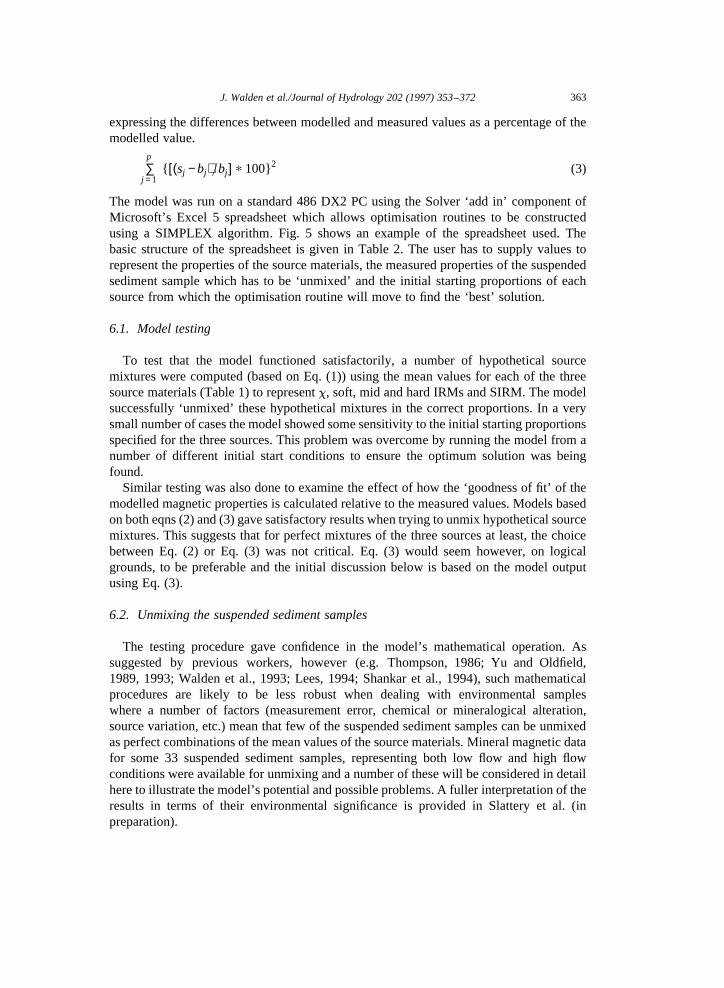
expressing the differences between modelled and measured values as a percentage of themodelled value.
∑p
j =1{ [(sj −bj)=bj ] p 100}2 (3)
The model was run on a standard 486 DX2 PC using the Solver ‘add in’ component ofMicrosoft’s Excel 5 spreadsheet which allows optimisation routines to be constructedusing a SIMPLEX algorithm. Fig. 5 shows an example of the spreadsheet used. Thebasic structure of the spreadsheet is given in Table 2. The user has to supply values torepresent the properties of the source materials, the measured properties of the suspendedsediment sample which has to be ‘unmixed’ and the initial starting proportions of eachsource from which the optimisation routine will move to find the ‘best’ solution.
6.1. Model testing
To test that the model functioned satisfactorily, a number of hypothetical sourcemixtures were computed (based on Eq. (1)) using the mean values for each of the threesource materials (Table 1) to representx, soft, mid and hard IRMs and SIRM. The modelsuccessfully ‘unmixed’ these hypothetical mixtures in the correct proportions. In a verysmall number of cases the model showed some sensitivity to the initial starting proportionsspecified for the three sources. This problem was overcome by running the model from anumber of different initial start conditions to ensure the optimum solution was beingfound.
Similar testing was also done to examine the effect of how the ‘goodness of fit’ of themodelled magnetic properties is calculated relative to the measured values. Models basedon both eqns (2) and (3) gave satisfactory results when trying to unmix hypothetical sourcemixtures. This suggests that for perfect mixtures of the three sources at least, the choicebetween Eq. (2) or Eq. (3) was not critical. Eq. (3) would seem however, on logicalgrounds, to be preferable and the initial discussion below is based on the model outputusing Eq. (3).
6.2. Unmixing the suspended sediment samples
The testing procedure gave confidence in the model’s mathematical operation. Assuggested by previous workers, however (e.g. Thompson, 1986; Yu and Oldfield,1989, 1993; Walden et al., 1993; Lees, 1994; Shankar et al., 1994), such mathematicalprocedures are likely to be less robust when dealing with environmental sampleswhere a number of factors (measurement error, chemical or mineralogical alteration,source variation, etc.) mean that few of the suspended sediment samples can be unmixedas perfect combinations of the mean values of the source materials. Mineral magnetic datafor some 33 suspended sediment samples, representing both low flow and high flowconditions were available for unmixing and a number of these will be considered in detailhere to illustrate the model’s potential and possible problems. A fuller interpretation of theresults in terms of their environmental significance is provided in Slattery et al. (inpreparation).
363J. Walden et al./Journal of Hydrology 202 (1997) 353–372

Fig
.5.
Exa
mpl
eof
the
unm
ixin
gm
odel
cons
truc
ted
usin
gth
eS
olve
rad
d-in
inM
icro
soft’
sE
xcel
5sp
read
shee
t.S
eete
xtan
dT
able
2fo
rex
plan
atio
n.364 J. Walden et al./Journal of Hydrology 202 (1997) 353–372
6.3. Reliable estimates of sediment source
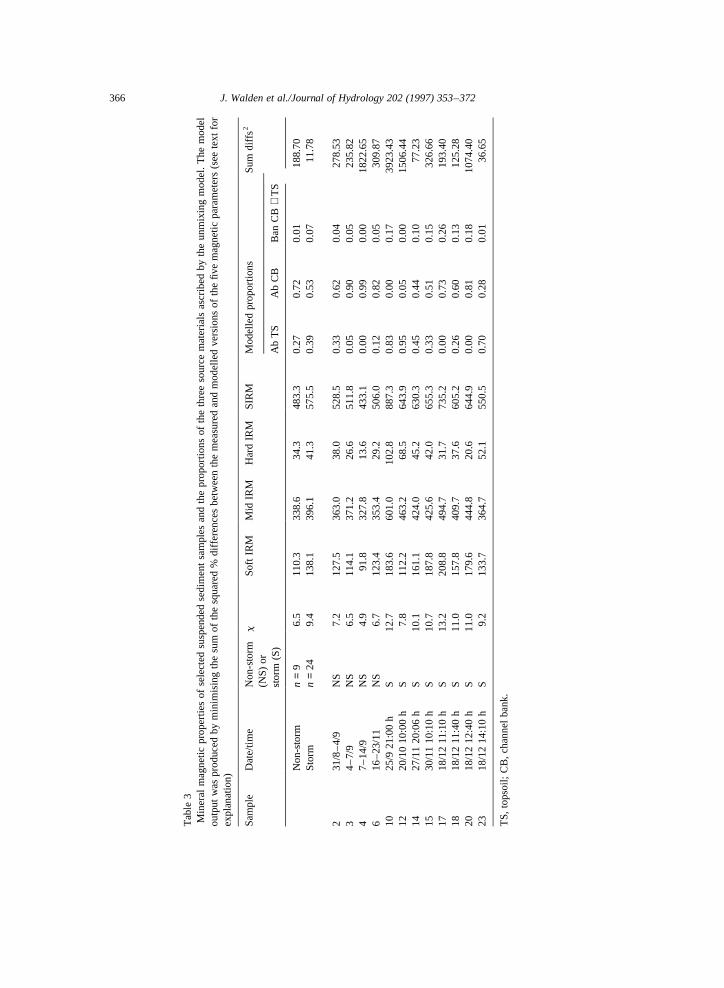
Both Figs. 3 and 4 offer some insight into the type of suspended samples for which theunmixing model might produce more or less reliable estimates of sediment source con-tributions. For example, while the suspended sediment samples 4, 10, 12, 17 and 20 all liewithin the range of magnetic properties displayed by the source materials, they lie near tothe extremes of those properties and therefore at some distance from the mean values ofeach source material type chosen to represent that source type within the unmixing model.In contrast, the mean values of both the non-storm and storm sample types lie nearer to theAberford source means as do, for example, suspended sediment samples 2, 14 and 23.
Table 3 shows the model output for selected suspended sediment samples. The results ofthe modelling process for the mean magnetic properties of the non-storm and stormsamples are consistent with both Figs. 3 and 4 and seem sensible given their environmentalcontext. Thus, the non-storm mean is dominated by material derived from the Aberfordchannel banks but with a significant proportion of Aberford topsoil. As discussed bySlattery (1994) and Slattery et al. (in preparation), material derived from the Aberfordtopsoil at higher flow conditions and subsequently stored on the channel bed is the mostlikely source of this contribution during lower flow levels. In contrast, the storm meansample shows greater proportions of Aberford topsoil and a small contribution from theBanbury series source. Many of the higher flow events generated overbank flow (Slattery,1994; Slattery et al., in preparation) providing an obvious mechanism for incorporation ofgreater amounts of Aberford topsoil into the suspended sediment system. The sum ofsquared differences is lower for the storm mean sample, suggesting that mathematicallyat least, the model is a better ‘fit’ for this sample than for the non-storm mean.
Samples 2, 14 and 23 produce what would appear to be sensible proportions of the threesource materials given their magnetic properties and their respective flow conditions. Ineach case, the sum of squared differences are also relatively low. Pairs of samples 3 and 6(non-storm samples) and samples 15 and 18 (storm samples) show similar magnetic
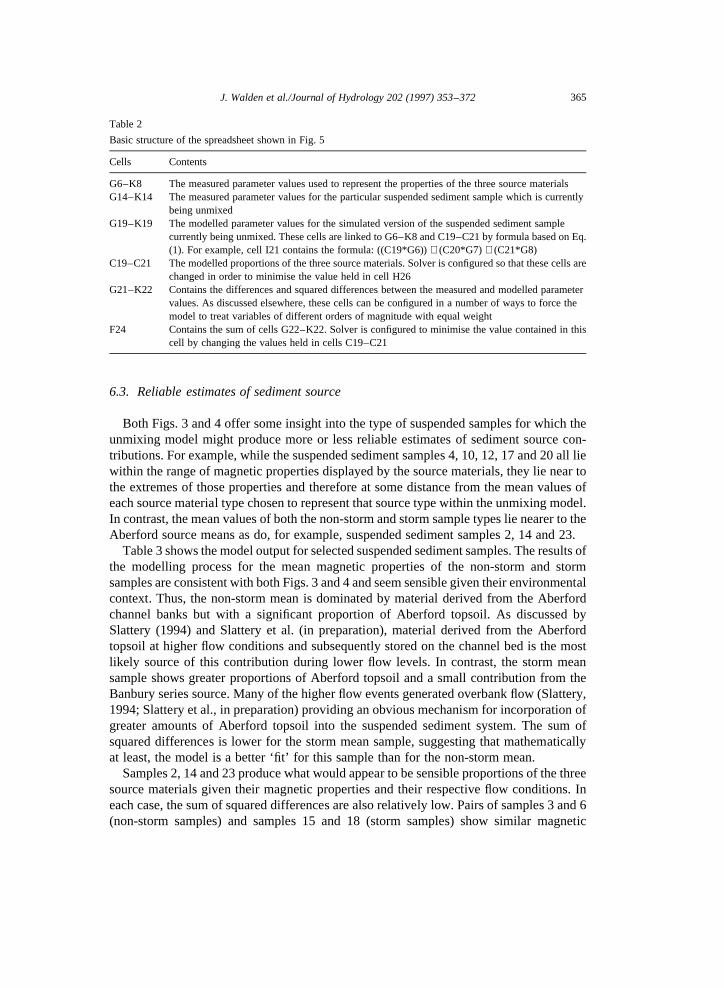
Table 2
Basic structure of the spreadsheet shown in Fig. 5
Cells Contents
G6–K8 The measured parameter values used to represent the properties of the three source materialsG14–K14 The measured parameter values for the particular suspended sediment sample which is currently
being unmixedG19–K19 The modelled parameter values for the simulated version of the suspended sediment sample
currently being unmixed. These cells are linked to G6–K8 and C19–C21 by formula based on Eq.(1). For example, cell I21 contains the formula: ((C19*G6))+ (C20*G7)+ (C21*G8)
C19–C21 The modelled proportions of the three source materials. Solver is configured so that these cells arechanged in order to minimise the value held in cell H26
G21–K22 Contains the differences and squared differences between the measured and modelled parametervalues. As discussed elsewhere, these cells can be configured in a number of ways to force themodel to treat variables of different orders of magnitude with equal weight
F24 Contains the sum of cells G22–K22. Solver is configured to minimise the value contained in thiscell by changing the values held in cells C19–C21
365J. Walden et al./Journal of Hydrology 202 (1997) 353–372
Tab
le3
Min
eral
mag
netic
prop
ertie
sof
sele
cted
susp
ende
dse
dim
ent
sam
ples
and
the
prop
ortio
nsof
the
thre
eso
urce
mat
eria
lsas
crib
edby
the
unm
ixin
gm
odel
.T
hem
odel
outp
utw
aspr
oduc
edby
min
imis
ing
the
sum
ofth
esq
uare
d%
diffe
renc
esbe
twee
nth
em
easu
red
and
mod
elle
dve
rsio
nsof
the
five
mag
netic
para
met
ers
(see
tex
tfo
rex
plan
atio
n)
Sam
ple
Dat
e/tim
eN
on-s
torm
(NS
)or
stor
m(S
)
xS
oft
IRM
Mid
IRM
Har
dIR
MS
IRM
Mod
elle
dpr
opor
tions
Sum
diffs2
Ab
TS
Ab
CB
Ban
CB
+T
S
Non
-sto
rmn
=9
6.5
110.
333
8.6
34.3
483.
30.
270.
720.
0118
8.70
Sto
rmn
=24
9.4
138.
139
6.1
41.3
575.
50.
390.
530.
0711
.78
231
/8–
4/9
NS
7.2
127.
536
3.0
38.0
528.
50.
330.
620.
0427
8.53
34
–7/
9N
S6.
511
4.1
371.
226
.651
1.8
0.05
0.90
0.05
235.
824
7–
14/9
NS
4.9
91.8
327.
813
.643
3.1
0.00
0.99
0.00
1822
.65
616
–23
/11
NS
6.7
123.
435
3.4
29.2
506.
00.
120.
820.
0530
9.87
1025
/921
:00
hS
12.7
183.
660
1.0
102.
888
7.3
0.83
0.00
0.17
3923
.43
1220
/10
10:0
0h
S7.
811
2.2
463.
268
.564
3.9
0.95
0.05
0.00
1506
.44
1427
/11
20:0
6h
S10
.116
1.1
424.
045
.263
0.3
0.45
0.44
0.10
77.2
315
30/1
110
:10
hS
10.7
187.
842
5.6
42.0
655.
30.
330.
510.
1532
6.66
1718
/12
11:1
0h
S13
.220
8.8
494.
731
.773
5.2
0.00
0.73
0.26
193.
4018
18/1
211
:40
hS
11.0
157.
840
9.7
37.6
605.
20.
260.
600.
1312
5.28
2018
/12
12:4
0h
S11
.017
9.6
444.
820
.664
4.9
0.00
0.81
0.18
1074
.40
2318
/12
14:1
0h
S9.
213
3.7
364.
752
.155
0.5
0.70
0.28
0.01
36.6
5
TS
,to
psoi
l;C
B,
chan
nelb
ank.
366 J. Walden et al./Journal of Hydrology 202 (1997) 353–372
properties (Figs. 3 and 4) and, encouragingly, the output from the unmixing model is bothsimilar and environmentally sensible for each pair.
6.4. Less reliable estimates of sediment source
Less confidence might be placed in the ability of the model to ascribe source proportionsto samples 4, 10, 12, 17 and 20 and with the exception of sample 17, the sum of the errorsappear relatively high, suggesting a poor fit between the modelled and measured magneticproperties. In each case, the qualitative interpretation of Figs. 3, and 5 provide a guide tothe likely usefulness of the model output. For example, the model ascribes a channel bankcontribution of almost 100% Aberford to sample 4. While the error term is relatively large,the position of sample 4 in Figs. 3 and 4 suggests the model output is environmentallysensible. The large error term is simply a function of the fact that this sample has magneticproperties which are more like the magnetically weaker of the Aberford channel banksource samples than the mean for this source group.
In contrast, the source proportions ascribed to sample 10 with 0% Aberford channelbanks, while mathematically the optimum solution, would seem to be unrealistic given thefield setting. The measured magnetic properties of the sample are somewhat extremerelative to the source means. Although measurement error is a possible cause, two otherpossibilities, chemical alteration or selective transport, are more likely explanations.Further field observations would be required to determine the likelihood of either explana-tion. Alternatively, it may be that a more realistic source mixture for sample 10 wouldinclude a proportion of the Aberford channel banks, a smaller proportion of the Aberfordtopsoil and a slightly larger proportion of the Banbury series. This sample might beexhibiting the same problem as sample 2 in Fig. 2(a). The ‘numerical multiple’ problemmeans that the model cannot resolve between a number of possible mixtures whichproduce similar mathematical solutions, some of which make more environmental sensethan others. For example, a mixture of 35%, 41% and 24% Aberford topsoil, channelbanks and Banbury series, respectively, produces a slightly higher error term but wouldseem more realistic given the environmental setting. Samples 12, 17 and 20 might alsoexhibit this problem.
Whichever of the above explanations is the actual cause of the unrealistic or poornumerical fit of the model, attempting to quantify the source contributions would seemunwise for those samples lying at the extremes of behaviour for the suspended sedimentsas a whole. In these cases, a qualitative interpretation of the particular sample data may beall that is justifiable.
6.5. Comparison with factor analysis
When Eq. (2) is used to calculate the error term between the modelled and measuredmagnetic properties, in a number of cases the model ascribes significantly different sourceproportions. For example, sample 2 is modelled as 63% Aberford topsoil and 37%Aberford channel banks. While this might not seem to be unreasonable in terms of theenvironmental setting, the proportions given in Table 3, based upon Eq. (3), are muchmore consistent with the output from the factor analysis (Fig. 4). The position of sample 2
367J. Walden et al./Journal of Hydrology 202 (1997) 353–372
lies almost directly between that of the positions of the mean samples for the two Aberfordsource types, but significantly closer to that of the Aberford channel bank mean, suggest-ing greater proportions of that source within the sample. If the relative distances in factorspace of sample 2 are measured from the positions of the two Aberford source means, theysuggest proportions almost identical to those given in Table 3 (allowing for the smallBanbury series contribution).
Similar calculations for other samples lying almost directly between these two sourcemeans on Fig. 4, including samples 3, 6 and 23, would seem to confirm that the modelbased upon Eq. (3) and the factor analysis provide similar indications of the sedimentsource proportions. This in turn, would seem to suggest that the use of Eq. (3) in theunmixing model is preferable to Eq. (2).
6.6. Sensitivity analysis
All of the above analyses were based upon an unmixing model using the mean proper-ties of the magnetic variables for the three source material types (Table 1). The sensitivityof the model output to these properties was tested by systematically changing their valuesand the output produced by the model varied in a predictable manner. For example, in oneexperiment, the parameter values for Aberford topsoil and Aberford channel banks wereadjusted in steps of 5% (up to 20%) in opposite directions (effectively stretching orcontracting the multivariate ‘distance’ between these two sources). Where the propertiesof individual suspended sediment samples remained between those of the two sourcetypes, the source proportions ascribed to them were very similar to those of the standardmodel using the mean source properties. Only as the change in the source material proper-ties moved the source ‘closer’ in multivariate space to an individual suspended sedimentsample did that sample produce significantly different unmixing results.
In all cases, however, the model continued to produce similar source proportions forsuspended sediment samples with comparable magnetic properties (e.g. samples 3 and 6).This suggests that even if the parameter values adopted for a given source are not accuraterepresentations of that source, whilst the modelled source proportions will also be lessaccurate in absolute terms, the patterns in modelled source proportions for a particular setof suspended sediment samples should be similar. Identification of any such patternsmight, in itself, be justification for the modelling. The testing of the model sensitivitysuggested no logical reason why mean parameter values of each source type should not beadopted for modelling purposes.
7. Discussion
These results emphasise a number of issues already raised, concerning both the modellingprocessingeneralandthespecificenvironmentalsettingfromwhichthesesamplesweredrawn.
7.1. General issues
Two important general issues are highlighted by these results. First, in examining the
368 J. Walden et al./Journal of Hydrology 202 (1997) 353–372
output from the model, it is clear that the qualitative and statistical analyses of the datahave provided a useful guide concerning both the general feasibility of modelling and,more specifically, some indication of which individual samples might prove difficult tounmix for particular reasons. The model output can therefore be examined in a morecritical fashion. While this in no way confirms how realistic or useful the model outputmight be in environmental terms, it does give some confidence in the numerical robustnessof the modelling process itself. The environmental interpretation of the model output stillrequires some subjective judgement on the part of the researcher to assess the realism ofthe modelled sediment source proportions.
Second, the accuracy of the quantitative estimates of source contributions is difficult toassess as the absolute values produced by the model will be different if the source materialsare defined by different values of each parameter measured. The initial definition of thenumber and mean properties of the source materials is therefore both a critical componentof the modelling process (Lees, 1994) and, even with the most rigorous field procedures,conditional upon an element of subjective judgement on behalf of the researcher.
In this study, suspended sediment samples caught at the catchment outlet might havetravelled only a few tens of metres. They may therefore have been derived from anindividual section of channel bank (a bank slump, for example) and would possess thecompositional properties of that particular portion of the channel bank source rather thanthe ‘mean’ properties of the channel banks in general. In a larger catchment system, suchindividual point source contributions are more likely to be diluted and will therefore beless significant. In contrast, the initial definition of the source types in a larger catchmentsystem would clearly be a more difficult task.
7.2. Issues specific to this environmental setting
Two main issues which are specific to this individual field setting are highlighted. First,these data do show an element of the ‘numerical multiple’ problem and therefore somecaution is needed in interpretation of the quantitative output provided by the modellingprocess. In most cases however, comparison of the model output with the qualitative andstatistical data analyses can allow spurious model results for particular suspended sedi-ment samples to be identified. Despite the qualification above concerning the definition ofthe source material properties, the general nature of the model output would seem sensiblegiven the environmental context. Thus, the relatively greater contribution of Aberfordtopsoil material during periods of higher discharges is consistent with field observations ofoverbank and surface flow during these periods. Identification of this pattern is in itselfuseful, even if it is difficult to assess the absolute accuracy of the proportions ascribed toeach source. This problem may well present itself in other field settings and the use ofadditional compositional properties such as elemental geochemistry to provide greaterdimensionality for the modelling algorithm to work with is recommended.
Second, a number of explanations can be suggested to account for the fact that some ofthe suspended sediment samples display results which lie outside the mean values adoptedfor the source material types. Some effort should be made to identify the presence orabsence of selective particle size transport or chemical alteration during transportation andthe effect such processes might have on subsequent modelling. These issues are currently
369J. Walden et al./Journal of Hydrology 202 (1997) 353–372

under investigation (Jenns, in preparation). An additional problem here may be small massof the suspended sediment samples. Like most analytical equipment, magnetic instrumen-tation does display some sensitivity to sample mass (e.g. Dearing, 1994) and the bulksuspended sediment samples collected by some pump water samplers can be of very smallmass. Material collected using continuous flow centrifuge equipment would therefore bean advantage in this type of work. While the influence of these factors can not be ruled outin the current field context, for many of the suspended sediment samples available, themodelling process seems to have produced realistic results even if those results are ofunknown absolute accuracy.
8. Conclusions
A number of conclusions can be drawn from this work which support the main findingsof Lees (1994) in other types of sedimentary environments.
1. Identification of the major source material types within the sedimentary system andquantification of their compositional properties is a critical step in any attempt toquantify sediment source contributions using linear programming algorithms. Sourceswhich do not have distinct compositional properties or are numerical multiples of oneanother will make attempts at source modelling much less reliable.
2. Qualitative and statistical analyses of compositional data which are being consideredfor sediment source unmixing perform two important tasks: assessment of how well thedata fit the various criteria necessary for successful application of the modelling pro-cedure and, once modelling is performed, provision of a useful means of verifying (atleast in a numerical sense) how realistic the output produced by the model is likely to befor particular suspended sediment samples.
3. While the modelling procedure can reliably unmix ‘perfect’ mixtures of the sourcematerials, field samples will not unmix without some errors. Such errors can have anumber of causes including the natural levels of variability within each source type butfactors such as compositional alteration or selective sediment transport must also beconsidered.
4. It would seem therefore, that unmixing models can be a useful development from initialqualitative and statistical analysis of suspended sediment source ascription, providedsuch quantitative results are interpreted with an full awareness of their possible limita-tions. It is also clear that there is considerable scope for further development of thesetypes of modelling procedures provided the recommendations outlined by Lees (1994)and summarised here are carefully followed.
5. Within this particular field setting, it appears that the modelling procedure can offersome real insights into the proportions of the source material contributions to thesuspended sediment system. While the absolute accuracy of the quantitative estimatesof source material ascription is uncertain, it is encouraging that the values suggested fornon-storm and storm flow conditions are consistent with both field observation and thequalitative appraisal of these same data. Further work, combining magnetic with otherforms of compositional analyses is clearly warranted.
370 J. Walden et al./Journal of Hydrology 202 (1997) 353–372
Slattery et al. (in preparation) develop this final conclusion by examining the environ-mental interpretation of the model output in more detail within the context of this parti-cular field setting and as a tool to assist other studies of sediment source ascription insuspended sediment systems.
Acknowledgements
The authors wish to thank the School of Geography, University of Oxford for access tothe facilities used in this work. J.W. would like to thank Dr Joan Lees (CoventryUniversity), Prof. John Dearing (Liverpool University) and Dr Bill Macmillan (OxfordUniversity) for useful discussions on the modelling procedures used in this paper.
References
Caitcheon, G.G., 1993. Sediment source tracing using environmental magnetism: a new approach with examplesfrom Australia, Hydrological Processes, 7, 349–358.
Davis, J.C., 1986. Statistics and Data Analysis in Geology, 2nd edn. Wiley, New York.Dearing, J.A., 1994. Environmental Magnetic Susceptibility: Using the Bartington MS2 System. Chi Publishing,
Kenilworth.Jarvis, M.G., Allen, R.H., Fordham, S.J., Hazeelden, J., Moffat, A.J., Sturdy, R.G., 1984. Soil Survey of England
and Wales, Bulletin 15, Harpendon.Jenns, N.J., in preparation. Sediment source ascription and quantification using mineral magnetics: a palaeo-
limnological reconstruction of the sedimentation of Slapton Higher Ley. M.Sc. Thesis, University of Oxford,UK.
Lees, J.A., 1994. Modelling the magnetic properties of natural and environmental materials. Unpublished Ph.D.Thesis, University of Coventry, UK.
Maher, B.A., 1988. Magnetic properties of some synthetic sub-micron magnetites, Journal of GeophysicalResearch, 94, 83–96.
Oldfield, F., 1991. Environmental magnetism; a personal perspective, Quaternary Science Reviews, 10, 73–85.Oldfield, F., Rummery, T.A., Thompson, R., Walling, D.E., 1979. Identification of suspended sediment sources
by means of magnetic measurements, Water Resources Research, 15, 211–218.Oldfield, F., Clark, R.L., 1990. Lake sediment-based studies of soil erosion. In: J. Boardman, I.D.L. Foster, J.A.
Dearing (Editors), Soil Erosion on Agricultural Land. Wiley, Chichester, pp. 201–230.Richards, J.A., 1993. Remote Sensing Digital Image Analysis, 2nd edn. Springer, Berlin.Shankar, R., Thompson, R., Galloway, R.B., 1994. Sediment source modelling: unmixing of artificial magnetisa-
tion and natural radioactivity measurements, Earth and Planetary Science Letters, 126, 411–420.Slattery, M.C., 1994. Contemporary sediment dynamics and sediment delivery in a small agricultural catchment,
north Oxfordshire, U.K. Unpublished Ph.D. Thesis, University of Oxford, UK.Slattery, M.C., Burt, T.P., Walden, J., in preparation. Use of mineral magnetic measurements to fingerprint
suspended sediment sources: a case study using a small agricultural catchment, Oxfordshire, UK.Taha, H.A., 1992. Operations Research: An Introduction, 5th edn. Macmillan, New York.Thompson, R., 1986. Modelling magnetization data using SIMPLEX, Physics of the Earth and Planetary Inter-
iors, 42, 113–127.Thompson, R., Oldfield, F., 1986. Environmental Magnetism. Allen and Unwin, London.Walden, J., Smith, J.P., Dackombe, R.V., 1992. The use of simultaneous R- and Q-mode factor analysis as a tool
for assisting interpretation of mineral magnetic data, Mathematical Geology, 24, 227–247.Walden, J., Slattery, M.C., 1993. Verification of a simple gravity technique for separation of particle size fractions
suitable for mineral magnetic analysis, Earth Surface Processes and Landforms, 18, 829–833.
371J. Walden et al./Journal of Hydrology 202 (1997) 353–372

Walden, J., White, K., Macmillan, W.D., Burt, T., Slattery, M., Parker, A., 1993. A comparison of qualitative,statistical and mathematical approaches for identification of natural magnetic mineral assemblages withinsediment samples. European Geophysical Society XVIII General Assembly, Wiesbaden, Germany.
Walden, J., Smith, J.P., 1995. Factor analysis: a practical application. In: D. Maddy, J.S. Brew (Editors),Statistical Modelling of Quaternary Science Data: A Practical Manual. Technical Guide Series, QuaternaryResearch Association, pp. 39–63.
Walling, D.E., Peart, M.R., Oldfield, F., Thompson, R., 1979. Suspended sediment sources identified by magneticmeasurements, Nature, 281, 110–113.
Walling, D.E., Woodward, J.C., Nicholas, A.P., 1993. A multi-parameter approach to fingerprinting suspendedsediment sources. In: N.E. Peters, E. Hoehn, Ch. Leibundgut, N. Tase, D.E. Walling (Editors), Tracers inHydrology. IAHS Publication 215, pp. 328–338.
Yu, L., Oldfield, F., 1989. A multivariate mixing model for identifying sediment source from magnetic measure-ments, Quaternary Research, 32, 168–181.
Yu, L., Oldfield, F., 1993. Quantitative sediment source ascription using magnetic measurements in a reservoir-catchment system near Nijar, S.E. Spain, Earth Surface Processes and Landforms, 18, 441–454
372 J. Walden et al./Journal of Hydrology 202 (1997) 353–372
Copyright © 2022 FDOKUMEN