Cardiorespiratory Fitness in Pediatric Renal Transplant Recipients
For Peer ReviewThe Use of Artificial Neural Networks (ANN) in Prediction of Congenital
CMV Outcome from Sequence Data
Journal: Bioinformatics
Manuscript ID: BIOINF-2008-0360
Category: Original Paper
Date Submitted by the Author:
11-Mar-2008
Complete List of Authors: Arav-Boger, Ravit; Johns Hopkins, Pediatrics Boger, Yuval; Sensics Foster, Charles; Cleveland Clinic, Pediatrics Boger, Zvi; Optimal Neural Informatics
Keywords:cytomegalovirus, strains, artificial neural networks, outcome, congenital
Bioinformatics
For Peer Review
The Use of Artificial Neural Networks in Prediction of Congenital CMV Outcome from Sequence Data
Running title: Neural network model of CMV genes
*Ravit Arav-Boger1, Yuval S. Boger2, Charles B. Foster3, Zvi Boger4
1 Department of Pediatrics, Division of Infectious Diseases, Johns Hopkins Hospital, Baltimore, MD
2 Sensics Inc, Baltimore, MD
3 Department of Pediatrics, Division of Infectious Diseases, The Cleveland Clinic, Cleveland, OH
4 Optimal Neural Informatics, Pikesville, MD
* Ravit Arav-Boger, MD
Department of Pediatrics, Division of Infectious Diseases
Johns Hopkins Hospital
200 N. Wolfe St. /room 3153
Baltimore, MD 21287
Phone: 410-614-3917 Fax: 410-614-1491
Financial Support: N/A
Category of study: translational
Page 1 of 21 Bioinformatics
123456789101112131415161718192021222324252627282930313233343536373839404142434445464748495051525354555657585960

For Peer Review
Word count of abstract: 227
Word count of manuscript: 4765 (including references, tables and figures)
Page 2 of 21Bioinformatics
123456789101112131415161718192021222324252627282930313233343536373839404142434445464748495051525354555657585960
For Peer Review
Abstract:
Motivation: A large number of CMV strains has been reported to circulate in the human population, and
the biological significance of these strains is currently an active area of research. The analysis of complex
genetic information may be limited using conventional phylogenetic techniques.
Results: We constructed artificial neural networks to determine their feasibility in predicting the
outcome of congenital CMV disease (defined as presence of CMV symptoms at birth) based on two data sets:
54 sequences of CMV gene UL144 obtained from 54 amniotic fluids of women who contracted acute CMV
infection during their pregnancy, and 80 sequences of 4 genes (US28, UL144, UL146 and UL147) obtained
from urine, saliva or blood of 20 congenitally infected infants that displayed different outcomes at birth. When
data from all four genes was used in the 20-infants’ set, the artificial neural network model accurately identified
outcome in 90% of cases. While US28 and UL147 had low yield in predicting outcome, UL144 and UL146
predicted outcome in 80% and 85% respectively when used separately. The model identified specific nucleotide
positions that were highly relevant to prediction of outcome. The artificial neural network classified genotypes
in agreement with classic phylogenetic analysis. We suggest that artificial neural networks can accurately and
efficiently analyze sequences obtained from larger cohorts to determine specific outcomes.
Availability: Matlab is commercially available from The MathWorks company (Natick, MA)
Abbreviations:
ANN – artificial neural network
CMV- cytomegalovirus
PCR- polymerase chain reaction
Page 3 of 21 Bioinformatics
123456789101112131415161718192021222324252627282930313233343536373839404142434445464748495051525354555657585960
For Peer Review
1. Introduction
CMV is a ubiquitous virus that infects the majority of humans by adulthood [1]. CMV infection is also
the most common congenital infection in the U.S., affecting around 1% of infants [2]. While most CMV-
infected infants have no symptoms at birth, approximately 10% are severely symptomatic and have major
central nervous system complications including hearing loss, seizures and mental retardation [3, 4]. Hearing
loss develops in the majority of symptomatic infants but also in some previously-asymptomatic ones. These
variable outcomes involve viral and host determinants. The role of specific CMV strains and/or infection with
multiple CMV strains in the outcome of congenital CMV infection is unclear [5], [6].
Most of the 165 genes present in the 236 kbp human CMV genome are highly conserved among strains.
However, at least 12 genetic loci are unusually variable (4-15 subsets in each) and sequencing at multiple
genetic loci reveals that a large but finite number of strains is in circulation [7]. The number of strains continues
to increase because of the lack of intra- and inter-genic linkage [8].
The most popular approach for analyzing sequence variation and genetic clustering is the phylogenetic
analysis. Several studies have reported associations between specific CMV strains and disease outcome, defined
as presence of CMV symptoms at birth [6, 9]. However, considering the hypervariability of several genes,
phylogenetic analysis may be limited in determining associations between polymorphisms and outcomes, as
well as in identifying genetic substitutions across multiple loci. The genetic information obtained from studies
of strain variation in different populations can be extensive because of the number of subjects and the number of
genetic loci that are sequenced. Therefore, more tools are in need to analyze complex and multiple genetic
factors. The ability to predict the outcome of congenital CMV infection based on virus heterogeneity may have
major clinical significance.
Artificial neural networks (ANNs) have been successfully applied in different fields to address complex
problems. ANNs learn by an iterative process that adjusts the weights of the connections between the artificial
Page 4 of 21Bioinformatics
123456789101112131415161718192021222324252627282930313233343536373839404142434445464748495051525354555657585960
For Peer Review
neurons, such that the system outputs an appropriate result. Data processing by these systems does not require
assumptions of how outputs relate to inputs. Similarly successful learning does not require independent inputs.
As such, ANN analysis is sometimes able to confirm causal input-to-output relationships that were discovered
using traditional means, as well as uncover additional insight and knowledge.
Because of the high sequence variability in several CMV genes (e.g. 70% divergence at amino acid level
for UL146)[10], and the many different genetic strains that were observed, we decided to construct an ANN
model, to determine whether we could enhance prediction accuracy of congenital CMV disease outcome based
on sequence data from four CMV-encoded genes: UL144, UL146 and UL147 and US28. In addition, we
determined the ability of the ANN model to identify specific nucleotide positions that were particularly related
to outcome.
Page 5 of 21 Bioinformatics
123456789101112131415161718192021222324252627282930313233343536373839404142434445464748495051525354555657585960
For Peer Review
2. Materials and Methods
2.1 Samples: we obtained samples from two cohorts: 54 amniotic fluids from Italian women and 23 cultured
samples (urine, saliva or blood) from the US-born neonates diagnosed with congenital CMV. Thirteen viral
isolates (8 urine samples, 4 saliva samples and one blood sample) were cultured from symptomatic neonates,
ten other isolates (all saliva samples) were cultured from asymptomatic, CMV-infected neonates.
2.2 DNA extraction and genotyping: Total genomic cell and viral DNA was extracted from infected cells and
original amniotic fluids using a capture-column kit (Gentra systems, Minneapolis, Minnesota). PCR
amplification of US28, UL144, UL146 and UL147 was described elsewhere [6, 10]. Out of 23 samples obtained
from US born neonates, DNA amplification for US28, UL144, UL146 and UL147 was successful in 20 samples
(7 asymptomatic, 13 symptomatic infants) and provided 80 sequences total. PCR products obtained from both
cohorts were sequenced directly with the BigDye Terminator Cycle Sequencing Kit (Perkin-Elmer Applied
Biosystems, Foster City, California) and the sequencing products were analyzed on an ABI 310 automated
sequencer. Sequence alignment and phylogenetic analyses were described elsewhere [6]. Multiple alignment of
coding DNA from aligned amino acid sequences was done using RevTrans[11].
2.3 Design of ANN models: An ANN model was constructed from three layers of mathematical “neurons”:
input layer, hidden layer, and output layer. The output of each neuron is a function of the values of the inputs to
it multiplied by calculated weights of each input. ANN models are trained by learning from known examples,
and adjusting the weights between the neurons so that the errors between the ANN outputs and the known data
are minimized. After training of the ANN, additional information is obtained by analyzing the individual
weights that connect the input layer into the hidden layer, and the hidden layer into the output layer [12], and
inputs with the greatest impact on outputs can be determined. Starting non-random weights were calculated
using published algorithm [13]. Five hidden neurons were used. Once the ANN was trained, we tested the
Page 6 of 21Bioinformatics
123456789101112131415161718192021222324252627282930313233343536373839404142434445464748495051525354555657585960
For Peer Review
sensitivity and accuracy of the model to identify specific outcomes based on sequences presented as validation
samples that were not used in the training process. The outcome of the patients was already known to us but the
ANN network performed “blinded” analysis after its training was completed. Furthermore, the training and
validation samples were randomly selected from the entire data set, and selection was not based on outcome.
2.4 Construction of inputs to the ANN: we combined the sequence data of UL144, UL146, UL147, and the N-
terminus region of US28 into one vector for each of the samples. Each vector had 1631 nucleotide positions:
531 positions for UL144, 377 for UL146 (after alignment), 483 for UL147 and 240 for US28. These 20 vectors
were then transformed into 20 binary vectors, by expanding each nucleotide position into four binary positions.
“A”, “C”, “G”, and “T” were coded as [1 0 0 0], [0 1 0 0}, [0 0 1 0] and [0 0 0 1] respectively. Positions with
nucleotide deletions were coded as [0 0 0 0]. This binary coding resulted in binary vectors with 1,631 x 4 =
6,524 positions. Binary positions that were identical among all 20 samples were removed, resulting in a set of
1451-long binary vectors comprised of 301 inputs for UL144, 827 for UL146, 268 for UL147 and 55 for US28.
The higher position count for UL146 is indicative of the hypervariability of this gene. For the 54-sample group
that only had UL144 data, a similar process was repeated, resulting in a 301-long binary vector for each sample.
2.5 ANN output: the ANN was constructed with a single output, designating outcome at birth (severe
congenital CMV disease or asymptomatic CMV infection with no sequelae at birth). Samples from
symptomatic infants were denoted as an output value of 0.9 whereas asymptomatic samples were denoted as an
output value of 0.1. Both hidden and output neurons used the sigmoid function.
yey −+=
1
1)(σ
where y is the sum of individual input values xj times the individual weights connecting the inputs to the
neuron:
∑=
=n
iiij xwy
1
Page 7 of 21 Bioinformatics
123456789101112131415161718192021222324252627282930313233343536373839404142434445464748495051525354555657585960
For Peer Review
Training was done on a notebook computer with a 1.66 GHz Intel Core Duo processor (IBM ThinkPad
2623D4U) using Matlab numerical analysis software (Mathworks, Natick, MA) with ANN training and analysis
code from Optimal Neural Informatics (Pikesville, MD).
2. 6 training methods: we first analyzed the 54 samples with UL144 data. 36 samples were randomly
selected for training, and the remaining 18 samples were selected for validation. The ANN was trained,
optimizing the individual weights connecting input to hidden and hidden to output so that the ANN outputs
were as close as possible to known outcomes. Thereafter, the ANN model was tested for its ability to predict the
outcome of the other 18 samples which were not used as part of the training. An ANN output of 0.5 or higher,
was defined “symptomatic”, and an ANN of less than or equal to 0.5 was defined as “asymptomatic”. The
quality of the network was determined using two measures: 1) the number of samples which were correctly
predicted and 2) the AUC (area under curve) of the ROC (receiver operating curve). In a perfectly-accurate
model, AUC would be 1. This process was repeated 100 times with a different random assignment of samples
into the validation and training groups in each time.
When considering the 20-sample data set, we realized that training the ANN with just 12 samples might
be difficult. Thus, we employed the commonly-used “leave one out” training strategy, as follows: we
performed 20 “leave one out” training sessions. In each session, a different sample was used as an independent
test, while the remaining 19 out of the 20 samples were used as training vectors. Once trained, the ANN was
tested by predicting the outcome of the independent test sample which was not used as part of the training.
To determine the most significant nucleotides in each gene that predict outcome, the “leave one out”
process was repeated using data from only one gene at a time, as well as various combinations of two genes. To
verify the validity of the “leave one out” method, we also performed it on the 54-sample Italian cohort, and
compared the results with those obtained when taking 36 samples for training and 18 for validation.
Page 8 of 21Bioinformatics
123456789101112131415161718192021222324252627282930313233343536373839404142434445464748495051525354555657585960
For Peer Review
In the 20-sample cohort we determined the specific nucleotide positions in each of the four tested genes
that were most relevant to the network in determining outcome. To find these locations, we randomly divided
the samples into two groups: 15 samples (5 asymptomatic, 10 symptomatic) for training and 5 samples (2
asymptomatic, 3 symptomatic) for testing. We then ranked the inputs based on their relevance to the ANN
prediction accuracy, calculated using the hidden neurons relative variance (HDRV) knowledge extraction and
dimensionality reduction technique [12]. This technique is based on the observation that in a trained ANN
model, a less relevant input contributes only a small proportion of the variance in the activities of hidden
neurons. After each iteration, we removed the least significant inputs that contributed a total of 10% of the
variance of the hidden neuron, according to their causal index (CI) as defined below, and left those inputs that
contributed 90% of the variance. We then re-trained the network using the same 15 training samples but with
the reduced input set and repeated this process of training and input removal 20 times.
We calculated the causal index (CI) of each input, a semi-quantitative estimate of the direction and
magnitude of the influence of each ANN input on the ANN output [14]. For any combination of input neuron i
and output neuron k, the causal index is defined as
∑=
=h
jijkjik wwCI
1
Where h is the number of hidden neurons, wkj are the connection weights from hidden neuron j to output
k, and wij are the connection weights between input i and hidden neuron j. The magnitude of the CI estimates
the relative contribution of each input to the output value. The sign of each coefficient (positive or negative)
estimates in which direction does the input affect the output value. Large positive CI means that a particular
input strongly influences the outcome towards being symptomatic (0.9 output value), whereas large negative CI
means that a particular input strongly influences the outcome of the network towards an asymptomatic outcome
(0.1 output value).
Page 9 of 21 Bioinformatics
123456789101112131415161718192021222324252627282930313233343536373839404142434445464748495051525354555657585960

For Peer Review
Last, we analyzed the output of the hidden neurons in network trained with all 20 samples. It has been
published [15] that in a well-trained ANN, these outputs tend to be close to 0 or 1. For each input sample, we
rounded the value of the each hidden neuron to 0 or 1 (using a 0.5 threshold) and used these “binary” patterns of
the hidden layer for each set of inputs can be used for clustering of input vectors into similar groups.
Page 10 of 21Bioinformatics
123456789101112131415161718192021222324252627282930313233343536373839404142434445464748495051525354555657585960
For Peer Review
3. Results
3.1 Italian Cohort (54 samples with UL144 data)
We randomly selected 36 samples to train an ANN and 18 samples to validate it. We then recorded the
total number of correct classifications in the validation group as well as the total number of correct
classification in the training group. We then repeated this process 100 times, each time performing a different
random selection to the training and validation groups. On average, 13.4 samples (74.4%) were correctly
classified from the validation group, with a standard deviation of 1.75 samples (9.7%). Out of the entire 54-
sample cohort, 48.9 samples (90.5%) were classified correctly on average, with a standard deviation of 2.3
samples (4.3%). Mean AUC for validation group was 0.88, with a standard deviation of was 0.07.
The “leave one out” analysis correctly predicted 83% of the samples (11 of 16 symptomatic, 34 of 38
asymptomatic) with an AUC of 0.88.
3.2 US Cohort (20 samples analyzed with UL144, UL146, UL147 and US28)
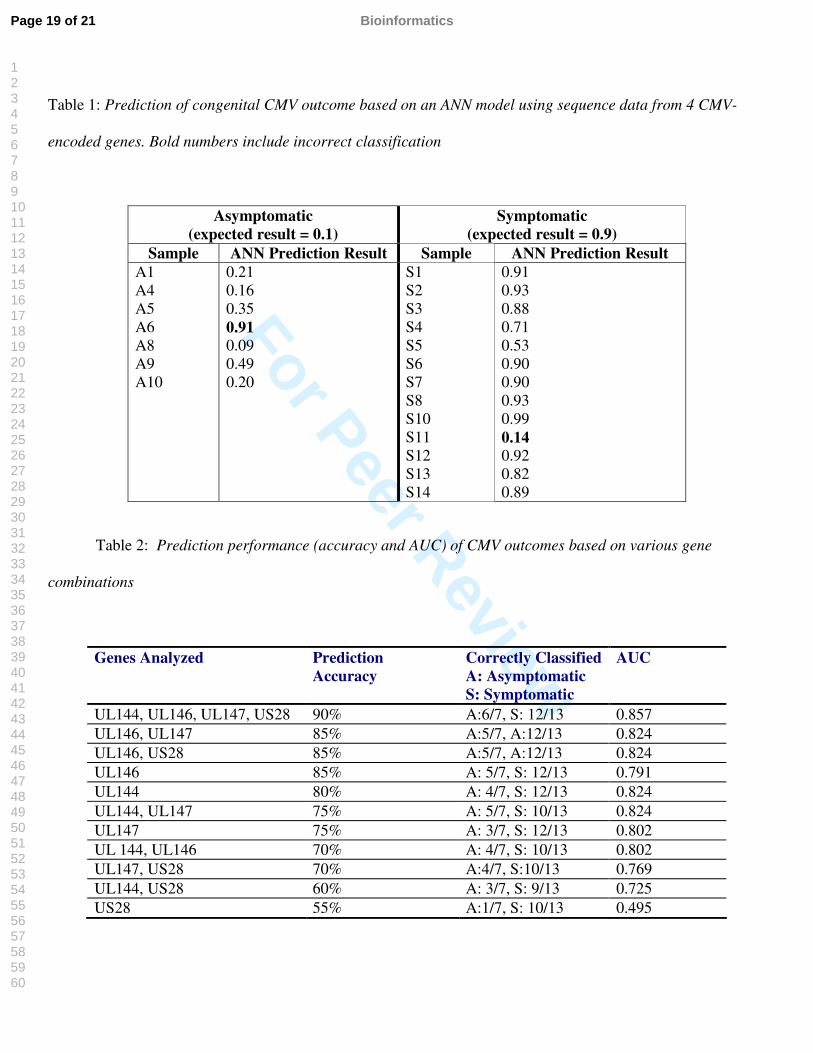
Using all 4 genes, ANNs predicted outcome in 90% of the samples (6 out of 7 asymptomatic, 12 out of
13 symptomatic). Table 1 summarizes the results of ANN prediction of outcome. Only two samples (A6 and
S11) were incorrectly identified. ROC analysis revealed an AUC of 0.857.
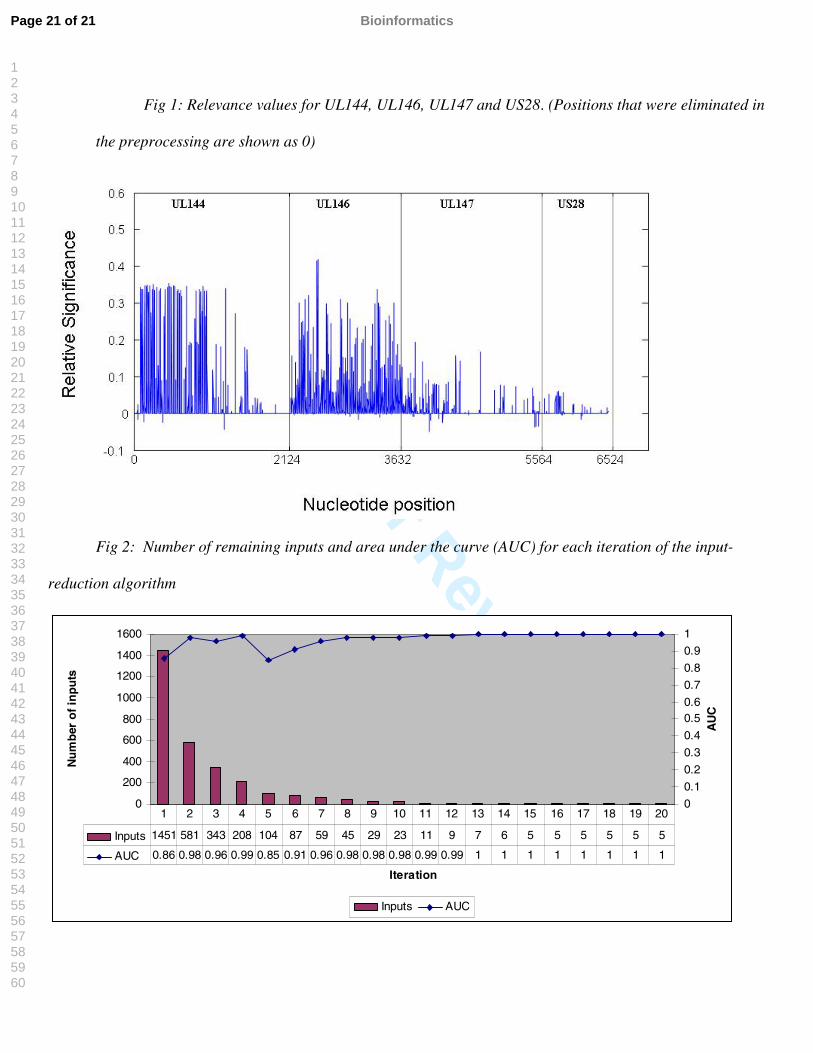
We determined the relative relevance (HDRV) index for each of the nucleotide position (Fig. 1). Most of
the relevant values are concentrated in the UL144 and UL146 regions. Summarizing the absolute value of the
relevance for each gene shows that UL146 contained 48.2% of the total relevance, UL144 contains 43.4%,
UL147 contains 7.1% and US28 contains 1.4%. Thus, UL147 and US28 appear insignificant in determining
outcome.
Page 11 of 21 Bioinformatics
123456789101112131415161718192021222324252627282930313233343536373839404142434445464748495051525354555657585960
For Peer Review
To further test the hypothesis that UL144 and UL146 were most relevant to prediction of outcome, we
performed ANN analysis when using only one gene or a combination of several genes at a time (Table 2). The
“leave one out” ANN prediction for various gene combinations revealed that the highest prediction accuracy
(85%) was achieved when using UL146 data alone or UL146 data in combination with UL147 or US28 data.
Comparing UL144-based networks with UL146-based networks revealed that prediction accuracy with UL144
is slightly lower (80% vs. 85%), but AUC is slightly higher (0.824 vs. 0.791). Thus, prediction based on UL144
is very similar to prediction based on UL146, and the differences may be reduced with a larger data set. As
expected, UL147 or US28 alone produced inaccurate networks as evidenced by both low prediction accuracy
and low AUC (for US28).
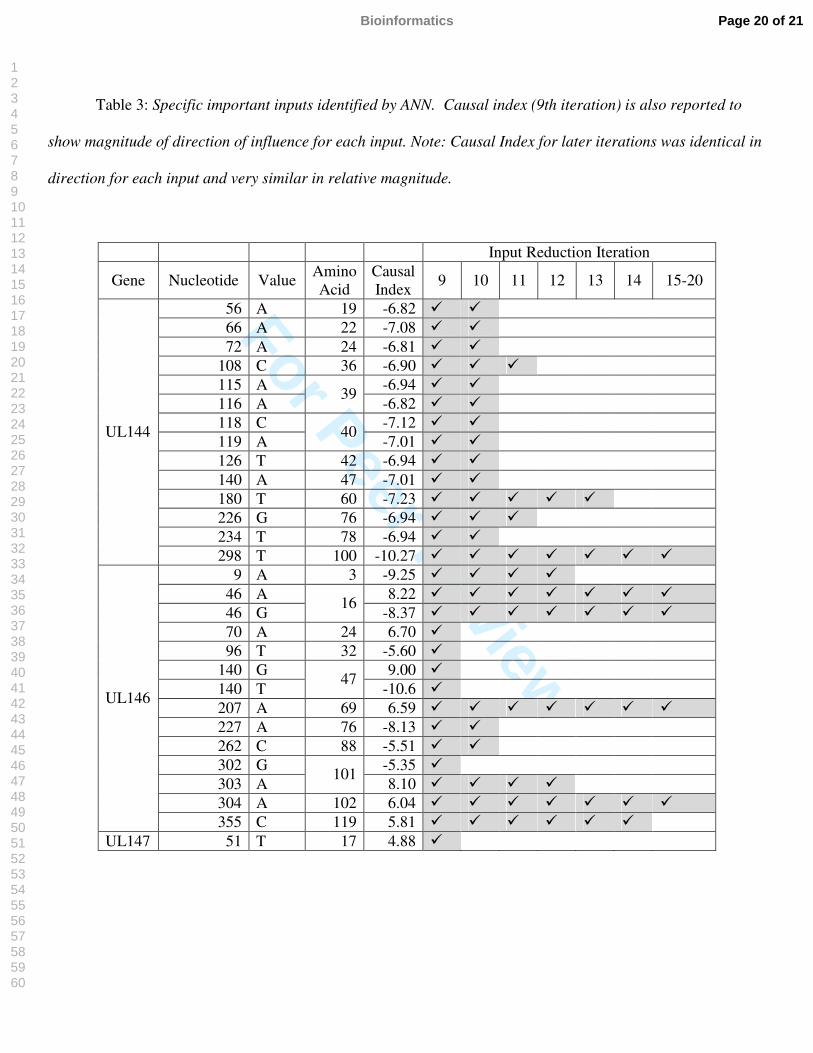
20 iterations of the input count reduction procedure were executed (figure 2) with a resultant AUC.
The positions chosen from the 9th iteration onwards are shown in Table 3. Prediction accuracy for the 9th
and 11th iteration was 90%, including 100% of the samples that did not participate in the input reduction
process. Prediction accuracy for the 10th and 12th iteration was 95%, including 100% of the samples that did not
participate in the input reduction process. Inputs identified in the 13th iteration onwards were able to accurately
predict 100% of the samples.
We performed clustering of input samples by training an ANN with UL144 inputs. The network
identified the following three clusters: Cluster 1: samples A1, A4, A5, A6, A8 and A10 (all asymptomatic),
cluster 2: samples S1, S2, S5, S6, S8, S10, S11, S12, S13 and S14 (all symptomatic), cluster 3: samples S3, S4
and S7 (all symptomatic). These clusters are comparable to the phylogenetic clustering previously published on
these samples[6]. Repeating the process using only the UL146 inputs, we identified three clusters: cluster 1:
samples A1, A4, A5, A8 and A10 (all asymptomatic), cluster 2: samples A6, S1, S2, S3, S4, S5, S6, S7, S8,
S10, S12, S13 and S14 (all symptomatic), cluster 3: Samples A9 and S11
Page 12 of 21Bioinformatics
123456789101112131415161718192021222324252627282930313233343536373839404142434445464748495051525354555657585960
For Peer Review
4 Discussion
We report that ANN is a sensitive and effective method for the analysis of complex CMV
polymorphisms, prediction of outcome of CMV infection and knowledge extraction. There is an ongoing debate
whether strain variation plays a role in CMV disease outcome in general and congenital CMV in particular.
Sequencing of several gene loci reveals high degree of sequence variation, but the biological significance of this
finding is unclear. The comparison between and the definition of genotype at each locus is largely based on
divergence levels and clustering, which are distinct for each gene, and give unambiguous results. We have
reported that polymorphism in the CMV-encoded UL144, a truncated TNF receptor gene, was predictive of the
outcome of congenital CMV infection among 23 US and 56 Italian newborns [6, 16]. Polymorphisms in UL146
and UL147, both α-chemokine genes, were not found to be associated with disease severity among 23 US
newborns [10]. High degree of sequence variation was noted in UL146, and therefore segregation of genotypes
among asymptomatic or symptomatic newborns was technically impossible, and especially so given the sample
size. Analysis of an association between gene polymorphisms and disease outcome is performed for one gene at
a time. Thus, if the outcome depends on several genes, than identifying correlation between genetic clusters and
outcomes becomes even more difficult.
The ability to predict symptomatic CMV disease from DNA sequence data is important, because it may
allow early diagnosis and therapeutic considerations. Therefore a system that is able to analyze concurrently
complex and high number of strains may advance our ability to predict outcome and detect more virulent
strains. In fact, the artificial neural network approach has been applied to predicting CMV disease after renal
transplantation, and revealed that the predictions were a considerable improvement on current prediction
methods available at that time, although viral loads have not been used as parameters in this model [17].
Page 13 of 21 Bioinformatics
123456789101112131415161718192021222324252627282930313233343536373839404142434445464748495051525354555657585960

For Peer Review
An ANN analyzes data when the relationships between cause and affect are complex and unclear. ANN
modeling has been successfully used in many different fields, including medicine and biology [18].
Specifically, ANN has been used in bio-modeling [19], and in molecular sequence analysis [20]. Researchers
have used ANN modeling for analysis of gene expression arrays of cancer cells [15], [21], [22], [23] identifying
several genes that can correctly classify cancer types. In addition, ANN modeling has been used to enhance
prediction of Lopinavir resistance from HIV genotype [24].
The ANN method does not pre-suppose any knowledge about the relationship between inputs and
outputs. In principal, we can use any combinations of genes as a possible predictor of disease outcome, and use
insights derived from ANN analysis as triggers for more detailed studies using standard molecular laboratory
techniques.
Even without prior knowledge, the ANN model generated results that are in agreement with our
previously-published findings obtained using phylogenetic analysis and clustalW methods. The ANN modeling
accurately predicted outcome of congenital CMV disease based on UL144 sequences. However, using the
conventional phylogeny, we were unable to find a significant association between UL146 polymorphisms and
outcome of congenital CMV, largely due to extreme hypervariability and a small sample size. When applying
ANN modeling for prediction of congenital CMV outcome based on UL146 sequences , UL146 genotypes were
predictive of outcome, while in UL147 and US28 no positions were found that correlated with disease outcome.
In addition, a combination of four genetic loci was 90% sensitive in predicting outcome of congenital CMV.
Our analysis on the larger Italian cohort showed that the “leave-one-out” methods correlates with results
obtained using the traditional ANN approach (2/3 of samples for training, 1/3 of samples for validation). This
correlation further supports the use of the “leave-one-out” approach for the smaller US cohort. We attribute the
somewhat better results obtained with the “leave-one-out” method to the larger sample size available for
Page 14 of 21Bioinformatics
123456789101112131415161718192021222324252627282930313233343536373839404142434445464748495051525354555657585960
For Peer Review
training: 53 samples in the leave-one-out method vs. 36 samples in the traditional approach. Both approaches
generated very similar AUC values.
Using an ANN modeling also allowed us to determine the inputs (nucleotide positions) that have the
most significant effect on the output (disease outcome). The model extracted the minimum number of
nucleotide changes that resulted in the best prediction. While the ANN did not need more than 5 inputs to make
a perfect prediction for the sample, we decided to provide additional inputs that were still present in late-stage
iterations as they may lead to more focused questions related to biological mechanisms.
Clustering using ANN modeling was also analyzed. The fact that automatic ANN clustering based on
UL144 matched our previous findings using more conventional techniques helped validate the automatic
method. Since clustering for UL146 data was very difficult with conventional techniques (because of high
degree of variability), we found it interesting that clustering could be performed with the ANN. Similarly, if
samples need to be clustered based on more than one gene, an ANN is capable of producing relevant results
whereas conventional distance-based methods face greater difficulties.
In summary, we have shown the potential use of analyzing large sequence information using ANNs
modeling in addition to conventional phylogentic techniques. The ANN seems to have several advantages over
regular phylogenetic analysis including concurrent analysis of multiple genetic loci, clustering into subtypes and
identifying the most significant positions that affect the output. We recognize that the analysis was performed
on a small sample size and a limited number of hypervariable genes, yet results are intriguing. At this time, we
do not have sequence information on other hypervariable CMV genes such as gN and gB. Future studies should
include a larger cohort of samples and sequence data of other hypervariable CMV genes. This will allow us to
determine the role of different CMV strains in outcome of congenital CMV. We may also be able to create a
prediction model that links different inputs (such as nucleotide sequences, multiple CMV strains, race, age, and
Page 15 of 21 Bioinformatics
123456789101112131415161718192021222324252627282930313233343536373839404142434445464748495051525354555657585960

For Peer Review
family history) to outputs (such as symptomatic or asymptomatic disease, hearing loss etc). The successful
development of such a model will allow identification of groups at higher risk for disease sequelae.
Page 16 of 21Bioinformatics
123456789101112131415161718192021222324252627282930313233343536373839404142434445464748495051525354555657585960
For Peer Review
Reference List:
1. Staras SA, Dollard SC, Radford KW, Flanders WD, Pass RF, Cannon MJ: Seroprevalence of cytomegalovirus infection in the United States, 1988-1994. Clin Infect Dis 2006, 43:1143-1151.
2. Demmler GJ: Infectious Diseases Society of America and Centers for Disease Control. Summary of a workshop on surveillance for congenital cytomegalovirus disease. Rev Infect Dis 1991, 13:315-329.
3. Weller TH: The cytomegaloviruses: ubiquitous agents with protean clinical manifestations. I. N Engl J Med 1971, 285:203-214.
4. Weller TH: The cytomegaloviruses: ubiquitous agents with protean clinical manifestations. II. N Engl J Med 1971, 285:267-274.
5. Pignatelli S, Dal Monte P, Rossini G, Landini MP: Genetic polymorphisms among human cytomegalovirus (HCMV) wild-type strains. Rev Med Virol 2004, 14:383-410.
6. Arav-Boger R, Willoughby RE, Pass RF, Zong JC, Jang WJ, Alcendor D, Hayward GS: Polymorphisms of the cytomegalovirus (CMV)-encoded tumor necrosis factor-alpha and beta-chemokine receptors in congenital CMV disease. J Infect Dis 2002, 186:1057-1064.
7. Davison AJ, Dolan A, Akter P, Addison C, Dargan DJ, Alcendor DJ, McGeoch DJ, Hayward GS: The human cytomegalovirus genome revisited: comparison with the chimpanzee cytomegalovirus genome. J Gen Virol 2003, 84:17-28.
8. Rasmussen L, Geissler A, Winters M: Inter- and intragenic variations complicate the molecular epidemiology of human cytomegalovirus. J Infect Dis 2003, 187:809-819.
9. Pignatelli S, Dal Monte P, Rossini G, Lazzarotto T, Gatto MR, Landini MP: Intrauterine cytomegalovirus infection and glycoprotein N (gN) genotypes. J Clin Virol 2003, 28:38-43.
10. Arav-Boger R, Foster CB, Zong JC, Pass RF: Human Cytomegalovirus-Encoded alpha -Chemokines Exhibit High Sequence Variability in Congenitally Infected Newborns. J Infect Dis 2006, 193:788-791.
11. Wernersson R, Pedersen AG: RevTrans: Multiple alignment of coding DNA from aligned amino acid sequences. Nucleic Acids Res 2003, 31:3537-3539.
12. Boger Z, Guterman H: Knowledge extraction from artificial neural network models. Orlando, FL; 1997:3030-3035.
13. Guterman H: Application of principal component analysis to the design of neural networks. Neural, Parallel & Scientific Computations 1994, 2:43-54.
14. Baba KEIYMHLI: Explicit representation of knowledge acquired from plant historicaldata using neural network. San Diego, CA; 1990:155-160.
15. Khan J, Wei JS, Ringner M, Saal LH, Ladanyi M, Westermann F, Berthold F, Schwab M, Antonescu CR, Peterson C, Meltzer PS: Classification and diagnostic prediction of cancers using gene expression profiling and artificial neural networks. Nat Med 2001, 7:673-679.
16. Arav-Boger R, Battaglia CA, Lazzarotto T, Gabrielli L, Zong JC, Hayward GS, Diener-West M, Landini MP: Cytomegalovirus (CMV)-encoded UL144 (truncated tumor necrosis factor receptor) and outcome of congenital CMV infection. J Infect Dis 2006, 194:464-473.
Page 17 of 21 Bioinformatics
123456789101112131415161718192021222324252627282930313233343536373839404142434445464748495051525354555657585960
For Peer Review
17. Sheppard D, McPhee D, Darke C, Shrethra B, Moore R, Jurewitz A, Gray A: Predicting cytomegalovirus disease after renal transplantation: an artificial neural network approach. Int J Med Inform 1999, 54:55-76.
18. Lisboa PJ: A review of evidence of health benefit from artificial neural networks in medical intervention. Neural Netw2002, 15:11-39.
19. Dayhoff JE, DeLeo JM: Artificial neural networks: opening the black box. Cancer 2001, 91:1615-1635.
20. Wu CH: Artificial neural networks for molecular sequence analysis. Comput Chem 1997, 21:237-256.
21. Xu Y, Selaru FM, Yin J, Zou TT, Shustova V, Mori Y, Sato F, Liu TC, Olaru A, Wang S, Kimos MC, Perry K, Desai K, Greenwald BD, Krasna MJ, Shibata D, Abraham JM, Meltzer SJ: Artificial neural networks and gene filtering distinguish between global gene expression profiles of Barrett's esophagus and esophageal cancer. Cancer Res2002, 62:3493-3497.
22. Ellis M, Davis N, Coop A, Liu M, Schumaker L, Lee RY, Srikanchana R, Russell CG, Singh B, Miller WR, Stearns V, Pennanen M, Tsangaris T, Gallagher A, Liu A, Zwart A, Hayes DF, Lippman ME, Wang Y, Clarke R: Development and validation of a method for using breast core needle biopsies for gene expression microarray analyses. Clin Cancer Res 2002, 8:1155-1166.
23. Selaru FM, Xu Y, Yin J, Zou T, Liu TC, Mori Y, Abraham JM, Sato F, Wang S, Twigg C, Olaru A, Shustova V, Leytin A, Hytiroglou P, Shibata D, Harpaz N, Meltzer SJ: Artificial neural networks distinguish among subtypes of neoplastic colorectal lesions. Gastroenterology 2002, 122:606-613.
24. Wang D, Larder B: Enhanced prediction of lopinavir resistance from genotype by use of artificial neural networks. J Infect Dis 2003, 188:653-660.
Page 18 of 21Bioinformatics
123456789101112131415161718192021222324252627282930313233343536373839404142434445464748495051525354555657585960
For Peer Review
Table 1: Prediction of congenital CMV outcome based on an ANN model using sequence data from 4 CMV-
encoded genes. Bold numbers include incorrect classification
Table 2: Prediction performance (accuracy and AUC) of CMV outcomes based on various gene
combinations
Genes Analyzed Prediction Accuracy
Correctly ClassifiedA: AsymptomaticS: Symptomatic
AUC
UL144, UL146, UL147, US28 90% A:6/7, S: 12/13 0.857UL146, UL147 85% A:5/7, A:12/13 0.824UL146, US28 85% A:5/7, A:12/13 0.824UL146 85% A: 5/7, S: 12/13 0.791UL144 80% A: 4/7, S: 12/13 0.824UL144, UL147 75% A: 5/7, S: 10/13 0.824UL147 75% A: 3/7, S: 12/13 0.802UL 144, UL146 70% A: 4/7, S: 10/13 0.802UL147, US28 70% A:4/7, S:10/13 0.769UL144, US28 60% A: 3/7, S: 9/13 0.725US28 55% A:1/7, S: 10/13 0.495
Asymptomatic(expected result = 0.1)
Symptomatic(expected result = 0.9)
Sample ANN Prediction Result Sample ANN Prediction ResultA1A4 A5A6A8A9A10
0.210.160.350.910.090.490.20
S1S2S3S4S5S6S7S8S10S11S12S13S14
0.910.930.880.710.530.900.900.930.990.140.920.820.89
Page 19 of 21 Bioinformatics
123456789101112131415161718192021222324252627282930313233343536373839404142434445464748495051525354555657585960
For Peer Review
Table 3: Specific important inputs identified by ANN. Causal index (9th iteration) is also reported to
show magnitude of direction of influence for each input. Note: Causal Index for later iterations was identical in
direction for each input and very similar in relative magnitude.
Input Reduction Iteration
Gene Nucleotide ValueAmino Acid
Causal Index
9 10 11 12 13 14 15-20
56 A 19 -6.82 � �66 A 22 -7.08 � �72 A 24 -6.81 � �
108 C 36 -6.90 � � �115 A -6.94 � �116 A
39-6.82 � �
118 C -7.12 � �119 A
40-7.01 � �
126 T 42 -6.94 � �140 A 47 -7.01 � �180 T 60 -7.23 � � � � �226 G 76 -6.94 � � �234 T 78 -6.94 � �
UL144
298 T 100 -10.27 � � � � � � �9 A 3 -9.25 � � � �
46 A 8.22 � � � � � � �46 G
16-8.37 � � � � � � �
70 A 24 6.70 �96 T 32 -5.60 �
140 G 9.00 �140 T
47-10.6 �
207 A 69 6.59 � � � � � � �227 A 76 -8.13 � �262 C 88 -5.51 � �302 G -5.35 �303 A
1018.10 � � � �
304 A 102 6.04 � � � � � � �
UL146
355 C 119 5.81 � � � � � �UL147 51 T 17 4.88 �
Page 20 of 21Bioinformatics
123456789101112131415161718192021222324252627282930313233343536373839404142434445464748495051525354555657585960
For Peer Review
Fig 1: Relevance values for UL144, UL146, UL147 and US28. (Positions that were eliminated in
the preprocessing are shown as 0)
Fig 2: Number of remaining inputs and area under the curve (AUC) for each iteration of the input-
reduction algorithm
0
200
400
600
800
1000
1200
1400
1600
Iteration
Nu
mb
er o
f in
pu
ts
0
0.1
0.2
0.3
0.4
0.50.6
0.7
0.8
0.9
1
AU
C
Inputs AUC
Inputs 1451 581 343 208 104 87 59 45 29 23 11 9 7 6 5 5 5 5 5 5
AUC 0.86 0.98 0.96 0.99 0.85 0.91 0.96 0.98 0.98 0.98 0.99 0.99 1 1 1 1 1 1 1 1
1 2 3 4 5 6 7 8 9 10 11 12 13 14 15 16 17 18 19 20
Page 21 of 21 Bioinformatics
123456789101112131415161718192021222324252627282930313233343536373839404142434445464748495051525354555657585960
Copyright © 2022 FDOKUMEN