Satellite Precipitation Measurements for Water Resource Monitoring

Use of APHRODITE Rain Gauge–Based Precipitation and TRMM 3B43Products for Improving Asian Monsoon Seasonal Precipitation Forecasts
by the Superensemble Method
AKIYO YATAGAI*
Research Institute for Sustainable Humanosphere, Kyoto University, Kyoto, Japan
T. N. KRISHNAMURTI, VINAY KUMAR, A. K. MISHRA, AND ANU SIMON
The Florida State University, Tallahassee, Florida
(Manuscript received 13 June 2013, in final form 25 September 2013)
ABSTRACT
A multimodel superensemble developed by the Florida State University combines multiple model
forecasts based on their past performance (training phase) to make a consensus forecast. Because observed
precipitation reflects local characteristics such as orography, quantitative high-resolution precipitation
products are useful for downscaling coarse model outputs. The Asian Precipitation–Highly-Resolved
Observational Data Integration Toward Evaluation of Water Resources (APHRODITE) and Tropical
Rainfall Measuring Mission (TRMM) 3B43 products are used for downscaling and as training data in the
superensemble training phase. Seven years (1998–2004) of monthly precipitation (June–August) over the
Asian monsoon region (08–508N, 608–1508E) and results of four coupled climate models were used. TRMM
3B43 was adjusted by APHRODITE (m-TRMM). For seasonal climate forecasts, a synthetic super-
ensemble technique was used. A cross-validation technique was adopted, in which the year to be forecast
was excluded from the calculations for obtaining the regression coefficients. The principal results are as
follows: 1) Seasonal forecasts of Asian monsoon precipitation were considerably improved by use of
APHRODITE rain gauge–based data or them-TRMMproduct. These forecasts are much superior to those
from the best model of the suite and ensemble mean. 2) Use of a statistical downscaling and synthetic
superensemble method for multimodel forecasts of seasonal climate significantly improved precipitation
prediction at higher resolution. This is confirmed by cross-evaluation of superensemble with using other
observation data than the data used in the training phase. 3) Availability of a dense rain gauge network–
based analysis was essential for the success of this work.
1. Introduction
Seasonal monsoon forecasts for Asian countries are
undoubtedly important to society. This is a scientifically
challenging endeavor, however, especially for precipitation.
Operationally, observed precipitation is sometimes used
for postprocessing of numerical forecasts. This is because
precipitation is a localized phenomenon for which it is
difficult to reproduce realistic patterns, even qualitatively.
Quantitative estimates are difficult to attain in both short-
term and long-term forecasts.
There have been many studies using multimodel en-
sembles to reducemodel biases. The superensemble,which
uses observation data to minimize bias of multiple model
simulation results, has shown significant improvement of
precipitation forecast scores (Krishnamurti et al. 1999). An
accurate observed precipitation dataset is key for achieving
the best forecast. Rain gauge–based, daily gridded pre-
cipitation data across India produced better short-term and
seasonal forecasts in that country (Krishnamurti et al.
2009a,b; Chakraborty and Krishnamurti 2009).
The Asian Precipitation–Highly-Resolved Observa-
tional Data Integration Toward Evaluation of Water
Resources (APHRODITE) project created daily grid
*Current affiliation: Solar-Terrestrial Environment Laboratory,
Nagoya University, Nagoya, Japan.
Corresponding author address: Akiyo Yatagai, Solar-Terrestrial
Environment Laboratory, Nagoya University, Furo-cho, Chikusa-
ku, Nagoya 464-8601, Japan.
E-mail: [email protected]
MONTH 2014 YATAGA I ET AL . 1
DOI: 10.1175/JCLI-D-13-00332.1
� 2014 American Meteorological Society

precipitation data over the entire Asian domain (Yatagai
et al. 2009, 2012). The initial purpose of APHRODITE
was to formulate reliable, rain gauge–based, high-resolution
products. These were for validating high-resolution cli-
mate model simulations (Yatagai et al. 2005) and for
statistical downscaling of relatively course climate sim-
ulation outputs, to make localized precipitation fore-
casts according to future climate change resulting from
the anthropogenic greenhouse effect. APHRODITE
products are used for such purposes because they con-
tain substantial rain gauge data and use an interpolation
method that considers orographic effects (see next sec-
tion). Hence, they represent a useful database for trans-
forming biased model precipitation patterns into more
realistic ones, especially in mountainous areas. Thus,
APHRODITE can furnish training data in the super-
ensemble method, as well as data to use in downscaling
(Kumar and Krishnamurti 2012).
Satellite products are also used for superensembles.
Satellite estimates usually have higher spatiotemporal
sampling rates and fewer missing values than rain gauges,
and are hence convenient for use as a downscaling tool.
However, for surface precipitation, model and satellite
estimates should be validated against rain gauge data
(Chen et al. 2008). Above all, an advantage of satellite
products over rain gauges is near-real-time delivery.
Very few countries have dense gauge networks and can
collect their data in a timely fashion and apply quality
control and gridding in near–real time. It is also difficult
to do so beyond national boundaries, although this may
sometimes be necessary (e.g., to determine precipitation
in the headwaters of an international river).
Hence, it is useful to adjust satellite products with
APHRODITE data during periods of mutual data avail-
ability. The superensemble technique requires 1) at least
four or five model results, 2) observation data for training,
and 3) observation data for validation. The second and
third items must be independent (usually different years).
Because current APHRODITE products have temporal
coverage through 2007 and becausemodels should cover
the same period as in items 2 and 3 except when applying
climate superensemble (Yun et al. 2003), we did per-
formance tests of the adjustment using currently avail-
able datasets. We compare the results of superensemble
forecasting for summer monsoon precipitation using
APHRODITE and Tropical Rainfall Measuring Mis-
sion (TRMM) 3B43 products.
2. Data
a. APHRODITE precipitation data
As reference rain gauge–based precipitation, we
used a daily gridded precipitation dataset created by
the APHRODITE project (Yatagai et al. 2012), with
0.258 resolution over the Asian monsoon region
(APHRO_MA_V0902; APHRO hereafter). The data
period is 1998–2004 (7 yr), and the coverage is over
08–558N, 608–1558E. Maximum input data were from
1998, with a gradual decrease through 2004 (Yatagai et al.
2009). We used APHRO after formulating monthly total
precipitation.
b. TRMM 3B43 precipitation data
We used TRMM 3B43, a 0.258 monthly precipitation
product. It is a combined product of microwave satellite
imagery, including that from the TRMM Microwave
Imager (TMI), geostationary satellite infrared sensors,
and rain gauges. For the latter data type in Asia, only
data from the Global Telecommunication System (GTS)
were used. Figure 1 shows the distribution of gauge sta-
tions used by APHRO and GTS. The APHRODITE
project collected data from 2.3 to 5.5 times the number of
rain gauges of GTS (this quantity varied with the year).
There were substantially more input data around the
Himalayas and Southeast Asia, which give precipitation
estimates exceeding 1000mmyr21 (Yatagai et al. 2012).
Considering the potential application of this study
to operational seasonal forecasting, an observation
dataset and multiple model results are required. Hence,
optimizing the use of satellite-based data is also expec-
ted. Therefore, we prepared three training datasets:
1) APHRO; 2) TRMM 3B43 (TRMM hereafter); and
3) modified TRMM 3B43 with APHRO (m-TRMM
hereafter). The time (7 yr) and space coverage is the
same as described above. We used all monthly data, but
show only results for summer (June–August).
c. Model data
The multiple superensemble requires at least four
model datasets. Thus, we used four coupled general
circulation model (CGCM) outputs those are the part
of Climate Prediction and Its Application to Society
(CliPAS) project (Wang et al. 2009). These are from the
Geophysical Fluid Dynamics Laboratory (GFDL) of
the National Oceanic and Atmosphere Administration
(NOAA;Delworth et al. 2006), the National Centers for
Environmental Prediction (NCEP) and NOAA (Saha
et al. 2005), Seoul National University (SNU) in Korea
(Kug et al. 2005), and the University of Hawaii (Fu and
Wang 2001). Each model consists of different sets of
atmospheric or oceanic GCMs. Forecast precipitation
data from the four GCMs were converted to monthly
precipitation for the seven years.
CGCM results do not reflect the dynamic field in a
year. Hence, the climate superensemble technique (Yun
et al. 2003, 2005) uses empirical orthogonal function
2 JOURNAL OF CL IMATE VOLUME 00

(EOF) analysis to compare the 7-yr summer model data
with observation data prior to the construction of a
multimodel superensemble.
3. Method of analysis
a. Preparation of m-TRMM
Monthly m-TRMM data were created by the follow-
ing equation:
RAPHRO5 aRTRMM 1 b , (1)
where RAPHRO and RTRMM are APHRO monthly pre-
cipitation and TRMM, respectively. The regression co-
efficients a and b are the slope and intercept of the least
squares fit. Figure 2 shows a and b patterns for July.
Large values appear around the Himalayas and Tianshan
Mountains and Southeast Asia, where GTS rain gauges
are sparse (Fig. 1). Here, a (slope) is the ratio of APHRO
to TRMM.
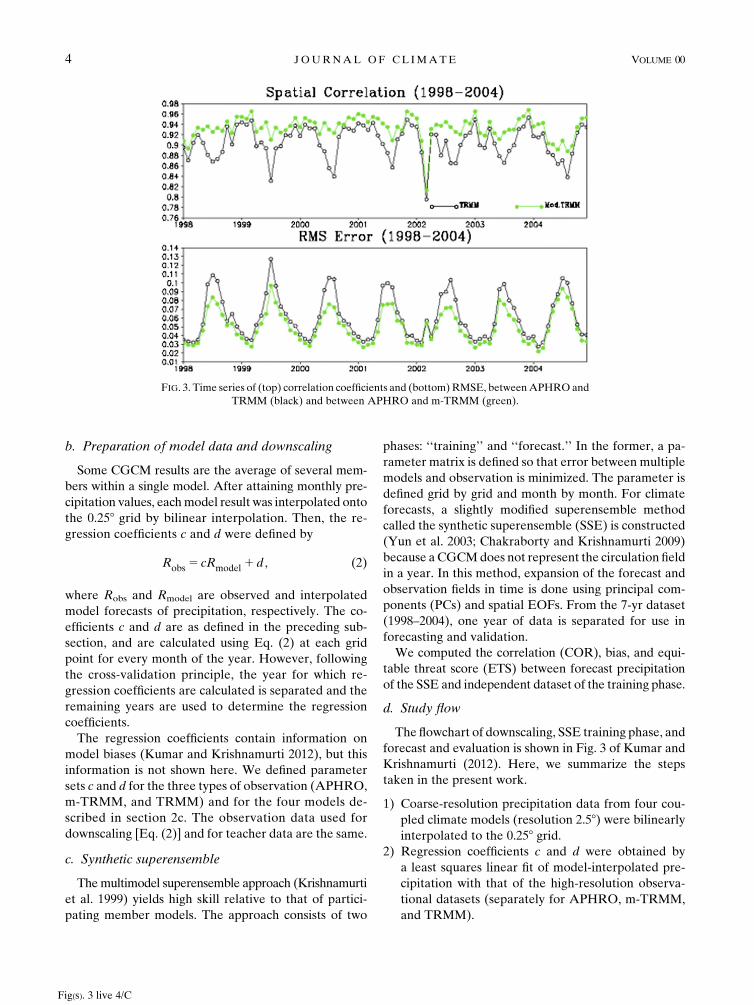
Figure 3 shows time series of the coefficient of
spatial correlation between TRMM (m-TRMM) and
APHRODITE and root-mean-square error (RMSE)
between TRMM (m-TRMM) and APHRODITE, which
was calculated monthly over the entire domain de-
scribed above (Fig. 2). There was large error in summer
relative to other seasons because summer is the rainy
season across most of the domain. Correlation coeffi-
cients improved with m-TRMM compared with TRMM
itself, because of the related adjustment.
FIG. 1. Distribution of APHRODITE rain gauges across Asian monsoon region.
FIG. 2. Pattern of a (slope) and b (intercept), defined in Eq. (1).
Fig(s). 1,2 live 4/C
MONTH 2014 YATAGA I ET AL . 3
b. Preparation of model data and downscaling
Some CGCM results are the average of several mem-
bers within a single model. After attaining monthly pre-
cipitation values, eachmodel result was interpolated onto
the 0.258 grid by bilinear interpolation. Then, the re-
gression coefficients c and d were defined by
Robs 5 cRmodel 1 d , (2)
where Robs and Rmodel are observed and interpolated
model forecasts of precipitation, respectively. The co-
efficients c and d are as defined in the preceding sub-
section, and are calculated using Eq. (2) at each grid
point for every month of the year. However, following
the cross-validation principle, the year for which re-
gression coefficients are calculated is separated and the
remaining years are used to determine the regression
coefficients.
The regression coefficients contain information on
model biases (Kumar and Krishnamurti 2012), but this
information is not shown here. We defined parameter
sets c and d for the three types of observation (APHRO,
m-TRMM, and TRMM) and for the four models de-
scribed in section 2c. The observation data used for
downscaling [Eq. (2)] and for teacher data are the same.
c. Synthetic superensemble
Themultimodel superensemble approach (Krishnamurti
et al. 1999) yields high skill relative to that of partici-
pating member models. The approach consists of two
phases: ‘‘training’’ and ‘‘forecast.’’ In the former, a pa-
rameter matrix is defined so that error between multiple
models and observation is minimized. The parameter is
defined grid by grid and month by month. For climate
forecasts, a slightly modified superensemble method
called the synthetic superensemble (SSE) is constructed
(Yun et al. 2003; Chakraborty and Krishnamurti 2009)
because aCGCMdoes not represent the circulation field
in a year. In this method, expansion of the forecast and
observation fields in time is done using principal com-
ponents (PCs) and spatial EOFs. From the 7-yr dataset
(1998–2004), one year of data is separated for use in
forecasting and validation.
We computed the correlation (COR), bias, and equi-
table threat score (ETS) between forecast precipitation
of the SSE and independent dataset of the training phase.
d. Study flow
The flowchart of downscaling, SSE training phase, and
forecast and evaluation is shown in Fig. 3 of Kumar and
Krishnamurti (2012). Here, we summarize the steps
taken in the present work.
1) Coarse-resolution precipitation data from four cou-
pled climate models (resolution 2.58) were bilinearly
interpolated to the 0.258 grid.2) Regression coefficients c and d were obtained by
a least squares linear fit of model-interpolated pre-
cipitation with that of the high-resolution observa-
tional datasets (separately for APHRO, m-TRMM,
and TRMM).
FIG. 3. Time series of (top) correlation coefficients and (bottom)RMSE, betweenAPHROand
TRMM (black) and between APHRO and m-TRMM (green).
Fig(s). 3 live 4/C
4 JOURNAL OF CL IMATE VOLUME 00
3) A cross-validation technique was adopted, in which
the year to be forecast was excluded from calcula-
tions of the regression coefficients. Coefficients var-
ied spatially and monthly during the study years.
4) These regression coefficients were applied to the
forecast year to obtain downscaled model forecasts
for that year.
5) The above steps (1–4) were repeated for each year of
1998–2004 to obtain downscaled forecasts of individ-
ual models.
6) The final outcome was monthly precipitation fore-
casts on 0.258 grids across the greater monsoon
region, from the four coupled models.
To assess the performance of SSE, we did the following
(7 and 8) calculations separately.
7) We also computed ensemble means of seasonal fore-
casts from our suite of multiple models, which did not
use TRMM or gauge datasets. The seasonal precipita-
tion forecasts were validated against the dense gauge-
based seasonal datasets over the greater monsoon
region. Metrics for forecast validation included the
standardRMS errors, ETS, and bias against APHRO.
8) The same metric was applied for the three observa-
tion data, and validation is cross checked with other
observation data.
FIG. 4. Precipitation pattern (mmday21) in summer (June–August) 1998 from (a)APHRODITEand (b)m-TRMM.
(c) Ensemblemean of summer 1998 precipitation forecast by the fourmodels; (d) summer 1998 precipitation simulated
by best performing of the four models; and SSE results with (e) m-TRMM and (f) APHRO used for training.
Fig(s). 4 live 4/C
MONTH 2014 YATAGA I ET AL . 5

4. Results
a. Precipitation pattern and time series
Figure 4 shows precipitation patterns of APHRO and
m-TRMM, along with results of forecasts for summer
1998 (June–August). The superensemble and other fore-
cast experiments were executed monthly, and the figure
shows the three-month sum. The correlation between
APHRO and m-TRMM is 0.96, and that of RMSE with
APHRO is 0.43 (Fig. 4b).
Figures 4c–f describe the results of an ensemble
mean, a model achieving best performance, SSE with
m-TRMM, and SSE with APHRO, respectively. Sta-
tistics (spatial correlation and RMSE) shown in the
figures are versus APHRO (Fig. 4a).
Downscaling was applied in Figs. 4c–f, so even Figs. 4c
and 4d show orographic rainfall along the Himalayas
and over South and Southeast Asia realistically, com-
pared with the model climatology/seasonal patterns
[precipitation patterns simulated by CGCMs, including
the four models used here, were displayed in Kumar
and Krishnamurti (2012) and Krishnamurti and Kumar
(2012)].
Spatial correlation in the areas shown in Fig. 4 reveals
that the SSE with APHRO had the best correlation,
followed by the SSE with m-TRMM. In terms of RMSE,
the SSE with APHRO had the least error. RMSE time
series for the four results are shown in Fig. 5a. This
shows results consistent with Fig. 4, the example plot,
throughout the years. The SSEwithAPHROperformed
best, followed by SSE with m-TRMM. In the summer
monsoon months, the difference among the four [en-
semble mean (EM), best model, SSE with m-TRMM,
SSE with APHRO] was large compared with winter. In
summer, the EM and best model performed similarly;
SSE with m-TRMM showed better performance, with
about half the error of the best model and SSE with
APHRO.
Figures 5b and 5c show bias and ETS according to
rainfall intensity threshold, respectively. In every rain-
fall class, SSE with APHRO gave better performance,
followed by m-TRMM, best model, and EM. In terms
of bias (Fig. 5b), SSE with APHRO and SSE with
m-TRMM were almost the same, but the other two
showed large biases for weak (2mmday21) and heavy
(.20mmday21) rainfall.
b. Metrics against other observations
The above three metrics are relative to benchmark
APHRODITE data. It may be that forecast precipitation
looks like training data, not real values. To evaluate
this effect, we derived statistics versus m-TRMM, and
TRMM versus APHRO. Results are listed in Table 1.
It is clear that correlation coefficients are higher in the
case in which the forecast was evaluated with bench-
mark data used for training (shown in italics). The same
was true for RMSE and ETS. RMSEs are lower in the
case of evaluation against the data used for training, and
ETS was larger in the couple that is evaluated against
the same with the training data.
Interestingly, compared with the value itself, the
correlation of APHRO (0.91) is the highest among the
same pairs (m-TRMMhad 0.88 and TRMMhad 0.82). It
may be expected that APHRO had a low correlation
because it has very precise patterns that may produce
bias. The RMSE revealed excellent performance, simi-
lar to the use of APHRO. The RMSE of APHRO was
the smallest at 0.64; m-TRMM yielded 0.80 and TRMM
FIG. 5. (a) Time series of RMSE computed against benchmark
APHRODITE data for ensemble mean (green), best model (blue),
SSE by m-TRMM (purple), SSE by APHRO (red). (b) Bias and
(c) ETS computed against APHRO. Colors in (b),(c) are as in (a).
Fig(s). 5 live 4/C
6 JOURNAL OF CL IMATE VOLUME 00

gave 1.0. The result of ETS was a slightly different. The
TRMM pair showed the best value (0.65) followed by
APHRO (0.62), but this is a slight difference.
These results demonstrate that high-resolution pre-
cipitation data from a dense network of rain gauges are
essential for improving seasonal rainfall estimation over
the Asian monsoon region.
5. Conclusions
Using APHRODITE precipitation data (APHRO),
the TRMM 3B43 product, and four CGCMs, we per-
formed an experiment combining an SSE with downscal-
ing. The results were compared with ensemble forecasts
lacking observation data and singular (best) model out-
puts. This revealed the following:
1) The dense rain gauge network dataset (APHRO-
DITE) considerably improved seasonal summer
monsoon precipitation forecasts. An m-TRMM
product, which was created by modifying TRMM
3B43 using APHRO data, gave similar results. Skill
scores of these two experiments weremuch superior to
the best single model and ensemble forecast lacking
observation data.
2) Availability of a dense rain gauge network is imper-
ative to success of the seasonal forecast. It is con-
firmed by cross-evaluation of superensemble with
using other observation data than the teacher data
used in the training phase.
3) The method using satellites can be effective in real-
time application.
Acknowledgments. This paper is a contribution to the
APHRODITE project, supported by the Global Envi-
ronment Research Fund of the Ministry of the Envi-
ronment, Japan. This work was also supported by NASA
GPM Grant Number NNX13AF75G. Part of this work
was supported by a research project on Human Life,
Aging, and Disease in High-Altitude Environments ad-
ministrated in the Research Institute for Humanity and
Nature and a Research Collaboration with Disaster
Prevention Research Institute, Kyoto University.
REFERENCES
Chakraborty, A., and T. N. Krishnamurti, 2009: Improving global
model precipitation forecasts over India using downscaling
and the FSU superensemble. Part II: Seasonal climate. Mon.
Wea. Rev., 137, 2736–2757.
Chen, M., W. Shi, P. Xie, V. B. S. Silva, V. E. Kousky, R. W.
Higgins, and J. E. Janowiak, 2008: Assessing objective
techniques for gauge-based analyses of global daily pre-
cipitation. J. Geophys. Res., 113, D04110, doi:10.1029/
2007JD009132.
Delworth, T. L., and Coauthors, 2006: GFDL’s CM2 global cou-
pled climate models. Part I: Formulation and simulation
characteristics. J. Climate, 19, 643–674.
Fu, X., and B. Wang, 2001: A coupled modeling study of the sea-
sonal cycle of the Pacific cold tongue. Part I: Simulation and
sensitivity experiments. J. Climate, 14, 765–779.
Krishnamurti, T. N., and V. Kumar, 2012: Improved seasonal
precipitation forecasts for the Asian monsoon using 16
atmosphere–ocean coupled models: Anomaly. J. Climate,
25, 65–88.
——, C. M. Kishtawal, T. E. LaRow, D. R. Bachiochi, Z. Zhang,
C. E. Williford, S. Gadgil, and S. Surendran, 1999: Improved
weather and seasonal climate forecasts from multimodel su-
perensemble. Science, 285, 1548–1550.——, A. K. Mishra, A. Chakraborty, and M. Rajeevan,
2009a: Improving global model precipitation forecasts
over India using downscaling and the FSU superensemble.
Part I: 1–5-day forecasts. Mon. Wea. Rev., 137, 2713–
2735.
——,——, A. Simon, and A. Yatagai, 2009b: Use of a dense gauge
network over India for improving blended TRMM products
and downscaled weather models. J. Meteor. Soc. Japan, 87,
395–416.
Kug, J.-S., S.-I. An, F.-F. Jin, and I.-S. Kang, 2005: Preconditions
for El Ni~no and La Ni~na onsets and their relation to the
Indian Ocean. Geophys. Res. Lett., 32, L05706, doi:10.1029/
2004GL021674.
Kumar, V., and T. N. Krishnamurti, 2012: Improved seasonal
precipitation forecasts for the Asian monsoon using 16
atmosphere–ocean coupled models: Climatology. J. Climate,
25, 39–64.Saha, S., and Coauthors, 2005: The NCEP Climate Forecast
System Reanalysis. Bull. Amer. Meteor. Soc., 91, 1015–
1057.
Wang, B., and Coauthors, 2009: Advance and prospectus of sea-
sonal prediction: Assessment of the APCC/CliPAS 14-model
ensemble retroperspective seasonal prediction (1980–2004).
Climate Dyn., 33, 93–117.
Yatagai, A., P. Xie, and A. Kitoh, 2005: Utilization of a new
gauge-based daily preciptiation dataset over monsoon Asia for
validation of the daily precipitation climatology simulated by
TABLE 1. Evaluation of score statistics against the references (APHRO,m-TRMM, and TRMM). Values in italics denote the forecast was
evaluated with benchmark data used for training. Boldface values indicate the best score statistics.
Observations used
in downscaling/training
Validation against APHRODITE Validation against m-TRMM Validation against TRMM
COR RMSE ETS COR RMSE ETS COR RMSE ETS
APHRODITE 0.91 0.64 0.62 0.74 0.95 0.54 0.52 1.3 0.61
m-TRMM 0.73 1.2 0.60 0.88 0.80 0.60 0.51 1.4 0.59
TRMM 0.45 1.9 0.46 0.75 0.97 0.50 0.82 1.0 0.65
MONTH 2014 YATAGA I ET AL . 7

the MRI/JMA 20-km-mesh AGCM. SOLA, 1, 193–196,
doi:10.2151/sola.2005-050.
——, O. Arakawa, K. Kamiguchi, H. Kawamoto, M. I. Nodzu, and
A. Hamada, 2009: A 44-year daily gridded precipitation
dataset for Asia based on a dense network of rain gauges.
SOLA, 5, 137–140, doi:10.2151/sola.2009-035.
——, K. Kamiguchi, O. Arakawa, A. Hamada, N. Yasutomi, and
A. Kitoh, 2012: APHRODITE: Constructing a long-term
daily gridded precipitation dataset for Asia based on a dense
network of rain gauges. Bull. Amer. Meteor. Soc., 93, 1401–
1415.
Yun, W.-T., L. Stefanova, and T. N. Krishnamurti, 2003: Im-
provement of the multimodel superensemble technique for
seasonal forecasts. J. Climate, 16, 3834–3840.
——,——,A. K.Mitra, T. S. V. Vijayakumar,W.Dewar, and T. N.
Krishnamurti, 2005: A multi-model superensemble algorithm
for seasonal climate prediction using DEMETER forecasts.
Tellus, 57A, 280–289.
8 JOURNAL OF CL IMATE VOLUME 00
Copyright © 2022 FDOKUMEN