Southern California winter precipitation variability revealed by ...
14
Page 1/14 Southern California winter precipitation variability revealed by 100-year ocean salinity record Sierra Byrne ( [email protected] ) Scripps Institution of Oceanography, University of California San Diego https://orcid.org/0000-0002-0798-8192 Mark Merrield Scripps Institution of Oceanography, University of California San Diego, La Jolla, California Melissa Carter Scripps Institution of Oceanography, University of California San Diego Dan Cayan Scripps Institution of Oceanography and Water Resources Discipline Reinhard Flick Scripps Institution of Oceanography, University of California San Diego Alexander Gershunov University of California San Diego https://orcid.org/0000-0002-6598-6638 Sarah Giddings Scripps Institution of Oceanography, University of California San Diego Article Keywords: Posted Date: July 19th, 2022 DOI: https://doi.org/10.21203/rs.3.rs-1769820/v1 License: This work is licensed under a Creative Commons Attribution 4.0 International License. Read Full License
-
Upload
khangminh22 -
Category
Documents
-
view
0 -
download
0
Transcript of Southern California winter precipitation variability revealed by ...

Page 1/14
Southern California winter precipitation variability revealed by100-year ocean salinity recordSierra Byrne ( [email protected] )
Scripps Institution of Oceanography, University of California San Diego https://orcid.org/0000-0002-0798-8192Mark Merri�eld
Scripps Institution of Oceanography, University of California San Diego, La Jolla, CaliforniaMelissa Carter
Scripps Institution of Oceanography, University of California San DiegoDan Cayan
Scripps Institution of Oceanography and Water Resources DisciplineReinhard Flick
Scripps Institution of Oceanography, University of California San DiegoAlexander Gershunov
University of California San Diego https://orcid.org/0000-0002-6598-6638Sarah Giddings
Scripps Institution of Oceanography, University of California San Diego
Article
Keywords:
Posted Date: July 19th, 2022
DOI: https://doi.org/10.21203/rs.3.rs-1769820/v1
License: This work is licensed under a Creative Commons Attribution 4.0 International License. Read Full License

Page 2/14
AbstractA century-long daily sea surface salinity (SSS) record from the Scripps Institution of Oceanography (SIO) Pier, La Jolla, CAfeatures short-term (~ 1 week) fresh anomalies (< -0.3 psu) associated with rain events. During the peak wet season (January-March, JFM) the SSS anomaly 10% quantile (SSS10) correlates signi�cantly with nearby river out�ow, local and regionalmeasures of precipitation, as well as with a similar SSS10 time series from the Newport Beach Pier (100 km to the north),indicating that the Scripps salinity record provides a measure of year-to-year variations in regional winter precipitation levelsand runoff to the coastal ocean. Correlations between SSS10 and El Niño Southern Oscillation (ENSO) and Paci�c DecadalOscillation (PDO) indices are low; however, negative ENSO (La Niña) and PDO phases correspond consistently with highSSS10/dry winters. In particular, high SSS10 winters tend to cluster during negative decadal phases of the PDO, including anotable three-decade span from 1944–1977 and the current unusually dry period since 2006. Low SSS10/wet winters occurduring positive PDO and ENSO phases, although not exclusively, as dry winters are as likely during positive phases. Shifts inNortheast Paci�c wind and moisture climatologies, captured in reference to ENSO and PDO phases, help to interpret wetwinter variations captured by the salinity record. The long SSS10 time series emphasizes the strong constraint that negativeENSO and PDO phases have on winter drought conditions in southern California, and provides an ocean-based metric forassessing decadal rainfall variations that impact the region.
MainSouthern California precipitation, or lack thereof, occurs in extremity, resulting in multiyear droughts with sporadic years ofheavy rainfall and the highest year-to-year precipitation variability in the continental United States 1 . Climate change isprojected to exacerbate this pre-existing hydroclimate volatility 2 . Above-average rainfall years are critical for replenishingvaluable water supplies to meet growing agricultural and direct human consumption needs. Precipitation also helps tomoderate wild�re risk, a costly consequence of dry foliage and long dry periods. In 2018 alone during a severe drought year,California’s wild�res cost the US an estimated $148.5 billion 3 . The occurrence of extreme rain events and runoff can alsohave devastating effects across southern California in the form of �ooding 4,5 , mudslides 6 , and contamination of coastalwaters 7 . The ability to predict whether a coming water year will be wet or dry would have signi�cant rami�cations for theregion, allowing preparation to reduce risks associated with extreme events and improving planning for water resourceallocation.
Climate indices often are used to characterize atmospheric and oceanic patterns favorable to wet or dry conditions overwestern North America8,9,10. In particular for the southern California region, El Niño Southern Oscillation (ENSO) bringsdrought-like conditions in the La Niña phase and a higher probability of intense rainfall during strong El Niño years10. Otherstudies have considered the in�uence of the Paci�c Decadal Oscillation (PDO) on winter rainfall in the study region11,12,13.Shukla et al. 2015 (ref. 13) found that the negative PDO phase increases the probability of drought favorable conditions insouthern California over the late winter months. The PDO modulates ENSO teleconnections, including precipitation14, andimproves seasonal precipitation prediction skill in the study region15. Negative PDO and ENSO phases have been linked toincreased �re activity in the southwestern US due to decreased precipitation16.
Rainfall accumulation in California is strongly contributed by a few heavy precipitation pulses each year1, 17, 18. These pulsesoccur primarily in the form of atmospheric river (AR) events, accounting for 92% of the heaviest 3-day rain events19,20. ARevents in the southern California region speci�cally occur over a few days each year and can contribute up to half of theannual precipitation accumulation21. The presence or absence of strong AR events contributes to the total precipitationreceived in a given year, making ARs of importance for state-wide water supply20.
Freshwater impacts southern California’s coastal zone during storm events, through direct input of rain water into the surfacewaters and from resulting runoff. Storm runoff is known to carry pollutants through watersheds to the ocean, reducing local

Page 3/14
water quality, increasing fecal indicator bacteria signals, and posing public health risks7,22. River plumes of this relativelyfresh stormwater in�ltrate the salty ocean waters with a plume area dependent on the amount of rainfall23. The fate of theplume depends on the relative strength of the discharge and the waves. Plumes during relatively small discharge and largewaves are trapped in the surfzone and travel along the coast in the direction of the surf zone wave-driven currents24,25,26,whereas larger discharge plumes escape the surfzone and travel along coast depending upon the inner-shelf currents27. Thedirection plumes travel in the inner-shelf varies with wind speed and direction, river discharge inertia, and buoyancy28. Riverplumes in southern California frequently travel southward along the coast due to the relative timing of regional precipitationand wind patterns28, which has implications for the study site located 7.5 km south of the Los Penasquitos Lagoon and 12km south of the San Dieguito River.
Over a century of daily sea surface salinity measurements have been recorded at the Scripps Pier. The standardized collectionprocedures provide con�dence that the salinity measurements are consistent over time. This long record enables a unique105-year investigation of hydroclimate variation affecting the southern California coastal region. Annual-averages of the piersalinity record have been used to assess wind-driven upwelling29, but freshwater spikes in the daily record have not been wellcharacterized. In this paper, we explore the potential for using coastal salinity to infer runoff from heavy rain events over thewet winter season when downward salinity spikes are most prevalent in the pier record. We �nd that freshest salinity quantile(10%) is a good indicator of year-to-year variations in precipitation and runoff (extending the local stream�ow record bynearly 50 years) and that the pier record provides insight that could contribute to better predictability of dry winter seasonsrelative to Paci�c climate variability.
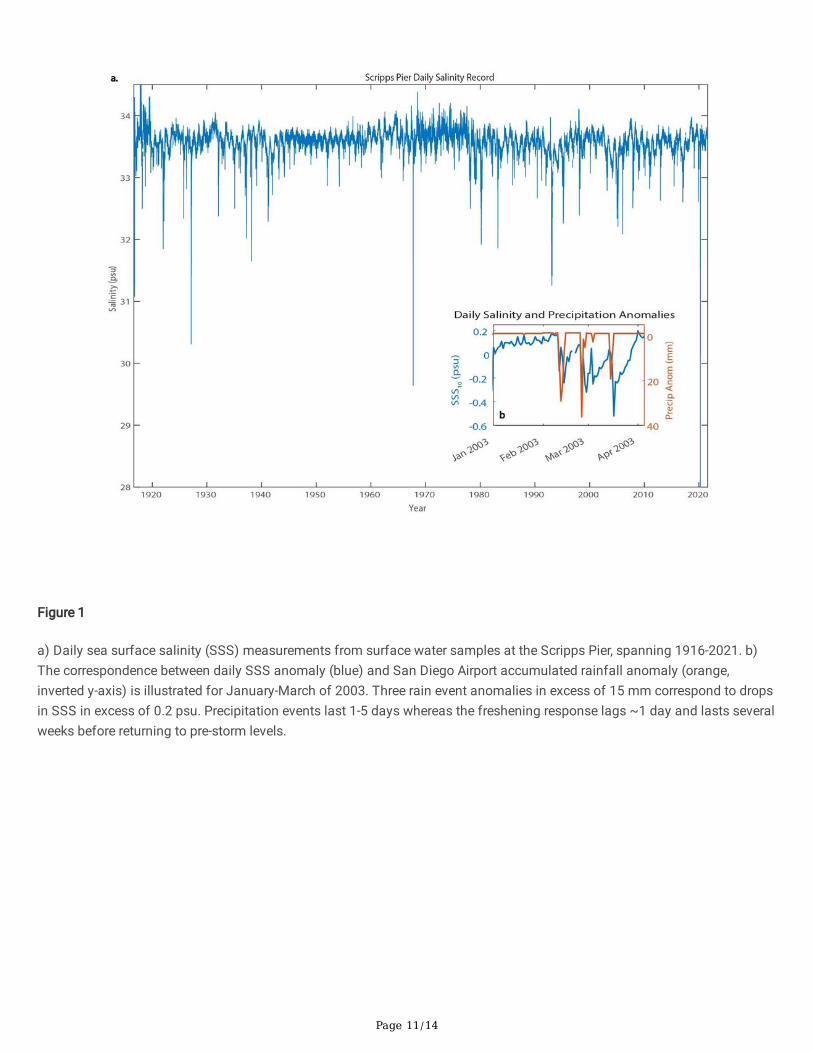
Precipitation In�uence On Surface SalinityThe daily SSS record from Scripps Pier (Fig. 1a) exhibits spike-like fresh events ranging from − 3 to -0.3 psu, contributing to anegative skewness (-2.84) about a mean value of 35.58 psu. A blowup of the record during January through March (JFM)2003 shows that the fresh SSS anomalies align with winter rain events that last for 1–5 days (Fig. 1b). Within 1–3 daysfollowing each rain peak, salinity at the pier drops abruptly by several tenths psu, and slowly returns to near pre-event valuesafter several weeks. Local stream�ow anomalies exhibit a near identical pattern to that of the precipitation over the eventsshown in Fig. 1b. The SSS time delay relative to the rain peak could suggest that the southward advection of the local river orlagoon out�ow plume contributes to the Scripps signal28, and the SSS decay time could re�ect advective-diffusive timescales of the plume within the nearshore zone27. Some localized runoff can also contribute during extreme events.
The fresh salinity events at Scripps Pier can occur throughout the year but are most prevalent during JFM, the three freshestmonths on average (Table 1). The JFM winter season also corresponds to seasonal highs in Los Peñasquitos stream�ow(https://waterdata.usgs.gov/nwis/dv?referred_module=sw&site_no=11023340) and San Diego Airport rainfall (NOAA NCEI;see Methods for data access). Approximately half the annual rainfall in the San Diego Airport record occurs during JFM,consistent with estimates for the larger San Diego region (Hydroclimate Report Water Year 2016, https://water.ca.gov). Wefocus the remainder of our analyses on the JFM winter season of high rainfall, highest stream�ow, and lowest salinity. Toemphasize the in�uence of rain events relative to oceanic signals (e.g., wind-driven upwelling29) during the JFM wet season,the 10% quantile of the JFM salinity anomaly (SSS10) is computed each year after removing the JFM average for that year.Similar results are obtained by subtracting the 50% quantile from the 10% quantile for each JFM season.

Page 4/14
Table 1Average monthly values of SSS, Los Peñasquitos stream�ow (USGS), and accumulated precipitation at San Diego Airport
(NOAA NCEI) highlight the wet winter season that peaks during JFM.
Jan Feb Mar Apr May Jun Jul Aug Sep Oct Nov Dec
SSS (psu) 33.51 33.47 33.45 33.54 33.65 33.70 33.70 33.67 33.61 33.58 33.56 33.54
LosPeñasquitos
Stream�ow(m3/s)
0.70 0.97 0.76 0.30 0.11 0.05 0.04 0.04 0.05 0.11 0.22 0.42
Precipitation(mm)
49.10 45.47 41.81 18.84 5.39 1.37 0.97 1.52 4.87 11.49 27.71 42.72
The SSS10 time series captures year-to-year freshening in the JFM winter season. In years of low precipitation, SSS10 (Fig. 2a)remains relatively consistent at a near zero anomaly (0 to -0.2 psu). These strong correlations suggest that the 10% quantilecharacterizes the relationship between SSS and freshwater inputs at the coast (see also Supplemental Fig. 1). As a check onthe reliability of the Scripps SSS10 time series, we compare it to a similar estimate of the 10% quantile from the Newport PierSSS measurements (Supplemental Fig. 2). A strong signi�cant (p < 0.05) correspondence between the SSS10 time series ofScripps and Newport (r = 0.74) suggests that the rain-related SSS signal is robust in the daily pier measurements (i.e., notsubject to changes in observers or methodology).
Together the SSS10, stream�ow, and precipitation series highlight especially wet winters (SSS10< -0.35) against a backgroundof otherwise dry conditions (Fig. 2a,b). The SSS10 record particularly emphasizes consecutive dry years during predominantlynegative PDO phases (Fig. 2a,c). A noteworthy feature in the SSS10 record is the negative PDO phase of 1944–1977 (Fig. 2c)when the precipitation and stream�ow are weak and the SSS10 is nearly constant for 30 + years. During the two extendednegative PDO phases, with the exception of 2005, the JFM-averaged precipitation anomaly remains under 40 mm. In addition,multi-year droughts in excess of 3 years appear to be less apparent in the �rst 25 years of the SSS10 record, prior to the 30-year long dry period. While dry winters tend to occur sequentially, one low SSS/wet winter is rarely followed by another. Apotential source of this shorter term variability in SSS10/precipitation is ENSO phase (Fig. 2d).
High, signi�cant correlations between SSS10 and the JFM precipitation accumulation anomaly (r = -0.78) and LosPeñasquitos stream�ow anomaly (r = -0.83) further support that SSS10 re�ects rainfall and runoff variability (Fig. 2a,b). Highcorrelations of SSS10 to regional precipitation (Fig. 3) and stream�ow suggest SSS10 captures freshwater drainage of thegreater coastal watershed. The probability of below average JFM daily stream�ow is highest in the “saltiest” years (SSS10 >-0.2 psu) and lowest in the “freshest” years (SSS10 < -0.35 psu; Supplemental Fig. 3).
The tails of the daily stream�ow distributions (Supplemental Fig. 3b) highlight differences in the number of large out�owevents during fresh, moderately fresh, and salty years. In salty years, the probability of rain events causing sustained highstream�ow is much lower than that of the freshest years. The fresh years that feature the largest SSS10 anomalies (Fig. 2a)correspond to generally higher chances of sustained intense stream�ow (Supplemental Fig. 3). The distribution of stream�owhighlights that strong rain events occur less frequently in salty/dry years than fresh years. The contribution of AR events tothe overall rainfall received is explored lightly in this study. The primary investigation is of variability in rainfall totals whichmay include but is not exclusive to AR events.
To further explore the connection between Scripps Pier salinity and regional winter precipitation patterns, we examinecorrelations between SSS10 and the Livneh gridded precipitation product30 for 1917–2011. JFM-averaged precipitationexhibits statistically signi�cant correlations (| r | > 0.20 ) with SSS10 over a broad swath of the southwestern US, with the

Page 5/14
highest correlations (up to r = -0.79) in the Southern California region (Fig. 3). The low SSS10/high rain winters appear to beindicative of large-scale precipitation patterns that affect a signi�cant part of the Southwest region.
Surface Salinity And Climate ModesWe next consider the extent to which Paci�c climate modes can provide context and a degree of predictability for the JFMprecipitation and runoff captured by the SSS10 time series. For comparison with SSS10, the NINO3.4 and PDO indices are
JFM-averaged. The strongest ENSO teleconnections occur in JFM31. Correlations between SSS10 and ENSO and PDO indicesare weak (taking into account serial correlation) with r = -0.25 (signi�cant), -0.28 (insigni�cant), respectively. Despite the lowcorrelation with the PDO, multi-year periods of high SSS10/low rain generally correspond to negative PDO phases (Fig. 2a,c).
Scatter plots con�rm that while the linear correlations between SSS10 and indices of the PDO (Fig. 4a) and ENSO (Fig. 4b) are
weak, there is a strong tendency for high SSS10/low rain winter seasons during negative values of both indices12,13,14,15. Thecase for the PDO is slightly less obvious for annual values, but with a 5-year smoothing to emphasize decadal polaritychanges, the relationship is tighter (Fig. 4a).
JFM ENSO state provides a stronger constraint on year-to-year drought conditions than the PDO, with only one low SSS10
winter (in 1918) evident when the ENSO index dips below − 0.2, and none during strong La Niña events when the JFM-averaged index falls below − 1.0 (Fig. 4b). Thus, La Niña-like conditions strongly favor below-average rain levels for any givenwinter14, whereas multi-year drought periods tend to fall within prolonged negative PDO phases.
In contrast, wet winters occur during positive PDO and ENSO phases14, but not consistently so as high SSS10/dry winters arejust as likely, and high index values do not ensure low SSS10 levels (Fig. 4a,b). With regard to ENSO, the lowest SSS10 winterstend to occur during weak to moderate index levels, and strong El Niño years (Niño 3.4 > 1) have more weak anomalies thanstrong. A recent study32 notes that the Tropical Northern Hemisphere pattern33 (TNH) is highly correlated with Californiaprecipitation variability, and suggests that a combination of ENSO and TNH indices (as opposed to ENSO alone) providesimproved predictability of precipitation. Dry/wet years in southern California tend to occur during TNH positive/negativephases. A strong negative 500-hPa geopotential height anomaly is seen at TNH negative phases over the NE Paci�c Ocean,and vice versa for positive phases34. Negative phase TNH conditions support cloud formation and precipitation whereaspositive phase TNH conditions reduce the winter storm landfalling probability in California32. A scatter plot of SSS10 versusthe NINO3.4 and TNH indices con�rms these tendencies, with low SSS10 wet winters clustered primarily in the lower right-hand quadrant of Fig. 4c where El Niño and negative TNH conditions meet.
Composites of JFM-averaged surface wind and precipitable water anomalies illustrate the relationship between climatephase and southern California precipitation. During La Niña and negative PDO phases (Fig. 5a), the Aleutian low pressuresystem over the northeast Paci�c weakens (clockwise wind anomaly) with negative precipitable water anomalies andaverage wind conditions over the western US. During El Niño and positive PDO phase wet years (Fig. 5c), the Aleutian lowstrengthens and deepens (anticlockwise wind anomaly) forcing the Northern Hemisphere Jetstream (NHJ) southward,resulting in increased storm landfalls on the US west coast and signi�cant positive precipitable water anomalies35,36. DuringEl Niño and positive PDO phase dry years (Fig. 5b), the southeastern extent of the NHJ is located more northwest whencompared to rainy year conditions (Fig. 5c), pushing storm landfalls further north and causing negligible to negativeprecipitable water anomalies in the southern California region.
Shifts in the meridional position of the NHJ, in�uenced by both ENSO and PDO conditions, modulate extreme winter stormtracks and resulting precipitation to the southwestern US35,37,38. Previous studies have linked PDO and North Paci�c GyreOscillation (NPGO) phases, acting in conjunction, to the occurrence/frequency of ARs in California39. The combination ofpositive PDO and negative NPGO phases tend to shift the North Paci�c AR belt southward and result in increased ARfrequency in southern California32,38,39. In summary, the co-occurrence of El Niño and negative TNH increases the likelihood

Page 6/14
for rainfall as a whole while PDO positive and NPGO negative phases together can help dictate where ARs will impact, and allof these nuances could be in part due to NHJ shifts and resulting changes in storm tracks. Future research on NHJpositioning during different combinations of climate modes across all seasons would help to assess the usefulness forpredictability.
ImplicationsThe long-running salinity record from Scripps Pier re�ects regional winter precipitation and stream�ow patterns in�uenced byboth the PDO and ENSO. Low SSS10/wet winters (SSS10 < -0.35) occurred during 17.1% (12.8%) of positive PDO (El Niño)years, while only 1.6% (3.5%) of negative PDO (La Niña) winters. High SSS10/dry winters (SSS10 > -0.20) occurred during73.2% (76.6%) of positive PDO (El Niño) years and 91.9% (91.4%) of negative PDO (La Niña) winters. Over the past 70 years,the majority of low SSS10/wet winters have occurred during positive PDO phases, and more speci�cally when the NINO3.4and TNH indices are positive and negative, respectively. The SSS10 time series especially highlights the occurrences of multi-year drought conditions over the past century. In particular, during the prolonged negative PDO phase between 1944–1977,SSS10 was persistently near normal (Fig. 2b), indicating a lack of heavy winter rain events. In that regard, the current multi-year drought affecting southern California aligns with the recent negative phase of the PDO state, and will likely persist untilthe next phase shift. Moreover, the recent El Niño event of 2015-16, which lacked the expected magni�ed rainfall in the studyregion, featured positive to neutral TNH values, potentially explaining why the impacts were minimized.
The SSS10 observations suggest that a fresh coastal zone plume that persists for days to weeks requires a major rain eventwith substantial stream out�ow and runoff. As such, the SIO pier data may be a proxy for assessing speci�cally extremewinter storm events, including ARs, impacting the southern California region. Based on the AR Rank database, the 1978 to1999 positive PDO phase featured 50% more days with winter AR events in the southern California region compared to the1944 to 1977 negative PDO phase phase (12+/- 1.3% (twice standard error) to 8 +/- 1.1% respectively). AR events previouslyhave been shown to contribute more to the total water year precipitation during PDO + and El Niño years in southernCalifornia1,21. In general, we �nd that mean JFM precipitation provides a better correspondence with SSS10 than time seriesbased on AR Rank (not shown) and further work is needed to quantify the in�uence of different ranked AR events on coastalsalinity.
As the climate changes, current projections are uncertain regarding how the climate modes in�uencing the southernCalifornia region will be impacted40. The IPCC WGII Sixth Assessment Report40 states with moderate con�dence that extremeEl Niño and La Niña events may become more frequent, up to twice as often, with increased teleconnection responses overthe remainder of this century. In a warmer climate, one study41 projects weaker and shorter (from 20 yrs to 12yrs) PDOphases; however, a consensus on future PDO conditions under climate change has not been reached40. The US west coastmay experience a decrease in the frequency of non-AR related rain but an increase in extreme rain due to ARs speci�cally2. Inthe dry southern California region, distinguishing natural �uctuations in rainfall from the emerging climate-change signal willbe critically important for water resource management.
The ocean salinity time series at Scripps Pier complements information provided by nearby stream�ow data and effectivelyextends that record by 50 years, and reinforces the detection of interannual and decadal winter rainfall variations apparent inrain gauge data. The salinity record also provides a long-term context for assessing the impacts of extreme precipitationevents on the coastal zone. Results here provide a more nuanced view of the value of the coastal salinity record in that eventscale structure in the form of low SSS pulses (or lack of these) provides a gauge of the vital heavy precipitation events thatdictate the status of precipitation and water resources in the southern California coastal region. Together the measurementshighlight the strong in�uence that Paci�c climate modes have on regional precipitation, and coastal hydrography, withimplications for seasonal predictability, particularly for anticipating dry winters based on forecasts of La Niña conditions(e.g., NOAA Climate Prediction Center ENSO outlooks). Our �ndings underscore the strong role that interannual to multi-

Page 7/14
decadal variation plays in driving hydroclimate conditions in this region – multi-decadal periods of relatively dry winters arecommon for the region and relief from the current drought may not occur until the PDO shifts to a positive state.
Methods And Data
Salinity DataSince 1916, daily water samples have been collected at the end of the Scripps Institution of Oceanography (SIO) pier in LaJolla, CA. For the near-surface sample, salinity has been measured with two consistent methodologies over time, initially bytitration (1916–1964) and now by inductive salinometer (1965- present). The current collection and measurement proceduresare described in the Shore Stations Program Annual Reports (https://shorestations.ucsd.edu/). Here we analyze the year-to-year wet season variability using the daily sea surface salinity (SSS) record spanning 1916 to 2021 for a total of 38,330 daysof data. We also examine similar daily salinity measurements collected at the Newport Beach Pier following the samemethodology. Time series from both stations are part of the Shore Stations Program.
Precipitation and Stream�owDaily and monthly precipitation accumulation data (1939–2021) for San Diego Airport (~ 16 km southeast of the Pier) areobtained on request from the National Oceanic and Atmospheric Administration’s National Center for EnvironmentalInformation (NOAA NCEI). The Livneh daily near-surface gridded precipitation data30 (1915–2011) spans the continental USin 1/16 degree resolution and is provided by the Physical Sciences Laboratory (PSL), NOAA.
Daily stream�ow time series from Los Peñasquitos, the closest major stream to Scripps Pier, is obtained from the U.S.Geological Survey (1965–2021). The stream feeds into Los Peñasquitos Lagoon, which discharges to the ocean ~ 7 km northof the SIO pier. Anomalies for Los Peñasquitos out�ow and monthly precipitation accumulation are the JFM averages withJFM mean climatologies removed.
An Atmospheric River rank system categorizes the magnitude of landfalling ARs based on the maximum instantaneousvertically integrated water vapor transport (IVT) and storm duration20. This work utilizes a retrospective analysis projectproduced daily AR Rank dataset (1948 to 2020) for consideration of JFM AR events21.
Climate Indices and Atmospheric VariablesEl Niño-Southern Oscillation (ENSO) variability is characterized using the NINO3.4 SST index (1870 to present), obtained fromthe PSL, NOAA. NINO3.4 is calculated from the HadISST1’s SST averaged between 5°S-5°N and 170 − 120°W (ref. 43).
The Paci�c Decadal Oscillation index (1854 to present), obtained from NOAA NCEI, is computed using the ERSST Version 5extended reconstruction of sea surface temperature44. The PDO index is smoothed using a convolution �lter with a 5- yearBlackman window to emphasize decadal variability.
The Tropical/ Northern Hemisphere pattern33 (TNH, 1950 to present) index was provided by the NOAA NCEP ClimatePrediction Center (CPC) and accessed through Columbia University International Research for Climate and Society Institute’sClimate Data Library (https://iridl.ldeo.columbia.edu/SOURCES/.NOAA/.NCEP/.CPC/.Indices/.NHTI/.TNH/). The TNH index isprovided by the CPC with only December through February values. The North Paci�c Gyre Oscillation29 (NPGO, 1950 topresent) was obtained through the Di Lorenzo Research Group (http://www.o3d.org/npgo/index.html).
For atmospheric composites (Fig. 5), surface wind (1948 to present) and precipitable water data (1981 to present) wereobtained from NCEP/ NCAR Reanalysis 1 (ref. 45) and NCEP Daily Global Analyses, respectively. NOAA PSL provided accessto both NCEP datasets. Precipitable water content over a given area denotes humidity, which is positively correlated torainfall46.

Page 8/14
All climate indices are averaged over the rainy season (JFM), with the exception of TNH which is DJF averaged, and all arereferred to without mention of this averaging for the sake of brevity. For all correlations, signi�cance is determined by a p-value < 0.05, assuming every data point is independent unless otherwise speci�ed.
DeclarationsData availability
Source data are cited within this paper.
Code availability
The code used in this study is available upon request to the corresponding author.
Author information
Authors and A�liations
Scripps Institution of Oceanography, UC San Diego, La Jolla, CA, USA
Sierra M. Byrne, Mark A. Merri�eld, Melissa L. Carter, Daniel R. Cayan, Reinhard E. Flick, Alexander Gershunov & Sarah N.Giddings
Contributions
S.M.B. led the data analysis and writing. M.A.M. contributed to and guided the analysis and writing. S.N.G, A.G., D.R.C., M.L.C.,and R.E.F. provided analytical insight and feedback on the analysis and written content.
Corresponding author
Correspondence to S.M. Byrne.
Ethics declarations
The authors declare no competing interests.
Acknowledgements
This study was funded in part by the U.S. Army Corps of Engineers (W912HZ1920020) and the California Department ofParks and Recreation, Natural Resources Division Oceanography Program (C19E0026). The Shore Stations Program iscurrently funded by the California Department of Parks and Recreation, Natural Resources Division, Award #C1670003. Wethank all collectors who contributed to the Shore Stations datasets. Data were collected by Shore Station staff and volunteersstarting March 2020 to present. From 1950-2020 data were collected by aquarists and volunteers with the Birch Aquarium atSIO. Prior to 1950, data were collected by SIO staff and tide observers.
References1. Dettinger, M. D., Ralph, F. M., Das, T., Neiman, P. J. & Cayan, D. R. Atmospheric rivers, foods and the water resources of
California. Water 3, 445–478 (2011).
2. Gershunov, A. et al. Precipitation regime change in Western North America: the role of atmospheric rivers. Scienti�creports 9, 1–11 (2019).
3. Wang, D. et al. Economic footprint of California wild�res in 2018. Nat. Sustain. 4, 252–260 (2021).

Page 9/14
4. Corringham, T. W., Ralph, F. M., Gershunov, A., Cayan, D. R. & Talbot, C. A. Atmospheric rivers drive �ood damages in thewestern United States. Science advances 5, eaax4631 (2019).
5. Jennings, P. C. & Brooks, N. H. Storms, Floods, and Debris Flows in Southern California and Arizona, 1978 and 1980:Proceedings of a Symposium, September 17–18, 1980. (National Research Council, 1982).
�. Campbell, R. H. Debris �ows originating from soil slips during rainstorms in Southern California. Quarterly Journal ofEngineering Geology 7, 339–349 (1974).
7. Reeves, R. L. et al. Scaling and management of fecal indicator bacteria in runoff from a coastal urban watershed insouthern California. Environmental science and technology 38, 2637–2648 (2004).
�. Ropelewski, C. F. & Halpert, M. S. North American precipitation and temperature patterns associated with the ElNiño/Southern Oscillation (ENSO). Mon. Wea. Rev. 114, 2352–2362 (1986).
9. Gershunov, A. & Barnett, T. P. ENSO in�uence on intraseasonal extreme rainfall and temperature frequencies in thecontiguous United States: Observations and model results. J. Clim. 11, 1575–1586 (1998).
10. Cayan, D. R., Redmond, K. T. & Riddle, L. G. ENSO and hydrologic extremes in the western United States. J. Clim. 12,2881–2893 (1999).
11. Mantua, N. J., Hare, S. R., Zhang, Y., Wallace, J. M. & Francis, R. C. A Paci�c interdecadal climate oscillation with impactson salmon production. Bull. Am. Meteorol. Soc. 78, 1069–1080 (1997).
12. Cayan, D. R., Dettinger, M. D., Diaz, H. F. & Graham, N. E. Decadal variability of precipitation over western North America.J. Clim. 11, 3148–3166 (1998).
13. Shukla, S., Steinemann, A., Iacobellis, S. F. & Cayan, D. R. Annual drought in California: Association with monthlyprecipitation and climate phases. J. Appl. Meteorol. and Climatol. 54, 2273–2281 (2015).
14. Gershunov, A. & Barnett, T. P. Interdecadal modulation of ENSO teleconnections. Bull. Am. Meteorol. Soc. 79, 2715–2726(1998).
15. Gershunov, A. & Cayan, D. R. Heavy daily precipitation frequency over the contiguous United States: Sources of climaticvariability and seasonal predictability. J. Clim. 16, 2752–2765 (2003).
1�. Westerling, A. L. & Swetnam, T. W. Interannual to decadal drought and wild�re in the western United States. EOS,Transactions American Geophysical Union 84, 545–555 (2003).
17. Dettinger, M. & Cayan, D. R. Drought and the California delta—A matter of extremes. San Francisco Estuary andWatershed Science 12, (2014).
1�. Kalansky, J. et al. California’s Fourth Climate Change Assessment. San Diego Summary Report SUM-CCCA4-2018-009,(2018).
19. Ralph, F. M. & Dettinger M. D. Historical and national perspectives on extreme West Coast precipitation associated withatmospheric rivers during December 2010. Bull. Am. Meteorol. Soc. 93, 783–790 (2012).
20. Ralph, F. M. et al. A scale to characterize the strength and impacts of atmospheric rivers. Bull. Am. Meteorol. Soc. 100,269–289 (2019).
21. Gershunov, A., Shulgina, T., Ralph, F. M., Lavers, D. A. & Rutz, J. J. Assessing the climate-scale variability of atmosphericrivers affecting western North America. Geophys. Res. Lett. 44, 7900–7908 (2017).
22. Aguilera, R., Gershunov, A. & Benmarhnia, T. Atmospheric rivers impact California's coastal water quality via extremeprecipitation. Sci. Total Environ. 671, 488–494 (2019).
23. Nezlin, N. P., DiGiacomo, P. M., Stein, E. D. & Ackerman, D. Stormwater runoff plumes observed by SeaWiFS radiometer inthe Southern California Bight. Remote Sens. Environ. 98, 494–510 (2005).
24. Wong, S. H., Monismith, S. G. & Boehm, A. B. Simple estimate of entrainment rate of pollutants from a coastal dischargeinto the surf zone. Environmental Science & Technology 47, 11554–11561 (2013).
25. Rodriguez, A. R., Giddings, S. N. & Kumar, N. Impacts of nearshore wave-current interaction on transport and mixing ofsmall‐scale buoyant plumes. Geophys. Res. Lett. 45, 8379–8389 (2018).

Page 10/14
2�. Kastner, S. E., Horner-Devine, A. R. & Thomson, J. M. A conceptual model of a river plume in the surf zone. J. Geophys.Res. Oceans 124, 8060–8078 (2019).
27. Grimes, D. J., Feddersen, F., Giddings, S. N. & Pawlak, G. Cross-shore deformation of a surfzone-released dye plume by aninternal tide on the inner shelf. J. Phys. Oceanogr. 50, 35–54 (2020).
2�. Warrick, J. A. et al. River plume patterns and dynamics within the Southern California Bight. Continental Shelf Research27, 2427–2448 (2007).
29. Di Lorenzo, E. et al. North Paci�c Gyre Oscillation links ocean climate and ecosystem change. Geophys. Res. Lett. 35,(2008).
30. Livneh, B. et al. A long-term hydrologically based dataset of land surface �uxes and states for the conterminous UnitedStates: Update and extensions. J. Clim. 26, 9384–9392 (2013).
31. Chapman, W. E. et al. Monthly modulations of ENSO teleconnections: implications for potential predictability in NorthAmerica. J. Clim. 34, 5899–5921 (2021).
32. Liu, Y. C., Di, P., Chen, S. H. & DaMassa, J. Relationships of rainy season precipitation and temperature to climate indicesin California: long-term variability and extreme events. J. Clim. 31, 1921–1942 (2018).
33. Mo, K. C. & Livezey, R. E. Tropical-extratropical geopotential height teleconnections during the Northern Hemispherewinter. Mon. Wea. Rev. 114, 2488–2515 (1986).
34. Barnston, A. G. & Livezey, R. E. Classi�cation, seasonality and persistence of low-frequency atmospheric circulationpatterns. Mon. Wea. Rev. 115, 1083–1126 (1987).
35. Li, A. K., Paek, H. & Yu, J. Y. The changing in�uences of the AMO and PDO on the decadal variation of the Santa Anawinds. Environ. Res. Lett. 11, 064019 (2016).
3�. Raphael, M. & Mills, G. The role of mid-latitude Paci�c cyclones in the winter precipitation of California. Prof. Geogr. 48,251–262 (1996).
37. Sung, M. K., An, S. I., Kim, B. M. & Woo, S. H. A physical mechanism of the precipitation dipole in the western UnitedStates based on PDO-storm track relationship. Geophys. Res. Lett. 41, 4719–4726 (2014).
3�. Belmecheri, S., Babst, F., Hudson, A. R., Betancourt, J. & Trouet, V. Northern Hemisphere jet stream position indices asdiagnostic tools for climate and ecosystem dynamics. Earth Interactions, 21, 1–23 (2017).
39. Liu, X., Ren, X. & Yang, X. Q. Decadal changes in multiscale water vapor transport and atmospheric river associated withthe Paci�c Decadal Oscillation and the North Paci�c Gyre Oscillation. J. Hydrometeorol. 17, 273–285 (2016).
40. IPCC, 2022: Climate Change 2022: Impacts, Adaptation, and Vulnerability. Contribution of Working Group II to the SixthAssessment Report of the Intergovernmental Panel on Climate Change (eds Pörtner, H.-O. et al.). Cambridge Univ. Press,in the press.
41. Zhang, L. & Delworth, T. L. Simulated response of the Paci�c decadal oscillation to climate change. J. Clim. 29, 5999–6018. (2016).
42. Crameri, F. Scienti�c colour-maps. Zenodo 10, (2018).
43. Rayner, N. A. et al. Global analyses of sea surface temperature, sea ice, and night marine air temperature since the latenineteenth century. J. Geophys. Res. 108, 4407 (2003).
44. Huang, B. et al. Extended reconstructed sea surface temperature, version 5 (ERSSTv5): upgrades, validations, andintercomparisons. J. Clim. 30, 8179–8205 (2017).
45. Kalnay, E. et al. The NCEP/NCAR 40-year reanalysis project. Bull. Am. Meteorol. Soc. 77, 437–470 (1996).
4�. Muller, C. J., Back, L. E., O'Gorman, P. A. & Emanuel, K. A. A model for the relationship between tropical precipitation andcolumn water vapor. Geophys. Res. Lett. 36, (2009).
Figures
Page 11/14
Figure 1
a) Daily sea surface salinity (SSS) measurements from surface water samples at the Scripps Pier, spanning 1916-2021. b)The correspondence between daily SSS anomaly (blue) and San Diego Airport accumulated rainfall anomaly (orange,inverted y-axis) is illustrated for January-March of 2003. Three rain event anomalies in excess of 15 mm correspond to dropsin SSS in excess of 0.2 psu. Precipitation events last 1-5 days whereas the freshening response lags ~1 day and lasts severalweeks before returning to pre-storm levels.

Page 12/14
Figure 2
a) SSS10 (1917-2021). b) JFM-averaged precipitation (blue, 1940-2021) and stream�ow (orange, 1965-2021) anomalies withclimatological monthly averages removed, shown with �ipped y-axes. c) 5-year smoothed JFM-averaged PDO index values.d) JFM-averaged NINO3.4 index values.
Figure 3

Page 13/14
Correlation coe�cient contour map of SSS10 to Livneh gridded precipitation30 (1917-2011). Inset on the left shows southernCalifornia north of the US-Mexico border and south of San Luis Obispo. Colormap from ref. 42.
Figure 4
Scatter of SSS10 (1917-2021) versus a) 5-year smoothed JFM-averaged PDO index and b) JFM-averaged NINO3.4 index. c)Scatter of JFM-averaged NINO3.4 index with DJF-averaged TNH index, colored by the corresponding SSS10 for each year(1951-2021).
Figure 5
Composites of JFM-averaged anomalies of NCEP surface winds and precipitable water (1981-2021) for a) La Niña & PDOnegative phases with high SSS10/dry winters (n=13 yrs), b) El Niño & PDO positive phases with high SSS10/dry winters (n=6yrs), and c) low SSS10/wet winters (n=4 yrs). Colormap from ref. 42.

Page 14/14
Supplementary Files
This is a list of supplementary �les associated with this preprint. Click to download.
SupplementalByrneSIOSalinityManuscriptNatGeoscience.docx