A comparison study of summer-time synoptic-scale waves in South China and the Yangtze River basin...
9
Science in China Series D: Earth Sciences © 2008 SCIENCE IN CHINA PRESS Springer www.scichina.com www.springerlink.com Sci China Ser D-Earth Sci | Jan. 2008 | vol. 51 | no. 1 | 114-122 A comparison study of summer-time synoptic-scale waves in South China and the Yangtze River basin using the TRMM Multi-Satellite Precipitation Analysis daily product FU Rong 1,2 , HU Liang 1† , GU GuoJun 3 & Li YaoDong 1 1 Institute of Atmospheric Physics, Chinese Academy of Sciences, Beijing 100029, China; 2 School of Earth and Atmospheric Sciences, Georgia Institute of Technology, Atlanta, GA 30332, USA; 3 Goddard Earth Sciences and Technology Center, University of Maryland Baltimore Country, and Laboratory for Atmospheres, NASA Goddard Space Flight Center, Greenbelt, MD 20771, USA Summer-time synoptic-scale waves in South China and the Yangtze River basin are quantified and compared by means of analyzing the 6-year (1998―2004) TRMM Multi-Satellite Precipitation Analysis (TMPA) daily product. An innovative 3-dimensional spectrum analysis method is applied. The results indicate that synoptic-scale waves appearing in South China prominently propagate westward within a zonal wavenumber range of 9―21 and a frequency range of −0.12―−0.22 cycles day −1 , while those in the Yangtze River basin primarily move eastward with the same characteristic wavenumbers of 9―21, but within a frequency range of 0.2―0.29 cycles day −1 . Zonal and meridional distributions, and sea- sonal variations of these waves are further explored and compared. It shows that summer-time synop- tic-scale waves in the South China result from the northward migration and oscillation of the Intertropical Convergence Zone (ITCZ) in the western Pacific, whereas the ones in the Yangtze River basin are generally related to the synoptic troughs within the westerly flow, originating from the Qing- hai-Tibet Plateau. TRMM, 3-dimensional spectrum analysis, synoptic-scale waves, South China, Yangtze River basin As an important disturbance in the atmosphere, the ori- gin, development and variation of synoptic-scale waves have been extensively studied. Various weather systems in both the tropics and extratropics are associated with these waves, including frontal cyclones, shear lines, low-level jets, tropical convergence zone, the Southwest Trough, hurricanes/typhoons, etc. Specifically, many weather patterns and features are directly developed and evolved from these wave disturbances. To quantify and explore them, the first question is how to extract and isolate them from their noisy background. In the early 1980s, Huang et al. [1] detailed various spectrum analysis methods and their application in analyzing atmospheric perturbations at synoptic and other time scales. Chen et al. [2] extracted atmospheric signals on the synoptic and sub-synoptic time scales by means of low-pass filtering, and then computed energy exchanges between these two within heavy-rain systems. Their results indicated, in the high levels sub-synoptic-scale systems could transfer momentum energy to synoptic ones with a maximum transfer layer at upper troposphere 300―100 hPa; below 500 hPa, reverse processes occurred. Huang et al. [3] in- vestigated the impact of large-scale circulation on sum- Received May 18, 2007; accepted June 22, 2007 doi: 10.1007/s11430-007-0125-6 † Corresponding author (email: [email protected] ) Supported by the special grant from the National Natural Science Foundation of China (Grant No.40428002) and the National Key Basic Research and Development Program of China (Grant No. 2004CB418303)
Transcript of A comparison study of summer-time synoptic-scale waves in South China and the Yangtze River basin...

Science in China Series D: Earth Sciences
© 2008 SCIENCE IN CHINA PRESS
Springer
www.scichina.com www.springerlink.com Sci China Ser D-Earth Sci | Jan. 2008 | vol. 51 | no. 1 | 114-122
A comparison study of summer-time synoptic-scale waves in South China and the Yangtze River basin using the TRMM Multi-Satellite Precipitation Analysis daily product
FU Rong1,2, HU Liang1†, GU GuoJun3 & Li YaoDong1
1 Institute of Atmospheric Physics, Chinese Academy of Sciences, Beijing 100029, China; 2 School of Earth and Atmospheric Sciences, Georgia Institute of Technology, Atlanta, GA 30332, USA; 3 Goddard Earth Sciences and Technology Center, University of Maryland Baltimore Country, and Laboratory for Atmospheres,
NASA Goddard Space Flight Center, Greenbelt, MD 20771, USA
Summer-time synoptic-scale waves in South China and the Yangtze River basin are quantified and compared by means of analyzing the 6-year (1998―2004) TRMM Multi-Satellite Precipitation Analysis (TMPA) daily product. An innovative 3-dimensional spectrum analysis method is applied. The results indicate that synoptic-scale waves appearing in South China prominently propagate westward within a zonal wavenumber range of 9―21 and a frequency range of −0.12―−0.22 cycles day−1, while those in the Yangtze River basin primarily move eastward with the same characteristic wavenumbers of 9―21, but within a frequency range of 0.2―0.29 cycles day−1. Zonal and meridional distributions, and sea-sonal variations of these waves are further explored and compared. It shows that summer-time synop-tic-scale waves in the South China result from the northward migration and oscillation of the Intertropical Convergence Zone (ITCZ) in the western Pacific, whereas the ones in the Yangtze River basin are generally related to the synoptic troughs within the westerly flow, originating from the Qing-hai-Tibet Plateau.
TRMM, 3-dimensional spectrum analysis, synoptic-scale waves, South China, Yangtze River basin
As an important disturbance in the atmosphere, the ori-gin, development and variation of synoptic-scale waves have been extensively studied. Various weather systems in both the tropics and extratropics are associated with these waves, including frontal cyclones, shear lines, low-level jets, tropical convergence zone, the Southwest Trough, hurricanes/typhoons, etc. Specifically, many weather patterns and features are directly developed and evolved from these wave disturbances. To quantify and explore them, the first question is how to extract and isolate them from their noisy background. In the early 1980s, Huang et al.[1] detailed various spectrum analysis methods and their application in analyzing atmospheric perturbations at synoptic and other time scales. Chen et
al.[2] extracted atmospheric signals on the synoptic and sub-synoptic time scales by means of low-pass filtering, and then computed energy exchanges between these two within heavy-rain systems. Their results indicated, in the high levels sub-synoptic-scale systems could transfer momentum energy to synoptic ones with a maximum transfer layer at upper troposphere 300―100 hPa; below 500 hPa, reverse processes occurred. Huang et al.[3] in-vestigated the impact of large-scale circulation on sum- Received May 18, 2007; accepted June 22, 2007 doi: 10.1007/s11430-007-0125-6 †Corresponding author (email: [email protected]) Supported by the special grant from the National Natural Science Foundation of China (Grant No.40428002) and the National Key Basic Research and Development Program of China (Grant No. 2004CB418303)

FU Rong et al. Sci China Ser D-Earth Sci | Jan. 2008 | vol. 51 | no. 1 | 114-122 115
mer-time floods in the Yangtze River basin by evaluat-ing signal-noise ratio of conditional correlation matrix, discussed possible nonlinear relations between synop-tic-scale and other time-scale perturbations, and further proposed a related physical and statistical model. Also, Li and Li[4] examined the effect of synoptic-scale waves on precipitation in the Yangtze River-Huai River basins during the summer flooding season. They showed that the effect of synoptic-scale waves is weaker than those from stationary planetary waves and low-frequency os-cillations. Gao et al.[5―7] explored the role of synop-tic-scale waves in the accelerating and strengthening of upper-tropospheric jet, analyzed the interaction between upper-tropospheric disturbances and jet during the proc-esses of East Asian cold-outbursts, and established a dynamic relationship between low-level frontogenesis function and the acceleration of zonal mean flow within the upper-level jet. Hence, there exist very important relationships between synoptic-scale waves and other distinct large-scale weather processes.
For their importance, the structures and properties of synoptic-scale waves have also been focused. Felice et al.[8] studied a synoptic-scale wave in the tropical Atlan-tic by means of the ECMWF reanalysis data. It was noted that the wave had a period of 6―9 days and propagated westward with a speed of approximately 8.5 degrees per day, and its structure was similar to tropical mixed-Rossby-gravity (MRG) waves. Reed and Recker[9] analyzed and compared zonal wind, temperature, hu-midity, vertical velocity, and precipitation fields associ-ated with 18 synoptic-scale waves in the equatorial western Pacific. They concluded that the changes in wave structure were primarily caused by the longitudinal variations of the basic flow. Gu and Zhang[10] quantified the properties of westward-propagating synoptic-scale waves within the ITCZ in the Pacific and Atlantic Oceans, and further estimated their contributions to the time-mean ITCZ by means of the long-recorded outgo-ing longwave radiation (OLR) data. Although 80%―
90% of the cloud systems within the ITCZ are random, non-propagating ones, the contributions of synoptic- scale waves to the strength of the ITCZ are still very important. Specifically about 25%―40% of deep con-vective activities within the ITCZ are related to these westward-propagating synoptic-scale waves.
Synoptic-scale waves are very important weather phenomena and become comparatively active during
boreal summer in China. There have been many case studies of their related weather patterns and processes. However, relatively fewer studies have systematically analyzed and quantified these wave systems. There are two major precipitation belts during the summer season in China: one in South China, the other in the Yangtze River basin. The amount of summer-time precipitation in these two regions each year directly determines whether there will be drought or flooding and how se-vere the situation would be. Since summer-time precipi-tation primarily results from synoptic-scale wave activ-ity, these wave signals and their properties can thus be extracted and clarified from surface precipitation data. By means of the TRMM Multi-Satellite Precipitation Analysis (TMPA) daily product (3B42) and an innova-tive 3-dimensional spectrum analysis method, this study intends to analyze and compare these wave signals in both South China and the Yangtze River basin, and fur-ther explores their respective formation mechanisms. The accomplishment of this study will improve our un-derstanding of weather processes in the two regions spe-cifically during boreal summer.
1 Data and methods
The satellite-measured OLR data can provide useful information on cloud top and surface condition under clear sky, however it could not give a real account of surface precipitation. In the tropics, OLR is a reasonably good representation of deep convection or even rainfall, though large difference may still exist, especially over land. In the extratropics, the difference becomes even larger. Thus OLR is rarely used to represent surface pre-cipitation in the extratropics and higher latitudes[11]. Here we focus on synoptic-scale waves and associated convection and precipitation mostly in the extratropics, hence OLR is not appropriate.
TRMM satellite was designed to measure tropical precipitation for its unique instruments including both passive and active microwave sensors. It has been shown that these sensors can provide excellent airborne measurements of precipitation and vertical structure of precipitating systems in both tropics and extratropics[12]. The TMPA (3B42) combines precipitation estimates from the TRMM and other currently-available satellite products including the TRMM/TMI, SSM/I, AMSR-E, and AMSU-B passive microwave estimates. Precipita-tion estimates from the infrared (IR) data collected from

116 FU Rong et al. Sci China Ser D-Earth Sci | Jan. 2008 | vol. 51 | no. 1 | 114-122
geosynchronous-Earth-orbit (GEO) satellites are also applied for their high temporal sampling, but carefully calibrated by the passive microwave estimates. Over land, the precipitation estimates are further calibrated by surface rain gauges. Archived on 0.25°×0.25° grids, the TMPA covers 40°S―40°N. Its temporal resolution is 6 hours. More details can be found in Huffman et al.[13]. The TMPA (3B42) has been applied to investigating various tropical phenomena for its accuracy, and high temporal and spatial resolutions[14,15]. For our purpose the data are merged into 1°×1° grids with time resolution of 1 day. The data used here last from January 1998 to February 2004.
The analysis method used here is the 3-dimensional (longitude-latitude-time) spectrum analysis developed by Gu and Zhang[16]. The basic procedures are as fol-lows:
(1) For a given field x(λ, t), here λ=0―2π is longi-
tude and t=2T
− ―2T is time, wavelet transform is ap-
plied in longitude:
2π *0
1ˆ( , , ) ( , ) d ,( )( )
c k t x ta ka kλ λλ λ Ψ λ′⎡ ⎤−′ ′= ⎢ ⎥
⎣ ⎦∫ (1)
where ( )a k is a function of wavenumber k, and *Ψ the complex conjugate of a base function Ψ. The Morlet wavelet, a complex wavelet base function widely used in geosciences is applied here. Thus the wavelet transform coefficient ˆ( , , )c k tλ is also complex.
(2) Complex Fourier transform is further applied to ˆ( , , )c k tλ in time to obtain the Fourier coefficients:
2π2
2
( , , ) ( , , ) ( , , )
1 ˆ( , , )e d ,T
ftT
c k f A k f iB k f
c k t tT
λ λ λ
λ −
−
≡ +
= ∫ (2)
where f is frequency. Positive (negative) frequencies indicate wave signals tending to propagate eastward (westward). Hence, the wavelet spectral power
2 2( , , ) ( , , ) ( , , )q k f A k f B k fλ λ λ= + . It is easy to find that the estimated spectral power is a function of longi-tude. We thus can readily extract the longitudinal varia-tions of spectral power. This is the tremendous advan-tage over traditional spectrum analysis methods.
(3) To explore the seasonal variation of synoptic-scale waves, the entire time series is divided into a series of subsets of time series, and the above two steps is then
applied to each subset. The time length for each subset time series is t =92 days, roughly covering three months. The estimated spectral power is considered to represent the strength of various signals in the central month. So the procedure works as a 92-day running window with a 30-day step. The resulting spectral power is hence also a function of month m, i.e., q(k, λ, f, m).
(4) The above procedures (1)―(3) are further applied to the daily TMPA (3B42) data along each latitude band from 0―40°N. The wavelet spectral power thus covers the time period from February 1998 to January 2004 and is a function of latitude φ, i.e., q(k, λ, f, m, φ).
(5) Finally, for the purpose of displaying various 2-dimensional pattern of spectral power, averaging can be used to any three parameters in q(k, λ, f, m, φ). Here, the two domains of 21.5°―23.5°N, 105.5°―120.5°E and 29.5° ― 31.5°N, 105.5° ― 120.5°E are used to roughly represent South China and the Yangtze River basin, respectively (Figure 1).
Figure 1 The selected regions (dashed rectangles) represent South China and the Yangtze River basin, respectively.
As we know, wavelet analysis is a powerful tool for detecting local signals both temporally and spatially, and has been applied in many fields[17]. Traditional 2-di-mensional spectrum analysis can decompose a field into two parts: westward- and eastward-propagating[18]. The method used here combines these two. It is able to extract the propagating signals from the field within various wavenumber and frequency domains, and keep their regional information. Thus, the 3-dimensional (lon- gitude-latitude-time) information can provide their spa-tiotemporal distributions simultaneously.

FU Rong et al. Sci China Ser D-Earth Sci | Jan. 2008 | vol. 51 | no. 1 | 114-122 117
2 Wavenumber-frequency spectra dur-ing the summer season in South China and the Yangtze River basin
To quantify the spectral properties of synoptic-scale waves during the summer season (June―August) in South China, the mean 2-dimensional wavenumber- frequency spectrum ( , )q k f is obtained by averaging q(k, λ, f, m, φ). Obviously, ( , )q k f is comparable to the traditional 2-dimensional wavenumber-frequency spectrum (Figure 2(a)).
From Figure 2(a), it is noted that this wavenumber- frequency spectrum ( , )q k f is basically “red” as dis-covered in previous studies[19,20]. Also, there seems more spectral power in the negative frequency domain, proba-bly indicating the dominance of westward-propagating signals in South China. To further detect and discern the wave signals from their “red” background, similar pro-cedures are applied as in Wheeler and Kiladis[19]. The background “red” spectrum is first estimated by averag-ing the original spectrum many times in both wavenum-
ber and frequency directions (Figure 2(b)). The ratio between the original and “red” spectra is further calcu-lated and used to estimate the statistical confidence level (shades in Figure 3(a) indicate the ratio is larger than 1.1 and the corresponding spectral signals are above the 95% confidence level).
Zangvil[21] identified synoptic-scale waves by multi-plying power spectrum with corresponding wavenumber and frequency. Even though this method could not guarantee the significance of discovered spectral peaks, it has been applied successfully in past studies[22]. Gu and Zhang[16] showed the consistence between spectral peaks identified using this method and by means of the method of Wheeler and Kiladis[19], specifically within the synoptic-scale domain. Similar results are shown in Figure 3. Therefore the method proposed by Zangvil[21] is used here to identify synoptic-scale wave signals.
Evident westward-propagating synoptic-scale waves appear during boreal summer in South China (Figure 3(a)), with characteristic wavenumbers of 9―21 (or wavelengths of roughly 2000―4500 km) and frequen-
Figure 2 Mean zonal wavenumber-frequency wavelet spectra in South China during June―August. (a) Base-10 logarithm of the raw power spectrum; (b) base-10 logarithm of the “background” power spectrum calculated by smoothing the raw power spectrum in (a) many times with a 1-2-1 filter in both wavenumber and frequency.
Figure 3 Mean zonal wavenumber-frequency wavelet spectra in (a) South China and (b) the Yangtze River basin during boreal summer. Shades denote a value of 1.1 for which the spectrum signals are significantly above the background at the 95% level, based on 500 dof, the solid and the dotted line are the value calculated by Zangvil; the dashed rectangles represent the wavenumber and frequency domains focused in this study.

118 FU Rong et al. Sci China Ser D-Earth Sci | Jan. 2008 | vol. 51 | no. 1 | 114-122
cies of −0.12―−0.22 cycles day−1 (or periods of 4―8 days).
A similar mean wavenumber-frequency spectrum is also estimated for the wave signals in the Yangtze River basin (Figure 3(b)). It is readily found that much more intense propagating signals are eastward-propagating, significantly different from those in South China. These eastward-propagating signals are concentrated in a wavenumer range of 9―21 and a frequency range of 0.2―0.29 cycles day−1 (or periods of 3―5 days). We thus focus on the wave signals in the two wavenumber (k) and frequency (f ) domains: k=9―21, f =−0.12―−0.22 cycles day−1 for South China, and k = 9―21, f = 0.2―0.29 cycles day−1 for the Yangtze River basin (Fig-ure 3).
Figure 3 shows that the synoptic-scale wave signals in these two regions have the same characteristic wavenu- mbers 9―21 but different characteristic frequencies. The wave signals in South China are dominated by the westward-propagating components (f <0), in contrast to the eastward-propagating (f >0) dominance in the Yang-tze River basin. The characteristic frequencies for the wave signals in South China tend to be lower than in the Yangtze River basin. Additionally, the spectrum is more scattered for the wave signals in the Yangtze River basin, probably suggesting much more complicated physical mechanisms than in South China.
3 Meridional variation of synoptic-scale waves
To explore the possible latitudinal variation and fre-quency shifts, the mean power spectrum as function of only frequency and latitude is estimated for the longitu-dinal belt 105.5°―120.5°E and during the summer sea-son (June―August). As mentioned above, we focus on the wavenumber range of 9―21. The resulting spectrum
( , )q f φ is shown in Figure 4. Westward-propagating synoptic-scale wave signals
are primarily located south of 26°N within the frequency range of −0.12―−0.22 cycles day−1. In contrast, east-ward-propagating synoptic-scale waves occur mostly north of 26°N within the frequency range of 0.2―0.29 cycles day−1. Also, the spectral power for these east-ward-propagating ones scatters across a much wider frequency range. This is likely caused by various kinds
of convective systems existing north of 26°N during boreal summer. These convective systems have shorter lifecycles (tenth minutes to tenth hours) and may be ef-fectively modulated by the diurnal cycle. Since daily precipitation data are applied here, these scattered spec-tral peaks are expected north of 26°N.
Figure 4 Mean spectral power as function of frequency and latitude during boreal summer. Shades indicate that signals are significant in Fig-ure 3.
To further investigate the meridional distributions of synoptic-scale wave signals, the mean spectra as func-tion of only wavenumber and latitude are estimated for two frequency bands: −0.12―−0.22 cycles day−1 and 0.2―0.29 cycles day−1 (Figure 5). It seems that west-ward-propagating signals dominate between 9°―23°N, while those eastward-propagating ones are primarily located between 29°―39°N, showing a similar feature as in Figure 4.
Hence, the synoptic-scale waves south of 26°N tend to show different propagating features from those north of 26°N. This distinction is likely related to the differ- ences existing in their corresponding large-scale circula- tion systems. South of 26°N, the southeastern trade winds are dominant during boreal summer, whereas northwesterly winds control the areas north of 26°N. These north-westerlies originating from the Qing- hai-Tibet Plateau are relatively more complicated and variable than the trade winds. This may partly explainthe scattered structure shown in Figures 4(b) and 5(b).
4 Zonal variation of synoptic-scale waves
To examine the zonal distribution of synoptic-scale

FU Rong et al. Sci China Ser D-Earth Sci | Jan. 2008 | vol. 51 | no. 1 | 114-122 119
Figure 5 Mean spectral power as function of wavenumber and latitude for (a) South China and (b) the Yangtze River basin during boreal summer. Shades indicate that signals are significant in Figure 3. waves and further compare the wave signals in South China and the Yangtze River basin with those in the other regions, the mean spectra as function of longitude and frequency are estimated along two latitude bands: 21.5°―23.5°N, 29.5°―31.5°N (Figure 6).
It is interesting to note that the spectral power corr- esponding to the synoptic-scale waves tends to be con- centrated in two regions for both westward-propagating and eastward-propagating components: one around 120°E, the other near 80°W, corresponding to the east coasts of Asia and North America, respectively. During boreal summer, both areas are affected by westerly and easterly winds. However, it appears that the wave sig-nals around 120°E are much stronger than near 80oW, likely indicating the differences in wave properties and the large-scale circulation systems.
For the wave signals around 120°E, westward- propagating ones are within the frequency domain of −0.12―−0.22 cycles day−1 in South China (Figure 6(a); consistent with our focused frequency range). In the Yangtze River basin, again one can find a scattered structure (Figure 6(b)). Around f = 0.2―0.29 cycles
day−1 appears one spectral peak. Nevertheless, one can see another peak in the higher frequency range. After carefully examination of Figure 6, one can also find that the maximum spectral power for westward-propagating synoptic-scale waves is primarily located around 75°―160°E generally controlled by the southeastern trade winds; on the other hand, the spectral power for east-ward-propagating waves is around 105°―140°E right located in the downstream of the Qinghai-Tibet Plateau. Thus these waves tend to be related to the atmospheric perturbations within the westerly mean flow.
The mean spectra ( , )q kλ as function of longitude and wavenumber are also estimated for two latitude bands (not shown). Similar conclusions can be deduced as from Figure 6.
5 Seasonal variation of synoptic-scale waves
Seasonal variations of synoptic-scale waves are exam- ined in this section. The mean spectra ( , )q k m as func tion of wavenumber and month are estimated for the two
Figure 6 Mean spectral power as function of longitude and frequency for (a) South China and (b) the Yangtze River basin during boreal summer. Shades indicate that signals are significant in Figure 3.
120 FU Rong et al. Sci China Ser D-Earth Sci | Jan. 2008 | vol. 51 | no. 1 | 114-122
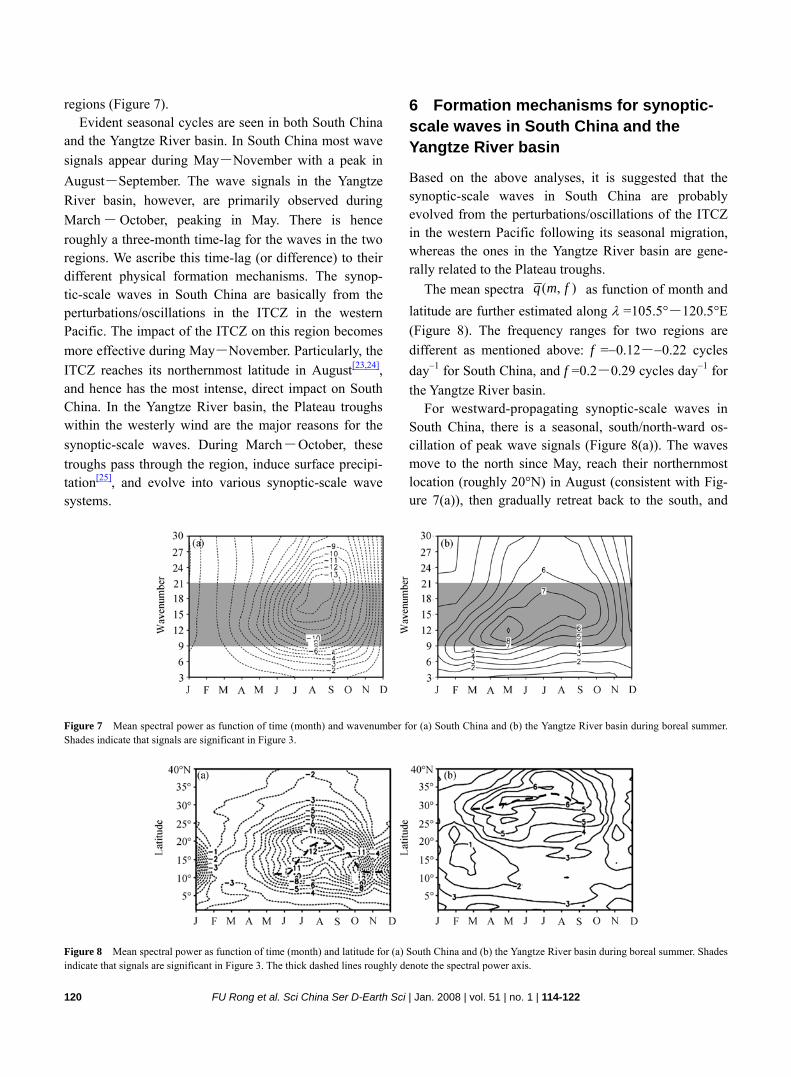
regions (Figure 7). Evident seasonal cycles are seen in both South China
and the Yangtze River basin. In South China most wave signals appear during May―November with a peak in August―September. The wave signals in the Yangtze River basin, however, are primarily observed during March―October, peaking in May. There is hence roughly a three-month time-lag for the waves in the two regions. We ascribe this time-lag (or difference) to their different physical formation mechanisms. The synop-tic-scale waves in South China are basically from the perturbations/oscillations in the ITCZ in the western Pacific. The impact of the ITCZ on this region becomes more effective during May―November. Particularly, the ITCZ reaches its northernmost latitude in August[23,24], and hence has the most intense, direct impact on South China. In the Yangtze River basin, the Plateau troughs within the westerly wind are the major reasons for the synoptic-scale waves. During March―October, these troughs pass through the region, induce surface precipi-tation[25], and evolve into various synoptic-scale wave systems.
6 Formation mechanisms for synoptic- scale waves in South China and the Yangtze River basin
Based on the above analyses, it is suggested that the synoptic-scale waves in South China are probably evolved from the perturbations/oscillations of the ITCZ in the western Pacific following its seasonal migration, whereas the ones in the Yangtze River basin are gene- rally related to the Plateau troughs.
The mean spectra ( , )q m f as function of month and latitude are further estimated along λ =105.5°―120.5°E (Figure 8). The frequency ranges for two regions are different as mentioned above: f =−0.12―−0.22 cycles day−1 for South China, and f =0.2―0.29 cycles day−1 for the Yangtze River basin.
For westward-propagating synoptic-scale waves in South China, there is a seasonal, south/north-ward os-cillation of peak wave signals (Figure 8(a)). The waves move to the north since May, reach their northernmost location (roughly 20°N) in August (consistent with Fig- ure 7(a)), then gradually retreat back to the south, and
Figure 7 Mean spectral power as function of time (month) and wavenumber for (a) South China and (b) the Yangtze River basin during boreal summer. Shades indicate that signals are significant in Figure 3.
Figure 8 Mean spectral power as function of time (month) and latitude for (a) South China and (b) the Yangtze River basin during boreal summer. Shades indicate that signals are significant in Figure 3. The thick dashed lines roughly denote the spectral power axis.

FU Rong et al. Sci China Ser D-Earth Sci | Jan. 2008 | vol. 51 | no. 1 | 114-122 121
finally reach their southernmost latitude (around 12°N). This migration feature is consistent with the seasonal march of the ITCZ in the western Pacific[26,27]. It thus tends to further support our arguments.
For eastward-propagating synoptic-scale waves in the Yangtze River basin, there is not any significant seasonal south/north-ward oscillation (Figure 8(b)). From Figure 7(b), it is noted that synoptic-scale wave signals become prominent since March. However, as shown in Figure 8(b), no wave signals propagate into this region before March, entirely different from the ones in South China. So it is reasonable to suggest that these waves be formed locally and mostly related to the Plateau troughs drifting from the upstream. With the coming of boreal summer season, the westerly flow moves to the north. The troughs within the mean flow also gradually move to the north. In August, the westerly flow reaches its north-ernmost, so do the eastward-drafting troughs. In fall and winter, these waves move a little bit to the south with the movement of the westerly flow.
In summary, synoptic-scale waves in South China are closely related to the seasonal movement of the ITCZ in the western Pacific; the ones in the Yangtze River basin however, are generally caused by the eastward-moving Plateau troughs within the westerly mean flow.
7 Conclusions
The spectral properties of synoptic-scale waves in South China and the Yangtze River basin are analyzed and compared by means of a new 3-dimensional spectrum analysis method. The formation mechanisms for these waves are further explored.
(1) Large differences exist between the waves in the two regions. In South China, most wave signals are westward-propagating and within the wavenumber and
frequency ranges of 9―21 and −0.12―−0.22 cycles day−1; in the Yangtze River basin, however, waves tend to be eastward-propagating and within the wavenumber and frequency ranges of 9―21 and 0.2―0.29 cycles day−1.
(2) There seems a latitude band (~26°N), which tends to separate westward-propagating and eastward-propa- gating signals. South of it, westward-propagating synop-tic-scale waves are dominant and focused along 9°―23°N; north of it, most wave signals are eastward- propagating and primarily located between 29°―39°N.
(3) In South China, synoptic-scale waves primarily appear between 75°―160°E; in the Yangtze River basin, synoptic-scale waves are mostly observed between 105°―140°E. In general, there are two regions with intense synoptic-scale wave signals for both westward- and eastward-propagating ones: the east coasts of Asia and North America.
(4) Evident seasonal variations can be seen for these waves. Westward-propagating synoptic-scale waves in South China are generally observed during May―November with their peak month being August; for eastward-propagating synoptic-scale waves in the Yang-tze River basin, they become active during March―October and peak in May.
(5) It is suggested that the westward-propagating synoptic-scale waves in South China are basically re-lated to the ITCZ in the western Pacific, while the east-ward-propagating ones in the Yangtze River basin are generally caused by the troughs moving from the Qing-hai-Tibet Plateau.
The TRMM Multi-Satellite Precipitation Analysis (TMPA) product was provided by NASA/GSFC-DAAC.
1 Huang J Y, Li H. The Spectrum Analysis in Meteorology (in Chinese).
Beijing: China Meteorological Press, 1984. 1―300 2 Chen S J, Xie A. The exchange of kinetic enerage between synoptic
and subsynoptic-scale motion. Acta Meteor Sin (in Chinese), 1981, 39(4): 408―415
3 Huang J Y, Gao S T. A research on atmospheric circulation factors of summer floods/drought over Yangtze River basin. Prog Nat Sci (in Chinese), 2003,13(2): 206―209
4 Li G L, Li C Y. Drought and flood in the Changjiang-Huaihe River Basin associated with the multi-time- scale oscillation. Chin J Atmos Sci (in Chinese), 1999, 23(1): 39―50
5 Gao S, Tao S, Ding Y. The generalized E-P flux wave-meanflow in-teractions. Sci China Ser B, 1990, 33: 704―715
6 Gao S T, Tao S Y. The lower layer frontogenesis induced by the ac-celeration of upper jet stream. Chin J Atmos Sci (in Chinese), 1991, 15(2): 11―22
7 Gao S T, Tao S Y. Upper wave-east Asian jet interaction during the period of cold wave outbreak. Chin J Atmos Sci (in Chinese), 1992, 16(6): 718―724
8 Felice P, Viltard A, Oubuih J. A synoptic-scale wave of 6―9-day pe-riod in the Atlantic tropical troposphere during summer 1981. Mon Weather Rev, 1993, 121(5): 1291―1298 [DOI]
9 Reed R J, Recker E E. Structure and properties of synoptic-scale wave disturbances in the equatorial western Pacific. J Atmos Sci, 1971, 28: 1117―1133
10 Gu G, Zhang C. Cloud components of the intertropical convergence

122 FU Rong et al. Sci China Ser D-Earth Sci | Jan. 2008 | vol. 51 | no. 1 | 114-122
zone. J Geophys Res, 2002, 107(D21) 11 Jiang S C, Zhu Y F. The Application and Atlas of OLR (in Chinese).
Beijing: Peking University Press, 1990. 1―25 12 Kummerow C, Simpson J, Thiele O, et al. The status of the tropical
rainfall measuring mission (TRMM) after two years in orbit. J Appl Meteorol, 2000, 39: 1965―1982 [DOI]
13 Huffman G, Adler R F, Bolvin D T, et al. The TRMM Multi-Satellite Precipitation Analysis (TMPA): quasi-global, multi-year, combined- sensor precipitation estimates at fine scales. J Hydrometeorol, 2007, 8: 38―55 [DOI]
14 Adler R F, George H, David T, et al. Tropical rainfall distributions determined using TRMM combined with other satellite and rain gauge information. J Appl Meteorol, 2000, 39: 2007―2023 [DOI]
15 Gu G, Adler R F, Huffman G, et al. African easterly waves and their association with precipitation. J Geophys Res, 2004, 109(D04101)
16 Gu G, Zhang C. A spectrum analysis of synoptic-scale disturbances in the ITCZ. J Clim, 2001, 14: 2725―2739 [DOI]
17 Hayashi Y. Space-time spectral analysis and its applications to at-mospheric waves. J Meteor Soc, 1982, 60: 156―171
18 Torrence C, Compo G P. A practical guide to wavelet analysis. Bull Amer Metorol Soc, 1998, 79: 61―78 [DOI]
19 Wheeler M, Kiladis G N. Convectively coupled equatorial waves: Analysis of clouds and temperature in the wavenumber-frequency domain. J Atmos Sci, 1999, 56: 374―399 [DOI]
20 Gruber A. Wavenumber-frequency spectra of satellite-measured
brightness in the tropics. J Atmos Sci, 1974, 31: 1675―1680 21 Zangvil A. Temporal and spatial behavior of large-scale distributions
in tropical cloudiness deduced from satellite brightness data. Mon Weather Rev, 103: 904―920
22 May W. Space-time spectra of the atmospheric interseasonal varia- bility in the extratropics and their dependency on the El Niño/Sou- thern oscillation phenomenon: Model versus observation. Clim Dyn, 1999, 15: 369―387 [DOI]
23 Tao S Y, Zhu F K, Wu T Q. Synoptic research on activities of sub-tropical high over Chinese continent and its contiguous ocean in summer. In: Tao S Y, ed. Some Studies on Subtropical Synoptic Sys-tems over China in Summer (in Chinese). Beijing: Science Press, 1963. 106―123
24 Jiang S C, Dai Z Y. Satellite derived climatological feature of sub-tropical high over West Pacific. Chin Sci Bull (in Chinese), 1989, 34(19): 1492―1493
25 Zhu Q G, Lin J R, Shou S W, et al. Principle and Approach of the Synoptic (in Chinese). Beijing: China Meteorological Press, 2000. 342―383
26 Jiang S, Ye Q, Yang X F, et al. Climatological feature of the global tropical subsidence region based on satellite observations. Adv Atmos Sci, 2000, 17(3): 391―402 [DOI]
27 Jiang S C. The climatic characteristics of the ITCZ all over the globe. Acta Meteor Sin, 1988, 46(2): 241―245