Use of an individual-based model to forecast the effect of climate change on the dynamics, abundance...
15
Use of an individual-based model to forecast the effect of climate change on the dynamics, abundance and geographical range of the pest slug Deroceras reticulatum in the UK JENNA C. WILLIS *, DAVID A. BOHAN *, YOON H. CHOI w , KELVIN F. CONRAD * and MIKHAIL A. SEMENOV * *Rothamsted Research, Harpenden, Hertfordshire AL5 2JQ, UK, wCentre for Infections, Health Protection Agency, 61 Colindale Avenue, London NW9 5HT, UK Abstract Slugs are serious agricultural pests and their activity is strongly driven by ambient temperature and soil moisture. The strength of this relationship has been shown through the development of a deterministic model, based upon temperature and soil moisture conditions alone, which accurately describes the population dynamics and abundance of Deroceras reticulatum. Because of this strong climatic dependence, slug abundance and dynamics are likely to be affected by climate change. We used a validated individual- based model (IbM) of D. reticulatum, to assess the effects of climate change on the abundance of this species in the UK. Climatic scenarios were based on the UKCIP02 predictions and constructed using the LARS-WG stochastic weather generator. The IbM of slugs predicted population dynamics at three time slices (2020s, 2050s and 2080s), and two scenarios of greenhouse gas emissions. The maximum generation number, the number of population peaks, the number of slug-days in each season, the percentage of years when the population passes over a threshold for damage and the percentage of years in which populations go extinct were investigated. Currently, the south-west of the UK has the best conditions for D. reticulatum to thrive, with the north-east of Scotland having the most adverse. By 2080 under both low- and high-emissions scenarios, the north and west of Scotland will have the most favourable conditions for the survival of this species and the east of the UK and Scotland will have the harshest. By 2080 the climate in the north-west of Scotland will become more like the current climate in south- east England, which explains the shift in the pattern of abundance. The north-west of Scotland will have increased slug damage and south-west England and west-Wales will have decreased slug damage with some changes becoming evident by 2020. Keywords: climate change scenarios, slug population dynamics, stochastic modelling, UKCIP, weather generator Received 24 October 2005; revised version received 19 December 2005; accepted 20 December 2005 Introduction Deroceras reticulatum (Genus Deroceras), the grey field slug, is a major agricultural pest, thriving in the disturbed environments created in agricultural fields (Barker, 1991). D. reticulatum is found across the UK and much of the rest of the world, having been introduced into North America, Peru, Tasmania, New Zealand and Central Asia (Yildirim & Kebapc ¸i, 2004), as it is a highly successful invader. Slugs cause economic damage to crops by eating the shoots and endosperm of germinating seeds, occasion- ally causing whole areas of the field to be resown. This results in the application of d10 million of slug pellets each year in field crops in England and Wales alone (Garthwaite & Thomas, 1996). Slugs can also cause cosmetic damage; the presence of slugs themselves can devalue the crop. Potatoes and winter wheat are Correspondence: Mikhail Semenov, tel. 1 44 1582 763 133 (Ext. 2395), fax 1 44 1582 760 981, e-mail: [email protected]. Global Change Biology (2006) 12, 1643–1657, doi: 10.1111/j.1365-2486.2006.01201.x r 2006 The Authors Journal compilation r 2006 Blackwell Publishing Ltd 1643
-
Upload
nationalagriculturalresearchinra -
Category
Documents
-
view
3 -
download
0
Transcript of Use of an individual-based model to forecast the effect of climate change on the dynamics, abundance...

Use of an individual-based model to forecast the effect ofclimate change on the dynamics, abundance andgeographical range of the pest slug Deroceras reticulatumin the UK
J E N N A C . W I L L I S *, D AV I D A . B O H A N *, Y O O N H . C H O I w , K E LV I N F. C O N R A D * and
M I K H A I L A . S E M E N O V *
*Rothamsted Research, Harpenden, Hertfordshire AL5 2JQ, UK, wCentre for Infections, Health Protection Agency,
61 Colindale Avenue, London NW9 5HT, UK
Abstract
Slugs are serious agricultural pests and their activity is strongly driven by ambient
temperature and soil moisture. The strength of this relationship has been shown through
the development of a deterministic model, based upon temperature and soil moisture
conditions alone, which accurately describes the population dynamics and abundance of
Deroceras reticulatum. Because of this strong climatic dependence, slug abundance and
dynamics are likely to be affected by climate change. We used a validated individual-
based model (IbM) of D. reticulatum, to assess the effects of climate change on the
abundance of this species in the UK. Climatic scenarios were based on the UKCIP02
predictions and constructed using the LARS-WG stochastic weather generator. The IbM
of slugs predicted population dynamics at three time slices (2020s, 2050s and 2080s), and
two scenarios of greenhouse gas emissions. The maximum generation number, the
number of population peaks, the number of slug-days in each season, the percentage
of years when the population passes over a threshold for damage and the percentage of
years in which populations go extinct were investigated. Currently, the south-west of the
UK has the best conditions for D. reticulatum to thrive, with the north-east of Scotland
having the most adverse. By 2080 under both low- and high-emissions scenarios, the
north and west of Scotland will have the most favourable conditions for the survival of
this species and the east of the UK and Scotland will have the harshest. By 2080 the
climate in the north-west of Scotland will become more like the current climate in south-
east England, which explains the shift in the pattern of abundance. The north-west of
Scotland will have increased slug damage and south-west England and west-Wales will
have decreased slug damage with some changes becoming evident by 2020.
Keywords: climate change scenarios, slug population dynamics, stochastic modelling, UKCIP, weather
generator
Received 24 October 2005; revised version received 19 December 2005; accepted 20 December 2005
Introduction
Deroceras reticulatum (Genus Deroceras), the grey
field slug, is a major agricultural pest, thriving in the
disturbed environments created in agricultural fields
(Barker, 1991). D. reticulatum is found across the UK and
much of the rest of the world, having been introduced
into North America, Peru, Tasmania, New Zealand and
Central Asia (Yildirim & Kebapci, 2004), as it is a highly
successful invader.
Slugs cause economic damage to crops by eating the
shoots and endosperm of germinating seeds, occasion-
ally causing whole areas of the field to be resown. This
results in the application of d10 million of slug pellets
each year in field crops in England and Wales alone
(Garthwaite & Thomas, 1996). Slugs can also cause
cosmetic damage; the presence of slugs themselves
can devalue the crop. Potatoes and winter wheat are
Correspondence: Mikhail Semenov, tel. 1 44 1582 763 133
(Ext. 2395), fax 1 44 1582 760 981, e-mail:
Global Change Biology (2006) 12, 1643–1657, doi: 10.1111/j.1365-2486.2006.01201.x
r 2006 The AuthorsJournal compilation r 2006 Blackwell Publishing Ltd 1643

thought to be particularly vulnerable to economic losses
due to slugs (Port, 1986), therefore, accurate application
of control measures is essential in these crops. However,
the timing of slug damage is difficult to predict and
control measures are often ineffective, resulting in eco-
nomic loss and damage. Application of slug pellets is
increasing, with 70 times more slug pellets applied in
the 1990s compared with the 1970s (Garthwaite &
Thomas, 1996), possibly indicating an increase in slug
damage.
The most frequently applied pellets are metaldehyde-
based accounting for 55% of pellets applied in UK
arable and horticultural crops, with 40% of pellets being
methiocarb based and the remaining 5% based on
thiocarb (Garthwaite & Thomas, 1996). Slug control
can also be achieved using biological control agents
such as the nematode Phasmarhabditis hermaphrodita
(Schneider) (Ester et al., 2003), although this is not yet
used widely as it is a relatively expensive control
method. Natural predation by mammals, amphibians,
reptiles and even fish (South, 1992; Allen, 2004) has
been documented. Invertebrates including spiders
(Nyffeler & Symondson, 2001), flatworms (Winsor
et al., 2004), Diptera (Barker et al., 2004) and carabid
beetles (Port et al., 2000) are known to predate slugs and
provide some population control. Long-term shifts in
predator populations with changing climate may also
be an important factor in determining future slug
population dynamics and range.
Slugs are ectothermic and have a permeable cuticle.
Correct environmental conditions are essential for their
activity and survival. For example, movement requires
the production of a slime trail that contains a high
proportion of water (South, 1992). Slugs must, therefore,
adapt their behaviour to conserve water and survive
long periods of adverse weather conditions by exploit-
ing cracks in the soil, moving down to warmer, wetter
soils and becoming inactive (South, 1992). The egg stage
can survive for many months if batches remain undis-
turbed, however, even given these behaviours, periods
of frost or drought result in population crashes (Choi
et al., 2006).
The environmental dependence of slugs has been
exploited to produce predictive models of slug popula-
tion dynamics and abundance. A deterministic model
of grey field slug population dynamics has been devel-
oped based upon temperature and rainfall (Choi et al.,
2004). Average daily temperature and total rainfall at a
given site can be used to predict the numbers of grey
field slugs each day. The deterministic model was
developed using initial parameter values from the
literature, which were then calibrated using data taken
from a long-term field trial in Oxfordshire (Christian
et al., 1999). Three and a half years of data from the same
site were used for validation, which explained some
81.2% of the variance in the observed data and captured
the trends in slug numbers and dynamics well across
years. However, this deterministic model was calibrated
at a local, field-level and, therefore, might not be a
suitable tool with which to make UK wide predictions.
For this reason, a more complex individual-based sto-
chastic model was developed incorporating additional
functions describing the time delays between the laying
of egg batches and their hatching time (Choi et al., 2006).
Here, the individual-based model (IbM) of slug po-
pulation dynamics is used to make regional forecasts of
population sizes and dynamics under climate change
scenarios. The initial parameter values for the IbM were
taken from the literature and the calibrated values of the
previous deterministic model. The IbM simulates grey
field slug populations by determining the favourability
of the temperature and rainfall conditions on a parti-
cular day, giving the probability of slugs moving into
cells with food, gaining weight, laying eggs and dying.
The numbers of adults, juveniles, neonates and eggs,
are simulated on each day during the model run. Each
field cell in a virtual arena is also simulated; the damage
caused by slug visits affecting the status of each cell.
The IbM has been validated against long-term field-
sampled datasets from both Letcombe Laboratory in
Oxfordshire (Christian et al., 1999) and Long Ashton
Research Station in Somerset (Prew et al., 1990), show-
ing a good correlation between observed and predicted
slug numbers and demonstrating the IbM’s ability to
predict well at different sites.
The potential effects of long-term climatic change on
the abundance of D. reticulatum in cereal crops have not,
to our knowledge, been demonstrated. However, field
studies on calcareous grasslands indicate that increased
summer rainfall could cause a decrease in the relative
numbers of D. reticulatum (Sternberg, 2000). This effect
was probably due to increased plant growth which
caused a reduction in seedling numbers, which are
the preferred food for this slug. The heating of plots
caused increases in relative slug numbers in February
and January, due to increased winter survival
(Sternberg, 2000).
Modelling studies have shown the effects of climate
change in other species. In butterflies, qualitative pre-
dictions suggest that many populations will increase
with temperature. Of 31 species simulated using pre-
dicted climatic changes, only one had reduced num-
bers, a few remained stable and the rest had increasing
numbers (Roy et al., 2001). This pattern may be true for
many other species of ectothermic animals currently
near the northern edge of their ranges in the UK, areas
of habitat available to these species will increase as UK
climate changes. For other species, near the southern
1644 J . C . W I L L I S et al.
r 2006 The AuthorsJournal compilation r 2006 Blackwell Publishing Ltd, Global Change Biology, 12, 1643–1657
limits of their range in the UK, the opposite may be true
(Thomas et al., 1999). The abundance of nine species of
cereal aphid in southern Britain is likely to decrease in
summer by 2080 (Newman, 2005). The potential for
changes in population dynamics, abundance and range
have also been demonstrated in North Sea cod (Clark
et al., 2003) and in woodland trees (Broadmeadow et al.,
2004).
UK predicted climate change is both favourable and
unfavourable for slugs, making it difficult to form clear
quantitative predictions of future slug distribution
without the use of population models. Predicted in-
creased summer drought will have an adverse effect on
the ability of slug populations to withstand dry periods
(Hulme et al., 2002). Conversely, warmer wetter winters
will favour slugs, as drought and frost are known to
limit populations. A north-west to south-east gradient
of climatic change has been predicted for the UK, with
the south-east having greater changes than the north-
west; geographic changes which may be important
when forming hypotheses about future slug popula-
tions. By considering a number of aspects of slug
population dynamics we aim to address how abun-
dance, dynamics and range will change.
High-resolution climate change scenarios, needed as
an input to the IbM of slugs (Choi et al., 2006), were
developed using a stochastic weather generator
(LARS-WG, Semenov & Barrow, 1997) and based on the
UKCIP02 climate change prediction (Hulme et al., 2002).
Materials and methods
In order to assess the effect of climate change on slug
dynamics and abundance in the UK, we developed high
spatial and temporal resolution climate change scenar-
ios to be used in conjunction with the IbM of slugs.
These scenarios satisfied the following requirements.
The scenarios should:
� be specific down to a site (1 km) or a grid cell (5 km)
with daily temporal resolution;
� be available for any location in the UK, even if
observed daily weather records are missing for the
location;
� include the full set of climate variables required by
the impacts model (i.e. minimum and maximum
temperature, precipitation and radiation);
� be based on the UKCIP02 predictions and include
predicted changes in means and climatic variability;
� contain an adequate number of years to permit risk
analysis.
The methodology is based on the LARS-WG stochastic
weather generator and links predicted changes from a
general climate model (GCM) with the parameters of
the generator (Barrow & Semenov, 1995; Barrow et al.,
1996; Semenov & Barrow, 1997). The algorithm for
spatial interpolation of LARS-WG was developed and
tested in the UK (Semenov & Brooks, 1999). Both these
features are incorporated in the latest release of the
LARS-WG v.4.0 stochastic weather generator, which
was used for this study.1
LARS-WG is based on the series weather generator
described in Racsko et al. (1991) with a detailed descrip-
tion being given in Semenov et al. (1998). LARS-WG
produces synthetic daily time series of maximum and
minimum temperature, precipitation and solar radia-
tion. The weather generator uses observed daily weath-
er for a given site to determine parameters, specifying
probability distributions for weather variables, as well
as correlations between them. The generation procedure
to produce synthetic weather time series is based on
selecting values from the appropriate distributions
using a pseudo-random number generator.
The weather generator distinguishes dry and wet
days depending on whether the precipitation is greater
than zero. Precipitation is modelled using semiempiri-
cal probability distributions for each month, for the
lengths of series of wet and dry days, and for the
amount of precipitation on a wet day. Minimum tem-
perature, maximum temperature and radiation are re-
lated to the amount of cloud cover, and so LARS-WG
uses separate wet and dry day distributions for each of
these variables. The normal distribution is used for the
temperature variables with the mean and standard
deviation varying daily according to finite Fourier
series of order three. Time auto-correlations used for
minimum and maximum temperature are constant
through the year for the particular site and the cross-
correlation of the standardized residuals from the daily
mean is preset for all sites at 0.6. Semiempirical dis-
tributions with equal interval size are used for solar
radiation (for more details see Semenov et al., 1998).
The use of semiempirical distributions gives flexibil-
ity to the generator, allowing it to model a wide variety
of distributions. Analysis of observed data from many
sites around the world showed that the shapes of most
of the variables can vary considerably (Semenov et al.,
1998). Standard distributions were only considered to
be satisfactory for temperature, where the residuals are
modelled by the normal distribution, and the annual
variation in mean and standard deviation by Fourier
series. The weather generator has been tested for
diverse climates in North America, Europe, Asia and
New Zealand and, was able to reproduce most of the
1LARS-WG is available from www.rothamsted.bbsrc.ac.uk/
mas-models/larswg.php.
I B M T O F O R E C A S T T H E E F F E C T O F C L I M AT E C H A N G E 1645
r 2006 The AuthorsJournal compilation r 2006 Blackwell Publishing Ltd, Global Change Biology, 12, 1643–1657

characteristics of the observed data well at each site
(Semenov et al., 1998; Qian et al., 2004; Semenov &
Welham, 2004).
Rather than interpolating the climate variables di-
rectly, the parameters of a weather generator for each
of the observed sites can be interpolated, with the
resulting parameters being used by the weather gen-
erator to produce synthetic daily data for the unob-
served locations. The spatial interpolation procedure
combines global and local interpolation. An initial local
interpolation, based on sites with long daily weather
records (approximately 160 weather stations were used
with � 25 years of records on average), computes for a
selected unobserved site the weighted average of each
of the weather generator parameters from three neigh-
bouring observed sites, which form a triangle contain-
ing the site. We used the Delaunay triangulation
algorithm, which divides the UK area in a set of
adjacent triangles with vertexes at the observed sites.
In the global interpolation, the monthly average pre-
cipitation, temperature and radiation data were spa-
tially interpolated, using a substantially larger number
of sites. Distributions for precipitation, temperature and
radiation of the target site, derived in local interpola-
tion, were adjusted to account for the effects of the
elevation. For this purpose, we used the gridded
monthly climatology provided by the UK Met. Office
(Perry & Hollis, 2004). The interpolation method used
was a two-stage process of multiple regression of the
climate variable (some of them were normalized first)
with geographic factors as the independent variables,
including an elevation along with geographical coordi-
nates, followed by interpolation of the model residuals.
The regression surface and the interpolated residual
surface were added together to get the final gridded
datasets. The monthly values of precipitation, mini-
mum and maximum temperature and sunshine hours
are available for 5 km grid cells for the UK. 4400 sites
were used to interpolate monthly precipitation, 430 sites
for temperature and 290 sites for sunshine hours.
After local interpolation and global adjustment, the
resulting parameter file can be used by LARS-WG to
generate baseline synthetic daily weather data series of
any length for the target site.
UKCIP02 scenarios
The UKCIP02 climate change scenarios are based on a
series of climate modelling experiments completed by
the Hadley Centre, using HadCM3 and HadRM3 cli-
mate models (Hulme et al., 2002). The scenarios, based
on global emissions scenarios published by the Inter-
governmental Panel on Climate Change (Nakicenovic &
Swart, 2000), describe four alternative future climates
for the UK labelled, respectively, low emissions (LO),
medium-low emissions (Med-LO), medium-high emis-
sions (Med-HI) and high emissions (HI) and available
for three time periods 2020, 2050 and 2080.
The HadCM3 climate model is based on physical
principles, describing the transport of mass and energy;
these equations are solved at 30 min intervals for a
number of points over a globe-wide grid. In the
HadCM3 model this grid is 2.51 in latitude by 3.751 in
longitude, corresponding to about 265 km� 300 km
over the UK. The UKCIP02 scenarios are based on
the regional climate model HadRM3, which has a hor-
izontal resolution of 0.441� 0.441 (50 km), and a time step
of 5 min (Fig. 1). HadRM3 takes boundary conditions
from coarser resolution HadCM3 simulations and pro-
vides a higher spatial resolution of the local topography
and more realistic simulations of fine-scale weather
features. For each grid-cell UKCIP02 scenarios provide
changes in monthly mean variables, such as monthly
precipitation, monthly mean minimum and maximum
temperature and monthly mean radiation. These
changes are provided for each time period 2020, 2050
and 2080 and for each emission scenarios LO, Med-LO,
Med-HI and HI.
Fig. 1 The spatial resolution of the HadRM3 climate model
(50� 50 km2 grid cells), highlighted cells were used for simulat-
ing UKCIP02 scenarios in this study. Cells in black were used for
between site comparisons.
1646 J . C . W I L L I S et al.
r 2006 The AuthorsJournal compilation r 2006 Blackwell Publishing Ltd, Global Change Biology, 12, 1643–1657
Construction of climate scenarios using LARS-WG
Daily climate change scenarios were generated by the
LARS-WG stochastic weather generator, based on UK-
CIP02 projections and daily output from the HadCM3
climate model. The construction of a daily climate
change scenario was a two-step procedure. First, for a
selected site in the UK we calculated LARS-WG para-
meters for baseline weather, using interpolation proce-
dure described above. The second step was to derive
changes in mean and variability of climate character-
istics for the site, using monthly UKCIP02 projections
for temperature, precipitation and radiation and daily
precipitation output from HadCM3. The mean changes
in total monthly precipitation, changes in monthly
mean maximum and minimum temperature and
changes in monthly mean radiation were required.
These data were available from the UKCIP02. Changes
in duration of monthly mean dry and wet spells were
calculated using HadRM3 daily precipitation. The
LARS-WG scenario file was used to adjust baseline
parameters, producing new LARS-WG parameters for
the selected site and climate change scenario. These
parameters were then used to generate daily data based
on a particular climate-change scenario.
Modelling slug dynamics
Fifteen, 50 km grid squares were selected to represent
an even distribution of sites across the UK (Fig. 1).
LARS-WG was then used to generate daily climate
scenarios for each of the grid squares. Scenarios were
generated for baseline (1960–1990s), 2020s, 2050s and
2080s time periods for both LO and HI. Baseline cli-
matic conditions are representative of current weather
in the UK and can therefore be used to indicate current
slug populations across the UK enabling us to draw
comparisons. Each scenario contained 70 years of
weather data and was used to simulate grey field slug
population dynamics using the slug IbM. Numbers of
adults, juveniles, neonates and eggs were set to 32, 197,
164 and 600 respectively on 1st March every other year
as slug populations are reset each year as a result of
anthropogenic disturbances such as cultivations. Gen-
eration numbers were also reset to 1. In order to exclude
effect of the starting population values, the population
statistics were calculated for each second year, resulting
in 35 replicates at each site for each scenario.
Metrics and statistical analyses
IbM for slugs is a stochastic simulation model and
produces stochastic output. To compare various simu-
lation runs we have selected and used the following
slug population-dynamic statistics.
Extinction
Extinction was defined as when a population has no
adults, juveniles, neonates or eggs on the last day of
every other year in the simulation run. We calculated
the percentage of replicates in which the population
became extinct for each site. Extinction gave an indica-
tion of the current and future range of grey field slug
populations. Areas with low extinction are likely to
have persisting slug populations, those with high ex-
tinction rates may experience few years with slug
problems as slugs do not survive well at these sites.
Changes in extinction rates demonstrate the potential
for range shifts as they show areas where slugs are more
likely to survive and therefore where populations will
persist.
Generation number
In order to demonstrate changes in the population
dynamics of the grey field slug with climate, we la-
belled individual slugs with a generation number, start-
ing with 1 for slugs used to initialize the simulation run.
The maximum generation number reached at each site,
under each climate scenario, were used for analysis. The
maximum number of generations reached in a year
were then compared between sites and scenarios, using
the Mann–Whitney U-test as the data were not normally
distributed. Previous research has shown that, in slugs,
a larger number of generations are reached in more
favourable years (Hunter & Symonds, 1971). Therefore,
we consider this as an indicator of favourability, de-
scribing how population dynamics in this species might
alter with climate.
Population peaks
Here, we investigated the number of population peaks
in a year as they have been previously linked to the
number of generations in a year and because they reflect
environmental favourability. Greater numbers of popu-
lation peaks indicate whether the local environment is
favourable for slugs to reproduce. A relationship estab-
lished from the literature enables us to define a link
between generations and peaks forming a robust defini-
tion of a peak in terms of a threshold population size
and a duration over which a threshold population size
is exceeded (Hunter & Symonds, 1971).
We defined a population peak by systematically
varying the duration and threshold value of peak, and
comparing this with the maximum number of genera-
I B M T O F O R E C A S T T H E E F F E C T O F C L I M AT E C H A N G E 1647
r 2006 The AuthorsJournal compilation r 2006 Blackwell Publishing Ltd, Global Change Biology, 12, 1643–1657

tions in a given simulation run showing the most
accurate peak definition. Using this method we defined
a population peak as a period when the average num-
ber of juveniles plus adults exceeded a threshold of five
per m2 for a period of 6 consecutive days.
The number of peaks under baseline conditions was
compared with the number of peaks predicted under
scenarios of climate change using Mann–Whitney U-tests
as the data were not normally distributed.
Slug-days
We calculated the accumulated number of slug-days in
each season by summing the daily totals of adults and
juveniles across days. Therefore, slug-days for any
given scenario are:
slug-days ¼XSk
i¼1
Ai þ Jið Þ;
where Ai and Ji are the numbers of adults and juveniles,
respectively, on day 5 i and Sk is a number of days
in a season k 5 1 . . . 4. Spring was defined as March–
May, summer as June–August, autumn as September–
November and winter as December–February. We
compared the number of slug-days predicted for dif-
ferent scenarios of climatic change with the number
generated for baseline data using a two-tailed t-test, for
each season.
The number of slug-days at each site under each
climate change scenario demonstrates how slug
abundance and more importantly, slug damage may
change with climate. As slug abundance increases, crop
damage is also likely to increase, as does the probability
of populations persisting at a given site. Variations in
slug-days between seasons are also significant with
respect to the timing of crop vulnerability to slug
damage.
Years over a threshold for damage
We analysed the percentage of years in which there is a
daily total of more than 44 adults plus juveniles per m2
in a season. This threshold represents the population
size at which economic damage to wheat crops is
possible given the correct environmental conditions,
from our experience of slugs in the field. Using changes
in the percentage of years with spring, summer, autumn
or winter days over a threshold for damage, we showed
how grey field slug abundance and damage may
change with climate.
We analysed all results in GenStats (Payne et al.,
2005), which then been interpolated and plotted using
MapInfo to visualize changes across the UK. After
analysis of the plotted maps, we chose two sites for
regional comparison and five for comparison between
baseline and 2080 HI scenarios, indicted in Fig. 1. We
interpolated data using the Natural Neighbour algo-
rithm from Vertical Mapper.
Results
Under baseline climatic conditions, the most favourable
conditions for grey field slugs in the UK are the south-
west of England and Wales; this was reflected in all of
the measures of population dynamics, abundance and
range. By 2080, under both HI and LO scenarios, the
north and west of Scotland will have the most favour-
able conditions for this species; the most favourable
areas having shifted northwards. The results also show
that, for some of the measures considered, the varia-
bility in environmental favourability across the UK may
also change. Currently, most measures show that there
is a relatively smooth gradient of change in favourabil-
ity across the country, however, by 2080 both very
favourable areas and very adverse areas may become
increasingly isolated. Generally the results show
broadly the same trends, showing that environmental
favourability for this species is reflected by all the
measures chosen.
Extinctions
When the percentage of replicates in which populations
become extinct under baseline climatic conditions is
mapped, the west of the UK has the lowest extinction
rates (0–10%), with the exception of the central-western
coast of Scotland. Eastern Scotland has high extinction
rates (over 91%; Fig. 2a). By 2020, under both LO and
HI scenarios, extinction rates increase in the east and
in central England from 40% to 60% to at least 64%
(Fig. 2b). By 2050 extinction rates in southern Wales and
south-western England will have increased to at least
38% (Fig. 2c), a trend which becomes more pronounced
by 2080 (Fig. 2d). The western half of Scotland and
northern Wales is predicted to have extinction rates of
under 10% by 2080.
Generations
Under baseline conditions D. reticulatum populations in
the south-west of England and Wales reach 3.9 genera-
tions a year, with the south-west and northern tip of
Scotland also reaching relatively high generation num-
bers. Populations in the east of Scotland reach just 1–1.2
generations (Fig. 3a). Under the 2020s emissions scenar-
ios the maximum generation number reached will
1648 J . C . W I L L I S et al.
r 2006 The AuthorsJournal compilation r 2006 Blackwell Publishing Ltd, Global Change Biology, 12, 1643–1657

decrease throughout most of England and southern
Wales (Fig. 3b). By 2080 the areas of Scotland which
had high generation numbers under baseline conditions
will spread to meet each other, covering the whole of
the western half of Scotland. Areas of high numbers of
generations remain in northern Wales (Fig. 3d).
All of the five sites chosen for statistical comparison
between baseline and 2080 HI scenarios showed sig-
nificant changes in the maximum number of genera-
tions reached (Table 2). The north-west and east of
Scotland showed an increase in the maximum genera-
tion number reached, whereas south-western and cen-
tral England and the west of Wales reached decreasing
maximum generation numbers (Table 1).
Peaks
Under baseline conditions the north of Scotland, wes-
tern England and Wales show the highest number of
population peaks, around 1.9–2.1 peaks yr�1. Eastern
Scotland reached the lowest maximum number of po-
pulation peaks in a year; just 0.14–0.33. Under the 2050
LO scenario, much of the UK will experience less than 1.1
population peaks yr�1, with the western coast having
higher numbers. The south-west of England will have
the highest number of population peaks. By 2080 the
western coast of Scotland and the north-western tip of
Wales will have the highest number of population
peaks, the rest of the UK will have less than 1.3 popula-
10
20
30
40
50
60
70
80
90
100
Baseline 2020 LO
2020 HI
2050 LO 2080 LO
2050 HI 2080 HI
(a)
(c) (e) (g)
(b) (d) (f)
Fig. 2 (a–g) Maps showing UK wide % of years in which populations became extinct under: baseline, 2020 LO, 2020 HI, 2050 LO, 2050
HI, 2080 LO and 2080 HI-emissions scenarios, respectively.
I B M T O F O R E C A S T T H E E F F E C T O F C L I M AT E C H A N G E 1649
r 2006 The AuthorsJournal compilation r 2006 Blackwell Publishing Ltd, Global Change Biology, 12, 1643–1657

1.2
1.5
1.8
2.1
2.4
2.7
3.0
3.3
3.6
5.0
Baseline 2020 LO
2050 LO 2080 HI
(a) (b)
(c) (d)
Fig. 3 (a–d) Maps showing the predicted maximum generation number reached across the UK of slugs under baseline, 2020 LO, 2050
LO and 2080 HI-emissions scenarios, respectively, in average number of generations in a year.
Table 1 A comparison of site 142, in Scotland, with site 369, in west-Wales under both baseline and 2080 HI-emission scenarios
Measures Generations Peaks
Slug-days
Spring Summer Autumn Winter
Baseline 174.5, o0.001 354.5, o0.001 �2.85, 0.006 �1.92, 0.06 �2.72, 0.01 �2.38, 0.023
(1.5,2.9) (0.9,1.8) (625,2065) (534,1639) (373,2781) (24,751)
2080 HI 167.0, o0.001 357, o0.001 2.20, 0.031 3.00, 0.004 4.96, o0.001 3.08, 0.003
(3.3,2.0) (2.1,1.2) (2349,1277) (1729,544) (2798,240) (482,140)
U-test statistics and its P-value are presented, along with means given in brackets (142 followed by 369), probabilities which are not
significant at the 5% level are in bold font.
1650 J . C . W I L L I S et al.
r 2006 The AuthorsJournal compilation r 2006 Blackwell Publishing Ltd, Global Change Biology, 12, 1643–1657

tion peaks yr�1. The main shift northwards in areas
which reach the highest numbers of population peaks
will occur between the 2050s and 2080s, although
decreases in population peaks in much of eastern and
central England will occur by the 2050s (Fig. 4).
When baseline and 2080 HI scenarios were compared
all five sites showed significant changes in the number
of population peaks per year. The same trends were seen
to those shown when the maximum generation number
reached was considered, with the north-west and east of
Scotland having increased numbers of population
peaks, whereas south-western and central England
and the west of Wales showed decreases (Table 1).
Slug-days
Under spring baseline conditions the west of England
and Wales have the highest numbers of slug-days. In
0.2
0.4
0.6
0.8
1.0
1.2
1.4
1.6
1.8
2.5
Baseline 2050 LO
2080 HI
(a) (b)
(c)
Fig. 4 (a–c) Maps showing the numbers of population peaks predicted across the UK under: baseline, 2050 LO and 2080 HI-emissions
scenarios, respectively, in average number of population peaks in a year.
I B M T O F O R E C A S T T H E E F F E C T O F C L I M AT E C H A N G E 1651
r 2006 The AuthorsJournal compilation r 2006 Blackwell Publishing Ltd, Global Change Biology, 12, 1643–1657

summer, autumn and winter areas of high slug-days
spread northwards slightly into south-west Scotland
and northern Wales. Slugs-days are highest in autumn
reaching 1373 slugs m�2, in all other seasons they reach
just 176 slugs m�2 (Fig. 5a–d).
Under the 2080 HI scenario western and central
Scotland, and northern Wales will have the highest
number of slug-days in spring (4141 slugs m�2). The
north and east of Scotland will have the least numbers
of slug-days (o8 slugs m�2). In summer, projected areas
of lower numbers of grey field slugs will spread into the
east of the UK. The north-west of Scotland, however,
will have significantly higher numbers of slug-days
(P 5 0.01). In autumn, areas with high slug-days will
contract into the north-west of Scotland and the north-
ern tip of Wales. By winter the areas with high numbers
of slug-days will expand slightly. Areas with high
numbers of slug-days are expected to cover much of
central Scotland and the tip of northern Wales. All other
areas are expected to have small populations of this
species.
When the five separate sites were compared statisti-
cally, the south-west of England and west of Wales
showed the same pattern of change with significantly
fewer slug-days in summer, autumn and winter. Slug-
days in spring did not change. Central England had
significant decreases in slug-days in all other seasons.
Slug-days increased in the north-west of Scotland and
remained the same in eastern Scotland in all seasons
when baseline predictions are compared with 2080 HI
scenario (see Table 2 for means, significance levels and
trends).
Years over a threshold for damage
When the results for the percentage of years which
exceed an economic damage threshold are considered
(a daily total of more than 44 adults plus juveniles m�2,
similar seasonal patterns of change are seen between
autumn and winter under both baseline and 2080 HI
scenarios.
Under baseline conditions spring has a high per-
centage of years over the damage threshold around
south-eastern Wales, and in south-western and north-
ern Scotland. In summer, the areas with a high percen-
tage of years over threshold disappear in northern
Scotland, reappearing again in autumn. A similar pat-
tern is seen in winter with areas with high damage
levels on most of the west coast (Fig. 6a–d).
Under the 2080 HI scenario, in spring the western half
of the UK, will have a large percentage of years over the
threshold for damage from mid-Wales northwards. By
summer the south of Wales and south-western England
are expected to have a low percentage of years over a
damage threshold, with high percentages on the west
coast of north Wales. However, no change in autumn to
Spring
(a)
300 600 900 1200 1500 1900 2300 2700 1000033500
(e)
Summer Summer
(b)
Autumn Winter Autumn Winter
(h) (g)
(f)
(d) Spring
(c)
Fig. 5 (a–h) Maps showing the numbers of slug-days predicted across the UK, (a-d) show spring, summer, autumn and winter under
baseline climatic conditions and (e-h) show spring, summer, autumn and winter under a 2080 HI-emissions scenario, in slugs per m2.
1652 J . C . W I L L I S et al.
r 2006 The AuthorsJournal compilation r 2006 Blackwell Publishing Ltd, Global Change Biology, 12, 1643–1657
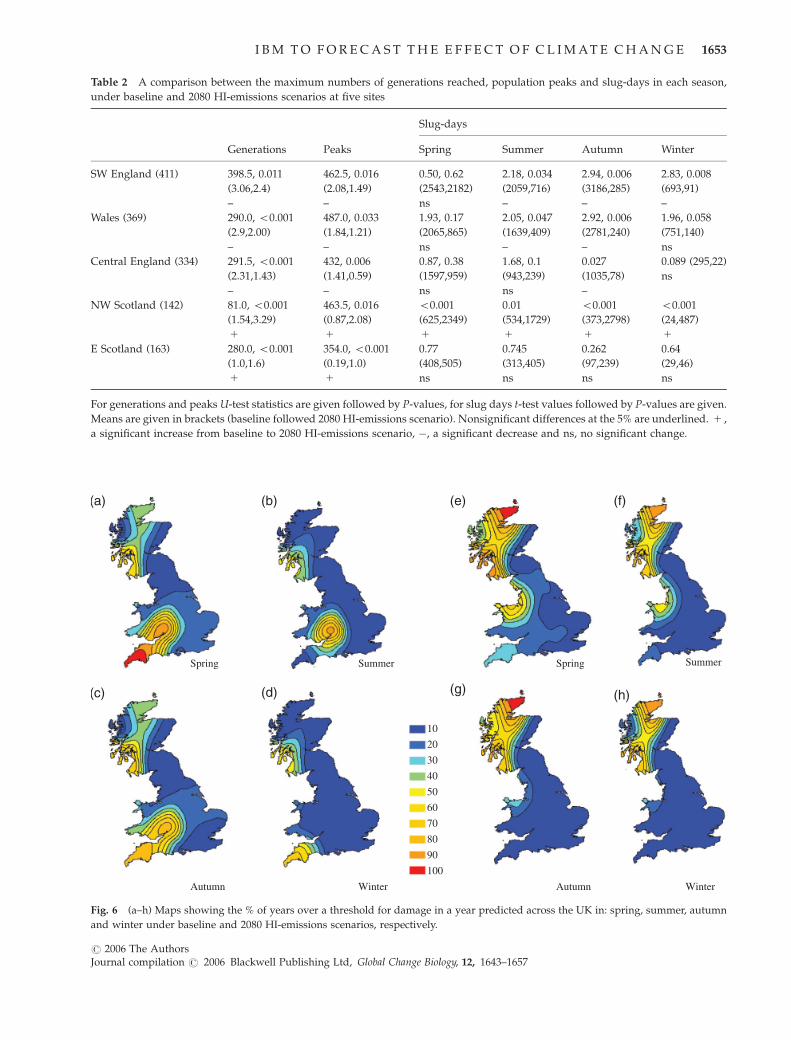
Table 2 A comparison between the maximum numbers of generations reached, population peaks and slug-days in each season,
under baseline and 2080 HI-emissions scenarios at five sites
Generations Peaks
Slug-days
Spring Summer Autumn Winter
SW England (411) 398.5, 0.011 462.5, 0.016 0.50, 0.62 2.18, 0.034 2.94, 0.006 2.83, 0.008
(3.06,2.4) (2.08,1.49) (2543,2182) (2059,716) (3186,285) (693,91)
– – ns – – –
Wales (369) 290.0, o0.001 487.0, 0.033 1.93, 0.17 2.05, 0.047 2.92, 0.006 1.96, 0.058
(2.9,2.00) (1.84,1.21) (2065,865) (1639,409) (2781,240) (751,140)
– – ns – – ns
Central England (334) 291.5, o0.001 432, 0.006 0.87, 0.38 1.68, 0.1 0.027 0.089 (295,22)
(2.31,1.43) (1.41,0.59) (1597,959) (943,239) (1035,78) ns
– – ns ns –
NW Scotland (142) 81.0, o0.001 463.5, 0.016 o0.001 0.01 o0.001 o0.001
(1.54,3.29) (0.87,2.08) (625,2349) (534,1729) (373,2798) (24,487)
1 1 1 1 1 1
E Scotland (163) 280.0, o0.001 354.0, o0.001 0.77 0.745 0.262 0.64
(1.0,1.6) (0.19,1.0) (408,505) (313,405) (97,239) (29,46)
1 1 ns ns ns ns
For generations and peaks U-test statistics are given followed by P-values, for slug days t-test values followed by P-values are given.
Means are given in brackets (baseline followed 2080 HI-emissions scenario). Nonsignificant differences at the 5% are underlined. 1 ,
a significant increase from baseline to 2080 HI-emissions scenario, �, a significant decrease and ns, no significant change.
Spring
(a)
Spring
(e) (b)
Autumn AutumnWinter Winter
SummerSummer
(h) (g)
(f)
(c) (d)
10
20
30
40
50
60
70
80
90
100
Fig. 6 (a–h) Maps showing the % of years over a threshold for damage in a year predicted across the UK in: spring, summer, autumn
and winter under baseline and 2080 HI-emissions scenarios, respectively.
I B M T O F O R E C A S T T H E E F F E C T O F C L I M AT E C H A N G E 1653
r 2006 The AuthorsJournal compilation r 2006 Blackwell Publishing Ltd, Global Change Biology, 12, 1643–1657

winter seasonal pattern is expected between baseline
and 2080 HI scenarios (Fig. 6e–g).
Discussions
By combining climate change predictions, the LARS-
WG stochastic weather generator, and an IbM of slug
population dynamics we have shown that by 2080
under both LO and HI scenarios, the areas of the
UK which are most favourable for populations of
D. reticulatum might be expected to shift northwards.
Current predictions of climate change for the UK
suggest that winters will become warmer and wetter
and summers hotter and drier. Warmer, wetter winters
will favour D. reticulatum populations due to a decrease
in the incidence of frosts. However, the drier summers
will have an adverse effect on grey field slug popula-
tions. These conflicting driving forces make it difficult
to make statements about future grey field slug distri-
butions in the UK. Population models are an ideal tool
for answering questions about future slug distribution,
abundance and range, that are so confounded.
Under current, baseline climatic conditions, areas of
the south-west of England and Wales have the ideal
warm, wet conditions for slug activity, yielding signifi-
cantly more generations, population peaks and slug-
days than elsewhere in the UK. Areas further north are
currently too cold for slugs, with periods of frost that
have been known to cause population crashes. Further
east, the UK becomes too dry to maintain populations,
because slugs require moisture for the production of
slime for movement, and will only lay eggs in soils
above 25% soil moisture (Carrick, 1942).
Areas of north-west Scotland are, therefore, likely to
suffer increased numbers of this species, which may in
turn cause increased crop damage. The south-west and
Wales will have significantly fewer population peaks,
generations and slug-days in summer autumn and
winter and are therefore likely to have decreased slug
problems.
Expectations for D. reticulatum in relation to climatechange
From our simulations, there are clear spatial trends
in the abundance, range and dynamics of D. reticulatum
across the UK with different scenarios of climate
change. Areas of the UK with the most favourable
conditions for D. reticulatum will shift northwards from
the south-west of England and Wales into northern
Wales and western Scotland. The north-west of Scotland
was found to have significantly more slug-days, gen-
erations and population peaks than west Wales by 2080
under a HI scenario, a reversal of the trend seen under
baseline conditions. These results are likely to be a
reflection of the predicted north-west to south-east axis
of climatic change (Hulme et al., 2002), which suggests
that the north-west of Scotland will have less extreme
changes in climate than the south-east of England.
These results are consistent with the prediction that
the north-west of Scotland will have less severe climatic
changes than south-east England (Hulme et al., 2002).
Population metrics considered
Qualitatively, extinctions and the percentage of years
over a threshold for damage follow similar patterns of
spatial change. Generations and peaks also show the
same, significant patterns of change. Qualitatively these
patterns are similar to those predicted for extinctions
and years over a threshold for damage. When slug-days
are considered the situation is more complex, however,
with no significant change in slug-days in eastern
Scotland. This suggests that, while slug population
dynamics might change in this area, yearly abundance
will not alter significantly.
Although all the population metrics considered de-
monstrate visible changes in grey field slug abundance
and/or range and/or dynamics by 2080, the time when
these changes become apparent varies with each metric.
Changes in the rate of extinctions are evident under the
2020s LO scenario, whereas the northward shift of
population peaks is not evident until 2080 under a HI
scenario. This may be a reflection of the varying sensi-
tivity of the different measures to climatic change or the
relative effects of different aspects of climatic change
upon D. reticulatum population biology.
Impact on arable agriculture
The seasonal timing of slug population changes will be
crucial for the observed intensity of damage to field
crops. Slug damage to crops, such as wheat, occurs
mainly at sowing when the endosperm of the seed
may be eaten, in the early stages of growth and after
germination when the tops of new shoots can be eaten
away (South, 1992). We found the predicted number of
slug-days over the season changed with the prevailing
environmental conditions. D. reticulatum currently has
peaks of breeding activity at the main times of arable
crop sowing, in the spring and autumn when climatic
conditions for breeding are optimal (Hunter & Symonds,
1971). This is when populations reach the highest num-
ber of predicted slug-days, under both baseline and 2080
HI scenarios. In winter and summer there are few areas
in which grey field slug populations are predicted to be
sustained at high levels, and in these areas there is likely
to be little drought and few frosted days.
1654 J . C . W I L L I S et al.
r 2006 The AuthorsJournal compilation r 2006 Blackwell Publishing Ltd, Global Change Biology, 12, 1643–1657
At sites with high numbers of slug-days in a parti-
cular season, the slug numbers may either have been
sustained at an intermediate level over the whole
season or have a large peak in numbers during that
season. In sustained populations, slugs still may not
cause crop damage. At sites where slug abundance
peaks over a threshold, however, economic damage
may occur very rapidly. Predictions for the percentage
of years over a threshold for damage currently have a
similar pattern of distribution to that shown for the
predicted number of slug-days under baseline condi-
tions at most sites. Where there are high predicted
numbers of slug-days populations show high peaks in
abundance and consequently a high percentage of years
over a threshold for damage. At some sites in south-
west England and in Wales, however, spatial differences
between these metrics suggest that populations of this
species exist at a steady intermediate level throughout
the year and do not peak over the threshold for damage.
By 2080, slug-days and the percentage of years over a
damage threshold should become more closely related
right across the UK.
An interesting, related finding was that the variation
in environmental favourability for slugs across the
country also changed under all of the climate metrics.
Under baseline conditions there appears to be a smooth
gradient between areas of high and low favourability.
However, as the climate changes areas that are rela-
tively favourable for this species become more isolated
with fewer areas of intermediate favourability. This
means that we expect most regions of the country either
have periods of severe slug damage problems or no
slug damage at all.
Such climate-driven changes in pest-species abun-
dance, range and population dynamics will likely be
superimposed on other climate-driven effects within
arable agriculture. Increases in the thermal growing
seasons will influence both when it is possible to grow
crops in the UK and the varieties and species of crops
grown (Davies et al., 1997; Hulme et al., 2002). Such
changes will alter the severity of slug damage in the
field. For example, although greater numbers of
D. reticulatum are predicted in the western half of
Scotland, few crops are currently grown there and
unless this changes, the predicted slug increases will
not cause significant economic problems.
Future climate may also affect the interactions be-
tween D. reticulatum and predators. The carabid beetle,
Pterostichus melanarius is an important predator that is
thought to be significant in regulating slug populations
(Bohan et al., 2000; Symondson et al., 2002). From a
study of the life cycles of four species of carabids,
Butterfield (1996) suggested that the response of car-
abids to changing climate would be a change in dis-
tribution rather than through physiological adaptation.
Fossil evidence also suggests that the composition of
British carabid fauna has changed in the past in relation
to climate and it is reasonable to assume that it may do
the same in the future (Coope, 1978). If the abundance,
range and dynamics of P. melanarius change signifi-
cantly with respect to slugs, then our predictions of
slug damage in the field would be improved by incor-
porating carabid predation.
Slug populations are also controlled by generalist
predators such as amphibians, birds, badgers and
hedgehogs (Runham & Hunter, 1970). There have been
a number of studies on the impact of climate change
upon migratory birds showing that the timing of mi-
gration may alter and even cease with climatic change
(Crick, 2004). Changes in reproductive output have also
been noted (Crick, 2004). It is as yet unclear how the UK
distribution of bird species will change with climate
making it difficult to draw any strong conclusions about
the knock on effects on slug predation. The situation is
likewise complicated for amphibian distribution. Many
amphibian populations are declining throughout the
world although the cause is unclear with a large num-
ber of explanations being explored to explain these
declines (Blaustein et al., 2004). Five out of seven studies
quoted in Beebee & Griffiths (2005) showed changes in
breeding phenology in relation to climate change. How-
ever, the authors also state that it is uncertain whether
climate change is having an effect on amphibian de-
clines. The effects of climate change upon mammalian
species in the UK are less well studied and little
information is available regarding the likely future
distribution and abundance of hedgehogs or badgers.
Changes in slug predator populations with climate will
have knock on effects for the natural control of slug
populations and future research should be considered
when forecasting range, dynamics and abundance.
Assumptions and uncertainties
The IbM models the case of a single field with uniform
initial conditions and uniform weather over the field.
Emigration is balanced by immigration and effectively
the field is a closed system. For local simulation runs,
this assumption would be unrealistic for predicting
D. reticulatum population dynamics. However, when
considering large-scale regional and temporal changes
in slug dynamics, the importance of local field hetero-
geneity and migration events are less important for
generating comparative population metrics.
The model does not allow for metapopulation ‘rescue
effects’ (Choi et al., 2006) where local heterogeneity in
environmental conditions and dispersal between fields
will allow some populations to persist even under
I B M T O F O R E C A S T T H E E F F E C T O F C L I M AT E C H A N G E 1655
r 2006 The AuthorsJournal compilation r 2006 Blackwell Publishing Ltd, Global Change Biology, 12, 1643–1657
predicted conditions of a 100% extinction probability.
Long-term climatic conditions that produce high extinc-
tion rates might, though, eventually lead to the eradica-
tion of D. reticulatum in these areas and consequently,
we used qualitative changes in extinction rate to indi-
cate how the range of D. reticulatum will alter with
climate.
Previous studies have linked the number of genera-
tions and peaks, with the number of peaks directly
proportional to the number of generations at a site, in
a given year. The numbers of population peaks indicate
the times of year at which there are high numbers of
slugs and hence how often crops are vulnerable. The
timing of peaks may also change with their number, as
many crops are vulnerable at specific times of the year,
the timing of peaks may be crucial in terms of crop
damage. The number of slug generations has also been
linked to environmental favourability at a given site. We
have found, through simulation, that a period of 6 days
with a minimum of 5 slugs m�2 can be used as an
indicator of a slug population peak. Using this defini-
tion, our results indicate that the predicted number of
population peaks is lower than expected from the
number of generations.
The range in the number of population peaks, across
scenarios and time slices, (1.57) is lower than that for the
number of generations (2.9), indicating that the relation-
ship between peaks and generations, particularly under
climate change, is not as straightforward as Hunter &
Symonds (1971) reported. This warrants further inves-
tigation using IbMs and experimental approaches.
However, both peaks and generations did show the
same qualitative and quantitative trends when shifts
with climate change were considered at five sites across
the country.
D. reticulatum is a highly adaptable species that can
exploit the disturbed habitat of arable fields. The cli-
mate change metrics we present in this paper are
subject to a basic assumption that D. reticulatum popu-
lation rates and responses to temperature and moisture
are similar across the UK and will not change through
time. However, it is likely that changes in local condi-
tions and long-term climate will result in local adapta-
tion selecting for D. reticulatum, with distinct population
rate parameters. Local variations in the fecundity of the
slug Arion lusitanicus have been noted by Briner &
Frank (1998), and varying fecundity with environmen-
tal conditions has also been found in the snail Cepaea
nemoralis L. (Wolda & Kreulen, 1973). If slugs are able to
adapt to adverse local conditions, then the predictions
we have made need to be adjusted. However, because
similar patterns of change were predicted for all mea-
sures considered, we believe it is likely that grey field
slug dynamics and abundance will change as predicted,
potentially affecting the future distribution and inten-
sity of slug damage to crops. Future IbM-based predic-
tions of changes in D. reticulatum abundance, range and
population dynamics would need to take into account
the local adaptation of this species were this to become
apparent.
Acknowledgements
JCW was supported by the BBSRC-CASE fellowship; she thanksDe Sangosse Ltd for funding and Julian Park, University ofReading, for guidance and support. We thank UKCIP for pro-viding access to UKCIP02 scenarios. We thank Stephen Powersfor advice on statistical analysis. Rothamsted Research receivesgrant-aided support from the Biotechnology and BiologicalSciences Research Council of the United Kingdom.
References
Allen JA (2004) Avian and mammalian predators of terrestrial
gastropods. In: Natural Enemies of Terrestrial Molluscs (ed
Barker GM), pp. 1–36. CAB International, Oxford.
Barker GM (1991) Biology of slugs (Agriolimacidae and Arioni-
dae, Mollusca) in New-Zealand Hill Country Pastures. Oeco-
logia, 85, 581–595.
Barker GM, Knutson L, Vala J et al. (2004) Overview of the
biology of marsh flies (Diptera: Sciomyzidae) with special
reference to predators and parasitoids of terrestrial gastro-
pods. In: Natural Enemies of Terrestrial Molluscs (ed. Barker
GM), pp. 159–226. CAB International, Oxford.
Barrow EM, Hulme M, Semenov MA (1996) Effect of using
different methods in the construction of climate change sce-
narios: examples from Europe. Climate Research, 7, 195–211.
Barrow EM, Semenov MA (1995) Climate change scenarios with
high spatial and temporal resolution for agricultural applica-
tions. Forestry, 68, 349–360.
Beebee TJC, Griffiths RA (2005) The amphibian decline crisis: a
watershed for conservation biology? Biological Conservation,
125, 271–285.
Blaustein AR, Romansic JM, Scheessele EA et al. (2004) Inter-
specific variation in susceptibility of frog tadpoles to the
Pathogenic Fungus Batrachochytrium dendtobatidis. Conser-
vation Biology, 19, 1460–1468.
Bohan DA, Bohan AC, Glen DM et al. (2000) Spatial dynamics of
predation by carabid beetles on slugs. Journal of Animal Ecology,
69, 367–379.
Briner T, Frank T (1998) Egg laying activity of the slug Arion
lusitanicus Mabille in Switzerland. Journal of Conchology, 36,
9–15.
Broadmeadow M, Ray D, Sing L et al. (2004) Climate change and
British woodland: what does the future hold? Forest Research
Annual Report and Accounts 2002–3, Forestry Commission,
Edinburgh, 70–83.
Butterfield J (1996) Carabid life-cycle strategies and climate
change: a study on an altitude transect. Ecological Entomology,
21, 9–16.
Carrick R (1942) The grey field slug Agriolimax Agrestis L., and its
environment. Annals of Applied Biology, 29, 43–55.
1656 J . C . W I L L I S et al.
r 2006 The AuthorsJournal compilation r 2006 Blackwell Publishing Ltd, Global Change Biology, 12, 1643–1657
Choi YH, Bohan DA, Potting RJP et al. (2006) Individual based
model of slug population and spatial dynamics. Ecological
Modelling, 190, 336–350.
Choi YH, Bohan DA, Witshire CW et al. (2004) Modelling
Deroceras reticulatum (Gastropoda) population dynamics based
on daily temperature and rainfall. Agriculture, Ecosystems and
Environment, 103, 519–525.
Christian DG, Bacon ETG, Brockie D et al. (1999) Interactions of
straw dispersal methods and direct drilling or cultivation on
winter wheat (Triticum aestivum) grown on a clay soil. Journal of
Agricultural Engineering Research, 150, 185–201.
Clark RA, Fox CJ, Viner D et al. (2003) North Sea cod and climate
change – modelling the effects of temperature on population
dynamics. Global Change Biology, 9, 1669–1680.
Coope GR (1978) Constancy of insect species versus inconstancy
of Quaternary environments. In: Diversity of Insect Faunas (eds
Mound LA, Waloff N), pp. 176–187. Symposia of The Royal
Entomological Society, Blackwell, Oxford.
Crick HQP (2004) The impact of climate change on birds. Ibis, 146
(Suppl. 1), 48–56.
Davies A, Jenkins T, Pike A et al. (1997) Modelling the predicted
geographic and economic response of UK cropping systems to
climate change scenarios: the case of potatoes. Annals of
Applied Biology, 130, 167–178.
Ester A, Huiting HF, Molendijk LPG et al. (2003) The rhabditid
nematode Phasmarhabditis hermaphrodita Schneider as a poten-
tial biological agent to control field slugs Deroceras reticulatum
(Muller) in Brussels sprouts. BCPC Symposium Proceedings:
Slugs and Snails Agricultural, Veterinay and Environmental Per-
spectives, 80, 313–318.
Garthwaite DG, Thomas MR (1996) The usage of molluscicides
in agriculture and horticulture in Great Britain over the last 30
years. BCPC Symposium Proceedings: Slug and Snail Pests In
Agriculture, 66, 39–46.
Hulme M, Jenkins GJ, Lu X et al. (2002) Climate Change Scenarios
for the UK: The UKCIP02 Scientific Report. Tyndall Centre for
Climate Change Research and School of Environmental
Sciences, University of East Anglia, Norwich.
Hunter PJ, Symonds BV (1971) The Leap-Frogging Slug. Nature,
229, 349.
Nakicenovic N, Swart R (2000) Emissions Scenarios 2000. Special
Report of the Intergovernmental Panel on Climate Change. Cam-
bridge University Press, Cambridge.
Newman J A (2005) Climate change and the fate of cereal aphids
in Southern Britain. Global Change Biology, 11, 940–944.
Nyffeler M, Symondson WOC (2001) Spiders and harvestmen as
gastropod predators. Ecological Entomology, 26, 617–628.
Payne RW, Harding SA, Murray DA et al. (2005) The Guide to
GenStat Release 8, Part 2: Statistics. VSN International, Oxford.
Perry M, Hollis D (2004) The Generation of Monthly Gridded
Datasets for Range of Climatic Variables over the United Kingdom.
Met Office, Exeter, UK.
Port GR, Glen DM, Symondson WOC (2000) Success in biological
control of terrestrial molluscs. In: Biological Control: Measures of
Success (ed. Gurr G, Wratten SD), pp. 137–157. Kluwer Aca-
demic Press, Dordrecht.
Port CM, Port GR (1986) The Biology and Behaviour of Slugs in
Relation to Crop Damage and Control. Agricultural Zoology
Reviews, 1, 255–299.
Prew RD, Cussans GW, Glen DM et al. (1990) Agronomic
aspects of straw incorporation. Agricultural Progress, 65,
39–45.
Qian BD, Gameda S, Hayhoe H et al. (2004) Comparison of
LARS-WG and AAFC-WG stochastic weather generators for
diverse Canadian climates. Climate Change, 26, 175–191.
Racsko P, Szeidl L, Semenov M (1991) A serial approach to local
stochastic weather models. Ecological Modelling, 57, 27–41.
Roy DB, Rothery P, Moss D et al. (2001) Butterfly numbers and
weather: predicting historical trends in abundance and the
future effects of climate change. Journal of Animal Ecology, 70,
201–217.
Runham NW, Hunter PJ (1970) Terrestrial Slugs. Hutchinson
University Library, London.
Semenov MA, Barrow EM (1997) Use of a stochastic weather
generator in the development of climate change scenarios.
Climate Change, 35, 397–414.
Semenov MA, Brookes RJ, Richardson CW (1998) Comparison of
the WGEN and LARS-WG stochastic weather generators for
diverse climates. Climate Research, 10, 95–107.
Semenov MA, Brooks RJ (1999) Spatial interpolation of the
LARS-WG stochastic weather generator in Great Britain. Cli-
mate Research, 11, 137–148.
Semenov MA, Welham S (2004) Comments on the use of statis-
tical tests in the comparison of stochastic weather generators
by Qian et al. (2004). Climate Research, 28, 83–84.
South A (1992) Terrestrial Slugs Biology Ecology and Control. Chap-
man & Hall, London.
Sternberg M (2000) Terrestrial gastropds and experimental cli-
mate change: a field study in a calcacerous Grassland. Ecolo-
gical Research, 15, 73–81.
Symondson WOC, Glen DM, Ives AR et al. (2002) Dynamics of
the relationship between a generalist predator and slugs over
five years. Ecology, 83, 137–147.
Thomas JA, Rose RJ, Clarke RT et al. (1999) Intraspecific variation
in habitat availability among ectothermic animals near their
climatic limits and their centres of range. Functional Ecology, 13
(Suppl. 1), 55–64.
Winsor L, Johns PM, Barker GM (2004) Terrestrial planarians
(Platyhelminthes: Tricladida: Terricola) predaceous on terres-
trial grastropods. In: Natural Enemies of Terrestrial Molluscs (ed.
Barker GM), pp. 227–278. CAB International, Oxford.
Wolda H, Kreulen DA (1973) Ecology of some experimental
populations of the Landsnail Cepaea nemoralis (L.). II. Produc-
tion and survival of eggs and juveniles. Netherlands Journal of
Zoology, 23, 168–188.
Yildirim MZ, Kebapci U (2004) Slugs (Gastropoda:Pulmonata) of
the lakes region (Goller Bolgesi) in Turkey. Turkish Journal of
Zoology, 28, 155–160.
I B M T O F O R E C A S T T H E E F F E C T O F C L I M AT E C H A N G E 1657
r 2006 The AuthorsJournal compilation r 2006 Blackwell Publishing Ltd, Global Change Biology, 12, 1643–1657