
Use of a Neural Network to Identify Man-made Structure in Millimeter-Wave Images for Security...
6
Use of a Neural Network to Identify Man-made Structure in Millimeter-Wave Images for Security Screening Applications Paul E. Keller, Douglas L. McMakin, Thomas E. Hall, David M. Sheen Abstract—Events in the past few years have heightened security concerns necessitating the development of more advanced methods for detecting potential threats being carried on individuals. One approach is to use imaging methods that see through clothing to find potentially threatening objects being concealed by individuals on their person. This sparks obvious privacy concerns. This paper describes one technique based on neural networks and Fourier features applied to active millimeter-wave imagery that finds man-made structure potentially indicating a threat without compromising personal privacy. I. INTRODUCTION EVERAL active millimeter-wave imaging systems have been developed at the Pacific Northwest National Laboratory (PNNL) for use as screening systems for security applications. These were developed initially to meet the needs of screening passengers at airports. Other approaches for personal screening include backscatter x-ray imaging systems, passive millimeter-wave imaging systems, and vapor detection systems [1,2]. The advantages of active millimeter-wave imaging include high contrast images without the use of ionizing radiation and better detection of dielectric materials such as plastic explosives. Two of these imaging systems were developed for screening individuals. The first, shown in Figure 1, is a cylindrical scanner that produces a series of images from different angles around the person to provide full coverage through the use of a cylindrical holographic imaging algorithm [3]. The second, shown in Figure 2, is a planar scanner that produces images of just the front and back of the person [4]. These systems are capable of showing concealed objects worn on the human body beneath clothing and are ideally suited for detecting objects such as plastics and ceramics that are not detected by conventional magnetometers. These systems can show concealed objects that are potential threats including plastic and composite guns, plastic explosives, and plastic knifes. These systems will also show metallic objects such as metallic guns and metallic knifes, though these are generally detected by magnetometers. Figures 3 and 4 show millimeter-wave images produced with these two systems on mannequins with several objects hidden under the clothing. These figures illustrate what can be seen through clothing. This work was supported in part by the U.S. Federal Aviation Administration and the U.S. Defense Advanced Research Projects Agency under Related Services Agreements with the U.S. Department of Energy, as well as Internal Research & Development funding from Battelle. Pacific Northwest National Laboratory is a multiprogram national laboratory operated by Battelle for the U.S. Department of Energy under Contract DE- AC06-76RLO 1830. P. Keller is with the Pacific Northwest National Laboratory (PNNL), Richland, WA 99352 USA (phone: 509-376-9310; fax: 509-376-5824; e- mail: [email protected]). D. McMakin is with PNNL (phone: 509-375-2206; fax: 509-375-3621; e-mail: [email protected]) T. Hall is with PNNL (e-mail: [email protected]). D. Sheen is with PNNL (e-mail: [email protected]). Fig. 1. This conceptual view shows the basic Cylindrical Holographic Imaging System that gathers 3-D images from a variety of angles around the individual being scanned. Fig. 2. This conceptual view shows the basic Dual Planar Panel Portal Imaging System that gathers 2-D images from the front and back or the sides of the individual being scanned. These systems employ a millimeter-wave (MM-wave) transceiver and antenna array, high-speed digital signal processing computer, and a holographic imaging algorithm [5,6]. Because millimeter waves are, unlike x-rays, non- S
-
Upload
independent -
Category
Documents
-
view
1 -
download
0
Transcript of Use of a Neural Network to Identify Man-made Structure in Millimeter-Wave Images for Security...

Use of a Neural Network to Identify Man-made Structure in Millimeter-Wave Images for Security Screening Applications
Paul E. Keller, Douglas L. McMakin, Thomas E. Hall, David M. Sheen
Abstract—Events in the past few years have heightened security concerns necessitating the development of more advanced methods for detecting potential threats being carried on individuals. One approach is to use imaging methods that see through clothing to find potentially threatening objects being concealed by individuals on their person. This sparks obvious privacy concerns. This paper describes one technique based on neural networks and Fourier features applied to active millimeter-wave imagery that finds man-made structure potentially indicating a threat without compromising personal privacy.
I. INTRODUCTION EVERAL active millimeter-wave imaging systems have
been developed at the Pacific Northwest National Laboratory (PNNL) for use as screening systems for security applications. These were developed initially to meet the needs of screening passengers at airports. Other approaches for personal screening include backscatter x-ray imaging systems, passive millimeter-wave imaging systems, and vapor detection systems [1,2]. The advantages of active millimeter-wave imaging include high contrast images without the use of ionizing radiation and better detection of dielectric materials such as plastic explosives.
Two of these imaging systems were developed for screening individuals. The first, shown in Figure 1, is a cylindrical scanner that produces a series of images from different angles around the person to provide full coverage through the use of a cylindrical holographic imaging algorithm [3]. The second, shown in Figure 2, is a planar scanner that produces images of just the front and back of the person [4]. These systems are capable of showing concealed objects worn on the human body beneath clothing and are ideally suited for detecting objects such as plastics and ceramics that are not detected by conventional magnetometers. These systems can show concealed objects
that are potential threats including plastic and composite guns, plastic explosives, and plastic knifes. These systems will also show metallic objects such as metallic guns and metallic knifes, though these are generally detected by magnetometers. Figures 3 and 4 show millimeter-wave images produced with these two systems on mannequins with several objects hidden under the clothing. These figures illustrate what can be seen through clothing.
This work was supported in part by the U.S. Federal Aviation
Administration and the U.S. Defense Advanced Research Projects Agency under Related Services Agreements with the U.S. Department of Energy, as well as Internal Research & Development funding from Battelle. Pacific Northwest National Laboratory is a multiprogram national laboratory operated by Battelle for the U.S. Department of Energy under Contract DE-AC06-76RLO 1830.
P. Keller is with the Pacific Northwest National Laboratory (PNNL), Richland, WA 99352 USA (phone: 509-376-9310; fax: 509-376-5824; e-mail: [email protected]).
D. McMakin is with PNNL (phone: 509-375-2206; fax: 509-375-3621; e-mail: [email protected])
T. Hall is with PNNL (e-mail: [email protected]). D. Sheen is with PNNL (e-mail: [email protected]).
Fig. 1. This conceptual view shows the basic Cylindrical Holographic Imaging System that gathers 3-D images from a variety of angles around the individual being scanned.
Fig. 2. This conceptual view shows the basic Dual Planar Panel Portal Imaging System that gathers 2-D images from the front and back or the sides of the individual being scanned.
These systems employ a millimeter-wave (MM-wave)
transceiver and antenna array, high-speed digital signal processing computer, and a holographic imaging algorithm [5,6]. Because millimeter waves are, unlike x-rays, non-
S

ionizing and therefore pose minimal health risks, they are ideally suited for surveillance of people. The array illuminates the person under surveillance with very low power millimeter waves, which readily penetrate clothing barriers and reflect off the body and concealed objects. For the systems discussed here, the Ku-band, Ka-band, and U-band have been used. This corresponds to frequencies in the range of 12 to 60 GHz or wavelengths in the range of 5 to 25 mm.
Fig. 3. The image on the left is a 2-D planar image of a mannequin with a plastic flare gun concealed under clothing over the abdomen. The image on the right is a 2-D planar image of a mannequin with a Glock-17 concealed under clothing on the upper chest.
Fig. 4. These images show front and back 2-D projections of a 3-D cylindrical combined holographic image of a mannequin with a concealed cigarette pack in the chest pocket, a hand calculator in the hip pocket, and a concealed Glock-17 handgun on the lower back.
The signals reflected off the imaged surfaces are collected
by an antenna array and sent to a high-speed imaging computer where they are formed into high-resolution radar images by holographic imaging software [7,8]. After the holographic images are formed, they are sent to a video monitor where the system operator can visually detect,
identify, and locate any concealed threats. Although this security system can detect and identify non-conventional concealed threats, it also displays human physical features in the imagery, which has delayed its full deployment into a wide range of security applications.
The presentation of millimeter-wave imagery data to a human screener is generally considered unacceptable in the most common security scenarios due to personal privacy concerns. As a consequence, this screening method is being used only in limited security check points where privacy is of secondary concern. These systems were originally developed to screen passengers at airport checkpoints, and ideally would be used in that application if privacy was not a concern. It is believed that public acceptance of this type of screening system would likely be greater if the imagery was presented to a computer pattern recognition or segmentation algorithm for threat detection and identification rather than to a human operator. In this scenario, the operator would be retained in the security activity to clear the alarms generated by the privacy algorithm from either false alarms or real threats. To eliminate privacy concerns, several machine vision techniques were developed as parts of an overall privacy algorithm development process. One technique that looked for speckle in millimeter-wave images was discussed in earlier papers [9-11]. It successfully finds dielectric material (e.g., plastics) including plastic guns and plastic explosives.
Another approach that was implemented and tested used a Pulse-Coupled Neural Network (PCNN) to segment hidden objects. A PCNN is a visual cortex model sometimes useful for object segmentation and edge detection [12]. This approach was not successful on the millimeter-wave imagery. We speculate that the variation in contrast and noise in millimeter-wave imagery is not conducive to PCNN segmentation. In another study, we found the PCNN worked well in segmentation of high contrast, low noise magnetic resonance images but not with low contrast, high noise scintigraphic images [13].
In this paper, we discuss another technique for protecting privacy while ensuring security. This technique uses certain features of man-made structure found in the images to identify hidden and potentially threatening objects. Man-made structures typically have higher spatial frequencies than natural objects (i.e., sharper edges). With this knowledge, a man-made structure detection algorithm was developed. This approach uses an artificial neural network trained on the spatial frequency features extracted from image segments to identify possible areas on the image containing man-made structures [14].
II. UNDERLYING CONCEPT Man-made objects with regular structure often produce a
larger percentage of high spatial frequencies in images than natural objects such as the human body. The natural distribution of Fourier magnitude is inversely proportional

to spatial frequency, f--1. On average, man-made objects produce a different distribution than this inverse relationship with a more probable distribution in the higher spatial frequencies than naturally occurring objects. Also, the spatial frequencies from man-made objects are dominant in certain directions. Figure 5 illustrates millimeter-wave images of some objects (e.g., stomach region, guns, and calculator) along with their spatial frequency representations or power spectra (i.e., magnitude-square of their Fourier transforms). By looking at the spatial frequencies of a Fourier transformed image segment, the segment can be classified as containing man-made structure or natural structure. The man-made structure detector is built around Fourier transforms of image segments, Fourier domain feature extractors, neural networks, and image processing filters.
Fig. 5. This figure displays image segments (upper) from a millimeter-wave scanner and the associated spatial frequency distributions (lower). From left to right: stomach view, Glock composite gun, Raven Arms metallic gun, metallic pellet gun, and calculator.
III. DETECTION PROCESS Figure 6 illustrates a block diagram of the complete man-
made structure detection process. It illustrates the process of breaking apart an image into a set of rectangular segments, transforming the segments into a spatial frequency representation through the use of Fourier transforms, extracting features from the spatial frequency representation, and then identifying each segment that contains structure representing a man-made object through the use of a multi-layer perceptron neural network classifier. Each image segment is processed separately and the final results are combined at the end of the process to show the segment location suspected of containing man-made objects. Finally, for imaging systems with multiple viewing angles, such as the Cylindrical Holographic Imaging System, a frame-to-frame consistency check is applied to validate that an object is found in adjacent frames. For single frame imaging systems such as the Dual Planar Panel Portal system, this check is ignored.
A. Segment the Image The detection process begins by breaking an image into
segments. Figure 7 illustrates how the image is divided into two sets of predetermined, overlapping rectangular segments. The size of a segment is large enough to contain most common threats, but not so large that it is difficult to localize the threat location. From our experiments with Ka-
band and Ku-band millimeter-wave imagery, a segment size of 32 by 32 pixels was found to be optimal. For U-band, a segment size of 64 by 64 pixels was found to be optimal.
Extract Features (ring-wedge, sector, ring)
Multi-layer Perceptron Neural Network
Frame to Frame Consistency
Fourier Transform Segments
Choose Active Segments
Reduced Set of Features
Single Frame Decision
2-D Array of Spatial Frequencies
2-D Array of Pixel Intensities
Overlay on Output Display
Input
Output
Fig. 6. This figure illustrates a block diagram of the major components used within the man-made structure detector and how images are processed with it.
B. Extract Fourier Features Next, each image segment is Fourier transformed to
produce a set a spatial frequency representations of the segment. The raw Fourier transformed values are represented by complex values. To reduce the number of values and to convert them to real values, a feature extraction process is applied. This reduces the complexity of the neural network and produces both a more robust and parsimonious system than if raw spatial frequency values were fed directly into the neural network. Figure 8 illustrates three feature extraction approaches, which have been tested in this man-made structure detector. The

specific one implemented is chosen based on an analysis of the probability of detection versus the probability of false alarm to provide an optimum trade off between high detection probability and low false alarm probability.
0 1 2
3 4 5
6 7 8
9 10 11
12 13 14
15 16 17
0 1 2
3 4 5
6 7 8
9 10 11
12 13 14
15 16 17
18 19
20 21
22 23
24 25
26 27
18 19
20 21
22 23
24 25
26 27
Overlapped Set 1 Set 2
0 1 2
3 4 5
6 7 8
9 10 11
12 13 14
15 16 17
0 1 2
3 4 5
6 7 8
9 10 11
12 13 14
15 16 17
0 1 2
3 4 5
6 7 8
9 10 11
12 13 14
15 16 17
18 19
20 21
22 23
24 25
26 27
18 19
20 21
22 23
24 25
26 27
18 19
20 21
22 23
24 25
26 27
Overlapped Set 1 Set 2
Fig. 7. This figure illustrates the process of breaking apart an image into a set of rectangular segments. Each square represents an image segment. To improve detection, two sets of overlapping segments are taken from the original image.
Fourier SpaceF(fx,fy) F(r,θ)
fx
fy
Sector Based Fourier Feature Extractor
fx
fy
Ring Based Fourier Feature Extractor
fx
fy
Ring-Wedge Based Fourier Feature Extractor
Fourier SpaceF(fx,fy) F(r,θ)
fx
fy
Sector Based Fourier Feature Extractor
fx
fy
Sector Based Fourier Feature Extractor
fx
fy
Ring Based Fourier Feature Extractor
fx
fy
Ring Based Fourier Feature Extractor
fx
fy
Ring-Wedge Based Fourier Feature Extractor
fx
fy
Ring-Wedge Based Fourier Feature Extractor
Fig. 8. This figure illustrates three feature extraction approaches used in the man-made structure detector. Each extractor maps a set of spatial frequencies into a common feature. In the case of the sector based extractor, all spatial frequencies in a sector become one feature. In the case of the ring extractor, all spatial frequencies within a ring become one feature.
The first feature extractor is a sector configuration. The geometry of this extractor is analogous to the sectors on a computer disk. By integrating the spatial frequencies within each sector, a set of features representing angular and radial features of the image segment is generated. This approach is neither rotation nor scale invariant, but can be useful for identifying objects with preferred orientations and sizes.
The second feature extractor is a ring-wedge configuration. It consists of a half-plane of wedges and a
half-plane of rings centered on the zeroth frequency component. The wedges in this feature extractor provide scale invariance and the rings provide rotation invariance. The use of a ring-wedge filter was patented in 1972 for use in optical signal processing systems [15]. The application of this approach to millimeter-wave imagery is novel and builds upon this expired patent.
The third feature extractor is a ring configuration. It is rotationally invariant, so represents the segment solely based on radial spatial frequency. Orientation is ignored and the decision about whether the segment contains man-made objects or not is based on the relationship of higher and lower spatial frequencies.
C. Process Features with Neural Network Next, the extracted features are fed into a multi-layer
perceptron neural network. The neural network is trained for structure identification through the back-propagation of error algorithm [16-18]. The spatial-frequency feature extractor combined with this multi-layer perceptron neural network makes the decision as to whether regular or man-made structure occurs in each image segment. The threshold used on the output of the neural network is adjusted to set the sensitivity of the detection. This is done iteratively to maximize detection probability while minimizing the false alarm probability. This produces a binary decision for each segment in the image with multiple images in each scan.
D. Check for Consistency to Reduce False Alarms Next, for multiple frame image sets, such as those from
the cylindrical imaging system, a frame-to-frame consistency-check process is applied to the individual processed frames to look for consistency in the detection between adjacent frames. If a threat is found only in one frame but not the adjacent frames, it is ignored as a likely false alarm. This is used to reduce the false alarm probability.
E. Display Processed Output to Screener Finally, the identified segments for each scan are overlaid
on a representation of the person being scanned to show the location where the potential threat was found. This alleviates most of the privacy concerns by highlighting the location of the detected object without revealing the human body features of the person being scanned.
A blue square is placed over the representation of the image segment that was identified by the man-made structure detection algorithm. The output representation can be a silhouette of the person, a generic outline, a generic 3-D rendered wire-frame computer aided design (CAD) model, or an optical photo of the person as shown in Figure 9. The silhouette is produced through an adaptive thresholding process that removes all detail other than the basic silhouette of the person. The computer aided design model is generated from 3-D wire-frame polygons to match the

various views of the millimeter-wave for each display angle. The optical photo requires registration between the optical image and the millimeter-wave image before the marked locations can be overlaid. For development, we typically overlay the output on the original input, but for display we use generally use the 3-D computer aided design model.
Optical PhotoCAD Model
Silhouette Generic Outline
Optical PhotoCAD Model
Silhouette Generic Outline
Fig. 9. This is an illustration of four different ways to output the location of a detected object so the human screener can easier narrow the search. The blue square indicates the location of a detected concealed object.
IV. NEURAL NETWORK TRAINING The neural network in this detector is a basic multilayer
perceptron trained with backpropagation of error. The inputs come from the Fourier features. For most of the development, 32 Fourier features were used. These features were extracted from image segments that were 32 by 32 pixels in the cases of Ku-band and Ka-band imagery and 64 by 64 pixels in the case of U-band imagery. Generally, between 10 and 20 hidden nodes were used in the neural network with a single output node trained to indicate either the presence or absence of man-made structure within the image segment.
For our test of the planar system at Ku-band (12-18 GHz), training data was generated by imaging two male and two female models. The models wore different types of clothing (casual, formal, and either with a heavy jacket or coat) and hid various kinds of threatening (guns, knifes, plastic explosives) and non-threatening objects (calculators, pens,
etc.) beneath their clothing. Also, several images were taken with no concealed objects. The total number of images taken was 502. This represents 14,056 image segments that were used to train and validate the neural network.
Even though a majority of the scans had some concealed object placed on the model, most of the image segments in the training sets had no man-made structure in them since they covered other parts of the body. For example, in a single image with one concealed object, the image is broken into 28 overlapping segments when Ku-band images are used. One object would generally not be in more than five image segments. This represents 17.9% of the segments in the image. Overall, approximately 7% of all segments had notable structure that was useful for training. So, it was necessary to balance the training process by increasing the representation of man-made structure by presenting segments with structure as often as segments without structure. This essentially increased the a priori probability of encountering a segment with notable structure to 50%.
V. RESULTS The man-made structure detector described here has
worked well at detecting objects with sharp edges such as guns and knifes. It has been successfully tested with a series of images taken at a variety of resolutions (i.e., at different imaging frequencies – Ku-band, Ka-band, and U-band). As expected, the performance on smoother objects such as blobs of plastic explosive is much poorer. However, in previously reported results, a detection algorithm was successful at locating plastics by detecting speckle in the image though the use of a neural network followed by kernel based image processing filters [10].
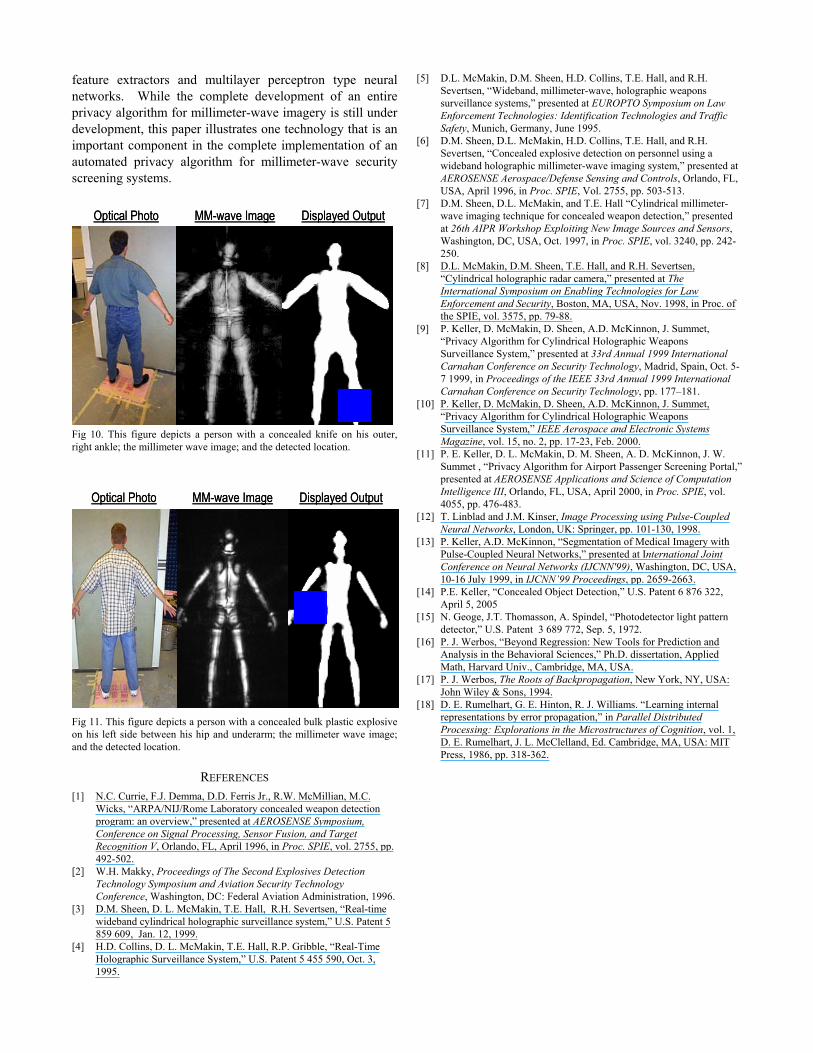
For the study with the planar system and Ku-band imaging, 10 male models and 10 female models were used. The total number of images collected was 1966 and formed the testing set. Specific detection probabilities and false alarm probabilities can not be reported in this paper due to security concerns, though a significant majority of objects with edges were detected but with a small number of false alarms also detected. Figures 10 and 11 show two examples of man-made objects detected with this method. These two examples are taken at the lowest resolution with a Ku-band (12-18 GHz) imaging array. In these figures, the blue square outlines the segments on the body that contained significant amounts of man-made structure as judged by the neural network. In the first, a knife is located on outer right ankle of the person being scanned. In the second, a bulk plastic explosive is located on the left side of the torso between the hip and the underarm.
VI. CONCLUSION By combing a neural network with appropriate feature
extraction methods, we have demonstrated an image analysis application that finds man-made structure in millimeter-wave security images through the use of Fourier based
feature extractors and multilayer perceptron type neural networks. While the complete development of an entire privacy algorithm for millimeter-wave imagery is still under development, this paper illustrates one technology that is an important component in the complete implementation of an automated privacy algorithm for millimeter-wave security screening systems.
Optical Photo MM-wave Image Displayed OutputOptical Photo MM-wave Image Displayed Output
Fig 10. This figure depicts a person with a concealed knife on his outer, right ankle; the millimeter wave image; and the detected location.
Optical Photo MM-wave Image Displayed OutputOptical Photo MM-wave Image Displayed Output
Fig 11. This figure depicts a person with a concealed bulk plastic explosive on his left side between his hip and underarm; the millimeter wave image; and the detected location.
REFERENCES [1] N.C. Currie, F.J. Demma, D.D. Ferris Jr., R.W. McMillian, M.C.
Wicks, “ARPA/NIJ/Rome Laboratory concealed weapon detection program: an overview,” presented at AEROSENSE Symposium, Conference on Signal Processing, Sensor Fusion, and Target Recognition V, Orlando, FL, April 1996, in Proc. SPIE, vol. 2755, pp. 492-502.
[2] W.H. Makky, Proceedings of The Second Explosives Detection Technology Symposium and Aviation Security Technology Conference, Washington, DC: Federal Aviation Administration, 1996.
[3] D.M. Sheen, D. L. McMakin, T.E. Hall, R.H. Severtsen, “Real-time wideband cylindrical holographic surveillance system,” U.S. Patent 5 859 609, Jan. 12, 1999.
[4] H.D. Collins, D. L. McMakin, T.E. Hall, R.P. Gribble, “Real-Time Holographic Surveillance System,” U.S. Patent 5 455 590, Oct. 3, 1995.
[5] D.L. McMakin, D.M. Sheen, H.D. Collins, T.E. Hall, and R.H. Severtsen, “Wideband, millimeter-wave, holographic weapons surveillance systems,” presented at EUROPTO Symposium on Law Enforcement Technologies: Identification Technologies and Traffic Safety, Munich, Germany, June 1995.
[6] D.M. Sheen, D.L. McMakin, H.D. Collins, T.E. Hall, and R.H. Severtsen, “Concealed explosive detection on personnel using a wideband holographic millimeter-wave imaging system,” presented at AEROSENSE Aerospace/Defense Sensing and Controls, Orlando, FL, USA, April 1996, in Proc. SPIE, Vol. 2755, pp. 503-513.
[7] D.M. Sheen, D.L. McMakin, and T.E. Hall “Cylindrical millimeter-wave imaging technique for concealed weapon detection,” presented at 26th AIPR Workshop Exploiting New Image Sources and Sensors, Washington, DC, USA, Oct. 1997, in Proc. SPIE, vol. 3240, pp. 242-250.
[8] D.L. McMakin, D.M. Sheen, T.E. Hall, and R.H. Severtsen, “Cylindrical holographic radar camera,” presented at The International Symposium on Enabling Technologies for Law Enforcement and Security, Boston, MA, USA, Nov. 1998, in Proc. of the SPIE, vol. 3575, pp. 79-88.
[9] P. Keller, D. McMakin, D. Sheen, A.D. McKinnon, J. Summet, “Privacy Algorithm for Cylindrical Holographic Weapons Surveillance System,” presented at 33rd Annual 1999 International Carnahan Conference on Security Technology, Madrid, Spain, Oct. 5-7 1999, in Proceedings of the IEEE 33rd Annual 1999 International Carnahan Conference on Security Technology, pp. 177–181.
[10] P. Keller, D. McMakin, D. Sheen, A.D. McKinnon, J. Summet, “Privacy Algorithm for Cylindrical Holographic Weapons Surveillance System,” IEEE Aerospace and Electronic Systems Magazine, vol. 15, no. 2, pp. 17-23, Feb. 2000.
[11] P. E. Keller, D. L. McMakin, D. M. Sheen, A. D. McKinnon, J. W. Summet , “Privacy Algorithm for Airport Passenger Screening Portal,” presented at AEROSENSE Applications and Science of Computation Intelligence III, Orlando, FL, USA, April 2000, in Proc. SPIE, vol. 4055, pp. 476-483.
[12] T. Linblad and J.M. Kinser, Image Processing using Pulse-Coupled Neural Networks, London, UK: Springer, pp. 101-130, 1998.
[13] P. Keller, A.D. McKinnon, “Segmentation of Medical Imagery with Pulse-Coupled Neural Networks,” presented at International Joint Conference on Neural Networks (IJCNN'99), Washington, DC, USA, 10-16 July 1999, in IJCNN’99 Proceedings, pp. 2659-2663.
[14] P.E. Keller, “Concealed Object Detection,” U.S. Patent 6 876 322, April 5, 2005
[15] N. Geoge, J.T. Thomasson, A. Spindel, “Photodetector light pattern detector,” U.S. Patent 3 689 772, Sep. 5, 1972.
[16] P. J. Werbos, “Beyond Regression: New Tools for Prediction and Analysis in the Behavioral Sciences,” Ph.D. dissertation, Applied Math, Harvard Univ., Cambridge, MA, USA.
[17] P. J. Werbos, The Roots of Backpropagation, New York, NY, USA: John Wiley & Sons, 1994.
[18] D. E. Rumelhart, G. E. Hinton, R. J. Williams. “Learning internal representations by error propagation,” in Parallel Distributed Processing: Explorations in the Microstructures of Cognition, vol. 1, D. E. Rumelhart, J. L. McClelland, Ed. Cambridge, MA, USA: MIT Press, 1986, pp. 318-362.


![To Identify the given inorganic salt[Ba(NO3)2] To Identify the ...](https://static.fdokumen.com/doc/165x107/63169e619076d1dcf80b7c23/to-identify-the-given-inorganic-saltbano32-to-identify-the-.jpg)