Usability Problem Reports for Comparative Studies: Consistency and Inspectability
45
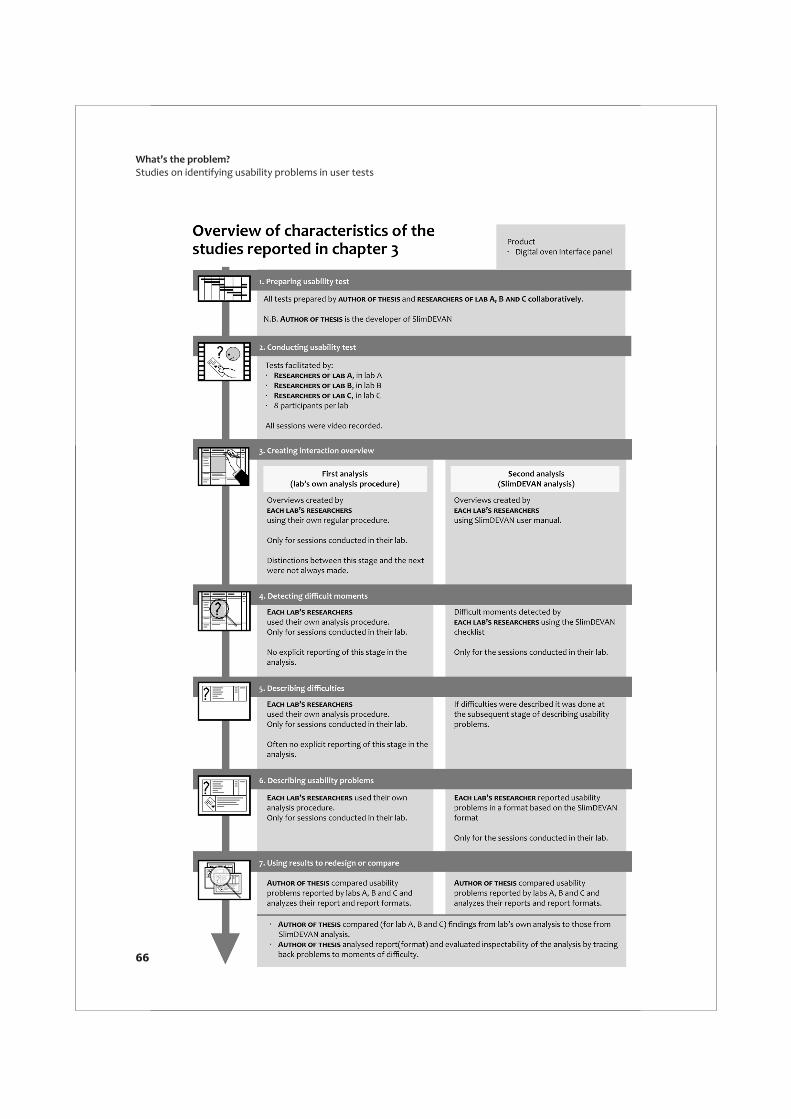
What’stheproblem? Studiesonidentifyingusabilityproblemsinusertests 65 chapter3 Usabilityproblemreports forcomparativestudies: consistencyandinspectability abstract Thisstudyexploresissuesofconsistencyandinspectabilityinusabil itytestdataanalysisprocessesandreports.Problemreportsresult ingfromusabilitytestsperformedbythreeprofessionalusabilitylabs inthreedifferentcountriesarecompared.Eachofthelabscon ductedausabilitytestonthesameproduct,applyingatestprotocol thatwascollaborativelydevelopedbythelabs.Eachlabfirstana lyzedtheirownfindingsastheyalwaysdointheirregularprofes sionalpractice.Afewweekslater,theyagainanalyzedtheirfindings buttheneveryoneappliedthesamemethod(SlimDEVAN:asimpli fiedversionofDEVAN,amethoddevelopedforfacilitatingcompari sonoffindingsfromusabilitytestsinanacademicsetting).Itwas foundthatlevelsofagreementbetweenlabsdidnotimprovewhen theyallusedSlimDEVAN,suggestingthattherewasinherentsubjec tivityintheiranalyses.Itwasfoundthatconsistencyofsingleanalyst teamsvariedconsiderablyandthatamethodlikeSlimDEVANcan helpinmakingtheanalysisprocessandfindingsmoreinspectable. Inspectabilityishelpfulincomparativestudiesbasedonidentified usabilityproblemsbecauseitallowsfortracingbackfindingsto originalobservations,aswellasforlayingbarethesubjectiveparts ofthedataanalysis. Thischapterwaspublishedas: VermeerenA.P.O.S.,AttemaJ.,AkarE.,RidderH.de,DoornA.J.van, ErbugC.,BerkmanA.E.,MaguireM.C.(2008)UsabilityProblemRe portsforComparativeStudies:ConsistencyandInspectability.In HumanComputerInteraction23(4),329380.
Transcript of Usability Problem Reports for Comparative Studies: Consistency and Inspectability

� � � What’s�the�problem?�Studies�on�identifying�usability�problems�in�user�tests
65
� chapter�3� Usability�problem�reports��for�comparative�studies:��consistency�and�inspectability�
abstract�This�study�explores�issues�of�consistency�and�inspectability�in�usabil�ity�test�data�analysis�processes�and�reports.�Problem�reports�result�ing�from�usability�tests�performed�by�three�professional�usability�labs�in�three�different�countries�are�compared.�Each�of�the�labs�con�ducted�a�usability�test�on�the�same�product,�applying�a�test�protocol�that�was�collaboratively�developed�by�the�labs.�Each�lab�first�ana�lyzed�their�own�findings�as�they�always�do�in�their�regular�profes�sional�practice.�A�few�weeks�later,�they�again�analyzed�their�findings�but�then�everyone�applied�the�same�method�(SlimDEVAN:�a�simpli�fied�version�of�DEVAN,�a�method�developed�for�facilitating�compari�son�of�findings�from�usability�tests�in�an�academic�setting).�It�was�found�that�levels�of�agreement�between�labs�did�not�improve�when�they�all�used�SlimDEVAN,�suggesting�that�there�was�inherent�subjec�tivity�in�their�analyses.�It�was�found�that�consistency�of�single�analyst�teams�varied�considerably�and�that�a�method�like�SlimDEVAN�can�help�in�making�the�analysis�process�and�findings�more�inspectable.�Inspectability�is�helpful�in�comparative�studies�based�on�identified�usability�problems�because�it�allows�for�tracing�back�findings�to�original�observations,�as�well�as�for�laying�bare�the�subjective�parts�of�the�data�analysis.�
�
This�chapter�was�published�as:��Vermeeren�A.P.O.S.,�Attema�J.,�Akar�E.,�Ridder�H.�de,�Doorn�A.J.�van,�Erbug�C.,�Berkman�A.E.,�Maguire�M.C.�(2008)�Usability�Problem�Re�ports�for�Comparative�Studies:�Consistency�and�Inspectability.�In�Human�Computer�Interaction�23�(4),�329�380.�
What’s�the�problem?�Studies�on�identifying�usability�problems�in�user�tests� �
66

� � � Chapter�3�Usability�problem�reports�for�comparative�studies:�consistency�and�inspectability
67
� 1� Introduction�
Usability�testing�often�takes�place�in�the�context�of�product�development�processes�(for�software,�websites,�electronic�products,�etc.)�as�a�way�of�getting�feedback�on�product�usability.�In�some�specific�cases,�findings�from�multiple�usability�tests�need�to�be�systematically�compared.�For�example,�in�academic�settings�comparative�studies�may�be�conducted�to�study�methodological�issues�of�user�evaluations�(e.g.,�Jacobsen,�Hertzum�and�John,�1998;�Vermeeren,�1999;�Cockton,�Lavery�and�Woolrych,�2002;�Molich,�Ede,�Kaasgaard�and�Karyukin,�2004;�Vermeeren,�Bekker,�van�Kesteren�and�de�Ridder,�2007);�in�other�settings�they�may�be�conducted�to�compare�usability�of�compet�ing�designs�or�design�proposals�(e.g.,�Park�and�Lim,�1999; Hoenderdos,�Vermeeren,�Bekker,�and�Pierik,�2002) and�in�international�product�development�settings�they�may�be�conducted�to�determine�cultural�differences�in�product�use�or�usability�(e.g.,�Daams�and�Hariandja,�2006;�Noiwan�and�Norcio,�2006).�For�being�able�to�properly�draw�conclusions�based�on�comparisons�of�findings�from�dif�ferent�test�conditions,�one�needs�to�be�reasonably�sure�that�identified�differences�in�findings�can�be�attributed�to�differences�in�conditions,�rather�than�to�for�example�in�consistencies�in�data�analysis�or�idiosyncratic�focus�or�interpretations�of�an�evaluator.�Issues�like�these�are�often�referred�to�as�issues�of�reliability�and�subjectivity�(or�objec�tivity)�respectively.�In�the�present�study,�three�labs�in�three�different�countries�con�ducted�usability�tests�on�the�same�product,�applying�an�agreed�test�protocol�and�then�(independent�from�each�other)�analyzed�their�data�and�reported�their�findings.�Based�on�the�labs’�problem�reports,�issues�of�reliability�and�subjectivity�are�studied�with�a�fo�cus�on�the�usability�labs’�data�analyses�and�reporting�of�results.�Before�proceeding�to�the�introduction�of�the�case�study,�the�following�section�will�discuss�issues�of�reliability�and�subjectivity�in�more�depth.��

What’s�the�problem?�Studies�on�identifying�usability�problems�in�user�tests� �
68
� 1.1� Consistency�of�individual�analysts�(reliability)�
Hartson,�Andre�and�Williges�(2001)�discuss�a�number�of�quality�criteria�for�Usability�Evaluation�Methods�(UEMs)�including:�thoroughness,�validity,�effectiveness,�and�reli�ability.�They�define�how�to�measure�thoroughness,�validity�and�effectiveness�based�on�counting�usability�problems.�However,�they�do�not�precisely�define�the�concept�of�reli�ability�in�terms�of�how�to�calculate�it;�Hartson,�Andre�and�Williges�(2001)�define�reliabil�ity�primarily�in�terms�of�evaluator�agreement�as�"…�a�measure�of�the�consistency�of�us�ability�testing�results�across�different�users�of�the�UEMs�(evaluators)"�(p.�396)�However,�they�also�speak�about�individual�reliability,�stating�that�"…�In�most�UEMs,�low�individual�reliability�means�high�variability�among�evaluators,�which�means�that�merging�results�over�a�group�of�evaluators�will�give�higher�overall�thoroughness"�(p.�397).�Thus�individual�reliability�seems�to�refer�to�evaluations�conducted�by�one�single�evaluator;�presumably�they�refer�to�consistency�of�UEM�results�in�cases�where�an�evaluator�applies�a�UEM�multiple�times�on�the�same�material�(i.e.,�within�evaluator�consistency).�In�line�with�Hartson,�Andre�and�Williges’�definition,�Guba�and�Lincoln�(1989)�state�that�(in�research�starting�from�a�positivistic�paradigm)�the�establishment�of�reliability�"…�typically�rests�on�replication,�assuming�that�every�repetition�of�the�same,�or�equivalent,�instruments�to�the�same�phenomena�will�yield�similar�measurements"�(p.�235).�However,�they�also�state�that�in�research�based�on�a�naturalistic�research�paradigm,�where�by�definition�measurements�cannot�be�exactly�repeated,�the�issue�of�reliability�(or�de�pendability,�as�it�is�often�referred�to�in�that�context)�is�dealt�with�mainly�by�making�sure�that�the�used�process�is�"…�an�established,�trackable,�and�documentable�process,"�so�that�outside�reviewers�"…�can�explore�the�process,�judge�the�decisions�that�were�made,�and�understand�what�salient�factors�in�the�context�led�the�evaluator�to�the�decisions�and�interpretations�made�(Guba�and�Lincoln,�1989,�p.�242)."��Kanis�(1993)�performed�an�extensive�literature�study�to�determine�how�the�term�reli�ability�is�used�in�two�important�constituent�disciplines�of�human�factors�and�ergonom�ics,�namely�technical�sciences�and�social�sciences.�As�a�result�of�his�inquiry�he�proposed�"…�to�maintain�a�clear�cut�distinction�between�random�variation�and�systematic�deviance�in�outcomes�of�measurements"�(p.�96)�and�to�use�the�term�reproducibility�rather�than�reliability.�According�to�Kanis�(1993),�reliability�(or�reproducibility)�should�deal�with�random�variation,�rather�than�with�systematic�deviance.�In�case�of�usability�test�data�analyses�based�on�extracting�usability�problems,�the�ana�lyst�forms�part�of�the�instrument�for�identifying�problems;�after�all,�ultimately,�it�is�the�analyst�who�judges�whether�an�event�is�considered�problematic�or�not.�Presumably,�analyst�judgments�are�largely�based�on�individual�expertise,�experiences,�and�ability�to�empathize�with�users.�In�such�a�context�reliability�concepts�based�on�‘repeated�meas�urements’�are�problematic�as�they�assume�that�in�the�repeated�analysis,�the�analyst�has�forgotten�everything�about�the�previous�analysis,�and�has�not�gained�any�relevant,�ad�ditional�knowledge�or�experience�affecting�his/her�perception�of�interactions�(which�will�probably�never�be�completely�true).�For�the�same�reason�it�is�also�questionable�to�

� � � Chapter�3�Usability�problem�reports�for�comparative�studies:�consistency�and�inspectability
69
what�extent�differences�in�findings�from�multiple�analyses�of�a�single�analyst�can�be�re�garded�as�'random�variation'�(cf.�Kanis,�1993).�Therefore,�in�the�remainder�of�this�article�the�term�‘reliability’�will�be�avoided�and�the�issue�will�be�dealt�with�mainly�in�terms�of�‘consistency�of�individual�analysts‘.��In�this�article,�consistency�of�individual�analysts�(analyst�teams)�will�be�dealt�with�by�using�the�repeated�measures�approach�(within�team�consistency),�but�taking�into�account�Guba�and�Lincoln’s�(1989)�advice�to�use�established,�documentable�and�traceable�processes.�
� 1.2� Consistency�of�findings�across�multiple�analysts�(subjectivity)�
According�to�Guba�and�Lincoln�(1989)�objectivity�is�"…concerned�with�assuring�that�data,�interpretations�and�outcomes�of�inquiries�are�rooted�in�contexts�and�persons�apart�from�the�evaluator�and�are�not�simply�figments�of�the�evaluator's�imagination"�(p.�243).�In�addition,�they�state�that�in�a�naturalistic�research�paradigm�one�may�not�assume�that�methods�can�prevent�the�inquirer�(even�inadvertently)�introducing�subjectivity�in�findings.�Instead,�assurances�of�integrity�of�findings�are�rooted�in�the�data�themselves.�In�other�words,�the�starting�point�is�that�(at�least�some�degree�of)�subjectivity�is�acknowledged�in�data�analysis�and�should�be�dealt�with�properly.�In�Guba�and�Lincoln's�view�this�means�that�both�the�original�data�and�the�processes�used�to�compress�these�data�should�be�available�to�be�inspected�and�confirmed�by�outside�reviewers�of�the�study.�For�this�they�adopt�a�criterion�of�confirmability�rather�than�objectivity.�Probably,�the�term�inspectability�would�be�more�appropri�ate,�as�the�products�and�processes�should�be�available�for�inspection�(not�only�for�confirmation,�but�also�for�falsification).�Because�in�usability�test�data�analyses�based�on�extracting�usability�problems�the�ana�lyst�forms�part�of�the�measurement�instrument,�Hartson,�Andre�and�Williges’�(2001)�definition�of�reliability�as�"…�a�measure�of�the�consistency�of�usability�testing�results�across�different�users�of�the�UEMs�(evaluators)"�(p.�396)�(and�analyst�agreement�in�gen�eral)�should�be�seen�as�primarily�dealing�with�issues�of�subjectivity/objectivity,�rather�than�with�reliability�purely.�Findings�from�a�number�of�studies�investigating�the�so�called�evaluator�effect�seem�to�confirm�this�notion.�The�evaluator�effect�(e.g.,�Hertzum�and�Jacobsen,�2001;�Vermeeren,�van�Kesteren�and�Bekker,�2003;�Law�and�Hvannberg,�2004)�is�the�effect�that�if�several�evaluators�analyze�the�same�video�recorded�user�test�sessions�there�is�a�considerable�lack�of�overlap�in�their�findings.�The�findings�from�the�studies�suggest�that�no�matter�how�careful,�structured�and�detailed�the�analysis�is,�if�it�involves�qualitative�analyses�there�is�a�considerable�subjective�component�in�it�(e.g.,�see�Vermeeren,�van�Kesteren�and�Bekker,�2003).�This�suggests�that,�also�in�case�of�user�test�data�analyses,�assurances�for�objectivity�cannot�be�rooted�entirely�in�the�method�used�and�its�subjectivity�will�have�to�be�dealt�with�somehow.�In�the�remainder�of�this�article,�issues�of�subjectivity�and�objectivity�will�be�dealt�with�by�using�measures�of�agreement�between�analyst�teams�as�well�as�by�keeping�in�mind�Guba�and�Lincoln’s�(1989)�advice�that�it�should�always�be�possible�to�trace�back�on�

What’s�the�problem?�Studies�on�identifying�usability�problems�in�user�tests� �
70
what�data�the�findings�are�based�and�how�the�data�transformed�from�primary�observa�tions�into�findings�(i.e.�findings�should�be�inspectable).�
� 1.3� Aim�of�the�study�
Aim�of�the�study�presented�in�this�article�is�to�investigate�issues�of�consistency�and�in�spectability�of�data�analyses�and�reports�from�usability�tests�based�on�extracting�usabil�ity�problems.�For�that�purpose�usability�tests�were�conducted�by�lab�teams�in�three�dif�ferent�countries.�They�all�tested�the�same�product,�applying�the�same�test�protocol.�Subsequently,�each�individual�team�analyzed�their�data�and�reported�about�it.�After�the�teams�had�finished�writing�their�reports,�they�were�asked�to�re�analyze�their�data�a�few�weeks�later,�now�applying�(a�simplified�version�of)�the�DEVAN�tool�(Vermeeren,�den�Bouwmeester,�Aasman�and�de�Ridder,�2002);�the�DEVAN�tool�was�originally�developed�for�improving�an�analyst’s�consistency�in�data�analysis,�for�documenting�the�analysis�procedures�and�for�making�findings�inspectable�(in�order�to�facilitate�recognition�of�subjectivity�in�each�of�the�data�analysis�stages).��The�teams’�reports�formed�the�basis�for�making�various�comparisons.�The�first�step�to�making�comparisons�was�to�compile�a�‘complete’�master�list�of�usability�problems�from�the�teams’�reports.�As�problem�formulations�in�team�reports�were�sometimes�too�am�biguous�or�incomplete�to�understand�problems�in�enough�detail�for�direct�comparison,�there�proved�to�be�a�need�to�track�back�reported�problems�to�their�original�sources.�Experiences�in�trying�to�do�so,�have�provided�insight�into�issues�of�inspectability�of�the�teams’�reported�findings.�Based�on�the�master�problem�list,�measures�of�consistency�(within�team�consistency,�as�well�as�agreement�between�teams)�were�calculated.�In�consistencies�in�findings�were�analyzed�in�more�depth�by�trying�to�trace�back�findings�to�the�original�data�(inspectability)�and�identifying�possible�causes�of�differences.�Iden�tified�causes�of�differences�indicate�whether�these�are�due�to�issues�of�inconsistency�of�individual�analyst�teams�or�of�inconsistency�between�multiple�analyst�teams.�Also,�those�procedures�that�had�been�described�in�enough�detail�and�those�findings�that�were�inspectable�enough,�indicated�at�what�stage�in�the�data�analysis�process�inconsis�tencies�(either�within�individual�analyst�teams�or�between�analyst�teams)�occurred.��In�the�next�section,�the�usability�tests�conducted�by�the�three�labs�are�described,�along�with�the�analyses�the�lab�teams�performed�and�the�way�they�reported�their�findings.�Subsequently,�in�section�3,�the�reference�analysis�procedure�(the�simplified�version�of�the�DEVAN�procedure)�is�explained,�along�with�the�teams’�report�formats�that�resulted�from�applying�it.�Section�4�discusses�the�procedure,�experiences�and�results�of�compar�ing�the�reported�findings�and�it�reports�the�identification�of�relevant�analysis�and�report�characteristics.�In�section�5�the�results�are�discussed�and�implications�for�data�analyses�and�usability�problem�reports�in�practice�are�drawn.��

� � � Chapter�3�Usability�problem�reports�for�comparative�studies:�consistency�and�inspectability
71
� 2� Case�study��
This�section�introduces�the�usability�tests�that�the�labs�conducted.�It�then�discusses�the�ways�in�which�the�lab�teams�analyzed�the�user�test�data�according�to�their�usual�profes�sional�practices�and�shows�examples�of�the�report�formats�used.��
� 2.1� Usability�tests�on�an�advanced�oven�interface�
� 2.1.1� The�laboratories�The�laboratories�that�conducted�the�user�tests�were�UTEST�at�the�Middle�East�Technical�University�in�Ankara�(Turkey),�the�WIT�lab�at�Delft�University�of�Technology�in�the�Neth�erlands,�and�ESRI�at�Loughborough�University�in�the�United�Kingdom.��At�the�time�of�the�test,�UTEST�was�a�relatively�new�usability�laboratory�within�Middle�East�Technical�University.�UTEST�provides�services�to�industry�and�promotes�academic�studies.�The�collaboration�with�industry�consists�of�both�research�and�consultancy�ac�tivities�embracing�military�and�consumer�products�as�well�as�software�and�electronic�appliances.�Evaluators�sitting�in�the�control�room�of�the�lab�can�observe�users�in�the�test�room�through�monitors�and�a�one�way�mirror.�Remote�controlled�and�portable�digital�cameras�are�used�to�record�user�performance�and�observational�software�is�used�for�data�analysis.�The�research�team�consists�of�experts�having�diverse�academic�back�grounds.�The�WIT�lab�(Laboratory�for�Work�and�Interaction�Technology)�is�a�laboratory�at�Delft�University�of�Technology,�for�both�commercial�usability�services�and�for�the�support�of�research�and�educational�projects.�At�the�time�of�the�study�it�had�more�than�ten�years�of�experience�in�commercial�usability�services.�The�lab�has�two�test�rooms,�an�evalua�tion�room�and�a�control�room.�Staff�members�have�a�background�in�organizational�psy�chology,�experimental�psychology�and�systems�engineering.��ESRI�(The�Ergonomics�and�Safety�Research�Institute)�is�located�within�Loughborough�University�and�was�formed�from�two�institutes�on�ergonomics�and�human�factors�(HUSAT�and�ICE)�dating�back�to�the�early�1970s.�ESRI�provides�research,�consultancy�and�teaching�in�the�area�of�human�interaction�with�computer�systems,�products�and�advanced�technology.�The�ESRI�usability�laboratory�is�fitted�with�audio�visual�equip�ment�for�testing�product�usability�and�is�split�into�two�areas:�a�user�work�area�and�an�evaluator's�control�room�from�which�users�can�be�monitored�directly�through�a�one�way�mirror.�Remote�controlled�and�portable�video�cameras�are�used�to�capture�the�us�ers'�interactions�and�performance�with�the�product.�The�camera�images�are�mixed�and�stored�on�tape�for�analysis.�ESRI�staff�has�a�background�in�ergonomics,�computer�sci�ence�and�psychology�and�has�more�than�ten�years�of�experience�in�offering�usability�services�in�a�commercial�context.��

What’s�the�problem?�Studies�on�identifying�usability�problems�in�user�tests� �
72
� 2.1.2� The�product�The�product�that�was�used�as�the�object�of�evaluation�was�a�prototype�of�an�advanced�oven�interface�panel.�The�interface�consisted�of�a�combination�of�an�LCD�display�with�two�push�buttons�and�a�rotary�knob;�at�all�times�during�product�use,�the�function�of�each�button�is�shown�on�the�display.�In�the�test�room�a�prototype�of�the�complete�oven�casing�was�shown,�with�a�non�functioning�interface�on�it.�Next�to�it�was�a�cardboard�mockup�with�a�functioning�interface�on�it�(see�figure�1).��
��Figure�1�A�participant�interacting�with�a�mockup�of�the�oven's�interface�panel.��
� 2.1.3� Sessions�and�task�scenarios�Test�protocols�were�collaboratively�developed�by�the�three�lab�teams.�Scenarios�were�defined�prescribing�what�tasks�each�participant�had�to�perform�with�the�control�panel;�these�scenarios�covered�most�of�the�functionality�of�the�oven�and�were�phrased�as�real�life�contextual�goals�to�be�reached�by�participants;�for�example:�"Suppose�the�test�room�is�the�kitchen�of�a�friend�of�yours.�You�enter�the�kitchen�and�you�see�that�it�is�filled�with�smoke�and�that�the�smoke�is�coming�from�the�oven.�You�see�that�the�oven�is�work�ing…something�is�cooking�inside.�Please�go�in�and�try�to�stop�the�cooking."�and�"For�some�special�dishes�the�oven�knows�how�it�has�to�be�set.�Now�suppose�that�you�want�to�grill�a�large�sized�fish.�See�if�the�oven�knows�this�recipe�and�if�it�does�then�start�grilling�the�fish."�After�each�task�scenario,�follow�up�questions�were�asked�for�clarification�of�actions�with�unclear�intentions�(e.g.,�"what�did�you�expect�would�happen�when�you�pressed�that�

� � � Chapter�3�Usability�problem�reports�for�comparative�studies:�consistency�and�inspectability
73
button?"�or�"what�did�you�think�had�happened�when�you�saw�that�screen�appear?").�On�average,�sessions�lasted�about�one�hour.��
� 2.1.4� Participants�Sampling�of�participants�was�done�according�to�the�manufacturer's�market�profile.�In�each�of�the�three�countries�eight�participants�took�part�in�the�trials�(6�female�and�2�male,�age�varying�between�20�and�55�years).�All�participants�were�regular�cooks�and�part�of�a�family�of�3�to�5�members.�They�all�had�either�recently�purchased�an�oven�or�had�recently�considered�the�possibility�of�purchasing�one.�Other�characteristics�in�cluded:�they�are�full�time�or�part�time�employees;�they�are�indigenous�individuals,�they�cook�for�themselves�at�least�4�times�a�week;�they�not�always�cook�ready�made�meals;�they�live�in�a�city�or�town�environment.��
� 2.2� The�lab�specific�data�analysis�procedures�
For�each�of�the�labs,�the�analyst�team’s�data�analysis�procedure�is�described�below.��
� 2.2.1� Team�A�In�lab�A�two�researchers�participated�in�the�test.�Researcher�1�acted�as�facilitator,�con�ducting�the�test�sessions�(providing�participants�with�tasks,�helping�them�if�necessary�and�asking�questions).�During�task�performance,�researcher�2�(acting�as�observer)�watched�participants�performing�tasks,�took�some�notes�and�sometimes�discussed�with�two�student�observers�what�exactly�was�happening.�After�the�sessions,�researcher�1�(the�facilitator)�watched�the�video�recorded�task�performance�sessions�and�wrote�notes�about�the�sessions�in�a�format�as�shown�in�Figure�A1�(Appendix�A).�Researcher�2�(the�observer)�and�the�two�student�observers�did�not�take�part�in�the�analysis�of�the�video�recorded�sessions.��
� 2.2.2� Team�B�In�lab�B,�two�researchers�were�involved�in�the�test.�Researcher�1�(the�observer)�manu�ally�logged�sessions�in�real�time�during�task�performance�and�interviews,�using�dedi�cated�database�software.�Logs�were�automatically�time�stamped�and�linked�to�the�digi�tal�video�recordings.�Figure�A2�(Appendix�A)�shows�an�example�log�(NB.�The�logs�were�not�part�of�the�reports�that�were�handed�in�and�thus�could�not�be�used�in�the�compari�sons).�Researcher�2�acted�as�facilitator�during�the�test,�but�did�not�take�part�in�the�data�analysis.��After�the�sessions,�researcher�1�went�through�the�event�logs�(during�the�analysis�video�recordings�were�automatically�kept�synchronized�with�the�log�files)�and�assigned�so�called�findings�(key�usability�related�observation)�to�logged�events.�Findings�were�then�categorized�according�to�tasks.�Subsequently,�for�each�finding�a�paragraph�discussing�the�weight�of�the�findings�was�written,�as�well�as�a�paragraph�providing�suggestions�for�solutions.�Weight�and�suggestions�for�solutions�were�inspired�by�going�through�the�ad�ditional�non�finding�events�in�the�log�files�(e.g.,�a�user’s�additional�verbal�comments).�

What’s�the�problem?�Studies�on�identifying�usability�problems�in�user�tests� �
74
Finally,�for�each�finding�a�number�of�example�events�was�selected�for�inclusion�in�the�report.�This�resulted�in�a�report�format�as�shown�in�Figure�A3�(Appendix�A).�
� 2.2.3� Team�C�In�lab�C,�two�researchers�participated�in�the�test:�researcher�1�acted�as�facilitator,�re�searcher�2�as�observer.�During�task�performance,�researcher�2�(with�no�strong�under�standing�of�the�product�interface)�took�notes�on�a�printed�version�of�the�task�protocol,�focusing�mainly�on�timing�of�tasks,�as�well�as�on�key�comments�and�actions�of�partici�pants.�Researcher�1�took�notes�on�a�printed�version�of�the�task�protocol,�using�their�own�defined�abbreviations.�The�notes�from�both�researchers�were�discussed�amongst�them�and�were�then�combined�and�typed�up�as�a�single�record�of�each�session.�The�data�analysis�was�jointly�done�by�both�researchers.�Subsequently,�researcher�1�wrote�a�report�based�on�the�combined�notes.�Video�tapes�were�now�and�then�used�as�a�reference�during�the�process.�Figure�A4�(Appendix�A)�shows�examples�of�team�C's�re�port.��
� 3� The�reference�analyses�
One�to�two�months�after�the�teams�had�reported�their�findings,�the�videotaped�ses�sions�were�analyzed�again.�This�time�a�prescribed,�detailed�analysis�was�performed,�us�ing�SlimDEVAN�(a�simplified�version�of�DEVAN�(Vermeeren,�den�Bouwmeester,�Aasman�and�de�Ridder,�2002))�as�a�reference�to�compare�the�initial�analysis�to.�Below,�Slim�DEVAN�will�first�be�explained,�followed�by�a�brief�description�of�how�the�teams�got�ac�quainted�with�it.�Then�the�teams’�SlimDEVAN�analyses�will�be�presented�together�with�the�report�formats�they�resulted�in.��
� 3.1� Description�of�SlimDEVAN�
SlimDEVAN�is�a�checklist�based�approach�to�user�test�data�analysis.�It�is�a�simplified�ver�sion�of�the�DEVAN�technique�for�video�data�analysis�(Vermeeren,�den�Bouwmeester,�Aasman�and�de�Ridder,�2002).�Main�differences�between�DEVAN�and�SlimDEVAN�lie�in�the�way�in�which�overviews�of�interactions�are�made.�In�case�of�DEVAN,�the�procedure�for�arriving�at�the�overviews�as�well�as�the�format�for�the�overviews�are�prescribed�in�much�detail;�in�case�of�SlimDEVAN�decisions�on�these�issues�are�largely�left�to�the�indi�vidual�analyst,�but�advice�and�constraints�are�given.�Both�DEVAN�and�SlimDEVAN�make�use�of�a�checklist.�The�checklist�(see�figure�2)�aids�in�detecting�events�that�signal�the�ex�istence�of�interaction�difficulties�by�defining�such�events.�In�this�context,�the�term�diffi�culty�does�not�necessarily�refer�to�a�complete�halt�in�task�performance.�For�example,�hesitations�before�(or�frustration�after)�successful�task�performance�are�also�regarded�as�difficulties,�as�are�erroneous�actions�that�are�corrected�instantaneously.�The�use�of�the�checklist�stimulates�that�evaluators�use�the�same�definition�of�what�constitutes�an�

� � � Chapter�3�Usability�problem�reports�for�comparative�studies:�consistency�and�inspectability
75
interaction�difficulty.�Moreover,�it�makes�the�analysis�process�more�explicit.�The�DEVAN�checklist�is�based�on�Lavery,�Cockton�and�Atkinson's�(1997)�definition�of�usability�prob�lems�which�describes,�in�general�terms,�the�behavioral�and�outcome�consequences�of�usability�problems.�The�SlimDEVAN�checklist�is�basically�the�same�as�the�DEVAN�check�list�(Vermeeren,�den�Bouwmeester,�Aasman�and�de�Ridder,�2002)�but�was�slightly�adapted�based�on�experiences�in�other�projects�(e.g.,�Barendregt�and�Bekker,�2006;�Vermeeren,�Bekker,�van�Kesteren�and�de�Ridder,�2007).�Basically,�two�types�of�observations�are�distinguished�within�the�checklist.�These�are:�•� physical�actions�performed�on�the�product�(i.e.�actions�performed�on�the�products'�
control�elements);�•� expressions:�(verbal)�utterances�from�users,�as�well�as�body�language�(i.e.,�facial�
expressions,�gestures,�etc.).�The�checklist�assumes�that�both�types�of�difficulty�signals�can�be�found�at�several�stages�of�performing�an�action:�(a)�prior�to�physically�performing�the�action�(e.g.,�user�hesitates�before�acting),�(b)�during�the�physical�performance�of�an�action�(e.g.,�mis�pressing�a�button),�(c)�directly�following�an�action�(e.g.,�exclamation�of�surprise�after�seeing�the�system's�reaction�to�an�action)�or�(d)�later�in�a�session�(e.g.,�when�after�con�tinuing�with�other�actions�the�user�suddenly�notices�a�preceding�erroneous�action�and�corrects�it).��The�SlimDEVAN�approach�works�best�if�the�analysis�starts�from�a�session�log�that�speci�fies�time�stamped�actions�on�the�product,�as�well�as�(verbal,�gestural,�facial)�user�ex�pressions.�The�procedure�is�to�go�through�a�log�file�(or�if�desired�also�review�parts�of�video�taped�sessions)�and�search�for�the�types�of�events�as�defined�in�the�checklist�(the�so�called�difficulty�signals).�Codes�for�detected�difficulty�signal�events�are�added�to�the�session�logs�(thereby�making�the�events�time�stamped).�Subsequently,�for�each�partici�pant,�a�list�of�difficult�moments�is�created,�preferably�with�time�stamps�added.�A�single�moment�of�difficulty�can�be�signaled�by�multiple�event�types�at�a�time�(i.e.,�a�single�us�ability�problem�can�be�identified�based�on�multiple�signaling�events).�Figure�3�shows�examples�of�how�moments�of�difficulties�can�be�specified�(these�examples�are�taken�from�the�SlimDEVAN�user�manual�(Vermeeren,�2003)).��

What’s�the�problem?�Studies�on�identifying�usability�problems�in�user�tests� �
76
�Breakdown�signals�in�the�form�of�physical�actions�performed�on�the�product��(code,�short�description:�definition):�
ACT,�wrong�action:�An�action�does�not�belong�in�the�correct�sequence�of�actions,�an�action�is�omitted�from�the�sequence,�an�action�within�the�sequence�is�replaced�by�another�action,�or�actions�within�the�sequence�are�performed�in�reversed�order��
DISC,�discontinued�action:�User�points�at�function�as�if�to�start�executing�it,�but�then�does�not,�or�user�stops�executing�action,�before�it�is�finished.�
EXE,�execution�problem:�Execution�of�action�not�done�correctly�or�optimally.�REP,�repeated�action:�An�action�is�repeated�with�exactly�the�same�effect.�CORR,�corrective�action:�An�action�is�corrected�with�a�subsequent�action�(or�sequence�of�actions),�or�an�
action�is�undone.�STOP,�task�stopped:�User�starts�new�task,�before�having�successfully�finished�the�current�task.�
�Breakdown�signals�in�the�form�of�utterances�(verbal,�sound)�or�body�language�(facial�expressions,�ges�tures)�(code,�short�description:�definition):�
PER,�perception�problem:�User�indicates�(in�words�or�behavior)�not�to�be�able�to�hear�or�see�something�clearly.�
INTN,�wrong�goal�or�intention:�User�formulates�a�goal�that�cannot�be�achieved�with�the�product�or�that�does�not�contribute�to�achieving�the�task�goal;�or�user�(verbally)�specifies�an�action�that�s/he�think�is�needed�in�order�to�progress�towards�the�goal,�but�the�specified�action�is�not�correct�(indicating�wrong�user�in�tention).�
PUZZ,�puzzled�(before�an�action):�User�indicates�(in�words�or�behavior)�not�to�know�how�to�perform�the�task�or�what�action�is�needed�for�it,�or�not�to�be�sure�whether�a�specific�action�is�needed�or�not.�
RAND,�random�actions:�User�indicates�(in�words�or�behavior):�that�the�current�action(s)�are�chosen�randomly�SEARCH,�searching�for�a�function�(but�not�finding�it):�User�indicates�(in�words�or�behavior):�not�being�able�to�
locate�a�specific�function�DIFF,�execution�difficulty:�User�indicates�(in�words�or�behavior)�having�physical�problems�in�executing�an�
action,�or�that�executing�the�action�is�difficult�or�uncomfortable�DSF,�doubt,�surprise,�frustration�(after�an�action):�User�indicates�(in�words�or�behavior)�not�to�be�sure�
whether�an�action�was�executed�properly,�not�to�understand�an�action’s�effect,�to�be�surprised�by�an�action’s�effect�or�that�the�effect�of�an�action�was�unsatisfactory�or�frustrated�the�user.�
WEX,�wrong�explanation�(after�an�action):�User�formulates�an�explanation�for�something�that�happens,�but�this�explanation�is�not�correct;�or�user�formulates�an�interpretation�for�displayed�feedback,�but�this�in�terpretation�is�not�correct.�
REC,�recognition�of�error�or�of�misunderstanding:�User�indicates�(in�words�or�behavior)�to�recognize�a�preceding�error,�or�to�understand�something�previously�not�understood�
QUIT,�quits�task:�User�indicates�(in�words�or�behavior)�to�recognize�that�the�current�task�was�not�finished�successfully,�but�continues�with�a�subsequent�task;�or�user�indicates�(in�words�or�behavior)�that�s/he�thinks�a�task�was�successfully�finished�and�continues�with�a�subsequent�task,�(whereas�in�fact�the�task�was�not�finished�successfully).�
�
Figure�2�The�SlimDEVAN�checklist�(at�the�time�of�the�test�the�word�breakdown�was�used�in�the�checklist,�as�a�synonym�for�the�word�difficulty�in�the�present�article).�

� � � Chapter�3�Usability�problem�reports�for�comparative�studies:�consistency�and�inspectability
77
�Time�stamp�and�signal�codes�
�Free�form�breakdown��description�
Inferences�about�what�design�elements�may�have�caused�the�breakdown�to�occur.�
0:02:40�ACT�DSF�0:04:20�CORR��
User�wants�to�change�Time�style,�and�clicks�at�the�time�in�the�bot�tom�right�corner.�Apparently,�he�expects�that�time�style�settings�can�be�found�there.�He�should�have�gone�to�regional�settings�in�the�control�panel.��
At�two�places�there�are�settings�related�to�time.�At�only�one�of�those�places�it�is�possible�to�change�Time�Style.�User�expects�it�to�be�where�the�clock�is,�but�it�isn’t.�
0:03:10�INTN�ACT��
User�expects�to�find�Time�style�settings�in�the�Time�Zone�tab�of�the�Date/Time�Properties,�instead�of�in�the�Regional�Settings�in�the�Control�Panel.�
At�two�places�there�are�settings�related�to�time.�At�only�one�of�those�places�it�is�possible�to�change�Time�Style.�User�expects�it�to�be�where�the�clock�is,�but�it�isn’t.�
Figure�3�Example�format�for�a�usability�problem�list�that�was�made�available�to�the�teams�(at�the�time�of�the�test�the�word�breakdown�was�used�as�a�synonym�for�the�word�difficulty).�
� 3.2� How�the�teams�learned�to�use�SlimDEVAN�
The�first�time�the�teams�heard�about�DEVAN�was�during�the�first�project�meeting�with�all�teams.�In�that�meeting�they�were�told�about�the�existence�of�DEVAN�and�were�pro�vided�with�copies�of�the�article�in�which�the�tool�was�first�introduced�(Vermeeren,�den�Bouwmeester,�Aasman�and�de�Ridder,�2002).�At�that�time,�however,�DEVAN�was�not�considered�feasible�for�use�in�the�project,�due�to�its�time�consuming�nature.�At�a�later�stage,�after�the�second�project�meeting,�the�idea�of�using�SlimDEVAN�arose.�A�brief�description�of�how�SlimDEVAN�differed�from�DEVAN�was�sent�to�all�partners�by�email,�along�with�a�few�paragraphs�of�information�about�what�actions�would�be�re�quired�from�them�if�they�would�be�willing�to�use�SlimDEVAN.�After�the�three�teams�agreed�on�using�SlimDEVAN,�a�user�manual�(Vermeeren,�2003)�was�written.�The�user�manual�included�a�separate�checklist�reference�card�specifying�the�SlimDEVAN�codes�for�difficulty�signals.�In�a�third�meeting�the�teams�were�provided�with�a�copy�of�the�user�manual.�In�addition,�the�procedures�for�using�it�were�orally�explained�and�ques�tions�were�answered�in�order�to�clarify�what�the�teams�could�expect�while�using�it.�It�was�suggested�to�the�teams�that�they�could�send�part�of�the�results�of�the�analysis�of�one�participant's�task�performance�to�the�first�author�of�the�present�article�(who�had�not�been�involved�in�conducting�the�tests).�In�this�way,�they�would�have�the�opportu�nity�to�have�their�analyses�checked�for�misunderstanding�SlimDEVAN.�Team�C�made�use�of�this�possibility.�

What’s�the�problem?�Studies�on�identifying�usability�problems�in�user�tests� �
78
� 3.3� The�teams’�SlimDEVAN�analyses�
Below,�each�team's�implementation�of�the�SlimDEVAN�reference�analysis�is�described.��
� 3.3.1� Team�A�In�case�of�lab�A,�two�researchers�participated�in�the�SlimDEVAN�analysis.�These�were�the�same�researchers�as�in�the�lab�specific�approach.�First,�the�researchers�together�analyzed�part�of�one�participant's�session�that�seemed�difficult�to�analyze�and�dis�cussed�their�implementation�of�SlimDEVAN.�In�this�way�they�developed�a�common�un�derstanding�about�the�use�of�it.�Then,�each�researcher�watched�the�videos�of�four�par�ticipants�and�took�notes�using�identical�table�formats�(see�Figure�B1,�Appendix�B�for�an�example).�The�checklist�card�was�used�as�a�reference�during�the�analysis.�In�addition,�researcher�2�(the�observer)�sometimes�compared�fragments�from�different�sessions�to�ensure�better�consistency.�Also,�researcher�2�analyzed�one�(difficult�to�understand)�session�twice�to�feel�more�confident�about�the�findings.�Subsequently,�researcher�2�went�through�all�typed�up�tables�of�both�researchers�to�check�for�consistency�in�assign�ing�codes.�This�led�to�only�a�few�changes�in�the�tables�of�researcher�2.�Finally,�for�each�participant�a�usability�problem�list�was�created.�This�was�done�by�researcher�1.�Figure�B2�(Appendix�B)�shows�an�example�of�the�format�used�for�reporting�the�problems.��
� 3.3.2� Team�B�In�case�of�lab�B,�researcher�1�(the�observer)�did�the�analysis.�The�SlimDEVAN�analysis�started�from�the�log�files�made�in�the�team’s�initial�analysis.�Figure�B3�(Appendix�B)�shows�an�example�of�part�of�a�session�log�made�by�team�B.�Figure�B4�(Appendix�B)�shows�an�example�report�format1.�The�researcher�went�through�all�log�files�on�the�computer�and�while�going�through�them,�the�video�recordings�were�automatically�kept�synchronized�with�the�log�files.�The�dedicated�software�for�logging�was�modified�to�allow�for�entering�SlimDEVAN�codes�as�markers�into�the�log�files.�An�additional�marker�called�Comment�was�added�for�difficulty�signals�found�in�the�interviews�and�for�comments�from�the�researcher�(e.g.,�ideas�for�solutions�to�problems).�As�the�video�recordings�ran�along�with�the�log�files,�it�was�possible�for�the�researcher�to�especially�focus�on�those�parts�of�the�video�for�which�no�loggings�were�made,�as�well�as�on�parts�of�the�log�files�for�which�it�was�not�clear�what�exactly�had�been�observed.�At�several�points�the�original�log�files�(from�the�lab�specific�analysis)�proved�to�be�incomplete.��Subsequently,�the�log�files�(including�the�SlimDEVAN�codes)�were�filtered�such�that�a�list�of�(SlimDEVAN)�coded�events�was�created.�Findings�were�then�defined�based�on�the�coded�events�and�multiple�events�could�be�linked�to�a�single�finding.�In�the�next�step�of�the�analysis,�the�findings�were�grouped�into�categories�that�emerged�during�the��
�
1� Although�log�files�with�SlimDEVAN�codes�were�made�for�all�eight�participants,�team�B�accidentally�reported�problems�for�only�six�participants.��

� � � Chapter�3�Usability�problem�reports�for�comparative�studies:�consistency�and�inspectability
79
process�itself�(e.g.,�consistency,�changing�parameters�during�cooking,�etc.).�Categories�in�turn�were�grouped�into�chapters.�Summaries�of�the�findings�reported�in�a�chapter�were�made�and�frequencies�of�findings�were�related�to�variables�like�participant,�par�ticipant�characteristics�or�tasks,�to�get�more�insight�into�those�situations�in�which�prob�lems�occurred�(in�the�report�this�was�referred�to�as�validity).�Descriptions�of�loosely�judged�problem�severity�were�written�as�well�as�suggestions�for�solutions.�In�writing�about�validity,�severity�and�suggestions,�the�researcher�especially�searched�for�inspira�tion�by�going�through�those�events�that�had�not�resulted�in�findings.�
� 3.3.3� Team�C�In�case�of�lab�C,�both�researchers�together�watched�the�tape�of�one�of�the�participants�and�discussed�it�in�relation�to�the�SlimDEVAN�checklist.�Researcher�2�then�watched�the�video�of�that�participant�again�and�wrote�down�actions�and�times�of�actions.�Subse�quently,�researcher�2�watched�the�video�again�to�add�participant�expressions�to�the�ac�tion�log,�as�well�as�to�assign�SlimDEVAN�codes�to�events.�Researcher�1�followed�the�same�procedure�for�the�other�seven�participants.�Notes�were�typed�up�by�each�of�the�researchers�in�a�format�as�shown�in�Figure�B5�(Appendix�B).�Finally,�researcher�1�used�the�format�as�shown�in�Figure�B6�(Appendix�B)�to�create�a�list�of�usability�problems�and�indicate�which�participants�experienced�each�problem.��
� 4� Comparing�the�reports�
In�this�section,�the�protocols�for�making�comparisons�are�presented�along�with�the�re�sults�of�the�comparisons.�First,�in�section�4.1,�how�the�findings�in�the�teams’�reports�were�re�formatted�into�a�form�that�allowed�for�making�comparisons�will�be�discussed:�across�teams,�as�well�as�across�each�team’s�subsequent�analyses.�Issues�of�inspectabil�ity�of�reports�as�experienced�in�this�process�are�discussed.�Then,�in�section�4.2,�it�is�dis�cussed�what�exact�measures�are�used�for�making�comparisons.��
� 4.1� Making�the�reported�findings�comparable�
� 4.1.1� Procedure�and�resulting�material�Figure�4�illustrates�the�process�of�making�the�reported�findings�comparable.�Starting�points�were�the�reports�with�problem�descriptions�as�they�were�handed�in�by�the�teams�(figure�4,�blocks�at�the�top).�The�reports�were�used�and�compared�without�any�further�clarification�and�explanations�by�the�teams.�The�comparer�(the�first�author�of�the�present�article,�who�had�not�been�involved�in�conducting�or�analyzing�any�of�the�test�sessions)�read�through�all�reports�and�(as�much�as�possible)�annotated�each�mo�ment�of�difficulty�reported�in�a�problem�description�with�a�unique�identification�num�ber�(id).�However,�this�proved�not�always�to�be�possible.�In�some�cases,�problem�de�scriptions�referred�to�n�unspecified�users�having�experienced�the�problem,�or��

What’s�the�problem?�Studies�on�identifying�usability�problems�in�user�tests� �
80
�Figure�4�Problem�descriptions�in�team�reports�(blocks�at�the�top)�were�re�formatted�into�difficulty�records�(blocks�in�the�middle).�Then�similar�moments�of�difficulty�were�grouped�in�order�to�arrive�at�a�master�list�of�usability�problems�(block�at�the�bottom).�
contained�no�reference�to�any�specified�user�or�specified�number�of�users�at�all.�Figure�5�specifies�the�applied�decision�procedure�for�assigning�ids�to�moments�of�difficulty.�Af�ter�ids�were�linked�to�the�specific�problem�descriptions,�a�difficulty�record�was�created�for�each�id�(figure�4,�blocks�in�the�middle).�Figure�6�provides�an�overview�of�attributes�of�problem�descriptions�that�were�used�as�fields�in�the�difficulty�records.�This�part�of�the�process�resulted�in�a�total�of�466�difficulty�records.��After�entering�as�many�attributes�as�possible�for�each�of�the�moments�of�difficulty,�us�ability�problems�were�defined�based�on�similarity.�This�was�done�in�an�iterative,�data�driven�process�where�the�actual�problem�definitions�emerged�from�the�descriptions�of�the�moments�of�difficulty�themselves.�Figure�7�shows�some�example�usability�prob�lems.�

� � � Chapter�3�Usability�problem�reports�for�comparative�studies:�consistency�and�inspectability
81
Moments�of�difficulty�had�to�be�similar�in�fairly�high�levels�of�detail�for�considering�them�to�be�the�same�problem.�For�example,�one�might�argue�that�the�first�three�prob�lems�mentioned�in�figure�7�essentially�are�instances�of�one�underlying�problem,�namely�a�problem�with�the�rotary�knob.�However,�important�in�many�comparative�user�studies�and�in�studies�conducted�in�design�contexts�are�inferences�about�causes�of�reported�problems.�In�this�example�case,�the�three�mentioned�problems�led�to�different�expla�nations�of�why�the�rotary�knob�related�problems�occurred;�in�case�of�the�first�problem,�participants�in�their�attempts�to�stop�the�cooking�process�tried�to�set�a�very�low�tem�perature�by�turning�the�rotary,�whereas�in�the�second�case�participants�most�likely�as�sumed�that�the�cooking�process�could�directly�be�stopped,�by�pressing�the�rotary�knob.�These�problems�refer�to�two�different�strategies�for�trying�to�stop�the�cooking�process.�As�to�the�second�and�third�problem:�they�both�start�from�the�same�wrong�use�of�the�ro�tary�knob�(trying�to�press�it,�whilst�this�was�not�possible).���
if�a�problem�description�explicitly�referred�to�a�moment�in�only�one�specified�user’s�interaction�(i.e.,�one�moment�of�difficulty)�this�was�recorded�as�one�single�id�(and�thus�as�one�single�difficulty�record),�with�a�reference�to�that�specific�user;��if�a�problem�description�referred�to�moments�in�all�users’�interactions,�these�were�recorded�as�individual�difficulty�records�for�each�individual�user�(so�in�case�of�a�difficulty�for�all�8�users,�this�turned�into�8�difficulty�records);��if�a�problem�description�referred�to�moments�in�n�specified�users’�interactions�(where�n�<�the�total�number�of�users),�the�reported�difficulties�were�recorded�as�n�difficulty�records�each�referring�to�an�individual�user;���if�a�problem�description�referred�to�moments�in�n�unspecified�users’�interactions�(where�n�<�the�total�number�of�users),�it�was�recorded�as�one�single�difficulty�record,�and�a�reference�was�made�to�‘n�users’,�without�specifying�the�users�(because�they�were�un�known).���if�a�problem�description�referred�to�moments�in�a�not�specified�number�of�unspecified�users'�interactions,�it�was�recorded�as�one�single�difficulty�record,�stating�‘unspecified’�in�the�database�field�referring�to�users.�
Figure�5�Checklist�that�was�used�for�deciding�how�to�create�difficulty�records�from�problem�de�scriptions.�
In�case�of�the�second�problem�this�was�done�with�the�aim�of�trying�to�immediately�stop�the�cooking�process,�whereas�in�case�of�the�third�problem,�this�was�done�to�select�a�menu�item�or�to�make�a�menu�setting.�Thus,�these�three�problems�are�likely�to�have�dif�ferent�causes�and�it�is�very�likely�that�in�a�design�context�these�problems�would�lead�to�

What’s�the�problem?�Studies�on�identifying�usability�problems�in�user�tests� �
82
different�interface�revisions.�Identifying�these�three�problems�as�one�single�problem�might�lead�to�false�impressions�of�agreement�similar�to�those�reported�by�Hertzum,�Ja�cobsen�and�Molich�(2002).�The�process�described�above�resulted�in�a�list�of�63�different�usability�problems�(figure�4,�block�at�the�bottom).��
�Attributes�(fields)�
�Possible�values�
1.�ID� Unique�number.�2.�Team�that�reported�the�problem� <A>,�<B>,�<C>�3.�Participant� <Name>�and�<participant�number>,�or�<unspecified>,�or�<number�of�
participants>�4.�Data�analysis�approach� <Lab�specific>�or�<SlimDEVAN>�5.�Task� <Task�number>�and�short�phrase�indicating�the�task�(e.g.,�<Stop�the�
cooking�process>)�6.�Description�of�difficulties�and�
causes�assumed�by�the�evalua�tor�
Copied�from�the�teams’�reports�in�unedited�form�
7.�The�action�stage�at�which�the�problem�occurred�
Action�stages�based�on�Hartson�(2003):�<Planning>,�<Translation>,�<Physical>,�<Outcome>,�<Assessment>,�<Independent>�
8.�The�context�in�which�the�prob�lem�occurred.�
Exact�reference�in�grammar�form�to�a�screen�image�on�the�product:�Cooking_mode_setting�(Tab:�Cooking,�Menu:�menu�where�mode�for�cooking�can�be�set)�
9.�Target�context�(i.e.,�screen�image�that�would�have�been�shown�had�the�participant�per�formed�the�correct�action�in�the�context�of�the�provided�task)�
Exact�reference�in�grammar�form�to�a�screen�image�on�the�product:�Cooking_mode_setting�(Tab:�Cooking,�Menu:�menu�where�mode�for�cooking�can�be�set)�
10.�Action�that�would�have�been�correct�in�the�context�of�the�task�and�would�have�led�to�the�target�context.�
Specified�in�loosely�defined�grammar�that�indicates�the�required�steps�in�detail.�For�example�<select_cooking_OK>�(i.e.,�participant�has�to�use�the�rotary�labeled�'select'�to�select�the�Cooking�tab�and�then�press�the�button�'OK'�to�confirm�the�selection).��
11.�Action�that�was�performed�by�the�participant�
Specified�in�loosely�defined�grammar�that�indicates�the�steps�per�formed�by�the�participant�in�detail.�For�example�<press_select>�(i.e.,�participant�pressed�the�rotary�labeled�'select').�
12.�Relevance�to�the�problem�of�a�number�of�high�level�issues�(vari�ables).��
��
For�each�variable,�relevance:�<Yes>,�<No>,�<Maybe>.�Multiple�variables�can�be�relevant,�at�least�one�is�relevant.��Variables�were:�•�manually�setting�some�cooking�parameters�•�making�settings�for�selecting�recipes�•�actions�for�naming�self�defined�recipes��•�actions�for�starting�a�cooking�process,�and�for�editing�or�stopping�an�
ongoing�cooking�process�•�issues�related�to�making�general�settings,�like�the�clock�time�etc.�•�issues�related�to�defrost�settings�•�issues�related�to�low�level�issues�on�how�to�use�buttons�and�menus�•�issues�related�to�the�meaning�and�use�of�the�'Back'�button�
Figure�6�Attributes�of�moments�of�difficulty�as�specified�in�the�fields�of�the�difficulty�records.�

� � � Chapter�3�Usability�problem�reports�for�comparative�studies:�consistency�and�inspectability
83
As�the�choice�of�the�level�of�abstraction�of�problems�is�to�some�extent�arbitrary�and�can�be�expected�to�influence�agreement�levels,�a�second�way�of�categorizing�problems�was�used�as�well.�This�other�way�of�categorizing�was�purely�based�on�the�higher�level�issues�as�specified�in�the�usability�problem�attributes�(see�figure�6,�attribute�12).�In�this�higher�level�categorization,�problems�were�characterized�by�combining�(mostly�pairs�of)�higher�level�issues�that�were�marked�as�relevant�to�the�reported�moment�of�diffi�culty.�For�example,�if�a�moment�of�difficulty�related�to�the�issues�manually�setting�the�cooking�parameters�(abbreviated�as�Cooking)�and�low�level�issues�on�how�to�use�buttons�and�menu�(in�short�Interaction�techniques),�it�would�be�categorized�as�<Cooking>�<Interaction�Techniques>.�In�cases�where�only�one�issue�related�to�the�moment�of�diffi�culty�it�was�characterized�as,�for�example�<Cooking>�<Only>.�In�rare�cases�of�more�than�two�issues,�all�possible�combinations�of�two�marked�issues�were�treated�as�separate�categories�(this�was�done�to�get�all�data�in�the�same�shape).�This�resulted�in�a�total�of�35�high�level�problem�category�pairs.�For�most�analyses�the�(detailed)�63�problems�were�used.�The�35�high�level�problem�category�pairs�were�only�used�for�comparing�agreement�measures.�
� 4.1.2� Findings�on�consistency�and�inspectability�The�process�of�creating�a�master�list�of�usability�problems�proved�to�be�hindered�by�how�problem�descriptions�were�structured�(inconsistent�formats),�by�the�formulations�that�were�used,�as�well�as�by�the�reports'�lack�of�inspectability.��������������Figure�7�Examples�of�usability�problems�(from�the�master�list�of�usability�problems).�
Inconsistencies�in�problem�formulations���Sometimes�problem�descriptions�were�formu�lated�in�behavioral�terms�of�difficulties�encountered�by�users�(e.g.,�Figure�A4,�Appendix�A:�"…�users�continued�interacting�thinking�that�the�oven�was�still�cooking"�or�"…�one�user�tried�to�reduce�the�temperature…�").�In�other�cases�problem�descriptions�were�formulated�in�terms�of�problematic�product�features;�then�it�was�sometimes�unclear�whether�any�of�the�users�actually�experienced�the�problem�or�what�exact�difficulty�they�had�encountered�(e.g.,�Figure�A4,�Appendix�A):�"Left�hand�arrow�indicating�that�there�is�a�submenu�available�is�not�clear").�In�yet�other�cases,�behavioral�descriptions�of�problematic�interaction�episodes�were�given,�but�the�difficulties�themselves�were�not�
Uses�rotary�to�stop�the�cooking�process�Presses�rotary�knob�to�stop�the�cooking�process�Presses�rotary�knob�to�select�a�menu�item�or�set�time�Participant�hesitates�to�select�EDIT�for�prolonging�the�cooking�time.�Inefficient�having�to�do�so�many�actions�for�making�settings:�composing�a�name�Setting�wintertime�should�not�be�done�by�just�changing�the�hours�and�minutes�Inconsistency�between�menu�options�with�and�without�default�values�Misunderstanding�that�BACK�in�tabs�menu�displays�main�menu�showing�the�clock�time.�Participant�needs�to�be�able�to�make�longer�names�for�own�recipes.�

What’s�the�problem?�Studies�on�identifying�usability�problems�in�user�tests� �
84
described�separately.�This�sometimes�made�it�difficult�to�infer�what�exactly�the�re�searchers�thought�the�difficulty�was�or�whether�they�thought�that�multiple�moments�of�difficulty�had�occurred�(e.g.,�Figure�A1,�Appendix�A):�"…�Pressed�rotary�knob,�turned.�Presses�‘stop’�but�puzzled�when�she�saw…(etc.)").��The�inconsistencies�in�problem�descriptions�hindered�the�construction�of�a�master�us�ability�problem�list.�In�cases�where�one�of�a�team's�report�described�a�problem�in�be�havioral�terms,�and�the�other�described�it�in�terms�of�a�problematic�product�feature,�it�often�proved�to�be�difficult�to�decide�whether�the�descriptions�actually�referred�to�the�same�moment�of�difficulty;�to�be�able�to�do�so�a�comparer2�has�to�infer�causal�relation�ships�between�observed�behavior�and�problematic�product�features.�Similar�problems�occurred�in�cases�where�problematic�interaction�episodes�were�described�without�separate�descriptions�or�marking�of�difficulties.�In�order�to�find�out�to�what�extent�such�a�description�refers�to�the�same�moment�of�difficulty�as�other�problem�descriptions�formulated�in�terms�of�an�encountered�difficulty,�a�comparer�has�to�infer�what�the�ana�lyst�may�have�concluded�about�how�many�(and�how�many�types�of)�difficulties�are�em�bedded�in�the�described�interaction.��
Useful�information�complementary�to�difficulty�descriptions���The�core�of�the�problem�de�scriptions�in�the�teams’�reports�(i.e.,�descriptions�of�difficulties�and�of�problematic�fea�tures)�was�often�provided�with�complementary�information.�Such�additional�informa�tion�sometimes�proved�to�be�essential�(and�often�at�least�very�helpful)�for�a�better�un�derstanding�of�the�problem.�For�example,�mentioning�the�task�in�which�a�difficulty�oc�curred�provides�context�that�can�help�in�envisioning�the�situation�in�which�the�difficulty�occurred.�Suggestions�for�interface�improvements�or�inferences�about�how�design�ele�ments�may�have�caused�the�problems�may�implicitly�detail�difficulty�description�(e.g.,�Figure�B2,�Appendix�B:�the�description�of�the�difficulty�only�states�"…�User�presses�ro�tary�knob�to�stop�the�oven",�whereas�the�inference�about�what�may�have�caused�the�difficulty�includes�the�statement:�"…�The�rotary�knob�is�the�most�dominant�element�among�the�controls,�so�that�the�user�is�directed�to�that�without�much�intention."�By�stat�ing�this,�the�researcher�implicitly�details�the�difficulty�description�by�suggesting�that�the�user’s�focus�of�attention�may�have�been�at�the�wrong�place.)��Thus,�information�complementary�to�the�core�of�the�problem�description�can�be�useful�to�a�better�understanding�of�the�observed�interaction.�However,�in�a�number�of�cases�another�problem�then�showed�up.�For�example,�in�some�cases�suggestions�for�solutions�or�inferences�about�possible�causes�were�not�linked�to�specific�observed�difficulties�on�a�one�to�one�basis;�instead,�a�group�of�inferences�about�causes�were�linked�to�a�group�of�difficulties�or�reasons�of�difficulties.�For�example,�in�Figure�A3�(Appendix�A),�it�is�un�clear�whether�the�researcher�intended�to�relate�suggestion�3�about�users’�preferences�for�a�stop/start�button�to�one�of�three�mentioned�reasons�or�only�to�the�main�problem�("…Users�find�the�stop�button�easily,�press�the�button,�but�are�then�confused�by�the��
�2� From� now� on� the� person� who� makes� the� comparisons� between� the� team� reports� will� be� referred� to� as� the�
'comparer'�(for�reasons�of�brevity).�

� � � Chapter�3�Usability�problem�reports�for�comparative�studies:�consistency�and�inspectability
85
�feedback�the�oven�provides").�Raw�descriptions�of�what�users�said�during�or�after�interactions�also�provided�comple�mentary�information�that�helped�in�better�understanding�ambiguous�problem�descrip�tions.�For�example�in�Figure�B4�(Appendix�B):�the�main�problem�was�formulated�as�"…�When�alarm�is�set�it�is�not�clear�if�time�indicates�time�until�alarm�or�indicates�the�actual�time."�The�comment�the�user�gives�in�the�second�finding�at�the�bottom�of�the�page�"…�I�was�not�sure�if�duration�was�the�total�time�or�the�time�left"�provides�extra�information�that�can�be�taken�into�account�in�trying�to�interpret�the�(more�or�less�cryptic,�main)�problem�formulation.��
Inspectability�of�data�analyses���In�some�team�reports,�some�of�the�raw�descriptions�re�ferred�to�above�were�included�and�clarified�reported�problems.�However,�in�many�cases�raw�descriptions�were�missing�and�could�only�be�found�in�the�log�overviews�rep�resenting�observed�interactions.�In�order�for�that�to�be�of�any�use,�it�should�be�possible�to�exactly�trace�back�which�raw�descriptions�relate�to�which�problem.�This�relates�to�the�issue�of�inspectability.�Inspectability�of�data�analyses�can�sometimes�alleviate�the�problems�mentioned�above.�For�example,�if�the�description�of�a�problematic�feature�has�some�kind�of�reference�to�a�specific�moment�that�is�captured�in�some�representa�tion�of�an�interaction,�that�interaction�may�be�re�inspected�to�find�out�what�observa�tion�lies�at�the�basis�of�the�problem.��The�primary�reference�needed�for�inspectability�always�is�a�reference�to�the�specific�user�that�encountered�the�difficulty.�In�cases�where�it�is�not�specified�which�user�encoun�tered�a�difficulty,�it�becomes�a�very�tedious�and�difficult�job�to�go�through�all�interac�tions�and�try�and�identify�the�exact�session�and�moment�at�which�the�difficulty�oc�curred.�In�those�cases�where�this�was�tried,�it�usually�ended�up�with�various�candidate�moments�from�multiple�users’�interactions.�No�further�information�was�then�available�for�a�better�understanding�of�problem�descriptions.�In�addition�to�references�to�users,�references�to�tasks�also�proved�to�be�very�helpful.�Not�only�because�the�task�description�in�itself�helps�in�envisioning�the�context�in�which�a�difficulty�might�have�occurred�(see�before),�but�also�because�it�makes�it�possible�to�search�in�a�more�focused�way�for�the�specific�interaction�in�which�a�difficulty�has�(or�might�have)�occurred.�In�many�cases�such�a�reference�to�a�task�is�not�needed,�because�it�is�almost�obvious�in�which�task�a�difficulty�must�have�occurred�(e.g.,�Figure�A4�(Ap�pendix�A):�it�is�very�likely�–�though�not�certain�–�that�the�difficulty�"…�after�the�user�presses�Stop,�there�is�no�feedback�that�the�oven�has�stopped�cooking"�refers�to�the�task�in�which�the�user�is�asked�to�stop�the�cooking�process).�However,�in�some�cases�this�is�less�clear�(e.g.,�Figure�A4�(Appendix�A):�the�problem�left�hand�arrow�indicating�that�there�is�a�submenu�available�is�not�clear�could�have�occurred�in�many�tasks).�In�general,�information�about�the�task�in�which�a�difficulty�occurred�helped�in�finding�back�interac�tion�episodes�when�overviews�of�interactions�were�available.�Again,�this�was�helpful�because�in�such�overviews�complementary�information�could�be�found�that�helped�in�understanding�the�problem�(e.g.,�verbal�utterances�of�users,�or�for�example,�sequences�

What’s�the�problem?�Studies�on�identifying�usability�problems�in�user�tests� �
86
of�actions�that�helped�re�constructing�what�the�state�of�the�product�must�have�been�at�the�time�when�the�problem�occurred).�
� 4.2� The�comparisons�
The�previous�section�described�how�problem�descriptions�were�made�comparable.�This�was�done�by�first�re�formatting�them�into�uniformly�structured�difficulty�records�and�by�then�constructing�a�master�list�of�usability�problems.�This�process�of�making�findings�comparable�allowed�for�the�comparisons�that�are�described�in�the�following�section.��First,�comparisons�between�(findings�from)�the�teams’�initial�and�reference�analyses�will�be�discussed.�Quantitative�comparisons�are�made�on�the�number�of�problems�iden�tified�in�each�of�the�analyses,�and�the�amount�of�overlap�in�problems�was�determined.�An�analysis�is�given�on�why�certain�problems�were�reported�in�one�analysis�and�not�in�the�other.�This�provides�some�information�on�consistency�of�teams,�when�re�analyzing�interactions.�Experiences�in�trying�to�trace�back�causes�of�inconsistencies�are�then�dis�cussed�and�shed�a�light�on�inspectability�of�reports.��Next,�comparisons�between�teams�are�discussed,�for�the�initial�analyses�as�well�as�for�the�reference�analyses.�Quantitative�comparisons�are�made�of�what�was�specified�about�each�difficulty�in�the�teams'�problem�descriptions,�as�well�as�about�the�extent�to�which�teams�reported�similar�or�different�problems�(agreement�or�consistency�across�teams).��
� 4.2.1� Comparing�problems�reported�in�a�team's�subsequent�analyses�For�comparing�how�many�problems�the�teams’�subsequent�analyses�produced,�a�measure�of�thoroughness�(Hartson,�Andre�and�Williges,�2001)�was�used,�and�overlap�in�identified�problems�was�examined�(i.e.,�the�number�of�problems�that�a�team�found�in�both�analyses,�divided�by�the�total�number�of�problems�they�found�in�the�two�analy�ses).�For�calculating�thoroughness�and�overlap,�usability�problems�(from�the�master�list�of�usability�problems)�were�used�as�units�of�comparison.�In�addition,�all�problems�that�were�uniquely�identified�either�by�a�team’s�initial�analysis�or�by�its�reference�analysis�were�further�inspected�to�trace�back�reasons�of�uniqueness.�For�that�inspection,�usabil�ity�problems�were�traced�back�to�the�difficulty�records�on�which�they�were�based�and�if�necessary�to�the�teams'�original�problem�descriptions�in�their�reports.��
Thoroughness.���Hartson,�Andre�and�Williges�(2001)�define�thoroughness�as�the�number�of�real�problems�found�divided�by�the�number�of�real�problems�that�exist.�In�this�case,�it�was�assumed�that�all�problems�identified�are�real,�as�we�had�no�reference�criterion�to�determine�whether�problems�are�real�or�not.�The�number�of�real�problems�that�exist,�is�defined�here�as�the�sum�of�all�problems�found�by�all�three�teams�(teamA�teamB�teamC),�using�both�their�initial�and�reference�analyses��(teamXlabspecific�teamXSlimDEVAN).�Figure�8�presents�the�results�of�the�calculations.��
�

� � � Chapter�3�Usability�problem�reports�for�comparative�studies:�consistency�and�inspectability
87
� Initial�analyses��
(lab�specific)�Reference�analyses�(SlimDEVAN)�
A/(A�B�C)labspecific�SlimDEVAN� 26/63 = 41,3 % 29/63 = 46,0 %
B/(A�B�C)labspecific�SlimDEVAN� 23/63 = 36,5 %* 27/63 = 42,9 %
C/(A�B�C)labspecific�SlimDEVAN� 23/63 = 36,5 % 33/63 = 52,4 %
*� Because�for�the�reference�analysis�with�SlimDEVAN�the�results�of�only�6�(instead�of�8)�partici�pants�were�reported,�the�measures�for�the�team’s�initial�report�are�based�on�the�results�of�the�same�6�participants.�
Figure�8�Thoroughness�of�data�analyses�(usability�problems�as�unit�of�comparison)�
For�all�teams,�the�second�(reference)�reports�describe�a�larger�number�of�problems�than�the�initial�team�reports.�Thus�the�second�analysis�must�have�revealed�problems�that�were�not�revealed�in�the�initial�analysis.�However,�based�on�the�summative�figures�of�thoroughness�it�cannot�be�excluded�that�the�initial�analysis�also�identified�some�unique�problems.�Thus,�as�a�next�step,�which�analyses�yielded�unique�problems,�and�to�what�extent,�will�be�examined.���
Figure�9�Number�of�problems�identified�in�the�teams’�initial�reports�and�in�the�teams’�reference�(second)�reports.�The�black�areas�indicate�overlap�in�problems�between�the�first�and�second�re�ports.�Because�team�B's�SlimDEVAN�report�reported�results�of�only�six�(instead�of�eight)�partici�pants,�the�measures�for�the�lab�specific�approach�are�based�on�the�results�of�the�same�six�partici�pants.�
Team A
Initial report
Reference report
3
12
23
Team B
Initial report
Reference report
8
12
15
Team C
Initial report
Reference report
8
18
15
Team A
Initial report
Reference report
3
12
23
Team A
Initial report
Reference report
Team A
Initial report
Reference report
3
6
23 3 23
Team B
Initial report
Reference report
8
12
15
Team B
Initial report
Reference report
Team B
Initial report
Reference report
8
12
15 8
12
15
Team C
Initial report
Reference report
8
18
15
Team C
Initial report
Reference report
Team C
Initial report
Reference report
8
18
15 8
18
15

What’s�the�problem?�Studies�on�identifying�usability�problems�in�user�tests� �
88
Overlap�and�uniqueness���Figure�9�shows�that�for�all�three�teams,�both�the�initial�analyses�as�well�as�the�reference�analyses�identified�unique�problems.�Because�the�thorough�ness�of�reference�analyses�was�always�higher�than�the�thoroughness�of�initial�analyses�the�number�of�unique�problems�was�always�higher�for�the�reference�analyses.�Within�team�consistencies�(i.e.,�the�proportion�of�overlap�depicted�in�figure�9)�varied�consid�erably�across�the�three�teams:�72%�(=23/(23+3+6))�for�team�A,�43%�(=15/(15+8+12))�for�team�B�and�37%�(=15/(15+8+18))�for�team�C.��
Inspecting�why�problems�were�reported�in�only�one�of�the�teams’�analysis�reports����Uniqueness�of�problems�extracted�in�only�one�of�the�analyses�can�be�explained�in�at�least�two�ways.�It�can�be�due�to�methodological�differences�in�the�subsequent�analyses�(e.g.,�the�focus�of�a�data�analysis�procedure�or�the�way�usability�problems�are�defined),�or�it�can�be�due�to�something�like�‘chance’�(because�researchers,�as�part�of�the�meas�urement�instrument,�can�not�be�expected�to�be�equally�concentrated�during�all�situa�tions�in�their�analysis).�Below,�unique�problems�are�studied�in�more�detail�by�trying�to�find�out�to�what�extent�the�specific�moments�of�difficulty�on�which�they�were�based�had�been�observed�and�analyzed�in�both�analyses,�and�how�these�were�further�inter�preted�in�each�of�the�analyses.�For�that,�problems�were�first�traced�back�to�the�diffi�culty�records�on�which�they�were�based�and�from�there,�if�necessary�and�possible�to�available�interaction�overviews�that�provided�detailed�insight�into�what�actually�hap�pened.�For�example,�if�a�problem�was�identified�in�the�reference�analysis,�but�not�in�the�initial�analysis,�one�could�search�in�the�reports�of�the�initial�analysis�to�find�out�whether�the�moment�of�difficulty�had�been�observed�at�all�and�had�been�interpreted�differently,�or�whether�it�seemed�to�have�been�overlooked.�Thus,�if�a�moment�of�difficulty�was�uniquely�found�in�the�reference�analysis�and�it�was�not�possible�to�find�anything�back�about�it�in�the�reports�of�the�initial�analysis,�this�tells�something�about�the�(un)�inspect�ability�of�the�report�from�the�initial�analysis;�after�all�both�analyses�were�based�on�the�same�observed�interactions.��For�57�(out�of�102)�moments�of�difficulty�that�were�uniquely�based�on�one�of�the�two�reports�it�appeared�to�be�impossible�for�the�comparer�to�find�anything�about�it�in�the�other�report�because�of�inspectability�problems.�In�the�remaining�45�cases�there�were�no�inspectability�problems�and�reasons�of�uniqueness�could�be�analyzed.�On�closer�in�spection,�in�10�out�of�these�45�cases�a�problem�had�incorrectly�been�considered�unique;�in�these�cases�the�comparer�had�problems�in�interpreting�the�problem�report�which�then�led�to�difficulties�in�recognizing�the�usability�problem�underlying�the�moment�of�difficulty.�In�35�cases�uniqueness�could�be�traced�back�to�specific�parts�of�the�data�analysis�process.�Below�these�categories�are�dealt�with�in�more�detail.��
No�inspection�possible:�unknown�reasons�of�uniqueness���Figure�10�shows�how�the�57�cases�in�which�moments�of�difficulty�appeared�not�be�inspectable�were�distributed�across�the�teams.�There�were�two�main�reasons�for�hindering�inspectability:�(1)�al�though�the�problems�were�described,�the�moments�of�difficulty�on�which�they�were�

� � � Chapter�3�Usability�problem�reports�for�comparative�studies:�consistency�and�inspectability
89
based�were�not�described;�in�such�cases�one�has�no�starting�points�for�inspecting�the�other�report,�or�(2)�it�was�not�possible�to�link�back�from�a�problem�description�in�the�re�port�to�a�moment�of�difficulty�reported�in�the�other�report.��Figure�10�shows�that�45�(out�of�the�57)�moments�of�difficulty�with�un�inspectable�rea�son�of�uniqueness�came�from�the�reference�reports�(the�sum�of�the�values�of�the�black�bars),�whereas�12�came�from�the�initial�reports�(sum�of�white�bar�values).�By�analyzing�the�reasons�of�un�inspectability,�it�becomes�clear�to�what�extent�these�lie�in�the�refer�ence�reports�or�in�the�initial�reports.��Team�A.�In�case�of�team�A�for�five�difficulties�uniquely�reported�in�the�initial�report�it�was�not�possible�to�find�anything�back�in�the�reference�reports.�As�no�complete�interac�tion�overviews�were�available�in�the�initial�report�(see�Figure�A1,�Appendix�A)�the�only�way�to�find�the�moment�of�difficulty�is,�would�be�to�re�view�the�video�tapes.�Therefore,�essentially�this�is�a�problem�of�inspectability�of�the�initial�reports�that�did�not�guide�enough�in�where�to�search�for�the�unique�difficulty�in�the�other�analysis.�In�case�of�six�moments�of�difficulty�uniquely�reported�in�the�reference�report,�the�reason�of�unique�ness�was�not�traceable,�again�for�the�same�reason:�in�the�initial�reports�there�were�no�complete�interaction�overviews�for�verifying�whether�the�interaction�that�lies�at�the�basis�of�the�difficulty�had�even�been�observed�or�not.��Team�B.�In�case�of�team�B�for�15�moments�of�difficulty�uniquely�identified�in�the�refer�ence�analysis,�there�was�a�lack�of�inspectability�of�the�initial�report.�This�lack�of�inspect�ability�was�a�result�of�the�fact�that�in�the�initial�analyses�(or�at�least�in�the�initial�report;�see�Figure�A3,�Appendix�A)�there�were�no�(relatively�complete)�overviews�that�repre�sented�the�users’�interactions�(there�were�only�some�example�interactions�embedded�in�the�problem�descriptions).�Trying�to�inspect�uniqueness�of�moments�of�difficulty�would�then�imply�re�viewing�the�video�recorded�interactions�for�the�specific�task�performance�of�the�specific�user�again.�Team�C.�In�case�of�team�C,�of�24�moments�of�difficulty�were�uniquely�identified�in�the�reference�analysis,�for�which�there�was�an�inspectability�problem�in�relation�to�the�ini�tial�report�(see�Figure�A4,�Appendix�A).�A�major�reason�for�that�was�that�in�the�initial�report�those�moments�of�difficulty�had�no�reference�to�specific�users,�some�also�had�no�reference�to�a�specific�task�and�no�interaction�overviews�were�available.�Therefore,�it�was�practically�impossible�to�reliably�trace�back�the�moments�of�difficulty�identified�in�the�reference�analysis�to�something�in�the�initial�reports�if�the�same�problem�descrip�tions�were�not�explicitly�mentioned�there.�Also�the�cases�of�the�three�unique�moments�of�difficulty�that�were�identified�in�the�initial�reports�only�were�caused�by�the�lack�of�in�spectability�of�the�initial�reports.�These�concerned�suggestions�for�solutions�for�which�it�was�unclear�whether�any�specific�observed�difficulty�had�been�at�the�basis�of�it.�In�four�other�cases,�the�comparer�had�no�idea�why�the�problems�had�not�been�recorded�in�the�reference�analysis:�a�lack�of�interaction�overviews�in�the�initial�reports�made�it�impossi�ble�to�verify�whether�the�problem�had�actually�occurred�or�not�(unless�the�video�re�cordings�would�be�re�viewed).��Thus,�in�summary,�the�initial�reports�proved�to�be�less�inspectable�than�the�reference�reports.�Problems�of�a�lack�of�inspectability�of�the�initial�reports�occurred�largely�be�

What’s�the�problem?�Studies�on�identifying�usability�problems�in�user�tests� �
90
cause:�initial�reports�provided�no�complete�interaction�overviews�(team�A,�B�and�C),�no�reference�to�specific�tasks�(team�C),�no�reference�to�specific�users�(team�C)�and�because�problems�formulated�in�the�initial�report�were�written�as�suggestion�with�no�apparent�moment�of�difficulty�mentioned�(because�of�which�it�was�unclear�where�to�search�in�the�reference�reports�or�in�available�session�logs�of�the�initial�reports,�and�the�video�would�have�to�be�re�viewed�to�see�whether�the�difficulty�actually�occurred�or�not).���
5
0
76
15
24
0
5
10
15
20
25
30
Team A Team B Team C
Nr o
f mom
ents
of d
iffic
ulty
fo
r whi
ch c
ause
s of
uni
quen
ess
wer
e no
t tra
ceab
le
Unique in initial analysisUnique in reference analysis
�Figure�10�Moments�of�difficulty�for�which�causes�of�uniqueness�were�not�traceable.��
On�closer�inspection�not�unique:�‘comparer’�problems.���For�ten�(out�of�102)�moments�of�difficulty,�the�reason�of�uniqueness�was�caused�by�the�fact�that�the�comparer�had�had�problems�interpreting�the�problem�report.�In�these�cases,�the�inspectability�of�the�re�ports�made�it�possible�to�find�out�that�the�'unique'�moments�of�difficulty�were�not�really�unique.�In�eight�of�those�cases�the�comparer�had�(on�hindsight)�made�a�wrong�decision�on�whether�a�statement�in�a�report�should�be�interpreted�as�a�problem�or�just�as�part�of�an�overview�of�an�interaction�episode;�this�was�the�case�for�six�records�that�were�uniquely�found�in�the�reference�analysis�of�team�A�and�for�two�unique�moments�of�dif�ficulty�in�the�reference�analysis�of�team�B.�Here,�problem�descriptions�were�embedded�in�incomplete�overviews�of�interaction�episodes�and�were�not�separately�and�explicitly�mentioned�as�such.�In�two�other�cases�the�comparer�had�interpreted�a�problem�descrip�tion�in�one�analysis�in�a�different�way�than�he�did�in�the�other�analysis.�This�happened�with�only�one�unique�moment�of�difficulty�from�team�B’s�initial�analysis�and�with�one�unique�moment�of�difficulty�from�team�C’s�reference�analysis.�In�case�of�team�B�this�was�due�to�an�ambiguous�problem�formulation�in�the�initial�report,�which�was�wrongly�interpreted�by�the�comparer.��Thus,�to�sum�up,�in�some�cases�the�comparer�had�made�errors�in�interpreting�problem�descriptions.�These�errors�related�largely�to�ambiguous�problem�formulations�(team�B)�and�lack�of�explicit�distinctions�between�logs�and�problem�descriptions�(team�A�and�B)�in�the�initial�reports.�This�could�only�surface�because�in�these�cases�the�problem�reports�proved�to�be�inspectable�enough.�

� � � Chapter�3�Usability�problem�reports�for�comparative�studies:�consistency�and�inspectability
91
Unique�problems:�tracing�back�reasons�of�uniqueness.���In�the�analysis�of�the�remaining�35�(out�of�102)�cases�for�which�the�comparer�had�concluded�that�a�moment�of�difficulty�was�uniquely�reported�and�for�which�the�reasons�were�traceable,�the�following�catego�ries�of�inferred�reasons�for�differences�emerged:��1� false�positives:�moments�of�difficulty�were�reported�but�should�not�have�been�re�
ported,�because�from�the�detailed�analysis�it�has�become�clear�that�it�is�extremely�unlikely�that�the�problem�actually�occurred�(and�no�other�proof�of�existence�was�found�other�than�the�final�problem�description�in�the�team’s�report);�
2� slips�in�the�analysis�leading�to�missed�moments�of�difficulty:�the�interaction�in�which�the�difficulty�arose�was�observed�in�both�analyses,�but�(for�unknown�reasons)�was�not�recorded�as�a�difficulty�in�one�of�the�analyses�even�though�it�unambiguously�represented�a�moment�of�difficulty;�
3� slips�in�the�analysis�leading�to�different�problem�descriptions:�missed�observations�or�utterances�leading�to�different�interpretations�of�moments�of�difficulty�and�thus�to�different�interpretations�of�what�exactly�the�problems�were;�
4� threshold�differences:�differences�in�an�analyst’s�decision�of�how�difficult�a�difficulty�should�be�for�recording�it�as�a�moment�of�difficulty�in�the�report;�
5� definition�of�'usability�problems':�differences�in�what�should�lay�at�the�basis�of�a�us�ability�problem�(e.g.,�defining�the�fact�that�the�user�needed�a�hint�as�a�moment�of�difficulty�or�not,�distinction�between�problems�of�usability�or�other�problems�like�software�bugs).�
Figure�11�shows�that�of�the�35�unique�moments�of�difficulty�that�were�inspectable�and�regarded�as�being�veritably�unique,�23�were�in�the�initial�reports�(sum�of�all�values�in�the�graph�at�the�top�of�the�figure)�and�12�were�in�the�reference�reports�(sum�of�all�val�ues�in�the�graph�at�the�bottom�of�the�figure).��Team�A.�In�case�of�team�A�(figure�11:�grey�bar),�for�the�one�moment�of�difficulty�uniquely�reported�in�the�initial�report�that�had�been�inspectable�the�reason�of�unique�ness�was�of�type�threshold�differences.�Based�on�the�low�number�of�inspectable�mo�ments�of�difficulty�here,�it�may�seem�as�if�the�reports�of�team�A�had�been�relatively�un�inspectable.�However,�one�should�bear�in�mind�that�team�A�had�the�smallest�number�of�unique�moments�of�difficulty,�among�which�a�relatively�large�amount�of�comparer�problems�(which�is�a�problem�not�of�inspectability�but�of�problem�descriptions�in�the�initial�report).��Team�B.�In�case�of�team�B�(figure�11:�white�bars),�most�‘real’�unique�moments�of�diffi�culty�for�which�the�reason�had�been�inspectable�were�in�the�initial�report�(top�graph�of�figure�11).�Reasons�of�uniqueness�were�mainly�of�types:�slips�causing�differences,�threshold�differences�and�definition�of�usability�problems.�In�addition�there�were�a�few�of�types�false�positives�and�slips�causing�misses.�In�case�of�the�slips�uniqueness�usually�had�to�do�with�not�hearing�or�not�noticing�user’s�verbal�utterances�containing�clues�that�helped�in�interpreting�the�specific�moment�of�difficulty.��Team�C.�In�case�of�team�C�(figure�11:�black�bars),�reasons�of�uniqueness�were�found�to�be�in�the�categories�threshold�differences�and�definition�of�usability�problems.�In�addi�

What’s�the�problem?�Studies�on�identifying�usability�problems�in�user�tests� �
92
tion,�for�eight�moments�of�difficulty�the�reason�of�uniqueness�was�placed�in�the�cate�gory�false�positives�(seven�of�these�were�from�the�reference�report).��Although�the�number�of�seven�seems�impressively�large,�it�should�be�mentioned�that�these�were�seven�instances�of�one�single�usability�problem,�and�each�of�the�instances�was�from�a�different�user.���
Reference analyses
0 0 0 0 001
0 0 0
7
0 0 0
4
0
5
10
Falsepositives
Slips causingmisses
Slips causingdifferences
Thresholddifferences
Differences inproblemdefinition
Num
ber
of
mom
ents
of d
iffic
ulty
Team A Team B Team C
��
Initial analyses
0 0 01
0
2
0
43
5
10 0
43
0
5
10
Falsepositives
Slips causingmisses
Slips causingdifferences
Thresholddifferences
Differences inproblemdefinition
Num
ber o
f m
omen
ts o
f diff
icul
ty
Team A Team B Team C
�Figure�11�Analysis�of�the�reasons�of�uniqueness�of�moments�of�difficulty.�

� � � Chapter�3�Usability�problem�reports�for�comparative�studies:�consistency�and�inspectability
93
In�summary,�inspectability�of�the�reports�allowed�for�tracing�back�causes�of�uniqueness�in�these�35�cases.�Reasons�for�uniqueness�included:�slips�causing�misses�(team�B�refer�ence�analysis),�slips�causing�differences�(due�to�for�example�missing�user�utterances)�(team�B�initial�analyses),�threshold�differences�(team�A,�B,�C),�differences�in�definitions�of�usability�problems�(team�B�and�C)�and�false�positives�in�the�reference�analysis�(team�C).�
� 4.2.2� Comparing�the�reported�problems�across�the�three�teams�Some�of�the�categories�of�reasons�for�uniqueness�mentioned�in�the�previous�section�seem�to�relate�to�issues�of�analysts�working�inaccurately�(e.g.,�lack�of�attention),�whereas�others�might�be�related�to�issues�of�differences�in�point�of�view,�opinions�or�focus.�For�example,�a�more�explicit�and�detailed�procedure�(as�in�the�reference�analysis�with�its�checklist�of�signals�of�difficulty),�may�(but�not�necessarily�does)�bring�about�an�implicit�focus�on�specific�elements�of�interactions�or�specific�interpretations�in�formu�lating�problems.�If�this�would�be�the�case,�than�one�would�expect�to�find�less�consis�tency�between�teams�in�the�initial�analysis�(lab�specific�analysis)�than�in�the�second�(reference)�analysis.�Thus�shifts�in�levels�of�agreement�between�teams�when�moving�from�the�initial�analyses�to�the�subsequent�analyses�can�tell�something�about�the�qual�ity,�in�terms�of�biasing�the�results�from�the�reference�analysis.�Below,�levels�of�agree�ment�across�teams�are�calculated.�First,�comparisons�are�made�of�which�problems�were�reported.�Subsequently,�comparisons�are�made�on�the�type�of�information�that�is�given�about�each�problem.��
Comparing�which�problems�were�reported���For�determining�consistency�in�what�prob�lems�each�of�the�three�teams�reported,�evaluator�agreement�measures�are�used.�Hertzum�and�Jacobsen�(2001)�suggest�the�use�of�the�any�two�agreement�measure�in�cases�where�the�number�of�evaluators�is�relatively�small.�In�this�article,�Hertzum�and�Jacobsen's�(2001)�definition�is�used,�substituting�evaluators�by�teams:��
�
the�average�of ji
ji
PPPP
�� (over�all�½n(n�1)�pairs�of�teams).�� (1)
Similarly,�agreement�between�x�teams�can�be�defined�as:���
...
...i j x
i j x
P P P
P P P
� � �� � �
.�� � � � � (2)�
In�equations�1�and�2,�Pi,�Pj�and�Px�are�the�sets�of�problems�(or�high�level�categories)�de�tected�by�team�i,�team�j,�and�team�x,�and�n�is�the�number�of�teams.�Figures�12�and�13�show�the�any�two�agreement�measures�for�usability�problems�and�for�high�level�categories�respectively.��Due�to�the�higher�level�of�abstraction�(and�hence�the�smaller�number�of�categories)�the�higher�any�two�agreement�for�high�level�problem�categories�comes�not�unexpected.�

What’s�the�problem?�Studies�on�identifying�usability�problems�in�user�tests� �
94
On�both�levels�of�abstraction,�any�two�agreement�in�the�initial�analysis�is�about�the�same�as�in�the�reference�analyses.�If�the�largely�prescriptive�analysis�and�reporting�techniques�of�the�reference�analysis�would�have�introduced�a�bias�in�finding�usability�problems,�a�higher�level�of�agreement�would�have�been�expected�for�the�second�(ref�erence)�analyses.�No�indications�were�found�that�the�reference�analysis�leads�to�a�spe�cific�bias�in�the�teams’�results.�In�other�words,�the�level�of�agreement�does�not�seem�to�be�influenced�by�the�fact�that�the�teams'�analysis�methods�used�in�the�initial�analyses�were�different,�whereas�those�in�the�second�analyses�were�similar.���
� Agreement�between�teams�
Usability�problems� Lab�specific� Slim�DEVAN�
Team�A�vs.�B� 11/38 = 28,9 % * 11/45 = 24,4 %
Team�A�vs.�C� 13/36 = 36,1 % 15/47 = 31,9 %
Team�B�vs.�C� 10/36 = 27,8 % * 16/44 = 36,4 %
Any�two�agreement� 30,9 % 30,9 %
Three�agreement�Teams�A�B�C� (7/45 =) 15,6 %* (9/56 =) 16,1 %
*� Because�for�the�reference�analysis�with�SlimDEVAN�the�results�of�only�6�(instead�of�8)�participants�were�reported,�the�measures�for�the�team’s�initial�report�are�based�on�the�results�of�the�same�6�participants.�
Figure�12�Agreement�between�teams�(usability�problems�as�unit�of�comparison)�
� Agreement�between�labs�
High�level�problem�categories� Lab�specific� Slim�DEVAN�
Team�A�vs.�B� 12/23 = 52,2 %* 15/28 = 53,6 %
Team�A�vs.�C� 12/23 = 52,2 % 14/23 = 60,9 %
Team�B�vs.�C� 13/19 = 68,4 %* 17/31 = 54,8 %
Any�two�agreement� 57,6 % 56,4 %
Three�agreement�Teams�A�B�C� (11/25 =) 44,0 %* (13/31 =) 41,9 %
*� Because�for�the�reference�analysis�with�SlimDEVAN�the�results�of�only�6�(instead�of�8)�participants�were�reported,�the�measures�for�the�team’s�initial�report�are�based�on�the�results�of�the�same�6�participants.�
Figure�13�Agreement�between�teams�(high�level�problem�categories�as�unit�of�comparison)�
Comparing�‘what�was�specified�about�each�problem’���Figure�14�shows,�for�each�of�the�analyses,�an�overview�of�the�elements�that�problem�descriptions�consisted�of�in�case�of�each�of�the�three�teams.�For�that,�the�fields�difficulty�and�cause�in�each�difficulty�record�(see�figure�6,�6th�attribute)�were�analyzed.�The�contents�of�these�difficulty�record�fields�had�been�taken�literally�from�the�teams’�reports.�These�difficulty�records�were�analyzed�

� � � Chapter�3�Usability�problem�reports�for�comparative�studies:�consistency�and�inspectability
95
to�find�out�to�what�extent�they�mentioned�(or�otherwise�referred�to)�the�following�problem�description�elements:�1� the�situation�in�which�the�problem�occurred�(was�the�product�status�mentioned,�
was�there�a�mentioning�of�preconditions�for�actions�that�were�not�met?)�2� the�user’s�observable�behavior�at�the�time�the�difficulty�occurred�(what�parameters�
was�the�user�trying�to�set,�what�physical�action�was�the�user�trying�to�perform?)�3� what�the�user�thought,�felt�or�understood�(explicit�mentioning�of�inferences�about�
the�user’s�reasoning,�understanding,�feelings�or�about�what�the�user�tried�to�achieve)�
4� what�the�effect�of�the�difficulty�was�(this�relates�to�the�effect�of�the�problem�on�the�product�status,�as�well�as�effects�on�the�user,�like�confusion,�frustration,�etc.)�
5� inferences�about�what�product�element�had�caused�the�difficulty�or�should�be�redes�igned�to�avoid�it�(explicit�mentioning�of�product�characteristics�that�are�believed�to�have�contributed�to�the�difficulty,�of�the�reason�why�they�are�believed�to�have�con�tributed�to�it,�as�well�as�suggestions�to�change�the�functionality�of�the�product).�
Compared�are�the�proportions�of�problem�descriptions�that�contained�statements�re�ferring�to�each�of�the�mentioned�descriptive�elements.�Thus,�the�figures�are�corrected�for�differences�in�absolute�numbers�between�the�initial�analyses�and�the�reference�analyses.��Figure�14�shows�that�in�the�graph�at�the�bottom,�the�relations�between�the�bars�per�team�(i.e.,�all�bars�of�a�certain�color)�are�more�similar�than�in�the�graph�at�the�top.�In�other�words,�it�seems�that�in�the�second�analysis�teams�have�produced�more�similar�reports�in�terms�of�what�they�reported�about�problems.��Summarizing,�the�reference�analysis�procedure�did�not�lead�to�more�agreement�on�what�usability�problems�were�extracted,�but�it�did�lead�to�more�consistency�in�what�was�reported�about�each�of�the�problems.�Teams�reported�more�about�the�situation�in�which�problems�occurred�and�were�more�in�agreement�with�each�other�with�respect�to�the�amount�of�problem�descriptions�containing�behavioral�observations�and�inferences�about�what�users�seemed�to�understand,�feel�and�think.�Especially�team�C,�which�origi�nally�reported�relatively�little�about�what�users�did,�now�reported�more�about�that.�The�teams�that�in�the�initial�reports�mentioned�only�few�possible�causes�of�problems�(teams�A�and�B),�now�showed�a�considerable�increase,�whereas�team�C�that�already�was�at�a�high�level,�reported�relatively�less�causes.�Finally,�for�teams�A�and�B,�the�re�porting�of�effects�of�actions�dropped�to�a�very�low�level�in�the�reference�analysis,�whereas�team�C�stayed�at�an�already�relatively�low�level.���

What’s�the�problem?�Studies�on�identifying�usability�problems�in�user�tests� �
96
�
Initial analysis
0,00
0,10
0,20
0,30
0,40
0,50
0,60
0,70
0,80
0,90
1,00
Situation User'sobservable
actions
What usersfelt, thought
orunderstood
Effect ofproblem
Productelement that
causedproblem
Pro
porti
on o
f pro
blem
des
crip
tions
co
ntai
ning
a s
peci
fic ty
pe o
f sta
tem
ent Team A
Team BTeam C
���
Reference analysis
0,00
0,10
0,20
0,30
0,40
0,50
0,60
0,70
0,80
0,90
1,00
Situation User'sobservable
actions
What usersfelt, thought
orunderstood
Effect ofproblem
Productelement that
causedproblem
Pro
porti
on o
f pro
blem
des
crip
tions
co
ntai
ning
a s
peci
fic ty
pe o
f sta
tem
ent Team A
Team BTeam C
�Figure�14�Overview�of�the�descriptive�elements�that�each�of�the�teams�used�in�their�problem�de�scriptions�(proportion�of�problem�descriptions�that�contained�a�specific�statement).�

� � � Chapter�3�Usability�problem�reports�for�comparative�studies:�consistency�and�inspectability
97
� 5� Discussion�and�conclusion�
The�aim�of�the�study�was�to�investigate�issues�of�consistency�and�inspectability�of�data�analyses�and�reports�based�on�usability�tests�meant�to�extract�usability�problems.�Con�sistency�of�findings�was�studied�for�analyst�teams�who�analyzed�their�observed�interac�tions�twice�with�time�intervals�of�one�to�two�months�(the�first�time�using�their�own�usual�method�of�analysis,�the�second�time�all�using�the�same�reference�method�of�analysis).�Inconsistencies�were�analyzed�in�detail�in�order�to�trace�back�their�origin.�Consistency�across�teams�was�studied�in�terms�of�levels�of�agreement�on�problems�and�high�level�categories;�it�was�determined�to�what�extent�these�levels�change�when�the�teams,�in�their�re�analysis,�all�use�the�same�data�analysis�method.�Also,�it�was�explored�to�what�extent�the�use�of�the�same�data�analysis�approach�led�to�the�use�of�similar�de�scriptive�elements�in�the�teams'�problem�descriptions.�By�making�the�reported�usability�problems�comparable�as�well�as�by�analyzing�reasons�of�inconsistencies,�it�became�clear�which�problem�report�elements�were�important�for�(1)�making�reports�inspect�able�and�(2)�making�the�reported�findings�traceable�to�the�original�observations.�Below�the�findings�on�inspectability�and�consistency�are�discussed.��
� 5.1� Inspectability�
Inspectability�of�usability�problem�reports�is�important�for�laying�bare�those�elements�in�a�data�analysis�process�that�involve�subjective�analyst�judgments.�In�this�study�it�be�came�clear�that�for�comparative�studies�inspectability�is�also�important�for�two�other�reasons.�Firstly,�it�proved�to�be�of�crucial�importance�for�understanding�reported�prob�lems�in�enough�detail�to�be�able�to�decide�on�their�similarity.�Secondly,�inspectability�proved�to�be�of�major�importance�for�tracing�back�reasons�of�why�a�team�reported�a�problem�in�one�analysis�and�not�in�the�other.�For�example,�problems�of�inspectability�when�trying�to�trace�back�the�origin�of�uniqueness�were�present�in�57�of�the�102�prob�lem�records�that�were�reported�in�just�one�of�a�team's�analyses.��The�absence�of�the�following�report�characteristics�proved�to�be�a�hindrance�in�tracing�back�findings�to�more�primary�data.�In�other�words,�to�make�usability�problem�reports�more�inspectable,�the�following�issues�can�be�helpful:��•� inclusion�of�descriptions�of�a�user's�actual�behavior�in�the�description�of�a�problem,�
e.g.,�descriptions�of�problematic�user�actions;��•� making�references�to�which�users�encountered�a�problem;�•� making�references�to�the�task�context�or�the�(sub)�goal�that�a�user�was�trying�to�
accomplish�at�the�time�of�the�problem;�•� making�clear�distinctions�between�descriptions�of�problematic�interactions�and�de�
scriptions�of�interactions�that�are�interpreted�as�proceeding�without�problems;��•� inclusion�of�(or�making�references�to)�overviews�of�observed�interactions�(without�
substantial�gaps),�instead�of�only�relying�on�problem�descriptions;�

What’s�the�problem?�Studies�on�identifying�usability�problems�in�user�tests� �
98
•� inclusion�of�an�account�of�a�user's�verbal�utterances�,�as�well�as�clear�links�between�such�account�and�interaction�overviews�or�problem�descriptions;�
•� inclusion�of�inferences�about�causes�of�problems�(or�suggestions�for�how�to�re�solve�problems)�with�clear�links�to�behavioral�problem�descriptions.��
� 5.2� Consistency��
� 5.2.1� Across�teams�consistency�(subjectivity)�Comparison�of�what�descriptive�elements�were�used�to�report�problems�showed�that�the�(SlimDEVAN)�reference�reports�led�to�more�across�teams�consistency,�than�the�ini�tial�reports.�In�other�words,�without�using�an�agreed�method�for�reporting�problems,�consistency�across�analysts�on�what�elements�are�used�to�report�problems�may�suffer;�this�in�turn�makes�it�more�difficult�to�compare�the�usability�problems�identified�by�those�analysts.�In�the�present�study,�the�SlimDEVAN�method�led�to�more�consistency�in�the�degree�to�which�the�teams�provided�descriptions�of�the�situations�in�which�prob�lems�occurred,�of�the�behavioral�descriptions�of�observable�problematic�actions,�of�ac�counts�indicating�what�analysts�inferred�users�were�feeling,�understanding�or�thinking,�and�in�mentioning�product�elements�that�presumably�had�caused�problems.��Although�consistency�in�what�descriptive�elements�were�used�to�report�problems�was�higher�in�the�reference�reports�than�in�the�initial�reports,�measures�of�consistency�on�which�problems�were�identified�tell�a�different�story:�any�two�agreement�levels�were�about�the�same�for�the�initial�and�reference�analyses.�This�implies�that�adopting�similar�data�analysis�approaches�and�using�an�agreed�format�for�describing�usability�problems�do�not�necessarily�lead�to�more�consistency�in�findings�across�teams.�Any�two�agree�ment�of�the�teams�(comparing�usability�problems)�was�30,9%�for�both�analyses.�Based�on�our�data,�it�is�unclear�whether�the�lack�of�agreement�stems�(1)�from�differences�in�the�teams'�original�data�(e.g.,�actual�differences�in�interactions,�because�the�teams�used�different�test�participants�in�different�countries)�or�(2)�from�some�team�specific�(i.e.,:�not�method�specific)�characteristic�of�the�analysis�(e.g.,�inherent�subjectivity�in�the�data�analysis�process).��
� 5.2.2� Within�team�consistency�For�measuring�within�team�consistency�two�measures�were�used:�(1)�thoroughness�of�the�first�analysis�and�of�the�second�analysis;�(2)�overlap:�the�number�of�problems�that�a�team�found�in�both�analyses,�divided�by�the�total�number�of�problems�they�found�in�the�two�analyses.��In�the�reference�analysis�(the�second�analysis)�thoroughness�proved�to�be�consistently�higher�than�in�the�initial�analysis.�Two�possible�reasons�are:�(1)�problems�identified�in�the�initial�analysis�may�have�a�higher�chance�of�being�identified�again�in�the�second�analysis,�while�at�the�same�time�analysts�have�a�second�chance�for�identifying�problems�that�were�overlooked�in�the�first�analysis;�(2)�due�to�its�characteristics�the�reference�method�is�able�to�identify�a�larger�number�of�problems.�The�present�data�do�not�allow�determining�to�what�extent�these�reasons�contribute�to�the�current�findings.��

� � � Chapter�3�Usability�problem�reports�for�comparative�studies:�consistency�and�inspectability
99
The�proportion�of�overlap�of�findings�from�the�initial�and�subsequent�analyses�was�found�to�be�substantially�different�across�teams.�One�can�think�of�two�possible�rea�sons:�(1)�differences�in�levels�of�thoroughness�between�initial�and�subsequent�analyses�varied�considerably�(e.g.,�more�thoroughness�in�the�analyses�increases�the�chance�for�more�overlap);�(2)�the�methods�the�teams�used�in�their�initial�analyses�differed�in�the�extent�to�which�they�facilitate�analysts�to�work�in�a�consistent�manner.�Based�on�the�available�data�it�is�unclear�which�of�these�reasons�is�most�likely.�The�reasons�behind�the�findings�on�(within�team�as�well�as�across�teams)�consistency�all�raised�some�questions.�Due�to�issues�of�confounding�in�the�set�up�of�the�study,�the�questions�can�not�be�answered�just�by�using�the�data�of�the�present�study.�In�making�within�team�comparisons�there�was�confounding�due�to�the�analysis�methods�the�teams�used�as�well�due�to�an�order�effect�(teams�used�different�methods�in�their�first�and�second�analysis);�in�the�across�teams�comparisons,�there�was�confounding�due�to�the�fact�that�the�three�teams�worked�from�observations�of�different�test�participants.�Data�from�a�separate�study�described�in�Vermeeren,�Koenderink�van�Doorn�and�de�Ridder�(2006)�suggest�possible�answers.�These�are�dealt�with�below.��
� 5.3� Follow�up�study�on�causes�of�(in)consistency�
In�the�study�described�in�Vermeeren,�Koenderink���van�Doorn�and�de�Ridder�(2006)�two�pairs�of�students�(in�the�context�of�a�course�on�research�methodology)�were�asked�to�analyze�parts�of�the�recordings�from�team�B�twice�with�an�interval�of�about�three�weeks�and�to�use�SlimDEVAN�for�both�their�analyses.�Students�were�free�to�decide�how�many�and�which�sessions�they�analyzed.�They�were�third�year�(Bachelor)�students�of�Industrial�Design�Engineering�at�Delft�University�of�Technology�and�had�no�experience�in�formal�user�testing�and�data�analysis.�However,�they�had�three�years�of�experience�in�practical�courses�on�user�centered�design�and�evaluation�of�consumer�products.�Stu�dents�were�provided�with�the�English�language�user�manual�of�SlimDEVAN�(Vermeeren,�2003),�with�an�abbreviated�Dutch�language�user�manual�as�well�as�with�published�lit�erature�on�DEVAN�(Vermeeren,�van�Kesteren�and�Bekker,�2003;�Vermeeren,�2004).�In�addition,�the�first�author�of�the�present�article�explained�and�discussed�SlimDEVAN�with�each�individual�team�of�analysts.�In�addition,�after�they�had�performed�their�first�session,�student�teams�had�their�analysis�checked�by�the�first�author�of�the�present�pa�per�to�identify�misunderstandings�of�SlimDEVAN.��The�student�teams�analyzed�the�sessions�of�their�choice�twice�with�a�minimum�interval�of�three�weeks.�During�those�weeks�the�students�did�not�watch�the�recorded�sessions�nor�did�they�review�their�analyses;�largely�they�spent�time�on�doing�exams�for�other�courses�as�well�as�on�doing�a�literature�search�on�the�topic�of�comparing�usability�evaluation�methods.�Student�team�1�decided�to�analyze�the�sessions�of�test�partici�pants�1,�2,�3,�4�and�5;�student�team�2�analyzed�the�sessions�of�test�participants�2,�4,�5�and�6.�

What’s�the�problem?�Studies�on�identifying�usability�problems�in�user�tests� �
100
The�following�measures�were�applied�to�study�issues�of�consistency:��•� across�teams�consistency�in�the�second�analysis,�in�terms�of�agreement�between�
findings�of�each�student�team�and�of�lab�team�B�(expressed�as�a�proportion�of�the�total�number�of�problems�identified�by�team�B�and�the�student�team�in�their�sec�ond�analysis).�Figures�are�based�on�the�same�sample�of�test�participants�for�student�team�and�team�B).�See�figure�15�for�the�results.��
•� thoroughness�of�the�students�teams'�first�and�second�analyses�in�comparison�to�thoroughness�of�team�B's�analyses�(again�for�the�same�sample�of�test�participants).�Total�number�of�usability�problems�that�exist�is�defined�here�as�the�total�number�of�problems�identified�by�all�three�lab�teams�and�the�two�student�teams�in�their�first�and�second�analyses�(77�problems).�See�figure�16�for�the�results.�
•� within�team�consistency�in�terms�of�overlap�between�first�and�second�analysis�in�comparison�to�that�of�team�B�(for�the�same�sample�of�participants).�Overlap�is�ex�pressed�as�the�proportion�of�the�total�number�of�problems�identified�by�a�lab/student�team�in�their�two�analyses.�See�figure�17�for�the�results.�
In�the�discussion,�the�question�was�raised�as�to�what�had�caused�the�limited�agreement�in�the�lab�teams'�findings:�would�it�be�due�to�differences�in�the�observed�interactions�themselves�(as�the�teams�had�used�different�participants)�or�to�issues�of�analyst�sub�jectivity.�Even�though�each�of�the�student�teams�and�team�B�had�analyzed�exactly�the�same�data�(i.e.,�the�same�sessions�of�the�same�participants),�the�levels�of�agreement�still�are�roughly�in�the�same�range�as�those�of�the�lab�teams�(i.e.,�24,4%,�31,9%�and�36,4%�for�the�SlimDEVAN�analyses;�see�figure�12).�This�is�contrary�to�the�expectation�one�would�have�if�the�difference�in�original�data�would�have�been�the�most�important�fac�tor�for�the�lack�of�agreement.�This�suggests�that�analyst�team�specific�factors�(e.g.,�subjectivity)�play�an�important�role�in�the�lack�of�agreement.�The�fact�that�agreement�levels�between�team�B�and�the�student�teams�were�even�lower�than�agreement�levels�between�lab�teams�may�be�explained�by�the�fact�that�these�were�based�on�data�from�a�smaller�number�of�participants.��
�Analyst�combination�
Participant�sessions�
Analyst�agreement�second�analysis�(SlimDEVAN)�
Student�team�1�vs.�Lab�team�B� 1, 2, 3, 4, 5 26,8%
Student�team�2�vs.�Lab�team�B� 2, 4, 5, 6 29,4%
Figure�15�Analyst�agreements�of�student�teams�and�lab�team�B�in�the�second�analy�sis�(proportion�of�the�total�number�of�problems�identified�by�the�lab�team�and�the�student��
With�respect�to�the�observed�increase�of�thoroughness�from�the�first�to�the�second�analyses,�the�question�arose:�to�what�extent�would�this�be�due�to�the�fact�that�the�sec�ond�analysis�is�a�re�analysis�or�to�some�method�specific�factor.�In�figure�16,�the�ob�served�increase�in�thoroughness�for�the�student�teams�(i.e.,�1,3%�and�3,9%)�can�only�be�due�to�the�sole�fact�that�the�second�analysis�was�a�re�analysis.�A�similar�increase�in�

� � � Chapter�3�Usability�problem�reports�for�comparative�studies:�consistency�and�inspectability
101
thoroughness�for�lab�team�B�would�suggest�the�same�underlying�reason.�However,�fig�ure�16�shows�that�the�increase�for�lab�team�B�is�higher.�This�suggests�that�the�increase�in�the�labs'�thoroughness�is�partly�due�to�the�fact�that�the�analysis�is�a�re�analysis�(i.e.,�in�the�range�of�1,3���3,9�%)�and�partly�due�to�differences�between�the�methods�that�were�used�in�the�first�and�second�analysis�(i.e.,�one�of�the�methods�being�more�thorough�than�the�other).�Further�research�is�needed�to�substantiate�this.��
�Analysts�
Participant�sessions�
Thoroughness�1st�analysis�
Thoroughness�2nd�analysis�
Increase�in��thoroughness�
Student�team�1�
1, 2, 3, 4, 5 31,2%��(SlimDEVAN)�
32,5%��(SlimDEVAN)�
1,3%
Lab�team�B� 1, 2, 3, 4, 5 29,9%��(Lab�specific)�
35,1%��(SlimDEVAN)�
5,2%
Student�team�2�
2, 4, 5, 6 49,4%��(SlimDEVAN)�
53,3%��(SlimDEVAN)�
3,9%
Lab�team�B� 2, 4, 5, 6 26,0%��(Lab�specific)�
32,5%��(SlimDEVAN)�
6,5%
Figure�16�Thoroughness�of�teams�compared�across�1st�and�2nd�analysis.�Total�number�of�usability�problems�that�exist�is�77.�
�Analysts�
Participant�sessions�
�1st�Analysis�
�2nd�Analysis�
Within�team�consistency�
Student�team�1� 1, 2, 3, 4, 5 SlimDEVAN� SlimDEVAN� 63,3%
Lab�team�B� 1, 2, 3, 4, 5 Lab�specific� SlimDEVAN� 42,9%
Student�team�2� 2, 4, 5, 6 SlimDEVAN� SlimDEVAN� 71,7%
Lab�team�B� 2, 4, 5, 6 Lab�specific� SlimDEVAN� 36,4%
Figure�17�Within�team�consistencies�of�student�teams�and�lab�team�B�compared�(proportion�of�the�total�number�of�problems�identified�by�a�lab�team/student�team�in�their�two�analyses).�
The�question�regarding�within�team�consistency�in�terms�of�overlap�was�whether�this�would�relate�to�thoroughness�or�to�differences�in�methods�(as�some�methods�may�make�it�easier�to�work�in�a�consistent�manner�than�others).�The�findings�in�figures�16�and�17�suggest�no�clear�relation�between�thoroughness�and�within�team�consistency;�the�highest�and�lowest�within�team�consistency�are�found�for�the�analyses�with�the�highest�and�lowest�thoroughness,�but�within�team�consistency�of�student�team�1�is�also�high�without�their�thoroughness�being�quite�high.�Note�that�within�team�consistency�is�high�for�both�student�teams�and�low�for�lab�B.�This�raises�questions�about�the�role�of�the�used�analysis�method�in�consistency�across�subsequent�analyses:�What�role�do�the�characteristics�of�the�used�analysis�method�play�in�this?�Would�a�comparison�of�two�it�erations�of�any�method�give�higher�consistency�than�a�comparison�of�a�method�with�a�

What’s�the�problem?�Studies�on�identifying�usability�problems�in�user�tests� �
102
different�method?�To�what�extent�do�characteristics�of�the�analyst�teams�play�a�role?�Further�research�is�needed�to�answer�these�questions.��
� 5.3.1� Conclusions�The�findings�in�the�case�study�together�with�those�from�the�complementary�study�sug�gest�that:�•� the�levels�of�agreement�between�analyst�teams�relate�to�analyst�team�specific�
characteristics,�rather�than�to�characteristics�of�the�used�analysis�methods�or�to�dif�ferences�in�the�original�data.�In�other�words�there�seems�to�be�considerable�inher�ent�subjectivity�in�findings�from�a�usability�test�based�on�identifying�problems�and�consistency�across�teams�is�not�very�likely�to�be�improved�by�using�specific�analysis�methods;��
•� re�analysis�of�the�same�data�is�very�likely�to�lead�to�a�slightly�higher�thoroughness�in�the�second�analysis�even�if�the�second�analysis�is�done�one�or�two�months�later�(in�this�case�in�the�range�of�1�4%);�
•� within�team�consistency�can�vary�considerably�(in�this�case�between�37%�and�72%)�and�may�depend�on�the�methods�used�or�on�‘who�does�the�analyses’.��
� 5.3.2� Implications�In�usability�studies�that�are�based�on�comparing�problems,�it�is�important�that�all�data�are�analyzed�by�the�same�analysts/analyst�teams.�This�is�important�because�of�the�in�herent�subjectivity�in�extracting�usability�problems�from�observations.�With�appropri�ate�methods�that�conform�to�the�characteristics�as�present�in�SlimDEVAN�and�as�men�tioned�in�section�5.1�the�findings�can�be�made�inspectable.�Inspectability�is�important�for�laying�bare�subjective�parts�in�data�analyses�and�for�making�sure�that�outside�re�viewers�can�falsify�or�confirm�the�findings.�In�comparative�usability�studies�inspectabil�ity�is�also�important�for�a�thorough�understanding�of�the�reported�problems.�This�is�crucial�for�being�able�to�decide�on�similarity�of�problems.���

What’s the problem? Studies on identifying usability problems in user tests
143
References
Andre T.S., Hartson H.R., Belz S.M. and McCreary F.A. (2001) The user action frame-work”a reliable foundation for usability engineering support tools. Int. J. Human-Computer Studies 54, pp. 107-136.
Barendregt, W. and Bekker, M.M. (2006). Developing a coding scheme for detecting usability and fun problems in computer games for young children. Behavior Research Methods, 38, 382-389.
Barnum C.M. 2002, Usability Testing and Research (Longman, New York).
Bewley, W. L., Roberts, T. L., Schroit, D. and Verplank, W. L. (1983). Human factors testing in the design of Xerox's 8010 'Star' office workstation. Proceedings of the SIGCHI conference on Human Factors in Computing Systems. Boston, Massachusetts, United States ACM
Blandford A.E., Hyde J.K., Green T.R.G. and Connell I. (2008) Scoping Analytical Usabil-ity Evaluation Methods: A Case Study, Human-Computer Interaction 23 (3), 278-327
Capra M. G. (2006) Usability problem description and the evaluator effect in usability testing. PhD thesis. Virginia Polytechnic Institute and State University. Available from: http://scholar.lib.vt.edu/theses/available/etd-03222006-201913/unrestricted/MCapra_dissertation.pdf (last verified February 2009)
Card S.K., Moran T.P. and Newell A. 1990, The keystroke level model for user perform-ance time with interactive systems, in J. Preece, L. Keller and H Stolk (eds) Human-Computer Interaction: selected readings: a reader (Prentice Hall International, Hemel Hemstead), 327-357.
Cockton, G., (2004) From Quality in Use to Value in the World, CHI 2004 Extended Ab-stracts, 1287-1290.
Cockton, G. (2006). Focus, fit and fervour: Future factors beyond play with the inter-play. International Journal of Human-Computer Interaction, 21(2), 239–250.

What’s the problem? Studies on identifying usability problems in user tests
144
Cockton, G. and Lavery, D. (1999), A framework for usability problem extraction, in M.A. Sasse, C. Johnson (eds) Proceedings of the IFIP 7th International Conference on Hu-man-Computer Interaction — Interact’99 (IOS Press, London), 344-352.
Cockton, G., Lavery, D., and Woolrych, A. (2003). Inspection-based methods. In J.A. Jacko & A. Sears (Eds.), The human-computer interaction handbook: Fundamentals, evolving technologies and emerging applications, Mahwah, NJ: Lawrence Erlbaum Asso-ciates, Publishers. 1118-1138
Crowe E.C. and Narayanan N.H. 2000, Comparing interfaces based on what users watch and do, in Proceedings of the symposium on Eye tracking research and applications 2000, 29-36
Daams, B. and Hariandja J. (2006). Cross-cultural usability, testing a food processor in Indonesia and the Netherlands. Proceedings of IEA2006: 16th World Congress on Ergo-nomics IEA2006 , 1-5, Amsterdam, the Netherlands: Elsevier.
Dumas J.S., Molich R. and Jeffries R. (2004) Describing usability problems: Are we sending the right message? Interaction July/August, 24-29.
Furniss, D. (2008). Beyond Problem Identification: Valuing methods in a 'system of usabil-ity practice'. PhD Thesis. University College London. Available from: http://www.cs.ucl.ac.uk/staff/D.Furniss/Documents/08.10.28 DFurniss PhD Thesis Final copy.pdf (last verified February 2009)
Gould, J (1988) “How to Design Usable Systems” in M. Helander (Ed.) Handbook of Hu-man-Computer Interaction, 1st Edition, North-Holland, 757–789.
Gould, J. and Lewis, C. (1983). Designing for usability - key principles and what design-ers think. Proceedings of the SIGCHI conference on Human Factors in Computing Systems. Boston, Massachusetts, United States ACM
Gould, J. and Lewis, C. (1985) “Designing for usability: Key principles and what design-ers think,” Communications of the ACM, 28(3), 300-311.
Gray, W. and Salzman, M. (1998). Damaged merchandise? A review of experiments that compare usability evaluation methods, Human-Computer Interaction 13 (3), 203-261
Guba E.G. and Lincoln Y.S., (1989). Fourth generation evaluation. London: Sage.
Hacker W., (1986) Arbeitspsychology [Work psychology]. Bern: Huber.
Hartson, H.R. (2003). Cognitive, physical, sensory and functional affordances in interac-tion design. Behaviour & Information Technology, 22 (5), 315-338.
Hartson, H.R., Andre, T.S. and Williges, R.C. (2001). Criteria for evaluating usability evaluation methods. International Journal of Human-Computer Interaction 13 (4), 373-410.
Hertzum, M. and Jacobsen N.E. (2001). The evaluator effect: A chilling fact about usabil-ity evaluation methods. International Journal of Human-Computer Interaction, 13(4), 421-443.
Hertzum, M., Jacobsen, N.E. and Molich, R. (2002). Usability inspections by groups of specialists: Perceived agreement in spite of disparate observations. Extended abstracts of the ACM CHI 2002 Conference, 662-663, New York: ACM.

References
145
Hoenderdos, R., Vermeeren, A.P.O.S., Bekker, M.M. and Pierik A. (2002) Design for ex-perience: the "Look, mama!" experience. Proceedings of Interaction Design and Children Conference 2002, 4-10, Maastricht, the Netherlands: Shaker Publishing BV.
Hollnagel E. 1993, The phenotype of erroneous action, International Journal of Man-Machine Studies, 39, 1-32.
Hornbæk K. (in press) Dogmas in the Assessment of Usability Evaluation Methods. Be-haviour & Information Technology.
Hornbæk, K. and Frøkjær, E. (2008a) A Study of the Evaluator Effect in Usability Test-ing, Human-Computer Interaction, 23 (3), 251-277
Hornbæk, K. and Frøkjær, E. (2008b) Comparison of techniques for matching of usabil-ity problem descriptions, Interacting with Computers 20, 505–514
Houde, S. and Hill. C. (1997). “What Do Prototypes Prototype?” In: M. Helander, T.K. Landauer, and P.V. Prabhu, eds., Handbook of Human Computer Interaction, Amster-dam: Elsevier Science, pp. 367 – 381
Howarth J., Andre T.S. and Hartson R. (2007) A Structured Process for Transforming Usability Data into Usability Information. International Journal of Usability Studies, 3 (1), 7-23.
ISO 13407 (1999) Human-centred design processes for interactive systems. ISO.
ISO 9241-11 (1998) Ergonomic requirements for office work with visual display terminals (VDTs) Part 11: Guidance on Usability. ISO.
Jacobsen N.E. (1999), Usability Evaluation Methods – The reliability and Usage of Cogni-tive Walkthrough and Usability Test. PhD. Thesis, Copenhagen, Denmark: University of Copenhagen, Department of Psychology.
Jacobsen, N.E., Hertzum M. and John B.E. (1998), The evaluator effect in usability tests, in Proceedings of the conference on CHI’98, Summary: Conference on Human Factors in Computing Systems (Los Angeles, April 18-23) (ACM, New York), 255-256.
Jacobson I. (1992), Object-Oriented Software Engineering: A Use Case Driven Approach, Reading, Massachusetts: Addison Wesley
Jeffries, R., Miller, J. R., Wharton, C. and Uyeda, K. (1991). User interface evaluation in the real world: a comparison of four techniques. Proceedings of the SIGCHI conference on Human factors in computing systems: Reaching through technology. New Orleans, Louisiana, United States ACM
Jeffries, R. and Desurvire, H. (1992). Usability Testing vs. Heuristic Evaluation: Was there a Contest? SIGCHI Bulletin, 24 (4), 39-41
Jordan, P.W. (2000), Designing pleasurable products: an introduction to the new human factors, (Taylor & Francis, London).
Kanis, H. (1993). Reliability in ergonomics/human factors. Contemporary Ergonomics, 91-96, London: Taylor and Francis.
Kasanen, E., Lukka K. and Siitonen A. (1993). The constructive approach in manage-ment accounting. Journal of Management Accounting Research (5): 243-264

What’s the problem? Studies on identifying usability problems in user tests
146
Kemp J.A.M. and van Gelderen T. (1996), Co-discovery exploration: An Informal method for the iterative design of consumer products, in P.W. Jordan, B. Thomas, B.A. Weerdmeester and I.L. McClelland (eds) Usability Evaluation in Industry, (Taylor & Fran-cis, London), 147-156.
Lavery, D. and Cockton, G. (1997). Representing predicted and actual usability prob-lems. Proceedings of the International Workshop on Representations in Interactive Soft-ware Development. London, United Kingdom Queen Mary Westfield College 97-108
Lavery, D., Cockton, G. and Atkinson M. (1997). Comparison of evaluation methods us-ing structured usability reports. Behaviour & Information Technology, 16 (4), 246-266.
Law E. L.-C. and Hvannberg E.T. (2004). Analysis of combinatorial user effect in interna-tional usability tests. Proceedings of ACM CHI 2004 Conference on Human Factors in Com-puting Systems. New York: ACM.
Lewis, J. R. (1994). Sample sizes for usability studies: Additional considerations. Human Factors, 36, 368-378
Lindgaard G. and Chattratichart J. (2007) "Usability testing: What have we over-looked?", Proceedings of the SIGCHI conference on Human factors in computing sys-tems, CHI'07, ACM, April, San Jose, U.S.A., pp. 1415 - 1424.
Mayhew, D. J. (1999). The usability engineering lifecycle: A practitioner's handbook for user interface design. San Francisco, California: Morgan Kaufmann Publishers.
Molich R., Bevan N., Curson I, Butler S., Kindlund E., Miller D. and Kirakowski J. (1998), Comparative evaluation of usability tests, in Proceedings of the Usability Professionals Association 1998 (UPA98) Conference, Washington D.C. USA, June 25-26, 1998.
Molich R., Damgaard Thomsen A., Schmidt L., Ede M., Oel W. Van and Arcuri M (1999), Comparative evaluation of usability tests, in Proceedings of CHI’99, extended abstract, 83-84. Data available at http://www.dialogdesign.dk/cue.html (last verified February 2009)
Molich, R., Ede M.R., Kaasgaard K. and Karyukin B. (2004). Comparative usability evaluation. Behaviour & Information Technology, 23 (1), 65-74.
Molich R. and Dumas J.S. (2008), “Comparative Usability Evaluation (CUE-4),” Behav-iour & Information Technology, 27 (3), 263-281
Nardi B.A. 1996, Activity theory and human-computer interaction, in B.A. Nardi (ed.) Context and Consciousness: Activity theory and human-computer interaction (MIT Press, Cambridge MA), 7-16.
Newell A. 1990, Unified Theories of Cognition (Harvard University Press, Cambridge MA).
Newman W.M. 1998, Commentary on ‘Damaged Merchandise?’ Human-computer inter-action, Vol. 13, No. 3 (Special issue on ‘Experimental Comparisons of Usability Evalua-tion methods), 316 – 323.
Nielsen, C.M., Overgaard, M., Pedersen, M.B., Stage, J. and Stenild, S. (2006) It’s Worth the Hassle! The Added Value of Evaluating the Usability of Mobile Systems in the Field, In Nordichi 06: Proceedings of the Fourth Nordic Conference on Human-Computer Interaction 2006. pp. 272-280.
References
147
Nielsen, J. (1989) Usability Engineering at a discount, in Designing and Using Human-Computer Interface and Knowledge Based Systems, G.Salvendy & M.J. Smith (eds.), Amsterdam: Elsevier, pp. 394.-401.
Nielsen, J. (1997), Usability testing, in G. Salvendy (ed.), Handbook of Human Factors and Ergonomics, Second Edition, (John Wiley and Sons, New York), 1543-1568.
Nielsen, J. (2000), “Why You Only Need to Test With 5 Users”, Alertbox March 19, 2000, at http://www.useit.com/alertbox/20000319.html, accessed on 5 February 2009
Nielsen, J. (2008). Heuristic Evaluation. Retrieved 1 August 2008, from http://www.useit.com/papers/heuristic
Nielsen, J. and Landauer, T. K. (1993). A mathematical model of the finding of usability problems. Proceedings of the INTERACT '93 and CHI '93 conference on Human factors in computing systems. Amsterdam, The Netherlands ACM 206-213
Nielsen, J. and Molich, R. (1990). Heuristic evaluation of user interfaces. Proceedings of the SIGCHI conference on human factors in computing systems: Empowering people. Seat-tle, Washington, United States ACM
Noiwan J. and Norcio A.F. (2006). Cultural differences on attention and perceived us-ability: Investigating color combinations of animated graphics. International Journal of Human-Computer Studies 64 (2), 103-122.
Noldus (2002), The Observer Video-Pro. http://www.noldus.com/products/index.html
Norman D.A. 1986, Cognitive engineering, in D. A. Norman and S. Draper (eds.) User centred system design: New Perspectives on human-computer interaction (Lawrence Erl-baum Associates, New Jersey), 31-62.
Oosterholt R., Kusano M. and de Vries G. 1996 Interaction design and human factors support in the development of a personal communicator for children, in Conference proceedings on Human factors in computing systems.
Öztoprak, A. and Erbug, C., (2006) Field versus laboratory usability testing: A first Com-parison. Developments in Human Factors in Transportation, Design, and Evaluation", pp. 205-212.
Park K.S. and Lim C.H. (1999). A structured methodology for comparative evaluation of user interface designs using usability criteria and measures. International Journal of In-dustrial Ergonomics 23, 379 - 389.
Polson, P. G., Lewis, C., Rieman, J. and Wharton, C. (1992). Cognitive Walkthroughs - a Method for Theory-Based Evaluation of User Interfaces. International Journal of Man-Machine Studies, 36 (5) 741-773
Preece J., Rogers Y and Sharp H. 2002, Interaction design: beyond human-computer in-teraction (John Wiley and Sons, New York).
Rasmussen J. (1982. Human errors: A taxonomy for describing human malfunction in industrial installations. Journal of Occupational Accidents, 4, 311-335.
Rooden M.J. and Kanis H. 2000, Anticipation of usability problems by practitioners, in Proceedings of the Human Factors and Ergonomics Society 44th Annual Meeting (San Diego) 6-941 – 6-944.

What’s the problem? Studies on identifying usability problems in user tests
148
Rowe, A.L., Lowry, T., Halgren S.L. and Cooke N.J. (1994), A comparison of usability evaluations conducted by different teams, in Proceedings of the CHI’94 Conference Com-panion on Human Factors in Computing Systems (Boston, April 24-28) (ACM, New York), 109-110.
Sauer J., Franke H. and Ruettinger B., (2008) Designing interactive consumer products: Utility of paper prototypes and effectiveness of enhanced control labeling. Applied Er-gonomics 39, 71-85.
Siegel, S. and Castellan, N.J. 1988, Nonparametric statistics for the behavioural sciences (McGraw-Hill Book Company, New York), 144-151.
Spool, J. and Schroeder, W. (2001). Testing web sites: Five users is nowhere near enough. Extended abstracts of CHI 2001, 285-286.
Steen M.G.D. (2008) The fragility of human-centred design. PhD thesis (28 November 2008), Delft University of Technology, Industrial Design Engineering.
Streefkerk, J.W., van Esch-Bussemakers, M.P., Neerincx, M.A., and Looije, R. (2008). Evaluating Context-Aware Mobile User Interfaces. In: J. Lumsden (Ed.), Handbook of Research on User Interface Design and Evaluation for Mobile Technology. Chapter XLV (pages 759-779). Hershey PA, USA: IGI Global.
Sutcliffe A., Ryan M., Doubleday A. and Springett M. (2000), Model mismatch analysis: towards a deeper explanation of user’s usability problems, Behaviour and Information Technology, 19 (1), 43-55
Theofanus M. and Quesenbery W. (2005) Towards the Design of Effective Formative Test Reports. Journal of usability studies 1 (1), 27-45.
Vermeeren, A.P.O.S., (1999). Designing scenarios and tasks for user trials for home electronic devices. In W.S. Green & P.W. Jordan (Eds.), Human Factors in Product Design: current practice and future trends (pp 47-55). London: Taylor & Francis, 47-55.
Vermeeren, A.P.O.S. (2003). The DEVAN checklist for detecting problems in interactions: user manual (checklist version 1.1) (Technical Report). Delft, The Netherlands: Delft Uni-versity of Technology, Faculty of Industrial Design Engineering.
Vermeeren, A.P.O.S. (2004). Structured video analysis of user test data, using the DEVAN tool. In Ç. Erbu� (Ed.) Usability testing: Methods, experiences, achievements (pp. 123-140). Ankara, Turkey: Middle East Technical University, Faculty of Architecture.
Vermeeren, A.P.O.S., den Bouwmeester, K., Aasman, J., and de Ridder, H. (2002). DEVAN: A tool for detailed video analysis of user test data. Behaviour & Information Technology, 21 (6), 403-423 (chapter 2 of this thesis).
Vermeeren, A.P.O.S., van Kesteren, I.E.H., and Bekker M.M. (2003). Managing the Evaluator Effect in User Testing. Proceedings of INTERACT'03, Amsterdam, The Nether-lands: IOS Press, 647-654.
Vermeeren A.P.O.S., Koenderink-van Doorn A.J. and Ridder H. de (2006) Reliability of a checklist-based user test data analysis procedure. Proceedings IEA 2006 Congress: Meet-ing Diversity in Ergonomics, Amsterdam, The Netherlands: Elsevier.
Vermeeren, A.P.O.S., Bekker, M.M., van Kesteren, I.E.H. and de Ridder, H., (2007). Ex-periences with structured interviewing of children during usability tests. In L.J. Ball et

References
149
al. (eds.) Proceedings of HCI 2007, The 21st British HCI Group Annual Conference, 139-146. Swindon, UK: BCS.
Vermeeren A.P.O.S., Attema J., Akar E., Ridder H. de, Doorn A.J. van, Erbug C., Berk-man A.E. and Maguire M.C. (2008) Usability Problem Reports for Comparative Studies: Consistency and Inspectability. Human-Computer Interaction 23 (4), 329-380 (chapter 3 of this thesis)
Vermeeren, A.P.O.S., Kort J., Cremers, A.H.M. and Fokker J., (2008) Comparing UX Measurements, a case study. 5th COST294-MAUSE Open Workshop on Valid Useful User Experience Measurement (VUUM). Reykjavik, Iceland.
Virzi R.A. (1989) What can you learn from a low-fidelity prototype, in Proceedings of the Human Factors Society 33rd Annual Meeting, Denver, Colorado, 1989, pp.224-228.
Virzi R.A. (1992). Refining the test phase of usability evaluation: how many subjects is enough? Human Factors 34 (4), 457 – 468.
Watson, B. (1968) The Complete Works of Chuang Tzu, Columbia University Press, Ch 26, p 302.
Zapf, D., Brodbeck, F. C, Frese, M., Peters M. and Prümper, J. (1992) Errors in working with office computers: a first validation of a taxonomy for observed errors in a field setting, International Journal of Human-Computer Interaction, 4, 311-339.