updated-annual-results-booklet-2016-v1.pdf - Anglo American ...
94
ANGLO AMERICAN PLATINUM LIMITED ANNUAL RESULTS 2016 DELIVERING CHANGE BUILDING RESILIENCE POSITIONING FOR THE FUTURE
-
Upload
khangminh22 -
Category
Documents
-
view
1 -
download
0
Transcript of updated-annual-results-booklet-2016-v1.pdf - Anglo American ...

ANGLO AMERICAN PLATINUM LIMITED
ANNUAL RESULTS 2016
DELIVERING CHANGE BUILDING RESILIENCEPOSITIONING FOR THE FUTURE

LIVING OUR VALUES
SAFETYWe take personal accountability to ensure that we work and live safely
CARE AND RESPECTWe treat each other with respect and dignity in words and actions
INTEGRITYWe walk the talk – our actions are consistent with our words
ACCOUNTABILITYIndividual accountability drives team and business accountability
COLLABORATIONWe align and collaborate across functions to ensure collective high performance
INNOVATIONInnovation is key to our future and is a central part of our drive for sustainability
DELIVERING CHANGEBUILDING RESILIENCEPOSITIONING FOR THE FUTUREGlobally, the mining sector is weathering unprecedented challenges. Anglo American Platinum (Amplats) is proving its resilience and ability to manage change through a focused strategy that is positioning our group for the future.
By concentrating on elements within our control and building the foundations for continuous improvement, we are delivering on our strategy. We are shaping our business for a sustainable future – driving the transformation that will make us more robust, responsive and competitive.
As we focus strategically on value and not volume, we are repositioning our portfolio by exiting certain assets, focusing on market development opportunities and building positive relationships with all our stakeholders while our operations concentrate on optimising their potential.
www.angloamericanplatinum.com/investors/annual-reporting/2016
Supporting documentation on the websiteFull annual financial statementsFull mineral reserves and resources reportGRI indexUN Global Compact AssessmentKing III application register

KEY FEATURES
Lost-time injury-frequency rate (LTIFR) per 200,000 hours worked(2015: 0.98)
0.73Refined platinum production(2015: 2.46 Moz)
2.33 M ozProduced platinum production(2015: 2.34 Moz)
2.38 M ozHeadline earnings(2015 restated: R126m loss)
R1,867mNet debt(2015: R12,769m)
R7,319m
CONTENTS
2 Results commentary 2016
12 Summarised consolidated statement of comprehensive income
13 Summarised consolidated statement of financial position
14 Summarised consolidated statement of cash flow
15 Summarised consolidated statement of changes in equity
16 Notes to the summarised consolidated financial statements
31 Auditor’s report
32 Group performance data
48 Results presentation 2016
Anglo American Platinum Limited Annual Results Presentation 2016 1

DRAFT
RESULTS COMMENTARY
delivered an attributable R320 million in additional operating cash flow. Overall, a combination of capital discipline, working capital management and operational efficiencies resulted in the generation of free cash flow from operations, which, combined with sale proceeds for divestments, contributed to a reduction of net debt of R5.5 billion to R7.3 billion.
The Company remains committed to investing in PGM market development across a number of demand segments including jewellery, investment and industrial as well as areas supporting the widespread commercial adoption of fuel cells and hydrogen in the transport and other sectors.
OPERATIONAL EXCELLENCESafety, health and environmentTragically, there were seven fatalities due to work related incidents in 2016. Mr Mlamuli Cornelius Kubheka and Mr Mveliso Ntamehlo were fatally injured in a winch-related incident at Amandelbult (Tumela Mine) on 26 April 2016. Mr Pieter Henrico was injured after being struck by a rock conveyance at Rustenburg (Thembelani Mine) on 31 March 2016 and passed away on 9 July 2016. Mr Tamsanqa Ngqambiya sustained fatal injuries in a fall-of-ground at Rustenburg (Thembelani Mine) on 3 June 2016. Mr Amos Mataboge was fatally injured in a fall-of-ground incident at Rustenburg (Siphumelele Mine) on 5 August 2016, and Mr Nekisile Zibhonti died after drilling into explosives at Rustenburg (Thembelani Mine) on 18 August 2016. Mr Peter Leshoella was fatally injured in a conveyor-belt incident at Union Mine on 24 October 2016. Deepest condolences go to their families, friends and colleagues.
ANGLO AMERICAN PLATINUM – DELIVERING ON OUR COMMITMENTSAnglo American Platinum is delivering against its key strategic objectives by substantially improving operational performance across the portfolio, repositioning the portfolio to own and operate the highest margin assets in the platinum group metals (PGM) industry to a create a value-optimised portfolio, and investing in developing of the PGM market. Significant progress has been made in divesting of assets which are not strategic to the Company and deemed to be non-core including:
• Completion of the sale of the Rustenburg Operations to a subsidiary of Sibanye Gold Limited (Sibanye) on 1 November 2016
• An SPA was entered into with Northam Platinum Limited (Northam) to divest of resources within the Amandelbult mining right
• An SPA was entered into with Eastern Platinum Limited, a subsidiary of Lonmin plc (Lonmin), to divest of Anglo American Platinum’s 42.5% stake in the Pandora joint venture
• Post year end, an SPA was entered into with a subsidiary of Siyanda Resources Limited (Siyanda), divesting of the Company’s interest in the Union mine joint venture and Masa Chrome
• The process of the sale of the Company’s interest in the Bokoni joint venture is ongoing
Disciplined capital allocation remains key, and the Company has prioritised investment in high-value, capital-light projects with short pay-back periods, such as the Amandelbult chrome plant, which was successfully commissioned in 2016 at a cost of R415 million and has
DELIVERING CHANGE, BUILDING A RESILIENT BUSINESS AND POSTIONING FOR THE FUTURE
• Key strategic success in repositioning the portfolio: – Rustenburg Operations divestment completed, with R1.5 billion upfront proceeds received – Sales and purchase agreement (SPA) signed for sale of mineral resources to Northam – SPA signed for sale of Pandora stake to Lonmin – SPA signed for sale of Union and Masa Chrome operations to Siyanda (post year end)
• Operational improvements at all mines, with record production from Mogalakwena
• Unit cost increase of 1.4%, below South African CPI, with strict cost discipline mitigating mining inflation
• Delivered R700 million overhead cost reduction, with full run rate of R1 billion achieved in Q4 2016
• Capital discipline remains a priority – focus on value enhancing, quick pay back projects such as successful commissioning of Amandelbult chrome plant
• Generated R3.5 billion free cash flow from operations
• Reduced net debt by R5.5 billion to R7.3 billion
• Positioning for the future – retaining optionality in the portfolio and committed to market development, innovation, people and communities
2 Anglo American Platinum Limited Annual Results Presentation 2016
ANNUAL RESULTS PRESENTATION 2016 RESULTS COMMENTARY

DRAFT
2% year-on-year to 4.07 g/t in 2016. The 4E built-up head grade from underground sources at 4.46g/t is 3% higher than 2015.
Amandelbult successfully commissioned a new chrome plant at the mine in 2016 with steady-state production expected from 2017. The chrome plant was built at a capital cost of R415 million, on schedule and on budget. The plant is 74% owned by Anglo American Platinum and 26% by the Baphalane Siyanda Chrome Company Proprietary Limited in which the Baphalane-Ba-Mmantserre community owns 75% and Siyanda Chrome Investments Proprietary Limited owns 25%. The chrome plant produced 2.8 million tonnes of UG2 tailings, yielding 235,000 tonnes of chrome concentrate for 2016.
UnkiUnki increased production by 12% to 75,000 ounces, driven by higher productivity and improved mining reef cut, resulting in more quality-grade ore being delivered to the concentrator and the 4E built-up head grade rising to 3.46g/t from 3.22g/t.
Twickenham projectTwickenham produced 3,000 ounces, 10,000 ounces less than 2015 as the loss-making project was placed on care-and-maintenance during the year.
Joint ventures and third partiesPlatinum production from joint ventures, including both mined and purchased production, increased 2% to 785,000 ounces. Production was strong from all operations, with Modikwa up 10% to 115,000 ounces reflecting an effective productivity improvement plan; BRPM up 9% due to increased mining of the higher-grade Merensky reef from North Shaft Phase 3; Kroondal up 4%, the best performance since inception on improved stoping efficiencies; and Mototolo up 2% on increased throughput. Bokoni was up 4%, after normalising for the closures of the unprofitable UM2 and Vertical shafts.
Platinum ounces from third parties rose 179% to 112,000 ounces after including Rustenburg purchase of concentrate from 1 November 2016. Excluding Rustenburg, third-party purchase of concentrate decreased 26% from 40,000 to 30,000 ounces due to terminating some contracts at the end of 2015.
Non-core operations – RustenburgTotal production from Rustenburg, including the Western Limb Tailings Retreatment, decreased 4% from 478,000 to 460,000 in 2016, impacted by fatal incidents and operational difficulties. Operational improvements were evident in Q4 2016 as the mine was unaffected by safety issues. The sale of Rustenburg was completed on 1 November 2016, from which point its production is recognised as third-party purchase of concentrate and excluded from own production. Production from the Platinum Mile tailing retreatment is a retained third party contract and has been reported as part of third party purchase of concentrate.
Non-core operations – UnionUnion production increased 7% to 151,000 platinum ounces through higher stoping efficiencies and an increase in low grade surface ore, despite a significant reduction in labour after restructuring that was
This increase in work-related fatalities is particularly disappointing given the steady improvement in underlying safety performance indicators in 2016. The lost-time injury frequency fate (LTIFR, a lagging indicator) declined 26% from 0.98 in 2015 to 0.73, while the total recordable case frequency rate (TRCFR, a leading indicator) improved 31% from 1.52 in 2015 to 1.05 in 2016. These rates include the Rustenburg Operations until 31 October 2016.
The Company’s safety strategy, based on zero harm, embeds continuous improvement and review processes to incorporate lessons and to evaluate the effectiveness of strategic focus areas. This enables the Company to continue learning from each incident, and implement measures to prevent repeats. The priority remains further improving safety strategy and supporting employees to ensure they remained focused and consistent in applying safety measures at all times. Particular focus will be placed on ensuring unconditional and consistent adherence to critical controls.
Significant efforts have been made to improve disease awareness and the availability of prevention programmes with a significant increase in employee participation in disease management programmes. The encouraging uptake of anti-retroviral treatment continued to increase during the year, with a significant reduction (48%) of HIV/Aids and tuberculosis-related deaths reported in 2016.
Operational performanceTotal platinum production both mined and purchased increased 2% to 2.38 million ounces (on a metal-in-concentrate basis), towards the top end of guidance of 2.3 million to 2.4 million ounces. Platinum produced by own managed mines, including Twickenham project which is now on care-and-maintenance, increased 5% to 956,000 from 909,000 ounces in 2015. 4E built-up head grade of 3.38g/t was 2% lower than 2015 due to lower grade from Mogalakwena and Amandelbult, partly offset by increased grade at Unki.
MogalakwenaProduction from Mogalakwena mine increased 5% to a record 412,000 ounces (including ounces from the Baobab concentrator plant). Total tonnes mined rose 4% to 96 million tonnes in 2016, supported by improved equipment efficiencies and increased maintenance reliability. Tonnes milled increased 8% on higher throughput while 4E built-up head grade returned to a more normalised level of 3.02g/t from 3.09g/t in 2015.
Platinum production from Baobab rose to 31,000 ounces. As part of the transaction terms to sell the Company’s stake in the Pandora joint venture to Lonmin, a three-year contract was secured for the sole use and operational control of the Baobab concentrator.
AmandelbultAmandelbult production increased 7% to 467,000 ounces, despite safety stoppages, following a double-fatal incident. Higher production reflects mining from increased mineable ore reserves and improved panel-to-crew ratios. This was supported by higher tonnes milled, which rose 9% to 7.1 million tonnes. Tonnes from surface sources were up 0.9 million tonnes due to opencast operations producing for 12 months in 2016 compared to six months in 2015. Increased surface sources in the ore mix reduced the 4E built-up head grade by
Anglo American Platinum Limited Annual Results Presentation 2016 3
DRAFT
completed in June 2016 and the impact from the fatal incident. The mine also reduced its total injuries by 40% and improved its cash on-mine costs per platinum ounce by 14% year-on-year.
Refined production and sales volumeTotal refined platinum production of 2,335,000 ounces decreased 5% compared to 2,459,000 ounces in 2015, mainly due to a smelter run-out at Waterval smelter in September 2016. This affected refined production by 65,000 ounces in 2016, and has increased the work-in-process inventory which is expected to be refined in full in 2017. The decrease in refined inventory also reflects a lower stock gain in 2016 than 2015 of 70,000 ounces. The lower pipeline inventory resulted in less material to refine.
Refined platinum sales declined by 2% to 2,416,000 ounces, of which 2,400,000 ounces were sales from refined metal and the balance from market activities. Sales were higher than refined production which was supplemented by a drawdown in refined inventory. Lower PGM sales volumes reflect lower refined production after the Waterval smelter run-out in September and subsequent rebuild in Q4 2016. Sales of refined palladium and rhodium declined 4% and 1% respectively while sales of nickel increased 7%.
FINANCIAL PERFORMANCE2015 and H1 2016 restatementShareholders are advised that the Company has released restated group financial results for the year ended 31 December 2015 and half year ended 30 June 2016. The restatement arose from a correction of the exchange rate used for the translation of Unki mine’s depreciation from US dollars into South African rand, a correction of the valuation of work-in-process and finished goods metal inventory and a correction of the proportionate consolidation of a joint venture. Anglo American Platinum corrected these as material prior period errors on the basis of the aggregated impact, and restated the comparative period financials.
Restated basic earnings and earnings per share (EPS) for 2015 are a loss of R12,358 million (R12,125 million previously) and a loss of 4,728 cents (4,638 cents previously). Restated headline earnings and headline earnings per share (HEPS) for 2015 are a loss of R126 million (R107 million profit previously) and 48 cents loss (41 cents profit previously).
2016 overviewHeadline earnings increased to R1.9 billion in 2016 from the restated loss of R126 million in 2015. This reflected favourable foreign exchange movements, operating and overhead cost reduction, lower restructuring costs and the impact of impairments in the comparative period. As a result, headline earnings per share rose to 713 cents in 2016 from a loss of 48 cents in 2015.
The group effective tax rate for the year ended 31 December 2016 was 34.3% (2015: 13.7%). This increase is partly due to changes in Controlled Foreign Company (CFC) legislation, which results in the profits of the marketing companies in the United Kingdom and
Singapore being taxed at 28%. In addition, the effective tax rate is impact by the impairment of loans and investments which do not have an associated tax effect.
Sales revenueNet sales revenue rose 4% to R62.0 billion from R59.8 billion in 2015, due primarily to the weakening of the rand/US dollar exchange rate. This was partly offset by reduced sales volumes and the decline in metal prices, particularly platinum and palladium.
The average US dollar basket price per platinum ounce sold decreased 8% in 2016 to USD1,753 from USD1,905 in 2015. This was driven by the decrease in prices for all metals other than gold and iridium. The average US dollar sales price achieved on most metals declined, with platinum down 6% to USD993 per ounce, palladium down 13%, rhodium down 29%, nickel down 18% and copper down 8%.
The average rand/US dollar exchange rate weakened by 15% to R14.63 from the R12.71 average in the comparative period. After including the effect of the weakening rand against the US dollar, the average realised rand basket price per platinum ounce was 6% stronger at R25,649.
Customer prepaymentAs part of the Company strategy to strengthen its balance sheet, the marketing function engaged a key customer to advance a prepayment for future guaranteed delivery of metal. The contract is structured over five years with an initial payment of USD250 million. Of the full amount, USD153 million (R2.0 billion) was paid in the last quarter of 2016 and contributed significantly to reduced net debt at year end. The remainder of the prepayment will be received in Q1 2017. The transaction is cost neutral to the Company.
Working capitalThe Company has actively managed down its working capital. Trade working capital decreased by R5.3 billion to R8.0 billion as at 31 December 2016 while days decreased to 49 compared to 75 in 2015. This reflects a number of initiatives including creditor payment terms, where large creditor terms have been extended from 30 to 60 days, materials inventory management where store areas have been consolidated, and minor metal sales programmes realising cash and operational initiatives facilitating early settlement.
The increase in trade creditors was mainly due to higher expenditure, particularly the purchase of concentrate following the sale of the Rustenburg Operations, and deferred revenue arising from the customer prepayment.
Cost of salesCost of sales rose by 3%, from R54.6 billion in 2015 to R56.1 billion. Following the sale of Rustenburg operations in November 2016, the Company will have higher purchase of concentrate costs and lower on-mine costs due to the purchase of concentrate from Sibanye.
Cash on-mine costs (mines and concentrators) reduced by R1.1 billion to R32.8 billion due to lower mining costs as a result of the Rustenburg
4 Anglo American Platinum Limited Annual Results Presentation 2016
ANNUAL RESULTS PRESENTATION 2016 RESULTS COMMENTARY

DRAFT
exit partly offset by input cost inflation and increased volume at retained operations. Processing costs rose 5% or R350 million to R7.1 billion which was below input cost inflation.
Purchase of concentrate costs increased to R13.5 billion from R10.2 billion in 2015 due to higher volume which now includes two months of Rustenburg production as purchased metal, higher rand basket price compared to 2015 and R0.4 billion of metals purchased through marketing activity.
Other indirect costs increased 8% to R2.8 billion from R2.6 billion in 2015. The increase in costs was primarily due to higher transport of metal costs of R247 million and additional royalty expenses of R188 million partly offset by lower expenditure on corporate office, share based payments and research.
The cash cost of the Company comprises labour, stores, electricity, water, contractors and other costs.
Cash operating cost per platinum ounce rose 1.4% to R19,545 from R19,266 in 2015 which is significantly below mining inflation and the South African Consumer Price Index. This reflects the benefit of cost reductions, operating efficiencies and overhead reductions.
OverheadsThe Company started an overhead reduction programme to reduce the 2015 overhead of R5.4 billion to R3.4 billion, of which R700 million was through the exit of Rustenburg and R300 million will be through the exit of Union. Of the remaining R1.0 billion, the Company has delivered R700 million, with the full run rate of R1.0 billion achieved in Q4 2016. The Rustenburg exit reduced overhead cost by R500 million. Expectations are that the Union exit will complete in 2017 and result in an additional R300 million overhead reduction.
Earnings before interest, taxation, depreciation and amortisation (EBITDA)Reported EBITDA rose by R10.7 billion to a profit of R9.1 billion from a loss of R1.6 billion in 2015 due to the prior period impairment and write-off of assets totalling R12.0 billion. Normalised for the 2015 impairments, EBITDA increased from R8.6 billion to R9.1 billion. Stock-count gains and restructuring costs were once-off items in both years. The 2016 stock count gain was some R0.6 billion compared to the abnormally high R2.1 billion in 2015 while restructuring costs decreased by R654 million year on year to R342 million.
Uncontrollable items which include inflation, metal prices and the rand/dollar exchange rate, reduced earnings by R1.8 billion, with inflation contributing R2.5 billion, weaker metal prices R4.3 billion, partly offset by the weaker rand of R5.0 billion. The company’s earnings are very sensitive to price movements in the commodities sold and to the ZAR:USD exchange rate. Every R100 change in the rand basket price realised equates to R0.2 billion of EBITDA.
Controllable items – volume and costs – contributed R3.1 billion, with lower sales volumes than 2015 reducing earnings by R300 million. Costs, after adjusting for volume, inflation and forex, declined
R3.0 billion from 2015, including lower operating costs, overhead, marketing costs and cash on-mine costs after the Rustenburg sale, supported by higher income from associates of R427 million.
The Company’s return on capital employed (ROCE) was 8.9% compared to restated 2015 ROCE of 5.8%, after adjusting for scrapping.
Cash flowThe Company generated R13.6 billion in cash from operations, including the R2.0 billion customer prepayment. Underlying cash from operations therefore was R11.6 billion, including R342 million in restructuring costs. These cash flows were used to fund capital expenditure of R4.7 billion (excluding capitalised interest, including capitalised waste); pay taxation of R1.1 billion; settle net interest of R1.4 billion to our debt providers and contribute R1.0 billion to funding our joint venture and associate operations in 2016.
Capital expenditureCapital expenditure for 2016, excluding capitalised interest, declined 9% to R3.4 billion from R3.7 billion in 2015. Stay-in-business capital expenditure increased by R0.2 billion to R2.8 billion in 2016, focused on safety-critical, business continuity, value-accretive projects.
Project capital expenditure decreased by R0.6 billion from R1.2 billion to R0.6 billion in 2016. This was focused on Unki smelter and housing, phase 5 expansions at Bathopele Mine and Rustenburg ore replacement projects.
Interest capitalised during the period decreased to R323 million from R406 million in 2015 due to lower assets qualifying for capitalisation of interest.
The Company capitalised costs of R1.3 billion (2015: R1.0 billion) for waste stripping at Mogalakwena mine as part of the life-of-mine plan. Waste tonnes mined increased from 77.0Mt in 2015 to 77.6Mt in 2016. In 2016, the cost of mining 38.5Mt was capitalised against a capitalisation of 32.0Mt in 2015.
In addition, during 2016, the Company concluded a Broad Based Black Economic Empowerment (BBBEE) transaction with regards to its Amandelbult chrome plant, granting 26% of the equity of the plant to its BBBEE partners. An upfront consideration was received by Anglo American Platinum, which is less than the fair value of the equity granted. The remaining consideration was settled through vendor financing assistance provided by the Company. This transaction therefore resulted in the Company recognising a once-off IFRS2 charge (share based payment) of R156 million.
Net debt and dividendThe Company’s net debt at 31 December 2016 was R7.3 billion, R5.5 billion lower than the R12.8 billion reported in 2015, representing gearing of 18% (31 December 2015: 32%). This was supported by a cash receipt of R1.5 billion for the sale of Rustenburg, partly offset by R0.1 billion transaction costs and the R2.0 billion customer prepayment.
Anglo American Platinum Limited Annual Results Presentation 2016 5

DRAFT
Owing to the net debt position of the Company and uncertain macroeconomic environment, the Board has decided not to declare a dividend in 2016.
Anglo American Platinum will continue to monitor its capital requirements and to prioritise deleveraging the balance sheet before considering future dividend payments.
Disciplined capital allocationThe Company has a strict capital allocation policy to ensure the best use of capital to achieve the highest returns. The first priority is to maintain the core current operations and ensure they are equipped to achieve operational excellence. Stay-in-business capital and business continuity remain the priority with capital and the exit of Rustenburg, Pandora and now Union will enable the Company to focus its capital on its best assets.
The next priority of the Company is to deleverage the balance sheet so that it is strong enough to manage through the cycle. Net debt was reduced by R5.5 billion during the year, and the focus remains on reducing net debt further. One-off disposal proceeds from the sale of resources to Northam, and the sale of Union to Siyanda should further contribute to a decline in net debt. In addition, the balance of the customer prepayment will be received in Q1 2017. Thereafter the Company would like to introduce a sustainable dividend based on a pay-out ratio once the balance sheet has strengthened.
In the current environment, the decision has been taken to delay any major growth projects until the market demands more metal and the balance sheet allows, and not until post 2017. The operating free cash flow of own operations has been improved by reducing the capital intensity of stay in business capital, without increasing operational risk in future.
If there is any further capital to be allocated, the Company will consider a reiterative cycle of allocation between further debt reduction, capital projects if the market needs the ounces and a further dividend distribution.
MARKETSPlatinumAlthough the platinum price ended 2016 above where it began the year in US dollar terms, it declined 6% on average compared to 2015, underperforming many commodities due to a mix of expected tightening of monetary policy in the USA and modest fundamentals for platinum. While total supply of platinum from mine production and recycling increased, and gross demand for this metal declined marginally in the year, platinum remained in deficit for the fifth consecutive year.
Industrial demand was the strongest performing sector for platinum as industries - from glass manufacturing to chemicals purchased more metal than a year earlier. Demand for platinum from the automotive
sector also edged 1% higher. Net investment demand was again positive in 2016 outpacing demand a year earlier as Japanese buying continued and Exchange Traded Fund (ETF) selling slowed.
The performance of the jewellery sector was more disappointing, with demand slowing noticeably. Although there were bright spots elsewhere, Chinese consumers bought less jewellery – both platinum and gold – than a year earlier and demand fell sharply.
PalladiumFollowing its weak performance in 2015, the palladium price improved in 2016 but still recorded a lower average price (a fall of 13%) than a year earlier. In contrast to platinum, demand performed well and outweighed overall supplies. The automotive industry remains the principal user of this metal and demand rose 3%, while industrial demand fell slightly. In the investment sector, it was another year of net disinvestment in palladium. ETF net selling was slightly less intense than a year earlier but accelerated in the final quarter when over 300,000 ounces of metal were sold as the price rallied to highs for the year.
RhodiumThe rhodium market was again well-supplied in 2016 despite some growth in automotive demand for this metal. Tightening emission standards in various countries forced the fitment of catalysts with higher rhodium content and strong sales in China and, to a lesser extent, the USA and Europe contributed additional rhodium demand. Industrial demand for rhodium edged higher, with additional buying for capacity additions in the glass sector a major factor. The average rhodium price was 29% lower than 2015, but ended 2016 close to its yearly high.
AutomotiveGlobal light-vehicle sales expanded 4.6% in 2016 to a record 93.2 million units. Sales were strong in Europe, North America and, particularly, China where a cut in the tax payable on the purchase of smaller vehicles drove light-duty vehicle sales 12.3% higher. Demand for all three major PGMs grew as a result of this strong performance.
Gross automotive demand for platinum rose 30,000 ounces or 1%, its highest level since 2008. The standout performance was in Europe, where strong demand for new vehicles more than offset a slight decline in the share of the diesel engine. In fact, the number of diesel cars sold in Europe climbed while loadings increased too. More negatively, diesel’s share of the Indian car market fell while North American heavy-duty diesel demand for platinum was weaker than expected.
The outlook for the diesel engine remains a key factor, after the emissions scandal of 2015. Diesel share has fallen in Europe, but only in line with prior expectations as the smallest vehicles move away from this technology where it is least economically attractive. Catalyst
6 Anglo American Platinum Limited Annual Results Presentation 2016
ANNUAL RESULTS PRESENTATION 2016 RESULTS COMMENTARY

DRAFT
loadings edged higher in 2016 but could fall in 2017 before rising again as the later stages of the new, tougher European emissions rules, Euro 6, are phased in. While electric vehicles of all types – both battery electric vehicles and their fuel cell equivalents – are receiving extensive media coverage, their market share remains small. Diesel is therefore still extremely important for light and heavy-duty vehicle manufacturers and their ability to meet carbon-dioxide emission targets, and is likely to retain a strong position among larger vehicles.
Automotive demand for palladium climbed again to 7.8 million ounces as higher vehicle production outweighed the ongoing effects of thrifting. Strong growth in Chinese car sales, driven by domestic stimulus efforts, was a factor. In fact, despite some growth in palladium demand in Europe and Japan, China alone took 300,000 ounces more metal than the prior year. Gross automotive rhodium demand edged 2.0% higher, with higher global car production outweighing the impact of slowing thrifting.
IndustrialDemand for platinum from other industrial applications was healthy in 2016, growing 185,000 ounces or 9.7%, much faster than the pace of global economic growth. The glass manufacturing sector took more metal than a year earlier and other industries purchased more platinum too. Although still small, demand for platinum for use in fuel cells continues to grow and exceeded the 50,000 ounce level last year. In the short term, much of this demand is from using fuel cells in niches such as telecommunications back-up power or fork-lift trucks. However, there are also positive signs of increasing demand from the transport sector, including the launch of a number of semi-commercial fuel cell vehicle models.
Industrial demand for palladium fell slightly in 2016, by 50,000 ounces or 2.5%, partly due to thrifting in electronic applications. Higher demand for rhodium from the glass sector helped boost industrial and other demand for rhodium by 20,000 ounces to 185,000.
JewelleryGross global jewellery purchases of platinum fell for a second year in 2016, dropping 15.3% or 430,000 ounces. The major negative factor was slowing jewellery sales – both gold and platinum – in China, which is the largest jewellery purchaser of platinum. A decrease in the availability of credit to jewellery retailers and manufacturers combined with relatively weak consumer confidence to send retail purchasing of all types of jewellery lower. Additionally, instead of the stockbuilding over 2010-2013, there was some destocking across the industry due to store closures and lower sales. There may be scope for a rebound in demand in 2017, but we do not anticipate a rapid return to 2012-2014 levels.
Outside China, there were some positives for jewellery demand. In India, the platinum Evara brand continues to perform well, demonstrating the success of the Platinum Guild International’s
approach to marketing in this country, although sales were affected at the end of the year by the decision to withdraw some high-denomination bank notes from circulation. We see considerable potential for further demand growth here, driven by these market developments, although the recent demonetisation process could pose a short-term headwind. Elsewhere, North American demand expanded, reflecting strong economic growth and returning consumer confidence in the USA in particular. European jewellery demand was stable.
InvestmentNet investment demand for platinum was healthy, at close to its five-year average, and grew by 31% or 140,000 ounces from the prior year. ETF liquidation slowed and even reversed at times: US dollar strength meant that the platinum price provided some interesting buying opportunities in many currencies. Just as significantly, Japanese investors bought approximately 500,000 ounces of platinum: the metal’s continuing discount to gold and low absolute price in yen meant that consumers were very keen buyers for a second successive year. Work by the World Platinum Investment Council has helped to improve availability and demand for physical products in a number of countries.
ETF flows were the dominant factor in palladium investment demand. As the palladium price firmed in US dollar terms, and even more in other currencies, this provided an opportunity for profit-taking and ETF investors reduced their holdings by a net 590,000 ounces over the year. Investment demand for rhodium and the minor metals was boosted by improved product availability, although rhodium investment flows were negative on a net basis.
STRATEGYRestructuringAnglo American Platinum continues to make progress in implementing its value-driven strategy through restructuring. Since 2013, the company has reduced unprofitable platinum production by some 400,000 ounces after placing Marikana on care-and-maintenance; consolidating Rustenburg mines from five to two mines; consolidating Union from two to one mine and closing the declines; restructuring Bokoni to place the unprofitable Vertical and UM2 shafts on care-and-maintenance; and placing Twickenham project on care-and-maintenance in 2016.
Significant headcount reductions have occurred since the start of the restructuring in 2013, ensuring that the Company is appropriately sized to service a smaller and less complex organisation. Operational efficiencies have enabled production volumes to be sustained with fewer employees and without the need for capital.
Anglo American Platinum Limited Annual Results Presentation 2016 7

DRAFT
Repositioning the portfolioAnglo American Platinum has achieved key strategic successes in 2016 in repositioning its portfolio, announced in 2014. The Company aims to own and operate the best assets in the PGM industry, consisting of Mogalakwena, Amandelbult, Unki, and our JV operations, BRPM, Mototolo and Modikwa and the processing assets.
The completion of the sale of the Rustenburg Operations in 2016, and the SPA’s announced for the sale of the Company’s 42.5% stake in the Pandora joint venture, and the disposal of Union mine and Masa Chrome, (both of which are anticipated to complete during 2017), allow the Company to focus on the most competitive assets, consisting of largely open-pit and more mechanised operations which will result in higher margin production, a smaller and more highly skilled workforce, safer operations and a less complex organisation. As a result, the core operations stand to benefit from dedicated management attention and technical expertise, as well as disciplined capital allocation.
Disposal of Rustenburg Operations to SibanyeThe Company announced on 1 November 2016 that it had completed the disposal of Rustenburg Operations to Sibanye Rustenburg Platinum Mines Proprietary Limited, a subsidiary of Sibanye Gold Limited (Sibanye). The upfront proceeds of R1.5 billion were paid in cash and used to reduce net debt. The Company will also receive a deferred consideration of R3.0 billion over six to eight years in the form of 35% of distributable free cash flow from the Rustenburg Operations. The Company has also entered into a purchase of concentrate and tolling agreement, to purchase concentrate for two years (to 2018) and to then toll treat the material for up to eight years. The transaction is cashflow, earnings and ROCE accretive for the Company.
Disposal of mineral resources within the Amandelbult mining right to NorthamThe Company announced on 11 October 2016 that it had signed a SPA to dispose of mineral resources within the Amandelbult mining right and surface properties above and adjacent to Northam’s resource. These resources are excluded from current life of mine plans and are long dated. The consideration comprises cash of R1 billion and an ancillary mineral resource within Northam’s Zondereinde mining right that borders Amandelbult’s mining right, that can provide the Company with flexibility for the placement of future mining infrastructure. It is envisaged that the transaction will complete in 2017 and the cash proceeds be used to reduce net debt.
Disposal of Anglo American Platinum 42.5% stake in Pandora to LonminThe Company announced on 11 November 2016 that it had entered into a conditional Sales and Purchase agreement to dispose of its 42.5% stake in the Pandora Joint Venture, to Lonmin plc (Lonmin). The consideration will comprise of a deferred cash element of a minimum of R400 million and a maximum of R1.0 billion over
six years and a rental agreement for the use of and full operational control of Lonmin’s Baobab concentrator for a three year period commencing on completion of the Transaction. It is envisaged that the transaction will complete in 2017.
Disposal of Union mine and Masa Chrome to SiyandaAnglo American Platinum announces that it signed an SPA on 14 February 2017 to sell its 85% interest in Union mine and 50.1% interest in Masa Chrome Company Proprietary Limited to Siyanda Resources (Siyanda). The consideration comprises an initial purchase price of R400 million in cash, as well as a deferred consideration based on 35% of cumulative distributable free cash flow paid annually as an earn-out, for a period of ten years from the date of completion of the transaction. The Company has no obligation to pay towards any negative cash flow generated by these assets.
In addition to the initial and deferred consideration, Anglo American Platinum has entered into a purchase of concentrate agreement for seven years and thereafter an agreement to toll treat the 4E metals (platinum, palladium, rhodium and gold) until the end of life of mine. The transaction is subject to conditions precedent typical of a transaction of this nature, which include the granting of the Section 11 consent from the Department of Mineral Resources (DMR) and the approval of the transaction by the competition authorities of the Republic of South Africa. The transaction is expected to complete during 2017.
BokoniTechnical work to review the mine extraction strategy and to develop a path towards a sustainable and optimised operation was completed in collaboration with our JV partner. Following the closure of Vertical and UM2 shafts and reducing headcount by a third, Bokoni is implementing its new optimised mine plan, and will close the open pit operations. Discussions on the most appropriate exit for Anglo American Platinum are ongoing.
KroondalThe Company’s stake in Kroondal is considered a non-core operation. However, as the operation generates attractive cash flow for the Company it will only be disposed for value. No formal discussions have commenced.
POSITIONING FOR THE FUTUREMarket developmentAnglo American Platinum’s global PGM market development initiatives are focused on offsetting the risk of lower demand in existing demand segments using a mix of marketing initiatives in existing or near-term applications and targeted development in longer-term growth areas, such as fuel cells, hydrogen and clean energy generally. South African beneficiation objectives form part of our broader market development activities.
8 Anglo American Platinum Limited Annual Results Presentation 2016
ANNUAL RESULTS PRESENTATION 2016 RESULTS COMMENTARY

DRAFT
The Company invests in market development and beneficiation across a number of demand segments, using a range of approaches that are appropriate for each:
• Global and local development of platinum jewellery markets is carried out through the Platinum Guild International (PGI) which is funded by Anglo American Platinum and some of the other primary PGM producers. The PGI is focused on a number of important countries, including China, India, Japan and the USA, where it promotes platinum as a jewellery material by working with designers, manufacturers and retailers
• Further development of investment demand for platinum is led by the World Platinum Investment Council (WPIC), an industry body funded by a number of platinum producers including Anglo American Platinum. 2016 achievements include partnering with Valcambi, a Swiss refiner, to increase the availability of physical investment products, the UK’s BullionVault to offer vaulted products, and Mitsubishi UFJ to stimulate further Japanese demand for platinum through an Exchange Traded Fund or ETF
• The Company also operates a PGM investment programme. This uses a venture capital-type approach to provide start-up or early stage capital to companies working on the commercialisation of technology that utilises one or more of the platinum group metals. Many of the investments have focused on hydrogen, fuel cells and clean energy such as the 2016 investments in Greyrock, which is developing and commercialising technology used to produce clean fuels from flare gas, and in United Hydrogen Corporation, which is working on low cost hydrogen, a key issue for the adoption of fuel cell vehicles. In addition, we sponsor academic research into the use of the PGMs at a number of universities in South Africa and elsewhere
• The Company also continues to work on areas aiding the widespread commercial adoption of fuel cells and hydrogen in the transport sector and other sectors. This involves a range of activities from investing in companies that address specific market development opportunities through the PGM investment programme, to engaging with government to ensure equitable regulatory terms for these technologies, and assisting in demonstration programmes where these are appropriate
Mining innovationAnglo American Platinum initiated a new innovation strategy in 2011 to find alternatives for conventional mining and, in 2013, changed strategy to aim for 70% mechanised production from the core retained portfolio. The move to mechanisation will ensure that these alternative mining methods will be safer and more productive, as well as ultimately more cost effective for the Company.
The Company is focused on finding alternative ways to modernise mining in narrow tabular orebodies in the platinum industry by using different equipment, layouts and techniques that will change the conventional way of mining. In 2016, testing for this technology moved to Twickenham from Bathopele mine as this mine was exited with the sale of the Rustenburg Operations.
Anglo American Platinum has developed a number of new technologies and equipment, including electro-hydraulic hand-held drills; extra-low profile fleet of drill rigs and bolters; ultra-low profile drill rig, bolter, dozer and sweeper units; cutting technologies that include the rapid mining development system; continuous conveyor belts and more. In addition, significant progress has been made with fuel cell technologies and, within the Company’s fleet, a dozer and two locos are now running on hydrogen fuel. Assistance has also been given at Mogalakwena mine, with developments in autonomous drilling, blasting fragmentation and anti-collision devices on vehicles.
Social and labour plan investmentIn 2016, the pace of delivering on social and labour plan (SLP) commitments normalised after accelerated investment in 2015 to counter prior delays. In South Africa, the Company invested R337 million (2015: R547 million) in community development, in line with mining charter requirements. Since 2010, 114 SLP projects have been initiated. By the end of 2016, 107 projects had been completed with the remaining seven due for completion in 2017.
With the official completion of the first phase of SLPs, known as SLP1 (2011-2016), we were required to develop, submit and implement SLP2 for all operations. A total of 96 projects were identified in consultation with communities, local municipalities and ratified by relevant provincial departments. Implementation is under way, with six already completed.
Wage negotiationsThe Company signed a three year wage agreement on 27 October 2016 with the Association of Mineworkers and Construction Union (AMCU), retrospectively applied from 1 July 2016 when the previous agreement concluded. This agreement was extended to the National Union of Mineworkers (NUM), United Association of South Africa (UASA) and non-union affiliated employees in terms of section 23 of the Labour Relations Act, Act 66 of 1995.
The agreement followed a constructive and collaborative negotiation process, resulting in a cost-to-company increase of 6.71% in year 1, 6.56% in year two and 6.96% in year three, or 6.74% on average over the three-year period – an outcome deemed fair to employees and one that ensures a sustainable future for the business.
GOVERNMENT AND INDUSTRY POLICYMining Charter IIIAnglo American Platinum recognises the invaluable contribution that mining has made, and continues to make, to South Africa’s economic and social landscape. The Mining Charter provides important guidelines in advancing the transformation of the mining industry, covering a range of transformation pillars—from ownership, mine community development, employment equity, housing, to living conditions and procurement. The Company is confident that it has met its targets, in accordance with the current Mining Charter.
Anglo American Platinum Limited Annual Results Presentation 2016 9

DRAFT
A proposed Draft Reviewed Mining Charter was published on 15 April 2016 in the Government Gazette. Anglo American Platinum—through a submission by Anglo American plc—has voiced its serious concerns regarding the Draft Reviewed Mining Charter, and called amongst others for a regulatory impact assessment to be conducted by the Government to determine the potential consequences of the Draft Reviewed Mining Charter on the mining industry and South African economy. The Company believes that were a Draft Reviewed Mining Charter to result from an agreement between Government and industry (as was the case previously in 2004 and 2010), the effect would be greatly enhanced regulatory certainty and investor confidence.
The Company remains committed to working with the Department of Mineral Resources (DMR), through the Chamber of Mines, to ensure the industries concerns are appropriately addressed.
Mineral and Petroleum Resources Development Act (MPRDA)Amendments to South Africa’s MPRDA, which have been under parliamentary review for nearly two years, have recently been sent to the National Council of Provinces (NCOP) for approval, after a favourable National Assembly vote on the bill being referred to the NCOP, the upper house in parliament and the final step before promulgation. Minister Zwane has publicly stated he believes the bill will pass constitutional muster.
Some of the mining industry’s concerns on the MPRDA amendment relate to the status of the mining charter in the bill, capping exports of strategic minerals (still to be defined by the minister, a level of discretion that concerns the industry) and the fact that the minster has discretion on pricing minerals to local users to encourage beneficiation.
The Company continues to engage the minister and DMR, via the Chamber of Mines, on these aspects of the proposed bill, in an attempt to find a resolution before promulgation which, from DMR indications, is likely to happen in the first half of 2017.
Unki indigenisation in ZimbabweAfter approval of its indigenisation plan, Anglo American Platinum signed a heads of agreement with the government of Zimbabwe in November 2012 that set out key terms of the approved indigenisation plan for Unki mine investment. The proposed transaction would have resulted in the disposal of up to 51% of the equity in Unki, facilitated through a notional vendor-funded transaction.
The plan has not yet been implemented as the government of Zimbabwe has been refining its position on indigenisation. In April 2016, President Mugabe issued a press statement that sought to clarify the government’s position on the indigenisation and economic empowerment policy. In terms of the statement, existing mining companies such as Unki would achieve compliance with indigenisation requirements by ensuring that at least 75% of gross
sales proceeds are spent and retained in Zimbabwe. The statement concluded by noting that President Mugabe had directed that indigenisation legislation be amended to comply with this latest position. Amendments to the Indigenisation Act are yet to be made.
MINERAL RESERVES AND RESOURCES STATEMENTThe combined South African and Zimbabwean Ore Reserves decreased from 184.6 4E Moz to 170.2 4E Moz in the review period. This was primarily as a result of the sale of the Rustenburg Operations to Sibanye Gold Ltd. The reduction of Ore Reserves associated with the sale of the Rustenburg Operations has been partially offset by an increase in Ore Reserves at Mogalakwena and Amandelbult’s Dishaba mine due to the additional conversion of Mineral Resources to Ore Reserves. At Mogalakwena Ore Reserves increased significantly due to pit shell design changes and at Amandelbult’s Dishaba mine, Ore Reserves increased materially due to a revised UG2 extraction strategy.
The South African and Zimbabwean Mineral Resource, inclusive of Ore Reserves decreased by 9.2% from 916.4 4E Moz to 831.7 4E Moz equivalent in the year under review. This was primarily the result of the disposal of the Rustenburg Mineral Resource, inclusive of Ore Reserves to Sibanye. This disposal has been partially offset by the increase in Mineral Resource, inclusive of Ore Reserves at Mogalakwena mine due to the pit shell design changes.
Anglo American Platinum maintains an industry leading Mineral Resource and Ore Reserve status, even after the sale of the Rustenburg operations, and after revisions to future economic assumptions.
OUTLOOKIn view of the current and expected market conditions for PGMs, Anglo American Platinum remains focused on its strategy to deliver change and build a resilient business. The Company has positioned itself to manage through the current environment. Stringent cost controls have been implemented, restructuring completed at Union and unprofitable production at Twickenham placed on care and maintenance which will deliver cost savings in 2017. Restructuring the business has resulted in a further R700 million of overhead savings.
Underlying cash-flow generation remains a focus, and project capital will therefore be prioritised on quick-return projects that generate meaningful incremental value. No major project capital will be committed in 2017, although the Company continues with study plans for potential future replacement and growth projects to position itself to implement these should market conditions improve. The Company aims to strengthen the balance sheet to manage through the cycle and execute on high-returning projects when market conditions require additional production. Given project capital expenditure will be limited in the current environment, and in keeping with capital-allocation policy, the Board will continue to monitor the potential to reinstate a dividend in 2017.
10 Anglo American Platinum Limited Annual Results Presentation 2016
ANNUAL RESULTS PRESENTATION 2016 RESULTS COMMENTARY

DRAFT
Market outlookAnglo American Platinum expects the economic environment to remain challenging for PGMs in 2017, with relatively low prices.
Although there were numerous positives for platinum demand last year, in the form of investment, automotive and industrial demand, there were some notable challenges, particularly in the jewellery sector. These headwinds suggest that overall demand will change little in 2017. A combination of limited capital expenditure in recent years and the ageing of some older mines across the industry means that mine supply is more likely to decline than increase over the medium term. Even limited growth in existing applications would therefore be expected to support the platinum price to some extent. If the industry’s market-development initiatives in investment, jewellery, fuel cells and hydrogen are successful, these should result in fundamental deficits.
In contrast, palladium is expected to remain in substantial deficits over the next five years, as growth in autocatalyst demand drives overall demand higher. The outlook for rhodium is less positive: although there are signs of additional demand developing, this metal is currently in surplus and is unlikely to move into deficit rapidly.
The outlook for platinum demand in 2017 is largely neutral compared to 2016. Automotive demand is expected to contract marginally as the diesel engine continues to lose market share in smaller cars in Europe, although the introduction of tighter emissions rules involving real-world driving could boost individual catalyst loadings. Industrial platinum buying should remain strong in many sectors, with the chemical and glass sectors set to buy more metal. While investment demand is difficult to forecast, the current metal price and initial success of some of the industry’s market-development work suggests that demand in this sector could again be relatively strong. In the short term, however, the area of greatest concern is the performance of the jewellery sector. The Chinese jewellery sector contracted for a variety of reasons in 2016, with platinum suffering too. Some of these factors may be one-offs but, given lower prevailing economic growth, we anticipate at best a modest recovery in demand here. The Indian jewellery sector continues to show great promise but its performance in 2017 is likely to be hampered by the ongoing effects of the recent demonetisation programme.
Macroeconomic and political factors, such as US interest rate hike expectations, impact of the new Republican government under Donald Trump, and further information on Brexit, among others, will probably affect sentiment and therefore price as much as supply and demand fundamentals.
Operational outlookPlatinum production guidance (metal-in-concentrate) will be 2.35-2.40 million ounces for 2017, driven by increased purchase-of-concentrate from third parties. Own mine and managed production will remain constant year on year.
Financial outlookThe Company recorded input cost inflation of around 7.5% in 2016. Cost inflation is likely to remain a challenge in 2017. While some costs have been mitigated by restructuring the Company and implementing various initiatives, inflationary pressures from wages and electricity remain.
The decrease in capitalised waste costs in 2017 at Mogalakwena will add around R400 per ounce to unit costs for 2017 as overall volume is maintained at 99 million tonnes, and a lower amount of volume is capitalised (in line with IFRIC 20), however there will be no cash-flow impact. Further initiatives have been identified to reduce the impact of cost escalations and we expect the unit cost per platinum ounce produced to be between R20,350 and R20,850, an increase of 2% to 5% excluding Mogalakwena capitalised waste costs.
There are no significant restructuring activities envisaged for 2017 as all operational restructuring is complete.
The sale of out-of-plan resources at Amandelbult to Northam for R1 billion in cash, the upfront proceeds from the sale of Union mine of R400 million and a second customer prepayment for $100 million will be used to reduce debt in 2017.
Johannesburg, South Africa14 February 2017
Any forecast information included in this announcement has not been reviewed and reported on by the company’s external auditors.
For further information, please contact:
Investor relationsEmma Chapman+27 (0) 11 373 [email protected]
MediaMpumi Sithole+27 (0) 11 373 [email protected]
Anglo American Platinum Limited Annual Results Presentation 2016 11

Audited2016 2015
(Note 19)*Notes Rm Rm
Gross sales revenue 61,976 59,829 Commissions paid (16) (14)
Net sales revenue 2 61,960 59,815 Cost of sales 3 (56,096) (54,584)
Gross profit on metal sales 3 5,864 5,231 Other net expenditure 5 (600) (514)Loss on impairment and scrapping of property, plant and equipment (22) (10,242)Market development and promotional expenditure (683) (800)
Operating profit/(loss) 4,559 (6,325) Impairment of investments in associates (283) (4,082)Impairment of non-current financial assets (111) (1,792)Impairment of available-for-sale investment in Royal Bafokeng Platinum (RB Plat) – (775)Share-based payment expense for facilitation of BEE investment in Atomatic 17 (156) – Loss on disposal of Rustenburg Mine 18 (1,681) – Interest expensed (1,329) (1,049)Interest received 149 98Remeasurements of loans and receivables 27 40 Losses from associates (net of taxation) (115) (529)
Profit/(loss) before taxation 1,060 (14,414) Taxation 6 (364) 1,979
Profit/(loss) for the year 696 (12,435)
Other comprehensive income, net of income taxItems that will be reclassified subsequently to profit or loss (465) 1,731
Deferred foreign exchange translation (losses)/gains (769) 1,582Share of other comprehensive gains from associates – 49Actuarial loss on employees’ service benefit obligation (6) (4)Net gains/(losses) on available-for-sale investments 310 (671)Recycling of cumulative losses on impairment of available-for-sale investment – 775
Total comprehensive income/(loss) for the year 231 (10,704)
Profit/(loss) attributable to:Owners of the Company 632 (12,358) Non-controlling interests 64 (77)
696 (12,435)
Total comprehensive income/(loss) attributable to:Owners of the Company 167 (10,627) Non-controlling interests 64 (77)
231 (10,704)
Headline earnings/(loss) 7 1,867 (126)
Number of ordinary shares in issue (millions)# 268.3 268.0 Weighted average number of ordinary shares in issue (millions) 261.9 261.4 Weighted average number of diluted ordinary shares in issue (millions) 263.0 262.2Earnings/(loss) per ordinary share (cents)– basic 241 (4,728) – diluted 240 (4,714)
* Prior year restated.# Includes the shares issued as part of the community economic empowerment transaction, but excludes the shares held by the Group ESOP and the shares held by various
share schemes.
ANNUAL RESULTS PRESENTATION 2016 SUMMARISED PRELIMINARY AUDITED GROUP FINANCIAL RESULTS
12 Anglo American Platinum Limited Annual Results Presentation 2016
SUMMARISED CONSOLIDATED STATEMENT OF COMPREHENSIVE INCOMEfor the year ended 31 December 2016

Audited Audited2016 2015 2014
(Note 19)* (Note 19)*Notes Rm Rm Rm
ASSETSNon-current assets 51,662 52,205 66,686
Property, plant and equipment 38,574 39,869 44,297Capital work in progress 4,892 6,548 10,736Investment in associates 8 3,963 3,883 7,637Investments held by environmental trusts 907 882 842Other financial assets 9 3,326 1,023 3,120Other non-current assets – – 54
Current assets 26,035 20,715 22,373
Inventories 10 16,369 16,305 17,100Trade and other receivables 2,140 1,761 2,631Other assets 1,554 927 1,440Other financial assets 45 – –Taxation 470 50 –Cash and cash equivalents 5,457 1,672 1,202
Total assets 77,697 72,920 89,059
EQUITY AND LIABILITIESShare capital and reservesShare capital 27 27 27Share premium 22,498 22,395 21,846Foreign currency translation reserve 2,317 3,086 1,504Available-for-sale reserve 334 24 (80)Retained earnings 14,840 14,120 26,749Non-controlling interests (234) (408) (210)
Shareholders’ equity 39,782 39,244 49,836
Non-current liabilities 19,187 22,564 21,847
Interest-bearing borrowings 11 9,398 12,124 9,459Obligations due under finance leases 96 94 –Environmental obligations 1,938 2,404 2,110Employee benefits 17 14 8Other financial liabilities 219 – –Deferred taxation 7,519 7,928 10,270
Current liabilities 18,728 11,112 17,376
Interest-bearing borrowings 11 3,267 2,209 6,361Obligations due under finance leases 15 14 –Trade and other payables 10,241 6,818 7,660Other liabilities 4,623 2,058 2,043Other financial liabilities 567 2 –Share-based payment provision 15 11 19Taxation – – 1,293
Total equity and liabilities 77,697 72,920 89,059
* Prior year restated.
Anglo American Platinum Limited Annual Results Presentation 2016 13
SUMMARISED CONSOLIDATED STATEMENT OF FINANCIAL POSITIONas at 31 December 2016

Audited2016 2015
(Note 19)*Notes Rm Rm
Cash flows from operating activitiesCash receipts from customers 61,783 60,563 Cash paid to suppliers and employees (48,187) (49,621)
Cash generated from operations 13,596 10,942 Interest paid (net of interest capitalised) (1,071) (857)Taxation paid (1,125) (1,821)
Net cash from operating activities 11,400 8,264
Cash flows used in investing activitiesPurchase of property, plant and equipment (includes interest capitalised) (5,018) (5,152)Proceeds from sale of plant and equipment 140 41 Proceeds on sale of mineral rights and other investments – 3 Proceeds on sale of Rustenburg Mine (net of cash disposed of) 18 1,356 –Working capital support in respect of Rustenburg Mine 18 (1,418) –Funding to associates (448) (739)Acquisition of equity investment in associate (34) (23)Acquisition of available-for-sale investment in Greyrock (36) –Acquisition of convertible notes in United Hydrogen (39) –Acquisition of preference shares in Baphalane Siyanda Chrome Company (BSCC) 9 (84) –Advances made to Plateau Resources Proprietary Limited (312) (260)Net increase in investments held by environmental trusts 2 (1)Interest received 95 76 Growth in environmental trusts 7 6 Other advances (40) (15)
Net cash used in investing activities (5,829) (6,064)
Cash flows used in financing activitiesPurchase of treasury shares for the Bonus Share Plan (BSP) (163) (120)Purchase of Anglo American plc shares for the Amplats share schemes (7) – Repayment of interest-bearing borrowings (1,668) (1,487)Repayment of finance lease obligation (16) (21)Unpaid dividends written back – 19 Funding for non-controlling interest’s 26% share in subsidiary 112 –Cash distributions to non-controlling interests (44) (121)
Net cash used in financing activities (1,786) (1,730)
Net increase in cash and cash equivalents 3,785 470 Cash and cash equivalents at beginning of year 1,672 1,202
Cash and cash equivalents at end of year 5,457 1,672
Movement in net debtNet debt at beginning of year (12,769) (14,618)Net cash from operating activities 11,400 8,264 Net cash used in investing activities (5,829) (6,064)Other (121) (351)
Net debt at end of year (7,319) (12,769)
Made up as follows:Cash and cash equivalents 5,457 1,672 Non-current interest-bearing borrowings 11 (9,398) (12,124)Obligations due under finance leases within one year (15) (14)Current interest-bearing borrowings 11 (3,267) (2,209)Obligations due under finance leases (96) (94)
(7,319) (12,769)
* Prior year restated.
ANNUAL RESULTS PRESENTATION 2016 SUMMARISED PRELIMINARY AUDITED GROUP FINANCIAL RESULTS
14 Anglo American Platinum Limited Annual Results Presentation 2016
SUMMARISED CONSOLIDATED STATEMENT OF CASH FLOWfor the year ended 31 December 2016

Foreigncurrency Available- Non-
Share Share translation for-sale Retained controllingcapital premium reserve reserve earnings interests Total
(Note 19) (Note 19)# (Note 19)#Rm Rm Rm Rm Rm Rm Rm
Balance at 31 December 2014 (Restated) 27 21,846 1,504 (80) 26,749 (210) 49,836
Total comprehensive income/(loss) for the year (Restated) 1,582 104 (12,313) (77) (10,704)Cash distributions to minorities (121) (121)Shares acquired in terms of the BSP – treated as treasury shares (–)* (255) 135 (120)Shares vested in terms of the BSP – * 353 (353) – Shares vested in terms of the Group Employee Share Option Scheme (Kotula) – * 451 (451) – Equity-settled share-based compensation 338 338 Shares purchased for employees (4) (4)Unpaid dividends written back 19 19
Balance at 31 December 2015 (Restated) 27 22,395 3,086 24 14,120 (408) 39,244
Total comprehensive income/(loss) for the year (769) 310 626 64 231Non-controlling interest’s 26% share in subsidiary 112 112Cash distributions to minorities (44) (44) Shares acquired in terms of the BSP – treated as treasury shares (–)* (163) (163) Shares vested in terms of the BSP – * 266 (266) –Shares vested in terms of the Group Employee Share Option Scheme (Kotula) – * –Equity-settled share-based compensation 389 42 431 Shares purchased for employees (29) (29)
Balance at 31 December 2016 27 22,498 2,317 334 14,840 (234) 39,782
* Less than R500,000.# Prior year restated.
Anglo American Platinum Limited Annual Results Presentation 2016 15
SUMMARISED CONSOLIDATED STATEMENT OF CHANGES IN EQUITYfor the year ended 31 December 2016

1. The summarised consolidated financial statements are presented in accordance with the framework concepts and the measurement and recognition requirements of International Financial Reporting Standards (IFRS), the SAICA Financial Reporting Guides as issued by the Accounting Practices Committee, Financial Reporting Pronouncements as issued by the Financial Reporting Standards Council, as well as the requirements of the Companies Act of South Africa and the JSE Limited’s Listings Requirements. The summarised consolidated financial statements also contain, at a minimum, the information required by International Accounting Standard 34 Interim Financial Reporting. The accounting policies applied in the preparation of the consolidated financial statements from which the summarised consolidated financial statements were derived are in terms of IFRS and consistent with those applied in the financial statements for the year ended 31 December 2015.
The directors take full responsibility for the preparation of the preliminary report and that the summarised financial information has been correctly extracted from the underlying audited consolidated financial statements. The preparation of the Group’s audited results and the summarised consolidated financial statements for the year ended 31 December 2016 were supervised by the Finance director, Mr I Botha CA(SA).
The consolidated financial statements from which the summarised consolidated financial statements have been extracted have been audited by the Company’s auditors, Deloitte & Touche. The consolidated financial statements and the auditor’s unmodified report on the consolidated financial statements are available for inspection at the Company’s registered office.
Audited Audited AuditedNet sales revenue Operating contribution Depreciation
2016 2015 2016 2015 2016 2015Rm Rm Rm Rm Rm Rm
2. SEGMENTAL INFORMATION*Segment revenue and resultsOperationsMogalakwena Mine 14,227 13,864 4,785 5,174 1,813 1,600Amandelbult Mine 10,870 9,032 1,367 841 822 755Unki Platinum Mine 2,227 2,024 22 (62) 424 454Twickenham Platinum Mine 215 329 (448) (742) 48 268Modikwa Platinum Mine1 1,608 1,469 18 76 175 173Mototolo Platinum Mine1 1,418 1,411 290 371 120 105Kroondal Platinum Mine1 3,101 3,010 318 476 406 306Rustenburg Mine2 9,307 10,957 410 12 299 1,096Union Mine 3,958 3,695 596 93 253 244
Total – mined 46,931 45,791 7,358 6,239 4,360 5,001
Process tailings retreatment3 – 61 – (22) – 3Purchased metals 15,029 13,963 1,325 1,625 269 211
61,960 59,815 8,683 7,842 4,629 5,215
Other costs (note 4) (2,819) (2,611)
Gross profit on metal sales 5,864 5,2311 Amplats’ share (excluding purchase of concentrate)2 Effective 1 November 2016, Rustenburg Mine was disposed of.3 Includes slag tailings retreatment at Mortimer Smelter (closed September 2015).* Prior year restated.
Information reported to the Executive Committee of the Group for purposes of resource allocation and assessment of segment performance is done on a mine-by-mine basis.
Changes to the segmental informationThe following change to the segmental reporting was made following changes to internal reporting to the Executive Committee:
• Purchased metals was reclassified to include tailings from a third party and exclude it from Rustenburg Mine as it did not form part of the Rustenburg Mine sale.
This resulted in the following changes to the comparative figures:Audited Audited Audited
Net sales revenue Operating contribution DepreciationAs reported Reclassified As reported Restated Reclassified As reported Reclassified
Rm Rm Rm Rm Rm Rm Rm
Rustenburg Mine 11,117 10,957 38 56 12 1,098 1,096Purchased metals 13,803 13,963 1,562 1,581 1,625 209 211
24,920 24,920 1,600 1,637 1,637 1,307 1,307
ANNUAL RESULTS PRESENTATION 2016 SUMMARISED PRELIMINARY AUDITED GROUP FINANCIAL RESULTS
16 Anglo American Platinum Limited Annual Results Presentation 2016
NOTES TO THE SUMMARISED CONSOLIDATED FINANCIAL STATEMENTSfor the year ended 31 December 2016

Audited2016 2015
Rm Rm
3. GROSS PROFIT ON METAL SALES*Gross sales revenue 61,976 59,829Commissions paid (16) (14)Net sales revenue 61,960 59,815Cost of sales (56,096) (54,584)On-mine (32,812) (33,913)
Cash operating costs (29,615) (29,918)Depreciation (3,197) (3,995)
Purchase of metals and leasing activitiess (13,518) (10,247)Smelting (3,515) (3,403)
Cash operating costs (2,834) (2,886)Depreciation (681) (517)
Treatment and refining (3,619) (3,381)Cash operating costs (2,868) (2,678)Depreciation (751) (703)
Increase/(decrease) in metal inventories 187 (1,029)Other costs (note 4) (2,819) (2,611)
Gross profit on metal sales 5,864 5,231
* Prior year restated.s Consists of purchased metals in concentrate, secondary metals and other metals.
4. OTHER COSTS*Other costs consist of the following principal categories:OverheadsCorporate costs 364 483Contributions to education and community development 419 490Research 251 330Exploration 95 144
Total exploration costs 162 215Less: Capitalised (67) (71)
Other 367 2001,496 1,647
Direct operating overheadsTransport of metals 565 318Royalties 493 305Share-based payments - other share schemes 265 310Share-based payments - the Kotula Trust – 31
1,323 9642,819 2,611
* Prior year restated.
5. OTHER NET EXPENDITURE*Other net expenditure consists of the following principal categories:Realised and unrealised foreign exchange losses – non-financial items – (2)Foreign exchange (losses)/gains on loans and receivables (184) 793Foreign exchange gains/(losses) on other financial liabilities 34 (235)Project maintenance costs§ (233) (124)Restructuring and other related costs (342) (996)Loss on disposal of plant, equipment and conversion rights (23) (42)Royalties received 16 29Other – net 132 63
(600) (514)§ Project maintenance costs comprise costs incurred to maintain land held for future projects and costs to keep projects on care and maintenance. It also includes the
costs of the operations put onto care and maintenance once the decision was made.* Prior year restated. Anglo American Platinum Limited Annual Results Presentation 2016 17

Audited2016 2015
Rm Rm
6. TAXATION* % %
A reconciliation of the standard rate of South African normal taxation compared with that charged in the statement of comprehensive income is set out in the following table:South African normal taxation 28.0 (28.0)Disallowable items 9.7 1.4Share-based payment expense for facilitation of BEE investment in Atomatic 4.1 –Employee housing expenditure disallowed 4.3 –Impairment of loans and investments 10.4 13.2Prior year underprovision/(overprovision) 2.3 (0.3)Effect of after-tax share of losses from associates 3.0 1.0Difference in tax rates of subsidiaries (3.1) (0.6)Impact of disposal of Rustenburg Mine (note 18) (27.5) – Zimbabwean AIDS levy 1.3 –Other 1.8 (0.4)
Effective taxation rate 34.3 (13.7)
* Prior year restated.
7. RECONCILIATION BETWEEN PROFIT/(LOSS) AND HEADLINE EARNINGS/(LOSS)*Profit/(loss) attributable to shareholders 632 (12,358)AdjustmentsNet loss on disposal of property, plant and equipment 23 25
Tax effect thereon (6) (7)Loss on impairment and scrapping of property, plant and equipment 22 10 242
Tax effect thereon (6) (2,862)Non-controlling interests’ share – (20)
Impairment of investments in associates 283 4,082Tax effect thereon – –
Impairment of available-for-sale investment in RB Plat – 775Tax effect thereon – –
Loss on disposal of Rustenburg Mine 1,681 –Tax effect thereon (762) –
Profit on sale of other mineral rights and investments – (3)Tax effect thereon – –
Headline earnings/(loss) 1,867 (126)
Attributable headline earnings/(loss) per ordinary share (cents)Headline 713 (48)Diluted 710 (48)
* Prior year restated.
ANNUAL RESULTS PRESENTATION 2016 SUMMARISED PRELIMINARY AUDITED GROUP FINANCIAL RESULTS
18 Anglo American Platinum Limited Annual Results Presentation 2016
NOTES TO THE SUMMARISED CONSOLIDATED FINANCIAL STATEMENTS continuedfor the year ended 31 December 2016
Audited2016 2015
Rm Rm
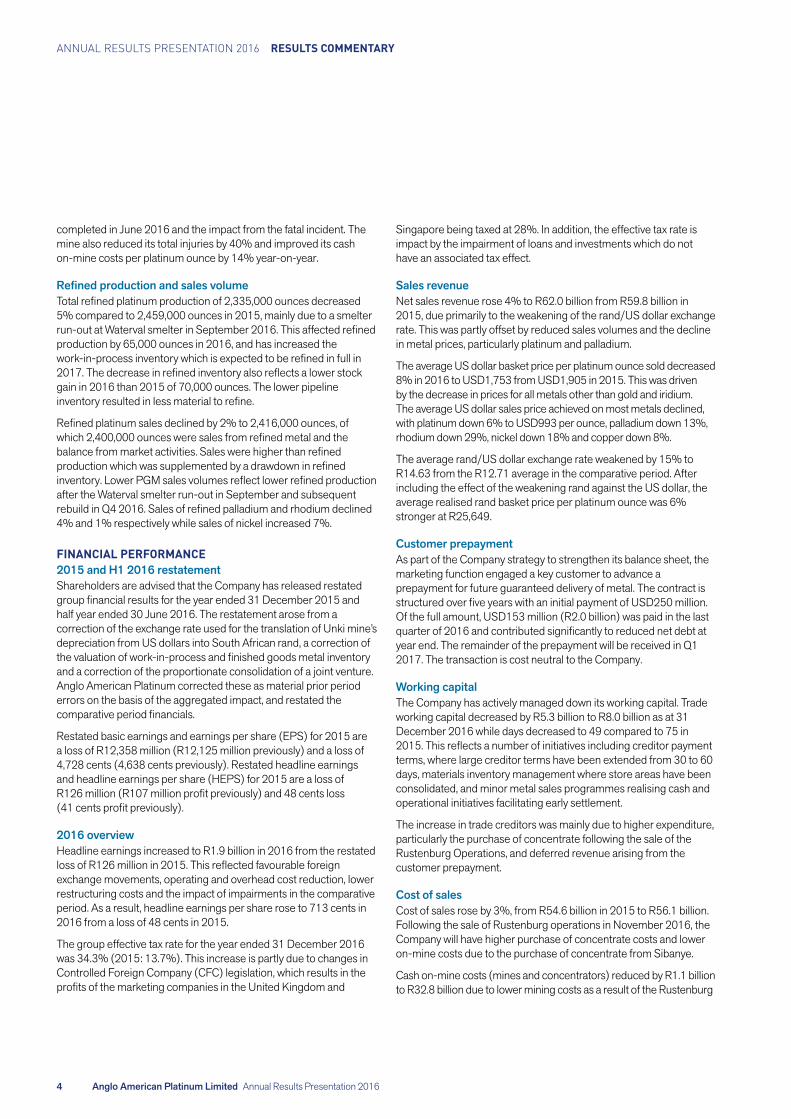
8. INVESTMENT IN ASSOCIATESListed (Market value: R113 million (2015: R61 million))Investment in Atlatsa Resources Corporation – –
Unlisted 3,963 3,883
Bokoni Platinum Holdings Proprietary Limited (Bokoni Holdco)Carrying value of investment – –
Bafokeng-Rasimone Platinum Mine (BRPM)Carrying value of investment 3,665 3,434
Richtrau No. 123 Proprietary LimitedCarrying value of investment 5 5
Peglerae Hospital Proprietary LimitedCarrying value of investment 56 52
Unincorporated associate – PandoraCarrying value of investment 192 366
Hydrogenious Technologies GmbHCarrying value of investment 45 26
3,963 3,883
9. OTHER FINANCIAL ASSETSLoans carried at amortised costLoans to Plateau Resources Proprietary Limited 201 –Loans to Atlatsa Holdings Proprietary Limited – –Loan to ARM Mining Consortium Limited 65 66Advance to Bakgatla-Ba-Kgafela traditional community 200 179Convertible notes in United Hydrogen Group Inc. 33 –Preference share investment in Baphalane Siyanda Chrome Company (note 17) 84 –Other 103 75
686 320
Available-for-sale investments carried at fair valueInvestment in Royal Bafokeng Platinum Limited 798 597Investment in Wesizwe Platinum Limited 161 87Investment in Greyrock Energy Inc. 34 –Food Freshness Technology Holdings 49 19
1,042 703
Investments at fair value through profit or lossDeferred consideration on sale of Rustenburg Mine (note 18) 1,598 –
Total financial assets 3,326 1,023
Anglo American Platinum Limited Annual Results Presentation 2016 19
Audited2016 2015
Rm Rm
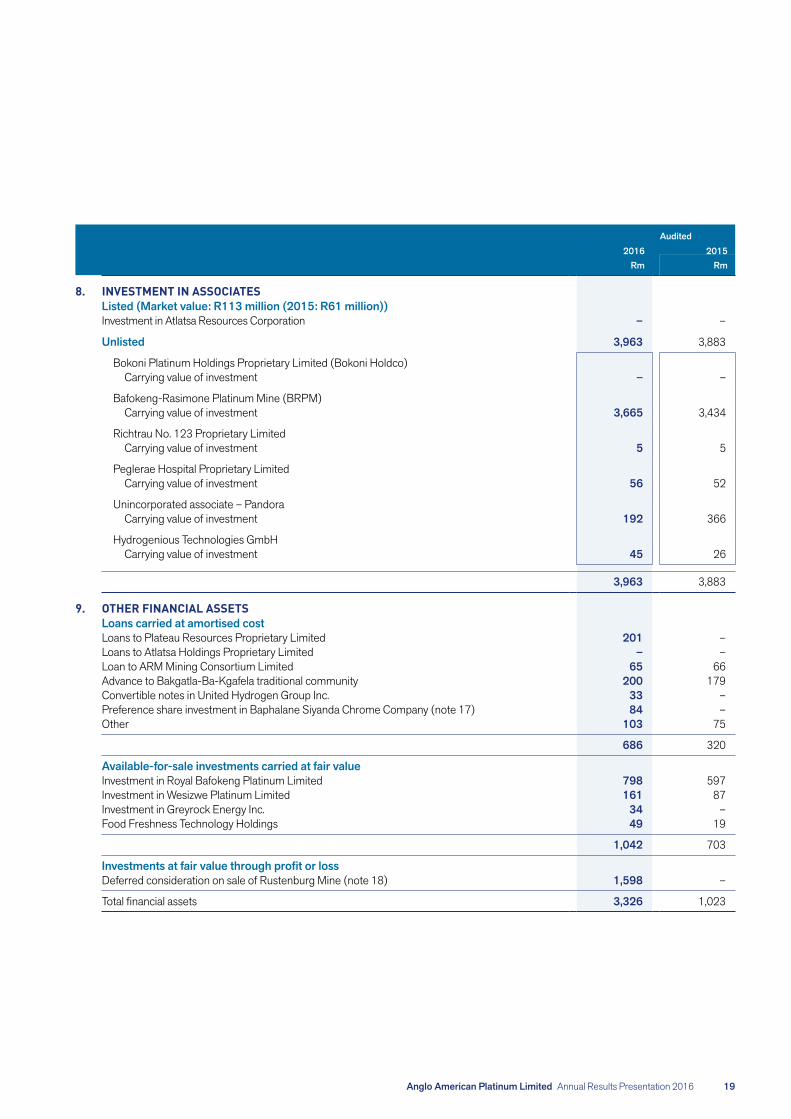
10. INVENTORIES*Refined metals 3,165 4,077
At cost 1,665 3,317At net realisable values 1,500 760
Work-in-progress 10,593 9,497
At cost 5,396 7,775At net realisable values 5,197 1,722
Trading metal originating from third parties at fair value less costs of disposals 3 –
Total metal inventories 13,761 13,574Stores and materials at cost less obsolescence provision 2,608 2,731
16,369 16,305
* Prior year restated.sTradingmetalcomprisesmetalacquiredfromthirdpartiesinarefinedstate,andwhichisvaluedatspotpricesattheendofthereportingperiod.
Facility Utilised Facility Utilisedamount amount* amount amount*
2016 2016 2015 2015Rm Rm Rm Rm
11. INTEREST-BEARING BORROWINGSUnsecured financial liabilities measured at amortised costCommitted 22,286 9,430 22,316 12,490Uncommitted 5,824 3,199 8,928 1,843
Total facilities 28,110 12,629 31,244 14,333Deferred income – 36 – –
Total interest-bearing borrowings 28,110 12,665 31,244 14,333
Disclosed as follows:Current interest-bearing borrowings 3,267 2,209Non-current interest-bearing borrowings 9,398 12,124
12,665 14,333
Weighted average borrowing rate (%) 8.80 7.91
Borrowing powersThe borrowing powers in terms of the memorandum of incorporation of the holding company and its subsidiaries are unlimited.
Committed facilities are defined as the bank’s obligation to provide funding until maturity of the facility, by which time the renewal of the facility is negotiated.
An amount of R19,657 million (2015: R18,515 million) of the facilities is committed for one to five years, R1,300 million (2015: R2,300 million) is committed for a rolling period of 364 days, R1,000 million (2015: Nil) is committed for a rolling period of 18 months, while the rest is committed for less than 364 days. The Company has adequate committed facilities to meet its future funding requirements.
Uncommitted facilities are callable on demand.
* Includes R9,100 million (2015: R9,100 million) and R3,199 million (2015: R1,843 million) owing to Anglo American SA Finance Limited on the committed and uncommitted facilities respectively. Related interest of R1,111 million (2015: R1,139 million) was paid.
ANNUAL RESULTS PRESENTATION 2016 SUMMARISED PRELIMINARY AUDITED GROUP FINANCIAL RESULTS
20 Anglo American Platinum Limited Annual Results Presentation 2016
NOTES TO THE SUMMARISED CONSOLIDATED FINANCIAL STATEMENTS continuedfor the year ended 31 December 2016

12. FAIR VALUE DISCLOSURESThe following is an analysis of the financial instruments that are measured subsequent to initial recognition at fair value. They are grouped into levels 1 to 3 based on the extent to which the fair value is observable.
The levels are classified as follows:
• Level 1 – fair value is based on quoted prices in active markets for identical financial assets or liabilities. • Level 2 – fair value is determined using directly observable inputs other than Level 1 inputs. • Level 3 – fair value is determined on inputs not based on observable market data.
Fair value measurement31 December at 31 December 2016
2016 Level 1 Level 2 Level 3Description Rm Rm Rm Rm
Financial assets through profit and lossInvestments held by environmental trusts 907 907 – –Other financial assets 1,643 – 1 1,642
Available-for-sale assets at fair valueOther financial assets 1,042 959 – 83
Non-financial assets at fair value through profit and lossTrading metal inventories originating from third parties 3 3 – –
Total 3,595 1,869 1 1,725
Financial liabilities through profit and lossTrade and other payables (6,266) – (6,266) –Other current financial liabilities (504) – (3) (501)
Non-financial liabilities at fair value through profit and lossLiabilities for return of metal (535) – (535) –
Total (7,305) – (6,804) (501)
Fair value measurement31 December at 31 December 2015
2015 Level 1 Level 2 Level 3Description Rm Rm Rm Rm
Financial assets through profit and lossInvestments held by environmental trusts 882 882 – –
Available-for-sale assets at fair valueOther financial assets 703 684 – 19
Non-financial assets at fair value through profit and lossTrading metal inventories originating from third parties – – – –
Total 1,585 1,566 – 19
Financial liabilities through profit and lossTrade and other payables* (2,972) – (2,972) –Other current financial liabilities (2) – (2) –
Non-financial liabilities at fair value through profit and lossLiabilities for return of metal – – – –
Total (2,974) – (2,974) –
* Represents payables under purchase of concentrate agreements.
There were no transfers between the levels during the year.
Anglo American Platinum Limited Annual Results Presentation 2016 21

12. FAIR VALUE DISCLOSURES continuedValuation techniques used to derive Level 2 fair valuesLevel 2 fair values for other current financial liabilities relate specifically to forward foreign exchange contracts.
The valuation of forward foreign exchange contracts is a function of the ZAR:USD exchange rate at balance sheet date and the forward exchange rate that was fixed as per the forward foreign exchange rate contract.
Level 2 fair values for trade and other payables relate specifically to purchase of concentrate trade creditors which are priced in US dollars. The settlement of these purchase of concentrate trade creditors takes place on average three to four months after the purchase has taken place. The fair value is a function of the expected ZAR:USD exchange rate and the metal prices at the time of settlement.
Level 3 fair value measurement of financial assets at fair valueThe Level 3 fair value of other financial assets comprises investments in unlisted companies Food Freshness Technology Holdings and Greyrock Energy Inc, which are classified as available-for-sale in terms of IAS 39 Financial Instruments: Recognition and Measurement and the deferred consideration on the disposal of the Rustenburg Mine which is classified as a financial asset at fair value through profit and loss. The fair values are based on unobservable market data, and estimated with reference to recent third party transactions in the instruments of the Company, or based on the underlying discounted cash flows expected.
The Level 3 fair value of other financial liabilities comprises the components of the deferred consideration on the disposal of the Rustenburg Mine, payable to Sibanye, which is classified as a financial liability at fair value through profit and loss. The fair value is based on the underlying discounted cash flows expected.
Reconciliation of Level 3 fair value measurements of financial assets and liabilities at fair value
2016 2015 2016 2015Other financial Other financial Other financial Other financial
assets assets liabilities liabilitiesRm Rm Rm Rm
Opening balance 19 – – –Acquisition of investment 35 19 – –Recognition of proceeds on disposal of Rustenburg Mine (note 18) 1,615 – (494) –Interest included in profit or loss 27 – (7) –Total gains included in profit or loss – – – –Total gains included in other comprehensive income 35 – – –Foreign exchange translation (6) – – –
Closing balance 1,725 19 (501) –
Level 3 fair value sensitivitiesAssumed expected cash flows, discount rates and market prices of peer groups have a significant impact on the amounts recognised in the statement of comprehensive income. A 10% change in expected cash flows, a 0.5% change in the discount rates and a 10% change in market prices of peer groups would have the following impact:
Financial asset Financial liability2016
Rm2015
Rm2016
Rm2015
Rm
10% change in expected cash flowsReduction to profit or loss 28 – – – Increase to profit or loss 28 – – –
0.5% change in discount rates Reduction to profit or loss 51 – 4 –Increase to profit or loss 53 – 4 –
10% change in market prices of peer groupsReduction to profit or loss 5 – – – Increase to profit or loss 5 – – –
ANNUAL RESULTS PRESENTATION 2016 SUMMARISED PRELIMINARY AUDITED GROUP FINANCIAL RESULTS
22 Anglo American Platinum Limited Annual Results Presentation 2016
NOTES TO THE SUMMARISED CONSOLIDATED FINANCIAL STATEMENTS continuedfor the year ended 31 December 2016

13. UNKI PLATINUM MINE INDIGENISATION PLANFollowing approval of its indigenisation plan by the government of Zimbabwe, Amplats signed a Heads of Agreement with the government of Zimbabwe in November 2012 that set out the key terms of the approved indigenisation plan for the Company’s Unki Mine investment. The plan has not yet been implemented.
In early April 2016, President Mugabe issued a press statement which sought to clarify the government of Zimbabwe’s position on the indigenisation and economic empowerment policy. In terms of the statement, existing mining companies such as Unki, would achieve compliance with the indigenisation requirements through ensuring that at least 75% of gross sales proceeds are spent and retained in Zimbabwe. The statement concluded by stating that President Mugabe had directed that the indigenisation legislation be amended to comply with this latest position. Amendments to the Indigenisation Act are yet to be made.
Stakeholders will be kept informed of any material developments in this regard.
14. ANNOUNCEMENT OF DISPOSAL TRANSACTIONSEquity investment in PandoraAmplats entered into a conditional Sale and Purchase Agreement (SPA) on 10 November 2016 with Eastern Platinum Limited, a wholly owned subsidiary of Lonmin plc (Lonmin) to sell its 42.5% interest in the Pandora Joint Venture (Pandora). The consideration for this interest will comprise a deferred cash payment of 20% of the distributable free cash flows generated by Pandora over six years, with minimum amount of R400 million; and a rental agreement for the use and full operational control of Lonmin’s Baobab concentrator for a three-year period.
Following the signing of the binding sales agreement, the investment in associate was assessed separately for impairment. As such, the recoverable value of Pandora is calculated as the fair value of the estimated proceeds less transaction costs, and amounts to R192 million – resulting in an impairment of R153 million. It excludes any economic value generated from the Baobab rental agreement which will be recognised for accounting purposes at the time when the benefit is received. The recoverable amount comprises a Level 3 fair value in terms of the fair value hierarchy (as defined in note 12). The fair value of the deferred consideration payable by Eastern Platinum Limited was determined based on the projected cash flows for Pandora’s E3 operations on a mine-to-ore basis. The relevant amounts were discounted at the cost of borrowing of Lonmin plc.
Since the transaction remains subject to DMR approval in terms of section 11, the investment has not been reclassified as held-for-sale.
Amandebult reservesOn 11 November 2016 Amplats announced the disposal of mineral resources within the Amandelbult mining right (the Resource), and surface properties above and adjacent to the Resource, to Northam Platinum Limited (Northam) for a consideration comprising R1.0 billion in cash (the Proceeds) and an ancillary mineral resource within Northam’s Zondereinde mining right that borders Amandelbult’s mining right and which provides the Company with flexibility for the placement of future mining infrastructure.
The Resource is long-dated and outside of Amplats’ long-term life-of-mine plans and therefore does not impact any current or future mining plans. The transaction does not constrain the Company’s next generation options for the Amandelbult mine, which has a number of shallow and less capital intensive life extension options. The surface properties forming part of the transaction will enable Northam to access the Resource.
No impairment was recognised as the carrying value of the Resource is nil. The transaction remains subject to DMR approval under section 102.
Anglo American Platinum Limited Annual Results Presentation 2016 23

15. IMPAIRMENT OF ASSETS AND INVESTMENTSEquity investments in Atlatsa and Bokoni Holdco and associated loansAmplats has a 22.76% shareholding in Atlatsa as well as a 49% shareholding in Bokoni Holdco (which is equity accounted as an associate). The group, together with Atlatsa, has completed a technical review of the Bokoni Platinum Mine to develop a new optimised mine plan. Following the closure of Vertical and UM2 shafts and reducing headcount by a third, Bokoni is implementing this new optimised mine plan.
In light of the difficult market conditions and negative cash flows incurred by Bokoni Platinum Mine, Amplats impaired its equity interests in Atlatsa and Bokoni Holdco in 2015. A further impairment of R130 million arose in 2016 with respect to the investment in Bokoni owing to the capitalisation of funding. These write-offs are included in basic earnings but excluded from headline earnings, in terms of SAICA circular 2/2015.
Atlatsa’s ability to service its debt obligations in the context of the current market conditions, where Bokoni Platinum Mine is its main source of funding, is doubtful at current PGM price levels. In 2015 Amplats, therefore, for accounting purposes impaired the various loans extended to Atlatsa and Atlatsa Holdings to the value of R1,792 million. A further impairment of R111 million was recognised in this regard during 2016. The impairment losses arising from these loan write-offs are included in basic and headline earnings.
16. SCRAPPING OF ASSETSDuring 2016 one of Amplats’ furnaces suffered a leak of molten furnace matte from the Waterval furnace hearth. A preliminary assessment of the damage to the furnace has shown that a rebuild of the furnace should be brought forward, as the most prudent means of mitigating future potential operational risks.
The capital expenditure for the rebuild will be capitalised. The net book value of the affected assets scrapped was R7 million. The proceeds from the insurance policy (cost incurred by Amplats less deductible) will be recognised as insurance income when received.
A claim for the rebuild has been submitted to the insurers. The insurance policy covers asset and business interruption including machinery breakdown. It insures property against all risks of physical loss, destruction, damage and electrical or machinery breakdown and against losses resulting from interruption with the business because of an insured property damage event and against extra expenses. The claim limit is USD1.5 billion.
17. BROAD BASED ECONOMIC EMPOWERMENT (BEE) TRANSACTIONA group subsidiary, Atomatic, holds a Chrome Processing Plant adjacent to the Amandelbult Mine. As part of Amplats’ commitment to transformation, Atomatic has issued 26% of its own shares to a BEE partner, Baphalane Siyanda Chrome Company Proprietary Limited (BSCC) which was primarily funded by way of cumulative, non-convertible and redeemable preference shares by the Amplats group. For accounting purposes, the shares issued by Atomatic have been treated as an option over its own equity, which resulted in a once-off share-based BEE expense of R156 million on initial recognition of the transaction. The option was effectively granted in 2014 when the transaction was substantively agreed to by all parties as there were no conditions which would have resulted in the deal subsequently being cancelled. The transaction, however vested in 2016 when the plant was commissioned and transferred to Atomatic. The fair value was determined based on a discounted cash flow of the business at grant date using a risk adjustment discount rate.
ANNUAL RESULTS PRESENTATION 2016 SUMMARISED PRELIMINARY AUDITED GROUP FINANCIAL RESULTS
24 Anglo American Platinum Limited Annual Results Presentation 2016
NOTES TO THE SUMMARISED CONSOLIDATED FINANCIAL STATEMENTS continuedfor the year ended 31 December 2016

18. DISPOSAL OF RUSTENBURG MINEOn 9 September 2015, Amplats entered into a sale and purchase agreement (SPA) with Sibanye Rustenburg Platinum Mines Proprietary Limited (a subsidiary of Sibanye Gold Limited) (Sibanye) for the disposal of Rustenburg Mine.
Amplats considers its mining, smelting and refining operations as a single cash-generating unit. Following the announcement of the signing of the SPA with Sibanye in 2015, the assets attributable to Rustenburg Mine were assessed separately within the cash-generating unit for impairment. As such, the recoverable value of Rustenburg Mine was calculated as the fair value of the estimated proceeds less transaction costs, and amounted to R2,798 million. It excluded any economic value generated from the future purchase of concentrate and toll treatment arrangements which will be recognised for accounting purposes at the time when the benefit is received. The recoverable amount comprised a Level 3 fair value in terms of the fair value hierarchy (as defined in note 12). The fair value of the deferred consideration payable by Sibanye, and negative free cash flow funding payable by Amplats were determined based on the projected cash flows for Rustenburg Mine. The relevant amounts were discounted at the cost of borrowing of Sibanye and Amplats respectively.
The net carrying value of Rustenburg Mine at 1 September 2015 was R7,274 million. The excess of the carrying value above the recoverable amount gave rise to an impairment in 2015 of R6,216 million (R4,476 million net of tax). The entire impairment was attributable to property, plant and equipment. A resulting impairment loss was recognised in the statement of comprehensive income and was separately presented. This impairment loss was included in basic earnings but excluded from headline earnings.
Rustenburg Mine was sold as a going concern for an upfront cash consideration of R1,500 million and deferred consideration amounting to 35% of the business’s distributable free cash flow for six to eight years subject to a minimum of R3,000 million. These proceeds will be offset by funding to be provided by Amplats in the event of the business having a negative free cash flow between the closing of the transaction and 31 December 2018. This funding is limited to R267 million per annum and is pro-rated. Taking into account the most recent cash flow estimates for the business, the estimated fair value of the total consideration amounts to R2,033 million. This excludes any economic value generated from the future purchase of concentrate and toll treatment arrangements which will be recognised for accounting purposes at the time when the benefit is received. A conditional section 11 approval was received on 2 August 2016 and Rustenburg Mine was reclassified as held for sale at that stage. The final section 11 was granted during the course of October 2016.
Effective 1 November 2016, Amplats disposed of its Rustenburg Mine.
Anglo American Platinum Limited Annual Results Presentation 2016 25

2016Rm
18. DISPOSAL OF RUSTENBURG MINE continuedConsideration received (including purchase price adjustments)Consideration received in cash 1,551Purchase of concentrate adjustment (2,933)Deferred sales proceeds (discounted)s 676
Total consideration (706)
Analysis of assets and liabilities over which control was lostNon-current assetsProperty, plant and equipment 1,397Capital work in progress 1,011Environmental trust funds 281
Current assetsTrade and other receivables 46Inventories 80Other assets 13Cash and cash equivalents§ –
Non-current liabilitiesProvision for decommissioning and restoration costs (736)Deferred tax –
Current liabilitiesTrade and other payables (677)Provisions (635)
Net assets disposed of 780
Loss on disposal of Rustenburg MineConsideration (706)Net assets disposed of (780)Transaction costs directly attributable to disposal (195)
Loss on disposal before taxation effects (1,681)Effects of taxation on consideration and release of unredeemed capex 762
(919)
The loss on disposal is included in profit for the year.
Net cash inflow on disposal of Rustenburg MineConsideration received in cash 1,551Transaction costs (195)Less: Cash and cash equivalents disposed of§ –
1,356
Purchase of concentrate payments related to concentrate transferred (1,418)
s Deferred consideration consists of the amounts payable to and due from Sibanye as part of the sales consideration. The amounts have been grouped as a single item as they all relate to a single sales agreement and adjustment to the purchase price.§ Less than R500,000.
ANNUAL RESULTS PRESENTATION 2016 SUMMARISED PRELIMINARY AUDITED GROUP FINANCIAL RESULTS
26 Anglo American Platinum Limited Annual Results Presentation 2016
NOTES TO THE SUMMARISED CONSOLIDATED FINANCIAL STATEMENTS continuedfor the year ended 31 December 2016

19. ADJUSTMENTS TO PRIOR PERIODSInventory errorThe following errors were detected in respect of inventory:
• A non-systemic error in the unit cost calculation to determine the value of work-in-process and finished goods metal inventory. This arose mainly in the current year owing to the preparatory work in separating Rustenburg Mine. The balance, which was restated back to 2014, related to the effect of the purchase of concentrate arrangement with Union Mine that has a 15% non-controlling interest.
• An error in the determination of net realisable value. All stock is valued at the lowest of Cost or net realisable value. The net realisable value equates to the market value at month end. When determining the net realisable value for the work in progress stock, the market value should have been reduced with the outstanding down stream cost. I.e. the net realisable value for stock in the Smelter should be reduced with the applicable Rustenburg Base Metals Refinery and Precious Metals Refinery unit costs. This has been corrected going back to 2011.
• Certain consolidation adjustments, which have been corrected going back to 2011.
For the year ended December 2015 the adjustment comprised 2% of the inventory balance and for June 2016 it comprised 6%.
Translation errorDuring the year it was found that Unki Dollar depreciation was being incorrectly translated at the historic exchange rate, rather the average exchange rate. The incorrect depreciation resulted from the SAP accounting system being configured with an incorrect rule during Unki’s system implementation in 2011.
Joint venture elimination errorAmplats is party to a pooling and sharing arrangement (PSA) with Sibanye Platinum (previously Aquarius Platinum) – referred to as the Kroondal PSA. The interest is accounted for as a joint operation and proportionately consolidated. In performing a review of intercompany balances, a receivable balance brought forward from prior years had not completely eliminated.
The above errors were adjusted through a restatement of: opening balances at 1 January 2015, for the cumulative effect of prior periods, and earnings for the year ended 31 December 2015.
Effect on 30 June 2016 interim resultsThe above errors had an impact on the 30 June 2016 published interim results. Accordingly the effect to the impact has been disclosed below.
Anglo American Platinum Limited Annual Results Presentation 2016 27

19. ADJUSTMENTS TO PRIOR PERIODS continuedThe following is the effect of the adjustments on the respective prior periods:
As previously As previously As previously reported Restated* reported Restated reported Restated 30 June 30 June 31 December 31 December 1 January 1 January
2016* Adjustment 2016 2015 Adjustment 2015 2015 Adjustment 2015Full effect of error Rm Rm Rm Rm Rm Rm Rm Rm Rm
IMPACT ON STATEMENT OF COMPREHENSIVE INCOMECost of sales (27,948) 977 (26,971) (54,544) (40) (54,584)Gross profit on metal sales 2,707 977 3,684 5,271 (40) 5,231Other net expenditure (213) (93) (306) (279) (235) (514)Operating profit/(loss) 2,162 884 3,046 (6,050) (275) (6,325)Profit before taxation 1,380 884 2,264 (14,139) (275) (14,414)Taxation (459) (282) (741) 1,934 45 1,979Profit/(loss) for the year 921 602 1,523 (12,205) (230) (12,435)Total comprehensive income for the year 833 710 1,543 (10,615) (89) (10,704)Profit attributable to:Owners of the Company 938 602 1,540 (12,125) (233) (12,358)Non-controlling interests (17) – (17) (80) 3 (77)Total comprehensive income attributable to:Owners of the Company 850 710 1,560 (10,535) (92) (10,627)Non-controlling interests (17) – (17) (80) 3 (77)Headline earnings 1,044 603 1,647 107 (233) (126)Earnings per ordinary share (cents)– Basic 358 231 589 (4,638) (90) (4,728)– Diluted 357 230 587 (4,625) (89) (4,714)
STATEMENT OF FINANCIAL POSITIONCurrent assets 24,576 (99) 24,477 21,755 (1,090) 20,665# 23,313 (940) 22,373 Inventories 16,314 818 17,132 16,571 (266) 16,305 17,451 (351) 17,100 Trade and other receivables 2,235 (917) 1,318 2,585 (824) 1,761 3,220 (589) 2,631Share capital and reserves 40,783 (69) 40,714 40,023 (779) 39,244 50,526 (690) 49,836Foreign currency translation reserve 2,293 408 2,701 2,786 300 3,086 1,345 159 1,504 Retained earnings 15,981 (480) 15,501 15,202 (1,082) 14,120 27,598 (849) 26,749Non-controlling interests (452) 3 (449) (411) 3 (408) (210) – (210)Non-current liabilities 21,694 (200) 21,494 22,776 (212) 22,564 22,093 (246) 21,847Deferred taxation 8,153 (200) 7,953 8,140 (212) 7,928 10,516 (246) 10,270 Current liabilities 14,251 170 14,421 11,161 (99) 11,062 17,380 (4) 17,376 Other liabilities 2,591 (18) 2,573 2,075 (17) 2,058 2,044 (1) 2,043 Taxation 29 188 217 32 (82) (50)# 1,296 (3) 1,293
RATIO ANALYSISGross profit margin % 8.8 3.2 12.0 8.8 (0.1) 8.7 4.8 (0.7) 4.1 Operating profit as a % of average operating assets % 7.3 3.1 10.4 (9.6) (0.6) (10.2) 1.3 (0.7) 0.6 EBITDA R million 4,326 992 5,318 (1,467) (134) (1,601) 5,658 (218) 5,440 Return on average shareholders equity % 9.4 (1.8) 7.6 (27.0) (0.9) (27.9) 0.7 (0.6) 0.1 Return on average capital employed % 8.5 (2.5) 6.0 (11.2) (0.6) (11.8) 1.2 (0.7) 0.5 Return on average attributable capital employed % 8.7 3.6 12.3 (11.5) (0.7) (12.2) 1.3 (0.7) 0.6Current ratio % 1.7:1 – 1.7:1 1.9:1 – 1.9:1 1.3:1 – 1.3:1 Debt:Equity ratio % 1:2.7 – 1:2.7 1:2.8 (0.1) 1:2.7 1:3.2 – 1:3.2 Interest cover – EBITDA times 5.9 1.3 7.2 (1.2) (0.1) (1.3) 5.3 (0.2) 5.1 Debt cover ratio times 0.4 – 0.4 0.8 – 0.8 0.5 – 0.5 Net debt to capital employed % 19.6 – 19.6 24.2 0.3 24.5 22.4 0.3 22.7 Interest-bearing debt to shareholders equity % 37.3 0.1 37.4 36.1 0.7 36.8 31.3 0.4 31.7 Net asset value as a % of market capitalisation % 41.2 (0.1) 41.1 80.1 (1.6) 78.5 54.9 (0.7) 54.2 Effective tax rate % 33.3 0.1 33.4 (13.7) – (13.7) 18.1 (3.8) 14.3
SHARE PERFORMANCEHeadline earnings/(loss) per ordinary share (cents) 399 230 629 41 (89) (48) – – –Net asset value per ordinary share 152 – 152 149 (3) 146 189 (3) 186
* The 30 June 2016 interim results were reviewed but not audited by the external auditors#R50milliontaxbalancereclassifiedtocurrentassets,resultinginarestatedcurrentassetsbalanceofR20,715million.
ANNUAL RESULTS PRESENTATION 2016 SUMMARISED PRELIMINARY AUDITED GROUP FINANCIAL RESULTS
28 Anglo American Platinum Limited Annual Results Presentation 2016
NOTES TO THE SUMMARISED CONSOLIDATED FINANCIAL STATEMENTS continuedfor the year ended 31 December 2016
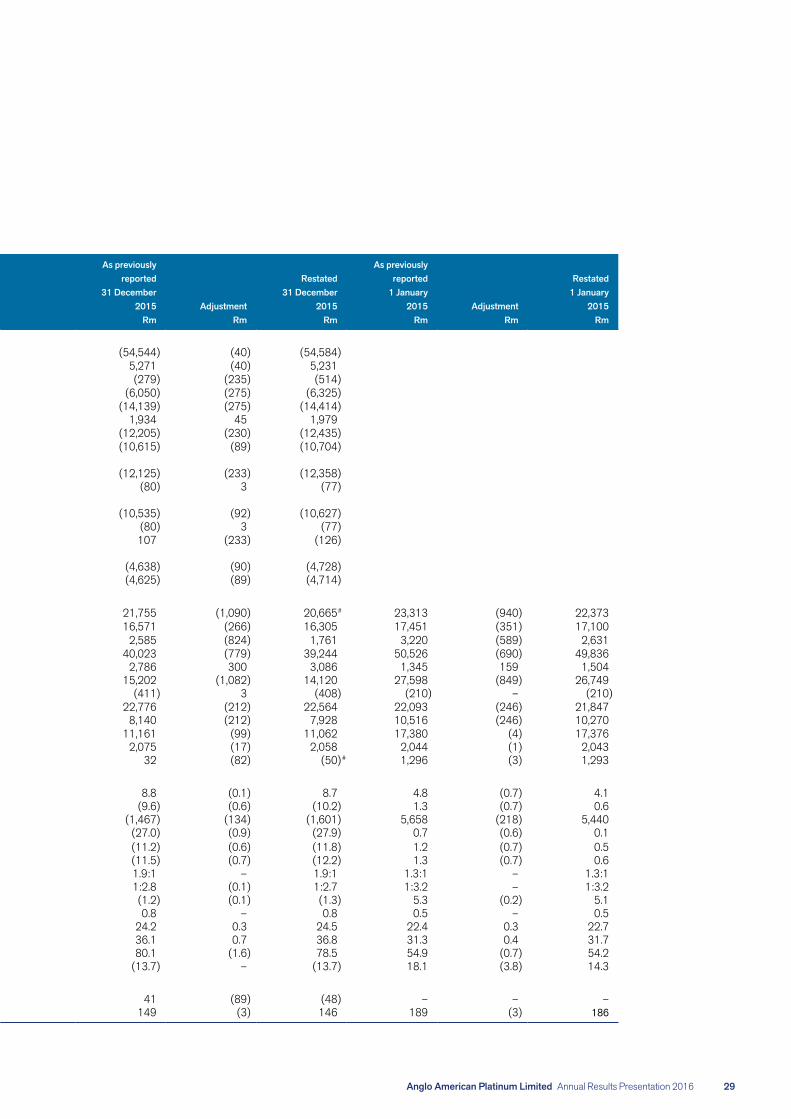
19. ADJUSTMENTS TO PRIOR PERIODS continuedThe following is the effect of the adjustments on the respective prior periods:
As previously As previously As previously reported Restated* reported Restated reported Restated 30 June 30 June 31 December 31 December 1 January 1 January
2016* Adjustment 2016 2015 Adjustment 2015 2015 Adjustment 2015Full effect of error Rm Rm Rm Rm Rm Rm Rm Rm Rm
IMPACT ON STATEMENT OF COMPREHENSIVE INCOMECost of sales (27,948) 977 (26,971) (54,544) (40) (54,584)Gross profit on metal sales 2,707 977 3,684 5,271 (40) 5,231Other net expenditure (213) (93) (306) (279) (235) (514)Operating profit/(loss) 2,162 884 3,046 (6,050) (275) (6,325)Profit before taxation 1,380 884 2,264 (14,139) (275) (14,414)Taxation (459) (282) (741) 1,934 45 1,979Profit/(loss) for the year 921 602 1,523 (12,205) (230) (12,435)Total comprehensive income for the year 833 710 1,543 (10,615) (89) (10,704)Profit attributable to:Owners of the Company 938 602 1,540 (12,125) (233) (12,358)Non-controlling interests (17) – (17) (80) 3 (77)Total comprehensive income attributable to:Owners of the Company 850 710 1,560 (10,535) (92) (10,627)Non-controlling interests (17) – (17) (80) 3 (77)Headline earnings 1,044 603 1,647 107 (233) (126)Earnings per ordinary share (cents)– Basic 358 231 589 (4,638) (90) (4,728)– Diluted 357 230 587 (4,625) (89) (4,714)
STATEMENT OF FINANCIAL POSITIONCurrent assets 24,576 (99) 24,477 21,755 (1,090) 20,665# 23,313 (940) 22,373 Inventories 16,314 818 17,132 16,571 (266) 16,305 17,451 (351) 17,100 Trade and other receivables 2,235 (917) 1,318 2,585 (824) 1,761 3,220 (589) 2,631Share capital and reserves 40,783 (69) 40,714 40,023 (779) 39,244 50,526 (690) 49,836Foreign currency translation reserve 2,293 408 2,701 2,786 300 3,086 1,345 159 1,504 Retained earnings 15,981 (480) 15,501 15,202 (1,082) 14,120 27,598 (849) 26,749Non-controlling interests (452) 3 (449) (411) 3 (408) (210) – (210)Non-current liabilities 21,694 (200) 21,494 22,776 (212) 22,564 22,093 (246) 21,847Deferred taxation 8,153 (200) 7,953 8,140 (212) 7,928 10,516 (246) 10,270 Current liabilities 14,251 170 14,421 11,161 (99) 11,062 17,380 (4) 17,376 Other liabilities 2,591 (18) 2,573 2,075 (17) 2,058 2,044 (1) 2,043 Taxation 29 188 217 32 (82) (50)# 1,296 (3) 1,293
RATIO ANALYSISGross profit margin % 8.8 3.2 12.0 8.8 (0.1) 8.7 4.8 (0.7) 4.1 Operating profit as a % of average operating assets % 7.3 3.1 10.4 (9.6) (0.6) (10.2) 1.3 (0.7) 0.6 EBITDA R million 4,326 992 5,318 (1,467) (134) (1,601) 5,658 (218) 5,440 Return on average shareholders equity % 9.4 (1.8) 7.6 (27.0) (0.9) (27.9) 0.7 (0.6) 0.1 Return on average capital employed % 8.5 (2.5) 6.0 (11.2) (0.6) (11.8) 1.2 (0.7) 0.5 Return on average attributable capital employed % 8.7 3.6 12.3 (11.5) (0.7) (12.2) 1.3 (0.7) 0.6Current ratio % 1.7:1 – 1.7:1 1.9:1 – 1.9:1 1.3:1 – 1.3:1 Debt:Equity ratio % 1:2.7 – 1:2.7 1:2.8 (0.1) 1:2.7 1:3.2 – 1:3.2 Interest cover – EBITDA times 5.9 1.3 7.2 (1.2) (0.1) (1.3) 5.3 (0.2) 5.1 Debt cover ratio times 0.4 – 0.4 0.8 – 0.8 0.5 – 0.5 Net debt to capital employed % 19.6 – 19.6 24.2 0.3 24.5 22.4 0.3 22.7 Interest-bearing debt to shareholders equity % 37.3 0.1 37.4 36.1 0.7 36.8 31.3 0.4 31.7 Net asset value as a % of market capitalisation % 41.2 (0.1) 41.1 80.1 (1.6) 78.5 54.9 (0.7) 54.2 Effective tax rate % 33.3 0.1 33.4 (13.7) – (13.7) 18.1 (3.8) 14.3
SHARE PERFORMANCEHeadline earnings/(loss) per ordinary share (cents) 399 230 629 41 (89) (48) – – –Net asset value per ordinary share 152 – 152 149 (3) 146 189 (3) 186
* The 30 June 2016 interim results were reviewed but not audited by the external auditors#R50milliontaxbalancereclassifiedtocurrentassets,resultinginarestatedcurrentassetsbalanceofR20,715million.
Anglo American Platinum Limited Annual Results Presentation 2016 29

19. ADJUSTMENTS TO PRIOR PERIODS continued
December2014 and
June December prior periodsEffect per error 2016* 2015 effect
Inventory impact on earnings before tax 1,084 85 (351)Royalties 1 16 1Tax effects (308) (21) 84Non-controlling interest – (3) –
Total inventory impact on earnings 777 77 (266)
Total depreciation impact on earnings (108) (141) (159)
Kroondal impact on earnings before tax (93) (235) (589)Tax effects 26 66 165
Total Kroondal impact on earnings (67) (169) (424)
Total impact of errors on retained earnings 602 (233) (849)
Cumulative adjustment to retained earnings (480) (1,082) (849)
20. POST-BALANCE SHEET EVENTSThere are no post balance sheet events other than disclosed below.
Sale of Union MineAs part of the Group’s divesture initiatives, a binding sale and purchase agreement with Siyanda Resources (Siyanda) was signed on 14 February 2017 for the Group’s interest in Union Mine, which sets out the following key commercial terms:
• Initial purchase price of R400 million • Deferred consideration of 35% of net cumulative positive free cash flow for 10 years (with an early settlement option) • Purchase of concentrate agreement for seven years with a toll arrangement from year eight onwards.
As a result of definitive agreements being signed, Union Mine will be considered separate from the Amplats single cash-generating unit as of this date and will accordingly be separately assessed for impairment.
21. AUDIT BY COMPANY’S AUDITORSThe consolidated financial statements from which the summarised consolidated financial statements have been extracted have been audited by the Company’s auditors, Deloitte & Touche and are consistent in all material respects with the consolidated financial statements. The audit of the summarised consolidated financial statements was performed in accordance with ISA 810 (Revised) , ‘Engagement to Report on Summary Financial Statements’. The auditor’s report does not necessarily report on all the information contained in this announcement. Shareholders are therefore advised that, in order to obtain a full understanding of the nature of the auditors’ engagement, they should obtain a copy of the auditor’s report together with the accompanying financial information from the Company’s registered office. The consolidated financial statements, their unmodified report on the consolidated financial statements and the summarised consolidated financial statements are available for inspection at the Company’s registered office, together with the financial statements identified in the respective auditor’s reports. Any reference to future financial performance, included in this announcement, has not been reviewed or reported on by the Company’s auditors.
ANNUAL RESULTS PRESENTATION 2016 SUMMARISED PRELIMINARY AUDITED GROUP FINANCIAL RESULTS
30 Anglo American Platinum Limited Annual Results Presentation 2016
NOTES TO THE SUMMARISED CONSOLIDATED FINANCIAL STATEMENTS continuedfor the year ended 31 December 2016

Anglo American Platinum Limited Annual Results Presentation 2016 31

SALIENT FEATURES
2016 2015 2014 2013 2012
Average market prices achievedPlatinum US$/oz 993 1,051 1,386 1,485 1,532Palladium US$/oz 610 703 803 722 640Rhodium US$/oz 680 958 1,147 1,053 1,264Gold US$/oz 1,244 1,156 1,259 1,384 1,669Nickel US$/lb 4.36 5.32 7.73 6.58 7.76Copper US$/lb 2.16 2.35 3.14 3.22 3.58
US$ basket price – Pt (net sales revenue per Pt oz sold) US$/oz Pt sold 1,753 1,905 2,413 2,326 2,406US$ basket price – PGM (net sales revenue per PGM oz sold) US$/oz PGM sold 856 939 1,164 1,123 1,316
R basket price – Pt (net sales revenue per Pt oz sold) R/oz Pt sold 25,649 24,203 26,219 22,586 19,764R basket price – PGM (net sales revenue per PGM oz sold) R/oz PGM sold 12,527 11,930 12,656 10,906 10,811
Exchange ratesAverage exchange rate achieved on sales ZAR/US$ 14.63 12.71 10.87 9.71 8.22Exchange rate at end of year ZAR/US$ 13.73 15.47 11.57 10.51 8.47
Unit cost performanceCash on-mine cost/tonne milled R/tonne 729 751 770 675 625Cash operating cost per Pt oz M&C1 R/oz 19,545 19,266 22,574 16,797 16,119Cash operating cost per PGM ounce R/oz 9,298 9,202 10,654 8,167 7,876
Productivitym2 per total operating employee per month2 6.85 6.71 6.46 6.57 6.05Refined platinum ounces per employee3 34.7 33.2 23.3 30.0 29.31 Cash operating cost per produced ounce (metal in concentrate) comprises operating mines and excludes projects.2 Square metres mined per operating employee including processing, but excluding projects, opencast and tailings retreatment employees.3 Refinedplatinumouncesperemployee:minedrefinedplatinumouncesdividedbyownandattributableAmplatsjointventureoperationalemployees.
ANNUAL RESULTS PRESENTATION 2016 GROUP PERFORMANCE DATA
32 Anglo American Platinum Limited Annual Results Presentation 2016
GROUP PERFORMANCE DATAFOR THE YEAR ENDED 31 DECEMBER 2016

REFINED PRODUCTION
2016 2015 2014 2013 2012
Total operationsRefined production from mining operationsPlatinum 000 oz 1,688.4 1,836.9 1,323.8 1,772.7 1,773.3Palladium 000 oz 1,090.6 1,238.2 921.1 1,055.9 1,080.5Rhodium 000 oz 227.0 225.8 154.1 217.1 240.3Gold 000 oz 85.8 91.5 74.0 81.1 86.4PGMs 000 oz 3,397.0 3,674.7 2,641.9 3,413.2 3,513.9Nickel 000 tonnes 21.0 21.9 23.9 18.8 14.9Copper 000 tonnes 11.9 14.9 15.6 12.0 9.9Chrome 000 tonnes 685.6 566.5 289.2 399.5 352.4
Refined production from purchases inclusive of returnsPlatinum 000 oz 646.3 621.9 565.7 606.8 605.3Palladium 000 oz 373.6 356.7 304.3 324.9 315.4Rhodium 000 oz 90.4 79.4 75.3 77.6 70.4Gold 000 oz 22.4 21.5 21.6 18.9 18.8PGMs 000 oz 1,282.0 1,193.7 1,092.9 1,151.7 1,126.7Nickel 000 tonnes 4.4 3.9 4.3 3.8 2.8Copper 000 tonnes 2.2 2.2 3.1 2.1 1.5Chrome 000 tonnes - – – – –
Total refined productionPlatinum 000 oz 2,334.7 2,458.8 1,889.5 2,379.5 2,378.6Palladium 000 oz 1,464.2 1,594.9 1,225.4 1,380.8 1,395.9Rhodium 000 oz 317.4 305.2 229.4 294.7 310.7Gold 000 oz 108.2 113.0 95.6 100.0 105.2PGMs 000 oz 4,679.0 4,868.4 3,734.8 4,564.9 4,640.6Nickel – Refined 000 tonnes 25.4 25.4 20.5 16.8 17.7Nickel – Matte 000 tonnes - 0.4 7.7 5.8 –Copper – Refined 000 tonnes 14.1 16.8 12.5 8.3 11.4Copper – Matte 000 tonnes - 0.3 6.2 5.8 –Chrome 000 tonnes 685.6 566.5 289.2 399.5 352.4
Anglo American Platinum Limited Annual Results Presentation 2016 33

PLATINUM PRODUCED (M&C)1
2016 2015 2014 2013 2012
Total operations 000 ozMogalakwena Mine 411.9 392.5 370.0 340.9 304.7Amandelbult Mine 466.5 437.5 218.6 372.6 380.6Unki Platinum Mine 74.5 66.5 62.3 64.1 63.1Twickenham Mine 3.4 13.0 11.6 9.5 –Joint ventures 505.6 482.7 482.4 489.0 485.3Rustenburg Mine 377.5 478.1 280.7 570.3 545.9 Union Mine2 151.2 141.1 88.2 181.1 198.6 Purchases from third parties and associates 391.3 325.9 356.1 328.2 274.7
M&C platinum production 2,381.9 2,337.3 1,869.9 2,355.7 2,252.9Pipeline stock adjustment 59.9 133.3 26.9 50.2 140.0
2,441.8 2,470.6 1,896.8 2,405.9 2,392.9
Refined platinum production (excl. toll refined metal) 2,330.1 2,458.7 1,887.2 2,376.4 2,329.11 Platinum in concentrate produced and purchased.2 Includes slag tailings at Mortimer Smelter (closed Q3 2015).
HEADCOUNTas at 31 December 2016
2016 2015 2014 2013 2012
Total employees1 number 28,250 45 520 49 295 50 800 59 420
Own enrolled 26,062 42 773 46 048 46 319 53 251Contractors 2,188 2 747 3 247 4 481 6 169
1 Amplats total own and contractor employees excluding joint venture and associate employees and contractors.
ANNUAL RESULTS PRESENTATION 2016 GROUP PERFORMANCE DATA
34 Anglo American Platinum Limited Annual Results Presentation 2016
GROUP PERFORMANCE DATAFOR THE YEAR ENDED 31 DECEMBER 2016

GROSS PROFIT ON METAL SALES FROM MINING AND PURCHASING ACTIVITIES
Mined including Purchasedchrome sales metals1 Total
Rm Rm Rm
2016Gross sales revenue 46,769 15,207 61,976Commissions paid (16) – (16)
Net sales revenue 46,753 15,207 61,960
Cost of sales (42,089) (14,007) (56,096)
On-mine (32,812) – (32,812)
Cash operating costs (29,615) – (29,615)Depreciation (3,197) – (3,197)
Purchase of metals and leasing activities1 (838) (12,680) (13,518)
Smelting (2,874) (641) (3,515)
Cash operating costs (2,318) (516) (2,834)Depreciation (556) (125) (681)
Treatment and refining (2,920) (699) (3,619)
Cash operating costs (2,315) (553) (2,868)Depreciation (605) (146) (751)
(Decrease)/increase in metal inventories (24) 211 187Other costs (2,621) (198) (2,819)
Gross profit on metal sales 4,664 1,200 5,864
Gross profit margin (%) 10.0 7.9 9.5Cost of sales per total Pt ounce sold (R) 23,923 21,343 23,222
2015*Gross sales revenue 45,685 14,144 59,829Commissions paid (14) – (14)
Net sales revenue 45,671 14,144 59,815
Cost of sales (41,965) (12,619) (54,584)
On-mine (33,913) – (33,913)
Cash operating costs (29,918) – (29,918)Depreciation (3,995) – (3,995)
Purchase of metals and leasing activities1 – (10,247) (10,247)
Smelting (2,823) (580) (3,403)
Cash operating costs (2,394) (492) (2,886)Depreciation (429) (88) (517)
Treatment and refining (2,783) (598) (3,381)
Cash operating costs (2,203) (475) (2,678)Depreciation (580) (123) (703)
Decrease in metal inventories (12) (1,017) (1,029)Other costs (2,434) (177) (2,611)
Gross profit on metal sales 3,706 1,525 5,231
Gross profit margin (%) 8.1 10.8 8.7Cost of sales per total Pt ounce sold (R) 22,828 19,933 22,086
* 2015 restated.1 Consists of purchased metals in concentrate, secondary metals and other metals.
Anglo American Platinum Limited Annual Results Presentation 2016 35

MINING AND RETREATMENT*
2016 2015 2014 2013 2012
Production performanceTotal development km 97.5 106.4 71.5 121.1 127.5Immediately available ore reserves (managed mines) months 47.1 38.6 20.0 22.2 22.2Square metres 000 3,299 3,613 2,290 3,576 3,497Tonnes mined from opencast mines 000 96,374 92,406 95,594 74,943 66,568Tonnes from surface sources including WLTR 000 7,910 5,774 6,716 6,901 6,707Tonnes – Underground mining 000 21,524 23,311 15,661 22,721 22,537
Tonnes milled 000 40,574 39,849 32,995 39,516 38,677
Opencast mines 000 13,194 11,896 11,731 11,054 10,598Surface sources including WLTR 000 7,191 5,842 6,618 6,905 6,574Underground mines 000 20,189 22,111 14,646 21,557 21,505
UG2 tonnes milled to total Merensky and UG2 % 87.2 84.2 87.8 81.9 81.5
Built-up head grade (gram/tonne milled) 4E 3.16 3.23 3.00 3.26 3.20
Surface sources including WLTR 4E 1.21 1.24 1.31 1.37 1.20Merensky Reef 4E 4.59 4.83 4.72 4.95 4.95UG2 Reef 4E 3.87 3.69 3.71 3.88 3.81Platreef (Mogalakwena Mine) 4E 3.02 3.09 3.03 2.90 2.81MSZ Reef (Unki Platinum Mine) 4E 3.57 3.22 3.10 3.40 3.43
M&C platinum production1 000 oz 2,381.9 2,337.3 1,869.9 2,355.7 2,252.9
Mined 000 oz 1,729.9 1,762.0 1,268.0 1,771.2 1,722.7Purchased 000 oz 652.0 575.3 601.9 584.5 530.2
Refined platinum ounces (excluding toll refined metal) 000 oz 2,330.1 2,458.7 1,887.2 2,376.4 2,329.1
Employees for efficiency and productivity2
Own-enrolled employees (average in service)2 number 42,699 45,241 45,485 50,011 48,235
Own mines number 37,169 39,688 39,906 44,668 44,609Joint ventures number 5,530 5,553 5,579 5,343 3,626
Contractors (average in service)2 number 4,104 4,153 4,109 4,548 6,875
Own mines number 2,308 2,138 2,145 2,980 2,694Joint ventures number 1,796 2,015 1,964 1,568 4,181
m2 per total operating employee – overall average3 per month 6.85 6.71 6.46 6.57 6.05m2 per total operating employee – own mines3 per month 6.12 6.34 6.03 5.88 5.28m2 per total operating employee – JVs3 per month 10.15 9.31 9.76 10.54 9.75
Unit cost performanceCash on-mine cost/tonne milled R/tonne 729 751 770 675 625Cash operating cost per Pt oz M&C4 R/oz 19,545 19,266 22,574 16,797 16,119
* Includes Rustenburg up until 31 October 2016.1 Platinum in concentrate produced and purchased.2 Employee numbers represent 100% of managed operations and Amplats’ attributable employees for all joint-venture operations. Bokoni and BRPM employees are excluded
from all periods. Joint-venture employees are included at Amplats’ attributable share. Excludes overhead and process employees.3 Square metres mined per operating employee including processing but excluding projects, opencast and tailings retreatment employees.4 Cash operating cost per Pt oz M&C excludes Twickenham.
ANNUAL RESULTS PRESENTATION 2016 GROUP PERFORMANCE DATA
36 Anglo American Platinum Limited Annual Results Presentation 2016
GROUP PERFORMANCE DATAFOR THE YEAR ENDED 31 DECEMBER 2016

MOGALAKWENA MINE (100% owned)
2016 2015 2014 2013 2012
Refined productionPlatinum 000 oz 401.1 417.6 357.0 342.8 304.8Palladium 000 oz 425.9 466.9 378.1 347.6 327.3Rhodium 000 oz 28.0 28.1 22.8 21.8 19.9Gold 000 oz 53.0 53.0 47.1 41.9 44.5PGMs 000 oz 886.2 941.3 785.0 734.9 676.0Nickel 000 tonnes 14.8 14.8 15.4 11.4 9.0Copper 000 tonnes 8.2 9.7 10.7 7.2 5.8
Production statisticsTonnes mined 000 tonnes 96,374 92,406 95,594 74,943 64,384Tonnes milled 000 tonnes 12,623 11,725 11,731 11,031 10,480Stripping ratio 4.1 5.0 5.1 3.0 3.4In-pit ore reserves months 29.8 52.1 52.3 87.0 71.0
Built-up head grade (gram/tonne milled) 4E 3.02 3.09 3.03 2.90 2.81
Platinum ounces M&C¹ 000 oz 411.9 392.5 370.0 340.9 304.7
Mine 000 oz 411.9 392.5 375.4 340.9 304.7Sale of concentrate 000 oz - – (5.4) – –
Employees for efficiency and productivityOwn-enrolled employees (average in service) number 1,823 1,760 1,756 1,800 1,783Contractor employees (average in service) number 419 425 426 326 336Tonnes moved per total employee per month 3,983 3,924 4,038 3,258 2,809Refined 4E oz per total operating employee per annum 405.0 441.9 368.9 354.7 328.7
Unit cost performanceCash on-mine cost/tonne milled R/tonne 428 409 437 360 315Cash operating cost per Pt oz M&C2 R/oz 18,477 17,502 18,900 15,906 15,231Cash operating cost per PGM (6E) R/oz 7,766 7,340 8,052 6,770 6,436
Operating income statementNet sales revenue Rm 14,227 13,864 13,779 10,086 7,649Operating cost of sales3 * Rm (9,442) (8,690) (8,704) (6,418) (5,448)EBITDA* Rm 5,781 6,230 5,505 4,397 3,130EBIT* Rm 3,959 4,615 4,050 2,954 1,511EBIT margin* % 27.8 33.3 29.4 29.3 19.8Operating free cash flow4 * Rm 3,158 4,378 3,444 1,952 1,310Net cash flow5 * Rm 3,122 4,325 3,273 1,649 921
* 2015 restated.1 Platinum in concentrate produced and purchased.2 Cash operating cost per produced ounce (metal in concentrate) comprises operating mines and excludes projects.3 Operating costs of sales excludes other costs.4 Operatingfreecashflowiscashaftercashoperatingcosts,overheads,stay-in-businesscapital,wastestrippingcapitalandminorites.Presentedbeforeprojectcapitaland
restructuring costs.5 Netcashflowequalsoperatingfreecashflowlesson-mineprojectcapitalandallocatedoff-mineprojectcapital.
Anglo American Platinum Limited Annual Results Presentation 2016 37

AMANDELBULT MINE (100% owned)
2016 2015 2014 2013 2012
Refined productionPlatinum 000 oz 456.5 440.1 245.2 375.2 383.2Palladium 000 oz 200.6 209.4 124.7 165.9 179.6Rhodium 000 oz 72.0 63.7 33.7 53.3 62.3Gold 000 oz 6.7 7.1 3.7 6.6 7.9PGMs 000 oz 858.8 827.7 453.4 686.9 730.0Nickel 000 tonnes 1.5 1.5 1.7 1.4 1.2Copper 000 tonnes 0.6 0.8 0.5 0.7 0.7
Production statisticsTotal development km 36.1 36.2 18.3 30,9 31.7Immediately available ore reserves months 24.2 24.6 23.5 19.6 22.5Square metres 000 m2 805 845 371 694 750Tonnes – Surface sources to concentrators 000 tonnes 1,510 586 748 60 183Tonnes – Underground mining 000 tonnes 5,641 5,939 2,684 4,676 4,943Tonnes milled 000 tonnes 7,058 6,501 3,471 4,761 5,149
Surface sources 000 tonnes 1,369 584 691 59 174Underground sources 000 tonnes 5,689 5,917 2,780 4,702 4,975
UG2 tonnes milled to total Merensky and UG2 % 84.3 81.9 83.5 82.4 80.0Built-up head grade (gram/tonne milled) 4E 4.07 4.12 3.83 4.68 4.45
Surface sources 4E 2.47 2.01 1.24 0.85 0.83Merensky 4E 4.77 4.63 4.72 5.07 5.20UG2 4E 4.41 4.26 4.43 4.66 4.43
Platinum ounces M&C¹ 000 oz 466.5 437.5 218.6 372.6 380.6Mining 000 oz 458.6 429.5 214.1 360.8 367.8Purchased metal 000 oz 7.9 8.0 4.5 11.8 12.8
Employees for efficiency and productivityOwn-enrolled employees (average in service) number 13,842 14,017 13,595 13,673 13,623Contractor employees (average in service) number 917 582 541 297 393m2 per total operating employee2 per month 4.9 5.2 4.3 4.9 4.8Refined 4E oz per total operating employee per annum 49.0 48.4 28.2 41.5 43.5
Unit cost performanceCash on-mine cost/tonne milled R/tonne 1,092 1,069 1,484 1,175 988Cash operating cost per Pt oz M&C³ R/oz 18,415 17,672 25,870 16,685 15,079Cash operating cost per PGM (6E) R/oz 9,547 9,042 13,312 8,614 7,826Operating income statementNet sales revenue Rm 10,870 9,032 6,429 7,470 6,485
Mining Rm 10,090 8,853 6,264 7,191 6,249Purchased metal Rm 178 179 165 279 236Chrome Rm 602 – – – –
Operating costs of sales4 * Rm (9,503) (8,191) (7,141) (6,212) (5,827)EBITDA* Rm 1,498 1,237 (404) 1,424 898EBIT* Rm 669 472 (1,048) 736 157EBIT margin* % 6.2 5.2 (16.3) 9.9 2.4Operating free cash flow5 * Rm 1,066 620 23 206 (119)Net cash flow6 * Rm 1,026 243 (367) 131 (248)* 2015 restated.1 Platinum in concentrate produced and purchased.2 Calculation based on a standard 23-shift month.3 Cash operating cost per produced ounce (metal in concentrate) comprises operating mines and excludes projects.4 Operating costs of sales excludes other costs.5 Operatingfreecashflowiscashaftercashoperatingcosts,overheads,stay-in-businesscapital,wastestrippingcapitalandminorites.Presentedbeforeprojectcapitaland
restructuring costs.6 Netcashflowequalsoperatingfreecashflowlesson-mineprojectcapitalandallocatedoff-mineprojectcapital.
ANNUAL RESULTS PRESENTATION 2016 GROUP PERFORMANCE DATA
38 Anglo American Platinum Limited Annual Results Presentation 2016
GROUP PERFORMANCE DATAFOR THE YEAR ENDED 31 DECEMBER 2016

UNKI PLATINUM MINE (100% owned) (Zimbabwe)
2016 2015 2014 2013 2012
Refined productionPlatinum 000 oz 71.7 69.4 60.3 67.0 64.6Palladium 000 oz 56.5 56.4 45.9 45.7 44.5Rhodium 000 oz 6.6 6.0 5.6 5.3 5.2Gold 000 oz 8.5 7.8 6.9 7.1 7.3PGMs 000 oz 144.4 139.2 119.3 124.7 121.1Nickel 000 tonnes 1.7 1.7 1.7 1.3 1.0Copper 000 tonnes 1.7 2.1 2.5 1.6 1.3
Production statisticsTotal development km 0.7 0.6 0.6 0.6 1.2Immediately available ore reserves months 163.8 144.4 3.8 11.9 14.2Square metres 000 m2 276 266 231 217 207Tonnes – Surface sources to concentrators 000 tonnes - – – – –Tonnes – Underground mining 000 tonnes 1,719 1,652 1,600 1,572 1,468
Tonnes milled 000 tonnes 1,719 1,656 1,598 1,570 1,535
Surface sources 000 tonnes – – – – –Underground sources 000 tonnes 1,719 1,656 1,598 1,570 1,535
Built-up head grade (gram/tonne milled) 4E 3.46 3.22 3.10 3.40 3.43
Surface sources 4E - – – – –MSZ 4E 3.46 3.22 3.10 3.40 3.43
Platinum ounces M&C¹ 000 oz 74.5 66.5 62.3 64.1 63.1
Employees for efficiency and productivityOwn-enrolled employees (average in service) number 1,050 1,055 1,083 1,061 980Contractor employees (average in service) number 106 187 163 171 170m2 per total operating employee2 per month 17.9 16.1 13.6 13.1 12.6Refined 4E oz per total operating employee per annum 124.0 112.4 95.3 101.5 105.7
Unit cost performanceCash on-mine cost/tonne milled R/tonne 873 835 722 606 622Cash operating cost per Pt oz M&C³ R/oz 24,151 25,078 22,844 18,208 18,536Cash operating cost per PGM (6E) R/oz 11,109 11,778 10,832 8,887 9,200
Operating income statementNet sales revenue Rm 2,227 2,024 2,107 1,639 1,345Operating cost of sales4 * Rm (2,205) (2,086) (1,739) (1,324) (1,169)EBITDA* Rm 264 328 486 108 313EBIT* Rm (162) (129) 192 (148) 71EBIT margin* % (7.3) (6.4) 9.1 (9.0) 5.3Operating free cash flow5 * Rm 61 158 301 (211) (140)Net cash flow6 * Rm (20) 20 55 (517) (438)
* 2015 restated.1 Platinum in concentrate produced and purchased.2 Calculation based on a standard 23-shift month.3 Cash operating cost per produced ounce (metal in concentrate) comprises operating mines and excludes projects.4 Operating cost of sales excludes other costs.5 Operatingfreecashflowiscashaftercashoperatingcosts,overheads,stay-in-businesscapital,wastestrippingcapitalandminorites.Presentedbeforeprojectcapitaland
restructuring costs.6 Netcashflowequalsoperatingfreecashflowlesson-mineprojectcapitalandallocatedoff-mineprojectcapital.
Anglo American Platinum Limited Annual Results Presentation 2016 39

TWICKENHAM PLATINUM MINE excluding New Mining Technology (100% owned) (Project)
2016 2015 2014 2013 2012
Refined productionPlatinum 000 oz 3.0 12.6 10.9 10.0 –Palladium 000 oz 3.2 13.3 10.5 9.7 –Rhodium 000 oz 0.7 2.3 2.4 0.8 –Gold 000 oz 0.0 0.3 0.4 0.3 –PGMs 000 oz 7.4 32.4 27.3 20.9 –Nickel 000 tonnes 0.0 0.0 0.1 – –Copper 000 tonnes 0.0 0.0 – – –
Production statisticsTotal development km 0.1 3.8 7.5 6.3 –Immediately available ore reserves months 18.5 23.4 – – –Square metres 000 m2 10 49 36 35 –Tonnes – Surface sources to concentrators 000 tonnes - – 28 11 –Tonnes – Underground mining 000 tonnes 67 306 202 190 –
Tonnes milled 000 tonnes 54 279 240 198 –
Surface sources 000 tonnes - – 43 35 –Underground sources 000 tonnes 54 279 197 163 –
UG2 tonnes milled to total Merensky and UG2 % 100.0 100.0 100.0 100.0 –
Built-up head grade (gram/tonne milled) 4E 3.82 3.87 4.01 4.02 –
Surface sources 4E - – – – –UG2 4E 3.82 3.87 4.01 4.02 –
Platinum ounces M&C¹ 000 oz 1.7 13.0 11.6 9.5 –
Employees for efficiency and productivityOwn-enrolled employees (average in service) number 587 1,271 1,157 797 –Contractor employees (average in service) number 2 12 86 499 –m2 per total operating employee2 per month 1.7 3.2 2.5 2.4 –Refined 4E oz per total operating employee per annum 11.8 22.3 19.4 16.0 –
Unit cost performanceCash on-mine cost/tonne milled R/tonne 5,411 2,841 3,112 3,008 –Cash operating cost per Pt oz M&C³ R/oz 148,035 63,586 66,760 64,035 –Cash operating cost per PGM (6E) R/oz 68,340 23,798 25,518 25,014 –
Operating income statementNet sales revenue Rm 104 329 367 148 1Operating costs of sales4 * Rm (366) (1,071) (889) (551) –EBITDA* Rm (291) (487) (457) (339) 1EBIT* Rm (307) (755) (544) (415) 1EBIT margin* % (295.4) (229.1) (148.2) (279.4) 89.2Operating free cash Flow5 * Rm (240) (528) (439) (491) 0Net cash flow6 * Rm (253) (810) (981) (849) (981)s Figures are shown excluding New Mining Technology (NMT).* 2015 restated.1 Platinum in concentrate produced and purchased.2 Calculation based on a standard 23-shift month.3 Cash operating cost per produced ounce (metal in concentrate) comprises operating mines and excludes projects.4 Operating cost of sales excludes other costs.5 Operatingfreecashflowiscashaftercashoperatingcosts,overheads,stay-in-businesscapital,wastestrippingcapitalandminorites.Presentedbeforeprojectcapitaland
restructuring costs.6 Netcashflowequalsoperatingfreecashflowlesson-mineprojectcapitalandallocatedoff-mineprojectcapital.
ANNUAL RESULTS PRESENTATION 2016 GROUP PERFORMANCE DATA
40 Anglo American Platinum Limited Annual Results Presentation 2016
GROUP PERFORMANCE DATAFOR THE YEAR ENDED 31 DECEMBER 2016

TWICKENHAM PLATINUM MINE New Mining Technology (100% owned) (Project)
2016
Refined productionPlatinum 000 oz 3.2 Palladium 000 oz 3.4 Rhodium 000 oz 0.8 Gold 000 oz –PGMs 000 oz 8.0 Nickel 000 tonnes –Copper 000 tonnes –
Production statisticsTotal development km 2.4 Immediately available ore reserves months 18.5 Square metres 000 m2 –Tonnes – Surface sources to concentrators 000 tonnes –Tonnes – Underground mining 000 tonnes 48
Tonnes milled 000 tonnes 40
Built-up head grade (gram/tonne milled) 4E 3.12
Platinum ounces M&C¹ 000 oz 1.8
Employees for efficiency and productivityContractor employees (average in service) number 352 Refined 4E oz per total operating employee per annum 21.3
Unit cost performanceCash on-mine cost/tonne milled R/tonne 5,062 Cash operating cost per Pt oz M&C2 R/oz 117,671 Cash operating cost per PGM (6E) R/oz 44,519
Operating income statementNet sales revenue Rm 111 Operating costs of sales3 Rm (297)EBITDA Rm (198)EBIT Rm (230)EBIT margin % (207.1)Operating free cash flow4 Rm (162)Net cash flow5 Rm (168)s Figures are shown excluding New Mining Technology (NMT).1 Platinum in concentrate produced and purchased.2 Cash operating cost per produced ounce (metal in concentrate) comprises operating mines and excludes projects.3 Operating cost of sales excludes other costs.4 Operatingfreecashflowiscashaftercashoperatingcosts,overheads,stay-in-businesscapital,wastestrippingcapitalandminorites.Presentedbeforeprojectcapitaland
restructuring costs.5 Netcashflowequalsoperatingfreecashflowlesson-mineprojectcapitalandallocatedoff-mineprojectcapital.
Anglo American Platinum Limited Annual Results Presentation 2016 41

MODIKWA PLATINUM MINE (50:50 joint venture with ARM Mining Consortium Limited)
2016 2015 2014 2013 2012
Refined production (mined and purchased)Platinum 000 oz 113.3 108.4 97.3 127.8 130.1Palladium 000 oz 107.3 109.8 90.0 118.2 120.3Rhodium 000 oz 22.7 20.4 19.1 25.1 20.8Gold 000 oz 2.9 3.0 3.0 3.3 3.6PGMs 000 oz 281.8 270.8 237.8 312.0 306.7Nickel 000 tonnes 0.5 0.5 0.6 0.6 0.4Copper 000 tonnes 0.3 0.3 0.5 0.3 0.3
Production statisticsTotal development km 6.2 8.1 8.4 10.3 9.4Immediately available ore reserves months 27.6 20.6 25.0 25.3 23.6Square metres 000 m2 206 181 172 216 205Tonnes – surface sources to concentrators 000 tonnes - – – 23 118Tonnes – Underground mining 000 tonnes 1,033 966 983 1,066 995
Tonnes milled 000 tonnes 1,019 956 986 1,083 1,112
Surface sources including opencast 000 tonnes - – – 23 118Underground sources 000 tonnes 1,019 956 986 1,060 994
UG2 tonnes milled to total Merensky and UG2 % 100.0 100.0 93.1 100.0 98.1
Built-up head grade (gram/tonne milled) 4E 4.53 4.42 4.28 4.48 4.51
Surface sources excluding opencast 4E - – – – –Merensky 4E - – 2.46 – 2.15UG2 4E 4.53 4.42 4.42 4.48 4.56
Platinum ounces M&C¹ 000 oz 114.8 104.8 104.6 118.2 121.3
Mined 000 oz 57.4 52.4 52.3 59.1 60.7Purchased metal 000 oz 57.4 52.4 52.3 59.1 60.7
Employees for efficiency and productivityOwn-enrolled employees (average in service) number 1,839 1,932 1,972 1,878 1,896Contractor employees (average in service) number 473 523 567 536 684m2 per total operating employee2 per month 7.6 6.4 6.3 7.5 7.2Refined 4E oz per total operating employee per annum 89.3 90.2 84.3 93.3 84.8
Unit cost performanceCash on-mine cost/tonne milled R/tonne 1,238 1,189 1,121 938 878Cash operating cost per Pt oz M&C3 R/oz 23,778 23,762 23,286 19,095 17,868Cash operating cost per PGM (6E) R/oz 9,222 8,913 9,533 8,023 7,434
Operating income statementNet sales revenue Rm 1,608 1,469 1,517 1,620 1,185Operating cost of sales4 * Rm (1,590) (1,393) (1,347) (1,354) (1,044)EBITDA* Rm 158 233 277 381 206EBIT* Rm (18) 59 134 215 48EBIT margin* % (1.1) 4.0 8.8 13.3 4.1Operating free cash flow5 * Rm 147 158 163 380 (105)Net cash flow6 * Rm 71 (12) (87) 200 (203)* 2015 restated.1 Platinum in concentrate produced and purchased.2 Calculation based on a standard 23-shift month.3 Cash operating cost per produced ounce (metal in concentrate) comprises operating mines and excludes projects.4 Operating costs of sales excludes other costs.5 Operatingfreecashflowiscashaftercashoperatingcosts,overheads,stay-in-businesscapital,wastestrippingcapitalandminorites.Presentedbeforeprojectcapitaland
restructuring costs.6 Netcashflowequalsoperatingfreecashflowlesson-mineprojectcapitalandallocatedoff-mineprojectcapital.
ANNUAL RESULTS PRESENTATION 2016 GROUP PERFORMANCE DATA
42 Anglo American Platinum Limited Annual Results Presentation 2016
GROUP PERFORMANCE DATAFOR THE YEAR ENDED 31 DECEMBER 2016

MOTOTOLO PLATINUM MINE (50:50 joint venture with XK Platinum Partnership)
2016 2015 2014 2013 2012
Refined production (mined and purchased)Platinum 000 oz 116.2 122.6 119.6 128.5 123.8Palladium 000 oz 68.8 77.3 72.4 73.9 74.5Rhodium 000 oz 19.5 19.3 19.7 20.8 18.3Gold 000 oz 2.0 2.1 2.2 2.1 2.1PGMs 000 oz 244.0 254.6 250.4 262.3 252.6Nickel 000 tonnes 0.4 0.4 0.5 0.4 0.3Copper 000 tonnes 0.1 0.2 0.2 0.2 0.1
Production statisticsTotal development km 0.9 0.3 0.9 1.1 0.7Immediately available ore reserves months 35.7 31.2 29.7 37.2 36.2Square metres 000 m2 168 148 171 157 151Tonnes – surface sources to concentrators 000 tonnes - – – – –Tonnes – Underground mining 000 tonnes 1,337 1,279 1,337 1,290 1,236
Tonnes milled 000 tonnes 1,284 1,286 1,316 1,284 1,233
Surface sources including opencast 000 tonnes - – – – –Underground sources 000 tonnes 1,284 1,286 1,316 1,284 1,233
UG2 tonnes milled to total Merensky and UG2 % 100.0 100.0 100.0 100.0 100.0
Built-up head grade (gram/tonne milled) 4E 3.02 3.07 3.17 3.30 3.33
Surface sources excluding opencast 4E - – – – –Merensky 4E - – – – –UG2 4E 3.02 3.07 3.17 3.30 3.33
Platinum ounces M&C¹ 000 oz 116.8 114.8 121.8 124.8 120.7
Mined 000 oz 58.4 57.4 60.9 62.4 60.3Purchased metal 000 oz 58.4 57.4 60.9 62.4 60.3
Employees for efficiency and productivityOwn-enrolled employees (average in service) number 765 764 753 739 722Contractor employees (average in service) number 238 253 178 149 151m2 per total operating employee2 per month 15.5 13.7 17.1 16.3 16.3Refined 4E oz per total operating employee per annum 205.9 217.7 229.9 253.6 250.6
Unit cost performanceCash on-mine cost/tonne milled R/tonne 678 625 612 556 533Cash operating cost per Pt oz M&C³ R/oz 16,899 16,060 15,227 12,952 12,530Cash operating cost per PGM (6E) R/oz 8,745 8,190 8,612 7,474 6,918
Operating income statementNet sales revenue Rm 1,418 1,411 1,570 1,362 1,006Operating costs of sales4 * Rm (1,128) (1,040) (1,060) (867) (732)EBITDA* Rm 377 449 580 555 311EBIT* Rm 257 342 472 451 195EBIT margin* % 18.1 24.2 30.1 33.1 19.4Operating free cash Flow5 * Rm 286 354 473 423 83Net cash flow6 * Rm 286 351 470 417 76
* 2015 restated.1 Platinum in concentrate produced and purchased.2 Calculation based on a standard 23-shift month.3 Cash operating cost per produced ounce (metal in concentrate) comprises operating mines and excludes projects.4 Operating costs of sales excludes other costs.5 Operatingfreecashflowiscashaftercashoperatingcosts,overheads,stay-in-businesscapital,wastestrippingcapitalandminorites.Presentedbeforeprojectcapitaland
restructuring costs.6 Netcashflowequalsoperatingfreecashflowlesson-mineprojectcapitalandallocatedoff-mineprojectcapital.
Anglo American Platinum Limited Annual Results Presentation 2016 43

KROONDAL PLATINUM MINE (50:50 pooling-and-sharing agreement with Aquarius Platinum (South Africa))
2016 2015 2014 2013 2012
Refined production (mined and purchased)Platinum 000 oz 267.3 277.6 237.4 260.2 223.4Palladium 000 oz 136.9 149.7 120.6 128.3 113.8Rhodium 000 oz 48.8 47.1 43.1 43.2 34.8Gold 000 oz 2.2 2.4 2.3 2.2 1.9PGMs 000 oz 549.0 556.7 485.8 510.7 436.6Nickel 000 tonnes 0.4 0.4 0.5 0.4 0.3Copper 000 tonnes 0.2 0.2 0.3 0.2 0.1
Production statisticsTotal development km 12.6 12.4 13.3 12.1 10.8Immediately available ore reserves months - – – – 14.3Square metres 000 m2 471 467 475 488 388Tonnes – Surface sources to concentrators 000 tonnes - – – – –Tonnes – Underground mining 000 tonnes 3,596 3,569 3,646 3,534 2,943
Tonnes milled 000 tonnes 2,391 2,344 2,415 2,312 1,872
Surface sources including opencast 000 tonnes - – – – –Underground sources 000 tonnes 2,391 2,344 2,415 2,312 1,872
UG2 tonnes milled to total Merensky and UG2 % 100.0 100.0 100.0 100.0 100.0
Built-up head grade (gram/tonne milled) 4E 3.70 3.69 3.53 3.55 3.63
Surface sources excluding opencast 4E - – – – –Merensky 4E - – – – –UG2 4E 3.70 3.69 3.53 3.55 3.63
Platinum ounces M&C¹ 000 oz 274.0 263.1 256.0 246.0 216.4
Mined 000 oz 137.0 131.5 128.0 123.0 108.2Purchased metal 000 oz 137.0 131.5 128.0 123.0 108.2
Employees for efficiency and productivityOwn-enrolled employees (average in service) number 2,926 2,857 2,854 2,726 1,005Contractor employees (average in service) number 1,085 1,239 1,219 884 2,331m2 per total operating employee2 per month 10.3 10.0 10.0 10.9 10.0Refined 4E oz per total operating employee per annum 113.5 116.4 99.0 120.2 112.1
Unit cost performanceCash on-mine cost/tonne milled R/tonne 928 883 836 788 877Cash operating cost per Pt oz M&C³ R/oz 17,286 16,882 16,981 15,758 16,233Cash operating cost per PGM (6E) R/oz 8,784 8,338 8,977 8,215 7,924
Operating income statementNet sales revenue Rm 3,101 3,010 2,990 2,608 1,717Operating cost of sales4 * Rm (2,783) (2,534) (2,407) (2,063) (1,496)EBITDA* Rm 654 705 765 657 154EBIT* Rm 246 395 512 460 86EBIT margin* % 7.9 13.1 17.1 17.6 5.0Operating free cash flow5 * Rm 412 475 470 401 (383)Net cash flow6 * Rm 412 474 439 329 (482)
* 2015 restated.1 Platinum in concentrate produced and purchased.2 Calculation based on a standard 23-shift month.3 Cash operating cost per produced ounce (metal in concentrate) comprises operating mines and excludes projects.4 Operating costs of sales excludes other costs.5 Operatingfreecashflowiscashaftercashoperatingcosts,overheads,stay-in-businesscapital,wastestrippingcapitalandminorites.Presentedbeforeprojectcapitaland
restructuring costs.6 Netcashflowequalsoperatingfreecashflowlesson-mineprojectcapitalandallocatedoff-mineprojectcapital.
ANNUAL RESULTS PRESENTATION 2016 GROUP PERFORMANCE DATA
44 Anglo American Platinum Limited Annual Results Presentation 2016
GROUP PERFORMANCE DATAFOR THE YEAR ENDED 31 DECEMBER 2016

RUSTENBURG MINE (Incorporating Western Limb Tailings) § (100% owned)
2016 2015 2014 2013 2012
Refined productionPlatinum 000 oz 364.3 499.2 321.5 560.6 568.0Palladium 000 oz 182.7 257.5 170.3 259.9 281.0Rhodium 000 oz 48.9 59.4 33.8 64.1 76.2Gold 000 oz 12.8 18.4 11.2 20.5 21.5PGMs 000 oz 686.7 924.6 583.6 1,004.7 1,067.9Nickel 000 tonnes 2.1 2.9 3.9 3.8 3.0Copper 000 tonnes 1.1 1.8 1.3 2.1 1.8
Production statisticsTotal development km 27.6 32.1 14.2 41.4 45.5Immediately available ore reserves months 36.3 38.5 21.0 24.1 23.8Square metres 000 m2 1,069 1,370 666 1,450 1,405Tonnes – Surface sources to concentrators 000 tonnes 5,921 5,041 5,286 5,746 5,450Tonnes – Underground mining 000 tonnes 5,954 7,494 3,953 7,736 7,682Tonnes milled 000 tonnes 11,789 12,545 9,231 13,491 13,114
Surface sources 000 tonnes 5,921 5,041 5,286 5,750 5,441Underground sources 000 tonnes 5,867 7,504 3,945 7,741 7,673
UG2 tonnes milled to total Merensky and UG2 % 75.9 72.4 74.3 64.9 66.0Built-up head grade (gram/tonne milled) 4E 2.36 2.63 2.29 2.86 2.76
Surface sources 4E 1.20 1.24 1.33 1.49 1.30Merensky 4E 4.46 4.85 4.81 4.92 4.84UG2 4E 3.23 3.07 3.14 3.32 3.27
Platinum ounces M&C¹ 000 oz 377.5 478.1 280.7 570.3 545.9Mining 000 oz 333.0 433.3 230.2 510.6 497.6Tailings 000 oz 44.5 44.8 50.4 59.7 48.3
Employees for efficiency and productivityOwn-enrolled employees (average in service) number 14,473 15,318 15,093 20,033 20,828Contractor employees (average in service) number 685 640 694 1,447 1,510m2 per total operating employee2 per month 7.1 7.4 6.8 6.4 5.3Refined 4E oz per total operating employee per annum 40.2 52.3 34.0 44.0 42.4
Unit cost performanceCash on-mine cost/tonne milled R/tonne 637 693 709 651 632Cash operating cost per Pt oz M&C³ R/oz 21,888 20,717 25,768 16,901 16,826Cash operating cost per PGM (6E) R/oz 11,135 10,210 12,408 9,313 8,342
Operating income statementNet sales revenue Rm 9,307 10,957 8,861 11,402 10,116
Mining Rm 8,039 9,784 7,323 10,159 9,288Tailings Rm 998 1,043 1,487 1,163 768Chrome Rm 270 130 51 80 60
Operating costs of sales4 * Rm (8,897) (10,945) (9,639) (10,047) (10,655)EBITDA * Rm 177 563 (155) 1,845 19EBIT * Rm (129) (547) (1,425) 545 (1,351)EBIT margin * % (1.4) (5.0) (16.1) 4.8 (13.4)Operating free cash flow5 * Rm 72 192 630 257 (585)Net cash flow6 * Rm (278) 28 422 (48) (1,478)§ Financials are shown post allocated costs and prior to cost reduction initiatives planned for a stand-alone entity.
2015 - 2012 Restated to exclude Platinum Mile Tailings Retreatment which was not part of the Rustenburg sale.* 2015 restated.1 Platinum in concentrate produced and purchased.2 Calculation based on a standard 23-shift month.3 Cash operating cost per produced ounce (metal in concentrate) comprises operating mines and excludes projects.4 Operating costs of sales excludes other costs.5 Operatingfreecashflowiscashaftercashoperatingcosts,overheads,stay-in-businesscapital,wastestrippingcapitalandminorites.Presentedbeforeprojectcapitaland
restructuring costs.6 Netcashflowequalsoperatingfreecashflowlesson-mineprojectcapitalandallocatedoff-mineprojectcapital.
Anglo American Platinum Limited Annual Results Presentation 2016 45

UNION MINE (Incorporating Ivan Plant Tailings Treatment)§ (85% owned)s
2016 2015 2014 2013 2012
Refined productionPlatinum 000 oz 147.5 151.6 107.1 170.8 213.1Palladium 000 oz 65.2 70.6 53.2 73.4 94.7Rhodium 000 oz 25.8 24.3 15.8 29.4 39.1Gold 000 oz 1.4 1.4 1.0 1.3 1.8PGMs 000 oz 284.3 285.9 197.3 323.8 417.2Nickel 000 tonnes 0.3 0.3 0.4 0.3 0.3Copper 000 tonnes 0.1 0.1 0.1 0.1 0.1
Production statisticsTotal development km 10.8 12.9 8.2 18.4 22.1Immediately available ore reserves months 17.5 11.0 14.6 24.4 18.6Square metres 000 m2 293 287 168 320 333Tonnes – Surface sources to concentrators 000 tonnes 479 147 654 1,061 956Tonnes – Underground mining 000 tonnes 2,129 2,106 1,256 2,657 2,866Tonnes milled 000 tonnes 2,597 2,557 2,007 3,786 3,919
Surface sources 000 tonnes 472 394 654 1,062 959Underground sources 000 tonnes 2,125 2,164 1,353 2,724 2,960
UG2 tonnes milled to total Merensky and UG2 % 98.3 96.1 96.9 98.1 97.7Built-up head grade (gram/tonne milled) 4E 3.81 3.93 3.13 3.34 3.37
Surface sources 4E 1.64 1.55 1.23 1.30 1.21Merensky 4E 5.18 6.95 6.15 5.09 6.55UG2 4E 4.27 3.98 3.98 4.12 4.01
Platinum ounces M&C¹ 000 oz 151.2 141.1 88.2 181.1 198.6Mining 000 oz 151.2 137.8 88.2 181.1 198.6Tailings 000 oz - 3.3 – – –
Employees for efficiency and productivityOwn-enrolled employees (average in service) number 5,394 6,266 7,222 7,304 7,392Contractor employees (average in service) number 179 292 235 239 285m2 per total operating employee2 per month 4.4 3.4 4.0 4.0 3.7Refined 4E oz per total operating employee per annum 43.0 37.8 23.7 36.4 45.4
Unit cost performanceCash on-mine cost/tonne milled R/tonne 1,015 1,138 1,379 846 770Cash operating cost per Pt oz M&C³ R/oz 20,020 23,152 33,521 19,139 16,945Cash operating cost per PGM (6E) R/oz 10,147 10,952 14,860 10,630 7,967
Operating income statementNet sales revenue Rm 3,958 3,756 3,159 3,865 3,978
Mining Rm 3,327 3,153 2,774 3,442 3,575Tailings Rm - 61 – – –Chrome Rm 631 542 385 423 403
Operating cost of sales4 * Rm (3,362) (3,685) (3,893) (3,405) (3,810)EBITDA * Rm 476 72 (600) 485 204EBIT * Rm 221 (179) (984) 84 (236)EBIT margin * % 5.6 (4.8) (31.2) 2.2 (5.9)Operating free cash flow5 * Rm 302 34 (292) (275) (110)Net cash flow6 * Rm 302 29 (296) (309) (301)§ Financials are shown post allocated costs and prior to cost reduction initiatives planned for a stand-alone entity.s The Bakgatla-Ba-Kgafela traditional community acquired 15% minority interest in Union Mine from 1 December 2006. The chrome resource is shared with Siyanda
Chrome Resources who holds 49.9% in MASA Chrome. The above statistics represents 100% of Union Mine and MASA chrome.* 2015 restated.1 Platinum in concentrate produced and purchased.2 Calculation based on a standard 23-shift month.3 Cash operating cost per produced ounce (metal in concentrate) comprises operating mines and excludes projects.4 Operating costs of sales excludes other costs.5 Operatingfreecashflowiscashaftercashoperatingcosts,overheads,stay-in-businesscapital,wastestrippingcapitalandminorites.Presentedbeforeprojectcapitaland
restructuring costs.6 Netcashflowequalsoperatingfreecashflowlesson-mineprojectcapitalandallocatedoff-mineprojectcapital.
ANNUAL RESULTS PRESENTATION 2016 GROUP PERFORMANCE DATA
46 Anglo American Platinum Limited Annual Results Presentation 2016
GROUP PERFORMANCE DATAFOR THE YEAR ENDED 31 DECEMBER 2016

ANALYSIS OF GROUP CAPITAL EXPENDITURE2016 2015
Stay-in- Waste Stay-in- WasteR millions business stripping Projects Total business stripping Projects Total
Mogalakwena Mine 972 1,297 35 2,304 893 999 47 1,939Amandebult Mine 324 – 40 364 308 – 375 683Unki Platinum Mine 136 – 81 217 109 – 137 246Twickenham Mine 23 – 16 39 15 – 289 304Modikwa Mine 43 – 76 119 41 – 170 211Mototolo Mine 94 – (3) 91 98 – 2 100Kroondal Mine 226 – – 226 225 – – 225Rustenburg Mine 315 – 347 662 239 – 161 400Union Mine 40 – – 40 79 – 6 85
Mining and retreatment 2,173 1,297 592 4,062 2,007 999 1,187 4,193Polokwane Smelter 47 – – 47 20 – – 20Waterval Smelter 196 – (1) 195 150 – 15 165Mortimer Smelter 40 – – 40 48 – – 48Unki Smelter – – 54 54 – – – –
Rustenburg Base Metal Refiners 149 – – 149 141 – – 141Precious Metals Refiners 56 – – 56 32 – – 32
Total smelting and refining 488 – 53 541 391 – 15 406Other 89 – 3 92 138 – 9 147
Total capital expenditure 2,750 1,297 648 4,695 2,536 999 1,211 4,746Capitalised interest – – – 323 – – – 406
Total capitalised costs 2,750 1,297 648 5,018 2,536 999 1,211 5,152
Anglo American Platinum Limited Annual Results Presentation 2016 47

ANGLO AMERICAN PLATINUM 2016 ANNUAL RESULTS PRESENTATION 15 FEBRUARY 2017
PGI – Platinum wedding bands
ANNUAL RESULTS PRESENTATION 2016 ANNUAL REVIEW
48 Anglo American Platinum Limited Annual Results Presentation 2016
2016 ANNUAL RESULTS PRESENTATIONFOR THE YEAR ENDED 31 DECEMBER 2016

2
CAUTIONARY STATEMENT
Disclaimer: This presentation has been prepared for Anglo American Platinum Limited and the entities in the Anglo American Platinum group (“Anglo American Platinum”) and comprises the written materials/slides for a presentation concerning Anglo American Platinum. By attending this presentation and/or reviewing the slides you agree to the following conditions, and accept that all statements attributable to Anglo American Platinum or persons acting on their behalf are qualified in their entirety by the cautionary statements set out below: This presentation is for information purposes only. It does not constitute an offer to sell or the solicitation of an offer to buy shares in Anglo American Platinum. Further, it does not constitute a
recommendation by Anglo American Platinum or any other party to sell or buy shares in Anglo American Platinum (or any other securities). Nothing in this presentation should be interpreted to mean that future earnings per share of Anglo American Platinum will necessarily match or exceed its historical published earnings per share. Certain statistical and other information about Anglo American Platinum included in this presentation is sourced from publicly available third party sources. As such it presents the views of those
third parties, which does not necessarily correspond to the views held by Anglo American Platinum. Forward-looking statements This presentation includes forward-looking statements. All statements other than statements of historical facts in this presentation are forward-looking statements, including those regarding Anglo
American Platinum’s financial position, business and acquisition strategy, plans and objectives of management for future operations (including development plans and objectives relating to Anglo American Platinum’s products, production forecasts and reserve and resource positions). Known and unknown risks, uncertainties and other factors may cause the actual results, performance or achievements of Anglo American Platinum, or industry results, to be materially different from those expressed in or implied by such forward-looking statements. Such forward-looking statements are based on assumptions, including in relation to Anglo American Platinum’s present and future business strategies and the environment in which Anglo American Platinum will operate in the future.
Factors that could cause Anglo American Platinum’s actual results, performance or achievements to differ materially from those in the forward-looking statements include, among others, levels of actual production during any period, levels of global demand and commodity market prices, mineral resource exploration and development capabilities, recovery rates and other operational capabilities, the availability of mining and processing equipment, the ability to produce and transport products profitably, the impact of foreign currency exchange rates on market prices and operating costs, the availability of sufficient credit, the effects of inflation, political uncertainty and operating conditions in relevant areas of the world, the actions of competitors, activities by governmental authorities such as changes in taxation or safety, health, environmental or other types of regulation in the countries where Anglo American Platinum operates, conflicts over land and resource ownership rights and such other risk factors identified in Anglo American Platinum’s most recent Integrated Report. Forward-looking statements should, therefore, be construed in light of such risk factors and undue reliance should not be placed on forward-looking statements.
These forward-looking statements speak only as of the date of this presentation. Anglo American Platinum disclaims any obligation (except as required by applicable law, the Listings Requirements of the securities exchange of the JSE Limited in South Africa and other applicable regulations) to release publicly any updates or revisions to any forward-looking statement contained herein, notwithstanding any change in any of Anglo American Platinum’s expectations or in anything on which any such statement is based.
No investment advice This presentation has been prepared without reference to your particular investment objectives, financial situation, taxation position and particular needs. You should consult your stockbroker, bank
manager, solicitor, accountant, taxation adviser or other independent financial adviser (where applicable, as authorised under the Financial Advisory and Intermediary Services Act 37 of 2002 in South Africa) for financial or investment advice.
Anglo American Platinum Limited Annual Results Presentation 2016 49

AGENDA Overview of 2016
Operations
Financials
Markets
Strategy
Outlook
ANNUAL RESULTS PRESENTATION 2016 ANNUAL REVIEW
50 Anglo American Platinum Limited Annual Results Presentation 2016
2016 ANNUAL RESULTS PRESENTATIONFOR THE YEAR ENDED 31 DECEMBER 2016

OVERVIEW OF 2016 CHRIS GRIFFITH, CHIEF EXECUTIVE OFFICER
Hydraulic shovel loading a truck at Mogalakwena Mine
Anglo American Platinum Limited Annual Results Presentation 2016 51

5
12.8
7.3
31 Dec 15 31 Dec 16
19 266 19 545
2015 2016
OVERVIEW OF 2016 Delivering change…building a resilient business…
…and positioning for the future
Zero harm remains the priority
PGM pricing remained weak
Strong operational performance up 2%
Unit cost increase of only 1.4%
R3.5 billion of free cash flow generated from operations
Net debt reduced by R5.5 billion to R7.3 billion
Solid earnings per share of R7.13
Significant progress in repositioning the portfolio
Unit cost (Rand / platinum ounce) (1)
Net debt profile (R billion)
+1.4%
R(5.5)bn
ANNUAL RESULTS PRESENTATION 2016 ANNUAL REVIEW
52 Anglo American Platinum Limited Annual Results Presentation 2016
2016 ANNUAL RESULTS PRESENTATIONFOR THE YEAR ENDED 31 DECEMBER 2016

OPERATIONAL REVIEW CHRIS GRIFFITH, CHIEF EXECUTIVE OFFICER
Precious Metals Refinery Amandelbult Chrome Plant
Anglo American Platinum Limited Annual Results Presentation 2016 53

7
SAFETY, HEALTH & ENVIRONMENT Disappointing fatality performance…
…remain committed to zero harm
Number of fatalities – own mine operations
Lost time injury frequency rate (LTIFR) (2)
Safety
Tragically, 7 fatalities occurred during 2016
Overall safety trend showing strong improvement
– LTIFR (2) reduced by 26% to 0.73
– TRCFR (3) reduced by 31% to 1.05
Section 54 stoppages continue to impact production
Health & Environment
Effective disease management programmes resulted in significant reduction in HIV and TB related deaths
No significant environmental incidents
25
6 3 2 7
2007 2013 2014 2015 2016
2.03
1.05 0.95 0.98 0.73
2007 2013 2014 2015 2016
(4)
(26)%
ANNUAL RESULTS PRESENTATION 2016 ANNUAL REVIEW
54 Anglo American Platinum Limited Annual Results Presentation 2016
2016 ANNUAL RESULTS PRESENTATIONFOR THE YEAR ENDED 31 DECEMBER 2016

8
440 440 630
440
65*
Dec 14 Dec 15 Jun 16 Dec 16
OPERATIONAL PERFORMANCE IN 2016 Efficiencies improving at operations…
…leading to an increase in profitable production
Total platinum production (million ounces) (5)
Pipeline & refined platinum inventory (‘000 ounces)
Total platinum production up 2% to 2.38 million ounces
Retained own mine operations up 5% to 956,000 ounces
– Mogalakwena up 5% to 412,000 ounces – Amandelbult up 7% to 467,000 ounces – Unki up 12% to 75,000 ounces – Twickenham placed on care and maintenance
Joint ventures total production up 2% to 785,000 ounces
Non-core operation Union up 7% to 151,000 ounces
Total production from Rustenburg down 4% (including purchase of concentrate post sale)
Pipeline inventory impacted by Waterval smelter run-out New normalised refined inventory levels at c.130,000 ounces
Pipeline inventory Refined inventory
Normalised Level: 440
212 200
50
130
Dec 14 Dec 15 Jun 16 Dec 16
2.36
1.87
2.34 2.38
2013 2014 2015 2016
New normal level
* Built up pipeline inventory from the Waterval smelter run-out
240
200
130
Anglo American Platinum Limited Annual Results Presentation 2016 55

9
46% 49% 50% 47%
30 130
35,624 32 850 34 309
0%
10%
20%
30%
40%
50%
2013 2014 2015 2016 Cash Operating Margin Rand Basket Price
325 353 369 381 16
22 23
31
2013 2014 2015 2016 Mogalakwena Baobab
MOGALAKWENA Another record performance…
...through increased operational efficiencies, without the need for growth capital
Platinum production (‘000 ounces) (5)
Cash operating margin (%) (6)
Award winning safety performance – 6 million fatality free shifts
Record production performance:
– Total production up 5% to 412,000 ounces – Total tonnes milled up 8%
Baobab continued to deliver value, with production up to 31,000 ounces
– Secured full use and operational control for 3 years on completion of the sale of the Pandora JV
Highest rand basket price in the portfolio of R34,309 per platinum ounce
Maintained strong cash operating margin
R3.2 billion operating free cash flow
341 375
392 412
ANNUAL RESULTS PRESENTATION 2016 ANNUAL REVIEW
56 Anglo American Platinum Limited Annual Results Presentation 2016
2016 ANNUAL RESULTS PRESENTATIONFOR THE YEAR ENDED 31 DECEMBER 2016

10
AMANDELBULT Success visible in production performance…
…boosted by value from chrome plant
Platinum production (‘000 ounces) (5)
Operating free cash flow (R million) (7)
Tragically 2 fatalities in 2016
Strong production performance up 7%: – Improved operational efficiencies in underground
mining – Open pit production added 41,000 ounces
Chrome plant commissioned on time and on budget – 235,000 tonnes of chrome concentrate produced – Payback period of 6 months
Rand basket price increased 10% with the inclusion of chrome revenue
Generated R1.1 billion operating free cash flow including R320 million from chrome
Dishaba UG2 project in progress - limited capital expenditure
373
219
437 467
2013 2014 2015 2016
206
23
620
1 066
2013 2014 2015 Restated
2016
Anglo American Platinum Limited Annual Results Presentation 2016 57

11
JOINT VENTURE OPERATIONS Record production performance…
…with increases from all operations
Lost time injury frequency rate (LTIFR) (2)
Platinum production (‘000 ounces) (5)
Tragically 6 fatalities occurred across the joint venture operations
LTIFR stable at 0.64 in 2016
Strong mining performance up 2% to 785,000 ounces:
– Modikwa up 10% to 115,000 ounces
– BRPM up 9% to 196,000 ounces
– Kroondal up 4% to 274,000 ounces
– Mototolo up 2% to 117,000 ounces
– Bokoni up 4% to 83,000 ounces - normalised for closure of two unprofitable shafts
0.84
0.69 0.62 0.64
2013 2014 2015 2016
388
765
781 768
785
2013 2014 2015 2016
ANNUAL RESULTS PRESENTATION 2016 ANNUAL REVIEW
58 Anglo American Platinum Limited Annual Results Presentation 2016
2016 ANNUAL RESULTS PRESENTATIONFOR THE YEAR ENDED 31 DECEMBER 2016

12
NON-CORE OPERATIONS - RUSTENBURG & UNION Rustenburg sale complete…operational improvements at Union…
…contributing to free cash flow
Production (‘000 ounces) (5) Rustenburg
Tragically 4 fatalities in 2016
Total platinum production down 4% to 460,000 ounces
R85 million operating free cash flow (including purchase of concentrate)
Union
Tragically 1 fatality in 2016
Strong platinum production up 7% to 151,000 ounces
R302 million operating free cash flow
Production (‘000 ounces) (5)
570
281
478 377
83
2013 2014 2015 2016 Own mined POC
460
181
88
141 151
2013 2014 2015 2016
Operating free cash flow (Rm) (7)
Operating free cash flow (Rm) (7)
257
630
192 85
2013 2014 2015 Restated
2016
(275) (292)
34
302
2013 2014 2015 Restated
2016
Anglo American Platinum Limited Annual Results Presentation 2016 59

13
REFINED PRODUCTION & SALES VOLUME IN 2016 Refined production impacted by the Waterval smelter run-out…
…drawdown in inventory helped supplement sales in 2016
Total refined platinum production (million ounces)
Total platinum sales volume (million ounces)
Refined platinum production
Platinum refined production down 5% to 2,335 koz
– Impacted by the Waterval smelter run out by 65,000 ounces
– Lower stock gain by 70,000 ounces led to lower pipeline inventory to refine
The PMR has fully made up production after the section 54 safety stoppage in H1 2016
Platinum sales
Platinum sales down 2% to 2,416 koz
Palladium & Rhodium
Palladium refined production down 8%
Rhodium refined production up 4%
2.38
1.89
2.46 2.33
2013 2014 2015 2016
2.32
2.11
2.47 2.42
2013 2014 2015 2016
ANNUAL RESULTS PRESENTATION 2016 ANNUAL REVIEW
60 Anglo American Platinum Limited Annual Results Presentation 2016
2016 ANNUAL RESULTS PRESENTATIONFOR THE YEAR ENDED 31 DECEMBER 2016

FINANCIAL REVIEW IAN BOTHA, FINANCE DIRECTOR
PLATINUM
Valcambi Suisse 500g Platinum Bar
Anglo American Platinum Limited Annual Results Presentation 2016 61

15
R billion 2015 2016
Basket price (Rand / Pt ounce) 24,203 25,649
Sales revenue 59.8 62.0
EBITDA 8.6 9.1
EBIT
⁽ ⁾
3.4 4.4
Headline earnings (0.1) 1.9
Project and SIB Capex
⁽ ⁾
3.7 3.4
Net debt 12.8 7.3
Unit costs (Rand / Pt ounce) 19,266 19,545
SUMMARY OF 2016 RESULTS Balance sheet strengthened…
…supported by operational delivery and cash initiatives
Headline Earnings per share (Rand/share) Key financials
(3.25) (1.31) (0.48) (1.02)
(6.86)
1.70
4.78
7.84
1.62
5.99
7.13
2016
3.64
(0.48)
2013 Restated
2015 Restated
2014 Restated
Stock Gain Impairments + IFRS2 Underlying Restructuring Costs
(8) EBITDA, EBIT and Headline earnings restated for 2015
(9)
(10)
EBITDA
ANNUAL RESULTS PRESENTATION 2016 ANNUAL REVIEW
62 Anglo American Platinum Limited Annual Results Presentation 2016
2016 ANNUAL RESULTS PRESENTATIONFOR THE YEAR ENDED 31 DECEMBER 2016

16
0.4
3.0
5.0
0.7
2016
6.0
(4.3)
(1.5)
(2.5)
8.6
7.8
9.1
Costs Sales Volume
CPI
(0.3)
Price Currency Stock gain Associates Restructuring costs
2015 Restated
EBITDA VARIANCE
…offset by weaker US Dollar prices and lower stock gain
Improved earnings from strong cost delivery and weaker Rand…
(10) (9)
Uncontrollable: – R1.8bn Controllable: + R3.1bn Once-off: – R0.8bn
2016 vs. Restated 2015 (R billion)
(11) (12) (11) (12) (13) (14)
Anglo American Platinum Limited Annual Results Presentation 2016 63

17
4.2%
7.1%7.1%
10.2%
Labour Consumables Electricity Diesel
UNIT COST Cost control keeping unit cost escalation below CPI and input cost inflation…
…supported by operating cost and overhead savings
AAP’s input cost inflation (%) Unit cash cost escalation
251
1,439
Volume Costs
19,545 (300)
AAP input cost inflation
2015
(1,111)
19,266
2016
2017E
20,850 1.4%
(15)
R/Pt oz
2016 guidance R19,250 – R19,750 AAP input cost inflation:
2016: 7.5% (2015: 6.9%)
SA CPI = 6.4% (2015: 4.6%)
12% 46% 3% 25% % of cash cost
20,350
Overheads
Reduction in Mogalakwena Capitalised Waste in 2017
+R400 YOY
Achieved 1.4%
Detailed cash cost % breakdown included in appendices
1.4%
ANNUAL RESULTS PRESENTATION 2016 ANNUAL REVIEW
64 Anglo American Platinum Limited Annual Results Presentation 2016
2016 ANNUAL RESULTS PRESENTATIONFOR THE YEAR ENDED 31 DECEMBER 2016

18
R700 million lower than 2015…
…with R1.0 billion run rate saving established in Q4 2016
RIGHTSIZING OVERHEADS
The target… Delivery outperforming target
3.4
5.4
End state 2014 Rustenburg exit
Union exit
(0.7)
Overhead reduction
(0.3)
(1.0)
3.0
3.5
4.2
5.4
2014
(0.3)
2016 pro forma
Rustenburg exit
Rustenburg (10 Months)
(35)%
2016 2015
(0.5)
Union
(35)%
Anglo American Platinum Limited Annual Results Presentation 2016 65

19
CAPITAL EXPENDITURE Disciplined capital allocation continues…
…aimed at maintaining asset integrity and adding value
Capital expenditure (R billion) (16)
2.8 2.5
0.6 1.2
3.7 – 4.2
2017E
2.9 – 3.2
0.8 – 1.0 3.4
2015
2016
3.7
Projects
SIB
Focus on low capex, fast payback, value accretive projects Continued strong SIB governance
2017: Unki smelter Dishaba UG2 Smelter furnace rebuild Mogalakwena concentrator optimisation
Near term: SO₂ abatement Replacement and ore reserve development Smelter furnace rebuilds No expansion projects until after 2017 and then
only if balance sheet allows and market demands metal
R billion 2015 2016 2017E
Capitalised Waste Stripping 1.0 1.3 0.8
ANNUAL RESULTS PRESENTATION 2016 ANNUAL REVIEW
66 Anglo American Platinum Limited Annual Results Presentation 2016
2016 ANNUAL RESULTS PRESENTATIONFOR THE YEAR ENDED 31 DECEMBER 2016

20
WORKING CAPITAL Actively managed down…
…supported by Rustenburg exit and customer prepayment
Trade working capital (R billion) Customer prepayment
Inventory reduction (‘000 ounces) 8.0
13.3
Creditor days
Stores reduction
2016
(0.1)
(1.3)
(0.4)
Rustenburg exit
2015 Restated
2017 Customer
prepayment (at spot)
(2.0)
2016 Customer
prepayment
(2.8)
5 year contract
c.$250 million ($150 million in 2016, c.$100 million in 2017)
No incremental cost
Metal pricing at spot on the date of sale
440 440
212 200130
440505
130
WIP
Finished metals
635
New normal 2016
570
640
2015 2014
652
Days
$100m
75 49
Anglo American Platinum Limited Annual Results Presentation 2016 67

21
Opening net debt 1 January 2016 12.8
Cash flow from operations (10.5)
Restructuring costs 0.3
Capex and capitalised waste stripping 4.7
Cash tax paid 1.1
Other 0.9
Free cash flow (3.5)
Net interest paid 1.4
Customer prepayment (2.0)
Net cash flow (4.1)
Rustenburg proceeds after costs
⁽
¹
⁾
(1.4)
Closing net debt 31 December 2016 7.3
November 2016 VAT (Received in January) (0.5)
Pro forma 2016 net debt 6.8
NET DEBT Generated R3.5bn free cash flow from operations…
…strengthening the balance sheet and increasing liquidity
Net debt (R billion) Net debt (R billion)
Liquidity headroom (R billion)
9.5
5.3 1.6
7.9 6.5
1.1
9.5
2015 2016 2014
14.9
7.6
Cash Committed facilities less gross debt
7.3
12.814.6
31 Dec 2014 31 Dec 2015 31 Dec 2016
Net debt : EBITDA
2.6
1.5 0.8
(17)
ANNUAL RESULTS PRESENTATION 2016 ANNUAL REVIEW
68 Anglo American Platinum Limited Annual Results Presentation 2016
2016 ANNUAL RESULTS PRESENTATIONFOR THE YEAR ENDED 31 DECEMBER 2016

MARKETS REVIEW CHRIS GRIFFITH, CHIEF EXECUTIVE OFFICER
Hydrogenious – Hydrogen supply system for a hydrogen filling station
Anglo American Platinum Limited Annual Results Presentation 2016 69

23
MARKET PRICES Average US Dollar PGM prices were lower year-on-year in 2016…
…with US Dollar strength weighing on prices in H2
USD platinum price (USD / ounce) US Dollar platinum price remains below peak 2015 levels
Average platinum price was down 6% year-on-year
The platinum price fell in H2 2016 due to a stronger US Dollar and an increase in US interest rates
Realised basket price
2016 realised basket prices
˗ US Dollar basket down 8% to $1,753/oz ($1,905/oz in 2015)
˗ Rand basket up 6% to R25,649/oz (R24,203/oz in 2015)
Realised basket prices
1 400
1 550
1 700
1 850
2 000
21 000
23 000
25 000
27 000
Jan Feb Mar Apr May Jun Jul Aug Sep Oct Nov Dec
US
Dol
lar p
er o
unce
Ran
d pe
r oun
ce
Rand basket price (LHS) 2016 average Rand basket price Dollar basket price (RHS) 2016 average US Dollar basket price
2016: R25,649/oz
2016: $1,753/oz
700 800 900
1000 1100 1200 1300
Jan.15 Apr.15 Jul.15 Oct.15 Jan.16 Apr.16 Jul.16 Oct.16
US
Dol
lar p
er o
unce
Platinum price Average platinum price 2016 Average platinum price 2015
2016: $989/oz 2015: $1,053/oz
Y-o-y (6.0)%
Y-o-y +6%
Y-o-y (8)%
ANNUAL RESULTS PRESENTATION 2016 ANNUAL REVIEW
70 Anglo American Platinum Limited Annual Results Presentation 2016
2016 ANNUAL RESULTS PRESENTATIONFOR THE YEAR ENDED 31 DECEMBER 2016

24
PLATINUM MARKET Platinum in deficit in 2016 due to strong industrial and investment demand…
…despite headwinds in automotive and jewellery sectors
-185
-791 -856
-457 -422
2012 2013 2014 2015 2016E
Demand: 0.4% growth
Higher y-o-y consumption in the automotive, industrial, and investment sectors
Total number of diesel vehicles sold in Europe increased, despite some moderation in market share as expected
Chinese jewellery demand fell compared to 2015
Supply: 0.9% growth
Primary supply decreased largely due to lower sales of stock by South African producers
Automotive recycling levels increased modestly but remain depressed due to weak prices
Jewellery recycling was stronger than normal
Balance
Platinum market was in deficit in 2016 with a deficit expected again this year
JM platinum market balance (‘000 ounces) (18)
JM platinum supply & demand 2016 vs 2015 (18)
-422
Thousand Ounces 2015 2016 Y-o-Y Δ% Demand
3,267 3,318 51 1.6% 2,829 2,572 (257) (9.1)% 1,749 1,954 205 12.0%
451 487 36 8.0% 8,296 8,331 35 0.4%
Supply 6,109 6,007 (102) (1.7)% 1,730 1,902 172 9.9%
7,839 7,909 70 0.9%
Market Balance (457) (422)
0.4%
9.9% 0.9%
Anglo American Platinum Limited Annual Results Presentation 2016 71

25
PLATINUM MARKET - AUTOMOTIVE Strong European sales support platinum demand…
…despite a slow decline in diesel market share as expected
6%
1%
12%
5%
W. Europe N. America China Global
Autocat demand grew during 2016:
– Sales in Western Europe up 6% – Slightly higher loadings due to Euro 6b legislation – Diesel fell to 49.6% market share, but more
vehicles sold than in 2015
Heavy Duty Diesel still a growth market
Fuel Cell Electric Vehicles (FCEVs) – technology developments proceeding well
– Infrastructure: number of fuelling stations rises with aggressive expansion plans in China
– Awareness: Continuing vehicle launches and increased use in public transport
Global light duty vehicle sales (2016 vs 2015) (19)
Global fuel cell electric vehicle sales (units sold) (19)
362 112
641
2,699
2013 2014 2015 2016
6%
ANNUAL RESULTS PRESENTATION 2016 ANNUAL REVIEW
72 Anglo American Platinum Limited Annual Results Presentation 2016
2016 ANNUAL RESULTS PRESENTATIONFOR THE YEAR ENDED 31 DECEMBER 2016

26
PLATINUM MARKET - JEWELLERY Chinese jewellery demand for gold and platinum weakens in 2016…
…while platinum gains market share in India
Global jewellery demand fell in 2016
Chinese jewellery market struggled due to: – Destocking – Softer consumer confidence – Shift in spending patterns
India demonetisation stalls growth in Q4 but platinum makes headway in the retail sector
Platinum Guild International (PGI) Focus on China continues – with PGI partners
outperforming rest of sector
Evara and Platinum Day of Love initiatives delivering results in India in challenging conditions
Year-on-year Chinese performance (21)
Chinese platinum jewellery demand (‘000 ounces) (20)
1 000
1 500
2 000
2 500
2011 2012 2013 2014 2015 2016
Headline demand Consumer demand
(17)% (16)%
(8)%
6%
Headline Gold Headline Platinum PGI partner- plain metal
PGI partner- gem set
Anglo American Platinum Limited Annual Results Presentation 2016 73

27
PLATINUM MARKET – INVESTMENT Japanese investment strong again in 2016…
…and market development work widens investment product availability
Platinum ETF holdings (million ounces) (22)
Annual net investment demand (‘000 ounces) (23)
Overall investment flows healthy last year - Platinum ETF holdings stable over the last
few years
- Physical investment in Japanese bars continued to be strong in 2016
World Platinum Investment Council (WPIC) WPIC and The Royal Mint working on a new range
of physical platinum investment products
Austrian Mint issues first platinum coin as part of the Vienna Philharmonic range
WPIC and Bullion Vault launched a new online market place for physical platinum
0.0
0.5
1.0
1.5
2.0
2.5
3.0
Jan.10 Jan.11 Jan.12 Jan.13 Jan.14 Jan.15 Jan.16
Mill
ion
Oun
ces
460 450
871
277
451 487
2011 2012 2013 2014 2015 2016
ANNUAL RESULTS PRESENTATION 2016 ANNUAL REVIEW
74 Anglo American Platinum Limited Annual Results Presentation 2016
2016 ANNUAL RESULTS PRESENTATIONFOR THE YEAR ENDED 31 DECEMBER 2016

28
PALLADIUM MARKET Palladium in deficit in 2016 due to healthy automotive growth…
…and outlook remains positive
-1 113
-500
-1 861
-356 -651
2012 2013 2014 2015 2016E
Demand: 4.6% growth
Automotive demand firms with Chinese growth a main driver
Industrial demand edges lower despite modest global economic growth
Net investment demand negative for a second year due to ETF disinvestment
Supply: 1.5% growth
Primary supply almost unchanged in 2016
Automotive recycling grew by 3.6 per cent but remained below 2014 levels due to lower metal prices
Balance
Palladium was in a fundamental deficit in 2016 and is expected to be in deficit again in 2017
JM palladium supply & demand 2016 vs 2015 (16)
JM palladium market balance (‘000 ounces) (16)
-651
Thousand Ounces 2015 2016 Y-o-Y Δ% Demand
7,655 7,840 185 2.4% 2,264 2,202 (62) (2.7)% (659) (357) 302 (46.0)% 9,260 9,685 425 4.6%
Supply 6,444 6,485 41 0.6% 2,460 2,549 89 3.6%
8,904 9,034 130 1.5%
Market Balance (356) (651)
( ) 4.6%
1.5%
Anglo American Platinum Limited Annual Results Presentation 2016 75

STRATEGY REVIEW CHRIS GRIFFITH, CHIEF EXECUTIVE OFFICER
Process operator at the Precious Metals Refinery
ANNUAL RESULTS PRESENTATION 2016 ANNUAL REVIEW
76 Anglo American Platinum Limited Annual Results Presentation 2016
2016 ANNUAL RESULTS PRESENTATIONFOR THE YEAR ENDED 31 DECEMBER 2016

30
Developing the market for PGMs and positioning for the future - Market development – focus on creating incremental demand for PGMs - Innovation – focus on unlocking value through modernisation in mining and processing
technology - People and Communities – investing in building relationships to create a sustainable
and productive environment in which we operate
…to generate long term value through the cycle
STRATEGY REVIEW Three key areas of our strategy…
Our value driven strategy is built around three key deliverables:
1 Repositioning our assets into a value maximising portfolio ˗ Positioned in the first half of the cost curve ˗ At least 70% mechanised mining ˗ More highly skilled work force ˗ Safer operations ˗ Less complex organisation
2 Extracting the full value from our operations – ensuring we optimise each of our assets to their potential
3
Anglo American Platinum Limited Annual Results Presentation 2016 77

31
5.4
4.2 3.5
3.0 3.0 2.7
(0.5) (0.3)
2014
2015
2016
Rus
tenb
urg
(10
mon
ths)
2016
pro
-form
a R
uste
nbur
g ex
it
Uni
on
REPOSITIONING THE PORTFOLIO Restructuring largely complete…repositioning of the portfolio progressing…
…and early benefits as a result of rightsizing the overhead
Rustenburg sold
Pandora SPA signed
Union SPA signed
Bokoni
Kroondal
Restructuring since 2013… …success with repositioning the portfolio…
Reshaped Rustenburg
Restructured Union
Simplifying JV Portfolio and maximising value
…and rightsizing the overhead
Twickenham placed on care and maintenance (in 2016)
SPA signed for disposal of long dated Amandelbult
mineral resources
R billion
(35)%
+
ANNUAL RESULTS PRESENTATION 2016 ANNUAL REVIEW
78 Anglo American Platinum Limited Annual Results Presentation 2016
2016 ANNUAL RESULTS PRESENTATIONFOR THE YEAR ENDED 31 DECEMBER 2016

32
SALE OF UNION MINE & MASA CHROME Another strategic success in the repositioning strategy…with R400m upfront consideration…
…further upside consideration potential and life of mine POC and tolling contract
Strategic Rationale As announced in 2013, the Union mine is a non-core operation Significant effort was made to make the mine profitable including:
- Closing unprofitable production areas by consolidating two mines into one and closing declines - Undertaking restructuring to reduce the labour force by ~1,000 employees
Created a sustainable operation, with improved cost position and cash generation However, the retained portfolio has better capital investment options so the mine remains non-core
Terms of the Transaction A subsidiary of Siyanda will purchase the mine from AAP for R400 million cash upfront consideration In addition, AAP will participate in 35% of positive cumulative distributable free cash flow for 10 years Purchase of concentrate agreement for 7 years and thereafter tolling arrangement for 4E metals for the life of
mine Conditions precedent include Competition Commission approval and Section 11 approval from the DMR
Anglo American Platinum Limited Annual Results Presentation 2016 79
OUTLOOK CHRIS GRIFFITH, CHIEF EXECUTIVE OFFICER
30 kW off-grid electricity supply system by Hydrogenious Technologies
ANNUAL RESULTS PRESENTATION 2016 ANNUAL REVIEW
80 Anglo American Platinum Limited Annual Results Presentation 2016
2016 ANNUAL RESULTS PRESENTATIONFOR THE YEAR ENDED 31 DECEMBER 2016

34
KEY MESSAGES & 2017 OUTLOOK Summary of a successful 2016…
…and more of the same for the year ahead
Guidance for 2017
Platinum production between 2.35 – 2.40 million ounces (own mine production constant at c. 960,000 ounces)
Unit cash cost guidance between R20,350 – R20,850 / platinum ounce
Capital expenditure guidance between R3.7 billion – R4.2 billion
Key messages
Strong operational performance up 2%
Unit cost increase of only 1.4%
R3.5 billion of free cash flow generated from operations
Net debt reduced by R5.5 billion to R7.3 billion
Solid earnings per share of R7.13
Significant progress in repositioning the portfolio
Anglo American Platinum Limited Annual Results Presentation 2016 81

ANNUAL RESULTS PRESENTATION 2016 ANNUAL REVIEW
82 Anglo American Platinum Limited Annual Results Presentation 2016
2016 ANNUAL RESULTS PRESENTATIONFOR THE YEAR ENDED 31 DECEMBER 2016

APPENDICES
Anglo American Platinum Limited Annual Results Presentation 2016 83

37
Operation
Net DebtDecember
2015Cash fromoperations
Restructuringcosts
SIB & Waste capital
Project capital Cash tax paid
Funding of associates &
otherFree cash
flowNet interest
paidCustomer
Prepayment Net cash flow
Rustenburg proceeds after
costs
Net DebtDecember
2016Mogalakwena 5,628 2 (2,471) (35) 3,125 Amandelbult 1,449 (17) (383) (39) 113 1,123 Unki 224 - (163) (81) (20) Twickenham (238) (65) (2) (13) (318) NMT (142) - (20) (6) (168) Joint Ventures 1,978 (16) (419) (76) 1,467 Associates 604 - (42) 0 (760) (198) 3rd Parties 167 - (19) 0 148 Rustenburg 446 (74) (374) (350) (352) Union 361 (78) (59) 0 224 Company 23 (95) (95) (47) (1,125) (218) (1,557) (1,394) 2,015 1,356
(12,769) 10,500 (342) (4,047) (648) (1,125) (865) 3,473 (1,394) 2,015 4,094 1,356 (7,319)
Stronger Rand basket price…
…mines cash positive
NET DEBT AND CASH FLOW BY MINE
(4.0)
(0.6)(1.1)
(0.9)
(1.4)
(7.3)
(8.7)(9.3)
(12.8)
10.5 1.4
(0.3)
2.0
R3.5bn
(24)
ANNUAL RESULTS PRESENTATION 2016 ANNUAL REVIEW
84 Anglo American Platinum Limited Annual Results Presentation 2016
2016 ANNUAL RESULTS PRESENTATIONFOR THE YEAR ENDED 31 DECEMBER 2016

38
Non ZAR – 10% of total costs 100% at Unki Circa 25% at Mogalakwena
COST BREAKDOWN
Conventional mines 60% 5% 17% 1% 7% 10%
Mechanised mines 40% 25% 20% 4% 4% 7%
Open pit 18% 4% 43% 10% 12% 12%
Company 40% 6% 24% 3% 12% 15%
Company ex Rtb 37% 5% 26% 3% 13% 16%
Sundries and Water
Labour Consumables Diesel ElectricityContractors
Anglo American Platinum Limited Annual Results Presentation 2016 85

39
MOGALAKWENA WASTE STRIPPING Waste stripping at Mogalakwena will continue…tonnes mined will remain the same…
…however capitalised amount will decrease in 2017
Waste Stripping is the process of removing mine waste material (overburden) in order to gain access to ore deposit
Waste stripping in the production phase, which provides improved access to ore, is recognised as a stripping asset i.e. capitalised
This stripping asset is depreciated on a unit of production basis over the life of the orebody to which it improves access. Ongoing operational stripping is expensed as incurred
The annual waste stripping tonnes are determined based on the mining plan and the extraction strategy, this can change during any financial year and as a result will impact the capital tonnes mined
Capitalise to extent that it provides access to future ore (incl. pre-production)
ANNUAL RESULTS PRESENTATION 2016 ANNUAL REVIEW
86 Anglo American Platinum Limited Annual Results Presentation 2016
2016 ANNUAL RESULTS PRESENTATIONFOR THE YEAR ENDED 31 DECEMBER 2016

40
0
2
4
6
8
10
2015 2016 2017 2018 2019 2020 2021 2022 2023
Electric Hybrids
0 20 40 60 80
100 120
2015 2016 2017 2018 2019 2020 2021 2022 2023
Diesel Gasoline Electric Hybrids
PLATINUM MARKET – AUTOMOTIVE
Trend towards greater electrification of the drivetrain will continue…
….but PGM autocatalyst market expected to grow
Forecast annual light duty vehicle production (millions) (19)
Forecast electric vehicle penetration rates (millions) (19)
Automotive market expected to grow
Internal combustion engine market expected to grow despite lower market share in the future
PGM demand forecast to be robust over this timescale
China offering subsidies for electric vehicles
Electrification will increase
Alternative powertrain penetration forecast to be 8% by 2023
Hybrid electric vehicles will account for the majority of electric drive trains
Hybrid electric vehicles contain similar amounts of platinum group metals to conventional vehicles
2m
Gasoline
Diesel
Hybrid Electric
67m
18m
6m
80m
21m
Electric
Anglo American Platinum Limited Annual Results Presentation 2016 87

41
ANNOUNCED SALE AND PURCHASE AGREEMENTS Major milestones completed in the restructuring of the portfolio…
…adding further value to Anglo American Platinum
Signed a sale and purchase agreement to dispose of a 42.5% stake in Pandora mine to JV partner Lonmin plc on 10 November 2016
Proceeds made up of: - Deferred payment of R400 million in nominal
terms over 6 years; and
- Full use and operational control of Baobab concentrator for a 3 year period, unlocking further potential at Mogalakwena mine through guaranteed increased processing capacity
Allow AAP to integrate the Baobab operation into supply chain activities, resulting in cost reduction opportunities
Anticipated completion in 2017
Sale of 42.5% stake in the Pandora joint venture Sale of resources within Amandelbult mining right
On 11 October announced disposal of mineral resources within the Amandelbult mining right and surface properties to Northam
Consideration comprising R1 billion cash and an ancillary mineral resource within Northam’s Zondereinde mining right, bordering Amandelbult
The transaction will allow realisation of value for resources that were not in the mine plan, contributing to deleveraging the balance sheet
In addition, the mineral resource acquired provides further flexibility for the placement of future infrastructure of next generation replacement
Anticipated completion in 2017
ANNUAL RESULTS PRESENTATION 2016 ANNUAL REVIEW
88 Anglo American Platinum Limited Annual Results Presentation 2016
2016 ANNUAL RESULTS PRESENTATIONFOR THE YEAR ENDED 31 DECEMBER 2016

42
(1) Unit cost on a produced metal in concentrate basis (2) Lost time in jury frequency rate (LTIFR) based per 200,000 hours worked (3) TRCFR is total recordable case frequency rate (4) 2014 LTIFR normalised for the 5 month long strike (5) Total platinum production is on a metal in concentrate basis (6) Cash operating margin is defined as (revenue less cash operating costs) / revenue (7) Operating free cash flow is defined as free cash flow for operating mines after full overhead allocation, SIB capex, capitalised waste stripping
and minorities. It is presented before project capex and one-off restructuring costs (8) Impairment and IFRS2 includes impairments for Bokoni and IFRS2 charge for Amandelbult Chrome Plant (9) EBIT is Earnings before interest and tax including pre-tax profits and losses from associates normalised for impairments (10) Project and SIB capital expenditure excludes Capitalised waste stripping and Interest capitalised. 2016 capital excludes Rustenburg for
November and December 2016 (11) Price variance calculated as increase/(decrease) in Dollar price multiplied by current period sales volume (12) Inflation variance calculated using CPI on prior period cash operating costs that have been impacted directly by inflation (13) Sales volume variance calculated as increase/(decrease) in sales volume multiplied by prior period cash margin (14) Costs include cash operating costs, inventory movements and depreciation (15) AAP Mining inflation is CPI and inflation above CPI as experienced by AAP based on its basket of costs (16) Capital expenditure excludes capitalised waste stripping and Interest capitalised (17) Rustenburg disposal proceeds offset by transaction costs (18) Johnson Matthey data as of PGM Market Report November 2016 (19) Source: LMC Automotive (20) Headline demand as measured by Johnson Matthey. Consumer demand based on Company estimates (21) Source: Johnson Matthey, World Gold Council, Platinum Guild International (22) ETF publically available data (23) (24) Company costs includes mainly marketing expenses, Corporate SIB expenditure and Twickenham new mining technology
FOOTNOTES
Anglo American Platinum Limited Annual Results Presentation 2016 89

ANNUAL RESULTS PRESENTATION 2016 ANNUAL REVIEW
90 Anglo American Platinum Limited Annual Results Presentation 2016
NOTES

DIRECTORSExecutive directorsCI Griffith (Chief executive officer)I Botha (Finance director) Independent non-executive directorsMV Moosa (Independent non-executive chairman)RMW Dunne (British)NP MagezaNT MoholiD NaidooJM Vice
Non-executive directorsM Cutifani (Australian)R Médori (French)AM O’Neill (British)AH Sangqu
Alternate directorsPG Whitcutt (Alternate to R Medori)
COMPANY SECRETARYElizna [email protected]
Telephone +27 (0) 11 638 3425Facsimile +27 (0) 11 373 5111
FINANCIAL, ADMINISTRATIVE, TECHNICAL ADVISERSAnglo Operations Proprietary Limited
CORPORATE AND DIVISIONAL OFFICE,REGISTERED OFFICE AND BUSINESS ANDPOSTAL ADDRESSES OF THE COMPANY SECRETARYAND ADMINISTRATIVE ADVISERS55 Marshall Street, Johannesburg 2001PO Box 62179, Marshalltown 2107
Telephone +27 (0) 11 373 6111Facsimile +27 (0) 11 373 5111 +27 (0) 11 834 2379
ADMINISTRATION
SPONSORRand Merchant Banka division of FirstRand Bank Limited
REGISTRARSComputershare Investor Services Proprietary LimitedRosebank Towers, 15 Bierman AvenueRosebank, 2196PO Box 61051Marshalltown 2107
Telephone +27 (0) 11 370 5000Facsimile +27 (0) 11 688 5200
AUDITORSDeloitte & ToucheBuildings 1 and 2, Deloitte PlaceThe Woodlands, Woodlands DriveWoodmeadSandton 2196
INVESTOR RELATIONSEmma [email protected]
Telephone +27 (0) 11 373 6239
LEAD COMPETENT PERSONGordon [email protected]
Telephone +27 (0) 11 373 6334
FRAUD LINE – SPEAKUPAnonymous whistleblower facility0800 230 570 (South Africa)[email protected]
HR-RELATED QUERIESJob opportunities: www.angloamericanplatinum.com/ careers/job-opportunities
Bursaries, email: [email protected]
Career information: www.angloamericanplatinum.com/ careers/working-at-anglo-american-platinum
DISCLAIMERCertain elements made in this annual report constitute forward looking statements. Forward looking statements are typically identified by the use of forward looking terminology such as ‘believes’, ‘expects’, ‘may’, ‘will’, ‘could’, ‘should’, ‘intends’, ‘estimates’, ‘plans’, ‘assumes’, or ‘anticipates’ or the negative thereof or other variations thereon or comparable terminology, or by discussions of, e.g. future plans, present or future events, or strategy that involve risks and uncertainties. Such forward looking statements are subject to a number of risks and uncertainties, many of which are beyond the company’s control and all of which are based on the company’s current beliefs and expectations about future events. Such statements are based on current expectations and, by their current nature, are subject to a number of risks and uncertainties that could cause actual results and performance to differ materially from any expected future results or performance, expressed or implied, by the forward looking statement. No assurance can be given that such future results will be achieved; actual events or results may differ materially as a result of risks and uncertainties facing the company and its subsidiaries.

Anglo American Platinum LimitedIncorporated in the Republic of South AfricaDate of incorporation: 13 July 1946Registration number: 1946/022452/06JSE code: AMS – ISIN: ZAE000013181www.angloamericanplatinum.com A member of the Anglo American plc groupwww.angloamerican.com
Find us on Facebook
Follow us on Twitter


![[Updated Constantly] - ITExamAnswers.net](https://static.fdokumen.com/doc/165x107/631602506ebca169bd0b61e0/updated-constantly-itexamanswersnet.jpg)


