Untitled - Unitus DSpace
112
-
Upload
khangminh22 -
Category
Documents
-
view
1 -
download
0
Transcript of Untitled - Unitus DSpace


ACKNOWLEDGMENTS
Theideatostartaworkontheevaluationoftheperformanceofinnovationcameanalysingthe
actualevaluationproceduresontherankingofinnovation.Therewasnomethodandworks
arewidelybasedonindividualopinionsofthedifferentparticipantsintheevaluation
commissions.
Basingonthatitappearedimportanttostartdefininganewmethodforanindependentand
realisticidentificationandevaluationoftheinnovation.Themethodshouldbeabletoidentify
anychangeinthestateoftheartthatmightproduceanewtechnologyoranimportant
improvementofferingstakeholdersclearbenefits.Itshouldbebasedonindependentindexes
withnoinfluencebypersonalopinions.Wehopethatthisworkwillbethestartofmorespecific
worksandwillhelptoidentifyrealinnovationsinthefieldofagriculturalmachineryandtheir
components.
Icouldnothavefinishedthisworkwithouttheinvaluablesupportofaseveral.Iwouldliketo
givemydeepestgratitudetoProf.DaniloMonarca,PresidentoftheItalianAssociationof
AgriculturalEngineering,forhiscompetenceandtimeofferedduringthedevelopmentofthis
work.
I’dalsoliketogiveaheartfelt,specialthankstoProf.MassimoCecchiniandDr.Andrea
ColantonithathavealwaysbeenavailabletooffertheirfullsupportandProf.PaoloBalsarifor
havinginvestedtimeandexpertisesincemanyyearsintheENTAMNetwork..
Specialthanksalsotoallwhowishedmesuccessespeciallymyfamilyandfriendswhosesupport
andcaremademestaywell.

1
EVALUATION METHOD FOR THE EFFICIENCY OF INNOVATIONS
IN AGRICULTURAL MACHINERY
INDEX
INTRODUCTION 2
1 PREFACE 4
2 AGRICULTURAL MACHINERY AND FARM SPRAYERS 6
3 THE STANDARDISATION, TESTING AND CERTIFICATION PROCESS 14
3.1 Standards 16
3.2 Testing 18
3. 3 Certification 20
3.4 The process: standardisation,, testing and certification 22
3.5 Benefits 27
4 INDEXES IN THE EVALUATION PROCESS 28
4.1 Creation of indexes for the evaluation process 30
4.2 Using indexes as a good practice 40
4.3 Testing and indexing as a full evaluation process 42
5 BENEFIT OF THE EVALUATION METHOD 45
6 CONCLUSION 48
REFERENCES 49
Annex 1 Technical Instruction for ENTAM-TEST of Air Assisted Sprayers
Annex 2 ENTAM Test Report

2
INTRODUCTION
With this work I’d like to offer a new approach to the definition of innovation through an
evaluation of the average performances and the building of specific indexes. As a first step
towards a clear definition of innovation it will be necessary to make some definitions. A
product innovation is the introduction of a new product, or a significant qualitative change in an
existing product. It has to be distinguished from the “process innovation” that is the
introduction of a new process for producing or delivering goods and services. Product
innovation may be tangible manufactured goods, intangible services, or a combination of the
two. General examples of recent tangible product innovations that have had a very significant
impact on the way people live are personal computers, mobile phones etc. They made a
qualitative change of existing products being commonly used. Examples of intangible products
are various pieces of computer software needed to check and control flows of information, the
delivery of information etc. In this frame the question arises on the amount of novelty that is
enough to identify any change as “innovative”. A key issue is to distinguish innovation as what
has to be considered sufficient to qualify the product as innovative. A clear estimation of this
last issue is the benefit that the market and its stakeholders can get from it. Besides it is
important to evaluate another feature of innovation in order to distinguish it from an invention
or discovery. An invention or discovery enhances the amount of knowledge but it doesn’t
instantaneously arrive in the market as an innovative product. Finally innovation occurs when it
brings to the commercial market new products arising from applications or both existing and
new knowledge. After this clear definition of the meaning of innovation it becomes important
the estimation of innovation that will be based on the additional performance compared to the
average value of the same kind of performance measured on an existing sample of tests. The
additional performance will be compared to a specific index considering the average
improvement of the state of the art during years. If the measured additional performance
compared to the average is inside the range stated by the index then it will be considered as a
normal progress of the state of the art but if it overcomes the index then it can be considered as
an important improvement of the state of the art that has to be considered innovative.
The aim of this work is to offer all public and private institutions a new approach to measure the
level of innovation on a product or even on a process.
An example of application of the method could be inside the Rural Development Programme
2014 – 2020 providing for six economic, environmental and social priorities and programmes
proposing clear targets to be achieved. In this frame agricultural machines play an important

3
role and innovation is a key factor to get more chances for receiving financial aid by a farmer.
In this case the evaluation procedure described in the present work can offer an effective support
to the “decision making” experts to identify the best innovation performing machines helping a
more efficient subsidy policy too.

4
1 PREFACE
The new globalized world scenario is making more important the role of innovation in the
industry of agricultural machines. Worldwide the production of tractors exceeds 2 million units
with a high variation from country to country. In Italy approximately 18.500 tractors and 325
combine harvesters have been sold in 2015. The global trend of the first half of 2015 according
to the Economic Committee of Agrievolution after four strong tears provides for weak global
tractor sales. Most markets are affected by saturation (in conjunction with attractive second hand
machinery prices) and lower purchasing power by customers. Sales in the segment > 23 kW
have dropped by 17% in the first half of 2015 (excluding China) respectively by 3% (including
China). The difference between these two numbers shows which great impact the Chinese
figures have in the world as the country has become the market number considering unit terms.
It might not be surprising that this trend is not related to smaller tractors. At the same time in the
United States it is exactly the opposite and hobby farmers spend their money to buy new
machines while professional farmers are much more hesitant to spend money after a long period
of extensive investment. These scenarios show clearly some different trends worldwide but the
investment made by Governments to help farmers and farm contractors to get new machines are
still very high and in the different web sites of institutions the word “innovation” is the most
frequently considered. Innovation plays a key role not only for agricultural machinery but also
for animal husbandry, biotechnologies, fisheries, food processing, plantation and horticulture,
post harvest, water management etc.
The European Union has specific programs in the Rural Development Program 2014 – 2020.
In this worldwide scenario it will be fundamental to provide an evaluation method for the
efficiency of innovation in order to contribute offering a clear definition to the decision makers.
The aim of this work is to provide for a new approach based on real results for the evaluation of
the performances evolution trend of agricultural machinery. The work will apply the method on
a specific machine that is considered fundamental for agriculture for its relation with the quality
and quantity of production and food - human - environment security.
This work will be divided in different sections:
- chapter 2 Agricultural machinery and focus on sprayers: in this chapter an overview of
trends in the agricultural machinery sector will be deepened with a focus on orchard
sprayers that will be taken as a practical example in the following chapters.
- chapter 3 The standardisation, testing and certification process: in this chapter the
importance of standardisation, testing and certification will be deepened because they are

5
at the basis of the evaluation method. The testing activity performed by accredited
institutions/organisations offers the basis of data for a clear definition of the state of the
art of a certain system/technology being used.
- chapter 4 Indexes in the evaluation process: in this chapter a we will define some
examples of indexes to be used in the evaluation process of the performance of
innovation.
- chapter 5 Evaluation method: in this chapter we will consider the selected machine
(orchard sprayer) as an example for the evaluation method. The work will start with an
analisys of the methodology being used by the ENTAM network in Europe.
- chapter 6 Benefits: in this chapter a short review of benefits of the application of the new
evaluation method for innovation will be summarized with a clear focus for every
stakeholder in the process worldwide.
In this research work official documents will be provided by the ENTAM (European Network
for Testing Agricultural Machines) and will be used as well as some test results performed by
the Members Testing Stations. All data being used for the evaluation method are published in
the national web sites as well as in the web site of ENTAM with authorisation of manufacturers
that are the owners of outcoming data in a certification process.
In the conclusion to this brief preface the present work will also describe how other world areas
are putting their attention to the testing and certification activity as a system to upgrade the
general level if agricultural mechanisation and to evaluate the introduction of innovation.

6
2 AGRICULTURAL MACHINERY AND FOCUS ON SPRAYERS
As mentioned in the preface, agricultural machines are a key factor in the development of
agricultural mechanisation and are being used worldwide with different levels of technologies.
Worldwide there are million of machines being used in agriculture and typologies vary
according to the agricultural needs, traditions, investments etc. in the different world areas.
The world market of agricultural machines exceeds 100 billion Euros/year with a descrese
expected because of the fall of prices of the most important commodities in the farming sector.
The Food and Agriculture Organisation of the United Nations (FAO) calculated the Food Price
Index in April 2015 that was 20% below the value of one year before and this will have a
consequence on the sales of agricultural machines.
Concerning production of agricultural machines Europe and the NFTA area (Usa, Canada and
Mexico) total more than 50 % of world production as displayed in slide 1.
Figure 1 – Worldwide Production of Agricultural Machinery (Source VDMA, Germany).
Considering that the total value of world market is approx. 100 billion Euros it will be very
simple to consider the values of production and market in the different world areas comparing
the data displayed in figure 1.

7
In the near future new technologies are coming into the sector as the ISOBUS technology that is
a new global protocol. The ISOBUS was developed as a need of farmers often using tractors
from one brand with implements from another supplier and as long as they are using different
electronic systems each tractor and each implement combination required a specific terminal.
With the ISOBUS technology such inefficiency becomes the past by creating a new
standardized and compatible interface between tractor and every associated implement. The aim
is to have a plug and play system for every combination and just one ISOBUS terminal will
replace a multitude of terminals specific to single implements on the tractor. The new
technology of ISOBUS will simplify machines management for farmers and on the other hand it
will offer a system enabled to check and control all kind of data on the field including
traceability of the agricultural production.
Figure 2 - Example of ISOBUS application for the management of a wide range of agricultural machines (Source Teejet Co.).
The ISOBUS technology will influence the management of agriculture in the coming years
offering new important opportunities for users but also influencing the economics of the whole
sector. This technology has to be considered as a pillar of the precision farming and
hardware/software technologies will be the real new challenge. We already have a clear
demonstration of this new trend as we can see in all seminars or workshops dealing with this

8
matter where nowadays the big worldwide players as Microsoft, Google etc. are on the front line
while only twenty years ago it was a matter spoken only among agricultural engineers.
This is a clear example on how new technologies are influencing the primary sector and how it
is important to able to evaluate correctly their technical performances and even consequences on
the economic side. As mentioned in the preface the ISOBUS technology is a clear example of a
“significative change in existing products with benefits fo the market and its stakeholders”.
But how can we measure the performance of the new technology is another question and there is
the need for a new approach that is the main subject of this work. In the preface of this work we
have defined the innovation process and the results of innovation on the market. The definitions
are valid for every commercial sector and concerning agricultural machines we will take as an
example the air assisted sprayers as machines dealing with the human, the environment and the
food safety. These machines are being used worldwide and are quite simple on the construction
but special attention has to be put into the engineering because performances may be strictly
related to the quality and proper assembly of all parts and devises. The use of pesticides is a
key issue for many world areas because of their efficiency and potential damages to the
environment.
In the world approximately 2 billion people are engaged in agriculture and most of them use
pesticide for an estimated total of 3.000.000 tons of pesticides. In addition to that in many
countries there is a total lack of programs to control exposures.
Figure 3 - Pesticides being used worldwide (Source: Max Roser, 2015, Fertilizer and pesticide).

9
Altough there are befits related to the use of pesticides there are also many problems associated
with their use also because they do not remain in the same location where they have been
applied. They are mobile in the environment (through water, air etc.) and may come in contact
with other organism. Besides they may kill non-pest organism altering drastically the balance
of an ecosystem. Some statistics estimate in over 40.000 people being killed every year by
exposure to pesticides. Bioaccumulation is an important problem and it may occur when a
living body has not the capacity to remove them. Many synthetic pesticides are not able to be
broken down therefore when they enter a living body they are permanently stored. When a
body is consumed by a predator they are transferred into another body and so on. This process
is called “biomagnification”. A famous example of biomagnification is the use of a pesticide
known worldwide as DDT (dichlorodiphenyltrichloroethane). In this frame the previously
mentioned programmes of the European Union and together with the regulations on sustainable
use of pesticides have provided for a better use of those products including the machines
involved in the process that are known in agriculture as sprayers. The actions on sustainable
use of pesticides are an important effort towards a comprehensive approach that includes both
pesticides and machines by the legislator.
Figure 4 - Example of “biomagnification” showing how concentration may increase in the food chain.

10
The main actions of the sustainable use of pesticides can be summarized in the development by
countries of specific action plans that must include objectives and timetables to reduce risk and
impact of pesticide use, specific training for operators, information and awareness raising
programs, prohibition or severe limits to aerial spraying, minimising or bannig specific products
and, finally, the inspection of equipment in use to grant a proper efficient use of any plant
protection product. In this frame the new harmonized standard for inspection of pesticide
application equipment, the EN ISO 16122 (parts 1 to 4) are now cited in the documents. After
having a more clear view of the current situation worldwide it becomes very important that
machines are a fundamental part in the process of environment protection as well as of
agricultural productions safety and human safety (the three pillars of safety – Sandro Liberatori
G20 – OECD, Paris 2011). Therefore the process of evaluation of innovation will consider
those machines for their importance as an example.
Figure 5 - The three pillars of safety (Sandro Liberatori, G20 – OECD, Paris 2011 and Milano Expo Conference 2015).
In the world there is an estimation of some million sprayers using chemicals starting from the
most simple knapsack sprayers used in the small scale farming to the large self propelled
machines being used in the big farms and by farm contractors.
The main components of an air assisted sprayer are as follows: tank, pump, pressure regulators,
pressure gauges, control valves, manifolds, fan, spray nozzles. The tank is the part of the

11
machine containing the liquid (water + chemical) and should be corrosion resistant and designed
for easy filling and rapid drainage in order to facilitate cleaning. An important issue of the tank
is the agitation that should be sufficient to keep all materials uniformly distributed in every inner
part of the tank. The efficiency of the tank is very important and when pesticide formulations
are mixed with water they need a vigorous and efficient agitation provided by paddle or
propeller type mechanical agitators and jet hydraulic agitators. Settling of pesticides in the tank
may cause problems during use of the machine and reduce the pesticide efficiency.
Pumps are usually piston or centrifugal type units and the first are usually selected for high
pressure applications while centrifugal pumps move a high volume of liquid at low to medium
pressure. Pressure regulators are variable orifice devices that are opened or closed to change
system pressure. With air blast sprayers, pressure regulators are primarily used to divert varying
amounts of the pump output back to the tank. They are often referred to as pressure relief valves
or unloading valves. Actually spray output can be managed by pressure regulators on air blast
sprayers. Spray pressure is sometimes regulated by varying the pump speed too. It can also be
regulated by varying engine RPM. Accordingly, it is very important to maintain consistent
engine speed so the RPMs of the sprayer PTO remain in the range needed.
Figure 6 – The wide range of sprayers.
Pressure gauges are monitors of spray system operations; they alert the operator when a
malfunction has changed manifold pressure. Control valve can be an on/off valve but often they
provide for manifold selection option. They must always be mounted within easy reach of the
operator. Manifolds deliver spray to nozzles and generally allow a selective nozzle placement
to achieve the best spray pattern for the crop. Spray nozzles atomize the spray by specific
droplet size and number of droplets obtained from a given volume of liquid. The nozzle

12
location and type con influence the spray pattern and consequently the efficiency of distribution
on crops. Nozzles must be erosion protected and must be checked periodically to assure a
constant performance during time.
Fans are used in air assisted sprayers. The air stream function is transporting spray into crops
and enhancing uniformity of pesticide dispersion. It assures droplets velocity and the greater
velocity the greater the atomization. The air stream characteristics that influence coverage of
crops (fruits, foliage, wood etc.) include air volume (cubic meter per minute) and velocity
(meter per minute). These parameters depend on the fan type, speed, size and design.
Performance data on air speed at different heights is a very important parameter to evaluate an
air assisted orchard sprayer.
Figure 7 - Basic components of an air assisted sprayer (from Orchard sprayers of Paul E. Sumner).
Considering all the above mentioned aspects some national and international organisations have
developed methodologies in order to assess and evaluate performances and safety of machines
using chemicals together with actions to promote the maintenance of the performances during
time. It is very important to use sprayers with a good performance level in order to provide for
a uniform application on crops and avoid the use of excess of chemical that will not assure a
correct application but will develop damages to production and to the environment.
In this frame even a small component of the machine as the above mentioned agitator is very
important. The agitator is located inside the tank where the chemical diluted into water is
contained. It must assure a uniform percentage of chemical into the solution in every part of
the tank providing for a uniform application on the field of the pesticide being used. This

13
component is often a cheap component that can be easy replaced but it is fundamental to assure
a correct application on the field and can influence the whole performance of a very
sophisticated machine. Therefore an evaluation of the agitation and all its components becomes
very important in the overall evaluation of an agricultural sprayer. This is just an example on
how every part is important in the general testing and evaluation of a machine that will be used
by farmers.
Other aspects are important too as the energy efficiency that may consider the efficiency related
to the amount of pesticide being used as well as the energy absorption of the machine during its
work. These are jus extreme examples of how many aspects are important. All these aspects
have to be considered in testing methodologies. The purpose of testing methodologies is to put
all of them together with specific standard references in order to set up a correct testing
procedure that will state the real performance. The average real performance can then be used
in order to assess the state of the art of technology and evaluate the progress and the innovation
performance.

14
3 THE STANDARDISATION, TESTING AND CERTIFICATION PROCESS
In this chapter we will deal with certifications emphasizing the importance of a strong basis of
well defined standards that will allow the setting up of high level performing testing procedures
and consequent assessments of the products or processes being tested.
Growing globalisation requires technical standardisation as a well as common rules in order to
assure to all stakeholders a fair competition and trade. In this frame the development of
internationally approved and harmonized standards is essential. It is also essential to develop
internationally approved and harmonized testing and certification in order to guarantee the
whole process to all stakeholders.
A fair market where all stakeholders have the same guarantee is in line with the definition that
can be found in the World Trade Organisation (WTO) documents stating that the WTO “deals
with the global rules of trade between nations. Its main function is to ensure that trade flows as
smoothly, predictably and freely as possible”.
In this part of the work we will try to give an answer to the need of a smooth, predictably and
freely trade through a system based on the harmonisation of standardisation, testing and
certification.
We can imagine a global harmonisation with arbitrarily set regulations that could be used as an
excuse for protectionism. Therefore the WTO Agreement on TBT (Technical Barriers to
Trade) tries to ensure that regulations, standards, testing and certification procedures do not
create unnecessary obstacles, while also providing legitimate policy objectives such as the
protection of human health and safety, or the environment.
In this frame a good practice is to avoid unnecessary obstacles to international trade by making
regulations and conformity assessments procedures more transparent, open and predictable that
will benefit companies and countries with limited resources trying to meet the requirements of
their export markets. In the meantime they will assure for a fair competition.
Other international organisations provide for international regulations as the OECD Codes, that
are very important for agricultural machines. OECD Codes were created in the late 1950s/early
1960 and the number of participating countries has been constantly raising. The OECD Codes
and Schemes are open to any OECD or non-OECD country that is a Member of the United
Nations or of the WTO. The scopes of the OECD Codes and Schemes are to “simplify existing
international trade procedures, increase transparency, reduce technical barriers to trade,
contribute to international harmonization of standards, environmental protection and, to

15
increase market confiedence through enforcement of quality control and inspection procedures,
as well as the traceability of the traded products” as stated in the OECD official documents.
In this frame international certification differs from national certification, as domestic regulatory
systems may differ to a large extent. Thus a voluntary international system is a tool in which
different countries can benefit for specific product characteristics without having to change their
national framework. The benefits from product certification and guarantees are shared among all
stakeholders, consumers, producers, exporters and importers as well as public institutions.
In other words we can summarize benefits as the contribution to the reduction of technical
barriers to trade that particularly affect trade among developing and developed countries.
Joining such activities even emerging and developing countries can take the benefits of
globalization and penetrate properly global markets.
Actually OECD Codes and Schemes range from agricultural and forestry tractors to seeds, fuits
and vegetables and forestry.
The following chapters will define the meaning of standard, test and certification and then
summarize the benefits of considering them as single parts of a sequence in a whole process
offering benefits to all stakeholders.
It’s a common thinking that harmonised standardisation alone may offer a guarantee on a
product or a process but often there is the need for an assessment made by an independent third
party body. This assessment or certification has to follow well defined rules and has a double
benefit: the first is to assure the company asking for it that it has fulfilled all the requirements
and the second is related to the market that will recognize in the certification mark a guarantee
that the product or process is made in respect of all requirements. Of course in this process
large companies will be able to manage this assessment process by themselves but it is not
enough because in a globalized world it will always be possible that a declaration of standards
fulfilment is not perfect and the product will go on the market causing damages to all
stakeholders. We have some good examples for that and with the increase of the number of
global players there will be a higher risk that this may happen.

16
3.1 Standards.
Standards are defined by ISO as a “document that provides requirements, specifications,
guidelines or characteristics that can be used consistently to ensure that materials, processes
and services are fit for their purpose”. Besides the CEN adds “standards are created by
bringing together all interested parties such as manufacturers, consumers and regulators of a
particular material, product, process or service. All parties benefit from standardisation
through increased product safety and quality as well as lower transaction costs and prices”.
And more: “Standards are developed and defined through a process of sharing knowledge and
building consensus among technical experts nominated by interested parties and other
stakeholders – including businesses, consumers and environmental groups among other. The
formal definition of a standard is a “document”, established by consensus and approved by a
recognised body, that provides for common and repeated use, rules, guidelines or
characteristics for activities or their results, aimed at the achievement of the optimum degree of
order in a given context” as stated in the CEN web site.
These explanations offer a clear meaning of the importance of standards in every sector.
Standards are usually not mandatory unless called up in legislation or cited as part of a contract.
Legislation can refer to a standard as means of of compliance with regulatory requirements.
This means that compliance with the standard is recognised as a possible way of fulfilling
regulatory obligations. Other ways to comply with these obligations may be choosen but those
using the standard have the presumption of being in conformity with legal requirements. This is
the case of the Machine Directive in the European Union where a CEN standard substitutes
many different national standards. A major example and driver of the development of global
standards is the ISO that since the founding in 1946 has provided for thousands of standards
(more than 19.000). In 1987 the ISO developed a significant new path when it adopted the ISO
9000 standards of quality management. Afterwards many firms all over the world have chosen
to have their systems independently audited and certified. This situation made the ISO 9000
standards de facto the requirement for doing business in Europe as well as in other parts of the
world. Other examples are the European CEN standards system that provides for standards
generally harmonized with ISO standards and other national standards systems.
In this frame harmonized standards are unquestionably one of the most important prerequisite
for driving efficiencies in the industry but also for other stakeholders.
The CEN is very clear in summarizing the benefits (a similar list is on the ISO web site):
- for enterprises (there is a distinction between small and large enterprises but benefits are
almost the same): reduce business cost, open new export markets, improve products, attract new

17
customers, inspire added trust in the business, make products comparable, help business to be
more sustainable, improve the changes of success, disseminate and promote innovation, improve
product safety etc.;
- for trade associations and federations: inspire added trust in the business, disseminate and
promote innovation, improve products, comply with regulations, open the gate to global trade;
- for public sector: support and complement regulation, make lighter touch regulations possible,
support public policy, interoperability and accessibility, improve success in public procurement,
encourage research and innovation, simplify processes, build a better future for the economy,
open the doors to new markets and trade, improve protection for all;
- for consumers: protect the safety and health of the citizen, inspire confidence, integrate
sustainability, ensure accessibility.
All the above listed statements offer a clear idea of what standards are and the benefits they can
provide. The processes of standardisation are open and the time to define and approve a new
standard can differ depending on the agreement process it has to undergo.
Applying a standard to a product means that the product should be made according with the
standard’ requirements.
Even the process of setting up a standard can contribute to better understand the importance of
standardisation. When there is the need for a new standard risen by private or public
organisations as well as stakeholders specific technical committees meet and discuss all
technical issues being monitored by the technical board or similar of the standardisation
organisation. When the technical work is completed there is an evaluation and approval process
to be made that will change the proposal or draft standard into an official standard. Usually the
whole process can take many months/years before an official standard is issued according to the
approval by all participating organisations.
In this chapter we have briefly summarized the first part of the process including
standardisation, testing and then certification.
18
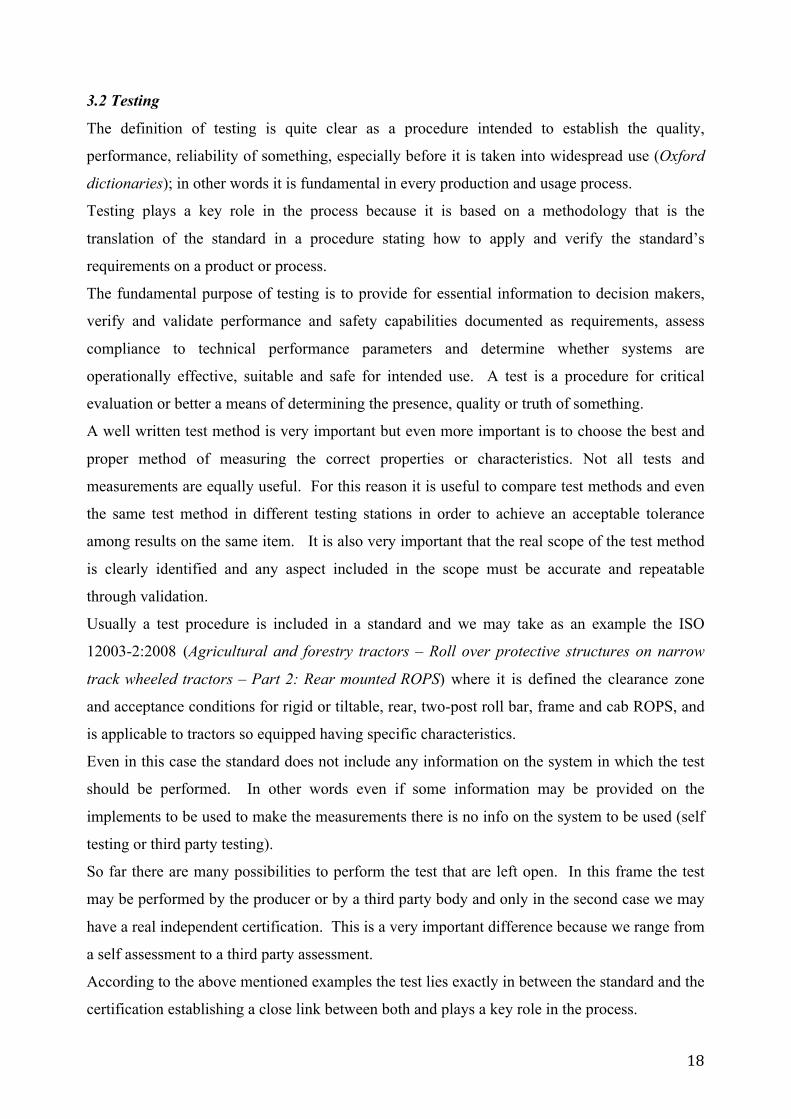
3.2 Testing
The definition of testing is quite clear as a procedure intended to establish the quality,
performance, reliability of something, especially before it is taken into widespread use (Oxford
dictionaries); in other words it is fundamental in every production and usage process.
Testing plays a key role in the process because it is based on a methodology that is the
translation of the standard in a procedure stating how to apply and verify the standard’s
requirements on a product or process.
The fundamental purpose of testing is to provide for essential information to decision makers,
verify and validate performance and safety capabilities documented as requirements, assess
compliance to technical performance parameters and determine whether systems are
operationally effective, suitable and safe for intended use. A test is a procedure for critical
evaluation or better a means of determining the presence, quality or truth of something.
A well written test method is very important but even more important is to choose the best and
proper method of measuring the correct properties or characteristics. Not all tests and
measurements are equally useful. For this reason it is useful to compare test methods and even
the same test method in different testing stations in order to achieve an acceptable tolerance
among results on the same item. It is also very important that the real scope of the test method
is clearly identified and any aspect included in the scope must be accurate and repeatable
through validation.
Usually a test procedure is included in a standard and we may take as an example the ISO
12003-2:2008 (Agricultural and forestry tractors – Roll over protective structures on narrow
track wheeled tractors – Part 2: Rear mounted ROPS) where it is defined the clearance zone
and acceptance conditions for rigid or tiltable, rear, two-post roll bar, frame and cab ROPS, and
is applicable to tractors so equipped having specific characteristics.
Even in this case the standard does not include any information on the system in which the test
should be performed. In other words even if some information may be provided on the
implements to be used to make the measurements there is no info on the system to be used (self
testing or third party testing).
So far there are many possibilities to perform the test that are left open. In this frame the test
may be performed by the producer or by a third party body and only in the second case we may
have a real independent certification. This is a very important difference because we range from
a self assessment to a third party assessment.
According to the above mentioned examples the test lies exactly in between the standard and the
certification establishing a close link between both and plays a key role in the process.

19
We may consider also the testing as a harmonized part of the process. Besides if testing is
performed on a different technical basis or in a different system (self testing or third party
testing) the result will have a different meaning or may have a different output.
This is the second part of the process but is totally useless without a good standardisation work
and an even good certification process offering clear regulations. Considering only a standard
and the relating tests is not sufficient to guarantee all stakeholders that everything has been
performed correctly because of too many variations that might arise during the process.
As we will state in the following chapters only a full system considering a certification
procedure can offer all guarantees of accuracy, precision, repeatability, reproducibility etc. in a
testing procedure not depending on the location or time it has been carried out.
In the examples that will be considered during the definition of some innovation performance
indexes we will use the methodologies for testing developed inside the ENTAM (European
network for testing Agricultural machines) network and being used in the network’s Member
countries. During the development of the ENTAM methodologies many problems had to be
solved; first the definition of common based test procedures because even if standards were
internationally recognised (ISO, CEN etc.) they didn’t consider test conditions and other
parameters. Those parameters had to be reconsidered together in order to develop clear test
conditions, instruments to be used, interpretation of results etc. and then the first version of the
ENTAM methodology was defined and finally approved by all Member countries. Even after
that results displayed many differences and then all Members decided to perform some “round
tests” in order to check the reasons for those differences in resulting test reports. After this
activity where everything was discussed, clarified and agreed it was assured that everything was
acting according to the common methodology (Annex 1). At present time the range of
differences in the results of an ENTAM testing activity are acceptable not depending on the time
and location of the test. This is the most important result gained in many years of activity
carried out by all Member countries assuring all stakeholders a complete assurance on the
products being tested.

20
3.3 Certification
The definition of certification is well stated in common dictionaries as “the forma procedure by
which an accredited body or authorized person or agency assesses and verifies (and attests in
writing by issuing a certificate) the attributes, characteristics, quality qualification or status of
individuals or organizations, goods or services, procedures or processes, or events or
situations, in accordance with established requirements or standards”. Furthermore ìn the ISO
web site the definition of certification is as follows: “the provision by an independent body of
written assurance (a certificate) that the product, service or system in question meets specific
requirements”. Besides, the same web site states that it “is not involved in the certification to
any of the standards it develops. Certification is performed by external certification bodies …”.
Besides it is useful to know that the ISO Committee on Conformity Assessment (CASCO) has
produced a number of standards that relate to the certification processes.
The certification is therefore the final act of a process that states officially the positive results of
the testing activity based on standards. Of course there are many certification bodies on the
market and the evaluation should prefer those that have an official accreditation that is a
confirmation of the competence. Accredited certification bodies can be found by accessing the
list of the national accreditation body in every country.
Even the certification process has to comply a well established procedure stated in international
standards and should be performed by an accredited certification body.
The procedure plays a key role in he process because it is the guarantee that everything has been
done according to official regulations and according to the interest of all stakeholders with no
prevalence. It also assures that everything part of the process has been performed with accuracy,
precision, repeatability, reproducibility etc. as mentioned in the previous chapter.
In order to offer all the above mentioned guarantee the accreditation body must be properly
accredited in order to be qualified to supply to the market reliable, credible and internationally
recognised certification. Accreditation certifies the quality of the work of a certification and
inspection body assessing the conformity of its management system and its competence against
internationally recognised requirements and standards, including legal obligations. Thus
accreditation is a guarantee of: impartiality, independence, correct behaviour and competence.
In other words, the accreditation process is the process assessing that the certification body is
capable of carrying out certification. Accreditation is not compulsory but it adds another level
of confidence as accredited means the certification body has been independently checked to
make sure it operates according to international standards. Besides with the accreditation the
whole process, including testing, is under strict control.

21
This is the third part of the process assessing that everything contained in the standard has been
checked with a positive result. Besides it assesses that the results are all obtained on the same
method and procedure making it possible to compare them. If we go back to the preface we can
prove that it is perfectly in line with the statements. Of course certification is a useful tool to
add credibility by demonstrating that a product or service meets expectations of customers as
well as for some industries it is a legal contractual agreement.
22
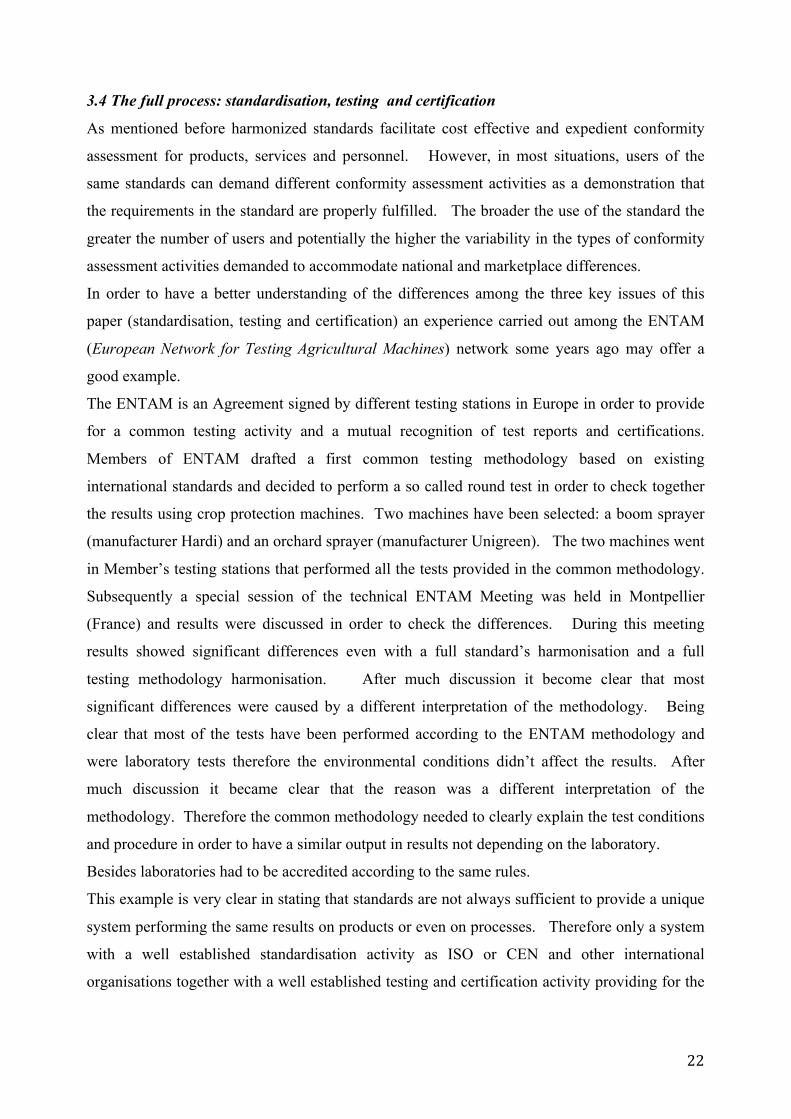
3.4 The full process: standardisation, testing and certification
As mentioned before harmonized standards facilitate cost effective and expedient conformity
assessment for products, services and personnel. However, in most situations, users of the
same standards can demand different conformity assessment activities as a demonstration that
the requirements in the standard are properly fulfilled. The broader the use of the standard the
greater the number of users and potentially the higher the variability in the types of conformity
assessment activities demanded to accommodate national and marketplace differences.
In order to have a better understanding of the differences among the three key issues of this
paper (standardisation, testing and certification) an experience carried out among the ENTAM
(European Network for Testing Agricultural Machines) network some years ago may offer a
good example.
The ENTAM is an Agreement signed by different testing stations in Europe in order to provide
for a common testing activity and a mutual recognition of test reports and certifications.
Members of ENTAM drafted a first common testing methodology based on existing
international standards and decided to perform a so called round test in order to check together
the results using crop protection machines. Two machines have been selected: a boom sprayer
(manufacturer Hardi) and an orchard sprayer (manufacturer Unigreen). The two machines went
in Member’s testing stations that performed all the tests provided in the common methodology.
Subsequently a special session of the technical ENTAM Meeting was held in Montpellier
(France) and results were discussed in order to check the differences. During this meeting
results showed significant differences even with a full standard’s harmonisation and a full
testing methodology harmonisation. After much discussion it become clear that most
significant differences were caused by a different interpretation of the methodology. Being
clear that most of the tests have been performed according to the ENTAM methodology and
were laboratory tests therefore the environmental conditions didn’t affect the results. After
much discussion it became clear that the reason was a different interpretation of the
methodology. Therefore the common methodology needed to clearly explain the test conditions
and procedure in order to have a similar output in results not depending on the laboratory.
Besides laboratories had to be accredited according to the same rules.
This example is very clear in stating that standards are not always sufficient to provide a unique
system performing the same results on products or even on processes. Therefore only a system
with a well established standardisation activity as ISO or CEN and other international
organisations together with a well established testing and certification activity providing for the

23
interpretation of standards can have as a result a high level system of quality and conformity
assurance.
The value of the system can be increased if everything is performed under the umbrella of an
intergovernmental organisation as the OECD Tractor Codes are.
Of course, in this frame harmonisation plays a very important role because if the standards are
different it will be impossible to have a common testing and certification.
Some support may come from some international agreements as we see in Europe where many
efforts are being made in order to facilitate intra-European trade by harmonizing regulatory
requirements. Even the WTO (World Trade Organisations) provided that where international
standards for technical requirements exist, Member states should use those standards as the basis
for their own technical requirements.
But in both cases referring only to the standard may not be enough because it may take to the
situation mentioned above related to the initial Entam activities. Only a full harmonized
process of standardisation, testing and certification can assure all involved parties as well as
Governments and all stakeholders. Besides it assures for a fair competition among companies
and countries too.
In this frame a number of factors are coming together in the global business environment to
cause the demand for standards and third party assurance services to explode. The role of
standardisation and certification is rapidly becoming so important that even in parts of the world
where the rule of regulations is weak it may be a good mechanism to regulate business. The
reason for this success is quite clear for buyers and for suppliers. Buyer firms not always have
the appropriate expertise and incentive to inspect products to be sure they meet specifications.
On the other side suppliers might have the necessary expertise unlikely to have the necessary
independence to inspect and certify their own factories. When companies are located in
different world areas and economic systems the assurance system based on common standards,
testing and certification can provide for trust among all involved parties in every step of the
process.
In this frame we have to distinguish a standard compliance based on a self declaration from a
standard compliance based on an official test and certification. An example of self declaration
is the Machine Directive that provides for the CE declaration made by the manufacturer. This
declaration is simply a self declaration and the process stops with the hypothesis of fulfilment of
standard’s requirement without any external third party assessment. In other words the value of
it is limited to the skills inside the producer. At the same time for the most dangerous machines
the Annex IV of the above mentioned Directive provides for a testing and certification. The

24
fact that for dangerous machines or components the self declaration is not enough is a clear
demonstration that an assessment (standard fulfilment + testing + certification) is necessary to
provide a full guarantee too.
A clear example may be offered by the agricultural and forestry tractor sector where different
standardisation systems are active. Even here harmonisation is very appreciated by all
stakeholders because it makes everything much easier for the already stated reasons. Different
systems may provide for more cost and less efficiency to all stakeholders including
Governments that are responsible for the homologation process. But the simple fulfilment of
standard’s requirements by manufacturers is not sufficient because of the many reasons already
explained (different interpretation, different approaches to the compliance process etc.) and this
becomes more important dealing with key safety aspects as for example the protective structure
for the operator. In these cases the process should be completed with a testing and certification
system offering to all manufacturers a fair competition ground and provide users safe machines.
Of course the process should not be a monopoly of one testing station but it should be open and
in this case the OECD (Organisation for Economic Co-operation and Development) is
providing for a well established system where all participating countries may provide for testing
stations and technical and procedural inputs to upgrade the process. The system is based on
common methodologies defined as Codes that are used by accredited testing stations to perform
tests on agricultural and forestry tractors. There are many accredited testing stations in
different countries operating on the basis of a free market. In addition there is an OECD
governed centre providing for the issue of certifications based on tests performed by the testing
stations.
The OECD tractor Codes concern the performance tests providing that all tested tractors must
complete compulsory tests of engine power output and fuel consumption, drawbar power output
and fuel consumption, hydraulic lift capacity. In addition there are measurements of the noise
level at the operator’s driving position and safety tests dealing with the Roll-Over Protective
Structures (ROPS) and Falling Object Protective Structures (FOPS). Special Meetings and the
possibility for every Member country to give inputs is assuring the system a high level of
transparency and competence.
Of course the process has to work as smooth as possible in order to not become an obstacle in
terms of time scheduling, cost etc. as it does at present time.
During the last years in the OECD Annual Meeting that is the formal meeting where problems
are discussed as well as all other issues that need a vote to be introduced in the OECD tractor
Codes the harmonisation process had a key role. More in detail there has been a discussion on

25
the roles of the different standardisation organisations and at the end a complete harmonisation
concerning standards content was achieved with full agreement of all Member countries. At the
same time it has been stated that if other organisations have the role to produce harmonised
standards the OECD has the role to develop and include harmonised standards into the Codes
and then into the testing/certification process assuring an added value to all stakeholders. This
is an important difference between a standardisation organisation and an organisation providing
also for a testing and certification process even in the case the standard contains information on
test procedures. The whole process is completed only by a testing and certification system that
is not provided by the standard.
Of course everything should always be made in a frame of standards harmonisation as
mentioned before and the value becomes much higher if the process is carried under the
umbrella of an international inter governmental organisation as the OECD.
This is a clear example of a complete system providing for the same competition floor to all
manufacturers and offering Governments a clear and fair system. The system will
automatically exclude unfair competitors leaving the floor only to fair manufacturers.
This is in line with the all the international agreements in trade and in line with the Governments
agreement to promote fair policies improving the economic and social well being of people
around the world.
Therefore a complete standard harmonisation among all involved institutions, public and/or
private, giving clear information to all stakeholders should operate in synergy with a testing and
certification system.
Fig. 8 - The whole process: Standardisation, Testing, Certification
STANDARDISATION+TESTING+CERTIFICATION
Itprovidesforthesamecompe11onfloortoallstakeholdersofferingGovernmentsaclearandfairsystem.
Isinlinewithinterna1onalAgreementstopromotefairpolicies
improvingtheeconomicsandsocialwell-beingforpeoplearoundtheworld

26
In conclusion a few words on how a certified product can be recognised in order to make
consumers aware on its added value. The recognition of a certified product can be achieved
through a proper marking carrying a specific logo assessing that the whole certification process
has been done with a positive result.
The marking is only the final visual recognition tool for certified products while a full test report
is the real proof of the results gained during the testing activity. The test report can contain a
lot of technical information and may be published in a reduced paper containing only the
important information/results for the consumers. Consumers will then be able to better choose
the most suitable product according to their needs and have a clear information on the added
value. Of course certified products are those who fulfilled all requirements during the testing
activity according to the contents of the methodologies being used and test reports display
detailed results. Those results may differ from one product to the other according to their
performances but all are above the limits stated in the methodology. A deep analysis of results
will show differences from one product to the other even if they fulfil the minimum
requirements and the average of results for every single test offers an idea of the state of the art
of the performance. Basing on this state of the art it will be possible to establish an index that
will be able to identify those results that are above a certain limit from the average and will
establish a new state of the art that can be defined as innovation. This argument will be
deepened in a specific chapter of this work with some examples.

27
3.5 Benefits
According to the content of the previous chapters it is quite clear that standardisation, testing
and certification are an enduring feature of the global business environment and may provide for
clear and immediate benefits to all stakeholders.
In the case of agricultural machinery where the use of different technologies as well as different
products coming from different areas of the world have to fulfil standards requirements only this
full process can assure all stakeholders and even Governments especially for their important
subsidy policies. Governments will be able to identify the best products and finalize their
policies.
In this work we’ve also described how standardisation of products and processes in conjunction
with testing and certification provides an important solution to the puzzle otherwise posed by
moving production out of firms and into hybrids, networks and global supply chains that may be
considered as “rule less” environments. In this context even traceability may be assured.
As mentioned before Governments have important subsidies policies worldwide for agriculture
and agricultural machines play a key role; therefore all subsidy policies should be oriented only
to products with a clear assessment of quality and standards compliance. This can be made only
through a well established and complete process of standardisation, testing and certification.
Besides, if this process is made under the umbrella of an international and intergovernmental
organisation as OECD does for the Tractor Codes, the ENTAM or the ANTAM network (Asian
Network for tsting Agricultural Machines) it is the best guarantee for all stakeholders that a fair
competition is under process and subsidies will be spent for good performing products.
Besides it is clear that basing on test results coming from an official certification activity it is
possible to obtain realistic information on the state of the art of technologies being used. With a
well defined state of the art data the process of identifying new technologies and innovation will
be easier through specific indexes that can monitor what is performing “much better” than the
overall average state of the art. In case of the mentioned subsidy policy, where innovation
plays always a key role it becomes very important to be able to identify and rank clearly
performances and consequently innovations in order to optimize all investments.
Actually in many situations the definition of innovation is made by groups of experts and their
opinion may vary according to their competences and knowledge. A system based on indexes
can help to build an independent evaluation process providing for clear information for experts
making their opinion more suitable to the real requirements of the sector being involved.

28
4 INDEXES IN THE EVALUATION PROCESS
In the previous chapters we have explained the importance of the whole certification process
with a focus on the fact that the results from the certification activity can provide useful
information in order to define a clear and realistic state of the art of performances related to
technologies being used. The average value of a certain performance has to be considered as
the state of the art because it is a value being calculated on a time defined basis. Then we need a
performance indicator that is a type of performance measurement to evaluate the success in
terms of innovation in terms of performance improvement. In case of test results coming form
a performance test on agricultural machines we will analyse them in order to provide a statistical
measure of how performance changes over time. This has to be related to a single measure but
we can also have a performance indicator (PI) defined as the result of the comparative analysis
of a performance measurement outcome. In this case we will have many information/test results
resulting from many testing activities to consider and performance indexing becomes a useful
performance management tool. In other words the real significance is to condense a great deal
of information into one number. This number is an index that is a statistical measure of how a
variable set of variables changes over time offering a quick and overall picture of performance.
The creation of an index is quite difficult because there is no set of formula or algorithm
generating indexes. However some concepts can be considered that apply to all indexes as the
need to design an index in order to fit a particular purpose and that the designing process
involves choosing the related indicators to be combined together in a manner supporting the
intended purpose of the index. In this work we will use a method based on determining
incremental changes in a number of indicators related to a baseline period of time and then
averaging these changes. The incremental changes will be referred to as “performance
relatives” (PR); for example as performance during a certain period relative to performance
during a set baseline period. In this case the index is not an absolute indicator but is meaningful
when tracked over time and compared to past performance but this is exactly what we want to
define, in further stage, the level of innovation. The averaging of changes will give a trend that
is the state of the art development year by year and it will be used as the basis for the innovation
evaluation. In fact when the trend gets an impulse making the average growth of the index
increase more than before there is an innovation input. The product being tested generating this
increase will be the key factor identifying it as innovation.
In the following chapters we will create indexes for a commonly used agricultural machine
identified as an air assisted sprayer described before in this work (chapter 4.1) then we will use

29
the new indexes (chapter 4.2) and finally relate it to a full evaluation process of innovation
(chapter 4.3). The final chapter will contain some examples of innovations as defined through
the indexing process as a full example of a well performing and realist evaluation of the
performance of innovation in an important sector of agricultural machinery as the sprayers are.
It will be just an example and the same model with a change in the rating of indexes to be more
suitable for other kind of machinery can be adopted in every sector of agricultural
mechanisation worldwide. It will give realistic date on the development of innovation for the
previously mentioned purposes related to the subsidy policies but also to be used as economic
parameters to check the performance and competition skills of a specific industrial sector.

30
4.1 Creation of indexes for the evaluation process
We have already mentioned the importance of sprayers worldwide in agriculture because of
their implication on the quality and security of food production as well as on the safety of
humans and of the environment. For these reasons inside the ENTAM network those machines
have been always considered as the most important. Besides, in some countries even in Europe
they have to be registered or checked before being put into the market because of their
implication on the environmental safety (Plant protection act in Germany etc.)
The ENTAM sprayers methodology is based on a common agreement on the standards to be
used and the testing procedure to be followed called ENTAM Methodology for sprayers. There
are different versions of the methodology according to the kind of sprayer to be used:
- ENTAM Nozzles methodology
- ENTAM Air assisted sprayers
- ENTAM Field crop sprayers
- ENTAM Knapsack sprayers
In Italy methodologies are being used by ENAMA (Ente Nazionale per la meccanizzazione
Agricola) that developed over 60 different methodologies for most typologies of agricultural
machines. Concerning sprayers ENAMA is performing tests in over than 20 years with a wide
database on the performances of those machines and their evolution by time.
We can consider for this work the methodology for air assisted sprayers that at present time is at
its 4th release: Technical Instructions for ENTAM-Test of Air assisted sprayers. The full text of
the methodology or technical instructions is included in Annex 1. The methodology has been
prepared in order to obtain a uniform testing according to CEN and ISO international standards.
The methodology provides for many tests and/or descriptions to be made by test engineers as
follows:
A – Tests made by measurements
- Pump (description and pump capacity);
- Spray thank (roughness of outside and inner surface, filling hole diameter, over volume,
strainer-minimum depth and mesh size, filling capacity, introduction bowle, volume of
total residual, tank content indicator, filling hole distances, agitator performance);
- Nozzles (characteristics and anti drip);
- Measuring systems (description and accuracy of measurements);
- Adjustment of the volume application rate (pressure adjustment devices, volume/hectare
adjustment devices, pressure drop);

31
- Distribution of liquid and air (flow rate, volume application rate, liquid flow rate:
left/right; air volume: measured/provided; air symmetry);
B – Tests made visually
- Safety requirements and/or measures;
- Spray tank (filling devices, opening lid, tank emptying, tank contents indicator);
- Auxiliary tanks (rinsing water tank, clean water tank);
- Hoses and lines;
- Filters;
- Nozzles (predetermined position nozzle output, measuring system, adjustment of the
volume application rate);
- Test adapters;
- Adjustment of liquid and air flow.
C – Additional reuirements
- Devices for cleaning crop protection product cans.
For this work we will consider the agitator performance because it is a very important test that
can influence the performance of the whole machine when working in the filed. The agitator has
the task to provide for a constant concentration of the chemical diluted into water in the sprayer
tank. The concentration has to be the same in every part of the tank. There are some standards
to use as reference for this test and they are: EN 12761-3:4 point 4.1.1.5 Mixing and ISO 5682-
2: point 7.9 Agitation. The chapter for this test is the following.
Agitator performance
Requirements
EN 12761-3: 4.1.1.5 Mixing
Tanks shall be equipped with devices (e.g. agitators) to ensure an even concentration of
mixture. The maximum allowable deviation is +/- 15% when tested in accordance with ISO
5682-2.
ISO 5682-1: 7.9 Agitation
Preliminary test
The agitator shall be tested using 1% suspension of copper oxychloride (see composition on ISO
5682-2 annex A). This concentration shall be called basis concentration. When test begins, the
tank shall be filled to the nominal capacity whilst agitating.
Special instruction for measurement

32
When preparing the test liquid to be filled in the tank it is recommended to use a filter mask and
gloves.
Before agitating shall be stopped, take two basis samples (>/= 30 ml) at three levels. The three
levels are: 5 cm below the level of nominal volume, 50 % of the height between tank ground
and level of nominal volume and 5 cm above the tank ground (this instruction differs from ISO
5682-2). Fig.7 shows an example of equipment for taking samples.
Fig.10 - Example of equipment for taking samples.
Each sample shall be assessed individually and the mean for each level shall be calculated.
The mean values of the three levels shall be between 0,95 % amd 1,05 %. If they are not within
this range, te test has to be repeated with more effective agitating.
The mean of all three levels shall be used as the basis concentration for the calculation of
deviation later on.
The samples can be analysed by a drying technique at a temperature between 105 °C and 110
°C.
Another technique, given the same values and accuracy, can be used.
Special directions for measurements
If salts and/or solids in the water are higher concentrated than 0,1 % this has to be taken in
consideration.
Sampling equipment should be positioned on the line linking the centre of the filling hole with
the suction area (fig. 10), when possible. Otherwise the sampling position shall be indicated in
the test report.

33
Before taking the first sample (basis concentration) agitate for 10 min with maximum agitator
capacity.
For sprayers equipped with more than one main tank, the measurement for the preliminary test
shall be carried out at each tank. The requirement is fulfilled when the average value of all
single tanks fulfil the requirement of +/- 15 %.
Fig. 12 - Position of the sampling equipment.
Re-agitating test
After the sampling period, the suspension shall be allowed to stand for 16 hours.
Then restart the agitating abd after 10 minutes, take two samples at the same three leves used in
ISO 5682-2: 7.9.1.
Concentration uniformity during the emptying process
Simulate empy-spraying of the tank by opening one of the spray feeders and connecting to a
valve which lets out the same amount of liquid as is applied by all nozzles together during
normal spraying. Close all other feeders.
The test pressure shall be the middle between minimum and maximum operating pressure
indicated by the manufacturer to the operator for the type of nozzle mounted on the sprayer.
If there are several nozzle sets, supposing the use of the nozzle set given the greatest amount of
spray liquid.
At the outlet of the spray feeder, take two samples at the beginning of the test and for the
sampling frequency indicated on the table below (tab.5 – of the methodology), until spraying is
finished.

34
Nominal capacity (l) Sampling frequency
up to 400 l 50 l
400 to 1.000 l 100 l
more than 1.000 l 200 l
Fig. .. Sampling frequency during the agitation test according to the main tank capacity.
The last sample is to be taken from the residue of the tank content.
Special directions for measurement
At the end of the 10 min re-agitation take the three samples from the three levels and then within
1 min start to empty the tank via the feeders and take the samples at the defined sampling levels.
At the beginning of the test, take the two samples 5 s after the first green coloured liquid flows
out of the outlet of the spray feeder.
The two samples from the residue of the tank content are to be taken at the outlet of the spray
feeder at the end of the test at the moment when the pump is sucking air for the first time,
changes its noise and the pressure drop of 25% becomes visible.
If the sprayer allows to switch off the agitator this should be done directly after the last but one
sample.
Instruction to determine the concentration of the sample
The concentration of the samples is stated by determining their content of solid matter. Shake
the samples and fill 20 ml of each into evaporating pans. Weight empty and filled pans
accurately to 1 mg. Dry samples in the pans at 105°C to 110°C in a hot air cabinet then suck
off the air. Cool samples down in the dessicator and weigh them again accurately to 1 mg.
Calculate the concentration as follows:
C: concentration
E: weight of the empty pan (mg)
F: weight of the filled pan (mg)
D: weight of the pan after drying
D - E C = ----------------------------- x 100
F - E

35
Considering the above stated procedure for the measurement of the performance of the agitator
in the tank we will take all the date of the testing activity performed in the last years and their
average will offer us a clear statement of the mean performance during time. Besides it will
show the progress made during time by technology.
In the following chart data are displayed concerning tested machines divided by year and at the
end of every year the averages and the variance on the average has been calculated in order to
evaluate the agitator’s performances of the tested machines.
minutes agitation
1997 1998 1999
2 86 81 77 77 85 75 70 76 74,51 77
4 96 88 90 87 97 82 81 85 82,24 78
6 97 92 94 90 97 87 87 92 87,2 81
8 98 96 99 95 97 87 89 96 86,53 84
10 96 95 100 96 98 90 89 97 90,14 86
Test in 1997, 1998, 1999 (total of 50 test results) considered samples after 2, 4, 6, 8 and 10
minutes of agitation in the tank. We have considered them too in the analysis. Then tests have
been performed according to the above described method. In the following tables test results of
the agitator performances have been divided in different periods ranging from 2 to 3 years each.
A total of 10 tanks (sprayers) have been considered for the period 1997 – 1999, a total of 14
tanks (sprayers) for the period 2001 – 2002, a total of 11 tanks (sprayers) for the period 2003 –
2005, a total of 9 tanks (sprayers) for the period 2006 – 2008 and finally a total of 15 tanks
(sprayers) for the period 2014 – 2015. Finally in the 18 years period 49 tests have been
considered and used for this work.

36
liters 2001 2002
0 93,20 87,81 90,79 109,60 105,60 107,20 90,80 98,39 98,00 87,81 86,50 89,60
200 90,10 87,69 89,42 102,80 100,60 106,90 92,10 100,73 100,00 87,69 87,50 97,10
400 91,90 88,24 89,79 96,30 98,60 100,70 92,30 99,27 98,00 88,24 89,00 93,20
600 91,00 89,09 91,28 90,90 93,50 97,90 93,50 99,22 102,00 89,09 88,00 92,60
800 94,10 89,30 92,87 88,20 92,30 94,90 94,70 99,67 104,00 90,60 88.70 93,10
1000 94,20 89,32 91,85 88,00 91,20 92,70 104,60 101,53 91,30 88,30 94,50
1200 95,40 90,59 91,75 87,20 87,90 87,10 99,19 92,10 90,20 90,59
1400 96,90 90,68 93,41 87,30 90.00 97,96 92,70 91,50
1600 96,00 92,01 92,70 86,20 87,90 99,12 94,50 91,40
1800 95,20 93,72 93,61 86,20 98,05 96,80 92,00
2000 94,80 100,79 91,57 85,30 99,24 97,50 91,60
2200 102,92 93,68 98,62 94,30
2400 105,95 96,36 100,94 96,80
2600 106,55 102,20 100,09 95,10
2800 112,21 103,47 98,44
3000 111,89 104,60 108,51
3200 107,30
3400 107,94
3600 110,40
3800 11,87
liters segue 2002 0 87,80 86,50
200 87,70 87,50
400 88,20 89,00
600 89,10 88,00
800 90,60 88,70
1000 91,30 88,30
1200 92,10 90,20
1400 92,70 91,50
1600 94,50 91,40
1800 96,80 92,00
2000 97,50 91,60
2200 94,30
2400 96,80
2600 95,10
Tables with test results from 2001 to 2002 (total 158 results).

37
liters 2003 2004 2005
0 99,90 100,10 99,40 88,80 90,67 92,27 88,00 85,98 85,71 90,10 95,50
200 97,30 96,80 96,50 90,79 90,51 92,20 90,00 89,89 88,86 90,30 94,40
400 97,80 97,50 98,20 92,47 91,92 94,85 94,82 94,26 92,74 91,40 95,10
600 100 100,50 100 94,45 90,82 92,25 93,00 101,86 96,71 93,30 96,10
800 93,90 100 99,90 97,56 90,90 89,84 93,00 95,01 99,00 94,50 98,90
1000 92,30 99,40 92,67 90,90 89,24 96,12 97,60 99,20
1200 91,30 91,29 90,32 89,30
1400 92,47 90,92
1600 91,29 87,60
1800 97,14
2000 89,58
2200
2400
2600
2800
Table with test results form 2003 to 2005 (total 74 results).
liters 2006 2007 2008
0 90,10 90,00 90,00 90,70 92,30 95,60 96,40 90,00 90,70
200 92,80 90,80 90,80 90,50 92,20 96,80 98,40 90,80 90,50
400 95,10 92,50 92,50 91,90 94,90 98,70 100,50 92,50 91,90
600 94,90 94,50 94,50 90,80 92,20 99,10 101,50 94,50 90,80
800 97,60 97,60 90,90 89,80 99,60 102,50 97,60 90,90
1000 92,70 92,70 90,90 89,20 100,70 103,60 92,70 90,90
1200 91,30 90,30 101,10 103,60 91,30
1400 92,50 90,90 102,20 104,60 92,50
1600 91,30 87,60 101,30 105,70 91,30
1800 97,10 102,60 105,70 92,50
2000 89,60 106,20 105,20 91,30
2200 108,60 105,20
2400 106,70
2600 107,80
2800 108,80
3000 113,00
Table with test results from 2006 to 2008 (total 81 results).

38
liters 2014 2015
0 92,13 90,50 90,97 87,40 94,50 92,20 88,80 88,10 89,44 88,69
200 91,70 92,00 90,90 90,20 95,80 92,90 92,90 89,20 92,66 92,31
400 96,19 91,70 90,65 97,00 95,10 93,10 92,80 92,30 93,00 93,98
600 96,08 96,60 95,88 96,00 97,70 94,60 96,50 94,52 95,39
800 96,87 96,80 95,89 94,60 89,20 97,30 103,50 94,67 94,20
1000 106,34 96,90 95,80 87,30 91,90 111,20 94,59 93,84
1200 97,00 95,21 95,31 94,46
1400 106,00 96,26 96,38 95,08
1600 108,20 96,52 97,00 95,05
1800 106,85 98,39 95,29
2000 107,32 100,79 95,71
2200 102,92 95,02
2400 98,51
2600 102,17
2800 107,94
3000
Table with test results from 2014 to 2008 (total 79 results).
Data from 2009 to 2013 are not included due to difficulties to get the results.
All above data (total 442 test results – analysed 295) have been processed in order to have a data
on the variance showing how data are spread out. As a first analysis of resulting variance we
have the following data (considered for measurements from 0 to 800 litres):
year range (n. of tests results) average variance
1997 – 1999 88,27 59,54751249
2001 – 2002 93,39 33,25459522
2003 – 2005 94,30 16,18622168
2006 – 2008 93,89 12,81556025
2014 – 2015 93,36 8,456346613

39
As a final comment we may assume that even if the average results are according to the
standards requirements technology has made it possible that the variance of results is reduced in
the last years compared to the 90’s where date had a high variance (59 compared to 8).
On the basis of the results we may have a graphic showing the decrease of variance according to
the new technologies.
Fig. 13 - The graphic shows how variance decreases with the introduction of new technologies.
In the following chapter we will consider how we can build an index to evaluate the introduction
of new technologies in the process. The approach will be described basing on the example
considered in this work on the agitator performance in sprayer’s tanks.
0,0010,0020,0030,0040,0050,0060,0070,00
1997-1999 2001-2002 2003-2005 2006-2008 2014-2015
Variance
Variance

40
4.2 Using indexes as a good practice
The use of indexes is a good practice for the evaluation of the performance of innovation is
quite simple to be applied. In the case of air assisted sprayers the testing methodologies
provide for a certain number of test to be performed (see Annex 1) and we have considered the
agitator performance. Of course the same procedure can be applied for every test collecting
resulting data to be displayed on a line stating the average improvement by time of the
performance. The average data resulting from every test will be defined according to single
data and a range of maximum and minimum and it will give us the state of the art of a certain
period of time. If there is a result performing much better than the maximum there will be clear
evidence that there is an innovative input.
We can explain better this concept using the data displayed in the previous chapter.
In the case of the agitator we can see from the figure in the previous chapter that the average
performance is always inside the limits stated in the methodology (averages from 88,27 to 94,30
thus inside the limit of +/- 15 % from 85%) and that with technological progress data are more
similar in every sample collected. In other words the concentration of the chemical seems to be
always the same providing for a uniform distribution in the fields. Providing for more details we
can see that the variance started from approx. 59,55 to approx. 33,25, then to approx. 16,19 and
finally to approx. 12,81 and 8,46. These data show clearly that the real performance of the
agitators has improved offering a very good concentration and consequent distribution on the
fields.
If we consider the period from 2003 to 2015 we see that the variance has moved from 16,19 to
8,46 and it means that there has been a decrease of 7,67 in 13 years with an average decrease of
0,59. Considering the average decrease (or improvement depending on the point of view) we
can state that a change in one year of 0,59 + 20 % can be defined as an important contribution to
innovation. In other words if a new technology is able to reduce the variance by 0,7 instead of
0,59 it will be innovative. The related index will be 0,118 (20% of 0,59).
An example can help to explain better the procedure considering the graphic in figure 13 where
we have the line indicating the decrease during time of the variance and at the same time with an
average reduction of 0,59 for every year. If an innovative device is able to perform much better
reducing the variance for more than 0,59 + 0,118 = 0,7 then it can be considered as innovative
and the line will take another angle.

41
Fig. 14 - The graphic shows the standard trend of industrial development of tank agitators in sprayers and the trend with the introduction of innovation.
In the figure we can see that the line of variance changes its angle in 2004 and it means that
there has been an important change in the variance because of the introduction of an innovative
device providing for a higher uniformity of test results and therefore reducing the resulting
variance. This innovative device will make it possible that the average variance decreases and
the mixture inside the sprayer’s tank becomes more uniform at different stages according to the
international standard described in the previous chapters.
This point defines exactly the introduction of innovation offering at the same time a clear
indication on the performance of the innovation. This last point is very important because with
this system we will be able to measure the improvement because the more the reduction of
variance is stated the more the innovation becomes important.
In this specific case we must also consider that the variance must be related to the minimum
percentage of uniformity stated by the standard that is 85% of the initial concentration with a
range of +/- 15 %.
Finally the perfect resulting system will provide for 85 % at every stage with a minimum of
variance.
0,0010,0020,0030,0040,0050,0060,0070,00
1997-1999 2001-2002 2003-2005 2006-2008 2014-2015
Variance
Variance

42
4.3 Testing and indexing as a full evaluation process
The procedure described in the previous chapter can be adopted for all tests being included in a
methodology offering a full evaluation for a machine considering every aspect that is important
for a daily use of the machine.
In the methodology there are some important elements to be considered as the spray tank
(roughness of outside and inner surface, filling hole diameter, over volume, strainer depth and
mesh size, filling capacity, introduction bowle, volume of total residual, tank content indicator,
filling hole distances, agitator performance), nozzles (anti drip), measuring systems (accuracy),
adjustment of the volume application rate (pressure adjustment devices, volume/hectare
adjustment devices, pressure drop), distribution of liquid and air (flow rate, volume application
rate, liquid flow rate, air volume, air symmetry) for a full evaluation of the machine. Of course
they do not include the safety aspects but only performances with the final aim to provide for
the chemical application on crops.
Considering all the mentioned elements we might attribute to each of them a value for the full
evaluation of the technological performance and eventually consider it as a machine with
substantial innovations. The value will consider the weight of the single test on the whole
performance of the machine. In this frame the most important parts of the machine are those
related with the distribution of pesticide on crops (distribution of liquid and air through nozzles)
that have to provide for a uniform and efficient application and the agitator in the tank for the
uniformity of chemical inside the liquid to be sprayed.
Less importance has been given to other parts and related tests of the machine that are more
important for the overall management as the filling hole, mesh size and many other as listed in
the table.
A possible ranking of tests according to the content of the ENTAM methodology to be
performed on agricultural sprayers could be as reported in the following table that shows in
percentage the weight for every single test:

43
Tests by measurements Weight % Total weight % Pump 8
pump 8 Spray tank 20
roughness of outside and inner surface 2 filling hole diameter 1
over volume 1 strainer – minimum depth and mesh size 1
filling capacity 1 introduction bowle 1
volume of total residual 1 tank contents indicators 1
filling hole distances 1 agitator performance 10
Nozzles 20 anti drip 20
Measuring system 4 accuracy of instruments 4
Adjustment of the volume application rate
10
pressure adjustment device 3 volume/hectare adjustment devices 4
pressure drop 3 Distribution of liquid and air 36
flow rate 4 volume application rate 10
liquid flow rate 4 air volume: left/right 10
air symmetry 8
Fig. 14 - Weight of each test on an agricultural sprayer.
Considering the above reported values if we apply the same procedure for the evaluation of
technology we can have a clear ranking of the state of innovation to the related machine.
We can see that the agitator used in this work influences only by approx. 10 % of the total
performance and is the most important component of the sprayer tank. A lot of research has
been done on the agitators considering that they are made generally by a small tube of plastic
with holes where the liquid has to flow and activate a turbolence inside the tank providing for a
continuous mixture of chemical and water.
The table offers also the possibility to weight all parts of the machine and consider their
influence on the overall performance.
44
In conclusion it is very important that for every test the variance is calculated on a wide
population of resulting data in order to define clearly the state of the art.
After that the creation of the index will be quite simple basing on the average trend of
performance and an added value that has been calculated in 20 % of variance reduction for the
agitator.

45
5 BENEFITS FOR STAKEHOLDERS
As mentioned in the preface a clear example of putting into practice the evaluation method will
be inside the National Rural Development Programme 2014 – 2020 (NRDP) for Italy. The
programme will outline the priorities for Italy for the use of approximately 2.14 billion € of
public expenditure (963 million € from the EU budget and 1.17 billion of national co-financing)
for the period from 2014 to 2020. The Rural Development Programme addresses thematic
areas relating to the farm risk prevention and management, conservation of farm breeds and
efficiency in the use of water resources. Support for the rural development is the so-called 2nd
Pillad of the common agricultural policy, providing Member States with EU funding to manage
nationally or regionally co-funded programmes. The new Rural Development regulation
provides for six economic, environmental and social priorities. Programmes propose clear
targets to be achieved. Moreover, in order to improve coordination and maximise synergies with
the other European Structural and Investment Funds (ESIF), it has been agreed with each
Member State a partnership agreement setting out its broad strategy for EU-funded structural
investment (for Italy it has been approved in 2014).
The NRDP is implemented through 22 RDP – 2 national and 21 regional – and in addition a
rural network programme supports activities of pooling and transfer of knowledge between the
different actors of rural development in Italy.
Italy covers an area of 301.337 km2 of which 92% is rural and the total population is 60,7
million of which almost 58% live in rural areas. The utilised agricultural area (UAA) is just
under 13 million hectares out of which almost 4 million (31%) are irrigable and almost 3 million
(21%) are irrigated. The average size of farms is 7,9 ha of total agricultural land; out of a total of
,6 million agricultural holdings, approximately 0,65 million have irrigable land.
To serve the RDP needs, 3 aspects were identified and selected in the context of the rural
development priorities:
- Food chain organisation, including processing and marketing of agricultural products,
animal welfare and risk management in agriculture – under this priority the RDP will
focus support on promoting the supply and use of risk management tools in agriculture.
In order to mitigate the risk of production in agriculture, it proposes to activate
throughout Italy 3 risk management tools: harvest insurance, mutual funds and income
stabilisation tool. It is expected that the RDP will provide support to more than 5% of
farms (90.000 farms).

46
- Restoring, preserving and enhancing ecosystems related to agriculture and forestry –
Under this priority the RDP will support the improvement of the genetic quality of
livestock and animal biodiversity. The programme seeks to encourage an innovative
system integrated livestock assistance based on cooperation and integration of functions
and competences of the different actors and bodies involved. The intervention will
concern 39 cattle breeds involved in the initiatives for biodiversity, corresponding to
100% of the Italian cattle breeds enrolled in the herd books and national registers.
- Resource efficiency and climate – Under this priority the RDP will support investment to
improve the efficient use of water resources through the irrigation infrastructure. The
programme pursues the objective of making more efficient use of water resource
encouraging the restructuring and modernisation. This will contribute to the
sustainability of agricultural production by romoting climate change adaptation and
mitigation. The area to be covered by more efficient irrigation system will be almost
400.000 hectares.
In this general frame we can deepen in one of the Regional Rural Development Programmes and
the Region of Umbria has been taken as an example. The RDP for Umbria was formally
adopted by the EU Commission on June 2015 outlining the Regional priorities for using the 877
million € of public money that will be available for the 7 year period (2014 – 2020) – 378
million € from the EU budget and 499 million € from the national co-funding.
Umbria's RDP is putting particular emphasis on actions related to restoring, preserving and
enhancing ecosystems, improving the competitiveness of the farm and forestry sectors and
promoting social inclusion and economic development in rural areas. Almost 42% of the
agricultural land is expected to come under management contracts supporting better water
management, nearly 29% of the agricultural land will be under contracts to improve soil
management and over 13% of the agricultural land and over 5% of forestry area will come under
management contracts supporting biodiversity. To improve the competitiveness of farmers, 1
200 farms will receive support to restructure or modernise their farms and 400 young farmers
will be granted business start-up aid. In this regard, particular emphasis is put on innovation
when selecting operations and 11% of RDP public expenditure is earmarked by actions that
foster innovation, cooperation and the development of the knowledge base. Umbria's RDP will
contribute to social inclusion and economic development in rural areas by bringing improved
services to 34% of the rural population and new or improved broadband infrastructure to 90% of
the rural population in rural areas.

47
Considering the general lines of the European programme the region Umbria will fund
operations under all Rural Development priorities with a particular emphasis on restoring,
preserving and enhancing ecosystems related to agriculture and forestry as well as improving
competitiveness of farms and prompting social inclusion and economic development in rural
areas.
If we analyse the focus of each priority we can see that innovation plays a key role and wehen
we consider agricultural machinery than this role becomes the most important in every selection.
In this general frame it is very clear that the evaluation method proposed with this work can
offer an independent, above parties and clear system for a well defined procedure to state what
is really innovative.
There are many products on the market with all kind of declared performances that only in some
situations meet the real field conditions that are the most important for farmers and for the
decision making bodies for financing. Therefore clear testing methods and clear evaluation
methods can offer the real situation to decision making bodies that will direct financing only to
well performing and innovative products offering farmers implements to improve their quality,
production and competitiveness in full respect of the environment. All this becomes more
important when we deal with machinery using chemical as sprayers are. In fact these machines
should be considered in more sectors of the RDP because of their close relation with the 3
pillars of safety: food, man and environment.
Fig. 15 - Sandro Liberatori, OECD, Paris, 2011.

48
6 CONCLUSION
This work has been a first approach to a new evaluation method for the performance of
innovation on agricultural machines as a useful tool for many purposes. Among them we can
consider the subsidies policies that are in many countries a key factor for the development of
agriculture as we have demonstrated with the data in the preface.
All above mentioned situations are only some examples that probably will contribute to the
development of the agricultural machinery industry and the whole agricultural sector that will
benefit from innovation. It will also offer a unique chance to decision makers to have a system
to evaluate the level of innovation and better make their selection and finalize contribution for
the purchase of new equipment. Besides innovation is and will be in the future the most
important as it is the act of bringing something new to the market that improves the range and
quality of products on offer.
In this work we have also considered the new RDP programmes for Italy and a specific Region
that provide for important subsidies policies for farmers even for the purchase of agricultural
machinery giving preference for innovative machines but there is no criteria
In this context it will be very important to consider the approach described in this work as a the
basis for future and more detailed works in order to define clearly a methodology for the
assessment of innovation.
This work has been a simple basis for a new approach and a clear demonstration that assessing
innovation is possible within a system based on real test results.

49
REFERENCES
- The nature and importance of innovation, Princeton University Press Release, 2014
- Summer P. E., Orchard Sprayers, Department of Agricultural & Biological Engineering,
University of Georgia U.S.A.
- VDMA Economic Report 2015
- Michael C.R. Alavania, 2010;
- Liberatori S. 2013, presentation UN-ESCAP/CSAM - The Asian and Pacific Network for
Testing of Agricultural Machinery (ANTAM);
- Liberatori S. 2015, Le Agroenergie come strumento di integrazione tra Agricoltura, Energia e
Ambiente – Politiche e strumenti di sviluppo sostenibile, EXPO Milano;
- Liberatori S. 2013, Standardisation, testing and certification together for a new combined
success, Club of Bologna, Hannover;
- Liberatori S. 2014, contributo alla stesura del Rapporto sulle tecnologie agricole Verdi,
Fondazione Symbola;
- Liberatori S. 2014, “The future of the Agricultural Mechanization in Asia and the Pacific”, 18th
World Congress of International Commission of Agricultural and Biosystem Engineering”,
Bejing, China;
- Liberatori S. et al., 2015, “The International role of Enama in improving safety of agricultural
machines – The international experience”, Lodi, 8th and 9th of September 2015;
- Liberatori S. ed al., 2015, “The International role of Enama in improving safety of agricultural
machines – The international experience”*, Rabat, Marocco, 16th of September 2015 * revised
version of the previous presentation;
- Liberatori S. et al. “The Italian system for the development of renewable energy in
agriculture”, Renewable Energy India, Noida, India, 23rd of September 2015;
- Liberatori S. et al., 2015, “Technical review of test reports”, 2nd ANTAM Annual Meeting, 3rd
– 5th of December 2015, New Delhi, India;
- Liberatori S. et al., 2015, “Technical review of ANTAM codes”, 2nd ANTAM Annual
Meeting, 3rd – 5th of December 2015, New Delhi, India;
- Liberatori S. et al., 2014 “The ENAMA experience in testing”, Tenth Session of the Technical
Committee (TC) of CSAM & Regional Workshop on Establishing a Regional Database of
Agricultural Mechanization in Asia and the Pacific, 17th of November 2014, Siam Reap,
Cambodia;

50
- ANTAM Technical Instruction for ENTAM-Test of Air Assisted Sprayers, ver. 4.0;
- ENAMA and DEIAFA Test Reports on agricultural sprayers;
- OAK Ridge Institute for Science and Education, U.S. Department of Energy;
- Oggero G., Balsari P., Marrucco P., Liberatori S., Limongelli R., 2014 “Certification” of the
inspection workshop activity: the necessary requirements”.

51
ANNEX 1 – Technical Instruction for ENTAM-TEST of Air Assisted Sprayers

Last review: 10.2010 (JKI)
Technical Instructions
for
ENTAM-Tests
of
Air Assisted Sprayers
(Rel. 4)

2
Purpose of the instruction This technical instruction is applied in the test of air assisted sprayers performed by test stations within the European Network for Testing Agricultural Machinery (ENTAM). The technical instruction has been prepared in order to obtain a uniform testing according to CEN and ISO standards. The technical instruction represent the ENTAM-methodology for testing air assisted sprayers. Changes since the previous version of this technical instruction are written in blue letters.

3
Contents
Page TESTS BY MEASUREMENT ....................................................................................5 Foreword.......................................................................................................................5 Pump.............................................................................................................................6
Pump capacity ..........................................................................................................6 Spray Tank....................................................................................................................6
Roughness of outside and inner surface ...................................................................6 Filling hole diameter.................................................................................................8 Over volume .............................................................................................................9 Strainer - minimum depth and mesh size .................................................................9 Filling capacity .......................................................................................................10 Introduction bowle..................................................................................................10 Volume of total residual .........................................................................................11 Tank contents indicator ..........................................................................................14 Filling hole distances..............................................................................................15 Agitator performance..............................................................................................16
Nozzles .......................................................................................................................20 Anti drip..................................................................................................................20
Measuring systems .....................................................................................................20 Accuracy of instruments.........................................................................................20
Adjustment of the volume application rate ................................................................20 Pressure adjustment devices ...................................................................................20 Volume/hectare adjustment devices .......................................................................21 Pressure drop ..........................................................................................................25
Distribution of liquid and air ......................................................................................26 Flow rate .................................................................................................................26 Volume application rate .........................................................................................27 Liquid flow rate: left/right ......................................................................................27 Air volume: measured/provided .............................................................................27 Air symmetry..........................................................................................................35
TESTS MADE VISUALLY.......................................................................................38 Safety requirements and/or measures .....................................................................38
Spray Tank..................................................................................................................41 Filling devices ........................................................................................................41 Opening lid .............................................................................................................42 Tank emptying........................................................................................................42 Tank contents indicator ..........................................................................................43
Auxiliary tanks ...........................................................................................................43 Rinsing water tank..................................................................................................43 Clean water tank .....................................................................................................43
Hoses and lines ...........................................................................................................44 Filters ..........................................................................................................................44 Nozzles .......................................................................................................................44
Predetermined position...........................................................................................44 Nozzle output..........................................................................................................44

4
Measuring systems................................................................................................... 45 Adjustment of the volume application rate.............................................................. 45
Test adapters ...............................................................................................................45 Adjustment of liquid and air flow ..............................................................................46 ADDITIONAL REQUIREMENTS ...........................................................................47
Devices for cleaning crop protection product cans ................................................47

5
TESTS BY MEASUREMENT
Foreword All the tests, where there are no specific directions, shall be made with the sprayer in normal operating conditions, following the recommendations given in the operator handbook. If nothing is said in the operators handbook make the test with the sprayer positioned on a horizontal and hard floor. The sprayer shall be levelled in longitudinal direction (by use of a level put on a part of the longitudinal frame, working platform or tank opening).

6
Pump
Pump capacity Requirements of ENTAM The pump capacity shall correspond to the intended use of the sprayer. Special directions for measurements The total flowrate of the pump at nominal speed (rpm) has to be measured in the sprayer at 5 equal increments within the pressure range of the sprayer. For measurement it shall be possible to connect a flow meter between the pump and the pressure regulator without damaging any hoses or removing the couplers from the hoses. Suitable adapters with 3/4″ or 1″ or 2″ hose socket shall be provided by the manufacturer/supplier. Spray Tank Roughness of outside and inner surface Requirements EN 12761-3: 4.1.1.1 Surfaces Depth of roughness of inner and outer walls of the tank shall be such that Rz ≤ 100 µm as specified in ISO 4287, and measured according to ISO 4288. ISO 4287: 4.1.3 Maximum height Rz of profile is the sum of height of the largest profile peak height Zp and the largest profile valley depth Zv within a sampling length (see Fig. 1).
Sampling Length
Zp
Zv
Rz
Fig. 1 Profile of roughness Note: In ISO 4287-1:1984, the Rz symbol was used to indicate the "ten point height of irregularities". In some countries there are surface roughness measuring instruments in use which measure the former Rz parameter. Therefore, care must be taken when using existing technical documents and drawings because differences between results obtained with different types of instruments are not always negligibly small. ISO 4288 Table 2 - Roughness sampling lengths for the measurement of Rz, Rv, Rp, Rc and Rt of non-periodic profiles (for example ground profiles).

7
Rz1) Rz1max.2)
µm
Roughness sampling lengthlr
mm
Roughness evaluation length ln
mm (0.025) < Rz, Rz1max. ≤ 0.1
0.1 < Rz, Rz1max. ≤ 0.5 0.5 < Rz, Rz1max. ≤ 10 10 < Rz, Rz1max. ≤ 50
50 < Rz, Rz1max. ≤ 200
0.08 0.25 0.8 2.5 8
0.4 1.25
4 12.5 40
1) Rz is used when measuring Rz, Rv, Rp, Rc and Rt. 2) Rz1max. is used only when measuring Rz1max., Rv1max., Rp1max., and Rc1max. Special directions for measurement. 1. Measurements shall be carried out on that part of the surface on which critical
values can be expected; this can be assessed by visual. The measurement should be done on clean parts of the inner and outer walls of the tank.
2. The measurement of the inner and outer roughness should be done at 10 different points each. The measuring points can be selected randomly. The result of no single measurement may exceed the limit of 100 µm.
3. The arithmetic mean (value) of the 10 single measurements (Rz10) has to be reported.
4. About the roughness of special parts of the tank (e. g. joint parts in the walls or corners or filaments not covered with resin) which obviously exceed the usual roughness of the walls and which can not be measured with the used instrument it shall be reported separately.

8
Filling hole diameter
Requirements EN 12761-3: 4.1.1.2 Filling The filling hole diameter shall comply with ISO 9357 (Tab. 1). ISO 9357: Table 1 - Tank nominal volume and filling hole diameter of agricultural sprayers
Nominal volume of tank1) (l)
Minimum diameter of filling hole (mm)
> 5 and < 100 100 100 150
150
200 300 400 500 600
200
700 800 900 1000
300
> 1000 300 1) The difference between total and nominal volumes
shall be 5% min (see Fig. 2). Special directions for measurement. The diameter shall be measured from the edge of the screwing, also if the screwing is a bayonet joint (Fig. 2). The diameter shall be measured in mm.
Level of total volume
Level of nominal volume
minimum 5 % of nominal volume
Filling hole diameter
Fig. 2 Filling hole diameter, levels of total and nominal volume

9
Over volume
Requirements EN 12761-3: 4.1.1.2 Filling The total tank volume shall be at least 5 % more than its nominal volume (see Fig. 2). Special directions for measurement. Make the test with the sprayer positioned on a horizontal and hard floor. The sprayer shall be levelled in longitudinal direction (by use of a level put on a part of the longitudinal frame, working platform or tank opening). It is recommended to measure the volume of the tank by weighing the poured in water (for calculation replace 1 kg of water by 1 litre of volume). The error of the measurement should not exceed 0.5 % of the measured value. If a flow meter has to be used its error has to be determined by use of a balance with the above mentioned accuracy and has to be considered. Strainer - minimum depth and mesh size Requirements EN 12761-3: 4.1.1.2 Filling Strainers shall have a minimum depth as given in table 2 and measured according to figure 3.
Tab. 2 Minimum depth of strainers
Nominal tank capacity
l
Minimum depth 1)
mm ≤ 150
> 150 and ≤ 400 > 400 and ≤ 600
> 600
60 100 150 250
1) measured from the upper edge of the strainer down to its bottom Strainers shall be installed in filling openings and shall have a mesh size (see Fig. 3) less than 2 mm. Also any gap(s) between the tank filling hole and the strainer shall not exceed 2 mm (see Fig. 3). Special directions for measurement see Fig. 3

10
Gap between filling holeand strainer
Depth of the strainer
Mesh size
Fig. 3 Mesh size and depth of strainers Filling capacity Requirements EN 12761-3: 4.1.1.2 Filling The filling capacity of the tank with strainer when filled with water shall be at least 100 l/min for tanks with a nominal volume of 100 l or more. For tanks with a nominal volume less than 100 l, it shall be possible to fill the tank within 1 minute. Introduction bowl Requirements EN 12761-3: 4.1.1.2 Filling Strainers of the chemical introduction bowl, if available, shall have a filter with a maximum mesh size of 20 mm (Fig. 4).
Web rips in thesucking hole ofan introductionbowl Maximum mesh width
Fig. 4 Filter in a chemical introduction bowl. Special directions for measurement. If it is too difficult or not possible to measure the mesh size you may use a ball with 20 mm diameter. This ball may not pass the sucking hole of the introduction bowl.

11
Volume of total residual
Requirements
Air assisted sprayers for bushes and tree crops
EN 12761-3: 4.1.1.3 Emptying The volume of total residual as defined in 2.1 ISO 13440: 1996 shall not exceed: - 4% of the nominal tank volume for a tank
volume less than 400 l; - 3% of the nominal tank volume for a tank
volume between 400 l (included) and 1000 l (included);
- 2% of the nominal tank volume for a tank volume more than 1000 l
The volume of the total residual shall be determined in accordance with ISO 13440.
Definitions ISO 13440: 2.1 volume of total residual Volume of the spray mixture remaining in the sprayer which cannot be delivered with the intended application rate and/or pressure, equal to the sum of the volume of residual tank and the dead volume. ISO 13440: 2.2 volume of residual in the tank; dilutable volume Part of the total residuals that remains in the tank or that can flow back to the tank during normal sprayer operation. ISO 13440: 2.3 dead volume; non dilutable volume Part of the total residual that cannot flow back to the tank during normal operation of the sprayer. ISO 13440: 2.4 horizontal position Normal operating position of the sprayer on level ground.
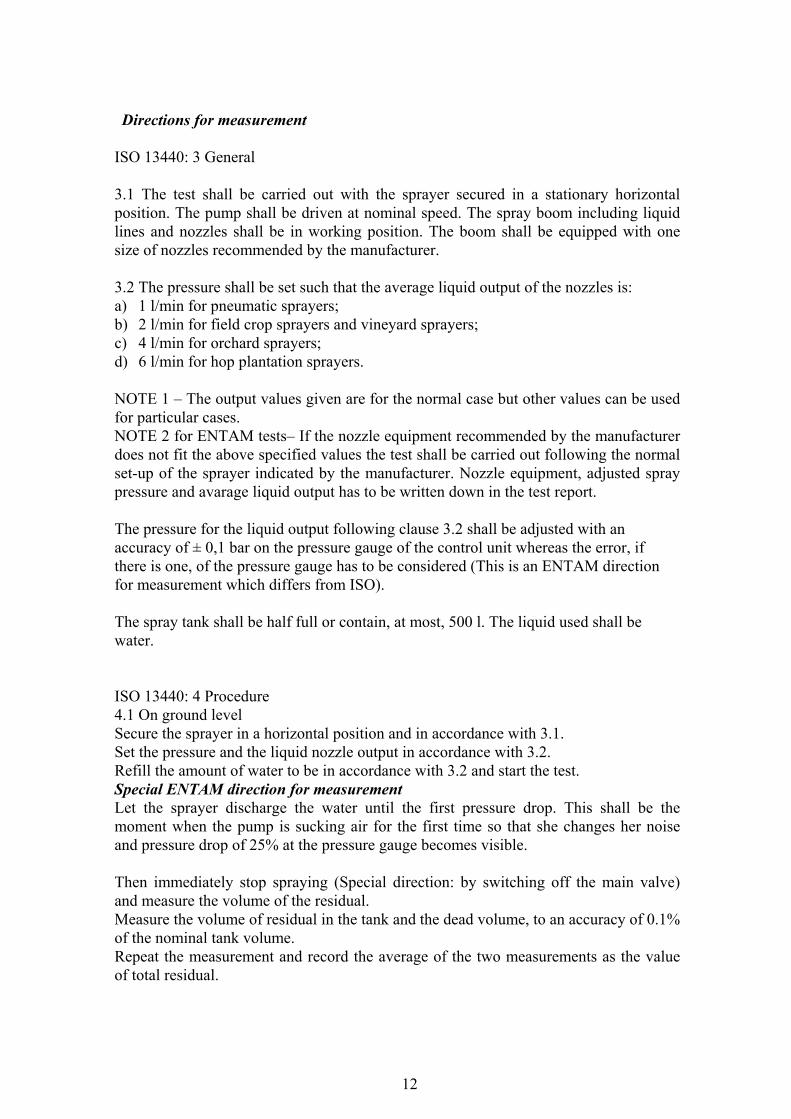
12
Directions for measurement
ISO 13440: 3 General 3.1 The test shall be carried out with the sprayer secured in a stationary horizontal position. The pump shall be driven at nominal speed. The spray boom including liquid lines and nozzles shall be in working position. The boom shall be equipped with one size of nozzles recommended by the manufacturer. 3.2 The pressure shall be set such that the average liquid output of the nozzles is: a) 1 l/min for pneumatic sprayers; b) 2 l/min for field crop sprayers and vineyard sprayers; c) 4 l/min for orchard sprayers; d) 6 l/min for hop plantation sprayers. NOTE 1 – The output values given are for the normal case but other values can be used for particular cases. NOTE 2 for ENTAM tests– If the nozzle equipment recommended by the manufacturer does not fit the above specified values the test shall be carried out following the normal set-up of the sprayer indicated by the manufacturer. Nozzle equipment, adjusted spray pressure and avarage liquid output has to be written down in the test report. The pressure for the liquid output following clause 3.2 shall be adjusted with an accuracy of ± 0,1 bar on the pressure gauge of the control unit whereas the error, if there is one, of the pressure gauge has to be considered (This is an ENTAM direction for measurement which differs from ISO). The spray tank shall be half full or contain, at most, 500 l. The liquid used shall be water. ISO 13440: 4 Procedure 4.1 On ground level Secure the sprayer in a horizontal position and in accordance with 3.1. Set the pressure and the liquid nozzle output in accordance with 3.2. Refill the amount of water to be in accordance with 3.2 and start the test. Special ENTAM direction for measurement Let the sprayer discharge the water until the first pressure drop. This shall be the moment when the pump is sucking air for the first time so that she changes her noise and pressure drop of 25% at the pressure gauge becomes visible. Then immediately stop spraying (Special direction: by switching off the main valve) and measure the volume of the residual. Measure the volume of residual in the tank and the dead volume, to an accuracy of 0.1% of the nominal tank volume. Repeat the measurement and record the average of the two measurements as the value of total residual.

13
For sprayers equipped with more than one main tank, the requirement has to be fulfiled
for the sum of the residuals of the single main tanks. NOTE – Alternatively, instead of measuring the volume of the residual, the sprayer can be weighed after the test and after the total discharge of the sprayer. The residual can then be calculated. 4.2 On slopes 4.2.1 8,5° slope The sprayer shall be inclined to the left and to the right, to the front and to the rear at an angle of 8,5° ± 0,5°. In each of these positions, determine the volume of residues in the tank and the dead volume as stipulated in 4.1. 4.2.2 Maximal slope Optionally, an additional determination can be performed at an angle corresponding to the maximum slope recommended by the manufacturer. Special directions for measurement Make test with sprayer in that operating condition which results in the smallest volume of total residual. That means, if the sprayer allows to switch off back flow and/or agitation, do this. The setting for the test has to be written down in the test report. The requirement has to be fulfiled for the sprayer under the conditions of ISO 13440: 4.2.1 or 4.2.2. In case of 4.2.2 the angle has to be mentioned in the manual and the test report. Example how to measure and calculate the different volumes of residual: 1. weigh the empty sprayer (A) 2. do the special test 3. weigh the sprayer with total residual (B) 4. empty all dilutable volume 5. weigh the sprayer inclusive non dilutable volume (C) Calculation: Volume of total residual = (B)-(A) Dilutable volume = (B)-(C) Non dilutable volume = (C)-(A) two repetitions in horizontal position are obligatory, for other positions two are recommended.

14
Tank contents indicator
Requirements EN 12761 – 3 4.1.1.4 The contents gauge scale shall be marked according to the table reported in ISO 9357 The acceptable tolerances of the level gauge are: a) +/- 7,5 % for each graduation mark for volumes up to 20 % of the nominal tank. b) +/- 5 % for each graduation mark for volumes above 20 % of the nominal tank
volume. ISO 9357: Extract from Table 1 Specifications for scale between marks for the contents gauge.
Nominal volume of tank1) (l) Contents gauge scale between two marks2) (l)
> 5 and < 100 1 100 150
25
200 300 400 500 600
50
700 800 900 1000
50
> 1000 100 1) The difference between total and nominal volumes shall be 5% min. 2) More detailed contents gauges are recommended.
Special directions for measurement Make the test with the sprayer positioned on a horizontal and hard floor. The sprayer shall be levelled in longitudinal direction (by use of a level put on a part of the longitudinal frame, working platform or tank opening). For measuring the tank content, first empty the sprayer then close the bottom valve of the tank. Fill the tank from mark to mark as indicated in the table above. Measure at these marks. (tank content = tank volume from bottom valve to upper edge of the filling hole). If there are several tank content indicators on the tank, all have to be tested. Follow the guideline about the method of reading the indicator which shall be reported in the sprayer’s instruction handbook. If nothing is reported in the instruction handbook follow the directions in Fig. 5.

15
Connectingline betweenthe middle ofthe needle tipand the axle
Indicator isthe liquidsurface
in a hoseIndicator isa cylinder
in an emptytube
Look to the indicator from the same height where you have to read it andkeep your eyes right-angled to the indicator.
Eye
Indicator isis the liquidsurface in a
hoseIndicator is a
dial gauge
Float
Fila
men
t
A ballhelps toindicatethe liquidsurface
Fig. 5 Reading of the contents gauge scale For sprayers equipped with more than one main tank and with the tanks hydraulically communicating with each other, the requirement of 7.5 % and 5.0 % have to be related to the sum of the single nominal tank contents if not, each tank shall be considered as a single tank.
Filling hole distances Requirements EN ISO 4254-6: 5.4.2 To limit the risk of exposure to chemicals during filling/cleaning operations: ⎯ a chemical induction bowl or equally effective device shall be provided with the
sprayer;
⎯ alternatively, the filling hole of the spray tank shall be so positioned that the height from the ground or platform is not more than 1 300 mm, with the horizontal reach between the rim of the hole and the outer edge of any part of the sprayer which could hinder the operator being not be more than 300 mm at the operator filling position. (Fig.6)
ENTAM special requirement Also induction bowls (induction hoppers) mounted at the sprayer have to fulfil Fig.6.

16
Fig. 6 Filling hole distances Agitator performance Requirements EN 12761-3: 4.1.1.5 Mixing Tanks shall be equipped with devices (e.g. agitators) to ensure an even concentration of mixture. The maximum allowable deviation is ± 15% when tested in accordance with ISO 5682-2. ISO 5682-2: 7.9 Agitation Definition Reference level: the level of the liquid for the nominal capacity of the tank in horizontal position of the sprayer. ISO 5682-2: 7.9.1 Preliminary test The agitator shall be tested using 1% suspension of copper oxychloride (see composition in ISO 5682-2 annex A). This concentration shall be called basis concentration. When test begins, the tank shall be filled to the nominal capacity whilst agitating. Special instruction for measurement When preparing the test liquid to be filled in the tank it is recommended to use a filter mask and gloves. Before agitating shall be stopped, take two basis samples (>/= 30 ml) at three levels. The three levels are: 5 cm below the level of nominal volume, 50 % of the height between tank ground and level of nominal volume, and 5 cm above the tank ground (This instruction differs from ISO 5682-2). Fig.7 shows an example of equipment for taking samples.
Height from theground or from
the 1300 mm max
300 mm max

17
AdjustableHolding Device
Vacuum Pump
Air Suction Tube
Test Liquid Suction Tube
To p Middle Bottom
Collecting Flask for TwoSamples
Top
Middle
Bottom
Level of Nominal Tank Volume
Fig. 7 Example of equipment for taking samples Each sample shall be assessed individually and the mean for each level shall be calculated. The mean values of the three levels shall be between 0.95 % and 1.05 %. If they are not within this range, the test has to be repeated with more effective agitating. The mean of all three levels shall be used as the basis concentration for the calculation of deviations later on. The samples can be analysed by a drying technique at a temperature between 105 and 110 °C. Another technique, given the same values and accuracy, can be used. Special directions for measurement If salts and/or solids in the water are higher concentrated than 0,1 % this has to be taken in consideration. should be positioned on the line linking the centre of the filling hole with the suction area (Fig. 8), when possible. Otherwise the sampling position shall be indicated in the test report. Before taking the first sample (basis concentration) agitate for 10 min with maximum agitator capacity. For sprayers equipped with more than one main tank, the measurement for the preliminary test shall be carried out at each tank. The requirement is fulfiled when the average value of all single tanks fulfil the requirement of ± 15 %.

18
5 cm
50% of the height
5 cm
filling hole
Level of nominal volume
suction area
Fig. 8 Position of the sampling equipment ISO 5682-2: 7.9.2 Re-agitating test After the sampling period, the suspension shall be allowed to stand for 16 h. Then restart the agitating and after 10 min, take two samples at the same three levels used in 7.9.1. ISO 5682-2: 7.9.3 Concentration uniformity during the emptying process Simulate empty-spraying of the tank by opening one of the spray feeders and connecting to a valve which lets out the same amount of liquid as is applied by all nozzles together during normal spraying. Close all other feeders. The test pressure shall be the middle between minimum and maximum operating pressure indicated by the manufacturer to the operator for the type of nozzle mounted on the sprayer. If there are several nozzle sets, supposing the use of the nozzle set given the greatest amount of spray liquid. At the outlet of the spray feeder, take two samples at the beginning of the test and for the sampling frequency indicated on the table below (Tab. 5), until spraying is finished.
Nominal capacity Sampling frequency up to 400 l 50 l
400 to 1000 l 100 l more than 1000 l 200 l
Tab. 5 Sampling frequency during the agitation test according to the main tank capacity. The last sample is to be taken from the residue of the tank content. Special directions for measurement At the end of the 10 min re-agitation take the 3 samples from the 3 levels and then

19
within 1 min start to empty the tank via the feeders and take the samples at the defined sampling levels.
At the beginning of the test, take the two samples 5 s after the first green coloured liquid flows out of the outlet of the spray feeder. The last two samples from the residue of the tank content are to be taken at the outlet of the spray feeder at the end of the test at the moment when the pump is sucking air for the first time, changes its noise and pressure drop of 25% at the pressure becomes visible. If the sprayer allows to switch off the agitator this should be done directly after the last but one sample. Instruction to determine the concentration of the samples The concentration of the samples is stated by determining their contents of solid matter. Shake samples and fill 20 ml of each into evaporating pans. Weigh empty and filled pans accurately to 1 mg. Dry samples in the pans at 105° to 110°C in a hot air cabinet, suck off the air. Cool samples down in the dessicator and weigh them again accurately to 1 mg. Calculate the concentration as follows: C: concentration in % E: weight of the empty pan (mg) F: weight of the filled pan D: weight of the pan after drying
100*EFEDC
−−
=

20
Nozzles
Anti drip Requirements of ENTAM When the spraying stop control has been activated, nozzles shall not drip; 5 s after the spray angle collapsed dripping shall have come to an end. Measuring systems Accuracy of instruments Requirements EN 12761-3: 4.1.5 On sprayers which shall be fitted with a pressure gauge complying with 4.6 of EN 907: 1997, the accuracy of the pressure gauge shall be: - ± 0.2 bar for working pressure between 1 bar (included) and 8 bar (included); - ± 0.5 bar for working pressure between 8 bar and 20 bar (included); - ± 1 bar for working pressure more than 20 bar. Special directions for measurement The pressure gauge has to be removed from the sprayer and connected to a measuring device with a calibrated pressure gauge. EN ISO4254-6:5.5 For analog pressure gauges, the minimum diameter of pressure gauge dial plate shall be: ⎯ 63 mm where the gauge is connected to controls and positioned within the hand
reach of the operator or between the plane formed by the hitch points of the three-point linkage and the tractor;
⎯ 100 mm in all other cases. Adjustment of the volume application rate EN 12761-3: 4.2 The maximum error for all the below measurements shall be ±2.5%. Pressure adjustment devices Requirements EN 12761-3: 4.2.1 Pressure adjustment devices shall maintain a constant working pressure at constant revolutions of the pump. After switching off and on the sprayer and its individual sections, the working pressure shall return to its original value within ±7.5%. This applies also if the pressure has been adjusted in the meantime.
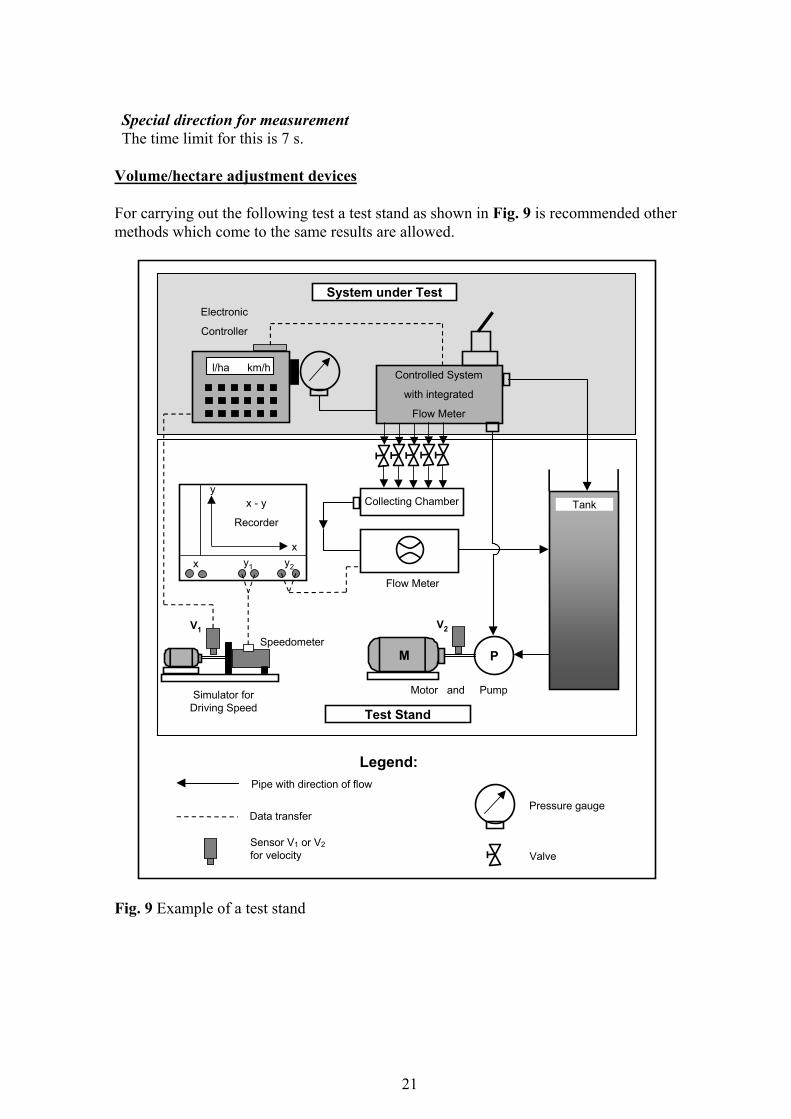
21
Special direction for measurement The time limit for this is 7 s.
Volume/hectare adjustment devices For carrying out the following test a test stand as shown in Fig. 9 is recommended other methods which come to the same results are allowed.
l/ha km/hControlled System
with integrated
Flow Meter
Electronic
Controller
Collecting Chamber
Flow Meter
M
Motor and Pump
P
Tank
V2
y
x
x - y
Recorder
x y1 y2
V1
System under Test
Test Stand
Legend:Pipe with direction of flow
Data transfer
Sensor V1 or V2for velocity
Pressure gauge
Valve
Speedometer
Simulator forDriving Speed
Fig. 9 Example of a test stand

22
Requirements EN 12761-3:4.2.2 Volume/hectare adjustment devices shall meet the following
requirements: a) Seven seconds after variations in operating conditions, the measured volume
application rate shall be within ± 10% of the mean volume application rate in the new constant operating condition.
Note: Changes in operating conditions are effected for instance by switching off nozzles, varying the speed and switching of sections of the spray boom. b) During repeated adjustments of the same volume application rate (l/ha), the
coefficient of variation calculated from 7 measurements shall not exceed 3%. c) Whilst spraying with constant P.T.O.-revolutions and at a constant driving speed,
the maximum deviation from the mean volume application rate (l/ha) shall not exceed 5%.
d) The acceptable deviation on the measured volume application rate (l/ha) or respective flowrate (l/min) from the values required are as follows: 1) ± 6% for the mean deviation and 2) 3% for the coefficient of variation.
The test of the volume/hectare adjustment system shall be carried out in accordance with ISO 5682-3. Requirement a) shall be checked according to 5.1 and 5.2 of ISO 5682-3 :1996. Requirements b), c) and d) shall be checked according to 5.3 of ISO 5682-3 :1996 ISO 5682-3:1996 3 Definitions For the purposes of this part of ISO 5682, the definitions given in ISQ 5681 and the following definition apply. 3.1 Volume/hectare adjustment system: Device which allows application, in liquid form, of a predetermined constant volume per hectare treated, of protection and/or fertilizing spray mixture independent of variation in the forward driving speed. NOTE – The different systems are classified as follows:
1) system controlled by the rotation of a power take off (PTO); 2) system controlled by the rotation of a land wheel; 3) system controlled by any other means.
4 Test conditions and apparatus General test conditions The general test conditions shall be those specified in IS 5682-2:1986, clause 6, and the specific conditions given in 4.2. 4.2 Specific test conditions

23
4.2.1 All measurements of the volume/hectare rate are carried out at the spray boom or
nozzle carrier using water as the test liquid. Measuring and recording shall continue until the system returns to a steady state condition. 4.2.2 At the start of the measurements defined in 5.1 and 5.2, the following conditions
shall be set on the sprayer: - driving speed: 2 m/s; - power take-off (PTO) rotational frequency: 400 min-1 - volume/hectare rate: 300 l/ha.
In case of other travelling speeds, nominal (PTO) rotational frequencies (for example at 1000 min-1 or non PTO gives rotational frequencies analogous to 540 min-1 are valid. 4.2.3 If hydraulic driven pumps are tested when integrated in the sprayer, variation of the speed is not necessary. 4.3 Test apparatus The standard pressure gauges and the stop-watch used for the tests shall meet the specifications of ISO 5682-1:1996, clause 5. 5 Test procedure The measurements shall be made under the conditions specified in 4.1 and 4.2 together with the conditions specified in 5.1, 5.2 and 5.3. Measure continuously the real volume/hectare rate and evaluate the duration(s) for which it deviates by more than 10 % from the mean volume/hectare rate in the steady state. The measurements in 5.1 and 5.2 shall be repeated twice. 5.1 Switching on and off the nozzle lines 5.1.1 Set the sprayer to the conditions specified in 4.2.2. Switch on the nozzle lines and make the measurements simultaneously. 5.1.2 Set the sprayer to the conditions specified in 4.2.2, then lower the driving speed to l.5 m/s and reduce the PTO rotational frequency to 300 min-1. Switch on the nozzle lines and make the measurements simultaneously. 5.1.3 Set the sprayer to the conditions specified in 4.2.2, then raise the driving speed to 2.5 m/s and raise the PTO rotational frequency to 500 min-1. Switch on the nozzle lines and make the measurements simultaneously. 5.1.4 Successively switch off boom sections except one, then switch them on again. Make the measurements simultaneously.

24
5.2 Speed variations
5.2.1 Power take-off (PTO) rotational frequency Change the PTO rotational frequency from at least 300 min-1 to 400 min-1 and then to 500 min-1 and then from 500 min-1 to 400 min-1 and then 300 min-1 in stages of five seconds each. Make the measurements simultaneously. 5.2.2 Driving speed Set the driving speed to at least 1,5 m/s, 2 m/s, 2,5 m/s, 2 m/s, 1,5 m/s and make the measurements simultaneously. 5.3 Resetting the volume/hectare rate Measure the volume/hectare rate as described below and calculate the coefficient of variation in accordance with clause 6. The equipment is operated at PTO rotational frequency of 500 min-1 and a driving speed of 2 m/s. Make the following two series of measurements seven times. Set and operate the equipment at a volume/hectare rate of 100 I/ha, or .the next highest value, then successively set it to 200 l/ha, 300 l/ha and 400 l/ha [1.st series of measurements (ascending)]. Set to 500 l/ha, or the next lowest value, then successively set it to 400 l/ha, 300 l/ha and 200 l/ha [2nd series of measurements (descending)]. Make measurements at volume/hectare rates of 200 l/ha, 300 l/ha and 400 l/ha for the ascending series and at 400 l/ha, 300 l/ha and 200 l/ha for the descending series respectively. When setting the volume/hectare rates, be careful not to exceed the required value to be set and to have to adjust the volume/hectare rate in the opposite direction. NOTE – If tables, diagrams or the operator’s manual, provide for a volume/hectare rate of less than 150 l/ha or greater than 450 l/ha, at a driving speed of 2 m/s, then both series of measurements should be reset to 150 l/ha 6 Calculation For each setting the coefficient of variation, CV, expressed as a percentage, is calculated as follows:
100xsCV ×=
where ( )
1ns
xxi2
−=
∑ −
X is the mean volume/hectare rate:

25
nX
X i∑=
xi is the i th value of volume/hectare rate: i = 1, 2, 3,... n is the measurement index (n = 7). The largest and smallest deviations, δmax and δmin respectively, expressed as percentages, are calculated as follows:
100x
xxmaxmax ×
−=δ
100x
xxminmin ×
−=δ
The mean deviation, ∆, expressed as a percentage, between mean volume/hectare rate,
x , and nominal volume/hectare rate, xnom is calculated as follows:
100x
xx
nom
nom ×−
=∆
Note: Settings/changes for measure the Volume/hectare rate (ISO 5682-3:1996, subclause 5.3) Pressure drop Requirements EN 12761-3: 4.2.3 The pressure drop between the measuring point for pressure on the air-assisted sprayer and the nozzle (including anti-drip device, if available) or the orifice plate shall not exceed 10% of the pressure shown on the pressure gauge.

26
Distribution of liquid and air
Flow rate Single nozzle output mounted at a sprayer Measured/provided EN 12761-3: 4.3 Distribution of liquid and air: 4.3.1 Liquid Requirements The flow rate of each nozzle shall not deviate more than 10% from the data given in the flow rate tables provided by the sprayer manufacturer. Single/mean EN 12761-3: 4.3 Distribution of liquid and air: 4.3.1 Liquid Requirements The flow rate of all nozzles with the same characteristics, for example nominal flow rate, type , etc. shall not deviate by more than 10% from the mean flow rate. ISO 5682-1: 4 Test liquids 4.1 Clean water, free from solids in suspension. ISO 5682-1: 5 Apparatus: 5.1.4 Measuring tube with dimensions compatible with the requirements of 7.1.3, or balance, for measuring the quantity of liquid collected. ISO 5682-1: 5 Apparatus: 5.1.5 Watch, with an accuracy of ±0.5 s. ISO 5682-1: 6 General test conditions: 6.2 Pressures During the test period, the pressure shall not vary by more than ±2.5% of the test pressure. The test pressures shall be stated in the test report. ISO 5682-1: 7.1.2 Use the test liquid described in 4.1. ISO 5682-1: 7.1.3 Measure, for each complete nozzle, the volume discharged at the pressure of 0.3 MPa (3 bar) with an error of less than 1%. The measuring time, measured with a watch (5.1.5) and with an error of less than 1 s, shall be greater than or equal to 60s. ISO 5682-1: 7.2.2 Perform the tests at the maximum and minimum pressure indicated by the manufacturer and at least two intermediate pressures. The differences between two consecutive pressures shall be less than or equal to 0.5 MPa (5 bar). Special directions for measurement The accuracy of the tubes shall be at least 10 ml; the accuracy of the balance shall be at least 1 g. Different measuring devices are allowed if their measuring error is less than 1% of the measured value.

27
Measure the volume discharged just at the minimum and maximum pressure indicated by the manufacturer and at least two intermediate pressures (0.3 MPa usually is too low for air-assisted sprayers). The pressure shall be adjusted with an accuracy of ± 0,1 bar with a calibrated pressure gauge connected to the ¼ '' inner thread according to ISO 4102: 1984 or with the pressure gauge of the control unit whereas the error, if there is one, of the pressure gauge has to be considered. Volume application rate Requirements EN 12761-3: 4.3 Distribution of liquid and air: 4.3.1 Liquid During spraying and independent of the volume of liquid in the tank, the measured volume application rate (l/ha) shall be within ±10% of the mean value calculated from 5 measurements. This shall be checked in accordance with ISO 5682-2. Liquid flow rate: left/right Requirements EN 12761-3: 4.3 Distribution of liquid and air: 4.3.1 Liquid The flow rate of the left and right sides shall be within 50% ± 5% of the total flow rate. These requirements for flow rate shall be checked with a measuring error of less than ± 2.5% of the true value. Air volume: measured/provided Requirements EN 12761-3: 4.3 Distribution of liquid and air: 4.3.2 Air The real output of the fan shall not deviate more than 10% from the nominal output. Special directions for measurement Air measurements shall be made according to the ISO 9898. ISO 9898 3 Test conditions 3.1 Setting of the sprayer Tests shall be done with the machine in order of work (grids, nozzles, deflectors, etc.).

28
3.2 Sprayer arrangements The deflector positions, the shapes and the orientation of the air outlet, the nozzle orientation and the other device modifying the air or the liquid distribution should be described in the report. Schematic diagrams and photographs can be used to describe the sprayer arrangement. 3.3 Sprayer environment A distance of at least 5 m, in the air velocity direction(s), should be free of obstacles. 3.4 PTO speed The test shall be done at least for the nominal PTO speed (540 min-1). 3.5 Sprayer gear box If the power transmission includes a device providing different speeds for the fan rotation, the tests should be done for all the gear box positions. The PTO speed and the different fan rotation speeds should be measured. 3.6 Fan swivelling blades For the sprayer’s fan equipped with a variable outlet, the tests should be done at least with the angle recommended by the manufacturer. Otherwise, the medium position of the adjustment range will be adopted for the test. 3.7 Variable with fan outlet For the sprayer equipped with a variable outlet, the tests should be done at least with the width recommended by the manufacturer. Otherwise, the central position or the nearest central position of the adjustment range will be adopted for the test. 3.8 Mounted sprayer equipped with an axial fan The height of the fan axis should be mentioned in the report. 5 Measurement of the flow rate 5.1 Reference Method A measuring chamber connected to two measuring tubes (as for example indicated in DIN 24163 Fans, performance testing) will be used as a general method to measure the air flow rate at the inlet or at the outlet of the single or multiple fans of the sprayer. For the basic arrangement of the chamber test stand see Fig. 12 and for the possible connections between the measuring chamber and the different types of air assisted sprayers see Figs. 13a to 13d.

29
6 5
4 3 2 1t
∆PS
∆PAI
Legend1-4 Measuring tube
1 Calibrated air intake2 Rectifier3 Auxiliary fan4 Connecting piece5 Measuring chamber6 Air-assisted sprayer
Fig. 12 Basic arrangement of the chamber test stand The chamber test stand shall have the following specifications. Its main parts are a tight chamber and, connected to it, two measuring tubes (measuring range of tube 1 with 900 mm diameter is 20000 to 110000 m3/h and for tube 2 with 450 mm diameter it is 2000 to 20000 m3/h). The dimensions of the chamber are: width = 4.60 m, length = 6.15 m and height = 3.70 m. One wall of the chamber is made from removable stays and metal plates and allows the sprayer to be connected with the chamber. The fan of the sprayer sucks the air volume out of the chamber and the same amount of air volume is blown into the chamber with the auxiliary fan of one of the measuring tubes. To make sure that the fan operates under the same conditions as outside in the field, its speed shall be controlled and the air flow rate of the auxiliary fan has to be adjusted to the flow rate of the tested fan. This is to be verified by the static pressure difference 0=∆ sP between measuring chamber and the ambient atmosphere. The pressure AIP∆ in the calibrated air intakes of the measuring tubes represents the air flow rate. The formulae to calculate the air flow rate from the pressure AIP∆ are for: Tube 1:
ρAI
vPq ∆
∗= 20.3203
Tube 2:
ρAI
vPq ∆
∗= 2883.88
where: vq is the flow rate expressed in m3/h;
AIP∆ is the pressure in the calibrated air intakes of the measuring tubes expressed in Pa;
ρ is the air density expressed in kg/m3.

30
2
1
3Legend1 Measuring chamber2 Sprayer3 Measuring tube
Fig. 13a Arrangement of an one way sucking air assisted sprayer in the measuring
chamber
1
2
3Legend
1 Measuring chamber2 Sprayer3 Measuring tube
Fig. 13b Arrangement to measure the half side air flow rate of an air assisted sprayer

31
2 1
3Legend1 Measuring chamber2 Sprayer3 Measuring tube
2
1
3Legend
1 Measuring chamber2 Sprayer3 Measuring tube
Figs. 13c and 13d Arrangement for a two way sucking air assisted sprayer in the
measuring chamber 5.2 Other methods 5.2.1 General The air flow rate of air assisted sprayers also can be measured at the intake or outlet side of the fan with different instruments for measuring the air velocity. Instruments could be Prandtl tubes, hot wire, small propeller anemometers or laser anemometer. In order to provide representative measurements of the air velocity in the cross section area, a minimum number of measuring points shall be taken (see 5.2.2 and 5.2.3). The flow rate shall be calculated by multiplying the air speed in the 90° cross section area by the cross section area of the wind flow. Obstacles like deflectors, nozzles or structural components of the fan shall be accounted for when the total cross area of the fan is calculated. For hot wire, small propeller anemometers and laser anemometers make sure that their measurements agree with Prandtl tube measurements. The number of measuring points to be taken in the cross section area will be the same as established for Prandtl tube measurements.

32
For each measurement point, a mean of air velocities for a minimum period of 10 s with a minimum of 100 data samples will be taken.
The higher dimension (length or diameter) of the head including the sensing device to be introduced into the air stream shall be less than 25 mm. The measuring error shall be less than 5%. With Prandtl tubes for each measuring point, air speed will be calculated by means of the following expression:
ρPv ∆∗
=2
where v is the air velocity expressed in m/s; P∆ is the differential pressure measured by means of the Prandtl tube expressed in
Pa; ρ is the air density expressed in kg/m3. To calculate the air density, the atmospheric pressure and the air temperature shall be measured. For the calculation, use the following expression:
Tp
∗= 348.0ρ
where ρ is the air density expressed in kg/m3; p is the atmospheric pressure expressed in mbar; T is the air temperature expressed in °K. 5.2.2 Measurement of air flow rate on the suction side of a fan The measurement should be done in a pipe connected to the suction side of the fan. In order not to influence the suction of the fan, the diameter of the pipe should be 1.5 times of the suction diameter of the fan. The length of the pipe should be at least 2 m. The measurement of the air velocity should be done with Prandtl tubes in a cross section of the pipe. ¾ of the pipe length away from the suction opening of the fan (see Fig. 14).
≈ 3/4 x LP
DF
LP ≥ 2 m
DP ≈
1.5
x D
F
12
3
4
Legend1 Air assisted sprayer2 Fan3 Pipe4 Cross-section for measurementDF Suction diameter of fanDP Diameter of the pipe connected to the fanLP Length of the pipe connected to the fan
Figure 14 – Measurement of air flow rate on the suction side of a fan

33
The measuring points in the cross section should be positioned on centroidal circles of 5 circular rings with uniform surface areas. There should be a t least three measuring
points (every 120°) on each centroidal circle (see Fig. 15). Circular rings are defined by using the following calculation formulas:
⎟⎠⎞
⎜⎝⎛−=ni
RRi 1
⎟⎠⎞
⎜⎝⎛ −
−−=ni
RYi
21211
Where iY are the distances between the pipe side and the measuring points;
iR are the radii of the circles; n is the total number of circular rings; i is the special number of circular ring.
R1
R2
R3
R4
R5
Y1
Y2
Y3
Y4
Y5
Legend• measuring points---- centroidal circles
Figure 15 – Cross-section for measuring, position of measuring points For different pipe diameters, divided into 5 circular rings (n = 5), the distances Y1 to Y5 between the pipe side and the measuring points on centroidal circles are calculated and shown in Table 1 ISO 9898.

34
Table 1 – Distances (mm) between the pipe side and the measuring points for different pipe diameters
Distances between the pipe side and measuring points Pipe diameter Y1 Y2 Y3 Y4 Y5
100 3 8 15 23 34 200 5 16 29 45 68 300 8 25 44 68 103 400 10 33 59 90 137 500 13 41 73 113 171 600 15 49 88 136 205 700 18 57 103 158 239 800 21 65 117 181 274 900 23 74 132 204 308 1000 26 82 146 226 342 1100 28 90 161 249 376 1200 31 98 176 271 410 1300 33 106 190 294 444 1400 36 114 205 317 479 1500 38 123 220 339 513
This method can also be used for measurements on the pressure side if there are circular shaped outlets. 5.2.3 Measurement of air flow rate on the outlet side of a fan For rectangular areas a rectangular grid of measuring points is recommended and the minimum number of measuring points shall be taken according to ISO 9898 table 2.

35
Table 2 – Definition of measuring points Dimension of cross-section
cm2
Type or shape of air outlet (inlet) Maximum area covered by each point
cm2/point
Minimum number of
measurement points
Point area / Total Outlet
area
< 100 • Single outlets on radial, axial or cross flow fans (ISO 13441
– 1 - 502.4) • Secondary outlets on axial fan
(ISO 13441 – 1 – 502.1)
5 20 >0.05
100 – 500 • Secondary outlets on axial fan (ISO 13441 – 1 – 502.1)
• Rectangular outlets on cross-flow fan (ISO 13441-1 –
502.5)
10 10 - 50 0.1 – 0.02
500 – 2000 • Main (ring) outlets on axial fan (ISO 13441-1 – 502.1)
• Rectangular outlets on axial fan, vertical deflectors (ISO
13441-1 – 502.2) • Rectangular outlet on cross-
flow fans (ISO 13441-1 – 502.5)
25 25 - 80 0.05 – 0.0125
2000 – 4000 • Main (ring) outlets on axial fan (ISO 13441-1 – 502.1)
• Rectangular outlets on axial fan, vertical deflectors (ISO
13441-1 – 502.2) Rectangular outlet on cross-flow
fans (ISO 13441-1 – 502.5)
50 40 - 80 0.025 – 0.0125
> 4000 • Rectangular outlets on axial fan, vertical deflectors (ISO
13441-1 – 502.2)
100 40 <0.025
> 4000 Pipes connected to the suction side (circle section)
250 16 <0.125
Air symmetry Requirements EN 12761-3: 4.3 Distribution of liquid and air: 4.3.2 Air It shall be possible to adjust the sprayer so that the maximum air velocity produced by the fan is symmetrical at the right and the left side. NOTE This requirement will be reviewed when results from the test method defined in ISO/DIS 9898: 1998 are available. Special directions for measurement Air measurements shall be made according to the ISO 9898. ISO 9898:

36
6 Measurement of the air velocity distribution at distance (static test) Scanning velocities and air flow direction at 0.50 m distance from the outlet (special
direction for multi row sprayers, see below). Displacement of the sprayer or the measuring sensors at a speed less than 1 cm/s. Measuring sensors for air flow direction could be vanes with angle decoder (for air velocity see ISO 9898 - 5.2.1). Velocity and direction also can be measured in combination by use of a 5-hole-Pitot-tube or a laser anemometer. In a static measurement on the vertical line with the maximum air velocity the air velocity in the flow direction and the flow direction shall be measured in 10 cm sections with 1 cm steps within 10 s. By reported temporal integration, the representative air velocity and air flow angle have to be evaluated and reported for each section (see example in Fig. 16).
Air velocity Height Left Right Mean Deviation (cm) (m/s) (m/s) (m/s) (%) 140 14.2 8.5 11.3 26 130 17.7 10.2 13.9 27 120 18.7 14.6 16.7 12 110 14.6 17.2 15.9 8 100 …
14.1 …
19.8 …
17.0 …
17 …
Angle Height Left Right Mean Deviation (cm) (°) (°) (°) (%) 150 55 41 48.0 7 140 50 43 46.5 4 130 52 45 48.5 4 120 51 46 48.5 2 110 48 44 46.0 2 100 45 41 43.0 2 90 40 38 39.0 1 …
Fig. 16 Example of a graph and data report about air flow direction and air velocity distribution at distance

37
Special ENTAM directions for measurement: Special directions for measurement of air speed on multi row sprayers with non
horizontal air outlets. For multi row sprayers with non horizontal air outlets (see scheme of air outlets for outer rows in fig. below), the measuring distance between single air outlet and measuring point shall be defined as follows:
Fig.17 Example scheme of multi row air assisted sprayer with non horizontal air outlets
for outer rows and horizontal arranged air outlets for inner rows
S
500 mm
ABCC
Fig.18 Diagram of position of imagined leaf wall surface
- Define an imagined leaf wall surface “S” in a horizontal distance of 500 mm
to the most outside positioned air outlet (A). - Adjust the angles of inclination of the other air outlets (B, C) according the
instruction handbook to this leaf wall distance. - Measure the air speed along the imagined leaf wall surface “S”. - For air symmetry, compare the outlets of one side with their counterpart at
the other sprayer side. - The requirement do not has to be fulfiled between the air outlets for different
rows on one side of the sprayer.

38
TESTS MADE VISUALLY
Safety requirements and/or measures EN ISO 4254-6: 5.1.3 The machine shall allow for handling and operating, including filling and maintenance, by an operator wearing adequate personal protective equipment as recommended in 7.1 f). EN ISO 4254-6: 5.12 It shall be possible to carry out servicing and maintenance operations on pumps and filters without causing leakage from the tank when it is filled to its nominal volume. This can be achieved by, for example, appropriate positioning of components, isolation by means of a tap, or the use of valves. See EN ISO 15811: 4.1 – 4.7 Note: Only the requirements listed directly in EN ISO 4254-6 have to be measured for an ENTAM test. In some cases EN ISO 4254-6 refers to requirements of other standards. Those requirements need not to be tested in an ENTAM test. EN ISO 4254-6: 5.2.1 The machine shall be designed to be stable as specified in ISO 4254-1:2008, 6.2.1. See also 7.1 k). EN ISO 4254-6: 5.2.2; Tab.2 Machines equipped with transport rollers for manual handling shall be designed so that they cannot tip-over. (Remark: procedure according EN ISO 4254-6: Table 2) ENTAM special requirement: (ENTAM-Note: requirement of EN 907 but not EN ISO 4254-6) This requirement does not apply to sprayers fitted with a centrifugal pump whose maximal pressure, whatever the output, cannot exceed 20 % of the allowable pressure of the circuit. EN ISO 4254-6: 5.6 The sprayer shall be provided with a safety device that prevents the pressure from exceeding the maximum working pressure of the circuit by more than 20 %. The adjustment of this safety device shall be protected against unauthorized or accidental modification. Its actuation shall not cause any spillage or leakage of liquid from the circuit. EN ISO 4254-6: 5.7

39
If a sprayer is equipped with a fan, the following requirements apply: ⎯ the fan shall be placed or protected so that when the sprayer is operating it shall
not be able to draw in or discharge foreign matter which could injure the operator;
⎯ access to the fan shall be prevented by fixed guards, which may be a combination of imperforate and mesh guards whose apertures conform to requirements of ISO 13857:2008, Tables 1, 3, 4 and 6;
⎯ when the fan drive is not controlled independently from the pump drive, it shall be possible to disengage the fan drive from the pump drive from the ground or from a platform.
EN ISO 4254-6: 5.8 For self-propelled sprayers equipped with a cab, hoses shall not be located in the sprayer cab. For self-propelled sprayers without a cab, hoses and their connecting devices shall be protected by imperforate screens, so that leakage cannot come into contact with the operator. All pressurized hoses shall be directly and durably marked with the maximum working pressure. The maximum working pressure of hoses and the maximum working pressure of connecting devices shall be at least equal to the maximum working pressure of the circuit [see also 7.1 n), 7.2.2 and 7.2.4]. (ENTAM remark: Requirment also specified in EN 12761-3: 4.1.1.2) Filling devices shall be designed to avoid any return of liquid from the tank to the filling supply. EN ISO 4254-6: 5.9 Each machine shall be equipped at the driver’s position with a manual spraying stop control device to safely stop the flow (e.g. by means of two valves placed in series). ENTAM special requirement: (ENTAM-Note: requirement of EN 907 but not EN ISO 4254-6) Manually operated spraying device Manually operated spraying devices (e.g. spray guns) shall be designed so that no inadvertent operation can occur (e.g. by a separate manually controlled latch or lock). They shall be lockable in the closed position and not lockable in the open position. EN ISO 4254-6: 7.1 and 7.2 An instruction handbook shall be provided by the manufacturer with each machine. Comprehensive instructions and information on all aspects of maintenance and the safe use of the machine, including suitable clothing and personal protective equipment (PPE) requirements, as well as the need for training, if necessary, shall be provided in the instruction handbook. Useful information for the drafting of the instruction handbook is given in ISO 3600 and in ISO 12100-2:2003, 6.5.

40
In particular, the following information shall be included (residual risks):
a) the restarting procedures for the machine after wintering; b) methods for adjusting the pressure; c) details of adjustments to be made to the sprayer when various nozzles are used; d) the folding/unfolding and transport procedures for the boom; e) the procedures to be followed for dealing with blocked nozzles and other
breakdowns in the field; f) a recommendation concerning precautions to be taken against contact with and/or
inhalation of hazardous chemicals, i.e. the installation of the sprayer on a tractor with a cabin fitted with air filtration, the wearing of personal protective equipment, the use of equipment facilitating the direct introduction of chemical products and liquid fertilizers into the tank, etc., at each of the following stages of use: ⎯ filling of the tank and adding of chemicals; ⎯ spraying; ⎯ adjustments; ⎯ draining and cleaning of the tank; ⎯ changing of chemicals; ⎯ servicing;
g) where applicable according to 5.3.1, information to the effect that mounted spray booms shall not be used in front of the tractor where there is no cab, and that the cab windows and doors are to be closed;
h) the hazards from entering the tank with the whole body; i) the need to ensure that no other person is standing near the machine, including near
the fan; j) information to the effect that the risk of unintentional contact with overhead power
lines possible during spraying operations (e.g. due to uneven ground or use of boom levelling devices), requires the operator to complete an analysis of the field in order to decide on the best working method — in particular for folding/unfolding operations during work process — before any spraying operation commences in the area to be sprayed by the machine;
k) the procedures to be followed for parking the machine; l) the precautions (particularly for limiting the propagation of contamination) to be
taken for the cleaning of the machine; m) instructions for winter storage of the sprayer; n) maximum working pressure of the circuit. In addition, the following points shall be emphasized (additional information for the
user): o) the requirement that any maintenance intervention, shall only be undertaken after
the parts of the sprayer involved have been cleaned of contamination; p) the instructions and specifications of the pump needed for safe replacement.

41
Marking General The marking shall comply with ISO 12100-2:2003, 6.4. All machines shall be marked legibly and indelibly with at least the information given in 7.2.2 to 7.2.4. Sprayers At least the following information shall be marked on sprayers: ⎯ the business name and full address of the manufacturer and, where applicable, his
authorized representative; ⎯ designation of the machinery; ⎯ year of construction; ⎯ designation of series or type; ⎯ serial number, if any; ⎯ maximum working pressure of circuit; ⎯ mass when empty; ⎯ laden mass; ⎯ nominal rotational frequency and direction of rotation of power input connection (marked by
an arrow), when applicable; ⎯ tank nominal volume; ⎯ nominal power in kilowatts (for self-propelled machines). In addition: ⎯ a warning placed near any spray tank opening of sufficient size to allow whole body
access, after removal of any detachable grating shall indicate the hazards of entering the tank;
⎯ a warning placed at the operator’s position — at the driver’s station for self-propelled machines, close to controls for other types of machines — shall draw attention to the risk of unintentional contact with overhead power lines;
⎯ a warning placed on the clean water tank shall indicate that it is to be filled only with clean water.
Pumps At least the following information shall be marked on pumps: ⎯ name and address of manufacturer; ⎯ serial number; ⎯ maximum pump pressure; ⎯ nominal frequency of rotation.
Hoses The maximum working pressure shall be marked on hoses. Spray Tank Filling devices Requirements EN 12761-3: 4.1.1.2 Filling devices shall be designed to avoid any return of liquid from the tank to the

42
filling supply.
Opening lid Requirements EN 12761-3: 4.1.1.2 The opening lid shall be tightly sealed to avoid spillage. Special directions for visual test Simulate the field test with the filled up spray tank (nominal tank capacity) attached or trailed by a tractor and slowing down and accelerating the driving speed. EN ISO 4254-6: 5.4.2 The lid shall be: ⎯ attached to the machine, e.g. by means of a chain;
⎯ fitted with a holding device ensuring a closed position either by means of a positive mechanical action or lids fixed by screwing;
⎯ fitted so as to prevent leakage of the spray mixture, e.g. by means of a seal.
The level of liquid shall be indicated to the operator during filling and emptying. The nominal volume of the tank shall be marked. A pressure-compensation device shall be fitted on tanks that are not designed to be put under pressure, in order to keep them at atmospheric pressure when emptying and filling. See also 7.1 b). Tank emptying Requirements EN 12761-3: 4.1.1.3 An emptying device in accordance with 4.5.3 of EN 907: 1997 shall allow the complete emptying of the residual in the tank when the sprayer is in a horizontal position. Complete emptying of the residual is achieved if there are no visible puddles at the bottom of the tank after 5 min drainage. It shall be possible to collect the liquid at the outlet without contaminating the operator or equipment parts, e.g. stays. The tank outlet shall be guarded against accidental opening.(e.g. by contact with branches in an orchard field or by ground contact.) Special direction for test After 5 min drainage, use a sponge to dry the bottom of the tank and weigh it before and after the test, so to determine the volume of liquid still present as residue.

43
Tank contents indicator Requirements EN 12761-3: 4.1.1.4 The indication of contents shall correspond to ISO 9357. It shall be durable and easily visible from the driver’s position and from where the tank is filled. Auxiliary tanks Rinsing water tank Requirements Pr EN 12761-3: 4.4 A water tank (or tanks) for rinsing the sprayer equipment shall be provided except on mounted sprayers of capacity less than or equal to 400 l. This tank shall not be combined with the clean water tank for the operator’s use (see 4.11 of EN 907: 1997). It shall have a volume of at least 10% of the nominal tank volume or at least 10 times the volume of residual which can be diluted (test by measurement, see 2.2 of ISO 13440: 1996)*. In the latter case, the volume of residual of tank shall be specified in the instruction handbook. Water tanks shall be designed so that they can be connected with the equipment in such a way that the rinsing of the pipes is possible even when the tank is filled to its nominal volume. In addition, the dilution of the volume of residual in the tank shall be possible. *ENTAM - special direction for test For ENTAM testing this requirement has to be measured and fulfiled for the residual in horizontal sprayer position. Clean water tank Requirements EN ISO 4254-6: 5.10 Sprayers shall be equipped with a clean water tank for the operator’s use (e.g. in case a person has been in contact with chemicals) having a minimum capacity of 15 l. This tank shall be totally isolated from the other parts of the machine and shall be fitted with a tap which can be easily opened without the use of a tool and without being continuously pressed. See also 7.2.2.

44
Hoses and lines
Requirements EN 12761-3: 4.1.2 The bending radius of hoses shall be within limits recommended by the hose manufacturer. Hoses shall not have any deformation which can disturb the liquid flow. Pressure lines shall be equipped with quick-acting shut-off valves (e. g. tip-over lever valves). Filters Requirements EN 12761-3: 4.1.3 Sprayers equipped with a positive displacement pump shall have a suction filter. On the pressure side, the liquid going on to the nozzles shall be filtered by means of central filters or filters in the lines of boom sections. The mesh size of filters shall correspond to the size of nozzles fitted on the sprayer. This applies also to nozzle and pump filters. Blockages shall be indicated to the driver, for example by an appropriate positioning of the central pressure filters and pressure gauge. Filters shall be easily accessible and filter insets shall be removable. For quick cleaning the filter tissue of the inset shall be easily accessible. It shall be possible, with the tank filled to its nominal volume, to clean central filters without any spray liquid leaking out except for that which may be present in the filter casing and suction or pressure lines. Nozzles Predetermined position Requirements EN 12761-3: 4.1.4 It shall be possible to fix nozzles in predetermined position, to ensure that the spray is correctly directed, by appropriate means such as marking, locking systems or patterns. Nozzle output Requirements EN 12761-3: 4.1.6 It shall be possible to measure the flow rate of each individual nozzle. In the case of multi-head nozzles, this requirement applies to each multi-head nozzle.

45
Measuring systems
Requirements EN 12761-3: 4.1.5 The working pressure, the volume application rate (in l/ha), where relevant, the adjustment controls and the tank volume indication shall be clearly readable from the driver’s position. Turning of the head and the upper body is tolerable. The pressure gauge shall be clearly readable. The pressure indication shall be stable. The scale of the pressure gauge shall be marked: - every 0.2 bar for working pressures less than 5 bar; - every 1.0 bar for working pressures between 5 bar (included) and 20 bar
(included); - every 2.0 bar for working pressures more than 20 bar. EN ISO 4254-6: 5.10 The gauge case shall be isolated from the spray mixture. Pressure exceeding the maximum working pressure shall be indicated — for example, on the analog pressure gauge by a red marking and on a digital instrument by an (audible or optical) indication initiated when the pressure reaches the maximum working pressure. Adjustment of the volume application rate Requirements of ENTAM Sufficient and easy readable dosage tables or diagrams must be permanently fitted to the sprayer. EN 12761-3: 4.2.4 Appropriate calibration aids (at least a measuring jar with a capacity of 1 l and an accuracy of 2.5%) shall be supplied with the sprayer. Test adapters Requirements EN 12761-3: 4.1.7 (Clause 1 is modified for ENTAM tests) When the measurement of nozzle output (see 4.1.6) is performed by collecting the liquid and when it is not possible to connect a ¾″ hose directly, the manufacturer/supplier shall provide sealing adapters. For the test of the equipment’s pressure gauge there shall be a connection with a 1/4″ inner thread according to ISO 4102: 1984. Otherwise the manufacturer/supplier shall provide a suitable adapter.

46
It shall be possible to connect a flow meter between the pump and the pressure regulator without damaging any hoses or removing the couplers from the hoses.
Suitable adapters with 3/4″ or 1″ or 2″ hose socket shall be provided by the manufacturer/supplier. Adjustment of liquid and air flow Requirements EN 12761-3: 4.1.8 It shall be possible to switch off the blower(s) independently from other driven part of the machine. It shall be possible to switch off the spray of each side of the sprayer independently. It shall be possible for one person to adjust the liquid and air-jets according to the respective crop type and height in a reproducible way, by appropriate means such as marking, locking systems or patterns. It shall be possible to switch each nozzle off and to adjust the direction of their spray independently. In the case of multi–head nozzles, this requirement applies to each multi-head nozzles.

47
ADDITIONAL REQUIREMENTS
Devices for cleaning crop protection product cans Requirements EN 12761-3: 7 Devices for cleaning crop protection product cans, when provided, shall be designed so that the volume of residue after cleaning is less than 0.01% of the nominal can volume. This requirement shall be checked according to Annex A.
NOTE: An example of a cleaning device that meets this requirement is given in Annex B.
The collection and transfer of rinsing water to the tank of the sprayer shall be possible. This requirement shall be checked visually. Annex A (normative) Test method for cleaning crop protection product cans A.1 Test procedure The test shall be carried out with a reference can conforming to A.2 and a reference product conforming to A.3. The reference can filled with the reference product shall be emptied directly before the test. Cleaning with the device to be tested shall! be carried out according to the manufacturer’s recommendations. The cleaning duration shall be a maximum of 30 s The residue of the reference product in the reference can shall be determined after the cleaning procedure using simple methods of analysis (for example photometry or titration). A.2 Reference can (see figure A.1) The reference can shall have a nominal volume of 10 l and shall correspond to figure A.1. The handle shall be squeezed off. In addition, it shall have the following characteristics: - Material: Polyethylene, non coloured. - Weight: 400 g + 20 g. - Maximum volume: 11 l + 0,2 l (at 20° C). The reference can shall be stable on even ground. It shall be free from dirt. A.3 Reference product Table A.1
Constituent Composition (%) polysaccharide (based on xanthan) 0,7
methyl cellulose 0,3 soda 0,2
bactericidal means of preservation 0,1 duasyn blue acid 0,1
water 98,6 NOTE: The constituents are known for example as: Rhodopol 23 (polysaccharide), Tylose H 300 (methyl cellulose) and Kobate C (bactericidal means of preservation)

48
227
180
R150R3
39B
A
0,4
0,8
0,6
1
A
B
R2
R110
R10
R4
R20
00
22.5°
4 6
R4R6R8
R10
R30R3
04°
19
6°
15
3683
142.3
310
313
A
162
R700
R10
R10050
256
375
± 2
375
± 3
R100
82
2.5
7.7 30
165
± 3
230 ± 3
50 ±
3
R50
0
R25
R48R8
R32
R350
50.0±0.5
55.5−0.3
60.0−0.5
28-0
.5+0
2 3- 0
.5+0
45°
6 1.3
Figure A.1 - Reference can
Dimensions in mm

49
Annex B (informative) Example of device for cleaning of crop protection product cans
B.1. General The device is described in figures B.1 to B.4 and specified by B.2 to B.5. B.2 Plate The plate on which the can is placed is be 30 mm width and 100 mm long (see figure B.2). The plate is designed so that the liquid flows out of the can freely. When the can is pressed down on the plate, the valve opens. Releasing the pressure closes the valve automatically. B.3 Nozzle pipe The dimensions of the nozzle pipe are as follows: Outside diameter: 20 mm Length (including nozzle): 180 mm B.4 Nozzle The rotating nozzle, see figure B.3, has the following characteristics: Output: 22 to 25 I/min at 3 bar Number of openings: 3 (flat spray) Distribution angle: > 300° (see figure A.3) Speed: 750 to 1 250 rpm at 3 bar Outside diameter: 38 mm B.5 Frame For flexible packaging ( e.g. bags, sacks ), a cone-shaped frame is used (see figure B.4). The frame is detachable.

50
e
d
f
c
1
2
3
4
5
Key
1 - Nozzle
2 - Nozzle pipe
3 - Plate
4 - Valve
5 - Tip
Figure B.1 - Cleaning device
c
b
23
Figure B.2 - Plate
Figure B.3 - Nozzle - 40
A-A
-e 20
-e 130
A A
-e 200
-e 250
-50
-175
-540
Figure B.4 - Frame
Dimensions in mm

52
ANNEX 2 – ENTAM Test Report

1
Sprayer type: Air Assisted Sprayer
Trade mark: SAE di A.Poltronieri & C. Sas
Model: TURBMATIC DEFENDER
MK2 DP 81/1000
Manufacturer: SAE di A.Poltronieri & C. Sas
Via Due Abeti, 17/A 44122 FERRARA - ITALY
Test report: 05.168
September 2015
ENTAM - Test Report

2
No. Contents Assesment
1 Spray tank surface roughness xxx
2 Spray tank overvolume x
3 Volume of total residual xxx
4 Spray tank content gauge up to 10% filling xx
5 Spray tank content gauge from 10% to 20% filling xx
6 Spray tank content gauge from 20% filling xx
7 Agitation system (deviation of even solution) x
8 Pressure drop between manometer and nozzles xx
9 Deviation of single nozzle output from tables xx
10 Accuracy of pressure gauge (max deviation) xx
11 Liquid flow rate left/right xxx
12 Rinsing water tank x
13 Cleaning system efficacy xx
14 Tank cleaning efficacy x
Note: The assessment keys are listed below. All detailed results are in the following test report.
No. unit x xx xxx No. unit x xx xxx
1 µm >70-100 30-70 <30 9 % >7-10 3-7 <3
2 % 5-8 >8-12 >12 10 bar >0.10-0.20 >0.05-0.10 0.00-0.05
3 of allow. value
>2/3-3/3 1/3-2/3 <1/3 11 % 4-5 2-4 0-2
4 % 15-10 10-5 <5 12 multiple of residual
10-12 >12-14 >14
5 % 7.5-5.0 5.0-2.5 <2.5 % nominal volume
10-12 >12-15 >15
6 % 5.0-4.0 <4.0-2.0
<2.0 13 % 99.75-99.80 99.80-99.90 > 99.90
7 % >10-15 5-10 <5 14 % 80-85 >85-90 >90
8 % >7-10 3-7 <3
Assessment table
Free download of the complete test report under: www.ENTAM.net or: www.ENAMA.it

3
Dimensions and weights
lenght (mm) width (mm)
max height (mm)
tank height (mm)
empty weight (kg)
total weight (kg)
3220 1180 1350 1300 530 1682
Technical data of sprayer

4
The implement is a trailed sprayer for use on orchard crops. The sprayer is attached to the tractor via the towing hook. The machine frame is made out of hot galvanised steel, the main and auxiliary tanks are made out of polyethylene. The main tank is equipped with two gauges, one on the front right and the other on the left side. The liquid level is indicated by a transparent external tube with float. Agitation is via hydraulic stirrers located at the back of the tank. The tank is completely emptied using a valve located on the left side. Access to the main tank if directly from the ground. The rinsing water tank is located in longitudinal central position to limit the roll and to ensure the stability of the machine even with the main tank empty. The implement is powered via the tractor PTO having a rated power of 540 rpm. The implement is endowed with a piston-diaphragm pump located in an ad hoc space in the front section of the main tank. Pressure regulation and liquid dispensing are controlled using electrically operated controls that can be placed in the tractor cab. There are 2 filters: one suction filter, which can be inspected even if the main tank is full, and one discharge filter. The pressure gauge for checking operating pressure is positioned on the front of the main tank. It has a diameter of 100 mm, end scale of 60 bar and is in intervals of 1 bar. Liquid is sprayed under pressure, while drops are conveyed via an airflow generated by an axial fan (no.11 blades) with front suction (between the tank and the fan unit) and with tower conveyor. To regularize the air flow of the outgoing is an against fan fixed with 12 blades. The speed of rotation of the fan may be modified via a 2-speed gear (+ disengagement). It is possible to interrupt the air flow on one of the two dispensing sides by means of bulkheads that are moved electrically. Nozzle holder units, endowed with membrane antidrip devices, are located outside the air outlet section. Each nozzle can be placed and closed singly to adjust the distribution profile in relation to the vegetation being treated.
Description of sprayer

5
The strainer basket filters located on the openings of the main tank contain a bottle washing device and a powder mixer. The main tank is equipped with an internal washing system using a rotary nozzle. On the right side of the machine is a spray gun for washing the outside of the machine.
Lateral view Control panel
Distribution unit with adjustable nozzles Air closure on the left side

6
Air velocity measured 0.50 m from outlet
I - 1890 rpm
Residual (l)
in the tank
horizontal
with back flow - with agitation 2,00
with back flow - without agitation --
without back flow - without agitation 0,10
inclined to right 0,10
inclined to left 0,10
inclined to rear 2,90
inclined to front 0,20
in the hoses: dilutable 4,40
dilutable residual 1 7,30
in the hoses: non dilutable 2 0,70
total residual 8,00
Liquid that can flow back into the main tank and can be diluted by the washing tank contentsLiquid that not can flow back into the main tankPosition at which the rinsing water tank is too small
1
2
*
Pressure gauge Fan
flow rate* power needed
distance between mark 0,10 bar I 27600 m3/h 10,1 kW
accuracy 0,10 bar II 38600 m3/h 19,4 kW* measured follow ISO 9898 point 5.2.3 indication
Main results of functional test

7
Distribution of liquid measured with row spacing of 2.0 m
I - 1890 rpm
Testing takes place according to the Technical Instructions for ENTAM-Tests of air assisted sprayers (release 3). This procedure was developed by the competent testing authorities of the European countries participating in ENTAM and is based on the CEN standard EN ISO 16119-3 “Agricultural and forestry machinery – Environmental requirements for sprayers – Part 3: Sprayers for bush and tree crops“. This test is only a technical performance test which takes place without an accompanying field test. The test results apply only to the tested appurtenances of the sprayer. Statements on the behaviour of the sprayer with different appurtenances cannot be derived from these results.
Explanation on testing

8
CMA - Administració de la Generalitat de Catalunya, Centre de Mecanització Agrària –
SPAIN EPHP005/15
FJ-BLT HBLFA Francisco Josephinum Wieselburg - Biomass, Logistics, Technology –
AUSTRIA 040/15
IRSTEA - Institut National de Recherche en Sciences et Technologies pour l'Environnement
et l'Agriculture (formerly CEMAGREF) – FRANCE
IRSTEA/ CEMAGREF/ ENTAM/15/
017
JKI - Julius Kühn-Institut (formerly BBA) – GERMANY
ENT-I-06/15
MGI - MEZOGAZDASÁGI GÉPESÍTÉSI INTÉZET– HUNGARY
I-112/2015
PIMR - Przemyslowy Instytut Maszyn Rolniczych – POLAND
PIMR-129/ENTAM/
15
Responsibility and recognition
Performing competent authority: Crop Protection Technology DISAFA – University of Torino Via Leonardo da Vinci, 44 I - 10095 Grugliasco (TO) - ITALY
This test is recognized by the ENTAM members: