
Untitled - Strathprints
18
-
Upload
khangminh22 -
Category
Documents
-
view
0 -
download
0
Transcript of Untitled - Strathprints


Page 1 of 17
Effect of fluorosurfactant additive during Cu-Sn codeposition from methanesulfonic acid 1
Naray Pewnima,*, Sudipta Royb 2
3
a Department of Chemistry, Faculty of Science, Maejo University, Chiang Mai, 50290, 4
Thailand. Email address: [email protected] 5
b School of Chemical Engineering and Advanced Materials, Merz Court, Newcastle 6
University, Newcastle upon Tyne, NE1 7RU, UK. Email address: [email protected] 7
* Corresponding author. 8
9
Abstract 10
Methanesulfonic acid (MSA) is an interesting supporting electrolyte with many desirable 11
properties such as high salt solubility, high conductivity, low corrosivity and toxicity. 12
Various additives or complexing agents such as brighteners, antioxidants, and surfactants are 13
required for deposition of Sn and Cu-Sn alloys. It has been shown that the simplest 14
electrolyte for successful Cu-Sn deposition can contain just an antioxidant and a 15
fluorosurfactant. In this work we have further examined the role of fluorosurfactant in 16
shifting the electrochemical reduction potential for the more noble metal. The surface 17
adsorption and desorption processes of the surfactant has been inferred through the use of an 18
electrochemical quartz crystal nanobalance (EQCN). Cu and Sn have been deposited 19
individually and simultaneously from MSA electrolytes. Mass changes at the quartz crystal 20
have been compared against those calculated from charge consumption. These data show that 21
in MSA electrolytes the adsorption and desorption of the fluorosurfactant to the surface is 22
potential dependent and it suppresses Cu deposition but facilitates Cu-Sn alloy deposition. 23
24
Keywords 25
Copper, Cu-Sn alloy, electrodeposition, methanesulfonic acid, surfactant 26
27
Page 2 of 17
1. Introduction 1
In the past decades increasing scrutiny of environmental impact of various chemicals1, 2 has 2
resulted in a concerted search for new electrolytes for electrodeposition processes. 3
Methanesulfonic acid (MSA) electrolytes have been proposed as an alternative to standard 4
acid plating baths due to its ability to dissolve a variety of metal salts, its high conductivity, 5
as well as low toxicity and corrosivity3, 4. This promise has led various researchers to 6
examine the performance and elucidate the process of electrodeposition of copper5, 6, tin7, 8 7
and their alloys9-11 from MSA electrolytes. 8
9
These studies have shown that additives or complexing agents such as antioxidants8, 12 and 10
surfactants13-17 play a vital role during the co-deposition of Cu-Sn9, 10, 18. In fact, the simplest 11
electrolyte where good deposits are obtained contain an antioxidant and a fluorosurfactant9, 18. 12
The antioxidant, a hydroquinone, is added to stop the spontaneous oxidation8, 12 of Sn2+ to 13
Sn4+, and the non-ionic fluorosurfactant, DuPont™ Zonyl® FSN, was shown to reduce 14
hydrogen evolution14-17 as well as prevent the formation of metal oxides11. 15
16
Electrochemical voltammetric investigations revealed that the inclusion of these two 17
additives in the electrolyte shifted the metal reduction potential of Cu in the cathodic 18
direction, whereas Sn deposition remained unaffected9, 18. Since copper is the more noble 19
metal, this phenomenon facilitates the co-deposition of the Cu-Sn alloy11, 17, 18. However, 20
these studies have not clearly shown whether this facilitation is due to the adsorption of the 21
fluorosurfactant. Previous elemental analysis (EDX) showed no fluorine [11] in the deposit. 22
Hence, although the fluorosurfactant plays a role in Cu-Sn co-deposition, it was not 23
incorporated into the deposit. Potential dependent adsorption/desorption of fluorosurfactants 24
in MSA-based electrolytes have not been reported, specifically with regards to how it 25

Page 3 of 17
influences the deposition of individual metals, i.e. Cu and Sn, and the Cu-Sn alloy. 1
2
In this work we have examined the adsorption and desorption of the fluorosurfactant as a 3
function of potential using an electrochemical quartz crystal nanobalance (EQCN). Cu and Sn 4
have both been deposited individually and simultaneously from an MSA electrolyte. 5
Frequency changes at the quartz crystal have been interpreted to determine the potentials 6
where the surfactant, metal and alloy were being deposited using the Sauerbrey equation19. 7
These mass changes have been compared against those calculated from the Faraday equation 8
by monitoring the charge consumed for deposition or stripping. These data were interpreted 9
to show the potential regions for adsorption or desorption of the fluorosurfactant and its 10
influence on metal and alloy deposition. 11
12
2. Experimental 13
2.1. Chemicals and Apparatus 14
All solutions contained 0.1 M hydroquinone (Merck) and 2.0 M methanesulfonic acid (Alfa 15
Aesar), which was the base electrolyte. Solutions used for plating individual metals Cu and 16
Sn contained 0.015 M CuSO4 and 0.015 M SnSO4, respectively. The Cu-Sn plating solution 17
contained 0.015 M CuSO4 and 0.15 M SnSO4 as it has been shown that a high Sn:Cu ratio is 18
required to achieve the desired Sn-rich deposits9, 11. In order to study the influence of 19
surfactant on the current-potential behavior of the base electrolyte and deposition of 20
individual metals, 0.01 %vol fluorosurfactant (DuPont Zonyl FSN) was added to these 21
solutions and compared against ones where it was not present. 22
23
A Seiko EG&G Model QCA917 Quartz Crystal Analyzer was used in the experiments along 24
with commercially purchased standard AT-cut, gold coated 9 MHz quartz crystals (Ametek) 25

Page 4 of 17
which have an active surface area of 0.196 cm2. A custom built electrochemical cell, which 1
enabled vertical positioning of the crystal, was used as it had been reported earlier to give 2
stable measurements20. In all experiments, after placing the quartz crystals in solution, it was 3
found to stabilize at approximately 8.95 MHz. The voltage change sensed by the quartz 4
crystal analyzer was read-off directly by the potentiostat and converted to frequency change. 5
An EcoChemie µAutolab II potentiostat with NOVA 1.7 software was used to carry out 6
potential sweeps and record current, potential and time data. 7
8
2.2. Methodology 9
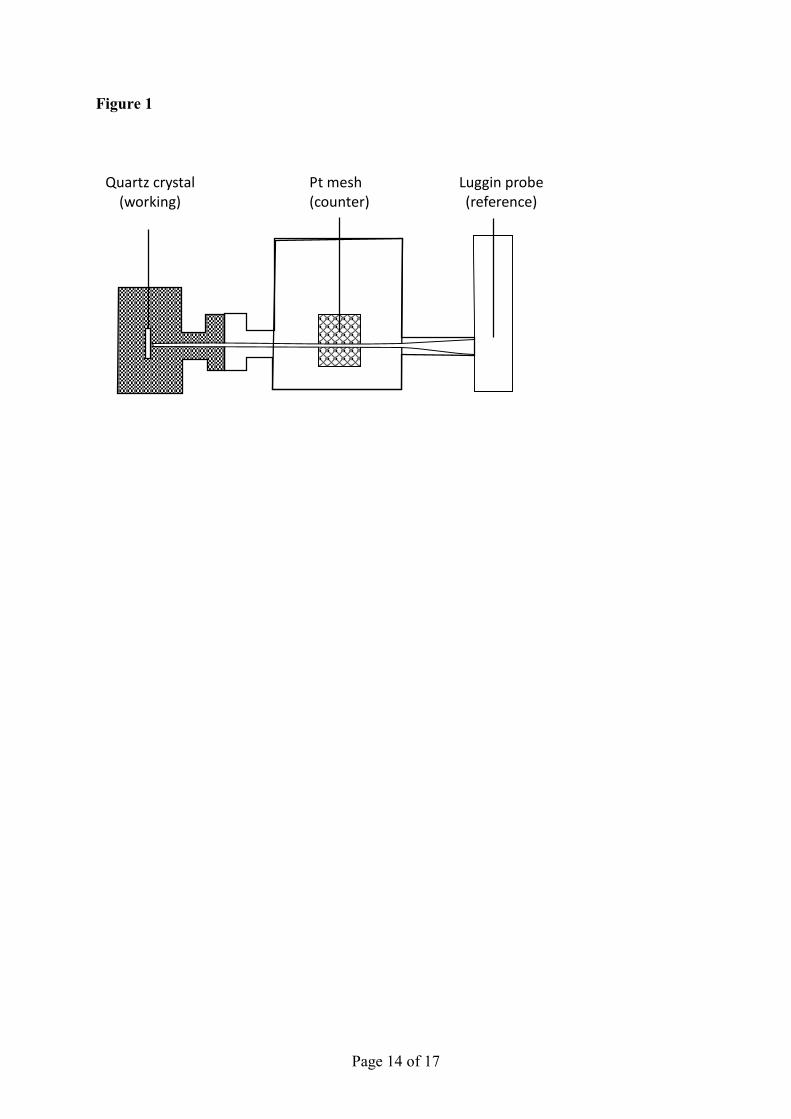
Figure 1 is a schematic of the glass cell used in EQCN experiments. The potentiostat was 10
connected to the QCN with the gold plated quartz crystal acting as the working electrode. The 11
counter electrode was a platinum mesh and the reference was a saturated calomel electrode 12
(SCE). Cyclic voltammetry was carried out with the forward scan starting from the upper 13
limit of 0.4 V towards the lower limit of -0.6 V where significant amounts of hydrogen 14
evolution occurred. In the reverse scan the potential was increased towards and stopped at the 15
upper limit. The scan rate was 10-50 mV s-1. 16
17
2.3. QCN Calibration 18
A standard calibration method which involved deposition of Cu from an acidified electrolyte 19
was used to determine the sensitivity and stability of the quartz crystal. A solution of 0.1 M 20
CuSO4 in 0.5 M H2SO4 was used as Cu deposition from this solution is known to proceed at 21
100% current efficiency [20]. The mass of Cu deposited on the crystal surface would change 22
its resonance frequency according to the Sauerbrey equation19, 21: 23
mf 24
where Δf is change in frequency (Hz) and Δm is change in mass of the deposit (g), and is 25
Page 5 of 17
the sensitivity factor (Hz g-1) which can be determined experimentally through calibration 1
experiments. The change in frequency is inversely proportional to the mass of Cu deposited, 2
i.e. mass increase leads to frequency decrease. By monitoring the charge consumed, one can 3
also determine the theoretical mass of Cu deposited as per the Faraday equation. The value 4
for was found to be 8.14 x 10⁸ Hz g-1 with a standard deviation of ±5% (±4.12 x 10⁷ Hz g-1) 5
for Cu deposition at 100% current efficiency. 6
7
3. Results and Discussion 8
Figure 2 shows a linear potential sweep of the base electrolyte with only fluorosurfactant 9
added. As the potential is scanned in the negative direction, the frequency continuously 10
decreases, indicative of progressive adsorption on the electrode surface. Maximum surfactant 11
adsorption occurred at approximately -0.2 V where a maximum frequency change of -8.5 Hz 12
(approximately 10 ng) was observed. However, as the potential becomes more negative than -13
0.3 V, the frequency begins to increase, which is indicative of desorption from the surface. It 14
should be noted that adsorption/desorption of the surfactant proceeds without any charge 15
transfer, and hence no significant change in current density is recorded as the surfactant 16
adsorbs or desorbs from the surface. Further cathodic polarization down to -0.5 V shows 17
continued increase in f and a sharp increase in current due to hydrogen evolution. No 18
evidence of gold dissolution from the crystal was observed. 19
20
As a potential sweep is a dynamic process that continually changes the electrode surface 21
potential over a short period of time (typically 90s at a scan rate of 10 mV s-1), a set of 22
potentiostatic experiments were also carried out to observe surfactant adsorption/desorption 23
over a longer period of time up to 600 s. Figure 3 shows the varying amount of surfactant 24
adsorption for different electrode potentials ranging from -0.5 to 0.3 V. The open circuit 25

Page 6 of 17
potential (OCP) of the blank electrolyte was approximately 0.3 V. Therefore, the potential 1
was initially set to the OCP and gradually decreased towards -0.5 V after 600s intervals at 2
each potential. Usually the frequency stabilized after about 300 s, showing that an 3
equilibrium of adsorbed surfactant had been achieved. It can be seen that the surfactant is 4
never fully desorbed from the surface in the potential window between -0.5 to 0.3 V. This 5
data corroborates with potential sweep results found in Figure 1 suggesting that 6
fluorosurfactant adsorption in MSA-based electrolytes is indeed potential dependent with 7
maximum adsorption near -0.2 and -0.3 V. 8
9
Sn deposition without and with surfactant is shown in Figure 4a and Figure 4b, respectively. 10
For Sn it can be seen that the polarization and frequency change data are identical. Inclusion 11
of surfactant in the electrolyte does not affect the polarization behaviour of Sn reduction and 12
oxidation from this electrolyte. This behaviour is similar to those reported earlier9. 13
Interestingly, in the potential regime of -0.45 to -0.50 V there is a slight decrease in 14
frequency of about -200 Hz (corresponding to 0.2 µg), below which, i.e. from -0.50 V to -15
0.60 V, a sharper decrease in frequency is observed. The polarization data shows two 16
cathodic peaks, a small one between -0.45 V and -0.50 V, and a larger one beyond -0.50 V. 17
As per Figure 2, it was shown that the surfactant desorbs at potentials below -0.32 V, and 18
therefore this decrease in frequency at potentials more negative than -0.32 V (c.f. Figure 4a 19
and Figure 4b) is due to Sn metal being plated. The first peak around -0.45 V is attributed to 20
Sn underpotential deposition (UPD) on Au22-24 which has been known to occur in our 21
electrolyte. Overpotential deposition of Sn commences at potentials more negative than -0.50 22
V, which is accompanied by a much larger reduction current and a large decrease in 23
frequency. On the reverse scan two separate stripping peaks were observed at -0.46 V and -24
0.32 V which could correspond to two different phases of Sn that were deposited. 25

Page 7 of 17
1
The dotted line in Figure 4 is the value of current consumption calculated from the frequency 2
change. Corresponding metal deposition can be obtained by combining the Sauerbrey and 3
Faraday equations20 for 100% current efficiency: 4
calc
zF fi
M t
5
Where icalc is the calculated current, is the sensitivity factor (Hz g-1), M is the atomic mass 6
of the metal (g mol-1); average mass in the case of the alloy, z is the number of electrons 7
involved in the reaction, F is Faraday’s constant (C mol-1), δf is the frequency change (Hz), 8
and δt is the time duration (s). The calculated current values show excellent agreement with 9
the polarization currents, except in the region -0.45 V to -0.5 V. The discrepancy in the 10
calculated values would be due to the desorbing surfactant, which would result in slightly 11
lower calculated values for current density. 12
13
Cu deposition without and with surfactant is shown in Figure 4c and Figure 4d, respectively. 14
In Figure 4c, without surfactant in solution, an increase in current at approximately -0.30 V is 15
seen which is accompanied by a decrease in frequency throughout the entire cathodic 16
polarization range. A single peak is observed during anodic stripping accompanied by 17
frequency increase indicative of Cu stripping. The calculated values of current density from 18
frequency changes show very good agreement with the experimentally measured values of 19
Cu deposition and stripping current, and the frequency changes mirror the process of metal 20
plating and stripping. 21
22
Figure 4d shows that when surfactant is added, Cu deposition now commences at -0.43 V. In 23
addition, the deposition current is lower, which is reflected in a smaller decrease in 24
frequency; -2800 Hz with surfactant compared to -5000 Hz without surfactant corresponding 25
Page 8 of 17
to 3.4 and 6.1 µg, respectively. The stripping peak of Cu is shifted to more positive 1
overpotentials. The stripping current is also lower, due to the lower amount of deposited 2
material. For Cu the calculated current values exceed the measured values in the region 3
between -0.050 V and 0.20 V, due to desorption of the surfactant from the surface (cf. Figure 4
2). These data show that the surfactant adsorption blocks the Cu discharge. In addition, it 5
inhibits Cu deposition at more cathodic potentials, thereby reducing the total amount of Cu 6
deposited. The shift in deposition potential9, 18 and inhibition of Cu deposition11 has been 7
observed in earlier studies, but this is the first direct evidence that they are due to the 8
adsorption of surfactant on the electrode surface. 9
10
Co-deposition of Cu and Sn without and with surfactant is shown in Figure 4e and Figure 4f, 11
respectively. In Figure 4e, where no surfactant is added to the solution, a small cathodic peak 12
for Cu deposition at -0.40 V is observed. This potential is slightly more negative than that 13
observed for Cu only deposition (cf. Figure 4c). Once the potential reaches -0.47 V a large 14
cathodic current is observed. The deposition of the two metals is accompanied by a decrease 15
in frequency indicating that Cu and Cu-Sn co-deposition are occurring. On the reverse scan 16
two anodic stripping peaks were observed at -0.37 V and 0.08 V, corresponding to the 17
stripping of Sn and Cu, respectively. The calculated values of current from the frequency 18
changes show good agreement with measured polarization current, showing that the 19
frequency changes are due to metal deposition and dissolution from the surface. 20
21
There are two notable items which are gleaned from the polarization and frequency data of 22
Figure 4e. The first issue is that Cu and Sn strip separately from the electrode. However, 23
during co-deposition, both metals, i.e., Cu and Sn are reduced, with Sn being the major 24
component. Therefore, when Sn is stripped from the surface, Cu should be released due to the 25

Page 9 of 17
breakdown of the deposit (and not due to electrochemical oxidation). It is possible that such a 1
process leads to a loss in mass without incurring any charge consumption. This would explain 2
the excess calculated anodic current just above -0.40 V which is the loss of Cu detected due 3
to the dissolution of the Sn matrix. This would also lead to lower Cu deposition efficiency if 4
one used anodic stripping voltammetry to investigate these systems. 5
6
The second notable item is that during co-deposition experiments, Sn UPD is not observed as 7
only one Sn stripping peak is seen. During individual metal deposition Sn UPD was observed 8
when Sn was deposited on the gold substrate; in the -0.45 to -0.50 V potential region. 9
However, in the electrolyte containing both Cu and Sn but no surfactant (cf. Figure 4e), the 10
characteristic sharp Sn UPD peak that is usually observed is missing and we see a small peak 11
in the -0.40 to -0.45 V potential region instead. This smaller peak is attributed to a small 12
amount of Cu only being deposited. A similar observation has been reported25 that Cu 13
deposition prevents underpotential deposition of Cu-Sn alloys in MSA electrolytes. 14
15
Figure 4f shows that in the electrolyte containing surfactant, Cu deposition is severely 16
inhibited, as was found earlier for individual Cu deposition (cf. Figure 4d). Almost no 17
frequency changes are observed until -0.5 V. Once the potential reaches a significantly 18
negative value, i.e. -0.50 V, the co-deposition of Cu-Sn begins, which is reflected in 19
decreasing EQCN frequency. Calculated values of current agree well with the measured 20
currents, showing that frequency changes are closely aligned to the process of metal 21
deposition and dissolution. 22
23
There are again two notable issues in this case. The first is that during the reverse sweep one 24
does not observe any differences between measured and calculated currents at -0.4 V, as was 25

Page 10 of 17
the case for the surfactant-free solution (cf. Figure 4e). This shows that no Cu is lost from the 1
deposit due to the electrochemical dissolution of the Sn matrix. This also shows that Cu 2
oxidation to cupric ions is inhibited by the adsorbed surfactant – which leads to a slight shift 3
in the oxidation overpotential of Cu. In principle, depending on the scan rate and surface 4
diffusion of Sn and Cu atoms, a nano-porous Cu layer could be formed if only Sn is stripped 5
from the deposit. This process could be used as a new method to fabricate nano-porous 6
materials. 7
8
The second item is related to the role of surfactants in metal deposition. It is generally 9
believed that the main role of surfactants was to reduce gas evolution by lowering surface 10
energy and improve grain refinement by its adsorption to the surface14-16. However, our 11
results show that surfactant adsorption can be used to manipulate changes in electrochemical 12
behaviour of the two metals, i.e. that the reduction of the more noble metal may be 13
suppressed, which allows one to deposit Sn-rich alloys18. In this regard, the surface active 14
agent is acting as a “poison” that blocks the more noble material from depositing. 15
16
4. Conclusion 17
The role of a fluorosurfactant additive during the co-deposition of Cu and Sn from MSA 18
electrolytes has been examined. Polarisation data for individual metals and Cu-Sn has been 19
collected at a quartz crystal coated with Au. The results show that the surfactant adsorbs on 20
the surface at all potentials where the two metals deposit. This does not affect the 21
electrochemical behaviour of Sn, because the surfactant starts to desorb in the potential range 22
where Sn is reduced and oxidised. However, the surfactant blocks the surface more strongly 23
at potentials where Cu is reduced and oxidized, which suppresses Cu reduction. Co-24
deposition is enabled due to the difference in electrochemical behaviour of these metals, 25
Page 11 of 17
whereby Sn-rich deposits are obtained. This could provide a significant route for surfactant-1
enabled electrodeposition of base-metal rich alloys via electrochemical deposition. 2
3
Acknowledgement 4
The authors would like to thank Newcastle University’s nanoLAB for their support. 5

Page 12 of 17
References
1. European Chemicals Agency (ECHA), Available at http://echa.europa.eu/ (accessed
12.03.2015), 2015.
2. Registration, Authorisation & restriction of CHemicals (REACH), Available at
http://www.hse.gov.uk/reach/ (accessed 12.03.2015), 2015.
3. M. D. Gernon, M. Wu, T. Buszta, and P. Janney, Green Chem., 1, 127-140 (1999).
4. R. Balaji and MalathyPushpavanam, Trans. Inst. Met. Finish., 81 (5), 154-158 (2003).
5. M. Hasan and J. F. Rohan, J. Electrochem. Soc., 157 (5), D278-D282 (2010).
6. F. Florence, Nisha, Rajendran, S., Srinivasan, K.N., John, S., Int. J. ChemTech Res., 3
(3), 1318-1325 (2011).
7. Y. H. Yau, J. Electrochem. Soc., 147 (3), 1071-1076 (2000).
8. C. T. J. Low and F. C. Walsh, Electrochim. Acta, 53 (16), 5280-5286 (2008).
9. C. T. J. Low and F. C. Walsh, Surf. Coat. Technol., 202 (8), 1339-1349 (2008).
10. C. T. J. Low and F. C. Walsh, Trans. Inst. Met. Finish., 86 (6), 315-325 (2008).
11. N. Pewnim and S. Roy, Trans. Inst. Met. Finish., 89 (4), 206-209 (2011).
12. M. Schlesinger and M. Paunovic, Modern Electroplating, 5th ed., John Wiley & Sons,
Hoboken (2010).
13. N. M. Martyak and R. Seefeldt, Electrochim. Acta, 49 (25), 4303-4311 (2004).
14. C. Cachet, M. Keddam, V. Mariotte, and R. Wiart, Electrochim. Acta, 37 (12), 2377-
2383 (1992).
15. C. Cachet, M. Keddam, V. Mariotte, and R. Wiart, Electrochim. Acta, 39 (18), 2743-
2750 (1994).
16. C. S. Cha and Y. B. Zu, Langmuir, 14 (21), 6280-6286 (1998).
17. C. T. J. Low and F. C. Walsh, J. Electroanal. Chem., 615 (2), 91-102 (2008).
18. N. Pewnim and S. Roy, Electrochim. Acta, 90, 498-506 (2013).
19. G. Sauerbrey, Z. Phys., 155, 206-222 (1959).
20. K. Johannsen, D. Page, and S.Roy, Electrochim. Acta, 45, 3691-3702 (2000).
21. S. Bruckenstein and M. Shay, Electrochim. Acta, 30 (10), 1295-1300 (1985).
22. M. Fonticelli, R. Tucceri, and D. Posadas, Electrochim. Acta, 49 (28), 5197-5202
(2004).
23. Z. Qiao, W. Shang, X. Zhang, and C. Wang, Anal. Bioanal. Chem., 381 (7), 1467-
1471 (2005).
24. L. Meier, S. Garcia, and D. Salinas, Surf. Interface Anal., 44 (1), 37-40 (2012).
25. J. Horkans, I. C. H. Chang, P. C. Andricacos, and H. Deligianni, J. Electrochem. Soc.,
142 (7), 2244-2249 (1995).

Page 13 of 17
FIGURE CAPTIONS
Figure 1. Schematic of the glass cell used in EQCN experiments showing the position of the
working, counter, and reference electrodes.
Figure 2. Cyclic voltammogram of base electrolyte containing only fluorosurfactant. Scan
rate of 10 mV s-1. Measured current — and frequency change ----.
Figure 3. Potentiostatic measurements showing potential dependent surfactant adsorption in
the potential window of -0.5 to 0.3 V.
Figure 4. Cyclic voltammogram Sn, Cu, and Cu-Sn plating solutions with and without
surfactant at a scan rate of 10 mV s-1. Measured current —, calculated current ····, and
frequency change ----.
Page 14 of 17
Figure 1
Quartz crystal (working)
Pt mesh (counter)
Luggin probe
(reference)

Page 15 of 17
Figure 2

Page 16 of 17
Figure 3

Page 17 of 17
Figure 4