Untitled - Pakistan Research Repository
193
i
-
Upload
khangminh22 -
Category
Documents
-
view
0 -
download
0
Transcript of Untitled - Pakistan Research Repository

i

ii
GENETIC POLYMORPHISM OF UDP-GLUCURONOSYLTRANSFERASE (UGT1A
and UGT2B) IN LOCAL POPULATION.
By
Huma Mehboob
M.Phil Biochemistry (UAF)
A THESIS SUBMITTED IN PARTIAL FULFILMENT OF THE REQUIREMENTS FOR THE
DEGREE OF
DOCTOR OF PHILOSOPHY
IN
BIOCHEMISTRY
DEPARTMENT OF BIOCHEMISTRY
FACULTY OF SCIENCES
UNIVERSITY OF AGRICULTURE
FAISALABAD PAKISTAN
2016

iii
DECLARATION
I hereby declare that the contents of the thesis, “Genetic Polymorphism of UDP-
glucuronosyltransferase (UGT1A and UGT2B) in local Population” are the product of my
own research and no part has been copied from any published source (except the references,
standard mathematical or genetic models/formulate/ protocols etc). I further declare that this
work has not been submitted for the award of any other degree/ diploma.
Huma Mehboob
2006-ag-748

iv
The Controller of Examinations,
University of Agriculture,
Faisalabad.
We, the supervisory committee, certify that the contents and form of thesis submitted by
HUMA MEHBOOB Regd. No. 2006-ag-748 have been found satisfactory and recommend that it
be processed for evaluation for the award of degree.
SUPERVISORY COMMITTEE:
Chairperson: ---------------------------------------
PROF. DR. TAHIRA IQBAL
Member: --------------------------------------
PROF. DR. AMER JAMIL
Member: -------------------------------------------
PROF. DR. TANWEER KHALIQ

v
DEDICATED
TO
My Parents and Brothers & Sisters
Whose affections and support inspired me to achieve this Milestone
And
Who did their best to uplift me to the
Heights of an ideal life

vi
ACKNOWLEDGEMENT
First and Foremost praise is to ALLAH, the Almighty, Compassionate, the greatest of all, on
whom ultimately we depend for sustenance and guidance. I would like to thank Almighty Allah
for giving me opportunity, determination and strength to accomplish this task. His continuous
grace and mercy was with me throughout my life. I also invoke peace for Hazrat Muhammad
(SAW), the Last Prophet of Allah, who is forever a torch of guidance for humanity as a whole.
I express my gratitude to all my teachers whose teachings have brought me to this stage of
academic zenith but in particular I wish to express immeasurable gratitude to my supervisor
Prof. Dr. Tahira Iqbal, Professor of Biochemistry, University of Agriculture, Faisalabad, for
her kind attitude. It was a wonderful experience to work under her supervision. Her intellect
guided me to overcome all barriers in research. Her indefatigable patience made me believe that
everything is easy. Her kind supervision and help enabled me to complete research and to write
this manuscript.
I am highly obliged to Prof. Dr. Amer Jamil, Department of Biochemistry and Prof. Dr.
Tanweer Khaliq, Chairman, Department of Physiology and Pharmacology, for their support,
guidance, encouragement, insightful suggestions and comments on my thesis.
I am also grateful to Dr. Wanqing Liu, Department of Medicinal Chemistry and Molecular
Pharmacology, Purdue University, USA who offered his time, expertise, and wisdom in guiding
me and mentoring me step by step through the research process.
I deeply express my thanks and gratitude to my parents, the ones who can never ever be thanked
enough, for the overwhelming love, care, unconditional trust and endless patience they bestow
upon me, and who have supported me financially as well as morally. It was their love that raised
me up again when I got weary. I feel a deep sense of gratitude for my Brothers (Usman Farooqi,
Aboubakker Farooqi and Umer Farooqi) and Sisters (Sadia Farooqi, Moona Farooqi and
Shamaiela Farooqi) who formed part of my vision and taught me good things that really matter
in life. Their infallible love and support has always been my strength. Their patience and
sacrifice will remain my inspiration throughout my life.
I extend my sincere word of thanks to Prof. Dr. Munir Ahmad Sheikh for his great assistance
and advice through my whole academic stay at UAF. I am indebted to him for his continuous
encouragement and guidance.
I am immensely grateful to Shamshad Ahmad (Office Assistant) and Mubarik Ali for their
various forms of support during my study.
I would like to thank my friends who have been a source of moral support to me and have
extended their helping hands without fail. My acknowledgement will never be complete without
the special mention of my lab seniors (Sadaf Saleem, Naila Rafique, Bushra Munir and
Bushra Arshad) who have taught me the lab culture and have lived by example to make me
understand the hard facts of life. At last but not the least, I want to offer my gratitude to all my
lab juniors who accompanied me in Pharmaceutical Research Lab.

vii
TABLE OF CONTENTS
Serial No. Title Page No.
Dedication
Acknowledgement
Table of Contents
List of Tables
List of Figures
Abstract
Chapter 1 Introduction 01
Chapter 2 Review of Literature 07
2.1 UDP-glucuronosyltransferases (UGTs) 07
2.1.1 UGT isozymes 08
2.1.2 UDP Glucuronosyltransferase 1 11
2.1.3 UDP glucuronosyltransferase 2 13
2.1.4 UDP glucuronosyltransferase 3 17
2.1.5 UDP glucuronosyltransferase 8 17
2.1.6 Functional role of UGT 17
2.1.7 UGT and Disease 18
2.2 Genotype-phenotype relationship 21
2.3 Phenotype 23
2.3.1 Paracetamol (PAR) 24
2.3.2 Physiochemical properties and Chemistry 24
2.3.3 Analysis 25
2.3.4 Pharmacokinetics 25
2.3.5 Toxic Effects 27
2.3.6 Genetic and related effects 28
2.4 Aspirin 28
2.4.1 Chemistry and physiochemical properties 29
2.4.2 Pharmacokinetics of Aspirin 29
2.4.3 Analysis 31
2.4.4 Adverse effects 32
Chapter 3 Materials and Methods 34
3.1 Study Subjects 34
3.2 Probe Drugs 36
3.3 Collection of blood samples 36
3.4 Biochemical Parameters 37
3.5 Complete Blood Picture (CBP) 37
3.6 Chemicals and Reagents 38
3.7 Equipment and Instrmentation 38
3.8 Phenotyping 39
3.8.1 Preparation of stock solutions and standards 39
3.8.2 Analysis of paracetamol (PAR) and paracetamol glucuronide (PAR-Glu) 40
3.8.3 Analysis of Aspirin (ASP) and Aspirin glucuronide (salicylic acid acyl
glucuronide)
41

viii
3.9 Validation of HPLC assay 42
3.9.1 Specificity and Selectivity 42
3.9.2 Limit of Detection (LOD) and Limit of Quantification (LOQ) 43
3.9.3 Calibration Curves and Linearity 43
3.9.4 Accuracy and Precision 43
3.9.5 Stability of quality controls and test samples 44
3.10 Genotyping of UGT1A and UGT2B 44
3.10.1 DNA extraction and quantification 44
3.10.2 UGT1A and UGT2B SNPs 45
3.10.3 UGT1A(UGT1A6) SNPs 47
3.10.4 TaqMan® Probes 48
3.10.5 Optimization of qPCR conditions 48
3.10.6 Optimization of DNA templete 48
3.10.7 Real time Polymerase chain reaction for UGT(1A and 2B) genes 49
3.11 Statistical analysis 59
Chapter 4 Results and Discussion 60
4.1 Glucuronidation Status 67
4.1.1 HPLC method validation for probe drugs and their glucuronidated
metabolites
67
4.1.1.1 Selectivity 67
4.1.1.2 Limit of Detection (LOD) and Limit of Quantification (LOQ) 68
4.1.1.3 Calibration and Linearity 68
4.1.1.4 Accuracy and Precision 69
4.1.1.5 Stability of stock solutions 71
4.1.1.6 Stability of test samples 71
4.1.1.7 Recovery 71
4.1.2 Paracetamol Phenotype 72
4.1.2.1 Male volunteers 72
4.1.2.2 Female volunteers 72
4.1.3 Aspirin (acetyl salicylic acid) phenotype 81
4.1.3.1 Male volunteers 83
4.1.3.2 Female volunteers 83
4.1.4 Concordance Between Probe drugs (Paracetamol and Aspirin) 92
4.1.4.1 Male volunteers 92
4.1.4.2 Female volunteers 92
4.2 Genotyping of UGT1A and UGT2B genes 94
4.2.1 Distribution of UGT1A and UGT2B alleles and genotype frequencies 104
4.2.2 Paracetamol phenotype-genotype Relationship 112
4.2.3 Aspirin phenotype-genotype Relationship 124
4.3 Conclusion 134
Chapter 5 Summary 136
Literature Cited 139

ix
LIST OF TABLES
Table No. TITLE Page No.
2.1 Conjugation of drugs metabolized by different polymorphic enzymes 10
2.2 Analysis of Paracetamol and its glucuronidated metabolite through
chromatographic techniques
26
2.3 Analysis of acetylsalicylic acid and its metabolite salicylic acid acyl
glucuronide through chromatographic techniques
32
3.1 Comparative demographic data of healthy male and female subjects 35
3.2 qPCR reaction mixture for UGT1A1, UGT2B4 and UGT2B15 SNPs 49
4.1 Values for complete blood picture (CBP) of the healthy male and
female subjects
61
4.2 Values for biochemical parameters of the healthy male and female
subjects
62
4.3 Comparative values for complete blood picture (CBP) of the healthy
male and female subjects
63
4.4 Comparative values for biochemical parameters of the healthy male
and female subjects
64
4.5 Intraday and Inter day precision and accuracy for paracetamol (PAR)
and paracetamol glucuronide (PAR-Glu)
69
4.6 Intraday and Inter day precision and accuracy for aspirin (ASP) and
aspirin glucuronide (ASP-Glu)
70
4.7 Paracetamol (PAR) and paracetamol glucuronide (PAR-Glu)
concentration, PAR-Glu/PAR ratio, slow, intermediate and fast
glucuronidators assigned to male (n=59) subjects
74
4.8 Paracetamol (PAR) and paracetamol glucuronide (PAR-Glu)
concentration, PAR-Glu/PAR ratio, slow, intermediate and fast
glucuronidators assigned to female (n=50) subjects
76
4.9 Distribution of glucuronidation phenotype for paracetamol in healthy
male and female volunteers (n=109)
81
4.10 Aspirin (ASP) and ASP Glucuronide (ASP-Glu) concentration, ASP-
Glu /ASP ratio, slow, intermediate and fast glucuronidators assigned to
male (n=59) subjects.
85
4.11 Aspirin (ASP) and ASP Glucuronide (ASP-Glu) concentration, ASP-
Glu /ASP ratio, slow, intermediate and fast glucuronidators assigned to
female (n=50) subjects.
88
4.12 Distribution of Glucuronidation phenotype for aspirin in healthy male
and female volunteers (n=109)
90
4.13 Comparison of Paracetamol-Aspirin phenotype in male subjects (n=59) 93
4.14 Comparison of Paracetamol-Aspirin phenotype in female subjects
(n=50)
93
4.15 Comparison of Paracetamol-Aspirin phenotype in male and female
subjects (n=109)
93
4.16 Genotyping of UGT1A and UGT2B genes in healthy male volunteers 98

x
(n=59)
4.17 Genotyping of UGT1A and UGT2B genes in healthy female volunteers
(n=50)
100
4.18 Distribution of genotypic glucuronidation in healthy male (n=59) and
female (n=50) subjects
103
4.19 Distribution of UGT1A and UGT2B allele frequency in male (n=59)
volunteers
105
4.20 Distribution of UGT1A and UGT2B allele frequency in female (n=50)
volunteers
106
4.21 Distribution of UGT1A and UGT2B allele frequency in male and
female (n=109) volunteers
107
4.22 Distribution of UGT1A and UGT2B genotype in male (n=59)
volunteers
109
4.23 Distribution of UGT1A and UGT2B genotype in female (n=50)
volunteers
110
4.24 Distribution of UGT1A and UGT2B genotype in male and female
(n=109) volunteers
111
4.25 Comparison of paracetamol phenotype/rs8330 genotype in male
volunteers (n=59)
113
4.26 Comparison of paracetamol phenotype/rs8330 genotype in female
volunteers (n=50)
113
4.27 Comparison of paracetamol phenotype/rs8330 genotype in male and
female volunteers (n=109)
113
4.28 Comparison of paracetamol phenotype/rs10929303genotype in male
volunteers (n=59)
115
4.29 Comparison of paracetamol phenotype/rs10929303 genotype in female
volunteers (n=50)
115
4.30 Comparison of paracetamol phenotype/rs10929303 genotype in male
and female volunteers (n=109)
115
4.31 Comparison of paracetamol phenotype/ rs1902023 genotype in male
volunteers (n=59)
117
4.32 Comparison of paracetamol phenotype/rs1902023 genotype in female
volunteers (n=50)
117
4.33 Comparison of paracetamol phenotype/rs1902023 genotype in male
and female volunteers (n=109)
117
4.34 Comparison of paracetamol phenotype/rs2070959 genotype in male
volunteers (n=59)
118
4.35 Comparison of paracetamol phenotype/rs2070959 genotype in female
volunteers (n=50)
118
4.36 Comparison of paracetamol phenotype/rs2070959 genotype in male
and female volunteers (n=109)
118
4.37 Comparison of paracetamol phenotype/rs1105879 genotype in male
volunteers (n=59)
119
4.38 Comparison of paracetamol phenotype/ rs1105879 genotype in female
volunteers (n=50)
120

xi
4.39 Comparison of Paracetamol phenotype/rs1105879 genotype in male
and female volunteers (n=109)
120
4.40 Comparison of paracetamol phenotype/rs1131878 genotype in male
volunteers (n=59)
121
4.41 Comparison of paracetamol phenotype/rs1131878 genotype in female
volunteers (n=50)
121
4.42 Comparison of paracetamol phenotype/rs1131878 genotype in male
and female volunteers (n=109)
121
4.43 Comparison of paracetamol phenotype/rs2013573genotype in male
volunteers (n=59)
123
4.44 Comparison of paracetamol phenotype/rs2013573 genotype in female
volunteers (n=50)
123
4.45 Comparison of paracetamol phenotype/rs2013573 genotype in male
and female volunteers (n=109)
123
4.46 Comparison of Aspirin phenotype/rs1105879 genotype in male
volunteers (n=59)
125
4.47 Comparison of Aspirin phenotype/rs1105879 genotype in female
volunteers (n=50)
125
4.48 Comparison of Aspirin phenotype/rs1105879 genotype in male and
female volunteers (n=109)
126
4.49 Comparison of Aspirin phenotype/ rs2070959 genotype in male
volunteers (n=59)
126
4.50 Comparison of Aspirin phenotype/rs2070959 genotype in female
volunteers (n=50)
126
4.51 Comparison of Aspirin phenotype/rs2070959 genotype in male and
female volunteers (n=109)
127
4.52 Comparison of Aspirin phenotype/rs1902023 genotype in male
volunteers (n=59)
127
4.53 Comparison of Aspirin phenotype/ rs1902023 genotype in female
volunteers (n=50)
128
4.54 Comparison of Aspirin phenotype/rs1902023 genotype in male and
female volunteers (n=109)
128
4.55 Comparison of Aspirin phenotype/rs10929303 genotype in male
volunteers (n=59)
129
4.56 Comparison of Aspirin phenotype/ rs10929303 genotype in female
volunteers
129
4.57 Comparison of Aspirin phenotype/rs10929303 genotype in male and
female volunteers (n=109)
129
4.58 Comparison of Aspirin phenotype/rs8330 genotype in male volunteers
(n=50)
130
4.59 Comparison of Aspirin phenotype/rs8330 genotype in female
volunteers (n=50)
130
4.60 Comparison of Aspirin phenotype/rs8330 genotype in male and female
volunteers (n=109)
131
4.61 Comparison of Aspirin phenotype/rs1131878 genotype in male
volunteers (n=59)
131

xii
4.62 Comparison of Aspirin phenotype/ rs1131878 genotype in female
volunteers (n=50)
131
4.63 Comparison of Aspirin phenotype/ rs1131878 genotype in male and
female volunteers (n=109)
132
4.64 Comparison of Aspirin phenotype/ rs2013573 genotype in male
volunteers (n=59)
133
4.65 Comparison of Aspirin phenotype/rs2013573 genotype in female
volunteers (n=50)
133
4.66 Comparison of Aspirin phenotype/rs2013573 genotype in male and
female volunteers (n=109)
133

xiii
LIST OF FIGURES
Figure No. TITLE Page No.
2.1 Conjugation reactions catalyzed by UDP-Glucuronosyltransferase 09
2.2 Representation of human UGT1A locus 12
2.3 Classification of super family UGT into subfamilies UGT1 and UGT2
and their location on respective chromosomes
14
2.4 Polymorphic variations in UGT1A and UGT2B genes showing
position of mutated amino acids
16
2.5 Chemical structure of paracetamol and paracetamol glucuronide 25
2.6 Chemical structure of aspirin and aspirin glucuronide 29
3.1 Comparative levels of demographic data in male (n=60) and female
(n=50) healthy subjects.
36
3.2 Representative chromatogram of standard 40µg/mL PAR-Glu and
PAR
40
3.3 Representative chromatogram of plasma sample of volunteer 41
3.4 Representative chromatogram of standard 40µg/mL ASP-Glu and
ASP
42
3.5 Representative chromatogram of plasma sample of volunteer 42
3.6 Agarose gel electrophoresis after genomic DNA extraction from
venous blood of male volunteers. Five µL of DNA along with 1 kb
DNA ladder (1 µL) was electrophoresed on 1.0% agarose gel and its
quality was checked after RedSafe™ staining
45
3.7 Agarose gel electrophoresis after genomic DNA extraction from
venous blood of male volunteers. Five µL of DNA along with 1 kb
DNA ladder (1 µL) was electrophoresed on 1.0% agarose gel and its
quality was checked after RedSafe™ staining.
46
3.8 Agarose gel electrophoresis after genomic DNA extraction from
venous blood of female volunteers. Five µL of DNA along with 1 kb
DNA ladder (1 µL) was electrophoresed on 1.0% agarose gel and its
quality was checked after RedSafe™ staining
46
3.9 Agarose gel electrophoresis after genomic DNA extraction from
venous blood of female volunteers. Five µL of DNA along with 1 kb
DNA ladder (1 µL) was electrophoresed on 1.0% agarose gel and its
quality was checked after RedSafe™ staining
47
3.10 Allele discrimination plot of homozygous for allele 1/ allele 1,
homozygous for allele 2/ allele 2 and heterozygote for the SNP
rs10929303
50
3.11 Amplification plot of homozygote allele 2/allele 2 (T/T) for the SNP
rs10929303 after qPCR.
50
3.12 Amplification plot of heterozygote allele 1/allele 2 (C/T) for the SNP
rs10929303 after qPCR
51
3.13 Allele discrimination plot of homozygous for allele 1/ allele 1,
homozygous for allele 2/ allele 2 and heterozygote allele 1/allele 2 for
the SNP rs8330
51
3.14 Amplification plot of homozygote allele 1/allele 1 (C/C) for the SNP 52

xiv
rs8330 after qPCR
3.15 Amplification plot of homozygote allele 2/allele 2 (G/G) for the SNP
rs8330 after qPCR
52
3.16 Amplification plot of heterozygote allele 1/allele 2 (C/G) for the SNP
rs8330 after qPCR
53
3.17 Allele discrimination plot of homozygous for allele 1/ allele 1,
homozygous for allele 2/ allele 2 and heterozygote allele 1/allele 2 for
the SNP rs2013573
53
3.18 Amplification plot of homozygote allele 1/allele 2 (C/C) for the SNP
rs2013573 after qPCR
54
3.19 Amplification plot of homozygote allele 2/allele 2 (T/T) for the SNP
rs2013573 after qPCR
54
3.20 Amplification plot of heterozygote allele 1/allele 2 (C/T) for the SNP
rs2013573 after qPCR
55
3.21 Allele discrimination plot of homozygous for allele 1/ allele 1,
homozygous for allele 2/ allele 2 and heterozygote allele 1/allele 2 for
the SNP rs1131878.
55
3.22 Amplification plot of homozygote allele 1/allele 1 (C/C) for the SNP
rs1131878 after qPCR
56
3.23 Amplification plot of heterozygote allele 1/allele 2(C/T) for the SNP
rs1131878 after qPCR
56
3.24 Amplification plot of homozygote allele 2/allele 2 (T/T) for the SNP
rs1131878 after qPCR
57
3.25 Allele discrimination plot of homozygous for allele 1/ allele 1,
homozygous for allele 2/ allele 2 and heterozygote allele 1/allele 2 for
the SNP rs1902023
57
3.26 Amplification plot of homozygote allele 1/allele 1 (A/A) for the SNP
rs1902023 after qPCR
58
3.27 Amplification plot of homozygote allele 2/allele 2 (C/C) for the SNP
rs1902023 after qPCR
58
3.28 Amplification plot of heterozygote allele 2/allele 2 (A/C) for the SNP
rs1902023 after qPCR.
59
4.1 Comparative levels of hemoglobin, total RBCs, total WBCs,
monocytes and eosinophils in male (n=59) and female (n=50) healthy
subjects
65
4.2 Comparative levels of Hct, MCV, MCH, MCHC, Lymphocytes,
Neutrophils and Platelet count in male (n=59) and female (n=50)
healthy subjects
65
4.3 Comparative levels of billirubin, creatinine, total protein, albumin,
globulin and albumin/ globulin ratio in male (n=59) and female (n=50)
healthy subjects
66
4.4 Comparative levels of TGs, Cholestrol, HDL and LDL, ALT, AST
and urea in male (n=59) and female (n=50) healthy subjects
66
4.5 Probability plot of paracetamol-glucuronide/paracetamol metabolic
ratio in healthy male and female volunteers (N=109) showing cut off
points
73
xv
4.6 Frequency histogram of metabolic ratio of PAR-Glu/PAR showing
trimodal distribution (slow, intermediate and fast) of healthy male
volunteers (n=59).
79
4.7 Frequency histogram of metabolic ratio of PAR-Glu/PAR showing
trimodal distribution (slow, intermediate and fast) of healthy female
volunteers (n=50).
80
4.8 Frequency histogram of metabolic ratio of PAR-Glu/PAR showing
trimodal distribution (slow, intermediate and fast) of healthy male and
female volunteers (n=109).
80
4.9 Probability plot of aspirin-glucuronide/aspirin metabolic ratio in
healthy male and female volunteers showing cut off points.
82
4.10 Frequency histogram of metabolic ratio of ASP-Glu/ASP showing
trimodal distribution (slow, intermediate and fast) of healthy male
volunteers (n=59).
90
4.11 Frequency histogram of metabolic ratio of ASP-Glu/ASP showing
trimodal distribution (slow, intermediate and fast) of healthy female
volunteers (n=50).
91
4.12 Frequency histogram of metabolic ratio of ASP-Glu/ASP showing
trimodal distribution (slow, intermediate and fast) of healthy male and
female volunteers (n=109).
91
4.13 Agarose gel electrophoresis after PCR amplification of fragment of
UGT1A6 (267 bp) using specific primers from genomic DNA of male
subjects. The amplicons were resolved on 1.5% agarose gel along with
1 Kb ladder from Fermentas
96
4.14 Agarose gel electrophoresis after PCR amplification of fragment of
UGT1A6 (267 bp) using specific primers from genomic DNA of
female subjects. The amplicons were resolved on 1.5% agarose gel
along with 1 Kb ladder from Fermentas
96
4.15 Agarose gel electrophoresis after digestion with Nsil and Fnu4H1
restriction enzyme DNA fragments were resolved on 3 % agarose gel
along with marker from Fermentas in volunteers.
97
4.16 Agarose gel electrophoresis after digestion with Nsil and Fnu4H1
restriction enzyme DNA fragments were resolved on 3 % agarose gel
along with marker from Fermentas in volunteers.
97
4.17 Agarose gel electrophoresis after digestion with Nsil and Fnu4H1
restriction enzyme DNA fragments were resolved on 3 % agarose gel
in volunteers
98

xvi
ABSTRACT
The recent project was planned to determine the UGT1A and UGT2B glucuronidation in human
population by administering probe drugs such as paracetamol and aspirin under indigenous
conditions. At predetermined time intervals, blood samples of the volunteers were taken after
drug administration. High performance liquid chromatography (HPLC), PCR which is based on
allele specific amplification assay followed by RFLP (restriction fragment length polymorphism)
and real time PCR. These techniques were employed for determination of glucuronidation level
by both phenotypically and genotypically. Correlation between phenotype and genotype was
determined. Biochemical parameters such as complete blood picture, alanine aminotransferase
(ALT), aspartate aminotransferase (AST), lipid profile (Cholestrol, triglycerides, HDL and
LDL), total protein, urea level and creatinine of the volunteers were recorded. This was helpful
for clinical investigation under indigenous conditions. The categorization of glucuronidation
phenotype for paracetamol in all healthy volunteers (n=109) displayed that 57% (54.24% male
and 60% female) and 34% (38.98% male and 32% female) of the under study population had fast
and intermediate glucuronidation, respectively whereas 7% (6.78% male and 8% female) of the
population was categorized as slow glucuronidators. Similarly, the classification of
glucuronidation phenotype for aspirin in healthy male and female volunteers illustrated that 45%
(44.07% male and 46% female) of the population was fast and 46% (45.76% male and 46%
female) of the population had intermediate glucuronidation and at the same time 9% (10.17%
male and 8% female) of the population was categorized as slow glucuronidator. The UGT1A1,
UGT1A6 and UGT2B15 genes showed good to moderate concordance with paracetamol and
aspirin phenotypes whereas association of UGT2B4 gene with paracetamol and aspirin was poor
or non-significant.

xvii
Chapter 1 INTRODUCTION
Genetic polymorphism is the variation in sequence of DNA among populations and
individuals. Inter ethnic variations in drug response are connected to polymorphisms with racial
populations showing discrete allele frequencies and inconsistency from each other (Balram et al.,
2003; Chowbay et al., 2005 and Tate and Goldstein, 2004). Genetic polymorphisms may occur
by chance and they may be caused by some agents such as chemicals, radiations or viruses. In
human genome, the most common source and simple form of genetic polymorphism is the SNP
and it contributes to ninety percent of human DNA polymorphisms. Genetic polymorphisms of
DMEs (drug metabolizing enzymes) can influence the biodisposition of drugs and thus alter the
concentration of drugs in plasma and in target tissues (Ma and Lu, 2011).
In human population, person to person variations in expression and activity of drug
metabolizing enzymes have been associated with the variations in responses to toxicants,
carcinogens and drugs (Cascorbi, 2006). Progress in pharmacogenetics has displayed that a series
of drug-metabolizing enzymes become extremely essential to consider the biotransformation of
drugs. Allelic variants with different catalytic functions have been recognized from common and
wild type allele as the number of drug-metabolizing enzymes is increased. In individualizing
drug therapy, these specific genetic variants are valuable to phenotype/genotype an individual
(Westphal et al., 2000; Satoh, 2007). Hence, the association between genetics and
biotransformation of drugs has recently been the focus of extreme investigational activity.
Pharmacogenetics enable personalized therapy based on genetic profiling and describes
patients’ variation in response to therapy due to genetic factors. Pharmacogenetics is the study of
inter individual differences in sequence of particular genes affecting drug metabolism (Hess and
Cooper, 1999; Rusnak et al., 2001). Single nucleotide polymorphism (SNP) in genes of drug-
metabolizing enzymes affects the response of drug to body and absorption, distribution,
biotransformation and excretion of drugs. These SNPs are source of inter-individual and inter-
ethnic differences. Some mutations in coding region causes amino acid change that result in
alterations of enzyme activity, substrate selectivity and sometimes, protein stability. Ensuing
functional differences cause different metabolizer phenotypes (Matimba et al., 2009).
Pharmacogenetics analysis provides insight to mechanisms included in drug response, with
ultimate goal to achieve optimal drug efficacy and safety (Lhermitte et al., 2006).

xviii
Genetic polymorphism within a population arises as a result of alteration in genes
encoding metabolizing enzymes with a variant allele frequency of more than 1% (Meyer, 2000).
For such genes, an allelic site has many SNPs which causes altered and even absent enzyme
function and regulation by several mechanisms. Genotype is the comprehensive study of an
organism’s genetic make-up while the observable traits of an individual describe its phenotype.
As the interaction between genetic make-up and environment produce phenotype which is not
correlated with genotype always (Shenfield, 2004).
Drug metabolizing enzymes (DMEs) have a significant role in biotransformation and
final excretion of xenobiotics and drugs by increasing their hydrophilicity. Biotransformation of
drugs is usually comprised of phase I (oxidation, reduction and hydrolysis) reactions carried out
by cytochrome P450 enzyme and phase II conjugation reactions involve glucuronidation by
uridine diphosphate-glucuronosyltransferases (UGTs), acetylation by N-acetyltransferase (NAT)
and glutathione-S-transferase in liver, with numerous proteins accountable for transportation.
These phase 1 and phase 2 enzymes are highly polymorphic leading to variation in the level of
enzyme expression in vivo (Koo and Lee, 2006).
The first polymorphism in drug metabolizing enzyme was reported in patients more than
40 years ago with the incidence of side effects after administration of recommended therapeutic
dose of drug ((Meyer and Zanger, 1997). An array of possible physiological and environmental
factors has been assigned to human variability in drug response. The physiological features
consist of hepatic and renal function, age, gender, bodyweight whereas the environmental
features include concomitant drug administration, contact to definite chemicals and dietary
intake as well. Genetic factors have traced that individual’s body respond to drug therapy in
different way as some people are well tolerated while others have harmful effects (Koo and Lee
et al., 2006).
The uridine diphosphate-glucuronosyltransferases (UGTs) exist in almost all living
beings counting microorganisms (viruses, bacteria), animals, plants, and humans. UDP-
glucuronosyltransferase is a microsomal enzyme carrying the glucuronidation of several
exogenous (different carcinogens as well as drugs) and endogenous compounds (bilirubin; break
down product of heme, hormones). Glucuronidation is a primary reaction for the removal of
countless substrates and drug compounds. The genetic variations in UGT enzyme lead to its

xix
changed regulation and expression. The activities of UDP-glucuronosyltransferase contribute to
pharmacological and physiologic consequences (Desai et al., 2003).
In humans, main drug-metabolizing reaction called glucuronidation is catalyzed by
uridine disphospho glucuronosyltransferase enzyme (EC 2.4.1.17). Glucuronidation is the
conjugation of small lipophilic molecules with uridine diphosphate (UDP) as a sugar donor,
altering them into more water-soluble metabolites and accounts for 40–70% of xenobiotic
elimination approximately (Ahn et al., 2014). UDP-glucuronosyltransferases are primarily
expressed in the liver but are also distributed in various organs of body including heart, kidney,
thymus, spleen, olfactory epithelium, brain, intestine, adrenal glands and lungs (Tukey and
Strassburg, 2000).
The superfamily UGT is divided into four subfamilies called UDP-
glucuronosyltransferase 1, UDP-glucuronosyltransferase 2, UDP-glucuronosyltransferase 3 and
UDP-glucuronosyltransferase 8. This classification is kept on sequence similarity at the level of
amino acid. The isozymes of family UGT1A have first exon that is spliced into two to five
common exons and thus producing a C-terminal and N-terminal domain. Gene-specific promoter
region is possessed by each member of UGT1A family (Mackenzie et al., 2005). The thirteen
isoenzymes of UGT1A gene (9 functional and 4 pseudo genes) are all originated due to alteration
in exon 1 region of this gene located on chromosome 2q37 and six isoforms of UGT2B
subfamily emerge to be encoded by a rigid cluster of separate genes located on chromosome four
in humans (Turgeon et al.,2001).
In human population, wide variations are found in their glucuronidation capacity of
drugs. The extent of variations can range from 3 fold to more than hundred fold, considering the
studied drug. Many genetic and environmental factors act discretely and in combination to
produce broad inter individual differences. Phenotype like glucuronidation capacity of UGT is
not separated from genotype but somewhat displays continuous and overlapping changes due to
multiple interacting environmental and genetic factors (Vesell and Gaylor, 1995).
In general population, polymorphisms in phase 1 and phase 2 drug metabolizing enzymes
lead to differences in enzyme expression level. This variability in enzyme expression is due to
presence of genetic polymorphisms and mutations in the wild-type gene resulting in impaired or
reduced activity of enzyme. Individuals having mutated enzymes may differ from normal
individuals in their vulnerability to certain diseases. Some specific phenotypes for these

xx
polymorphic enzymes are related to increased vulnerability to cancer, predominantly lung,
bladder cancer and Parkinson's disease. This altered enzyme activation or certain chemicals
including constituents of tobacco, xenobiotics and neurotoxin initiate these diseases (Daly et al.,
1991).
Biotransformation is a key process in body that finds out the pharmacokinetics of an
administered drug. Several factors, which control the level of biotransformation, include
physiological state of patient, genetics, and co administered drugs and these may cause toxic or
sub therapeutic concentration of drugs. The large inter individual variability is gradually
accumulating in glucuronidation due to underlying genetic mechanisms but a few
polymorphisms have been described in UGTs with probable clinical relevance. The
polymorphisms can lead to altered drug clearance with a clinically relevant phenotype. However,
the proof in vivo for such a link is very weak (Wells et al., 2004).
Biotransformation of drugs enhances polarity and excretion of these compounds in urine
in form of their water soluble conjugates which are usually harmless for body but a small number
of glucuronides show biological activity. Uridine disphospho glucuronosyltransferase (UGT)
enzymes are critical for metabolism of hydroxamic acids via N-O-glucuronidation which lead to
formation of active metabolites of these compounds associated with carcinogenesis or the acyl
glucuronides of carboxylic acids which lead to detoxification and exhibit higher polarity and
excretability (Faed, 1984; Spahn-Langguth and Benet, 1992). Endogenous substrates for UGTs
are comprised of metabolic by-products and steroids such as bilirubin, testosterone, estradiol and
androsterone. Several xenobiotics such as non steroidal anti-inflammatory drugs
(acetaminophen, aspirin) and anti-convulsants, anti-psychotics, anti-virals and analgesics as well
as dietary flavonoids extracted from plants, carcinogens, and other pollutants serve as substrates
for UGTs (Miners and Mackenzie, 1991; Kiang et al., 2005; Sorich et al., 2006; Court, 2010). In
metabolism of broad range of drugs, UDP-glucuronosyltransferase has a noteworthy role. In
human population, individual to individual variations exist genetically in UGT activity and are
phenotypically divided as rapid or slow glucuronidator. On the basis of UDP-
glucuronosyltransferase activity, humans are divided into bimodal and trimodal distribution. In
bimodal distribution, humans are categorized as fast and slow glucuronidators or fast,
intermediate and slow glucuronidators in trimodal distribution. UGT1A and UGT2B subfamilies
exhibit overlapping but different substrate specificities and variable levels of expression in

xxi
different organs (Tukey and Strassburg, 2000; Guillemette, 2003; Ouzzine et al., 2003; Wells et
al., 2004).
An increasing integer of functional SNPs (single nucleotide polymorphisms) is identified
in humans at UGT1A gene locus with a potential relevance for drug therapy. A single nucleotide
polymorphism or combination of multiple nucleotide substitution and insertion or deletion is
responsible for allelic variants of UGT (UGT1A and UGT2B) (Innocenti et al., 2004). The most
common isoforms of UGT associated with drug metabolism are UGT1A1, 1A6, 1A9 and
UGT2B4, UGT2B15. Many studies have described associations between specific phenotypes for
UGT polymorphic enzyme and susceptibility to cancer, particularly lung and bladder, breast
cancer, Parkinson's disease, and the autoimmune disease systemic lupus erythematosus. These
associations may be due to differences in the ability of enzyme phenotypes to activate or
detoxify chemical toxins or, alternatively, to linkage disequilibrium where a particular allele
coding for another gene with a direct role in determining disease susceptibility shows genetic
linkage with an allelic variant of the xenobiotic-metabolizing enzyme (Daly et al., 1994).
Allelic analysis disclosed the presence of rare alleles. Since the racial variation exists in
the frequency distribution of rare and wild type alleles, and distribution of alleles in one ethnic
group is not necessarily applicable to other (Oliveira et al., 2002). Hence, different allele
frequency distribution determined variation in glucuronidation capacity that may modify contact
to carcinogens and this manipulates individual vulnerability to environmental exposure.
The grouping of genotyping and phenotyping can be hypothesized as an appropriate tool
to optimize therapy with xenobiotics in the future which are subject to glucuronidation. Today,
the focus of intense investigation is to determine the variability in biotransformation of drugs and
xenobiotics with reference to genetics because of its inferences for clinical therapy, drug
development, and toxicology. The study of polymorphic enzymes for drugs undergoing
biotransformation is more noteworthy than development of drug but is not considered usually
(Kinzig-schippers et al., 2005). To comprehend the functional worth of each variant allele and to
have specific and accurate diagnostic tests, there is need to characterize the extent of allelic
variation at UGT gene locus for categorizing them in population and epidemiological studies.
Genetic polymorphisms lead to truncated and shorten gene which efficiently diminishes
enzymatic activity and even a single mutation alone can account for decrease or increase in
enzymatic regulation. On the other hand, increased and elevated enzymatic activity may be due

xxii
to elevated mRNA stability (Court et al., 2002). Hence, the current study was designed to find
out some of allelic variation at UGT1A and UGT2B gene locus. There was no data available on
UGT glucuronidation to phenotype/genotype healthy population of Pakistan. The results of the
current study will be practical for understanding the inherited basis and for further clinical
studies of UGT polymorphism regarding glucuronidation. Thus in current study, the
glucuronidation phenotype and genotype of UGT1A and UGT2B genes was examined in healthy
male and female volunteers of Pakistan.
Aims and objectives
To determine and compare the glucuronidation status of two probe drugs,
paracetamol and aspirin in healthy female and male volunteers.
To determine inter individual variability in the biotransformation capacity in human
population.
To compare UGT1A and UGT2B genotype and distribution of UGT1A and UGT2B
mutant or variant alleles in female and male healthy volunteers.
To establish concordance between phenotype and genotype.

xxiii
Chapter 2 REVIEW OF LITERATURE
Many drugs used for therapy of human beings are metabolized by glucuronidation before their
elimination from the body. The rate of glucuronidation is polymorphic and is determined
genetically i.e. subjects in a population can be discriminated as slow and fast glucuronidators on
the basis of their capacity to change a specific drug substrate into their glucuronidated
derivatives (Burchell et al., 1995). Many unwanted chemical reactions of drugs have been
associated with their glucuronidation status. Hence, it is essential to know the glucuronidation
phenotype of individuals in occupational and clinical set up and for this purpose, several
screening techniques by using different probe drugs should be developed.
2.1. UDP-glucuronosyltransferases (UGTs)
The covalent conjugation of sugar with small organic molecule is brought about by a
super family UDP-glucuronosyltransferase (UGT). This super family of UDP-
glucuronosyltransferase enzyme is found in microorganisms (bacteria), plants and animals and is
developed by gene replication and variation to maintain contact to an altering environment of
lipid soluble compounds. The UDP-glucuronosyltransferases are protein in nature that are bound
to membrane and are confined to the smooth endoplasmic reticulum (SER) and nuclear
compartment of cell. They have significant role in glucuronidation of many endobiotics and
xenobiotics (Desai et al., 2003). UGTs are synthesized as approximately five hundred and thirty
(530) residues precursor containing an N-terminal signal peptide (Mackenzie and Owens, 1984).
The mammalian UGT super family comprises of 4 families denoted by UGT 1, UGT 2,
UGT 3 and UGT 8.The members of each of these four families can also be recognized in various
lower vertebrates. The UGT super family comprises of all glucosyltransferases that contain the
UGT signature sequence (FVA)-(LIVMF)-(TS)-(HQ)-(SGAC)-G- X(2) -(STG)-X(2)- (DE)-
X(6)-P-(LIVMFA)-(LIVMFA)-X(2)-P-(LMVFIQ)- X(2)- (DE)-Q, (X is any amino acid)
(Mackenzie et al., 1997), and add sugar to small lipophilic compounds. Glucuronidation of
compounds forms a range of glucuronides containing functional groups (O-, N-, S- and C-)
which significantly enhance the solubility of the parent drugs and terminates its biological effect
(Mackenzie et al., 2008).
Approximately, the drugs from all therapeutic classes containing an extensive range of
acceptor groups pass through glucuronidation process. But non steroidal anti inflammatory drugs

xxiv
and analgesic agents are usually metabolized by this mechanism. It is well recognized that the
liver has the maximum abundance and array of UDP-glucuronosyltransferases (Izukawa et al.,
2009; Ohno and Nakajin, 2009). The members of UGT1A and UGT2B subfamilies are also
found in many other tissues and organs incorporating, the epithelium, brain, nasal cavity,
stomach, small intestine, colon, kidneys, lungs, ovaries, mammary glands, testis and prostate
gland, in addition to hepatic abundance (Tukey and Strassburg, 2000; Gaganis et al., 2007; Ohno
and Nakajin, 2009). The kidneys and GIT (gastrointestinal tract; stomach, small intestine and
colon) are the most important extra-hepatic sites in case of drug metabolism (Gaganis et al.,
2007; Knights and Miners, 2010). All members of the UGT1A and UGT2B families are
expressed differentially in human liver with the exception of some members of both families
including UGT1A5, 1A7, 1A8, 1A10 and 2A1 (Miners et al., 2004; Zhang et al., 2005). In
contrast to the UGT1A and UGT2B, members of UGT3 family are principally expressed in
thymus, testis and kidney with nearly untraceable expression in liver and GI tract (Mackenzie et
al., 2011).
Substrates containing different functional groups form different glucuronides like
aliphatic alcohols and phenols form ether glucuronides, while those containing a COOH- group
form ester glucuronides (acyl glucuronides). The compounds which possess both phenolic as
well as COOH- groups can be transformed into both ether and ester glucuronides such as
mycophenolic acid (MPA). Glucuronidation of amines (primary, secondary, and tertiary) and
sulfhydryl compounds result in the formation of N-glucuronides and S-glucuronides,
respectively whereas C-glucuronides are obtained from compounds containing carbonyl group.
The most common and rare drug glucuronides in humans are O-glucuronides and C-
glucuronides, respectively (Shipkova and Wieland, 2005).
2.1.1. UGT isozymes:
UDP-glucuronosyltransferase enzyme catalyzes the transfer of sugar glucuronic acid
(GA) from uridine-diphospho-glucuronic acid (UDP-GA) to various exogenous as well as
endogenous compounds containing hydroxyl, thiol, amine, carbonyl, carboxylic and
hydroxylamine due to structural diversity of the substrates. Binding with glucuronic acid is the
quantitatively most important phase II reaction and is a primary pathway in nature for
detoxification of a wide range of drugs, dietary compounds, cancer causing agents and their
oxidized metabolites, and a variety of environmental chemicals and thus excreting lipid soluble

xxv
waste compounds from the body in urine and bile (Miners and Mackenzie, 1991; Kiang et al.,
2005).
The large substrate specificity of each UGT isoform makes possible the glucuronidation
of structurally isolated molecules. In humans, roughly (40–70%) drugs administered clinically
undergo glucuronidation (Wells et al., 2004). In humans, 19 UGT isoforms have been
recognized, expressed and differentiated: 9 UGT1A members encoded by the UGT1A gene locus
are positioned on chromosome number 2 and nine members of UGT2B family (7 members of
UGT2B and 2 members of the UGT2A subfamily) were located on chromosome 4. The isoforms
of the UGT1A and UGT2B families have a key role in dispensing lipophilic compounds because
of their ability to glucuronidate an extensive array of structurally different substrates.
Different UGT isoforms are involved in formation of drug glucuronides but they reveal
overlapping and unusual substrate selectivity and specificity. Individual UGTs differ from each
other in sense of regulation and expression. UGT activity is known to be affected by
physiological and environmental factors like age, diet, disease state, induction and inhibition of
UDP-glucuronosyltransferase by chemicals, ethnicity, genetic polymorphism and hormonal level
(Miners et al., 2004).
Following are some of general conjugation reactions of glucuronidation carried by UGT.
R -OH + UDP -GA → UDP + R -O-GA
R – SH + UDP -GA → UDP + R - S-GA
R -NH2 + UDP-GA → UDP + R NH−GA
R –CHO + UDP -GA → UDP + R -CO-GA
R -COOH + UDP –GA → UDP + R –CO−(OGA)
R -NHOH + UDP -GA → UDP + R -N−(OH)GA
Figure 2.1 Conjugation reactions catalyzed by UDP-glucuronosyltransferase (Ritter, 2002)
The 19 human UGT cDNAs have been identified, expressed, and characterized: nine UGT1A
proteins encoded by the UGT1A locus, located on chromosome 2 and nine proteins encoded by
UGT2 genes (seven members of the UGT 2B subfamily, and two members of the UGT2A

xxvi
subfamily), which were mapped to chromosome 4. The members of the UGT 1 and 2 families
have a major role in processing lipophilic chemicals due to their capacity to glucuronidate a
broad range of structurally-dissimilar substrates.
The formation of drug glucuronides involves more than one and different UGT isoforms
exhibiting overlapping but different substrate specificities. Individual UGTs differ in terms of
regulation of expression. Age, diet, disease states, induction and inhibition by chemicals,
ethnicity, genetic polymorphism and hormonal factors are known to influence UGT activity
(Miners et al., 2004). There are many enzymes in humans that are polymorphic in nature and
metabolize a variety of drugs through biotransformation reactions presented in Table 2.1.
Table 2.1.Conjugation of drugs metabolized by different polymorphic enzymes
Polymorphic
Enzymes
Endogenous
Cofactor
Reactions Specific
Substrate
Metabolite Reference
Sulfotransferase
(SULT)
Sulfate Sulfation Salbutamol Salbutamol
sulfate
Lau and
Critchley,
1994
UDP-
glucuronosyltransf
erase (UGT)
UDP
glucuronic
acid
Glucuronidat
ion
Morphine
morphine–3-
glucuronide
Smith et
al., 1990
Glutathione-S-
transferase (GST)
Glutathione Glutathione
conjugation
Doxorubicin Glutathione
metabolite
Ekhart et
al., 2008
N-acetyltransferase
(NAT)
Acetyl-CoA Acetylation SMX
Caffeine
N-Ac SMX
AFMU
Cantilena
et al., 2004
Grant et
al.,1984
Methyltransferase
(MT)
Methyl Methylation Mercaptopuri
ne,
captopril
Methyl
metabolite
Mannisto
and
Kaakkola,
1999

xxvii
2.1.2. UDP-glucuronosyltransferase 1:
The UGT1A isoforms are encoded by a single intricate and complex locus that is organized
similarly in all mammals. The nine functional proteins are encoded by UGT1A gene locus (1A1,
1A3, 1A4, 1A5, 1A6, 1A7, 1A8, 1A9 and 1A10). In humans, the UGT1A gene size is about 200
kb located on chromosome 2q37 and encodes 13 isozymes. Each isoform has a distinctive
promoter region, unique exon-1, and shares (2–5) four common exons (Ritter et al., 1992; Gong
et al., 2001). Transcription is commenced at unique promoter. Consequently each of the thirteen
transcripts has a unique 5′ end and a similar 3′ end which is engaged in identification of the
UDP-sugar molecule. The human UGT1A locus is presented in Figure 2.2. The human UGT1A
isoforms can be divided into four groups on the basis of sequence resemblance, amplification
and divergence of gene: UGT1A1, UGT1A6, and UGT1A2P to 1A5 cluster and UGT1A7 to
1A13P cluster. Exons of UGT1A1 and UGT1A6 made proteins that are nearly 50% alike;
conversely, within exons of 1A2P–1A5 and 1A7–1A13P clusters; the resulting proteins are more
than 90% identical (Mackenzie et al., 2005). Four members (1A2P, 1A11P, 1A12P and 1A13P)
of UGT2A subfamily have been recognized as pseudo genes since they have mutations that
would avert their translation into functional proteins. It has been observed that complexity to the
UGT1A locus produces another form of the common exon 5 so called as 5b exon that can be
merged into the human UGT1 proteins. The alternative forms produce mRNAs that encode
smaller polypeptides of each UGT1 protein. These smaller proteins do not have a trans
membrane part but keep their ability to confine themselves to smooth endoplasmic reticulum.
These small UGT1 forms are nonfunctional and can hetero dimerize with whole UGT1 form and
lack their activity (Girard et al., 2007). In human tissues, short-form UGT1 transcripts are largely
distributed and expressed at considerable levels (Bellemare et al., 2010). UGT1A1 is the most
important isoform of UGT1A gene that bring about the glucuronidation of bilirubin (breakdown
product of hemoglobin) which requires to be eliminated from the body. Genetic alterations in the
UGT1A gene presumed to have intense effect on the health of affected individuals; particularly
those modify UGT1A1 activities and correspond to rare mutations. Sixty rare mutations have
been well-known as point mutations, deletions and insertions in UGT1A1 gene. Only a small
number of these mutations were occurred in common population at adequately high frequency of
41%.

xxviii
Figure.2.2. Representation of human UGT1A locus. Each UGT1A gene having a distinctive first
exon [A] and a common set of four downstream exons (2–5). Splicing of exon [A] results in the
formation of nine unique UGT1A isoform (Rowland et al., 2013)
These mutations called polymorphisms in TATA box region of UGT1A1 promoter produces
variant alleles that leads to decrease in activity and rate of glucuronidation by UDP-
glucuronosyltransferase (Bosma et al., 1994-1995; Beutler et al., 1998 and Guillemette et al.,
2000). These mutations in the UGT1 gene are correlated with two forms of the un conjugated
hyper bilirubinemia syndromes. The wild type and common variant allele include six and seven
repeats, respectively (Monaghan et al., 1996). The UGT1A isoforms appeared to be expressed at
a lower level in different populations of the world: approximately 0–3% in Asian population, 2–
13% in Caucasian population and up to 16–19% in Africans (Guillemette et al., 2000).
Paracetamol is mainly cleared by hepatic glucuronidation from the body. Inter individual
variability in capacity to glucuronidate paracetamol and possible risk for liver damage could be
explained by polymorphisms in genes encoding the paracetamol glucuronidation (Bridger et al.,
1998).
Court et al., (2013) used human liver samples for accessing paracetamol glucuronidation
activity by UGT isoforms (1A1, 1A6, 1A9, and 2B15) that chiefly glucuronidate paracetamol.
Three single nucleotide polymorphisms (rs10929303, rs1042640, rs8330) positioned in 3' un

xxix
translated region of UGT1A1 were found to be associated with paracetamol glucuronidation
activity. Consistently highest glucuroniation activity is observed with SNP rs8330. This single
nucleotide polymorphism did not modify stability of mRNA and translation capacity. In some
pharmacokinetic studies acetominophen and SN-38 were used as phenotyping probes in vivo to
check glucuronidation activity. Forty five patients were given irinotecan and acetaminophen
separately after a specific wash out period and no association was observed between irinotecan
and acetaminophen glucuronidation activity, proposing affinity for many different UGT1
isoforms (Bock et al., 1987; Gupta et al., 1997).
2.1.3. UDP-glucuronosyltransferase 2:
The UGT2 gene family is further divided into two subfamilies on the basis of sequence
resemblance: UGT2A and UGT2B. The genes in each subfamily usually have more than seventy
percent (70%) sequence resemblance. The great level of resemblance makes it complex to
establish orthologous associations between species in each subfamily. Therefore, a sequential
numbering system; based on their chronological order of discovery has been used for UGT2
genes (Mackenzie et al., 1997). In the human genome, the UGT2 family comprises of three
UGT2A and six UGT2B members. The members of UGT2A subfamily are called pseudo genes
as they do not form functional proteins. The members of UGT2B subfamily are encoded by
separate and independent genes including UGT2B4, UGT2B7, UGT2B10, UGT2B11,
UGT2B15, and UGT2B17. The UGT2B genes emerge to be encoded by a firm group of genes
located on chromosome number four (Turgeon et al., 2001).
The members of UGT2 family are supposed to be developing by replication of whole
UGT2 gene. UGT2A3 gene has six distinct exons. But, UGT2A1 and UGT2A2 genes have a
variable and shared exon structure similar to that of the UGT1A family. The UGT2 members
also have first unique exon and a set of (2–6). 5 shared exons. The first two exons of each UGT2
gene encode a region of 241 amino acids similar to that of UGT1A gene locus (Meech et al.,
2012). The classification of super family UGT into subfamilies UGT1A and UGT2B and their
position on respective chromosomes is presented in Figure 2.3.
UGT2B4 gene of UGT2 family plays an important role in biotransformation and
glucuronidation of bile acids allowing their glucuronide efflux from hepatocytes via transporters
such as multi drug resistance-associated protein (MRP) 2 or MRP3 (Pillot et al., 1993 and

xxx
Hirohashi et al., 2000) and detoxification of many phenols (Levesque et al., 1999; Turgeon et
al., 2001; Ritter et al., 1990; Jin et al., 1997 and Monaghan et al., 1997).
Figure 2.3 Classification of super family UGT into subfamilies UGT1A and UGT2B and their
location on respective chromosomes (Guillemette et al., 2010).

xxxi
UGT2B4 gene is expressed in chief metabolizing organ: liver and in several extra hepatic tissues
(Levesque et al., 1999; Turgeon et al., 2001). Polymorphism in the co substrate binding region of
UGT2B4 gene resulted in mutant allele which causes change in position of amino acid from
aspartate to glutamate at 458 codon (Levesque et al., 1999). The single change in position of
amino acid alters the rate of glucuronidation. This variant allele is present in the Caucasian,
African and Hispanic populations at a frequency varying between 0.17-0.38 whereas it is absent
from the Asian population (Levesque et al., 1999; Riedy et al., 2000 and Lampe et al., 2000).
Lampe et al., (2000) used human liver samples to study polymorphisms in UGT2B4 gene. These
polymorphisms cause change in position of amino acids: from phenylalanine to leucine at codons
109 and 396. It was found that these polymorphisms are rare because they were absent in a big
group of 272 individuals.
UGT2B15 gene showed glucuronidation activity towards steroid hormones, a number of
classes of drugs and their metabolites (Levesque et al., 1997; Levesque et al., 1998; Court et al.,
2002; Green et al., 1994). A guanine to thymine replacement at codon eighty five (85) causes an
amino-acid change from aspartate to tyrosine in substrate binding site of UGT2B15 gene. The
homozygous wild type allele is not common in Caucasians as compared to the Asian, Hispanic
and African populations. On the whole, individuals with homozygous variant allele were
occurred in 19% to 32% of the population. Levesque et al., (1998) studied the effect of
UGT2B15 gene polymorphisms on function and enzyme activity in vitro using liver microsomes.
The homozygous variant allele presented same reaction constant (Km) values but the rate of
reaction (Vmax) is two times different for steroid hormones. Court et al., (2002) determined the
functional impact of UGT2B15 variants towards catalytic activities in HEK 293 cellular fractions
by using S-oxazepam as probe drug. The glucuronidation activity of homozygous wild type
allele for S-oxazepam was five times more than homozygous variant allele UGT2B15*2.
Lampe et al., (2000) evaluated the rate of recurrence of the UGT2B4, UGT2B7, and
UGT2B15 polymorphisms in Caucasian and Asian individuals. For all polymorphisms, the
genotype and allele frequencies were considerably different in both populations. The distribution
of the genotypes also differed by ethnic group. All Asians were homozygous for common allele
and incidence of wild type allele is two times higher in them as compared to Caucasians.
Navarro et al., (2011) investigated the effect of UGT1A6 and UGT2B15 genotypes on
paracetamol glucuronidation in a controlled feeding trial. 1000 mg paracetamol was administered

xxxii
to healthy volunteers orally and saliva and urine samples were collected for determining
concentration of paracetamol and its metabolites. The concentration of unchanged paracetamol is
higher in men as compared to women who had more paracetamol glucuronide. The percentage of
unchanged paracetamol is higher in individuals with homozygous common allele relative to
heterozygote and homozygous variants. The UGT2B15 gene considerably affected the
paracetamol glucuronidation while the involvement of UGT1A6 in paracetamol glucuronidation
was moderate.
Mutlib et al., (2006) demonstrated the importance of UGT1A and UGT2B15 genotypes:
1A1, 1A6, 1A9, and 2B15 on paracetamol glucuronidation. It was observed that UGT1A1 and
UGT2B15 contribution was highest in conjugating paracetamol. The polymorphic variations in
UGT1A and UGT2B genes is presented in Figure 2.4.
Figure 2.4: Polymorphic variations in UGT1A and UGT2B genes showing position of mutated
amino acids (Guillemette, 2003)

xxxiii
2.1.4. UDP-glucuronosyltransferase 3:
The third family of UGT super family is UGT3A that consists of two genes: UGT3A1,
UGT3A2 and is situated in a 115 kb piece of chromosome number 5p13. Each gene of this
family includes seven unique exons that are just about 30 kb size and encodes 523 amino acids
of protein. At protein level, both genes are eighty percent (80%) similar which shows larger
conservation of sequence in UGT3A than that found in UGT1A and UGT2B families (Meech
and Mackenzie, 2010).
2.1.5. UDP-glucuronosyltransferase 8:
The fourth family of UGT super family is UGT8 gene family. This family is composed of
a single gene which contains five exons and is situated on chromosome number four (4q26)
together with genes that encode other phase II enzymes. The UGT8 gene is greatly conserved
and does not involve in biotransformation of drugs. This is due to its partial expression in brain
where exposure to xenobiotics is restricted (Meech et al., 2012).
2.1.6. Functional role of UGT
In the beginning, UGT1A and UGT2B families may be developed as a result of great
effort against noxious chemical at the hepato gastro intestinal barrier. Regulation of UGTs may
have developed along with some other DMEs (drug metabolizing enzymes) in the course of
animal and plant competition (Bock, 2003). The families expanded in different ways on different
chromosomes, but similar exon-intron structures encode a protein family with similar functional
architecture despite the amino acid sequence diversity (Burchell et al., 1995). UGTs performed
their functions at pre systemic, systemic level and locally in cells. Glucuronidation by UGT
provides a critical detoxification pathway for exogenous compounds and drugs from several
therapeutic classes, including analgesic and non-steroidal anti-inflammatory agents, anti-
convulsants, anti-psychotics, anti-virals and benzo-diazepines (Miners and Mackenzie, 1991;
Kiang et al., 2005; Sorich et al., 2006; Miners et al., 2010a).
Some substrates and drugs are fairly selective for a particular UGT enzyme as the
endogenous molecule; bilirubin is particularly glucuronidated by UGT1A1 enzyme. But bulk of
substrates (small and hydrophobic molecules) are often metabolized by several UGT isoforms
(Lin and Wong, 2002), thus making it complex to recognize which UGT enzyme is primarily
accountable for the glucuronidation of compounds. The accessibility of individual cDNA has
made it possible to study the function of each UGT enzyme, even though the quantitative

xxxiv
variations in rate of reaction might be present based on their expression (Kiang et al., 2005).
Moreover, there are facts and figures which designate that UDP-glucuronosyltransferase
enzymes are linked as homo and hetero oligomers in vitro and in vivo. Oligomerization may be
necessary for the activity of the UGT enzymes and sometimes it may even vary the rate of the
biotransformation (Lin and Wong, 2002; Ouzzine et al., 2003). Formation and disposition of
glucuronides in cells and even in whole organism is under control of several factors. However,
activity of isoform specific substrate in vitro associates very well with activity in vivo and is
appropriate for anticipation of metabolic detoxification in vivo (Mistry and Houston, 1987; Soars
et al., 2002). The functional significance of numerous UGT isoforms is ambiguous for many
reasons: substrate specificity of isoform is weak displaying overlapping substrate specificity and
substrate conjugating regions of UGT enzymes have not been recognized (Miners et al., 2002).
Lampe et al., (1999) found that individuals possessing homozygous variant allele of
UGT1A1 and UGT1A6 isoform presented abnormality in conjugation of a variety of drugs. In
Tankanitlert’s study the combined effect of UGT1A1 and UGT1A6 genes was investigated on
thalassemic patients. Thalassemic patients were grouped in three categories. It was figured out
that there is no difference in glucuronidation capacity of patients with homozygous wild type
allele and those who were heterozygous but rate of glucuronidation is lower in patients with
variant alleles signifying that variant alleles are potent modifier of acetaminophen
glucuronidation.
2.1.7. UGT and Disease
Human UDP-glucuronosyltransferase enzyme was appeared to be polymorphic
genetically. Genetic polymorphisms in this enzyme are unlikely to participate in toxicity of drugs
since the isozymes illustrate broad overlapping specificity and tissue distribution (Burchell,
2003). Polymorphisms lead to varying degree of transcriptional as well as functional variations
that might reduce the activity of UGT enzyme and consequently affected individuals present
some sort of pathology. The polymorphisms in UGT1A and UGT2B gene families were also
suggested to change the risk of diseases either due to reduced inactivation of hormone or as a
result of decreased detoxification of carcinogenic chemicals and production of their reactive
conjugates (Guillemette, 2003).
The variant alleles of UGT1A1 gene result in some syndromes associated with diminish
bilirubin conjugation capacity of UGT1A1 isoform. Kadakol et al., (2000) summarized the data

xxxv
of approximately fifty polymorphisms of UGT1A1 gene contributing to Crigler Najjar syndrome
type I and II. Crigler Najjar syndrome type 1, also known as non hemolytic jaundice, is entirely
deficient of UGT1A1 activity due to which bilirubin exerts toxic effects on brain. One of the
widespread diseases caused by inactivity of UGT1A1 gene is Gilbert’s syndrome. More than
10% of the population suffered from this localized chaos was differentiated by sporadic
unconjugated hyperbilirubinemia. This syndrome is associated by polymorphism in the promoter
region of UGT1A1 enzyme (Monaghan et al., 1996). In patients of Gilbert’s syndrome, when
irinotecan drug was administered; it resulted in increased toxicity of an active metabolite of SN–
38 because in these patients UGT1A1 gene is not functional as it is responsible for formation of
inactive glucuronide of irinotecan (Wasserman et al., 1997).
Several studies assessed the function and differential expression of the UGT1A isofoms
in colon (Bigler et al., 2001), liver (Tseng et al., 2005), pancreas (Piepoli et al., 2006), and
kidney cancers (Rouleau et al., 2014). The inquiry of a case controlled study exposed that
individuals carrying variant alleles of UGT1A gene were at increased risk of having colorectal
cancer (Tang et al., 2005).
In two independent studies it was investigated that polymorphisms in promoter and
coding regions of UGT1A isoforms were correlated with toxicity of irinotecan drug in Japanese
cancer patients and with neutropenia (Ando et al., 2000; Innocenti et al., 2004).
Yilmaz et al., (2015) examined association between mRNA expression of UGT (1A3 and
1A7) isoforms and pancreatic cancer. Healthy and tumor samples were collected from
pancreatic patients. The mRNA expression of both isoforms of UGT1A gene was notably higher
in pancreatic cancer tissue than normal healthy tissue and this high expression was also linked
with tumor size and its progression.
Cengiz et al., (2015) reported that expression of UGT1A genes was different in healthy
normal and tumor cells of patients suffering from stomach cancer. This differential expression
might affect the growth and progression of a variety of cancers. Several authors studied the role
of UGTs in breast cancer risk and incidence in different populations. They focused on expression
of isoforms of UGT1A gene by using cell lines of breast cancer and concluded that women with
mutations in UGT1A1 enzyme were at higher risk of developing breast cancer due to its reduced

xxxvi
activity but no relationship was observed between estrogen receptor status and UGT1A1
genotype (Guillemette et al., 2000; Adegoke et al., 2004).
Bigler et al., (2001) examined the function of UGT1A6 polymorphisms in healthy
controls and patients of colon adenoma in context of aspirin use. A conflicting association was
found between aspirin users’ colon adenoma patients and the UGT1A6 variants.
Quite a few studies have explored the relationship between polymorphisms of UGT1A7
gene and colorectal, hepatocellular carcinoma and lung cancer in Japanese (Araki et al., 2005;
Wang et al., 2004), Chinese (Tseng et al., 2005), Caucasian (Strassburg et al. (2002), French
(Stucker et al., 2007), and Koreans (Kong et al., 2008) with reduced incidence of common wild
type allele (Ehmer et al., 2004).
MacLeod et al., (2000) observed that the individuals with elevated level of androgens
might be at higher risk of prostate cancer due to presence of lower activity allele and a case
control study verified that the patients of prostate cancer were homozygous for variant allele that
had low enzymatic activity and positive associations were reported between prostate cancer risk
and a low-activity UGT2B15 allele or a complete UGT2B17 deleted gene (Chouinard et al.,
2008; Nadeau et al., 2011). The UGT2B15 gene is recognized to be greatly expressed in cell
lines of prostate cancer (Levesque et al., 1998; Belanger et al., 2003) and a noteworthy
involvement was found between the UGT2B15 homozygous variant genotype and cancer
recurrence (Park et al., 2004). The UGT2B15*2 variant allele appeared to be a risk factor for the
incidence and poor subsistence of patients of breast cancer. It was reported in breast cancer
patients who had mutations in more than one drug metabolizing enzymes as one UGT2B15*2
allele and also the SULT1A1*2 allele had mainly reduced survival rates of five years.
In humans, Uridine diphospho glucuronosyltransferase 2B: UGT2B proteins facilitate the
elimination of testosterone hormone in form of glucuronide metabolites. Grant et al., (2013)
evaluated the association between UGT2B15 and UGT2B17 genes of UGT2B family relative to
plasma levels of androgens and development of cancer in Whites and Blacks. An association was
determined between copy number variant of the UGT2B17 gene and plasma androgen levels in
Whites, but surprisingly no association was found in Blacks.

xxxvii
A number of glucuronides are known to acquire pharmacologically useful and harmful
activities. Morphine is mainly cleared from the body by glucuronidation pathway and possessed
two binding domains (Ritter, 2000). The Morphine-3-glucuronide is a main glucuronide and is a
powerful inhibitor of morphine (Smith et al., 1990; Smith, 2000). The deposition of M-3-G
reduces the effectiveness of morphine and exerts excitatory effects on central nervous system
(Faura et al., 1996; Sjogren et al., 1998). Decreased glucuronidation of morphine to Morphine-6-
Glucuronide in vivo was associated with polymorphisms in UGT2B7 gene (Sawyer et al., 2003).
2.2. Genotype- phenotype relationship
Uridine disphospho glucuronosyltransferase (UGT1A and UGT2B) enzyme contribute to
the removal of miscellaneous drugs, environmental chemicals and endogenous compounds
(Miners and Mackenzie, 1991; Kiang et al., 2005). The majority of human uridine disphospho
glucuronosyltransferase enzymes metabolize aliphatic alcohol and phenol compounds of low
molecular mass. Most of UGT genes contain single-nucleotide polymorphisms (SNPs) those
altered drug metabolism, excretion and drug function and have been found to be associated with
Crigler-Najjar syndrome type 1 and 2, hyperbilirubinemia and Gilbert’s syndrome. It is believed
that SNPs in regulatory regions have the highest impact on phenotype (Miners et al., 2006,
2010a).
Classification of the UGTs implicated in phenotyping reaction of a compound depends
upon the activity of UGT, the expression and the incidence of glucuronidation rate. But the ever-
increasing accessibility of agonists and antagonists probes for individual UGTs provides
dependable prospect for glucuronidation phenotyping (Miners et al., 2006). Moreover, many
factors affect the functions and activities of UGT proteins in vivo such as age (i.e., neonatal
period), consumption of alcohol, smoking of cigarette, diet and nutritional habits, pathological
condition, ethnicity, hormonal factors and polymorphisms of genes (i.e. occurrence or frequency)
(Miners and Mackenzie, 1991; Miners et al., 2002, 2004; Guillemette 2003; Kiang et al., 2005
and Court, 2010).
The techniques required for glucuronidation phenotype of UGT enzymes have been
developed extensively with the discovery and differentiation of specific and selective probes
(substrates and inhibitors), accessibility of recombinant UGT enzymes and optimization of
incubation states necessary for measuring glucuronidation of drugs. Though, the recombinant

xxxviii
preparation of UGTs reveals considerable inconsistency in both, the rate and the specificity of
glucuronidation process (Walsky et al., 2012).
The tissue specific expression of each UGT1A and UGT2B isoforms is the subject of
genetic polymorphisms and these individual isoforms can be induced and inhibited by drugs. The
individual isoforms differed from each other in sense of substrate specificity and selectivity,
incidence of genetic polymorphisms and gene functions that resulted in broad inter individual
variability in metabolic clearance (Soars et al., 2002). It is apparent that polymorphisms in the
coding and regulatory segments of all UGT enzymes are likely to be altered their functions and
expression. In addition, induction of metabolism may increase the clearance of therapeutic agents
leading to sub-therapeutic exposures and lack of pharmacological effect. Alternatively, inhibition
of metabolism may reduce clearance and lead to supra therapeutic exposures resulting in
undesired side-effects or toxicity.
Many polymorphisms have been reported for UGT1A and UGT2B genes and new
polymorphisms are continuously evolving. These polymorphisms affect the phenotype and
extent of variation depends on the nature of the polymorphisms and their position in gene,
(Guillemette, 2003). Knowledge about genetic polymorphisms underlying the extensive inter
individual differences in glucuronidation process is progressively gathering but only a small
number of polymorphisms in UDP-glucuronosyltransferase enzyme has been reported with
possible clinical significance. Patients possessing different genetic polymorphisms illustrated
lower or even diminished glucuronidation of a wide range of drugs from almost all therapeutic
classes. The incidence of polymorphisms is variable in different populations of the world for
various isoforms of UGT1A and UGT2B. The common mutant allele UGT1A1*28 of UGT1A
gene includes 7 (TA) repeats and its frequency in Caucasians is 6 to 12% whereas it is 23% in
Africans and less than 3% in Asians (Guillemette, 2003; Burchell et al., 2003).
Two polymorphisms in exon 1 region of UGT1A6 gene resulted in amino acid
substitutions and these substitutions were likely to be related with reduced enzyme activity
towards numerous phenolic compounds (Ciotti et al., 1997). UGT2B15 gene catalyzes the
metabolism of multiple substrates, thus enhancing their clearance from the body (Green et al.,
1994).

xxxix
Navarro et al., (2011) evaluated the impact of UGT1A6 gene and dietary inducers on
urinary excretion of aspirin in Caucasians and Asians. They undertook this study on healthy 264
men and 264 women aged between 21–45 years. These healthy volunteers were administered
650 mg aspirin and their urine samples were collected at predetermined time intervals.
Considerable variation was found in excretion pattern of aspirin between sexes and ethnicities.
Asians excreted more aspirin, salicylic acid acyl glucuronide and salicylic acid phenolic
glucuronide as compared to Caucasians. Diet might manipulate the excretion of aspirin but
effects were due to binding of glycine endogenous molecule rather than glucuronic acid. In
another study, the glucuronidation of aspirin was undertaken in relevance to UGT isoforms: 1A1,
1A3, 1A4, 1A6, 1A7, 1A8, 1A9, 1A10, 2B4, 2B7, 2B15 and 2B17. It was analyzed that all UGT
isoforms conjugated aspirin except UGT1A4 and UGT2B17 (Kuehl et al., 2006).
2.3. Phenotype:
The word phenotype is derived from two Greek words: phainein, means "to show" and
typos, "type". It is the outward, physical manifestation and combination of an organism's
discernible characteristics and traits including morphology, structures, functions,
metabolism, development, biochemical and physiological states, phonology, behavior, and
products of behavior. The phenotype depends upon which genes are dominant in an individual’s
genetic constitution as well as on environmental factors.
Phenotypic difference is a fundamental prerequisite for descent with modification and
evolution by natural selection due to underlying heritable genetic variation. The living organisms
transmit characteristics from one generation to next generation, thus natural selection influences
the genetic make-up of individuals of a population ultimately via involvement of phenotypes.
There would be no development by natural selection without phenotypic variation. A number of
techniques and methods had been proposed by many researchers to evaluate the genotype and
phenotype relationship on UGT enzyme. For phenotyping, the most reliable method in terms of
sensitivity and selectivity is HPLC. In the present project two probe drugs paracetamol and
aspirin were used for phenotyping of UGT.
2.3.1. Paracetamol (PAR)

xl
Paracetamol, also known as acetaminophen (PAR), is an extensively prescribed
antipyretic and analgesic drug. It is most frequently used for the treatment of mild to fair pain
and fever, acute musculoskeletal pains and acute headache (Wilcock et al., 2013). It is frequently
prescribed solely or in combination with other drugs such as with pseudo-ephedrine, dextro-
methorphan, chlor-pheniramine, diphen-hydramine, doxyl-amine, codeine, hydro-codone, or
oxy-codone. In combination therapy with opioids, paracetamol can also be administered to treat
intense post surgical pain. Paracetamol is an inhibitor of cyclo-oxygenase (COX)-2 reduces
postoperative nausea and vomiting but only when it is administered before, during or
immediately after surgery (Hinz et al., 2008).
2.3.2. Physiochemical properties and chemistry
The chemical name of paracetamol is N-acetyl-p-aminophenol, while its IUPAC name is
N-4-Hydroxyphenyl acetamide. The different synonyms of paracetamol used are 4-
acetamidophenol; acetaminophen; 4-acetaminophenol; 4-acetylaminophenol; 4-N-
acetylaminophenol; 4-hydroxyacetanilide; 4-hydroxyacetanilide; N-4-hydroxyphenylacetamide.
Its chemical formula and molecular mass are C8H9NO2 and 151.17, respectively. Paracetamol is
a white crystalline powder (Verschueren, 1996) and it is soluble in water to some extent but its
solubility is higher in hot water. It is readily dissolved in organic solvents as in methanol,
ethanol, dimethylformamide, ethylene dichloride, acetone, ethyl acetate (Budavari, 1996). The
density of paracetamol is 1.293 g/cm at 21°C and its melting point is 170°C (Lide, 1997).
Paracetamol is available as 350 mg to 500 mg tablets, capsules, liquid
suspensions, suppositories, intra-venous, intra- muscular and effervescent forms. Trade names
for paracetamol include Tylenol and Panadol (Wilcock et al., 2013).
2.3.3. Analysis:
Significant work has been conducted on paracetamol and is analyzed by different techniques.
These included HPLC-UV for detection of paracetamol and paracetamol glucuronide in river
water (Lucia et al., 2013), in syrup and suppositories (Farid et al., 2014), blood spots (Oliveira et
al., 2002), pharmaceutics (Hadad et al., 2009). The chemical structure of paracetamol and
paracetamol glucuronide is presented in Figure 2.4

xli
Figure 2.5 Chemical structure of paracetamol (a), paracetamol glucuronide (b)
The analysis of paracetamol in biological fluids of human and animal such as plasma,
urine, saliva, serum has been conducted. The techniques of analysis encompass mass
spectrometry paired with two dimensional turbulent flow and reversed phase liquid
chromatography (Modick et al., 2013), liquid chromatography paired with electro-spray mass
spectrometry (Tan et al., 2012), HPLC–MS/MS technique (Hewavitharana et al., 2008), RP-
HPLC-DAD (Dewani et al., 2014), RP-HPLC using ion suppression and ion pairing (Hart et al.,
1981), capillary electrophoresis with ultraviolet and mass spectrometric detection (Heitmeier and
Blaschke, 1999). The different chromatographic techniques used for detection of paracetamol
and paracetamol glucuronide in biological fluids are given in Table 2.2.
2.3.4. Pharmacokinetics
Paracetamol is quickly absorbed from the GI tract and its rate of absorption is largely
dependent on empty stomach when administered orally. The absorption of paracetamol is
delayed by presence of food. It distributes rapidly and consistently all through the tissues and
biological fluids. Its volume of distribution is around 0.9 L/ kg.
Table 2.2 Analysis of Paracetamol and its glucuronidated metabolite through chromatographic
techniques
Probe Drug Measurement in
biological fluid
Technique Reference
(a)
(b)

xlii
Paracetamol and
Paracetamol
glucuronide
Plasma and urine
samples of healthy
volunteers
HPLC Lau and Critchley,
1994.
Paracetamol and
Paracetamol
glucuronide
Plasma, urine and saliva HPLC A1-Obaidy et
al.,1995
Paracetamol and
Paracetamol
glucuronide
Urine samples HPLC Girolamo et al.,1998
Paracetamol and
Paracetamol
glucuronide
Plasma and urine
samples of healthy
volunteers
HPLC Jensen et al., 2004
Paracetamol Plasma samples HPLC Locatelli et al., 2015
Paracetamol is chiefly metabolized by liver and produces glucuronide and sulphate
metabolites. In healthy individuals approximately 85-95% of the administered dose is eliminated
in urine. Only 4% of given paracetamol is excreted unchanged while the percentage values for its
conjugates (glucuronide, sulphate, mercapturic acid and cysteine) are 55%, 30% , 4% and 4%,
respectively (Forrest et al., 1982). The glucuronidation of paracetamol was reported in a small
group of 6 healthy individuals and they were administered two tablets of (Panadol TM): each
500 mg. Blood and urine samples, at pre-dose and post dose (0.5-24 h), (0-24 h) were collected,
for the presence of unchanged and glucuronidated paracetamol (total minus unchanged was
considered to be glucuronidated form) respectively (Jensen et al., 2004).
In one study twenty healthy volunteers were administered 1000 mg (1 g) dose of
paracetamol for 4-times every day on three consecutive days and their venous blood and saliva
samples were collected at 0.5-6 h. The concentration in venous plasma, capillary plasma and in
saliva was 45±12.9 mg/1.h, 33.4±12.99 mg/1.h and 35.19 ± 9.4 mg/1.h, respectively (Rittau et
al., 2012). In another study twenty healthy subjects (Chinese=11 and Caucasian=9), aged 21-44
years, male (n=11) and female (n=9) was given 20 mg/kg of paracetamol after an overnight fast

xliii
and their serial plasma samples were collected upto 24h. The peak plasma concentration of
paracetamol and paracetamol glucuronide in Chinese and Caucasian was 23.8 ug/mL, and 9.5
ug/mL and 18.7 ug/mL and 11.2 ug/mL, respectively (Critchley et al, 2005). Hundred healthy
human male volunteers were given 1 g dose of paracetamol to investigate its profile and urine
samples were collected over 8 h. Highest concentration of paracetamol glucuronide was detected
in urine of male volunteers while free paracetamol was only 5.05 ± 2.1% (Pabba et al., 2002).
2.3.5. Paracetamol Toxic Effects:
Multiple undesirable reactions called toxic reactions are related to paracetamol
comprising of dyspepsia, elevated liver enzymes, cholestatic jaundice, acute pancreatitis,
thrombocytopenia, agranulocytosis, anaphylaxis, malaise and hypotension (Twycross et al.,
2013). Paracetamol toxic dose is recognized to cause a serious damage to liver resulting in acute
hepatic failure and even death (Marzilawati et al., 2012). In overdose case, larger amounts of
paracetamol undergo oxidation process by phase 1 enzyme: cytochrome P450 and produces a
reactive intermediate of N-acetyl-p-benzoquinonimine NAPQI because of saturation of the
conjugation pathway. NAPQI is usually inactivated by binding with endogenous glutathione
reserves but, in case of overdose, the body’s glutathione store becomes exhausted and the
accumulation of NAPQI leads to liver parenchymal cell death (Twycross et al., 2013).
In vitro, acetaminophen enhanced apoptosis induced by cisplatin and paclitaxel with
similar effects on glutathione, reactive oxygen species and mitochondrial membrane potential but
different effects on nuclear factor erythroid 2-related factor2 (NRF2) translocation (Wu et al.,
2013). Acetaminophen is harmful to cardio myocytes, and various important genes are affected:
induced genes incorporated oxidative stress, DNA damage, and cell death and repressed genes
integrated those connected with cell proliferation, heart muscles contraction, and cell shape (Jin
and Park, 2012).
2.3.6. Genetic and related effects:
When patients were given 3 g paracetamol orally who had already taken 2 g of pro-
pacetamol by IV infusion at every 6 hour. This process was repeated for seven days. It was
evaluated that paracetamol did not stimulate structural aberrations of chromosomes in peripheral
blood lymphocytes of volunteers (Hantson et al., 1996). In vitro study conducted on leukemic
cell lines, NAPQI a toxic metabolite of over dosed acetaminophen was found to be a powerful

xliv
antagonist of Topoisomerase II enzyme and damage the ability of this enzyme to seal the cleaved
DNA molecule. In this way paracetamol exerts genotoxic effects (Bender et al., 2004).
2.4 Aspirin:
Aspirin: a derivative of salicylic acid is also called acetylsalicylic acid. Aspirin
irreversibly inhibits both cyclooxygenase enzyme 1 and cyclooxygenase enzyme 2. Though the
cyclooxygenase enzyme 1 is a specific target of acetylsalicylic acid. This enzyme consists of two
alike subunits that are joined together to form a dimmer. Aspirin finishes the activity of
cyclooxygenase 2 by blocking active site of enzyme efficiently and thus, barricades the
formation of prostaglandins (Pirkera et al., 2004) Prostaglandin acts as messenger molecule and
organizes different physiological mechanisms in various regions of the body as a general
analgesic to treat headache (Steiner et al., 2003) migraine pain ( MacGregor et al., 2002) sore
throat (Eccles et al., 2003), principal dismenorrhea ( Zhang and Li, 1998) and pain of teeth
(Forbes et al., 1992), fever (Bachert et al., 2005) back muscle pain and other common pains and
antiinflammatory property makes it a valuable drug to treat indications of arthritis and other
rheumatologic diseases (osteoarthritis, rheumatoid arthritis, spondylo-arthropathies).
Prostaglandins also act as the chief stimulators of platelet aggregation. Aspirin alters the activity
of cyclooxygenase enzyme in platelets by hindering the production of thromboxane A and thus
functions as an anti-platelet drug. Platelet aggregates and sticks to the wall of blood vessels and
stops the blood flow (Schwertner et al., 2006).
2.4.1. Chemistry and physiochemical properties:
The IUPAC name of aspirin is 2-(acetoxy)benzoic acid and different synonyms used are
acetylsalicylate ,acetylsalicylic acid, O-acetylsalicylic acid, Sol-pyron; Eco-trin; Col-farit; Asa-
tylin; Aceto-phen; Aceto-sal; Rhodine; O-Acetoxybenzoic Acid; Extren; Bena-spir; Entericin;
Bial-pirinia; Contrheuma Retard and Salicylic acid acetate. Acetylsalicylic acid is an odorless
and slightly bitter taste compound that has white crystalline appearance. It is weakly acidic
substance with acid dissociation constant of 3.5 at 25 °C (77 °F). Acetylsalicylic acid has
melting and boiling point of 137°C and 140 °C, respectively (Meyer, 2000). The chemical

xlv
structure is shown in Figure 2.5 having chemical formula, C9H8O4 and molecular mass of
180.157 g/mol. Aspirin solubility in water is 3 mg/mL and is steadily hydrolyzed as it is exposed
to moisture (Reynolds, 1982). Low doses of aspirin are used to reduce the risk of heart attack,
stroke, and blood clotting (Lewis et al., 1983; Paterson et al., 2008; Schror, 2009). Some new
evidences propose that low dose of aspirin may be helpful for preventing cancers (Rothwell et
al., 2012).
Figure 2.6 Chemical structure of Aspirin (a), Salicylic acid acyl glucuronide (b)
2.4.2. Pharmacokinetics of Aspirin:
Aspirin has antipyretic, anti-platelet and analgesic effects. All these effects are associated
with the synthesis of prostaglandins (Ahmed, 2002). Prostaglandins belong to a class of fatty
acids that performed series of functions in the human body and are classified into different
groups on the basis of their chemical structure. The vital prostaglandin forms for aspirin are
thromboxane A2 and prostacyclin. The earlier form works on platelets and is a potent vaso-
constrictor. The second form functions on blood vessels and is a powerful vaso-dilator.
Prostaglandins are synthesized from arachidonic acid by the action of cyclooxygenase
enzyme. Cyclo-oxygenase enzyme has two forms: COX-1 and COX-2. COX-1 is expressed in
almost all cells of human body and is liable for the production of prostaglandin that maintains
homeostasis In contrast to COX-1, Cyclo-oxygenase-2 is not expressed in all tissues and is
responsible for regulation of inflammatory response. In fact, aspirin keeps one hundred and
seventy times more affinity for COX-1 than COX-2 (Awtry and Loscalzo, 2004).
Average half life of platelets is about 10 days after their production in bone marrow cells
and then they are detached from the blood by phagocytic cells of neutrophils, monocytes and
macrophages. The circulating platelets are replaced in human body at the rate of approximately
ten percent per day (McCance and Heuther, 2002). Platelets usually move freely, remain
(a) (b)

xlvi
suspended in plasma and are inactive but the response of platelets is immediate when a wound
occurs. As aspirin inhibits COX-1 then, platelets are no longer able to cluster and produce a
platelet aggregate. In human circulation, the concentration of aspirin in plasma diminishes within
15 to 20 minutes. Therefore, the concentration of aspirin can be evaluated in the plasma only for
a little time due to its hydrolysis in plasma (Grosser et al., 2011).
When aspirin is administered orally then, it first crosses the mucosal layer of stomach and
small intestine in its hydrophobic form with a bioavailability of 40 to 50% (Pedersen and
FitzGerald, 1984). It passes through considerable presystemic hydrolysis to form its first
metabolite: salicylic acid by the action of esterase enzyme prior to enter in systemic circulation
(Harris and Riegelman, 1969), and displays a half life of around 15 to 20 min across an array of
treatment doses (Costello and Green, 1982). In one study, aspirin metabolism and effects of
dietary inducers of UDP-glucuronosyltransferases in healthy men and women were determined.
The healthy individuals (men=264, women=264) aged 21 to 45 years were included in the study
and they were given a single oral dose of 650 mg aspirin. After administration, it is quickly de
acetylated by a minor pathway accomplished by cytochrome P450 enzyme whereas UDP-
glucuronosyltransferase enzyme converts deacetylated compound into glucuronides. Men
excreted more deacetylated aspirin whereas women excreted more glucuronide conjugates.
Dietary inducers influenced the excretion of aspirin in urine but these effects were through
glycine binding instead of glucuronidation (Navarro et al., 2011a).
The safety profile of acetylsalicylic acid (aspirin) and clopidogrel was evaluated on
healthy Korean population. The study included sixty four healthy volunteers aged 28 years. They
were administered a fixed dose of 100 mg/75 mg and blood samples were collected over 24
hours. Both drugs were well tolerated by healthy population and drug related side effects were
momentary (Jung et al., 2013).
2.4.3. Analysis:
Aspirin is an anionic drug ((Jain et al., 2012). Several analytical techniques have been
developed for the analysis and detection of acetylsalicylic acid and its metabolites in various
biological fluids: plasma (Yamamotoa et al., 2007; Liu and Smith, 1996; Vree et al., 1994;
Pirkera et al., 2004; Abu-Qare and Abou-Donia, 2001; Schwertner et al., 2006; Polagania et al.,
2012; Kees et al., 1996), serum, urine and stomach contents (Kato et al., 2010; Zaugga et al.,
2001; Shen et al.,1991; Liu and Smith, 1996; Vree et al., 1994; Abu-Qare and Abou-Donia,

xlvii
2001), dosage formulation (Franeta et al., 2002; Kmetec, 1992; Kahsay et al., 2012; Patel et al.,
2013), tissues (Croubels et al., 2005) and food (Janssena et al., 1997). These methods comprise
of HPLC combined with UV (Yamamotoa et al., 2007; Shen et al.,1991; Franeta et al., 2002;
Kmetec,1992; Liu and Smith, 1996; Kahsay et al., 2012; Vree et al., 1994; Kees et al., 1996;
Abu-Qare and Abou-Donia, 2001), mass spectrometry (Croubels et al., 2005; Pirkera et al.,
2004), fluorescence (Zaugga et al., 2001). The catalog of various analytical techniques paired
with HPLC for detection of acetylsalicylic acid and salicylic acid acyl glucuronide is presented
in Table 2.3. The pre analytical inspection of human plasma consists of acidification of plasma
with hydrochloric acid and precipitation of proteins with either the acetonitrile (Liu and Smith,
1996; Kees et al., 1996) or methanol or perchloric acid (Vree et al., 1994). Most of earlier
developed methods required an additional derivatization step. All of these techniques were
laborious and tedious due to more consumption of time and may be exaggerated by
unpredictability in response yield (Roda et al., 2006). Therefore, the separation of acetylsalicylic
acid and salicylic acid acyl glucuronide is performed by reverse phase chromatography providing
more reliable results in terms of quantitative analyses, stating its great selectivity and sensitivity.
For pharmacokinetic studies of drugs, HPLC is the most common and recommended technique
in complex matrices.
2.4.4. Adverse Effects:
Like many other non steroidal anti inflamatory (NSAID) drugs, most commonly used
acetylsalicylic acid has immense unwanted reactions. Platelets are converted into their active
form through production of thromoboxaneA2 (thrombin) which moves freely in the blood
circulation (White et al., 2001). Many drugs display extensive plasma protein binding and those
drugs function only when they are in unbound form and circulate freely. Warfarin and Coumadin
drugs are 99% bound to plasma proteins. However, when aspirin was given to patients already
taking Warfarin then aspirin displaces Warfarin from the protein binding site and binds itself to
that location. As a result, there is more Warfarin active in the blood circulation which extremely
thins the blood (American Heart Association, 1999). Moreover, as aspirin inhibits the activity of
COX-1 on arachidonic acid formation and its inhibitory effects are not confined to the
thromboxane assembly. Rather, aspirin influences the production of several other prostaglandins,
including those that guard the stomach mucosal lining (Awtry and Loscalzo, 2004).

xlviii
Table 2.3. Analysis of acetylsalicylic acid and its metabolite salicylic acid acyl glucuronide
through chromatographic techniques.
Probe drug Biological fluid Technique Reference
acetylsalicylic acid
and salicyl acyl
glucuronide
Plasma and urine HPLC Liu et al., 1996
salicylic acid and
salicyl acyl
glucuronide
Plasma and urine HPLC Vree et al., 1994
acetylsalicylic acid Human Plasma HPLC-MS Polagania et al., 2012
acetylsalicylic acid Dosage Formulation HPLC Franeta et al., 2002
acetylsalicylic acid
and salicyl acyl
glucuronide
Human urine HPLC Chen et al.,2007
So, the patients taking aspirin can suffer from severe bleeding. GI tract bleeding risk is
connected with long term usage of higher doses of aspirin. Higher doses of aspirin decrease the
synthesis of mucosal prostaglandin (Cole et al., 1999; Penglis et al., 2000). Meta analysis of
thirty one clinical trials displayed the utmost risk of GIT bleeding in those taking 200 mg dose of
aspirin daily (Serebruany et al., 2005). Aspirin also contributes a dose related impact on the
formation of renal vasodilatory prostaglandins resulting in worsening of hypertension (Kee and
Hayes, 2002). In addition to this, aspirin reduces the clearance of uric acid from body.
Approximately ten percent of asthamatic patients showed allergic reactions to aspirin as it
stimulates bronchospasm (Sanek et al., 2000).
The principal purpose of creating awareness regarding the glucuronidation status of
UDP-glucuronosyltransferase could be useful to individualize drug therapy, measure the extent
of efficacy/toxicity as well as to get improved medical outcomes for treatment. The incidence
and frequency of UGT glucuronidation and phenotype/genotype association together was not
studied in Pakistani population yet. Therefore, the present project was designed to study effect of

xlix
polymorphism on glucuronidation level of UGT and to find correlation between genotype and
phenotype in the population.
Chapter 3 MATERIALS AND METHODS
To study the genetic polymorphism of UDP-glucuronosyltransferase (UGT) in local human
population, the study was divided into two parts i.e phenotyping and genotyping. For
phenotyping the UGT glucuronidation was determined by HPLC in healthy female and male
volunteers by using probe drugs Paracetamol (PAR) and Aspirin (ASP). The genotyping was
determined by allele specific amplification followed by RFLP and qPCR based on fluorescence
intensity of TaqMan probes, used to amplify target DNA molecule for UGT variant alleles. The
whole research was conducted in Pharmaceutical Research Lab, Molecular Biochemistry Lab
University of Agriculture, Faisalabad, Pakistan, and Dr. Wanging Liu’s Lab, Department of
Medicinal Chemistry and Molecular Pharmacology, Purdue University, West Lafayette, USA.
Laboratory Tests (Clinical part of the study) were conducted under the supervision of senior
physician of health unit, University of Agriculture, Faisalabad, Pakistan.
3.1 Study Subjects

l
The project was designed and conducted according to the good clinical practice (GCP),
the International Conference on Harmonized (ICH) tripartite Guideline (2005) and the ethical
principles laid down in declaration of Helsinki (WHO 2008). The study was officially approved
by the ethics committee of the University and written informed consent forms, signed by all
volunteers were collected. In this study, a total of one hundred and ten local subjects took part.
Sixty male volunteers took part in the study but one of the male volunteers was excluded from
study due to positive hepatitis C. Fifty nine male subjects (mean age, 22.19 y; range 19-32 y,
mean body weight 69.76 kg; range 46-102 kg and mean height 170.91 cm; range 154.9-187.9
cm) were selected. Fifty healthy female subjects (mean age, 22.26 y; range 18-29 y, mean body
weight 55.8 kg; range 40-80 kg and mean height 160.22 cm; range 144.8-170.2 cm) were
selected. For ensuring health status of subjects, the physical examination and laboratory tests
were conducted. The subjects who have any type of abnormality in their history, clinical
laboratory investigation or physical examination were debarred from the study. Also the
volunteers those having any type of allergic reactions to non steroidal anti inflammatory drugs
including paracetamol and aspirin were disqualified from the study. All the volunteers were on
normal diet and no one was on any medication. All were non alcoholics and not permitted to take
any caffeinated drinks and juices during the sampling. Laboratory tests incorporated complete
blood picture (CBP) and plasma and serum biochemical parameters. The demographic data of all
volunteers is presented in Appendix I and II respectively. The comparative demographic data of
male and female subjects is shown in Table 3.1 and graphically presented in Figure 3.1.
Table 3.1.Comparative demographic data of healthy male and female subjects
Demographic
parameters
Male (n=60) Female (n=50)
Mean
±SD
Range Mean
±SD
Range
Min. Max. Min. Max.
Age(y) 22.2
±2.4 19 32
22.3
±2.4 18 29

li
Weight(kg) 69.8
±10.5 46 102
55.8
±9.4 40 80
Height(cm) 170.9
±7.9 154.9 187.9
160.2
±4.4 144.8 170.2
Body
Temperature(°F)
98.2
±0.3 98 98.6
98.2
±0.4 98.2 98.6
Blood
Pressure
(mm Hg)
Systolic 116.8
±4.7 110 120
115.8
±5.8 100 130
Diastolic 77.5
±5.1 70 90
80
±7.3 70 90
Min; Minimum, Max; Maximum, SD; Standard Deviation, n; Number of subjects

lii
Figure 3.1 Comparative levels of demographic data in male (n=60) and female (n=50) healthy
subjects.
3.2. Probe Drugs
The probe drugs used in this study for determination of glucuronidation phenotype
included paracetamol (Pharmatec Pvt. Ltd, Karachi, Pakistan) and aspirin (Reckitt Benckiser,
Karachi, Pakistan Ltd). The paracetamol and aspirin were in tablet forms containing 500 mg (2
tablets) and 300 mg (2 tablets), respectively. Probe drugs, paracetamol and aspirin were given to
each volunteer separately with a glass of water and sampling of drugs was conducted.
3.3. Collection of blood samples
Prior to sampling written informed consents from each subject was collected. All subjects
were requested to come after an overnight fasting and not to take any caffeinated drinks before
sampling. The blank blood sample (10 mL) was collected from each volunteer and was used for
biochemical parameters, complete blood picture and isolation of DNA. Sampling of probe drugs
was done in a cross over design. After an overnight fasting, all subjects were given an oral dose
0
20
40
60
80
100
120
140
160
180
200
Age(years) Weight(kg) Height(cm) BodyTemperature
(0F)
Blood Pressure(mm Hg)systolic
Diastolic
Male
Female

liii
of 500 mg (2 tablets) paracetamol (PAR) tablet with a glass of water. All volunteers were given
similar breakfast and single blood sample (3 mL) was collected in heparinized centrifuge tube at
1.5 hour after an oral administration of paracetamol. The plasma was separated and stored at -20
°C till analysis. All volunteers were given one week wash out period so that paracetamol
completely flush out from their bodies. The volunteers were requested to come after one week
gap for the sampling of other drug (aspirin) and the blank blood sample was collected. All
volunteers were given an oral dose of 600 mg aspirin with a glass of water after an overnight
fasting. All volunteers were given similar breakfast and single blood sample (3 mL) was
collected in heparinized centrifuge tube at 20 minutes after an oral administration of aspirin. The
plasma was stabilized directly upon collection by adjusting its pH= 3-4 with phosphoric acid to
avoid the degradation of the labile acyl glucuronide metabolite of aspirin.
3.4. Biochemical parameters
The biochemical parameters of all volunteers were determined in blank plasma and serum
samples by using commercial diagnostic kits. The urea, creatinine, total protein, albumin,
globulin, cholesterol, triglycerides, HDL, LDL, alanine aminotransferase (ALT), aspartate
aminotransferase (AST), billirubin, anti HCV(ICCT) and Hbs-AG(ICT) were measured on
Roche automated clinical chemistry analyzer.
3.5. Complete blood picture (CBP)
The blank blood sample collected from each volunteer was also used to determine
complete blood picture, which included hemoglobin (Hb), total white blood cells (WBC’s),
neutrophils, lymphocytes, monocytes and eosinophils, total red blood cells, hematocrit (Hct),
mean corpuscular volume (MCV), mean corpuscular hemoglobin (MCH), mean corpuscular
hemoglobin concentration (MCHC) and platelet count.

liv
3.6. Chemicals and reagents
Paracetamol, the reference standard (purity > 99.0 %) and paracetamol β-D-glucuronide
(analytical standard) were purchased from Sigma-Aldrich and Fluka. Aspirin (purity ≥ 99.0 %)
and aspirin glucuronide (salicyl acyl glucuronide) were purchased from Sigma and LC Scientific
Inc, Canada, respectively. EDTA, ethydium bromide and potassium dihydrogen phosphate were
purchased from Sigma, acetone, nuclease free water and tris-base from Bio basic Int. DNA blood
isolation kit was purchased from Bio Basic Inc. (EZ-10 Spin Column Genomic DNA Mini preps
Kit). 6X loading dye and DNA ladders (1Kb) were purchased from Fermentas. De-ionized
distilled water was obtained (Advanced GS-590, Distillery and CPW-200 Japan) from Central
High Tech Lab, University of Agriculture, Faisalabad, Pakistan. Acetonitrile was purchased from
Merck, methanol from Lab Scan. All chemicals and solvents were of high purity and HPLC
grade (Sigma-Aldrich/ Lab Scan/Bio Basic Int. / LC Scientific Inc.). Drug free plasma was
obtained from Chiniot Dialysis Centre, Faisalabad. Paracetamol was purchased from Pharmatec
and aspirin was purchased from Reckitt Benckiser, TaqMan genotyping master mix and TaqMan
genotyping assay mix (Probes) specific to each SNP were purchased from Applied Bio Systems,
USA.
3.7. Equipment and instrumentation
HPLC, the high performance liquid chromatographic system used for determining
glucuronidation phenotype was consisted of a Shimadzu CBM-20A/20 Alite system controller,
SPD-M20AUV-Visible photodiode array detector, LC-10AT pump with FCU-10AL VP flow
controller valve, DGU-20A3/DGU-20A5 online degasser and LC-20AT solvent delivery
Module. Separation was attained at room temperature with a Hypersil BDS-C18 column (250 mm
x 4.6 mm, internal diameter, 5 µm, Thermo Electron Corporation, USA) and this column was
used to analyze paracetamol and its glucuronidated metabolite. The separation of aspirin and its
glucuronidated metabolite was done on Hyper Chrom ODS-BP C18 column (200 mm x 4.6 mm,
internal diameter, 5 µm). The chromatographic data (chromatograms, peak area, height, retention
time) was collected and analyzed by using CSW 32 software. The mixing and filtration of mobile
phase was obtained by magnetic mixer (Gallen Kamp England), filtration assembly under
vacuum with cellulose acetate membrane filters (Sartorius, AG, 37070 Geottingen, Germany) of
diameter 47 mm and pore size 0.45 µm. Other equipments incorporated; Sonicator (Elma, E 60

lv
H), Thermostat Water Bath (HH-4), pH meter (WTW series 720 Inolab), Micropippette
(AccuPeT Pro™ and Ependorf), Glass Distillery (GS-590, Distillery and CWP-200),
Microcentifuge (Hitachi Germany), Spectrophotometer (T 60 PG instrument England),
Electronic balance (Shimadzu Japan), Vortexer (VELP Scientific), Centrifuge machine (YJ03-
043-4000 China). Conventional PCR thermocycler (Bio Rad T100™, USA) and qPCR was used
for genotyping of UGT. The Real Time Polymerase chain Reaction machine used was composed
of ViiA™ 7 System, Interchangeable block (96 & 384 well plate), 6 emission filters (500-720
nm), OptiFlex™ System (enhanced fluorescence detection), 6 excitation filters (450-670 nm),
Dimensions: (53.3 cm (21 in) (W) x 63.5 cm (25 in) (D) x 64.5 cm (25.4 in) (H), Power limit: 60
Hz, Linear dynamic range of 9 logs, input voltage 100-240 V, automation accessory robot for
plate handling, Automation includes plate-loading arm with barcode, temperature range 4-100°C,
and reaction volume 5-20 µL (Applied Bio System, USA), clinical chemistry analyzer (Roche),
Gel Electrophoresis and Gel Documentation System (Bio Rad, USA), Gen5™ (Bio-Tek, USA).
3.8. Phenotyping
Phenotyping technologies entail several chromatographic techniques with the new rising
advances in the field of science and technology. In the recent project, one of the most reliable
and sensitive techniques, high performance liquid chromatography (HPLC) was used for
determination of UGT phenotype in local human population of Pakistan.
3.8.1. Preparation of stock solutions and standards
The stock solutions (1000 µg/mL) of paracetamol (PAR) and (1000 µg/mL) paracetamol
glucuronide were prepared in 95 percent methanol. The stock solution (1000 µg/mL) of acetyl
salicylic acid and salicylic acid acyl glucuronide were prepared in methanol. These stock
solutions were stored at 4 °C and were used to prepare plasma standards and quality controls
(QCs). Drug free plasma was used to prepare the plasma standards and quality controls (QCs).
The drugs and their glucuronidated metabolites were presented in the form of their peak areas.

lvi
3.8.2. Analysis of paracetamol (PAR) and paracetamol glucuronide (PAR- Glu)
The concentrations of paracetamol and glucuronidated paracetamol were determined on
the HPLC at 242 nm by using the method of Vertzoni et al., (2003) with the modification in
sample processing and flow rate. The processing of standards and plasma samples involves 100
µL of standards and plasma samples and 200 µL of the 15 % perchloric acid was added to
deproteinize the plasma proteins. The standards and plasma samples were vortexed for 1 minute
and then centrifuged at 13,000 rpm for 10 minutes. The supernatant was taken, filtered through
syringe filters of the pore size 22 µm and 20 µL of the sample was injected directly on to HPLC
column. For elusion of sample through column, the mobile phase used was composed of aqueous
buffer solution of 0.05M KH2PO4 (475 mL) in 5 % acetic acid (pH 6.5) and methanol (25 mL).
For analysis, isocratic mode was used and the solvent flow rate was 1 mL/min. The retention
time for paracetamol and paracetamol glucuronide was 6.7 and 1.8 minutes respectively.
Representative chromatograms of standard concentration of PAR and PAR-Glu and volunteer
plasma samples showing concentration of PAR and PAR-Glu were shown in Figures 3.2 and 3.3,
respectively
Figure 3.2 Representative chromatogram of standard 40µg/mL PAR-Glu and PAR
0.0 1.0 2.0 3.0 4.0 5.0 6.0 7.0 8.0 9.0 10.0 11.0 min
0.0
1.0
2.0
3.0
4.0 mAU (x10)
Ch1-242nm,4nm (1.00) Extract-190nm,4nm (1.00)
PAR-Glu
PAR

lvii
Figure 3.3 Representative chromatogram of plasma sample of volunteer
3.8.3. Analysis of aspirin (ASP) and aspirin glucuronide (salicylic acid acyl glucuronide)
The standards and plasma samples of aspirin (acetyl salicylic acid) and aspirin
glucuronide (salicylic acid acyl glucuronide) were determined on the HPLC at 230 nm by using
the method of Patel et al., 2013. This method was optimized for the determination of aspirin and
aspirin glucuronide in plasma with the change in sample preparation. The processing of
standards or plasma samples involves 200 µL of standards or plasma sample and 400 µL of
acetonitrile was added to deproteinize the plasma proteins. The standards and plasma samples
were vortexed and then centrifuged at 13,000 rpm for 10 minutes. The supernatant was taken,
evaporated under nitrogen gas and then residue was reconstituted in 0.5 mL mobile phase.
Finally, the mobile phase containing test sample was filtered through syringe filters of the pore
size 22 µm and 20 µL of the sample was injected directly to the HPLC column. For sample
elusion through column the mobile phase used was a mixture of acetonitrile (125 mL), methanol
(125 mL) and 0.05M potassium dihydrogen phosphate buffer (250 mL) of pH 3. The pH was
adjusted with orthophosphoric acid. For analysis of test samples isocratic mode was used and the
solvent flow rate was 1 mL/min. The retention time for aspirin and aspirin glucuronide was 3.1
and 2.0 minutes, respectively. Representative chromatograms of standard concentration of ASP
and salicylic acid acyl glucuronide (ASP-Glu) and volunteer plasma samples showing
concentration of ASP and salicylic acid acyl glucuronide (ASP-Glu) were shown in Figures 3.4
and 3.5, respectively.
0.0 1.0 2.0 3.0 4.0 5.0 6.0 7.0 8.0 9.0 min
-1.0
0.0
1.0
2.0
3.0
4.0
5.0mAU(x10)
Ch1-242nm,4nm (1.00)Extract-190nm,4nm (1.00)
PAR-Glu PAR

lviii
3.9. Validation of HPLC assay
To give steady results that could be correctly interpreted, the method was validated
according to Good Laboratory Practice Standards. The goal of method validation is to make
known that the method is good for its future purpose. The method was validated for linearity,
accuracy, specificity, stability, precision and Intra-day and inter-day precision.
3.9.1. Specificity and Selectivity
Six blank plasma samples from different sources were processed and run in the same way
as the standard to ensure selectivity-specificity. All these blank plasma samples were run to
check interference in specificity/selectivity. There were no interferences around the retention
time of PAR and PAR-Glu and also for other drug: ASP and ASP glucuronide as shown in
Figures 3.2 and 3.4, respectively.
Figure 3.4 Representative chromatogram of standard 40µg/mL ASP-Glu and ASP
Figure 3.5 Representative chromatogram of plasma sample of volunteer
0.0 1.0 2.0 3.0 4.0 5.0 6.0 min
0.0
1.0
2.0
3.0
mAU (x100) Extract-190nm,4nm (1.00)
ASP-Glu
ASP
0.0 1.0 2.0 3.0 4.0 5.0 min
0.0
0.5
1.0
1.5
2.0 mAU (x100) Extract-190nm,4nm (1.00)
ASP-Glu
ASP

lix
3.9.2. Limit of Detection (LOD) and limit of quantification (LOQ)
LOD (limit of detection) and LOQ (limit of quantification) were determined for checking
signal to noise ratio. The limit of detection was two times the signal to noise ratio. Limit of
quantification was appraised according to the guidance and regulation for industry on the
development and validation of bio analytical methods, i.e as the lowest concentration of analyte
is analogous to response at least five times more than the blank response and that can be
established with 80% to120% accuracy and 20% precision.
3.9.3. Calibration Curves and linearity
Calibration curves were constructed by analyzing six standards prepared in freshly spiked
human plasma for PAR, PAR glucuronide, ASP and ASP glucuronide, these standards were
processed and run in replicate daily for three successive days. The standard concentrations of
PAR, PAR-Glu, ASP and ASP-Glu were ranged from 2.5-200 µg/mL for paracetamol and PAR
glucuronide and 1.0-80 µg/mL for aspirin and salicylic acid acyl glucuronide. The calibration
curves for probe drugs and their glucuronidated metabolites were plotted using linear least
square regression analysis according to the equation y = a + bx, where y is the ratio of peak areas
for probe drugs and their glucuronide metabolites and x is the concentration in µg/mL, a is the
intercept and b is the slope of regression line. Concentrations of quality control (QC) samples
and unknown samples were calculated by interpolating their peak area ratios on the calibration
curves.
3.9.4. Accuracy and Precision
Quality control samples (low, medium and high quality controls) were used to check the
precision and accuracy of results. Standards and triplicate of quality controls (QCs) at each
concentration of plasma samples for PAR, PAR-Glu, ASP and ASP-Glu were analyzed on three
successive days. QC sample concentration was 6.5, 37, 150 µg/mL for PAR, PAR-Glu and 3, 15,
60 µg/mL for ASP and ASP-Glu. Inter and intraday mean standard deviation and coefficient of
variation (CV) was calculated by standard methods (ICH Guidelines, 2005).
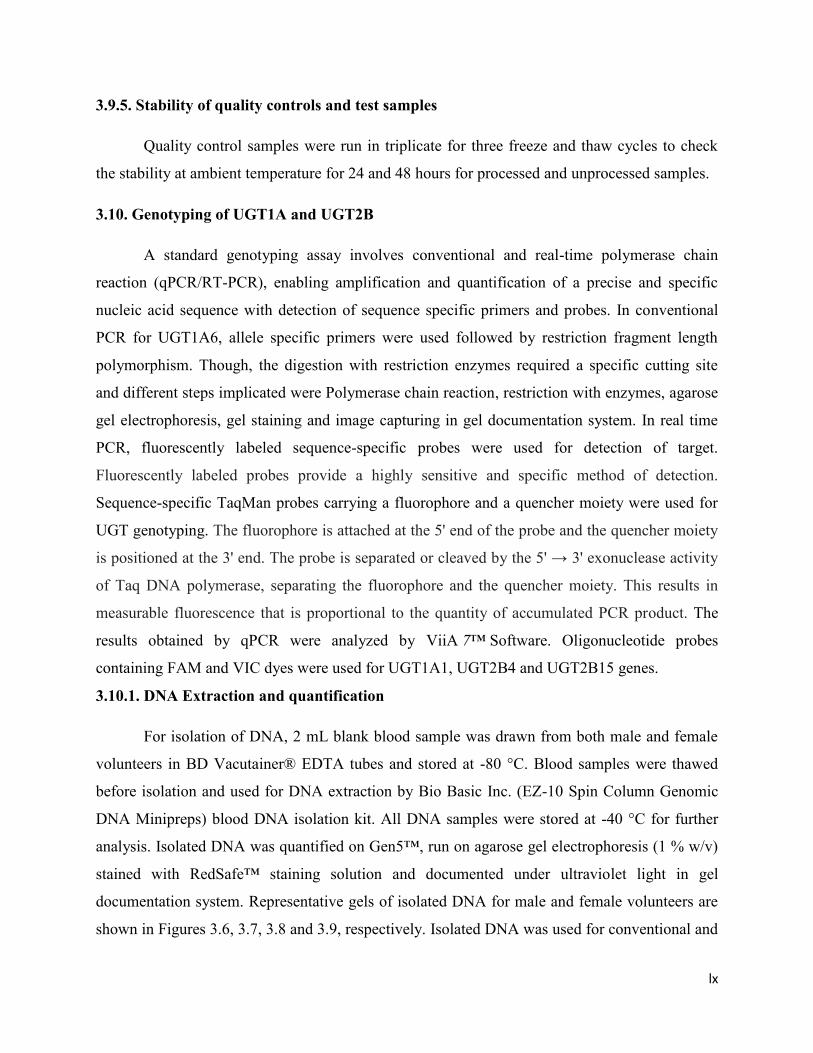
lx
3.9.5. Stability of quality controls and test samples
Quality control samples were run in triplicate for three freeze and thaw cycles to check
the stability at ambient temperature for 24 and 48 hours for processed and unprocessed samples.
3.10. Genotyping of UGT1A and UGT2B
A standard genotyping assay involves conventional and real-time polymerase chain
reaction (qPCR/RT-PCR), enabling amplification and quantification of a precise and specific
nucleic acid sequence with detection of sequence specific primers and probes. In conventional
PCR for UGT1A6, allele specific primers were used followed by restriction fragment length
polymorphism. Though, the digestion with restriction enzymes required a specific cutting site
and different steps implicated were Polymerase chain reaction, restriction with enzymes, agarose
gel electrophoresis, gel staining and image capturing in gel documentation system. In real time
PCR, fluorescently labeled sequence-specific probes were used for detection of target.
Fluorescently labeled probes provide a highly sensitive and specific method of detection.
Sequence-specific TaqMan probes carrying a fluorophore and a quencher moiety were used for
UGT genotyping. The fluorophore is attached at the 5' end of the probe and the quencher moiety
is positioned at the 3' end. The probe is separated or cleaved by the 5' → 3' exonuclease activity
of Taq DNA polymerase, separating the fluorophore and the quencher moiety. This results in
measurable fluorescence that is proportional to the quantity of accumulated PCR product. The
results obtained by qPCR were analyzed by ViiA 7™ Software. Oligonucleotide probes
containing FAM and VIC dyes were used for UGT1A1, UGT2B4 and UGT2B15 genes.
3.10.1. DNA Extraction and quantification
For isolation of DNA, 2 mL blank blood sample was drawn from both male and female
volunteers in BD Vacutainer® EDTA tubes and stored at -80 °C. Blood samples were thawed
before isolation and used for DNA extraction by Bio Basic Inc. (EZ-10 Spin Column Genomic
DNA Minipreps) blood DNA isolation kit. All DNA samples were stored at -40 °C for further
analysis. Isolated DNA was quantified on Gen5™, run on agarose gel electrophoresis (1 % w/v)
stained with RedSafe™ staining solution and documented under ultraviolet light in gel
documentation system. Representative gels of isolated DNA for male and female volunteers are
shown in Figures 3.6, 3.7, 3.8 and 3.9, respectively. Isolated DNA was used for conventional and

lxi
real-time polymerase chain reaction (qPCR) to determine the homozygous wild type allele,
heterozygote and homozygous mutant alleles of UGT1A and UGT2B in human healthy
volunteers.
3.10.2. UGT1A and UGT2B SNPs
Two UGT1A1 SNPs (rs10929303, c.1813C>T; rs8330, c.2042C>G) in 3' UTR region
(Untranslated region), two SNPs (rs2070959, rs1105879) in exon1 region of UGT1A6, two
SNPs of UGT2B4 (rs2013573) in intron; (rs1131878) in 3' UTR region; UGT2B15*2
(rs1902023, D85Y) in UGT2B were genotyped.
Figure 3.6 Agarose gel electrophoresis after genomic DNA extraction from venous blood of male
volunteers. Five µL of DNA along with 1 kb DNA ladder (1 µL) was electrophoresed on 1.0%
agarose gel and its quality was checked after RedSafe™ staining.

lxii
Figure 3.7 Agarose gel electrophoresis after genomic DNA extraction from venous blood of male
volunteers. Five µL of DNA along with 1 kb DNA ladder (1 µL) was electrophoresed on 1.0%
agarose gel and its quality was checked after RedSafe™ staining.
Figure 3.8 Agarose gel electrophoresis after genomic DNA extraction from venous blood of
female volunteers. Five µL of DNA along with 1 kb DNA ladder (1 µL) was electrophoresed on
1.0% agarose gel and its quality was checked after RedSafe™ staining.

lxiii
Figure 3.9 Agarose gel electrophoresis after genomic DNA extraction from venous blood of
female volunteers. Five µL of DNA along with 1 kb DNA ladder (1 µL) was electrophoresed on
1.0% agarose gel and its quality was checked after RedSafe™ staining.
3.10.3 UGT1A (UGT1A6) SNPs
The two polymorphisms in exon 1 region of UGT1A6 gene was determined using
conventional PCR followed by RFLP (Restriction Fragment Length Polymorphism). The
forward and reverse primers for UGT1A6 gene were obtained from Gene Link, USA and the
following sequence of primers was used for amplification of target.
Forward Primer 5' CATCAACTGCCAGAGCCTCC 3'
Reverse Primer 5' GGAAGTTGGCCACTCGTTGG 3'
For UGT1A6 alleles, the PCR reaction was optimized by using various concentrations of Taq
buffer, MgCl2 and different annealing temperatures (57, 59, 61, 63 °C) were practiced to get the
desired PCR product of 267 base pairs. The optimized reaction mixture consisted of 30.5 µL
nuclease free water (d3H2O), 5 µL 10X buffer, 4.0 µL MgCl2, 6 µL dNTPs, 1 µL forward and
reverse primer each, Taq DNA polymerase 0.5 µL and DNA 2 µL in 50 µL total reaction
volume. The PCR cycling conditions used were comprised of denaturation step of 2 minutes at
94 °C followed by 45 cycles of 45 seconds at 94 °C, then annealing at 63 °C for 45 seconds and

lxiv
extension step was carried out at 72 °C for 45 seconds. The amplified PCR product was run on
1.5% (w/v) agarose gel electrophoresis. Then restriction fragment length polymorphism was
performed. The 267 base pair long PCR product was digested overnight with restriction enzyme
Nsil for SNP (rs2070959) T181A and Fnu 4HI for SNP (rs1105879) R184S. The restriction
mixture for Nsil and Fnu 4H1 was consisted of 20 µL of PCR product, 1 µL restriction enzyme,
2 µL buffer and 2 µL d3H2O in a total reaction volume of 25 µL. The digestion was ceased by
adding EDTA (0.5 µmol/L) and the products were run on 3% (w/v) agarose gel.
3.10.4. TaqMan® probes
Fluorescently labeled probes provide a highly sensitive and specific method of detection.
Sequence-specific TaqMan probes carrying a fluorophore and a quencher moiety were used for
UGT1A1, UGTB4 and UGTB15 genotyping. The fluorophore is attached at the 5' end of the
probe and the quencher moiety is positioned at the 3' end. TaqMan probes are sequence-specific
oligonucleotide probes having a fluorophore and a quencher moiety. The probe is separated or
cleaved by the 5' → 3' exonuclease activity of Taq DNA polymerase, separating the fluorophore
and the quencher moiety. This results in measurable fluorescence that is proportional to the
quantity of accumulated PCR product. Oligonucleotide probes containing FAM and VIC dyes
were used for UGT1A1, UGT2B4 and UGT2B15 genes.
3.10.5. Optimization of qPCR conditions
The real-time PCR reaction was optimized for UGT1A1, UGT2B4 and UGT2B15 alleles
by using different concentrations of DNA template and different annealing temperatures (56, 60,
62 and 65 °C) were applied to get good amplification plot due to different probe sensitivity. For
this purpose, HapMap DNA samples of absolutely high quality were used to identify
homozygote for allele 1 and 2 and heterozygote along with sequence specific probes of UGT1A
and UGT2B.
3.10.6. Optimization of DNA template
The PCR reaction was optimized for UGT1A and UGT2B alleles by using different
concentrations of genomic DNA, as it is recommended that concentration of DNA should be
ranged from 10-100 ng per reaction. So, 5, 10, 20, 40 and 60 ng concentration was run for
different sets of qPCR experiment. The optimized template concentration was 40 ng per reaction.

lxv
3.10.7. Real-time polymerase chain reaction (RT-PCR) for UGT1A1, UGT2B4 and
UGT2B15 alleles
The optimized reaction mixture consisted of 2.50 µL of TaqMan genotyping master mix
(2X), 0.25 µL of TaqMan genotyping assay mix (20X) and 2.25 µL of DNase-free, RNase-free
water. The 40 ng DNA template was aliquoted in 384-well plate for drying. The thermal cycling
conditions of qPCR were consisted of a pre-read stage of 30 seconds at 60 °C, hold stage of 10
minutes at 95 °C, PCR stage containing denaturation and annealing at 95 °C for 15 seconds and
62 °C for 1 minute, respectively. The qPCR results were obtained in form of allele amplification
plots and allele discrimination plots. The allele discrimination plots and allele amplification plots
for UGT1A1 (rs8330, rs10929303), UGT2B4 (rs1131878, rs2013573) and UGT2B15
(rs1902023) SNPs, are presented in Figures 3.10 to 3.28.
Table 3.2 qPCR reaction mixture for UGT1A1, UGT2B4 and UGT2B15 SNPs
Components Quantity (µL)
TaqMan Genotyping Master Mix (2X) 2.5
TaqMan Genotyping assay mix (20X) 0.25
DNase-free, RNase-free water 2.25
Total Volume 5

lxvi
Figure 3.10 Allele discrimination plot of homozygous for allele 1/ allele 1, homozygous for
allele 2/ allele 2 and heterozygote for the SNP rs10929303.
Figure 3.11. Amplification plot of homozygote allele 2/allele 2 (T/T) for the SNP rs10929303
after qPCR.

lxvii
Figure 3.12.Amplification plot of heterozygote allele 1/allele 2 (C/T) for the SNP rs10929303
after qPCR
Figure 3.13. Allele discrimination plot of homozygous for allele 1/ allele 1, homozygous for
allele 2/ allele 2 and heterozygote allele 1/allele 2 for the SNP rs8330.

lxviii
Figure 3.14.Amplification plot of homozygote allele 1/allele 1 (C/C) for the SNP rs8330 after
qPCR
Figure 3.15.Amplification plot of homozygote allele 2/allele 2 (G/G) for the SNP rs8330 after
qPCR

lxix
Figure3.16.Amplification plot of heterozygote allele 1/allele 2 (C/G) for the SNP rs8330 after
qPCR
Figure3.17. Allele discrimination plot of homozygous for allele 1/ allele 1, homozygous for
allele 2/ allele 2 and heterozygote allele 1/allele 2 for the SNP rs2013573.

lxx
Figure 3.18. Amplification plot of homozygote allele 1/allele 1 (C/C) for the SNP rs2013573
after qPCR
Figure 3.19.Amplification plot of homozygote allele 2/allele 2 (T/T) for the SNP rs2013573 after
qPCR
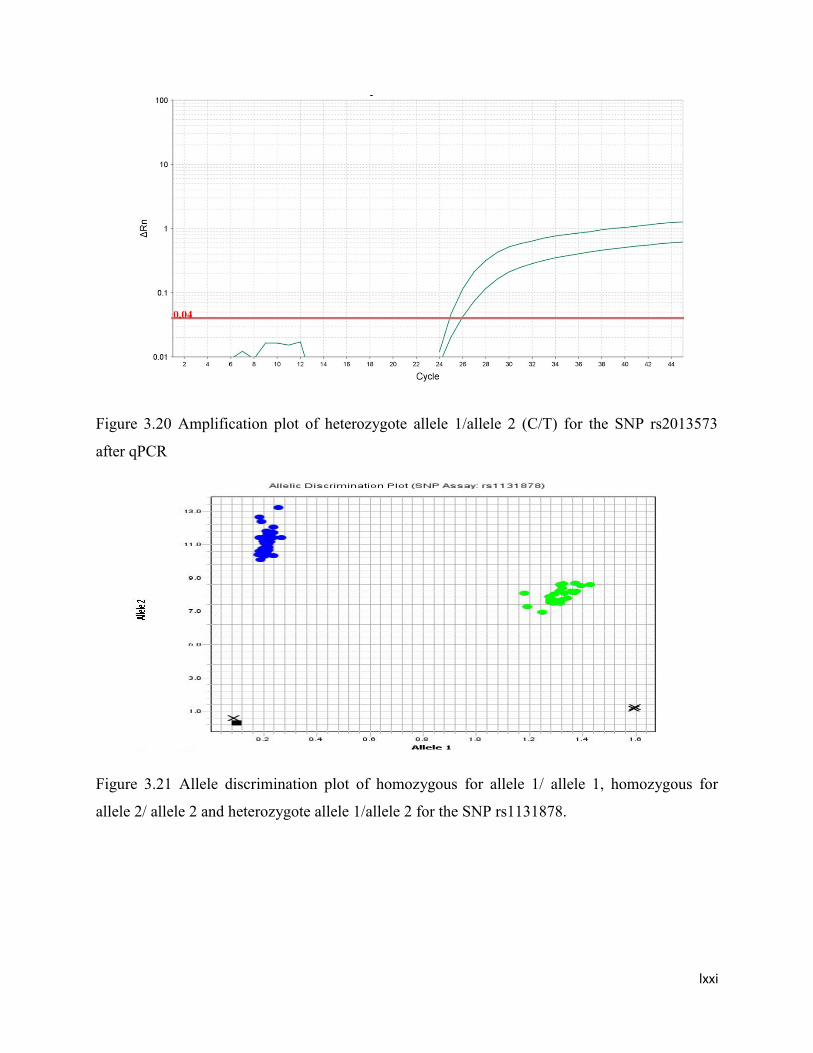
lxxi
Figure 3.20 Amplification plot of heterozygote allele 1/allele 2 (C/T) for the SNP rs2013573
after qPCR
Figure 3.21 Allele discrimination plot of homozygous for allele 1/ allele 1, homozygous for
allele 2/ allele 2 and heterozygote allele 1/allele 2 for the SNP rs1131878.

lxxii
Figure3.22. Amplification plot of homozygote allele 1/allele 1 (C/C) for the SNP rs1131878 after
Figure 3.23. Amplification plot of heterozygote allele 1/allele 2(C/T) for the SNP rs1131878
after qPCR

lxxiii
Figure 3.24 Amplification plot of homozygote allele 2/allele 2 (T/T) for the SNP rs1131878 after
qPCR
Figure3.25.Allele discrimination plot of homozygous for allele 1/ allele 1, homozygous for allele
2/ allele 2 and heterozygote allele 1/allele 2 for the SNP rs1902023.

lxxiv
Figure3.26. Amplification plot of homozygote allele 1/allele 1 (A/A) for the SNP rs1902023
after qPCR
Figure3.27. Amplification plot of homozygote allele 2/allele 2 (C/C) for the SNP rs1902023 after
qPCR

lxxv
Figure 3.28. Amplification plot of heterozygote allele 2/allele 2 (A/C) for the SNP rs1902023
after qPCR.
3.11. Statistical analysis
The mean ± SD for demographic data, biochemical tests and data for complete blood
picture (CBP) was computed by using the Microsoft Excel Windows7 and was presented in the
form of graphs and tables. The probit plot was used for the phenotype (glucuronidation)
distribution of Paracetamol and Aspirin into fast, intermediate and slow glucuronidators on the
basis of cutoff points. SPSS statistics version 17 was used to describe the concordance between
phenotypes, phenotype and genotype, the concordance values are presented in percentages by
using the k statistics (Kappa test). The comparison of parameters between male and female
volunteers was evaluated by Chi square test. The mean values of the metabolite ratios of
paracetamol and aspirin were compared for fast and slow glucuronidators and with genotypes by
using Student’s t test (Steel et al., 2006).

lxxvi
Chapter 4 RESULTS AND DISCUSSION
The genetic polymorphism of UDP-Glucuronosyltransferase was determined by genotyping and
phenotyping in local human population of Pakistan. The glucuronidation rank (phenotyping) of
two probe drugs paracetamol (PAR) and aspirin (ASP) in male (n=59) and female (n=50)
volunteers was determined by HPLC methods. A single oral dose of 1000 mg of paracetamol and
aspirin (600 mg) was used to conduct phenotyping study in healthy female and male subjects.
The samples of blood were drawn at pre determined time interval of 1.5 hour and 20 minutes for
paracetamol and aspirin, respectively in separate experiments. Glucuronidation status for
genotyping was resoluted by RT-PCR. The blood samples for DNA isolation was drawn from all
volunteers in fasting condition and without administering any medication and then subjected to
Real time PCR to discriminate between wild type, heterozygote and rare (mutant) alleles of
UGT1A and UGT2B. The data thus gained was used to find out concordance between genotype
and phenotype (glucuronidation). The biochemical parameters (Triglycerides, High density
lipoprotein (HDL), Low density lipoprotein (LDL), Alaninetransaminase (ALT), Aspartate
aminotransferase (AST), Albumin/Globulin ratio, Billirubin, Anti-HCV and Hbs-AG) and
complete blood picture includes hemoglobin, total RBCs, Hematocrit, Mean corpuscular volume,
Mean corpuscular hemoglobin; Mean corpuscular hemoglobin concentration, total WBCs,
platelet count, Neutrophils, Lymphocytes, Monocytes and Eosinophils was tested from blank
blood samples taken out from all male and female volunteers. These parameters were used to
ensure health of volunteers and exclude the volunteers having any type of abnormality in them.
One of the volunteers had Anti-HCV positive and was removed from the study and rest of the
volunteers were normal and had values of biochemical parameters falling in normal range. The
data of biochemical parameters and complete blood picture obtained from all male and female
volunteers is presented in the appendix. The mean ± SD of biochemical parameters and CBP of
the healthy volunteers is presented in the Table 4.1 and 4.2 whereas comparative data of both
sexes is presented in Table 4.3 and 4.4, respectively. Trends for biochemical parameters and
CBP of female and male volunteers are shown in Figures 4.1, 4.2, 4.3 and 4.4, respectively.
Table 4.1.Values for complete blood picture (CBP) of the healthy male and female subjects
(n=109)

lxxvii
Parameters Reference
values
n=109
Mean
± SD
MIN MAX
Hb
(g/dL)
12-16 14.1
± 1.7
9.6 17
Total RBC
(10^6/µL)
4-5.5 4.89
± 0.5
3.47 6.75
Hct
(%)
40-50 39.8
± 3.9
27.5 47.4
MCV
(fL)
80-98 81.4
± 6.3
58.1 95.4
MCH
(pg)
26-31 28.7
± 2.6
19.6 35.1
MCHC
(g/dL)
31-36 35.3
± 1.5
31.3 38.3
Platelet Count
(10^3/µL)
150-450 327.9
± 70.7
147 470
Total WBC
(10^3/µL)
4-10 7.35
± 1.5
4.2 11.6
Neutrophils
(%)
55-70 61.2
± 8.6
35 85
Lymphocytes
(%)
25-40 32.2
± 7.0
11 50
Monocytes
(%)
2-11 5.10
± 1.9
2 10
Eosinophils
(%)
2-6 3.20
± 1.5
2 8
Hb; Hemoglobin, RBC; Red blood cells, Hct; Hematocrit, MCV; Mean corpuscular volume,
MCH; Mean corpuscular hemoglobin, MCHC; Mean corpuscular hemoglobin concentration,
WBC; White blood cells, SD; Standard deviation, Min; Minimum, Max; Maximum.
Table 4.2.Values for biochemical parameters of the healthy male and female subjects (n=109)
Biochemical Reference n=109

lxxviii
parameters values Mean
± SD
MIN MAX
Urea
(mg/dL)
10-50 22.3
±5.6
11 34
Creatinine
(mg/dL)
0.6-1.1 0.82
±0.1
0.6 1.2
TGs
(mg/dL)
< 150 139.2
±33.1
73 220
Cholestrol
(mg/dL)
< 200 167.9
±24.4
102 224
HDL
(mg/dL)
35-60 40.3
±5.8
28 55
LDL
(mg/dL)
< 150 84.6
±14.1
59 128
ALT
(U/L)
10-45 22.6
±8.4
10 50
AST
(U/L)
8-40 21.5
±7.7
10 49
Billirubin
(mg/dL)
0.3-1.9 1.19
±0.3
0.4 1.9
Total Protein
(g/dL)
6.0-8.0 7.60
±0.3
7.0 8.1
Albumin
(g/dL)
3.5-4.8 4.25
±0.2
3.8 4.9
Globulin
(g/dL)
3.0-4.0 3.45
± 0.3
2.9 4.1
A/G ratio ----- 1.23
±0.1
1.02 1.59
Anti-
HCV(ICT)
Negative Negative ----- -----
Hbs-AG(ICT) Negative Negative ----- -----
TGs; Triglycerides, HDL; High density lipoprotein, LDL; Low density lipoprotein, ALT;
Alanine transaminase, AST; Aspartate aminotransferase, A/G; Albumin/Globulin, SD; Standard
deviation, Min; Minimum, Max; Maximum.
Table 4.3 Comparative values for complete blood picture (CBP) of the healthy male (n=59) and
female (n=50) volunteers

lxxix
Parameters Male (n=59) Female (n=50)
Mean
± SD
Range Mean
± SD
Range
MIN MAX MIN MAX
Hb
(g/dL)
15.2
±1.1
12.7 17 12.7
±1.2
9.6 14.7
Total RBC
(10^6/µL)
5.19
±0.5
4.36 6.75 4.54
±0.4
3.47 5.4
Hct
(%)
42.6
±2.5
36.2 47.4 36.6
±2.8
27.5 40.8
MCV
(fL)
81
±5.8
58.1 94 81.9
±6.8
59.4 95.4
MCH
(pg)
29.0
±2.4
19.6 35.1 28.4
±2.9
19.8 33.4
MCHC
(g/dL)
35.6
±1.6
31.3 38.3 34.9
±1.3
32.1 37
Platelet
Count
(10^3/µL)
324.8
±71.6
147 461 331.6
±70.2
170 470
Total WBC
(10^3/µL)
7.18
±1.4
4.9 11.5 7.55
±1.6
4.2 11.6
Neutrophils
(%)
62.4
±8.6
35 85 59.8
±8.4
40 75
Lymphocytes
(%)
31.5
±7.9
30 50 32.4
±7.1
20 48
Monocytes
(%)
4.54
±1.9
2.0 10 5.76
±1.9
3.0 10
Eosinophils
(%)
2.71
±1.1
2.0 6.0 3.78
±1.6
2.0 8.0
Hb; Hemoglobin, RBC; Red blood cells, Hct; Hematocrit, MCV; Mean corpuscular volume,
MCH; Mean corpuscular hemoglobin, MCHC; Mean corpuscular hemoglobin concentration,
WBC; White blood cells, SD; Standard deviation, Min; Minimum, Max; Maximum.
Table 4.4 Comparative values for biochemical parameters of the healthy male and female
volunteers
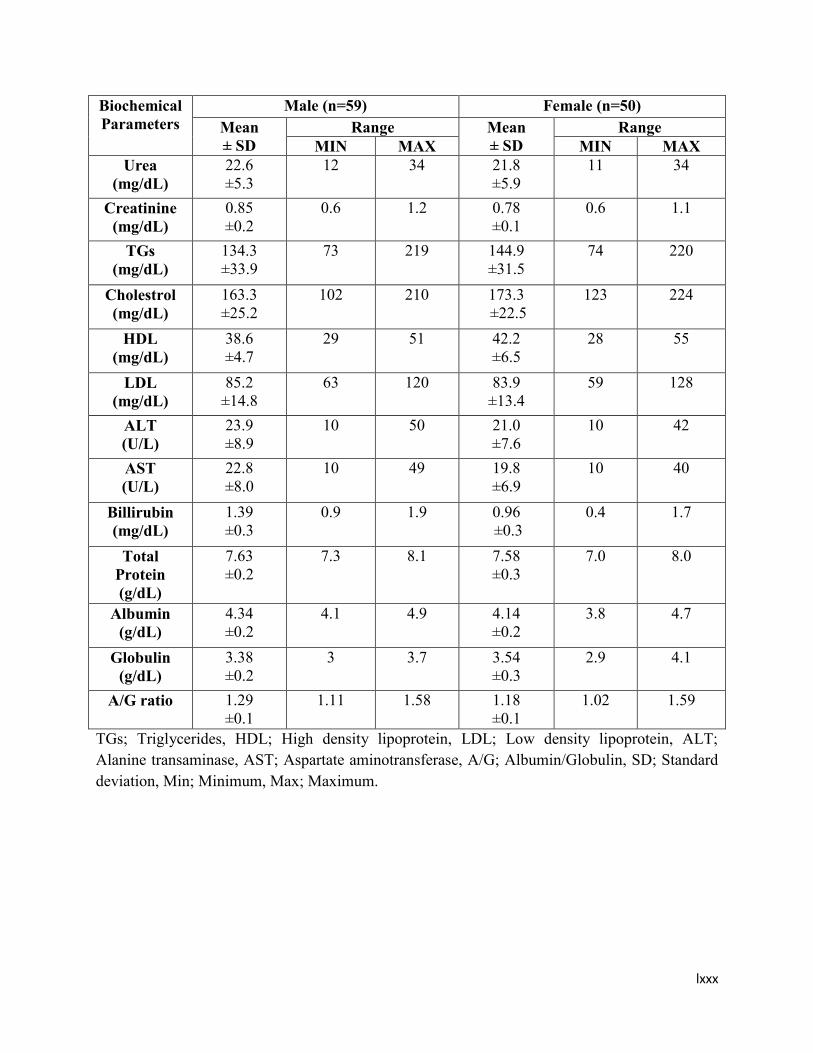
lxxx
Biochemical
Parameters
Male (n=59) Female (n=50)
Mean
± SD
Range Mean
± SD
Range
MIN MAX MIN MAX
Urea
(mg/dL)
22.6
±5.3
12 34 21.8
±5.9
11 34
Creatinine
(mg/dL)
0.85
±0.2
0.6 1.2 0.78
±0.1
0.6 1.1
TGs
(mg/dL)
134.3
±33.9
73 219 144.9
±31.5
74 220
Cholestrol
(mg/dL)
163.3
±25.2
102 210 173.3
±22.5
123 224
HDL
(mg/dL)
38.6
±4.7
29 51 42.2
±6.5
28 55
LDL
(mg/dL)
85.2
±14.8
63 120 83.9
±13.4
59 128
ALT
(U/L)
23.9
±8.9
10 50 21.0
±7.6
10 42
AST
(U/L)
22.8
±8.0
10 49 19.8
±6.9
10 40
Billirubin
(mg/dL)
1.39
±0.3
0.9 1.9 0.96
±0.3
0.4 1.7
Total
Protein
(g/dL)
7.63
±0.2
7.3 8.1 7.58
±0.3
7.0 8.0
Albumin
(g/dL)
4.34
±0.2
4.1 4.9 4.14
±0.2
3.8 4.7
Globulin
(g/dL)
3.38
±0.2
3 3.7 3.54
±0.3
2.9 4.1
A/G ratio 1.29
±0.1
1.11 1.58 1.18
±0.1
1.02 1.59
TGs; Triglycerides, HDL; High density lipoprotein, LDL; Low density lipoprotein, ALT;
Alanine transaminase, AST; Aspartate aminotransferase, A/G; Albumin/Globulin, SD; Standard
deviation, Min; Minimum, Max; Maximum.

lxxxi
Figure 4.1 Comparative levels of hemoglobin, total RBCs, total WBCs, monocytes and
eosinophils in male (n=59) and female (n=50) healthy subjects.
Figure 4.2 Comparative levels of Hct, MCV, MCH, MCHC, Lymphocytes, Neutrophils and
Platelet count in male (n=59) and female (n=50) healthy subjects.
0
2
4
6
8
10
12
14
16
18
Hb (g/dL) Total RBCs(10^6/µL)
Total WBCs(10^3/µL)
Monocytes (%) Eosinophils (%)
male
female
0
50
100
150
200
250
300
350
400
450
Hct (%) MCV (fL) MCH (pg) MCHC (g/dL) Lymphocytes(%)
Neutrophils(%)
Plateletcount
(10^3/µL)
male
female

lxxxii
Figure 4.3 Comparative levels of billirubin, creatinine, total protein, albumin, globulin and
albumin/ globulin ratio in male (n=59) and female (n=50) healthy subjects.
Figure 4.4 Comparative levels of TGs, Cholestrol, HDL and LDL, ALT, AST and urea in male
(n=59) and female (n=50) healthy subjects.
0
1
2
3
4
5
6
7
8
9
Billirubin(mg/dL)
Creatinine(mg/dL)
Total Protein(g/dL)
Albumin (g/dL)Globulin (g/dL) A/G ratio
male
female
0
50
100
150
200
250
TGs (mg/dL) Cholestrol(mg/dL)
HDL (mg/dL) LDL (mg/dL) ALT (U/L) AST (U/L) Urea(mg/dL)
male
female

lxxxiii
4.1. Glucuronidation Status
The glucuronidation level of UGT was established in healthy male and female volunteers
genotypically and phenotypically. The association between paracetamol and aspirin phenotypes
was found out; also the association between the genotype and phenotype was ascertained.
4.1.1. HPLC Method Validation for Probe drugs and their Glucuronidated metabolites
UGT glucuronidation status of paracetamol and aspirin was established phenotypically in
plasma samples of healthy female and male volunteers by isocratic, RP-HPLC technique. Quite a
few HPLC techniques were validated for probe drugs (PAR & ASP) and their corresponding
glucuronidated metabolites in plasma samples. In the beginning, preliminary experiments of
method validation included the use of different columns with varying length and particle size for
detection of PAR, PAR-Glu, aspirin and salicyl acyl glucuronide retention time. Many aqueous
mobile phases containing buffers of various pH values combined with methanol or acetonitrile
organic solvent was tested. The results for PAR, PAR-Glucuonide were the most excellent in
sense of sharp peak, resolution and run time with Hypersil-C18 BDS column (4.6 mm x 250 mm,
internal width, 5 µm, Thermo Electron Corporation, USA) with a mixture of aqueous buffer
solution of KH2PO4 in acetic acid (pH= 6.5) and methanol while for aspirin (acetyl salicylic acid)
and aspirin glucuronide (salicylic acid acyl glucuronide) good results were achieved with Hyper
Chrom ODS-BP C18 column (200 mm x 4.6 mm, internal diameter, 5 µm) using mobile phase
comprising of acetonitrile (ACN), methanol and phosphate buffer of pH 3. The conditions for
purging through column and reequilibration ensured pressure of column and chromatogram
stability along with reproducible retention time for at least fifty subsequent injections.
4.1.1.1 Selectivity
The selectivity of method was appraised by investigating the presence of potential
interference from blank plasma samples of different healthy volunteers. Absence of interference
was determined for all forms. For PAR, PAR-Glu as well as for ASP and salicyl acyl
glucuronide, no interfering peaks were monitored at the time of elution. This designates that
HPLC method was appropriate and suitable for the careful detection of probe drugs and their
glucuronidated metabolites in plasma.
4.1.1.2 Limit of detection and limit of quantification

lxxxiv
Detection limit was fairly estimated by spiking varying concentrations in human plasma.
Limit of detection (LOD) values were 1 µg/mL and 0.5 µg/mL for paracetamol and paracetamol
glucuronide (PAR-Glu) whereas LLOQ (lower limit of quantification) was 2.5 µg/mL and 1
µg/mL. LOD values for acetyl salicylic acid and salicyl acyl glucuronide were 0.5 µg/mL
whereas LLOQ value was 1 µg/mL. Quantification limit was appraised according to ICH guide
lines on validation: as the lowest concentration of analyte analogous and associated with a
response is at least five times high than blank response and that can be evaluated with 20%
precision and 80-120% accuracy.
4.1.1.3 Calibration and Linearity
Parameters of calibration curves were developed by the arithmetical analysis of six
standards of varying concentrations. The calibration curves displayed a good linearity in
concentration range between 2.5 and 200 µg/mL (R2 ≥ 0.9949 for PAR and R2 > 0.9908 for
PAR-Glu), the value of slope for PAR and PAR-Glu was 3.59 and 4.75 and their intercept was
26.95 and 76.02 respectively. The calibration of standard points displayed percent coefficient of
variation (% CV) values ranging from 0.03 % to 4.92 % for both PAR and PAR-Glu. The data of
standard concentrations and QCs accomplished from calibration curves were given in Table 4.5.
Likewise, acetyl salicylic acid and salicyl acyl glucuronide calibration curves displayed a good
linearity in concentration range between 1 and 80 µg/mL (R2 ≥ 0.996 for ASP and R2 > 0.9942
for ASP-Glu). The value of slope for ASP and ASP-Glu was 27.35 and 15.68 and their intercept
was 35.81 and 100.65, respectively. The calibration of standard points displayed CV % values
ranging from 0.01 % 4.9 % for both analytes. The data of standard concentrations and QCs
attained from calibration curves were given in Table 4.6. This verified that the method showed
adequate sensitivity to carry out pharmacokinetic studies and clinical trials.

lxxxv
4.1.1.4 Accuracy and Precision
The inter and intraday precision and accuracy for drugs (PAR & ASP), their
glucuronidated metabolites and quality control (QC) samples geared up in human drug free
plasma at varying concentration level of 6.5, 37 and 150 µg/mL for probe drug paracetamol and
Table 4.5 Intra day and Inter day precision and accuracy for paracetamol (PAR) and paracetamol
glucuronide (PAR-Glu)
Reproducibility Conc.
(µg/mL)
Paracetamol Paracetamol Glucuronide
Intraday assay Added Found
(Mean
±SD)
CV% Accuracy Found
(Mean
±SD)
CV% Accuracy
Quality
Controls
6.5 6.51
±0.2
2.92 100.2 6.53
±0.3
5.21 100.5
37 36.9
±0.2
0.41 99.9 36.9
±0.4
1.14 99.6
150 150
±0.5
0.31 99.9 150.9
±0.8
0.50 100.6
Interday assay
Quality
Controls
6.5 6.59
±0.2
3.03 101.4 6.72
±0.3
4.61 103.4
37 37.2
± 0.4
0.99 100.6 36.8
±0.6
1.49 99.5
150 150.1
± 0.8
0.51 100.2 150.6
±0.6
0.39 100.4
Standards
2.5 2.53
± 0.1
4.74 101.2 2.44
±0.1
4.92 97.6
10 10.1
±0.2
1.46 102.5 10.1
±0.1
1.09 100.5
25 27.6
±0.2
0.69 110.4 25.2
±0.1
0.52 100.9
50 51.9
±0.2
0.42 103.9 50.7
±0.1
0.09 101.4
100 100.8
±0.3
0.29 100.8 100.9
±0.2
0.19 100.9
200 201
±0.2
0.09 100.5 200
±0.1
0.03 100
Conc.; Concentration, CV; Cofficient of variation; SD; Standard deviation
Table 4.6 Intra day and Inter day precision and accuracy for aspirin (ASP) and aspirin
glucuronide (ASP-Glu)

lxxxvi
Reproducibility Conc.
(µg/mL)
Aspirin Aspirin Glucuronide
Intraday assay Added Found
(Mean
± SD)
CV% Accuracy Found
(Mean±
SD)
CV% Accuracy
Quality
Controls
3
3.04
±0.1
0.66 101.3 3.11
±0.1
1.93 103.7
15
15.6
±0.1
0.77 103.8 15.1
±0.1
0.39 100.3
60
59.6
±0.1
0.20 99.3 59.9
±0.5
0.82 99.8
Interday assay
Quality
Controls 3
3.04
±0.01
0.66 101.3 3.09
±0.1
1.62 103
15
15.4
±0.2
1.56 102.6 15.1
±0.1
0.33 100.2
60
59.6
±0.2
0.39 99.3 59.9
±0.3
0.5 99.9
Standards
1
1.07
±0.01
0.93 107 1.03
±0.03
2.91 103
5
4.96
±0.03
0.60 99.2 5.69
±0.3
4.9 113.8
10
10.8
±0.04
0.37 108.1 11.1
±0.5
4.4 110.6
20
20.1
±0.1
0.25 100.3 19.9
±0.4
2.11 99.6
40
39.8
±0.1
0.18 99.5 40.6
±0.1
0.34 101.6
80
80.5
±0.1
0.01 100.7 80.7
±0.1
0.06 100.9
Conc.; Concentration, CV; Cofficient of variation; SD; Standard deviation
3, 15 and 60 µg/mL for aspirin was determined. For inter and intraday, precision and accuracy
values were computed for all tested levels (n=6 each) did not go over 9% and 10%, respectively.

lxxxvii
4.1.1.5 Stability of Stock Solutions
Stability tests were executed to determine the stability of analytes in stock solutions and
in plasma samples under different storage conditions. The stability of stock solutions (1000
µg/mL) and standards of PAR, ASP and their glucuronidated metabolites was evaluated by
repeat measurement of the quality controls at three different concentration levels stored at -20 C0
and -80 °C and, analytical standards stored at 4 °C in refrigerator, respectively for over a tenure
of 6 weeks during method validation. For storage at 4 °C, no remarkable difference was seen
during first 7 days facilitating the precise measurement of unknown plasma samples. The stock
solutions of test compounds sustained their stability for more than a month at -20 °C and -80 °C
and no considerable deviations were observed during this tenure.
4.1.1.6 Stability of test samples
The stability of samples collected from healthy male and female subjects after
administration of probe drugs was also evaluated during validation process. The stored samples
were run against the fresh calibrators. The results verified that plasma samples of paracetamol
and aspirin retained their stability over 6 weeks period after storage at -20 °C and -80 °C,
respectively. During typical analysis measurement, freeze and thaw stability of plasma test
compounds was checked up to 3 freeze and thaw cycles. There was no impact of freeze and thaw
cycles on the stability of probe drugs and their glucuronidated metabolites, and QCs in triplicate.
The processed and unprocessed samples were stable at ambient temperature for 24 to 48 hours.
4.1.1.7 Recovery
Recoveries of test compounds, paracetamol and aspirin and their glucuronidated
metabolites were appraised at three different concentration levels. The recovery of PAR and
PAR-Glu was > 98 % whereas recovery of ASP and ASP-Glu was > 95%.
4.1.2. Paracetamol Phenotype
The concentration of paracetamol, paracetamol glucuronide, and ratio of paracetamol
glucuronide to paracetamol, distribution of fast, intermediate and slow glucuronidators of healthy
male and female volunteers was determined. The fast, intermediate and slow glucuronidation
phenotype was established from molar ratio of PAR-Glu/PAR by using probit plot. The probit

lxxxviii
plot shows apparent trimodal distribution with two antimodes at glucuronidation metabolic ratio
of 0.3 and 1.8 for paracetamol (PAR). The volunteers having molar ratio less than or equal to 0.3
were supposed to be slow glucuronidators whereas those with molar ratio of >0.3 were
intermediate glucuronidators and those with molar ratio of ≥1.8 were considered fast or rapid
glucuronidators at 1.5 hour after a single oral dose of paracetamol (1000mg). The probability
plot for all male and female volunteers showing the cut off points is presented in Figure 4.5. The
frequency histogram displayed the number of male and female volunteers having slow,
intermediate and fast glucurpnidation.
4.1.2.1 Male Volunteers
The concentration of paracetamol, paracetamol glucuronide, paracetamol
glucuronide/paracetamol metabolic ratio and distribution of slow, intermediate and fast
glucuronidators of healthy male volunteers is given in Table 4.7. The frequency histograms were
plotted against the metabolic ratio of PAR-Glu/PAR for the male volunteers shown in Figure 4.6.
The PAR-Glu/PAR metabolic ratio for the male volunteers was ranged from 0.23 to 4.72,
maximum number of volunteers have metabolic ratio ranging from 0.2 to 2.8. The allocation of
glucuronidation phenotype illustrated that 7% (4) were slow, 37% (22) were intermediate and
56% (33) male volunteers were fast glucuronidators phenotypically (Table 4.9).
4.1.2.2 Female Volunteers
The concentration of paracetamol, paracetamol glucuronide, paracetamol
glucuronide/paracetamol metabolic ratio and distribution of slow, intermediate and fast
glucuronidators of healthy female volunteers is given in Table 4.8. The frequency histograms
were plotted against metabolic ratio of PAR-Glu/PAR for the female volunteers (Figure 4.7).
The PAR-Glu/PAR metabolic ratio for the female volunteers was ranged from 0.26 to 2.95,
highest number of volunteers have metabolic ratio ranging from 0.6 to 1.8.

lxxxix
Figure 4.5 Probability plot of paracetamol-glucuronide/paracetamol metabolic ratio in healthy
male and female volunteers (n=109) showing cut off points.

xc
Table 4.7.Paracetamol (PAR) and paracetamol glucuronide (PAR-Glu) concentration, PAR-
Glu/PAR ratio, slow, intermediate and fast glucuronidators assigned to male (n=59) subjects.
Subject No. Concentration (µg/mL) PAR-GLU/PAR
ratio
Slow/Intermediate/
Fast PAR PAR-GLU
1 39.84 143.64 3.61
Fast
2 23.23 5.32 0.23
Slow
3 21.95 15.47 0.70
Intermediate
4 19.21 16.19 0.84
Intermediate
5 60.83 16.95 0.28
Slow
6 33.03 77.52 2.35
Fast
7 11.49 51.62 4.49
Fast
8 30.05 36.49 1.21
Fast
9 12.13 9.69 0.80
Intermediate
10 6.28 16.55 2.64
Fast
11 54.87 49.85 0.91
Intermediate
12 96.78 121.69 1.26
Fast
13 14.42 16.64 1.15
Fast
14 42.22 100.48 2.38
Fast
15 18.78 20.37 1.08
Fast
16 37.02 31.16 0.84
Intermediate
17 26.56 28.75 1.08
Fast
18 12.51 12.83 1.03
Fast
19 20.63 17.88 0.87
Intermediate
20 54.87 68.61 1.25
Fast
21 8.97 20.10 2.24
Fast
22 25.54 75.74 2.97
Fast
23 197.50 116.33 0.59
Intermediate
24 6.23 22.02 3.54
Fast
25 95.06 89.81 0.94
Intermediate
26 20.33 15.77 0.78
Intermediate

xci
27 3.07 14.48 4.72
Fast
28 14.14 23.44 1.66
Fast
29 13.26 11.71 0.88
Intermediate
30 2.38 7.91 3.32
Fast
31 25.25 22.09 0.87
Intermediate
32 28.02 24.32 0.87
Intermediate
33 10.86 24.07 2.22
Fast
34 12.23 18.05 1.48
Fast
35 4.70 4.08 0.87
Intermediate
36 73.37 65.63 0.89
Intermediate
37 4.50 13.44 2.98
Fast
38 30.06 96.52 3.21
Fast
39 73.84 60.58 0.82
Intermediate
40 4.23 10.37 2.45
Fast
41 6.64 10.84 1.63
Fast
42 14.08 12.43 0.88
Intermediate
43 16.60 17.83 1.07
Fast
44 28.28 24.14 0.85
Intermediate
45 85.42 24.61 0.29
Slow
46 21.68 19.43 0.89
Intermediate
47 28.23 24.66 1.27
Intermediate
48 21.24 30.18 1.42
Fast
49 22.61 25.64 1.13
Fast
50 8.51 7.63 0.89
Intermediate
51 11.03 14.52 1.32
Fast
52 17.37 13.12 0.75
Intermediate
53 32.29 55.36 1.71
Fast

xcii
54 16.18 27.12 1.68
Fast
55 7.08 4.59 0.65
Intermediate
56 26.02 6.18 0.24
Slow
57 6.21 8.85 1.42
Intermediate
58 5.39 12.13 2.25
Fast
59 3.33 5.20 1.56
Fast
Table.4.8. Paracetamol (PAR) and paracetamol glucuronide (PAR-Glu) concentration, PAR-
Glu/PAR ratio, slow, intermediate and fast glucuronidators assigned to female (n=50) subjects.
Subject No. Concentration (µg/mL) PAR-GLU/ PAR
ratio
Slow/Intermediate/
Fast PAR PAR-GLU
1 35.01 26.10 0.75
Intermediate
2 19.99 21.97 1.10
Fast
3 34.02 23.16 0.68
Intermediate
4 13.86 14.35 1.04
Fast
5 8.76 15.00 1.71
Fast
6 16.09 21.89 1.36
Fast
7 22.67 24.55 1.08
Fast
8 23.01 16.42 0.71
Intermediate
9 7.56 12.16 1.61
Fast
10 28.66 55.04 1.92
Fast
11 28.63 25.42 0.89
Intermediate
12 12.96 14.76 1.14
Fast
13 13.16 16.93 1.29
Fast
14 18.17 19.98 1.10
Fast
15 35.86 25.81 0.72
Intermediate
16 35.45 25.19 0.71
Intermediate
17 31.32 26.54 0.85
Intermediate

xciii
18 25.09 31.16 1.24
Fast
19 18.43 27.34 1.48
Fast
20 28.67 22.91 0.80
Intermediate
21 43.66 45.05 1.03
Fast
22 11.10 25.34 2.28
Fast
23 54.15 104.06 1.92
Fast
24 64.70 46.04 0.71
Intermediate
25 29.75 30.73 1.03
Fast
26 54.67 60.65 1.11
Fast
27 142.94 36.78 0.26
Slow
28 24.53 30.06 1.23
Fast
29 30.58 9.16 0.30
Slow
30 58.55 47.70 0.81
Intermediate
31 20.25 20.99 1.04
Fast
32 15.56 15.28 0.98
Fast
33 25.97 18.55 0.71
Intermediate
34 21.52 23.13 1.08
Fast
35 24.69 30.93 1.25
Fast
36 9.07 22.96 2.53
Fast
37 32.09 88.50 2.76
Fast
38 83.05 59.36 0.71
Intermediate
39 53.64 38.60 0.72
Intermediate
40 17.93 20.24 1.13
Fast
41 18.91 17.42 0.92
Fast
42 129.42 34.13 0.26
Slow
43 202.00 173.56 0.86
Intermediate
44 103.73 74.54 0.72
Intermediate
45 40.85 11.57 0.28
Slow

xciv
46 72.73 134.48 1.85
Fast
47 21.78 36.95 1.70
Fast
48 44.73 120.82 2.70
Fast
49 42.26 30.43 0.72
Intermediate
50 41.51 122.36 2.95
Fast
The frequency histograms divide the population in slow, intermediate and fast
glucuronidators as shown in Figure 4.8. The distribution of glucuronidation phenotype in the
male volunteers for slow, intermediate and fast was approximately 7%, 39% and 54% while in
female volunteers, this distribution was 8%, 32% and 60%, respectively (Table 4.9). The
distribution of glucuronidation phenotype for PAR displayed trimodal distribution in both female
and male volunteers. The comparative distribution of slow glucuronidators in male and female
(7% and 8%) healthy volunteers was similar. The male and female volunteers did not show the
noteworthy variation for intermediate (37% and 32%) and fast (56% and 60%) glucuronidators.
Overall, there was non significant difference in the PAR phenotype. Wojcicki et al., (1979)
studied pharmacokinetic of paracetamol in plasma samples of men and women. It is accounted
that paracetamol metabolism is higher in men as compared to women. This is due to increased
glucuronidation activity in men than women. Pabba et al., (2002) investigated the metabolism of
paracetamol in healthy Indian population and determined the concentration of paracetamol and
its metabolites. The concentration of glucuronide conjugates was found to be higher and this
supports the present study as glucuronide is major metabolite of paracetamol. Osborne et al.,
(1991) studied paracetamol metabolism in healthy male Caucasians and Chineses to describe
ethnic differences in their glucuronidation capacity. No difference was observed in
glucuronidation capacity of paracetmol by both populations as the fraction of paracetamol
glucuronide was higher in them as compared to sulphate and cystein metabolites. This describes
that glutathione resvoirs are equally present in both populations.
The concentration of PAR and PAR-Glu in the plasma sample was determined through
HPLC method. The method was validated for trouble-free sample processing and quick
determination of UGT phenotype. UGT glucuronidation phenotype was appraised by measuring

xcv
the PAR-Glu and PAR metabolic ratio in the 1.5 hour plasma sample after single dose
administration. In many studies, the paracetamol glucuronidation phenotype was determined in
Hong Kong Chinese, Caucasian healthy subjects after administration of a single oral dose via
High Performance Liquid Chromatography (Critchley et al., 2005; Flouvat et al., 2004). It is
obvious from various studies that glucuronidation phenotype could be discriminated by
measuring the conjugated drug to non conjugated drug ratio in plasma or urine samples (Bock et
al., 1987; Navarro et al., 2011).
Figure 4.6 Frequency histogram of metabolic ratio of PAR-Glu/PAR showing trimodal
distribution (slow, intermediate and fast) of healthy male volunteers (n=59).
43210
25
20
15
10
5
0
PAR-Glu/PAR
Freq
uen
cy

xcvi
Figure 4.7.Frequency histogram of metabolic ratio of PAR-Glu/PAR showing trimodal
distribution (slow, intermediate and fast) of healthy female volunteers (n=50).
Figure 4.8 Frequency histogram of metabolic ratio of PAR-Glu/PAR showing trimodal
distribution (slow, intermediate and fast) of healthy male and female volunteers (n=109).
3.02.41.81.20.6
12
10
8
6
4
2
0
PAR-Glu/PAR
Freq
uen
cy
4.503.753.002.251.500.75
25
20
15
10
5
0
PAR-Glu/PAR
Freq
uen
cy

xcvii
Table 4.9 Distribution of glucuronidation phenotype for paracetamol in healthy male and female
volunteers (n=109)
Volunteers Fast Intermediate Slow
Male % 54.2% (32/59) 38.9% (23/59) 6.8% (4/59)
Female % 60% (30/50) 32% (16/50) 8.% (4/50)
Total 56.9% (62/109) 35.8% (39/109) 7.3% (8/109)
In current project the paracetamol was used as a substrate for UGT, because 52 to 57
percent PAR is metabolized and excreted from the body through glucuronidation pathway by
UGT. The glucuronidation phenotype was found out by measuring the metabolic ratio of
glucuronidated paracetamol to non metabolized or free paracetamol in the local healthy
population of Pakistan. The classification of glucuronidation phenotype illustrates the triomodel
distribution of slow, intermediate and fast glucuronidators with antimode values of 0.3 and 1.8.
The study in Caucasian and Oriental subjects displayed that the metabolism of acetaminophen in
humans have apparently bimodality presenting fairly extensive glucuronidation (Patel et al.,
1992). In another study, distribution of paracetamol glucuronide to paracetamol metabolic ratio
showed unimodality (Bock et al., 1994).
The divergent results may be due to differences in ethnicity and in genetic make of the
population. Many studies accounted that the measure of glucuronidation level may differ broadly
due to geographical basis and ethinicities. The ethnic diversity in paracetamol biotransformation
may be related to pharmacogenetic and environmental aspects counting differences in protein
intake and diet (Critchley et al., 1986).
4.1.3. Aspirin (Acetyl salicylic acid) Phenotype
The concentration of aspirin (acetyl salicylic acid), aspirin glucuronide (salicylic acid
acyl glucuronide), and ratio of salicylic acid acyl glucuronide to acetyl salicylic acid and
distribution of fast and slow glucuronidators of healthy male and female volunteers was
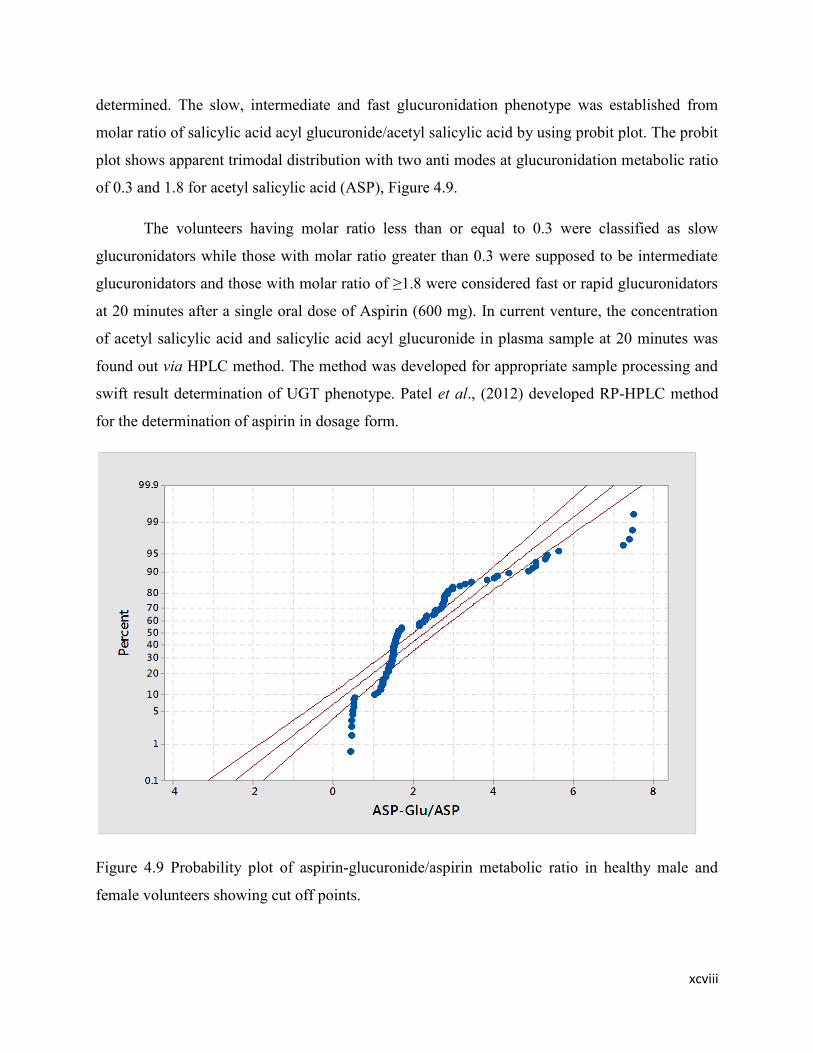
xcviii
determined. The slow, intermediate and fast glucuronidation phenotype was established from
molar ratio of salicylic acid acyl glucuronide/acetyl salicylic acid by using probit plot. The probit
plot shows apparent trimodal distribution with two anti modes at glucuronidation metabolic ratio
of 0.3 and 1.8 for acetyl salicylic acid (ASP), Figure 4.9.
The volunteers having molar ratio less than or equal to 0.3 were classified as slow
glucuronidators while those with molar ratio greater than 0.3 were supposed to be intermediate
glucuronidators and those with molar ratio of ≥1.8 were considered fast or rapid glucuronidators
at 20 minutes after a single oral dose of Aspirin (600 mg). In current venture, the concentration
of acetyl salicylic acid and salicylic acid acyl glucuronide in plasma sample at 20 minutes was
found out via HPLC method. The method was developed for appropriate sample processing and
swift result determination of UGT phenotype. Patel et al., (2012) developed RP-HPLC method
for the determination of aspirin in dosage form.
Figure 4.9 Probability plot of aspirin-glucuronide/aspirin metabolic ratio in healthy male and
female volunteers showing cut off points.

xcix
UGT glucuronidation phenotype was appraised by measuring the salicylic acid acyl
glucuronide and acetyl salicylic acid metabolic ratio in plasma sample at 20 minutes after oral
single dose administration. The determination of metabolic ratio to drug fraction is more accurate
and precise way to establish the glucuronidation phenotype in plasma than measuring the urinary
metabolic ratio (Hein, 2009).
4.1.3.1. Male Subject
The frequency histograms were plotted against molar ratio of salicylic acid acyl
glucuronide/acetyl salicylic acid for the male volunteers (Figure 4.10). The salicylic acid acyl
glucuronide/acetyl salicylic acid metabolic ratio for male volunteers was varied from 0.44 to
7.43. More volunteers have molar ratio ranging from 0.4 to 4.4. The allocation of
glucuronidation phenotype illustrated that 10% (6) were slow, 46% (27) were intermediate and
44% (26) male volunteers were fast glucuronidators phenotypically (Table 4.12).
4.1.3.2. Female Subjects
The frequency histograms were plotted against metabolic ratio of salicylic acid acyl
glucuronide/ acetyl salicylic acid for the female volunteers (Figure 4.8). The salicylic acid acyl
glucuronide/ acetyl salicylic acid metabolic ratio for female volunteers was varied from 0.45 to
7.49, great number of volunteers have metabolic ratio ranging from 0.4 to 3.4. The division of
glucuronidation phenotype displayed that 8% (4) were slow, 46% (23) were intermediate and
46% (23) female volunteers were fast glucuronidators phenotypically (Table 4.12).
The frequency histograms for all the volunteers are shown in the Figure 4.10. The
trimodal distribution (slow, intermediate and fast) was presented for glucuronidation phenotype.
The distribution of glucuronidation phenotype for acetyl salicylic acid in plasma sample of
healthy volunteers (n=109) demonstrated that approximately 9.00% and 46% of local population
had slow and intermediate glucuronidation, respectively while 45% of the population had fast
glucuronidation. The population illustrates trimodal distribution; the salicylic acid acyl
glucuronide to acetyl salicylic acid metabolic ratio was used to compute the percentage of slow,
intermediate and fast glucuronidators. Kuehl et al., (2006) determined the glucuronidation of
aspirin by relevant UGTs and isolated the salicylic acid acyl glucuronide and salicylic acid
phenolic glucuronide from urine of individuals dosed 650 mg aspirin. In present study, the

c
glucuronidation of aspirin is higher in females than males as supported by Navarro et al., (2011)
who determined the glucuronidation activity of UGT by using aspirin as probe drug in different
populations like Caucasians, Asians and African Americans and illustrated that aspirin
metabolism is higher in women as compared to men. These variations in metabolism of drug
might be due to differences in hormone level, body fat and biotransfermation enzyme acivity. In
another study individuals were classified phenotypically for aspirin and displayed that its
disposition is more in males than in females (Miners et al., 1986). Chen et al., (2007) studied the
genetic polymorphism of UGT and measured glucuronidation rate by administering aspirin to
healthy individuals (n=28). Apparently a bimodal distribution was found in individuals under
consideration. Depending upon genotype, urinary excretion and renal clearance of aspirin was
more than 8 hours. Low dose of aspirin was known to have bimodal effect on renal clearance of
uric acid in plasma and urine sample (Caspi et al., 2000). The individuals with variant alleles
were found to be fast glucuronidators. Lares-Asseff et al., (2004) studied the pharmacokinetics
of aspirin and its metabolites in Otomic and Mestician ethnic groups. Metabolic rate of aspirin
was significantly different in both groups. However, there is a lot of disagreement about
glucuronidation phenotype displaying variation. These contentious effects may be due to
environment, chemicals and genetic make up differences in various populations (Critchley et al.,
1986). The smaller number of slow metabolizers in population made it complex and hard to
establish associations. The divergence from current study may be due to different sample size,
studies conducted in different populations and due to biological disparity and variation.

ci
Table 4.10.Aspirin (ASP) and ASP Glucuronide (ASP-Glu) concentration, ASP-Glu /ASP ratio,
slow, intermediate and fast glucuronidators assigned to male (n=59) subjects.
Subject No. Concentration (µg/mL) ASP-GLU/ASP
ratio
Slow/Intermediate/
Fast ASP ASP-GLU
1 1.06 7.67 7.25
Fast
2 9.01 4.45 0.49
Slow
3 5.86 8.76 1.50
Intermediate
4 3.21 5.01 1.56
Intermediate
5 7.72 3.58 0.46
Slow
6 2.68 9.29 3.46
Fast
7 4.18 9.67 2.31
Fast
8 6.20 17.28 2.79
Fast
9 5.60 9.46 1.69
Intermediate
10 1.86 9.40 5.05
Fast
11 2.35 3.99 1.70
Intermediate
12 8.57 12.79 1.49
Intermediate
13 3.34 8.55 2.56
Fast
14 3.96 11.78 2.98
Fast
15 4.52 9.67 2.14
Fast
16 6.52 9.95 1.53
Intermediate
17 8.91 4.25 0.48
Slow
18 4.05 9.42 2.33
Fast
19 4.31 7.36 1.71
Intermediate
20 3.72 8.49 2.28
Fast
21 4.06 11.23 2.77
Fast
22 4.82 7.29 1.51
Intermediate
23 5.36 8.22 1.53
Intermediate
24 3.68 9.91 2.70
Fast
25 5.74 7.60 1.33
Intermediate
26 6.54 10.75 1.64
Intermediate

cii
27 3.64 10.38 2.85
Fast
28 2.99 12.26 4.11
Fast
29 4.59 6.09 1.32
Intermediate
30 3.39 9.39 2.77
Fast
31 4.76 7.03 1.48
Intermediate
32 5.31 8.36 1.57
Intermediate
33 7.26 3.75 0.52
Slow
34 4.36 11.94 2.74
Fast
35 4.12 6.08 1.48
Intermediate
36 4.87 7.25 1.49
Intermediate
37 3.58 8.16 2.28
Fast
38 2.84 7.90 2.78
Fast
39 4.98 6.98 1.40
Intermediate
40 3.23 8.24 2.55
Fast
41 3.18 12.18 3.83
Fast
42 5.07 7.94 1.57
Intermediate
43 3.42 10.17 2.97
Fast
44 4.25 5.33 1.26
Intermediate
45 8.40 4.54 0.54
Slow
46 5.95 8.17 1.37
Intermediate
47 5.53 8.17 1.48
Intermediate
48 3.12 7.30 2.34
Fast
49 3.64 5.81 1.60
Intermediate
50 3.93 4.86 1.24
Intermediate
51 0.70 5.25 7.47
Fast
52 3.56 4.71 1.32
Intermediate
53 2.87 6.19 2.15
Fast

ciii
54 3.42 5.33 1.56
Intermediate
55 3.78 3.93 1.04
Intermediate
56 5.27 2.32 0.44
Slow
57 5.57 8.18 1.47
Intermediate
58 7.38 23.23 3.15
Fast
59 1.45 7.36 5.06
Fast

civ
Table 4.11.Aspirin (ASP) and ASP Glucuronide (ASP-Glu) concentration, ASP-Glu /ASP ratio,
slow, intermediate and fast glucuronidators assigned to female (n=50) subjects.
Subject No. Concentration (µg/mL) ASP-Glu/ ASP
ratio
Slow/Intermediate/
Fast ASP ASP-Glu
1 7.15 9.83 1.37
Intermediate
2 3.03 13.28 4.38
Fast
3 7.38 11.15 1.51
Intermediate
4 3.33 7.17 2.15
Fast
5 2.95 7.85 2.66
Fast
6 7.45 18.92 2.54
Fast
7 8.03 11.25 1.40
Intermediate
8 6.88 11.02 1.60
Intermediate
9 3.47 4.17 1.20
Intermediate
10 1.18 6.24 5.30
Fast
11 4.76 7.08 1.49
Intermediate
12 2.77 4.27 1.55
Intermediate
13 3.33 7.53 2.26
Fast
14 8.24 20.98 2.55
Fast
15 7.13 9.76 1.37
Intermediate
16 6.82 11.08 1.62
Intermediate
17 18.82 22.73 1.21
Intermediate
18 4.13 30.57 7.40
Fast
19 4.89 19.72 4.03
Fast
20 7.56 12.41 1.64
Intermediate
21 4.26 11.62 2.73
Fast
22 9.31 14.16 1.52
Intermediate
23 7.08 39.81 5.62
Fast
24 6.79 9.76 1.44
Intermediate
25 3.57 17.77 4.98
Fast
26 3.09 8.56 2.77
Fast

cv
27 31.47 15.69 0.50
Slow
28 5.73 8.60 1.50
Intermediate
29 13.02 6.76 0.52
Slow
30 6.28 10.08 1.60
Intermediate
31 5.39 6.69 1.24
Intermediate
32 3.14 8.95 2.85
Fast
33 5.84 9.12 1.56
Intermediate
34 5.48 13.58 2.48
Fast
35 4.42 33.08 7.49
Fast
36 3.15 16.88 5.35
Fast
37 4.72 23.05 4.88
Fast
38 2.71 3.97 1.46
Intermediate
39 6.66 8.24 1.24
Intermediate
40 3.19 10.51 3.29
Fast
41 3.48 7.60 2.18
Fast
42 7.94 3.67 0.46
Slow
43 9.49 11.28 1.19
Intermediate
44 4.20 6.29 1.50
Intermediate
45 8.72 3.91 0.45
Slow
46 4.65 12.65 2.72
Fast
47 3.25 8.93 2.75
Fast
48 4.17 12.02 2.88
Fast
49 5.67 8.14 1.44
Intermediate
50 4.31 4.76 1.10
Intermediate

cvi
Table 4.12 Distribution of Glucuronidation phenotype for aspirin in healthy male and female
volunteers (n=109)
Volunteers Fast Intermediate Slow
Male % 44.1% (26/59) 45.8% (27/59) 10.2% (6/59)
Female % 46% (23/50) 46% (23/50) 8% (4/50)
Total 44.9% (49/109) 45.9% (50/109) 9.2% (10/109)
Figure 4.10.Frequency histogram of metabolic ratio of ASP-Glu/ASP showing trimodal
distribution (slow, intermediate and fast) of healthy male volunteers (n=59).
6.44.83.21.6
25
20
15
10
5
0
ASP-Glu/ASP ratio
Fre
qu
en
cy

cvii
Figure. 4.11 Frequency histogram of metabolic ratio of ASP-Glu/ASP showing trimodal
distribution (slow, intermediate and fast) of healthy female volunteers (n=50).
Figure 4.12 Frequency histogram of metabolic ratio of ASP-Glu/ASP showing trimodal
distribution (slow, intermediate and fast) of healthy male and female volunteers (n=109).
6.44.83.21.6
25
20
15
10
5
0
ASP-Glu/ASP ratio
Freq
uenc
y
7654321
40
30
20
10
0
ASP-Glu/ASP ratio
Freq
uen
cy

cviii
4.1.4 Concordance between Probe drugs (Paracetamol and Aspirin)
The concordance or association was established by using k-statistics between drug
phenotypes (paracetamol and aspirin) and for comparison of phenotypes in male and female
volunteers, chi square test was used. The trimodal distribution of fast, intermediate and slow
glucuronidation was monitored by computing the metabolic ratio of paracetamol glucuronide to
paracetamol in 1.5 hour plasma sample and salicylic acid acyl glucuronide to acetyl salicylic acid
in 20 minute plasma sample in same volunteers.
4 .1.4.1 Male Volunteers
The UGT1A & UGT2B glucuronidation phenotype was established in healthy male
volunteers by using paracetamol and aspirin. The results attained are recapitulated in Table 4.13.
The 26 (44.07%) of the male volunteers were the fast glucuronidators by both phenotypes and 6
volunteers were fast glucuronidators by aspirin phenotype. Out of these 6 volunteers, 4 were
classified as intermediate and 2 were slow glucuronidator by paracetamol phenotype. Overall, 23
(38.98%) volunteers were intermediate and 4 (6.78%) were slow glucuronidators by both
phenotypes. The male volunteers (n=59) were classified by PAR phenotype into 54.24% (32/59)
fast, 38.98% (23/59) intermediate and 6.78% (4/59) slow glucuronidators, whereas the ASP
phenotype classified the male volunteers as 44.07% (26/59) fast, 45.76% (27/59) intermediate
and 10.17% (6/59) slow glucuronidators. The results obtained by comparison of both drugs in
male volunteers display excellent association or concordance and have high Kappa value 82.3%
(0.823) for PAR and ASP phenotype.
4 .1.4.2 Female Volunteers
The results attained from female volunteers for PAR and ASP phenotypes are presented
in Table 4.14. The 23 (46%) of the female volunteers were fast glucuronidators by both PAR and
ASP phenotypes and 7 volunteers were fast glucuronidators by aspirin phenotype but classified
as intermediate glucuronidators by PAR phenotype whereas 16 (32%) and 4 (8%) volunteers
were categorized as intermediate and slow glucuronidators by both PAR and ASP phenotypes.
The female volunteers (n=50) were classified into 60.00% (30/50) fast glucuronidators and
32.00% (16/50) intermediate and 8.00% (4/50) slow glucuronidators by paracetamol phenotype,
respectively. Aspirin categorized the female volunteers into 46.00% (23/50) fast, 46.00% (23/50)
intermediate and 8.00% (4/50) slow glucuronidators.

cix
Table 4.13 Comparison of Paracetamol-Aspirin phenotype in male subjects (n=59)
Paracetamol Phenotype (Male) Total
Fast Intermediate Slow
Aspirin
Phenotype
(Male)
Fast 26 4 2 32
Intermediate 0 23 0 23
Slow 0 0 4 4
Total 26 27 6 59
Kappa value = 0.823
Table 4.14 Comparison of Paracetamol-Aspirin phenotype in female subjects (n=50)
Paracetamol Phenotype (Female) Total
Fast Intermediate Slow
Aspirin
Phenotype
(Female)
Fast 23 7 0 30
Intermediate 0 16 0 16
Slow 0 0 4 4
Total 23 23 4 50
Kappa value = 0.755
Table 4.15.Comparison of Paracetamol-Aspirin phenotype in male and female subjects (n=109)
Paracetamol Phenotype Total
Fast Intermediate Slow
Aspirin
Phenotype
Fast 49 11 2 62
Intermediate 0 39 0 39
Slow 0 0 8 8
Total 49 50 10 109
Kappa value= 0.792
The results obtained by comparison of PAR and ASP phenotypes in female volunteers display
good association or concordance by both phenotypes and have 75.5% (0.755) kappa value. In
present project, non significant variation (P>0.05) was monitored between male and female

cx
volunteers for giving out fast, intermediate and slow glucuronidation phenotype by both probe
drugs.
The 56.88% and 44.95% volunteers were fast glucuronidators by paracetamol and aspirin
(acetyl salicylic acid), respectively. On the other hand, non significant but incompatible results
were attained from thirteen volunteers as their plasma analysis of aspirin proposed that they were
fast glucuronidators but investigation of plasma paracetamol graded them as intermediate (11)
and slow (2) glucuronidators. There were roughly 35.78% and 7.34% volunteers categorized as
intermediate and slow glucuronidators by both PAR and ASP phenotypes. The concordance or
correlation was determined by Kappa (k-statistics) test and Kappa value computed the level of
agreement or concordance between PAR and ASP phenotypes. On the whole, good correlation
was figured out between both phenotypes as had accessed from the kappa value 79.2% (0.792).
The present project displayed trimodal distribution of PAR and ASP phenotypes and
were associated positively. No literature was figured out regarding the phenotyping of UGT
using two substrates (PAR, ASP) which displayed association between two phenotypes. The
similar study was design to determine the phenotyping of N-acetyltransferse 2 by using two
probe drugs (dapsone and sulfamethazine) and displayed good concordance between both probe
drugs (Ellard et al., 2006). Due to diverse genetic and environmental factors and investigational
or analytical methods, the probe drugs used for phenotyping did not separate the population
precisely and accurately and demonstrate overlapping deviation. But determination of
glucuronidation phenotype presents better estimation of toxicity and efficacy in making
therapeutic judgment.
4.2 Genotyping of UGT1A and UGT2B genes
The UGT polymorphism in 3' UTR region, intron and exon 1 was determined in the local
Pakistani population. The genetic polymorphism was investigated with conventional PCR
followed by RFLP and real time PCR by using specific probes in 109 volunteers (female=50 and
male=59). The glucuronidation rate was determined genotypically by using genomic DNA and
probes specific to sequence to find out SNP (single nucleotide polymorphism) in healthy male
and female volunteers. TaqMan based assay was performed for all SNPs except rs2070959; A>G
and rs1105879; A>C (UGT1A6). These SNPs of UGT1A6 were determined by conventional

cxi
PCR using restriction enzymes and PCR product was run on 1.5% agarose gel. Then digestion of
PCR product (267 bp) was performed with Nsil and Fnu 4H1 restriction enzymes. Finally,
amplicons obtained after restriction were run on 3% agarose gel to differentiate among
homozygous wild type, heterozygous and homozygous variant alleles. The representative gels of
PCR product and restriction of amplicons of male and female volunteers for UGT1A6 gene are
shown in Figures 4.13, 4.14, 4.15, respectively.Genotypes of UGT1A1 isoform of UGT1A,
UGT2B4 and UGT2B15 genes were allocated using allele discrimination software.
The conditions for real time PCR were optimized for amplification of UGT1A1,
UGT2B4 and UGT2B15 genes with HapMap DNA template. The optimized genomic DNA
concentration was 40 ng/µL and annealing temperature was 62 C0 for qPCR to obtain a specific
amplification plot and allele discrimination plot. The different Single Nucleotide Polymorphisms
(rs10929303, rs8330 and rs1131878) in 3' UTR region and in intron (rs2013573 and rs1902023)
of UGT1A and UGT2B were genotyped in all individuals. The results for homozygous wild
type, heterozygote and homozygous variant allele of all SNPs for female and male healthy
volunteers are presented in Table 4.16 and 4.17, correspondingly. The most relevant single
nucleotide polymorphisms to paracetamol glucuronidation are rs8330, rs10929303 and
rs1902023 and aspirin relevant SNPs are rs2013573 and UGT1A6. The results have illustrated
that individuals who are homozygous for wild type allele of different SNPs in male population
are fast glucuronidator and the individuals homozygous for variant allele are slow
glucuronidators. The genotype results of UGT1A1 gene SNPs (rs8330 and rs10929303) have
shown that distribution of fast, intermediate and slow glucuronidators for both SNPs in male and
female volunteers is approximately the same i.e 54%, 39% and 7%, respectively in male while in
female 60% are fast, 30% intermediate and 8% are slow glucuronidators, respectively. For SNPs
of UGT1A6 (rs2070959 and rs1105879) gene, the 44% (26/59) of male volunteers are fast, 46%
(27/59) are of intermediate and 10% (6/59) are slow glucuronidators for both SNPs while 46%
(23/50) female volunteers are of intermediate glucuronidation genotypically. For SNP
rs2070959, 48% (24/50) and 6% (3/50) of the volunteers are fast and slow glucuronidators while
for rs1105879 SNP, 46% (23/50) are fast and 8% (4/50) are slow glucuronidators, respectively.

cxii
Figure 4.13 Agarose gel electrophoresis after PCR amplification of fragment of UGT1A6 (267
bp) using specific primers from genomic DNA of male subjects. The amplicons were resolved on
1.5% agarose gel along with 1 Kb ladder from Fermentas.
Figure 4.14 Agarose gel electrophoresis after PCR amplification of fragment of UGT1A6 (267
bp) using specific primers from genomic DNA of female subjects. The amplicons were resolved
on 1.5% agarose gel along with 1 Kb ladder from Fermentas.
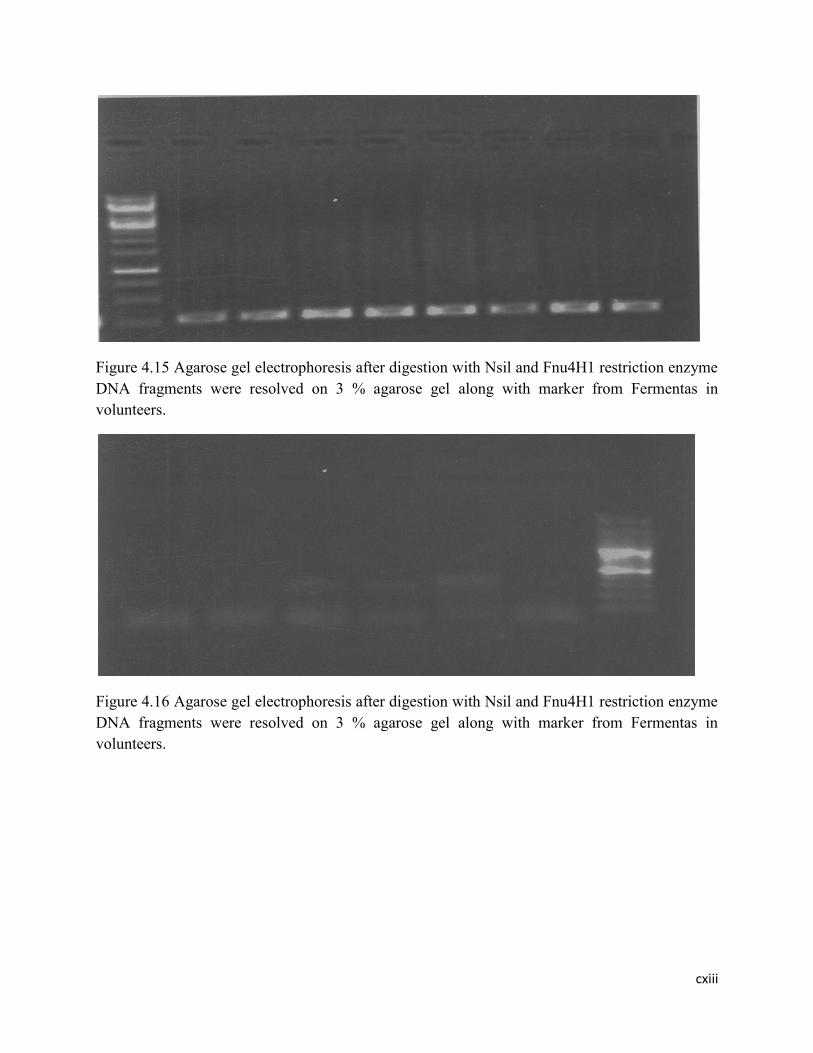
cxiii
Figure 4.15 Agarose gel electrophoresis after digestion with Nsil and Fnu4H1 restriction enzyme
DNA fragments were resolved on 3 % agarose gel along with marker from Fermentas in
volunteers.
Figure 4.16 Agarose gel electrophoresis after digestion with Nsil and Fnu4H1 restriction enzyme
DNA fragments were resolved on 3 % agarose gel along with marker from Fermentas in
volunteers.

cxiv
Figure 4.17 Agarose gel electrophoresis after digestion with Nsil and Fnu4H1 restriction enzyme
DNA fragments were resolved on 3 % agarose gel in volunteers.
Table 4.16 Genotyping of UGT1A and UGT2B genes in healthy male volunteers (n=59)
Subject
No.
rs2013573 rs1131878 rs10929303 rs1902023 rs8330 rs2070959 rs1105879
1 C/C T/T C/C A/A C/C A/A A/A
2 C/T C/C T/T C/C G/G G/G C/C
3 C/C T/T C/T A/C C/G A/G A/C
4 C/C T/T C/T A/C C/G A/G A/C
5 C/C T/T T/T C/C G/G G/G C/C
6 C/C T/T C/C A/A C/C A/A A/A
7 C/C T/T C/C A/A C/C A/A A/A
8 C/T T/T C/C A/A C/C A/A A/A
9 C/C C/T C/T A/C C/G A/G A/C
10 C/C T/T C/C A/A C/C A/A A/A
11 C/C C/T C/T A/C C/G A/G A/C
12 C/C T/T C/C C/C C/C A/G A/C
13 C/C T/T C/C A/A C/C A/A A/A
14 C/C T/T C/C A/A C/C A/A A/A
15 C/C T/T C/C A/A C/C A/A A/A
16 C/C C/T C/T A/C C/G A/G A/C
17 C/C T/T C/C A/A C/C G/G C/C
18 C/C T/T C/C A/A C/C A/A A/A
19 C/T C/T C/T A/C C/G A/G A/C
20 C/C T/T C/C A/A C/C A/A A/A
21 C/C T/T C/C A/A C/C A/A A/A
22 C/C T/T C/C A/A C/C A/G A/C
267 bp
180 bp
87 bp
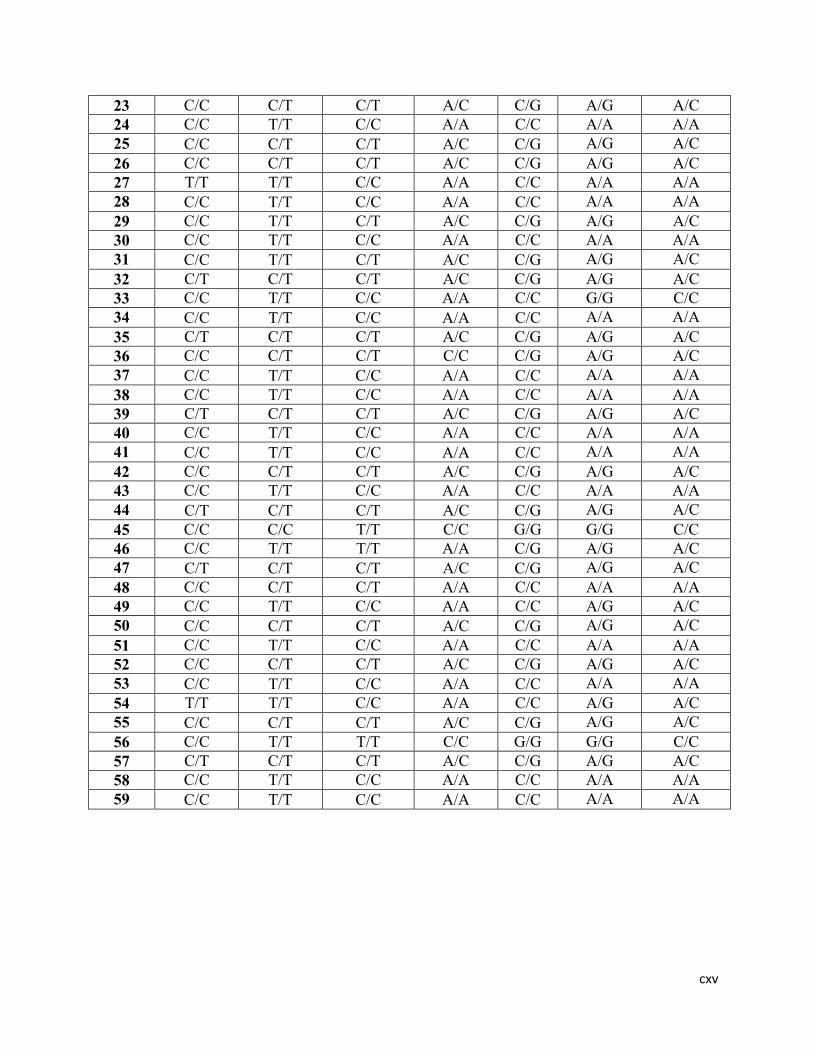
cxv
23 C/C C/T C/T A/C C/G A/G A/C
24 C/C T/T C/C A/A C/C A/A A/A
25 C/C C/T C/T A/C C/G A/G A/C
26 C/C C/T C/T A/C C/G A/G A/C
27 T/T T/T C/C A/A C/C A/A A/A
28 C/C T/T C/C A/A C/C A/A A/A
29 C/C T/T C/T A/C C/G A/G A/C
30 C/C T/T C/C A/A C/C A/A A/A
31 C/C T/T C/T A/C C/G A/G A/C
32 C/T C/T C/T A/C C/G A/G A/C
33 C/C T/T C/C A/A C/C G/G C/C
34 C/C T/T C/C A/A C/C A/A A/A
35 C/T C/T C/T A/C C/G A/G A/C
36 C/C C/T C/T C/C C/G A/G A/C
37 C/C T/T C/C A/A C/C A/A A/A
38 C/C T/T C/C A/A C/C A/A A/A
39 C/T C/T C/T A/C C/G A/G A/C
40 C/C T/T C/C A/A C/C A/A A/A
41 C/C T/T C/C A/A C/C A/A A/A
42 C/C C/T C/T A/C C/G A/G A/C
43 C/C T/T C/C A/A C/C A/A A/A
44 C/T C/T C/T A/C C/G A/G A/C
45 C/C C/C T/T C/C G/G G/G C/C
46 C/C T/T T/T A/A C/G A/G A/C
47 C/T C/T C/T A/C C/G A/G A/C
48 C/C C/T C/T A/A C/C A/A A/A
49 C/C T/T C/C A/A C/C A/G A/C
50 C/C C/T C/T A/C C/G A/G A/C
51 C/C T/T C/C A/A C/C A/A A/A
52 C/C C/T C/T A/C C/G A/G A/C
53 C/C T/T C/C A/A C/C A/A A/A
54 T/T T/T C/C A/A C/C A/G A/C
55 C/C C/T C/T A/C C/G A/G A/C
56 C/C T/T T/T C/C G/G G/G C/C
57 C/T C/T C/T A/C C/G A/G A/C
58 C/C T/T C/C A/A C/C A/A A/A
59 C/C T/T C/C A/A C/C A/A A/A

cxvi
Table 4.17. Genotyping of UGT1A and UGT2B genes in healthy female volunteers (n=50)
Subject
No.
rs2013573 rs1131878 rs10929303 rs1902023 rs8330 rs2070959 rs1105879
1 C/T C/T C/T A/C C/G A/G A/C
2 C/C T/T C/C A/A C/C A/A A/A
3 C/C C/T C/T A/C C/G A/G A/C
4 C/C T/T C/C C/C C/C A/A A/A
5 C/C T/T C/C A/A C/C A/A A/A
6 C/C T/T C/C A/A C/C A/A A/A
7 C/C T/T C/C A/C C/C A/G A/C
8 C/C C/T C/T A/C C/G A/G A/C
9 C/C T/T C/C A/C C/C A/G A/C
10 C/C T/T C/C A/A C/C A/A A/A
11 C/C C/T C/C A/C C/G A/G A/C
12 C/T T/T C/C A/C C/C A/G A/C
13 C/C T/T C/C A/A C/C A/A A/A
14 C/C T/T C/C A/A C/C A/A A/A
15 C/T C/T C/T A/C C/G A/G A/C
16 C/C T/T C/T A/C C/G A/G A/C
17 C/C T/T C/T A/C C/G A/G A/C
18 C/C T/T C/C C/C C/C A/A A/A
19 C/C T/T C/C A/A C/C A/A A/A
20 C/C T/T C/T A/C C/G A/G A/C
21 C/C T/T C/C C/C C/C A/A A/A
22 C/C T/T C/C A/C C/C A/G A/C
23 C/C T/T C/C A/A C/C A/A A/A
24 C/T C/T C/T A/C C/G A/G A/C
25 C/C T/T C/C A/A C/C A/A A/A
26 C/C T/T C/C A/A C/C A/A A/A
27 T/T C/C T/T C/C G/G G/G C/C
28 C/C T/T C/C A/C C/C A/G A/C
29 C/C T/T T/T C/C G/G G/G C/C
30 C/C T/T C/T A/C C/G A/G A/C
31 C/C T/T C/C A/A C/C A/G A/C
32 C/C T/T C/C A/C C/C A/A A/A
33 C/T C/T C/T A/C C/G A/G A/C
34 C/C T/T C/C A/A C/C A/A A/A
35 C/C T/T C/C A/A C/C A/A A/A
36 C/C T/T C/C A/A C/C A/A A/A
37 C/C T/T C/C A/A C/C A/A A/A
38 C/T C/T C/T A/C C/G A/G A/C
39 C/T C/T C/T A/C C/G A/G A/C
40 C/C T/T C/C A/C C/C A/A A/A
41 C/C T/T C/C A/A C/C A/A A/A

cxvii
42 C/C T/T T/T C/C G/G G/G C/C
43 C/C C/T C/T A/C C/G A/G A/C
44 C/C C/T C/T A/C C/G A/G A/C
45 C/C C/C T/T C/C G/G A/A C/C
46 C/C T/T C/C A/A C/C A/A A/A
47 C/C T/T C/C A/A C/C A/A A/A
48 C/C T/T C/C A/A C/C A/A A/A
49 C/T C/T C/T A/C C/G A/G A/C
50 C/C T/T C/C A/A C/C A/G A/C

cxviii
The classification of UGT2B4 SNP (rs2013573) in male and female volunteers is approximately
the same as 82%, 16% and 2% of the population are fast, intermediate and slow glucuronidators.
The rs1131878 SNP of UGT2B4 showed different ration of fast, intermediate and slow
glucuronidators in male and female volunteers. In male 64.41% (38/59) are fast, 32.20% (19/59)
are intermediate and 3.39% (2/59) are slow volunteers genotypically whereas 72% (36/50) of
female are fast, 24% (12/50) are intermediate and 4% (2/50) are slow glucuronidators for
rs1131878 SNP of UGT2B4. For UGT2B15 gene SNP (rs1902023), distribution of fast,
intermediate and slow glucuronidators is significantly different in male and female volunteers.
The 54.24% (32/59), 35.59% (21/59) and 10.17% (6/59) of male volunteers are fast, intermediate
and slow glucuronidators, respectively while in female, the percentage of fast, intermediate and
slow glucuronidators is 40% (20/50), 46% (23/50) and 14%(7/50), respectively. The genotypic
data obtained from female and male volunteers was used to get the limit of concordance between
paracetamol, aspirin phenotypes and UGT1A and UGT2B genotype and is presented in Table
4.16 and 4.17. The distribution of fast, intermediate and slow glucuronidators for different SNPs
of UGT1A and UGT2B in male and female volunteers is summarized in Table 4.18. The
genotypic data of different SNPs obtained from female and male volunteers was used to
determine the limit of correlation or concordance between phenotype (paracetamol, aspirin) and
genotype. The genotyping data of UGT1A and UGT2B genes displayed trimodal distribution of
homozygous wild type, heterozygote and homozygous variant allele. Many studies carried out
for the phenotyping and genotyping of UGT1A and UGT2B genes illustrate trimodal distribution
in various populations (Navarro et al., 2011; Scherer et al., 2014).

cxix
Table 4.18 Distribution of genotypic glucuronidation in healthy male (n=59) and female (n=50)
subjects
Gene SNP Male Fast Intermediate Slow Total
UGT1A1 rs8330 54.2% (32/59) 38.9%(23/59) 6.8%(4/59) 100
UGT1A1 rs10929303 52.5%(31/59) 40.7%(24/59) 6.8%(4/59) 100
UGT1A6 rs2070959 44.1%(26/59) 45.8%(27/59) 10.2%(6/59) 100
UGT1A6 rs1105879 44.1%(26/59) 45.8%(27/59) 10.2%(6/59) 100
UGT2B4 rs2013573 81.4%(48/59) 16.9%(10/59) 1.7%(1/59) 100
UGT2B4 rs1131878 64.4%(38/59) 32.2%(19/59) 3.4%(2/59) 100
UGT2B15 rs1902023 54.2%(32/59) 35.6%(21/59) 10.2%(6/59) 100
UGT1A1 rs8330 Female 60%(30/50) 32%(16/50) 8%(4/50) 100
UGT1A1 rs10929303 62%(31/50) 30%(15/50) 8%(4/50) 100
UGT1A6 rs2070959 48%(24/50) 46%(23/50) 6%(3/50) 100
UGT1A6 rs1105879 46%(23/50) 46%(23/50) 8%(4/50) 100
UGT2B4 rs2013573 82%(41/50) 16%(8/50) 2%(1/50) 100
UGT2B4 rs1131878 72%(36/50) 24%(12/50) 4%(2/50) 100
UGT2B15 rs1902023 40%(20/50) 46%(23/50) 14%(7/50) 100

cxx
4.2.1 Distribution of UGT1A and UGT2B allele and genotype frequencies
The genetic polymorphism of UGT1A and UGT2B alleles was determined in all
individuals (n=109) and frequency distribution of homozygous wild type, heterozygote and
homozygous variant alleles for various SNPs are summarized in Table 4.19. Distribution of
UGT1A1 (rs8330) genotype is 56.88% (n=62) homozygous wild type (C/C), 36.69% (n=40)
heterozygous (C/G) and 6.42% (n=7) homozygous variant (G/G), they are in linkage
disequilibrium with UGT1A1 (rs10929303) genotype. Of those with UGT1A1 (C/G; rs8330)
genotype, 56.88% are also UGT1A1(C/C); 34.86% who are UGT1A1(C/G) are UGT1A1 (C/T)
and 6.42% who are UGT1A1 (G/G) are UGT1A1 (T/T).
The allele frequency of UGT1A1 SNPs (440G→C rs8330, c.211T→C rs10929303) in 3'
UTR region is 75.51% and 26.39%, respectively in healthy local population of Pakistan. It is also
reported that these single nucleotide polymorphisms are associated with glucuronidation. This
allele frequency is closely resembled with that of European ancestral population. (Court et al.,
2013). It was reported that UGT1A1 (C/C; rs8330) and UGT1A1(C/C; rs10929303) are major
allele frequencies in Japanese and French Canadian population (Nishijima et al., 2014; Menard
et al., 2009) and it supported the present study. In another study conducted in Caucasian
Pediatric population, more prevalent alleles are UGT1A1 (C/C; rs8330) and UGT1A1(C/C;
rs10929303). This is consistent with the present study. From HapMap data base, it was found
that major allele in Caucasians and Han Chinese population is C/C. In contrast to this, major and
minor allele frequencies are equal in Yoruban population. The SNP (rs10929303) has been
studied in all major populations of the world and major allele in most of the studied populations
is C/C except African ancestry and Yoruban population (www.hapmap.org).
Two single nucleotide polymorphisms (rs2070959; A>G and rs1105879; A>C) in exon 1
region of UGT1A6 are studied that causes change in position of amino acids (T181A and
R184S), respectively. The genotype frequency of rs2070959 and rs1105879 in local population is
45% for homozygous wild type (A/A), 46% for heterozygous (A/C) and 9% for homozygous
variant (C/C), respectively. Palikhe et al., (2011) determined the genotype frequency of SNPs
(rs2070959 and rs1105879) in healthy individuals of Korean population. They reported that
58.2% individuals were homozygous, 37% were heterozygous and 4.8% were homozygous
variant for SNP (rs2070959). The genotype frequency for UGT1A6 (rs1105879) was 54.4%

cxxi
(AA), 37.9% (AC) and 7.6% (CC), respectively. Major allele in all populations of the world is
A/A. Lamp et al., (1999) determined the allele frequency of polymorphism in UGT1A6 in men
and women of Asian and Caucasian ethnic groups. 43.3% individuals were homozygous wild
type in both ethnic groups. Frequency of UGT1A6*2 variant allele was 0.226 and 0.375 in
Asians and Caucasians respectively. In another study, the genotype frequency of UGT1A6*1/*1,
UGT1A6*1/*2 and UGT1A6*2/*2 reported in healthy volunteers was 67.61%, 26.76% and
5.63%, respectively. UGT2B4 gene is located on chromosome number 4 and UGT2B4 SNP
(rs1131878; C>T) is positioned in part of gene encoding 3' un translated region. The C/C, C/T
and T/T genotypes frequency in local population of Pakistan is 3.67%, 27.52% and 68.81%
respectively. In Han Chinese population, this frequency is 81.3%, 18.0%, and 0.7%, respectively,
in healthy individuals (Che et al., 2015). There was a considerable difference in genotype
frequency of volunteers. This difference is due ethnicity and variability in genome make up. The
distribution of UGT1A and UGT2B alleles in female and male volunteers is presented in Table
4.19 and 4.20.
Table 4.19 Distribution of UGT1A and UGT2B allele frequency in male (n=59) volunteers
Gene SNP Allele Frequency Percentage Total
UGT1A1 rs8330 C/C 0.737 73.7 % 100
G/G 0.262 26.3 %
UGT1A1 rs10929303 C/C 0.720 72.1 % 100
T/T 0.279 27.9 %
UGT1A6 rs2070959 A/A 0.686 68.6% 100
G/G 0.314 31.4%
UGT1A6 rs1105879 A/A 0.669 66.9% 100
C/C 0.331 33.1%
UGT2B4 rs2013573 C/C 0.888 88.9 % 100
T/T 0.110 11.1 %
UGT2B4 rs1131878 C/C 0.194 19.5 % 100
T/T 0.805 80.6 %
UGT2B15 rs1902023 A/A 0.720 72.1 % 100
C/C 0.279 27.9 %

cxxii
Table 4.20 Distribution of UGT1A and UGT2B allele frequency in female (n=50) volunteers
Gene SNP Allele Frequency Percentage Total
UGT1A1 rs8330 C/C 0.755 75.5 % 100
G/G 0.244 24.5 %
UGT1A1 rs10929303 C/C 0.755 75.5 % 100
T/T 0.244 24.5 %
UGT1A6 rs2070959 A/A 0.71 71% 100
G/G 0.29 29%
UGT1A6 rs1105879 A/A 0.69 69% 100
C/C 0.31 31%
UGT2B4 rs2013573 C/C 0.898 89.8% 100
T/T 0.102 10.2%
UGT2B4 rs1131878 C/C 0.153 15.3 % 100
T/T 0.846 84.7 %
UGT2B15 rs1902023 A/A 0.622 62.2 % 100
C/C 0.377 37.8 %
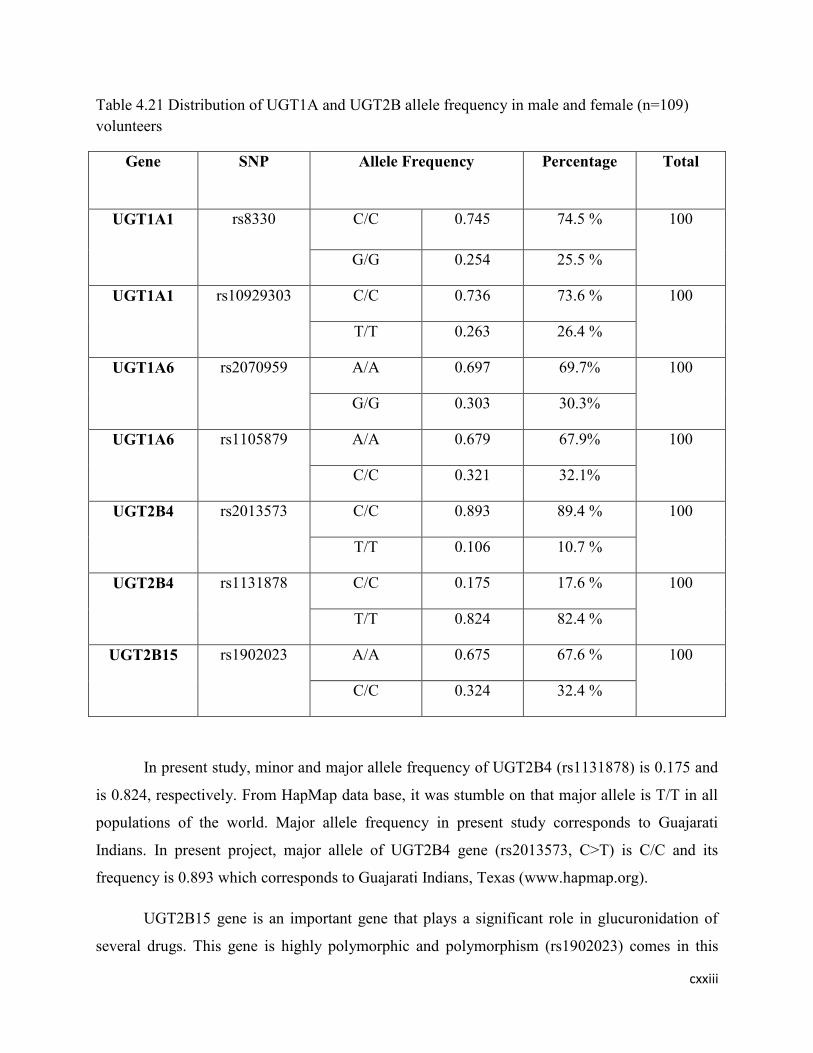
cxxiii
Table 4.21 Distribution of UGT1A and UGT2B allele frequency in male and female (n=109)
volunteers
Gene SNP Allele Frequency Percentage Total
UGT1A1 rs8330 C/C 0.745 74.5 % 100
G/G 0.254 25.5 %
UGT1A1 rs10929303 C/C 0.736 73.6 % 100
T/T 0.263 26.4 %
UGT1A6 rs2070959 A/A 0.697 69.7% 100
G/G 0.303 30.3%
UGT1A6 rs1105879 A/A 0.679 67.9% 100
C/C 0.321 32.1%
UGT2B4 rs2013573 C/C 0.893 89.4 % 100
T/T 0.106 10.7 %
UGT2B4 rs1131878 C/C 0.175 17.6 % 100
T/T 0.824 82.4 %
UGT2B15 rs1902023 A/A 0.675 67.6 % 100
C/C 0.324 32.4 %
In present study, minor and major allele frequency of UGT2B4 (rs1131878) is 0.175 and
is 0.824, respectively. From HapMap data base, it was stumble on that major allele is T/T in all
populations of the world. Major allele frequency in present study corresponds to Guajarati
Indians. In present project, major allele of UGT2B4 gene (rs2013573, C>T) is C/C and its
frequency is 0.893 which corresponds to Guajarati Indians, Texas (www.hapmap.org).
UGT2B15 gene is an important gene that plays a significant role in glucuronidation of
several drugs. This gene is highly polymorphic and polymorphism (rs1902023) comes in this

cxxiv
gene due to change in exon 1 at position of 253 G>T that causes an amino acid change (D85Y).
The major and minor allele frequency of gene UGT2B15 (rs1902023) in local population of
Pakistan is 67.59% and 32.41% respectively. This allele frequency is similar to allele frequency
reported in Asians but in Caucasians D85 and Y85allele frequency is 0.450 and 0.550 reported by
Lamp et al., (2000). Kim et al., (2014) conducted a comprehensive and widespread mutant
selection of UGT gene family (1A, 2B) in Korean, Japanese, Han Chinese, African American
and European American subjects. MAFs of UGT2B15 (rs1902023) was much higher in Korean
and Japanese than Han Chinese, African American and European American subjects
(MAF=0.484, 0.436, and 0.298) respectively. This variability is due to diggerent ethenic groups.
Chung et al., (2005) investigated the effects of udp-glucuronosyltransferase (UGT2B15) genetic
polymorphism in healthy subjects. The individuals who possessed minor allele (UGT2B15*2/*2)
were found to have less glucuronidation and lower systemic clearance than the individuals
having homozygous wild type allele (UGT2B15*1/*1).Court et al., (2004) studied UGT2B15
(D85Y) genotype and gender influence on glucuronidation by using human liver microsomes.
They found that minor allele had lower glucuronidation activites in contrast to major allele
(UGT2B15*1/*1).
The genotype frequency of UGT1A1 SNPs (rs8330, rs10929303) is significantly
different in female and male volunteers. For SNP rs8330, the percentage of homozygous wild
type, heterozygote and homozygous variant genotype is 60%, 32% and 8%, respectively in
female volunteers while in male volunteers, this percentage is 54%, 41% and 5%. For SNP
rs10929303, the comparative percentage of genotype of homozygous wild type and heterozygous
in male and female is (53%, 62%) and (39%, 30%) whereas the percentage of homozygous
variant genotype is 8% in both male and female volunteers. The distribution of UGT1A6
(rs2070959, rs1105879) genotype is not significantly different in both male and female
volunteers. The comparison of UGT2B4 (rs2013573) genotype in male and female volunteers
displayed (81%, 82%) homozygous wild type, (15%, 16%) heterozygous and (3%, 2%)
homozygous variant genotype whereas the comparison of (rs1131878) UGT2B4 gene displayed
significant variation in genotype frequency between male and female volunteers. The percentage
of homozygous wild type and heterozygous genotype in male and female is (32%, 74%) and
(64%, 22%), respectively. The percentage of homozygous variant genotype is approximately the
same (3.4%, 4%) in both male and female volunteers. The distribution of UGT2B15 genotype is

cxxv
significantly different in both male and female volunteers. The comparison of UGT2B15
genotype displayed (54%, 40%) homozygous wild type, (36%, 46%) heterozygote and (10%,
14%) homozygous variant genotype. The genotype frequency of UGT1A and UGT2B
pharmacogenes in male (n=59) and female (n=50) volunteers is presented in Table 4.21 and 4.22,
respectively. Many studies displayed that the genotype frequency of UGT1A and UGT2B
pharmacogenes is different among various (Korean, Japanese, Han Chinese, African American,
European American) populations of the world (Kim et al., 2014; Saeki et al., 2004).
Table 4.22 Distribution of UGT1A and UGT2B genotype frequency in male (n=59) volunteers
Gene SNP No.of subjects Genotype Frequency Percentage Total
UGT1A1 rs8330 32 C/C 0.542 54.23% 100
24 C/G 0.406 40.68%
3 G/G 0.050 5.08%
UGT1A1 rs10929303 31 C/C 0.525 52.54% 100
23 C/T 0.389 38.98%
5 T/T 0.084 8.47%
UGT1A6 rs2070959 27 A/A 0.457 45.76% 100
27 A/G 0.457 45.76%
5 G/G 0.084 8.47%
UGT1A6 rs1105879 26 A/A 0.440 44.07% 100
27 A/C 0.457 45.76%
6 C/C 0.101 10.17%
UGT2B4 rs2013573 48 C/C 0.813 81.36% 100
9 C/T 0.152 15.25%
2 T/T 0.033 3.39%
UGT2B4 rs1131878 2 C/C 0.033 3.39% 100
19 C/T 0.644 64.41%
38 T/T 0.322 32.20%
UGT2B15 rs1902023 32 A/A 0.542 54.24% 100
21 A/C 0.355 35.59%
6 C/C 0.101 10.17%
Table 4.23 Distribution of UGT1A and UGT2B genotype frequency in female (n=50) volunteers

cxxvi
Gene SNP No.of
subjects
Genotype Frequency Percentage Total
UGT1A1 rs8330 30 C/C 0.60 60% 100
16 C/G 0.32 32%
4 G/G 0.08 8%
UGT1A1 rs10929303 31 C/C 0.62 62% 100
15 C/T 0.30 30%
4 T/T 0.08 8%
UGT1A6 rs2070959 24 A/A 0.48 48% 100
23 A/G 0.46 46%
3 G/G 0.06 6%
UGT1A6 rs1105879 23 A/A 0.46 46% 100
23 A/C 0.46 46%
4 C/C 0.08 8%
UGT2B4 rs2013573 41 C/C 0.82 82% 100
8 C/T 0.16 16%
1 T/T 0.02 2%
UGT2B4 rs1131878 2 C/C 0.04 4% 100
11 C/T 0.22 22%
37 T/T 0.74 74%
UGT2B15 rs1902023 20 A/A 0.40 40% 100
23 A/C 0.46 46%
7 C/C 0.14 14%

cxxvii
Table 4.24 Distribution of UGT1A and UGT2B Genotype frequency in male and female (n=109)
volunteers
Gene SNP No.of
subjects
Genotype Frequency Percentage Total
UGT1A1 rs8330 62 C/C 0.568 56.88% 100
40 C/G 0.366 36.69%
7 G/G 0.064 6.42%
UGT1A1 rs10929303 62 C/C 0.568 56.88% 100
38 C/T 0.348 34.86%
9 T/T 0.082 8.26%
UGT1A6 rs2070959 51 A/A 0.467 46.79% 100
50 A/G 0.458 45.87%
8 G/G 0.073 7.34%
UGT1A6 rs1105879 49 A/A 0.449 44.95% 100
50 A/C 0.458 45.87%
10 C/C 0.091 9.17%
UGT2B4 rs2013573 89 C/C 0.816 81.65% 100
17 C/T 0.155 15.59%
3 T/T 0.027 2.75%
UGT2B4 rs1131878 4 C/C 0.036 3.67% 100
30 C/T 0.275 27.52%
75 T/T 0.688 68.81%
UGT2B15 rs1902023 52 A/A 0.477 47.71% 100
44 A/C 0.403 40.37%
13 C/C 0.119 11.93%
The distribution of various UGT1A andUGT2B alleles and genotypes in present study is similar
to Caucasians and Gujarati Indians but many studies display variation from this distribution. The

cxxviii
reason may be associated with various methods and incongruity of racial populations in UGT
polymorphism. Genetic variation in human UGT1A and UGT2B presents functionally
noteworthy variation in biochemical phenotype. Genetic variation might influence clinical
efficacy/toxicity of drugs metabolized by UGT. The study displayed non significant distribution
of alleles and genotype frequencies in male and female volunteers but some of the gene SNPs
like UGT1A1 (rs8330 and rs10929303) and UGT2B15 displayed significant variation in their
distribution between male and female volunteers.
4.2.2. Paracetamol Phenotype-Genotype Relationship
The UGT phenotype was accomplished from genotype and relationship between
phenotypic and genotypic methods was determined. The results of paracetamol phenotype and
UGT1A1 (rs8330) genotype are presented in Table 4.24 for male subjects. The 32 (54.24%) of
the male volunteers were fast glucuronidators, 23 (38.98%) were intermediate and 4 (6.78%)
were slow glucuronidators by both phenotypically and genotypically. The kappa value was
determined to find the level of agreement between PAR phenotype and UGT1A1 genotypic
results and chi square test was used for comparison. The kappa value 1.00 (100%) displayed
outstanding association or concordance. The data about the comparison of PAR phenotype and
genotype in female volunteers is shown in Table 4.25. The 30 (60%) of the female volunteers
were fast glucuronidators, 16 (32%) were intermediate and 4 (8%) were slow glucuronidators by
both phenotypically and genotypically. The kappa value 1.00 (100%) displayed outstanding
concordance. The genotypic UGT1A1 (rs8330) and PAR phenotypic data for all the female and
male volunteers is shown in Table 4.26. On the whole, 62 (56.88%) volunteers were categorized
as fast glucuronidators, 39 (35.78%) were intermediate and 8 (7.34%) were slow glucuronidators
by both phenotypically and genotypically. The classification of fast, intermediate and slow
glucuronidators in our population displayed an excellent concordance of 1.00 (100%).
Table 4.25 Comparison of paracetamol phenotype/UGT1A1 (rs8330) genotype in male
volunteers (n=59)

cxxix
Genotype (Male) Total
Fast Intermediate Slow
Paracetamol
Phenotype
(Male)
Fast 32 0 0 32
Intermediate 0 23 0 23
Slow 0 0 4 4
Total 32 23 4 59
Kappa value= 1
Table 4.26 Comparison of paracetamol phenotype/UGT1A1rs8330 genotype in female
volunteers (n=50)
Genotype (female) Total
Fast Intermediate Slow
Paracetamol
Phenotype
(female)
Fast 30 0 0 30
Intermediate 0 16 0 16
Slow 0 0 4 4
Total 30 16 4 50
Kappa value= 1
Table 4.27 Comparison of paracetamol phenotype/rs8330 genotype in male and female
volunteers (n=109)
Genotype Total
Fast Intermediate Slow
Paracetamol
Phenotype
Fast 62 0 0 62
Intermediate 0 39 0 39
Slow 0 0 8 8
Total 62 39 8 109
Kappa value= 1
The UGT phenotype was accessed from genotype and association between phenotype and
genotype (rs10929303) was determined. The results of paracetamol phenotype and UGT
(rs10929303) genotype are presented in Table 4.27 for male volunteers. The 31 (52.54%) of the
male volunteers were classified as fast glucuronidators by both PAR phenotype and genotype

cxxx
(rs10929303) whereas 1 volunteer was fast glucuronidator by PAR phenotype but categorized as
intermediate glucuronidator by (rs10929303) genotype whereas 23 (38.98%) and 4 (6.78%) male
volunteers were categorized as intermediate and slow glucuronidators by both PAR phenotype
and genotype and no volunteer was diverged from this classification. The kappa value for the
level of agreement between PAR phenotype and (rs10929303) genotype is 0.969 (96.9%) which
showed excellent correlation or concordance. The data about the comparison of PAR phenotype
and genotype in female volunteers is shown in Table 4.28. The 30 (60%) of the female
volunteers were classified as fast glucuronidator by both PAR phenotype and (rs10929303)
genotype whereas 1 female volunteer was fast glucuronidator by PAR phenotype but categorized
as intermediate glucuronidator by (rs10929303) genotype. Similarly, 15 (30%) and 4 (8%) of the
female volunteers were classified as intermediate and slow glucuronidators, respectively. The
results displayed excellent association in female volunteers with a kappa value of 0.962 (96.2%).
The results of paracetamol phenotype and UGT (rs10929303) genotype for male and female
volunteers are presented in Table 4.29. On the whole, 61 (55.96%) of the male and female
volunteers were categorized as fast glucuronidator by both PAR phenotype and genotype while
38 (34.86%) and 8 (7.34%) volunteers were classified as intermediate and slow glucuronidator,
respectively and 2 volunteers were deviated from this classification. One was fast glucuronidator
by PAR phenotype but categorized as intermediate genotypically while other volunteer had fast
glucuronidation by UGT genotype but classified as intermediate glucuronidator by PAR
phenotype. The classification of fast, intermediate and slow glucuronidators in male and female
volunteers displayed an excellent concordance value of 0.966 (96.6%).
Bock et al., (1993) investigated the function of UGTs in glucuronidation of paracetamol
by using recombinant UDP-glucuronosyltransferases and found that paracetamol is an
overlapping substrate of various UGT isoforms but paracetamol glucuronidation is highly
associated by UGT1A1 gene which supports the present study.
Table 4.28 Comparison of paracetamol phenotype/UGT1A1 (rs10929303) genotype in male
volunteers (n=59)
Genotype (Male) Total
Fast Intermediate Slow
Paracetamol
Phenotype
(Male)
Fast 31 1 0 32
Intermediate 0 23 0 23

cxxxi
Slow 0 0 4 4
Total 31 24 4 59
Kappa value= 0.969
Table 4.29 Comparison of paracetamol phenotype/UGT1A1 (rs10929303) genotype in female
volunteers (n=50)
Genotype (female) Total
Fast Intermediate Slow
Paracetamol
Phenotype
(female)
Fast 30 1 0 31
Intermediate 0 15 0 15
Slow 0 0 4 4
Total 30 16 4 50
Kappa value= 0.962
Table 4.30 Comparison of paracetamol phenotype/rs10929303 genotype in male and female
volunteers (n=109)
Genotype Total
Fast Intermediate Slow
Paracetamol
Phenotype
Fast 61 1 0 62
Intermediate 1 38 0 39
Slow 0 0 8 8
Total 62 39 8 109
Kappa value= 0.966
The concordance or association between PAR phenotype and UGT1A6 (rs2070959) genotype
was determined and the data about the comparison of PAR phenotype and UGT1A6 (rs2070959)
genotype in male volunteers is presented in Table 4.35. The 26 (44.07%), 23 (38.98%) and 4
(6.78%) male volunteers were categorized as fast, intermediate and slow glucuronidators,
respectively and 6 male volunteers showed divergence from this distribution. Out of these 6
volunteers, 4 were fast glucuronidators by UGT1A6 (rs2070959) genotype but classified as

cxxxii
intermediate glucuronidators by PAR phenotype and 2 male volunteers were slow
glucuronidators by PAR phenotype but categorized as fast glucuronidators by UGT1A6
(rs2070959) genotype. The kappa value 0.823 (82.3%) illustrates a good concordance in male
volunteers. The results regarding the comparison of PAR phenotype and (rs2070959) genotype
in female volunteers is presented in Table 4.36. The 26(52%), 16(32%) and 3(6%) female
volunteers were classified as fast, intermediate and slow glucuronidators, respectively by both
phenotypically and genotypically while 8 volunteers are grouped differently in female. Seven
female volunteers were of intermediate glucuronidation by PAR phenotype but categorized as
fast glucuronidators by UGT1A6 (rs2070959) genotype and remaining 1 was fast glucuronidator
by PAR phenotype but ranked as slow glucuronidator by genotype. The level of agreement 0.714
(71.4%) as measured from k-statistic illustrate good association between paracetamol phenotype
and UGT1A6 genotype in female volunteers. A total of 49 (44.95%), 39(35.78%) and 7(6.42%)
male and female volunteers were classified as fast, intermediate and slow glucuronidators. The
kappa value 0.774 (77.4%) showed good correlation in all male and female volunteers. Almost
similar results were obtained for the other SNP (rs1105879) of UGT1A6 in male and female
volunteers. Overall the kappa value 0.792 (79.2%) displayed good concordance in all the male
and female volunteers for paracetamol phenotype and UGT1A6 SNP (rs1105879).

cxxxiii
Table 4.31 Comparison of paracetamol phenotype/UGT1A6 (rs2070959) genotype in male
volunteers (n=59)
Genotype (Male) Total
Fast Intermediate Slow
Paracetamol
Phenotype
(Male)
Fast 26 0 0 26
Intermediate 4 23 0 27
Slow 2 0 4 6
Total 32 23 4 59
Kappa value= 0.823
Table 4.32 Comparison of paracetamol phenotype/UGT1A6 (rs2070959) genotype in female
volunteers (n=50)
Genotype (female) Total
Fast Intermediate Slow
Paracetamol
Phenotype
(female)
Fast 23 0 1 24
Intermediate 7 16 0 23
Slow 0 0 3 3
Total 30 16 4 50
Kappa value= 0.714
Table 4.33 Comparison of paracetamol phenotype/UGT1A6 (rs2070959) genotype in male and
female volunteers (n=109)
Genotype Total
Fast Intermediate Slow
Paracetamol
Phenotype
Fast 49 0 1 50
Intermediate 11 39 0 50
Slow 2 0 7 11
Total 62 39 8 109
Kappa value= 0.774

cxxxiv
Table 4.34 Comparison of paracetamol phenotype/UGT1A6 (rs1105879) genotype in male
volunteers (n=59)
Genotype (Male) Total
Fast Intermediate Slow
Paracetamol
Phenotype
(Male)
Fast 26 0 0 26
Intermediate 4 23 0 27
Slow 2 0 4 6
Total 32 23 4 59
Kappa value= 0.823
Table 4.35 Comparison of paracetamol phenotype/UGT1A6 (rs1105879) genotype in female
volunteers (n=50)
Genotype (female) Total
Fast Intermediate Slow
Paracetamol
Phenotype
(female)
Fast 23 0 0 23
Intermediate 7 16 0 23
Slow 0 0 4 4
Total 30 16 4 50
Kappa value= 0.755
Table 4.36 Comparison of paracetamol phenotype/UGT1A6 (rs1105879) genotype in male and
female volunteers (n=109)
Genotype Total
Fast Intermediate Slow
Paracetamol
Phenotype
Fast 49 0 0 49
Intermediate 11 39 0 50
Slow 2 0 8 10
Total 62 39 8 109
Kappa value= 0.792

cxxxv
The association between UGT2B4 (rs1131878) genotype and PAR phenotype was determined in
female and male subjects separately and results narrating the comparison between phenotype and
genotype in male volunteers is presented in Table 4.36. The 31(52.54%), 18(30.51%) and
2(3.39%) male volunteers were fast, intermediate and slow glucuronidators by both
phenotypically and genotypically while 8 male volunteers showed deviation from this
classification. The 7 male volunteers were fast glucuronidators phenotypically but categorized as
intermediate (5) and slow (2) glucuronidators by UGT2B4 genotype (rs1131878) and remaining
1 volunteer was of intermediate glucuronidation phenotypically but classified as fast
glucuronidator genotypically. The kappa value 0.741 (74%) showed moderate concordance in
male volunteers. The data related to comparison between phenotype and genotype is presented in
Table 4.37 for female volunteers. According to these results 30(60%), 12(24%) and 2(4%)
female volunteers were fast, intermediate and slow glucuronidators and 6 female volunteers
displayed disagreement from this division. These 6 female volunteers were fast glucuronidators
by PAR phenotype but grouped as intermediate and slow glucuronidators genotypically. The
moderate correlation was found out from kappa value 0.754 (75.4%) in female volunteers. The
classification of fast, intermediate and slow glucuronidators exhibited moderate concordance
0.748 (74.8%) in all the male and female volunteers as presented in Table 4.38.
Table 4.37 Comparison of Paracetamol phenotype/UGT2B4 (rs1131878) genotype in male
volunteers (n=59)
Genotype (Male) Total
Fast Intermediate Slow
Paracetamol
Phenotype
(Male)
Fast 31 5 2 38
Intermediate 1 18 0 19
Slow 0 0 2 2
Total 32 23 4 59
Kappa value= 0.741

cxxxvi
Table 4.38 Comparison of Paracetamol phenotype/ UGT2B4 (rs1131878) genotype in female
volunteers (n=50)
Genotype (female) Total
Fast Intermediate Slow
Paracetamol
Phenotype
(female)
Fast 30 4 2 36
Intermediate 0 12 0 12
Slow 0 0 2 2
Total 30 16 4 50
Kappa value= 0.754
Table 4.39 Comparison of Paracetamol phenotype/UGT2B4 (rs1131878) genotype in male and
female volunteers (n=109)
Genotype Total
Fast Intermediate Slow
Paracetamol
Phenotype
Fast 61 9 4 74
Intermediate 1 30 0 31
Slow 0 0 4 4
Total 62 39 8 109
Kappa value= 0.748
The association between UGT2B4 (rs2013573) genotype and PAR phenotype was determined in
female and male subjects separately and results reporting the comparison between phenotype and
genotype is presented in Table 4.39, 4.40 and 4.41. The kappa value 0.309 (30.9%) showed
overall poor concordance in male and female volunteers for PAR phenotype and UGT2B4
(rs2013573) genotype.

cxxxvii
Table 4.40.Comparison of Paracetamol phenotype/ UGT2B4 (rs2013573) genotype in male
volunteers (n=59)
Genotype (Male) Total
Fast Intermediate Slow
Paracetamol
Phenotype
(Male)
Fast 29 16 3 48
Intermediate 1 7 1 9
Slow 2 0 0 2
Total 32 23 4 59
Kappa value= 0.216
Table 4.41 Comparison of Paracetamol phenotype/ UGT2B4 (rs2013573) genotype in female
volunteers (n=50)
Genotype (female) Total
Fast Intermediate Slow
Paracetamol
Phenotype
(female)
Fast 29 9 3 41
Intermediate 1 7 0 8
Slow 0 0 1 1
Total 30 16 4 50
Kappa value= 0.429
Table 4.42 Comparison of Paracetamol phenotype/rs2013573 genotype in male and female
volunteers (n=109)
Genotype Total
Fast Intermediate Slow
Paracetamol
Phenotype
Fast 58 25 6 89
Intermediate 2 14 1 17
Slow 2 0 1 3
Total 62 39 8 109
Kappa value= 0.309

cxxxviii
The UGT phenotype and UGT2B15 genotype (rs1902023) association was determined and the
data related to the comparison of PAR phenotype and (rs1902023) genotype in male volunteers
is presented in Table 4.42. The 31 (52.54%) and 21 (35.59%) male volunteers were classified as
fast glucuronidators and intermediate glucuronidators, respectively by both PAR phenotype and
genotype (rs1902023) whereas 1 volunteer was fast glucuronidator by PAR phenotype but
categorized as intermediate glucuronidator by (rs1902023) genotype. The 4 (6.78%) male
volunteers were slow glucuronidators and 2 volunteers showed deviation from this classification.
These two volunteers were slow glucuronidators by PAR phenotype but were categorized as fast
and intermediate glucuronidators by (rs1902023) genotype. The kappa value for PAR phenotype
and (rs1902023) genotype in male volunteers is 0.909 (90.9%) which displayed good
concordance. The data about the comparison of PAR phenotype and (rs1902023) genotype in
female volunteers is shown in Table 4.43. The 20 (40%) and 16 (32%) female volunteers were
classified as fast and intermediate glucuronidators by both PAR phenotype and (rs1902023)
genotype and 7 volunteers showed deviation from this distribution. These 7 volunteers were fast
glucuronidators genotypically but classified as intermediate glucuronidators by PAR phenotype.
Similarly, 4 (8%) female volunteers were classified as slow glucuronidators by both
phenotypically and genotypically but 3 volunteers displayed divergence from this distribution.
These 3 volunteers were fast glucuronidators genotypically but grouped as slow glucuronidators
phenotypically. The kappa value 0.668 (66.8%) illustrated moderate concordance in female
volunteers for PAR phenotype and (rs1902023) genotype. The phenotypic and genotypic data for
all male and female volunteers is presented in table 4.44. A total of 51 (46.79%), 37 (33.94%)
and 8 (7.34%) female and male volunteers were categorized as fast, intermediate and slow
glucuronidators, respectively and 12 volunteers demonstrated deviation from this distribution.
Out of these 12 volunteers, 7 volunteers were fast glucuronidators by (rs1902023) genotype but
classified as intermediate glucuronidators and 5 volunteers were slow glucuronidators by PAR
phenotype but categorized as fast and intermediate glucuronidators genotypically. The kappa
value 0.793 (79.3%) illustrates a good concordance in all male and female volunteers.

cxxxix
Table 4.43 Comparison of Paracetamol phenotype/ UGT2B15 (rs1902023) genotype in male
volunteers (n=59)
Genotype (Male) Total
Fast Intermediate Slow
Paracetamol
Phenotype
(Male)
Fast 31 1 0 32
Intermediate 0 21 0 21
Slow 1 1 4 6
Total 32 23 4 59
Kappa value=0.909
Table 4.44 Comparison of Paracetamol phenotype/ UGT2B15 (rs1902023) genotype in female
volunteers (n=50)
Genotype (female) Total
Fast Intermediate Slow
Paracetamol
Phenotype
(female)
Fast 20 0 0 20
Intermediate 7 16 0 23
Slow 3 0 4 7
Total 30 16 4 50
Kappa value= 0.668
Table 4.45 Comparison of Paracetamol phenotype/ UGT2B15 (rs1902023) genotype in male and
female volunteers (n=109)
Genotype Total
Fast Intermediate Slow
Paracetamol
Phenotype
Fast 51 1 0 52
Intermediate 7 37 0 44
Slow 4 1 8 13
Total 62 39 8 109
Kappa value= 0.793

cxl
Paracetamol glucuronidation is associated with UGT1A1 (rs8330 & rs10929303), UGT1A6
(rs2070959 & rs1105879), UGT2B4 (rs1131878) and UGT2B15 (rs1902023). Poor association
was observed between paracetamol glucuronidation and UGT2B4 (rs2013573) SNP. The UDP-
glucuronosyltransferase is important for glucuronidation of paracetamol. The SNPs are source of
interindividual variability in glucuronidation capacity of xenobiotics. The individuals with the
homozygous variant have been shown to have a slower metabolism of paracetamol in vitro
(Ciotti et al., 1997).
Court et al., (2013) identified genetic polymorphisms linked with inter individual
variability in glucuronidation of paracetamol in the human liver samples. They reported that
SNPs (rs8330, rs10929303) in 3' UTR of UGT1A1 and UGT2B15 gene are associated with
paracetamol glucuronidation which supports the present study. Navarro et al., (2011) reported
that UGT1A6 gene is involved in glucuronidation of paracetamol by using recombinant UGTs
and human liver microsomes. On the other hand, the results of genotype and phenotype study are
not always concordant due to presence of base substitutions in genotype which becomes the
source of variation in phenotype and genotype.
4.2.3. Aspirin Phenotype-Genotype Relationship
The relationship between aspirin phenotype and genotype methods was determined and
level of agreement was established by k-statistic and chi square test was used for comparison.
The comparison of (rs8330) genotype and ASP phenotype in male and female volunteers showed
good concordance and results are presented in Table 4.45 and 4.46. In male volunteers, 26
(44.07%), 23 (38.98%) and 4 (6.78%) volunteers were categorized as fast, intermediate and slow
glucuronidators, respectively and kappa value 0.823 (82.3%) displayed good association. In
female volunteers, 23(46%), 16(32%) and 4(8%) volunteers were categorized as fast,
intermediate and slow glucuronidators and kappa value 0.755 (75.5%) displayed good
concordance. A total of 49(44.95%), 39(35.78%) and 8(7.34%) male and female volunteers were
fast, intermediate and slow glucuronidators and 13 volunteers exhibited divergence from this
distribution. These volunteers were fast glucuronidators by ASP phenotype but classified as
intermediate and slow glucuronidators by (rs8330) genotype. Overall, the kappa value 0.792
(79.2%) showed good concordance in female and male volunteers as presented in Table 4.47.
The comparison of ASP phenotype and UGT (rs10929303) genotype in male volunteers showed
good concordance and results are presented in Table 4.48. The 25(42.37%) of the male

cxli
volunteers were fast glucuronidators, 23 (38.98%) were intermediate and 4(6.78%) were slow
glucuronidators by both phenotypically and genotypically and 7 volunteers were away from this
classification. The 6 volunteers were fast glucuronidators by ASP phenotype but categorized as
intermediate and slow by (rs10929303) genotype and 1 volunteer was fast glucuronidator
genotypically but classified as intermediate glucuronidator by aspirin phenotype. The
information related to comparison of phenotype and genotype is presented in Table 4.49 for
female volunteers. The 23(46%) of the female volunteers were fast glucuronidators, 15 (30%)
were intermediate and 4(8%) were slow glucuronidators by both phenotypically and
genotypically and 8 volunteers were fast glucuronidators by ASP phenotype but categorized as
intermediate glucuronidators genotypically. The kappa value 0.719 showed good correlation in
female volunteers. Overall, 48(44.04%), 38(34.86%) and 8(7.34%) female and male volunteers
were fast, intermediate and slow glucuronidators, respectively and kappa value 0.760 (76%)
displayed good relationship.
Table 4.46 Comparison of Aspirin phenotype/UGT1A1 (rs8330) genotype in male volunteers
(n=50)
Genotype (Male) Total
Fast Intermediate Slow
Aspirin
Phenotype
(Male)
Fast 26 4 2 32
Intermediate 0 23 0 23
Slow 0 0 4 4
Total 26 27 6 59
Kappa value= 0.823
Table 4.47 Comparison of Aspirin phenotype/ UGT1A1 (rs8330) genotype in female volunteers
(n=50)
Genotype (female) Total
Fast Intermediate Slow
Aspirin
Phenotype
(female)
Fast 23 7 0 30
Intermediate 0 16 0 16
Slow 0 0 4 4
Total 23 23 4 50
Kappa value= 0.755
Table 4.48 Comparison of Aspirin phenotype/ UGT1A1 (rs8330) genotype in male and female
volunteers (n=109)
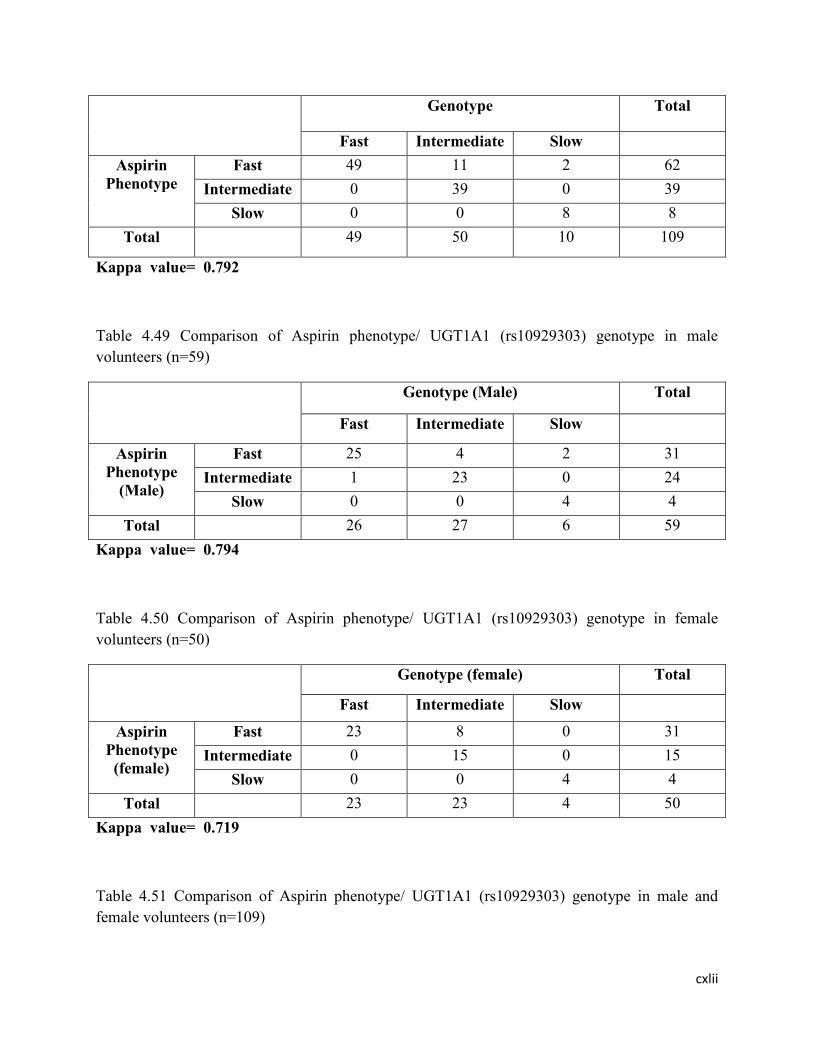
cxlii
Genotype Total
Fast Intermediate Slow
Aspirin
Phenotype
Fast 49 11 2 62
Intermediate 0 39 0 39
Slow 0 0 8 8
Total 49 50 10 109
Kappa value= 0.792
Table 4.49 Comparison of Aspirin phenotype/ UGT1A1 (rs10929303) genotype in male
volunteers (n=59)
Genotype (Male) Total
Fast Intermediate Slow
Aspirin
Phenotype
(Male)
Fast 25 4 2 31
Intermediate 1 23 0 24
Slow 0 0 4 4
Total 26 27 6 59
Kappa value= 0.794
Table 4.50 Comparison of Aspirin phenotype/ UGT1A1 (rs10929303) genotype in female
volunteers (n=50)
Genotype (female) Total
Fast Intermediate Slow
Aspirin
Phenotype
(female)
Fast 23 8 0 31
Intermediate 0 15 0 15
Slow 0 0 4 4
Total 23 23 4 50
Kappa value= 0.719
Table 4.51 Comparison of Aspirin phenotype/ UGT1A1 (rs10929303) genotype in male and
female volunteers (n=109)

cxliii
Genotype Total
Fast Intermediate Slow
Aspirin
Phenotype
Fast 48 12 2 62
Intermediate 1 38 0 39
Slow 0 0 8 8
Total 49 50 10 109
Kappa value= 0.760
The results of aspirin phenotype and UGT1A6 (rs1105879) genotype are presented in Table 4.51
for male subjects. The 26 (44.07%), 27 (45.76%) and 6 (10.17%) of the male volunteers were
fast, intermediate and slow glucuronidators. by both genotypically and phenotypically and no
male volunteer showed deviation from this classification. The data related to the comparison of
ASP phenotype and genotype in female volunteers is shown in Table 4.52. The 23(46%),
23(46%) and 4(8%) of the female volunteers were fast, intermediate and slow glucuronidators by
both genotypically and phenotypically and no female volunteer showed deviation from this
categorization. Overall, 49(44.95%), 50(45.87%) and 10(9.17%) male and female volunteers
were fast, intermediate and slow glucuronidators, respectively by both genotypically and
phenotypically as presented in Table 4.53. The kappa value 1.00 (100%) displayed outstanding
association or concordance in male and female volunteers separately and cumulatively. The
kappa value 0.964 (96.4%) displayed an outstanding concordance between genotype and
phenotype.
Table 4.52.Comparison of Aspirin phenotype/UGT1A6 (rs1105879) genotype in male volunteers
(n=59)
Genotype (Male) Total
Fast Intermediate Slow
Aspirin
Phenotype
(Male)
Fast 26 0 0 26
Intermediate 0 27 0 27
Slow 0 0 6 6
Total 26 27 6 59
Kappa value= 1
Table 4.53 Comparison of Aspirin phenotype/UGT1A6 (rs1105879) genotype in female
volunteers (n=50)

cxliv
Genotype (female) Total
Fast Intermediate Slow
Aspirin
Phenotype
(female)
Fast 23 0 0 23
Intermediate 0 23 0 23
Slow 0 0 4 4
Total 23 23 4 50
Kappa value= 1
Table 4.54 Comparison of Aspirin phenotype/ UGT1A6 (rs1105879) genotype in male and
female volunteers (n=109)
Genotype Total
Fast Intermediate Slow
Aspirin
Phenotype
Fast 49 0 0 49
Intermediate 0 50 0 50
Slow 0 0 10 10
Total 49 50 10 109
Kappa value= 1
The comparison of ASP phenotype andUGT1A6 (rs2070959) genotype in male
volunteers presented an outstanding association as assessed by from kappa value 1.00 (100%)
and results of aspirin phenotype and UGT1A6 (rs2070959) genotype are presented in Table 4.54
for male subjects. The 23(46%), 23(46%) and 3(6%) of the female volunteers were fast,
intermediate and slow glucuronidators by both genotypically and phenotypically. One female
volunteer was fast glucuronidator by ASP phenotype but classified as slow glucuronidator by
(rs2070959) genotype. The data related to the comparison of ASP phenotype and genotype in
female volunteers is shown in Table 4.55. For this SNP and ASP phenotype, a total of
49(44.95%), 50(45.87%) and 9(8.26%) male and female volunteers were categorized as fast,
intermediate and slow glucuronidators by both genotype and phenotype and only 1 volunteer
showed deviation from this classification. The kappa value 0.984 (98.4%) showed excellent
correlation in all the female and male volunteers. The data relating to the comparison of ASP
phenotype and genotype in female and male volunteers is shown in Table 4.56.
Table 4.55 Comparison of Aspirin phenotype/ UGT1A6 (rs2070959) genotype in male
volunteers (n=59)

cxlv
Genotype (Male) Total
Fast Intermediate Slow
Aspirin
Phenotype
(Male)
Fast 26 0 0 26
Intermediate 0 27 0 27
Slow 0 0 6 6
Total 26 27 6 59
Kappa value= 1
Table 4.56 Comparison of Aspirin phenotype/UGT1A6 (rs2070959) genotype in female
volunteers (n=50)
Genotype (Female) Total
Fast Intermediate Slow
Aspirin
Phenotype
(female)
Fast 23 0 1 24
Intermediate 0 23 0 23
Slow 0 0 3 3
Total 23 23 4 50
Kappa value= 0.964
Table 4.57 Comparison of Aspirin phenotype/ UGT1A6 (rs2070959) genotype in male and
female volunteers (n=109)
Genotype Total
Fast Intermediate Slow
Aspirin
Phenotype
Fast 49 0 1 50
Intermediate 0 50 0 50
Slow 0 0 9 9
Total 49 50 10 109
Kappa value= 0.984
The association of aspirin phenotype and (rs1131878) genotype in male and female
volunteers showed overall fair concordance with kappa value 0.558 (55.8%).The results are

cxlvi
presented in Table 4.58,4.59 and 4.60, respectively. Poor correlation was observed between
aspirin phenotype and (rs2013573) genotype with a kappa value 0.245(24.5%) in all the female
and male volunteers. The results related with association are presented in Table 4.61, 4.62 and
4.63, respectively.
Table 4.58 Comparison of Aspirin phenotype/UGT2B4 (rs1131878) genotype in male volunteers
(n=59)
Genotype (Male) Total
Fast Intermediate Slow
Aspirin
Phenotype
(Male)
Fast 25 9 4 38
Intermediate 1 18 0 19
Slow 0 0 2 2
Total 26 27 6 59
Kappa value= 0.580
Table 4.59 Comparison of Aspirin phenotype/ UGT2B4 (rs1131878) genotype in female
volunteers (n=50)
Genotype (female) Total
Fast Intermediate Slow
Aspirin
Phenotype
(female)
Fast 23 11 2 36
Intermediate 0 12 0 12
Slow 0 0 2 2
Total 23 23 4 50
Kappa value= 0.532
Table 4.60 Comparison of Aspirin phenotype/ UGT2B4 (rs1131878) genotype in male and
female volunteers (n=109)

cxlvii
Genotype Total
Fast Intermediate Slow
Aspirin
Phenotype
Fast 48 20 6 74
Intermediate 1 30 0 31
Slow 0 0 4 4
Total 49 50 10 109
Kappa value= 0.558
Table 4.61 Comparison of Aspirin phenotype/ UGT2B4 (rs2013573) genotype in male
volunteers (n=59)
Genotype (Male) Total
Fast Intermediate Slow
Aspirin
Phenotype
(Male)
Fast 24 19 5 48
Intermediate 1 7 1 9
Slow 1 1 0 2
Total 26 7 6 59
Kappa value= 0.165
Table 4.62 Comparison of Aspirin phenotype/ UGT2B4 (rs2013573) genotype in female
volunteers (n=50)
Genotype (female) Total
Fast Intermediate Slow
Aspirin
Phenotype
(female)
Fast 23 15 3 41
Intermediate 0 8 0 8
Slow 0 0 1 1
Total 23 15 4 50
Kappa value= 0.343
Table 4.63 Comparison of Aspirin phenotype/ UGT2B4 (rs2013573) genotype in male and
female volunteers (n=109)

cxlviii
Genotype Total
Fast Intermediate Slow
Aspirin
Phenotype
Fast 47 34 8 89
Intermediate 1 15 1 17
Slow 1 1 1 3
Total 49 50 10 109
Kappa value= 0.245
The UGT phenotype and UGT2B15 genotype (rs1902023) association was determined and the
data related to the comparison of ASP phenotype and (rs1902023) genotype in male volunteers is
presented in Table 4.64. The 26 (44.07%), 21(35.59%) and 4(6.78%) male volunteers were fast,
intermediate and slow glucuronidators by both genotype and phenotype and 8 male volunteers
were disagreed from this distribution. The 6 male volunteers were fast glucuronidators by ASP
phenotype but grouped as intermediate and slow glucuronidators genotypically. Similarly, 2
volunteers were slow phenotypically but classified as intermediate glucuronidators
genotypically. The kappa value 0.769 displayed good concordance. In female volunteers,
18(36%), 21(42%) and 4(8%) volunteers were classified as fast, intermediate and slow
glucuronidators by both genotype and phenotype and 7 female volunteers showed disagreement.
Only 2 volunteers were fast by aspirin phenotype but classified as intermediate glucuronidators
genotypically and remaining 5 volunteers were fast glucuronidators by UGT (rs1902023)
genotype but distributed as intermediate and slow glucuronidators by ASP phenotype. The kappa
value 0.764 showed good association and results are presented in Table 4.65. On the whole,
44(40.37%), 42(38.53%) and 8(7.34%) female and male volunteers were fast, intermediate and
slow glucuronidators, respectively and kappa value 0.767 (76.7%) showed good concordance
overall and results are presented in Table 4.66.
Table 4.64 Comparison of Aspirin phenotype/ UGT2B15 (rs1902023) genotype in male
volunteers (n=59)
Genotype (Male) Total

cxlix
Fast Intermediate Slow
Aspirin
Phenotype
(Male)
Fast 26 4 2 32
Intermediate 0 21 0 21
Slow 0 2 4 6
Total 26 27 6 59
Kappa value= 0.769
Table 4.65 Comparison of Aspirin phenotype/ UGT2B15 (rs1902023) genotype in female
volunteers (n=50)
Genotype (female) Total
Fast Intermediate Slow
Aspirin
Phenotype
(female)
Fast 18 2 0 20
Intermediate 2 21 0 23
Slow 3 0 4 7
Total 23 23 4 50
Kappa value= 0.764
Table 4.66 Comparison of Aspirin phenotype/UGT2B15 (rs1902023) genotype in male and
female volunteers (n=109)
Genotype Total
Fast Intermediate Slow
Aspirin
Phenotype
Fast 44 6 2 52
Intermediate 2 42 0 44
Slow 3 2 8 13
Total 49 50 10 109
Kappa value= 0.767

cl
Kuehl et al., (2006) identified UGTs involved in glucuronidation of aspirin and
determined that UGT1A1, UGT1A6 and UGT2B4 catalyze the glucuronidation of aspirin in
human liver microsomes. Navarro et al., (2011) studied the effects of UGT1A6 genotypes on
metabolism of aspirin after administering an oral dose of 650 mg to healthy population but they
did not observe any UGT1A6 genotype effects on urinary excretion of aspirin. The measurement
of urinary excretion following a single dose of aspirin is not sensitive to identify the activity of
UGT isoforms suggesting the role of UGT1A6 gene in catalyzing aspirin glucuronidation. The
results of genotype and phenotype study are not always concordant due to presence of base
substitutions in genotype which becomes the source of variation in phenotype and genotype.
4.3. Conclusion
UGT is a super family of enzyme that shows overlapping substrate specificity and play
significant role in enhancing excretion of exobiotic and endobiotic drugs. In this way,
conjugation with endogenous glucuronide catalyzed by UGT1A and UGT2B family members
serves as clearance pathway. They play a critical role in stopping biological action and boosting
renal excretion of lipophic drugs. Greater variation exits from individual to individual in amount
and rate of glucuronidation of drugs. Therefore, glucuronidation of drugs is essential for
therapeutic responses. For determination of drugs responses, phenotype and genotype is the
fundamental tool that furnishes an idea how person to person variations in metabolizing enzymes
lead to efficacy and toxic reactions. The current project develops association of UGT1A and
UGT2B genotype and phenotype (PAR and ASP). The glucuronidation level was established
phenotypically by administering paracetamol and aspirin to healthy volunteers and genotypically
with real time PCR (UGT1A1, UGT2B4 and UGT2B15 SNPs) and conventional PCR (UGT1A6
SNPs) followed by restriction fragment length polymorphism. Generally, Pakistani healthy
population displayed excellent association between paracetamol and UGT1A1 and occurrence of
fast, intermediate and slow healthy volunteers is 56%, 35% and 7%, respectively. Similarly
aspirin and UGT1A6 showed excellent relationship and prevalence of fast, intermediate and slow
glucuronidators in this case is 45%, 46% and 8%, respectively. While both paracetmol and
aspirin displayed good concordance with UGT2B15 and moderate to poor concordance was
observed with UGT2B4 SNPs. In all studied SNPs, the wild type allele is more common in
Pakistani population as compared to mutant allele. Both phenotypic and genotypic methods
showed outstanding to moderate concordance statistically with all studied SNPs except UGT2B4

cli
(rs2013573) that showed poor association with both paracetamol and aspirin and no noteworthy
variation was found in male and female volunteers overall in categorization of fast, intermediate
and slow glucuronidators. It is figure out that these phenotypic and genotypic methods are evenly
favorable, helpful and beneficial in finding the glucuronidation status of UDP-
Glucuronosyltransferase (UGT1A and UGT2B).
Future Prospect and outlook
The study of phenotyping coupled with genotype to access the glucuronidation of drugs
is making progress. Genetic variations in genes encoding UGT (udp-glucuronosyltransferase)
should be corroborated in clinical and experimental trials to improve the health and provide
relieve to the patients because patients have unusual activity of DMEs. Moreover, the effect of
glucuronidation and other DMEs (drug metabolizing enzymes) should be considered because
they might reflect individual vulnerability in various disease states. The effect of UGT (1A and
2B) genotype and genotype of other drug metabolizing enzymes should be studied together to
develop drug regimen and to provide better treatment to patients. This is an area for future
research and examination of mutant alleles linked to various diseases in human UGT.
Chapter 5 SUMMARY

clii
The purpose of present study was to establish the glucuronidation status of UGT (1A &2B) by
administering probe drugs like paracetamol and aspirin to Pakistani population under local and
native conditions. The data regarding the UGT glucuronidation was not presented in our
population. Hence, the correlation and comparison of phenotyping was accomplished by
administering paracetamol and aspirin to healthy volunteers. Overall, 110 volunteers (male =60
and female = 50) having age 18 years or more were enrolled in this project. One volunteer had
positive Hepatitis C test so he was removed from the study and project was conducted on 109
healthy male and female subjects. After an overnight fast, blood samples from the subjects were
collected at specified time interval of 1.5 hour and 20 minutes after administration of
paracetamol (1000 mg) and aspirin (600 mg). The demographic data (age, weight, height, body
temperature and blood pressure) of all male and female volunteers was documented. To ensure
the health status of volunteers biochemical tests like complete blood picture (Hemoglobin, total
WBC’s, neutrophils, lymphocytes, monocytes and eosinophils, total RBCs, Hct, MCV, MCH,
MCHC, and platelet count), liver enzymes (ALT, AST) and billirubin), lipid profile
(triglycerides, cholesterol, HDL,LDL), kidney function tests (creatinine and urea level) were
recorded. The glucuronidation status was determined phenotypically by using HPLC and
genotypically by using conventional PCR followed by restriction fragment length polymorphim
for UGT1A6 gene and qPCR by using gene specific TaqMan probes for UGT1A1, UGT2B4 and
UGT2B15 wild type and variant allele. The concentration of paracetamol and paracetamol
glucuronide was found out in 1.5 hour plasma sample of all the male female volunteers by high
performance liquid chromatography and metabolic ratio of paracetamol glucuronide to
paracetamol was computed to categorize the volunteers in fast, intermediate and slow
glucuronidators. Similarly the concentration of aspirin (acetyl salicylic acid) and aspirin
glucuronide (salicylic acid acyl glucuronide) was detected in 20 minute plasma sample by HPLC
and metabolic ratio of aspirin glucuronide/aspirin was calculated. This metabolic ratio was used
to classify volunteers into fast, intermediate and fast glucuronidators. The categorization of
glucuronidation phenotype for paracetamol in all healthy volunteers (n=109) displayed that 57%
(54.24% male and 60% female) and 34% (38.98% male and 32% female) of the under study
population had fast and intermediate glucuronidation, respectively whereas 7% (6.78% male and
8% female) of the population was categorized as slow glucuronidators. Similarly, the
classification of glucuronidation phenotype for aspirin in healthy male and female volunteers

cliii
illustrated that 45% (44.07% male and 46% female) of the population was fast and 46% (45.76%
male and 46% female) of the population had intermediate glucuronidation and at the same time
9% (10.17% male and 8% female) of the population was categorized as slow glucuronidator.
Good correlation was detected between paracetamol and aspirin phenotypes in all male and
female volunteers as figured out statistically from the kappa value 0.792 (79.2%). The UGT1A6
glucuronidation was determined through PCR based on allele specific amplification by using
sequence specific primers and restriction fragment length polymorphism. The frequency
distribution of two SNPs (rs2070959; A>G and rs1105879; A>C) of UGT1A6 gene showed that
wild type allele (A/A) was common in population and major and minor allele frequency of
(rs2070959) SNP was 0.697 and 0.303 in all volunteers whereas the MAF (major allele
frequency) of SNP (rs1105879) was 0.679 and its minor allele frequency was 0.321. These two
SNPs were resulted due to change in position of amino acid. Genotype frequency of (rs2070959)
SNP demonstrated that 47%, 46% and 7% of the population was homozygous for wild type allele
(A/A), heterozygous (A/G) and homozygous for variant allele (G/G), respectively while
genotype frequency of (rs1105879) SNP confirmed that 45% of the population was homozygous
for wild type allele (A/A), 46% was heterozygous (A/C) and 9% was homozygous for variant
allele (C/C). These SNPs showed excellent concordance with aspirin phenotype but their
concordance with paracetamol phenotype was good.
The UGT1A1, UGT2B4 and UGT2B15 glucuronidation was detected through real time
PCR by using sequence specific TaqMan probes. Two SNPs (rs8330; C>G and rs10929303;
C>T) of UGT1A1 and their genotype frequency in all male and female volunteers were studied.
The distribution of rs8330 genotype frequency showed that 57% of the population was
homozygous for common (C/C) allele, 37% was heterozygous (C/G) and 6% was homozygous
for mutant allele (G/G) whereas 57%, 35% and 8% of the population was homozygous (C/C) for
common allele, heterozygous (C/T) and homozygous (G/G) for variant allele. Genotype
frequency of (rs8330) and (rs10929303) SNPs showed excellent concordance with paracetamol
phenotype but their correlation with aspirin phenotype was good. Similarly, the distribution of
UGT2B15 genotype disclosed that the common allele in studied population was A/A and 48%
population was homozygous for this allele whereas 40% and 12% of the population was
heterozygous (A/C) and homozygous for mutant allele (C/C), respectively. UGT2B15 gene
presented overall good association with paracetmol and aspirin. UGT2B4 gene (rs1131878)

cliv
illustrated fair to good concordance with aspirin and paracetamol phenotypes respectively but its
other SNP (rs2013573) association with aspirin and paracetamol phenotypes was poor as
accessed statistically from the kappa value. Consequently the population showed trimodal
distribution both phenotypically and genotypically. Overall, excellent to good concordance was
observed between phenotypic and genotypic methods. The people possessing homozygous wild
type allele of UGT1A and UGT2B genes metabolize drugs rapidly and those having
homozygous variant alleles metabolize paracetamol and aspirin slowly. Thus, these slow
metabolizers have reduced function of UDP-glucuronosyltransferase enzyme.
LITERATURE CITED

clv
A1-Obaidy, S. S., A. L. W. Po, P. J. McKiernan, J. F. T. Glasgow and J. Millership. 1995. Assay
of paracetamol and its metabolites in urine, plasma and saliva of children with chronic
liver disease. Journal of Pharmaceutical and Biomedical Analysis. 13: 1033-1039.
Abu-Qare, A. W. and M. B. Abou-Donia. 2001. A validated HPLC method for the determination
of pyridostigmine bromide, acetaminophen, acetylsalicylic acid and caffeine in rat plasma
and urine. Journal of Pharmaceutical and Biomedical Analysis. 26: 939–947.
Adegoke, O. J., S. XO, Y. T. Gao, Q. Cai, J. Breyer and J. Smith. 2004. Genetic polymorphisms
in uridine diphospho-glucuronosyltransferase 1A1 (UGT1A1) and risk of breast
cancer. Breast Cancer Res Treat. 85: 239–245.
Ahmed, A. 2002. Interaction between aspirin and angiotensin converting enzyme inhibitors:
should they be used together in older adults with heart failure? Journal of the American
Geriatric Society. 50: 1293–1296.
Ahn, S., W. Dermauwc, N. Wybouwc, D. G. Heckel and T. V. Leeuwen. 2014. Bacterial origin
of a diverse family of UDP-glycosyltransferase genes in the Tetranychus urticae genome.
Insect Biochemistry and Molecular Biology. 50: 43-57.
Ando, Y., H. Saka, M. Ando, T. Sawa, K. Muro and H. Ueoka. 2000. Polymorphisms of UDP-
glucuronosyltransferase gene and irinotecan toxicity: a pharmacogenetic analysis. Cancer
Res. 60:6921– 6926.
Araki, J., Y. Kobayashi, M. Iwasa, N. Urawa, E. C. Gabazza and O. Taguchi. 2005.
Polymorphism of UDP-glucuronosyltransferase 1A7 gene: a possible new risk factor for
lung cancer. Eur J Cancer. 41(15): 2360–2365.
Awtry, E. H. and J. Loscalzo. 2004. Aspirin. Circulation. 101: 1206–1218.
Bachert, C., A. G. Chuchalin and R. Eisebitt. 2005. Aspirin compared with acetaminophen in the
treatment of fever and other symptoms of upper respiratory tract infection in adults: a
multicenter, randomized, double-blind, double-dummy, placebo-controlled, parallel-
group, single-dose, 6-hour dose-ranging study. Clin Therapeutics. 27: 993–1003.
Balram, C., Q. Zhou, Y. B. Cheung and E. J. Lee. 2003. CYP3A5*3 and *6 single nucleotide
polymorphisms in three distinct Asian populations. Eur. J. Clin. Pharmacol. 59: 123–126.

clvi
Belanger, A., G. Pelletier, F. Labrie, O. Barbier and S. Chouinard. 2003. Inactivation of
androgens by UDP-glucuronosyltransferase enzymes in humans. Trends Endocrinol
Metab. 14(10): 473–479.
Bellemare, J., M. Rouleau, M. Harvey and C. Guillemette. 2010. Modulation of the human
glucuronosyltransferase UGT1A pathway by splice isoform polypeptides is mediated
through protein–protein interactions. J Biol Chem. 285: 3600–3607.
Bender, R. P., R. H. Lindsey, D. A. Burden and N. Osheroff. 2004. N-Acetyl-p-benzoquinone
Imine, the Toxic Metabolite of Acetaminophen, Is aTopoisomerase II Poison.
Biochemistry. 43: 3731-3739.
Beutler, E., T. Gelbart and A. Demina. 1998. Racial variability in the
UDPglucuronosyltransferase1 (UGT1A1) promoter: a balanced polymorphism for
regulation of bilirubin metabolism? Proc Natl Acad Sci USA. 95: 8170–8174.
Bigler, J., J. Whitton, J. W. Lampe, L. Fosdick, R. M. Bostick and J. D. Potter. 2001. CYP2C9
and UGT1A6 genotypes modulate the protective effect of aspirin on colon adenoma risk.
Cancer Res. 61: 3566–3569.
Bock, K. W., J. Wiltfang, R. Blume, D. Ullrich and J. Bircher. 1987. Paracetamol as a test drug
to determine glucuronide formation in man: Effects of inducers and of smoking.
European Journal of Clinical Pharmacology. 31(6): 677-683.
Bock, K. W., A. Forster, H. Gschaidmeier, M. Brück, P. Münzel, W. Schareck, S. Fournel
Gigleux and B. Burchell. 1993. Paracetamol glucuronidation by recombinant rat
and human phenol UDP-glucuronosyltransferases. Biochemical Pharmacology.
45(9): 1809-1814.
Bock, K. W., D. Schrenk, A. Foster, E. U. Griese, K. Morike, D. Brockmeier and M.
Eichelbaum. 1994. The influence of environmental and genetic factors on CYP2D6,
CYP1A2 and UDP-glucuronosyltransferases in man using sparteine, caffeine, and
paracetamol as probes. Pharmacogenetics. 4(4): 209-218.
Bock, K. W. 2003. Vertebrate UDP-glucuronosyltransferases: functional and evolutionary
aspects. Biochemical Pharmacology. 66: 691–696.
Bosma, P. J., B. Goldhoon and C. Bakker. 1994. Presence of an additional TA in the TATAA
box of B-UGT1 correlates with Gilbert’s syndrome. Hepatology. 20: 680.

clvii
Bosma, P. J., J. R. Chowdhury, C. Bakker, S. Gantla, A. Boer and B. A. Oostra. 1995. The
genetic basis of the reduced expression of bilirubin UDPglucuronosyltransferase1 in
Gilbert’s syndrome. N Engl J Med. 333: 1171–1175.
Bridger, S., K. Henderson, E. Glucksman, A. J. Ellis, J. A. Henry and R. Williams. 1998. Deaths
from low-dose paracetamol poisoning. B. M. J. 316:1724–1725.
Budavari, S.1996. The Merck Index: an encyclopedia of chemicals, drugs and biologicals, 12th
ed. Rahway, New Jersey Merck and Co., Inc.
Burchell, B., C. H. Brierley and D. Rance. 1995. Specificity of human UDP
glucuronosyltransferases and xenobiotic glucuronidation. Life Sci. 57: 1819-1831.
Burchell, B., M. Soars, G. Monaghan, A. Cassidy, D. Smith and B. Ethell. 2000. Drug-mediated
toxicity caused by genetic deficiency of UDP-glucuronosyltransferases. Toxicol Lett.
112–113:333– 340.
Burchell, B. 2003. Genetic variation of human UDP-glucuronosyltransferase: implications in
disease and drug glucuronidation. Am J Pharmacogenomics. 3: 37– 52.
Cantilena, L. R., A. G. Katki, R. W. Klecker and J. M. Collins. 2004. Metabolism by N-
acetyltransferase 1 in vitro and in healthy volunteers: a prototype for targeted inhibition. J
Clin Pharmacol. 44: 1405-1411.
Cascorbi, I. 2006. Genetic basis of toxic reactions to drugs and chemicals. Toxicol. Lett. 162(1):
16–28.
Caspi, D., E. Lubart, E. Graff, B. Habot, M. Yaron and R. Segal. 2000. The effect of mini-dose
aspirin on renal function and uric acid handling in elderly patients. Arthritis Rheum.
43(1):103-8.
Cengiz, B., O. Yumrutas, E. Bozgeyik, E. Borazan, Y. Z. Igci, I. Bozgeyik and S. Oztuzcu. 2015.
Differential expression of the UGT1A family of genes in stomach cancer tissues. Tumour
Biol. 36(8): 5831-5837.
Che, X., D. Yu, Z. Wu, J. Zhang, Y. Chen, Y. Han, C. Wang and J. Qi. 2015. Polymorphisms in
UGT2B4 and susceptibility to pancreatic cancer. Int J Clin Exp Med. 8(2): 2702-2710.

clviii
Chen, Y., G. E. Kuehl, J. Bigler, C. F. Rimorin, Y. Schwarz, and D. D. Shen. 2007. UGT1A6
polymorphism and salicylic acid glucuronidation following aspirin. Pharmacogenet
Genomics. 17: 571–579.
Chouinard, S., M. F. Yueh, R. H. Tukey, F. Giton, J. Fiet and G. Pelletier. 2008. Inactivation by
UDP-glucuronosyltransferase enzymes: the end of androgen signaling. J Steroid Biochem
Mol Biol. 109: 247–253.
Chowbay, B., S. Zhou and E. J. Lee. 2005. An interethnic comparison of polymorphisms of the
genes encoding drug-metabolizing enzymes and drug transporters: Experience in
Singapore. Drug Metab. Rev. 37: 327–378.
Chung, J. Y., J. Y. Cho, K. S. Yu, J. R. Kim, H. R. Jung and K. S. Lim. 2005. Effect of the
UGT2B15 genotype on the pharmacokinetics, pharmacodynamics, and drug interactions
of intravenous lorazepam in healthy volunteers. Clin Pharmacol Ther. 77: 486-494.
Ciotti, M., A. Marrone, C. Potter and I. S. Owens. 1997. Genetic polymorphism in the human
UGT1A6 (planar phenol) UDPglucuronosyltransferase: pharmacological implications.
Pharmacogenetics. 7: 485– 495.
Costello, P. B. and F. A. Green. 1982. Aspirin survival in human blood modulated by the
concentration of erythrocytes. Arthritis Rheum. 25: 550–555.
Court, M. H., S. X. Duan, C. Guillemette, K. Journault, S. Krishnaswamy and L. L.V. Moltke.
2002. Stereoselective conjugation of oxazepam by human UDP-Glucuronosyltransferases
(UGTs): S-oxazepam is glucuronidated by UGT2B15, while R-oxazepam is
glucuronidated by UGT2B7 and UGT1A9. Drug Metab Dispos. 30: 1257–1265.
Court, M. H., Q. Hao, S. Krishnaswamy, T. Bekaii-Saab, A. Al-Rohaimi and L. L. Moltke. 2004.
UDP-glucuronosyltransferase (UGT) 2B15 pharmacogenetics: UGT2B15 D85Y
genotype and gender are major determinants of oxazepam glucuronidation by human
liver. J Pharmacol Exp Ther. 310: 656-665.
Court, M. H. 2010. Interindividual variability in hepatic drug glucuronidation: studies into the
role of age, sex, enzyme inducers, and genetic polymorphism using the human liver bank
as a model system. Drug Metab Rev. 42: 209–224.

clix
Court, M. H., M. Freytsis, X. Wang, I. Peter, C. Guillemette, S. Hazarika, S. X. Duan, D. J.
Greenblatt and W. M. Lee. 2013. The UDP-Glucuronosyltransferase (UGT) 1A
polymorphism c.2042C.G (rs8330) is associated with increased human liver
acetaminophen glucuronidation, increased UGT1A exon 5a/5b splice variant mRNA
ratio, and decreased risk of unintentional acetaminophen-induced acute liver failures. J
Pharmacol Exp Ther. 345:297–307.
Critchley, J. A. J. H., G. R. Nimmo, C. A. Gregson, N. M. Woolhouse and L. F. Prescoit. 1986.
Inter-subject and ethnic differences in paracetamol metabolism. Br. J. clin. Pharmac. 22:
649-657.
Critchley, J.A., L. A. Critchley, P. J. Anderson and B. Tomlinson. 2005. Differences in the
single-oral-dose pharmacokinetics and urinary excretion of paracetamol and its
conjugates between Hong Kong Chinese and Caucasian subjects. J Clin Pharm Ther.
30(2): 179-184.
Croubels, S., A. Maes, K. Baert and P. D. Backer. 2005. Quantitative determination of salicylic
acid and metabolites in animal tissues by liquid chromatography–tandem mass
spectrometry. Analytica Chimica Acta. 529: 179–187.
Daly, A. K., M. Armstrong, S. C. Monkman, M. E. Idle and J. R. Idle. 1991. The genetic and
metabolic criteria for the assignment of debrisoquine hydroxylation (cytochrome
P450IID6) phenotypes. Pharmacogenetics 1: 33-41.
Daly, A. K., S. Cholerton, M. Armstrong and J. R. Idle. 1994. Genotyping for Polymorphisms in
Xenobiotic Metabolism as a Predictor of Disease Susceptibility. Environ Health
Perspect.102:55-61.
Desai, A. A., F. Innocentia and M. J. Rataina. 2003. UGT pharmacogenomics: implications for
cancer risk and cancer therapeutics. Pharmacogenetics. 13: 517–523.
Dewani, A. P., B. B. Barik, V. D. Chipade, R. L. Bakal, A. V. Chandewar and S. K. Kanungo.
2014. RP-HPLC-DAD method for the determination of phenylepherine, paracetamol,
caffeine and chlorpheniramine in bulk and marketed formulation. Arabian Journal of
Chemistry. 7: 811–816.
Eccles, R., I. Loose, M. Jawad and L. Nyman. 2003. Effects of acetylsalicylic acid on sore throat
pain and other pain symptoms associated with acute upper respiratory tract
infection. Pain Medicine. 4: 118–124.

clx
Ehmer, U., A. Vogel, J. K. Schutte, B. Krone and M. P. Manns. 2004. Variation of hepatic
glucuronidation: Novel functional polymorphisms of the UDPglucuronosyltransferase
UGT1A4. Hepatology. 39: 970–977.
Ellard, G. A., P. T. Gammon, J. A. Savin and R. S. H. Tan. 2006. Dapson acetylation in
dermatitis herpetiformis. Br. J. of Dermatology. 90(4): 441-444.
Ekhart, C., S. Rodenhuis, P. H. M. Smits, J. H. Beijen and A. D. R. Huitema. 2008. An overview
of relations between polymorphisms in drug metabolizing enzymes and drug transporters
and survival after cancer drug treatment. Cancer Treatment Reviews. 35: 18-31.
Faed, E. M. 1984. Properties of acyl glucuronides: implications for studies of the
pharmacokinetics and metabolism of acidic drugs. Drug. Metab. Rev. 15: 1213–1249.
Farid, F. N., N. A. E. Ragehy, M. A. Hegazy, M. Abdelkawy and F. H. Metwally. 2014.
Simultaneous determination of a quaternary mixture of oxomemazine, sodium benzoate,
guaifenesin and paracetamol by chromatographic methods. Journal of basic and applied
sciences. 3: 260-268.
Faura, C. C., M. J. Olaso, C. C. Garcia and H. F. Horga. 1996. Lack of morphine-6-glucuronide
antinociception after morphine treatment. Is morphine-3-glucuronide involved? Pain. 65:
25–30.
Flouvat, B., A. Leneveu, S. Fitoussi, B. Delhotal-Landes and A. Gendron. 2004. Bioequivalence
study comparing a new paracetamol solution for injection and propacetamol after single
intravenous infusion in healthy subjects. Int J Clin Pharmacol Ther. 42(1): 50-57.
Forbes, J. A., W. T. Beaver and K. F. Jones. 1992. Analgesic efficacy of bromfenac, ibuprofen,
and aspirin in postoperative oral surgery pain. Clin Pharmacol Ther. 51: 343–352.
Forrest, J. A., J. A. Clements and L. F. Prescott. 1982. Clinical pharmacokinetics of paracetamol.
Clin Pharmacokinet. 7(2): 93-107.
Franeta, J. T., D. Agbaba, S. Eric, S. Pavkov, M. Aleksic and S. Vladimirov. 2002. HPLC assay
of acetylsalicylic acid, paracetamol, caffeine and phenobarbital in tablets. Il Farmaco. 57:
709- 713.
Gaganis, P., J. O. Miners, J. S. Brennan, A. Thomas and K. M. Knights. 2007. Human renal
cortical and medullary UDP-glucuronosyltransferases (UGTs): immunohistochemical

clxi
localization of UGT2B7 and UGT1A enzymes and kinetic characterization of S-naproxen
glucuronidation. Journal of Pharmacology and Experimental Therapeutics. 323: 422–430.
Girard, H., E. Levesque, J. Bellemare, K. Journault, B. Caillier and C. Guillemette. 2007.
Genetic diversity at the UGT1 locus is amplified by a novel 3′ alternative splicing
mechanism leading to nine additional UGT1A proteins that act as regulators of
glucuronidation activity. Pharmacogenet Genomics. 17: 1077–1089.
Girolamo, A. D., W. M. O. Neill and I. W. Wainer. 1998. A validated method for the
determination of paracetamol and its glucuronide and sulphate metabolites in the urine of
HIV:AIDS patients using wavelength-switching UV detection. Journal of Pharmaceutical
and Biomedical Analysis. 17: 1191–1197.
Gong, Q. H., J. W. Cho, T. Huang, C. Potter, N. Gholami and N. K. Basu. 2001.
ThirteenUDPglucuronosyltransferase genes are encoded at the human UGT1 gene
complex locus. Pharmacogenetics. 11: 357–368.
Grant, D. J., C. Hoyo, S. D. Oliver, L. Gerber, K. Shuler and E. Calloway. 2013. Association of
uridine diphosphate-glucuronosyltransferase 2B gene variants with serum glucuronide
levels and prostate cancer risk. Genet Test Mol Biomarkers. 17: 03–09.
Grant, D. M., B. K. Tang and W. Kalow. 1984. A simple test for acetylator phenotype using
caffeine. Br. J. Clin. Pharmac. 17: 459-464.
Green, M. D., E. M. Oturu and T. R. Tephly. 1994. Stable expression of a human liver UDP-
glucuronosyltransferase (UGT2B15) with activity toward steroid and xenobiotic
substrates. Drug Metab Dispos. 22(5): 799–805.
Guillemette, C., R. C. Millikan, B. Newman and D. E. Housman. 2000. Genetic polymorphisms
in uridine diphospho-glucuronosyltransferase 1A1 and association with breast cancer
among African Americans. Cancer Res. 60: 950–956.
Guillemette, C., I. D. Vivo, S. E. Hankinson, C. A. Haiman, D. Spiegelman and D. E. Housman.
2001. Association of genetic polymorphisms in UGT1A1 with breast cancer and plasma
hormone levels. Cancer Epidemiol Biomarkers Prev. 10: 711-714.
Guillemette, C. 2003. Pharmacogenomics of human UDP–glucuronosyltransferase enzymes. The
Pharmacogenomics Journal. 3(3): 136–158.
clxii
Guillemette, C., E. Levesque, M. Harvey, J. Bellemare and V. Menard. 2010. UGT genomic
diversity: beyond gene duplication. Drug Metab Rev. 42(1): 22-42.
Gupta, E., R. Mick and J. Ramirez. 1997. Pharmacokinetic and pharmacodynamic evaluation of
the topoisomerase inhibitor irinotecan in cancer patients. J Clin Oncol. 15(4): 1502–1510.
Hadad, G. M., S. Emara and W. M. M. Mahmoud. 2009. Development and validation of a
stability-indicating RP-HPLC method for the determination of paracetamol with
dantrolene or/and cetirizine and pseudoephedrine in two pharmaceutical dosage forms.
Talanta. 79: 1360–1367.
Halvorsen, S., F. Andreotti, J. M. Berg, M. Cattaneo, S. Coccheri, R. Marchioli, J. Morais, F. W.
A. Verheugt and R. D. Caterina. 2014. Aspirin therapy in primary cardiovascular disease
prevention. Journal of the American college of cardiology. 64(3): 319-327.
Hantson, P., L. Saint-Georges, B. P. Mahieu, E. D. Lonard, M. C. Crutzen-Fayt and A. Lonard.
1996. Evaluation of the ability of paracetamol to produce chromosome aberrations in
man. Mutation Research. 368: 293-300.
Harris, P. A. and S. Riegelman. 1969. Influence of the route of administration on the area under
the plasma concentration-time curve. J PharmSci. 58: 71–75.
Hart, S. J., R. Tontodonati and I. C. Calder. 1981. Reverse-phase chromatography of urinary
metabolites of paracetamol using ion suppression and ion pairing. Journal of
Chromatogmphy. 225: 387-405.
Hein, D. W. 2009.N-acetyltransferase SNPs: emerging concepts serve as a paradigm for
understanding complexities of personalized medicine. Expert.Opin. Drug Metab. Toxicol.
5(4): 353-366.
Heitmeier, S and G. Blaschke. 1999. Direct determination of paracetamol and its metabolites in
urine and serum by capillary electrophoresis with ultraviolet and mass spectrometric
detection. Journal of Chromatography B. 721: 93–108.
Hess, P and D. Cooper. 1999. Impact of pharmacogenomics on the clinical laboratory. Mol.
Diagn. 4: 289–298.
Hinz, B., O. Cheremina and K. Brune. 2008. "Acetaminophen (paracetamol) is a selective
cyclooxygenase-2 inhibitor in man." The FASEB journal. 22 (2): 383–390.

clxiii
Hirohashi, T., H. Suzuki, H. Takikawa and Y. Sugiyama. 2000. ATP-dependent transport of bile
salts by rat multidrug resistance-associated protein 3 (Mrp3). J Biol Chem. 275: 2905-
2910.
Innocenti, F., S. D. Undevia, L. Iyer, P. X. Chen, S. Das and M. Kocherginsky. 2004. Genetic
variants in the UDPglucuronosyltransferase 1A1 gene predict the risk of severe
neutropenia of irinotecan. J Clin Oncol. 2: 1382–1388.
International conference on Harmonized (ICH) of technical requirements for the registration of
pharmaceuticals for human use, Validation of Analytical Procedures: Text and
Methodology. J. ICH Q2 (IR) (2005), Geneva.
Iyer, L., D. Hall, S. Das, M. A. Mortell, J. Ramirez and S. Kim. 1999. Phenotype–genotype
correlation of in vitro SN-38 (active metabolite of irinotecan) and bilirubin
glucuronidation in human liver tissue with UGT1A1 promoter polymorphism. Clin
Pharmacol Ther. 65: 576–582.
Iyer, L., S. Das, L. Janisch, M. Wen, J. Ramirez and T. Karrison. 2002. UGT1A1*28
polymorphism as a determinant of irinotecan disposition and toxicity. Pharmacogenomics
J. 2: 43- 47.
Izukawa, T., M. Nakajima, R. Fujiwara, H. Yamanaka, T. Fukami and M. Takamiya. 2009.
Quantitative analysis of UDP-glucuronosyltransferase (UGT) 1A and UGT2B expression
levels in human livers. Drug Metabolism and Disposition. 37: 1759–1768.
Jain, D. K., N. Jain and J. Verma. 2012. RP-HPLC method for simultaneous estimation of aspirin
and prasugrel in binary combination. International Journal of Pharmaceutical Sciences
and Drug Research. 4(3): 218-221.
Janssena, P. L. T. M. K., M. B. Katana, W. A. Staverena, P. C. H. Hollmanb and D. P. Venemab.
1997. Acetylsalicylate and salicylates in foods. Cancer Letters. 114: 163-164.
Jensen, L. S., J. Valentine, R. W. Milne and A. M. Evans. 2004. The quantification of
paracetamol, paracetamol glucuronide and paracetamol sulphate in plasma and urine
using a single high-performance liquid chromatography assay. Journal of Pharmaceutical
and Biomedical Analysis. 34: 585–593.
Jin, C. J., P. I. Mackenzie and J. O. Miners. 1997. The regio- and stereo-selectivity of C19 and
C21 hydroxysteroid glucuronidation by UGT2B7 and UGT2B11. Arch Biochem
Biophys. 341: 207–211.

clxiv
Jin, S. M. and K. Park. 2012. Acetaminophen Induced Cytotoxicity and Altered Gene Expression
in Cultured Cardiomyocytes of H9C2 Cells. Environmental Health and Toxicology. 27:1-
8.
Jinno, H., T. Tanaka-Kagawa, N. Hanioka, M. Saeki, S. Ishida and T. Nishimura. 2003.
Glucuronidation of 7-ethyl-10-hydroxycamptothecin (SN-38), an active metabolite of
irinotecan (CPT-11), by human UGT1A1 variants, G71R, P229Q, and Y486D. Drug
Metab Dispos. 31(1): 108–113.
Jung, J. A., T. Kim, J. Kim, M. Kim, W. Huh, K. Park, S. Lee and J. Ko. 2013. The
pharmacokinetics and safety of a fixed-dose combination of acetylsalicylic acid and
clopidogrel compared with the concurrent administration of acetylsalicylic acid and
clopidogrel in healthy subjects: A randomized, open-label, 2-sequence, 2-period, single-
dose cross over study. Clinical Therapeutics. 35 (7): 985-994.
Kadakol, A., S. S. Ghosh, B. S. Sappal, G. Sharma, J. R. Chowdhury and N. R. Chowdhury.
2000. Genetic lesions of bilirubin uridine–diphosphoglucuronate glucuronosyltransferase
(UGT1A1) causing Crigler–Najjar and Gilbert syndromes: correlation of genotype to
phenotype. Human Mutation. 16(4): 297–306.
Kahsay, G., A. V. Schepdael and E. Adams. 2012. Development and validation of a liquid
chromatographic method for purity control of clopidogrel–acetylsalicylic acid in
combined oral dosage forms. Journal of Pharmaceutical and Biomedical Analysis. 61:
271-276.
Kato, H., K. Yoshimoto and H. Ikegaya. 2010. Two cases of oral aspirin overdose. Journal of
forensic and legal medicine.17: 280-282.
Kees, F., D. Jehnich and H. Grobecker. 1996. Simultaneous determination of acetylsalicylic acid
and salicylic acid in human plasma by high-performance liquid chromatography. Journal
of Chromatography B. 677: 172-177.
Kiang, T. K., M. H. Ensom and T. K. Chang. 2005. UDP-glucuronosyltransferases and clinical
drug–drug interactions. Pharmacology and Therapeutics. 106(1): 97–132.
Kim, J. Y., H. S. Cheong, B. L. Park, L. H. Kim, S. Namgoong, J. O. Kim, H. D. Kim, Y. H.
Kim, M. W. Chung, S. Y. Han and H. D. Shin. 2014. Comprehensive Variant Screening
of the UGT Gene Family. Yonsei Med J. 55(1): 232-239.

clxv
Knights, K. M. and J. O. Miners. 2010. Renal UDP-glucuronosyltransferases and the
glucuronidation of xenobiotics and endogenous mediators. Drug Metabolism Reviews.
42: 60–70.
Kinzig-Schippers, M., D. Tomalik-Scharte, A. Jetter, B. Scheidel, V. Jakob, M. Rodamer, I.
Cascorbi, O. Doroshyenko, F. Sorgel and U. Fuhr. 2005. Should we use N-
acetyltransferase type 2 genotyping to personalized isoniazid doses. J. Antimicrob.
Agents. Chemother. 49: 1733-1738.
Kmetec, V. 1992. Simultaneous determination of acetylsalicylic, salicylic, ascorbic and
dehydroascorbic acid by HPLC. Journal of Pharmaceutical & Biomedical Analysis.
10(12): 1073-1076.
Kong, S. Y., C. S. Ki, B. C. Yoo and J. W. Kim. 2008. UGT1A7 haplotype is associated with an
increased risk of hepatocellular carcinoma in hepatitis B carriers. Cancer Sci. 99: 340–
344.
Koo, S. H. and E. J. Lee. 2006. Pharmacogenetics approach to therapeutics. Clin Exp Pharmacol
Physiol. 33(5-6): 525-532.
Kuehl, E. G., J. Bigler, J. D. Potter and J. W. Lampe. 2006. Glucuronidation of the aspirin
metabolite salicylic acid by expressed udp-glucuronosyltransferases and human liver
microsomes. Drug Metabolism and Disposition. 34: 199–202.
Lampe, J. W., J. Bigler, N. K. Horner and J. D. Potter. 1999. UDPglucuronosyltransferase
(UGT1A1*28 and UGT1A6*2) polymorphisms in Caucasians and Asians: relationships
to serum bilirubin concentrations. Pharmacogenetics. 9: 341–349.
Lampe, J. W., J. Bigler, A. C. Bush, and J. D. Potter. 2000. Prevalence of Polymorphisms in the
Human UDP-Glucuronosyltransferase 2B Family: UGT2B4(D458E), UGT2B7(H268Y),
and UGT2B15(D85Y)1. Cancer Epidemiology, Biomarkers & Prevention. 9: 329–333.
Lares-Asseff, I., H. Juarez-Olguin, J. Flores-Perez, A. Guille-Perez and A. Vargas. 2004.
Pharmacokinetics and Metabolic Rates of Acetyl Salicylic Acid and Its Metabolites in an
Otomi Ethnic Group of Mexico. Biol. Pharm. Bull. 27(5): 706-709.
Lau. G. S. N. and J. A. J. H. Critchley. 1994. The estimation of paracetamol and its major
metabolites in both plasma and urine by a single high performance liquid
chromatography assay. Journal of Pharmaceutical & Biomedical Analysis. 12(12): 1563-
1572.

clxvi
Levesque, E., M. Beaulieu, M. D. Green, T. R. Tephly, A. Belanger and D. W. Hum. 1997.
Isolation and characterization of UGT2B15(Y85): a UDP-glucuronosyltransferase
encoded by a polymorphic gene. Pharmacogenetics. 7: 317-325.
Levesque, E., M. Beaulieu, C. Guillemette, D. W. Hum and A. Belanger. 1998. Effect of
Interleukins on UGT2B15 and UGT2B17 Steroid Uridine Diphosphate-
Glucuronosyltransferase Expression and Activity in the LNCaP Cell Line.
Endocrinology. 139(5): 2375–2381.
Levesque, E., M. Beaulieu, D. W. Hum and A. Belanger. 1999. Characterization and substrate
specificity of UGT2B4 (E458): a UDP-glucuronosyltransferase encoded by a
polymorphic gene. Pharmacogenetics. 9: 207–216.
Lewis, H. D., J. W. Davis, D. G. Archibald, W. E. Steinke, T. C. Smitherman, J. E. Doherty, H.
W. Schnaper, M. M. LeWinter, E. Linares, J. M. Pouget, S. C. Sabharwal, E. Chesler and
H. Demots. 1983. Protective effects of aspirin against acute myocardial infarction and
death in men with unstable angina. Results of a Veterans Administration Cooperative
Study. New Engl. J. Med. 309 (7): 396-403.
Lhermitte, M., D. Allorge and F. Broly. 2006. Therapeutic failure: importance of genes? Ann
Pharm Fr. 64(6): 406-415.
Lide, D. R. 1997. CRC Handbook of Chemistry and Physics, 78th Ed., Boca Raton, FL, CRC
Press, p. 3-4.
Limenta, L. M., G. T. Jirasomprasert, J. Tankanitlert, S. Svasti, P. Wilairat, U. Chantharaksri, S.
Fucharoen and N. P. Morales. 2008. UGT1A6 genotype-related pharmacokinetics of
deferiprone (L1) in healthy volunteers. British journal of clinical pharmacology. 65(6):
908-916.
Lin, J. H and B. K. Wong. 2002. Complexities of glucuronidation affecting in vitro-in vivo
extrapolation. Curr Drug Metab. 3: 623–646.
Liu, J. and P. C. Smith. 1996. Direct analysis of salicylic acid, salicyl acyl glucuronide,
salicyluric acid and gentisic acid in human plasma and urine by high-performance liquid
chromatography. Journal of Chromatography B. 675: 61-70.
Locatellia, M., R. Cifellia, C. D. Leggea, R. C. Barbacanec, N. Costad, M. Frestad, C. Celiaa, C.
Capolupog and L. D. Marzioaa. 2015. Simultaneous determination of eperisone
hydrochloride andparacetamol in mouse plasma by high performance

clxvii
liquidchromatography-photodiode array detector. Journal of Chromatography A.
1388:79-86.
Ma, Q and A. Y. H. Lu. 2011. Pharmacogenetics, Pharmacogenomics, and Individualized
Medicine. Pharmacol Rev. 63: 437–459.
MacGregor, A. E., A. Dowson and P. T. G. Davies. 2002. Mouth-dispersible aspirin in the
treatment of migraine: a placebo-controlled study. Headache. 42: 249–255.
Mackenzie, P. I. and I. S. Owens. 1984. Cleavage of nascent UDP glucuronosyltransferase from
rat liver and dog pancreas microsomes. Biochemical and Biophysical Research
Communications. 122: 1441–1449.
Mackenzie, P. I., I. S. Owens, B. Burchell, K. W. Bock, A. Bairoch and A. Belanger. 1997. The
UDP glycosyltransferase gene superfamily: recommended nomenclature update based on
evolutionary divergence. Pharmacogenetics. 7: 255–269.
Mackenzie, P. I., K. W. Bock, B. Burchell, C. Guillemette, S. Ikushiro and T. Iyanagi. 2005.
Nomenclature update for the mammalian UDP glycosyltransferase (UGT) gene
superfamily. Pharmacogenet Genomics. 15: 677–685.
Mackenzie, P. I., A. Rogers, J. Treloar, B. R. Jorgensen, J. O. Miners and R. Meech. 2008.
Identification of UDP glycosyltransferase 3A1 as a UDP N
acetylglucosaminyltransferase. J Biol Chem. 283: 36205–36210.
Mackenzie, P. I., A. Rogers, D. J. Elliot, N. Chau, J. A. Hulin and J. O. Miners. 2011. The novel
UDP glycosyltransferase 3A2: cloning, catalytic properties, and tissue distribution.
Molecular Pharmacology. 79:472–478.
Macleod, S. L., S. Nowell, J. Plaxco and N. P. Lang. 2000. An allele-specific polymerase chain
reaction method for the determination of the D85Y polymorphism in the human UDP
glucuronosyltransferase 2B15 gene in a case–control study of prostate cancer. Ann Surg
Oncol. 7: 777-782.
Mannisto, P. T. and S. Kaakkola. 1999. Catechol-O-methyltransferase (COMT): biochemistry,
molecular biology, pharmacology, and clinical efficacy of the new selective COMT
inhibitors. Pharmacol. Rev. 51: 593–628.

clxviii
Marzilawati, A. R., Y. Y. Ngau and S. Mahadeva. 2012. Low rates of hepatotoxicity among
Asian patients with paracetamol overdose: a review of 1024 cases. BMC Pharmacol
Toxicol. 13: 1-8.
Mathijssen, R. H., R. J. Alphen, J. Verweij, W. J. Loos, K .Nooter and G. Stoter. 2001. Clinical
pharmacokinetics and metabolism of irinotecan (CPT-11). Clin Cancer Res. 7(8): 2182–
2194.
Matimba, A., J. Del-Favero, C. V. Broeckhoven, C. Masimirembwa. 2009. Novel variants of
major drug-metabolising enzyme genes in diverse African populations and their predicted
functional effects. Hum Genomics. 3(2): 169-190.
McCance, K. L. and S. E. Heuther. 2002. Pathophysiology: the Biologic Basis for Disease in
Adults and Children. Mosby, Philadelphia.
McCarthy, D. M. 2012. Efficacy and gastrointestinal risk of aspirin used for the treatment of pain
and cold. Best Practice & Research Clinical Gastroenterology. 26: 101–112.
Meech, R. and P. I. Mackenzie. 2010. UGT3A: novel UDP-glycosyltransferases of the UGT
superfamily. Drug Metab Rev. 42: 43–52.
Meech, R., J. O. Miners, B. C. Lewis and P. I. Mackenzie. 2012. The glycosidation of
xenobiotics and endogenous compounds: Versatility and redundancy in the UDP
glycosyltransferase superfamily. Pharmacology & Therapeutics. 134: 200–218.
Menard, V., H. Girard, M. Harvey, L. Perusse and C. Guillemette. 2009. Analysis of inherited
genetic variations at the UGT1 locus in the French-Canadian population. Hum Mutat. 30:
677–687.
Meyer, U. A. and U. M. Zanger. 1997. Molecular mechanisms of genetic polymorphisms of drug
metabolism. Annu. Rev. Pharmacol. Toxicol. 37: 269–296.
Meyer, U. A. 2000. Pharmacogenetics and adverse drug reactions. Lancet. 356: 1667-1671.
Miners, J. O., N. Grgurinovich, A. G. Whitehead, R. A. Robson and D. J. Birkett. 1986.
Influence of gender and oral contraceptive steroids on themetabolism of salicylic acid and
acetylsalicylic acid. Br. J. clin. Pharmac. 22: 135-142.
Miners, J. O and P. I. Mackenzie. 1991. Drug glucuronidation in humans. Pharmacology and
Therapeutics. 51: 347–369.
clxix
Miners, J. O., R. A. Mckinnon and P. I. Mackenzie. 2002. Genetic polymorphisms of UDP-
glucuronosyltransferases and their functional significance. Toxicology. 181-182: 453-
456.
Miners, J. O, P. A. Smith and M. J. Sorich. 2004. Predicting human drug glucuronidation
parameters: application of in vitro and in silico modeling approaches. Annual Reviews of
Pharmacology and Toxicology. 44: 1–25.
Miners, J. O., K. M. Knights, J. B. Houston and P. I. Mackenzie. 2006. In vitro–in vivo
correlation for drugs and other compounds eliminated by glucuronidation in humans:
pitfalls and promises. Biochemical Pharmacology. 71: 1531–1539.
Miners, J. O., P. I. Mackenzi and K. M. Knights. 2010a. The prediction of drug-glucuronidation
parameters in humans: UDP-glucuronosyltransferase enzyme-selective substrate and
inhibitor probes for reaction phenotyping and in vitro–in vivo extrapolation of drug
clearance and drug–drug interaction potential. Drug Metabolism Reviews. 42:196–208.
Mistry, M. and J. B. Houston. 1987. Glucuronidation in vitro and in vivo. Comparison of
intestinal and hepatic conjugation of morphine, naloxone and buprenorphine. Drug Metab
Dispos. 15: 710–717.
Modick, H., A. Schutze, C. Palmke, T. Weiss, T. Bruning and H. M. Koch. 2013. Rapid
determination of N-acetyl-4-aminophenol (paracetamol) in urine by tandem mass
spectrometry coupled with on-line clean-up by two dimensional turbulent flow/reversed
phase liquid chromatography. Journal of Chromatography B. 925: 33– 39.
Monaghan, G., B. Burchell and M. Boxer. 1997. Structure of the human UGT2B4 gene encoding
a bile acid UDP-glucuronosyltransferase. Mamm Genome. 8: 692–694.
Monaghan, G., M. Ryan, R. Seddon, R. Hume and B. Burchell. 1996. Genetic variation in
bilirubin UPD–glucuronosyltransferase gene promoter and Gilbert's syndrome. Lancet.
347(9001): 578–581.
Mutlib, A. E., T. C. Goosen, J. N. Bauman, J. A. Williams, S. Kulkarni and S. Kostrubsky. 2006.
Kinetics of acetaminophen glucuronidation by UDP-Glucuronosyltransferases 1A1, 1A6,
1A9 and 2B15. Potential Implications in Acetaminophen-Induced Hepatotoxicity. Chem.
Res. Toxicol. 19: 701-709.
Nadeau, G., J. Bellemare, E. Audet-Walsh, C. Flageole, S. P. Huang and B. Y. Bao. 2011.
Deletions of the androgen-metabolizing UGT2B genes have an effect on circulating

clxx
steroid levels and biochemical recurrence after radical prostatectomy in localized prostate
cancer. J. Clin. Endocrinol. Metab. 96: 1550–1557.
Navarro, S. L., M. R. Saracino, K. W. Makar, S. S. Thomas, L. Li, Y. Zheng, L. Levy, Y.
Schwarz, J. Bigler, J. D. Potter and J. W. Lampe. 2011a. Determinants of aspirin
metabolism in healthy men and women: effects of dietary inducers of UDP-
Glucuronosyltransferases. J. Nutrigenet Nutrigenomics. 4:110–118.
Navarro, S. L., Y. Chen, L. Li, S. S. Li, J. Chang, Y. Schwarz, I. B. King, J. D. Potter, J. Bigler
and J. W. Lampe. 2011. UGT1A6 and UGT2B15 polymorphisms and acetaminophen
conjugation in response to a randomized, controlled diet of select fruits and vegetables.
Drug Metabolism and disposition. 39(9): 1650–1657.
Nishijima,T., K. Tsuchiya, N. Tanaka, A. Joya, Y. Hamada1, D. Mizushima, T. Aoki, K.
Watanabe, E. Kinai, H. Honda, H. Yazaki, J. Tanuma, K. Tsukada, K. Teruya, Y.
Kikuchi, S. Oka and H. Gatanaga. 2014. Single-nucleotide polymorphisms in the UDP-
glucuronosyltransferase 1A-3′ untranslated region are associated with atazanavir-induced
nephrolithiasis in patients with HIV-1 infection: a pharmacogenetic study. Journal of
Antimicrobial Chemotherapy. 69(12): 3320-3328.
Nowell, S. A., J. Ahn, J. M. Rae, J. O. Scheys, A. Trovato and C. Sweeney. 2005. Association of
genetic variation in tamoxifen-metabolizing enzymes with overall survival and
recurrence of disease in breast cancer patients. Breast Cancer Res Treat. 91(3): 249–258.
Oliveira, E. J., D. G. Watson and N. S. Morton. 2002. A simple microanalytical technique for
the determination of paracetamol and its main metabolites in blood spots. Journal of
Pharmaceutical and Biomedical Analysis. 29: 803–809.
Ohno, S. and S. Nakajin. 2009. Determination of mRNA expression of human UDP
glucuronosyltransferases and application for localization in various human tissues by
real-time reverse transcriptase-polymerase chain reaction. Drug Metabolism and
Disposition 37: 32–40.
Osborne, N.J., A. L. Tonkin and J. O.Miners.1991.Interethnic differences in drug
glucuronidation: A comparison of paracetamol metabolism in Caucasians and Chinese.
Br. J. clin. Pharmac.32: 765-767.

clxxi
Ouzzine, M., L. Barre, P. Netter, J. Magdalou and S. Fournel-Gigleux. 2003. The human UDP-
glucuronosyltransferases: structural aspects and drug glucuronidation. Drug Metab Rev.
35: 287-303.
Pabba, S. K., S. Bolla, R. Kandhagatla, M. R. Chaluvadi and D. R. Krishna. 2002.
Paracetamol metabolism in Indian population. Arzneimittelforschung. 52(10):769-772.
Palikhe, N. S., S. Kim, Y. H. Nam, Y. Ye and H. Park. 2011. Polymorphisms of Aspirin-
Metabolizing Enzymes CYP2C9, NAT2 and UGT1A6 in Aspirin-Intolerant Urticaria.
Allergy Asthma Immunol Res. 3(4): 273-302.
Park, J., L. Chen, K. Shade, P. Lazarus, J. Seigne and S. Patterson. 2004. Asp85tyr
polymorphism in the udp-glucuronosyltransferase (UGT) 2B15 gene and the risk of
prostate cancer. J Urol. 171: 2484–2488.
Patel, M., B. K. Tang and W. Kalow. 1992. Variability of acetaminophen metabolism in
Caucasians and Orientals. Pharmacogenetics. 2: 38–45.
Patel, D., N. Patel, R. Vaishy, V. Patel, C. Solanki and M. Patel. 2013. Development and
validation of RP-HPLC method for simultaneous estimation of aspirin and esomeprazole
magnesium in tablet dosage form. Journal of Chemistry. 1-5.
Paterson, J. R., G. Baxter, J. S. Dreyer, J. M. Halket, R. Flynn and J. R. Lawrence. 2008.
Salicylic acid sans aspirin in animals and man: persistence in fasting and biosynthesis
from benzoic acid. J Agric Food Chem. 56(24):11648-11652.
Patrignani, P., P. Filabozzi and C. Patrono. 1982. Selective cumulative inhibition of platelet
thromboxane production by low-dose aspirin in healthy subjects. J Clin Invest. 69: 1366–
1372.
Pedersen, A. K. and G. A. FitzGerald. 1984. Dose-related kinetics of aspirin. Presystemic
acetylation of platelet cyclooxygenase. N Engl J Med. 311: 1206–1211.
Penglis, P. S., L. G. Cleland, M. Demasi, G. E. Caughey and M. J. James. 2000. Differential
regulation of prostaglandin E2 and thromboxane A2 production in human monocytes:
implications for the use of cyclooxygenase inhibitors. J Immunol. 165: 1605-1611.
Piepoli, A., A. Gentile, M. R. Valvano, D. Barana, C. Oliani and R. Cotugno.2006. Lack of
association between UGT1A7, UGT1A9, ARP, SPIN K1 and CFTR gene polymorphisms
and pancreatic cancer in Italian patients. World J Gastroenterol. 12:6343-6348.

clxxii
Pillot, T., M. Ouzzine, S. Fournel-Gigleux, C. Lafaurie, A. Radominska and B. Burchell. 1993.
Glucuronidation of hyodeoxycholic acid in human liver. Evidence for a selective role of
UDP-glucuronosyltransferase 2B4. J Biol Chem. 268: 25636-25642.
Pirkera, R., C. W. Hucka, M. Poppb and G. K. Bonna. 2004. Simultaneous determination of
gentisic, salicyluric and salicylic acid in human plasma using solid-phase extraction,
liquid chromatography and electrospray ionization mass spectrometry. Journal of
Chromatography B. 809: 257–264.
Polagania, S. R., N. R. Pillib and V. Gandu. 2012. High performance liquid chromatography
mass spectrometric method for the simultaneous quantification of pravastatin and aspirin
in human plasma: Pharmacokinetic application. Journal of Pharmaceutical Analysis. 2(3):
206–213.
Prescott, L. 1983. Paracetamol overdosage: pharmacological considerations and clinical
management. Drugs. 25: 290–314.
Reynolds, E. F. 1982. "Aspirin and similar analgesic and anti-inflammatory agents".Martindale:
The Extra Pharmacopoeia. 28: 234–282.
Riedy, M., J. Y. Wang, A. P. Miller, A. Buckler, J. Hall and M. Guida. 2000. Genomic
organization of the UGT2b gene cluster on human chromosome 4q13. Pharmacogenetics.
10: 251–260.
Rittau, A. M. and A. J. McLachlan. 2012. Investigating paracetamol pharmacokinetics
using venous and capillary blood and saliva sampling. Journal of Pharmacy and
Pharmacology. 64(5): 705-711.
Ritter, J. K., Y. Y. Sheen and I. S. Owens. 1990. Cloning and expression of human liver UDP-
glucuronosyltransferase in COS-1 cells. 3,4-catechol estrogens and estriol as primary
substrates. J Biol Chem. 265: 7900–7906.
Ritter, J. K., F. Chen, Y. Y. Sheen, H. M. Tran, S. Kimura and M. T. Yeatman. 1992. A novel
complex locus UGT1 encodes human bilirubin, phenol, and other
UDPglucuronosyltransferase isozymes with identical carboxyl termini. J Biol Chem. 267:
3257–3261.
Ritter, J. K. 2000. Roles of glucuronidation and UDP-glucuronosyltransferases in xenobiotic
bioactivation reactions. Chemico-Biological Interactions. 129: 171–193.
clxxiii
Roda, A., L. Sabatini, A. Barbieri, M. Guardigli, M. Locatelli, F. S. Violante, L. C. Rovati and S.
Persiani. 2006. Development and validation of a sensitive HPLC-ESI-MS/MS method for
the direct determination of glucosamine in human plasma. J Chromatogr B Analyt
Technol Biomed Life Sci. 844(1): 119-126.
Rothwell, P. M., J. F. Proce, and F. G. Fowkes. 2012. Short-term effects of daily aspirin on risks
of cancer and non-vascular death: Analysis of the time-course of risks and benefits in
randomised controlled trials. Lancet. 379(9826):1602-1612.
Rouleau, M., J. Roberge, J. Bellemare and C. Guillemette. 2014. Dual roles for splice variants of
the glucuronidation pathway as regulators of cellular metabolism. Mol Pharmacol. 85:
29–36.
Rowland, M., S. Riegelman, P. A. Harris and S. D. Sholkoff. 1972. Absorption kinetics of
aspirin in man following oral administration of an aqueous solution. J Pharm Sci. 61:
379–385.
Rowland, A., J. O. Miners and P. I. Mackenzie. 2013. The UDP-glucuronosyltransferases: Their
role in drug metabolism and detoxification. The International Journal of Biochemistry &
Cell Biology.45: 1121– 1132.
Rusnak, J. M., R. M. Kisabeth, D. P. Herbert and D. M. McNeil. 2001. Pharmacogenomics: A
clinician’s primer on emerging technologies for improved patient care. Mayo Clin. Proc.
76: 299–309.
K. Schrör, Acetylsalicylic acid, 2009. ISBN 978-3-527-32109-4,
Saeki, M., Y. Saito, H. Jinno, T. Tanaka-Kagawa, A. Ohno and S. Ozawa. 2004. Single
nucleotide polymorphisms and haplotype frequencies of UGT2B4 and UGT2B7 in a
Japanese population. Drug Metab Dispos.32: 1048-1054.
Sanek, M., M. Pierzchalska, S. Bazan-Socha and A. Szczeklik. 2000. Enhanced expression of
the leukotriene C4 synthase due to overactive transcription of an allelic variant associated
with aspirin-intolerant asthma. American Journal of Respiratory Cellular Molecular
Biology. 23 (3): 290–296.
Satoh, N., T. Akiba, S. Yokoshima and T. Fukuyama. 2007. A practical synthesis of (-)-
Oseltamivir. Angew. Chem. Int. Ed. 46: 5734-5736.

clxxiv
Sawyer, M. B., F. Innocenti, S. Das, C. Cheng, J. Ramirez and F. H. Pantle-Fisher. 2003. A
pharmacogenetic study of uridine diphosphate-glucuronosyltransferase 2B7 in patients
receiving morphine. Clin Pharmacol Ther. 73: 566-574.
Scherer, D., L. M. Koepl, E. M. Poole, Y. Balavarca, L. Xiao, J. A. Baron, L. Hsu, A. E. Coghill,
P. T. Campbell, S. E. Kleinstein, J. C. Figueiredo, J. W. Lampe, K. Buck, J. D. Potter, R.
J. Kulmacz, M. A. Jenkins, J. L. Hopper, A. K. Win, P. A. Newcomb, C. M. Ulrich and
K. W. Makar. 2014. Genetic Variation in UGT Genes Modify the Associations of
NSAIDs with Risk of Colorectal Cancer: Colon Cancer Family Registry. GENES,
CHROMOSOMES and CANCER. 53: 568–578.
Schror, K. Acetylsalicylic acid Weinheim: Wiley-VCH; 2009.
Schwertner, H. A., D. Mcglasson, M. Christopher and A. C. Bush. 2006. Effects of different
aspirin formulations on platelet aggregation times and on plasma salicylate
concentrations. Thromb Res. 118(4): 529-534.
Shen, J., S. Wanwimolruk and M. S. Roberts. 1991. Novel direct high-performance liquid
chromatographic method for determination of salicylate glucuronide conjugates in human
urine. Journal of Chromatography: Biomedical Applications. 565: 309-320.
Shenfield, G. M. 2004. Genetic Polymorphisms, Drug Metabolism and Drug Concentrations.
Clin Biochem Rev. 25(4): 203–206.
Shipkova, M., C. P. Strassburg, F. Braun, F. Streit, H. J. Grone and V. W. Armstrong. 2001.
Glucuronide and glucoside conjugation of mycophenolic acid by human liver, kidney and
intestinal microsomes. Br J Pharmacol 132: 1027–1034.
Sjogren, P., L. P. Thunedborg, L. Christrup, S. H. Hansen and J. Franks. 1998. Is development of
hyperalgesia, allodynia and myoclonus related to morphine metabolism during long-term
administration? Six case histories. Acta Anaesthesiol Scand. 42: 1070– 1075.
Smith, M. T., J. A. Watt and T. Cramond. 1990. Morphine-3-glucuronide-a potent antagonist of
morphine analgesia. Life Sci. 47: 579-585.
Smith, M. T. 2000. Neuroexcitatory effects of morphine and hydromorphone: evidence
implicating the 3-glucuronide metabolites. Clin Exp Pharmacol Physiol. 27: 524–528.
Soars, M. G., B. Burchell and R. J. Riley. 2002. In vitro analysis of human drug glucuronidation
and prediction of in vivo metabolic clearance. J. Pharmacol. Exp. Ther. 301: 382–390.

clxxv
Sorich, M. J., R. A. Mckinnon, J. O. Miners and P. A. Smith. 2006. The importance of local
chemical structures for chemical metabolism by human uridine 5-
diphosphateglucuronosyltransferase. Journal of Chemical Information and Modeling. 46:
2692–2697.
Spahn-Langguth, H and L. Z. Benet. 1992. Acyl glucuronides revisited: is the glucuronidation
process atoxification as well as a detoxification mechanis. Drug. Metab. Rev. 24: 5–47.
Steel, R. G. D., J. H. Torrie and D. A. Dickey. 2006. Principles and procedures of statistics: A
biochemical approach. 3rd Ed. McGraw Hill Book Companies New York, USA.
Steiner, T. J., R. Lange and M. Voelker. 2003. Aspirin in episodic tension-type headache:
placebo-controlled dose-ranging comparison with paracetamol. Cephalalgia. 23:59–66.
Strassburg, C. P., A. Vogel, S. Kneip, R. H. Tukey and M. P. Manns. 2002. Polymorphisms of
the human UDP-glucuronosyltransferase (UGT) 1A7 gene in colorectal cancer. Gut.
50(6): 851–856.
Stucker, I., M. A. Loriot, G. N’koutchou, S. Cenee and L. Bodin. 2007.
UDPglucuronosyltransferase UGT1A7 genetic polymorphisms in hepatocellular
carcinoma: a differential impact according to seropositivity of HBV or HCV markers?
BMC Cancer. 7: 214.
Tan, Q., R. Zhu, H. Li, F. Wang, M. Yan and L. Dai. 2012. Simultaneous quantitative
determination of paracetamol and its glucuronide conjugate in human plasma and urine
by liquid chromatography coupled to electrospray tandem mass spectrometry:
Application to a clinical pharmacokinetic study. Journal of Chromatography B. 894: 162–
167.
Tang, K. S., H. F. Chiu, H. H. Chen, H. L. Eng and C. J. Tsai. 2005. Link between colorectal
cancer and polymorphisms in the uridine-diphosphoglucuronosyltransferase 1A7 and
1A1 genes. World J Gastroenterol. 11: 3250–3254.
Tankanitlert, J., N. P. Morales, T. A. Howard, P. Fucharoen, R. E. Ware and S. Fucharoen. 2007.
Effects of combined UDPglucuronosyltransferase (UGT) 1A1*28 and 1A6*2 on
paracetamol pharmacokinetics in beta-thalassemia/HbE. Pharmacology. 79: 97–103.
Tate, S. K and D. B. Goldstein. 2004. Will tomorrow’s medicines work for everyone? Nat.
Genet. 36: 34–42.

clxxvi
Tseng, C. S., K. S. Tang, H. W. Lo, C. G. Ker and H. C. Teng. 2005.
UDPglucuronosyltransferase 1A7 genetic polymorphisms are associated with
hepatocellular carcinoma risk and onset age. Am J Gastroenterol. 100: 1758–1763.
Tukey, R. H. and C. P. Strassburg. 2000. Human UDP-glucuronosyltransferases: metabolism,
expression, and disease. Annu Rev Pharmacol Toxicol. 40: 581– 616.
Turgeon, D., J. S. Carrier, E. Levesque, D.W. Hum and A. Belanger. 2001. Relative enzymatic
activity, protein stability, and tissue distribution of human steroid-metabolizing UGT2B
subfamily members. Endocrinology. 142: 778–787.
Twycross, R., V. Pace, M. Mihalyo and A. Wilcock. 2013. Therapeutic Reviews. Journal of Pain
and Symptom Management. 46(5): 747-755.
Verschueren, K. 1996. Handbook of environmental data on organic chemicals, 3rd Ed., New
York, Van Nostrand Reinhold Co., p. 1444.
Vertzoni, M. V., H. A. Archontaki and P. Galanopoulou. 2003. Development and optimization of
a reversed-phase highperformance liquid chromatographic method for the determination
of acetaminophen and its major metabolites in rabbit plasma and urine after a toxic dose.
Journal of Pharmaceutical and Biomedical Analysis. 32(3): 487-493.
Vesell, E and D. Gaylor. 1995. Limitations of probit plots in pharmacogenetics: requirement of
genetic analyses to test hypotheses based on graphical methods. Pharmacogenetics. 5: 18-
23.
Vree, T. B., E. W. J. Kolmer, C. P. W. G. M. V. Wissen and Y. A. Hekster. 1994. Direct gradient
reversed-phase high-performance liquid chromatographic determination of salicylic acid,
with the corresponding glycine and glucuronide conjugates in human plasma and urine.
Journal of Chromatography B. 652: 161-170.
Walsky, R. L., J. N. Bauman, K. Boucier, G. Giddens, K. Lampham, A. Negahban, T. F. Ryder,
R. S. Obach, R. Hyland and T. C. Goosen. 2012. Optimized assays for human UDP-
glucuronosyltransferase (UGT) activities: altered alamethicin concentration and utility to
screen for UGT inhibitors. Drug Metab Dispos. 40(5): 1051-1065.
Wang, Y., N. Kato, Y. Hoshida, M. Otsuka and H. Taniguchi. 2004.
UDPglucuronosyltransferase 1A7 genetic polymorphisms are associated with
hepatocellular carcinoma in japanese patients with hepatitis C virus infection. Clin
Cancer Res. 10: 2441–2446.

clxxvii
Wasserman, E., A. Myara, F. Lokiec, F. Goldwasser, F. Trivin, M. Mahjoubi, J. L. Misset and E.
Cvitkovic. 1997. Severe CPT–11 toxicity in patients with Gilbert's syndrome: two case
reports. Annals of Oncology. 8(10): 1049–1051.
Wells, P. G., P. I. Mackenzie, J. R. Choewdhury, C. Guillemette, P. A. Gregory, Y. Ishii, A. J.
Hansen, F. K. Kessler, P. M. Kim, N. R. Chowdhury and J. K. Ritter. 2004.
Glucuronidation and the UDP–glucuronosyltransferases in health and disease. Drug
Metabolism and Disposition. 32(3): 281–290.
Westphal, G. A., A. Schnuch, T. G. Schulz, K. Reich, W. Aberer, J. Brasch, P. Koch, R.
Wessbecher, C. Szliska, A. Bauer and E. Hallier. 2000. Homozygous gene deletions of
the glutathione S-transferase M1 and T1 are associated with thimerosal sensitization. Int.
Arch. Occup. Environ. Health. 73(6): 384-388.
White, H. D., B. J. Gersh and L. H. Opie. 2001. Antithrombotic agents: platelet inhibitors,
anticoagulants, and fibrinolytics. In: Opie, Lionel H., Gersh, Bernard J. (Eds.), Drugs for
the Heart, fifth ed. W.B.Saunders, Philadelphia, pp. 273–322.
Wilcock, A. and R. Twycross. 2013. Therapeutic reviews. Journal of pain and symptom
management. 46(5):747-755.
Williams, J. 2008. "The Declaration of Helsinki and public health". Bulletin of the World Health
Organisation. 86 (8).
Wojcicki, J., B. Gawronska-Szklarz, J. Kazimierczyk, Z. Baskiewicz and A. Raczynski.
1979. Comparative pharmacokinetics of paracetamol in men and women considering
follicular and luteal phases. Arzneimittelforschung. 29(2): 350-352.
Yamamotoa, E., S. Takakuwa, T. Kato and N. Asakawa. 2007. Sensitive determination of aspirin
and its metabolites in plasma by LC–UV using on-line solid-phase extraction with
methylcellulose-immobilized anion-exchange restricted access media. Journal of
Chromatography B. 846: 132–138.
Yilmaz, L., E. Borazan , T. Aytekin, I. Baskonus, A. Aytekin, S. Oztuzcu, Z. Bozdag and
A. Balik. 2015. Increased UGT1A3 and UGT1A7 Expression is Associated with
Pancreatic Cancer. Asian Pac J Cancer Prev. 16(4): 1651-1655.
Zaugga, S., X. Zhangb, J. Sweedlerb and W. Thormanna. 2001. Determination of salicylate,
gentisic acid and salicyluric acid in human urine by capillary electrophoresis with laser-
induced fluorescence detection . Journal of Chromatography B. 752: 17–31.

clxxviii
Zhang, W. Y. and W. P. A. Li. 1998. Efficacy of minor analgesics in primary dysmenorrhoea: a
systematic review. Br J Obstet Gynaecol. 105: 780–789.
Zhang, X., Q. Y. Zhang, D. Liu, T. Su, Y. Weng and G. Ling. 2005. Expression of cytochromes
P450 and other biotransformation genes in fetal and adult human nasal mucosa. Drug
Metabolism and Disposition. 33:1423–1428.

clxxix
Appendix 1.Demographic data for healthy male volunteers (n=59)
Subject ID Age
(Years)
Weight
(Kg)
Height
(cm)
Blood Pressure
(mm Hg)
Body
Temperature
(0F) Systolic Diastolic
1 22 67 172.7
120 80 98
2 24 72 170.2
120 80 98.6
3 23 69 172.7
120 80 98.6
4 19 72 170.2
120 80 98
5 27 75 172.7
120 80 98.6
6 21 64 175.3
110 70 98
7 25 102 185.4
120 80 98
8 22 74 170.2
120 80 98.4
9 22 70 165.1
120 80 98.6
10 20 68 167.6
120 80 98
11 23 80 180.3
110 70 98
12 22 56 154.9
120 90 98
13 23 60 185.4
120 80 98.6
14 24 73 175.3
120 80 98.6
15 22 75 180.3
120 80 98.6
16 21 57 165
120 80 98.4
17 21 81 154.9
110 70 98
18 21 67 170.2
120 80 98.4
19 23 86 180.3
110 70 98
20 20 55 154.9
120 80 98.6
21 22 74 170.2
110 80 98
22 22 69 172.7
110 70 98.2
23 22 78 182.9
120 80 98.4
24 21 77 180.3
120 80 98.6
25 23 65 165.1
120 80 98

clxxx
26 25 78 170.2
120 80 98.6
27 23 68 172.7
120 80 98
28 20 72 187.9
110 70 98.2
29 21 80 182.8
110 80 98
30 19 62 175.3
120 80 98.6
31 19 71 170.2
120 80 98
32 20 70 170.2
120 80 98
33 25 78 172.7
120 80 98.6
34 21 78 172.7
110 70 98
35 23 60 165.1
110 70 98
36 24 65 165.1
120 80 98.6
37 21 46 162.6
120 80 98.4
38 26 55 170.2
120 70 98
39 25 63 162.6
120 80 98.2
40 23 70 167.6
110 70 98
41 22 68 175.3
110 70 98
42 19 60 175.3
110 90 98.2
43 19 55 175.3
120 80 98.2
44 21 76 154.9
110 70 98
45 21 70 170.2
120 80 98.6
46 21 70 167.6
110 70 98
47 21 69 180.3
120 80 98
48 22 100 165.1
120 70 98
49 21 72 175.3
120 80 98.6
50 20 62 170.2
110 80 98
51 32 72 154.9
120 80 98.6
52 23 76 175.3
120 80 98
53 29 59 167.6
110 70 98.2

clxxxi
54 21 65 172.7
120 70 98
55 24 96 175.3
120 80 98
56 20 60 172.7
110 70 98.4
57 19 65 175.3
110 80 98
58 23 63 154.9
120 80 98.6
59 21 56 162.6
120 80 98.6
Mean 22.19
69.76
170.91
116.78
77.46
98.24
±SD 2.43
10.49
7.94
4.71
5.12
0.27
Maximum 32 102 187.9 120 90 98.6
Minimum 19 46 154.9
110 70 98
Appendix 2.Demographic data for healthy female volunteers (n=50)
Subject ID Age
(Years)
Weight
(Kg)
Height
(cm)
Blood Pressure
(mm Hg)
Body
Temperature
(0F) Systolic Diastolic
1 22 72 162.6
120 90 98
2 20 49 157.5
110 90 98.6
3 20 55 160
110 90 98
4 27 46 160
110 70 98
5 20 56 157.5
120 80 98.6
6 21 50 157.5
120 90 98.6
7 21 60 165.1
120 80 98
8 21 45 160
110 80 98
9 21 80 162.6
120 90 98.6
10 21 48 170.2
110 70 98
11 24 40 154.9
120 80 98
12 21 61 160
120 90 98.4

clxxxii
13 24 61 162.6
100 80 98
14 21 54 154.9
110 70 98.6
15 23 70 162.6
110 70 98
16 21 45 160
110 80 98.6
17 23 47 160
120 80 98.6
18 20 56 157.5
120 80 98.4
19 21 64 162.6
120 90 98.6
20 22 59 162.6
110 70 98.4
21 23 55 154.9
120 90 98.2
22 26 48 157.5
110 70 98
23 24 58 160
120 90 98.6
24 20 63 162.6
120 80 98
25 20 57 162.6
120 80 98
26 24 57 160
120 80 98.6
27 23 74 160
120 90 98.6
28 21 60 162.6
120 80 98.6
29 22 44 152.4
120 70 98
30 21 59 154.9
120 90 98
31 27 55 144.8
110 70 96.2
32 22 47 167.6
120 80 98
33 22 54 160
130 90 98.4
34 22 57 167.6
110 80 98
35 24 47 160
110 70 98
36 24 50 154.9
120 90 98.4
37 20 43 160
120 80 98.6
38 24 47 162.6
110 70 98
39 28 54 154.9
110 70 98
40 23 80 157.5
110 80 98
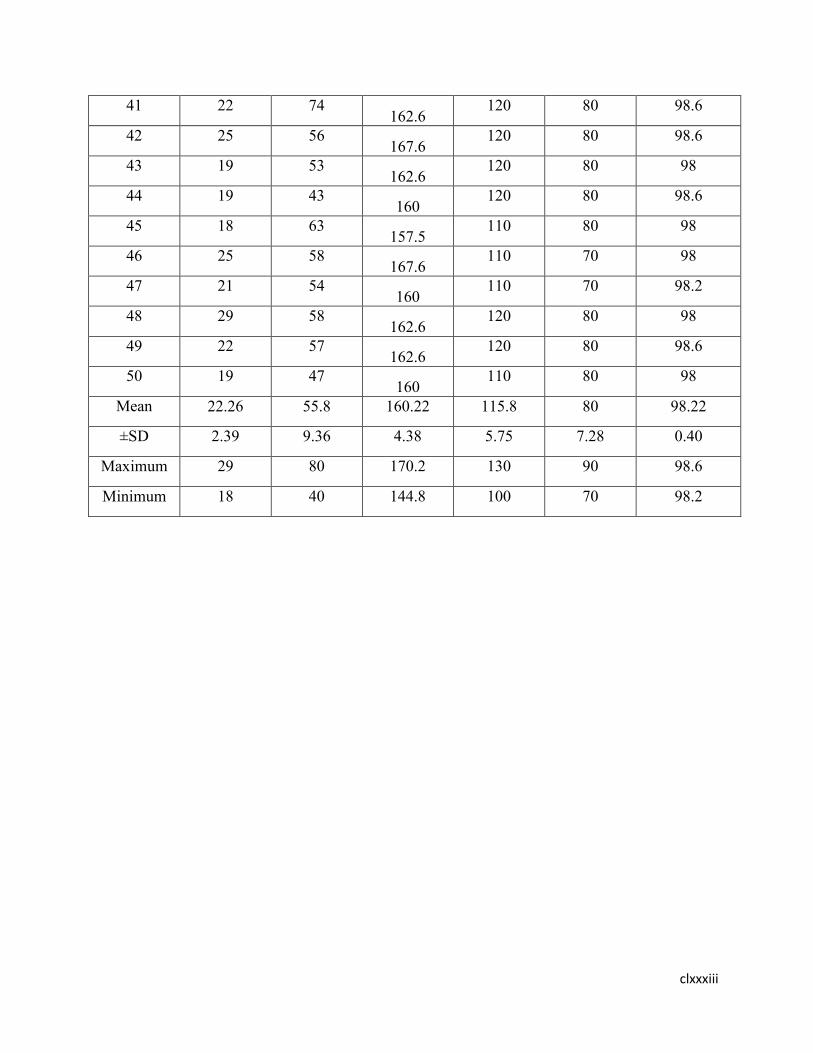
clxxxiii
41 22 74 162.6
120 80 98.6
42 25 56 167.6
120 80 98.6
43 19 53 162.6
120 80 98
44 19 43 160
120 80 98.6
45 18 63 157.5
110 80 98
46 25 58 167.6
110 70 98
47 21 54 160
110 70 98.2
48 29 58 162.6
120 80 98
49 22 57 162.6
120 80 98.6
50 19 47 160
110 80 98
Mean 22.26 55.8 160.22 115.8 80 98.22
±SD 2.39 9.36 4.38 5.75 7.28 0.40
Maximum 29 80 170.2 130 90 98.6
Minimum 18 40 144.8 100 70 98.2

clxxxiv
Appendix 3. Biochemical parameters for healthy male volunteers (n=59)
Sub.
ID Urea
(mg/dL)
Creatinine
(mg/dL)
TGs
(mg/dL)
Cholestrol
(mg/dL)
HDL
(mg/dL)
LDL
(mg/dL)
ALT
(U/L)
AST
(U/L)
Billirubin
(mg/dL)
Total
Protein
(g/dL)
Albumin
(g/dL)
Globu
lin
(g/dL)
A/G
ratio
1 29 1.1 180 193 47 96 20 18 1.4 7.3 4.3 3.5 1.2
2 24 0.9 153 189 46 99 29 27 1.3 7.5 4.2 3.1 1.4
3 25 1 159 151 35 81 18 21 1.5 7.8 4.3 3.4 1.3
4 29 0.7 193 191 41 92 21 19 1.8 7.4 4.3 3.5 1.2
5 24 0.9 129 146 32 69 25 23 1.2 7.5 4.5 3.2 1.4
6 12 0.7 130 149 31 73 13 15 1.4 7.9 4.3 3.1 1.4
7 20 0.9 139 155 34 89 14 13 1.3 7.8 4.4 3.6 1.2
8 14 0.6 120 149 30 71 13 10 1.9 7.4 4.8 3.2 1.5
9 21 0.6 146 171 36 88 17 20 1.2 7.6 4.3 3.4 1.3
10 13 0.8 159 187 40 89 18 21 1 7.3 4.2 3.5 1.2
11 24 0.9 190 192 39 100 18 18 1.6 7.7 4.1 3.3 1.2
12 23 1 154 171 46 79 35 31 1.6 7.9 4.1 3.7 1.1
13 26 0.9 89 126 29 63 28 25 1.7 8.1 4.3 3.7 1.2
14 19 0.8 136 168 45 81 28 26 1.5 7.3 4.9 3.1 1.6
15 17 0.6 101 126 31 70 12 10 1.2 7.7 4.3 3.5 1.2
16 20 0.7 160 168 39 84 21 22 1.1 7.4 4.3 3.3 1.3
17 23 0.8 112 128 31 72 21 24 1.8 7.4 4.5 3 1.5
18 16 0.6 180 193 38 101 44 39 1.7 7.6 4.4 3.3 1.3
19 19 0.7 171 188 36 92 24 20 1.5 7.7 4.4 3.4 1.3
20 16 0.8 152 173 40 81 17 21 1.4 7.6 4.2 3.4 1.2
21 26 1 219 210 39 120 23 28 1.6 7.7 4.3 3.4 1.3
22 18 0.9 139 174 39 75 50 49 1.3 7.5 4.3 3.5 1.2
23 33 1 142 174 32 81 13 16 1.5 7.6 4.1 3.3 1.2
24 30 0.8 168 178 41 90 36 30 1.3 7.5 4.1 3.3 1.2
25 21 0.8 156 179 40 73 35 38 1.2 7.4 4.1 3.2 1.3
26 24 1 204 209 38 116 14 19 1.7 7.5 4.3 3.1 1.4
27 30 1.1 169 184 40 97 44 38 1.9 7.6 4.2 3.4 1.2

clxxxv
28 34 1.2 153 161 47 91 49 44 1.8 7.3 4.3 3.2 1.3
29 29 1.1 73 105 36 69 10 12 1.7 7.3 4.1 3.4 1.2
30 25 0.8 89 102 31 70 23 20 1.7 7.4 4.2 3.4 1.2
31 21 0.7 113 131 35 86 17 19 1.6 7.3 4.2 3.3 1.3
32 23 1.1 173 207 40 108 22 26 1.6 7.5 4.3 3.3 1.3
33 19 1 184 201 51 96 20 19 1.2 7.9 4.3 3.6 1.2
34 18 0.8 83 160 36 71 23 20 1.1 7.6 4.5 3.3 1.4
35 16 0.7 95 169 38 68 19 17 1.2 7.3 4.6 3.5 1.3
36 20 0.9 115 171 42 79 24 22 1.4 7.9 4.9 3.6 1.4
37 26 1 98 156 41 112 16 20 1.4 8 4.8 3.2 1.5
38 22 0.8 130 168 40 109 26 16 1.5 7.4 4.2 3.4 1.2
39 33 0.8 109 175 38 69 29 21 1.2 7.9 4.1 3.7 1.1
40 27 0.7 118 131 35 73 15 27 1 7.7 4.1 3.4 1.2
41 24 0.9 145 105 39 68 19 30 1 7.9 4.4 3.3 1.3
42 29 0.7 133 109 44 102 23 34 1.2 8 4.6 3.6 1.3
43 16 0.9 117 171 41 105 22 18 1.1 7.8 4.3 3.6 1.2
44 28 0.8 74 149 37 86 20 16 1.4 8.1 4.3 3.4 1.3
45 21 1 85 154 36 82 18 22 1.4 7.6 4.2 3.5 1.2
46 18 1.1 127 159 43 75 33 10 1.2 7.8 4.6 3.6 1.3
47 20 0.9 119 181 46 72 28 18 1.4 7.8 4.3 3.2 1.3
48 23 0.8 139 156 38 67 31 31 0.9 8 4.5 3.3 1.4
49 19 0.8 152 166 39 83 24 29 1.1 8.1 4.5 3.2 1.4
50 22 0.6 99 159 42 79 20 22 1.3 7.5 4.3 3.6 1.2
51 14 0.7 78 167 36 104 17 25 1.5 7.9 4.2 3.4 1.2
52 24 0.8 92 185 37 97 30 17 1.3 7.6 4.3 3.3 1.3
53 17 0.9 112 173 41 117 18 23 1.3 7.3 4.2 3.2 1.3
54 26 0.9 124 151 35 93 25 14 1.2 7.6 4.4 3.4 1.2
55 29 1 148 162 39 78 31 17 1.1 7.5 4.3 3.6 1.2
56 19 0.7 125 164 37 74 22 21 1.2 7.9 4.6 3.1 1.5
57 31 0.7 108 149 40 64 36 19 1.5 7.7 4.4 3.6 1.2
58 21 0.8 111 149 42 67 32 32 1.6 7.3 4.3 3.4 1.3
59 24 1 150 167 43 89 21 24 1.8 7.4 4.3 3.7 1.2

clxxxvi
Mea
n
22.61 0.85 134.25 163.31 38.64 85.17
23.97 22.81 1.39 7.63 4.34 3.38 1.29
±SD 5.27 0.15 33.99 25.24 4.65 14.78 8.91 8.04 0.25 0.24 0.19 0.18 0.09
Max
imu
m
34 1.2 219 210 51 120 50 49 1.9 8.1 4.9 3.7 1.58
Mini
mum
12 0.6 73 102 29 63 10 10 0.9 7.3 4.1 3 1.11
Appendix 3. Biochemical parameters for healthy female volunteers (n=50)
Sub.
ID Urea
(mg/dL)
Creatinine
(mg/dL)
TGs
(mg/dL)
Cholestrol
(mg/dL)
HDL
(mg/dL)
LDL
(mg/dL)
ALT
(U/L)
AST
(U/L)
Billirubin
(mg/dL)
Total
Protein
(g/dL)
Albumin
(g/dL)
Globu
lin
(g/dL)
A/G
ratio
1 11 0.8 220 224 31 112 12 16 0.8 7.7 4.2 4 1.1
2 13 0.9 151 176 39 81 11 10 0.7 7.4 4.2 4.1 1.0
3 17 0.7 176 190 49 85 25 29 0.9 7.2 4.2 3.6 1.2
4 14 0.8 99 123 36 59 41 33 0.8 7.9 4.3 3.3 1.3
5 26 0.7 121 147 37 78 16 16 0.7 7.7 4.1 3.1 1.3
6 22 0.8 168 184 40 81 14 19 0.6 7.9 4 3.9 1.0
7 18 0.6 160 183 37 90 14 12 0.4 7.8 4.1 3.7 1.1
8 25 0.7 195 213 38 102 16 18 0.5 7.6 4 3.9 1.0
9 18 0.6 149 163 31 87 10 12 0.5 7.2 4.2 3.8 1.1
10 18 0.7 209 221 36 128 42 35 0.7 7.1 4.1 3.5 1.2
11 30 0.7 106 143 28 71 20 19 1 7 4.1 3.3 1.2
12 20 0.7 173 192 39 91 15 19 1.1 7.6 4 3 1.3
13 18 0.6 131 150 39 69 17 21 1.1 7.7 4.2 3.5 1.2
14 29 0.8 160 165 38 75 15 17 1 7.4 4.2 3.8 1.1
15 25 0.8 190 186 40 93 20 16 0.7 7.8 4.3 3.3 1.3
16 34 0.9 168 192 52 80 18 18 0.9 7.7 4.1 3.9 1.1
17 28 1 135 165 44 79 18 15 0.9 7.5 4.2 3.7 1.1
18 32 1.1 128 176 38 75 20 17 1.3 7.9 4.1 3.9 1.1

clxxxvii
19 21 0.7 147 182 46 81 24 20 1.1 7.7 4.2 3.8 1.1
20 27 1 156 179 39 90 37 40 1.4 8 4 3.7 1.1
21 19 0.7 124 152 40 78 13 15 0.9 7.8 4.3 3.9 1.1
22 29 0.9 131 143 49 72 15 18 1 7.8 4 3.9 1.0
23 24 0.9 180 201 43 101 17 12 1.1 7.7 4.2 3.7 1.1
24 18 0.7 129 148 51 90 26 29 1.2 7.9 4.3 3.9 1.1
25 21 0.8 156 198 44 86 18 16 1.6 7.3 4.1 3.7 1.1
26 14 0.7 155 170 43 85 14 15 0.8 7.4 4 3.2 1.3
27 16 0.6 129 148 39 66 25 23 0.9 7.9 4.2 3.1 1.4
28 20 0.7 169 206 55 79 19 21 0.7 7.4 3.9 3.8 1.0
29 21 0.8 129 143 38 112 19 16 0.7 7.6 4 3.3 1.2
30 13 0.7 130 192 48 81 12 19 1 8 3.9 3.6 1.1
31 19 0.9 139 150 30 85 18 12 1.3 7.9 3.9 3.7 1.1
32 22 0.6 120 165 40 59 29 18 1.5 7.7 4 3.7 1.1
33 15 1 130 186 52 78 22 12 1.1 7.9 4.5 3.4 1.3
34 25 0.6 109 192 44 81 31 35 1.2 7.3 4.4 3.7 1.2
35 29 0.7 118 165 38 90 16 19 1 7.4 4.1 3 1.4
36 24 0.7 145 176 46 90 18 19 0.9 7 4 3 1.3
37 18 0.9 133 182 39 78 23 21 0.8 7.5 4.4 3 1.5
38 20 0.8 117 179 40 72 15 17 0.9 7.4 4.1 3.6 1.1
39 32 0.8 74 152 49 101 25 16 0.8 8 4.1 3.3 1.2
40 29 0.7 85 143 43 90 24 10 0.7 7.9 4 3.8 1.1
41 17 0.9 127 201 51 86 28 29 0.7 7.7 4.1 3.9 1.1
42 27 0.7 119 148 44 85 32 33 0.9 7.9 3.9 3.8 1.0
43 21 0.7 139 198 43 66 22 16 1.1 7.4 3.8 3.5 1.1
44 14 0.9 149 163 39 79 18 23 1 7.1 4.1 3.4 1.2
45 16 1 209 159 55 59 16 19 0.8 7.2 4.2 3 1.4
46 26 0.8 106 187 53 78 24 13 0.9 7.3 4 3.1 1.3
47 29 0.8 173 154 40 81 34 17 1.1 7 4.2 3.2 1.3
48 31 0.6 131 167 46 90 35 22 1.3 7.5 4.6 2.9 1.6
49 16 0.9 160 169 52 102 20 25 1.2 7.7 4.7 3.8 1.2
50 20 0.7 190 176 37 87 18 30 1.7 7.4 4.3 3.1 1.4
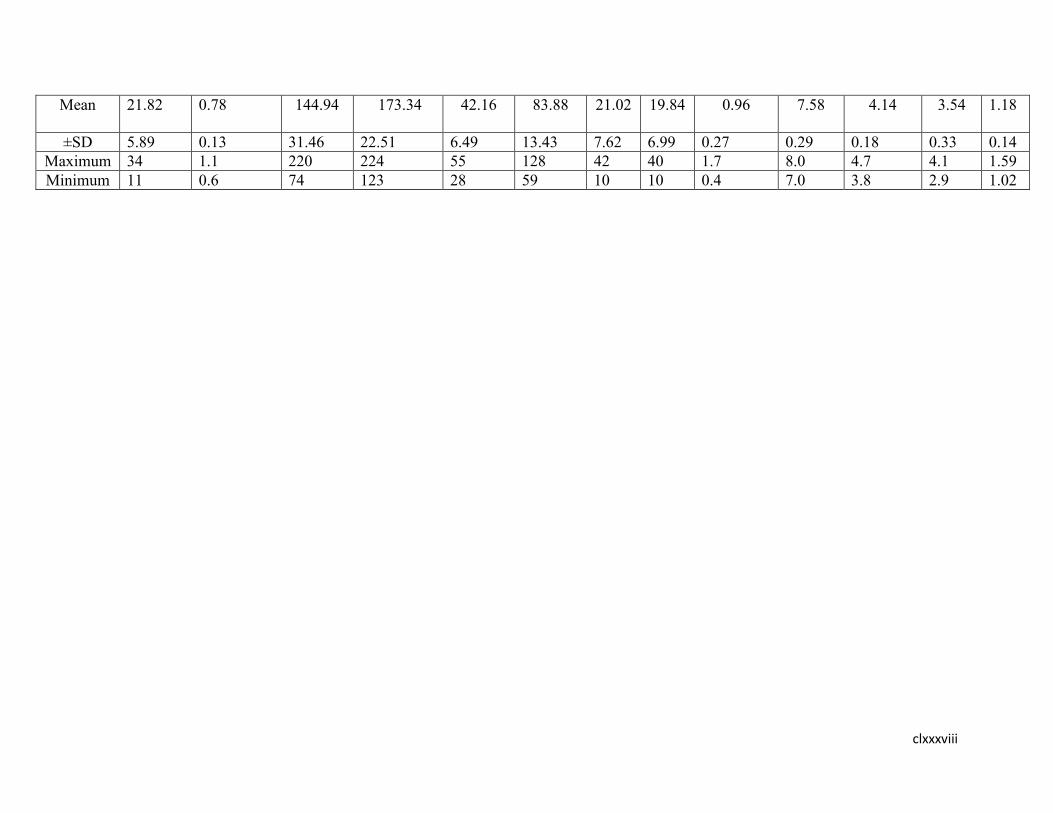
clxxxviii
Mean 21.82 0.78 144.94 173.34 42.16 83.88 21.02 19.84 0.96
7.58 4.14 3.54 1.18
±SD 5.89 0.13 31.46 22.51 6.49 13.43 7.62 6.99 0.27 0.29 0.18 0.33 0.14
Maximum 34 1.1 220 224 55 128 42 40 1.7 8.0 4.7 4.1 1.59
Minimum 11 0.6 74 123 28 59 10 10 0.4 7.0 3.8 2.9 1.02

clxxxix
Appendix 5.Complete blood picture for healthy male volunteers (n=59)
Sub.
ID Hb
(g/dL)
Total RBC
(10^6/µL)
Hct
(%)
MC
V
(fL)
MCH
(pg)
MCHC
(g/dL)
Platelet
Count
(10^3/µL)
Total
WBC
(10^3/µL)
Neutro
phils
(%)
Lympho
cytes
(%)
Monoc
ytes
(%)
Eosinophils
(%)
1 15.8 4.94 43.6 88.3 32 36.2 218 8.2 54 40 3 3
2 15.2 5.39 42.7 79.2 28.2 35.6 296 7.4 60 35 3 2
3 14.7 4.97 39.3 79.1 29.6 37.4 213 7.1 55 39 4 2
4 16 5.69 45 79.4 28.1 35.4 281 5.3 62 31 4 3
5 16.6 5.15 43.6 84.7 32.2 38.1 313 7.2 56 39 3 2
6 16.8 5.4 43.9 80.7 30.9 38.3 335 7.6 65 30 3 2
7 16.2 5.64 45.1 80 28.7 35.9 317 6.9 67 26 4 3
8 14.7 5.64 42.1 74.6 26.1 34.9 301 6.9 60 34 4 2
9 15.9 6.04 44.2 73.2 26.3 36 311 7.5 74 21 3 2
10 15.3 4.97 41.4 83.3 30.8 37 235 5.3 55 37 5 3
11 16 5.33 44.1 82.7 30 36.3 269 5.5 51 42 4 3
12 16.2 5.62 43.3 77 28.8 37.4 417 7.5 70 22 5 3
13 15.1 5.04 41.7 82.7 30 36.2 224 7.4 56 38 4 2
14 16.9 5.47 44.8 81.9 30.9 37.7 303 8.7 69 26 3 2
15 17 5.4 44.9 83.1 31.5 37.7 291 9.4 71 23 3 3
16 14.9 4.89 41.8 85.5 30.5 35.6 260 6.7 62 34 2 2
17 12.9 4.48 36.7 81.9 28.8 35.1 147 5.9 65 28 4 3
18 14.1 4.55 39.3 86.4 31 35.9 447 9.7 67 28 3 2
19 15.1 5.08 41.7 82.1 29.7 36.2 269 7.7 72 22 4 2
20 13.9 4.73 38.4 81.2 29.4 36.2 332 7.7 60 33 4 3
21 15 5.37 42.4 79 27.9 35.4 305 9.3 65 30 3 2
22 12.7 4.98 36.2 72.7 25.5 35.1 361 11.5 85 11 2 2
23 15.9 4.53 42.6 94 35.1 37.3 241 9 74 22 4 2
24 14.6 4.85 41 84.5 30.1 35.6 276 8.7 75 20 3 2
25 13.7 4.59 37.8 82.4 29.8 36.2 248 5.2 62 32 4 2
26 15.7 5.33 43.1 80.9 29.5 36.4 213 7.7 63 32 3 2
27 16.6 5.43 44.9 82.7 30.6 37 238 8.7 67 28 3 2

cxc
28 15.8 5.89 45 76.4 26.8 35.1 406 6.6 53 39 5 3
29 17 5.29 45.1 85.3 32.1 37.7 191 6.7 52 35 7 6
30 13.2 6.75 39.2 58.1 19.6 33.7 345 5.2 50 38 8 4
31 15.3 5.18 41.6 80.3 29.5 36.8 303 6 35 50 9 6
32 16 6.72 45.7 68 23.8 35 323 6.3 45 43 7 5
33 15.7 5.28 43.8 83 29.7 35.8 337 4.9 44 40 10 6
34 16 4.36 41.6 82.9 29.9 32.1 413 5.5 70 36 4 2
35 15.2 5.34 44.8 83.9 31 31.3 435 6.8 64 25 3 2
36 16.1 4.76 43.7 83.1 30.5 33.9 417 7.1 54 37 2 3
37 15.5 4.98 41.9 85.7 28.9 35.9 401 9.5 58 40 3 2
38 14.8 5.28 44.5 86.9 31 36 311 6.6 61 27 5 3
39 13.3 5.1 45.6 86.4 30.5 32.3 335 6.9 65 38 6 2
40 14.4 5.36 42.8 82.3 29.4 36.1 369 7.8 66 28 4 2
41 15.2 4.98 40.7 81.8 27.6 34.4 417 5.7 70 25 6 3
42 14.3 4.53 41.3 79.1 26.5 33.5 324 5.4 65 34 5 2
43 15 4.85 41.7 72.9 31 31.8 303 5.3 63 28 5 2
44 12.9 4.59 39.8 94 30.1 33.9 391 7.2 68 29 3 2
45 15.9 5.33 42.4 84.9 29.9 35.6 360 7.6 71 28 6 2
46 14.8 5.43 39.2 84.4 30.3 35.4 247 6.9 67 33 4 2
47 13.9 5.89 42.6 80.9 30.5 32.9 347 6.9 66 31 7 2
48 15.6 5.29 41.7 69.7 26.9 35.2 369 7.5 72 31 3 2
49 16.4 5.47 37.8 73.6 30.4 34.3 432 5.3 70 26 5 3
50 15.5 5.4 43.5 84.4 27.4 35.5 405 5.5 72 25 3 6
51 14.9 4.89 44.4 82.1 29.5 36 461 7.5 65 31 3 3
52 15.8 4.48 45 80.6 25.9 33.9 341 7.4 67 34 8 3
53 16 4.55 45.7 76.8 29.3 35.6 376 8.7 64 28 5 4
54 15.3 5.08 41.4 79.5 26.4 36.1 348 9.4 58 39 4 2
55 16.1 4.73 45.2 81.4 28.9 36.4 313 6.7 56 3 7 2
56 15.2 5.37 43.3 90 26.1 37 338 6.2 58 38 10 2
57 14.9 4.98 47.4 82.8 27.4 35.5 406 6.5 51 37 4 3
58 13.9 5.23 46.9 74.9 28.2 37.2 291 7.9 58 41 6 4
59 13.7 5.5 40.8 79.7 26.5 33.7 445 8.6 59 39 7 2

cxci
Mean 15.21 5.19 42.57 81 29.04 35.55 324.76 7.18 62.36 31.51 4.54 2.71
±SD 1.06 0.48 2.49 5.83 2.36 1.55 71.63 1.38 8.64 7.94 1.91 1.11
Maximum 17 6.75 47.4 94 35.1 38.3 461 11.5 85 50 10 6.0
Minimum 12.7 4.36 36.2 58.1 19.6 31.3 147 4.9 35 30 2.0 2.0

cxcii
Appendix 5.Complete blood picture for healthy female volunteers (n=50)
Sub.
ID Hb
(g/dL)
Total RBC
(10^6/µL)
Hct
(%)
MCV
(fL)
MCH
(pg)
MCH
C
(g/dL)
Platelet
Count
(10^3/µL)
Total
WBC
(10^3/µL)
Neutro
phils
(%)
Lympho
cytes
(%)
Monoc
ytes
(%)
Eosinophils
(%)
1 14.2 4.69 40.4 86.1 30.3 35.1 285 6.9 65 28 4 3
2 14.7 4.83 34.7 82.2 30.4 37 303 9.7 75 20 3 2
3 10.9 5.29 31.4 59.4 20.6 34.7 327 7.1 69 25 4 2
4 14.7 4.7 40.2 83.9 30.7 36.6 358 10.3 55 34 7 4
5 11.5 4.05 32.8 81 28.4 35.1 364 10.2 50 40 6 4
6 13.8 4.35 38.2 87.8 31.7 36.1 331 7.1 62 33 3 2
7 12.1 4.65 35.2 75.7 26 34.4 397 8.8 67 25 5 3
8 14.7 4.74 40.8 86.1 31 36 354 9.2 54 28 10 8
9 13.6 4.38 37.4 85.4 31.1 36.4 432 6.3 45 44 6 5
10 10.1 5.1 31.5 61.8 19.8 32.1 319 8 62 29 6 3
11 11 4.95 32.9 66.5 22.2 33.4 229 4.2 40 45 9 6
12 9.6 3.64 27.5 75.5 26.4 34.9 281 5 60 30 6 4
13 13.9 4.65 37.8 81.3 29.9 36.8 253 8.2 70 22 5 3
14 13.1 4.95 36.2 73.1 26.5 36.2 442 8 48 40 7 5
15 11.9 4.49 34.9 77.7 26.5 34.1 340 6.5 73 20 4 3
16 11.6 3.47 33.1 95.4 33.4 35 284 7.5 61 33 4 2
17 12 4.09 33.5 81.9 29.3 35.8 253 8 49 40 6 5
18 13.2 4.48 37 82.6 29.5 35.7 254 6.3 62 25 8 5
19 11 4.25 32.6 76.7 25.9 33.7 324 5.2 43 40 9 8
20 14 4.5 39 86.7 31.1 35.9 170 5.9 47 43 6 4
21 11.8 4.31 35.3 81.9 27.4 33.4 335 7.6 65 30 3 2
22 13 4.39 35.6 81.1 29.6 36.5 370 7 65 30 3 2
23 12.6 4.38 37.2 84.9 28.8 33.9 270 11.6 40 48 7 5
24 12.8 4.1 35.6 86.8 31.2 36 360 8 67 28 3 2
25 13.7 4.83 38.5 79.7 28.4 35.6 282 6.7 50 42 5 3
26 11.3 4.83 34.6 71.6 23.4 32.7 235 8.5 71 23 4 2
27 12.9 4.19 36.3 86.6 30.8 35.5 374 5.4 63 31 4 2

cxciii
28 12.8 4.59 36.1 78.6 27.9 35.5 285 6.8 62 32 4 2
29 14.4 4.76 40.2 85.2 31.3 34.2 403 10 63 28 5 4
30 14.1 4.48 36.8 81.3 29.4 34 427 9.8 65 24 4 3
31 11.5 5.4 39.2 79.4 24.6 34.7 438 7.4 66 25 5 3
32 13.2 4.99 38.2 85.9 30.7 36.8 264 8.9 55 31 8 5
33 11.5 4.64 40.8 81 28.7 35.7 231 9.5 56 40 7 3
34 13.9 4.75 38.4 88.8 31 36.9 297 6.9 62 34 4 3
35 12.5 4.85 35.5 79.9 26 34.8 454 8.3 68 26 6 2
36 13.8 4.59 36.9 87.3 30.5 36 332 4.9 57 29 10 7
37 13.6 4.47 37.5 87.7 31.1 35.9 419 5.5 55 41 7 4
38 12.3 4.39 39.8 81.8 29.8 32.4 329 8.2 65 30 5 4
39 11.3 4.28 35.2 86.5 23.9 33.4 381 8.4 60 40 8 5
40 11.1 4.35 36.9 79.5 26.4 34.5 353 6.9 60 31 7 5
41 13.9 4.15 34.1 83.3 30 33.1 342 7.7 69 24 6 4
42 13.3 4.11 35.5 83.1 26.8 32.6 440 8 58 38 6 4
43 12.4 4.39 37.8 87.7 26.5 34.7 384 6.1 71 27 5 4
44 11.9 4.78 38.6 95.4 31.4 35.1 353 5.4 64 35 5 3
45 12.4 4.21 39.5 84.9 29.3 35.8 354 6.8 59 40 7 4
46 13.5 4.93 38.3 84.6 28.5 35.9 224 7.6 63 27 9 4
47 11.9 4.73 37.6 79.7 26.9 34.9 270 7.1 53 40 8 8
48 14 4.59 37.5 86.7 31.1 33.9 235 10 57 39 7 3
49 12.1 4.79 38.6 82.9 27.4 34.4 470 8 61 32 4 3
50 13.2 4.66 39.5 84.1 29.8 35.5 370 6.3 63 33 4 3
Mean 12.69 4.54 36.57 81.89 28.39 34.99 331.62 7.55 59.8 32.44 5.76 3.78
±SD 1.24 0.37 2.76 6.79 2.94 1.26 70.22 1.59 8.38 7.08 1.90 1.59
Maximum 14.7 5.4 40.8 95.4 33.4 37 470 11.6 75 48 10 8.0
Minimum 9.6 3.47 27.5 59.4 19.8 32.1 170 4.2 40 20 3.0 2.0