Untitled - CVR API
108
-
Upload
khangminh22 -
Category
Documents
-
view
1 -
download
0
Transcript of Untitled - CVR API


›
COMPANY DETAILS
COMPANYZITON A/S
Bygholm Søpark 21E
8700 Horsens
Denmark
WEBSITEwww.ziton.eu
PRODUCTIONOTW A/S

TABLE OF CONTENTS
ABOUT ZITON
ZITON AT A GLANCE . . . . . . . . . . . . . . . . . . . . . . . . . . . . . . . . . . . . . . . . . . . . . . . . . . . . . . . . . . . . . . . . . . . . . . . . . . . . . . . . . . . . . . . 04
HIGHLIGHTS OF THE YEAR . . . . . . . . . . . . . . . . . . . . . . . . . . . . . . . . . . . . . . . . . . . . . . . . . . . . . . . . . . . . . . . . . . . . . . . . . . . . . . . . 06
VESSELS . . . . . . . . . . . . . . . . . . . . . . . . . . . . . . . . . . . . . . . . . . . . . . . . . . . . . . . . . . . . . . . . . . . . . . . . . . . . . . . . . . . . . . . . . . . . . . . . . . . . 08
MANAGEMENT AND BOARD . . . . . . . . . . . . . . . . . . . . . . . . . . . . . . . . . . . . . . . . . . . . . . . . . . . . . . . . . . . . . . . . . . . . . . . . . . . . . . 11
CORPORATE STRUCTURE . . . . . . . . . . . . . . . . . . . . . . . . . . . . . . . . . . . . . . . . . . . . . . . . . . . . . . . . . . . . . . . . . . . . . . . . . . . . . . . . . . 14
HISTORY OF THE COMPANY . . . . . . . . . . . . . . . . . . . . . . . . . . . . . . . . . . . . . . . . . . . . . . . . . . . . . . . . . . . . . . . . . . . . . . . . . . . . . . . 16
THE OFFSHORE WIND INDUSTRY AND O&M SERVICES
MARKET DEVELOPMENT OF OFFSHORE WIND . . . . . . . . . . . . . . . . . . . . . . . . . . . . . . . . . . . . . . . . . . . . . . . . . . . . . . . . . . . 18
OFFSHORE WIND FARMS . . . . . . . . . . . . . . . . . . . . . . . . . . . . . . . . . . . . . . . . . . . . . . . . . . . . . . . . . . . . . . . . . . . . . . . . . . . . . . . . . . 24
ZITON’S SERVICE OFFERING . . . . . . . . . . . . . . . . . . . . . . . . . . . . . . . . . . . . . . . . . . . . . . . . . . . . . . . . . . . . . . . . . . . . . . . . . . . . . . . 26
O&M SETUP FOR OFFSHORE WIND FARMS . . . . . . . . . . . . . . . . . . . . . . . . . . . . . . . . . . . . . . . . . . . . . . . . . . . . . . . . . . . . . . . 28
DIGITAL TRANSFORMATION . . . . . . . . . . . . . . . . . . . . . . . . . . . . . . . . . . . . . . . . . . . . . . . . . . . . . . . . . . . . . . . . . . . . . . . . . . . . . . 30
CORPORATE SOCIAL RESPONSIBILITY . . . . . . . . . . . . . . . . . . . . . . . . . . . . . . . . . . . . . . . . . . . . . . . . . . . . . . . . . . . . . . . . . . . . 32
STR ATEGIC DIRECTION
VISION AND MISSION . . . . . . . . . . . . . . . . . . . . . . . . . . . . . . . . . . . . . . . . . . . . . . . . . . . . . . . . . . . . . . . . . . . . . . . . . . . . . . . . . . . . . . 36
STRATEGIC DIRECTION . . . . . . . . . . . . . . . . . . . . . . . . . . . . . . . . . . . . . . . . . . . . . . . . . . . . . . . . . . . . . . . . . . . . . . . . . . . . . . . . . . . . . 38
BUSINESS MODEL . . . . . . . . . . . . . . . . . . . . . . . . . . . . . . . . . . . . . . . . . . . . . . . . . . . . . . . . . . . . . . . . . . . . . . . . . . . . . . . . . . . . . . . . . . 40
RISK MANAGEMENT . . . . . . . . . . . . . . . . . . . . . . . . . . . . . . . . . . . . . . . . . . . . . . . . . . . . . . . . . . . . . . . . . . . . . . . . . . . . . . . . . . . . . . . 42
BUSINESS PERFORMANCE
ALTERNATIVE PERFORMANCE MEASURES . . . . . . . . . . . . . . . . . . . . . . . . . . . . . . . . . . . . . . . . . . . . . . . . . . . . . . . . . . . . . . . . 44
HOW WE MEASURE PERFORMANCE . . . . . . . . . . . . . . . . . . . . . . . . . . . . . . . . . . . . . . . . . . . . . . . . . . . . . . . . . . . . . . . . . . . . . . . 46
2018 PERFORMANCE REVIEW . . . . . . . . . . . . . . . . . . . . . . . . . . . . . . . . . . . . . . . . . . . . . . . . . . . . . . . . . . . . . . . . . . . . . . . . . . . . . 48
OUTLOOK FOR 2019 . . . . . . . . . . . . . . . . . . . . . . . . . . . . . . . . . . . . . . . . . . . . . . . . . . . . . . . . . . . . . . . . . . . . . . . . . . . . . . . . . . . . . . . 50
CAPITAL STRUCTURE . . . . . . . . . . . . . . . . . . . . . . . . . . . . . . . . . . . . . . . . . . . . . . . . . . . . . . . . . . . . . . . . . . . . . . . . . . . . . . . . . . . . . . 52
KEY FIGURES . . . . . . . . . . . . . . . . . . . . . . . . . . . . . . . . . . . . . . . . . . . . . . . . . . . . . . . . . . . . . . . . . . . . . . . . . . . . . . . . . . . . . . . . . . . . . . . 55
FINANCIAL STATEMENTS AND FINANCIAL REVIEW
STATEMENT BY THE BOARD OF DIRECTORS AND EXECUTIVE MANAGEMENT . . . . . . . . . . . . . . . . . . . . . . . . . . 56
INDEPENDENT AUDITOR’S REPORT . . . . . . . . . . . . . . . . . . . . . . . . . . . . . . . . . . . . . . . . . . . . . . . . . . . . . . . . . . . . . . . . . . . . . . . 57
FINANCIAL REVIEW AND STATEMENTS . . . . . . . . . . . . . . . . . . . . . . . . . . . . . . . . . . . . . . . . . . . . . . . . . . . . . . . . . . . . . . . . . . . 59
NOTES TO THE FINANCIAL STATEMENTS . . . . . . . . . . . . . . . . . . . . . . . . . . . . . . . . . . . . . . . . . . . . . . . . . . . . . . . . . . . . . . . . . . 67
PARENT COMPANY FINANCIAL STATEMENTS . . . . . . . . . . . . . . . . . . . . . . . . . . . . . . . . . . . . . . . . . . . . . . . . . . . . . . . . . . . . 95
ZITON · Annual Report 2018 03
TABLE OF CONTENTS

ZITON
AT A GLANCE
ZITON’s business arises from owning and operating jack-up
vessels designed to carry out O&M services on turbines at
offshore wind farms. In recent years, the business model has
evolved to include full-service and turnkey solutions.
ZITON provides full-service solutions with maritime project
planning & execution, lift planning & execution, specialised tools
& lifting equipment and technicians in addition to jack-ups with
experienced crews. Full-service solutions are provided for major
component replacements, including gearboxes, blades, genera-
tors, transformers, main bearings, main shafts, etc.
ZITON also offers turnkey solutions for blade campaigns. In
addition to full-service solutions, this also includes blade repair
and upgrades as well as facilities that meet the requirements for
temperature, humidity, etc.
ZITON also offers turnkey solutions for decommissioning. In
addition to a full-service solution, this also includes cutting, recy-
cling of waste materials, seabed inspection, etc.
Our customers are leading wind turbine manufacturers and
wind farm owners.
ZITON owns and operates three jack-ups:
• J/U WIND SERVER is the first jack-up vessel purpose built to
provide offshore wind operations & maintenance services
• J/U WIND PIONEER is a converted jack-up vessel adapted to
the offshore wind industry
• J/U WIND has the longest proven track-record in the industry
in terms of major component replacements
ZITON has about 75 employees offshore, and about 30 onshore
at the head office in Horsens, Denmark and subsidiaries in Ger-
many, UK and China.
ZITON is the market-leading service provider within offshore wind operations & maintenance. ZITON has carried out more than 800 service interventions at 47 wind farms across 7 countries.
SURVEY AND DEVELOPMENT(typically 2-5 years)
CONSTRUCTION(around 2 years)
O&M(20-25 years)
DECOMMISSIONING(1-2 years)
Environ mental survey
FOUR MAIN PHASES OF AN OFFSHORE WIND FARMOrange shading indicates services provided by ZITON.
Geophysical survey
Geotechnical survey
Installation of met mast
Turbine foundationinstallation
Substation and cable
installation
Turbine installation
Installation support
Remote monitoring
Major component
replacement
O&M routines
Blade repair
Turbinefoundation
decommissioning
Met mast decom
missioning
Turbine decom
missioning
Substation decom
missioning
SER
VIC
ES
ZITON · Annual Report 201804
›
ABOUT ZITON

ZITON provides jack-up services for replacement of the major components shown in the illustration.
GENERATOR
GEARBOX
MAIN SHAFT
MAIN BEARING
FULL ROTOR
TRANSFORMER
BLADE
ABOUT ZITON
05ZITON · Annual Report 2018

Q&A
HIGHLIGHTS OF THE YEAR
Q: How is the market for offshore wind
operations & maintenance services devel-
oping?
A: During the last couple of years, we’ve
heard a lot of talk and rumours in the
industry about wear and tear on blades,
especially about erosion issues on the lead-
ing edge of the blades. It is obvious that the
offshore environment of rain, hail and salt
water is very tough on the blades as they
reach tip speeds in excess of 300 km/h.
2018 was a breakthrough year for us
with Siemens Gamesa Renewable Energy
deciding to upgrade 88 blades at the
Anholt wind farm. A total of 141 blades
were replaced in 2018, compared to 158
replacements of other major components.
In other words, blades nearly doubled our
addressable market.
It seems likely that blade repair will
continue to be a large market for many
years to come. We continue to allocate
many resources to developing solutions
that fit the requirements of our customers.
We have been selected as preferred
supplier for a blade campaign at West of
Duddon Sands to repair 108 turbines for
an expected duration of 12 months. We
will provide a full turnkey solution includ-
ing jack-up, lifting equipment, lift planning,
technicians and onshore blade repair
facilities.
ZITON CEO Thorsten Jalk comments on the performance of 2018 and the outlook for the coming year.
SERVICE OFFERING A jack-up with a crane Develop value-added servicesTurnkey solutions, including for blade repair and decommissioning
VESSEL FLEET Three vessels Three vesselsAcquire fourth vessel for 6+ MW turbines
GEOGRAPHY Europe Europe Geographical expansion
DIGITALISATION Connectivity with customersAutomation of processes and data-driven decision making
Further leverage machine learning
CO
MPA
NY
SIZ
E
20
16
20
12
20
19
20
22
BUILD THE FOUNDATION
OFFER FULL-SERVICE SOLUTIONS
SCALE THE BUSINESS
THREE PERIODS WITH DIFFERENT STRATEGIC FOCUS
ZITON · Annual Report 201806
›
ABOUT ZITON

Q: What steps have you taken to imple-
ment your strategy?
A: The West of Duddon Sands blade cam-
paign is the culmination of ZITON’s stra-
tegic direction launched two years ago to
provide value-added services and estab-
lish ZITON Contractors. It shows that
customers appreciate that we take more
responsibility in the value chain. With
turnkey solutions we also take on more
risk. However, we are clearly the market
leader, backed by experience from more
than 800 interventions. Consequently,
we believe we are best positioned in the
value chain to manage risks of a turnkey
solution.
A key element of our strategy remains
to continue to grow together with our
customers as turbines become larger. As
turbines become larger and larger, we
will need larger vessels to service them.
One of the discussions we had during our
strategy process was how large a vessel
we would need and by when. You don’t
want to be too early, nor too late when
defining the vessel size to match the mar-
ket requirements.
We are in the process of expanding
geographically and are opening offices in
Beijing (China), Hamburg (Germany) and
London (UK).
Furthermore, we will continue to
transform our business through digitalisa-
tion. We elaborate on our digital transfor-
mation elsewhere in this report.
Q: How do you see the outlook for 2019?
A: From my perspective the market is in
a very interesting phase, right now. The
wear and tear on blades, and the increas-
ing urgency to repair or exchange the
blades has almost doubled the market size
of major component replacements. We
see a very strong market for the coming
years, and we are keen to take our share.
We’re beginning 2019 with satisfac-
tory contract coverage. If the blade
campaign at West of Duddon Sands is
signed and initiated shortly after expiry
of the J/U WIND SERVER time charter, it
will ensure good utilisation of J/U WIND
SERVER in 2019 and into 2020. We have
framework agreements securing satis-
factory utilisation of J/U WIND and J/U
WIND PIONEER during the year.
Thorsten Jalk, CEO, ZITON.
ZITON · Annual Report 2018 07
ABOUT ZITON
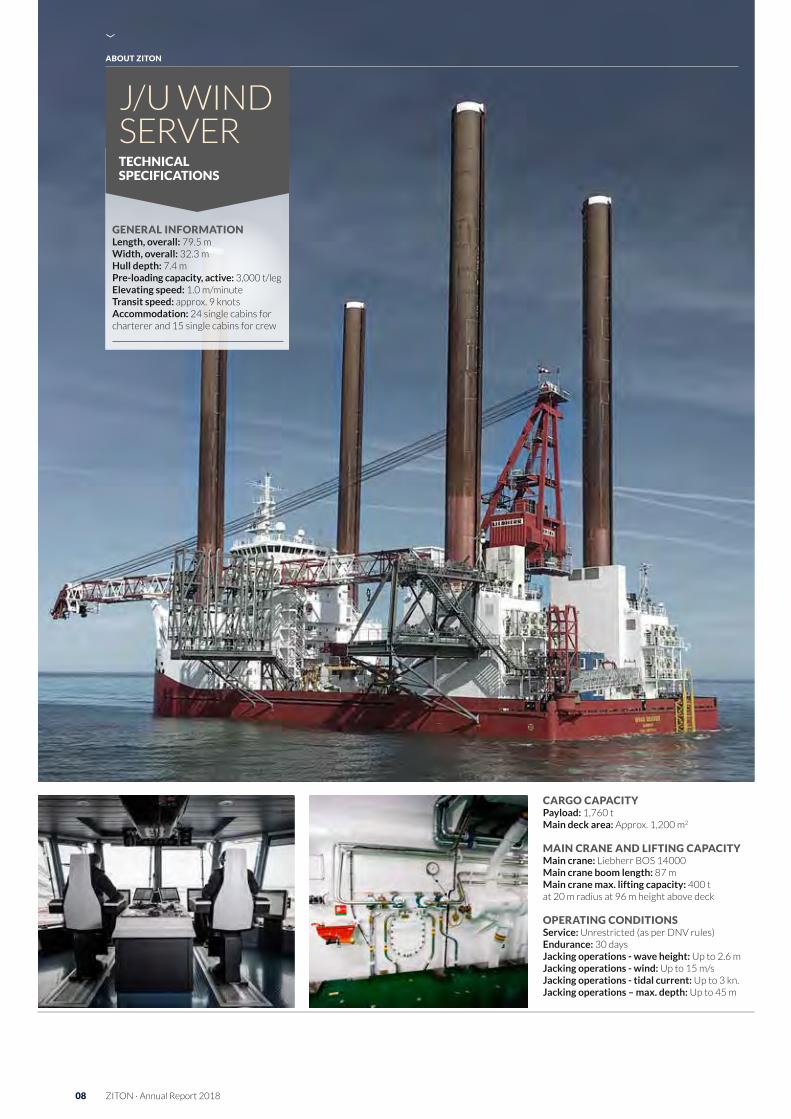
CARGO CAPACITYPayload: 1,760 tMain deck area: Approx. 1,200 m2
MAIN CRANE AND LIFTING CAPACITYMain crane: Liebherr BOS 14000Main crane boom length: 87 mMain crane max. lifting capacity: 400 t at 20 m radius at 96 m height above deck
OPERATING CONDITIONSService: Unrestricted (as per DNV rules) Endurance: 30 daysJacking operations wave height: Up to 2.6 mJacking operations wind: Up to 15 m/sJacking operations tidal current: Up to 3 kn.Jacking operations – max. depth: Up to 45 m
›
ABOUT ZITON
GENERAL INFORMATIONLength, overall: 79.5 mWidth, overall: 32.3 mHull depth: 7.4 m Preloading capacity, active: 3,000 t/legElevating speed: 1.0 m/minuteTransit speed: approx. 9 knotsAccommodation: 24 single cabins for charterer and 15 single cabins for crew
J/U WIND SERVER TECHNICAL SPECIFICATIONS
ZITON · Annual Report 201808

›
CARGO CAPACITYPayload: 650 tMain deck area: Approx. 530 m2
MAIN CRANE AND LIFTING CAPACITYMain crane: Liebherr BOS 7500Main crane boom length: 78 m Main crane max. lifting capacity: 150 t at 19 m radius at 78 m height above deck
OPERATING CONDITIONSService: Unrestricted (as per DNV rules) Endurance: 30 daysJacking operations wave height: Up to 1.35 mJacking operations wind: Up to 15 m/sJacking operations tidal current: Up to 2.5 kn.Jacking operations – max. depth: Up to 34 m
GENERAL INFORMATIONLength, overall: 56.0 mWidth, overall: 28.0 mHull depth: 4.5 mPreloading capacity, active: 1,200 t/legElevating speed: 0.5 m/minuteTransit speed: 5 knots (towed)Accommodation: 22 single cabins for charterer and 12 single cabins for crew
J/U WIND PIONEER TECHNICAL SPECIFICATIONS
ZITON · Annual Report 2018 09
ABOUT ZITON

CARGO CAPACITYPayload: 220 tMain deck area: Approx. 430 m2
MAIN CRANE AND LIFTING CAPACITYMain crane: Liebherr LTR 11200Main crane boom length: 28-110 m (telescopic)Main crane max. lifting capacity: 40 tons at 20 m radius at 100 m height above deck
OPERATING CONDITIONSService: Weather restricted, site specific Endurance: 30 daysJacking operations wave height: Up to 0.75 mJacking operations wind: Up to 10 m/sJacking operations tidal current: Up to 1 kn.Jacking operations – max. depth: Up to 35 m
J/U WIND TECHNICAL SPECIFICATIONS
GENERAL INFORMATIONLength, overall: 55.1 mWidth, overall: 18.1 mHull depth: 4.0 mPreloading capacity, active: 600 t/leg Elevating speed: 0.7 m/minuteTransit speed: 6 knotsAccommodation: 20 single cabins for charterer and 11 single cabins for crew
ZITON · Annual Report 201810
›
ABOUT ZITON

MANAGEMENT AND BOARD
RESPONSIBILITIES OF THE BOARDPursuant to Danish legislation, ZITON has a two-tier manage-
ment structure consisting of the Board of Directors and the
Executive Management Team, with no individual being a member
of both. The division of responsibilities between the Board of
Directors and the Executive Management Team is outlined in the
Rules of Procedure for the Board of Directors.
In 2018, the Board of Directors held a total of five board
meetings. The Board of Directors has established an audit com-
mittee consisting of the entire Board of Directors. The Audit
Committee held two meetings in 2018. The annual cycle of board
meetings, illustrated below, ensures that the Board regularly
reviews all topics relating to strategic development, risk manage-
ment, operational and financial performance and compliance.
RESPONSIBILITIES OF THE AUDIT COMMITTEEThe Board of Directors has the overall responsibility for ZITON’s
control environment. The Audit Committee is responsible for
monitoring on an ongoing basis the internal control and risk man-
agement systems related to the financial reporting process. The
Board of Directors approves the overall policies and procedures
in key areas of financial reporting. ZITON has implemented for-
malised processes for its internal and external financial reporting.
DIVERSITY IN MANAGEMENT This section covers the statutory requirements for reporting on
gender composition of management in accordance with section
99 b of the Financial Statements Act.
ZITON’s Articles of Association require the Board of Direc-
tors to have from three to six members elected by the share-
holders at an annual general meeting. Currently, the Board has
six members, all elected for terms of one year. ZITON aims to
employ the best candidates, and a candidate’s qualifications must
therefore always be the decisive factor in external and internal
recruitment processes. Nominations for the Board of Direc-
tors are based on an evaluation of factors such as competences,
diversity, independence and prior performance.
ZITON recognises the value of diversity, including gender-
related diversity. The Board of Directors has set targets for the
representation of the underrepresented gender on the Board
of Directors and has drawn up a policy for increasing the repre-
sentation of the underrepresented gender at other management
levels. The target is for an increase from 0% (0 out of 6) to 33%
(2 out of 6). The measurement period runs from the annual gen-
eral meeting held in April 2017 to the annual general meeting to
be held in April 2020. The efforts to identify and nominate a suit-
able candidate of the underrepresented gender for the Board
of Directors for the annual general meeting in April 2018 were
unsuccessful. Consequently, no progress has been achieved
towards this target.
It is our ambition at ZITON to increase diversity at all man-
agement levels by providing equal opportunities for men and
women. ZITON sets targets for gender diversity at all manage-
ment levels and seeks to have both genders represented as can-
didates in all recruitment processes. ZITON has had relatively
little success in increasing the proportion of women at manage-
ment levels. We believe this is due to the general employment
patterns in the offshore wind and shipping industries, where men
are generally overrepresented.
2016 2017 2018
Diversity at Officer level(Officers of underrepresented gender to total officers) 0 of 48 0 of 52 0 of 53
Diversity at management level(Managers of underrepresented gender to total managers) 0 of 5 0 of 5 0 of 5
ZITON’s governance structure aims to support the Company’s strategic development and long-term value creation.
Ordinary board meeting
Monthly reporting
Audit Committee
Rolling forecasting/budget
Risk management
Stategic Direction
FEBRUA
RY
JANUARY
MA
RC
HA
PR
IL
OC
TO
BE
RS
EP
TE
MB
ER
NO
VEM
BER
DECEMBER
JUNEJULY
AU
G
UST M
AY
ZITON · Annual Report 2018 11
ABOUT ZITON

THORSTEN JALKChief Executive OfficerAppointed CEO in 2011Born 1967
Mr Jalk has 20 years of experience from the offshore wind industry and held numerous high-level positions prior to being appointed CEO of ZITON A/S.Previous engagements: Mr Jalk has experience from being an owner and senior consultant with WayPoint Consult ApS in Denmark. During the period from 2000 to 2011, Mr Jalk worked for A2SEA A/S where he held the following positions: head
of Service Solutions, director of Marine Operations and logistics manager. Mr Jalk served in the Danish armed forces from 1987 to 2000.Educational background: Master of Transport and Maritime Management (MTMM) from the University of Southern Denmark, 2010. In addition, Mr Jalk has completed the Executive Management Programme at INSEAD, 2016.
JENS MICHAEL HAURUMChief Financial OfficerAppointed CFO in April 2015Born 1966
Previous engagements: Mr Haurum was CFO with Borg Automotive A/S and head of group finance and investor relations with BioMar Group A/S and has also held various positions in the financial services industry.Educational background: Mr Haurum holds an HD Graduate Diploma in Business
Administration (Accounting) from Aarhus University, an HD Graduate Diploma in Business Administration (International Management) from Copenhagen Business School and a Master of Business Administration from Henley Business School in the UK.
RASMUS MÜHLEBACHChief Legal OfficerAppointed CLO in April 2015Born 1980
Mr. Mühlebach joined ZITON in June 2012 as Chief Financial Officer and was appointed Chief Legal Officer in April 2015.Previous engagements: Prior to joining ZITON, Mr Mühlebach held positions as CFO and business developer with NordEstate A/S.
Educational background: Mr Mühlebach graduated in 2007 with a Master of Science in Business Administration and Commercial Law and a Bachelor of Science in Economics and Corporate Law from the Aarhus School of Business (Aarhus University).
BENT THAMBO JENSENChief Commercial OfficerAppointed CCO in September 2015Born 1972
Previous engagements: Prior to joining ZITON, Mr Jensen held positions as a key account manager with A2SEA A/S, sales and marketing manager with Statoil Gazelle A/S, commercial sales manager at Siemens
Wind Power A/S and as regional manager with Energi Danmark A/S.Educational background: MA in Business, Language and Culture (cand. negot) from Odense University.
MADS ALBÉRChief Operating OfficerAppointed COO in April 2015Born 1970
Previous engagements: Prior to joining ZITON, Mr Albér worked as an operations manager with Fred. Olsen Windcarrier. He worked for ZITON from 2008 to 2011 as Master Mariner (2009-2011) and HSEQ manager (2008-2009). Before joining ZITON, Mr Albér held positions
as SQE manager (2008) and marine superintendent (2006-2008) with the Clipper Group.Educational background: Mr Albér is a Master Mariner and holds a degree in navigation from Marstal Navigationsskole.
EXECUTIVE MANAGEMENT TEAM
ZITON · Annual Report 201812
›
ABOUT ZITON

VAGN LEHD MØLLERChairman of the board since March 2012Born 1946Appointed by BWB Partners
Current engagements: Mr Møller is Chairman of the Board of Directors of ZITON A/S. He is also a member of the boards of directors of Jack-Up InvestCo 3 Plc and Costamare Inc.Previous engagements: Mr Møller has worked his entire career in different positions with A.P. Møller-Maersk. He has
also held numerous positions as chairman or member of the boards of directors of a number of A.P. Møller-Maersk affiliated companies.Educational background: Studies within Management at CEDEP (European Center for Executive Development), INSEAD and the University of Western Ontario.
ESBEN BAY JØRGENSENMember of the board since January 2012Born 1969Appointed by BWB Partners
Current engagements: Mr Jørgensen is a founder and partner of BWB Partners. He serves as a member of the boards of directors of Hydratech Industries A/S, Logos Design A/S, Nordic Petrol Systems A/S, SH Group A/S, System Frugt A/S and Qubiqa Holding A/S.Previous engagements: Prior to founding BWB Partners in 2005, Mr Jørgensen
worked with the consultancy firm AlixPartners. Before that, Mr Jørgensen spent some eight years with the Boston Consulting Group.Educational background: Master of Science in Economics and Business Administration from Copenhagen Business School, McGill University, Montreal, and Università degli Studi di Siena, Italy.
LARS THORSGAARD JENSENMember of the board since January 2012Born 1974Appointed by BWB Partners
Current engagements: Mr Jensen is a partner at BWB Partners. He serves as a member of the boards of directors of Heatex AB and SSG Group A/S.Previous engagements: Mr Jensen has a background in investment banking. He previously worked for six years as a
director with Carnegie Investment Banking in Copenhagen and for two years with Morgan Stanley Investment Banking in London.Educational background: Master of Science in Management & Economics (cand. oecon) from Aarhus University.
OVE C . ERIKSENMember of the board since January 2008Born 1960Appointed by Dansk Bjergning og Bugsering Holding ApS
Current engagements: Mr Eriksen serves as a director of Dansk Bjergning og Bugsering A/S. Previous engagements: Founded Dansk Bjergning og Bugsering A/S in 1987. Founded DBB Jack-Up Services A/S in 2008.
Educational background: Electrician.
MORTEN MELINMember of the board since April 2017Born 1968Appointed by BWB Partners
Current engagements: Mr Melin serves as Executive Vice President, Construction of Northland Power Inc. Previous engagements: Mr Melin has held a number of positions with both wind turbine manufacturers and utilities. Most recently, he served as Vice President EPC & Construction Management with Ørsted and as a member of the board of A2SEA
A/S. Previously served as Vice President Project & Technology at MHI Vestas Offshore.Educational background: BSc. Mechanical Engineering from Aarhus Teknikum. Advanced Corporate Finance Programme from London Business School and Executive Leadership Development from INSEAD
NIELS ØRSKOV CHRISTENSENMember of the board since December 2016Born 1943Appointed by OY Finans ApS
Current engagements: Mr Ørskov Christensen serves as a chairman of the board of directors of Ann Birgitte og Niels Ørskov Christensens Familiefond, Orskov Yard A/S and OY Finans ApS.Previous engagements: Mr Ørskov Christensen has worked his entire career in the shipyard industry, both as a naval
architect and as a CEO. He is a former chairman of the Danish Shipyard Industry Association (Skibsværftsforeningen – now Danske Maritime), a position he held for several years while also serving on the board of representatives of Danish Ship Finance (Danmarks Skibskreditfond).Educational Background: Naval architect.
BOARD OF DIRECTORS
ZITON · Annual Report 2018 13
ABOUT ZITON

CORPORATE
STRUCTURE
LEGAL STRUCTUREZITON Group consists of the parent company ZITON A/S and
six subsidiaries, including Jack-Up InvestCo 2 A/S and ZITON
Contractors A/S in Denmark, and Jack-Up InvestCo 3 Plc. in
Malta. Recently, ZITON expanded geographically, establishing
the subsidiaries ZITON GmbH in Germany, ZITON Ltd. in the UK
and Ziton Offshore Wind Science & Technology (Beijing) Limited
in China. All subsidiaries are wholly owned.
J/U WIND is owned by ZITON A/S, J/U WIND PIONEER is
owned by Jack-Up InvestCo 2 A/S, and J/U WIND SERVER is
owned by Jack-Up InvestCo 3 Plc.
JACK-UP HOLDING A/S - BWB PARTNERSBWB Partners is an independent owner-led Danish investment
firm investing in small and medium-sized companies with a turno-
ver of up to EUR 100 million and a strong growth potential.
BWB Partners manages two funds, investing on behalf of
Danish and international investors. Both are active funds and
open for new investment opportunities. BWB Partners I has a
committed capital of EUR 175 million, while BWB Partners II has
committed capital of EUR 130 million. ZITON is an investment
held in BWB Partners II.
The investor base at BWB Partners includes Danish and
international institutional investors and dedicated private-equity
investors (fund-of-funds). BWB Partners II consists of Danish
pension funds (15.1%), foreign financial investors (83.7%) and
other foreign investors (1.2%).
BWB Partners takes an active ownership approach in respect
of its portfolio companies. The aim is to drive each company
towards becoming an attractive medium-sized business with a
strong market position and healthy earnings. As achieving such
transformation of a company can be a major task, the investment
horizon is usually four to seven years.
BWB Partners is a member of the DVCA trade association and
follows DVCA guidelines on corporate governance and recommen-
dations on responsible ownership. Consequently, ZITON is also
subject to the DVCA’s corporate governance guidelines. For fur-
ther information, please visit the DVCA website at www.dvca.dk.
DANSK BJERGNING OG BUGSERING HOLDING APSIn addition to its shareholding in ZITON A/S, the company owns
Dansk Bjergning og Bugsering A/S, an ROV operations company.
OY FINANS APSOY Finans ApS is part of the Orskov Group, which owns and
operates Orskov Yard in Frederikshavn, Denmark, where the
conversion of J/U WIND PIONEER took place. The yard employs
200 people and comprises three docks.
JACK-UP HOLDING A/S(BWB Partners)
JACK-UP INVESTCO 3 PIC .
(Malta)
JACK-UP INVESTCO 2 A/S
(Denmark)
ZITON CONTRACTORS A/S
(Denmark)
ZITON GMBH .(Germany)
ZITON LTD .(UK)
ZITON OFFSHORE WIND SCIENCE &
TECHNOLOGY (BEIJING) LIMITED*
(China)
DANSKE BJERGNING OG BUGSERING HOLDING APS
(Ove Eriksen)
OY FINANS APS(Orskov Yard)
MANAGEMENT/CHAIRMAN
ZITON A/S
59 .5 % 25 .1 % 14 .8 % 0 .6 %
The ownership structure and legal structure of the ZITON Group are set out below
* Company under foundation
ZITON · Annual Report 201814
›
ABOUT ZITON

47wind farms
FROM THE BALTICTO THE IRISH SEA.
DEEP TO SHALLOW – ANY SEABED
7countries
PROVIDING OFFSHORE SERVICES ALL OVER EUROPE
800turbines serviced
TURBINES, BLADES,GEAR BOXES, GENERATORSTRANSFORMERS, SHAFTS,
BEARINGS
ABOUT ZITON
15ZITON · Annual Report 2018

Dansk Bjergning og Bugsering A/S was
founded in 1989 by Ove Eriksen. In 2007,
that company acquired the vessel J/U
WIND, and in 2008 the jack-up opera-
tions were carved out into a separate
company, which had J/U WIND as part of
its assets.
BWB Partners invested in the Com-
pany in 2012, appointing Thorsten Jalk as
CEO. The company has since accelerated
both commercially and through the acqui-
sition of another two vessels, J/U WIND
PIONEER and J/U WIND SERVER.
HISTORY
OF THE COMPANY
ZITON has its roots in the offshore wind industry dating back to 2007 when the vessel J/U WIND was acquired. ZITON has some of the most experienced employees in the world within offshore wind.
Fresh equity and issuance of
EUR 40 million bond
3year charter signed for J/U WIND SERVER with
Siemens Wind Power
1year framework agreement with
MHI Vestas
Issuance of EUR 100 million bond
J/U WIND SERVER operational in March
2015 and J/U WIND PIONEER in
September 2015
2year extension of agreement with
MHI Vestas
DBB JackUp Services A/S changed its name to
ZITON A/S
J/U WIND SERVER initiated 3year charter with Siemens Gamesa
Renewable Energy
Framework agreement with Ørsted with
duration to March 2019
3year framework agreement with
Vattenfall
BWB Partners invested in ZITON
Joint venture with BWC to finance
J/U WIND SERVER
J/U WIND PIONEER acquired, and
J/U WIND SERVER ordered from Nordic Yards
2014 2012
20162015
ZITON · Annual Report 201816
›
ABOUT ZITON
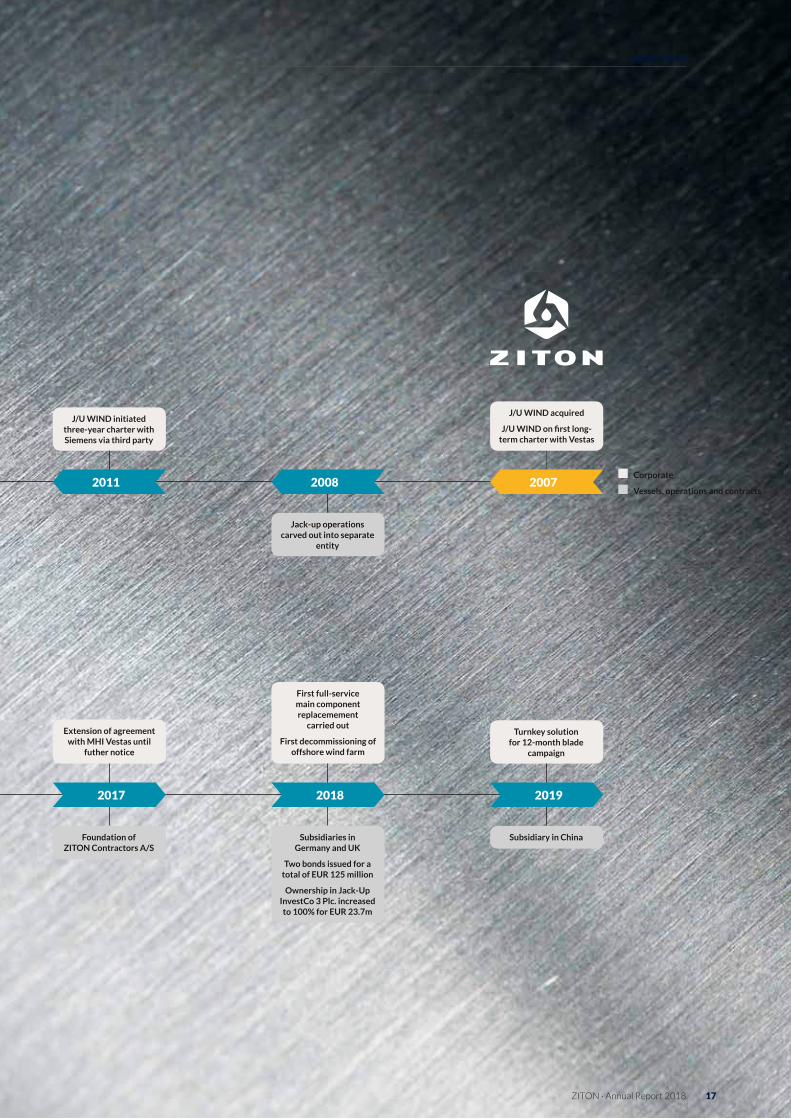
J/U WIND initiated threeyear charter with Siemens via third party
J/U WIND acquired
J/U WIND on first long-term charter with Vestas
Subsidiaries in Germany and UK
Two bonds issued for a total of EUR 125 million
Ownership in JackUp InvestCo 3 Plc. increased to 100% for EUR 23.7m
First fullservice main component replacemement
carried out
First decommissioning of offshore wind farm
Foundation of ZITON Contractors A/S
Extension of agreement with MHI Vestas until
futher notice
Subsidiary in China
Turnkey solution for 12month blade
campaign
Jackup operations carved out into separate
entity
2011 2008 2007
20182017 2019
Corporate
Vessels, operations and contracts
ZITON · Annual Report 2018 17
ABOUT ZITON

MARKET DEVELOPMENT OF
OFFSHORE WINDThe market for offshore wind services has developed strongly in 2018 with repair and upgrade of blades expanding the market.
GLOBALISATION OF OFFSHORE WINDThe world’s first offshore wind farm, Vindeby, had a total capac-
ity of 4.95 MW and was inaugurated off the coast of Denmark in
1991. It was to stay in operation for more than ten years until the
first large wind farm (more than 100 MW capacity), Horns Rev
1 (total capacity 160 MW), was established in Denmark in 2002.
Since then, offshore wind has steadily expanded because wind
speeds are higher and more consistent at sea than on land. At
the end of 2018, there were 4,425 turbines installed at 85 wind
farms in Europe, mainly in the Irish Sea, the English Channel, the
Baltic Sea and the North Sea.
For many years, offshore wind remained mainly a European
phenomenon accounting for more than nine out of ten offshore
wind turbines installed. In recent years, globalisation of offshore
wind has increased, and in 2018 China accounted for 20 per cent
of the 23 MW global capacity, according to Global Wind Energy
Council. In both China and the USA many of the big cities with
large populations are located in coastal areas. Building offshore
wind farms in these areas can help address their energy needs
from nearby sources. Over the next decade, offshore wind is
expected to accelerate in countries like China, the USA, Taiwan,
South Korea and Japan.
Source: Global Wind Energy Council, Annual Market update 2018
Offshore wind Global installed capacity (MW)
Europe
China
Asia excl. China
US
0
2,500
5,000
7,500
10,000
12,500
15,000
17,500
20,000
201820172016201520142013201220112010
ZITON · Annual Report 201818
›
THE OFFSHORE WIND INDUSTRY AND O&M SERVICES

Source: Eurostat and EU Renewable Energy Directive, December 2018
Expected growth in the number of turbines installed in EuropeTurbines grid connected, end of period
0
1,000
2,000
3,000
4,000
5,000
6,000
7,000
8,000
20232022202120202019201820172016201520142013201220112010
United Kingdom
Germany
Netherlands
Denmark
Belgium
France
Ireland
Sweden
Finland
OFFSHORE WIND IN EUROPEGrowth in offshore wind capacity in Europe is driven primarily
by EU-level targets to reduce greenhouse gas emissions. The EU
Renewable Energy Directive stipulates that renewable energy
should account for 20 per cent of the EU’s total energy con-
sumption by 2020 and for 32 per cent by 2030; this compares
to 9 per cent in 2005. Offshore wind energy plays an important
role in meeting these targets and is expected to account for
approximately 11 per cent of total EU renewable energy by
2020, according to European Environment Agency. The UK
government has recently completed at sector deal with the UK
offshore wind industry with the ambition that offshore wind will
power more than 30% of British electricity by 2030. The growth
is supported by lower subsidies that, according to the govern-
ment, have fallen by over 50% in the past two years. Due to their
increased scale, the new targets are expected to make offshore
wind projects cheaper to build than fossil fuels plants by 2020.
The sector deal provides a target capacity of 30 GW by 2030,
up from 8.2 GW today, an increase equivalent to today’s global
market.
The number of offshore wind turbines is expected to continue
to grow by 10% per annum over the next five years. In 2023, the
installed base will number more than 7,000 turbines - a 59 per
cent increase over 2018. Growth will continue to be spurred by
the UK and German markets.
The UK remains the dominant nation within the European
offshore wind industry. At the end of 2018, the UK accounted
for 1,925 turbines, or 44 per cent of the total installed base. Ger-
many is the second-largest player with 1,349 turbines (31 per
cent). Other notable countries are Denmark, the Netherlands
and Belgium, which combined have 1,060 installed turbines (24
per cent).
A few companies control a significant share of the installed
capacity of wind farms in Europe. Ørsted maintains the position
as the largest offshore wind farm operator (WFO), operating
30 per cent of Europe’s installed base at the end of 2018. Other
major European WFOs include E.On, Vattenfall and Innogy, oper-
ating 12, 11 and 7 per cent respectively of the installed turbine
base. The remaining capacity is relatively fragmented among
several operators.
Manufacturing of offshore turbines in Europe has tradition-
ally been the domain of two OEMs, Siemens Gamesa Renewable
Energy and MHI Vestas Offshore Wind.
EU Renewable Energy targets EU-28 Renewable Energy share of energy consumption (per cent)
Historical Renewable Energy Share Renewable Energy Share target
0
5
10
15
20
25
30
35
20302028202620242022202020182016201420122010200820062004
Source: ZITON data
ZITON · Annual Report 2018 19
THE OFFSHORE WIND INDUSTRY AND O&M SERVICES

Country distributionTurbines installed in Europe, end 2018
Source: ZITON data
0 500 1,000 1,500 2,000 2,500
Ireland
Finland
Sweden
Belgium
Netherlands
Denmark
Germany
United Kingdom 1,925 (44%)
1,349 (30%)
498 (11%)
289 (7%)
273 (6%)
64 (1%)
20 (0%)
7 (0%)
Turbine model distributionTurbines installed in Europe, end 2018
Source: ZITON data
0 600 1,200 1,800 2,400 3,000
GE
BARD
Senvion
MHI Vestas (V164)
Siemens Gamesa(D6 and later & Adwen)
MHI Vestas(V80, V90, V112 & earlier)
Siemens Gamesa(G4 & earlier)
2.230 (50%)
924 (21%)
764 (17%)
144 (3%)
210 (5%)
80 (2%)
73 (2%)
Wind farm operator distributionTurbines installed in Europe, end 2018
Source: ZITON data
0 300 600 900 1,200 1,500 1,800
Others
EnBW
Eneco
Siemens Gamesa
SSE Renewables
Equinor
Parkwind BV
Northland Power
Innogy
Vattenfall
E.ON
Ørsted 1,335 (30%)
523 (12%)
501 (11%)
319 (7%)
204 (5%)
177 (4%)
155 (4%)
140 (3%)
121 (3%)
103 (2%)
101 (2%)
746 (17%)
At the end of 2018, Siemens Gamesa had delivered 67 per
cent of the installed turbine base in Europe, with MHI having
delivered 24 per cent. Siemens Gamesa had installed a total of
764 turbines of their new and larger generation of D6 & D7
direct drive and Adwen models at 16 wind farms, while MHI
Vestas had installed their new, large V164 model across 5
wind farms for a total of 144 turbines. Siemens Gamesa had an
installed base of 2,230 turbines of their previous smaller turbine
models, while MHI Vestas had 924.
At the end of 2018, Senvion and General Electric had market
shares of 5% and 2%, respectively.
The new turbine models (D6, D7 and Adwen from Siemens
Gamesa and V164 from MHI Vestas) made up 20% of the
installed base at the end of 2018. Over the next three years or
so, these two models are expected to make up the majority of
turbines installed offshore. The drive towards larger turbines
comes from the fact that the size of the swept area determines
the amount of electricity a turbine can generate. As the swept
area increases with the square of the rotor length, the swept
area and electricity generation will quadruple with a doubling
of the blade length. A larger swept area combined with high and
consistent wind speeds makes it economically viable for wind
farm developers to continue installing larger turbines, even if the
costs of larger turbines also go up. Eventually, larger turbines of
10-12 MW are expected to become the industry standard.
ZITON’S ADRESSABLE MARKET The market for major component replacement, such as gear-
boxes, blades, generators, transformers, main bearings and main
shafts is driven by the number of turbines installed and turbine
failure rates.
The first of the two major drivers of demand for O&M services
is the number of installed turbines. As previously mentioned, the
number of installed offshore turbines in Europe has grown at a
compound annual growth rate of 20% from 2010 to 2018 and
is expected to grow by 10% annually for the next five years. The
4,425 turbines installed in Europe at the end of 2018 will require
servicing during the turbines’ lifespan of about 20-25 years.
The second driver is the turbine failure rate. The offshore wind
industry is still relatively young, meaning that the first generation
of turbines installed in the early 2000s remain in operation. There
is hence limited long-term, empirical data available on the failure
rate of major components. Moreover, the data varies between first,
second and later generation of turbines, and it varies from OEM
to OEM, location to location, etc. Earlier generations of turbine
models suffered from serial defects caused by design or sub-com-
ponent failures. These defects will often manifest themselves dur-
ing the first few years after installation, but the prevalence of such
serial defects has fallen as the industry has matured and OEMs
have improved on turbine designs from generation to generation.
As illustrated by the chart opposite, the offshore wind
industry in Europe is still relatively young, with more than half
of the installed base being less than five years old and thus still
within the respective OEM’s warranty period, which is typically
five years. Once maintenance responsibility is handed over to an
owner and operator, predictive maintenance is often intensified
due to the direct financial interest of the owner/operator.
ZITON · Annual Report 201820
›
THE OFFSHORE WIND INDUSTRY AND O&M SERVICES

2023202220212020201920182017201620152014
Average size of turbines installed per yearMW/Turbine
Average MW per turbine
0
1
2
3
4
5
6
7
8
9
10
11
12
Source: ZITON data
AgeBetween 5 and 10 years old
Number of turbines1,503
Percentage of total number of turbines
34%
AgeMore than 15 years old
Number of turbines232
Percentage of total number of turbines
5%
AgeBetween 10 and 15 years old
Number of turbines329
Percentage of total number of turbines
7%
Age of turbines installed
AgeUp to 5 years old
Number of turbines2,361
Percentage of total number of turbines
53%
Source: ZITON data
Source: ZITON data
ZITON · Annual Report 2018 21
THE OFFSHORE WIND INDUSTRY AND O&M SERVICES

›
During the next two years, around 1,000 turbines will pass five
years of age, which is thus expected to lead to increased turbine
maintenance. Furthermore, ZITON’s proprietary data shows that
failure rates increase considerably between year 5 and year 10
due to wear-and-tear.
CUSTOMER CONTRACTSZITON applies different types of contracts with its customers:
Time charter (T/C), framework agreements or turnkey contracts.
A T/C is characterised by being a hire of a vessel for a certain
predetermined period at a fixed day rate. T/C can be short-term
(up to three months), medium-term (from 3 to 24 months) or
long-term (beyond two years). Customers often have exten-
sion options at the end of a contract period. Contracts gener-
ally follow international standards for T/C contracts, typically a
BIMCO standard. Under T/C contracts, the customer is generally
required to pay for fuel, port calls and for necessary logistical
support from supply boats in addition to the day rate. The cost of
delays resulting from adverse weather lies with the customer.
ZITON also enters into framework agreements with its
customers. Framework agreements ensure that contract terms
including pricing are agreed upon beforehand, thus reducing
the time required by ZITON to respond to requests for major
component replacements. Framework agreements are based
on either fixed prices or T/C rates. For fixed price per replace-
ment, ZITON bears all costs including fuel, port calls, etc., as well
as costs incurred due to delays resulting from adverse weather
or maintenance work on the vessel. Due to the harsh weather
conditions that often occur during the winter period, weeks can
go by without the weather permitting any major component
replacement. During the summer, on the other hand, several
components can be replaced in a week if the turbines are located
in close proximity to one another.
ZITON enters into turnkey contracts in market segments
where it has a competitive edge. In general, this is in segments
where maritime knowledge, availability of a jack-up vessel with
a crane combined with strong knowledge of the offshore wind
industry is essential. These market segments include decommis-
sioning of met masts, foundations, turbines and blade campaigns.
As for lump sum agreements, costs related to fuel, port calls and
delays due to adverse weather, etc. are borne by ZITON, as are
the risks related to the subpar performance of any sub-supplier.
The responsibility of a turnkey project requires strong project
management skills in order to avoid cost overruns.
ZITON has entered into contracts with four of the leading
companies within offshore wind.
Framework agreement with ØrstedZITON has a framework agreement with Ørsted covering the
period from August 2016 until March 2019. Ørsted has initi-
ated a tender process for a new framework agreement. Ørsted is
Europe’s largest operator of offshore wind farms. The agreement
is not vessel specific. Remuneration to ZITON takes place on a
lump sum basis, with the price varying with the type and site of
the intervention.
Framework agreement with VattenfallZITON has a three-year framework agreement with Vattenfall
covering the period from November 2016 to November 2019.
Vattenfall is Europe’s second-largest operator of offshore wind
farms. The agreement is not vessel specific. Remuneration to
ZITON takes place on a fixed price basis, with the price varying
with the type and site of the intervention, and ZITON’s response
time to Vattenfall’s request. According to the contract, Vattenfall
is required to perform a minimum number of major component
replacements annually.
Framework agreement with MHI Vestas Offshore WindZITON has a framework agreement with MHI Vestas Offshore
Wind (MHI Vestas) entered into in December 2014. This
agreement has been extended until one of the parties cancels
the agreement. The agreement grants ZITON the right of first
refusal on all service interventions on the majority of MHI
Vestas’ offshore turbines. The agreement is not vessel specific.
Remuneration to ZITON takes place on a fixed price basis, with
the price varying with the type and site of the intervention.
Turnkey contract for blade campaign with Siemens Gamesa Renewable EnergyZITON has been selected as preferred supplier for a blade cam-
paign contract with Siemens Gamesa Renewable Energy (SGRE).
The blade campaign covers exchange, repair and upgrade of the
blades of 108 turbines at the West of Duddon Sands wind farm
in the UK. ZITON will provide a full turnkey solution including
jack-up, lifting equipment, lift planning, technicians and blade
repair including repair facilities.
Vattenfall is very satisfied with the decommissioning work performed by ZITON at Utgrunden. ZITON has proven how a very demanding project can be executed with highest HSE awareness in combination with the use of both new technology and proven methodologies. Magnus Jansson, Project Manager, Vattenfall
ZITON · Annual Report 201822
›
THE OFFSHORE WIND INDUSTRY AND O&M SERVICES

THE OFFSHORE WIND INDUSTRY AND O&M SERVICES
23ZITON · Annual Report 2018

København
Ijmuiden
7026
60
47
Hywind DemoSWT-2.3 MW
Equinor1
AnholtSWT-3.6 MWØrsted
Baltic 2SWT-3.6 MWEnBW
Thornton Bank Phase II+III6.2M 126C-Power
SeaMadeSG-8.0 MWOtary
NortherV164-8.0 MWEneco
Arklow Bank Phase 1GE 3.6 -104GE Energy
Oriel WindfarmV164-9.5 MWOriel Windfarm
8072
West of Duddon SandsSWT-3.6 MW
Ørsted
Ormonde5M 126Vattenfall
Burbo BankSWT-3.6 MWØrsted
Burbo Bank ExtensionV164-8.0 MWØrsted
Walney Phase 2SWT-3.6 MW
ØrstedWalney Phase 1SWT-3.6 MW
ØrstedWalney Extension West
V164-8.0 MWØrsted
Walney Extension East
SWT-7.0 MWØrsted
Rhyl FlatsSWT-3.6 MW
Innogy
25
35
32Gwynt y Mor
SWT-3.6 MWInnogy
Westermost RoughSWT-6.0 MWØrsted
Hornsea 2SG-8.0 MW Ørsted
160
25
Greater GabbardSWT-3.6 MW
SSE Renewables
East Anglia OneSWT-7.0 MWIberdrola
Moray EastV164-8.0 MWEDP
Aberdeen OWFV164-8.4/8.8 MWVattenfall
Kincardine V164-9.5 MWCobra Wind
Inch CapeSG-10.0 MWSDIC
BeatriceSWT-7.0 MWSSE Renewables
Neart na GaoitheSG-8.0 MWEDF
Hywind ScotlandSWT-6.0 MWEquinor
LincsSWT-3.6 MWØrsted
75
London ArraySWT-3.6 MW
Ørsted
Gunfleet Sands 3 DemoSWT-6.0 MW
Ørsted
Sheringham ShoalSWT-3.6 MWEquinor
Race BankSWT-6.0 MWØrsted
Triton KnollV164-9.5 MWInnogy
DudgeonSWT-6.0 MWEquinor
Dogger Bank Creyke Beck AV164-10.0 MWEquinor
Hornsea 1SWT-7.0 MWØrsted
88
18
58
30
60
43
7242
23
648 44
55
67
120
174
165
7
41
50
36
9477
100
116
3430 15
1752
140
102
56
91
90
LynnSWT-3.6 MW
Siemens Gamesa
Inner DowsingSWT-3.6 MW
Siemens Gamesa27
27
Gunfleet Sands I + IISWT-3.6 MW
Ørsted
RiffgatSWT-3.6 MWEWE
Alpha VentusM5000-116 /5M 126EWE
Gode Wind I+IISWT-6.0 MWØrsted
Gode Wind III+IVSG-8.0 MWØrsted
Nordergründe6.2M 126WPD Offshore
Nordsee One6.2M 126Northland Power
Borkum Riffgrund IIV164-8.0 MW
Ørsted
BARD Offshore 1BARD 5.0-122Ocean Breeze
Energy
Veja MateSWT-6.0 MW
Siemens Gamesa
GeminiSWT-4.0 MW
Northland Power
Deutsche BuchtV164-8.0 MW
Northland Power
Trianel Windpark Borkum I
M5000-116Trianel
Trianel Windpark Borkum II6.2M 126
Trianel
Nordsee Ost6.2M 126
Innogy
Borkum Riffgrund ISWT-4.0 MW
Ørsted
TeessideSWT-2.3 MWEDF
27
5Global Tech IM5000-116Global Tech
Offshore WindAlbatrosSWT-7.0 MW
EnBW Hohe SeeSWT-7.0 MWEnBW
Meerwind Ost/SudSWT-3.6 MWWindMW GmBh
KaskasiSG-8.0 MWInnogy
Amrumbank WestSWT-3.6 MWE.ON
ButendiekSWT-3.6 MWWPD OffshoreDanTysk
SWT-3.6 MWVattenfall
SandbankSWT-4.0 MW
Vattenfall
48 80
Horns Rev 2SWT-2.3 MW
Ørsted
Tuno KnobV39-500 kW
SE Blue Renewables
Baltic 1SWT-2.3 MWEnBW
MiddelgrundenB76/2000Ørsted
40
80
80
7180
67
16
31
56 78
150 40 975466 45
12
30
LillgrundSWT-2.3 MWVattenfall
8080
NystedSWT-2.3 MWØrsted
SamsoSWT-2.3 MWSamsoe Havvind
91
10
49
4
SprogoV90-3.0 MWEuropean Energy
21
FrederikshavnVariousSE Blue Renewables
Pori 2 – TahkoluotoSWT-4.0 MW
Suomen Hyotytuuli Oy
Gulf of Bothnia
Baltic sea
20
111
3
10
48
7
10
Rodsand IISWT-2.3 MW
E.ON90 72
Merkur OffshoreHaliade 150-6 MWMerkur Offshore
32
Robin RiggV90-3.0 MWE.ON
BarrowV90-3.0 MWØrsted
North HoyleV80-2.0 MWInnogy
30
58
108
51514047
30
30
Humber GatewayV112-3.0 MW
E.ON
73
84
100
11
5
72
54
5
72
Blyth demoV164-8.0 MWEDF
ThanetV90-3.0 MW
Vattenfall
Northwester 2V164-9.5 MW
Parkwind
Thanet ExtensionV164-9.5 MW
VattenfallRampionV112-3.45 MWE.ON
Scroby SandsV80-2.0 MWE.ON
Galloper Wind FarmSWT-6.0 MW
Innogy
Kentish FlatsV90-3.0 MW
Vattenfall
Kentish Flats Extension
V112-3.3 MWVattenfall
Eneco LuchterduinenV112-3.0 MW
Eneco
BelwindV90-3.0 MW
Parkwind NobelwindV112-3.3 MWParkwind BV
NorthwindV112-3.0 MWParkwind
Egmond aan ZeeV90-3.0 MW
VattenfallPrinses Amalia
V80-2.0 MWEneco
KårehamnV112-3.0 MWE.ON
Kriegers FlakSG-8.0 MW
Vattenfall
ArkonaSWT-6.0 MWE.ON
Baltic EagleV164-9.5 MWIberdrola
WikingerM5000-135Iberdrola
Arcadis Ost 1V164-9.5 MW
Parkwind
Horns Rev 1V80-2.0 MWVattenfall
Horns Rev 3V164-8.2 MWVattenfall
Nissum Bredning VindSWT-7.0 MWNissum Bredning Vindmollelaug
79
16
Thornton Bank Phase I
5M 126C-Power
Borssele I+IISG-8.0 MWØrsted
Borssele III+IVV164-8.0 MWBlauwwind
Grenå
Nyborg
Karlskrona
SkærbækEsbjerg
Sassnitz
Rostock
Harwich
Vlissingen
Ramsgate
Liverpool
Skagen
Oostende
Holyhead
Cuxhaven
Hull
Wicklow
Hvide Sande
Great Yarmouth
Belfast
Emshaven
Barrow
Falmouth
RentelSWT-7.0 MWOtary
Hollandse Kust Zuid I+IISG-10.0 MWVattenfall
PORTS
Updated April 2019
GRID CONNECTED END 2018
GRID CONNECTED 2019
GRID CONNECTED 2020
GRID CONNECTED 2021
GRID CONNECTED 2022
No. of turbines at the wind farm
AnholtSWT-3.6 MWØrsted
Site nameTurbineOperator
111
48
76
154253 ZITON_Plakat_kort.indd All Pages 16/04/2019 08.35
ZITON · Annual Report 201824
›
THE OFFSHORE WIND INDUSTRY AND O&M SERVICES

København
Ijmuiden
7026
60
47
Hywind DemoSWT-2.3 MW
Equinor1
AnholtSWT-3.6 MWØrsted
Baltic 2SWT-3.6 MWEnBW
Thornton Bank Phase II+III6.2M 126C-Power
SeaMadeSG-8.0 MWOtary
NortherV164-8.0 MWEneco
Arklow Bank Phase 1GE 3.6 -104GE Energy
Oriel WindfarmV164-9.5 MWOriel Windfarm
8072
West of Duddon SandsSWT-3.6 MW
Ørsted
Ormonde5M 126Vattenfall
Burbo BankSWT-3.6 MWØrsted
Burbo Bank ExtensionV164-8.0 MWØrsted
Walney Phase 2SWT-3.6 MW
ØrstedWalney Phase 1SWT-3.6 MW
ØrstedWalney Extension West
V164-8.0 MWØrsted
Walney Extension East
SWT-7.0 MWØrsted
Rhyl FlatsSWT-3.6 MW
Innogy
25
35
32Gwynt y Mor
SWT-3.6 MWInnogy
Westermost RoughSWT-6.0 MWØrsted
Hornsea 2SG-8.0 MW Ørsted
160
25
Greater GabbardSWT-3.6 MW
SSE Renewables
East Anglia OneSWT-7.0 MWIberdrola
Moray EastV164-8.0 MWEDP
Aberdeen OWFV164-8.4/8.8 MWVattenfall
Kincardine V164-9.5 MWCobra Wind
Inch CapeSG-10.0 MWSDIC
BeatriceSWT-7.0 MWSSE Renewables
Neart na GaoitheSG-8.0 MWEDF
Hywind ScotlandSWT-6.0 MWEquinor
LincsSWT-3.6 MWØrsted
75
London ArraySWT-3.6 MW
Ørsted
Gunfleet Sands 3 DemoSWT-6.0 MW
Ørsted
Sheringham ShoalSWT-3.6 MWEquinor
Race BankSWT-6.0 MWØrsted
Triton KnollV164-9.5 MWInnogy
DudgeonSWT-6.0 MWEquinor
Dogger Bank Creyke Beck AV164-10.0 MWEquinor
Hornsea 1SWT-7.0 MWØrsted
88
18
58
30
60
43
7242
23
648 44
55
67
120
174
165
7
41
50
36
9477
100
116
3430 15
1752
140
102
56
91
90
LynnSWT-3.6 MW
Siemens Gamesa
Inner DowsingSWT-3.6 MW
Siemens Gamesa27
27
Gunfleet Sands I + IISWT-3.6 MW
Ørsted
RiffgatSWT-3.6 MWEWE
Alpha VentusM5000-116 /5M 126EWE
Gode Wind I+IISWT-6.0 MWØrsted
Gode Wind III+IVSG-8.0 MWØrsted
Nordergründe6.2M 126WPD Offshore
Nordsee One6.2M 126Northland Power
Borkum Riffgrund IIV164-8.0 MW
Ørsted
BARD Offshore 1BARD 5.0-122Ocean Breeze
Energy
Veja MateSWT-6.0 MW
Siemens Gamesa
GeminiSWT-4.0 MW
Northland Power
Deutsche BuchtV164-8.0 MW
Northland Power
Trianel Windpark Borkum I
M5000-116Trianel
Trianel Windpark Borkum II6.2M 126
Trianel
Nordsee Ost6.2M 126
Innogy
Borkum Riffgrund ISWT-4.0 MW
Ørsted
TeessideSWT-2.3 MWEDF
27
5Global Tech IM5000-116Global Tech
Offshore WindAlbatrosSWT-7.0 MW
EnBW Hohe SeeSWT-7.0 MWEnBW
Meerwind Ost/SudSWT-3.6 MWWindMW GmBh
KaskasiSG-8.0 MWInnogy
Amrumbank WestSWT-3.6 MWE.ON
ButendiekSWT-3.6 MWWPD OffshoreDanTysk
SWT-3.6 MWVattenfall
SandbankSWT-4.0 MW
Vattenfall
48 80
Horns Rev 2SWT-2.3 MW
Ørsted
Tuno KnobV39-500 kW
SE Blue Renewables
Baltic 1SWT-2.3 MWEnBW
MiddelgrundenB76/2000Ørsted
40
80
80
7180
67
16
31
56 78
150 40 975466 45
12
30
LillgrundSWT-2.3 MWVattenfall
8080
NystedSWT-2.3 MWØrsted
SamsoSWT-2.3 MWSamsoe Havvind
91
10
49
4
SprogoV90-3.0 MWEuropean Energy
21
FrederikshavnVariousSE Blue Renewables
Pori 2 – TahkoluotoSWT-4.0 MW
Suomen Hyotytuuli Oy
Gulf of Bothnia
Baltic sea
20
111
3
10
48
7
10
Rodsand IISWT-2.3 MW
E.ON90 72
Merkur OffshoreHaliade 150-6 MWMerkur Offshore
32
Robin RiggV90-3.0 MWE.ON
BarrowV90-3.0 MWØrsted
North HoyleV80-2.0 MWInnogy
30
58
108
51514047
30
30
Humber GatewayV112-3.0 MW
E.ON
73
84
100
11
5
72
54
5
72
Blyth demoV164-8.0 MWEDF
ThanetV90-3.0 MW
Vattenfall
Northwester 2V164-9.5 MW
Parkwind
Thanet ExtensionV164-9.5 MW
VattenfallRampionV112-3.45 MWE.ON
Scroby SandsV80-2.0 MWE.ON
Galloper Wind FarmSWT-6.0 MW
Innogy
Kentish FlatsV90-3.0 MW
Vattenfall
Kentish Flats Extension
V112-3.3 MWVattenfall
Eneco LuchterduinenV112-3.0 MW
Eneco
BelwindV90-3.0 MW
Parkwind NobelwindV112-3.3 MWParkwind BV
NorthwindV112-3.0 MWParkwind
Egmond aan ZeeV90-3.0 MW
VattenfallPrinses Amalia
V80-2.0 MWEneco
KårehamnV112-3.0 MWE.ON
Kriegers FlakSG-8.0 MW
Vattenfall
ArkonaSWT-6.0 MWE.ON
Baltic EagleV164-9.5 MWIberdrola
WikingerM5000-135Iberdrola
Arcadis Ost 1V164-9.5 MW
Parkwind
Horns Rev 1V80-2.0 MWVattenfall
Horns Rev 3V164-8.2 MWVattenfall
Nissum Bredning VindSWT-7.0 MWNissum Bredning Vindmollelaug
79
16
Thornton Bank Phase I
5M 126C-Power
Borssele I+IISG-8.0 MWØrsted
Borssele III+IVV164-8.0 MWBlauwwind
Grenå
Nyborg
Karlskrona
SkærbækEsbjerg
Sassnitz
Rostock
Harwich
Vlissingen
Ramsgate
Liverpool
Skagen
Oostende
Holyhead
Cuxhaven
Hull
Wicklow
Hvide Sande
Great Yarmouth
Belfast
Emshaven
Barrow
Falmouth
RentelSWT-7.0 MWOtary
Hollandse Kust Zuid I+IISG-10.0 MWVattenfall
PORTS
Updated April 2019
GRID CONNECTED END 2018
GRID CONNECTED 2019
GRID CONNECTED 2020
GRID CONNECTED 2021
GRID CONNECTED 2022
No. of turbines at the wind farm
AnholtSWT-3.6 MWØrsted
Site nameTurbineOperator
111
48
76
154253 ZITON_Plakat_kort.indd All Pages 16/04/2019 08.35
OFFSHOREWIND FARMS
IN EUROPEZITON · Annual Report 2018 25

ZITON’S
SERVICE OFFERING
FULL-SERVICE SOLUTIONZITON’s core business is to own and operate jack-up vessels. In
recent years, we have expanded on this foundation by introduc-
ing value-added services.
ZITON provides full-service solutions for major component
replacement, including maritime project planning & execution, lift
planning & execution, specialised tools & lifting equipment and
technicians in addition to jack-ups with experienced crews. Our
expanded scope of a full-service solution is illustrated below.
Full-service solutions have their obvious advantages from
the customers’ point of view. They have built their skills and
expertise in day-to-day O&M routines, but those routines do not
include major component replacement. Even for a large wind
farm of 100 turbines, the wind farm operator may only need
to perform a major component replacement once every three
months. That makes it difficult to build the experience necessary
to carry out major component replacements smoothly and effi-
ciently. ZITON has performed more than seven hundred major
component replacements and has developed processes and pro-
cedures enabling safe and efficient operations. We have invested
significant resources in the ZITON Portal, which enables us to
deliver cost-efficient project documentation and to collaborate
with our customers on such operations.
TURNKEY SOLUTIONSZITON has expanded its scope further by offering turnkey
solutions for blade campaigns and decommissioning. For blade
campaigns ZITON collaborates with sub-suppliers to repair and
upgrade blades, provides facilities that offer temperature and
humidity management and other compulsory requirements
when it comes to blade repair. For decommissioning, ZITON
collaborates with sub-suppliers where relevant, and provides a
turnkey solution for cutting, recycling of waste materials, seabed
inspection, etc.
In a turnkey solution, ZITON takes full responsibility for the
solution and assumes all risk. ZITON has the experience to han-
dle risks better than anyone, including when it comes to weather
risk, project management, coordination with sub-suppliers, etc.
This has its obvious advantages from the customer’s point of
view, as it means less risk and only one contracting partner. From
ZITONs perspective, the benefit is equally attractive as it further
differentiates ZITON’s service offering from that of the competi-
tion.
TYPICAL O&M SETUPOEMs or wind farm operators monitor offshore turbines
remotely, as wind farms are often located in harsh and difficult-
to-access areas. Remote monitoring is an important part of
O&M, and includes supervision of the turbines and diagnostics
should a malfunction occur. In many cases, turbine restarts can
also be performed remotely.
Day-to-day O&M routines include inspections, minor repairs,
greasing or electrical work, for example, performed on a weekly
or monthly basis. An offshore wind farm with about 100 turbines
usually operates two or three small crew transfer vessels (CTV)
on a full-time basis as part of its O&M setup. For wind farms
further offshore, the use of large service operation vessels (SOV)
helps reduce travel times, because SOVs also function as a spare-
part warehouse, hotel and workshop.
Jack-up vessels such as those operated by ZITON are required
for major component replacement jobs involving the replacement
of gearboxes, blades, generators and other components.
ZITON’s business arises from owning and operating jack-up vessels designed to carry out O&M services on turbines at offshore wind farms. The business model has evolved in recent years and now includes full-service and turnkey solutions.
FOUNDATION A JACK-UP WITH A CRANE
LIFT PLANNING & EXECUTION
SPECIALISED TOOLS & LIFTING
EQUIPMENT
MARITIME PROJECT
PLANNING & EXECUTION
TECHNICIANS
ZITON · Annual Report 201826
›
THE OFFSHORE WIND INDUSTRY AND O&M SERVICES

A typical O&M setup is illustrated on the next page
J/U WIND SERVER working on blade campaign at Anholt Wind Farm, Denmark
ZITON · Annual Report 2018 27
THE OFFSHORE WIND INDUSTRY AND O&M SERVICES

O&M SETUP
FOR OFFSHORE WIND FARMS
SUBSTATION
The substation connects the offshore wind farm to the onshore electricity network and converts and transmits the power.
CREW TRANSFER VESSEL (CTV)
Used for near-shore wind farms for transporting technicians to the turbines for everyday O&M routines.
ONSHORE OFFICES AND OPERATIONS
Onshore hub for daily operations.
ZITON · Annual Report 201828
›
THE OFFSHORE WIND INDUSTRY AND O&M SERVICES

SERVICE OPERATION VESSEL (SOV)
Used for far-offshore wind farms for transporting technicians to the turbines for everyday O&M routines.
MET MAST
The met mast is erected prior to installation of the wind farm to provide actual measurement of weather conditions at the site.
DEDICATED O&M JACK-UP FOR MAJOR COMPONENT REPLACEMENT
Occasionally, it is necessary to exchange a major component, such as a gearbox, blades, generators, etc. This requires a dedicated O&M jack-up positioned next to the turbine.
ZITON · Annual Report 2018 29
THE OFFSHORE WIND INDUSTRY AND O&M SERVICES

DIGITAL
TRANSFORMATION
Digital transformation at ZITON encompasses the processes
across the company from operation to connectivity with custom-
ers, and automation of processes to data-driven decision making.
We continually review process by process. Initially, we strive to
reduce waste and streamline processes. Then we investigate the
digitalisation and automation potential of each process. We also
review technology trends to evaluate whether there are solu-
tions we can utilise in our digital transformation.
It is our leadership philosophy that innovation does not neces-
sarily occur through a top-down approach, but one that is rooted
in individual initiative by all employees of ZITON. Likewise, digital
transformation initiatives are often driven by the curiosity of our
people and their enthusiasm for continual improvement.
Thanks to a team dedicated to improving connectivity with
our customers, we have in recent years developed the ZITON
Portal. This enables us to exchange project documentation seam-
lessly with our customers. We use a cloud-based solution on
which customers can interact with us using a browser. This is a
very cost-effective solution that allows customers to access all
documentation in one place. We also maintain all our safety and
quality management documentation on the ZITON Portal, for
our own and for our customers’ convenience.
ZITON continually invests in the digitalisation of the business to improve operations and its interaction with customers. Digitalisation is one of four key strategic initiatives at ZITON.
OPERATIONS• Use of geographic information systems
for turbine locations, positioning of
jack-up, etc.
• Use of sensor data to support operation
of crane and jacking system
CONNECTIVITY• Collaboration with customers on project
documentation using a cloud-based
collaboration platform
• Document repository for customers
of Daily Progress Reports, HSE plans,
operating procedures, vessel certificates,
crew certificates, technical information of
vessels, etc.
AUTOMATION OF PROCESSES• Automation of processes and support for
work flow of financial processes using
modern ERP
• Add-on modules to ERP system for
expense management, invoice payment
processes and reconciliation of accounts
• Automation of manual processes and
integration of systems using Robotic
Process Automation
DATA-DRIVEN DECISION MAKING• Use of machine learning and advanced
analytics to predict future market demand
• Wind farm database to monitor industry
development
• Prediction of industry-wide vessel
utilisation
• Cloud-based Financial Planning & Analysis
platform used for both short- and long-
term planning
ZITON · Annual Report 201830
›
THE OFFSHORE WIND INDUSTRY AND O&M SERVICES

J/U WIND PIONEER in gearbox exchange
ZITON · Annual Report 2018 31
THE OFFSHORE WIND INDUSTRY AND O&M SERVICES

ZITON maintains policies for corporate social responsibility
(“CSR”). This section covers the statutory requirements for CSR
reporting according to section 99a of the Danish Financial State-
ments Act within the areas of social and employee conditions, cli-
mate impact, environmental impact, human rights and measures
to combat bribery and corruption.
SOCIAL AND EMPLOYEE CONDITIONSAt ZITON, we have a relentless focus on health, safety, environ-
ment and quality (“HSEQ”) for our employees, subcontractors
and customers. HSEQ is an important risk factor to ZITON.
Management believes the implementation of various policies,
systems and procedures has effectively mitigated the company’s
HSEQ risk exposure. Please refer to the Risk management sec-
tion of this annual report for more information.
Our HSEQ system has been certified by Bureau Veritas to
satisfy the requirements of the ISM Code /MLC 2006 and to the
ISO9001:2015 / ISO14001:2015 & OHSAS 18001:2008 stand-
ards. The ISO and OHSAS standards are all voluntary, but the
company applies them to strengthen its safety and quality stand-
ards. During the annual ISM review, Bureau Veritas reviews
ZITON’s performance according to various HSEQ performance
measures.
Our Safety First culture permeates our entire organisation
and is the all-encompassing rule onboard our vessels. Emergency
drills are held monthly on all our vessels and we conduct more
than 62 drills on each vessel every year. In addition, we have a
ship-to-shore drill at least once a year to train the procedures
between the onshore Emergency Group and the masters of the
vessels. This means we are trained for almost any unexpected sit-
uation that may arise. Further, we apply a vessel risk assessment
management system which includes a toolbox talk before each
assignment and a Safety Observation Card system, enabling us
to react proactively to potentially unsafe conditions.
Group management diligently monitors that the established
procedures for operations, projects and work on all vessels are
followed to the letter and carefully reviews the monthly HSEQ
report. The monthly HSEQ report includes reporting on the fol-
lowing categories of incidents:
• Near Miss Reports – an event or sequence of events which
did not result in an injury but which, under slightly different
conditions, could have done so.
• Medical Treatment Cases - any work-related loss of
consciousness (unless due to ill health), injury or illness
requiring more than first aid treatment by a physician, dentist,
surgeon or registered medical personnel.
• Lost-Time Injuries (“LTIs”) – any work-related incident where
the injured person is not able to work the day after the incident
occurred.
• Lost-Time Injury Frequency (“LTIF”) – Lost-Time Incidents per
million hours vessel crews are exposed to risk offshore.
Despite our high level of safety standards, incidents do occur
within the three different categories. Our objective is to avoid
LTIs altogether, and fortunately, the LTIs that have occurred have
been of low severity.
2016 2017 2018
Near Miss Reports(Number of incidents) 9 11 10
Medical Treatment Cases(Number of incidents) 1 3 2
Lost-Time Injuries (LTIs)(Number of incidents) 1 1 1
Lost-Time Injury Frequency (LTIF)(Number of incidents / exposure hours * 1,000,000) 3.5 3.4 3.1
Retaining experienced officers is considered important to main-
taining a culture of high HSEQ standards on board our vessels.
ZITON has successfully maintained a high officer retention rate
during the past three years, mainly by facilitating generally good
working conditions. ZITON applies the BIMCO Shipping KPI sys-
tem to monitor and follow-up on the retention rate.
2016 2017 2018
Officer Retention Rate(Officers end of period – officers resigned / officers end of period) 99.0% 98.5% 99.1%
CORPORATE SOCIAL
RESPONSIBILITY ZITON maintains various policies in relation to corporate social responsibility.
ZITON · Annual Report 201832
›
THE OFFSHORE WIND INDUSTRY AND O&M SERVICES

To support safety at sea, ZITON employs a zero-tolerance policy
for drugs and alcohol. This policy is undebatable and never open
to question. The policy applies not only to ZITON staff, but also
to customers, subcontractors and suppliers. Unannounced
examinations are standard procedure and are conducted by an
independent, external agency with expertise in drug and alcohol-
testing programmes. In 2017, positive tests, meaning above
0% drug or alcohol, were at a worryingly high level of 4.9%. The
positive tests resulted in the immediate dismissals of the persons
tested positive, and we stressed of our zero-tolerance policy.
In 2018, no positive tests were performed, therefore it is con-
cluded that the measures have been effective.
2016 2017 2018
Drug and Alcohol positive testing(Positive tests / number of tests * 100) 2.0% 4.9% 0.0%
Working offshore is a demanding occupation with uneven work-
ing hours (four weeks on duty, four weeks off). Further, it may
be difficult to maintain a healthy lifestyle with a proper diet and
exercise on board a vessel. ZITON maintains a policy of offering
good working conditions for its crews, which include a healthy
and balanced diet and access to a well-equipped fitness centre.
In 2017, a couple of employees were on long-term leave due to
health issues, resulting in their decision to stop working offshore.
Consequently, the absenteeism ratio declined in 2018.
2016 2017 2018
Absenteeism ratio(Number of hours of absence / exposure hours * 100) 3.5% 4.6% 2.2%
CLIMATE IMPACTZITON maintains a DNV-GL-certified Ship Energy Efficiency
Management Plan (“SEEMP”) that optimises fuel consumption,
hull and machinery with a view to keeping energy consumption
as low as possible. CO2 emissions are monitored in accordance
with the BIMCO Shipping KPI system. CO2 emissions from our
vessels increased to 7,792 tonnes in 2018 from 7,391 tonnes in
ZITON · Annual Report 2018 33
THE OFFSHORE WIND INDUSTRY AND O&M SERVICES
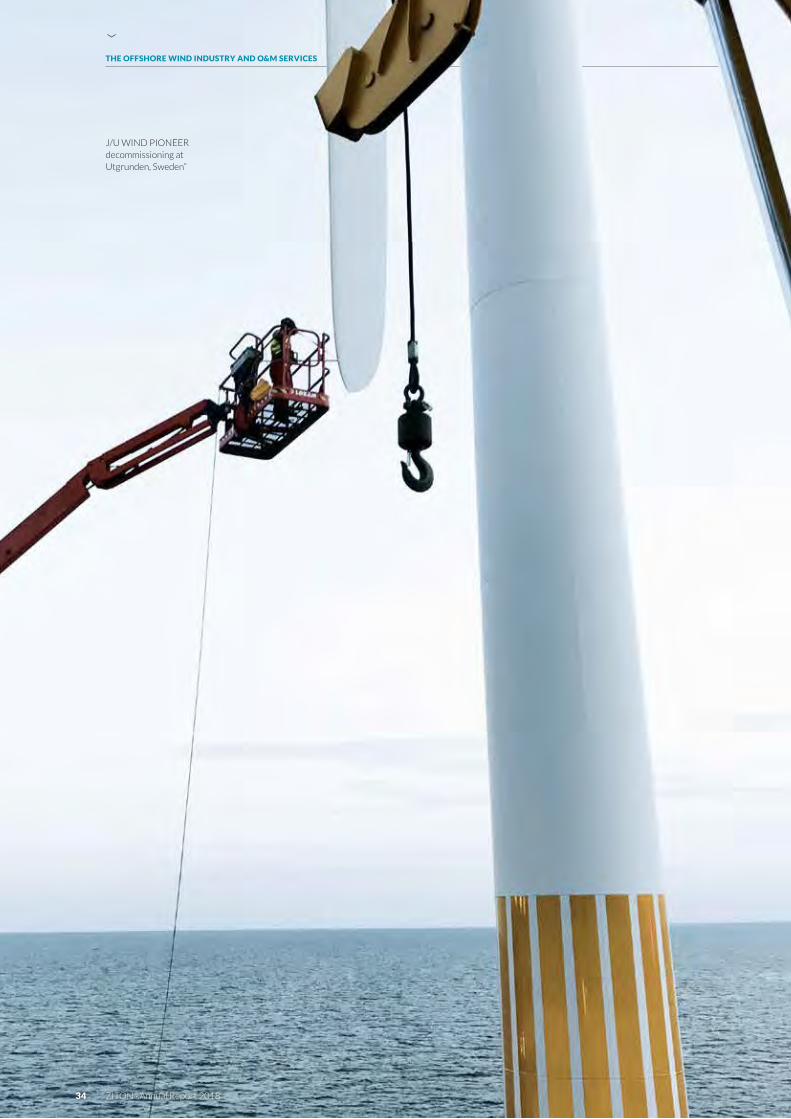
J/U WIND PIONEER decommissioning at Utgrunden, Sweden”
›
THE OFFSHORE WIND INDUSTRY AND O&M SERVICES
ZITON · Annual Report 201834

2017, mainly due to increased activity. The volume of CO2 emis-
sions in 2018 was equivalent to the greenhouse gas emissions
avoided by a wind turbine running for about 1.7 years, according
to the US Environmental Protection Agency’s Greenhouse Gas
Equivalencies Calculator.
Emissions per intervention, meaning the number of compo-
nent replacements, blade exchanges, turbines decommissioned,
declined significantly due to the combination of more interven-
tions performed and improved energy efficiency.
2016 2017 2018
CO2 emissions (Tonnes CO2) 5,897 7,391 7,792
Emissions per intervention(Tonnes CO2 per intervention) 91 95 44
ENVIRONMENTAL IMPACTZITON maintains an environmental policy specifying the objec-
tive to prevent environmental spills including oil, ballast water,
garbage, etc. Our environmental policy is tested regularly
through port stay controls performed by the maritime authori-
ties of the country in question. Inspections are performed to
check a vessel’s certificates, its general condition as well as its
compliance with various regulations including environmental
regulations. If a vessel is not compliant with the regulations, the
maritime authorities can place it in detention until the issue is
resolved. ZITON has had zero detentions during the past three
years.
Accidental fuel oil and hydraulic oil spills is an important envi-
ronmental issue. ZITON uses biodegradable hydraulic oil so as
not to harm the environment in case of accidental spills. ZITON
had zero accidents in 2016 and 2017. In 2018, we had two
incidents of accidental spills relating to wear and tear on hoses
carrying hydraulic oil to thrusters. The hoses were designed to
have a duration of five years, but wear and tear occurred sooner
than expected. As a consequence, we replaced all hoses to the
thrusters on the vessel, and decided that future replacement
will be carried out every three to four years. As a result of these
measures, we target zero oil spills going forward.
Ballast water management violations are increasingly subject
to scrutity by maritime authorities due to the negative impact
on the environment if ballast water from one biological area is
emptied into other waters. ZITON has had zero ballast water
violations during the past three years.
Our policy for garbage management aims to minimise the
production of waste on board our vessels and at our office prem-
ises. Our garbage management policy is part of Annex V of the
MARPOL 73/78 convention and IMO Resolution MEPC20(62).
The policy stresses, among other things, that the volume of
packaging brought on board our vessels must be kept at an
absolute minimum, and where packaging is imperative, we prefer
two-way-packaging or recyclable material. All crew members
must be fully familiar with the content of the ZITON garbage
management policy. Crew members are required to sign a state-
ment confirming that they have familiarised themselves with and
fully understand the garbage management policy. ZITON has had
zero garbage disposal violations during the past three years.
2016 2017 2018
Port stay control detentions(Number of detentions) 0 0 0
Accidental oil spills(Number of oil spills) 0 0 2
Ballast water management violations(Number of violations) 0 0 0
Garbage disposal violations(Number of violations) 0 0 0
RESPECT FOR HUMAN RIGHTSWithin the area of Human Rights and Labour, ZITON maintains
a policy of not employing people under the age of 18 on board
the company’s vessels. The aim is to avoid people under the age
of 18 performing hazardous work when working for ZITON. We
have been certified to the Maritime Labour Convention by the
Danish Maritime Authority. We enforce this policy for all work
carried out on board our vessels by our own employees and by
those of our suppliers or sub-contractors. The policy was suc-
cessfully applied in 2018, as no direct employees or employees of
suppliers or sub-contractors under the age of 18 worked on our
vessels during the year.
2016 2017 2018
Employees under the age of 18(Number of employees under 18) 0 0 0
ANTI-BRIBERY AND ANTI-CORRUPTION ZITON maintains an anti-bribery and anti-corruption policy.
The aim is to conduct our business in a lawful and ethical man-
ner with integrity towards our stakeholders. We enforce this
policy mainly by our management promoting our values across
our organisation. In addition, we require receipts for all costs
consumed and all costs must be approved by a superior to the
person consuming the costs. To the best of our knowledge, the
policy was successfully applied in 2018, as we have not identified
any indications of bribery or corruption.
2016 2017 2018
Number of bribery and corruption cases(Number of incidents revealed) 0 0 0
ZITON · Annual Report 2018 35
THE OFFSHORE WIND INDUSTRY AND O&M SERVICES

›
36 ZITON · Annual Report 2018
STRATEGIC DIRECTION

OUR VISIONOffshore renewables are the
preferred future source of energy.
OUR MISSIONTo provide second-to-none
solutions to the offshore renewables industry through our dedication
to skilled people, specialist equipment and safe operations.
VISION AND MISSION
Can do . Will do .
29YEARS AT SEA
Steffen Skov Nilsson, Chief engineer
J/U WIND PIONEER
“Always keeping the engines running.”
STRATEGIC DIRECTION
ZITON · Annual Report 2018 37

VALUE-ADDED SERVICESZITON offers value-added services within the catego-ries of maritime project plan-ning & execution, lift plan-ning & execution, specialised tools & lifting equipment and technicians in addition to a jack-up with an experienced crew. In a turnkey solution, ZITON takes full responsi-bility for the solution and assumes all risk. ZITON has the experience to handle risks better than anyone, including when it comes to weather risk, project man-agement, coordination with sub-suppliers, etc. This has its obvious advantages from the customer’s point of view, as it means less risk and only one contracting partner. From ZITONs perspective, the benefit is equally attrac-tive as it further differenti-ates ZITON’s service offering from that of the competition.
ZITON has steadily expanded its service offering from being a vessel supplier to become a provider of turn-key solutions.
SERVICE LARGER TURBINESTurbines are becoming larger and larger thanks to technol-ogy innovation. The current generation of turbines typi-cally have capacities of 7.0–10.0 MW, which is twice the power generation capability of the 3.6-4.0 MW turbines erected just three years ago.
ZITON’s current fleet is designed for the former gen-eration. These turbines will still need service during their lifetime of around 20 years. However, adding a larger vessel to the fleet is part of a strategic priority to grow with the market and serve our customers in the future.
GEOGRAPHICAL EXPANSIONZITON and many of our people have been part of the offshore wind industry since its infancy. Offshore wind has evolved in northern Europe since the year 2000, but only in the last couple of years has it begun to gain traction across the globe. ZITON has gained significant offshore wind experience over the years and is now exploring opportunities to apply this experience in other parts of the world.
In particular, it would seem that political support for offshore wind is creating business opportunities in Asia. As a first step, we are currently opening an office in Beijing, China.
DIGITALISATIONZITON continually invests in the digitalisation of the busi-ness to improve operations and customer interaction. Achieving operational effi-ciency in major component replacement in the offshore wind industry is very much subject to weather condi-tions and also depends on the many touchpoints and the coordination needed between ZITON, customers and suppliers. ZITON seeks to digitise and integrate internal processes and touchpoints in the supply chain.
ZITON has recently employed machine learn-ing and advanced analytics to predict future market demand, and Robotic Pro-cess Automation for automa-tion of manual processes and integration of diverse systems.
STRATEGIC
DIRECTIONThe strategic direction for ZITON contains the four key elements described below in conjunction with recent strategic achievements
ZITON · Annual Report 201838
›
STRATEGIC DIRECTION

FOUNDATION A JACK-UP WITH A CRANE
LIFT PLANNING & EXECUTION
SPECIALISED TOOLS & LIFTING
EQUIPMENT
MARITIME PROJECT
PLANNING & EXECUTION
TECHNICIANS
DIGITALISATION
VALUE-ADDED SERVICES
GEOGRAPHICAL EXPANSION
SERVICE LARGER TURBINES
ZITON · Annual Report 2018 39
STRATEGIC DIRECTION

KEY RESOURCES
Building or acquir-
ing jack-up vessels
requires high initial
investments and
design requirement
know-how.
Project manage-
ment capabilities are
essential for plan-
ning and successfully
executing projects.
ZITON employs a
customer portal to
deliver cost-efficient
project documenta-
tion and to collabo-
rate with customers
on projects.
COST STRUCTURE
Owning a fleet of jack-up ves-
sels requires high initial invest-
ments that must be recouped
over the life-time of the vessel.
Operating a maritime
organisation that serves off-
shore wind farms implies a pre-
dominantly fixed-cost structure
with relatively limited variable
costs. For example, staff, insur-
ance, catering and other costs
are fixed regardless of the level
of activity.
Providing turnkey solutions
involves ZITON taking full
responsibility for the solution
and assuming all risk, includ-
ing for the collaboration with
sub-contractors. If the cost of a
project exceeds budget, ZITON
may not only be liable for its
own costs, but also for those of
its sub-contractors.
CUSTOMER SEGMENTS
There are two customer segments
in the offshore wind industry; tur-
bine manufacturers and wind farm
operators.
Turbine manufacturers include
Siemens Gamesa Renewable
Energy, MHI Vestas Offshore
Wind, Senvion, GE Renewable
Energy, among others.
Wind farm operators are pri-
marily utilities like Ørsted, E.On,
Vattenfall, Equinor, Innogy, SSE,
EnBW. Once an offshore wind
farm has been installed, turbine
manufacturers normally provide
operations & maintenance ser-
vices under their warranty pro-
grammes, which typically extend
for five years. It is customary for
wind farm operators to assume full
O&M responsibility when the war-
ranty period ends.
VALUE TO CUSTOMERS
It is important for wind
farm owners to avoid any
unscheduled downtime, as
that would reduce a wind
turbine’s power output. Cus-
tomers use remote condition
monitoring to avoid turbine
breakdowns and optimise
the timing of major compo-
nent replacements. Our ves-
sels are dedicated to opera-
tions & maintenance and
are always ready to provide
swift assistance to “keep the
blades turning” at offshore
wind farms.
Blade repair provides
important value for custom-
ers, as wear and tear of
blades reduces the output
of the turbines and conse-
quently the profitability of
wind farms.
BUSINESS
MODEL
In recent years, ZITON’s business model has evolved to include full-service and turnkey solutions, building on the foundation of owning and operating jack-up vessels. To own jack-up vessels involves a high initial investment and high operating costs with only a minor variable cost component. Accordingly, most costs are fixed, and ZITON’s key drivers of cash flow generation are day rates and the fleet utilisation rate.
ZITON · Annual Report 201840
›
STRATEGIC DIRECTION
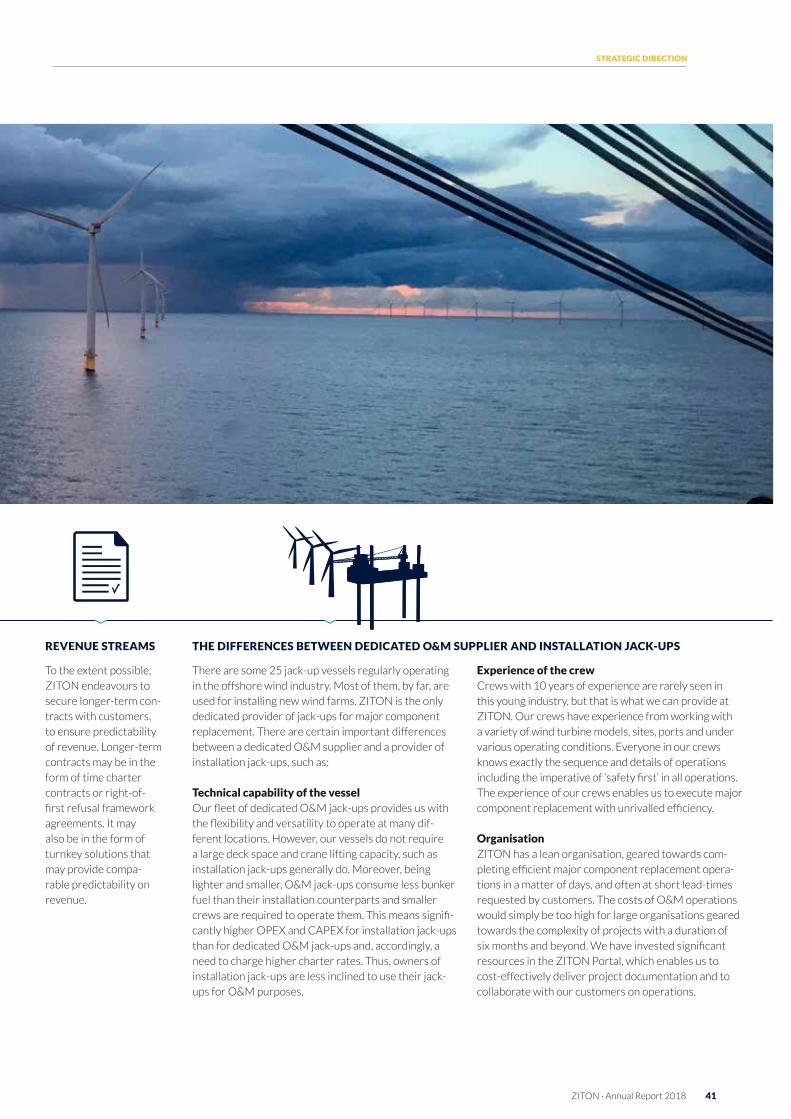
REVENUE STREAMS
To the extent possible,
ZITON endeavours to
secure longer-term con-
tracts with customers,
to ensure predictability
of revenue. Longer-term
contracts may be in the
form of time charter
contracts or right-of-
first refusal framework
agreements. It may
also be in the form of
turnkey solutions that
may provide compa-
rable predictability on
revenue.
THE DIFFERENCES BETWEEN DEDICATED O&M SUPPLIER AND INSTALLATION JACK-UPS
There are some 25 jack-up vessels regularly operating
in the offshore wind industry. Most of them, by far, are
used for installing new wind farms. ZITON is the only
dedicated provider of jack-ups for major component
replacement. There are certain important differences
between a dedicated O&M supplier and a provider of
installation jack-ups, such as:
Technical capability of the vesselOur fleet of dedicated O&M jack-ups provides us with
the flexibility and versatility to operate at many dif-
ferent locations. However, our vessels do not require
a large deck space and crane lifting capacity, such as
installation jack-ups generally do. Moreover, being
lighter and smaller, O&M jack-ups consume less bunker
fuel than their installation counterparts and smaller
crews are required to operate them. This means signifi-
cantly higher OPEX and CAPEX for installation jack-ups
than for dedicated O&M jack-ups and, accordingly, a
need to charge higher charter rates. Thus, owners of
installation jack-ups are less inclined to use their jack-
ups for O&M purposes.
Experience of the crewCrews with 10 years of experience are rarely seen in
this young industry, but that is what we can provide at
ZITON. Our crews have experience from working with
a variety of wind turbine models, sites, ports and under
various operating conditions. Everyone in our crews
knows exactly the sequence and details of operations
including the imperative of ‘safety first’ in all operations.
The experience of our crews enables us to execute major
component replacement with unrivalled efficiency.
OrganisationZITON has a lean organisation, geared towards com-
pleting efficient major component replacement opera-
tions in a matter of days, and often at short lead-times
requested by customers. The costs of O&M operations
would simply be too high for large organisations geared
towards the complexity of projects with a duration of
six months and beyond. We have invested significant
resources in the ZITON Portal, which enables us to
cost-effectively deliver project documentation and to
collaborate with our customers on operations.
ZITON · Annual Report 2018 41
STRATEGIC DIRECTION

RISK
MANAGEMENTAt ZITON, we define risk as “anything that can adversely affect our ability to execute our strategy and achieve our objectives”.
RISK MANAGEMENT PROCESSThe risk assessment process is anchored in the Executive
Management team, which regularly reviews the process of risk
identification, analysis, evaluation and considers which steps
should be taken, as illustrated below. At regular board meetings,
the Board of Directors and the Executive Management assess
and discuss main changes to key risks.
Depending on their origin, risk factors are categorised as
strategic, operational, financial or compliance risk. Financial
risks, including risks related to credit, liquidity, interest rates and
markets, are addressed in note 4.1 to the consolidated financial
statements. Risk factors are not only perceived as risks, but also
as opportunities to continue developing the strategy. Strategic
responses to risk factors may in some cases lead to an improved
market position.
RISK HEAT MAPTo help visualise risks and opportunities, a heat map is prepared
with the net risk presented after possible mitigation. Risks
beyond the dotted red line are assessed to be the most signifi-
cant risks to which the Company is exposed.
BOARD OF DIRECTORS
EXECUTIVE MANAGEMENT TEAM
TREATMENT• Assess treatment
• Effectiveness of treatment
IDENTI-FICATION• Sources of risk• Areas of impact• Events
EVALUATION• Accept
• Mitigate• Avoid
ANALYSIS• Likelihood• Consequence• Quantification • Scenarios
Competition
Key customercontracts
Turbine technology innovation
Co
nse
qu
ence
Likelihood
High
High
Low
Low
ZITON · Annual Report 201842
›
STRATEGIC DIRECTION

THE THREE MOST IMPORTANT RISK FACTORS SHOWN IN THE RISK HEAT MAP ARE ELABORATED UPON BELOW
RISK FACTORS POSSIBLE CAUSESPOTENTIAL CONSEQUENCES
ENSUING MITIGATION
Turbine technology innovation
· Technology innovation enabling the industry to build larger turbines with heights that exceed the lifting heights of the Company’s current fleet
· Turbine technology innovation making it possible to carry out major component replacement or blade repair offshore without the need for a jack-up
· Development of more reliable turbine technology with fewer defects
· Uncertainty about future market demand for the Company’s current fleet
· Invest in/acquire vessels capable of meeting technology trends of increasingly larger turbines. The bond issue contains the opportunity to expand the fleet with certain restrictions
Competition · ZITON is currently the only company to offer dedicated O&M services for major component replacements at offshore wind farms
· Companies with jack-ups used for new wind farm installations may offer O&M services if there is inadequate demand for installation of new wind farms, or if turbines become too large for them to install
· New industry players may invest in jack-ups to offer major component replacement
· Excess capacity of jack-up vessels could lead to low utilisation rates and price competition
· Seek to increase differentiation from competition and create value to customers that peers are unable to match
· Build barriers to entry that will make ZITON’s dedicated O&M services more difficult to compete with
Key customer contracts
· ZITON relies on being able to fulfil contracts with its key customers to secure future revenue. Inability to meet requirements of contracts with key customers will have material consequences for the company’s cash flows. In the medium-term, the company relies on the prolongation of existing contracts or on winning new contracts
· Contracts with Siemens Gamesa Renewable Energy, Ørsted, Vattenfall and MHI Vestas collectively account for most of 2018 revenue
· ZITON believes that the best means of retaining customers is to provide value to customers by offering turnkey solutions, by being a dedicated O&M supplier with a diverse fleet, experienced crew and by having an organisation geared to provide efficient O&M services.
EVALUATION OF MAIN CHANGES TO RISKThe Board of Directors and the Executive Management have
reviewed the risk assessment and compared it to last year’s
annual report. In the Board’s assessment, two risk factors have
been reduced and are no longer considered significant in terms
of the combined risk of consequence and likelihood.
The risk of reduced “political support for offshore wind” is
believed to be lower because I) subsidies for offshore wind farms
have become less important, as offshore wind farms have become
more commercially viable and rely less on subsidies than they did
a few years ago; II) the total number of offshore wind turbines
installed in northern Europe at the end of 2018 was 4,425. They
will require service for the next many years, thus driving contin-
ued demand for jack-up vessels.
The risk of “liquidity and refinancing risk” was significantly
reduced as ZITON revised its capital structure in October 2018,
extending the maturity of its senior bond loan by three years
(maturing on 3 October 2021)
Furthermore, the potential impact of Brexit was reviewed. In
2018, Ziton generated about 20% of its revenue from the UK,
as can be seen from note 2.1 to the consolidated financial state-
ments. Accordingly, the UK market is of substantial importance,
but management believes that Brexit is highly unlikely to result in
trade barriers that will prevent ZITON from operating in the UK.
However, there may be short-term disruptions to trade and, as a
precaution, ZITON has established ZITON Ltd. in order to be able
to continue doing business in the UK. Further, ZITON has estab-
lished a business continuity plan concerning how to ensure free
movement in and out of UK territory of people and vessels, in the
unlikely event that trade barriers are established.
ZITON · Annual Report 2018 43
STRATEGIC DIRECTION

APMS DEFINITION RECONCILIATION EXPLANATION OF USE COMPARISION COHERENCE
Weighted average utilisation rate
Weighted average utilisation rate is defined as revenue plus other operating income during the period divided by full utilisation at standard rates. The combined standard rate for the three vessels is EUR 135k per day. Each vessel has a different weighting depending on its specifications
Revenue – non-vessel-related revenue + Other operating income (during the period) / EUR 135k * days (in the period) * 100
The weighted average utilisation rate at standard day rates expresses our ability to effectively utilise and capture the value of our fleet of vessels. This performance measure is a key driver of profitability
Prior-year comparative figures are presented in the “How we measure performance” section
The criteria used to calculate the weighted average utilisation rate are unchanged from last year with the exception that “other operating income” is a new line of income in 2018. Further, J/U WIND PIONEER and J/U WIND SERVER were included in 2015 as they became operationally available
EBITDA EBITDA is short for Earnings Before Interest, Tax, Depreciation and Amortisation
Income before tax + Financial payments, net + Depreciation and amortisation
EBITDA is a good approximation of pre-tax operating cash flow before working capital variations. This performance measure is a key driver of overall operational efficiency
Prior-year comparative figures are presented in the “How we measure performance” section
The criteria used to calculate EBITDA are unchanged from last year
EBITDA margin EBITDA divided by Revenue Income before tax + Financials, net + depreciation and amortisation / Revenue * 100
EBITDA margin is a good measure of operating efficiency
Prior-year comparative figures are presented in the “Key figures” section
The criteria used to calculate EBITDA margin are unchanged from last year
Cash flows from operating activities
Cash flows from operating activities is defined as EBITDA less working capital adjustments and other adjustments
Income before tax + Reversal of financial expenses, net + depreciation and amortisation + other adjustments + working capital adjustments
Cash flows from operating activities is a good measure of the company’s cash generation power, and the ability to pay interest, service loans and carry out investments
Prior-year comparative figures are presented in the “How we measure performance” section
The definition of cash flows from operating activities has been changed from last year when we also deducted financial payments in our definition of cash flows from operating activities
Subordinated capital Subordinated capital consists of equity, subordinated capital and a second lien bond. Subordinated capital ranks last if the company goes into liquidation
Equity + subordinated loan + a second lien bond loan
Subordinated capital can be considered the risk capital provided to the company. It consists of equity and loans that are subordinated to the first lien bond loan, working capital facility and guarantees
Prior-year comparative figures are presented in the “Key figures” section
Compared to prior years, a second lien bond loan was issued in 2018 and currently forms part of the subordinated capital. There are no other changes to the criteria used to calculate the subordinated capital
Subordinated capital ratio Subordinated capital ratio is subordinated capital as a percentage of total assets
Equity + subordinated loan + second lien bond loan / Total assets * 100
The subordinated capital ratio is the only maintenance covenant defined in the company’s loan agreements for the first lien and second lien bond loans
Prior-year comparative figures are presented in the “Key figures” section
Compared to prior years, a second lien bond loan was issued in 2018 and currently forms part of the subordinated capital. There are no other changes to the criteria used to calculate subordinated capital ratio
Net InterestBearing Debt (adjusted for capitalised financing costs)
Net Interest-Bearing Debt (“NIBD”) is senior debt with the highest priority level. It ranks ahead of subordinated debt if the company goes into liquidation
Bond loan, first lien (current and non-current) + lease obligations (current and non-current) – capitalised financing costs – Cash and cash equivalents
NIBD (adjusted for capitalised financing costs) is a measure of the senior debt less cash and cash equivalents
Prior-year comparative figures are presented in the “Key figures” section
The criteria used to calculate NIBD (adjusted for capitalised financing costs) is unchanged from previous years
Loan to Vessels ratio The Loan to Vessels ratio expresses NIBD (adjusted for capitalised financing costs) compared to the book value of the company’s vessels
Bond loan, first lien (current and non-current) + lease obligations (current and non-current) – capitalised financing costs – Cash and cash equivalents / Vessels * 100
The Loan to Vessels ratio is considered a quick way for investors to assess the security of the company’s vessels relative to the loans provided
Prior-year comparative figures are presented in the “Key figures” section
The criteria used to calculate the Loan to Vessels ratio is unchanged from previous years
Liquidity The liquidity available to the company less cash on retention account, which is provided as security for the company’s credit facilities
Cash and cash equivalents – cash on retention account
Liquidity is a good measure of the liquidity available to the company and its ability to pay interest and instalments and to withstand variations in future operating cash flows
Prior-year comparative figures are presented in the “Review of cash flows for 2018” section of the consolidated financial statements
The criteria used to calculate liquidity are unchanged from previous years
Available liquidity The liquidity available to the company less cash on retention account, which is provided as security for the company’s credit facilities, plus available working capital credit facilities
Cash and cash equivalents – cash on retention account – draw on working capital facility + available draw on facility
Available liquidity is a good measure of the liquidity available to the company incl. drawing rights on the working capital facility for paying interest and instalments and withstanding variations in future operating cash flows
Prior-year comparative figures are presented in the “Review of cash flows for 2018” section of the consolidated financial statements
The criteria used to calculate available liquidity are unchanged from previous years
ALTERNATIVE
PERFORMANCE MEASURESAlternative Performance Measures (“APMs”) are non-IFRS financial measures used as supplements to financial statements.
ZITON · Annual Report 201844
›
BUSINESS PERFORMANCE

APMS DEFINITION RECONCILIATION EXPLANATION OF USE COMPARISION COHERENCE
Weighted average utilisation rate
Weighted average utilisation rate is defined as revenue plus other operating income during the period divided by full utilisation at standard rates. The combined standard rate for the three vessels is EUR 135k per day. Each vessel has a different weighting depending on its specifications
Revenue – non-vessel-related revenue + Other operating income (during the period) / EUR 135k * days (in the period) * 100
The weighted average utilisation rate at standard day rates expresses our ability to effectively utilise and capture the value of our fleet of vessels. This performance measure is a key driver of profitability
Prior-year comparative figures are presented in the “How we measure performance” section
The criteria used to calculate the weighted average utilisation rate are unchanged from last year with the exception that “other operating income” is a new line of income in 2018. Further, J/U WIND PIONEER and J/U WIND SERVER were included in 2015 as they became operationally available
EBITDA EBITDA is short for Earnings Before Interest, Tax, Depreciation and Amortisation
Income before tax + Financial payments, net + Depreciation and amortisation
EBITDA is a good approximation of pre-tax operating cash flow before working capital variations. This performance measure is a key driver of overall operational efficiency
Prior-year comparative figures are presented in the “How we measure performance” section
The criteria used to calculate EBITDA are unchanged from last year
EBITDA margin EBITDA divided by Revenue Income before tax + Financials, net + depreciation and amortisation / Revenue * 100
EBITDA margin is a good measure of operating efficiency
Prior-year comparative figures are presented in the “Key figures” section
The criteria used to calculate EBITDA margin are unchanged from last year
Cash flows from operating activities
Cash flows from operating activities is defined as EBITDA less working capital adjustments and other adjustments
Income before tax + Reversal of financial expenses, net + depreciation and amortisation + other adjustments + working capital adjustments
Cash flows from operating activities is a good measure of the company’s cash generation power, and the ability to pay interest, service loans and carry out investments
Prior-year comparative figures are presented in the “How we measure performance” section
The definition of cash flows from operating activities has been changed from last year when we also deducted financial payments in our definition of cash flows from operating activities
Subordinated capital Subordinated capital consists of equity, subordinated capital and a second lien bond. Subordinated capital ranks last if the company goes into liquidation
Equity + subordinated loan + a second lien bond loan
Subordinated capital can be considered the risk capital provided to the company. It consists of equity and loans that are subordinated to the first lien bond loan, working capital facility and guarantees
Prior-year comparative figures are presented in the “Key figures” section
Compared to prior years, a second lien bond loan was issued in 2018 and currently forms part of the subordinated capital. There are no other changes to the criteria used to calculate the subordinated capital
Subordinated capital ratio Subordinated capital ratio is subordinated capital as a percentage of total assets
Equity + subordinated loan + second lien bond loan / Total assets * 100
The subordinated capital ratio is the only maintenance covenant defined in the company’s loan agreements for the first lien and second lien bond loans
Prior-year comparative figures are presented in the “Key figures” section
Compared to prior years, a second lien bond loan was issued in 2018 and currently forms part of the subordinated capital. There are no other changes to the criteria used to calculate subordinated capital ratio
Net InterestBearing Debt (adjusted for capitalised financing costs)
Net Interest-Bearing Debt (“NIBD”) is senior debt with the highest priority level. It ranks ahead of subordinated debt if the company goes into liquidation
Bond loan, first lien (current and non-current) + lease obligations (current and non-current) – capitalised financing costs – Cash and cash equivalents
NIBD (adjusted for capitalised financing costs) is a measure of the senior debt less cash and cash equivalents
Prior-year comparative figures are presented in the “Key figures” section
The criteria used to calculate NIBD (adjusted for capitalised financing costs) is unchanged from previous years
Loan to Vessels ratio The Loan to Vessels ratio expresses NIBD (adjusted for capitalised financing costs) compared to the book value of the company’s vessels
Bond loan, first lien (current and non-current) + lease obligations (current and non-current) – capitalised financing costs – Cash and cash equivalents / Vessels * 100
The Loan to Vessels ratio is considered a quick way for investors to assess the security of the company’s vessels relative to the loans provided
Prior-year comparative figures are presented in the “Key figures” section
The criteria used to calculate the Loan to Vessels ratio is unchanged from previous years
Liquidity The liquidity available to the company less cash on retention account, which is provided as security for the company’s credit facilities
Cash and cash equivalents – cash on retention account
Liquidity is a good measure of the liquidity available to the company and its ability to pay interest and instalments and to withstand variations in future operating cash flows
Prior-year comparative figures are presented in the “Review of cash flows for 2018” section of the consolidated financial statements
The criteria used to calculate liquidity are unchanged from previous years
Available liquidity The liquidity available to the company less cash on retention account, which is provided as security for the company’s credit facilities, plus available working capital credit facilities
Cash and cash equivalents – cash on retention account – draw on working capital facility + available draw on facility
Available liquidity is a good measure of the liquidity available to the company incl. drawing rights on the working capital facility for paying interest and instalments and withstanding variations in future operating cash flows
Prior-year comparative figures are presented in the “Review of cash flows for 2018” section of the consolidated financial statements
The criteria used to calculate available liquidity are unchanged from previous years
ZITON presents its consolidated financial statements in accord-
ance with generally accepted accounting practices (IFRS).
Accordingly, key figures and ratios have been prepared in accord-
ance with CFA Society Denmark’s online version of ”Recommen-
dations & Ratios”. In addition, ZITON presents APMs according
to the Directives of European Securities and Markets Authority
(“ESMA”). Management uses APMs in its decision-making and
for evaluating the performance of the company. Furthermore,
APMs provide useful information that supplements the financial
statements. APMs are not defined under IFRS and may not be
directly comparable with APMs for other companies. Details
of disclosures required by ESMA on definition, reconciliation,
explanation of use, comparisons and coherence of each APM are
provided below.
ZITON · Annual Report 2018 45
BUSINESS PERFORMANCE

The Board of Directors and Executive Manage-
ment monitor a number of key performance
indicators (“KPIs”) to evaluate the performance of
our strategy over time. The KPIs applied are both
financial and operational, internal and external,
leading and lagging indicators. KPIs are main-
tained for various purposes in the organisation. To
monitor the operational performance of individual
vessels, we employ BIMCO’s Shipping KPI system.
At group level, we monitor, among other things,
HSEQ reporting, vessel utilisation, day rates,
return on invested capital and employee turnover.
The three main KPIs, disclosed externally, are
elaborated upon below. For specific definitions of
the KPIs and an explanation of use, please refer to
the section Alternative Performance Measures. Weighted average utilisation ratePer cent
HOW WE MEASURE
PERFORMANCEThe Board of Directors and Executive Management monitor a number of key performance indicators (“KPIs”) to evaluate the performance of our strategy over time.
WEIGHTED AVERAGE UTILISATION RATE ZITON expanded its fleet of vessels during 2015 from one to
three vessels, and a strategic priority has been to improve utili-
sation. Supported by the three-year time charter of J/U WIND
SERVER to Siemens Gamesa Renewable Energy (“SGRE”) from
March 2016, utilisation has since steadily improved. In 2018,
vessel utilisation reached 92% in 2018, reflecting strong utili-
sation of the entire fleet. A relatively more uncertain contract
situation is projected for 2019, in part due to the expiry of the
time charter with SGRE in March 2019. However, this concern
is partly counterbalanced by solid market developments and
a good level of activity within contract tendering, with ZITON
being selected as a preferred supplier for a large blade campaign.
0
10
20
30
40
50
60
70
80
90
100
2019 target2018201720162015
ZITON · Annual Report 201846
›
BUSINESS PERFORMANCE

EBITDAEUR million
Cash flows from operating activitiesEUR million
EBITDAEBITDA has improved steadily, mainly as a consequence of the
improved vessel utilisation. ZITON’s business model is character-
ised by high initial investments in jack-ups, combined with minor
variable costs and high operating costs. Consequently, as vessel
utilisation and revenue has increased, a notable improvement in
EBITDA has been achieved. The projection for 2019 reflects the
lower vessel utilisation rate expected.
CASH FLOWS FROM OPERATING ACTIVITIESCash flows from operating activities are defined as EBITDA less
working capital and other adjustments. Consequently, cash flows
from operating activities is a good indication of the company’s
cash flow generation power. Cash flows from operating activities
have increased in line with the improvements in EBITDA, reflect-
ing the company’s ability to manage working capital in the busi-
ness. The projection for 2019 reflects the lower vessel utilisation
rate expected and the resulting lower EBITDA.
-5
0
5
10
15
20
25
30
35
2019 target2018201720162015-5
0
5
10
15
20
25
30
35
2019 target2018201720162015
ZITON · Annual Report 2018 47
BUSINESS PERFORMANCE

›
BUSINESS PERFORMANCE
ZITON · Annual Report 201848
The following is a review of the guidance provided to bondholders in terms of our performance in 2018.
GUIDANCE FEBRUARY 2018
REVISED GUIDANCE AUGUST 2018
REVISED GUIDANCE NOVEMBER 2018 ACTUAL 2018
WEIGHTED AVERAGE UTILISATION RATE
75-85% 85-90% 85-90% 92%
EBITDA EUR 21-25m EUR 25-28m EUR 27-28m EUR 30.3m
CASH FLOWS FROM OPERATING ACTIVITIES
EUR 11-15m EUR 15-18m EUR 12-15m EUR 18.4m
CAPEX Up to EUR 4m Up to EUR 4m Up to EUR 4m EUR 0.6m
We provided initial guidance to the
bondholders at the release of our
Q4 2017 interim report published
on 27 February 2018.
Our performance in the first half
of 2018 was better than expected,
and as a result we upgraded the
full-year guidance in August 2018
when releasing our Q2 2018
interim report.
The strong performance con-
tinued into Q3 2018, and conse-
quently we upgraded the guidance
further in November 2018 when
releasing our Q3 2018 interim
report.
Performance in the final quarter
of the year also exceeded expecta-
tions. As a result, actual perfor-
mance in 2018 also exceeded the
upgraded guidance provided after
Q3 2018.
BETTER THAN EXPECTED• J/U WIND SERVER completed
a blade campaign from February
to September 2018, replacing
88 sets of blades at Anholt wind
farm, Denmark.
• J/U WIND PIONEER
decommissioned the Utgrunden
Offshore Windfarm, Sweden as a
turnkey project for Vattenfall.
• J/U WIND completed
decommissioning of two met
masts as a turnkey project at a
UK wind farm, and worked as
an accommodation platform for
cable repair.
• J/U WIND SERVER was fully
operational and on-hire during
the entire year.
AS EXPECTED• We maintained good customer
relationships during the year and
benefitted from key contracts
with four of the leading players in
the offshore wind industry.
• J/U WIND and J/U WIND
PIONEER met expectations of
operational availability.
WORSE THAN EXPECTED• Market demand was somewhat
lower than expected during the
third quarter of 2018, as turbines
had fewer breakdowns than
projected. We were able to cover
for this by a decommissioning
project and operate as an
accommodation platform during
the quarter.
2018 PERFORMANCE
REVIEW

J/U WIND at low tide in the Irish Sea
BUSINESS PERFORMANCE
ZITON · Annual Report 2018 49

OUTLOOK FOR
The 2019 guidance reflects the more uncertain contract situation considering the expiry of the time charter with SGRE in March 2019, which is partly offset by solid market developments and the good level of activity in contract tendering with ZITON being selected as a preferred supplier for a large blade campaign. The following sets out our guidance for our key performance indicators in 2019.
2019
ZITON · Annual Report 201850
›
BUSINESS PERFORMANCE

CAPEXWe expect CAPEX
of up to EUR 4.0m,
compared to EUR 0.6m
in 2018.
Cash flow from operating activities is defined as EBITDA
less changes in working
capital (in 2018
we also deducted
financial payments in
our definition). We
expect cash flows from
operating activities of
EUR 19-23m, down
from EUR 31.0m in
2018. The main reason
for the projected
decline is the expected
lower EBITDA.
EBITDA We expect EBITDA
to be in the range of
EUR 21-25m. This is
somewhat less than
our realised 2018
EBITDA of EUR
30.3m. The reduced
guidance reflects
expected lower
revenue following
the strong 2018
performance.
Weighted average utilisation rate We expect a utilisation
rate in the range of
75%-85%. The 2018
weighted average
utilisation rate was
92%. The main reason
for the expected
lower utilisation rate
is the very strong
performance in 2018.
ZITON · Annual Report 2018 51
BUSINESS PERFORMANCE

On 3 October 2018, ZITON issued a three-year EUR 100 million
first lien bond loan and a three-and-a-half year EUR 25 million
second lien bond loan. The bonds were listed on the Oslo Stock
Exchange on 28 November 2018, under ISIN NO 0010832488
and NO 0010832512 respectively. The key terms of the bond
are set out in note 4.2 to the financial statements.
Proceeds from the bond issues were used to refinance the
outstanding bond, acquire shares in the subsidiary Jack-Up
InvestCo 3 Plc., repay part of the subordinated debt and to pay
transaction costs. The use of proceeds is illustrated below.
USE OF PROCEEDS (EUR ’000)
Repayment of existing bond incl. redemption costs 91,688
Purchase af BWC’s shares in Jack-Up InvestCo 3 Plc. 23,658
Partial repayment of subordinated loan 17,000
Transaction costs 2,500
General corporate purposes -9,845
Total 125,000
The outstanding bond FRN ZITON A/S Senior Secured Call-
able Bond Issue 2016/2019 (ISIN NO 0010751332) was repaid
on 5 November 2018. Repayment of the existing bond amounted
to EUR 91.7m including a premium of 3.02% for early redemp-
tion of the bond.
Jack-Up InvestCo 3 Plc. was established in 2013 as a joint
venture between ZITON A/S and Blue Water Capital S.A. ZITON
A/S acquired the 50% ownership interest held by Blue Water
Capital S.A. on 11 October 2018 at a price of EUR 23.7m.
ZITON made a partial repayment of the subordinated loan
amounting to EUR 17.0m on 11 October 2018.
The proceeds from the bond issues were also used to pay
transaction costs of EUR 2.5m.
Further, ZITON used EUR 9.8m of the cash proceeds from
the refinancing to further reduce debt.
The illustration below shows the capital structure of the ZITON
Group at the end of 2018. The three vessels make up 91.6% of
the assets.
The bond loan agreements define subordinated capital as
equity, plus subordinated loans plus second lien bond loan. The
subordinated capital ratio is subordinated capital as a percent-
age of total assets. The subordinated capital ratio was at 33.8%
at the end of 2018.
CAPITAL
STRUCTUREZITON revised its capital structure in October 2018 with a substantial extension of its debt maturity profile.
ASSETS
VesselsEUR 153 .3m
91.6%
Other assetsEUR 14m
8.4%
ZITON · Annual Report 201852
›
BUSINESS PERFORMANCE

LIABILITIES
Subordinated loansEUR 22 .4m
13.4%
Bond loan, first lienEUR 98 .1m
58.6%
Other liabilitiesEUR 12 .6m
7.5%
EquityEUR 8 .9m
5.3%
Bond loan, second lienEUR 25 .2m
15.1%
Working Capital Facility and leasingEUR 0 .2m
0.1%
The equity is owned by BWB partners, Dansk Bjergning og
Bugsering Holding ApS, OY Finans ApS and management.
The subordinated loan matures on 3 October 2022 and was
provided by a Danish pension fund. There are no instalments on
the subordinated loan, and interest accrues until maturity with
the exception of 2.0% interest payable in cash.
The second lien bond matures on 3 April 2022. There are no
instalments on the second lien bond loan and interest accrues until
maturity. Interest is a floating coupon of 3M EURIBOR + 11.85%.
The first lien bond matures on 3 October 2021 and bears a
floating coupon of 3M EURIBOR + 6.90% with quarterly inter-
est payments. The bond has fixed amortisation of EUR 2.5m on 3
April 2019, 3 October 2019, 3 April 2020 and 3 October 2020.
In addition, this bond loan has a cash sweep of excess liquidity.
The cash sweep is measured semi-annually at the end of June
and the end of December, with the first measurement due at the
end of December 2019. Liquidity in excess of EUR 7.5m is to be
repaid to bondholders at the subsequent interest payment date
at a 2.0% premium.
The working capital facility is renewed annually. The working
capital facility and the bond loans make up a joint security pack-
age with security in all three vessels. The main items of the secu-
rity package are set out in note 6.1 to the financial statements.
ZITON · Annual Report 2018 53
BUSINESS PERFORMANCE
ZITON · Annual Report 2018 53

›
BUSINESS PERFORMANCE
ZITON · Annual Report 201854

EUR ’000IFRS
2014IFRS
2015IFRS
2016IFRS
2017IFRS
2018
Income statement
Revenue 10,433 9,138 29,042 33,227 45,504
EBITDA 4,635 -966 16,411 19,257 30,348
Net financial expenses -793 -14,221 -13,186 -13,168 -17,624
Income before tax 1,929 -21,154 -4,550 -1,841 4,799
Income after tax 573 -16,524 5,804 -2,984 -1,283
Balance sheet items
Non-current assets 164,966 173,108 167,370 161,011 153,424
Current assets 6,320 2,756 6,398 6,720 13,908
Total assets 171,286 175,864 173,768 167,731 167,332
Equity 49,460 42,580 36,824 33,843 8,902
Equity and subordinated capital 88,229 71,892 69,197 69,403 56,483
Current liabilities 11,442 5,983 10,975 8,703 7,278
Cash flows
Net cash flows from operating activities* -867 -1,085 13,790 19,566 31,010
Net cash flows before investment activities* -5,427 -15,071 4,049 10,401 18,416
Net cash used in investing activities -29,535 -11,061 -2,378 -1,474 -24,235
Net cash used/received in financing activities 33,415 25,029 -2,500 -5,500 13,933
Net change in cash and cash equivalents -1,547 -1,103 -829 3,427 8,114
Financial ratios and other key figures
EBITDA margin 44.4% -10.6% 56.5% 58.0% 66.7%
Subordinated capital ratio 51.5% 40.9% 39.8% 41.4% 33.8%
NIBD (adjusted for capitalised financing costs) 68,928 99,888 98,209 89,412 89,321
Loan to vessel ratio 42.0% 60.0% 61.0% 57.9% 58.3%
Total number of operating vessels (average) 1 2 3 3 3
* ZITON has changed the presentation of net cash flows from operating activities excluding financial payments as part of cash flows from operating activities primarily because financial payments relate to finance activities.
KEY
FIGURES
Key ratios have been prepared in accordance with CFA Society Denmark’s online version of ”Recommendations & Ratios”. Financial ratios and other key figures are described in management review ”Alternative Performance Measures”.
The ratios below are not defined in ”Recommendations & Ratios” and are defined as follows:
Subordinated capital ratio = Total equity + Subordinated loans + 2. lien bond loan
Total assets
NIBD (adjusted for capitalised financing costs)Senior Net Interest-Bearing Debt (NIBD) includes bond debt (adjusted for capitalised expenses), the amount drawn on the working capital facility and finance lease liabilities less cash and cash equivalents.
Loan to vessel ratio = NIBD (adjusted for capitalised financing costs)
Vessel book value
ZITON · Annual Report 2018 55
BUSINESS PERFORMANCE


FINANCIAL REVIEW AND STATEMENTS TABLE OF CONTENTS
READING GUIDE:
The following abbreviations I/S, B/S and C/F used
in the notes to these financial statements indicate
amounts that can be found in the income statement,
balance sheet and cash flow statement respectively.
CONSOLIDATED FINANCIAL STATEMENTS
Income Statement . . . . . . . . . . . . . . . . . . . . . . . . . . . . . . . . . . . . . . . . . . . . . . . . . . . . . . 60
Review of Income Statement . . . . . . . . . . . . . . . . . . . . . . . . . . . . . . . . . . . . . . . . . . . 61
Balance Sheet . . . . . . . . . . . . . . . . . . . . . . . . . . . . . . . . . . . . . . . . . . . . . . . . . . . . . . . . . . . 62
Review of Balance Sheet . . . . . . . . . . . . . . . . . . . . . . . . . . . . . . . . . . . . . . . . . . . . . . . . 63
Cash Flow Statement . . . . . . . . . . . . . . . . . . . . . . . . . . . . . . . . . . . . . . . . . . . . . . . . . . . 64
Review of Cash Flow Statement . . . . . . . . . . . . . . . . . . . . . . . . . . . . . . . . . . . . . . . . 65
Statement of Changes In Equity . . . . . . . . . . . . . . . . . . . . . . . . . . . . . . . . . . . . . . . . 66
1. NOTES TO THE CONSOLIDATED FINANCIAL STATEMENTS
1.1 Basis of reporting . . . . . . . . . . . . . . . . . . . . . . . . . . . . . . . . . . . . . . . . . . . . . . . . . . 67
2. OPERATING ACTIVITIES
2.1 Segment reporting . . . . . . . . . . . . . . . . . . . . . . . . . . . . . . . . . . . . . . . . . . . . . . . . . 70
2.2 Staff costs. . . . . . . . . . . . . . . . . . . . . . . . . . . . . . . . . . . . . . . . . . . . . . . . . . . . . . . . . . 71
3. OPERATING ASSETS AND LIABILITIES
3.1 Vessel and equipment. . . . . . . . . . . . . . . . . . . . . . . . . . . . . . . . . . . . . . . . . . . . . . 72
3.2 Intangible assets . . . . . . . . . . . . . . . . . . . . . . . . . . . . . . . . . . . . . . . . . . . . . . . . . . . 75
3.3 Financial assets . . . . . . . . . . . . . . . . . . . . . . . . . . . . . . . . . . . . . . . . . . . . . . . . . . . . 76
3.4 Provisions . . . . . . . . . . . . . . . . . . . . . . . . . . . . . . . . . . . . . . . . . . . . . . . . . . . . . . . . . . 77
3.5 Trade and other receivables . . . . . . . . . . . . . . . . . . . . . . . . . . . . . . . . . . . . . . . 78
3.6 Trade and other payables . . . . . . . . . . . . . . . . . . . . . . . . . . . . . . . . . . . . . . . . . . 79
4. CAPITAL STRUCTURE AND FINANCING
4.1 Risk management . . . . . . . . . . . . . . . . . . . . . . . . . . . . . . . . . . . . . . . . . . . . . . . . . . 80
4.2 Loans. . . . . . . . . . . . . . . . . . . . . . . . . . . . . . . . . . . . . . . . . . . . . . . . . . . . . . . . . . . . . . . 81
4.3 Net financial expenses . . . . . . . . . . . . . . . . . . . . . . . . . . . . . . . . . . . . . . . . . . . . . 84
4.4 Reconciliation of financing liabilities . . . . . . . . . . . . . . . . . . . . . . . . . . . . . . . 84
5. TAX
5.1 Income tax expense . . . . . . . . . . . . . . . . . . . . . . . . . . . . . . . . . . . . . . . . . . . . . . . . 85
5.2 Deferred tax . . . . . . . . . . . . . . . . . . . . . . . . . . . . . . . . . . . . . . . . . . . . . . . . . . . . . . . 86
6. OTHER DISCLOSURES
6.1 Commitments and contingencies . . . . . . . . . . . . . . . . . . . . . . . . . . . . . . . . . . 89
6.2 Share-based payments . . . . . . . . . . . . . . . . . . . . . . . . . . . . . . . . . . . . . . . . . . . . 89
6.3 Fees to auditors . . . . . . . . . . . . . . . . . . . . . . . . . . . . . . . . . . . . . . . . . . . . . . . . . . . . 90
6.4 Related party transactions. . . . . . . . . . . . . . . . . . . . . . . . . . . . . . . . . . . . . . . . . 91
6.5 Subsequent events. . . . . . . . . . . . . . . . . . . . . . . . . . . . . . . . . . . . . . . . . . . . . . . . . 92
6.6 Legal entities . . . . . . . . . . . . . . . . . . . . . . . . . . . . . . . . . . . . . . . . . . . . . . . . . . . . . . . 92
ZITON · Annual Report 2018 59
CONSOLIDATED FINANCIAL STATEMENTS

INCOME STATEMENT
EUR ’000 Note 2018 2017
Revenue 2.1 45,504 33,227
Other operating income 1,340 -
Project-related expenses -2,578 -1,281
Operating expenses -9,186 -8,196
Gross profit 35,080 23,750
Administrative expenses -1,559 -1,712
Staff costs, office staff 2.2 -3,173 -2,781
EBITDA 30,348 19,257
Depreciation and amortisation 3.1 -7,925 -7,930
EBIT 22,423 11,327
Financial income 4.3 1 -
Financial expenses 4.3 -17,625 -13,168
Income before tax 4,799 1,841
Tax on profit (loss) 5.1 -6,082 -1,143
Income for the year 1,283 2,984
Attributable to:
Shareholders of ZITON A/S -3,701 -6,321
Non-controlling interests 2,418 3,337
Income for the year 1,283 2,984
STATEMENT OF COMPREHENSIVE INCOME
EUR ’000 Note 2018 2017
Income for the year 1,283 2,984
Items that will subsequently be reclassified to the income statement when specific conditions are met:
Reserve for equity-settled warrants - -
Exchange adjustments of foreign entities, net of tax - 1
Total comprehensive income for the year, after tax 1,283 2,983
Attributable to:
Shareholders of ZITON A/S -3,701 -6,320
Non-controlling interests 2,418 3,337
Total comprehensive income for the year, after tax 1,283 2,983
INCOME STATEMENT AND STATEMENT OF COMPREHENSIVE INCOME 1 JANUARY - 31 DECEMBER
ZITON · Annual Report 201860
›
CONSOLIDATED FINANCIAL STATEMENTS

Revenue & EBITDAEUR million
0
5
10
15
20
25
30
35
40
45
50
201820172016
33.2
45.5
Revenue EBITDA
30.3
19.3
29.0
16.4
REVIEW OF THE INCOME STATEMENT FOR 2018
RevenueThe consolidated results for ZITON show net revenue for the full year 2018 of EUR 45.5m compared to EUR 33.2m YTD 2017, an increase of 37%. The main reason for the increase in revenue was the solid execution of a strong pipeline of projects.
Other operating incomeOther operating income comprise of the insurance EUR 1.3m from loss of hire from the vessel J/U WIND.
ExpensesTotal expenses in ZITON increased to EUR 16.6m in 2018 from EUR 14.0m in 2017.
Projectrelated expensesProject-related expenses increased to EUR 2.6m in 2018 from EUR 1.3m in 2017. The main reason for the increase in costs was the high level of activity, as well as expenses related to decommissioning projects.
Operating expenses Operating expenses increased to EUR 9.2m in 2018 from EUR 8.2m in 2017. The main reason for the increase in costs was the high level of activity, as well as expenses related to decommissioning projects.
Administrative expensesAdministrative expenses amounted to EUR 1.6m in 2018 compared to EUR 1.7m in 2017.
Staff costs, office staffSalaries for office staff increased to EUR 3.2m in 2018 from EUR 2.8m in 2017. The main reason for the increase of EUR 0.4m was an increase in office staff as a consequence of the higher level of activity.
EBITDAEBITDA was a EUR 30.3m profit for 2018 compared to EUR 19.3m in 2017, an improvement of 58%. The main reason for the increase in EBITDA was the improved level of activity. The initial guidance for 2018 EBITDA was in the range of EUR 21-25m, as reported in the Q4 2017 interim report in February 2018. As revenue in both Q2 and Q3 2018 was better then expected we raised our guidance to a range of EUR 27-28m in November 2018 when releasing our Q3 2018 interim report. EBITDA of EUR 30.3m for 2018 exceeded the upwardly adjusted guidance.
Depreciation and amortisation Depreciation charges of EUR 7.9m in 2018 were unchanged compared to 2017.
Net financialsFinancials, net was an expense of EUR 17.6m in 2018 compared to an expense of EUR 13.2m in 2017. The main reason for the increase was one-off costs related to a revised capital structure and costs to repay an outstanding bond at a 3.02% call premium, double interest until repayment and expensing of capitalised issuance costs ofthe repaid bond. These additional financial costs amounted to EUR 4.2m. Financial income and expenses are described further in note 4.4.
Tax on profit (loss)Tax on profit was an expense of EUR 6.0m. Taxation is described further in note 5.1.
ExpensesEUR million
13 14 15 16 17
14.0
1.3
1.0
-0.1
0.4
16.6
Project-related expenses
Operating expenses
Administrative expenses
Staff costs, office staff
2018
2017
Accumulated EBITDA & expected rangeEUR million
0
5
10
15
20
25
30
35
Q4 2018Q3 2018Q2 2018Q1 2018Q4 2017
Noncontrolling interestsNon-controlling interests are described in ”Statement of changes in equity”.
ZITON · Annual Report 2018 61
CONSOLIDATED FINANCIAL STATEMENTS

BALANCE SHEET 31 DECEMBER
ASSETS
EUR ’000 Note 2018 2017
Noncurrent assets
Vessels, including fixtures & equipment 3.1 153,324 154,517
Intangible assets 3.2 100 105
Financial assets 3.3 - 6,055
Deferred tax assets 5.2 - 334
Noncurrent assets 153,424 161,011
Current assets
Inventories 35 39
Trade and other receivables 3.5 3,031 3,928
Cash and cash equivalents 4.1-4.4 10,842 2,753
Current assets 13,908 6,720
Total assets 167,332 167,731
EQUITY AND LIABILITIES
EUR ’000 Note 2018 2017
EQUITY
Share capital 11,093 11,093
Reserves 189 189
Retained earnings -2,380 3,517
Total equity attributable to shareholders of ZITON A/S 8,902 14,799
Non-controlling interests - 19,044
Total equity 8,902 33,843
LIABILITIES
Noncurrent liabilities
Subordinated loan 4.1-4.4 22,373 35,560
Bond loan, second lien 4.1-4.4 25,208 -
Bond loan, first lien 4.1-4.4 93,630 85,486
Lease obligations 4.1-4.4 159 110
Deferred income tax liabilities 5.2 9,782 4,029
Total noncurrent liabilities 151,152 125,185
Current liabilities
Bond loan, first lien 4.1-4.4 4,478 5,437
Lease obligations 4.1-4.4 14 55
Trade and other payables 3.6 1,488 2,008
Provision for other liabilities 3.4 1,298 1,203
Total current liabilities 7,278 8,703
Total liabilities 158,430 133,888
Total equity and liabilities 167,332 167,731
ZITON · Annual Report 201862
›
CONSOLIDATED FINANCIAL STATEMENTS

Subordinated capital ratioEUR million · Percent
0
20
40
60
80
100
120
140
160
180
200
2018201720160%
10%
20%
30%
40%
50%
60%
70%
80%
90%
100%
69.2
173.8167.4
69.4
167.3
56.5
Equity + Subord. loan +
Subordinated capital ratio
Bond loan, second lien = Subord. capital
Assets Financial covenant
39.8% 41.4%
33.8%
33% 34%30%
REVIEW OF THE BALANCE SHEET 2018
Vessels, including fixtures & equipmentThe total value of the vessels amounted to EUR 153.3m, which was largely unchanged from 2017 primarily due to the transfer of the call option on Jackup-InvestCo 3 Plc. from Financial assets to Vessels offset by annual depreciation charges.
Net working capitalChanges in working capital were negative in the amount of EUR 2.5m in 2018, as changes in accounts receivable were higher than changes in trade payables.
Trade receivablesTrade receivables decreased from EUR 3.6m in 2017 to EUR 1.2m. The decrease was mainly a consequence of the early payment of receivables by a single customer.
Trade payablesTrade payables decreased from EUR 0.7m in 2017 to EUR 0.8m, which was largely unchanged from 2017.
EquityTotal equity declined to EUR 8.9m at the end of 2018 from EUR 33.8m at end 2017. Movements on change in equity are described in ”Statement of changes in equity”.
Subordinated capital ratioThe subordinated capital ratio (defined as total equity plus subordinated capital and the 2nd lien bond loan divided by total assets) at the end of 2018 was 33.8%. The reduction from 41.4% at the end of 2017 was due to the revised capital structure which reduced both equity and subordinated loans, but was partly offset by a new second lien bond loan. The subordinated capital ratio has a safe margin relative to the company’s only financial covenant, which required a subordinated capital ratio of 30.0% or higher, at the end of Q4 2018.
Net Interest Bearing Debt (NIBD)NIBD includes bond debt (adjusted for capitalised expenses), the amount drawn on the working capital facility and finance lease liabilities less cash and cash equivalents.
Change in NIBDNIBD decreased from EUR 89.4m in 2017 to 89.3m in 2018. The decrease was driven by positive EBITDA of EUR 30.3m and working capital adjustments, which was offset by finance costs and purchase of non-controlling interests.
Net working capitalEUR million
-3
-2
-1
0
1
2
3
4
5
201820172016
4.2
-1.5
3.6
1.2
-0.7 -0.8
Trade receivables Net working capitalTrade payables
2.92.7
0,4
Vessels, including fixtures & equipmentEUR million
150 155 160 165
154.5
-0.2
7.1
-0.1
-7.9
153.3
Currency adjustments
Additions
Disposals
Depreciation
2018
2017
ZITON · Annual Report 2018 63
CONSOLIDATED FINANCIAL STATEMENTS

CASH FLOW STATEMENT1 JANUARY - 31 DECEMBER
EUR ’000 Note 2018 2017
Income before tax 4,799 1,841
OPERATING ACTIVITIES
Adjustments for noncash items
Reversal of financial expenses, net 4.3 17,625 13,156
Depreciation and writedowns for the period 3.1 7,925 7,930
Other adjustments -1,743 457
Working capital adjustments
Changes in inventories 3 -38
Change in trade receivables 2,314 639
Change in trade payables 87 -737
Income tax expense
Income tax expense - -
Net cash flows from operating activities 31,010 19,566
FINANCIAL PAYMENTS
Financial receipts - -
Financial payments -12,594 -9,165
Net cash flows before investing activities 18,416 10,401
INVESTING ACTIVITIES
Purchase of vessel, including fixtures & equipment (excl. interest) 3.1 -589 -1,474
Purchace of non-controlling interests 1) -23,646 -
Net cash used in investing activities 24,235 1,474
FINANCING ACTIVITIES
Proceeds from bank and bond loans 4.4 -108,407 -5,500
Repayment of debt to bank and bondholders 4.4 122,340 -
Net cash used/received in financing activities 13,933 5,500
Net change in cash and cash equivalents 4.4 8,114 3,427
Cash and cash equivalents at beginning of period 4.4 2,753 -670
Exchange gains/losses on cash and cash equivalents -25 -4
Cash and cash equivalents at end of period 2) 4.4 10,842 2,753
1) See Statement of changes in equity.2) Cash and cash equivalents in the cash flow statement include drawings on working capital facility.
ZITON · Annual Report 201864
›
CONSOLIDATED FINANCIAL STATEMENTS

REVIEW OF CASH FLOWS FOR 2018
Operating activitiesCash flows from operating activities were an inflow of EUR 31.0m in 2018 as a result of the positive EBITDA.
Investing activitiesInvestment activities in 2018 consisted of the purchase of the non- controlling interests in Jack-Up InvestCo 3 Plc (EUR 23.6 m). CAPEX investments for the year were EUR 0.6 m.
Financing activitiesIn October 2018, ZITON A/S refinanced its bond and subordinated loan by repaying the existing bond loan and making a down payment of EUR 17.0m on the subordinated loan. The new financing of ZITON resulted in a re-negotiated subordinated loan, a first lien bond and a second lien bond.
EUR 6.0 m was repaid to bondholders during 2018. In 2019, EUR 5.0m will be repaid to bondholders, excluding any cash sweep.
Available liquidity Available liquidity including drawings available on the working capital facility amounted to EUR 16.3m at the end of 2018. This was EUR 8.0m higher than at the end of 2017, mainly due to positive operating cash flows during the period.
EUR million 2016 2017 2018
Cash and cash equivalents 1.9 2.8 10.8
Cash on retention account -1.1 -1.2 -1.2
Liquidity 0.8 1.6 9.6
Utilised working capital facility -2.6 0.0 0.0
Available draw on working capital facility 6.7 6.7 6.7
Available liquidity 4.9 8.3 16.3
Investing activities vs. depreciationEUR million
0
5
10
15
20
25
30
201820172016
2.4 1.5
24.2
Investing activities Depreciation
7.87.9 7.9
Debt repayment next four yearsEUR million
0
20
40
60
80
100
Q4Q3Q2Q1Q4Q3Q2Q1Q4Q3Q2Q1Q4Q3Q2Q1
2019 2020 2021 2022
2.5 2.5 2.5 2.5
90.0
37.8 35.7
Bond loan, first lien Bond loan, second lien Subordinated loan
Cash flowsEUR million
-10 0 10 20 30 40
30.3
2.4
-1.7
31.0
-12.6
18.4
-24.2
8.0
13.9
EBITDA
Net working capitaladjustments
Other adjustments
Financial payments
Net cash flows from operating activities
Net cash flows before investment activities
Investing activities
Financing activities
Net change in cash and cash equivalents
ZITON · Annual Report 2018 65
CONSOLIDATED FINANCIAL STATEMENTS

STATEMENT OF CHANGES IN EQUITY
Attributable to shareholders of ZITON A/S
2018EUR ’000
Share capital
Reserve for
warrantsTranslation
reservesTotal
reservesRetained earnings Total
Non-controlling
interestsTotal
equity
Balance at 31 December 2017 11,093 143 46 189 3,517 14,799 19,044 33,843
Total comprehensive income for the year, after tax - - - - -3,701 -3,701 2,418 -1,283
Loss from purchase of non-controlling interests - - - - -2,196 -2,196 -21,462 -23,658
Balance at 31 December 2018 11,093 143 46 189 2,380 8,902 8,902
As of October 2018 ZITON A/S purchased the remaining non-controlling interests owned by BWC S.A. (50%) in the Malta-based company Jack-Up InvestCo 3 Plc. Non-controlling interest of EUR 2.4 m represents 50% of the income for the year 1 January 2018 - 3 October 2018. The effect of eliminating the remaining non-controlling interests and the premium loss recognised to the equity is set out here:
Purchase of non-controlling interests in Jackup-InvestCo 3 Plc. -23,658
- Non-controlling interests’ equity as of 3 October 2018 19,044
- Non-controlling interests’ share of income for the year end 3 October 2018 2,418
Loss from purchase of noncontrolling interests 2,196
Share capitalAt the end of 2018, the share capital consisted of 82,782,192 shares of DKK 1 each (EUR 11,093K). The shares are divided into two classes: 15,118,416 A shares of DKK 1 each and 67,663,782 B shares of DKK 1 each. Each A share carries one vote, while B shares do not carry voting rights, but carry preferential rights of dividend.
› ACCOUNTING POLICIESReserves on equity consist of the following:Reserve for warrants consists of warrants to management, selected employees and a subordinated loan providerThe translation reserve comprises foreign exchange differences arising on translation of financial statements of entities that have a functional currency other than DKK and translation from the functional currency to the presentation currency.
Attributable to shareholders of ZITON A/S
2017EUR ’000
Share capital
Reserve for
warrantsTranslation
reservesTotal
reservesRetained earnings Total
Non-controlling
interestsTotal
equity
Balance at 31 December 2016 11,093 143 45 188 9,838 21,119 15,705 36,824
Reserve for equity settled warrants - - - - - - -
Total comprehensive income for the year, after tax - - 1 1 -6,321 -6,320 3,339 -2,981
Balance at 31 December 2017 11,093 143 46 189 3,517 14,799 19,044 33,843
Share capitalAt the end of 2017, the share capital consisted of 82,782,192 shares of DKK 1 each (EUR 11,093K). The shares are divided into two classes: 15,118,416 A shares of DKK 1 each and 67,663,782 B shares of DKK 1 each. Each A share carries one vote, while B shares do not carry voting rights, but carry preferential rights of dividend.
ZITON · Annual Report 201866
›
CONSOLIDATED FINANCIAL STATEMENTS

NOTES TO THE CONSOLIDATED FINANCIAL STATEMENTS
GENERAL INFORMATIONZITON A/S is a public limited company incorporated in Horsens, Denmark. ZITON A/S is controlled by Jack-Up Holding A/S, which holds 59.5% of the share capital in ZITON A/S. Dansk Bjergning & Bugsering Holding ApS and OY Finans ApS hold 25.1% and 14.8% of the share capital respectively. The remaining shares, equivalent to 0.6% of the share capital, are held by management. The ultimate parent of the Group is Jack-Up Holding A/S’s holding company, Anpartsselskabet af 1. december 2011 ApS. ZITON A/S is consolidated in the financial statements of Jack-Up Holding A/S (registered office: Fredensborg, Denmark) and 1. december 2011 ApS (registered office: Fredensborg, Denmark).
The consolidated financial statements of ZITON A/S have been prepared in accordance with International Financial Reporting Standards (IFRS) as adopted by the EU and additional Danish disclosure requirements for annual reports of reporting class D companies.
The accounting policies are unchanged from last year.
The consolidated financial statements are presented in EUR thousands (EUR ´000).
The financial statements have been prepared on a historical cost basis except for certain financial assets that are measured at fair value at the end of each reporting period, as explained in the accounting policies for note 3.3.
Significant accounting policies adopted in the preparation of these consolidated financial statements are disclosed in relevant notes. If no relevant note exists, the accounting policies are listed in this note. These policies have been consistently applied to all the years presented, unless otherwise stated. The consolidated financial statements are for the group consisting of ZITON A/S and its subsidiaries.
Furthermore, significant accounting judgments, estimates and assumptions used in these consolidated financial statements are disclosed in relevant notes. If no relevant note exists, the significant accounting judgments, estimates and assumptions are listed in this note.
ACCOUNTING POLICIESBasis of consolidationThe consolidated financial statements incorporate the financial statements of the company and entities controlled by the company. Control is achieved when the company: · has the power over the investee; · is exposed, or has rights, to variable returns from its involvement with
the investee, and; · has the ability to use its power to affect its returns.
The company reassesses whether or not it controls an investee if facts and circumstances indicate that there are changes to one or more of the three elements of control listed above.
When the company has less than a majority of the voting rights of an investee, it has power over the investee when the voting rights are
sufficient to give it the practical ability to direct the relevant activities of the investee unilaterally. The company considers all relevant facts and circumstances in assessing whether or not the company’s voting rights in an investee are sufficient to give it power, including: · the size of the company’s holding of voting rights relative to the size
and dispersion of holdings of the other vote holders; · potential voting rights held by the company, other vote holders or
other parties; · rights arising from other contractual arrangements, and; · any additional facts and circumstances that indicate that the company
has, or does not have, the current ability to direct the relevant activities at the time that decisions need to be made, including voting patterns at previous shareholders’ meetings.
Consolidation of a subsidiary begins when the company obtains control over the subsidiary and ceases when the company loses control of the subsidiary. Specifically, income and expenses of a subsidiary acquired or disposed of during the year are included in the consolidated statements of profit or loss and other comprehensive income from the date the company gains control until the date when the company ceases to control the subsidiary.
The consolidated financial statements of ZITON A/S Group consist of the 100% owned subsidiaries Jack-Up InvestCo 2 A/S, ZITON Contractors A/S, Jack-Up InvestCo 3 Plc. and ZITON Ltd.
Profit or loss and each component of other comprehensive income are attributed to the shareholders of the ZITON A/S and to the non-controlling interests. Total comprehensive income of subsidiaries is attributed to the owners of the company and to the non-controlling interests even if this results in the non-controlling interest having a deficit balance.
Non-controlling interests in the results and equity of subsidiaries are shown separately in the consolidated income statement, statement of comprehensive income, statement of changes in equity and balance sheet respectively.
Intercompany transactions, balances and unrealised gains on transactions between group companies are eliminated. Unrealised losses are also eliminated unless the transaction provides evidence of an impairment of the transferred asset. Accounting policies of subsidiaries have been changed where necessary to ensure consistency with the policies adopted by the Group.
Foreign currenciesFunctional and presentation currencyItems included in the financial statements of each of the Group’s entities are measured using the currency of the primary economic environment in which the entity operates (‘the functional currency’). Although the functional currency for ZITON A/S is DKK, the consolidated financial statements are presented in euro.
Transactions and balancesForeign currency transactions are translated into the functional currency using the exchange rates at the dates of the transactions. Foreign exchange gains and losses resulting from the settlement of such transactions and from the translation of monetary assets and liabilities denominated in foreign currencies at year-end exchange rates are
1 .1 BASIS OF REPORTING
ZITON · Annual Report 2018 67
NOTES

generally recognised in profit or loss. They are deferred in equity if they are attributable to part of the net investment in a foreign operation.
Foreign exchange gains and losses that relate to borrowings are presented in the income statement under financial income/expenses. All other foreign exchange gains and losses are presented in the income statement on a net basis under revenue or other expenses.
Non-monetary items that are measured at fair value in a foreign currency are translated using the exchange rates at the date when the fair value was determined. Translation differences on assets and liabilities carried at fair value are reported as part of the fair value gain or loss.
Group companiesThe results and financial position of foreign operations (none of which has the currency of a hyperinflationary economy) that have a functional currency different from the presentation currency are translated into the presentation currency as follows: · assets and liabilities for each balance sheet presented are translated
at the closing rate at the date of that balance sheet; · income and expenses for each income statement and statement of
comprehensive income are translated at average exchange rates (unless this is not a reasonable approximation of the cumulative effect of the rates prevailing on the transaction dates, in which case income and expenses are translated at the dates of the transactions), and;
· all resulting exchange differences are recognised in other comprehensive income.
Foreign currency translationOn consolidation, exchange differences arising from the translation of any net investment in foreign entities are recognised in other comprehensive income. When a foreign operation is sold or any borrowings forming part of the net investment are repaid, the associated exchange differences are reclassified to profit or loss as part of the gain or loss on sale.
InventoriesInventories primarily comprise bunker onboard vessels. Inventories are measured at the lower of cost according to the FIFO method and net realisable value.
LeasingLeases of property, plant and equipment where the Group, as lessee, has substantially all the risks and rewards of ownership are classified as finance leases (note 3.1 Vessels and equipment). Finance leases are capitalised at the inception of the lease at the fair value of the leased property or, if lower, the present value of the minimum lease payments. The corresponding rental obligations, net of finance charges, are included in other short-term and long-term lease obligations. Each lease payment is allocated between the liability and financial expenses. The finance cost is charged to profit or loss over the lease period so as to produce a constant periodic rate of interest on the remaining balance of the liability for each period. Property, plant and equipment acquired under finance leases is depreciated over the asset’s useful life or over the shorter of the asset’s useful life and the lease term if there is no reasonable certainty that the Group will obtain ownership at the end of the lease term. Leases in which a significant portion of the risks and rewards of owner-ship are not transferred to the Group as lessee are classified as operating
leases (note 6.1 Commitments and contingencies). Payments made under operating leases (net of any incentives received from the lessor) are charged to profit or loss on a straight-line basis over the period of the lease.
Income statementProjectrelated expensesProject-related expenses consist of expenses in relation to projects and primarily involve expenses to subcontractors, tugboat, seabed analysis and special equipment used for operations. Like revenue, operating costs are recognised upon delivery of the service.
Operating expensesOperation of vessels comprises expenses other than project-related expenses incurred to generate the revenue for the year. Vessel operating costs are divided into fixed and variable expenses. As vessel are obligated by law to have a minimum crew, staff expenses for employees are considered a fixed expense. Fixed expenses include, insurance, maintenance expenses, staff costs, etc. Variable expenses include bunker, grease and other expenses to move the vessel. Like revenue, operating costs are recognised upon delivery of the service.
Administrative expensesAdministrative expenses comprise cost of rent, travel, external expenses and other office expenses, etc. Administrative expenses are recognised upon delivery of the service.
Cash flowsThe cash flow statement shows the cash flows from operating, investing and financing activities for the year, the year’s changes in cash and cash equivalents as well as cash and cash equivalents at the beginning and end of the year.
Cash flows from operating activities are calculated according to the indirect method as the income before tax adjusted for non-cash operating items and changes in working capital. Cash flows from investing activities comprise payments in connection with acquisitions and disposals of intangible assets, property, plant and equipment and other non-current assets.
Cash flows from financing activities comprise changes in the share capital and related costs as well as the raising of loans, repayment of bank and bond debt, acquisition and disposal of subordinated debt and payment of dividends to shareholders and changes on working capital facility.
SIGNIFICANT ACCOUNTING JUDGMENTS, ESTIMATES AND ASSUMPTIONSThe preparation of the Group’s consolidated financial reporting requires management to make judgments, estimates and assumptions that affect the reported amounts of revenues, expenses, assets and liabilities and the disclosure of contingent liabilities, at the end of the reporting period. However, uncertainty about these assumptions and estimates could result in outcomes that require a material adjustment to the carrying amounts of asset and liability affected in future periods.
ZITON · Annual Report 201868
›
NOTES

JudgmentsIn the process of applying ZITON A/S’s accounting policies, management has made the following judgments which have the most significant effects on the amounts recognised in the financial statements.
Estimates and assumptionsThe key assumptions concerning the future and other key sources of estimation uncertainty at the reporting date that involve a significant risk of causing a material adjustment to the carrying amount of assets and liabilities within the next financial year are discussed in relevant notes listed below.
The accounting estimates and assumptions which management deems to be significant to the preparation of the consolidated financial statements are: · Impairment of vessels (note 3.1) · Valuation of financial assets (note 3.3) · Leases (note 3.1 and 6.1) · Trade receivable (note 3.5) · Deferred tax (note 5.2) · Provisions (note 3.4) · Contingent liabilities (note 6.1)
RELEVANT NEW ACCOUNTING STANDARDSZITON A/S has adopted the following amended standards and interpretations effective from 1 January 2018.
IFRS 9 - Financial instruments. The number of categories of financial assets has been reduced to three: amortised cost category, fair value through other comprehensive income category and fair value through the income statement category. Simplified rules regarding hedge accounting are introduced, and impairment of receivables are based on expected loss.
Based on historical data of recognised losses on accounts receivable, a limited number of and well-known clients ZITON A/S has not recognised any provision for doubtful accounts (please refer to note 3.5, Trade and other receivables).
IFRS 15 – Revenue from Contracts with Customers was published in May 2014 and established a single comprehensive model for entities to use in accounting for revenue arising from contracts with customers.
We have applied the five-step model framework on our current revenue streams and have not identified any significant effect on recognition and measurement. The standard is implemented using the modified retrospective method. ZITON has made use of the relief option of not restating comparative figures and have only applied IFRS 15 to contracts that were not completed at 1 January 2018.
Contracts are identified as lease contracts, service agreements or de-construction contracts. Lease agreements, which are either time charter or bareboat charters, are recognised on a straight line during the lease period in accordance to IAS 17. Service or de-construction contracts are typically turnkey and fixed price contracts in accordance with IFRS 15. Where contracts are identified as service or de-construction contracts, revenue is recognised at a point in time when all performance obligations have been delivered. At 31 December 2018 all contracts and performanceobligations had been compleated.
NEW STANDARDS AND INTERPRETATIONS NOT YET ADOPTEDThe IASB has issued a number of new or amended standards and interpretations that are not mandatory for the consolidated financial statements for 2018. ZITON A/S expects to adopt the standards and interpretations as they become mandatory. None of these amended standards or interpretations are expected to have a significant impact on recognition and measurement, but may lead to further disclosures in the notes.
IFRS 16 - Leases. For the lessee, the distinction between finance and operating leases will be eliminated. In the future, operating leases including rental agreements on i.e. office and inventory must be recognised in the balance sheet with an asset and a corresponding lease commitment. The standard takes effect in 2019 and is not expected to have a significant effect on the consolidated financial statements. It is estimated that assets and liabilities will increase by EUR 1m during the first quarter of 2019 based on current operational lease and rental contracts. The effect on the income statement 2019 will be an estimated reduction in operating expenses of EUR 0.7m, which will be offset by additional depreciation of EUR 0.4m and lease interest expenses of EUR 0.3m.
Further, in 2019 minor amendments on changes to the interpretation of uncertain tax positions (IFRIC 23 ), and two minor amendments on the interpretation of Financial instruments (IFRS 9) and long term investments in associated companies and joint ventures (IAS 28). The new amendments are not expected to have any significant effect on the consolidated financial statement.
ZITON · Annual Report 2018 69
NOTES

2 .1 SEGMENT REPORTING
The internal reporting framework used for reporting on revenue and expenses to the Executive Management team and the Board of Directors has been set up to reflect and report on vessel and ZITON Contractors A/S revenue and expenses. As all three vessels including ZITON Contractors A/S operate on similar assignments, management reviews the results of the Group as a whole to assess performance. Thus, there is only one operating segment.
RevenueThe Group operates in northern Europe. The geographical distribution of fixed-priced revenue is based on the country in which the wind farm is located. For time charter contracts, the geographical distribution is based on the position of the vessel, during the contract.
Geographical distribution of revenue
EUR ’000 2018 2017
Denmark 29,993 14,029
United Kingdom 8,962 17,804
Sweden 3,974 -
Germany 1,675 257
Holland 490 955
Belgium 409 182
Total I/S 45,504 33,227
Sales to the three largest customers made up 53%, 14% and 12%, respectively, of total revenue in 2018 (2017: 72% and 10%, respectively).
› ACCOUNTING POLICIESRevenue is measured at the fair value of the consideration received or receivable. Amounts disclosed as revenue are reduced for estimates for trade allowances, rebates and amounts collected on behalf of third parties. The Group recognises revenue when the amount of revenue can be reliably measured, it is probable that future economic benefits will flow to the entity and specific criteria have been met for each of the Group’s activities as described below. The Group bases its estimates on historical results, taking into consideration the type of customer, the type of transaction and the specifics of each engagement.
For vessels on fixed-price contracts, the type of service provided is analysed as either a lease, service or construction contract. Where contracts are identified as service or construction contracts, revenue is recognised at a point in time when all performance obligations have been delivered. Where contracts are identified as a lease (Time Charter) the revenue recognition is based on a straight-line basis over the term of the lease period.
ZITON · Annual Report 201870
›
NOTES · OPERATING ACTIVITIES

2 .2 STAFF COSTS
Total staff costs in the Group
EUR ’000 2018 2017
Staff costs, office staff
Wages and salaries 2,950 2,566
Pensions – defined contribution plans 207 201
Other social security costs 17 14
Total office staff I/S 3,173 2,781
Vessel staff the amount is included in "Operating expenses"
Wages and salaries 4,323 3,648
Pensions – defined contribution plans 263 252
Other social security costs 86 44
Total vessel staff 4,672 3,944
Total staff costs 7,845 6,726
Average number of employees
2018 2017
Office staff 29 23
Vessel staff, Danish nationalities 57 55
Vessel staff, other EU nationalities 18 18
Total employees 104 96
ZITON · Annual Report 2018 71
NOTES · OPERATING ACTIVITIES

3 .1 VESSELS AND EQUIPMENT
2018EUR ’000
Fixtures & equipment Vessels Total
Cost at 1 January 775 184,295 185,070
Exchange rate adjustments -2 -301 -303
Additions 582 6,499 7,082
Disposals - -142 -142
Cost at 31 December 1,353 190,351 191,704
Depreciation at 1 January -195 -30,359 -30,554
Exchange rate adjustments 1 60 61
Depreciation I/S -176 -7,725 -7,901
Disposals - 12 12
Depreciation at 31 December 368 38,012 38,380
Impairment losses at 1 January - - -
Impairment losses at 31 December - - -
Carrying amount at 31 December B/S 985 152,339 153,324
- of which capitalised interest, at an average interest rate of 11.7% (Capitalised in 2018: EUR 0k). 16,629 16,629
At 31 December 2018, EUR 185k of the carrying amount of fixtures & equipment was car finance leases.
ZITON · Annual Report 201872
›
NOTES · OPERATING ASSETS AND LIABILITIES

3 .1 VESSELS AND EQUIPMENT (CONTINUED)
2017EUR ’000
Fixtures & equipment Vessels Total
Cost at 1 January 692 183,395 184,087
Transferred between asset categories -254 254 -
Exchange rate adjustments -1 -140 -141
Additions 539 901 1,440
Disposals -201 -115 -316
Cost at 31 December 775 184,295 185,070
Depreciation at 1 January -317 -22,457 -22,774
Transferred between asset categories 132 -132 -
Exchange rate adjustments - 19 19
Depreciation I/S -121 -7,798 -7,919
Disposals 111 9 120
Depreciation at 31 December 195 30,359 30,554
Impairment losses at 1 January - - -
Impairment losses at 31 December - - -
Carrying amount at 31 December B/S 580 153,936 154,516
- of which capitalised interests, at an average interest rate of 11.7%. (Capitalised in 2017: EUR 0k). 17,362 17,362
At 31 December 2017, EUR 195k of the carrying amount of fixtures & equipment was car finance leases.
Impairment of vesselsAssets are tested for impairment whenever events or changes in circumstances indicate that the carrying amount may not be recoverable. An impairment loss is recognised at the amount by which the asset’s carrying amount exceeds its recoverable amount – measured using the higher of fair value less cost to sell and value in use. An impairment loss is recognised if the higher of fair value less cost to sell and value in use is less than the carrying amount of the assets.
The value in use is calculated as the present value of the total expected cash flows during the rest of the vessels’ economic lives. This includes any concluded framework agreements and signed charters and by using estimated utilisation and average day rates for the ”open charter periods”. · The estimated utilisation is based on projected future installation of offshore turbines, the average rate at which a turbine needs assistance
from a jack-up vessel in the turbine’s lifetime and ZITON´s expected market share. · Average day rates are based on estimated future market prices and/or contracts.
Hence, the exact value used to measure impairment charges is subject to uncertainty and is based on what the company believes is the best estimate of the fair value. The budget used for the impairment test is based on a five-year period and a terminal period.
Management’s assessment of indication of impairment on vessels is based on the cash-generating unit (CGU) in which all vessels are included.
An impairment test is carried out based on value in use when impairment issues exist. The impairment test is performed by estimating the recoverable amount at value in use calculated as the present value of the total expected cash flows during the rest of the vessels’ economic lives and a determined WACC of 7.8% and a growth rate in the terminal period of 0%. The value in use was estimated to be materially higher than the carrying amount of EUR 152,339k.
Management assesses that the long-term value at the close of the financial year exceeds the carrying amount, and that, accordingly, there is no impairment.
ZITON · Annual Report 2018 73
NOTES · OPERATING ASSETS AND LIABILITIES

3 .1 VESSELS AND EQUIPMENT (CONTINUED)
› SIGNIFICANT ESTIMATES AND ASSUMPTIONS – IMPAIRMENT OF VESSELSSignificant accounting estimates include i.e. estimates of useful lives, residual values and impairment on tangible assets.
Useful lives of the vesselsThe useful lives of the vessel are assessed annually by the COO. At the current depreciation rate, the vessel are fully depreciated over 15 to 22 years.
Residual valuesThe residual values of the vessels are estimated at zero as it is expected that scrapping of the vessels will include expenses equivalent to the value of the steel.
ImpairmentRevenue for ”open charter periods” is estimated based on projected future installation of offshore turbines, the average rate at which a turbine needs assistance from a jack-up vessel in the turbine’s lifetime and ZITON´s expected market share. Average day rates are based on either already signed framework agreement or historical prices. The value in use calculation is sensitive to fluctuations in expected day rates and vessel utilisation. However, an increase of the WACC of 2 percentage points to 9.8% or a reduction of either 9.6% in utilisation or day rates will not lead to a value in use lower than the current carrying amount of the vessels.
› SIGNIFICANT ESTIMATES AND ASSUMPTIONS – LEASESManagement’s assessment of whether leases on assets should be classified as finance or operating leases is based on an overall evaluation of each lease. In finance leases, a non-current asset and a payable are recognised. In classification as operating leases, the regular lease payments are generally recognised in the income statement. As of 2019, all leases are classified as finance leases.
› ACCOUNTING POLICIESThe Group’s accounting policy for vessels and fixtures and equipment is stated at historical cost less depreciation. Historical cost includes expenditure that is directly attributable to the acquisition of the items. This includes capitalised staff costs and interest.
Subsequent costs are included in the asset’s carrying amount or recognised as a separate asset, as appropriate, only when it is probable that future economic benefits associated with the item will flow to the Group and the cost of the item can be measured reliably. The carrying amount of any component accounted for as a separate asset is derecognised when replaced. All other repairs and maintenance are charged to profit or loss during the reporting period in which they are incurred.
The basis of depreciation is allocated on a straight-line basis over the estimated useful lives of the assets as follows:
Vessels: between 20 and 30 yearsInstalled equipment on vessels: between 3 and 12 yearsMachinery & tools: between 3 and 10 years
Docking costs of the vessels are capitalised and depreciated over the period until the next docking, typically 5 years.
Gains and losses on disposals are determined by comparing proceeds with carrying amounts. These are included in profit or loss. When revalued assets are sold, it is group policy to transfer any amounts included in other reserves in respect of those assets to retained earnings.
An asset’s carrying amount is written down immediately to its recoverable amount if the asset’s carrying amount is greater than its estimated recoverable amount.
ZITON · Annual Report 201874
›
NOTES · OPERATING ASSETS AND LIABILITIES

3 .2 INTANGIBLE ASSETS
2018EUR ’000 Software Total
Cost at 1 January 108 108
Exchange rate adjustments - -
Additions 12 12
Disposals - -
Cost at 31 December 120 120
Depreciation at 1 January -3 -3
Exchange rate adjustments - -
Amortisation I/S -17 -17
Disposals - -
Depreciation at 31 December 20 20
Impairment losses at 1 January - -
Impairment losses at 31 December - -
Carrying amount at 31 December B/S 100 100
2017EUR ’000 Software Total
Cost at 1 January - -
Exchange rate adjustments - -
Additions 108 108
Disposals - -
Transferred during the year - -
Cost at 31 December 108 108
Depreciation at 1 January - -
Exchange rate adjustments - -
Amortisation I/S -4 -4
Disposals - -
Depreciation at 31 December 4 4
Impairment losses at 1 January - -
Impairment losses at 31 December - -
Carrying amount at 31 December B/S 104 104
ZITON · Annual Report 2018 75
NOTES · OPERATING ASSETS AND LIABILITIES

3 .2 INTANGIBLE ASSETS (CONTINUED)
› ACCOUNTING POLICIESThe Group’s accounting policy for intangible assets is stated at historical cost less amortisation. Historical cost includes expenditure that is directly attributable to the acquisition of the items.
Subsequent costs are included in the asset’s carrying amount or recognised as a separate asset, as appropriate, only when it is probable that future economic benefits associated with the item will flow to the Group and the cost of the item can be measured reliably.
The basis of amortisation is allocated on a straight-line basis over the estimated useful lives of the assets as follows: Software: between 3 and 7 years
An asset’s carrying amount is written down immediately to its recoverable amount if the asset’s carrying amount is greater than its estimated recoverable amount.
3 .3 FINANCIAL ASSETS
When Jack-Up InvestCo 3 Plc. was established ZITON A/S received a call option to purchase the remaining non-controlling interests. In 2015, a prepayment of EUR 6,057k on the call option was made to the non-controlling interest as part of the Group’s revised capital structure. ZITON A/S recognised the prepayment as a call option to acquire all remaining shares in Jack-Up InvestCo 3 Plc. from the co-investor (the non-controlling interests).
During October 2018 and as part of refinancing, ZITON A/S executed its rights to acquire all remaining shares in Jack-Up InvestCo 3 Plc. The call option has been transferred to tangible assets as part of the vessel J/U WIND SERVER.
2018EUR ’000
Assets at fair value
through P/L Total
Fair value at 1 January 6,055 6,055
- Transferred to tangible assets -6,055 -6,055
Fair value at 31 December B/S
2017EUR ’000
Assets at fair value
through P/L Total
Fair value at 1 January 6,055 6,055
Fair value at 31 December B/S 6,055 6,055
› ACCOUNTING POLICIESThe group classifies its financial assets in the following categories: · financial assets at fair value through profit or loss, · loans and receivables, · held-to-maturity investments, and · available-for-sale financial assets.
The classification depends on the purpose for which the investments were acquired. Management determines the classification of its investments at initial recognition and, in the case of assets classified as held-to-maturity, re-evaluates this designation at the end of each reporting period.
On initial recognition, the group measures a financial asset at its fair value. Transaction costs of financial assets carried at fair value through profit or loss are expensed in profit or loss.
Financial assets are measured at fair value and changes in the fair value are recognised as gains or losses through the profit and loss as either other income or other expenses.
ZITON · Annual Report 201876
›
NOTES · OPERATING ASSETS AND LIABILITIES
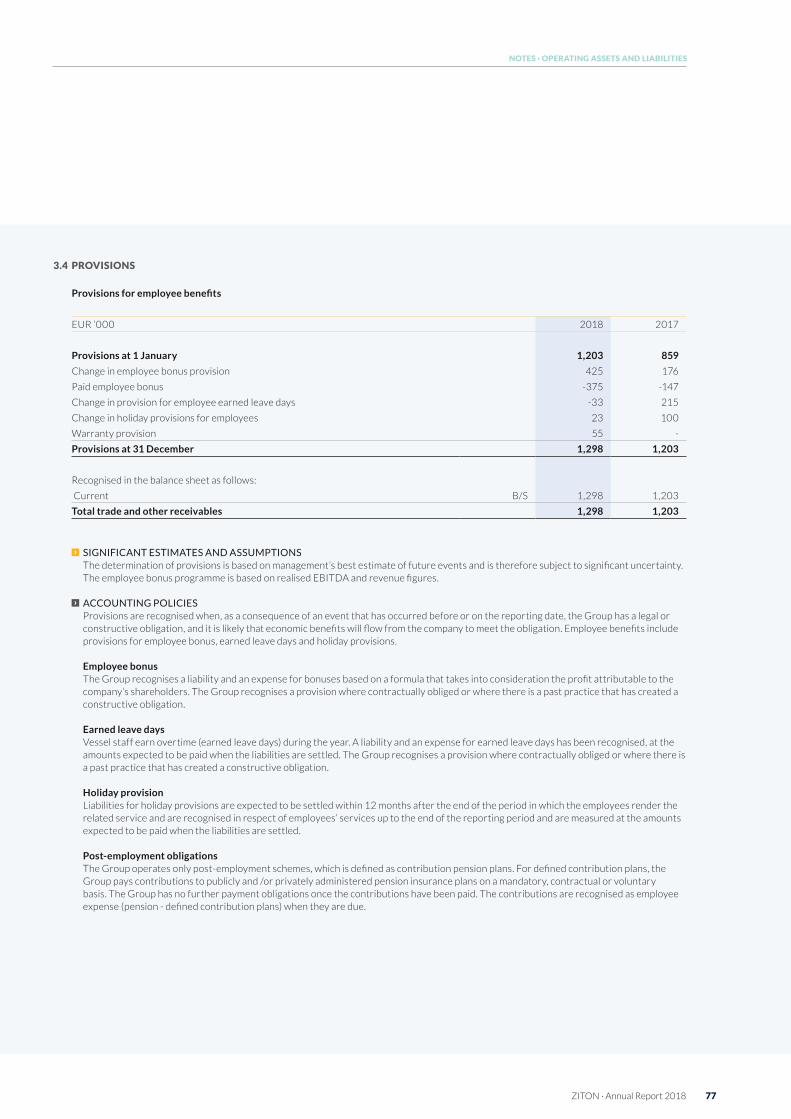
3 .4 PROVISIONS
Provisions for employee benefits
EUR ’000 2018 2017
Provisions at 1 January 1,203 859
Change in employee bonus provision 425 176
Paid employee bonus -375 -147
Change in provision for employee earned leave days -33 215
Change in holiday provisions for employees 23 100
Warranty provision 55 -
Provisions at 31 December 1,298 1,203
Recognised in the balance sheet as follows:
Current B/S 1,298 1,203
Total trade and other receivables 1,298 1,203
› SIGNIFICANT ESTIMATES AND ASSUMPTIONSThe determination of provisions is based on management’s best estimate of future events and is therefore subject to significant uncertainty. The employee bonus programme is based on realised EBITDA and revenue figures.
› ACCOUNTING POLICIESProvisions are recognised when, as a consequence of an event that has occurred before or on the reporting date, the Group has a legal or constructive obligation, and it is likely that economic benefits will flow from the company to meet the obligation. Employee benefits include provisions for employee bonus, earned leave days and holiday provisions.
Employee bonusThe Group recognises a liability and an expense for bonuses based on a formula that takes into consideration the profit attributable to the company’s shareholders. The Group recognises a provision where contractually obliged or where there is a past practice that has created a constructive obligation.
Earned leave days Vessel staff earn overtime (earned leave days) during the year. A liability and an expense for earned leave days has been recognised, at the amounts expected to be paid when the liabilities are settled. The Group recognises a provision where contractually obliged or where there is a past practice that has created a constructive obligation.
Holiday provisionLiabilities for holiday provisions are expected to be settled within 12 months after the end of the period in which the employees render the related service and are recognised in respect of employees’ services up to the end of the reporting period and are measured at the amounts expected to be paid when the liabilities are settled.
Postemployment obligationsThe Group operates only post-employment schemes, which is defined as contribution pension plans. For defined contribution plans, the Group pays contributions to publicly and /or privately administered pension insurance plans on a mandatory, contractual or voluntary basis. The Group has no further payment obligations once the contributions have been paid. The contributions are recognised as employee expense (pension - defined contribution plans) when they are due.
ZITON · Annual Report 2018 77
NOTES · OPERATING ASSETS AND LIABILITIES

3 .5 TRADE AND OTHER RECEIVABLES
EUR ’000 2018 2017
Trade receivables 1,240 3,554
Provision for impairment - -
Other receivables 1,397 37
Intercompany receivables 323 140
Prepayments 71 197
Total trade and other receivables B/S 3,031 3,928
Recognised in the balance sheet as follows:
Current B/S 3,031 3,928
Total 3,031 3,928
The carrying amount of receivables is in all material respects equal to the fair value. Trade receivables of total EUR 8k were overdue by less than 30 days at 31 December 2018. All payments were received during January 2019 (2017: Trade receivables of a total of EUR 40k were overdue by less than 60 days at 31 December 2017. All payments were received in January 2018).
› SIGNIFICANT ESTIMATES AND ASSUMPTIONS – TRADE RECEIVABLEProvisions for bad debts are determined on the basis of customers’ ability to pay, considering historical information about payment patterns, doubtful debts, customer concentrations, customer creditworthiness and collateral received as well as prevailing economic conditions. Estimates made are updated if the debtor’s ability to pay changes.
Management estimated that there were no need for provisions on receivables at 31 December 2018 (2017: No provision on receivables)
› ACCOUNTING POLICIESTrade receivables Trade receivables are recognised initially at fair value and subsequently measured at amortised cost, less allowance for expected credit losses. The Group applies the simplifed approach to measuring expected credit losses which uses lifetime expected credit losses for all trade receivables at each reporting date. An impairment analysis is performed at each reporting date using a provision matrix to measure expected credit losses. The provision rates are based on days past due for groupings of various customer segments with similar credit risk characteristics, i.e. geographical region and customer type. The calculation reflects the probability-weighted outcome, the time value of money and reasonable and supportable information that is available at the reporting date about past events, current conditions and forecasts of future economic conditions. Trade receivables are written off when there is no reasonable expectation of recovery. Impairment losses on trade receivables are presented as net impairment losses within operating profit before other items. Subsequent recovery of amounts previously written off are credited against the same line item.
Other receivables and prepaymentsOther receivables comprise deposits and other receivables.
Prepaid expenses comprise expenses paid relating to subsequent financial years such as rent, insurance premiums, subscription fees and interest and fees.
Other receivables and prepaid expenses are measured at the lower of amortised cost and net realisable value.
ZITON · Annual Report 201878
›
NOTES · OPERATING ASSETS AND LIABILITIES

3 .6 TRADE AND OTHER PAYABLES
EUR ’000 2018 2017
Trade payables 799 712
Other liabilities 689 1,296
Total trade and other payables B/S 1,488 2,008
› ACCOUNTING POLICIESTrade payables represent liabilities for goods and services provided to the Group prior to the end of the financial year which are unpaid.
The amounts are unsecured and are usually paid within 30 days of recognition. Other liabilities represent accruals for primarily for interest and VAT.
Trade payables and Other liabilities are presented as current liabilities unless payment is not due within 12 months after the end of the reporting period. They are recognised initially at their fair values and subsequently measured at amortised cost using the effective interest method.
ZITON · Annual Report 2018 79
NOTES · OPERATING ASSETS AND LIABILITIES

4 .1 RISK MANAGEMENT
The Group’s risk management is described in the section ”Risk management” elsewhere in this annual report. The financial risks are elaborated on below.
Credit riskCredit risk arises from cash and cash equivalents and trade receivables but is considered to be modest for the Group.
Cash and cash equivalents are only placed with Systemically Important Financial Institutions (”SIFI banks”).
The Group has not suffered any losses from any single major debtor in the last couple of years. The Group’s customers are primarily large international utilities and wind turbine manufacturers with a strong financial position.
Liquidity riskLiquidity risk includes the risk of the Group becoming short of liquidity and unable to refinance its maturing credit lines as and when needed. ZITON completed a revised financial structure in October 2018, obtaining a solid capital structure with subordinated loan maturing in October 2022, a first lien bond issue maturing in October 2021 and a second lien bond issue maturing in April 2022.
The terms to maturity of financial assets and liabilities are disclosed by category and class distributed on maturity periods. All interest payments and repayments of financial assets and liabilities are based on contractual agreements.
Maturities
EUR ’000 in 2019Between
2020 to 20222023 and
onwards Total Book value
Loans and receivables
Cash 10,842 - - 10,842 10,842
Trade receivables 1,240 - - 1,240 1,240
Other receivables 1,397 - - 1,397 1,397
Financial liabilities
Subordinated loan - 35,528 - 35,528 22,373
Bond loan, second lien 37,840 37,840 25,208
Bond loan, first lien 4,478 87,109 - 91,587 97,944
Trade and other payables 799 - - 799 799
Working capital facility, incl. lease liability 178 - - 178 178
Response:The company currently has a loan to book value of vessels ratio of 58% and plans to reduce that percentage before the current bond issue comes due for refinancing (first lien bond loan matures October 2021 and second lien bond loan matures in April 2022).
CovenantsThe bond loan agreement includes financial covenants that, if broken, involve default on credit facilities. The minimum required subordinated capital ratio at 31 December 2018 was 30%.
Market riskBunker price riskThe Group is exposed to fluctuating bunker prices. Bunker expenses in 2018 amounted to EUR 357k (2017: EUR 392k).
If bunker prices increase by 50%, the Group’s expenses are assessed to increase by less than EUR 1,000k.
Response: Given the modest impact on cash flows, the Group accepts that bunker expenses will vary and are unpredictable. The Group has chosen not to hedge bunker prices.
ZITON · Annual Report 201880
›
NOTES · CAPITAL STRUCTURE AND FINANCING

4 .1 RISK MANAGEMENT (CONTINUED)
Interest rate riskMost of the Group’s financing, including the bonds issues with EUR 100m, EUR 25.2m and subordinated loan of EUR 22.4m outstanding at 31 December 2018, carries a floating rate of interest. Consequently, an increase in the general level of interest rates, as denoted by 3M EURIBOR for the bond issues and 3M CIBOR for the subordinated loan, will have an adverse effect on the Group’s interest expenses.
An increase of 1 percentage point in interest rates would increase interest expenses by approx. EUR 1,5m. If EURIBOR or CIBOR rates fell below 0%, it would not benefit the Group to any major extent as there is a floor of 0% on ZITON A/S´s bond issue and subordinated loan.
Response:Given the modest impact on cash flows, the group accepts that interest rates will vary. The Group has chosen not to swap floating rate debt into fixed rate debt.
4 .2 LOANS
2018EUR ’000
Interests type
Currentdebt
Non-currentdebt Total
Subordinated loan B/S Floating rate - 22,373 22,373
Bond loan, second lien B/S Floating rate - 25,208 25,208
Bond loan, first lien B/S Floating rate 4,314 93,630 97,944
Lease liabilities B/S Floating rate 14 159 173
Working capital facility B/S Floating rate 164 - 164
Total loans 4,492 141,370 145,862
At 31 December 2018, the Group had an undrawn working facility with the bank of EUR 6,696k (2017: EUR 6,716k).
Fair value: First lien bondAt 31 December 2018, the latest trading price quoted for the first lien bond on the stock exchanges was 101.5. The fair value (hierarchy level 1) of the bond is equivalent to EUR 101,500k, compared to the carrying amount of 100,000k (adjusted for capitalised fees of EUR 2,055k).
Second lien bondAt 31 December 2018, there had been no trading in the second lien bond on the stock exchange. The exchange rate is set at 100. The fair value (hierarchy level 1) of the bond is equivalent to EUR 25,208k equivalent to the carrying amount of 25,208k (adjusted for capital fees of EUR 524k).
The fair value of the remaining loans are equivalent to the carrying amounts (adjusted for capitalised fees on subordinated loan of EUR 333k). The total fair value of the loans at 31 December 2018 was EUR 145,525k (adjusted for capitalised fees of total EUR 2,912k.
Financial covenants:BOND: FRN ZITON A/S 2018/2021 - ISIN NO0010832488 & FRN ZITON A/S 18/22 - ISIN NO 0010832512 Subordinated capital ratio: The Issuer shall at all times maintain a subordinated capital ratio of at least 30% during the first 12 months from the Issue Date. The covenant of subordinated capital ratio increases by 2.5p.p. each subsequent year. At 31 December 2018, the minimum ratio was 30%. The key terms of the bond are listed following the accounting policies below.
ZITON · Annual Report 2018 81
NOTES · CAPITAL STRUCTURE AND FINANCING

4 .2 LOANS (CONTINUED)
2017EUR ’000
Interests type
Currentdebt
Non-currentdebt Total
Subordinated loan B/S Fixed rate - 35,560 35,560
Bond B/S Floating rate 5,437 85,486 90,923
Lease liabilities B/S Floating rate 55 110 165
Working capital facility B/S Floating rate - - -
Total loans 5,492 121,156 126,648
Fair value:At 31 December 2017, the latest trading price quoted for the bond on the Oslo Stock Exchange was 101.5. The fair value (hierarchy level 1) of the bond is equivalent to EUR 92,000k, compared to the carrying amount of 97,500k (adjusted for capitalised fees of EUR 1,077k).The fair value of the remaining loans are equivalent to the carrying amounts. Hence, the total fair value of loans at 31 December 2017 was EUR 131,985k, excluding capitalised fees of EUR 1,077k.
Financial covenants: BOND: FRN ZITON A/S 2015/2019 - ISIN NO0010751332 Subordinated capital ratio: The Issuer shall at all times maintain a subordinated capital ratio of at least 30% during the first 12 months from the Issue Date and increase it by 1% each subsequent year. At 31 December 2017, the minimum ratio was 34%. The key terms of the bond are listed following the accounting policies below.
› ACCOUNTING POLICIES Loans are initially recognised at fair value, net of transaction costs incurred. Loans are subsequently measured at amortised cost.
Loans are derecognised from the balance sheet when the obligation specified in the contract is discharged, cancelled or has expired. The difference between the carrying amount of a financial liability that has been extinguished or transferred to another party and the consideration paid, including any non-cash assets transferred or liabilities assumed, is recognised in profit or loss as other income or finance costs.
Loans are classified as current liabilities unless the Group has an unconditional right to defer settlement of the liability for at least 12 months after the end of the reporting period.
ZITON · Annual Report 201882
›
NOTES · CAPITAL STRUCTURE AND FINANCING

4 .2 LOANS (CONTINUED)
Key terms for bond loans
100 MEUR first lien 25 MEUR second lien
Tap issue Additional 25 MEUR None
Listing/ISIN Oslo Børs - ISIN NO0010832488 Oslo Børs - ISIN NO 0010832512
Coupon 3m EURIBOR + 6.9% (0% floor) 3m EURIBOR + 11.85% PIK (0% floor)
Security First lien in J/U WIND SERVER, J/U WIND PIONEER and J/U WIND
Same security package with 2nd priority
Pledge in insurances, shares of subsidiaries, retention account, etc.
Maturity 3 years (3 October 2021) 3.5 years (3 April 2022)
Amortisation · Fixed amortisation: EUR 2,500,000 semi-annually (3 April 2019, 3 October 2019, 3 April 2020 and 3 October 2020)
No amortisation
· Mandatory cash sweep: Semi annual cash sweep of all cash in excess of EUR 7,500,000 @ 102% of par. First measurement date 31 December 2019.
Call structure Make whole first 18 months103.0% after 18-24 months102.0% after 24-30 months101.0% after 30-33 months100.5% after 33-36 months
Make whole first 18 months103.0% after 18-24 months102.0% after 24-30 months101.0% after 30-33 months100.5% after 33-36 months
Maintainance covenant
Subordinated Capital Ratio >30.0% increasing by 2.5p.p. annually
Subordinated Capital Ratio >30.0% increasing by 2.5p.p. annually
Incurrence covenant
Net Interest Bearing Debt to EBITDA is not greater than: · 5.00 from the First Issue Date until 31 December 2018; · 4.50 from 1 January 2019 until 31 December 2019; · 4.00 from 1 January 2020 until the Final Redemption
Date;
The Subordinated Capital Ratio exceeds 30.0% on a proforma basis, increasing 2.5p.p. annually
Dividends Not permitted prior to an IPO and Equity Claw Back Not permitted prior to an IPO and Equity Claw Back
Change of control call, ZITON A/S 104% 104%
Change of control put, Investors 101% 101%
ZITON · Annual Report 2018 83
NOTES · CAPITAL STRUCTURE AND FINANCING

4 .3 NET FINANCIAL EXPENSES
EUR ’000 2018 2017
Financial income:
Other 1 -
Total financial income I/S 1
Interest expense
Subordinated loan 4,015 3,883
Bank loans 148 161
Transaction costs 1,319 590
Bond loan, second lien 733 -
Bond loan, first lien 11,018 8,227
Finance lease liabilities 7 7
Foreign exchange loss 279 114
Other interest expense 106 186
Total financial expenses I/S 17,625 13,168
Net financial expenses 17,624 13,168
› ACCOUNTING POLICIESBorrowing costsGeneral and specific borrowing costs that are directly attributable to the acquisition, construction or production of a qualifying asset are capitalised during the period of time that is required to complete and prepare the asset for its intended use or sale. Qualifying assets are assets that necessarily take a substantial period of time to get ready for their intended use or sale.Investment income earned on the temporary investment of specific borrowings pending their expenditure on qualifying assets is deducted from the borrowing costs eligible for capitalisation.Any difference between the proceeds of loans (net of transaction costs) and the redemption amount is recognised in profit or loss over the period of the loans using the effective interest method, as transaction costs. Other borrowing costs are expensed in the period in which they are incurred.
4 .4 RECONCILIATION OF FINANCING LIABILITIES
Non-cash changes
EUR ’000 2017 Cash flow
Other non-cash
movementsNon-cash
interest
Foreign exchange
movements 2018
Subordinated loan 35,560 -17,333 - 4,238 -92 22,373
Bond loan, second lien - 24,439 - 733 36 25,208
Bond loan, first lien 85,486 5,950 2,200 -6 93,630
Bond loan - current liability 5,437 - -1,123 - - 4,314
Subtotal 126,483 13,933 200 4,971 62 145,525
Lease liabilities 110 49 - - - 159
Lease liabilities - current liability 55 -41 - - - 14
Cash -2,753 -8,114 - - 25 -10,842
Total financing liabilities 123,895 4,950 1,077 4,971 36 134,856
At 31 December 2018, total cash at bank included EUR 1,261k in a retention account, in favour of bond amortisation and interest (2017: EUR 1,170k).
ZITON · Annual Report 201884
›
NOTES · CAPITAL STRUCTURE AND FINANCING

5 .1 INCOME TAX EXPENSE
Income tax expense
EUR ’000 2018 2017
Current tax:
Current tax on income for the year - -
Adjustments in respect of prior years - current tax - -
Total current tax
Deferred tax (note 5.2):
Deferred tax on the income (profit/loss) for the year -5,970 -1,255
Adjustments in respect of prior years - deferred tax -112 112
Total deferred tax 6,082 1,143
Income tax expense I/S 6,082 1,143
The tax on the Group’s profit differs from the theoretical amount that would arise using the Danish tax rate to profits of the consolidated entities as follows:
Reconciliation of tax rate
EUR ’000 2018 2017
Profit/loss before tax 4,799 1,841
Danish tax rate 22% 1,056 405
Deviation in foreign subsidiaries' tax rates compared to the Danish tax rate -838 -1,157
Notional interest on equity (Malta) 1,077 926
Non-deductible interest -2,740 -1,387
Other adjustments -2,414 -42
Income tax expense for the year 5,970 1,255
ZITON recognised an income of EUR 4.7m for 2018, but the taxable income was a profit of EUR 27.1m, resulting in a tax expense of EUR 5.9m. The difference between the reported income of EUR 4.7m and the taxable income of EUR 27.1m is due to the effect of the Malta tax rate of 35%, non-deductible interest in Denmark and a deferred taxation on the vessel in Malta from executing the call option and recognising this as part of the vessel in Jack-Up InvestCo 3 Plc. On the other hand, the use of notional interest on equity financing in Malta partly offset the higher income tax percentage in Malta.
ZITON incurred a loss of EUR 1.8m for 2017, but the taxable income was a profit of EUR 5.7m, resulting in a tax expense of EUR 1.3m. The difference between the reported loss of EUR 1.8m and the taxable income of EUR 5.7m is due to the effect of the Malta tax rate of 35% and non-deductible interest in Denmark. On the other hand, the use of notional interest on equity financing in Malta partly offset the higher income tax percentage in Malta.
› ACCOUNTING POLICIESThe income tax expense or credit for the period is the tax payable on the current period’s taxable income based on the applicable income tax rate for each jurisdiction adjusted by changes in deferred tax assets and liabilities attributable to temporary differences and to unutilised tax losses.
The current income tax charge is calculated on the basis of the tax laws enacted or substantively enacted at the end of the reporting period in the countries where the company’s subsidiaries operate and generate taxable income. Management periodically evaluates positions taken in tax returns with respect to situations in which applicable tax regulation is subject to interpretation. It establishes provisions where appropriate on the basis of amounts expected to be paid to the tax authorities.
ZITON · Annual Report 2018 85
NOTES · TAX

5 .2 DEFERRED TAX
EUR ’000 2018 2017
Deferred tax 1 January -3,695 -2,441
Currency translation -5 2
Change in deferred tax - recognised in the income statement -5,970 -1,143
Adjustments to prior-years -112 -113
Total deferred tax, net at 31 December 9,782 3,695
Deferred tax gross:
Deferred tax asset 5,183 5,945
Deferred tax liabilities -14,965 -9,640
Total deferred tax, net at 31 December 9,782 3,695
Specification of deferred tax
EUR ’000 2018 2017
Vessel and equipment -14,965 -9,640
Tax-loss carry forwards 5,183 5,945
Total deferred tax at 31 December 9,782 3,695
Deferred tax in balance sheet
EUR ’000 2018 2017
Deferred tax assets B/S - 334
Deferred income tax liabilities B/S -9,782 -4,029
Total deferred tax at 31 December 9,782 3,695
In 2018, total deferred tax consists of a liability from Jack-Up InvestCo 3 Plc. of EUR 5,207k and a deferred tax liability of EUR 4,575k concerning Danish joint taxation, for a total of EUR 9,782k. In 2017, total deferred tax consisted of a liability from Jack-Up InvestCo 3 Plc. of EUR 4,029k and a deferred tax asset of EUR 334k concerning Danish joint taxation, for a total of EUR 3,695k.
› SIGNIFICANT ESTIMATES AND ASSUMPTIONS Deferred tax is recognised based on the assumption that ZITON A/S continues under the corporate tax regime, and on expectations of future activity. Deferred tax assets relating to tax losses carried forward are recognised, when management assesses that these can be offset against positive taxable income in the foreseeable future. The assessment is made at the reporting date taking into account the impact from limitation in interest deductibility and restrictions in utilisation of tax losses in local tax legislation. The assessment of future taxable income is based on financial budgets approved by management and management’s expectations on the operational development, mainly in terms of organic growth and operating margin in the following five years. Planned adjustments to capital structure in each country are also taken into consideration.
ZITON · Annual Report 201886
›
NOTES · TAX

5 .2 DEFERRED TAX (CONTINUED)
› ACCOUNTING POLICIES Deferred income tax is provided in full, using the liability method, on temporary differences arising between the tax bases of assets and liabilities and their carrying amounts in the consolidated financial statements. Deferred income tax is determined using tax rates (and laws) that have been enacted or substantively enacted by the end of the reporting period and are expected to apply when the related deferred income tax asset is realised or the deferred income tax liability is settled.
Deferred tax assets are recognised only if it is probable that future taxable amounts will be available to utilise those temporary differences and losses.
Deferred tax assets and liabilities are offset when there is a legally enforceable right to offset current tax assets and liabilities and when the deferred tax balances relate to the same taxation authority. Current tax assets and tax liabilities are offset where the entity has a legally enforceable right to offset and intends either to settle on a net basis, or to realise the asset and settle the liability simultaneously.
Current and deferred tax is recognised in profit or loss, except to the extent that it relates to items recognised in other comprehensive income or directly in equity. In this case, the tax is also recognised in other comprehensive income or directly in equity, respectively.
ZITON A/S is jointly taxed with the subsidiaries Jack-Up InvestCo 2 A/S and ZITON Contractors A/S, and the parent company Jack-up Holding A/S and the ultimate parent company Anpartsselskabet af 1. december 2011. Anpartsselskabet af 1. december 2011 is the administration company for the jointly taxed companies. The current Danish corporation tax is allocated between the jointly taxed companies in proportion to their taxable income.
ZITON · Annual Report 2018 87
NOTES · TAX

6 .1 COMMITMENTS AND CONTINGENCIES
Commitments (operating lease arrangements)Operating leases relate to leases of office and cars.
Recognised in the income statement in respect of rentals incl. commitments
EUR ’000 2018 2017
Recognised in the income statement in respect of rentals 173 161
Lease commitments:
0 - 1 year 53 103
1 - 5 years - 127
After 5 years - -
Total lease commitments 53 230
› SIGNIFICANT ESTIMATES AND ASSUMPTIONSManagement’s assessment of whether leases on vessels should be classified as finance or operating leases is based on an overall evaluation of each lease. In finance leases, a non-current asset and a payable are recognised. In classification as operating leases, the regular lease payments are generally recognised in the income statement.
› ACCOUNTING POLICIESAgreements to charter vessels and to lease other tangible assets where all substantial risks and rewards of ownership have been transferred to the Group (finance leases) are recognised in the balance sheet (Note 3.1 - Vessels and equipment). Other agreements to charter vessels and other leases are considered operating leases. Payments in connection with operating leases are recognised on a straight-line basis in the income statement over the terms of the leases.
As of 2019, ZITON will implement IFRS 16 which classifies all lease agreements or rentals as financial leases (1.1 Basis of reporting).
Contingencies
SecurityIn October 2018, the company issued two bonds of a total amount of EUR 125,000k and obtained a working capital facility consisting of an overdraft facility and performance guarantees. The overdraft facility is limited to DKK 50,000k (EUR 6,696k). The bondholders and the provider of the working capital facility and performance guarantees have entered into an intercreditor agreement sharing the following security: · The Group’s three vessels (J/U WIND, J/U WIND PIONEER and J/U WIND SERVER) with a total carrying amount of EUR 152,339k (2017:
EUR 153,936k) have been pledged for a total amount of EUR 195,003k (2016: EUR 195,003k). · The Group’s deposit from time to time held in a retention account with Spar Nord. · The Group’s entitlements under insurances related to its three vessels (J/U WIND, J/U WIND PIONEER and J/U WIND SERVER) other than
third-party liability insurances. · The Group’s rights and entitlements under the three-year charter of J/U WIND SERVER to Siemens Gamesa Renewable Energy A/S.
GuaranteesAs part of the working capital facility, the Group’s bank has provided a performance guarantee in connection with the three-year charter of J/U WIND SERVER to Siemens Gamesa Renewable Energy A/S. The guarantee amounts to EUR 1,000k (2017: EUR 2,961k), with a quarterly adjustment during the lifetime of the charter. The guarantee is an on-demand guarantee and serves to guarantee the full and punctual performance of ZITON A/S’s obligations and payment of any sums that ZITON A/S is liable to pay under or in connection with the charter contract. The executed guarantee has been delivered to charterers ninety days prior to the delivery date, and shall remain valid until ninety days after the expiry of this charter contract.
ZITON · Annual Report 201888
›
NOTES · OTHER DISCLOSURES

6 .1 COMMITMENTS AND CONTINGENCIES (CONTINUED)
Unrecognised contingent liabilitiesThere are pending disputes with individual suppliers. Management believes that the outcome of these disputes will not have a material impact on the Group’s financial position.
› SIGNIFICANT ESTIMATES AND ASSUMPTIONSInformation on contingent assets and liabilities and when recognition should be made as an asset and a liability, respectively, is based on assessments of the expected outcome of each claim. The assessments are made on the basis of legal assessments of the signed agreements, which in substantial claims also include assessments obtained from external advisors, including lawyers.
› ACCOUNTING POLICIESContingent assets are recognised when it is practically certain that the claim will have a positive outcome for the Group. A contingent liability is recognised if it is likely that the claim will have a negative outcome and when it is possible to estimate the amount. If this is not the case, the matter is an unrecognised contingent liability.
6 .2 SHARE-BASED PAYMENTS
The Group established two warrant programmes in 2012: one for management and selected employees and one for a subordinated loan provider. The value of the warrants granted in 2012 has been reduced due to the capital increase by conversion of debt to equity in 2014 and a cash payment in 2015. In line with the warrant agreement from 2012, the Board of Directors has approved an adjustment of the number of warrants to management and selected employees in 2016.
Management and selected employees (granted in 2012): The warrants may be exercised in whole or in part during a 10-year period from the date of the holder’s subscription for warrants. Each warrant entitles the holder to subscribe for one share of DKK 1 nominal value at a price of DKK 23.98 plus 7% p.a. as from the date of subscription for the warrants until the date of the holder’s payment of the subscription amount. If changes are made to the company’s capital structure involving a reduction or increase in the value of the warrants, the company’s Board of Directors must adjust the subscription price and/or the number of warrants, as applicable, to ensure that the value of the warrants remains unaffected by the change.
Subordinated loan provider (granted in 2012): The warrants may be exercised, in whole or in part, prior to the final repayment date in 2022. Each warrant shall provide the warrant holder with a right, but not an obligation, to subscribe for one share with a nominal value of DKK 1 in the company for an amount of DKK 23.98 (the ”Subscription Price”). If changes to the capital structure of the company are implemented, causing the value of the warrants to increase or decline, an adjustment of the Subscription Price will, depending on the circumstances, be made so that the value of the warrants remains unaffected by the changes.
Management and selected employees (granted in 2016): The Board of Directors has approved an adjustment of the number of warrants to management and selected employees by 138,645 additional warrants in 2016. The warrants carry a fair value of EUR 0, as the value has already been recognised in previous years. Furthermore, the Board of Directors has decided to grant 20,849 additional warrants to management based on the 2012 warrant programme. The warrants carry a fair value of EUR 7k.
Staff expenses Interest
2018Warrants – amount and value in EUR Management Employees
Subordinated loan provider Total
Outstanding warrants at 1 January 2018 327,329 51,078 99,500 477,907
Outstanding warrants at 31 December 2017 327,329 51,078 99,500 477,907
Number of exercisable options at 31 December 2018 477,907
Fair value at the time of grant (EUR ´000) 68 10 64 142
No warrants were granted, exercised or cancelled in 2018. The fair value of the warrants is fully recognised, hence there was no effect in the income statement or equity during 2018.
ZITON · Annual Report 2018 89
NOTES · OTHER DISCLOSURES

6 .2 SHARE-BASED PAYMENTS (CONTINUED)
› ACCOUNTING POLICIESThe Group has established a share-based equity-settled incentive programme. The fair value of the employee services received in exchange for the grant of warrants is calculated using the value of the warrants. The fair value of share-based payment on the grant date is recognised as a staff expense or interest over the period in which the stock options vest. In measuring the fair value, the calculation is based on ”Ligningsrådets formel” (Tax approved valuation calculation) and is calculated at EUR 143k, based on a discount rate of 2%. The value of equity-settled programmes is recognised in shareholders’ equity.
Staff expenses Interest
2017Warrants – amount and value in EUR Management Employees
Subordinated loan provider Total
Outstanding warrants at 1 January 2017 327,329 51,078 99,500 477,907
Outstanding warrants at 31 December 2017 327,329 51,078 99,500 477,907
Number of exercisable options at 31 December 2017 477,907
Fair value at the time of grant (EUR´000) at 31 December 2017 68 10 64 142
No warrants were granted, exercised or cancelled in 2017. The fair value of the warrants is fully recognised, hence there was no effect in the income statement or equity during 2017.
6 .3 FEES TO AUDITORS
The Group’s fees to auditors appointed by the Annual General Meeting, is listed below:
Fees to auditors appointed by the Annual General Meeting
EUR ’000 2018 2017
BDO Statsautoriseret revisionsaktieselskab
Statutory audit 38 35
Assurance engagements 2 2
Tax advisory 15 7
Other services 1 13
Total 56 57
ZITON · Annual Report 201890
›
NOTES · OTHER DISCLOSURES

6 .4 RELATED PARTY TRANSACTIONS
The Group’s transactions with related parties consist of remuneration to members of the Executive Management and the Board of Directors and trading with related parties.
Remuneration
Executive Management Board of Directors
EUR ’000 2018 2017 2018 2017
Wages and salaries 385 325 54 49
Pensions – defined contributions plans - -
Other social security costs 0 0 - -
Total 386 326 54 49
See note 6.2 for a description of the share-based payment.
Trading and accounts with related parties
EUR ’000 2018 2017
Balance sheet items:
Intercompany balances
Effect of joint taxation with Jack-Up Holding A/S and Anpartsselskabet af 1. december 2011 ApS 323 140
Profit and loss
Transactions with Dansk Bjergning and Bugsering A/S 1,353 604
No other material transactions took place during the year with members of the Board of Directors, the Executive Management, major shareholders or other related parties.
› ACCOUNTING POLICIESZITON A/S is controlled by Jack-Up Holding A/S, which holds 59.5% of the share capital in ZITON A/S. Dansk Bjergning & Bugsering Holding ApS (owner of Dansk Bjergning and Bugsering A/S) and OY Finans ApS hold 25.1% and 14.8% of the share capital respectively.
The ultimate controlling party of the Group is Jack-Up Holding A/S’s holding company Anpartsselskabet af 1. december 2011 ApS.
The above-mentioned companies are considered related parties, including their subsidiaries and associates, members of the Boards of Directors and Executive managements of these entities together with their immediate families.
Furthermore, ZITON’s subsidiaries, as well as members of the Board of Directors and the Executive Management of ZITON A/S together with their immediate families, including companies in which the above persons have control or joint control, are considered related parties.
All agreements relating to these transactions are based on market prices (arm’s length).
ZITON · Annual Report 2018 91
NOTES · OTHER DISCLOSURES

6 .5 SUBSEQUENT EVENTS
No significant events have occurred from the end of the reporting period to the date of publication of the annual report that have not been included and adequately disclosed in the annual report and that materially affect the income statement, balance sheet and disclosure requirements.The financial statements were approved by the Board of Directors and at the Annual General Meeting to be authorised for issue on 24 April 2019.
6 .6 LEGAL ENTITIES
Name and home Ownership (%)
Parent company
ZITON A/S, Horsens, Denmark -
Subsidiaries
ZITON Contractors A/S, Horsens, Denmark 100%
Jack-Up InvestCo 2 A/S, Horsens, Denmark 100%
Jack-Up InvestCo 3 Plc., Qormi, Malta 100%
ZITON Ltd., London, United Kingdom 100%
ZITON Gmbh, Hamburg, Germany 1) 100%
ZITON Ltd., Beijing, China 1) 100%
1) Company under foundation
ZITON · Annual Report 201892
›
CONSOLIDATED FINANCIAL STATEMENTS

ZITON · Annual Report 2018 93
CONSOLIDATED FINANCIAL STATEMENTS

J/U WIND PIONEER performing full rotor lift
›
CONSOLIDATED FINANCIAL STATEMENTS
ZITON · Annual Report 201894
PARENT COMPANY FINANCIAL STATEMENTSTABLE OF CONTENTS
PARENT COMPANY FINANCIAL STATEMENTS
Income Statement . . . . . . . . . . . . . . . . . . . . . . . . . . . . . . . . . . . . . . . . . . . . . . . . . . . . . . 96
Balance Sheet . . . . . . . . . . . . . . . . . . . . . . . . . . . . . . . . . . . . . . . . . . . . . . . . . . . . . . . . . . 97
Statement of Changes in Equity . . . . . . . . . . . . . . . . . . . . . . . . . . . . . . . . . . . . . . . . 98
NOTES TO THE FINANCIAL STATEMENTS
1.1 Basis of reporting . . . . . . . . . . . . . . . . . . . . . . . . . . . . . . . . . . . . . . . . . . . . . . . . . 100
2.1 Staff costs. . . . . . . . . . . . . . . . . . . . . . . . . . . . . . . . . . . . . . . . . . . . . . . . . . . . . . . . . 100
2.2 Net financial expenses . . . . . . . . . . . . . . . . . . . . . . . . . . . . . . . . . . . . . . . . . . . . 101
2.3 Income tax expense . . . . . . . . . . . . . . . . . . . . . . . . . . . . . . . . . . . . . . . . . . . . . . . 101
3.1 Intangible assets . . . . . . . . . . . . . . . . . . . . . . . . . . . . . . . . . . . . . . . . . . . . . . . . . . 102
3.2 Vessels and equipment. . . . . . . . . . . . . . . . . . . . . . . . . . . . . . . . . . . . . . . . . . . . 102
3.3 Financial assets . . . . . . . . . . . . . . . . . . . . . . . . . . . . . . . . . . . . . . . . . . . . . . . . . . . 103
3.4 Deferred tax . . . . . . . . . . . . . . . . . . . . . . . . . . . . . . . . . . . . . . . . . . . . . . . . . . . . . . 103
4.1 Loans . . . . . . . . . . . . . . . . . . . . . . . . . . . . . . . . . . . . . . . . . . . . . . . . . . . . . . . . . . . . . . 104
4.2 Proposed distribution of profit . . . . . . . . . . . . . . . . . . . . . . . . . . . . . . . . . . . 104
5.1 Commitments and contingencies . . . . . . . . . . . . . . . . . . . . . . . . . . . . . . . . . 105
5.2 Share-based payments . . . . . . . . . . . . . . . . . . . . . . . . . . . . . . . . . . . . . . . . . . . 105
5.3 Fees to auditors . . . . . . . . . . . . . . . . . . . . . . . . . . . . . . . . . . . . . . . . . . . . . . . . . . . 105
5.4 Related party transactions. . . . . . . . . . . . . . . . . . . . . . . . . . . . . . . . . . . . . . . . 105
5.5 Subsequent events. . . . . . . . . . . . . . . . . . . . . . . . . . . . . . . . . . . . . . . . . . . . . . . . 105
ZITON · Annual Report 2018 95
FINANCIAL STATEMENTS · PARENT COMPANY

PARENT COMPANY
EUR ’000 Note 2018 2017
Revenue 45,011 33,202
Other operating income 1,340 -
Project-related expenses -3,962 -1,445
Operating expenses -23,989 -27,601
Gross profit 18,400 4,156
Administrative expenses -1,452 -1,628
Staff costs 2.1 -6,611 -6,385
EBITDA 10,337 3,857
Depreciation and amortisation 3.3 -1,628 -2,221
EBIT 8,709 6,078
Income from equity investment 2,996 3,318
Financial income 2.2 8,565 11,251
Financial expenses 2.2 -19,880 -16,553
Income before tax 389 8,062
Tax on profit (loss) 2.3 -1,611 1,742
Income for the year 1,222 6,320
INCOME STATEMENT 1 JANUARY - 31 DECEMBER
ZITON · Annual Report 201896
›
FINANCIAL STATEMENTS · PARENT COMPANY

BALANCE SHEET AT 31 DECEMBER– ASSETS
PARENT COMPANY
EUR ’000 Note 2018 2017
Intangible assets 3.1 100 105
Intangible assets 100 105
Vessel 3.2 21,009 22,357
Fixtures & equipment 3.2 772 439
Tangible assets 21,781 22,796
Investment in subsidiaries 3.3 51,587 19,039
Deferred tax asset 3.4 318 3,118
Financial assets 3.3 - 6,055
Long-term receivables, subsidiaries 78,358 139,731
Financial assets 130,263 167,943
Inventories 35 38
Trade receivables 1,050 3,554
Intercompany receivables, subsidiaries 1,441 384
Other receivables 1,396 36
Prepayments 69 196
Cash and cash equivalents 10,518 2,664
Current assets 14,509 6,872
Total assets 166,653 197,716
ZITON · Annual Report 2018 97
FINANCIAL STATEMENTS · PARENT COMPANY

BALANCE SHEET AT 31 DECEMBER – EQUITY AND LIABILITIES
PARENT COMPANY
EUR ’000 Note 2018 2017
EQUITY
Share capital 11,093 11,093
Reserves 6,630 3,634
Retained earnings -4,185 68
Total equity 13,538 14,795
LIABILITIES
Subordinated loan 4.1 22,373 35,560
Bond loan, second lien 4.1 25,208 -
Bond loan, first lien 93,630 85,486
Lease obligation 4.1 159 110
Total noncurrent liabilities 141,370 121,156
Other provisions 1,230 1,189
Bond loan, first lien 4.1 4,314 5,437
Lease obligation 14 55
Trade payables 679 648
Intercompany payables, subsidiaries 4,988 52,374
Other liabilities 520 2,062
Total current liabilites 11,745 61,765
Total liabilities 153,115 182,921
Total equity and liabilites 166,653 197,716
ZITON · Annual Report 201898
›
FINANCIAL STATEMENTS · PARENT COMPANY

STATEMENT OF CHANGES IN EQUITY
PARENT COMPANY
2018EUR ’000
Share capital
Reserve for
warrantsTranslation
reserves
Reserve for equity
valueTotal
reservesRetained earnings
Total equity
Balance at 31 December 2017 11,093 143 17 3,474 3,634 68 14,795
Exchange rate adjustments - - - - -35 -35
Total Income for the year, after tax - - - 2,996 2,996 -4,218 -1,222
Balance at 31 December 2018 11,093 143 17 6,470 6,630 4,185 13,538
Share capitalAt the end of 2018, the share capital consisted of 82,782,192 shares of DKK 1 each (EUR 11,093K). The shares are divided into two classes: 15,118,416 A shares of DKK 1 each and 67,663,782 B shares of DKK 1 each. Each A share carries one vote, while B shares do not carry voting rights, but carry preferential rights of dividend.
Specification of movements in the share capital
EUR´000 2018 2017 2016 2015 2014
Share capital 11,093 11,093 11,093 11,093 7,763
ZITON · Annual Report 2018 99
FINANCIAL STATEMENTS · PARENT COMPANY

NOTES TO THE FINANCIAL STATEMENTS
BASIS OF REPORTING
ACCOUNTING POLICIESThe financial statements of ZITON A/S have been prepared in accordance with the provisions for class D enterprises of the Danish Financial Statements Act.
As the accounting policies of ZITON A/S differ from those of the Group, which follows IFRS, with respect to only a few items, only policies that differ from those of the Group are detailed below. Reference is made to the accounting policies of the ZITON Group for other items.
The accounting policies of the parent company, including presentation, are unchanged compared to last year.
Income statement and balance sheetEarnings from equity investmentsEarnings from investments in subsidiaries and joint ventures. In the parent company income statement, the proportional share of earnings is recognised under the item “Income from equity investment”.
Investments in subsidiaries Investments in Jack-Up InvestCo 2 A/S, ZITON Contractors A/S and Jack-Up InvestCo 3 Plc. are recognised and measured according to the equity method.
The proportional ownership share of the companies’ net asset value is recognised in the balance sheet under the items ”Investments in
Jack-Up InvestCo 2 A/S”, ”Investments in ZITON Contractors A/S” and ”Investment in Jack-Up InvestCo 3 Plc.”.
The total net revaluation of investments in subsidiaries is transferred through the distribution of profits to “Reserve for equity value” under equity. The reserve is reduced by dividend payments to the parent company and is adjusted for other changes in equity in subsidiaries.
Subsidiaries with negative net asset value are recognised at EUR 0 million, and a provision to cover the negative balance is recognised. In October 2018, ZITON A/S acquired the remaining shares in Jack-Up InvestCo 3 Plc. As a consequence the premium purchase price (EUR 2.1 million) from the purchase of the non-controlling interests and the call option (EUR 6.0million) to purchase the non-controlling interests (previously recognised as a financial asset) have been recognised as goodwill related to the vessel in Jack-Up InvestCo 3 Plc.
Goodwill amortisation 25 years
Other accounting policiesWith reference to the provisions of the Danish Financial Statements Act, the parent company has refrained from preparing a cash flow statement. For this information, see the consolidated financial statements of the ZITON Group.
2 .1 STAFF COSTS
Total staff costs
PARENT COMPANY
EUR ’000 2018 2017
Staff costs
Wages and salaries 6,056 5,889
Pensions - defined contributions plans 445 441
Other social security costs 110 55
Total staff costs I/S 6,611 6,385
of which remuneration to: Management 1) 385 326
Board of Directors 54 50
1) Executive Management registered with the Danish Business Authority (Erhvervsstyrelsen)
Average number of employees
2018 2017
Total employees 101 96
1 .1
ZITON · Annual Report 2018100
›
FINANCIAL STATEMENTS · PARENT COMPANY NOTES · PARENT COMPANY

2 .2 NET FINANCIAL EXPENSES
PARENT COMPANY
EUR ’000 2018 2017
Financial income
Financial income, related parties 8,564 11,251
Other financial income 1 -
Total financial income I/S 8,565 11,251
Financial expense
Financial expenses, related parties 2,254 3,386
Other financial expenses 17,626 13,167
Total financial expenses I/S 19,880 16,553
Net financial expenses 11,315 5,302
2,3 INCOME TAX EXPENSE
PARENT COMPANY
EUR ’000 2018 2017
Current tax
Current tax on income for the year - -
Adjustments in respect of prior years - current tax - -
Total current tax - -
Deferred tax (note 3,4):
Deferred tax on the profit/loss for the year -1,611 1,695
Adjustments to prior years - deferred tax - 47
Total deferred tax 1,611 1,742
Income tax expense I/S 1,611 1,742
ZITON · Annual Report 2018 101
FINANCIAL STATEMENTS · PARENT COMPANYNOTES · PARENT COMPANY

3 .1 INTANGIBLE ASSETS
PARENT COMPANY
2018EUR ’000 Software Total
Cost at 1 January 108 108
Exchange rate adjustments - -
Additions 12 12
Disposals - -
Cost at 31 December 120 120
Depreciation at 1 January -3 -3
Exchange rate adjustments - -
Depreciation -17 -17
Disposals - -
Depreciation at 31 December 20 20
Impairment losses at 1 January - -
Impairment losses at 31 December - -
Carrying amount at 31 December B/S 100 100
3 .2 VESSELS AND EQUIPMENT
PARENT COMPANY
2018EUR ’000
Fixtures & equipment Vessel Total
Cost at 1 January 627 37,068 37,695
Exchange rate adjustments -2 -111 -113
Additions 479 72 551
Additions on leased assets - 237 237
Disposals - -142 -142
Cost at 31 December 1,104 37,124 38,228
Depreciation at 1 January -188 -14,711 -14,899
Exchange rate adjustments 1 44 45
Depreciation -144 -1,425 -1,569
Depreciation of leased assets - -35 -35
Disposals - 12 12
Depreciation at 31 December 331 16,115 16,446
Impairment losses at 1 January - - -
Impairment losses at 31 December - - -
Carrying amount at 31 December B/S 773 21,009 21,782
– of which car finance leases 185 0 185
ZITON · Annual Report 2018102
›
FINANCIAL STATEMENTS · PARENT COMPANY NOTES · PARENT COMPANY

3 .3 FINANCIAL ASSETS
PARENT COMPANY
2018EUR ’000
Equity investment in
Jack-Up InvestCo 3 Plc.
Equity investment in Jack-Up
InvestCo 2
Equity investment
ZITONContractors Total
Cost at 1 January 14,001 742 64 14,807
Exchange rate adjustments - -3 3 -
Additions 29,636 734 - 30,370
Cost at 31 December 43,637 1,473 67 45,177
Adjustments at 1 January 5,039 -1,360 -207 3,472
Exchange rate adjustments -14 -63 - -77
Depreciation of goodwill -83 - - -83
Profit during the year 2,847 110 121 3,078
Adjustments at 31 December 7,790 1,313 86 6,391
Total 51,427 160 19 51,568
Transfer to other liabilities - 19 19
Carrying amount at 31 December B/S 51,427 160 51,587
Jack-Up InvestCo 3 Plc. (registered office: Qormi, Malta (Share of ownership 100% at 3 October 2018).Jack-Up InvestCo 2 A/S (registered office: Horsens, Denmark (Share of ownership 100%)) ZITON Contractors A/S (registered office: Horsens, Denmark (Share of ownership 100%))
3 .4 DEFERRED TAX
PARENT COMPANY
EUR ’000 2018 2017
Deferred tax 1 January 3,118 1,425
Currency translation
Change in deferred tax - recognised in the income statement -1,611 1,740
Utilisation of tax loss in joint taxation -1,189
Adjustments to prior-years -47
Adjustment to deferred tax asset
Total deferred tax, net at 31 December B/S 318 3,118
Deferred tax gross
Deferred tax asset 2,637 5,487
Deferred tax liabilities -2,319 -2,369
Total deferred tax, net at 31 December B/S 318 3,118
ZITON · Annual Report 2018 103
FINANCIAL STATEMENTS · PARENT COMPANYNOTES · PARENT COMPANY

4 .1 LOANS
PARENT COMPANY
Currentdebt Non-current debt
2018EUR ’000 0-1 year 1-5 years After 5 years Total
Subordinated loan - 22,373 - 22,373
Bond loan, second lien - 25,208 25,208
Bond loan, first lien 4,314 93,630 - 97,944
Lease obligation 14 159 - 173
Total B/S 4,328 141,370 145,698
Currentdebt Non-current debt
2017EUR ’000 0-1 year 1-5 years After 5 years Total
Subordinated loan - 35,560 - 35,560
Bond 5,437 85,486 90,923
Lease obligation 55 110 - 165
Total B/S 5,492 121,156 126,648
4 .2 PROPOSED DISTRIBUTION OF PROFIT
PARENT COMPANY
EUR ’000 2018 2017
Reserve for equity value 3,079 3,315
Amortisation of goodwill -83 -
Accumulated profit (loss) -4,218 -9,635
Proposed distribution of profit 1,222 6,320
ZITON · Annual Report 2018104
›
FINANCIAL STATEMENTS · PARENT COMPANY NOTES · PARENT COMPANY

5 .1 COMMITMENTS AND CONTINGENCIES
Commitments (operating lease arrangements)See note 6.1 to the consolidated financial statements.
ContingenciesLease obligationsZITON A/S bareboat charters the vessels J/U WIND SERVER and J/U WIND PIONEER from Jack-Up InvestCo 3 Plc. and Jack-Up InvestCo 2 A/S respectivly. The bareboat leases are based on the Group’s transfer pricing policy and are set up as operating leases.
Proposed distribution of profit
EUR ’000 2018 2017
Lease obligations from operating lease
Total future lease payments:
Within 1 year 8,396 9,235
Between 1 and 5 years - -
After 5 years
SecurityA vessel with a total carrying amount of EUR 21,009k (2016: EUR 22,357k) has been pledged as security for bond and bank debt at a total carrying amount of EUR 40,002k (2016: EUR 40,002k).
ZITON A/S has pledged the shares in the wholly-owned Jack-Up InvestCo 3 Plc. and the shares in the wholly-owned Jack-Up InvestCo 2 A/S. Furthermore, all intercompany receivables have been pledged as security for bond and bank debt.
GuaranteesSee note 6.1 to the consolidated financial statements.
Unrecognised contingent liabilitiesSee note 6.1 to the consolidated financial statements.
5 .2 SHARE-BASED PAYMENTS
See note 6.2 to the consolidated financial statements
5 .3 FEES TO AUDITORS
See note 6.3 to the consolidated financial statements
5 .4 RELATED PARTY TRANSACTIONS
See note 6.4 to the consolidated financial statements.
All agreements relating to transactions between ZITON A/S and subsidiaries are based on market prices (arm’s length).
The ownership share above 5% is listed on page 14 in the consolidated financial statements.
5 .5 SUBSEQUENT EVENTS
See note 6.5 to the consolidated financial statements
ZITON · Annual Report 2018 105
FINANCIAL STATEMENTS · PARENT COMPANYNOTES · PARENT COMPANY


›
COMPANY DETAILS
COMPANYZITON A/S
Bygholm Søpark 21E
8700 Horsens
Denmark
WEBSITEwww.ziton.eu
PRODUCTIONOTW A/S

Company ZITON A/S
Bygholm Søpark 21E
8700 Horsens
Denmark
Websitewww.ziton.eu
ANNUAL REPORT
2018