Unsupervised decomposition of low-intensity low-dimensional multi-spectral fluorescent images for...
13
This article appeared in a journal published by Elsevier. The attached copy is furnished to the author for internal non-commercial research and education use, including for instruction at the authors institution and sharing with colleagues. Other uses, including reproduction and distribution, or selling or licensing copies, or posting to personal, institutional or third party websites are prohibited. In most cases authors are permitted to post their version of the article (e.g. in Word or Tex form) to their personal website or institutional repository. Authors requiring further information regarding Elsevier’s archiving and manuscript policies are encouraged to visit: http://www.elsevier.com/copyright
-
Upload
independent -
Category
Documents
-
view
0 -
download
0
Transcript of Unsupervised decomposition of low-intensity low-dimensional multi-spectral fluorescent images for...

This article appeared in a journal published by Elsevier. The attachedcopy is furnished to the author for internal non-commercial researchand education use, including for instruction at the authors institution
and sharing with colleagues.
Other uses, including reproduction and distribution, or selling orlicensing copies, or posting to personal, institutional or third party
websites are prohibited.
In most cases authors are permitted to post their version of thearticle (e.g. in Word or Tex form) to their personal website orinstitutional repository. Authors requiring further information
regarding Elsevier’s archiving and manuscript policies areencouraged to visit:
http://www.elsevier.com/copyright

Author's personal copy
Unsupervised decomposition of low-intensity low-dimensional multi-spectralfluorescent images for tumour demarcation
I. Kopriva *, A. PeršinDepartment of Laser and Atomic Research and Development, Rudjer Boškovic Institute, Bijenicka Cesta 54, P.O. Box 180, 10002 Zagreb, Croatia
a r t i c l e i n f o
Article history:Received 16 July 2007Received in revised form 6 February 2009Accepted 9 February 2009Available online 20 February 2009
Keywords:Unsupervised decompositionIll-conditioned static linear mixture modelsMulti-spectral imagingTumour demarcationMulti-channel medical imaging
a b s t r a c t
Unsupervised decomposition of static linear mixture model (SLMM) with ill-conditioned basis matrix andstatistically dependent sources is considered. Such situation arises when low-dimensional low-intensitymulti-spectral image of the tumour in the early stage of development is represented by the SLMM,wherein tumour is spectrally similar to the surrounding tissue. The original contribution of this paperis in proposing an algorithm for unsupervised decomposition of low-dimensional multi-spectral imagefor high-contrast tumour visualisation. It combines nonlinear band generation (NBG) and dependentcomponent analysis (DCA) that itself combines linear pre-processing transform and independent compo-nent analysis (ICA). NBG is necessary to improve conditioning of the extended mixing matrix in theSLMM, while DCA is necessary to increase statistical independence between spectrally similar sources.We demonstrate good performance of the method on both computational model and experimentallow-intensity red–green–blue fluorescent image of the surface tumour (basal cell carcinoma). We believethat presented method can be of use in other multi-channel medical imaging systems.
� 2009 Elsevier B.V. All rights reserved.
1. Introduction
Methods for tumour demarcation include examples with visual-isation based on: fluorophores (Koenig et al., 2001; Bäumler et al.,2003), green fluorescent protein gene tumour transduction system(Hasegawa et al., 2000; Hoffman, 2002) or fluorescent nanoparti-cles (Tréhin et al., 2006). In the case of fluorophores, contrast visu-alisation is obtained under optimal combination of parameterssuch as concentration of photo-synthesiser, duration of treatmentwith photo-synthesiser and intensity of illuminating light. Underthese conditions a few well-established methods can be used fortumour visualisation (Scott et al., 2000; Ericson et al., 2003; Fischeret al., 2001). However, variability in some of the parameters willcause fluctuation of the intensity level of the acquired fluorescentimage, causing predefined threshold constants not being optimalany more. Here we propose a high-contrast tumour visualisationalgorithm that is based on unsupervised decomposition of a low-dimensional multi-spectral fluorescent image. It exhibits a high le-vel of robustness with respect to the fluctuation of the intensity le-vel. That is achieved due to the unsupervised nature of thealgorithm and the scale invariance property of the independentcomponent analysis algorithm (ICA) (Jutten and Herault, 1991; Belland Sejnowski, 1995; Hyvärinen and Karhunen, 2001; Cichocki andAmari, 2002) that forms the heart of the proposed method. How-
ever, spectral similarity between the tumour and surrounding tis-sue causes an ill-conditioning of the basis matrix as well asstatistical dependence between the sources in the hypothetical lin-ear mixture model of the fluorescent image. Therefore, ICA fails toyield accurate demarcation. Here we show that by nonlinear bandgeneration (NBG), (Ren and Chang, 2000; Du et al., 2004), anddependent component analysis (DCA), (Cichocki and Amari,2002; Cichocki and Georgiev, 2003; Cichocki, 2007; Hyvärinen,1998; Kopriva and Seršic, 2008), we can fix ill-conditioning prob-lem and increase statistical independence between the sources,hence creating an environment for the ICA to work more accu-rately. This newly proposed method exhibits improved perfor-mance over number of state-of-the-art multi-channel blinddecomposition algorithms on both computational and experimen-tal multi-spectral images.
2. Methods
The unsupervised decomposition problem consists in findingthe basis matrix A 2 RN�M
þ and matrix of hidden components orsources S 2 RM�T
þ given only the matrix of observed data X 2 RN�Tþ
such that the following static linear mixture model (SLMM) holds
X ¼ AS: ð1Þ
Each row of X and S is a signal or 1D image representation, N is thenumber of observed signals, M is the number of hidden components(sources) and T is the number of samples. Because we are concerned
1361-8415/$ - see front matter � 2009 Elsevier B.V. All rights reserved.doi:10.1016/j.media.2009.02.002
* Corresponding author. Tel.: +385 1 4571 286; fax: +385 1 4680 104.E-mail addresses: [email protected] (I. Kopriva), [email protected] (A. Peršin).
Medical Image Analysis 13 (2009) 507–518
Contents lists available at ScienceDirect
Medical Image Analysis
journal homepage: www.elsevier .com/ locate/media
Author's personal copy
with an unsupervised image decomposition problem, we have as-sumed X, A and S to be nonnegative.
2.1. Independent component analysis
The unsupervised decomposition problem (1), also known as astatic blind source separation problem, is efficiently solved byICA (Hyvärinen and Karhunen, 2001; Cichocki and Amari, 2002),provided that the sources are statistically independent, at mostone source has Gaussian distribution, and the number of sourcesM is less than or equal to the number of observed signals N. Thena solution to the unsupervised decomposition problem (1) is ob-tained with scale and permutation indeterminacy, i.e.,
S ¼WX ð2Þ
with WA = PK, where W represents the un-mixing matrix, P is ageneral permutation matrix and K is a diagonal matrix. This impliesthat ICA-based solution of the unsupervised decomposition prob-lem is unique up to the ordering, scale and sign. Thus, ICA algo-rithms possess a scale invariance property that makes themattractive for use in tumour visualisation and demarcation fromthe multi-spectral fluorescent image, when the level of the fluores-cence may vary from measurement to measurement for the reasonsalready discussed.
It is assumed by many ICA algorithms that sources are zeromean as well as that data are whitened (spatially uncorrelated).Most algorithms include mean removal and data whitening as afirst phase in the algorithm development. Mean removal isachieved very simple through
fxn xn � E½xn�gNn¼1 ð3Þ
where xn denotes rows of X and E[xn] denotes mathematical expec-tation of xn. Data whitening is achieved through
X K�1=2ETX ð4Þ
where K and E, respectively, stand for diagonal matrix of eigen-values and matrix of eigenvectors of the sample data covariancematrix RXX = E[XXT]. Since in the muti-spectral image decomposi-tion problem source signals represent spatial maps of the materialsresident in the image, we have always rescaled extracted sources tothe [0,1] interval such that probability of the source being present(that is maximally 1 and minimally 0) can be assigned at each pixellevel.
The strategy of the ICA algorithms in solving blind decomposi-tion problem is to find linear transform W such that componentsof S are as much statistically independent as possible. Dependingon available type of a priori information about the sources variousapproaches are exploited by ICA algorithms. Number of ICA meth-ods requires a priori information about the class of distributions towhich source signals belong (Bell and Sejnowski, 1995; Pham,1997; Choi et al., 2000). Such information is however not readilyavailable. One alternation is to derive methods that are adaptiveto the unknown source distributions. The representatives of suchclass of methods are kernel density methods (Xue et al., 2008; Prin-cipe and Xu, 1999; Principe et al., 2000). Main disadvantage of thekernel density-based ICA methods is their computational complex-ity that is O(T2N2) where T represents number of samples. In appli-cation domain considered in this paper T represents number ofpixels and can take value of even 107. Hence, the computationalcomplexity in such a case would be huge. It has been pointed outrecently (Xue et al., 2008) that computational complexity of thekernel density methods can be reduced by fast Fourier transform(Silverman, 1982). Other approaches to reduce computationalcomplexity of kernel density-based ICA methods were also pro-posed (Pham, 2003; Schwartz et al., 2004) yielding, respectively,
computational complexity of O(3NT + N2T) and O(NTlogT + N2T). Ifwe consider multi-spectral image to be an RGB image, then N = 3.Assuming T � 4 � 106 (that is today normal size of the RGB imagesfrom commercial digital cameras) we arrive at still very large num-bers for computational complexity of the kernel density-based ICAmethods. Due to computational complexity reasons we have reliedin this manuscript on ICA methods that are also source distributionindependent but solve blind decomposition problem through min-imization of the statistical dependence between the sources up tothe fourth order (FO) (Cardoso and Soulomniac, 1993) or throughminimization of the statistical dependence between the sourcesof the second order but for different lags (Belouchrani et al.,1997; Stone, 2001).
Representative of the first group is FO cumulant based ICA algo-rithm JADE (Cardoso and Soulomniac, 1993) that stands for JointApproximate Diagonalisation of the eigen-matrices, where statisti-cal independence is achieved through minimization of the squaresof the FO cross-cumulants between the components sm
W ¼ arg minXi;j;k;l
offðWTC4ðsi; sj; sk; slÞWÞ ð5Þ
where off(A) is measure for the off-diagonality of a matrix definedas offðAÞ ¼
P16i–j6N jaijj2. C4ðsi; sj; sk; slÞ are sample estimates of the
related FO cross-cumulants (Mendel, 1991; McCullagh, 1995) i.e.
C4ðsi; sj; sk; slÞ ¼ E½sisjsksl� � E½sisj�E½sksl� � E½sisk�E½sjsl�� E½sisl�E½sjsk� ð6Þ
The additional advantage of using FO cumulants based ICA algo-rithm is its capability to suppress additive Gaussian noise based onthe known property that FO cumulants are blind with respect toGaussian noise (Mendel, 1991). Disadvantage of the use of FO sta-tistics based methods is their sensitivity to outliers as well asrequirement that FO cumulants for the source signals in consider-ation must exist. On the other side SO statistics based methods aremore robust with respect to outliers. If the source signals have cer-tain structure (temporal or spatial) it is possible to obtain demixingmatrix W as the solution of the following joint diagonalizationproblem
JðWÞ ¼Xs2S
offðW�CssWTÞ ð7Þ
where �Css are symmetrical one-lag covariance matrices of the
sources
�Css ¼ EfSðtÞSðt � sÞTg þ EfSðt � sÞSðtÞTg
Since by assumption source signals are statistically independent itapplies that �Cs
s must be a diagonal matrix. Thus, it follows from(7) that W is matrix of eigen-vectors that jointly diagonilize set ofmatrices f�Cs
sgs2S. This is how the SOBI algorithm that stands for sec-ond order blind identification is formulated (Belouchrani et al.,1997).
For predictable signals it is further possible to obtain demixingmatrix W as the solution of the generalized eigen-decompositionproblem by maximizing predictability measure (Stone, 2001)
FðfsmðtkÞgÞ ¼ logVðfsmðtkÞgÞUðfsmðtkÞgÞ
¼ logPkmax
k ð�smðtkÞ � smðtkÞÞ2Pkmaxk ð~smðtkÞ � smðtkÞÞ2
ð8Þ
where V reflects the extent to which sm(tk) is predicted by a longterm moving average �smðtkÞ and U reflects the extent to which sm(tk)is predicted by a short term moving average ~smðtkÞ. Since source sig-nals in the problem considered in this paper are predictable (pixelvalues are locally correlated) we shall use this method, coined as‘‘temporal” predictability maximization ICA algorithm, in blindmulti-spectral image decomposition problem.
508 I. Kopriva, A. Peršin / Medical Image Analysis 13 (2009) 507–518
Author's personal copy
2.2. Dependent component analysis
The basic idea behind DCA (Cichocki and Amari, 2002; Cichockiand Georgiev, 2003; Hyvärinen, 1998; Kopriva and Seršic, 2008) isto find a linear transform H that can improve statistical indepen-dence between the sources but leave the basis matrix unchanged,i.e.,
HðXÞ ¼ HðASÞ ffi AHðSÞ ð9Þ
Since the sources in this new representation space will be less sta-tistically dependent, any standard ICA algorithm can in principle beused to learn the mixing matrix A or demixing matrix W. Once theyare estimated, the sources S can be recovered by applying W themulti-spectral image X in (1). Examples of linear transforms thathave such a required invariance property and generate less depen-dent sources in the new representation space include: high-pass fil-tering (Cichocki and Georgiev, 2003), innovations (Hyvärinen, 1998)and wavelet transforms (Kopriva and Seršic, 2008). However, to getoptimal performance out of DCA algorithm, chosen ICA algorithmshould be tuned to the chosen statistical independence enhance-ment transform. One computationally efficient approach to solvethe blind separation problem with statistically dependent sourcesis based on the use of innovations. The arguments for using innova-tions are that they are more independent from each other and morenon-Gaussian than original processes. The innovation process is re-ferred to as prediction error that is defined as:
~smðtÞ ¼ smðtÞ �Xl
i¼1
bmismðt � iÞ; m ¼ 1; . . . ;M ð10Þ
where sm(t � i) is the ith sample of a source process sm(t) at location(t � i) and bm is a vector of prediction coefficients. ~smðtÞ representsthe new information that sm(t) has but is not contained in the past lsamples. It has been proved in Hyvärinen (1998) that if X and S fol-low the linear mixture model (1), their innovation processes ~X and ~S(in matrix form) follow the same model as well, i.e.,
~X ¼ A~S ð11Þ
Because innovation basically removes predictable, or slow vary-ing, part of the signal it is super-Gaussian and close to independentand identically distributed (i.i.d.) signal. This is especially true if or-der of the prediction error filter in (10) is high. Thus, FO cumulantsare expected to be well defined for when high-order innovationsare used. Therefore, it is justified in DCA algorithm to combineJADE ICA algorithm with high-order innovations based lineartransform in order to achieve good performance. First order highpass filter can be thought as the first order innovation of the signal.In such a case significant part of the predictable signal componentwill still remain in its innovation. Therefore, it is justified in DCAalgorithm to combine SOBI-like ICA algorithms (Molgedey andSchuster, 1994; Ziehe et al., 1998) with low-order innovationsbased linear transform to achieve good performance. Due to thereasons discussed, we shall apply these two DCA algorithms inthe comparative performance analysis presented in Section 3. Atthis place we would also like to explain why, by means of innova-tions or high-pass filtering, removing statistical dependence be-tween the source pixels also increases statistical independencebetween the sources. Both high-pass filtering and innovations, theycan be viewed as source adaptive high-pass filtering, remove low-frequency part of the source spectrum. It is low-frequency part ofthe source spectrum that is a cause for eventual statistical depen-dence among the sources. This empirical observation has beenbrought out in Cichocki and Amari (2002), Cichocki and Georgiev(2003) and Cichocki (2007). It represents basis for construction ofvarious DCA algorithms and explains why all of them are lookingfor high-frequency part of the source spectrum in order to learn
a mixing matrix more accurately by applying ICA algorithms onhigh-pass filtered version of the mixtures, see (9) and (11). Henceby removing low-frequency part of the source spectrum innovationprocess also removes eventual cause of statistical dependenceamong the sources.
2.3. Nonnegative matrix factorization
Alternatives to the ICA or ICA-based DCA include algorithms fornonnegative matrix factorisation (NMF), (Lee and Seung, 1999;Zdunek and Cichocki, 2007; Cichocki et al., 2008), which are alsoapplicable to the SLMM (1) because the variables in the modelare nonnegative. Unlike ICA, the NMF algorithms do not imposestatistical independence and non-Gaussianity requirements onthe sources. However they do generally require N >> M, whichmakes them not good candidate for unsupervised decompositionproblems when X represents a low-dimensional multi-spectral im-age, such as a red–green–blue (RGB) image in which case N = 3 caneven be less than M. In addition to that, NMF algorithms are quitesensitive to the choice of initial conditions that often yields subop-timal performance. Various strategies are under investigation,including even ICA algorithms, to estimate good initial points forA and S. The basic approach to NMF, that is described in generalalgorithmic form below, is alternating minimization of a chosencost function (Zdunek and Cichocki, 2007; Cichocki et al., 2008).
Set Randomly initialize: A(0), S(0),For k = 1,2,. . ., until convergence do
Step 1: Sðkþ1Þ ¼ arg minsmtP0DðX AðkÞS��� ÞSðkÞ
Step 2: Aðkþ1Þ ¼ arg minanmP0~DðX ASðkþ1Þ
��� ÞAðkÞEnd
In general, the cost function DðX ASk Þ in Step 1 can be differentthan the cost function ~DðX ASk Þ in Step 2, however, usuallyDðX ASk Þ ¼ ~DðX ASk Þ. In Lee and Seung (1999) the algorithm wasfirst applied to two different cost functions: squared Euclidean dis-tance (Frobenius norm) and Kullback–Leibler divergence. Using agradient descent approach to perform Steps 1 and 2, they obtainedmultiplicative algorithms. However, the multiplicative algorithmsare known to be very slowly convergent and easily get stuck in lo-cal minima. Therefore, in Zdunek and Cichocki (2007) an algorithmwas recently derived that is based on the use of second-orderterms, Hessian, in the Taylor expansion of a cost function to speedup convergence. Specifically, the NMF algorithm used in the exper-iments in the cited paper combines quasi-Newton optimisation forbasis matrix A and a fixed-point regularised least-square algorithmfor S, with computer code provided in the appendix in Zdunek andCichocki (2007). Excellent performance of this algorithm has beendemonstrated in Zdunek and Cichocki (2007) and Cichocki et al.(2008). This algorithm will be used in the comparative perfor-mance analysis in Section 3. We shall refer to this algorithmthrough the rest of the paper as the SO NMF algorithm.
2.4. SLMM and multi-spectral imaging
The SLMM (1) is widely used in multi-spectral and hyper-spec-tral remote sensing, (Adams et al., 1993; Settle and Drake, 1993;Du et al., 2006; Du and Kopriva, 2008), where 3D image cube con-tains co-registered spectral images of the same scene. Within thisapplication field, N represents the number of spectral bands; rowsfxngN
n¼1 of X represent spectral images, and columns of X representmulti-spectral pixel vectors at particular spatial locations, t 6 T, inthe image; T represents the number of pixels in the image, whilecolumn vectors famgM
m¼1 of the basis or mixing matrix representspectral responses of the corresponding sources fsmgM
m¼1 that
I. Kopriva, A. Peršin / Medical Image Analysis 13 (2009) 507–518 509

Author's personal copy
themselves are rows of S that represent spatial distributions of thesources. Assuming that X represents an RGB fluorescent image thenumber of spectral bands N equals 3. In order to relate the SLMM(1) to the tumour visualisation, we point out again that sourcessm represent spatial maps of the tumour, surrounding healthy tis-sue and possibly some other material resident in the multi-spectralfluorescent image, while corresponding column vectors am of thebasis or mixing matrix represent their spectral responses. Follow-ing this interpretation we immediately see that spectral similarityof the sources sm and sn will affect the condition number of the ba-sis matrix, because the corresponding column vectors am and an
become close to collinear. This is elaborated in great details inthe appendix where effects of the NBG transform on the conditionnumber of the extended mixing matrix are evaluated analyticallyand numerically. Simulation example in Section 3.1 based on thecomputational model of the RGB image also demonstrates thatcondition number of the mixing matrix is increasing from 11.7 to117 when angle between two spectral vectors decreases from 10�to 1�. In addition to deteriorate conditioning of the mixing matrixspectral similarity between the sources makes them statisticallydependent. This is easily verified by assuming that sources sm
and sn are spectrally very similar. Then an ffi cam, where c repre-sents the intensity scaling factor. The contribution of these twosources at any pixel location t is amsmt + ansnt ffi amsmt + amcsnt,implying that sm and csn are indistinguishable i.e. sm and sn are sta-tistically dependent. Hence, two fundamental requirements im-posed by the ICA algorithms on the SLMM fail when the sourcesbecome spectrally highly similar. We point out that spectral simi-larity among the sources also affects the performance of the NMFalgorithms due to the ill-conditioning of the basis matrix. It isNBG transform that is necessary to improve conditioning of the ex-tended basis matrix. However, as it will be demonstrated in Section3, it is also DCA that is necessary to be used in combination withNBG transform in order to account for statistical dependence in-duced by spectral similarity between the sources.
2.5. New algorithm: NBG and DCA
Here we propose a novel solution for unsupervised decomposi-tion of the SLMM (1) for the case of ill-conditioned basis matrixand statistically dependent sources, by combining NBG transform(Ren and Chang, 2000; Du et al., 2004), that increases the dimen-sionality of the original multi-spectral image X and decreases thecondition number of the extended basis matrix, and DCA (Cichockiand Georgiev, 2003; Hyvärinen, 1998; Kopriva and Seršic, 2008)that increases the level of statistical independence between thespectrally similar sources. This combined use of two transformsis original contribution of this paper that is important for robustblind decomposition of low-dimensional multi-spectral imagessuch as RGB image for example. It is demonstrated on computa-tional model and experimental data that proposed algorithm yieldshigh-contrast tumour maps when intensity of the acquired fluores-cent image is fluctuating more than 10 times causing increasedspectral similarity between tumour and surrounding tissue.
The NBG process was originally proposed in Ren and Chang(2000) with the aim of increasing the accuracy of the orthogonalsubspace projection method in decomposition and classificationof the multi-spectral images and also used for the same purposein Du et al. (2004), when the number of sources M to be classifiedexceeds the number of spectral bands N. The same limitation,N P M, also applies to the ICA and DCA algorithms in unsuperviseddecomposition of the SLMM (1). According to Ren and Chang(2000) the basic idea behind the NBG approach arises from the factthat a second-order random process is generally specified by itsfirst-order and second-order statistics. Looking at the original spec-tral images fxngN
n¼1 as the first-order statistical images, a set of sec-
ond-order statistical spectral images can be generated by capturingthe correlation between the spectral bands. They provide usefulsecond-order statistical information about spectral bands that ismissing in the set of original spectral images. Theoretically, anynonlinear function can be used to generate set of artificial imageswith linearly independent spectral measurements. Previous exper-imental studies (Du et al., 2004) have shown that nonlinear func-tion that enlarges or emphasizes discrepancy between originalspectral measurements will help to improve classification perfor-mance, since the technique applied here uses spectral information.A simplest but effective choice is multiplication. When two originalspectral images are multiplied together a new artificial spectralimage is generated. Here, multiplication acts as matched filtering.When multiplicant and multiplier are equal, the product is themaximum. So multiplication can emphasize the spectral similaritybetween two spectral measurements of the same pixel, which isequivalent to emphasizing their dissimilarity or discrepancy. Mul-tiplication can be also used for a single band. Then, it emphasizes asingle spectral measurement itself, which is also equivalent toenlarging the spectral difference from other spectral measure-ments of this pixel. Thus, second-order statistics, which includeauto-correlation, cross-correlation and nonlinear correlation, areused to create nonlinearly correlated spectral images and increasethe dimensionality of the original image X. The set of auto-corre-lated spectral images is obtained as fx2
ngNn¼1 while the set of
cross-correlated spectral images is obtained as fxnxmgNm;n¼1;m–n.
The dimensionality of the original image X is extended from N to
2N + N2
� �. Thus the dimensionality of an RGB image is increased
from 3 to 9. Although dimensionality increase is important, espe-cially when the number of spectral bands is small, there is anotherimportant property of the NBG technique presented here for thefirst time. Namely, the NBG technique causes the two angularlyclose spectral vectors am and an to become more separated in theband-expanded version of the original image. We denote theband-expanded image as �X. This is achieved provided that thetwo corresponding sources sm and sn do not have exactly the sameintensity. Detailed demonstrations for 2D and 3D problems withcross-correlated and auto-correlated bands are presented inAppendix. Thus the NBG technique significantly improves condi-tioning of the original basis or mixing matrix caused by spectralsimilarity between the sources. Since in a tumour demarcationproblem we are interested in spatial localisation of the tumourclass, we shall impose a special constraint on the sources in theSLMM (1): sm � {0,1} i.e. we presume quasi-binary nature of thespatial maps of the sources, where 1 indicates source presenceand 0 indicates source absence at the pixel level. However, thetruth is that sources are continuous and not binary. But if blinddecomposition is reasonably successful other sources present ineach extracted source spatial map will be suppressed significantly.Thus, the extracted sources could be, at least as the first approxi-mation, modeled as quasi-binary. This assumption is necessary tomake analytical and numerical quantification of the effects ofNBG transform mathematically tractable. The analysis itself is inpresented in the Appendix for 2D and 3D problems, where it isdemonstrated that NBG transform really improves conditioningof the extended mixing matrix in relation to the original mixingmatrix. This is especially the case when the column vectors ofthe original mixing matrix become close to collinear (the angularseparation between the column vectors is small), see Figs. 7–9.
Another assumption that is necessary to carry on analysis dis-cussed above is that sources do not overlap in the spatial domain:smtsnt = dmn, where t denotes pixel location and dmn represents Kro-necker’s delta symbol. This helps to get rid out of the cross-termsthat show up in nonlinear band expansion process. This no-over-lapping assumption is however not pure mathematical construct.
510 I. Kopriva, A. Peršin / Medical Image Analysis 13 (2009) 507–518

Author's personal copy
It has justification in tumour demarcation problem due to the factthat the pixel footprint is small, usually less than a square mm, andit is highly unlikely that the tumour occupies the same pixel loca-tion with some other source resident in the multi-spectral image.Under these two assumptions (quasi-binary and no-overlappingsources) it is straightforward to show that the NBG technique ap-plied to the SLMM (1) produces the following result:
xmtxnt ffiXM
k¼1
amkankskt
Thus in matrix notation model (1) is transformed into
�X ¼ �AS ð12Þ
Spectral similarity between the sources sm and sn makes themalso statistically dependent. A few approaches that deal with theproblem of statistically dependent sources are presented in Ci-chocki and Amari (2002), Cichocki and Georgiev (2003), Hyvärinen(1998), Kopriva and Seršic (2008) and Kopriva (2007) and refer-ences cited therein. As elaborated in Section 2.2, the problem isfixed by finding a linear operator H with the property
Hð�XÞ ¼ Hð�ASÞ ¼ �AHðSÞ ð13Þ
such that the transformed sources H(S) are more statistically inde-pendent than the original sources S. We have been already dis-cussed the reasons for choosing high-order innovations transformwith JADE ICA algorithm to form DCA algorithm, as well as to choos-ing first order innovation transform (first order high-pass filter)with the SOBI ICA algorithm to form another DCA algorithm. Coef-ficients of prediction-error filter bm in (10) are efficiently estimatedby means of the Levinson algorithm (Orfanidis, 1988). The filter isapplied row-wise on the image �X and is obtained as an average ofthe prediction-error filters estimated for each image f�xngN
n¼1.Depending on the order of the prediction error filter used, eitherJADE or SOBI ICA algorithms are applied to the SLMM (13) in orderto learn more accurately the extended basis matrix �A or its inverse�W than would be possible from (12). Sources S are then recovered
by applying �W to the band-expanded image given by (12).Before proceeding to the presentation of the results, we briefly
comment on two important remaining issues: estimation of theunknown number of sources M, and prioritisation of the extractedsources by the measure of information contained in them. Deter-mination of the number of sources is a very old problem in mul-tivariate data analysis, and is also known as intrinsicdimensionality problem (Fukunaga and Olsen, 1971). Severalmethods for estimating the number of sources in a hyper-spectralimage have been tested in Chang and Du (2004). Malinowski’smethod (Malinowski, 1977a,b) developed for determination ofthe number of factors in absorption spectroscopy, mass spectra,and chromatography has been demonstrated in Chang and Du(2004) to give a good result in estimating the number of sourcesresident in the hyper-spectral image. We have used this methodin estimating the number of sources in the band-expanded ver-sion of the multi-spectral image given by (5). When dealing withthe original RGB image given by (1), estimating the number ofsources was not an issue, because a priori knowledge and the factthat maximal number of sources is limited by the number ofspectral bands, that is 3, narrowed down the number of sourcesto 1, 2 or 3. To prioritise the extracted sources we used thehigh-order statistics-based approximation of the negentropy mea-sure (Wang and Chang, 2006) and Eq. (5), p. 115 in Hyvärinenand Karhunen (2001):
JðsmÞ ffi1
12½j3
m�2 þ 1
48½j4
m � 3�2 ð14Þ
where k3m ¼ ð1=TÞ
PTt¼1ðsmtÞ3 and k4
m ¼ ð1=TÞPT
t¼1ðsmtÞ4 are samplemeans of third and fourth order statistics of sm.
3. Results
We now execute comparative performance evaluation of thepresented method on the computational model of an RGB fluores-cent image of a surface tumour as well as on experimental RGBfluorescent images of the surface tumour (basal cell carcinoma).For this purpose two experiments have been carried out. In firstexperiment we have recorded an image of a skin tumour afterbeing treated for 4 h with d-5-aminolaevulinic acid. This is aphoto-synthesiser that, through the process of biosynthesis, causesformation of the fluorophore protoporphyrin IX (PpIX), (Koeniget al., 2001). The tumour was illuminated with 405 nm light, whichinduces fluorescence of the PpIX. The fluorescent image was re-corded by a camera with an attached filter used to filter out the re-flected 405 nm light. In order to simulate effects of variability ofthe parameters such as concentration of the photo-synthesiser,intensity of illumination light and duration of the treatment withthe photo-synthesiser, on the variation of the fluorescent imageintensity, we acquired a fluorescent RGB image after illuminationwith high-intensity light as well as with light with a weak intensitylevel. The high-intensity fluorescent image shown in Fig. 1 wasused to extract spatial binary maps of the tumour and surroundinghealthy tissue that served as a ground truth in the comparativeperformance evaluation.
In second experiment, we have acquired a sequence of RGBfluorescent images of the patient with histologically verified diag-noses of superficial multicentric basal cell carcinoma in the lowerright part of the back. As before, skin of the tumour was treatedfor 4 h with d-5-aminolaevulinic acid before images have been ac-quired and the tumour was illuminated with 405 nm light. Theintensity of the illuminating light has been gradually varied over10 times. Two RGB fluorescent images with illumination intensitythat differs 10.91 times are shown in Fig. 4a and b.
3.1. Simulation results
To carry out comparative performance analysis we have firstcreated a computational model of an RGB image based on (1) in or-der to produce a synthetic fluorescent image with a controlled de-gree of spectral similarity between the tumour and surroundinghealthy tissue. Thus, we have M = 2 sources and by conventionwe choose source s1 to represent the tumour and source s2 to rep-resent the surrounding healthy tissue. In the corresponding col-umn vectors a1 and a2 we set the components that correspond
Fig. 1. RGB fluorescent image of the skin tumour acquired after illumination withhigh-intensity light.
I. Kopriva, A. Peršin / Medical Image Analysis 13 (2009) 507–518 511
Author's personal copy
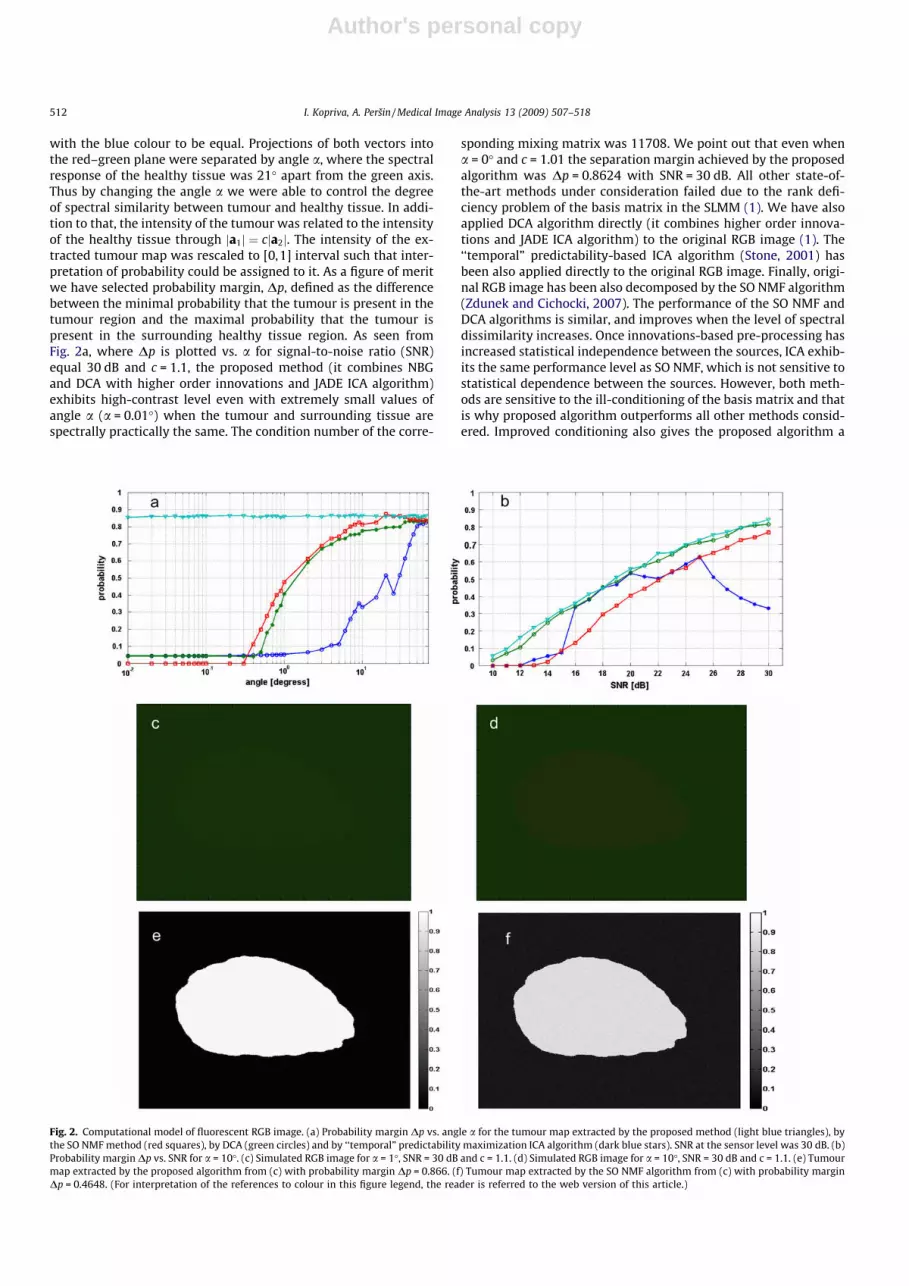
with the blue colour to be equal. Projections of both vectors intothe red–green plane were separated by angle a, where the spectralresponse of the healthy tissue was 21� apart from the green axis.Thus by changing the angle a we were able to control the degreeof spectral similarity between tumour and healthy tissue. In addi-tion to that, the intensity of the tumour was related to the intensityof the healthy tissue through ja1j ¼ cja2j. The intensity of the ex-tracted tumour map was rescaled to [0,1] interval such that inter-pretation of probability could be assigned to it. As a figure of meritwe have selected probability margin, Dp, defined as the differencebetween the minimal probability that the tumour is present in thetumour region and the maximal probability that the tumour ispresent in the surrounding healthy tissue region. As seen fromFig. 2a, where Dp is plotted vs. a for signal-to-noise ratio (SNR)equal 30 dB and c = 1.1, the proposed method (it combines NBGand DCA with higher order innovations and JADE ICA algorithm)exhibits high-contrast level even with extremely small values ofangle a (a = 0.01�) when the tumour and surrounding tissue arespectrally practically the same. The condition number of the corre-
sponding mixing matrix was 11708. We point out that even whena = 0� and c = 1.01 the separation margin achieved by the proposedalgorithm was Dp = 0.8624 with SNR = 30 dB. All other state-of-the-art methods under consideration failed due to the rank defi-ciency problem of the basis matrix in the SLMM (1). We have alsoapplied DCA algorithm directly (it combines higher order innova-tions and JADE ICA algorithm) to the original RGB image (1). The‘‘temporal” predictability-based ICA algorithm (Stone, 2001) hasbeen also applied directly to the original RGB image. Finally, origi-nal RGB image has been also decomposed by the SO NMF algorithm(Zdunek and Cichocki, 2007). The performance of the SO NMF andDCA algorithms is similar, and improves when the level of spectraldissimilarity increases. Once innovations-based pre-processing hasincreased statistical independence between the sources, ICA exhib-its the same performance level as SO NMF, which is not sensitive tostatistical dependence between the sources. However, both meth-ods are sensitive to the ill-conditioning of the basis matrix and thatis why proposed algorithm outperforms all other methods consid-ered. Improved conditioning also gives the proposed algorithm a
Fig. 2. Computational model of fluorescent RGB image. (a) Probability margin Dp vs. angle a for the tumour map extracted by the proposed method (light blue triangles), bythe SO NMF method (red squares), by DCA (green circles) and by ‘‘temporal” predictability maximization ICA algorithm (dark blue stars). SNR at the sensor level was 30 dB. (b)Probability margin Dp vs. SNR for a = 10�. (c) Simulated RGB image for a = 1�, SNR = 30 dB and c = 1.1. (d) Simulated RGB image for a = 10�, SNR = 30 dB and c = 1.1. (e) Tumourmap extracted by the proposed algorithm from (c) with probability margin Dp = 0.866. (f) Tumour map extracted by the SO NMF algorithm from (c) with probability marginDp = 0.4648. (For interpretation of the references to colour in this figure legend, the reader is referred to the web version of this article.)
512 I. Kopriva, A. Peršin / Medical Image Analysis 13 (2009) 507–518
Author's personal copy
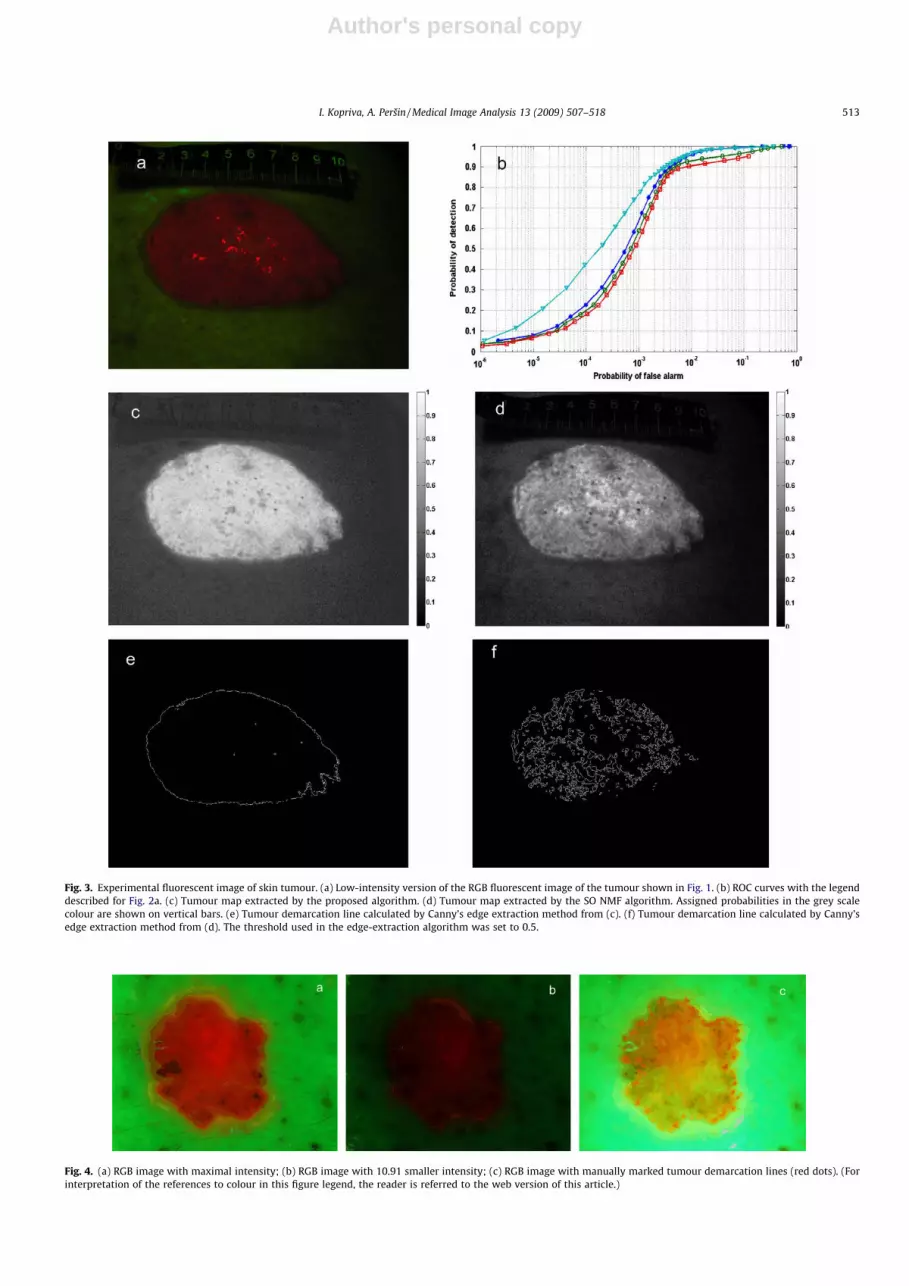
Fig. 4. (a) RGB image with maximal intensity; (b) RGB image with 10.91 smaller intensity; (c) RGB image with manually marked tumour demarcation lines (red dots). (Forinterpretation of the references to colour in this figure legend, the reader is referred to the web version of this article.)
Fig. 3. Experimental fluorescent image of skin tumour. (a) Low-intensity version of the RGB fluorescent image of the tumour shown in Fig. 1. (b) ROC curves with the legenddescribed for Fig. 2a. (c) Tumour map extracted by the proposed algorithm. (d) Tumour map extracted by the SO NMF algorithm. Assigned probabilities in the grey scalecolour are shown on vertical bars. (e) Tumour demarcation line calculated by Canny’s edge extraction method from (c). (f) Tumour demarcation line calculated by Canny’sedge extraction method from (d). The threshold used in the edge-extraction algorithm was set to 0.5.
I. Kopriva, A. Peršin / Medical Image Analysis 13 (2009) 507–518 513
Author's personal copy
higher robustness level against additive noise, which is demon-strated in Fig. 2b where Dp is plotted vs. SNR for a = 10� andc = 1.1. For the purpose of visual demonstration, Fig. 2c and d showsynthetic RGB images for a = 1� and a = 10�, respectively withSNR = 30 dB and c = 1.1. The visual contrast is very poor inFig. 2c. Fig. 2e and f show tumour maps extracted from Fig. 2c bythe proposed algorithm and the SO NMF algorithm after 2000 iter-ations, respectively. Note the very high-contrast in Fig. 2e withDp = 0.866, while for Fig. 2f Dp = 0.4648. The condition numbersof the corresponding basis matrices were 117 and 11.7. For thesake of comparison we mention that the condition numbers ofthe mixing matrices in the benchmark experiments used to testthe SO NMF algorithm in Zdunek and Cichocki (2007) were be-
tween 4 and 10. It is noteworthy that computation time forFig. 2e was around 30 s, and for Fig. 2f around 330 s in a MATLABenvironment on a desktop computer with 3 GHz clock speed and4 GB of RAM.
3.2. Results for experiment 1
We now present the results of the comparative performanceanalysis for the low-intensity version of the RGB fluorescent imageshown in Fig. 1. The low-intensity image itself is shown in Fig. 3a.The receiver-operating-characteristic (ROC) curves selected for thisexperimental example as a figure of merit, that show probability ofdetection vs. probability of false alarm, are shown in Fig. 3b for the
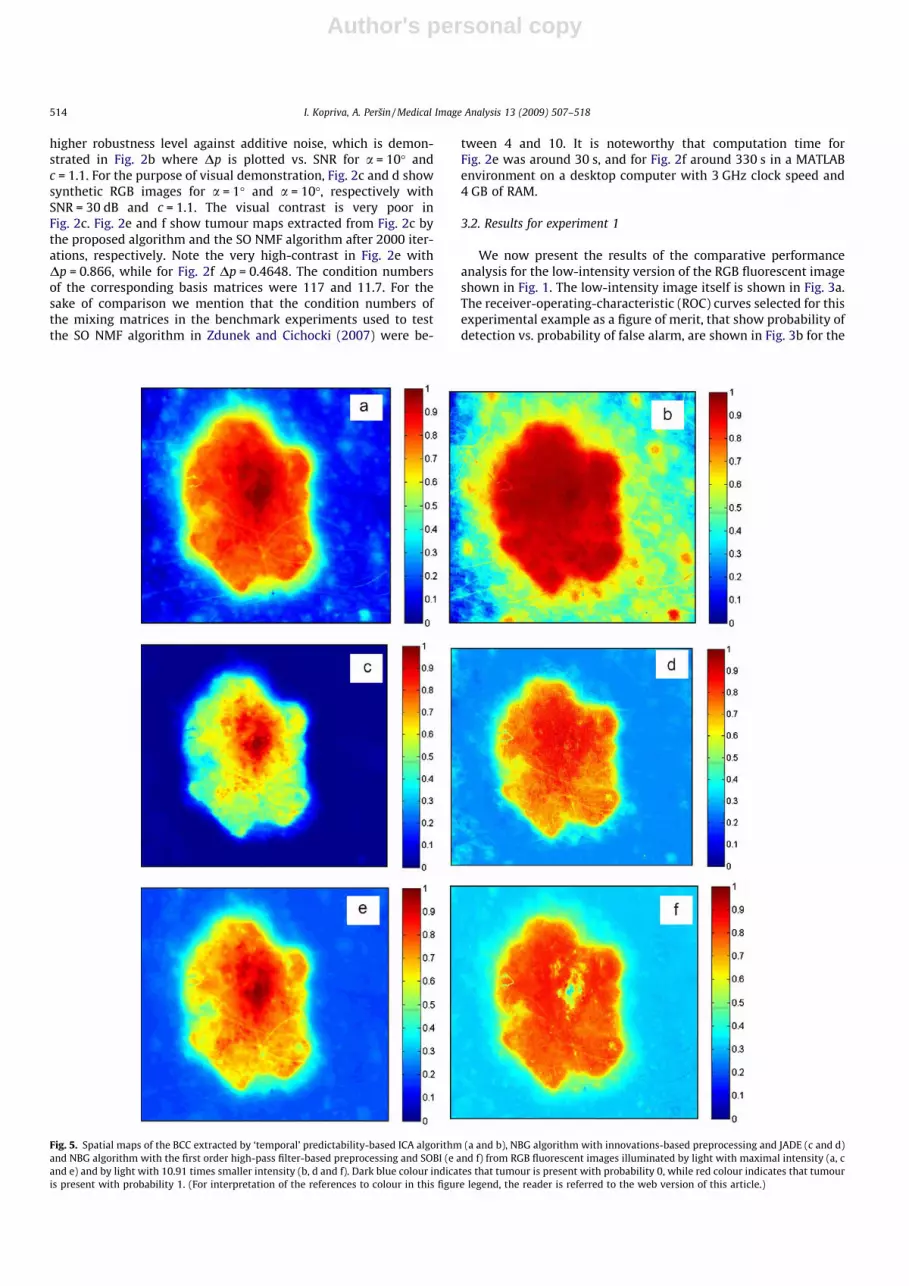
Fig. 5. Spatial maps of the BCC extracted by ‘temporal’ predictability-based ICA algorithm (a and b), NBG algorithm with innovations-based preprocessing and JADE (c and d)and NBG algorithm with the first order high-pass filter-based preprocessing and SOBI (e and f) from RGB fluorescent images illuminated by light with maximal intensity (a, cand e) and by light with 10.91 times smaller intensity (b, d and f). Dark blue colour indicates that tumour is present with probability 0, while red colour indicates that tumouris present with probability 1. (For interpretation of the references to colour in this figure legend, the reader is referred to the web version of this article.)
514 I. Kopriva, A. Peršin / Medical Image Analysis 13 (2009) 507–518

Author's personal copy
same algorithms as in Fig. 2. Note that the proposed algorithmexhibits significantly better performance in the region of smallprobability of false alarm than other methods in consideration.DCA, SO NMF and ICA performed similarly. Performance of thehigher order statistics based ICA algorithms is inferior in relationto the second order statistics based method used here (Stone,2001). Fig. 3c and d show tumour maps extracted from Fig. 3a bythe proposed algorithm and by the SO NMF algorithm, respectively.The contrast of the tumour map in Fig. 3c is much better. That isconfirmed in Fig. 3e and f, which show tumour demarcation linescalculated from Fig. 3c and d by Canny’s edge extraction methodwith threshold set to 0.5. In relation to the experimental imageshown in Fig. 3a, we make another comment: that its complexitywas artificially increased by adding a ruler in to the scene. Becausethe ruler is not spectrally homogenous, it increased the number ofsources resident in the image, probably to four, which exceededthe number of spectral bands of the original image. Despite that,and despite the fact that intensity was low, the proposed methodperformed well.
3.3. Results for experiment 2
In order to quantify robustness of the proposed algorithmagainst intensity fluctuation we have acquired a sequence of RGBfluorescent images of the patient with histologically verified diag-noses of superficial multicentric basal cell carcinoma in the lowerright part of the back. The intensity of the illuminating light hasbeen gradually varied over 10 times. Two RGB fluorescent imageswith illumination intensity that differs 10.91 times are shown inFig. 4a and b. Fig. 4c shows demarcation line of the tumour markedmanually by red dots. Through biopsy it has been verified thatthere is no tumour outside of the region marked by red dots. Thus,Fig. 4c can serve as a reference in comparative performance analy-sis of the tumour demarcation methods. Three best results are cho-sen and shown in Fig. 5. It shows extracted spatial maps of thetumours rescaled to [0,1] interval in the pseudo colour scale,where dark blue colour represents 0 (absence of the tumour) andred colour represents 1 (presence of the tumour). First row showsmaps extracted by ‘‘temporal” predictability-based ICA algorithm.Second row shows maps extracted by proposed algorithm whereDCA part was composed of tenth order innovation process and
JADE ICA algorithm. Third row shows maps extracted by proposedalgorithm where DCA part was composed of first order high-passfiltering and SOBI ICA algorithm. First column shows maps ex-tracted from RGB image shown in Fig. 4a. Second column showsmaps extracted from RGB image shown in Fig. 4b, whereas inten-sity of the illumination was 10.91 times less than in Fig. 4a. Thecontrast between the tumour area and background area is the bestpreserved by proposed method with DCA algorithm composed oftenth order innovation process and JADE ICA algorithm. This state-ment is further supported by Fig. 6, where length of the demarca-tion line in pixels is shown as a function of the relative intensity ofthe illuminating light. Relative intensity has been calculated as I0/In
where I0 represented maximal value of the intensity. Demarcationlines were calculated after edges were extracted from tumourmaps by Canny’s edge extraction method with a threshold varyingin the interval [0.4,0.6]. This small deviation of the threshold fromthe unbiased value of 0.5 was necessary to account for the quasi-binary nature of the sources. Note that high quality binary spatialmaps of the tumour can be obtained from maps extracted by blinddecomposition methods if some reasonably advance clusteringalgorithm is applied to them. Here we were applying Canny’s edgeextraction method with basically fixed threshold in order toemphasize good and robust performance of the proposed methodagainst intensity fluctuation. Proposed method with DCA algo-rithm composed of tenth order innovation process and JADE ICAalgorithm exhibited the best performance in term of the stabilityof demarcation line. Standard deviation for this case was estimatedas 127.1 pixels. Version of the proposed algorithm when DCA wascomposed of first order high-pass filtering and SOBI ICA methodyielded standard deviation of 263.8 pixels. ‘‘Temporal” predictabil-ity-based ICA algorithm when applied to RGB image directlyyielded standard deviation of 327.8 pixels. When the same algo-rithm was applied to band expanded image it yielded standarddeviation of 1157.6 pixels.
4. Discussion
We have presented an algorithm for high-contrast tumourvisualisation and demarcation through unsupervised decomposi-tion of a low-intensity low-dimensional (RGB) multi-spectralfluorescent image of the tumour. Coarse spectral resolution of
Fig. 6. Length of the demarcation lines, in pixels, of the tumour spatial maps extracted from RGB fluorescent images illuminated by light with different intensity levels.Horizontal axis from left to right represents ratio between maximal intensity and intensity of each particular illumination. Legend: sky blue stars – ‘temporal’ predictability-based ICA algorithm applied to band expanded RGB image; dark blue circles – ‘temporal’ predictability-based ICA algorithm applied on original RGB image; red squares – SOBIICA algorithm applied on first order high pass filter-based pre-processed band expanded RGB image; green diamonds – JADE ICA algorithm applied on innovations-based pre-processed band expanded RGB image. (For interpretation of the references to colour in this figure legend, the reader is referred to the web version of this article.)
I. Kopriva, A. Peršin / Medical Image Analysis 13 (2009) 507–518 515

Author's personal copy
the RGB-like images in combination with the low-intensity of thefluorescence yields ill-conditioned SLMM with statisticallydependent sources. This represents a great challenge for manystate-of-the-art blind image decomposition algorithms. Proposed
method is composed of two algorithms: NBG transform that im-proves conditioning of the extended basis matrix and DCA thatincreases statistical independence between the sources. We havedemonstrated good performance of this method on experimentalRGB fluorescent images of the BCC. High-contrast tumour mapswere extracted when the intensity of the illuminating light wasvaried more than 10 times causing spectral similarity betweenthe tumour and surrounding tissue. There are various situationsin clinical practice that could benefit from these results: (i) con-centration of the photo- synthesiser can be reduced; (ii) durationof treatment with the photo-synthesiser can be reduced; (iii)intensity of the illumination light can be reduced; (iv) tumourdetection in the early stage of development should be possible.Reduced intensity of the illuminating light could be important,for example in surgery on brain tumours, which can last for sev-eral hours, and where high intensity of the illuminating light cancause damage to healthy tissue. Although the method is demon-strated for the visualisation and demarcation of a surface tu-mour, it ought to be equally applicable to visualisation anddemarcation of other types of tumours, for example tumours atthe cell level, where fluorescent nanoparticle markers are usedto label the tumour cells (Tréhin et al., 2006), or where visualisa-tion is based on a green fluorescent protein gene tumour trans-duction system (Hasegawa et al., 2000; Hoffman, 2002).Extraction of the tumour map from the spectrally similar sur-rounding tissue can efficiently be executed by the ICA algorithmsalone and hyper-spectral imaging technology. However,achieving that with RGB images acquired by cheap commercialdigital cameras is important from the affordability viewpoint. Itshould enable easier dissemination of the tumour visualisationtechnology presented herein. Application of the proposed methodfor real time tumour demarcation is straightforward and it isonly a matter of the hardware platform chosen for the algorithmimplementation. Finally, we note that the general unsuperviseddecomposition method described above in the tumourdemarcation and multi-spectral imaging context should be appli-cable to other types of the multi-channel medical imagingsystems.
Acknowledgments
The work of I. Kopriva on algorithm development for unsuper-vised image decomposition was supported by the Ministry of Sci-ence, Education and Sport, Republic of Croatia Grant 098-0982903-2558. The work of A. Peršin on collecting data used inFigs. 1 and 3a was supported by the same Ministry through theproject TP-05/0098-47.
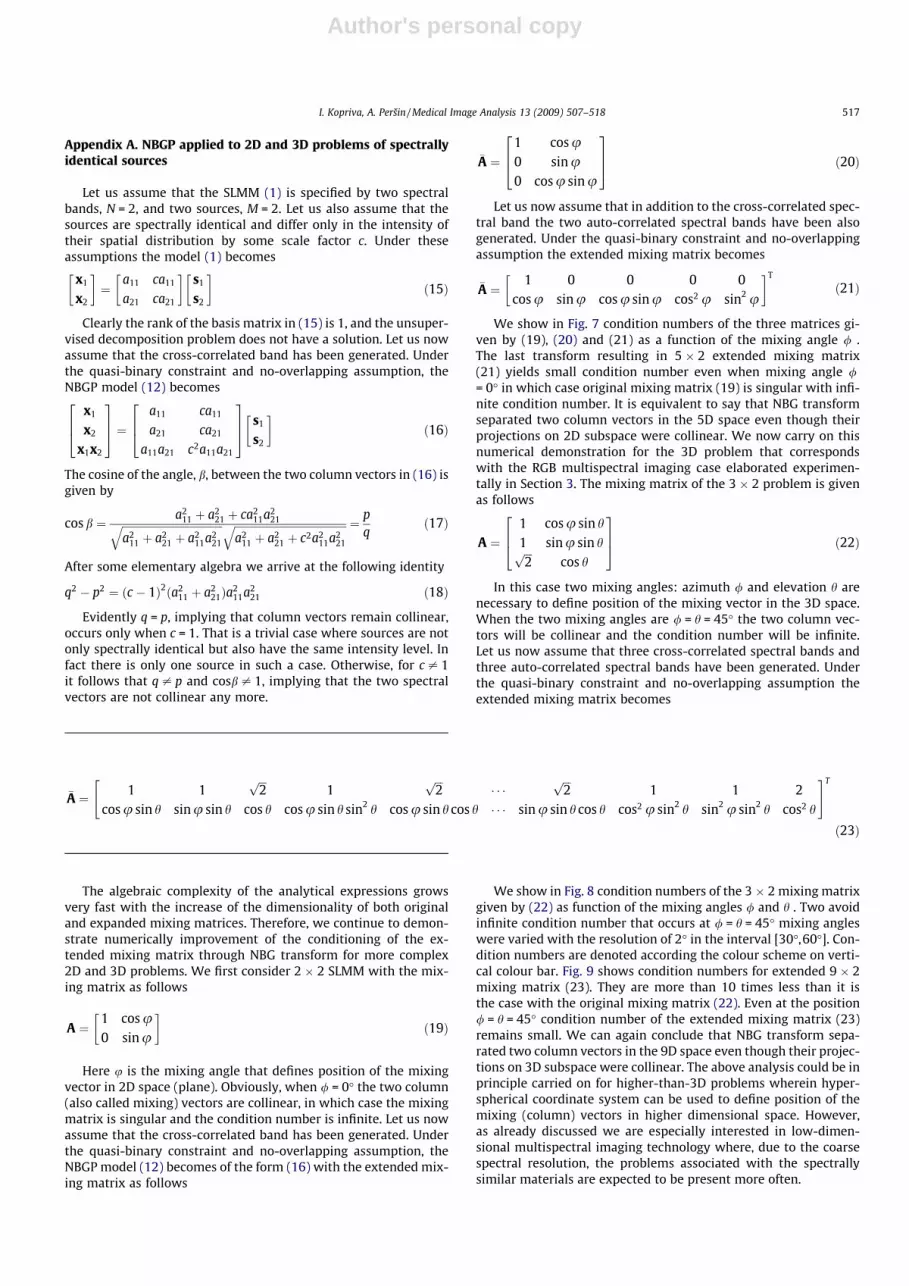
Fig. 7. Condition numbers vs. mixing angle for: original 2 � 2 mixing matrix, Eq. (19), (blue circles); expanded 3 � 2 mixing matrix, Eq. (20), (green squares); expanded 5 � 2mixing matrix, Eq. (21), (red diamonds). (For interpretation of the references to colour in this figure legend, the reader is referred to the web version of this article.)
Fig. 8. Condition numbers, according to the colour scheme on vertical colour bar,for 3 � 2 mixing matrix, Eq. (22), as a function of elevation and azimuth mixingangles. The mixing angles were varied in the 2� grid to avoid infinite conditionnumber that would occur at 45� of azimuth and elevation.
Fig. 9. Condition numbers, according to the colour scheme on vertical colour bar,for 9 � 2 mixing matrix, Eq. (23), as a function of elevation and azimuth mixingangles.
516 I. Kopriva, A. Peršin / Medical Image Analysis 13 (2009) 507–518
Author's personal copy
Appendix A. NBGP applied to 2D and 3D problems of spectrallyidentical sources
Let us assume that the SLMM (1) is specified by two spectralbands, N = 2, and two sources, M = 2. Let us also assume that thesources are spectrally identical and differ only in the intensity oftheir spatial distribution by some scale factor c. Under theseassumptions the model (1) becomes
x1
x2
� �¼
a11 ca11
a21 ca21
� �s1
s2
� �ð15Þ
Clearly the rank of the basis matrix in (15) is 1, and the unsuper-vised decomposition problem does not have a solution. Let us nowassume that the cross-correlated band has been generated. Underthe quasi-binary constraint and no-overlapping assumption, theNBGP model (12) becomes
x1
x2
x1x2
264
375 ¼
a11 ca11
a21 ca21
a11a21 c2a11a21
264
375 s1
s2
� �ð16Þ
The cosine of the angle, b, between the two column vectors in (16) isgiven by
cos b ¼ a211 þ a2
21 þ ca211a2
21ffiffiffiffiffiffiffiffiffiffiffiffiffiffiffiffiffiffiffiffiffiffiffiffiffiffiffiffiffiffiffiffiffiffiffiffiffiffia2
11 þ a221 þ a2
11a221
q ffiffiffiffiffiffiffiffiffiffiffiffiffiffiffiffiffiffiffiffiffiffiffiffiffiffiffiffiffiffiffiffiffiffiffiffiffiffiffiffiffiffia2
11 þ a221 þ c2a2
11a221
q ¼ pq
ð17Þ
After some elementary algebra we arrive at the following identity
q2 � p2 ¼ ðc � 1Þ2ða211 þ a2
21Þa211a2
21 ð18Þ
Evidently q = p, implying that column vectors remain collinear,occurs only when c = 1. That is a trivial case where sources are notonly spectrally identical but also have the same intensity level. Infact there is only one source in such a case. Otherwise, for c – 1it follows that q – p and cosb – 1, implying that the two spectralvectors are not collinear any more.
The algebraic complexity of the analytical expressions growsvery fast with the increase of the dimensionality of both originaland expanded mixing matrices. Therefore, we continue to demon-strate numerically improvement of the conditioning of the ex-tended mixing matrix through NBG transform for more complex2D and 3D problems. We first consider 2 � 2 SLMM with the mix-ing matrix as follows
A ¼1 cos u0 sin u
� �ð19Þ
Here u is the mixing angle that defines position of the mixingvector in 2D space (plane). Obviously, when / = 0� the two column(also called mixing) vectors are collinear, in which case the mixingmatrix is singular and the condition number is infinite. Let us nowassume that the cross-correlated band has been generated. Underthe quasi-binary constraint and no-overlapping assumption, theNBGP model (12) becomes of the form (16) with the extended mix-ing matrix as follows
�A ¼1 cos u0 sin u0 cos u sin u
264
375 ð20Þ
Let us now assume that in addition to the cross-correlated spec-tral band the two auto-correlated spectral bands have been alsogenerated. Under the quasi-binary constraint and no-overlappingassumption the extended mixing matrix becomes
�A ¼1 0 0 0 0
cos u sin u cos u sin u cos2 u sin2 u
� �T
ð21Þ
We show in Fig. 7 condition numbers of the three matrices gi-ven by (19), (20) and (21) as a function of the mixing angle / .The last transform resulting in 5 � 2 extended mixing matrix(21) yields small condition number even when mixing angle /= 0� in which case original mixing matrix (19) is singular with infi-nite condition number. It is equivalent to say that NBG transformseparated two column vectors in the 5D space even though theirprojections on 2D subspace were collinear. We now carry on thisnumerical demonstration for the 3D problem that correspondswith the RGB multispectral imaging case elaborated experimen-tally in Section 3. The mixing matrix of the 3 � 2 problem is givenas follows
A ¼1 cos u sin h
1 sinu sin hffiffiffi2p
cos h
264
375 ð22Þ
In this case two mixing angles: azimuth / and elevation h arenecessary to define position of the mixing vector in the 3D space.When the two mixing angles are / = h = 45� the two column vec-tors will be collinear and the condition number will be infinite.Let us now assume that three cross-correlated spectral bands andthree auto-correlated spectral bands have been generated. Underthe quasi-binary constraint and no-overlapping assumption theextended mixing matrix becomes
We show in Fig. 8 condition numbers of the 3 � 2 mixing matrixgiven by (22) as function of the mixing angles / and h . Two avoidinfinite condition number that occurs at / = h = 45� mixing angleswere varied with the resolution of 2� in the interval [30�,60�]. Con-dition numbers are denoted according the colour scheme on verti-cal colour bar. Fig. 9 shows condition numbers for extended 9 � 2mixing matrix (23). They are more than 10 times less than it isthe case with the original mixing matrix (22). Even at the position/ = h = 45� condition number of the extended mixing matrix (23)remains small. We can again conclude that NBG transform sepa-rated two column vectors in the 9D space even though their projec-tions on 3D subspace were collinear. The above analysis could be inprinciple carried on for higher-than-3D problems wherein hyper-spherical coordinate system can be used to define position of themixing (column) vectors in higher dimensional space. However,as already discussed we are especially interested in low-dimen-sional multispectral imaging technology where, due to the coarsespectral resolution, the problems associated with the spectrallysimilar materials are expected to be present more often.
�A ¼ 1 1ffiffiffi2p
1ffiffiffi2p
� � �ffiffiffi2p
1 1 2cos u sin h sinu sin h cos h cos u sin h sin2 h cos u sin h cos h � � � sin u sin h cos h cos2 u sin2 h sin2 u sin2 h cos2 h
" #T
ð23Þ
I. Kopriva, A. Peršin / Medical Image Analysis 13 (2009) 507–518 517
Author's personal copy
References
Adams, J.B., Smith, M.O., Gillespie, A.R., 1993. Image spectroscopy: interpretationbased on spectral mixture analysis. In: Pieters, C.M., Englert, P.A. (Eds.), RemoteGeochemical Analysis: Elemental and Mineralogical Composition. CambridgeUniversity Press, Cambridge, Massachusetts.
Bäumler, W., Abels, C., Szeimies, R.M., 2003. Fluorescence diagnosis andphotodynamic therapy in dermatology. Med. Laser Appl. 18, 47–56.
Bell, A., Sejnowski, T.J., 1995. An information maximization approach to blindseparation and blind deconvolution. Neural Comput. 7, 1129–1159.
Belouchrani, A., Abed-Meraim, K., Cardoso, J.F., Moulines, E., 1997. A blind sourceseparation technique based on second order statistics. IEEE Trans. SignalProcess. 45, 434–444.
Cardoso, J.F., Soulomniac, A., 1993. Blind beamforming for non-Gaussian signals.Proc. IEE F 140, 362–370.
Chang, C.I., Du, Q., 2004. Estimation of number of spectrally distinct signal sourcesin hyperspectral imagery. IEEE Trans. Geosci. Remote Sens. 42, 608–619.
Choi, S., Cichocki, A., Amari, S., 2000. Flexible independent component analysis. J.VLSI Signal Process. 26 (1–2), 25–38.
Cichocki, A., 2007. General component analysis and blind source separationmethods for analyzing multichannel brain signals. In: J Wenger, M., Schuster,C. (Eds.), Statistical and Process Models of Cognitive Aging, Notre Dame Serieson Quantitative Methods. Erlbaum, Mahwah, NJ.
Cichocki, A., Amari, S., 2002. Adaptive Blind Signal and Image Processing. JohnWiley, New York.
Cichocki, A., Georgiev, P., 2003. Blind source separation algorithms withmatrix constraints. IEICE Trans. Fund. Electron. Commun. Comput. Sci. E86-A,513–522.
Cichocki, A., Zdunek, R., Amari, S., 2008. Nonnegative matrix and tensorfactorization. IEEE Signal Proc. Mag. 25, 142–145.
Du, Q., Kopriva, I., 2008. Automated target detection and discrimination usingconstrained kurtosis maximization. IEEE Geosci. Remote Sens. Lett. 5, 38–42.
Du, Q., Kopriva, I., Szu, H., 2004. Independent component analysis for classifyingmultispectral images with dimensionality limitation. Int. J. Inf. Acq. 1, 201–216.
Du, Q., Kopriva, I., Szu, H., 2006. Independent component analysis for hyperspectralremote sensing. Opt. Eng. 45 (017008), 1–13.
Ericson, M.B., Sandberg, C., Gudmundson, F., Rosén, A., Larkö, O., Wennberg, A.M.,2003. Fluorescence contrast and threshold limit: implications forphotodynamic diagnosis of basal cell carcinoma. J. Photochem. Photobio. B:Biol. 69, 121–127.
Fischer, F., Dickson, E.F., Pottier, R.H., Wieland, H., 2001. An affordable, portablefluorescence imaging device for skin lesion detection using a dual wavelengthapproach for image contrast enhancement and aminolaevulinic acid-inducedprotoporphyrin IX, part I: design, spectral and spatial characteristics. LasersMed. Sci. 16, 199–206.
Fukunaga, K., Olsen, D.R., 1971. An algorithm for finding intrinsic dimensionality ofdata. IEEE Trans. Comput. C 20, 176–183.
Hasegawa, S., Yang, M., Chishima, T., Miyagi, Y., Shimada, H., Moossa, A.R., Hoffman,R.M., 2000. In vivo tumor delivery of the green fluorescent protein gene toreport future occurence of metastasis. Cancer Gene Therapy 10, 1336–1340.
Hoffman, R.M., 2002. Green fluorescent protein imaging of tumor growth,metastasis, and angiogenesis in mouse models. The Lancet Oncology 3, 546–556.
Hyvärinen, A., 1998. Independent component analysis for time-dependentstochastic processes. In: Proceedings of the International Conference onArtificial Neural Networks (ICANN’98), Skovde, Sweden, pp. 541–546.
Hyvärinen, A., Karhunen, J., Oja, E., 2001. Independent Component Analysis. WileyInterscience, New York.
Jutten, C., Herault, J., 1991. Blind separation of sources, part I: an adaptive algorithmbased on neuromimetic architecture. Signal Process. 24, 1–10.
Koenig, F., Knittel, J., Stepp, H., 2001. Diagnostic cancer in vivo. Science 292, 1401–1403.
Kopriva, I., 2007. Approach to blind image deconvolution by multiscale subbanddecomposition and independent component analysis. J. Opt. Soc. Am. A 24,973–983.
Kopriva, I., Seršic, D., 2008. Wavelet packets approach to blind separation ofstatistically dependent sources. Neurocomputing 71, 1642–1655.
Lee, D.D., Seung, S.H., 1999. Learning the parts of objects by non-negative matrixfactorization. Nature 401, 788–791.
Malinowski, E.R., 1977a. Theory of error in factor analysis. Anal. Chem. 49, 606–612.Malinowski, E.R., 1977b. Determination of the number of factors and experimental
error in a data matrix. Anal. Chem. 49, 612–617.McCullagh, P., 1995. Elementary theory of cumulants in tensor methods in
statistics. Chapman and Hall, London. pp. 24–46.Mendel, J.M., 1991. Tutorial on higher-order statistics (spectra) in signal processing
and system theory: theoretical results and some applications. Proc. IEEE 79,278–305.
Molgedey, L., Schuster, H.G., 1994. Separation of mixture of independent signalsusing time delayed correlations. Phys. Rev. Lett. 72, 3634–3636.
Orfanidis, S.J., 1988. Optimum Signal Processing – An Introduction, second ed.MacMillan Publishing Comp., New York.
Pham, D.T., 1997. Blind separation of mixtures of independent sources through aquasimaximum likelihood approach. IEEE Trans. Signal Process. 45, 1712–1725.
Pham, D.T., 2003. Fast algorithm for estimating mutual information, entropies andscore functions. In: Proceedings of the Fourth International Conference onIndependent Component Analysis and Blind Signal Separation (ICA’2003), Nara,Japan, pp.17–22.
Principe, J.C., Xu, D., 1999. Information theoretic learning using Reny’s quadraticentropy. In: Proceedings of the First International Conference on IndependentComponent Analysis and Blind Signal Separation (ICA’99), Aussois, France, pp.407–412.
Principe, J.C., Xu, D., Fisher, J.W., 2000. Information-Theoretic Learning inUnsupervised Adaptive Filtering-Volume I Blind Source Separation. J. Wiley(pp. 265–319).
Ren, H., Chang, Ch.-I., 2000. A generalized orthogonal subspace projection approachto unsupervised multispectral image classification. IEEE Trans. Geosci. RemoteSens. 38, 2515–2528.
Schwartz, S., Zibulevsky, M., Schechner, Y.Y., 2004. ICA using kernel entropyestimation with NlogN complexity. Lect. Notes Comput. Sci. 3195, 422–429.
Scott, M.A., Hopper, C., Sahota, A., Springett, R., Mcllroy, B.W., Bown, S.G.,MacRobert, A.J., 2000. Fluorescence photo diagnostics and photo bleachingstudies of cancerous lesions using ratio imaging and spectroscopic techniques.Lasers Med. Sci. 15, 63–72.
Settle, J.J., Drake, N.A., 1993. Linear mixing and estimation of ground coverproportions. Int. J. Remote Sens. 14, 1159–1177.
Silverman, B.W., 1982. Kernel density estimation using the fast Fourier transform.Appl. Stat. 31, 93–99.
Stone, J.V., 2001. Blind source separation using temporal predictability. NeuralComput. 13, 1559–1574.
Tréhin, R., Figueiredo, J.L., Pittet, M.J., Weisslender, R., Josephson, L., Mahmood, U.,2006. Fluorescent nanoparticle uptake for brain tumour visualization. Neoplasia4, 302–311.
Wang, J., Chang, C.I., 2006. Independent component analysis-based dimensionalityreduction with applications in hyperspectral image analysis. IEEE Trans. Geosci.Remote Sens. 44, 1586–1600.
Xue, Y., Wang, Y., Yang, J., 2008. Independent component analysis based on gradientequation and kernel density estimation. Neurocomputing. doi: 10.1016/j.neucom.2008.08.014.
Zdunek, R., Cichocki, A., 2007. Nonnegative matrix factorization with constrainedsecond-order optimization. Signal Process. 87, 1904–1916.
Ziehe, A., Muller, K.R., Nolte, G., Mackert, B.M., Curio, G., 1998. TDSEP-an efficientalgorithm for blind separation using time structure. In: Proceedings of theInternational Conference on Artificial Neural Networks (ICANN’98), Skovde,Sweden, pp. 675–680.
518 I. Kopriva, A. Peršin / Medical Image Analysis 13 (2009) 507–518