Unsupervised segmentation of conversational transcripts
17
Unsupervised Segmentation of Conversational Transcripts Krishna Kummamuru * , Deepak P * Shourya Roy † , L Venkata Subramaniam † Abstract Contact centers provide dialog based support to organizations to address various customer related issues. We have observed that calls at contact centers mostly follow well defined patterns. Such call flows could specify how an agent should proceed in a call, handle objections, persuade customers, follow compliance issues, etc and could also help to structure the operational process of call handling. Automatically identifying such patterns in terms of distinct segments from a collection of transcripts of conversations would improve productivity of agents as well as enable easy verification of whether calls comply to guidelines. Call transcripts from call centers typically tend to be noisy owing to the noise arising from agent/caller distractions, and errors introduced by the speech recognition engine. Such noise makes classical text segmentation algorithms such as TextTiling, which work on each transcript in isolation, very inappropriate. But such noise effects become statistically insignificant over a corpus of similar calls. In this paper, we propose an algorithm to segment conversational transcripts in an unsupervised way utilizing corpus level information of similar call transcripts. We show that our approach outperforms the classical TextTiling algorithm and also describe ways to improve the segmentation using limited supervision. We discuss various ways of evaluating such an algorithm. We apply the proposed algorithm to a corpus of transcripts of calls from a car reservation call center and evaluate it using various evaluation measures. We apply segmentation to the problem of automatically checking the compliance of agents and show that our segmentation algorithm considerably improves the precision. 1 Introduction Many companies today maintain contact centers in which professional agents interact with the customers through phone calls, online chat and/or emails to handle various types of customer related issues. These types range from technical support and promotional to transactional (travel booking, etc.) issues. Contact centers typically handle hundreds of calls depending on the nature of the business of the organization. Because of speech recognition systems, the transcripts of the calls at the contact centers are available in large volumes. There is a wealth of information hidden in these transcripts that could be useful to the organizations if it is extracted and used appropriately. Text analytics can play an important role in performing deeper and more insightful analysis of conversational transcripts. However, application of text analytics in contact centers is not very common because, contact centers do not have in-house text analytics capabilities. Also owing to the confidential nature of the contact center data, for example, the business information contained in emails, call logs, and call transcripts, the data can not be made public. Hence such data never reaches the text mining community. We have been interacting with services organizations including contact centers. In this paper, we will share our experiences of applying text analytics techniques on real-life data. Specifically, we identify a type of information, viz., segmented calls, that is specific to conversational text which can be used for various tasks by the organizations and propose an approach to extract the same. It has been observed that within a domain in a contact center such as car rental helpdesk or within an instance of such a domain, the interactions follows specific patterns. This is mainly because of similar nature of queries, requests, and complaints within a domain, or an instance of it. Especially, when aggregated over thousands of calls, we have realized that variations are not only finite, but rarely over a handful. End users may perceive their problems to be unique, but in fact, the queries are limited, the clarifications are bounded, and the results are mostly enumerable. Hence interactions can be represented as flow graphs from the begining to the end with a sequence of steps in between and each step having limited number of branches to the next. Moreover, agent supervisors encode the best practices in such a call flow to train agents on ways to handle different types of calls. Call flows can actually be thought of as directed acyclic graphs having a start and end state, where each state performs some specific function. Any call must follow one of the paths from start to end. * IBM India Research Lab, Bangalore, India. Email: {kkummamu,deepak.s.p}@in.ibm.com † IBM India Research Lab, New Delhi, India. Email: {rshourya,lvsubram}@in.ibm.com
-
Upload
independent -
Category
Documents
-
view
3 -
download
0
Transcript of Unsupervised segmentation of conversational transcripts

Unsupervised Segmentation of Conversational Transcripts
Krishna Kummamuru∗, Deepak P∗ Shourya Roy†, L Venkata Subramaniam†
Abstract
Contact centers provide dialog based support to organizations to address various customer related issues.We have observed that calls at contact centers mostly follow well defined patterns. Such call flows couldspecify how an agent should proceed in a call, handle objections, persuade customers, follow complianceissues, etc and could also help to structure the operational process of call handling. Automatically identifyingsuch patterns in terms of distinct segments from a collection of transcripts of conversations would improveproductivity of agents as well as enable easy verification of whether calls comply to guidelines. Call transcriptsfrom call centers typically tend to be noisy owing to the noise arising from agent/caller distractions, and errorsintroduced by the speech recognition engine. Such noise makes classical text segmentation algorithms suchas TextTiling, which work on each transcript in isolation, very inappropriate. But such noise effects becomestatistically insignificant over a corpus of similar calls. In this paper, we propose an algorithm to segmentconversational transcripts in an unsupervised way utilizing corpus level information of similar call transcripts.We show that our approach outperforms the classical TextTiling algorithm and also describe ways to improvethe segmentation using limited supervision. We discuss various ways of evaluating such an algorithm. Weapply the proposed algorithm to a corpus of transcripts of calls from a car reservation call center and evaluateit using various evaluation measures. We apply segmentation to the problem of automatically checking thecompliance of agents and show that our segmentation algorithm considerably improves the precision.
1 Introduction
Many companies today maintain contact centers in which professional agents interact with the customers throughphone calls, online chat and/or emails to handle various types of customer related issues. These types range fromtechnical support and promotional to transactional (travel booking, etc.) issues. Contact centers typically handlehundreds of calls depending on the nature of the business of the organization. Because of speech recognitionsystems, the transcripts of the calls at the contact centers are available in large volumes. There is a wealthof information hidden in these transcripts that could be useful to the organizations if it is extracted and usedappropriately.
Text analytics can play an important role in performing deeper and more insightful analysis of conversationaltranscripts. However, application of text analytics in contact centers is not very common because, contact centersdo not have in-house text analytics capabilities. Also owing to the confidential nature of the contact center data,for example, the business information contained in emails, call logs, and call transcripts, the data can not bemade public. Hence such data never reaches the text mining community. We have been interacting with servicesorganizations including contact centers. In this paper, we will share our experiences of applying text analyticstechniques on real-life data. Specifically, we identify a type of information, viz., segmented calls, that is specific toconversational text which can be used for various tasks by the organizations and propose an approach to extractthe same.
It has been observed that within a domain in a contact center such as car rental helpdesk or within an instanceof such a domain, the interactions follows specific patterns. This is mainly because of similar nature of queries,requests, and complaints within a domain, or an instance of it. Especially, when aggregated over thousands ofcalls, we have realized that variations are not only finite, but rarely over a handful. End users may perceivetheir problems to be unique, but in fact, the queries are limited, the clarifications are bounded, and the resultsare mostly enumerable. Hence interactions can be represented as flow graphs from the begining to the end witha sequence of steps in between and each step having limited number of branches to the next. Moreover, agentsupervisors encode the best practices in such a call flow to train agents on ways to handle different types of calls.Call flows can actually be thought of as directed acyclic graphs having a start and end state, where each stateperforms some specific function. Any call must follow one of the paths from start to end.
∗IBM India Research Lab, Bangalore, India. Email: {kkummamu,deepak.s.p}@in.ibm.com†IBM India Research Lab, New Delhi, India. Email: {rshourya,lvsubram}@in.ibm.com

AGENT: Welcome to CarCompanyA. My name is Albert. How may I help you?
.........
AGENT: Alright may i know the location you want to pick the car from.
CUSTOMER: Aah ok I need it from SFO.
.........
AGENT: Wonderful so let me see ok mam so we have a 12 or 15 passenger van available on this location
on those dates and for that your estimated total for those three dates just 300.58$ this is with Taxes
with surcharges and with free unlimited free mileage.
.........
CUSTOMER: oh and one more question Is it just in states or could you travel out of states
.........
AGENT: alright mam let me recap the dates you want to pick it up from SFO on 3rd August and drop it
off on august 6th in LA alright
.........
AGENT: The confirmation number for your booking is 221 384.
CUSTOMER: ok ok Thank you
AGENT: Thank you for calling CarCompanyA and you have a great day good bye
Figure 1: Snippet of an Example Interaction
Consider the example of a typical call center which receives requests, queries, complaints etc about rentingcars. In a typical conversation there, and also in more general settings, call center agents and callers take turnsspeaking to each other. As mentioned earlier, agents are supposed to follow a call flow to address the needs of thecustomers. For example, agents are expected to greet the customer at the beginning, gather requirement(s) of thecustomer, provide options, handle customer objections, either confirm booking and/or thank customers for theirinterest and finally conclude the call. A representative snippet of an example interaction is given in Figure 1 andthe call flow for the same domain is shown in Figure 2. Occasionally, calls could deviate from the typical pattern,because of agent/caller distractions, unexpected responses etc.
Automatically identifying the segments in calls has many potential applications in call analysis. Viz.,Call monitoring: In operational settings, once the call flow and guidelines are in place, Quality Analysts
(QAs) manually analyze a small sample of the calls regularly. Their job is to ensure that the calls follow theprescribed guidelines, a process which is often referred to as compliance checking. However, owing to the factthat plenty of such calls happen everyday (can go up to few thousand calls per day) and the calls can be of longduration (with calls as long as 30 minutes), the task of QAs is quite tedious. As a result, such manual analysisprocesses are inconsistent (many times one QA does not agree with another QA on the compliance of a call) andslow, (listening to long calls and reaching conclusions takes time). In compliance checking, rules to check couldinclude requirements that agents should greet the caller, agents should check whether the customer has a validdriver license, etc. Intuitively, compliance checking can be identified with better precision when the calls aresegmented since only certain segments may have to be analyzed for a specific check(s).
Agent monitoring: Certain agents perform better than other agents. Segmentation allows the call analyststo determine what good agents are doing in key segments so that all the agents can be trained to follow thesepositive traits. Also, call analysts try to identify patterns in problems and design corresponding solutions for theease of training and grooming of new as well as existing agents. Identification of patterns in problems would beeased if the calls are presented to the analysts in segments.
Our contributions: The main contributions of this work are:
• A collection level technique to automatically segment call transcripts, and
• two novel evaluation measures to evaluate segmentation algorithms.
The proposed technique is unsupervised in nature and performs well without any manual intervention. This isimportant mainly because obtaining labeled data (segmented calls) to learn models is difficult, and many a times,is impossible. At best, manual supervision in terms of characteristic phrases can be incorporated to improve the

Figure 2: Structure of a Car Rental Process from a Call Center
performance of the algorithm. The proposed technique is shown to degrade gracefully even in the presence ofnoise introduced by Automatic Speech Recognition (ASR) system.
Organization of the paper: We discuss related work in the next section. We describe the proposed algorithm inSection 3. In Section 4, we extend the method to enable it to use limited supervision. We discuss various evaluationmeasures used to measure the quality of segmentation of conversational text in Section 5. Our experimental studyis described in Section 6. Finally, this paper ends with summary and conclusions in Section 7.
2 Related Work
In the contact center scenario, we are not aware of any prior work trying to automatically identify segments (orstates) in conversational data in an unsupervised way. This is the first work to raise the importance of the problemin addition to proposing techniques to solve the problem. However, text segmentation has been well studied inliterature and we briefly discuss some popular text segmentation techniques in the next few paragraphs.
Current approaches to unsupervised text segmentation consider each document to be segmented in isolation.They work either by using coherence features to identify cohesive segments of text [6] [16] or by detecting topicshift indicators [13]. Certain techniques use keyword repetitions [12] or semantic networks [8] to detect topicboundaries. The well-known Topic Detection and Tracking (TDT) technique [1] also falls into this family ofalgorithms. Unlike TDT, our algorithm uses knowledge from a corpus of similar call transcripts to segment eachtranscript in the corpus. Supervised text segmentation techniques build a model from the training data and applyit to the test data; certain models work by extracting features that correlate with the presence of boundaries [2].
Text Analytics on call center dialogs have focused on clustering turns to gain insights into business processes[4] and to create domain models [14]. Call transcripts have also been analyzed for topic classification [5], qualityclassification [17] and for estimating domain specific importance of call center fragments [10]. Techniques whichwork well on clean text generally perform very badly on noisy text [3].
3 Segmentation of Conversational Text
3.1 Overview of the Call Segmentation Algorithm: The objective of call segmentation is to split callsinto sequences of sets (segments) of contiguous turns where each such set corresponds to a logical state of thecall flow. The problem we consider in this paper is to perform call segmentation in an unsupervised way from acorpus of similar calls. There are two steps in unsupervised segmentation of call transcripts. Firstly, we identifycharacterizations of calls that could represent segments in the calls by analyzing the corpus of call transcripts andthen, use these characterizations to segment a given call transcript.
Textual documents are typically represented as a point in the vector space model [15] in which each dimensionrepresents a word or a phrase in the document. A conversation consists of sequence of turns where a turn is a

Figure 3: Representation of conversational transcript as a line.
contiguous sequence of words spoken by the same speaker in the conversation. We use the sequence informationin representing conversational transcripts. We represent a conversational transcript as a piece-wise directionalline in the vector space where each turn is represent as a point and two contiguous turns are connected by adirectional line segment from the temporally earlier turn to the other. A two dimension projection of a call isillustrated in Figure 3.
The intuition behind the proposed algorithm is as follows: Figure 4 shows a representation of a corpus ofcalls. First, we group turns into clusters of turns that are lexically similar, viz., A, B, C, D, E and F. Figure 4shows the clusters of turns that are lexically similar. We refer these clusters to as Sub-procedure Text Segments(SPTS) as they possibly represent parts of the process that is followed in call in case there exists such a process.In this step, finding the correct number of clusters to group the turns into is a non-trivial task. We explain thisin detail in Section 3.2.
After finding lexically similar clusters of turns, we find sequences of these clusters which frequently appearin the corpus of calls. We determine these sequences using a temporal proximity measure defined in Section 3.3.We refer to these sequences as Representative Segments (RSs) as they potentially represent segments in the calls.Finally, we use these RSs in segmenting new calls.
In the implementation, we use the cosine similarity of term vectors to model lexical similarity and a pairwiseneighborhood based similarity measure to model temporal proximity (explained in a later section). Note thatclustering based on lexical similarity can be done by means of a linear algorithm whereas that using pairwisesimilarity measures demand a quadratic algorithm. Therefore, the proposed algorithm to find RSs is a two stepclustering process in which clustering in the first step is done using cosine similarity (linear) followed by the secondusing the pairwise similarity (quadratic). This process optimizes the computational cost since in the second step,the quadratic algorithm works on an already clustered input.
Finally, our approach to call segmentation is summarized in the following steps:
1. Generate RSs
(a) Cluster sentences from across calls using lexical similarity to arrive at sub-steps of a segment(Section 3.2)
(b) Cluster the sub-steps from the previous step using temporal proximity based measures to arrive atRepresentative Segments (Section 3.3)
2. Use RSs to segment individual calls (Section 3.4)
(a) Represent each call as a sequence of RS indexes by replacing each turn by the index of the lexicallyclosest segment summary and a confidence score using positioning information
(b) Use a variant of agglomerative clustering, which is robust to noise, to merge adjacent segments toarrive at a segmentation of the call

Figure 4: Representation of Calls showing Clusters of Lexically Similar Turns.
Figure 5: Representation of Calls showing Turns Grouped by Lexical Similarity and Temporal Proximity.

3.2 Clustering Using Lexical Similarity Let C be the collection of calls {C1, . . . , CN} under consideration.Each call Ci is represented by a sequence of turns {t1(Ci), . . . , t|Ci|(Ci)} where |Ci| is the number of turns in thecall. Each turn is either spoken by the caller or the callee1.
In order to work with a set of similar calls (on same topic), we first cluster C into K clusters using K-meansalgorithm [9]. It may be noted that if the corpus contains calls on the same topic, one can skip this initial phaseof clustering (in this case, K = 1). Let, T1, . . . , TK be the topic clusters and
Gi =⋃
∀l,Cj∈Ti,Speaker(tl(Cj))=caller
tl(Cj),
be the set of turns spoken by callers, and
Hi =⋃
∀l,Cj∈Ti,Speaker(tl(Cj))=callee
tl(Cj)
be the set of turns spoken by receiving call center agents. Gis and His are clustered separately using the cosinesimilarity measure to obtain lexically similar clusters of turns, which we refer to as Sub-Procedure Text Segments(SPTS). Similar words and phrases are spoken by agents (and customers) in different calls due to the similar natureof interactions and SPTSs are expected to group such similar turns together. We use the K-means algorithm(KMA) to cluster Gis and His.
We determine number of clusters of Gis and His by optimizing a measure which gives a quantification of thescatter of calls in the corpus across the clusters; we call this as the SCE (SPTS-Cluster-Entropy) measure. Wedescribe the SCE measure in more detail in the next few paragraphs.
We say that a given clustering S is good if many calls in the corpus are scattered across many clusters in S.That is, we define the SCE measure in terms of how each call is scattered across various clusters in S.
Definition 3.1. Normalized entropy (NE) of a call C with respect to S is defined as,
NES(C) = −(∑
i
di log(di))/ log(n),
where, di is the fraction of the call C in cluster Si and n is the length of the call C.
NE would assume a value between 0 and 1 since log(n) is the maximum value that Entropy can assume fora call of length n.
Example 3.1. Let, the call C1 be represented by the sequence of SPTSs (S2, S1, S5, S6, S4) and the call C2
(S3, S5, S5, S3, S5). As is obvious from the representation, C1 is more scattered than C2. The entropy, viz.,ES(C) = −
∑
i di log(di), captures this scatter. Because, when S = {S1, . . . , S6}, ES(C1) = 0.6989, andES(C2) = 0.29.
Consider the case in which C3 is (S1, S2) and C4, (S1, S1, S1, S1, S2, S2, S2, S2). Both these calls score equallyon the entropy measure. However, C3 could be expected to have a higher score since it is scattered across as manyclusters as it can be. In general, entropy measure is not suited for such cases when calls of widely different lengthsare compared. But, it may be noted that the NE measure works well to compare calls of different cardinalitiesunlike the entropy measure. In this case, it can be seen that C3 would have an NE value of 1.0 and C4 would havean NE value of 0.333, much in tune with the expectations.
Definition 3.2. Let C = {C1, . . . , CN} be the collection of calls and S = {S1, . . . , SM} be the sets of SPTSs.Then, each Ci is represented by a sequence of Sjs. Let Ci be represented the sequence {si1, . . . , sini
} where sij ∈ S.Then, the SCE measure of S with respect to the corpus C is defined as
SCEC(S) =
(
∑N
i=1 niNES(Ci)∑
i ni
)
.(3.1)
1Note that, in reality, the text corresponding to callee could represent that of more than one person. For example, when an agent
transfers the call to another colleague or her manager.

That is, SCE is the cardinality weighted average of NE values of the calls in the corpus. Properties of SCEmeasure are detailed in Appendix B.
Although maximizing scatter of calls (as quantified by the SCE measure) ensures better quality of SPTSclusters, we would ideally want to have the smallest possible number of SPTS clusters which also has a reasonablescatter. It may be noted that these requirements are quite contradicting because the scatter tends to increasewith the number of clusters. We accomplish our goal of finding a small number of clusters maximizing scatterby varying the two parameters of the K-means algorithm, namely the random seed and k by iterating over thefollowing sequence of steps starting from a small value for k:
1. Let the current value of k be l. Vary the random seed t times for k = l and k = l + 1, run the K-meansalgorithm for each such combination. Pick the best values for the SCE measure for both k = l and k = l+1
2. If the SCE value chosen in the above step for k = l + 1 is not better than that chosen for k = l by at leastp%, output the clustering with k = l. Else, set k = l + 1 and continue.
Setting p to a high value enables reaching the termination condition early, but may merge many logicalsub-steps. On the contrary, setting p to a low value risks splitting up of logical sub-steps. Increasing t helps inenabling the algorithm to explore more clusterings, thus reducing the chances of the algorithm choosing a badclustering regardless of the existence of a many good ones for the same k, the quality of the clustering beingjudged here by means of the SCE measure.
3.3 Finding Segment Summaries As detailed in Section 3.1, we cluster SPTSs based on temporal coherenceto arrive at segment summaries, referred to as Representative Segments (RSs). We define a similarity measurebetween SPTS and use the same in a relational-clustering algorithm to partition SPTS into a given number ofclusters. The similarity measure is dependent on frequency of their co-occurrence.
Definition 3.3. Let χij represent the number of times SPTS Si and Sj occurred in the corpus of calls within aneighborhood of ω. That is,
χij = |{(k, l,m) : skl = Si, skm = Sj , |l −m| < ω}|.
where sab refers to the SPTS cluster associated with the bth turn in the ath call. Let Φ = maxij χij. Then, thesimilarity, ψ(Si, Sj), between Si and Sj is defined as
ψ(Si, Sj) =χij
Φ.
ψ measures the frequency of co-occurrence of pairs of SPTS in the corpus of calls within a specific neighborhoodwhereas Φ scales the similarity so that ψ always ourputs values between 0 and 1, thus making ψ as true similaritymeasure. We use Agglomerative Hierarchical Clustering [11] to cluster SPTSs using the above similarity measure.We denote the resulting clusters (i.e., the RSs) by Σ1, . . . ,ΣL. Note that each of these clusters is represented bythe set of SPTSs that it contains. That is, Σi ⊆ S and Σi ∩ Σj = ∅,∀i 6= j.
3.4 Segmenting Calls using RS Given a new call C of length n, it is converted into a sequence ofrepresentative segment identifiers (RSIDs) by replacing each turn in the call by the identifier of the RS whichcontains the SPTS to which the turn is maximally similar. We assess the similarity between a turn and anSPTS using the cosine similarity, where an SPTS is represented as a bag of words from its component turns.Let {t1(C), . . . , tn(C)} be the sequence of turns of the call C and {r1, . . . , rn} be the corresponding sequence ofRSIDs. That is, ∃si ∈ ri, si = argmaxk∈{s1,s2...}Sim(ti(C), k) and ri ∈ {Σ1, . . . ,ΣL} where Sim(., .) representsthe cosine similarity function. Segmentation is the process of dividing the call into sequences of contiguous groupsof turns where each group is referred to as a segment. Pictorially this is represented in Figure 6. Here the callcontains 8 turns and each turn is mapped to some RSID, rj . An example segmentation of this call is shown withboxes surrounding the turns in segments: The first three sentences form the first segment, the next two form thesecond and the remaining sentences belong to the third segment.

Figure 6: A call represented as a sequence of SPTS and a possible segmentation.
We represent a segmentation J of C, as a sequence of numbers (j1, . . . , jd) where the first j1 sentences ofC belong to the first segment, the next j2 sentences belong to the next segment and so on. It may be notedthat
∑
k jk = n, the length of the call C. A simple segmentation could be arrived at, at this point, by mappingevery turn to a segment, symbolised by the RSID that it belongs to. However, calls are very noisy, and hence,such a segmentation is liable to introduce plenty of segment switches. We describe an algorithm to arrive at a(noise-tolerant) segmentation of C from the sequence of RSIDs in the rest of the section.
Definition 3.4. Let a call C be of length n and an RS Σ occurred at a position j in the call sequence. Then, itsrelative position of occurrence is j/n. The average relative position of occurrence of Σ, AV (Σ), in a corpus C isdefined as the average of relative positions of each occurrence of the RS in C.
We use the average relative positions of each Σi to estimate the genuineness of each sentence in C to enablerobust segmentation. We will elaborate on this in the following paragraph.
Definition 3.5. The probability of jth RS, rj in a call of length n, being a non-noisy occurrence is defined as
PN(rj) = 1 − |j/n−AV (rj)|.
It is intuitive to expect that that the occurrence of an RS at a position very far from where it usually occurs(in a call), is likely to be a noisy occurrence. The probability of non-noise defined above captures this notion byassigning to every RS occurrence, a weight inversely related to its distance from the usual occurrence position,modeled as the average fraction of call elapsed before the RS occurs. This PN value is a measure of genuineness.It may be noted that the weight is linear with the distance from the average relative position. One can use othervariations like those that depend on the position of the neighboring average relative positions.
Definition 3.6. Purity of a segment Jkl = (rk, . . . , rk+l) in a call C is given by
Purity(Jkl) =1
∑k+l
i=k PN(ri)max
p
k+l∑
i=k,ri=Σp
PN(ri).
Purity of a segment is thus quantified as ratio of the presence of the maximally present RS to the cumulativepresence of RSs; the presence of each RS being calculated as the sum of the non-noise probabilities of eachoccurrence of the RS in the segment.
We segment a call C into a sequence j1, . . . , jd such that the purity of each segment is greater than a thresholdµ, (0.0 ≤ µ ≤ 1.0). µ specifies the level of noise tolerance that we expect. For example, low values of µ wouldmerge clusters even if the merger does not lead to a high purity; this may not be desirable if the data is notvery noisy. The choice of µ, hence, is a careful trade-off between noise tolerance required, and the intra-segmentcoherence of the resulting segmentation. We achieve the same by using a variant of Agglomerative HierarchicalClustering. We start by assigning each sentence to it’s own segment labeled with the RS identifier of the sentence.We merge these segments in a robust fashion iterating through the sequence of steps as follows.
1. Merge contiguous sequences of segments which have the same segment label to form a single segment.
2. Merge the pair of adjacent segments (Si, Sj) which results in a segment of maximal purity. That is, find apair of adjacent segments (Si, Sj) such that Purity(Si ∪ Sj) ≥ Purity(Sx ∪ Sy) ∀x, y where x and y areadjacent segments. Ties are broken arbitrarily.
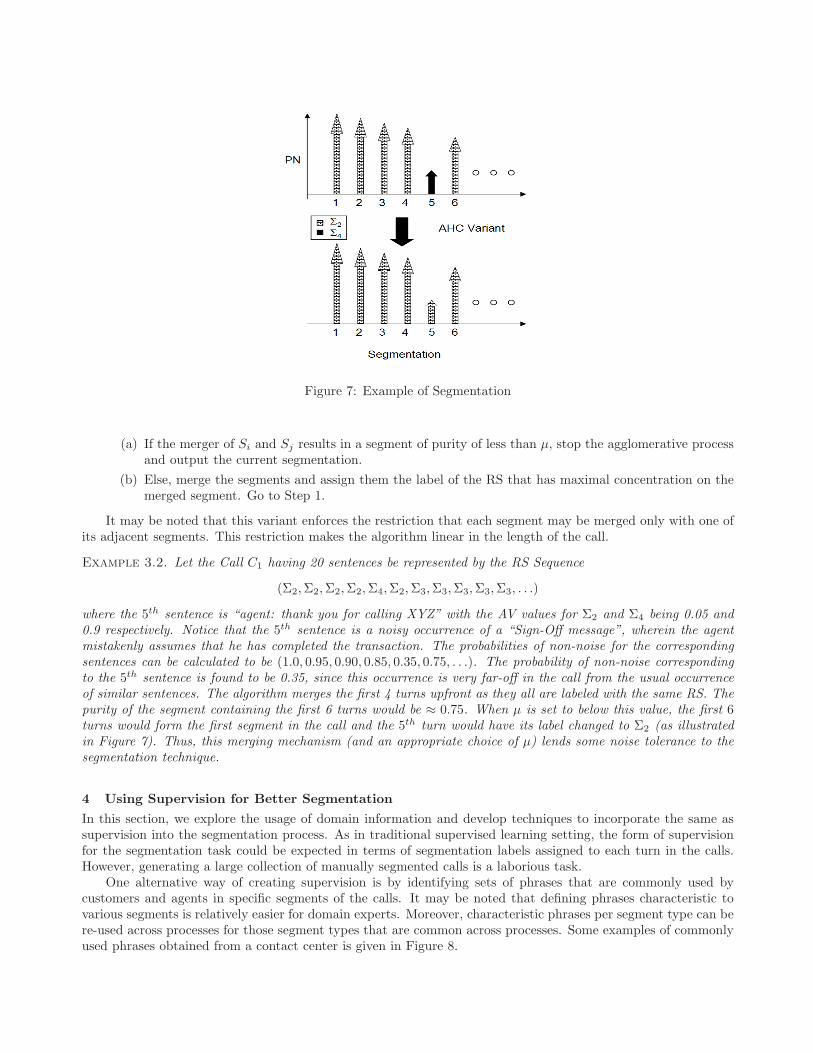
Figure 7: Example of Segmentation
(a) If the merger of Si and Sj results in a segment of purity of less than µ, stop the agglomerative processand output the current segmentation.
(b) Else, merge the segments and assign them the label of the RS that has maximal concentration on themerged segment. Go to Step 1.
It may be noted that this variant enforces the restriction that each segment may be merged only with one ofits adjacent segments. This restriction makes the algorithm linear in the length of the call.
Example 3.2. Let the Call C1 having 20 sentences be represented by the RS Sequence
(Σ2,Σ2,Σ2,Σ2,Σ4,Σ2,Σ3,Σ3,Σ3,Σ3,Σ3, . . .)
where the 5th sentence is “agent: thank you for calling XYZ” with the AV values for Σ2 and Σ4 being 0.05 and0.9 respectively. Notice that the 5th sentence is a noisy occurrence of a “Sign-Off message”, wherein the agentmistakenly assumes that he has completed the transaction. The probabilities of non-noise for the correspondingsentences can be calculated to be (1.0, 0.95, 0.90, 0.85, 0.35, 0.75, . . .). The probability of non-noise correspondingto the 5th sentence is found to be 0.35, since this occurrence is very far-off in the call from the usual occurrenceof similar sentences. The algorithm merges the first 4 turns upfront as they all are labeled with the same RS. Thepurity of the segment containing the first 6 turns would be ≈ 0.75. When µ is set to below this value, the first 6turns would form the first segment in the call and the 5th turn would have its label changed to Σ2 (as illustratedin Figure 7). Thus, this merging mechanism (and an appropriate choice of µ) lends some noise tolerance to thesegmentation technique.
4 Using Supervision for Better Segmentation
In this section, we explore the usage of domain information and develop techniques to incorporate the same assupervision into the segmentation process. As in traditional supervised learning setting, the form of supervisionfor the segmentation task could be expected in terms of segmentation labels assigned to each turn in the calls.However, generating a large collection of manually segmented calls is a laborious task.
One alternative way of creating supervision is by identifying sets of phrases that are commonly used bycustomers and agents in specific segments of the calls. It may be noted that defining phrases characteristic tovarious segments is relatively easier for domain experts. Moreover, characteristic phrases per segment type can bere-used across processes for those segment types that are common across processes. Some examples of commonlyused phrases obtained from a contact center is given in Figure 8.

There is an important benefit of using supervision in the segmentation process. Some representative segments,obtained by our algorithm, may not map to the states (as introduced in section 1) which have business significancewhereas some segments may map to multiple of them. In this paper, we use characteristic phrase collections toimprove the set of RSs as well as to attach them with states having business significance. We will refer to thisstep as RS repair phase in the rest of the paper.
Pickup Return Details: date and time, on what date, what date and, at what time, from which location,around what time, what date, date and, and time, which location, what time, on what, like to pick, to pick up,a car, to pick, i want to, you like to, time, would you like;Car Options and Rates: includes all the, for the whole, includes all, unlimited,with all the, all the taxes, withall, including all the, all taxes and, charges, the taxes, the taxes and, all taxes, unlimited miles, with unlimited,taxes and, surcharges;
Figure 8: Examples of characteristic phrases of segments
Let A = {A1, . . . , AM} be the sets of phrases obtained from domain experts where each Ai corresponds toa pre-defined state or state Gi. We now measure the correspondence between an RS Σi and a pre-defined stateGj using Score(Σi, Gj) which is defined as the total number of occurrences of phrases in the set Aj among thesentences in Σi. We use the scores to modify the collection of Σs to arrive at a new collection of Σs by thefollowing sequence of operations.
• For an RS Σi, if the majority of occurrences of phrases are from Aj , we assign Σi to Gj . If there is no suchpre-defined state, we exclude Σi from the set of RSs.
• If multiple Σs get assigned to the same Gj , we merge them to form a single merged RS.
The above operations may decrease the number of RSs by deletion or merger. The usage of domain knowledgein this fashion seeks to arrive at a set of RSs which have a one-to-one mapping to the pre-defined states. The firststep of deleting RSs which are not matched to a single pre-defined state helps to remove noisy RSs which maypollute the segmentation. Noisy RSs may be formed due to noisy sentences in the call, noise introduced by theclustering to SPTS clusters and/or by noise in the clustering of SPTS clusters to form RSs. The second step ofmerging RSs helps to remove any many-to-one mapping that exists between RSs and pre-defined states. It maybe noted that the above sequence of steps is incapable of repairing any one-to-many mappings between RSs andpre-defined states. Thus, in the presence of domain knowledge, it helps to generate a larger number of RSs thanthe number of pre-defined states. The many-to-one mappings introduced due to the larger number of RSs wouldbe eventually removed by the repairing step.
Finally, it may be noted that the above procedure heavily relies on the supervisory phrases and can nottolerate noise in the phrases. This problem can be easily addressed by assigning fuzzy membership values to thephrases in Ai and the function Score(., .) can be computed using these membership values.
5 Evaluation methodology
The best way to evaluate an automatic segmentation method is to compare the results of the segmentation withground truth viz., manual segmentation. In this section, we define two measures for the same. The choice ofmeasure depends on whether we have mapping between automatic segments and pre-defined states. We alsodiscuss another evaluation metric with the emphasis on an application of the segmentation namely, compliancechecking in a call center.
5.1 Segmentation Quality Evaluation. Evaluation of call segmentation algorithm would involve checkingthe extent to which the automatically generated segment labels match with the manual labels. In the manuallysegmented call, each segment in the call is assigned to a pre-defined state. On the other hand, the proposedunsupervised method generates segmentation where the segments do not have any semantic meaning - eachsegment is assigned to a unique number. However, in the presence of the RS repair phase, the algorithm doesgenerate segments with the pre-defined states. In this section, we present two evaluation measures - the first oneis applicable to the unsupervised scenario and the second to that with supervision.

5.1.1 Subsequence Agreements. We propose a measure to compare two segmentations of a call byaggregating their agreements on the segmentation of contiguous pairs of sentences in the call. In the absenceof correspondence between the segments in the automatic segmentation and states in the manual segmentation,we evaluate the quality of the former by aggregating the agreements between the segmentations over contiguoussubsequences in the call.
Definition 5.1. Consider two segmentations, J = (j1, j2, . . . , jd) and K = (k1, k2, . . . , kf ) for a call C.Assume a function fJ
i which gives the segment identifier to which the ith sentence of a call C is mapped underthe segmentation J . We define the measure of agreement A2
JK between the segmentations J and K for C as,
A2JK =
(
∑n−2i=1 I(I(f
Ji , f
Ji+1), I(f
Ki , fK
i+1))∑n−p
i=1 (1)
)
,(5.2)
where I(., .) returns 1 if both the arguments are equal and 0 otherwise. It may be noted that A2JK always assumes
a value between 0 and 1.
The superscript 2 denotes the usage of pairs of contiguous sentences. This measure can be generalized forcontiguous subsequences of length greater than 2. In general, the measure Ap
JK measures the fraction of contiguoussubsequences of length p which have equivalent segmentations (according to the segmentations in question). Avalue of 2 is the minimum value for p in Ap
JK that can differentiate between different segmentations. The otherextreme is to set p to the length of the call, in which case, any pair of slightly differing segmentations would havea score of 0. Thus, with increasing p, more penalties are given for mismatches. To measure the agreement overcollections of calls, we take the length-weighted average of the Ap
JK measure across calls in the collection. It maybe noted that this measure does not require that the segment identifiers for the different segmentations come fromthe same space.
Example 5.1. Consider two segmentations J = (5, 2, 7) and K = (5, 1, 1, 7) of the call C of length 14. Thesegmentations are obviously not equivalent, nor do they have the same number of segments. But, as can be noted,the contiguous subsequence of the first 6 sentences from the call have the same segmentation of (5, 1) from boththe segmentations. So do the next 8 sentences from the call. The 3rd segment break in K being spurious led to thetwo segmentations being non-equivalent. Intuitively, these segmentations have a very high match as they differonly in one segment break. The A2
JK estimates the match between these segmentations at a high value of 0.92.This shows how evaluating agreement over contiguous subsequences in the call captures the approximate matchbetween the segmentations even in the presence of noise.
5.1.2 Segment Type Matching. When the segment identifiers for the segmentations in question come fromthe same space, we can get a more intuitive measure of the quality of the automatic segmentation. In the presenceof the RS repair phase, we obtain a unique mapping from each automatic segment to a pre-defined state.
Definition 5.2. Let J and K be the automatic and manual segmentations of the call C. Assume that eachautomatic segment s be mapped to a unique predefined state under the mapping map(s). We define the qualitymeasure BJK for the automatic segmentation J of a call C against the manual segmentation K as,
BJK =
(∑n
i=1 I(map(fJi ), fK
i )
n
)
.(5.3)
Here, I(., .) and fJi are the same functions as defined in Section 5.1.1.
BJK measures the fraction of sentences from the call that are mapped to the same segment type in both theautomatic and manual segmentations.
5.2 Segmentation in Compliance Checking. In this subsection, we consider the problem of checking thecompliance of call-center agents with guidelines. One way of automatically checking the compliance is to findwhether predefined phrases relating to the guidelines are present in the call transcripts. For example, to check ifthe agent has confirmed that the customer has a valid driver license we can look for the key words “driver license”,

“valid”, etc. However, the occurrences of key words for a mandatory check may occur in various contexts in acall, whereas we wish to extract only those occurrences which occur as part of the mandatory check that we arelooking for. Therefore, we apply segmentation on call transcripts and check whether the predefined phrases arepresent in appropriate segments of the call. For example, confirming if the customer has a clean driving recordshould be present in Mandatory Checks segment, or any segment that maps to Mandatory Checks. In this case,we evaluate segmentation by comparing the key word matches in the entire call and in a specific segment.
6 Experimental Study
In this section, we present an experimental study of the segmentation technique. We start by describing thedataset and the experimental setup. The main parameter of the proposed algorithm is the number of clusterk used during determining SPTSs. We explain the process of determining k using SCE measure defined inSection 3.2. We compare the proposed technique against other techniques and the results confirm the superiorityof our technique. We then analyze the effect of various factors such as presence of named entity information,supervision, and noisy transcripts and show that our technique improves with the former two factors, whereas itdegrades gracefully with noise in the transcripts. Finally, we evaluate the proposed segmentation algorithm inthe context of compliance checking application.
6.1 Data set. We used data from a car rental help desk for our experiments. We used two methods of extractingcall transcripts. In the first method, we had humans listening to the audio recordings of the calls, and manuallytranscribing them. Such manual transcriptions of the calls are generally of good quality and may not have errorssuch as misspelt words, merged or split words etc. In the second method, we used automatic speech recognition(ASR) technologies to automatically convert audio transcripts to text. Such ASR transcripts are noisy and theyhad a word error rate of 40% on the average. The word error rate is usually computed as follows:
WER =S +D + I
N
where WER measures the distance between the automatic transcript and the real one (having N words) based onS, D and I; the number of substitutions, deletions and insertions respectively. The WER was found to be 25%on agent sentences and 55% on customer sentences. The WER measure is low for agent sentences because theASR system gets trained to the agent’s voice over time. The ASR transcripts helps to analyse the noise toleranceof our segmentation mechanism. We collected 74 calls using the manual transcription method, and 30 calls usingthe ASR method.
We analysed the car rental process workflow and analysed the semantics of the different states involved.We observed that there were ten states in the call flow. They are greeting, customer requirement, details (ofpickup and return), membership, rates, personal details, mandatory checks, verification, objection handling (andcustomer objection), conclusion. These states could be tracked back to the structure of the car rental process aspresented in Figure 2. We manually analyzed the transcripts (both manual and ASR) of the calls and labeledeach turn in the call with the state to which it belongs. An example of such a manual segmentation on the callshown in Figure 1 is given in Figure 9.
For the semi-supervision part of our approach (Section 4), we require characteristic phrases for each segment.We manually analyzed the segmented calls, and carefully extracted characteristic phrases from each segment. Wedid such extraction for 8 states as some states had similar behavior and had to be merged. We were able tocollect relatively noise-free phrases for 4 states: greeting, customer requirement and details of pickup and return,mandatory checks, conclusion. For the other states, i.e., membership and rates, personal details, verification andobjection handling (and customer objection), we were able to procure only certain generic phrases. Such genericphrases may be, many a times, misleading and may be regarded as noise. However, we use the phrases for all the8 states in our experiments. An example of such extracted phrases may be found in Figure 8.
6.2 Experimental Setup. We used the CLUTO toolkit [7] implementations of K-Means and AHC for ourexperiments. Based on the empirical analysis, we set p, the minimum percentage of improvement in SCE measurewhen k is increased by 1 (defined in Section 3.2), to 15 in the clustering to find SPTS clusters. We analyze otherways of choosing k in a separate section herein. We use a window size of 2 to compute the similarity betweenSPTS (refer Definition 3.3). The AHC phase of clustering SPTS to form RSs was stopped when each RS has

AGENT (Greeting): Welcome to CarCompanyA. My name is Albert. How may I help you?
.........
AGENT (Pickup Return Details): Alright may i know the location you want to pick the car from.
CUSTOMER (Pickup Return Details): Aah ok I need it from SFO.
AGENT (Pickup Return Details): For what date and time.
.........
AGENT (Car Options and Rates): Wonderful so let me see ok mam so we have a 12 or 15 passenger van
available on this location on those dates and for that your estimated total for those three dates just
300.58$ this is with Taxes with surcharges and with free unlimited free mileage.
.........
CUSTOMER (Customer Objection): oh and one more question Is it just in states or could you travel out
of states
.........
AGENT (Confirm Details): alright mam let me recap the dates you want to pick it up from SFO on 3rd
August and drop it off on august 6th in LA alright
.........
AGENT (Conclusions): The confirmation number for your booking is 221 384.
CUSTOMER (Conclusions): ok ok Thank you
AGENT (Conclusions): Thank you for calling CarCompanyA and you have a great day good bye
Figure 9: A Manually Segmented Dialog (partial).
around 2-3 SPTSs on the average. The threshold for purity in the segmentation phase was chosen at 0.85 on anempirical basis.
6.3 Choosing k in Clustering turns. An important consideration while choosing a clustering of turns toSPTSs is to maximize the scatter of calls among SPTS clusters (Section 3.2). While choosing a k for the k-meansclustering, there are two conflicting criteria. With the increase in k, due to the larger number of clusters for a callto get scattered to, the SCE measure would improve. As a boundary condition, the maximal scatter is achievedwhen each turn is in it’s own cluster. However, that leads to minimal generalization, which is also undesirable.Thus, the choice of a clustering and k is a careful trade-off between the conflicting criteria of minimizing kand maximizing SCE. Our strategy in Section 3.2 tries to achieve the objective by increasing k only when theimprovement in SCE is substantial. However, this strategy is prone to be caught in a local optima. In thissection, we describe alternative strategies to achieve the trade-off.
Figure 10 plots SCE measure against varying k for the data set considered in this paper. As it can be seen,the plot is bumpy with a lot of ups and downs. Hence, the strategy explained in Section 3.2 would reach anoptimum based on the starting point. The dotted line shown in the Figure represents the value of the threshold,p (viz., 15%). Referring to the Figure, if the algorithm had started around A, it would have ended up with B.Similarly, had it started at C, we would have taken D for the value of k. Note that both these strategies arenon-optimal, because they are ignorant of the steep improvements of the SCE measure leading to F . On a visualanalysis, one would probably choose the value F for k, which cannot be achieved by our strategy for any choiceof p or any starting condition. This points out the potential complexity inherent in the choice of k.
6.4 Comparison with TextTiling and Support Based Segmentation. We evaluated our approach againstthe classical TextTiling algorithm [6] and a baseline technique, viz., support based segmentation described inAppendix A. TextTiling evaluates the statistical probability of each sentence boundary to be a segment breakusing the text on either side of it. We used a window size as twice the length of the average length of sentencesin the call. Support based segmentation is an intuitive way of utilizing sequence information and corpus-levelinformation in segmentation. For each of these techniques, we compare the segmentation generated againstmanually segmented data, thus arriving at a A2
JK measure for each of these techniques. The performance of thesealgorithm in terms of A2
JK measure is presented in Table 1. It can be seen that our algorithm outperforms boththe techniques by a good margin.

Figure 10: SCE Increase vs Varying K.
The support based segmentation algorithm was very slow in performance, the execution time varying from 2seconds to 41 seconds for calls having a length of around 20, at the same time yielding a very low A2
JK score of45%. For certain highly structured processes, which have a well-defined workflow, sequences across segments mayhave a very high-support. This affects the performance of the support based technique whereas our algorithm ishighly immune to varying levels of structure. Our algorithm outperforms TextTiling too by a difference of 0.11 inthe A2
JK score. TextTiling constructs document vectors making it very sensitive to noise; hence, we expect thatits performance would deteriorate when applied to a collection of more noisy data such as ASR transcripts.
Approach A2JK Time Per Call
RS-Based 0.6820 0.03 sSupport-Based 0.4512 19.2 sTextTiling 0.5807 0.03 s
Table 1: Comparison with Support-Based Segmentation and TextTiling.
6.5 Effect of NE-Tagging. Typically calls have widely different ways of expressing the same concept orreferring to the same artifact. Certain concepts that give information about the process, are at a much higherlevel than their actual occurrences in the call. For example, an occurrence of an airport name provides just asmuch information as another instance of location. These variations induce a lot of errors in the generation ofSPTS clusters since the clustering relies on the scanty information from the sentences in the call. We cancel outsuch errors by replacing every named entity by its type. This pre-processing step resulted in an improvement inthe A2
JK by 5.4% to 0.7186. Therefore, we use the NE-tagged dataset in the rest of the experiments reported inthis section.
6.6 Effect of Supervision. We were able to procure collections of characteristic phrases for 8 pre-definedstates used in the car-rental process. Out of these, 4 segments had relatively error free phrases, whereas the other4 had noise in the form of very generic phrases. Although our RS Repair phase is highly sensitive to noise in thesupervision phase, we used all the 8 segment types as the A2
JK measure is useful only when both the segmentationsfor a given call contain roughly the same number of segments. Despite the noise in the supervision, its usageimproved the A2
JK measure by 4.6% to 0.7512. The presence of pre-defined states enables quality assessmentusing the BJK measure. As it can be seen in Table 2, this measure shows a very high-accuracy with non-noisysupervision, whereas the accuracy drops drastically with the usage of the noisy supervision. Thus, our technique,as expected, is not tolerant to noise in the provided supervision.
6.7 Effect of Noisy Data. We apply our techniques on the collection of ASR transcripts. It may be notedthat our ASR data has only 30 calls, as opposed to 74 in our manual transcript collection. Thus, any deterioration

Experiment Details # Segments for BJK
SupervisionNon-noisy Supervision 4 0.85Noisy Supervision 8 0.52
Table 2: Results of RS-based Segmentation.
Type of Transcript # Calls A2JK BJK
Manual 74 0.7512 0.85ASR 30 0.6915 0.62
Table 3: Comparison between ASR and Manual Transcripts.
in performance is to be attributed to the lesser amount of data as well as the noise in the data, and not solelyto one factor. We use only non-noisy supervision (4 segment types) in our experiments on ASR transcripts. Theresults on ASR transcripts are compared against those in manual transcript collections in Table 3. We observe adeterioration of 8% in the A2
JK measure whereas there is a deterioration of 27% in the BJK measure. This showsthat our techniques are relatively noise tolerant as they still achieve good performance while using highly noisyASR transcripts with 40% WER.
6.8 Segmentation for Compliance Checking. Finally, as mentioned in Section 5.2, we evaluate the utilityof the proposed segmentation in an end-user application by measuring its effectiveness in compliance checking.Compliance checking involves verifying that an agent has performed all the mandatory checks that are prescribedby the contact center process. We perform compliance checking by searching for the key words, corresponding toa specific mandatory check, in the segment where the key task is supposed to be present (for example, confirmingif the customer has a clean driving record should be present in Mandatory Checks segment, or any segment thatmaps to Mandatory Checks). Without segmentation, the compliance check is performed by searching for thekeywords matches in the entire call. We measure the effectiveness of segmentation using precision and recall ofaccuracy of compliance check using segmented and unsegmented calls. We summarize these results for each ofthe checks in Table 4.
We consider three mandatory questions that an agent has to ask within a car-reservation call namely: asking ifthe customer has a valid driver license, asking if the customer holds a major credit card, and confirming whetherthe customer is at least 25 years old. The results in Table 4 show that segmentation has been particularlysuccessful in reducing the number of false positives and thus has a much higher precision over the same task onthe raw calls. From the low value of precision for the compliance checking task on raw call, we can see that thereare a large number of instances which are wrongly detected as containing the key task (false positives). This isbecause the keywords that are characteristic of a mandatory check are likely to occur in other segments also. Forexample, consider the mandatory check of verifying that the customer has a “major credit card”. Characteristickeywords for this task, such as “credit”, “debit”, “card” etc. are likely to occur in other segments in other contexts
Check Segmented Calls Raw CallsPrecision Recall Precision Recall
Drivers 1.00 0.94 0.93 1.00LicenseCredit 1.00 0.95 0.88 1.00Card25 years 1.00 0.97 0.78 1.00
Table 4: Segmentation for Compliance Checking.

too. So, by looking at the entire call, it is not possible to capture the information if the agent has performed aparticular key task or not due to the large number of false positives.
Typically, quality analysts (QAs) randomly pick a pre-specified percentage of the calls, listen to these callsand rate the calls with respect to compliance checks. With the introduction of automatic compliance checkingmodule, QAs can manually analyze only those calls that fail the test by the module. Thus, with the introductionof such a module, every call is either analyzed by the module or a QA. However, this can be achieved only whenthe module has 100% precision even if it has low recall. That is, the module should not miss any call that fail thecompliance check. Hence, the proposed way of checking compliance using segmented calls significantly improvesthe overall process of compliance checking. Call centers score their agents based on the their compliance scores.Agents who consistently score poorly in compliance are penalized. Call centers demand high precision from theautomated system because that mirrors the performance of the human quality analysts more closely.
7 Summary and Conclusions
In this paper, we proposed an algorithm for automatic unsupervised segmentation of conversational transcripts.Our algorithm differs from the earlier approaches in the use of lexical coherence, temporal proximity and positioninformation. This makes our algorithm tolerant to noise in the transcripts. Further, we have outlined a stepwherein supervision in the form of characteristic phrases can be used to improve the segmentation. We use acomprehensive set of evaluation measures which can handle approximate matches. We compare with an existingtext segmentation algorithm. Our experimental results show that our algorithm performs better.
This is the first step toward the larger goal of providing an integrated framework for automatic segment levelanalysis of call transcripts. We show that unsupervised segmentation of calls is a plausible thing to do, and goodaccuracies can be attained even without using supervision.
In this paper, we have discussed and analyzed the utility of segmentation algorithms in the context of callmonitoring. We have also indicated that these algorithm can also be used in agent monitoring. It will beinteresting to investigate how these algorithms will be useful in agent training and evaluation tasks. Moreover, wehave analyzed the present segmentation algorithm with respect to a process with less variations. The performanceof the proposed segmentation technique and it’s adaptability to widely varying processes would also be interestingto study. Our technique uses a neighborhood clustering mechanism wherein the chosen neighborhood value issensitive to the average size of the segments. Larger values for neighborhood yield larger segments althoughthe vice versa is not true. One may need to devise techniques to automatically determine the value for theneighborhood using the corpus of calls and the domain information provided.
References
[1] J. Allan. Introduction to Topic Detection and Tracking. Kluwer Academic Publishers, MA, USA, 2002.[2] D. Beeferman, A. Berger, and J. Lafferty. Statistical models for text segmentation. Machine Learning, 34:177–210,
1999.[3] A. Clark. Pre-processing very noisy text. In Workshop on Shallow Parsing of Large Corpora, 2003.[4] P. Deepak and K. Kummamuru. Mining conversational text for procedures. In IJCAI-2007 Workshop on Analytics
for Noisy Unstructured Text Data, Hyderabad, India, January 8, 2007, 2007.[5] A. Gilman, B. Narayanan, and S. Paul. Mining call center dialog data. In Data Mining 5 (Information and
Communication Technologies volume 33). Wessex Institute of Technology Press, 2004.[6] M. A. Hearst. Multi-paragraph segmentation of expository text. In Annual Meeting of the Association for Computer
Linguistics (ACL), pages 9–16. Association for Computer Linguistics, 1994.[7] G. Karypis. CLUTO - A Clustering Toolkit. Technical Report 02-017, Dept. of Computer Science, University of
Minnesota, 2002.[8] H. Kozima. Text segmentation based on similarity between words. In Annual Meeting of the Association for Computer
Linguistics (ACL), Columbus, OH, USA, 1993. Association for Computer Linguistics.[9] J. B. MacQueen. Some methods for classification and analysis of multivariate observations. In Fifth Symposium of
Maths, Statistics and Probability, Berkeley, 1967.[10] G. Mishne, D. Carmel, R. Hoory, A. Roytman, and A. Soffer. Automatic analysis of call-center conversations. In
Intl. Conference on Information and Knowledge Management (CIKM), 2005.[11] F. Murtagh. A survey of recent advances in hierarchical clustering algorithms. Comput. J., 26(4):354–359, 1983.[12] J. C. Reynar. An automatic method of finding topic boundaries. In Annual Meeting of the Association for Computer
Linguistics (ACL), pages 331–333. Association for Computer Linguistics, 1994.

[13] K. Ries. Segmenting conversations by topic, initiative and style. In Proceedings of ACM SIGIR 01 Workshop onInformation Retrieval Techniques for Speech Applications, New Orleans, LA, USA, 2001.
[14] S. Roy and L. V. Subramaniam. Automatic generation of domain models for call-centers from noisy transcriptions.In Annual Meeting of the Association for Computer Linguistics (ACL). Association for Computer Linguistics, 2006.
[15] G. Salton, A. Wong, and C. S. Yang. A vector space model for automatic indexing. Commun. ACM, 18(11):613–620,1975.
[16] J. P. Yamron, I. Carp, L. Gillick, S. Lowe, and P. van Mulbregt. A hidden markov model based approach to textsegmentation and event tracking. In IEEE Intl. Conference on Acoustics, Speech and Signal Processing, 1998.
[17] G. Zweig, O. Siohan, G. Saon, B. Ramabhadran, D. Povey, L. Mangu, and B. Kingsbury. Automated qualitymonitoring in the call center with asr and maximum entropy. In IEEE Intl. Conference on Acoustics, Speech andSignal Processing, 2006.
A Support-based Segmentation
Support-based segmentation is an alternate approach to find segments using the set of sequences SPTSs derivedfrom the original corpus of calls. In this approach, support of a segment (s1,s2,. . . ,sl) is computed as the numberof times the sequence of states have appeared in the corpus of calls. Given the corpus of calls, we follow thefollowing 3 steps:
1. Identify SPTS clusters using the algorithm mentioned in Section 3.2,
2. Represent each call as sequence of SPTSs, and
3. Compute support of each SPTS subsequence.
Once the supports are calculated, one obvious good segmentation would be the one which has maximum totalsupport across all possible segmentations. Total support is computed as sum of supports of constituent segments.The rationale behind this is the fact that the states (or sentences) within a segment would be occurring in sequencemore often than states (or sentences) across segments and thus would have higher support. As a sequence of nconsecutive elements is always present in the sequence of n+1 elements (those n elements plus the next element),support of a sequence is multiplied with its length to nullify the advantage enjoyed by short segments. Givena call, total support for all possible segmentations are computed and the one with maximum total support isidentified. It may be noted that this is a computationally expensive task.
B Properties of the SCE Measure
The SCE measure quantifies the scatter of calls in a clustering. But, other properties of a clustering also affectthe scatter of calls. In this section, we discuss the interplay between SCE measure and other properties of aclustering, especially, the number of clusters in a clustering. Important properties of the SCE measure include:
• SCE increases with the number of clusters because, there are more clusters for a given call to get scatteredinto.
• For a given number of clusters and an approximately equal number of data elements, SCE decreases withthe increase in average call length. This is due to the increased probability of two steps (in a call) gettingmapped to the same cluster with increase in the length of a call.
SCE is parameterized by both the clustering and the corpus used. Thus, one could compare clustering algorithmsusing their SCE values on different corpora, and different corpora (for comparing homogeneity) by applying theclustering algorithm. However the characteristics of the SCE measure outlined above require that the clusteringsto be compared have approximately equal values for the following ratios
• Sentences Ratio: Number of turns per Cluster
• Call Length Ratio: Average Length of Calls per Cluster