Unravelling the Complexity of T Cell Abnormalities in Common Variable Immunodeficiency1
Upload
khangminh22Category
view
1download
0
1
BSc Thesis Biotechnology
Biobased Chemistry and Technology
Unravelling the kinetics of the
homogeneously catalysed oxidation of
amylopectin
Gijs Konings
18-01-2018

2
Unravelling the kinetics of the
homogeneously catalysed
oxidation of amylopectin
Name course : BSc Thesis Biotechnology Number : YBT-80324 Study load : 24 ects Date : 18-01-2018 Student : Gijs Konings Registration number : 970318460020 Study programme : BBT Report number : 094BCT Supervisor(s) : Tim Hoogstad, Piet Buwalda Examiners : Tomas van Haasterecht Group : Biobased Chemistry and Technology Address : Bornse Weilanden 9 6708 WG Wageningen The Netherlands

3
Table of Contents
Abstract .................................................................................................................................................................................. 4
Introduction ......................................................................................................................................................................... 4
Materials and methods .................................................................................................................................................... 7
Materials ............................................................................................................................................................................ 7
Description of methods ................................................................................................................................................ 7
Main experiments ..................................................................................................................................................... 7
Determining the k-values using modelling .................................................................................................... 7
Results and discussion .................................................................................................................................................. 11
Overnight oxidation .................................................................................................................................................. 11
Overnight autoclave control ................................................................................................................................... 16
Stepwise oxidation ..................................................................................................................................................... 18
Stepwise autoclave control ..................................................................................................................................... 26
Perspectives: ..................................................................................................................................................................... 32
Conclusions ........................................................................................................................................................................ 33
Effect of DP on rox ........................................................................................................................................................ 33
Effect of DS on rox ......................................................................................................................................................... 33
Effects of autoclaving ................................................................................................................................................. 33
Appendix ............................................................................................................................................................................. 33
References: ........................................................................................................................................................................ 36

4
Abstract
The production of anionic polymers is an expansive industry with widespread applications. The production
process of anionic polymers is ever changing. Both the method of catalysis and the raw materials have
changed or are prone to change in the near future. A greater understanding of the reaction kinetics of
macromolecules would help with the improvement of production processes. Gaining this knowledge is the
aim of this research; more specifically the effect both the degree of polymerisation (DP) and the degree of
substitution (DS) have on the oxidation rate (rox) of amylopectin. To achieve this, four starches with
different sizes were used, each starch originates from the strain of potato called Eliane. These starches will
be oxidised with hypochlorite and TEMPO ((2,2,6,6-Tetramethylpiperidin-1-yl)oxyl), to a DS of 20%. The
oxidation was done in a stepwise manner and in one go. The rox was measured and modelled yielding the
corresponding reaction constants. It is unexpected to see the DP affect the rox, because there should not be
a difference in availability of the C6 in anhydroglucose for a range of DP’s, because all starches have the
same properties and even with branching the hypochlorite is still able reach the all the C6 atoms of the
starch. A decrease in rox for an increase in DS is expected, because there are less available C6 atoms at higher
DS’s.
The results found from both the oxidation methods show that rox decreases for both DP and DS. A plausible
explanation for these results is a combination of the change of the micropolarity around the starches in
solution as the DS changes and the starch becomes more negatively charged. The inability to
homogeneously dissolve starch in water at room temperature strengthens this theory, because it would
further develop pockets of polarised starch. The found results give new insights into the reaction kinetics
of the oxidation of amylopectin, these results however can be applied to other macromolecules as well.
Introduction
Anionic polymers are negatively charged chains of molecules, that find their place in a great variety of
products, such as: absorbents, glues and drilling fluids (Narayan, 1994; Pierre et al., 2017). This widespread
occurrence of anionic polymers in common products makes it an expansive industry. Some common
examples of anionic polymers are polyacrylates and polyacrylamides. These polymers are made from
petrochemicals and are therefore not renewable. Starch is a fitting replacement for the building blocks of
these, previously, non-biodegradable polymers. This is already being used in the industry (Forssell,
Hamunen, Autio, Suortti, & Poutanen, 1995; Jonhed, 2006), but investigating kinetics of the oxidation of
starch will give new insights. These new insights might allow for further improvement of the production
process. The knowledge gained from studying the kinetics behind starch oxidation can be applied to other
macromolecules as well.
Figure 1: The oxidation of anhydroglucose resulting in negatively charged polymers.

5
To create anionic polymers from starch, hypochlorite (OCl−) is commonly used (Petter L. Bragd, Besemer,
& van Bekkum, 2000; P. L. Bragd, van Bekkum, & Besemer, 2004; Forssell et al., 1995). Hypochlorite
substitutes the hydroxyl group on the C6 of the monomers (anhydroglucose), seen in Figure 1, with
carboxylic acid (P. L. Bragd et al., 2004; Tojo, Fernández, Tojo, & Fernández, 2007). The hydroxyl group at
C6 will be substituted with a carboxyl group in a two-step reaction. The first step is shown in Figure 2.
Figure 2: The first of the two-step reaction using hypochlorite to oxidise the C6 of the anhydroglucose in starch. The R stands for the rest of the anhydroglucose monomer seen in figure 1. The ‘A’ and the ‘B’ indicate the state of the C6 group of the anhydroglucose. The drawing of this reaction was made using ChemDoodle.
To simplify the equations, the original state of the anhydroglucose monomer will be called A and the
intermediate product formed in Figure 2 will be called B. The reaction equation is shown in Equation. 1.01
and the change of [A] in time is shown in Equation. 1.02.
k1: RCH2OH + OCl− → RCHO + Cl− + H2O (slow) Eq. 1.01
dA
dt= −k1[A][OCl−] Eq. 1.02
Figure 3: The second of the two-step reaction using hypochlorite to oxidise the C6 of the anhydroglucose in starch. The R stands for the rest of the anhydroglucose monomer seen in figure 1. The ‘B’ and the ‘C’ indicate the state of the C6 group of the anhydroglucose. The drawing of this reaction was made using ChemDoodle.
In Figure 3 the second step is shown, where the intermediate product B from Figure 2 is transformed in
the final product C. Note that product C is negatively charged, because the reaction is performed under basic
conditions. The reaction equation of the second step is given in Equation. 1.03, the change of [B] in time in
Equation. 1.04 and the change of [C] in time in Equation. 1.05.
k2: RCHO + OCl− → RCOO− + Cl− + H+ (fast) Eq. 1.03
dB
dt= −k2 ∗ [B][OCl−] + k1 ∗ [A][OCl−] Eq. 1.04
dC
dt= k2 ∗ [B][OCl−] Eq. 1.05
B
C
C
A B

6
Combining these equations gives the change of [OCl−] in time. As shown in Equation. 1.06.
dOCl−
dt= −k1[A][OCl−] − k2[B][OCl−] Eq. 1.06
The focus of this research is to study the effects of two factors on rox, which is the combination of k1 and k2.
These two specific factors are: the degree of polymerisation (DP), or rather the number of monomers the
polymer consists of, and the degree of substitution (DS), the percentage of monomers within the polymer
chain that have had their hydroxyl group at the C6 substituted with a carboxyl group. The effects these
factors have on the rox will be looked at. The research question then boils down to: What are the effects of
the DP and DS on rox?
To answer this question an experimental approach was devised to chart the factors and their effects. To
study the effect of DP on rox, the starches will be oxidised from 0% DS to 20% DS. The effects of the DS on
rox will be monitored through stepwise oxidation: the starches will be oxidised in steps of 5% up to 20% DS.
To measure the DS the reaction will be done in a pHstat, because the pHstat not only keeps the pH at an
optimum of 8.5 (Petter L. Bragd et al., 2000; Tojo et al., 2007), but to keep it there, base has to be added.
Knowing the amount of base added is crucial to finding the rox, because acid is formed in the second step of
the two-step reaction (Equation 1.03). The amount of base added by the pHstat therefore corresponds to
the amount of substituted hydroxyl groups (Sakakibara, Sierakowski, Lucyszyn, & de Freitas, 2016). The
oxidation rates of each step (DS) and each DP will be compared. The experimentally found data will be fitted
to rate equations in Matlab to determine the k1 and k2 values. This approach can also be used for future
research on macromolecules.
Samples were taken of all DP/DS combinations for product characterisation using HPSEC (High pressure
size exclusion chromatography). The results however were not included in this thesis because of practical
limitations.
The materials to be used for this experimental approach are four different starches (provided by AVEBE)
used in this study, each with a different DP, are:
- Eliane MD6 ≈ 16 DP
- Eliane MD2 ≈ 50 DP
- Eliane C200 ≈ 250,000 DP
- Eliane 100 ≈ 500,000 DP
These are all potato starches made from the strain of potato called Eliane, which produces only amylopectin.
All the starches have the same degree of branching, because they came from the same species of potato, so
the only difference between them is their DP. Eliane 100 is the native potato starch, Eliane C200 is obtained
from the native starch through mechanical strain by being rolled between heated cylinders. Eliane MD2 and
Eliane MD6 are obtained through enzymatic reactions. Out of the four starches only the native starch (Eliane
100) is too big to be dissolved in water at room temperature.
These four starches will be oxidised using hypochlorite and TEMPO ((2,2,6,6-Tetramethylpiperidin-1-
yl)oxyl) as the catalyst. TEMPO has been used to study the oxidation of many other polysaccharides
(Bordenave, Grelier, & Coma, 2008; A. E. J. de Nooy, Besemer, & van Bekkum, 1994; Arjan E. J. de Nooy,
Besemer, & van Bekkum, 1995; Pierre et al., 2017; Sakakibara et al., 2016). Using hypochlorite for the
oxidation of starch has been done before in both the industry and research (Petter L. Bragd et al., 2000; P.
L. Bragd et al., 2004). TEMPO does not just speed up the reaction, it also allows for the oxidation of primary
alcohols of larger polymers at a relatively high selectivity and shows only a modest degradation of
polysaccharides (P. L. Bragd et al., 2004; Ciriminna & Pagliaro, 2010; Spier, Sierakowski, Reed, & de Freitas,
2017). Because of its ‘relatively high selectivity’ the polymers will only be substituted to a maximum DS of
20%, to ensure only the hydroxyl groups at the C6 will be substituted (Ding et al., 2008). Further motivating
the use of TEMPO is its possibility of catalysing the reaction without the use of Bromide, eliminating an
unwanted by-product (Petter L. Bragd et al., 2000). One downside to the use of TEMPO is its carcinogenicity,
therefore it is only used for research.

7
There are some hypotheses for the effects of DP and DS on rox. There should not be a difference in availability
of the C6 in anhydroglucose for a range of DP’s, because all starches have the same branching and even with
branching the hypochlorite is still able reach the innards of the starch (Steeneken, 1984). Polysaccharides
however, tend to form inclusion complexes in solution (Bender & Komiyama, 1978), these inclusion
complexes attract TEMPO (Okazaki & Kuwata, 1984) and thereby improve the catalytic capabilities of
TEMPO (Tabushi, 1982) increasing rox. Smaller polysaccharides like Eliane MD6 and Eliane MD2 might lack
the length necessary to form these loops thus decreasing their rox relative to the bigger polysaccharides
Eliane C200 and Eliane 100. As for the effect of DS on rox; an increase in rox for a higher DS is expected. By
increasing the DS, the overall charge of the molecule will be more negative. This could attract the TEMPO
intermediate, because it is positively charged (Petter L. Bragd et al., 2000). This would lead to a higher rox
for a higher DS. It is more likely however, that the rox would decrease as DS increases, because there are less
unsubstituted hydroxyl-groups left to oxidise at a higher DS (Ding et al., 2008).
The outcome of this will provide a greater understanding of the kinetics related to these reactions. This will
prove useful for the realisation of heterogeneous catalysed starch oxidation, but also to optimise the
production processes for the oxidation of starch and other such macromolecules.
Materials and methods
Materials The following chemicals were used for the necessary solutions: 37% HCl solution SIGMA-ALDRICH
(Germany). Solid NaOH crystals SIGMA-ALDRICH (Germany). TEMPO ((2,2,6,6-Tetramethylpiperidin-1-
yl)oxyl) crystals SIGMA-ALDRICH (Poland) and NaOCl solution 10-15% SIGMA-ALDRICH (Germany). The
starches used were: Eliane 100, Eliane C200, Eliane MD2 and Eliane MD6, provided by AVEBE (Netherlands,
Groningen).
Description of methods All experiments are carried out at room temperature unless stated otherwise. All experiments are carried
out in duplo. The water used is always demi water unless stated otherwise. The pH at which the experiments
were carried out is 8.5 (Bailey, Bobbitt, & Wiberg, 2007; Petter L. Bragd et al., 2000). The appropriate
concentration of Eliane in solution was found to be 0.2 w/w% (Appendix).
Main experiments The effect of DP and DS on rox
A 0.2 w/w% starch solution in water with the calculated (Appendix) amount of TEMPO in a beaker with a
stirring rod was placed on the pHstat (Metrohm, 877 Titrino plus with 801 stirrer). The used settings for
the pHstat are in Appendix C. The pH was adjusted to just above 8.5 with 0.1M HCl solution after addition
of hypochlorite and a Pasteur pipette before adding the calculated (Appendix) amount of hypochlorite. The
hypochlorite was kept on ice to prevent decomposition. The beaker was sealed with parafilm to prevent
evaporation of the solution. The reaction was run until near completion; the reaction was deemed
completed when the rate at which the pH drops was lower than 0.001 per 4 seconds, or when the pH goes
over 9.2 after an addition of NaOH by the pHstat. Why this is sign of the reaction being near completion will
be discussed in the results. The desired end DS is 20%, this DS was reached both stepwise (aliquots of 5%
DS) and non-stepwise (overnight).
The biggest of the four starches (Eliane 100), could not be dissolved at room temperature in water, therefore
an autoclave (Tuttnauer, 2840EL) was used. This introduced a new variable, to account for this variable all
other starches were also dissolved using the autoclave as a control experiment for both the stepwise and
overnight oxidations.
Determining the k-values using modelling The pHstat used in the previous section gives various measurements: pH, amount of NaOH added and the
corresponding time. The amount of added NaOH linearly relates to the formation of carboxylated

8
anhydroglucose which also forms acid (Equation 1.03). Plotting the amount of formed acid versus the time
gives an insight into the reaction rate (Figure 4).
Figure 4: The amount of mmol acid formed over time for the third overnight reaction, bringing Eliane MD6 from a degree of substitution of 0% to 20%.
To analyse these results more accurately a model for the concentration of hypochlorite, anhydroglucose,
carboxylated anhydroglucose and the intermediate aldonyl was made in Matlab. The following equations
describe the behaviour of these concentrations:
𝑑𝐴
𝑑𝑡= −𝑘1[𝐴][𝑂𝐶𝑙−] Eq. 1.02
𝑑𝐵
𝑑𝑡= −𝑘2[𝐵][𝑂𝐶𝑙−] + 𝑘1[𝐴][𝑂𝐶𝑙−] Eq. 1.04
𝑑𝐶
𝑑𝑡= 𝑘2[𝐵][𝑂𝐶𝑙−] Eq. 1.05
𝑑𝑂𝐶𝑙
𝑑𝑡= −𝑘1[𝐴][𝑂𝐶𝑙−] − 𝑘2[𝐵][𝑂𝐶𝑙−] Eq. 1.06
The Equations 1.02, 1.04, 1.05 describe the behaviour of A, B and C in time. A is unsubstituted
anhydroglucose, B is the intermediate aldonyl and C is the carboxylated anhydroglucose, consistent with
Figures 2 and 3. The initial values for A and OCl− are obtained from the amount of starch in the solution
and the amount of OCl added to start the reaction. The value of C over time is what the model will try to find
by estimating the parameters k1 and k2.
The value of the intermediate B is harder to determine, because it is not measured, the end-value of B
(aldonyl) can be estimated. This estimation is based on the amount of OCl− added and the amount of NaOH
administered by the pHstat (Equation 1.08). As mentioned before in the introduction, for every 2 units of
OCl−, 1 unit of carboxylated anhydroglucose is formed, which in turn requires 1 unit of NaOH from the
pHstat to counteract the acid formation. Assuming all OCl− has reacted in solution and assuming all OCl−
reacted at the C6 of anhydroglucose forming aldonyl, then all OCl− not accounted for with NaOH would have
resulted in aldonyl formation (Kato, Matsuo, & Isogai, 2003), de Nooy and Besemer (1995) also observed
aldonyl as an intermediate, but proposed they would be fully oxidised with reaction time.
0
0.05
0.1
0.15
0.2
0.25
0.3
0.35
0.4
0.45
0.5
0.00 1.00 2.00 3.00 4.00 5.00 6.00
acid
fo
rmed
(m
mo
l)
Time (hours)
acid formed

9
[𝐵]𝑒𝑛𝑑 =(𝑚𝑜𝑙 𝑂𝐶𝑙−𝑎𝑑𝑑𝑒𝑑)−(𝑚𝑜𝑙 𝑁𝑎𝑂𝐻 𝑎𝑑𝑑𝑒𝑑)𝑡𝑜𝑡𝑎𝑙∗2
𝑉 Eq. 1.08
To find the best local values for k1 and k2, minimisation of the SSE (Sum of Squared Errors) is used. A grid
of k1 and k2 values is set up in which the parameters resulting in the lowest SSE will be looked for, this is
the local field. With the calculated local minima another fit is made, and a 3D graph is plotted (Figure 5)
visualising the SSE for the different values within the local field. This graph can be used to judge whether
the right boundaries were chosen to calculate the local minima. If the graph suggests it, the boundaries of
the local field can be adjusted to allow for other minima. When the 3D graph is satisfactory a 2D graph is
made showing the local minima found for all the points in the local field (Figure 6). If the minima found are
outside of the local field or if there are multiple local minima, the boundaries should be adjusted again.
Neither are the case in Figure 3, so the found values for k1 and k2 are used for a final fit (Figure 7).
Figure 5: The 3D graph showing the sum of squared errors for the combinations of values for k1 and k2 within
the chosen local field. This specific graph is for the first overnight run of Eliane MD6 to a degree of substitution
of 20%. The coloured bar on the right indicates the relation of the colour to the SSE.

10
Figure 7: The fit with the k1 and k2 resulting in the lowest sum of squared errors found from the previous calculations. This specific graph is for the first overnight run of Eliane MD6 to a degree of substitution of 20%.
Figure 6: The 2D graph showing the minima found for the combinations of k1 and k2 within the chosen local field. The circles indicate the combinations of k-values and the line coming from these circles point to the minima found from these combinations as starting points. This specific graph is for the first overnight run of Eliane MD6 to a 20% degree of substitution.

11
Results and discussion:
Overnight oxidation in pHstat In the overnight oxidation, the four starches were oxidised from 0% DS to 20% DS. This oxidation reaction
was done with a pHstat, to measure the amount of base added to keep a constant pH of 8.5. The pHstat gives
a reading of the amount of NaOH added and the pH in time. The resulting curve is what will be used for this
study. The start of the curve is defined as the first data point nearest to a pH of 8.5 after a data point that
exceeds a pH of 9.0. This pH was chosen because after every addition of hypochlorite a spike in pH above
9.0 was observed. From this point on the rest of the full curve will be modelled.
Eliane 100 will be excluded from this part due to its inability to dissolve in water at room temperature.
For the first oxidation a slight start-up time can be seen in the curve of Eliane MD6 (Figure 8), giving the
graph an s-curve. All graphs show this behaviour, though the first one more prominently than the others.
Because of this s-curve the oxidation will be approached as the two-step reaction seen previously in
Equation 1.01 and 1.03. An explanation for the s-curve is that the k1 is lower than the k2.
Of the overnight runs with Eliane MD6, shown in Figure 8, the first is a clear outlier. This is most likely
because it was the first overnight run performed. The second run has incompatible data, because it ran for
much longer: the pHstat allows for only 1000 data points. The frequency of measurements is once every 20
seconds, causing some data points to be deleted when the run lasts for longer than 20,000 seconds. The 3rd
and 4th runs however are compatible with each other and more reliable, because they were done after a lot
more overnight runs had been completed. After having performed these experiments numerous times, they
became more consistent, as can be seen in Figures 9-11. These two runs will be used to calculate the
average of Eliane MD6 overnight (Figure 9).
Figure 8: An overview of the 4 overnight runs of Eliane MD6 is given. The Eliane MD6 was substituted from 0% to 20% degree of substitution.
0
0.1
0.2
0.3
0.4
0.5
0.6
0.00 2.00 4.00 6.00 8.00 10.00 12.00 14.00 16.00
acid
fo
rmed
(m
mo
l)
Time (hours)
Run 1 Run 2 Run 3 Run 4

12
Figure 9: The average graph of the third and fourth overnight runs of Eliane MD6.
Naturally, the average graph found is as long as the shortest run. Note that none of the runs reached the
20% DS goal, because this would take too long. The same was done for the overnight runs of the other
starches. Both runs of Eliane MD2 (Figure 10) and Eliane C200 (Figure 11) are very similar and therefore
give a reliable average.
Figure 10: An overview of the 2 overnight runs of Eliane MD2 is given. The Eliane MD2 was substituted from 0% to 20% degree of substitution.
0.00
0.05
0.10
0.15
0.20
0.25
0.30
0.35
0.40
0.45
0.00 1.00 2.00 3.00 4.00 5.00 6.00
acid
fo
rmed
(m
mo
l)
Time (hours)
Run 3 Run 4 Average
0.000
0.050
0.100
0.150
0.200
0.250
0.300
0.350
0.400
0.00 0.50 1.00 1.50 2.00 2.50 3.00 3.50 4.00
acid
fo
rmed
(m
mo
l)
Time (hours)
Run 1 Run 2 Average

13
Figure 11: An overview of the 2 overnight runs of Eliane C200 is given. The Eliane C200 was substituted from 0% to 20% degree of substitution.
Overview of all starches dissolved at room temperature and atmospheric pressure
At a first glance the averages in Figure 14 seem inconclusive. There does not seem to be much reason to
think DP affects rox, which would be in line with the hypotheses from the introduction. The following
arguments further support these hypotheses.
- The only difference between the starches is their DP, i.e. the length of their chains. A single
substituted anhydroglucose monomer in a chain of unsubstituted monomers only slightly affects
the oxidation of up to 2 monomers on either side of it (Ito & Yamashita, 1965). The sheer amount
of anhydroglucose monomers in solution and the limited end-value of DS (20%) make it highly
unlikely that there is any difference between the ability of TEMPO to oxidise the C6 of an
anhydroglucose molecule for different lengths of starches (P. L. Bragd et al., 2004; Arjan E. J. de
Nooy et al., 1995).
- While TEMPO is a reasonably large catalyst (Figure 12), it should still be able to freely access the
starches wherever in solution as it has done in many other studies (Petter L. Bragd et al., 2000; P.
L. Bragd et al., 2004; A. E. J. de Nooy et al., 1994; Ding et al., 2008; Tojo et al., 2007).
Figure 12: The catalyst TEMPO.
0
0.05
0.1
0.15
0.2
0.25
0.3
0.35
0.4
0.00 1.00 2.00 3.00 4.00 5.00 6.00
acid
fo
rmed
(m
mo
l)
Time (hours)
Run 1 Run 2 Average

14
If the DP of the starch in solution is what caused a drop in rox, then this could be explained by the fact that
polysaccharides have the inclination to fold into predetermined structures, such as coils, turns or inclusion
complexes (Bender & Komiyama, 1978). These predetermined structures create a hydrophobic
environment (Okazaki & Kuwata, 1984). It could be that the smaller polymers are unable to fully do so,
because they lack the length to adequately form these inclusion complexes, thus affecting their affinity for
the catalyst TEMPO. According to (Okazaki & Kuwata, 1984) these inclusion complexes, the hydrophobic
loops, cyclodextrins form with various molecules such as TEMPO would catalyse the reaction. This would
suggest the bigger polymers to have a higher rox, while the results (Figure 14) point towards the opposite.
The k-values found from the Matlab model might offer a better insight.
The three averages are reasonably close together, but nowhere as close as the duplo’s from Figures 9-11.
This suggests a very real difference in behaviour between the starches. The model made in Matlab is used
to quantify the reaction constants, the k-values. If there is a significant difference in the behaviour of these
starches, then the found k-values (Table 1) should not be interchangeable, i.e. if the k-values of Eliane MD6
were used to model Eliane MD2 there should be a significant increase in the SSE. They are indeed not
interchangeable as the SSE increases up to 40-fold.
The k-values found in Matlab also disprove the assumption that a higher DP would result in a higher roz.
What the k-values from Table 1 do show is a change of the ratio of k2/k1 over DP. An explanation for this
could be that the starches were not completely homogenously dissolved. Bigger, bulkier, starches are like a
bundle of branches, these bundles might be homogeneously spread in the volume, but the starch chains will
not be completely homogeneously dissolved, because the branched chains are to some degree stuck
together (Debet & Gidley, 2007; Durrani & Donald, 2000). This will be less of a problem for the smaller
starches. This is the first part of the explanation of why a different ratio for the k-values is seen for a different
DP, the second part rests on the theory that nitroxide radicals, such as TEMPO, are reactive to the polarity
of the solution they are in (Knauer & Napier, 1976; Saracino et al., 2002). As the oxidation reaction
progresses, more negatively charged carboxylated anhydroglucoses will form in solution, thus changing the
polarity of the solution near these starches and therefore the kinetics of TEMPO. This shift in the ratio of the
k-values will become more apparent when the results of the stepwise oxidations are studied.
Having made clear the three averages are different from each other, they can be looked at as individual
oxidation patterns. To make it easier to compare the three starches, the distinction between three different
parts in the curve is made: the start-up, the linear section and the drop off.
- The start-up: This is the part of the curve before the linear section. This part is decreasingly
noticeable with DP; there is a clear start-up time for Eliane MD6 (Figure 9), for Eliane MD2 (Figure
10) it can still be seen but it is less clear and for Eliane C200 (Figure 11) barely any start-up time
can be seen if at all. The measured acid formation is caused by the second reaction step, meaning
only the second reaction step is measured. For acid formation to occur the, slower, first reaction
step has to have occurred. Therefore, the ratio of k2/k1 dictates the start-up time. Eliane MD6 has
the highest ratio and the longest start-up time (Table 1).
- The linear section cannot be attributed to either one of the k-values or their ratio it seems, because
Eliane MD6 and Eliane MD2 show very similar linear sections in slope, while Eliane C200 is clearly
slower. When looking at DP, which should be the only variable, it is justified to pool together Eliane
MD6 and MD2, because they have a relatively similar DP compared to C200: 16 and 50 respectively,
compared to 250,000. This suggests a lower rox in the linear section for a greater DP.
- The drop off: the speed at which the reaction rate drops off, and therefore also the height at which
the curve levels out, is related to the k2, because the starch which does so the slowest (Eliane MD6),
also has the highest value for k2, while the starch that drops off the fastest (Eliane C200) has the
lowest value for k2 (Figure 13). Incidentally the smallest starch has the highest k2, and the biggest
starch has the lowest k2. The higher k2, the faster the already formed aldonyl-intermediates will be
oxidised to carboxyl groups. The starches with higher k2-values will therefore reach their final state
of 20% DS faster than the others. The slower starches will reach the same DS, but only take longer
to do so (Arjan E. J. de Nooy et al., 1995). The reactions were not run long enough to see the curves
reach the 20% DS. For this theory to hold ground it needs to be proven that at the end of the linear

15
section all hypochlorite in solution is used for the second reaction step. This could be realised by
either a much bigger k2 than k1, or some form of inhibition of the first reaction step.
Concluding from these three sections: the overall rox and the ratio k2/k1 decrease relative to DP. This lower
rox relative to DP could be explained by the increasing difficulty with respect to DP to obtain a
homogeneously dissolved solution of the bigger polymers in water at room temperature.
Table 1: The measured weights of dissolved starch, the corrected weight for water content and per L, the resulting k-values and sum of squared errors for the overnight runs of Eliane MD6, MD2 and C200. The sum of squared errors is an indication of the validity of the found results (k1 and k2), these values for sum of squared errors are all within the margins, considering the 600-1000 data points used.
overnight MD6 MD2 C200
Run 1 Run 2 Run 1 Run 2 Run 1 Run 2
Weight (g) 0.4460 0.4483 0.4444 0.4463 0.4455 0.4456
Cor. weight (g) per L 2.0070 2.0174 1.9998 2.0084 2.0048 2.0052
k1 0.029 0.032 0.062 0.058 0.048 0.046
k2 0.499 0.487 0.389 0.352 0.262 0.276
k2/k1 17.51 15.36 6.24 6.06 5.46 6.05
SSE 2.17 1.12 0.74 0.84 1.40 1.33
Figure 13: The averages of the k-values for each overnight oxidation of the starches: Eliane MD6, Eliane MD2 and Eliane C200.
Figure 14: An overview of the averages of the overnight oxidation curve of Eliane MD6, Eliane MD2 and Eliane C200.
0 0.1 0.2 0.3 0.4 0.5 0.6
MD6
MD2
C200
k2 k1
0.00
0.05
0.10
0.15
0.20
0.25
0.30
0.35
0.40
0.45
0.00 1.00 2.00 3.00 4.00 5.00 6.00
acid
fo
rmed
(m
mo
l)
Time (hours)
Eliane MD6 Eliane MD2 Eliane C200

16
Overnight autoclave control Eliane 100 (Figure 15) had a hiccup at the first run. The pH electrode was not completely submerged during
the run, which resulted in incorrect measurements of the pH and therefore faulty additions of NaOH. For
this reason, the first overnight run of Eliane 100 was excluded from the average (Figure 16). The other two
runs were performed correctly. Even though the second run lasted almost twice as long as the third one, it
did not exceed the 1000 data points limit of 20.000 seconds, so the second and third runs are compatible.
Figure 15: The three different overnight runs of Eliane 100. Brought from 0% to 20% degree of substitution. Dissolved in the autoclave with the standard liquid method: 15 minutes at 121 °C and 225 kPa.
Figure 16: The second and third overnight runs of E.100 and the average of these two graphs.
0
0.05
0.1
0.15
0.2
0.25
0.3
0.35
0.4
0.00 1.00 2.00 3.00 4.00 5.00 6.00
acid
fo
rmed
(m
mo
l)
Time (hours)
Run 1 Run 2 Run 3
0.000
0.050
0.100
0.150
0.200
0.250
0.300
0.350
0.400
0.00 1.00 2.00 3.00 4.00 5.00 6.00
acid
fo
rmed
(m
mo
l)
Time (hours)
Run 2 Run 3 Average

17
Autoclaving changes the starches to such a degree that they cannot be compared to their non-autoclaved
counterparts. Autoclaving degrades the starches in such a manner that they become more similar in DP and
the resulting starch solutions are more homogeneous than their non-autoclaved counterparts. After all four
have been autoclaved (Figure 17), Eliane 100 still does not seem to fit in with the others. Eliane MD6, MD2
and C200 have increasing start-up times corresponding to their DP. This is odd, as before for the non-
autoclaved oxidations the opposite was observed. Before the start-up time was theorised to be related to
the ratio of the k-values, but now these still seem to correlate with the start-up time, but the other way
around. The linear sections of all four starches are very similar in slope. Confirming that the four starches
have come closer together after autoclaving, also shown in Figure 18. After the linear section, Eliane MD6
and MD2 come back together, Eliane C200 follows the same curve as the smaller two and only seems to lag
behind due to the longer start-up time it endured, but Eliane 100 is different, and moves away from Eliane
MD6 and the others. This suggests that the conclusion that was drawn from the non-autoclaved results: “the
speed at which the reaction rate to drops off is related to the DP”, is no longer prevalent. Excluding Eliane
100, the starches appear to have come closer together after autoclaving. The same test from before to see
whether the SSE changes significantly when interchanging the k-values (Table 2) has been done and despite
coming closer together, the k-values continued to lack interchangeability.
Figure 17: A figure showing the averages of the overnight runs of the four different starches that have been dissolved with the help of an autoclave.
Table 2: The measured weights of dissolved starch, the corrected weight for water content and per L, the resulting k-values and SSE for the autoclaved overnight runs of Eliane MD6, MD2 and C200 are found. The SSE is an indication of the validity of the found results (k1 and k2), these values for SSE are all within the margins, considering the 600-1000 data points used.
overnight MD6 MD2 C200 100 Run 1 Run 2 Run 1 Run 2
Weight (g) 0.4438 0.4459 0.4447 0.4459 0.4478 0.4489 Cor. Weight (g) per L 1.9971 2.0066 2.0012 2.0066 2.0151 2.0201 k1 0.036 0.029 0.028 0.029 0.047 0.051 k2 0.499 0.500 0.453 0.301 0.349 0.349 k2/k1 14.06 17.49 16.31 10.37 7.36 6.80 SSE 1.17 4.30 5.29 4.79 3.00 0.81
0.00
0.05
0.10
0.15
0.20
0.25
0.30
0.35
0.40
0.45
0.00 1.00 2.00 3.00 4.00 5.00 6.00
acid
fo
rmed
(m
mo
l)
Time (hours)
Eliane MD6 Eliane MD2 Eliane C200 Eliane 100

18
Figure 18: The k-values are shown for each autoclaved overnight oxidation of the starches.
Stepwise oxidation in pHstat To study the effects of DS on rox all the different starches were oxidised, stepwise 0%, 5%, 10%, 15%, 20%,
at pH 8.5 in duplo.
The following figures contain tangents for each individual oxidation step. The first data point after addition
of OCl before addition of NaOH by the pHstat is the start of the data series of that oxidation step. The addition
of OCl can be recognized from a spike in the pH. The desired data point is the data point nearest to a pH of
8.5 before the pH is raised by the pHstat. The data series used for the tangent is determined by ‘eyeballing’
the graph to estimate up until which data point the graph is linear. Therefore, the found tangents should be
taken with a grain of salt. Their only purpose is to give an early insight into the relation between DS and rox.
To get a more accurate description of the rox the whole curve of each step will be modelled in Matlab later.
The stepwise oxidation of the first starch (Figure 19) clearly shows that rox decreases as DS increases. The
initial rox of the second, third, and the fourth addition of hypochlorite however are more or less the same.
This behaviour is also seen in the other runs with Eliane MD6. The first oxidation step is significantly faster
than the following steps. With each step there is a decrease in rox, albeit relatively small, especially between
the second and third oxidation step. In other words: the ratio of k2/k1 has decreased as DS increased. Based
on the previously mentioned effects of the micropolarity on TEMPO this makes sense, as the solution
becomes increasingly polarised as the oxidation progresses. The theory that the ratio of k2/k1 is not only
dependent on the DP, but also on the DS, is confirmed by the k-values found using the model from Matlab
(Tables 3-5).
The graph showing the pH deviates increasingly the farther away it gets from the addition of hypochlorite.
An explanation for this could be that the concentration of hypochlorite in solution is higher just after
addition. Therefore, the rate formation of carboxylated anhydroglucose, is higher, which would negate the
pH increase caused by the NaOH addition of the pHstat, because only once every 20 seconds a datapoint is
made. When the oxidation step has progressed farther, there is less hypochlorite in solution, causing the
reaction rate to be lower than before, which in turn causes a bigger measured increase in pH per addition
of NaOH by the pHstat. This results in the jagged graph a while after each addition of hypochlorite. This
theory is in line with the previously mentioned decrease in rox in relation to DS. The time it takes for the pH-
measurements to render a jagged graph increases with every step, suggesting a slower drop-off in reaction
rate after the addition of hypochlorite.
0 0.1 0.2 0.3 0.4 0.5 0.6
MD6
MD2
C200
100
k2 k1

19
Figure 19: A Figure showing the blue graph: the amount of NaOH (mL) added by the pHstat in time. In this graph the yellow, thicker, sections represent the initial rox with their corresponding slopes. The orange graph shows the pH in time. Certain peaks are labelled, because they signify times at which hypochlorite has been added to further the degree of substitution. This was the second of the stepwise oxidations of Eliane MD6.
To compare the graphs of the individual steps the averages of the runs need to be taken again. This was
done in the same way as for the overnight runs. To compare the oxidation rates of the different steps all
averages of the steps are plotted in one graph, see Figure 20.
Figure 20 confirms the observation that the rox decreases significantly from the first oxidation step to the
second, while the second and following oxidation steps are very similar. Eliane MD2 is only slightly bigger
than Eliane MD6, but this slight increase in DP seems to already affect the rox of the first oxidation step
(Figure 21). The following steps are again very close to each other, but they all have a lower rox than those
of Elaine MD6. This is can be seen when comparing Figures 20 and 22. The last three steps of Elaine MD6
are at about 0.180 mL of added NaOH after 1 hour while the last three steps of Eliane MD2 end at about
0.150 mL of added NaOH after being run for the same duration.
Figure 20: This figure shows the averages of the individual oxidation steps (0- 5%, 5- 10%, 10-15% and 15- 20% degree of substitution) of Elaine MD6.
pH 10.249, Time 0.03 hours
pH 9.9, Time 0.84 hours
pH 9.763, Time 2.36 hours
pH 9.583, Time 3.96 hours
y = 2.4524x - 0.0656
y = 0.1466x + 0.0178
y = 0.1464x - 0.0976
y = 0.1284x - 0.1439
0
2
4
6
8
10
12
0
0.1
0.2
0.3
0.4
0.5
0.6
0.00 1.00 2.00 3.00 4.00 5.00 6.00
pH
acid
fo
rmed
(m
mo
l)
Time (hours)
acid formation pH
0.00
0.02
0.04
0.06
0.08
0.10
0.12
0.14
0.00 0.20 0.40 0.60 0.80 1.00 1.20 1.40 1.60 1.80
acid
fo
rmed
(m
mo
l)
Time (hours)
Step 1 Step 2 Step 3 Step 4

20
Figure 21: A Figure showing the blue graph: the amount of NaOH (mL) added by the pHstat in time. In this graph the yellow, thicker, sections represent the initial oxidation rate with their corresponding slopes. The orange graph shows the pH in time. Certain peaks are labelled, because they signify times at which hypochlorite has been added to further the degree of substitution. This was the first of the stepwise experiments with Eliane MD2.
Figure 22: This figure shows the different oxidation rates of the individual steps (0- 5%, 5- 10%, 10-15% and 15- 20% degree of substitution) of Eliane MD2.
Eliane C200 (Figure 23) continues in the same trend as the previous: The first oxidation step is
significantly greater than the following three and the rate of these last three steps are in turn slower than
the last three steps of its predecessors in DP. After one hour the amount of added NaOH is 0.140 mL.
pH 10.215, Time 0.03 hours
pH 8.95, Time 1.25 hours
pH 9.735, Time 2.21 hours pH 9.605, Time 3.70 hours
y = 1.7858x - 0.0401
y = 0.1479x - 0.071
y = 0.1402x - 0.1143
y = 0.1342x - 0.2113
0
2
4
6
8
10
12
0
0.05
0.1
0.15
0.2
0.25
0.3
0.35
0.4
0.00 0.50 1.00 1.50 2.00 2.50 3.00 3.50 4.00 4.50 5.00
pH
acid
fo
rmed
(m
mo
l)
Time (hours)
acid formation pH
0.00
0.02
0.04
0.06
0.08
0.10
0.12
0.00 0.10 0.20 0.30 0.40 0.50 0.60 0.70 0.80 0.90 1.00
acid
fo
rmed
(m
mo
l)
Time (hours)
Step 1 Step 2 Step 3 Step 4
21
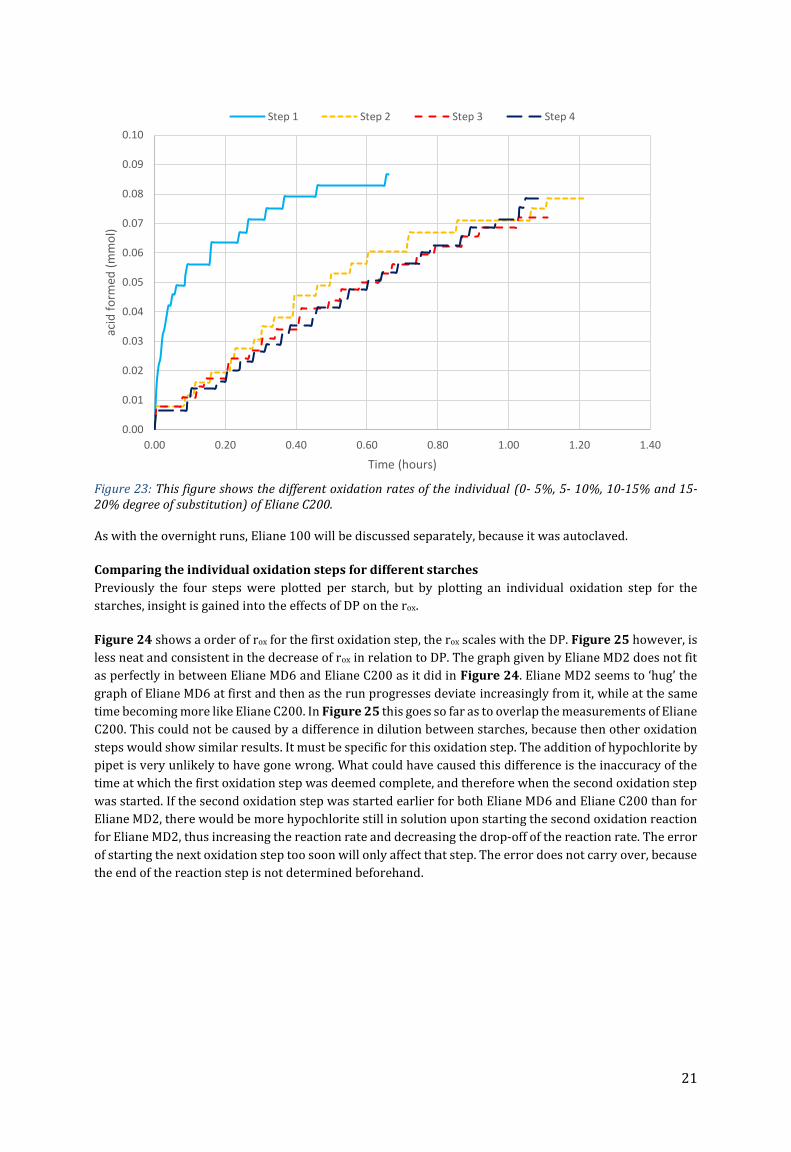
Figure 23: This figure shows the different oxidation rates of the individual (0- 5%, 5- 10%, 10-15% and 15- 20% degree of substitution) of Eliane C200.
As with the overnight runs, Eliane 100 will be discussed separately, because it was autoclaved.
Comparing the individual oxidation steps for different starches
Previously the four steps were plotted per starch, but by plotting an individual oxidation step for the
starches, insight is gained into the effects of DP on the rox.
Figure 24 shows a order of rox for the first oxidation step, the rox scales with the DP. Figure 25 however, is
less neat and consistent in the decrease of rox in relation to DP. The graph given by Eliane MD2 does not fit
as perfectly in between Eliane MD6 and Eliane C200 as it did in Figure 24. Eliane MD2 seems to ‘hug’ the
graph of Eliane MD6 at first and then as the run progresses deviate increasingly from it, while at the same
time becoming more like Eliane C200. In Figure 25 this goes so far as to overlap the measurements of Eliane
C200. This could not be caused by a difference in dilution between starches, because then other oxidation
steps would show similar results. It must be specific for this oxidation step. The addition of hypochlorite by
pipet is very unlikely to have gone wrong. What could have caused this difference is the inaccuracy of the
time at which the first oxidation step was deemed complete, and therefore when the second oxidation step
was started. If the second oxidation step was started earlier for both Eliane MD6 and Eliane C200 than for
Eliane MD2, there would be more hypochlorite still in solution upon starting the second oxidation reaction
for Eliane MD2, thus increasing the reaction rate and decreasing the drop-off of the reaction rate. The error
of starting the next oxidation step too soon will only affect that step. The error does not carry over, because
the end of the reaction step is not determined beforehand.
0.00
0.01
0.02
0.03
0.04
0.05
0.06
0.07
0.08
0.09
0.10
0.00 0.20 0.40 0.60 0.80 1.00 1.20 1.40
acid
fo
rmed
(m
mo
l)
Time (hours)
Step 1 Step 2 Step 3 Step 4

22
Figure 24: This figure shows the oxidation rates for the three different starches after addition of equimolar amounts of hypochlorite in the first oxidation step. The degree of substitution was brought from 0% to 5%.
Figure 25: This figure shows the oxidation rates for the three different starches after addition of equimolar amounts of hypochlorite in the second oxidation step. The degree of substitution was brought from 5% to 10%.
Figure 26 follows the same trend as the previous figures, the three starches are ordered in decreasing rox
with an increasing DP. Again, Eliane MD2 starts off very similar to MD6, but moves closer to C200 as the
reaction progresses, this time however it does not get as close to C200 as it did in the second oxidation step.
This indicates that it could indeed be caused by the inaccuracy of when to stop the current and start the
next oxidation step, but not completely, as Eliane MD2 still shows similar behaviour albeit far less extreme.
To further strengthen this theory, Figure 27 confirms this behaviour, though again less prominently visible.
On the other hand, the decrease in visibility of this behaviour could also be caused by the overall decrease
0.00
0.02
0.04
0.06
0.08
0.10
0.12
0.14
0.00 0.10 0.20 0.30 0.40 0.50 0.60 0.70 0.80 0.90
acid
fo
rmed
(m
mo
l)
Time (hours)
Eliane MD6 Eliane MD2 Eliane C200
0.00
0.02
0.04
0.06
0.08
0.10
0.12
0.00 0.20 0.40 0.60 0.80 1.00 1.20 1.40 1.60
acid
fo
rmed
(m
mo
l)
Time (hours)
Eliane MD6 Eliane MD2 Eliane C200

23
in reaction speed. The later reactions did not run as close to completion as their precedents, because this
would take too long. If these reactions were run until near completion, they might look more like Figure
25. By extrapolating the curve of Eliane MD2 in both Figures 26 and 27, similar results to Figure 25 would
be found. This behaviour however is not visible in the first oxidation step. It could be said that the first
oxidation step behaves differently altogether, because of its significant difference in reaction rate. This
behaviour of Eliane MD2 could still be the same as for the other steps, but not as apparent; at the start of
the reaction both Eliane MD6 and MD2 are very similar, and again as the reaction progresses Eliane MD2
moves away from MD6 towards C200, but it does not come nearly as close to C200 as it does for the other
reactions.
Figure 26: This figure shows the oxidation rates for the three different starches after addition of equimolar amounts of hypochlorite in the third oxidation step. The degree of substitution was brought from 10% to 15%.
Figure 27: This figure shows the oxidation rates for the three different starches after addition of equimolar amounts of hypochlorite in the fourth oxidation step. The degree of substitution was brought from 15% to 20%.
0.00
0.02
0.04
0.06
0.08
0.10
0.12
0.00 0.20 0.40 0.60 0.80 1.00 1.20 1.40 1.60 1.80
acid
fo
rmed
(m
mo
l)
Time (hours)
Eliane MD6 Eliane MD2 Eliane C200
0.00
0.02
0.04
0.06
0.08
0.10
0.12
0.00 0.20 0.40 0.60 0.80 1.00 1.20 1.40
NaO
H a
dd
ed (
mL)
Time (hours)
Eliane MD6 Eliane MD2 Eliane C200

24
The curve given with stepwise oxidation is different from the overnight oxidations. There is no visible s-
curve. The s-curve found in the overnight oxidations resulted from the ratio: k2/k1. The k2 in the stepwise
oxidations is a lot bigger and less consistent than those of the overnight oxidations (Table 3-5, Figure 30).
Using the 3D graph of the SSE for Eliane MD6 (Figure 28) as an example, the conclusion can be drawn that
the actual value of k2 does not matter all too much for the fit; the decrease in SSE for a greater k2 becomes
increasingly small, but never zero (Figure 28). This is not only the case for Eliane MD6, but also for Eliane
MD2 (Table 3) and Eliane C200 (Table 4). The relatively big standard deviation supports this. The standard
deviation of k2 for step 1 is only very small because for both cases the k2 approaches 50, because this was
the boundary set for the local field. This behaviour is apparent for all steps but the second. Out of the
comparing Figures 24-27) of the oxidation steps, the second oxidation step (Figure 25) seems the only one
to have any resemblance of an s-curve. This is quantified in the found k2-values from the Matlab model in
Tables 3-5. Due to a combination of both the inconsistency of the k2-values and the subtlety of the s-curve
from the second oxidation step it is justified to neglect this.
The k1 seems dependent on the DS for all starches, but the DP only for the first oxidation step (Figure 29).
This proves that the rox is far from independent of the k2, even if the k1 is rate limiting, because the order of
magnitude of k1 is opposite to the order of rox seen in Figure 24. When looking at later steps, the k1 does not
seem to be related to DP anymore, because the k1 of Eliane C200 decreases more than those of Eliane MD6
and Eliane MD2, becoming lower than both, while it was the highest at the first oxidation step.
Table 3: The averages of k1 and k2 of two runs and their respective standard deviations for each oxidation step of the stepwise oxidation of Eliane MD6 are given in this table.
Eliane MD6
Average k1 standard deviation k1 Average k2 standard deviation k2 k2/k1
step 1 0.455 0.043 50.000 0.000 109.95
step 2 0.126 0.013 6.204 1.139 49.24
step 3 0.066 0.005 40.066 9.934 604.76
step 4 0.057 0.000 38.883 11.116 683.36 Table 4: The averages of k1 and k2 of two runs and their respective standard deviations for each oxidation step of the stepwise oxidation of Eliane MD2 are given in this table.
Eliane MD2
Average k1 standard deviation k1 Average k2 standard deviation k2 k2/k1
step 1 0.669 0.154 33.662 16.338 50.35
step 2 0.238 0.044 3.906 0.436 16.40
step 3 0.133 0.089 27.380 22.620 205.17
step 4 0.106 0.065 23.306 19.324 220.49
Table 5: The averages of k1 and k2 of two runs and their respective standard deviations for each oxidation step of the stepwise oxidation of Eliane C200 are given in this table.
Eliane C200
Average k1 standard deviation k1 Average k2 standard deviation k2 k2/k1
step 1 0.818 0.124 16.503 0.627 20.17
step 2 0.145 0.039 3.259 0.291 22.55
step 3 0.035 0.002 49.962 0.006 1411.36
step 4 0.041 0.004 29.365 19.979 712.75

25
Figure 28: A 3D graph showing the sum of squared errors for the different possible combinations of k1 and k2
within the given local field (0-4 for k1 and 0-50 for k2). The coloured bar on the right indicates the relation of
the colour to the SSE.
Figure 29: The k1 values for each step and starch in the non-autoclaved stepwise oxidation.
Figure 30: The k2 values for each step and starch in the non-autoclaved stepwise oxidation.
0.00 0.10 0.20 0.30 0.40 0.50 0.60 0.70 0.80 0.90
step 1
step 2
step 3
step 4
C200 MD2 MD6
0.00 10.00 20.00 30.00 40.00 50.00 60.00
step 1
step 2
step 3
step 4
C200 MD2 MD6

26
Stepwise autoclave control The autoclaved stepwise oxidation of Eliane 100 was performed in triplo, while the autoclaved stepwise
oxidations of the other three starches were performed once.
The first noticeable difference between Eliane 100 (Figure 31) and the other starches, is the more gradual
change in rox with every oxidation step. Also, the initial rox of the first oxidation step appears to be lower
than those of the other three starches, which is in line with the observations made for the non-autoclaved
starches (Figure 24). To see if this behaviour is specific for Eliane 100 or was caused by the autoclaving,
will be determined from the autoclave control of the other three starches.
Figure 32: This figure shows the different oxidation rates of the individual steps (0-5%, 5-10%, 10-15% and 15- 20% degree of substitution) of Eliane 100.
0.00
0.01
0.02
0.03
0.04
0.05
0.06
0.07
0.08
0.09
0.10
0.00 0.20 0.40 0.60 0.80 1.00 1.20 1.40
acid
fo
rmed
(m
mo
l)
Time (hours)
Step 1 Step 2 Step 3 Step 4
Figure 31: A Figure showing the blue graph: the amount of NaOH (mL) added by the pHstat in time. In this graph the yellow, thicker, sections represent the initial rox with their corresponding slopes. The orange graph shows the pH in time. Certain peaks are labelled, because they signify times at which hypochlorite has been added to further the degree of substitution. This was the first of the stepwise experiments with Eliane 100.
pH 10.201, Time 0.01 hours
pH 9.63, Time 1.32 hours
pH 9.675, Time 2.20 hours
pH, 9.517, Time 3.97 hours
y = 0.5407x - 0.001
y = 0.2208x - 0.213
y = 0.142x - 0.1653
y = 0.1194x - 0.2215
0
2
4
6
8
10
12
0
0.05
0.1
0.15
0.2
0.25
0.3
0.35
0.4
0.00 1.00 2.00 3.00 4.00 5.00 6.00
pH
acid
fo
rmed
(m
mo
l)
Time (hours)
acid formation pH

27
The stepwise oxidations of Eliane MD6, MD2 and C200 were only performed once, making the results less
reliable. Still there are three distinct patterns to be found in the three Figures 33-35, of which two
previously observed.
- The first pattern, given by Eliane MD6 (Figure 33), is the spread in rox also found for Eliane 100:
with every oxidation step the rox decreases almost equally. While for Eliane 100 (Figure 32) the
first two oxidation steps level out sooner than the last two, this is not quite the case for Eliane MD6
(Figure 33), where only the first oxidation step levels out before the other three. This indicates
that also after autoclaving the difference in DP between Eliane MD6 and Eliane 100 has an effect on
the ratio of the k-values.
- The second pattern is one that has not been seen yet. For the autoclaved Eliane MD2 (Figure 34),
all oxidation steps seem to have roughly the same oxidation rate. The four steps are too closely
clumped together to point out any specific spread as was visible in Figure 33. Strangely enough
the first oxidation step is the slowest of the four. This is a clear indication that the autoclaving of
starch before oxidation significantly changed some characteristics of the starch.
- The third pattern is the same pattern as was found for all the non-autoclaved starches: the first
oxidation step is significantly faster than the other three, which are very similar in rox. This pattern
is given by the autoclaved Eliane C200 (Figure 35). The first step is incredibly fast however. It is
more likely that the first step is an outlier, because all other steps and starches are in line with the
results found from Eliane 100. At a first glance it might not seem that way, but Figures 37-39 show
how close (not only) Eliane C200 actually is to Eliane 100.
Figure 33: This figure shows the different oxidation rates of the individual steps (0-5%, 5-10%, 10-15% and 15- 20% degree of substitution) of autoclaved Elaine MD6.
0.00
0.02
0.04
0.06
0.08
0.10
0.12
0.00 0.20 0.40 0.60 0.80 1.00 1.20 1.40 1.60 1.80
acid
fo
rmed
(m
mo
l)
Time (hours)
Step 1 Step 2 Step 3 Step 4

28
Figure 34: This figure shows the different oxidation rates of the individual steps (0-5%, 5-10%, 10-15% and 15- 20% degree of substitution) of autoclaved Elaine MD2.
Figure 35: This figure shows the different oxidation rates of the individual steps (0-5%, 5-10%, 10-15% and 15- 20% degree of substitution) of autoclaved Elaine C200.
0.00
0.02
0.04
0.06
0.08
0.10
0.12
0.00 0.50 1.00 1.50 2.00 2.50
acid
fo
rmed
(m
mo
l)
Time (hours)
Step 1 Step 2 Step 3 Step 4
0.00
0.02
0.04
0.06
0.08
0.10
0.12
0.00 0.20 0.40 0.60 0.80 1.00 1.20 1.40 1.60 1.80 2.00
acid
fo
rmed
(m
mo
l)
Time (hours)
Step 1 Step 2 Step 3 Step 4

29
The results shown in Figures 36-39 give a new insight into the autoclaved stepwise oxidation by plotting
the starches for each step. When comparing the values for acid formed between the autoclaved starches and
the non-autoclaved starches in Figures 24 and 36, after 30 minutes both the smaller starches have
decreased in rox after autoclaving: Eliane MD6 went from 0.118 mmol to 0.077 mmol and Eliane MD2 from
0.100 mmol to 0.050 mmol, but Eliane C200 seems to have increased in rox: 0.083 mmol without autoclaving
and 0.099 with. This could be yet another confirmation of how inhomogeneous the solution is for greater
starches when solubilised in cold water.
For the first oxidation step it was previously shown in the non-autoclaved starches that the lower the DP of
the starch the higher its rox in the first step. Figure 36 shows the opposite, the curves of the greater two
starches (Eliane 100 and C200) start off much steeper than those of Eliane MD6 and MD2. There seem to be
two different shapes for the curves of these four starches, where Eliane 100 and C200 follow a similar shape
and Eliane MD6 and MD2 follow a different shape. Within these two subgroups the smaller of the two is still
the faster one. This division into two subgroups is not limited to the first oxidation step, in the second step
(Figure 37) it is less drastic, but still apparent. The division into two subgroups best noticed in Figures 36
and 37 is quantified using Matlab (Figure 40 and 41): Eliane C200 and Eliane 100 have a k1 of around 1 for
the first oxidation step, while Eliane MD6 and Eliane MD2 have significantly lower values for k1: of 0.26 and
0.14 respectively. This is far less apparent in the second oxidation step.
Notice also that the previously apparent s-curve in the second oxidation step of the non-autoclaved stepwise
oxidation is not visible anymore in Figure 37. Both Eliane C200 and Eliane 100 level out sooner than Eliane
MD6 and Eliane MD2. With the first oxidation step, the initial rate of oxidation seemed higher, with steeper
curves, than the smaller starches, this is not the case anymore, as all starches start at similar rates. The order
is also different, in the first step the smaller of the two was faster, while during the second step Eliane 100
is faster than Eliane C200. In the non-autoclaved oxidation all steps after the first were significantly slower,
if this is still the case after autoclaving it makes sense that Eliane C200 has a slower second oxidation step.
The following steps (Figure 38 and 39) however disprove this theory: the curves of all four starches are
very similar, suggesting they follow the same trend as Eliane 100. The curves of the four starches in Figures
38 and 39 are similar to such a degree that the found values from Matlab are completely interchangeable
for the fourth oxidation step and the values for Eliane MD6 and Eliane 100 are also interchangeable for the
third oxidation step.

30
Figure 36: This figure shows the oxidation rates for the four different autoclaved starches after addition of equimolar amounts of hypochlorite in the first oxidation step. The degree of substitution was brought from 0% to 5%.
Figure 37: This figure shows the oxidation rates for the four different autoclaved starches after addition of equimolar amounts of hypochlorite in the second oxidation step. The degree of substitution was brought from 5% to 10%.
0.00
0.02
0.04
0.06
0.08
0.10
0.12
0.00 0.20 0.40 0.60 0.80 1.00 1.20
acid
fo
rmed
(m
mo
l)
Time (hours)
Eliane MD6 Eliane MD2 Eliane C200 Eliane 100
0.00
0.02
0.04
0.06
0.08
0.10
0.12
0.00 0.50 1.00 1.50 2.00 2.50
acid
fo
rmed
(m
mo
l)
Time (hours)
Eliane MD6 Eliane MD2 Eliane C200 Eliane 100

31
Figure 38: This figure shows the oxidation rates for the four different autoclaved starches after addition of equimolar amounts of hypochlorite in the third oxidation step. The degree of substitution was brought from 10% to 15%.
Figure 39: This figure shows the oxidation rates for the four different autoclaved starches after addition of equimolar amounts of hypochlorite in the fourth oxidation step. The degree of substitution was brought from 15% to 20%.
0
0.02
0.04
0.06
0.08
0.1
0.12
0 0.5 1 1.5 2 2.5
acid
fo
rmed
(m
mo
l)
Time (hours)
Eliane MD6 Eliane MD2 Eliane C200 Eliane 100
0
0.02
0.04
0.06
0.08
0.1
0.12
0 0.2 0.4 0.6 0.8 1 1.2 1.4 1.6 1.8
acid
fo
rmed
(m
mo
l)
Time (hours)
Eliane MD6 Eliane MD2 Eliane C200 Eliane 100

32
Each autoclaved starch gives a different story making it difficult to draw a conclusion on what exactly the
autoclaving of starch did. What can be said though, is that autoclaving changes the oxidation pattern i.e. the
oxidation rates of the individual steps in relation to each other. This is most likely due to conformational
changes in the starches brought about by the high temperatures during autoclaving.
Figure 40: The k1 values for each step and starch in the autoclaved stepwise oxidation.
Figure 41: The k2 values for each step and starch in the autoclaved stepwise oxidation.
Perspectives
With the used method it was unreasonable to reach the desired percentage of DS, because this would take
an impractical amount of time. A possible solution for this is to use more TEMPO, combined with more
frequent measurements from the pHstat this would yield more accurate results for the later stages of the
oxidation reaction.
For the stepwise oxidation other sizes of oxidation steps: i.e. 2% at a time, would offer insight into the speed
at which the ratio of k-values changes with DS. Steps of 5% show a big difference between the rox of the first
oxidation step and the following steps. Using smaller steps might show a more gradual decrease in rox and
ratio in k-values.
For this research the assumption was made that the change in the ratio of k-values is exclusively caused by
the change of the micropolarity of the solution. It is however known that the starch degrades during the
oxidation reaction. This degradation could be charted with HPSEC by sampling for different combinations
of DS and DP. These samples would give insight into the composition of the starch solution at different DS’s
and different starting DP’s. This was initially planned for this thesis.
During this research the only carboxylic acid moieties were measured, this means that only the second step
of the oxidation reaction can be quantified. The intermediate product, aldonyl, was predicted. By studying
the aforementioned samples, the aldonyl content relative to DP and DS could be found. This would give
more data with relevance to the found shift in the ratio of the k-values.
0 0.2 0.4 0.6 0.8 1 1.2 1.4
step 1
step 2
step 3
step 4
100 C200 MD2 MD6
0 10 20 30 40 50 60
step 1
step 2
step 3
step 4
100 C200 MD2 MD6

33
Conclusions
Effect of DP on rox From the hypotheses in the introduction and the later stated arguments in the results section a relation of
DP to rox was unexpected. This relation was however apparent from the results. The ratio of the k-values,
and therefore the rox, changes for DP. Starches with a greater DP have a lower ratio of the k-values (Table
1). This lower ratio causes an overall drop in rox. This effect for DP can be seen in Figure 14 for the
overnight runs. This effect is also apparent in the stepwise runs, Figure 24 shows the decrease in rox in
relation to DP for the stepwise oxidation.
Effect of DS on rox
The hypotheses in the introduction are contradicting, however the hypothesis stating that the negative
charge of the starch would attract the positively charged TEMPO-intermediate is now known to be wrong,
as the change in micropolarity of the solution is probably what caused the noticed shift in the ratio of the
k-values. This shift in ratio was not only apparent for DP, but also for DS, as can be seen in Figure 20.
Effects of autoclaving After autoclaving the starches give more similar results than without autoclaving. It could be that the
autoclaved starches were more homogeneously dissolved than their room temperature and atmospheric
pressure counterparts. This effect was more apparent on the autoclaved stepwise oxidations, where the k-
values for the fourth oxidation step even became interchangeable.
Appendix A: Calculations for the amounts of hypochlorite needed for certain DS’s
To know how much hypochlorite must be added for a certain DS, the amount of anhydroglucose units in
solution needs to be known. All starches are from the Eliane potato strain, so they are all made up of only
anhydroglucose monomers in solution.
Table 6: All the properties and measurements that the calculation for the amount of hypochlorite needed is based on.
Properties and measurements
Measured weight 0.4456 g
w/w solution 0.2% -
volume solution 200 mL
anhydroglucose 0.002460368 mol
hypochlorite solution 0.125 M
w/w water in Eliane 10% -
active chlorine 12.5% -
Mw of anhydroglucose 163 g/mol
density NaOCl 1,206 kg/m3
Mw NaOCl 74.44 g/mol

34
Table 7: The amount of hypochlorite needed to reach a certain DS, for the measured weight shown in Table 6.
Hypochlorite calculations
DS 5% 10% 15% 20% Per 5%
NaOCl needed 0.000246 0.000492 0.000738 0.000984 0.000246 mol
NaOCl needed 0.0183 0.0366 0.0549 0.0733 0.0183 g
NaOCl needed 0.015 0.030 0.046 0.061 0.015 mL
NaOCl solution needed 0.121 0.243 0.364 0.486 0.121 mL
Example of the calculation: 1g of starch is dissolved in water, of that 1g 0.9g is actually starch. 0.9/163
=0.00552 mol anhydroglucose. The desired DS is 5%. 5% of 0.01209 is 2.76074*10-4 mol anhydroglucose.
For 1 unit of carboxylated anhydroglucose 2 units of hypochlorite are needed: 5.5215*10-4 mol
hypochlorite, 5.5215*10-4*74.44 = 0.0411 gram pure hypochlorite. The volume of pure NaOCl is
1/1206*0.0411*1000 = 0.034mL. The volume of NaOCl solution is 0.034*8 = 0.273mL.
It was originally planned to examine samples of the starches at different DS’s in the HPSEC. Taking these
samples changes the volume of the starch solution, this needs to be considered when calculating the amount
of hypochlorite needed for the next step. The amount of NaOH added by the pHstat also changes the volume,
and therefore the concentration of anhydroglucose. The necessary calculations for the amount of
hypochlorite needed to reach a certain DS with these altercations in the volume and concentration kept in
mind are found in Table 8.
From these values found in Table 8 it can be concluded that the added volume of NaOH does not
significantly change the total volume. The resulting change in the volume of hypochlorite that needs to be
added for the next oxidation step is too small to reliably administer using a pipet. Therefore, the added
volume of NaOH can be neglected in calculations.
Table 8: A table depicting the amounts of hypochlorite necessary for the next oxidation step based on calculations involving the anhydroglucose in solution and the effects of sampling on this. The numbers in this table are examples.
When taking samples
Degree of substitution
0% 5% 10% 15% 20%
solution volume before sample
200 197.23 194.46 191.69 188.92 ml
base added 0 0.23 0.23 0.23 0.23 ml
sample volume 3 3 3 3 3 ml
solution volume after sample
197 194.23 191.46 188.69 185.92 ml
anhydroglucose in solution
0.00001212 0.00001210 0.00001209 0.00001207 0.00001206 M
anhydroglucose 0.0024235 0.0023866 0.0023498 0.0023130 0.0022763 mol
NaOCl for next 0.120 0.116 0.112 0.109 - ml
NaOCl cumulative
- 0.120 0.236 0.348 0.457 ml

35
B: Determining the appropriate concentration of Eliane in water.
Test the solubility and retrogradation of Eliane 100 by dissolving it at 0.5%, 1%, 2%, and 5% w/w in 15 mL
tubes. Dissolve the starch in a heatblock and check for a pellet every minute. Disturb the pellet by inverting
or tapping the tube if there is one. Take out the tubes when the starch is fully dissolved and study them for
the following properties: viscosity, gel formation and a pellet. Store the tubes in a fridge for a week and
check to see if there are any changes in the aforementioned properties. Only Eliane 100 was used, because
it has the highest DP, and will therefore be the most likely to cause problems.
There were signs of retrogradation and gelation in all the tubes, but in the 0.5 w/w% solution there was a
very limited amount of gel in the shape of the tip, indicating the gel formation was caused by a higher
concentration in the tip. Even so it was decided to use a 0.2 w/w% solution to prevent any problems from
occurring.
C: Settings pHstat
- Conditioning: off
- Start condition
o Activation pulse: off
o Start delay time: 3s
o Start volume: 0.00000ml
o Dosing rate: 2ml/min
o Pause: 0s
o Request ID: off
o Request size: off
o Request unit: off
o Hold at request: on
- Titration parameters
o Solution: not defined
o Sensor: pH electrode
o Stirrer: on: 4
o Temperature: 22°C
o Titration direction: +
o Extraction time: 0s
o Time interval MP: 20s
- Control parameters EP 1
o Endpoint 1 at pH: 8.5
o Titration rate: optimal
o Stop criterion: off
- Control parameters EP 2
o Endpoint 2 at pH: off
o Titration rate: optimal
o Stop criterion: drift
o Stop drift: 20µl/min
- Stop conditions
o Stop volume: 200ml
o Stop time: off
o Filling rate: max. ml/min

36
References
Bailey, W. F., Bobbitt, J. M., & Wiberg, K. B. (2007). Mechanism of the Oxidation of Alcohols by Oxoammonium Cations. The Journal of Organic Chemistry, 72(12), 4504-4509. doi:10.1021/jo0704614
Bender, M. L., & Komiyama, M. (1978). Cyclodextrin chemistry / M. L. Bender, M. Komiyama. Berlin ; New York: Springer-Verlag.
Bordenave, N., Grelier, S., & Coma, V. (2008). Advances on Selective C-6 Oxidation of Chitosan by TEMPO. Biomacromolecules, 9(9), 2377-2382. doi:10.1021/bm800375v
Bragd, P. L., Besemer, A. C., & van Bekkum, H. (2000). Bromide-free TEMPO-mediated oxidation of primary alcohol groups in starch and methyl α-d-glucopyranoside. Carbohydrate Research, 328(3), 355-363. doi:https://doi.org/10.1016/S0008-6215(00)00109-9
Bragd, P. L., van Bekkum, H., & Besemer, A. C. (2004). TEMPO-Mediated Oxidation of Polysaccharides: Survey of Methods and Applications. Topics in Catalysis, 27(1), 49-66. doi:10.1023/b:toca.0000013540.69309.46
Ciriminna, R., & Pagliaro, M. (2010). Industrial Oxidations with Organocatalyst TEMPO and Its Derivatives. Organic Process Research & Development, 14(1), 245-251. doi:10.1021/op900059x
de Nooy, A. E. J., Besemer, A. C., & van Bekkum, H. (1994). Highly selective tempo mediated oxidation of primary alcohol groups in polysaccharides. Recueil des Travaux Chimiques des Pays-Bas, 113(3), 165-166. doi:10.1002/recl.19941130307
de Nooy, A. E. J., Besemer, A. C., & van Bekkum, H. (1995). Highly selective nitroxyl radical-mediated oxidation of primary alcohol groups in water-soluble glucans. Carbohydrate Research, 269(1), 89-98. doi:https://doi.org/10.1016/0008-6215(94)00343-E
Debet, M. R., & Gidley, M. J. (2007). Why Do Gelatinized Starch Granules Not Dissolve Completely? Roles for Amylose, Protein, and Lipid in Granule “Ghost” Integrity. Journal of Agricultural and Food Chemistry, 55(12), 4752-4760. doi:10.1021/jf070004o
Ding, B., Ye, Y. q., Cheng, J., Wang, K., Luo, J., & Jiang, B. (2008). TEMPO-mediated selective oxidation of substituted polysaccharides—an efficient approach for the determination of the degree of substitution at C-6. Carbohydrate Research, 343(18), 3112-3116. doi:https://doi.org/10.1016/j.carres.2008.09.005
Durrani, C. M., & Donald, A. M. (2000). Shape, molecular weight distribution and viscosity of amylopectin in dilute solution. Carbohydrate Polymers, 41(2), 207-217. doi:https://doi.org/10.1016/S0144-8617(99)00070-3
Forssell, P., Hamunen, A., Autio, K., Suortti, P., & Poutanen, K. (1995). Hypochlorite Oxidation of Barley and Potato Starch. Starch - Stärke, 47(10), 371-377. doi:10.1002/star.19950471002
Ito, K., & Yamashita, Y. (1965). Copolymer composition and microstructure. Journal of Polymer Science Part A: General Papers, 3(6), 2165-2187. doi:10.1002/pol.1965.100030607
Jonhed, A. (2006). Properties of modified starches and their use in the surface treatment of paper: Fakulteten för teknik- och naturvetenskap.
Kato, Y., Matsuo, R., & Isogai, A. (2003). Oxidation process of water-soluble starch in TEMPO-mediated system. Carbohydrate Polymers, 51(1), 69-75. doi:https://doi.org/10.1016/S0144-8617(02)00159-5
Knauer, B. R., & Napier, J. J. (1976). The nitrogen hyperfine splitting constant of the nitroxide functional group as a solvent polarity parameter. The relative importance for a solvent polarity parameter of its being a cybotactic probe vs. its being a model process. Journal of the American Chemical Society, 98(15), 4395-4400. doi:10.1021/ja00431a010
Narayan, R. (1994). Polymeric Materials from Agricultural Feedstocks. In Polymers from Agricultural Coproducts (Vol. 575, pp. 2-28): American Chemical Society.
Okazaki, M., & Kuwata, K. (1984). Molecular disposition of inclusion complexes of three aminoxyl radicals with .beta.-cyclodextrin in aqueous solution. The Journal of Physical Chemistry, 88(15), 3163-3165. doi:10.1021/j150659a001
Pierre, G., Punta, C., Delattre, C., Melone, L., Dubessay, P., Fiorati, A., . . . Michaud, P. (2017). TEMPO-mediated oxidation of polysaccharides: An ongoing story. Carbohydrate Polymers, 165(Supplement C), 71-85. doi:https://doi.org/10.1016/j.carbpol.2017.02.028

37
Sakakibara, C. N., Sierakowski, M. R., Lucyszyn, N., & de Freitas, R. A. (2016). TEMPO-mediated oxidation on galactomannan: Gal/Man ratio and chain flexibility dependence. Carbohydrate Polymers, 153(Supplement C), 371-378. doi:https://doi.org/10.1016/j.carbpol.2016.07.114
Saracino, G. A. A., Tedeschi, A., D'Errico, G., Improta, R., Franco, L., Ruzzi, M., . . . Barone, V. (2002). Solvent Polarity and pH Effects on the Magnetic Properties of Ionizable Nitroxide Radicals: A Combined Computational and Experimental Study of 2,2,5,5-Tetramethyl-3-carboxypyrrolidine and 2,2,6,6-Tetramethyl-4-carboxypiperidine Nitroxides. The Journal of Physical Chemistry A, 106(44), 10700-10706. doi:10.1021/jp026492e
Spier, V. C., Sierakowski, M. R., Reed, W. F., & de Freitas, R. A. (2017). Polysaccharide depolymerization from TEMPO-catalysis: Effect of TEMPO concentration. Carbohydrate Polymers, 170(Supplement C), 140-147. doi:https://doi.org/10.1016/j.carbpol.2017.04.064
Steeneken, P. A. M. (1984). Reactivity of Amylose and Amylopectin in Potato Starch. Starch - Stärke, 36(1), 13-18. doi:10.1002/star.19840360104
Tabushi, I. (1982). Cyclodextrin catalysis as a model for enzyme action. Accounts of Chemical Research, 15(3), 66-72. doi:10.1021/ar00075a001
Tojo, G., Fernández, M., Tojo, G., & Fernández, M. (2007). TEMPO-Mediated Oxidations. In Oxidation of Primary Alcohols to Carboxylic Acids: A Guide to Current Common Practice (pp. 79-103). New York, NY: Springer New York.
Copyright © 2022 FDOKUMEN