university of the western cape - Psychology
133
UNIVERSITY OF THE WESTERN CAPE Faculty of Community and Health Sciences Title: Employment and employability profiles of postgraduate psychology alumni from a historically disadvantaged university Student name: Mrs Janine Senekal Student number: 3608653 Orcid ID: 0000-0003-3843-2311 Department/School: Department of Psychology Degree: M.A. Psychology (Structured) Type of thesis: Mini-thesis Thesis completed in partial fulfilment of the degree requirements for the M.A. Psychology (Structured) programme Supervisor: Prof. Mario Smith Date: 16 July 2018 Keywords: higher education; graduate tracer study; employment destinations; graduate employability; alumni research; professional psychological training; graduate attributes; skills training relevance
-
Upload
khangminh22 -
Category
Documents
-
view
3 -
download
0
Transcript of university of the western cape - Psychology

UNIVERSITY OF THE WESTERN CAPE
Faculty of Community and Health Sciences
Title: Employment and employability profiles of postgraduate psychology
alumni from a historically disadvantaged university
Student name: Mrs Janine Senekal
Student number: 3608653
Orcid ID: 0000-0003-3843-2311
Department/School: Department of Psychology
Degree: M.A. Psychology (Structured)
Type of thesis: Mini-thesis
Thesis completed in partial fulfilment of the degree requirements for the M.A.
Psychology (Structured) programme
Supervisor: Prof. Mario Smith
Date: 16 July 2018
Keywords: higher education; graduate tracer study; employment destinations;
graduate employability; alumni research; professional psychological training;
graduate attributes; skills training relevance

i
Abstract
The present study aimed to determine the employment and employability profiles of alumni
from structured professional Masters programmes in psychology. Issues of low enrolment
rates and high attrition rates are at the fore of transformation efforts in the South African
higher education sector. The concern of graduate employability and the relevance of skills
training received to the labour market are of international concern. Graduate tracer studies
have been successfully implemented internationally to attempt to understand these issues.
Training relevance is of particular concern for the field of psychology in South Africa, as
there is a significant shortage of mental health professionals. Understanding where graduates
from professional Masters degrees in psychology find employment, as well as understanding
their employability, may lead to greater absorption of graduates from these programmes into
the workforce. Permission to conduct the present study and ethics clearance was obtained
from the Senate Research Committee of the University of the Western Cape, and all relevant
ethics principles were adhered to. An incentivised, online survey was conducted with a
sample of 29 Masters-level graduates from two professional psychology programmes at a
historically disadvantaged university. The study used a modified version of the Standard
Instrument for Graduates. The survey had a 50% response rate (29 of 58) after at least four
electronic reminders. Respondents graduated between 2008 and 2013, 13 from the clinical
Masters programme and 16 from the research Masters programme. Descriptive statistics were
used to depict the employment and employability profiles of the alumni. Most of the
respondents were female (n=21), and about a third were first generation students (n=11).
Most of the respondents were currently employed (n=25). They were employed in a variety
of fields, predominantly health (n=10) and higher education (n=7), and largely clustered in
the public sector (n=17). This suggested a transferability of skills. The training received was
perceived to be relevant, in terms of accessing employment and conducting current work.
Most of the clinical graduates were registered as clinical psychologists (n=12) with the
Health Professionals Council of South Africa. There were varied registrations held by
graduates from the research programme and some were not registered. The respondents held
generally positive attitudes towards their alma mater. These descriptive results were
interpreted through the use of McQuaid and Lindsay’s (2005) framework of employability,
based on the interaction between their individual factors, personal circumstances and external
factors. Through this frame, the results highlighted the complex nature of the employability
of these graduates.

ii
Declaration
I declare that the mini-thesis entitled Employment and employability profiles of
postgraduate psychology alumni from a historically disadvantaged university is my own
work. It has not been submitted for any degree or examination at any other university, and all
the sources I have used or quoted have been indicated and acknowledged by complete
references.
Mrs Janine Senekal
Signed:
Date: 16 July 2018

iii
Acknowledgements
The financial assistance of the National Research Foundation (NRF) towards this
research is hereby acknowledged. Opinions expressed, and conclusions arrived at, are those
of the author and are not necessarily to be attributed to the NRF.
Thank you to the UWC staff, research Masters class of 2016, the staff of CeSTII at
the Human Sciences Research Council, and all my friends and family who have supported me
in numerous ways throughout this process.
Thank you to my parents, Gary and Hilary, for supporting my educational
development throughout my life, and empowering me to achieve all that I have. Without you,
I would not have been able to be where I am today.
Thank you to Mario Smith for his supervision, guidance and direction. Your
knowledge and expertise helped me find my way in the swamp of research.
To my husband Jean-Pierre Senekal, thank you for your endless support and
encouragement throughout this process. You have kept me sane and given me the strength to
persevere and overcome everything in my way.
Thank you to God, for enduring faithfulness, love and mercy. Thank You for
guiding me, giving me strength and hope, and for never giving up on me. Thank You for all
You have provided, and for the path You are leading me on.

iv
Table of Contents
Abstract ....................................................................................................................................... i
Declaration ................................................................................................................................. ii
Acknowledgements .................................................................................................................. iii
Table of Contents ...................................................................................................................... iv
List of Tables ......................................................................................................................... viii
List of Figures ............................................................................................................................ x
List of Appendices .................................................................................................................... xi
1 Introduction ........................................................................................................................ 1
1.1 Background ................................................................................................... 1
1.2 Problem statement ........................................................................................ 2
1.3 Research rationale ......................................................................................... 4
1.4 Aim of the study ........................................................................................... 6
1.5 Objectives of the study ................................................................................. 7
1.6 Research question of the study ..................................................................... 7
2 Literature Review............................................................................................................... 7
2.1 Retention, throughput and transitions ........................................................... 7
2.2 Relevance of training .................................................................................... 9
2.3 Employability ............................................................................................. 11
2.4 Graduate attributes ...................................................................................... 14
2.5 Graduate tracer studies ............................................................................... 16
2.5.1 Graduate tracer methodologies .............................................................. 16
2.5.2 Graduate tracer study instruments .......................................................... 19
2.5.3 International and national trends in graduate tracer studies ................... 20
2.6 Gaps in the literature ................................................................................... 21
3 Theoretical Framework: Employability ........................................................................... 22
3.1 Broad model of employability (McQuaid & Lindsay, 2005) ..................... 22

v
3.1.1 Individual factors ................................................................................... 23
3.1.2 Personal circumstances .......................................................................... 23
3.1.3 External factors ...................................................................................... 24
3.2 Application of framework .......................................................................... 24
4 Methodology .................................................................................................................... 25
4.1 Aim of the study ......................................................................................... 25
4.2 Objectives of the study ............................................................................... 25
4.3 Research question of the study ................................................................... 25
4.4 Research setting .......................................................................................... 25
4.5 Research design .......................................................................................... 27
4.6 Participants and sampling ........................................................................... 29
4.6.1 Response rates ........................................................................................ 30
4.7 Instrument ................................................................................................... 30
4.7.1 Final instrument ..................................................................................... 31
4.7.2 Alignment with theoretical framework .................................................. 34
4.8 Procedure .................................................................................................... 36
4.9 Data analysis ............................................................................................... 37
4.9.1 Internal consistency ................................................................................ 37
4.9.2 Descriptive statistics .............................................................................. 37
4.9.3 Chi-square .............................................................................................. 37
4.10 Ethics .......................................................................................................... 38
5 Results and Discussion .................................................................................................... 39
5.1 Reliability: Internal consistency ................................................................. 39
5.2 Demographic results ................................................................................... 40
5.2.1 Education history ................................................................................... 44
5.3 The relationship between study and work .................................................. 47
5.3.1 Competencies at graduation ................................................................... 47
vi
5.3.2 University contribution to competencies ............................................... 51
5.3.3 Preparatory capacity of degree programmes .......................................... 54
5.3.4 Utilisation of competencies in subsequent employment ........................ 56
5.3.5 Relation of study to work ....................................................................... 59
5.4 Marketability .............................................................................................. 62
5.4.1 Employment search ................................................................................ 62
5.4.2 Increasing workplace marketability ....................................................... 63
5.4.3 Continued professional development ..................................................... 66
5.5 Most recent or current employment............................................................ 68
5.5.1 Dominant activity ................................................................................... 68
5.5.2 Field of work .......................................................................................... 69
5.5.3 Employment sector ................................................................................ 71
5.5.4 Tax income bracket ................................................................................ 72
5.5.5 Employment positions ............................................................................ 73
5.5.6 Professional registration ......................................................................... 74
5.6 Retrospective assessment of study ............................................................. 76
5.6.1 Rating of study provisions and conditions ............................................. 76
5.6.2 Overall usefulness of studies .................................................................. 79
6 Conclusions ...................................................................................................................... 80
6.1 Demographic profile ................................................................................... 81
6.2 Employment destinations ........................................................................... 81
6.3 Relevance of skills training to working environment ................................. 82
6.4 Proportion registered as health professionals ............................................. 82
6.5 Attitude towards alma mater....................................................................... 83
7 Theoretical Formulation of Results ................................................................................. 83
7.1 Individual factors ........................................................................................ 83
7.1.1 Employability skills and attributes ......................................................... 83

vii
7.1.2 Demographic characteristics .................................................................. 84
7.1.3 Job seeking ............................................................................................. 85
7.2 Personal circumstances ............................................................................... 86
7.2.1 Household circumstances ....................................................................... 86
7.2.2 Access to resources ................................................................................ 87
7.3 External factors ........................................................................................... 88
7.4 Overall Employability ................................................................................ 90
8 Limitations ....................................................................................................................... 90
9 Significance...................................................................................................................... 91
9.1 Methodological contribution ...................................................................... 91
9.2 Theoretical contribution ............................................................................. 92
9.3 Contribution to practice .............................................................................. 93
10 Recommendations ............................................................................................................ 94
Reference List .......................................................................................................................... 96
Appendix A: Letter of permission for use and adaptation of instrument .............................. 105
Appendix B: Adaptation of instrument .................................................................................. 106
Appendix C: Final instrument ................................................................................................ 109
Appendix D: Ethical clearance for conducting research ........................................................ 118
Appendix E: Letter of permission to conduct research from Registrar ................................. 119
Appendix F: Information sheet .............................................................................................. 120

viii
List of Tables
Table 1. Employability Framework Summary ......................................................................... 22
Table 2. Cross tabulation of HPCSA Registration Status and Masters Programme ................ 38
Table 3. Internal Consistency of Scales ................................................................................... 39
Table 4. Demographics of Clinical and Research Respondents .............................................. 40
Table 5. Frequency Table of Parental Education Level for Clinical and Research Respondents
................................................................................................................................... 41
Table 6. Interaction of Parental Education Levels for Clinical and Research Respondents .... 42
Table 7. Descriptive Statistics of Age in 2017 for Clinical and Research Respondents ......... 42
Table 8. Frequency Table of Masters Registration Year for Clinical and Research
Respondents ............................................................................................................... 44
Table 9. Frequency Table of Masters Graduation Year for Clinical and Research Respondents
................................................................................................................................... 45
Table 10. Descriptive Statistics of Age at Registration and Graduation for Clinical and
Research Respondents ............................................................................................... 45
Table 11. Descriptive Statistics of Years since Graduation for Clinical and Research
Respondents ............................................................................................................... 47
Table 12. Frequency Table of Preparatory Capacity for Clinical Respondents ...................... 55
Table 13. Frequency Table of Preparatory Capacity for Research Respondents .................... 55
Table 14. Frequency Table of Extent to which Field of Study Related to Field of Work for
Clinical and Research Respondents ........................................................................... 59
Table 15. Frequency Table of those who Consider their Job as Closely Linked to their Studies
for Clinical and Research Respondents ..................................................................... 60
Table 16. Frequency Table of Reasons for Working in a Field that was Unrelated to Training
for the Research Respondents .................................................................................... 60
Table 17. Frequency Table of Types of Useful Employment Search Methods for Clinical and
Research Respondents ............................................................................................... 62
Table 18. Frequency Table of Importance for Increasing Marketability in the Workplace for
Clinical Respondents ................................................................................................. 63
Table 19. Frequency Table of Importance for Increasing Marketability in the Workplace for
Research Respondents ............................................................................................... 64
Table 20. Frequency Table of Agreement with Statements about Continued Professional
Development for Clinical Respondents ..................................................................... 66

ix
Table 21. Frequency Table of Agreement with Statements about Continued Professional
Development for Research Respondents ................................................................... 67
Table 22. Frequency Table of Current Dominant Activities of Clinical and Research
Respondents ............................................................................................................... 69
Table 23. Frequency Table of Field of Work for Clinical and Research Respondents ........... 70
Table 24. Frequency Table of Employer Category for Clinical and Research Respondents .. 71
Table 25. Frequency Table of Tax Income Bracket for Clinical and Research Respondents . 72
Table 26. Frequency Table of Number of Positions Prior to Current or Most Recent Position
for Clinical and Research Respondents ..................................................................... 73
Table 27. Frequency Table of HPCSA Registration Status for Clinical and Research
Respondents ............................................................................................................... 74
Table 28. Frequency Table of Rating of University Experience for Clinical Respondents .... 76
Table 29. Frequency Table of Rating of University Experience for Research Respondents .. 77
Table 30. Frequency Table of Perception of Overall Usefulness of Studies for Clinical
Respondents ............................................................................................................... 79
Table 31. Frequency Table of Perception of Overall Usefulness of Studies for Research
Respondents ............................................................................................................... 79
Table 32. Source of Items included in Final Instrument, Changes Made and Reasons for
Changes .................................................................................................................... 106

x
List of Figures
Figure 1. Frequencies of the clinical respondents’ perceived level of competencies at the time
of graduation .............................................................................................................. 48
Figure 2. Frequencies of the research respondents’ perceived level of competencies at the
time of graduation ...................................................................................................... 49
Figure 3. Frequencies of the clinical respondents’ perceived contribution by the university to
competencies .............................................................................................................. 51
Figure 4. Frequencies of the research respondents’ perceived contribution by the university to
competencies .............................................................................................................. 53
Figure 5. Frequencies of the clinical respondents’ perceived utilisation of competencies in
subsequent employment ............................................................................................. 57
Figure 6. Frequencies of the research respondents’ perceived utilisation of competencies in
subsequent employment ............................................................................................. 58

xi
List of Appendices
Appendix A: Letter of permission for use and adaptation of instrument
Appendix B: Adaptation of instrument
Appendix C: Final instrument
Appendix D: Ethical clearance for conducting research
Appendix E: Letter of permission to conduct research from Registrar
Appendix F: Information sheet

1
1 Introduction
1.1 Background
The higher education sector plays a vital role within the South African economy, as
it has been identified as the main pipeline of human resource development (DST, 2007;
Shrivastava & Shrivastava, 2014). The National Plan for Higher Education and the
Department of Science and Technology’s (DST) Ten-Year Innovation Plan identified a
positive correlation between economic development and the level of participation in higher
education, indicating that increased participation in higher education may significantly
improve employment and economic transformation in South Africa (Asmal, 2001; DST,
2007). As such, the National Development Plan for 2030 identified increased participation in
higher education as integral to achieving the goals of economic growth and societal
transformation (National Planning Commission (NPC), 2011b). The Council for Higher
Education (CHE, 2015) has reported an increase in participation rates in higher education, as
reflected in increased enrolments in recent years. In particular, a notable increased
representativeness of the general population with regard to race has been reported (CHE,
2015). However, increased participation has not translated into improved completion rates,
ostensibly due to issues surrounding retention and throughput in higher education (Cloete,
2009; NPC, 2011a). Wingfield (2011) underscored that throughput rates were of particular
concern for Masters and Doctoral students in South Africa. MacGregor (2014) reported
completion rates in South Africa at 13% and 20% for Doctoral and Masters students
respectively. These throughput rates supported the evidence that the greater participation in
higher education has not translated into greater completion of tertiary-level training for
designated demographic groups. The disconnection between participation and throughput
rates is true even more so at a postgraduate level.
According to the National Development Plan, the ability of graduates to participate
in the knowledge economy depends partly on the skills they were equipped with, which
enabled them to access employment, thus determining their employability (NPC, 2011b). The
National Plan for Higher Education outlined that these skills need to go beyond technical
skills to more general skills (Asmal, 2001). This included analytical skills, communication
skills, negotiation skills, social sensitivity, computer literacy, adaptability, flexibility and
continuous learning (Asmal, 2001). As reported by Koen (2006), the employability of
graduates is influenced by the applicability of higher education training to the labour market.

2
In addition, Moleke (2001) posited that “the skills [graduates] possess do not match the skills
the economy needs to make great strides” (p. 215). The identified gap between the skills
graduates have and the skills used in the labour market highlights the connection between
higher education skills relevance, employability and economic development. The issue of
employability thus becomes vital to examine at a postgraduate level where cohorts are small,
and the impact of unemployment is exponentially larger.
The Cape Higher Education Consortium (CHEC) identified alumni-based research
as an important vehicle that may ensure that curricula keep pace with the labour market and
economic state of the country (CHEC, 2013). Alumni-based research tracks graduates and
gathers information from them regarding their employment destinations and the extent to
which their studies equip them for their subsequent employment (Mubuuke, Businge, &
Kiguli-Malwadde, 2014). Information gathered from alumni may be utilised to determine
curriculum adjustments for labour market relevance, policy adjustments to mediate
graduates’ transition from higher education into the world of work, institutional marketing, or
to inform new or potential higher education students about career prospects. As such,
graduate tracer study research has been noted to have far reaching benefits (CHEC, 2013).
There has been an international increase in concern regarding the employability of
graduates, given the identified role of higher education to prepare graduates for employment,
as well as the prevalence of unemployment (Goodman & Tredway, 2016; Griesel & Parker,
2009; Kaburise, 2016; Melink & Pavlin, 2009). The identified concerns about graduate skills,
curriculum relevance, and employability is justified, as immediate employment has been
noted to be difficult to achieve across all fields of study (Koen, 2006), and in particular for
graduates from the humanities and the arts (Cosser, 2003). The issue of employability may be
of particular concern for fields that are considered underrepresented in the workforce,
regarding whether graduates in these fields are being appropriately absorbed into the labour
market.
1.2 Problem statement
There are very few registered psychologists in South Africa, which has been
identified as a significant shortage of these skilled professionals (Mashigo, 2017). The
scarcity of psychological professionals may be attributed to the exponentially higher impact
of attrition on small numbers of trainees and graduates pursuing professional registration.
According to the website of the Health Professions Council of South Africa (HPCSA),

3
psychological practitioners formed 7.5% of the health professionals in South Africa in 2017.
According to the HPCSA (http://www.hpcsa.co.za/Publications/Statistics), the total number
of 18 750 psychological practitioners (including students and interns) registered in 2017 were
available to provide psychological services to a population of about 56.5 million
(http://www.southafrica.info/about/people/population.htm). The ratio of practitioners to the
population was the equivalent of one psychological practitioner per 3013 people, provides
supporting evidence for the identified strain on mental health care professionals (A. L. Pillay
& Kramers-Olen, 2014). However, the ratio of practitioners to population is also an
indication that the majority of the population does not have access to mental health care
services, as the majority of psychological services have been identified as located in the
private sector (Cooper, 2014). The greater capacity of private health services is largely due to
the historical development of health services which has yet to be fully rectified. Government
and public sector employment opportunities are limited, despite the need for more broadly
and publicly accessible mental health professionals, which further forces registered
psychologists towards the private sector (Department of Health (DoH), 2013). The clustering
of professionals in the private sector indicates a perpetuation of the trend in which health care
services (including psychological services) are accessible to the few who can pay for it,
resulting in limited access for the majority of the population. It therefore becomes important
to examine where professionally trained psychology graduates find employment, considering
both health care access and employment opportunities.
For many years, the field of psychology has been dominated by White individuals,
despite the demographics of the country as a whole (A. L. Pillay & Kramers-Olen, 2014; A.
L. Pillay & Kramers, 2003). The implications of a predominantly White demographic in the
field of psychology further limits access, in a more nuanced sense, to those who were able to
communicate in the language of the health professionals available. One would expect to see a
greater diversification in the demographics of those training and practising in the health
professions in South Africa, given that it has been more than 20 years since Apartheid ended.
There has also been an increased ‘feminisation’ of psychology in South Africa, in that the
majority of practitioners have been identified as female, which mirrors the international trend
(A. L. Pillay & Kramers-Olen, 2014). The predominance of females in the field of
psychology is in contrast to general South African undergraduate and postgraduate trends,
which have been dominated by males (Badat, 2010). This further underlines the unique
nature of the field of psychology.

4
There are larger than usual postgraduate intakes in psychology departments at
honours degree level, despite the fallout from undergraduate degree levels. The regulations
defining the scope of practice outlined by the Department of Health (DoH) indicate that the
completion of a Masters degree in psychology must be followed by the completion of an
approved internship and passing a board exam in order to qualify and register as a practicing
psychologist in South Africa (DoH, 2008). Entrance into the Masters degree programmes is
determined by a stringent selection process, and class sizes are typically small (Ahmed &
Pillay, 2004). There remains a risk of non-completion or termination of psychology Masters
students, meaning that acceptance into these programmes is not a guarantee of completion
(Offord, 2016). The persistent risk of non-completion means that the small group of
psychology Masters graduates is particularly vulnerable in terms of accessing employment
after graduation (Kagee & O'Donovan, 2011). What is unknown was what happens to these
highly-skilled and educated individuals, where do they find employment, and what skills
enable them to become economically active? Such questions have commonly been answered
through alumni-studies or tracer studies (Mubuuke et al., 2014). The present study conducted
a graduate tracer study survey to gain a sense of the employment and employability profiles
of alumni from two structured professional Masters programmes in psychology, namely
clinical psychology and research psychology, at a historically disadvantaged university. The
name of the institution has been anonymised throughout using ‘XXX’.
1.3 Research rationale
The South African government has undertaken various initiatives towards
transformation, since the birth of democracy in 1994 (Badat, 2010). The higher education
sector has been identified as needing significant reworking, as it holds a key position in
developing human resources, training highly-skilled individuals, and knowledge production
(Asmal, 2001; Coetzee & Esterhuizen, 2010; DST, 2007). The necessity of transforming the
higher education sector was highlighted in the National Plan for Higher Education, as well as
in the Ten-Year Innovation Plan and the National Development Plan (Asmal, 2001; DST,
2007; NPC, 2011b).
Retention and throughput were identified as areas of concern in the National Plan for
Higher Education and the National Development Plan (Asmal, 2001; NPC, 2011b). The
effects of identified low enrolment rates and high attrition rates are compounded by the
increased demand for higher skill levels in the labour market (Asmal, 2001; NPC, 2011b).

5
There have been upward trends in higher education participation rates (Cloete, 2014) and
improved population representation in enrolment rates (Wangenge-Ouma, 2012), yet attrition
rates and low completion rates remain prominent, particularly for Black students (Sommer &
Dumont, 2011; Wangenge-Ouma, 2012). Enrolment patterns have historically been
racialised, and remain so. The Department of Higher Education and Training (DHET) has
identified that the population of students who enrol in historically disadvantaged institutions
(HDI) have been more aligned with the national targets for higher education, with majority
Black and Coloured students (DHET, 2012). Additionally, HDIs attract many first-generation
students from previously disadvantaged backgrounds (DHET, 2012). As such, researching
HDIs remains a focus.
The National Development Plan identified a focus on increasing participation and
throughput of postgraduate students in particular. The most recent statistical profile of South
African postgraduate students was the document by CHE (2009), based on data from 2005.
High level results described the demographics of Masters students, including their age at
graduation, how long it took to complete a Masters degree, and participation rates in Masters
degrees. The mean age of Masters students at graduation was 34 years, as of 2005. The mean
number of years to complete a Masters degree was 2.9 years, as of 2005. The average time
taken to complete a Masters degree ranged from 2.4 years for students under 30, to 3.5 years
for students over 60. The study further showed that the participation rate of Masters graduates
in the 25-34-year-old age bracket was .98 per 1000. The data supported the identified
importance of research focusing on post-graduate students.
There has been an escalation of student protest movements in recent years, such as
#RhodesMustFall and #FeesMustFall, demanding release from student debt, no increase in
fees, and free education (S. R. Pillay, 2016). These movements also included a call for the
decolonisation of higher education, towards greater transformation within the system as a
whole (Pather, 2015; S. R. Pillay, 2016). These movements further highlight the imperative
for higher education transformation.
A large portion of citizens have been notes to be less able to actively participate in
employment after completion of higher education (NPC, 2012). The decreased ability to
access employment after completing a tertiary degree has limited citizens’ ability to
participate as active members of society, a core human right laid out in the Constitution of
South Africa (1996) . Immediate employment after graduation has been identified as rare
(Koen, 2006). Furthermore, when employment is attained immediately after graduation, these

6
positions are usually default positions for which the graduates are overqualified, in field that
are unrelated to the field of study, or seen as step towards preferred employment or career
goals (Koen, 2006). The identified mismatch between training and employment highlights the
difference between obtaining employment and securing employment that was deemed
relevant, in that it appropriately utilised the skills of the individual. The issue of graduate
employability was further highlighted in the CHEC (2013) study, with the implication that
education may not be the cure for unemployment. The limited power of education to reduce
unemployment may undermine the imperative to improve graduation throughput in order to
improve the economic state of the country, as outlined in the Ten-Year Innovation Plan
(DST, 2007).
Graduate tracer studies enable the measurement of various aspects within the higher
education sector, including graduate un/employment, employment destinations, employment
seeking behaviour, evaluation of educational experiences, and the relevance of training to the
work place (Cabrera, Weerts, & Zulick, 2003; CHEC, 2013; McGovren & Carr, 1989;
Schomburg & Teichler, 2006). The results of such research may be used to inform depictions
of the graduate labour market, as well as policy and curriculum development (CHEC, 2013).
As such, a graduate tracer study method may be beneficial towards understanding the
complex nature of issues relating to retention, throughput and employability in the higher
education sector of South Africa. Few and sporadic institutional or departmental graduate
tracer studies have been conducted in the South African context, with fewer still at
historically disadvantaged institutions (CHEC, 2013). Du Toit, Kraak, Favish, and Fletcher
(2014) attributed the lack of tracer studies to funding and resource limitations. As such, it
becomes important to conduct graduate tracer studies at various levels within the South
African higher education context, at both historically advantaged and disadvantaged
institutions, at the departmental level and institutionally, in order to assist in repositioning the
higher education sector to be efficient and effective in terms of access, retention, throughput
and the employability of graduates.
1.4 Aim of the study
The aim of the study was to determine the employment patterns and the
employability profiles of alumni from structured professional psychology Masters
programmes.

7
1.5 Objectives of the study
1. To establish a demographic profile of the alumni
2. To determine the employment destinations of the alumni
3. To determine the perceived relevance of skills training to the working
environment
4. To determine the percentage of eligible graduates who have completed
registration as health professionals
5. To establish the alumni’s attitude towards their alma mater
1.6 Research question of the study
What are the employment patterns and the employability profiles of alumni from
structured professional psychology Masters programmes?
2 Literature Review
The body of literature in the field of higher education, in particular in the South
African context, centres around issues of participation, representation, retention and
throughput, transitions into, through and out of higher education, training relevance,
employment destinations and employability. In addition, graduate attributes and graduate
tracer studies have been identified as a means to understanding the above-mentioned issues,
yet have been infrequently utilised in the South African context, warranting a review of the
literature on these topics.
2.1 Retention, throughput and transitions
In the South African context, issues of retention and throughput have been of
particular focus in studies concerning the transition from secondary to tertiary education
institutions. For example, Hobden and Hobden (2015) examined the long-term effect of
secondary school interventions in terms of future study and work destinations. Setlalentoa
(2013) examined the preparedness of secondary school graduates for tertiary education from
the perspective of the educators. Both studies noted the difficulties of the transition from
secondary school into tertiary education, including the importance of study programme
choice. The importance of study programme selection was further explored by Cosser and
Nenweli (2013) and Cosser (2009). Both studies focused on how programme selection

8
affected the transition into higher education, particularly as it related to throughput from
tertiary enrolments to graduation. Hobden and Hobden (2015) further identified that
transitions through tertiary education may be complicated by false starts and changes in
direction, in terms of study choice or focus. The importance of programme selection in higher
education research, as it affects retention, throughput and transition into and through higher
education was highlighted.
There has been relatively less research in South Africa concerning the transition out
of higher education and into the work place. For example, Du Toit et al. (2014) identified that
research concerning the movement from higher education to the world of work tends to be
limited to graduate opinion or exit surveys. In the South African context, opinion or exit
surveys may be distinguished from graduate tracer studies, as they typically survey alumni
upon graduation (CHEC, 2013; Du Toit et al., 2014). Several South African higher education
institutions conduct graduate opinion surveys at their graduation ceremonies. These surveys
typically “aim to gather a quick ‘snapshot’ of job search behaviour, employment status,
entry-level salaries, as well as satisfaction with the higher education institution, the
curriculum they offer and its relevance to the workplace” (CHEC, 2013, p. 7). The initial
snapshot of the transition from higher education into the workplace does not provide a long-
term view of future employment (McCowan & Wyganowska, 2008). Purcell and Elias (2004)
highlighted the issue of false starts in employment, which supported the notion that
immediate employment destinations may not be indicative of long-term employment and
career potential. Thus, research pertaining to the transition from higher education to the
workplace, both in the short term and the long term, is important.
Methods used to search for employment have been used as an indicator in
researching the transition from higher education into the workplace (CHEC, 2013). Job
search activity has been understood as a representation of social capital or networks that the
graduate is able to utilise to access employment (CHEC, 2013; Tomlinson, 2017). Tomlinson
(2017) further noted that the interaction of these social relationships and networks mobilise
graduates’ existing individual qualities and abilities. The mobilisation of individuals
improves graduate access to the labour market and their ability to understand and engage with
it in a meaningful and productive way (Tomlinson, 2017). The ability to access social
networks and social capital was identified as important beyond job search, and may be tied to
parental education level – an indicator of social capital (CHEC, 2013). Parental education
level has been identified as an indicator of social support, affecting educational and career

9
aspirations, and through access to education and employment networks (Ball, 2010). There
has been an influx of first generation students at South African higher education institutions,
particularly at HDIs (DHET, 2012). Research notes that first generation students are less
likely to complete their tertiary education (Siyengo, 2015; van Zyl, 2013). The increased
attrition for first generation students has been linked to the lower levels of social, financial
and educational support that their families were able to provide (Siyengo, 2015; van Zyl,
2013). Research has therefore noted the importance of various support factors affecting the
ability of individuals to transition into the workplace.
Much of the relatively small body of literature focusing on retention, throughput and
transition from higher education focused on undergraduate programmes. For example,
Letseka, Cosser, Breier, and Visser (2010) examined the retention and graduate destinations
of completers and non-completers of undergraduate programmes. One of the few examples
where post-graduate students were researched was the study by Albertyn, Kapp, and Bitzer
(2008). The study focused on completion rates of post-graduate students, and highlighted that
there was limited research focused on throughput and transition of students from postgraduate
programmes (Albertyn et al., 2008). An increase in postgraduate throughput, particularly at
Doctoral level, was highlighted as a priority area of transformation in the National
Development Plan (NPC, 2011b). Low participation rates and high attrition rates are
compounded from undergraduate to postgraduate levels, and throughout different levels of
postgraduate i.e. from Honours to Masters, and Masters to Doctorate. Thus, attrition
exponentially impacts negatively on participation and representation at postgraduate levels.
As such, research focusing on issues of retention, throughput and transition among
postgraduate students is both vital and lacking in the South African context.
2.2 Relevance of training
An emerging concern internationally and nationally has been the skills (mis)match
of higher education graduates with regard to their ability to access employment (De la Harpe,
Radloff, & Wyber, 2000; Holmes, 2013; Mason, Williams, & Cranmer, 2009; Schwartz,
2014). As mentioned before, exit studies or graduate opinion surveys focus on an evaluation
of educational experience and are typically conducted at the end of the educational
experience (CHEC, 2013). Exit studies are opinion based, and so may be affected by reduced
recollection accuracy and the influence of other experiences (Weisberg, 2005). As such, the
short-term focus of exit studies ensures that there is minimal time between the university

10
experiences being surveyed and the survey itself. In this way, the timing of exit studies may
be considered appropriate, as the research is less likely to be affected by error due to the
accuracy of participant recollection. However, the short-term focus provides little insight into
the long-term relevance of the skills training received for later employment.
Research involving the evaluation of higher education training has often been in
relation to current work tasks and overall satisfaction with training (Aina & Moahi, 1999;
Lutwama & Kigongo-Bukenya, 2004). Mugabushaka, Schomburg, and Teichler (2007) asked
respondents to assess the study conditions and provisions of their higher education
experiences. These conditions were divided into three themes: teaching and learning study
provisions, infrastructure and equipment of the university, and student welfare. The
evaluations of the study programme or university experiences may exist as stand-alone
research focus. However, there have been instances where the evaluation of curriculum
relevance may be tied more directly to employability (De Guzman & De Castro, 2008), or
may include the perspectives of existing professionals in the field or employers
(Varalakshmi, 2006).
Graduate destinations, i.e. employment destinations after graduation, have been
studied in conjunction with higher education evaluation to assess the labour market relevance
of higher education training (CHEC, 2013). Depictions of the graduate labour market may be
used to examine graduate unemployment. Such research has identified that there may be a
mismatch between the skills required by the labour market and the skills that graduates
possess. For example, Moleke (2001) examined South African graduates’ first employment
destinations and reported the same skills mismatch. Skills mismatch may be a reason why
graduates may still struggle to access employment, despite their qualifications. Not only do
the high levels of unemployed higher education graduates add to existing high levels of
unemployment in South Africa, but education also then ceases to be a ‘cure’ for
unemployment (CHEC, 2013).
There has been a growing concern that higher education graduates may in fact be
overqualified for the entry level work that they are able to gain upon graduation, particularly
within the fields of social sciences and humanities (Boulos, 2016; Green & McIntosh, 2007).
Green and McIntosh (2007) differentiated between being over-qualified and being over-
skilled, indicating that professional qualifications do not necessarily translate to relevant
skills that were required and utilised in the workplace. The disconnection between
qualifications and skills identified aligned with research by Boulos (2016) who specifically

11
addressed the predicament of highly qualified doctoral graduates. Many individuals may
pursue a PhD in order to increase their vocational opportunities, yet the desired career
development was identified to be slow to actualise, if at all (Boulos, 2016). It was suggested
that the attainment of a PhD itself was not necessarily recognised to the same extent outside
of academia, with the industry focus rather being on the skills required for or gained in the
pursuit of a PhD (Boulos, 2016). The issue of the relevance of skills training received during
higher education has been of particular interest as it relates to the transition of graduates from
higher education into the workplace, namely, their employability.
2.3 Employability
Employability has become central to much higher education discourse, given the
functional role of higher education institutions to prepare graduates for employment (Melink
& Pavlin, 2009) and the on-going international issue of unemployment – including among
graduates (Goodman & Tredway, 2016; Griesel & Parker, 2009; Kaburise, 2016). Simply
put, employability refers to the ability of an individual to secure employment (Goodman &
Tredway, 2016). However, the meaning of ‘employability’ has often been unclear or
undefined and has most commonly been used synonymously with individual employability
skills and/or attributes (Hinchliffe & Jolly, 2011; Holmes, 2013; McQuaid & Lindsay, 2005;
Tomlinson, 2017).
A ‘narrow’ definition of employability has been identified, which focuses
exclusively on graduate skills and attributes (Bridgstock, 2009; Griesel & Parker, 2009;
McQuaid, Green, & Danson, 2005; McQuaid & Lindsay, 2005; Tomlinson, 2017). Within the
narrow definition, the solution to unemployment is to increase skills, which is the
responsibility of the individual and takes place through education (McQuaid et al., 2005;
McQuaid & Lindsay, 2005; Tomlinson, 2017).
This singular focus on skills has been critiqued on various fronts. Firstly, there is a
gap between the skills that graduates actually have, and the narrow definition of ‘graduate
skills’ (Tomlinson, 2017). Secondly, employment cannot be ameliorated by simply ‘up-
skilling’ (Tomlinson, 2017). Therefore, the narrow definition does not take the additional
contextual factors that influence employability in general and the development of skills
specifically into account, as these skills may also be developed in settings outside of the
higher education context (Hinchliffe & Jolly, 2011; McQuaid et al., 2005; McQuaid &
Lindsay, 2005; Tomlinson, 2017).

12
The alternative, ‘broader’ definition of employability integrates the skills and
attributes of the individual, within their contextual settings, including labour market demand,
competition, personal circumstances, and the economic, political and social context (Griesel
& Parker, 2009; McQuaid & Lindsay, 2005). The broader definition changes the focus of
employability from securing initial employment, to ensuring life-long, meaningful and
relevant employment, enabled by the transferability of skills, rather than merely the
possession of skills (McQuaid & Lindsay, 2005). The broader definition also takes the sole
responsibility off of the individual, and places it additionally on the labour market and
government policy to ensure that the demand for relevant positions increases to meet the
supply of increasingly skilled graduates (McQuaid et al., 2005; McQuaid & Lindsay, 2005).
However, not all research has moved away from the narrow definition’s traditional
skills approach entirely. Researchers have attempted to add elements to the traditional skills
approach to account for the more complex nature of employability. For example, Hinchliffe
and Jolly (2011) explored the idea of graduate identity as a means of adding depth to the
narrow definition of graduate employability. The conceptual understanding of graduate
identity presented was offered in critique of the skills approach, which “cannot do justice to
the complexity of graduateness” (p. 564). Graduate identity included experience beyond
attributes alone, and included values, intellect, performance and engagement (Hinchliffe &
Jolly, 2011). In another attempt to engage with a broader definition of employability, whilst
building on the existing graduate attributes model, Bridgstock (2009) emphasised the
importance of career management skills, given the continuously changing labour market.
These skills allow individuals to adapt to task and role change within the fluctuating labour
market. Bridgstock (2009) expanded on the traditional model of graduate attributes for
employability, adding career management skills and career building skills to the traditional
employability skills, and further emphasised traits, dispositions, discipline specific skills,
generic skills, and self-management skills.
Current literature included research on how various aspects interact with or
influence the employability of graduates. A study conducted in the Netherlands by Batistic
and Tymon (2017) examined the relationship between networking behaviour and perceived
employability, identifying that the relationship was an indirect one which was mediated by
access to resources. The study conceptualised employability as being the result of interactive
relationships with various contextual factors, and thus drew on a more complex definition of
employability.

13
Much research on employability has been conducted internationally, but little has
been operationalised in the South African context. Goodman and Tredway (2016) drew on
international research, which identified volunteering as contributing to employability, and
examined the contribution that volunteering had on employability with a South African
sample. The social motivation for volunteering was identified as a predictor of perceived
internal employability, suggesting that it may equip students with relevant competencies,
preparing them for the work place (Goodman & Tredway, 2016). The study appeared to focus
on skills acquisition yet identified settings aside from the higher education institution as the
context of skills development. The study thus supported a broader definition of
employability.
Another South African study by Kaburise (2016) highlighted the importance of
improving ‘soft skills’, in particular communication ability, in order to improve
employability. The study focused on up-skilling in order to improve employability,
suggesting a narrow definition of the concept, yet it also recommended that the responsibility
of improving these skills rests not only with the individual, should be a “cooperative venture
involving all the stakeholders in education – students, parents, higher education institutions,
business and government” (Kaburise, 2016, p. 87). It thus appears that the study utilised a
broader conceptual understanding of employability.
Another aspect which may improve employability, or the ability to market oneself, is
engagement with employers, for example through work experience (Tomlinson, 2017). Work
experience acts as a bridge between higher education training and the labour market,
facilitating the development of professional identity, which is typically developed in more
applied training (Dahlgren, Handal, Szkudlarek, & Bayer, 2008). In addition to work
experience, continuous learning may increase long term employability, both in terms of
personal development and professional development (McQuaid & Lindsay, 2005).
Engagement with continued professional development training may assist in maintaining
relevance to the workplace, yet access to such networks was identified as a significant barrier
to these benefits by Broad (2015) and Parekh (2015).
Griesel and Parker (2009) examined employers’ perspectives of the quality of
undergraduates, based on the attributes they considered important and expected of graduates
upon entering the workplace, as well as the degree to which South African higher education
graduates demonstrated these attributes. The study identified the importance of transferable
skills, as well as aspects that go beyond key skills, including skilful practices, specialised

14
knowledge, personal identity and metacognition (Griesel & Parker, 2009). The study focused
on the employability skills and attributes of graduates and acknowledged that employability
may include factors beyond skills. The measurement of graduate attributes and skills has
remained a key focus in higher education research, despite the theoretical development of the
broader conceptual understanding of employability.
2.4 Graduate attributes
‘Graduate attributes’ is a term that has been used to refer to the desired outcomes of
higher education as it relates to the skills or attributes that graduates could develop and
possess upon graduation, which aid in gaining employment (Barrie, 2006). The role of
graduate attributes has generally been agreed upon, yet there have been various different
conceptualisations of graduate attributes (Barrie, 2006; Bridgstock, 2009). There have been
varying lists of attributes or competencies developed by different stakeholders (universities,
employers, government), so there has been no clear list of universal or national graduate
attributes (Barrie, 2006; Bridgstock, 2009).
It has become important for institutions to investigate quality assurance, given the
recent shifts in higher education and the labour market towards a knowledge-economy and
the massification of higher education (Bridgstock, 2009; Ipate & Parvu, 2010). Graduate
attributes have been used as an indicator for the evaluation of the relevance of training or
employability of graduates, which in turn have been used as an indicator of institutional
success (Ipate & Parvu, 2010). The operationalisation and utilisation of graduate attributes in
research has been difficult to do, despite the identified need to measure and assess graduate
attributes.
Compiled lists of graduate attributes have often been used as components of research
concerning the abovementioned foci evaluating labour market relevance, employability or
marketability. Studies by Schomburg and Teichler (2006) and Egesah, Wahome, Langat, and
Wishtemi (2014) used the same list of graduate attributes three times, yet each time assessed
from a different vantage point. For example, (1) evaluating the perceived extent to which
these competencies were possessed at the time of graduation, (2) the perceived contribution
of the university to said competencies, and (3) the extent to which these competencies were
required or utilised in the workplace. These varying vantage points may highlight which
competencies the university contributed towards, and perhaps more importantly, which
competencies were developed outside of the university context (Tomlinson, 2017).

15
Hughes and Barrie (2010) highlighted four critiques of graduate attributes. Firstly, as
mentioned above, there have been various conceptualisations of graduate attributes, which
determined what was measured and how it was measured. Secondly, graduate attributes have
been noted to be context-dependent and are developed in the individual over many years.
Thirdly, they have been identified as a combination of dispositions, understanding, attributes,
and practices, making them more abstract in nature than quantifiable and measurable. Lastly,
graduate attributes may be linked to various institutional systems, which means that assessing
and comparing results becomes increasingly difficult. Despite this critique, graduate
attributes have been successfully incorporated into various forms of research in the higher
education field, particularly in research related to training relevance and graduate
employability.
An example of how graduate attributes have been incorporated into research may be
seen in the research conducted by Schomburg and Teichler (2006), the data of which was
used by Vaatstra and Vries (2007). The list of gradate attributes used included: cross-
disciplinary thinking; planning, co-ordinating and organising; problem-solving ability;
analytical competence; learning ability; working independently, and working in a team
(Vaatstra & Vries, 2007). The list of attributes or ‘competencies’ used by Vaatstra and Vries
(2007) was not exhaustive, but it included most of the key attributes identified by the three
studies reviewed by Ipate and Parvu (2010). Ipate and Parvu (2010) identified the following
common attributes: interpersonal skills, communication skills, decision-making skills,
information retrieval skills, leadership skills motivation, a positive attitude, strategic skills,
integrity, confidence, literacy, numeracy, analytical ability, team work ability, and the ability
to work independently.
Within the South African context, the Department of Education (DoE) laid out the
role of Higher Education as being one that promotes and develops social responsibility and
awareness, and which produces graduates with specific skills and competencies towards
lifelong learning (DoE, 1997). This list of skills included: critical and analytical skills,
problem-solving abilities, communication skills, the ability to deal with change and diversity,
and a tolerance of different worldviews and ideas. The South African Qualifications
Authority (SAQA) outlined that graduates should be able to engage in five ways (SAQA,
1998). First, graduates must be able to engage in responsible problem solving using critical
and creative thinking. Second, graduates must be able to work as part of a team. Third,
graduates must be able to collect, analyse, organise and critically evaluate information.
16
Fourth, graduates must use sciences and technology effectively and critically, showing
responsibility towards the environment and the health of others. Fifth, graduate must be able
to view the world as a related system, wherein problem-solving contexts are not isolated.
The exact wording used to define graduate attributes differs in the literature, yet
there are underlying commonalities that have been considered important across contexts. An
exhaustive list has not yet been possible to compile. The list of competencies used by
Schomburg and Teichler (2006), which has been applied across various European contexts,
may be considered as a good template from which to develop a context-relevant list of
graduate attributes for use in research, such as a graduate tracer study.
2.5 Graduate tracer studies
Graduate tracer studies have long been used to track the activities of graduates from
an educational institution (Mubuuke et al., 2014). The exact terminology used may differ by
context, including graduate destination surveys, alumni surveys and alumni research that may
be used interchangeably. There are subtle methodological differences between the terms and
how they have been applied. Graduate tracer studies may be utilised to inform curriculum
transformation and development, labour market depictions, institutional marketing, and to
inform educational and labour market policy (CHEC, 2013). Common foci of graduate tracer
studies included profiling graduate retention, throughput and transition; graduate
un/employment; the evaluation of educational experience; and the relevance of training to the
work place (Cabrera et al., 2003; CHEC, 2013; McGovren & Carr, 1989; Schomburg &
Teichler, 2006). The field of graduate tracer study research may be considered a sub-field
within higher education research. Given that this field has not been explored to a large extent
within the South African context, a discussion of how these studies have been conducted was
considered important to review from a literature standpoint. The review of literature on
graduate tracer studies further informed the methodological decisions laid out in the
methodology section.
2.5.1 Graduate tracer methodologies
In a review of methodologies used in graduate tracer studies by J. S. Senekal (2015),
graduate tracer studies typically used a survey design, due to the increased ability to access
larger portions of the population and aiding generalisability, reliability and validity of the
data (Mubuuke et al., 2014). It has been noted that further qualitative research, making use of
focus group discussions or in-depth interviews would be beneficial to complement the

17
findings from the surveys, to provide a richer understanding of the graduates’ subjective
experiences (Albertyn et al., 2008; CHEC, 2013; Mubuuke et al., 2014). Qualitative tracer
studies have been conducted, for example, the study by Lutwama and Kigongo-Bukenya
(2004), but the scale of these qualitative studies has been more limited than a survey design
allows for, resulting in a very limited snapshot of graduate experiences.
Longer term studies, conducted more than two years after graduation, have been
deemed to provide a more accurate view of employment destinations and career trends, while
shorter term studies, conducted within two years of graduation may be more suited for course
evaluation (McCowan & Wyganowska, 2008; Purcell & Elias, 2004). Many department-
specific studies, particularly in library and information related fields, have been conducted
with small samples sizes to address issues related to that specific field of study, allowing
greater depth in the snapshot of graduates than would be possible in a broader population
(Aina & Moahi, 1999; Lutwama & Kigongo-Bukenya, 2004).
Larger sample sizes have been noted to be more common in institution- or country-
wide graduate tracer studies, and were more prevalent in countries such as the United
Kingdom (UK), United States of America (USA) and Australia (J. S. Senekal, 2015). This
included a study by the Higher Education Statistics Agency (HESA) in the UK, which had a
sample of over 567 000 graduates from multiple universities, and focused on short-term
employment destinations (HESA, 2013). The sample was accessed through university
records. A study by the National Association of Colleges and Employers (NACE) in the USA
also focused on short-term employment destinations, with a sample of about 274 000
graduates from multiple universities (NACE, 2015). The sample was accessed through
university records, as well as career services, LinkedIn employment profiles, and verification
via professors or employers. Graduate Careers Australia has been responsible for
implementing regular, systematic graduate tracer studies, an example of which was the
Australian Graduate Survey 2013 which accessed a total of about 253 000 graduates from
multiple universities and included short-term employment trends as well as university
evaluation (Guthrie, 2014). The sample was accessed using university records, with the
survey conducted through various mediums, including in person, online and telephonically.
Smaller samples, usually focusing on a single department, were more common in
lower-income countries, and often involved a specific agenda, for example, the connection
between study and work relevance or the implications of policy changes (J. S. Senekal,
2015). For example, Aina and Moahi (1999) focused on graduates from the Department of

18
Library and Information Studies at the University of Botswana who were working in
Botswana, Lesotho and Swaziland. The study had a sample of 77, and utilised postal surveys.
Lutwama and Kigongo-Bukenya (2004) conducted focus groups with 60 selected graduates
from the East African School of Librarianship. Shongwe and Ocholla (2011) surveyed 40
graduates from the Library and Information Sciences programme at the University of
Zululand using postal surveys. Stilwell (2004) included 40 alumni from the Honours
programme in Information and Library Sciences at the University of Natal, using postal and
email methods. Lastly, Varalakshmi (2006) obtained 27 responses to postal questionnaires of
alumni graduates from the Department of Library and Information Sciences (LIS) at Andhra
University who were working in LIS centres or related fields. Apart from the field of library
and information related fields, Jaakkimainen, Schultz, Glazier, Abrahams, and Verma (2012)
included three cohorts of family medicine graduates from the University of Toronto, with
cohort sizes of 248-306, and utilised existing professional data.
Graduate tracer studies have been noted to have particularly low response rates
(Lambert & Miller, 2014). J. S. Senekal (2015), in a review of 18 graduate tracer studies,
reported that nine of these studies had response rates lower than 45%, six studies with
response rates higher than 46%. The remaining three either did not mention a response rate or
used qualitative methods. Higher response rates appeared to be associated with either small
sample sizes from a specific university department (under 1000), or very large sample sizes
across multiple universities (over 100 000), which indicated a potential link between funding
and access to population (J. S. Senekal, 2015). Response rates may range from 18% (Hayati
& Muchlish, 2013) to 90% (Varalakshmi, 2006). The reasons for variable response rates in
graduate tracer studies have not been consistently reported on (J. S. Senekal, 2015).
In general, quantitative graduate tracer studies used descriptive statistics for analysis,
occasionally included some basic comparisons and keyword searches where relevant (J. S.
Senekal, 2015). Inferential statistical analysis was included in some instances, yet was less
commonly utilised (J. S. Senekal, 2015). There was an indication that methods of analysis
may be linked to the size of the sampling frame and the response rate (J. S. Senekal, 2015).
Two examples of studies that utilised inferential statistics had samples of about
14 000, despite low response rates of between 15% and 18.5% respectively (Letseka et al.,
2010; North Carolina Status University, 2015). A South African study by Rogan, Reynolds,
du Plessis, Bally, and Whitfield (2015) included multiple institutions, with a sample of 4 927,
a response rate of 43%, and included descriptive and inferential statistical analysis. Two

19
studies with smaller samples of 857 and 354 respectively focused on single departments, had
response rates of 100% and 99.7% respectively and used descriptive and inferential statistical
analysis (Jaakkimainen et al., 2012; Lassey, Lassey, & Boamah, 2013). Statistical theory
requires a normally distributed sample, which is most likely to be representative of the
population, in order to conduct inferential statistical (Bless, Higson-Smith, & Sithole, 2013)
A normally distributed sample may be achieved by high response rates, as was the case with
the two smaller samples. Additionally, a normally distributed sample by be achieved by
accessing a large sample, despite low response rates, to increase the odds of randomised
representation. Graduate tracer studies commonly have low response rates, and as such,
greater samples sizes would be required in order to conduct inferential analysis of the results.
As a result, the inclusion of inferential analysis has not been common to graduate tracer
studies, and therefore the results have often been descriptive in nature, including some basic
comparisons and keyword searches where appropriate.
2.5.2 Graduate tracer study instruments
As mentioned, measuring graduate attributes has been identified as being
particularly difficult, and so an existing list of ‘universal’ attributes that have been used in
multiple contexts may provide a good template for adaption to the research setting of interest.
An example of a system of measuring ‘universal’ attributes may be seen in the extensive
work on graduate tracer study methodologies by Schomburg and the Centre for Research on
Higher Education at Work at the University of Kassel (Schomburg, 2003). One of the main
outputs of their work has been the ‘Standard Instrument’, outlined below, which has been
widely utilised and adapted, of which three adaptations were discussed below (Schomburg,
2003).
The “Standard Instrument for Graduates 1995 Master Questionnaire” was the
original instrument developed (Schomburg, 1995) and included questions relating to the
course of study; retrospective assessment of studies; job search after graduation; current
employment; job requirements and use of qualifications; assessment of employment; further
higher education; continuing education and training; socio-biographic data; and concluding
comments. It has been used in tracer studies in various countries in Europe, Latin America,
Africa and Asia; however, it was adapted to the relevant contexts, as recommended by
Schomburg (2003).
The Standard Instrument for Graduates has been adapted to various studies and
contexts, including the Association of African Universities 1996 study (Mugabushaka et al.,

20
2007) which was conducted in 10 African universities in Ghana, Kenya, Malawi, Nigeria,
Tanzania, and Uganda. The standard instrument was adapted for the CHEERS study, which
was conducted across 11 European countries (Austria, Czech Republic, Finland, France,
Germany, Italy, the Netherlands, Norway, Sweden, Spain and the United Kingdom) and
Japan (Schomburg & Teichler, 2006). Most recently, the UNITRACE 2010 study was
conducted, utilising an adaptation of the instrument, across eight countries, including
Ethiopia, Kenya, Costa Rica, Nicaragua, Guatemala, Indonesia, Vietnam and the Philippines
(Egesah et al., 2014). It is clear that this instrument has been successfully adapted and utilised
for various contexts; however, the Standard Instrument for Graduates has up to this point, not
been used in the South African context.
2.5.3 International and national trends in graduate tracer studies
Increased international concern regarding the issue of skills mismatch in tertiary
education graduates, informed by the attributes and employability of alumni has led to more
interest in the implementation of graduate tracer studies (De la Harpe et al., 2000; Holmes,
2013; Mason et al., 2009; Schwartz, 2014). A review of graduate tracer studies by J. S.
Senekal (2015) indicated that there has been a greater prevalence of regular and systematic
implementation of graduate tracer studies in the United Kingdom (HESA, 2013), the United
States of America (NACE, 2015), and in particular in Australia (Guthrie, 2014). Low
response rates were common, and may be due to the commonly raised issue of out-dated or
incomplete graduate records and contact details (Aina & Moahi, 1999; Cable, 2013; CHEC,
2013; Gotch, 2008; Hayati & Muchlish, 2013; Shongwe & Ocholla, 2011; Stilwell, 2004).
However, Du Toit et al. (2014) reported that there has been no recent attempt to
conduct a broad scale and comprehensive graduate tracer study in South Africa aside from
the CHEC (2013) study. The CHEC study was conducted in the Western Cape and surveyed
graduates from four of the main universities in the province, two years after their graduation
in 2010. The aim of the CHEC study was to identify employment destinations, using an
online survey, producing quantitative results that were analysed descriptively with basic
comparisons. The CHEC study was the first of its kind in South Africa, in terms of scope (Du
Toit et al., 2014) and aside from it, “graduate destination research [has been] highly
underdeveloped... and there [has been] no systematic attempt to understand graduate
pathways outside of a few sporadic institutionally-based surveys” (CHEC, 2013, p. 7).
Furthermore, CHEC (2013) identified that fewer graduate tracer studies have been conducted
at historically disadvantaged institutions in comparison to historically advantaged institutions
21
and attributed this to resource constrictions. The authors of the CHEC report further argued
that the minimal number and sporadic institutionally or departmentally based surveys were
due to funding and resource limitations in the South African context.
2.6 Gaps in the literature
Research on higher education, particularly alumni-based research, has been limited
in the South African context, compared to the vast international literature. Research within
higher education in South Africa has largely focused on the transition from secondary to
tertiary education (Cosser, 2009; Cosser & Nenweli, 2013; Setlalentoa, 2013), as opposed to
the transition from higher education into the world of work. The comparatively smaller field
of research on the transition from higher education to the workplace tends to be limited to
undergraduate populations (Griesel & Parker, 2009; Letseka et al., 2010), with relatively few
populations of postgraduate students. The identified lack of focus on postgraduate alumni in
higher education research in the South African context was highlighted by Albertyn et al.
(2008). Research involving the transition from higher education to the workplace has often
been limited to immediate, institutional programme assessment (CHEC, 2013). There has
also been relatively limited research on graduate employability or the long-term employment
trends in the South African context, despite the increased national and international interest in
improving graduate employability. Internationally, there has been relatively low
implementation of graduate tracer studies, despite the interest therein and proven utility
thereof. In the South African context, graduate tracer studies have been conducted
sporadically, and with notably less implementation in historically disadvantaged institutions
(CHEC, 2013).
Psychology graduates may be considered vulnerable in terms of retention,
throughput and accessing employment (Ahmed & Pillay, 2004; Kagee & O'Donovan, 2011;
Offord, 2016). The vulnerability of psychology graduates is of particular concern, given the
identified scarcity of psychological practitioners to service the mental health care needs of
South Africans (Cooper, 2014; Mashigo, 2017; A. L. Pillay & Kramers-Olen, 2014).
Additionally, psychology graduates from professional Masters programmes have not been the
focus of a tracer study, particularly not in the South African context. The present study
attempted to address these gaps, by surveying graduates with Masters degrees in clinical and
research psychology from a historically disadvantaged institution, focusing on their

22
employment and employability profiles, as well as an assessment of their university
experiences.
3 Theoretical Framework: Employability
It has been uncommon for graduate tracer studies to explicitly use a theoretical
framework. The study by De Guzman and De Castro (2008) was one of the few exceptions.
There have been various frameworks developed for studying employability, as mentioned in
the literature review. These frameworks are still largely based on the narrower definition of
employability, with few operationalising the broader definition of employability. The present
study used a conceptual framework of employability to inform the groupings of
employability skills in the study.
3.1 Broad model of employability (McQuaid & Lindsay, 2005)
A key focus of the model presented by McQuaid and Lindsay (2005) was that
employability, and by extension employment and unemployment, was neither solely due to
supply or demand factors, but was rather an interaction between both factors. The model took
the changing labour market, employer needs, customer perceptions and competition into
account, as the interaction of these aspects with the individual’s attributes and competencies
would determine relative and changing employability based on context (McQuaid & Lindsay,
2005). The framework was presented by grouping various influencing factors into three
groups: individual factors, personal circumstances and external factors. A tabularised
representation of these factors may be found in Table 1 below, summarised from McQuaid
and Lindsay (2005).
Table 1. Employability Framework Summary
Individual factors Personal circumstances External factors
Employability skills and
attributes
• Essential attributes
• Personal competencies
• Basic transferable skills
• Key transferable skills
• High level transferable skills
• Qualifications
• Work knowledge base
• Labour market attachment
Demographic characteristics
Health and well-being
Household circumstances
• Direct caring responsibilities
• Other family and caring
responsibilities
• Other household
circumstances
Work culture
Access to resources
• Access to transport
• Access to financial capital
• Access to social capital
Demand factors
• Labour market factors
• Macroeconomic factors
• Vacancy characteristics
• Recruitment factors
Enabling support factors
• Employment policy factors
• Other enabling policy
• factors

23
• Health
• Disability
Job seeking
Adaptability and mobility
3.1.1 Individual factors
The individual factors identified in the framework comprise of employability skills,
demographic characteristics, health, job seeking and adaptability. The employability skills
and attributes identified were comparable to the narrow definition of employability’s skills
and attributes. McQuaid and Lindsay (2005) broke these skills down into various types of
attributes, competencies and skills including: essential attributes (honesty and integrity,
responsibility), personal competencies (initiative), basic transferable skills (written and verbal
presentation), key transferable skills (problem-solving, team work, computer skills,
communication skills), high level transferable skills (continuous learning, job-specific skills),
qualifications (formal and job-specific), work knowledge base (work experience) and labour
market attachment (un/employment status and duration). These factors represented the supply
of graduates with these attributes into the labour market. However, the framework also
considered other individual factors, such as demographic characteristics and health, which
may mediate access to certain employment opportunities. Demographic factors interact with
the demand factors of employer preferences outlined under external factors. For example, the
Black Economic Empowerment (BEE) initiative, an enabling support factor, which aims to
ensure increased opportunity for previously disadvantaged populations in South Africa, may
increase access for certain population groups, and decrease access for others. It is therefore
the interaction of ability and demographics that determine one’s access to employment, and
therefore one’s employability. Another individual factor identified by McQuaid and Lindsay
(2005) was job seeking, including various methods utilised and the appropriateness and
efficiency of these methods. Job seeking interacts with how employers advertise positions,
which were outlined under external factors. The last individual factor was adaptability and
mobility, which determined the location in which one can work, and the type of job one can
hold, based on wage and time requirements. Again, the interaction between factors showed
that appropriate employment may be determined by location and remuneration, according to
one’s needs, despite the skills one possesses.
3.1.2 Personal circumstances
Personal circumstances considered the effect that household circumstances of an
individual have on his or her employability. For example, having dependent family members

24
for which one is responsible may limit the time one has for employment, or increase the
financial pressure to attain an appropriately paying job, sometimes at the expense of
furthering one’s education. Personal circumstances also consider the social support provided
by family, friends and the community in the pursuit of employment. Social support may
interact with one’s demographics, regardless of one’s ability, deterring the pursuit of
employment. For example, traditional cultural norms may suggest that females should remain
at home and care for the family and that males should pursue studies and/or employment.
Regardless of ability or interest, these cultural norms may affect un/employment and
therefore employability. Furthermore, one’s personal access to resources may affect
employability, in terms of access to transport, financial capital and social capital. Access to
recourses interacts with mobility to access the work place, family obligations and roles, and
social support given regarding pursuit of employment.
3.1.3 External factors
External factors were broken into two groups: demand factors and enabling support
factors. Demand factors consider the state of the labour market, in terms of demand for
certain skills and industry locations, as well as the influence of the local economy. Demand
factors also included what positions were available, including remuneration, work conditions
and type of work, recruitment strategies taken by employers, employer preferences, and
discrimination, which interacts with personal demographic characteristics. Enabling support
factors included policies in place to support access to employment, for example, the BEE
initiative mentioned above, as well as accessibility and affordability of public transport and
child care.
3.2 Application of framework
This model integrated both supply and demand factors which affect un/employment,
and thus employability, including individual factors, personal circumstances and external
factors, particularly noting that it was the interaction of these factors that determined the
enabling and deterring factors affecting each individual’s employability. The model was
considered appropriate for the present study, given the complex nature of un/employment in
the South African context. The model was used to inform the selection of the instrument, to
ensure that relevant scales and items were included to adequately address the various factors
presented in the model. The model was used in a nominal sense to formulate explanations of

25
the findings. The application of this model was spoken to in the relevant methodological and
discussion sections.
4 Methodology
4.1 Aim of the study
The aim of the study was to determine the employment patterns and the
employability profiles of alumni from structured professional psychology Masters
programmes.
4.2 Objectives of the study
1. To establish a demographic profile of the alumni
2. To determine the employment destinations of the alumni
3. To determine the perceived relevance of skills training to the working
environment
4. To determine the percentage of eligible graduates who have completed
registration as health professionals
5. To establish the alumni’s attitude towards their alma mater
4.3 Research question of the study
What are the employment patterns and the employability profiles of alumni from
structured professional psychology Masters programmes?
4.4 Research setting
After the end of Apartheid, many sectors of South African society were reviewed,
and transformation initiatives set in place to rectify systemic problems. One area of redress
was that of higher education. An initiative was undertaken to merge institutions, which
typically entailed smaller institutions being absorbed by larger institutions (Martin & Roodt,
2008). Changes in student enrolments, increasing in some institutions and decreasing in
others, compounded the existing financial strain these institutions were under (DoE, 1997;
Harman & Meek, 2002). Additionally, the need to address the racialised inequality present in
the higher education system was considered (Sehoole, 2005). There remained some

26
institutions that did not merge. The repercussions for these institutions were twofold: (1)
increased resource constriction for HDIs and (2) the lack of national demographic
representation at historically advantaged institutions (Martin & Roodt, 2008). HDI student
populations have been noted to be more aligned with the national targets for higher
education, with majority Black and Coloured students and attracting many first-generation
students from previously disadvantaged backgrounds, according to the Department of Higher
Education and Training (DHET, 2012).
A specific historically disadvantaged higher education institution was selected as the
research setting for the present study, due to its unique location as one of the few HDIs which
did not merge with another institution post-Apartheid, and its categorisation as a research-
intensive institution. The institution attracts more historically disadvantaged individuals and
first-generation students, thus being a key focus for investigating issues of retention,
throughput and transition for this key population. The present study focused on a single
department from within the selected higher education institution, which was in line with the
recommendation of J. S. Senekal (2015) for future tracer studies, in order to accommodate
both depth of study and financial viability.
The Psychology Department was selected from this institution, due to the scarcity of
registered psychological professionals (Cooper, 2014; Mashigo, 2017; A. L. Pillay &
Kramers-Olen, 2014). The scarcity of professionals, coupled with the identified vulnerability
of psychological graduates in terms of retention, throughput and accessing employment,
informed the choice of the Psychology Department for the present study (Ahmed & Pillay,
2004; Kagee & O'Donovan, 2011; Offord, 2016). Two structured Masters degrees orientated
towards professional registration, namely the Masters degree in clinical psychology and the
Masters of Arts in research psychology were selected.
The Masters degree in clinical psychology entails a year of fulltime structured
coursework and practicum, followed by a year of internship at an accredited site. The
completion of a mini-thesis is also required for graduation. Thereafter, registration with the
HPCSA as a clinical or counselling psychologist is possible (M. Smith, personal
communication, January 10, 2017). The Master of Arts in research psychology entails a
structured programme offered fulltime only, with one year of coursework, followed by one
year of internship in a research setting. A mini-thesis is also required for completion of the
degree. Thereafter, registration with the HPCSA as a research psychologist is possible (M.
Smith, personal communication, January 10, 2018). The average intake rates for both Masters

27
programmes are on average eight students per programme per academic year, with an average
of 85% completion per programme (M. Smith, personal communication, January 20, 2018).
4.5 Research design
A graduate tracer study method was selected for use in the present study, as it
facilitated the tracking of alumni after graduation (CHEC, 2013; Mubuuke et al., 2014).
Furthermore, the common purposes and foci of graduate tracer studies, namely employment
destinations, employability and evaluation of training, aligned with the objectives of the
present study (Cabrera et al., 2003; Schomburg & Teichler, 2006). A graduate tracer study
method also aligned with the employability framework presented by McQuaid and Lindsay
(2005), in terms of assessing and gathering information regarding individual factors, personal
circumstances and external factors. Graduate tracer study methodologies have been
successfully utilised in the South African higher education context, albeit to a limited extent
(Du Toit et al., 2014).
A survey design was used for the present study, in accordance with the most
commonly used design of graduate tracer studies (Mubuuke et al., 2014). The survey research
design has been identified as a multidisciplinary method, and has frequently been used within
social science research (Gideon, 2012). Surveys may be classified by their mode, population,
or information collected, and as such, there are many different ‘types’ of surveys (Stoop &
Harrison, 2012). The most notable characteristic of a survey is that only a sample of the
population is studied, in order to generalise from a smaller group to the broader population
(Gideon, 2012; Stoop & Harrison, 2012).
The mode by which a survey may be administered to the sample has most often been
used to differentiate between survey ‘types’ (Stoop & Harrison, 2012). Surveys may be
conducted through an interview mode, either face-to-face or telephonically, or they may be
self-administered, usually delivered in the post or online, but may also be distributed in
person (Gideon, 2012; Stoop & Harrison, 2012). The present study used an online self-
administered mode to facilitate ease of access to more of the sampling frame (Azar, 2000).
The target population of the present study was alumni of two professional Masters
programmes, who were highly likely to have Internet access and online capabilities given
their postgraduate education level (Fricker & Schonlau, 2002). An online mode has the
benefit of being relatively fast and cheap, allowing participants to complete the survey when
it suits them, and with increased anonymity, as there was no direct contact between the

28
researcher and the participants (Robson, 2011). The online survey platform Survey Monkey
was used which further allows for confidentiality and anonymity to be ensured
(https://www.surveymonkey.com/mp/policy/anti-spam-policy/). Survey Monkey has been
used successfully by Masters level students for their theses, for example, J.-P. Senekal (2014)
and Nel (2016).
The time frame over which a survey may be conducted constitutes another
differentiating characteristic. The present study was cross-sectional, collecting data from the
sample at one point in time, with no intention of follow-up (Evans & Mathur, 2005). A cross-
sectional design was chosen as it provided a ‘snapshot’ of the current state of employment of
the alumni, and given that there was no intention for follow-up, and was cheaper to conduct
than a longitudinal study (Weisberg, 2005). Thus, the choice of a survey design in the present
study was consistent with the typical and frequent use of surveys in graduate tracer studies.
It is important to consider response rates in graduate tracer studies, as survey designs
and graduate tracer studies notably struggle with low response rates. Literature attributed the
lower response rates in graduate tracer studies to incomplete and inaccurate alumni contact
details as a common difficulty that in turn leads to undelivered contact appeals (Hayati &
Muchlish, 2013; Lambert & Miller, 2014). For survey research in general, Babbie (2011)
concluded that there has been no consensus on response rates for surveys and recommended
that a minimum response rate of 50% sufficed for data collection and generalisation. The
present study incorporated three strategies for increasing the response rate: (1) compiling as
complete a sampling frame as possible, (2) incentivising through a lottery to win book
vouchers, and (3) a schedule of repeated mailings and invitations until no change in response
rate resulted. A relatively complete sampling frame was compiled by collating the graduation
records, from the identified years and degrees. The sampling frame was then consolidated
against the existing records of alumni from the Psychology Department and supplemented by
the respondents. The incentives offered were in the form of three book vouchers. A lottery
process of those who had successfully completed the survey was conducted twice while the
survey was live, each time for R150 book vouchers, and with one final lottery for a grand
prize of a R500 book voucher once the survey had closed. A schedule of repeated mailings
involved reminding those who had started but not completed the survey as well as those who
had not started the survey. Reminders were sent weekly to respondents over the two months
that the survey was active, resulting in a total of eight reminders. The minimum number of

29
reminders was four, as new participants were invited throughout the first month that the
survey was active. ‘Thank you’ emails were sent to all participants that completed the survey.
4.6 Participants and sampling
The population of the present study included graduates from two structured
psychology Masters programmes, namely clinical and research psychology, at a historically
disadvantaged institution. Psychology graduates constitute a vulnerable group as they
undergo strenuous postgraduate selection processes, and as high attrition rates were
identified, many graduates may exit higher education without a profession (Richter et al.,
1998). Additionally, graduates with psychological degrees have been noted to pursue private
practice, thus having to create their own work rather than access existing positions (Cooper,
2014; NPC, 2011b). An inclusion criterion of graduation date was used, limiting the
population to those who graduated between 2008 and 2014. The time-frame was chosen
based on the recommendation by Purcell and Elias (2004) that a minimum of two years post-
graduation provides a clearer view of career movements and employment destination trends
compared to initial employment after graduation, which have rarely been a good indicator of
career trajectory. Based on public graduation records, which were incomplete for 2014, the
total population was estimated to be 113, made up of 58 clinical alumni and 55 research
alumni. This equates to approximately 9 graduates from each programme per year. The
sampling frame comprised of those alumni whose contact details could be obtained, based on
supplemented departmental records. These records proved to be difficult to confirm, despite
various efforts to attain as complete a sampling frame as possible, with a resultant sampling
frame of 51.33% of the population (58 of 113).
Stratified random sampling was used, with the two Masters programmes as the two
strata, ensuring that participants only fell into one stratum (Robson, 2011). Each of the
programmes was randomly sampled, proportionately reflecting the broader population,
aiming for a minimum of 30% of each stratum represented based on the average response rate
for online surveys (Dommeyer, Baum, Hanna, & Chapman, 2004; Nulty, 2008). The
advantage of using qualification to stratify allowed for greater representativeness of the two
qualifications resulting in a more representative sample of professional psychology Masters
graduates as a whole (Durrheim & Painter, 2006). The target sample size was set at a
minimum of 30% per stratum and 50% of the overall sampling frame. The target sample size
was based on the average response rates for surveys and the requirements for parametric

30
statistics (Babbie, 2011). The resultant sample size was 29, with 13 from the clinical
programme and 16 from the research programme. The sample size was below 50 cases,
which suggested that analyses should be cautiously conducted and referenced against z-
distributions that are more consistent with non-parametric statistics (Field, 2009).
4.6.1 Response rates
A total of 29 valid responses were received from both groups. This constituted a
50% response rate, from the initial 58 contactable alumni, which is higher than the average
response rates reported for surveys in general and graduate tracer studies in particular
(Babbie, 2011; Lambert & Miller, 2014; J. S. Senekal, 2015). Additionally, the 50% response
rate supported Babbie’s (2011) recommendations of robustness for analysis. The clinical
programme had 13 of a possible 29 responses, indicating a 44.83% response rate. The
research programme had 16 of a possible 55 responses, indicating a 55.17% response rate.
The response rates per stratum were higher than the targeted 30%, and the overall target of
50% was met. Without access to accurate registration and completion lists, it was difficult to
determine whether the sample was representative of the population. Given that the sample
was 50% of the sampling frame, which in turn was 51.33% of the population, a resultant
25.66% of the population was represented in the present study. The representation of the
population was high, particularly for a graduate tracer study; however, without more detailed
records of alumni, it was not possible to determine how representative the sample actually
was.
4.7 Instrument
The present study used the Standard Instrument for Graduates (Schomburg, 1995),
as adapted in the UNITRACE study (Egesah et al., 2014). The instrument additionally used
some of the item adaptation from the CHEERS study (Schomburg & Teichler, 2006) and the
AAU study (Mugabushaka et al., 2007). The various adaptations of the standard instrument
have been used extensively in multiple contexts and have been recommended for use with
student populations in developed and developing countries (Schomburg & Teichler, 2006), as
mentioned in the literature review. No existing psychometric properties were able to be
identified. The instrument was further adapted, as recommended by Schomburg (2003), to
ensure relevance to the South African context, and to the professional psychology
programmes. The author, H. Schomburg, granted permission to modify and use the
instrument in the present study (Appendix A).

31
The standard instrument covers the following topics: the course of study;
retrospective assessment of studies; job search after graduation; current employment; job
requirements and use of qualifications; assessment of employment; further higher education;
continuing education and training; socio-biographic data; and concluding comments. Sections
and items relevant to the employability framework were extracted and compiled into a draft
composite instrument. Basic editing for relevance to the South African context was
conducted, including wording and the use of standard tax income brackets. Thereafter, the
draft survey was loaded onto Survey Monkey. The draft instrument was tested by three
individuals, using both laptop and cell phone mediums, to ensure that both were feasible
modes of access. The instrument was edited for grammar and wording, as well as for
structure, with the removal of sections and items, based on refined relevance. The updated
instrument was tested by two individuals and subjected to final editing.
4.7.1 Final instrument
The final instrument was divided into seven sections labelled A to G. Section A
included the consent form, in which respondents were asked whether they agreed to
participate in the study. If the negative was selected, the respondent was taken to an exit
screen and they completed no more of the survey. If a positive answer was provided,
respondents continued to section B, which covered demographic information.
Section B of the survey contained eight questions regarding the demographic
characteristics of respondents. B1 asked about gender, with response options for female and
male, and an open response option for ‘Other’. B2 asked for year of birth, which was used to
calculate approximate age in 2017, as well as age at enrolment for and graduation from the
Masters programme in question. B3 asked for civil status, including the following response
options: married, divorced, single or unmarried, separated, with partner, widow(er) and an
open response option for ‘Other’. B4 asked for nationality, with response options including
South Africa, Namibian, Zimbabwean and an open response option for ‘Other’. B5 asked for
current area of current residence, with response options for South Africa and an open
response option for ‘Abroad’. B6 asked for province of current residence, if residing in South
Africa, including each of the nine South African provinces and a ‘not applicable’ response
option if the respondent was currently residing abroad. B7 and B8 asked about the education
level attained by respondents’ mother and father, including the following response options for
each parent: without education, incomplete primary school, complete primary school,
incomplete high school, complete high school, incomplete technical level, complete technical

32
level, incomplete higher education, complete higher education, incomplete postgraduate,
complete postgraduate, unknown, and an open response option for ‘Other’. B9 asked for
details about the highest degree level attained from the university in question, including
degree level, year started (registration), year completed (graduation), department/school and
major/specialisation. Response options for degree level included Bachelors, Honours,
Masters and Doctorate degree (PhD) (to identify and account for any out of scope
respondents), department or school included psychology or ‘Other’, and major or
specialisation included clinical, research, counselling and ‘Other’. The same group of
variables was obtained for the highest degree qualification, regardless of institution. The
degree level indicated was used to ascertain whether respondents had completed studies
beyond the Masters degree level at an institution other than the one in question.
Section C covered the relationship between study and work, in the form of five
scales and one follow up question. In section C, respondents were asked to rate the extent to
which they possessed a list of 25 competencies at the time of graduation (C1), the extent to
which the university contributed to these competencies (C2), and the extent to which these
competencies were utilised in their subsequent employment (C4). All three of these were
rated on five-point scales, anchored on the lower end with ‘not at all’ and on the upper end
‘to a very high extent’. In question C3, respondents were asked to rate the extent to which
their study programme at university had been a good basis for starting work, further learning
on the job, performing current work tasks, potential/future career(s), personal development
and the development of entrepreneurial skills. The question was rated on a five-point scale,
anchored on the lower end with ‘not at all’ and on the upper end by ‘to a very high extent’. In
question C5, respondents were asked to rate the extent to which their field of study related to
their area of work. The question used a five-point scale, anchored on the lower end by ‘not at
all’ and on the upper end by ‘to a very high extent’. A follow up question (C6) asked
respondents to indicate why they took up this work, if they felt that it was unrelated to their
training. Multiple response options were allowed, from the 12 provided, including an open
response option for ‘Other’. An option indicating that the respondent did consider their job
closely linked to their studies was also provided.
Section D assessed marketability and included three scales. In question D1,
respondents were asked about the methods that were useful in their search for employment.
Multiple response options were allowed, with 11 response options provided, as well as an
open response option for ‘Other’. In question D2, respondents were asked to rate the

33
importance of 12 aspects for increasing their marketability in the workplace. The question
was rated on a five-point scale anchored on the lower end by ‘not at all important’ and on the
upper end by ‘very important’. In question D3, respondents’ perceptions of continued
professional development (CPD) were assessed. Respondents were asked to indicate their
agreements with 15 statements, on a three-point scale, anchored on the lower end by
‘disagree’ and on the upper end by ‘agree’.
In section E, respondents were asked to provide information about their most recent
or current employment post-graduation. In question E1, they were asked what their current
dominant activity was, with the following response options: employed, self-employed, not
employed and seeking employment, professional training, advanced academic study, child
rearing or family care, and an open response option for ‘Other’. In question E2, respondents
reported on the field in which they work or have most recently worked. Response options
included basic education, higher education, early child development, policy, corporate, social
services, social development, health and an open response option for ‘Other’. In question E3,
respondents were asked to indicate the category into which their current or most recent
employer or institution fell, including the following response options: public, non-profit or
non-governmental, private, self-employed, and an open response option for ‘Other’. In
question E4, respondents were asked to indicate which tax income bracket their current
annual income fell. In question E5, respondents were asked to indicate the number of
positions they held before being appointed to their current position, excluding positions held
for less than six months, positions that were less than 50% part-time employment and
positions held prior to completion of most recent university training. In question E6,
respondents were asked to indicate their registration status with the HPCSA. Response
options included not eligible and not registered with the HPCSA; eligible, but not registered
with the HPCSA; and eligible and registered with the HPCSA. Thereafter in question E7,
respondents were asked to indicate which category of registration they were eligible for,
which included the following response options: “not applicable – I am not eligible for
registration with the HPCSA”, student, intern, community service, clinical, research,
counselling, and an open response option for ‘Other’.
Section F concerned a retrospective assessment of study at the university in
question, which contained two scales. In question F1, respondents were asked to rate 17
aspects of their university experience, on a five-point scale with end-labelling of ‘very bad’ at
the lower end and ‘very good’ at the upper end. A ‘not applicable’ option was provided as

34
well. In question F2, respondents were asked to rate the overall usefulness of their studies for
finding an adequate job after finishing studies, fulfilling present professional tasks, future
professional development or career, personality development, and the economic development
of their country. These were rated on a five-point scale, anchored on the lower end with 'not
at all useful’ and on the upper end with ‘very useful’.
Section G contained a single open-ended question in which respondents were asked
whether they had any further comments regarding the relationship between their study
programme and employment. The origin and adaptation of sections and items included in the
final instrument were described in Appendix B. The final instrument may be found in
Appendix C. Note that the formatting was slightly different than can be shown in text only, as
the use of the Survey Monkey functions allowed for alternative formatting.
4.7.2 Alignment with theoretical framework
The instrument was selected and adapted to ensure that it appropriately aligned with
the theoretical framework of the present study. The alignment between the questions in the
instrument and the factors outlined in McQuaid and Lindsay (2005) employability framework
was discussed below.
Individual factors. McQuaid and Lindsay (2005) identified five groupings of
employability skills and attributes, which included essential attributes, personal competences,
basic transferable skills, key transferable skills and high-level transferable skills. At least two
of the skills or attributes from the five groupings listed were included in the list of
competencies in the survey (C1, C2, and C4). The essential attributes included integrity and
responsibility. Personal competences included initiative and working independently and may
additionally include leadership skills and negotiation skills. Basic transferable skills included
the ability to write reports and documents and the ability to present ideas and information.
Key transferable skills included computer and internet skills, communication, problem
solving, project or programme management, team work, time management and critical
thinking. Additionally, analytical ability, learning ability, working under pressure, and
working with people from different cultures and backgrounds may be located as key
transferable skills. High-level transferable skills included the ability to continuously learn and
team work ability again. Research skills may also be included as high-level transferable
skills. As such, the competencies measured in the scales of the survey may be aligned to
McQuaid and Lindsay (2005) list of employability skills and attributes. Under the heading of
employability skills and attributes, McQuaid and Lindsay (2005) also identified

35
qualifications, work experience, and employment history. These factors align with the
question about level of education (B9) and details about current or most recent employment
(E1-3).
McQuaid and Lindsay (2005) included basic demographic attributes, such as age and
gender, under individual factors. These directly align with the demographic questions
included in the instrument, specifically gender (B1) and age (B2). Additional demographic
questions included were those of marital status (B3), nationality (B4) and current area of
residence (B5-6).
McQuaid and Lindsay (2005) identified various aspects under job seeking, including
ability to search for employment, awareness of networks available, ability to apply for and
interview for positions, awareness of labour market dimensions, and which jobs were
targeted. Not all of these aspects were addressed in the instrument. The ability of graduates to
access employment after graduation was assessed in C3 and F2. The types of methods
identified as useful in searching for employment were assessed in D1.
Adaptability and mobility were not explicitly investigated. However, it may be
explored under C6, which assessed reasons for pursing employment that appears unrelated to
the field of study. Options included locality, flexibility, and income, which align with
McQuaid and Lindsay (2005) definition of adaptability and mobility.
Personal circumstances. Household circumstances were not directly investigated
but may be indicated in various sections of the instrument. For example, C6 provided a
response option indicating family responsibilities as the reason for pursing work that was less
related to the field of study. The current dominant activity of respondents (E1) also included a
response option for child rearing and/or family care. These questions aligned with how
McQuaid and Lindsay (2005) defined family responsibility as being an influencing factors in
terms of employability.
Work culture was not explicitly investigated, as there were no items in the various
versions of the Standard Questionnaire that linked to this aspect. The question that may
provide some insight into existence of a supportive work culture was that regarding parental
educational level (B7-8). However, parental education level aligns more closely with social
capital, addressed under the next heading.
McQuaid and Lindsay (2005) identified various resources that could interact to
affect employability. Financial capital may be broadly assessed using the tax income brackets

36
investigated in E4. Social capital may be assessed using parental educational level (B7-8),
according to CHEC (2013) and Tomlinson (2017).
External factors. The focus of the present study was on the perspectives and
experiences of graduates. As such, the description of the external factors influencing
employability was limited, with the exception of where this could be extrapolated from
literature and the individual and personal factors explored above.
4.8 Procedure
The research project for the present study was assessed and approved by the Senate
Research Committee and the Senate Higher Degrees Committee of the University of the
Western Cape. Permission to conduct the survey was granted by the Registrar and Head of
Department. A list of postgraduate alumni from the structured clinical and research
psychology Masters programmes who graduated between 2008 and 2014 was compiled. The
sampling frame was compiled through the use of public graduation records, which were
consolidated against the department’s existing list of alumni, and further completed using
staff member’s personal contacts with alumni. In an attempt to ensure a complete sampling
frame, respondents were requested to provide any updated contact details that they had for
their classmates. The survey was administered through the online application, Survey
Monkey. Given the Protection of Private Information Act, a representative of the Psychology
Department sent out an invitation to those on the compiled list. The invitation included a brief
description of the study, and a link to the survey. It was clearly indicated that by clicking on
the link, the individual was agreeing to participate. Their right to withdraw at any time was
also clarified. Through the use of Survey Monkey, the researcher had no access to the
personal details of the participants. The application allowed for automated reminders to be
sent, without disclosing who these were being sent to. The application thus further protected
the anonymity of the participants and ensured that the Protection of Private Information Act
was not violated.
The survey went live on 29 March 2017, with the Psychology Department
representative sending invitations to the alumni in the sampling frame. Reminders were sent
once a week thereafter to those who had not responded to the invitation or had not completed
the survey, until there was no increase in response rates due to the reminders. Two incentives,
R150 book vouchers, were provided during the time that the survey was live, with the
announcement of the winners sent along with the reminders. A final email, in which the
37
grand prize winner of a R500 book voucher and the close of the survey were announced, was
sent on 18 May 2017. Thereafter, the survey was closed. The data was extracted and cleaned.
Incomplete responses and respondents who were out of scope in terms of degree level and
year of completion were excluded. The data was then analysed using the Statistical Package
for the Social Sciences (SPSS) version 24.
4.9 Data analysis
4.9.1 Internal consistency
Internal consistency has been used as a measure of reliability and is essentially the
extent to which a scale consistently measures a concept (Field, 2009). Internal consistency
may be measured using Cronbach’s Alpha, which ranges from no internal consistency (0) to
complete internal consistency (1). Cronbach’s Alpha may be affected by the number of items
in a scale; hence, the acceptable range of has been disputed. Alpha scores of about 0.70 have
generally been taken as an acceptable minimum for satisfactory internal consistency (Field,
2009). Tests for internal consistency were conducted for each scale included in the present
study, to determine the reliability of the various scales used.
4.9.2 Descriptive statistics
Descriptive statistics were used to give an overview of the data, through the use of
frequency distributions and measures of central tendency (Field, 2009). These results
provided the demographic, education and employment profiles of the respondents, as well as
descriptions of the relationship between study and work and attitudes towards the alma mater.
4.9.3 Chi-square
Chi-square statistic may be used to analyse categorical variables, using contingency
tables, comparing expected and actual frequencies (Field, 2009). Chi-square analysis is
intended for use to determine whether the model (expected frequencies) differs significantly
from the observed or actual frequencies. Two assumptions exist for the chi-square test:
independence of data and a minimum expected frequency of five for each category, with the
risk of decreased power, and thus the potential to miss a significant result if this is violated
(Field, 2009). The second assumption was not met for the attempted chi-square test, outlined
below. The question of interest was whether there was a significant difference between the
two Masters programmes, based on the reported HPCSA registration status. The variables of
interest were two categorical variables: HPCSA registration status (registered or not
registered) and Masters programme (clinical or research). The null hypothesis was that there

38
was no significant difference between these two variables, which would be shown by a non-
significant chi-square. The alternative hypothesis suggested that there was a connection
between these two variables, which would be shown by a significant chi-square. Chi-square
analysis was initiated using HPCSA registration status and Masters programme to test
whether these two variables were related. Table 1 below presented the cross-tabulation of
registration status by programme.
Table 2. Cross tabulation of HPCSA Registration Status and Masters Programme
Programme
Total Clinical Research
Registration
status
Not
registered
Count 1 6 7
Expected count 3.1 3.9 7.0
% within Registration status 14.3% 85.7% 100.0%
% within Programme 7.7% 37.5% 24.1%
% of Total 3.4% 20.7% 24.1%
Registered Count 12 10 22
Expected Count 9.9 12.1 22
% within Registration Status 54.5% 45.5% 100%
% within Programme 92.3% 62.5% 75.9%
% of Total 41.4% 34.5% 75.9%
Total Count 13 16 29
Expected Count 13 16 29
% within Registration Status 44.8% 55.2% 100%
% within Programme 100% 100% 100%
% of Total 44.8% 55.2% 100%
Table 1 showed that the expected count for those not registered in the clinical
programme was below five. A count below five in one of the categories indicated that
running a chi-square test may not show significant results, if they do exist, due to reduced
power and increased risk of type II error (Field, 2009). As such, the Chi-Square analysis was
not conducted, as the data did not support the analysis.
4.10 Ethics
Ethics clearance and project registration were obtained from the Senate Research
Committee at the University of the Western Cape in order to conduct the study (see Appendix
D). Permission to conduct the study using alumni from the specified university was requested
from and granted by the Registrar (Appendix E) and Head of Department.
An information sheet with a description of the study, its purpose, what participation
entailed and who to contact with any further queries or concerns was sent to each participant
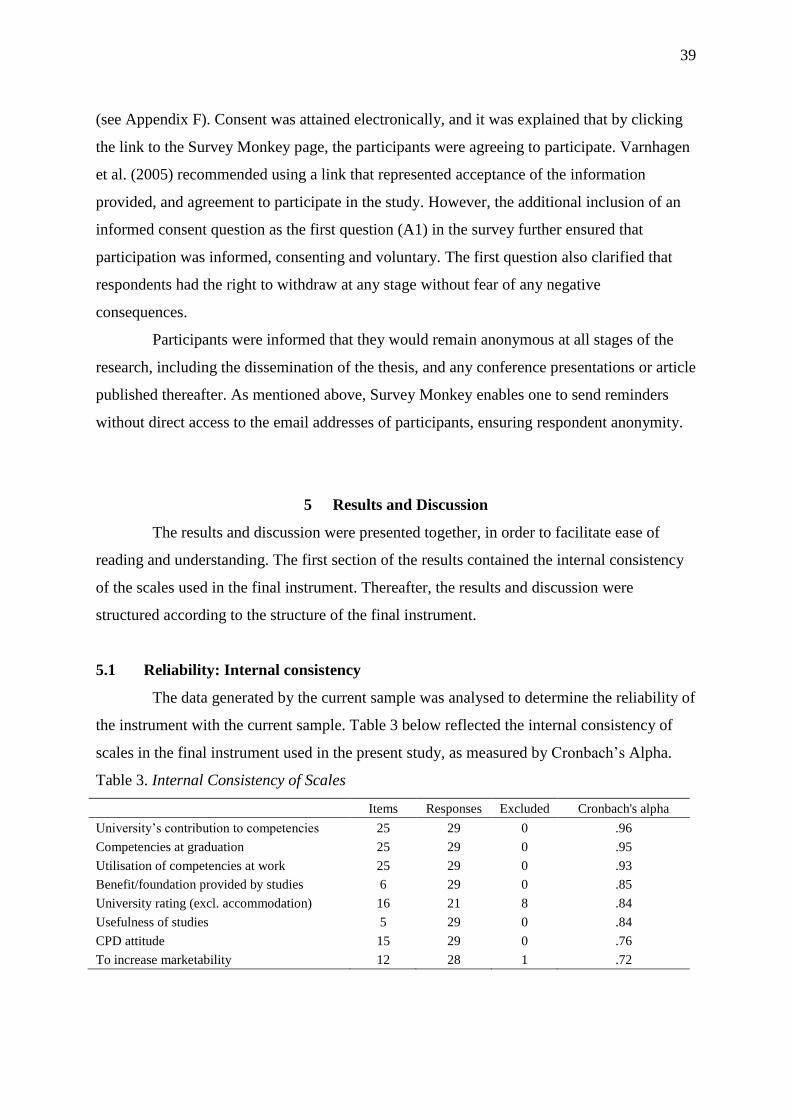
39
(see Appendix F). Consent was attained electronically, and it was explained that by clicking
the link to the Survey Monkey page, the participants were agreeing to participate. Varnhagen
et al. (2005) recommended using a link that represented acceptance of the information
provided, and agreement to participate in the study. However, the additional inclusion of an
informed consent question as the first question (A1) in the survey further ensured that
participation was informed, consenting and voluntary. The first question also clarified that
respondents had the right to withdraw at any stage without fear of any negative
consequences.
Participants were informed that they would remain anonymous at all stages of the
research, including the dissemination of the thesis, and any conference presentations or article
published thereafter. As mentioned above, Survey Monkey enables one to send reminders
without direct access to the email addresses of participants, ensuring respondent anonymity.
5 Results and Discussion
The results and discussion were presented together, in order to facilitate ease of
reading and understanding. The first section of the results contained the internal consistency
of the scales used in the final instrument. Thereafter, the results and discussion were
structured according to the structure of the final instrument.
5.1 Reliability: Internal consistency
The data generated by the current sample was analysed to determine the reliability of
the instrument with the current sample. Table 3 below reflected the internal consistency of
scales in the final instrument used in the present study, as measured by Cronbach’s Alpha.
Table 3. Internal Consistency of Scales
Items Responses Excluded Cronbach's alpha
University’s contribution to competencies 25 29 0 .96
Competencies at graduation 25 29 0 .95
Utilisation of competencies at work 25 29 0 .93
Benefit/foundation provided by studies 6 29 0 .85
University rating (excl. accommodation) 16 21 8 .84
Usefulness of studies 5 29 0 .84
CPD attitude 15 29 0 .76
To increase marketability 12 28 1 .72

40
As seen in Table 3, internal consistency scores above .70 were reported for all the
scales included in the questionnaire. These alpha values suggested that the measure was
reliable within the current sample (Field, 2009). These scales thus consistently measure their
underlying concepts. Cronbach Alphas above .90 were reported for the three scales
measuring competencies. These scores were very high and indicative of robust scales that
would be suitable for use in psychological research (Field, 2009). The marketability scale and
the CPD attitude scale reported the lowest internal consistency scores of .72 and .76
respectively. These two scales were adapted to a greater extent than the other scales for the
present study to suit the South African context and the discipline of psychology. The alpha
levels of these scales were still both above .70 and were deemed reliable in the sample. Thus,
the modifications to the scale did not impact the internal consistency adversely. It must be
noted that these revised scales should be examined more closely to increase their internal
consistency in future research.
The internal consistency of the scales indicated that the instrument was reliable for
the sample in the present study despite the small sample size. The internal consistency of the
scales may be an indication that the present instrument may be reliably used within the
population of psychology Masters graduates at the university in question.
5.2 Demographic results
The respondents provided demographic information concerning their gender, age,
civil status, nationality, current area of residence and parental education level. Table 4
outlines these demographic results, excluding age and parental education level. The findings
included subtotals per response option and were presented per programme for the alumni
from the clinical and research programmes.
Table 4. Demographics of Clinical and Research Respondents
Clinical (n=13) Research (n=16) Total (N=29)
Gender
Female 7 14 21
Male 5 2 7
Non-conforming 1 0 1
Civil status
Married 6 8 14
With partner 4 0 4
Single or unmarried 3 7 10
Separated 0 1 1
Nationality
South African 12 14 26
Zimbabwean 0 2 2
Namibian 1 0 1

41
Current residence
South Africa
Western Cape 10 14 24
Gauteng 1 1 2
KwaZulu-Natal 0 1 1
Abroad Namibia 1 0 1
Middle East 1 0 1
From Table 4, it was evident that both groups were predominantly female (nc=7,
nr=14). There were more male respondents from the clinical programme (nc=5) than the
research programme (nr=2). Ten of the clinical respondents were in a relationship, with six
married and four with a partner. The remaining three were single or unmarried. Half of the
research respondents were married (nr=8), seven were single or unmarried, and one was
separated. Most of the respondents in each group were South African citizens (nc=12, nr=14).
The remaining respondents were from the Southern African Development Community region
(SADEC). This included one Namibian from the clinical programme and two Zimbabweans
from the research programme. Most of the respondents were currently residing in the Western
Cape in South Africa (nc=10, nr=14).
The parental education levels of the respondents were tabularised and presented per
programme. Table 5 presented the parental education levels for the clinical and research
respondents. The unit of analysis was whether higher education training had been completed.
Table 5. Frequency Table of Parental Education Level for Clinical and Research
Respondents
Clinical
(n=13)
Research
(n=16)
Total
(N=29)
Maternal education level Less than complete higher education 7 10 17
Completed higher education or higher 6 6 12
Paternal education level Less than complete higher education 6 10 16
Completed higher education or higher 7 6 13
As shown in Table 5, about half of the mothers of the clinical respondents had not
completed higher education and had varying education levels below that (n=7). The
remaining mothers of the clinical respondents (n=6) had completed higher education or
postgraduate training. Similarly, six of the fathers of the clinical respondents had not
completed higher education training, with varying lower education levels. Seven of the
fathers of the clinical respondents had completed higher education training or postgraduate
training. For both the mothers and the fathers of the research respondents, ten each had not
completed higher education training, with varying lower education levels achieved. The
remaining six mothers and fathers had completed higher education training or postgraduate
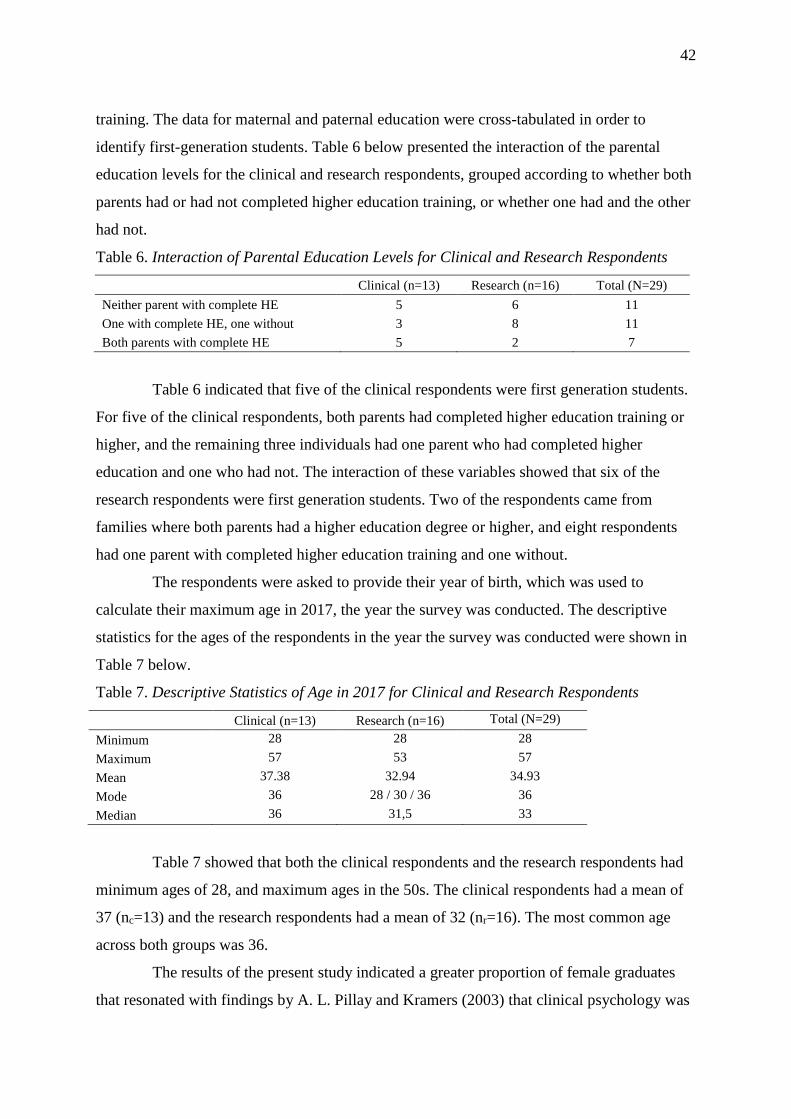
42
training. The data for maternal and paternal education were cross-tabulated in order to
identify first-generation students. Table 6 below presented the interaction of the parental
education levels for the clinical and research respondents, grouped according to whether both
parents had or had not completed higher education training, or whether one had and the other
had not.
Table 6. Interaction of Parental Education Levels for Clinical and Research Respondents
Clinical (n=13) Research (n=16) Total (N=29)
Neither parent with complete HE 5 6 11
One with complete HE, one without 3 8 11
Both parents with complete HE 5 2 7
Table 6 indicated that five of the clinical respondents were first generation students.
For five of the clinical respondents, both parents had completed higher education training or
higher, and the remaining three individuals had one parent who had completed higher
education and one who had not. The interaction of these variables showed that six of the
research respondents were first generation students. Two of the respondents came from
families where both parents had a higher education degree or higher, and eight respondents
had one parent with completed higher education training and one without.
The respondents were asked to provide their year of birth, which was used to
calculate their maximum age in 2017, the year the survey was conducted. The descriptive
statistics for the ages of the respondents in the year the survey was conducted were shown in
Table 7 below.
Table 7. Descriptive Statistics of Age in 2017 for Clinical and Research Respondents
Clinical (n=13) Research (n=16) Total (N=29)
Minimum 28 28 28
Maximum 57 53 57
Mean 37.38 32.94 34.93
Mode 36 28 / 30 / 36 36
Median 36 31,5 33
Table 7 showed that both the clinical respondents and the research respondents had
minimum ages of 28, and maximum ages in the 50s. The clinical respondents had a mean of
37 (nc=13) and the research respondents had a mean of 32 (nr=16). The most common age
across both groups was 36.
The results of the present study indicated a greater proportion of female graduates
that resonated with findings by A. L. Pillay and Kramers (2003) that clinical psychology was
43
characterised by a higher proportions of female students. The almost 60-40 female-male split
of the clinical respondents may indicate that there have been concerted efforts towards
improving the gender disparity in selection processes. However, it may indicate that male
clinical psychology graduates were more likely to respond to the survey. There was no
literature depicting the demographic profile of research psychologists, and as such, it was
unknown whether these results were representative of the present population. However, the
gender distribution of research respondents aligned with the identified predominance of
females of clinical psychologists, identified in the present study and in the literature.
Most of the respondents reported that their current residence was in the Western
Cape, which aligned with the location of the university where the Masters programmes were
offered. It was not known whether the respondents were clustered in the Western Cape due to
career prospects, personal or familial locality.
The education levels of the respondents’ parents indicated that there was a spread of
parental education levels, with about a third of each group being first generation students.
The substantial representation of first generation students suggested that parental education
alone did not necessarily determine the graduate potential of the next generation. The
representation of first-generation students with Masters level degrees, to come extent
disagreed with the comments by CHEC (2013) and Tomlinson (2017) of the corollary
relationship between potential educational achievement and parental education level, as a
proxy for previous disadvantage in terms of social capital. The present study suggested that
there was a fair representation of those from both previously advantaged and disadvantaged
backgrounds among the professionally skilled Masters graduates. The representation of
individuals from disadvantaged backgrounds may be explained by the HDI status of the
university in question, in that it draws a higher proportion of students from previously
disadvantaged backgrounds, compared to previously advantaged institutions (DHET, 2012).
As such, the current sample may be representative of the demographics of the specific
institution, and not of access to higher education in other South African institutions or
programmes. The potential lack of social capital, in terms of lower parental education level,
had not prevented the respondents in the current sample from accessing Masters degree
programmes and employment. However, there may have been other factors, for example,
other forms of social capital, at play which enabled these respondents to access professional
training and employment.

44
5.2.1 Education history
Respondents were asked to provide details about the highest degree level attained
from the university in question, including degree level, year started (registration), year
completed (graduation), department or school, and major or specialisation. The same group
of variables was obtained for the highest degree qualification, regardless of institution. All
respondents obtained professional Masters degrees from the identified institution in the
Department of Psychology. This qualification level additionally satisfied the inclusion
criteria. As mentioned before, the Masters programmes pursued included the clinical
psychology and research psychology programmes, with 13 respondents from the clinical
programme and 16 from the research programme.
For the majority of the sample, this Masters degree was the highest qualification
completed. Three respondents indicated that they completed a Doctoral degree at another
institution or in another department. One indicated that he/she was registered for a Doctoral
degree but had not yet completed it. The pursuit of post-Masters training was not explicitly
queried, and as such, cannot be commented on.
The year of registration for the respective Masters degree programmes indicated a
spread of respondents from every year between 2007 and 2013, as shown in Table 8 below.
The most represented year for the clinical respondents was 2011 (nc=3). The most
represented year for the research respondents was 2012 (nr=5).
Table 8. Frequency Table of Masters Registration Year for Clinical and Research
Respondents
Clinical (n=13) Research (n=16) Total (N=29)
2007 2 2 4
2008 1 3 4
2009 2 1 3
2010 1 2 3
2011 3 2 5
2012 2 5 7
2013 2 1 3
The year in which the respondents indicated that they graduated from their
respective Masters programmes indicated a spread from 2009 to 2014, as shown in Table 9
below. The most represented year for the clinical respondents was 2010 (nc=5). The most
represented group for the research respondents was 2013 (nr=7).

45
Table 9. Frequency Table of Masters Graduation Year for Clinical and Research
Respondents
Clinical (n=13) Research (n=16) Total (N=29)
2009 1 1 2
2010 5 5 10
2011 1 1 2
2012 1 1 2
2013 2 7 9
2014 3 1 4
The year of birth provided in the demographic section was used to calculate the age
of each respondent at the time that they registered for and graduated from their respective
Masters programmes. The descriptive statistics of the ages of respondents at registration and
graduation were shown in Table 10 below.
Table 10. Descriptive Statistics of Age at Registration and Graduation for Clinical and
Research Respondents
Clinical (n=13) Research (n=16) Total (N=29)
Age at M
registration
Minimum 24 22 22
Maximum 51 46 51
Mean 30.62 26.06 28.1
Mode 26 22 / 23 26
Median 28 23.5 26
Age at M
graduation
Minimum 25 23 23
Maximum 51 46 51
Mean 31.92 27.63 29.55
Mode 29 24 / 25 25
Median 29 25 28
Table 10 showed that the clinical respondents ranged from 24 years old to 51 years
old during the year of registration for their Masters programme, with a mean of 30.62
(nc=13), and the most common age being 26. By the time the clinical respondents graduated,
their age range was from 25 to 51 years old, with a mean of 31.92 and the most common age
being 29 years old.
During the year that they registered for their Masters programme, the research
respondents ranged from 22 years old to 46 years old, with a mean of 26.06 (nr=16) and a
joint equal most common age of 22 and 23 years old. The research respondents ranged from
23 to 46 years old during the year that they graduated from their Masters programme, with a
mean age of 27.63, and a joint most common age of 24 and 25 years old.

46
The age of enrolment ranged from early 20s to about 50 for both groups, indicating
that there was no set age for the pursuit of professional Masters degrees in psychology. The
most common age for the clinical respondents when they enrolled in their Masters
programme was 26, yet the mean was 30.62 and the median was 28. The distribution of ages
indicated that most of the students were in fact older than the most common age of 26.
Maturity has commonly been deemed an important selection criterion, particularly for the
clinical programme. However, maturity may not be determined by age alone. The age of
enrolment for the research respondents indicated an average lower enrolment age, as the
minimum, median and mode were between 22 and 24 years old. The distribution of ages
suggested that while the range of ages for the research respondents when they enrolled in
their Masters programme included a 46-year-old, most of the respondents were in their mid-
twenties. There has been no literature on the average ages of enrolment or graduation for
these specific Masters programmes nor for Masters programmes in general. The findings
suggested that age at graduation from these Masters programmes was lower than the average
of 34 years as of 2005 reported by CHE (2009). It may be that age at graduation has
decreased in the intervening years, or that the graduates from these Masters programmes were
younger than the general average age of Masters graduates reported in the CHE document.
The respondents reported the first year of registration and the year of graduation
which made it possible to calculate the years taken to complete the Masters programme. It
became apparent that some respondents indicated that they graduated in the same year that
they first registered for their Masters degree thus they took one academic year to complete
the degree. Upon reflection, it appeared that the question might have been ambiguous as
graduation at the identified institution typically takes place a few months after completion, in
the following academic year. Some participants may even graduate later if there are
outstanding fees. Thus, the item did not make a distinction between date of completion and
date of graduation. It was not possible to identify how respondents answered the question,
leaving these results vague, and were thus not further discussed. As of 2005, the average
years taken to complete a Masters degree was 2.9 years (CHE, 2009). It was not possible to
compare the two Masters programmes in question compare to the average time taken to
complete a Masters degree in 2005.
The years since graduation, according the year in which the study was conducted,
was calculated using the year of completion or graduation. This variable was included,
despite the potential different respondent interpretation, as it gives an indication of how long

47
the respondents have been in the workplace. The descriptive statistics for this calculated
variable was shown in Table 11 below.
Table 11. Descriptive Statistics of Years since Graduation for Clinical and Research
Respondents
Clinical (N=13) Research (N=16) Total (N=29)
Years since
graduation
Minimum 3 3 3
Maximum 8 8 8
Mean 5.46 5.31 5.38
Mode 7 4 7
Table 11 showed that the respondents from both programmes graduated between
three and eight years ago. The mean time since graduation for the clinical respondents was
5.46 years (nc=13), with a mode of 7 years ago. The mean time since graduation for the
research respondents was 5.31 years (nr=16), with a mode of 4 years. Overall, the mean time
between graduation from the respective Masters programmes and the year of the present
study being conducted was 5.38 years (N=29), with most of the respondents having graduated
7 years ago.
The respondents had spent between three and eight years in the work-place since
completing their Masters degrees. This affirms the inclusion criteria of respondents having
completed their Masters training a minimum of two years prior to completing the survey.
5.3 The relationship between study and work
5.3.1 Competencies at graduation
The responses provided by the respondents regarding the extent to which they
perceived that they possessed the listed competencies at the time of graduation were grouped
as low (1 and 2), neutral (3) and high (4 and 5) responses, to aid interpretation. The rank-
order of competencies for the clinical Masters programme was provided in Figure 1 below.

48
Figure 1. Frequencies of the clinical respondents’ perceived level of competencies at the time
of graduation
The results for the perceived level of competency of the clinical respondents at the
time of graduation, as shown in Figure 1 above, may be summarised in seven sets. The first
set was comprised of the highest ranked competencies. This set included the ability to learn
continuously, loyalty and integrity, responsibility and working independently These were
rated high by all but one of the clinical respondents (nc=12).
The second set of competencies were rated high by all but two of the clinical
respondents (nc=11). This set included computer skills, the ability to take initiative, working
with people from different cultures and backgrounds, and working under pressure. The third
cluster of skills was rated high by ten of the clinical respondents. This cluster included the
ability to learn and think analytically, internet skills, and time management. The fourth set of
skills was rated high by nine of the clinical group. This included the ability to write reports
and documents, problem-solve and communicate. This also included knowledge of clinical
psychology.
The fifth cluster of skills was rated high by eight of the clinical group. This included
general knowledge, the ability to present ideas and information, think critically and work as
0 1 2 3 4 5 6 7 8 9 10 11 12 13
Knowledge of other field(s) or discipline(s)Research skills
Project or programme managementLeadership
NegotiationTeam work ability
Critical thinkingAbility to present ideas and information
General knowledgeCommunication skills
Problem-solving abilityKnowledge of your field(s) or discipline(s)
Ability to write reports and documentsTime management
Learning abilityInternet skills
Analytical abilityWorking under pressure
Working with people from different cultures and…Initiative
Computer skillsWorking independently
ResponsibilityLoyalty and integrity
Ability to continuously learn
Low Neutral High
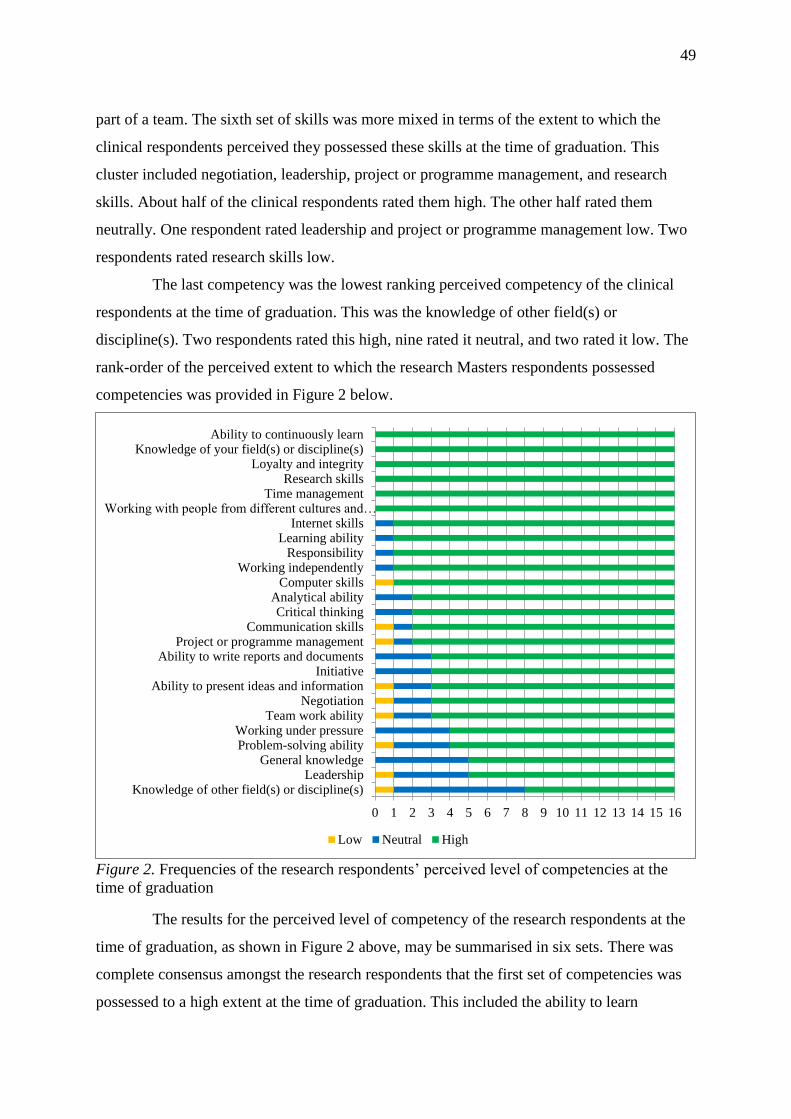
49
part of a team. The sixth set of skills was more mixed in terms of the extent to which the
clinical respondents perceived they possessed these skills at the time of graduation. This
cluster included negotiation, leadership, project or programme management, and research
skills. About half of the clinical respondents rated them high. The other half rated them
neutrally. One respondent rated leadership and project or programme management low. Two
respondents rated research skills low.
The last competency was the lowest ranking perceived competency of the clinical
respondents at the time of graduation. This was the knowledge of other field(s) or
discipline(s). Two respondents rated this high, nine rated it neutral, and two rated it low. The
rank-order of the perceived extent to which the research Masters respondents possessed
competencies was provided in Figure 2 below.
Figure 2. Frequencies of the research respondents’ perceived level of competencies at the
time of graduation
The results for the perceived level of competency of the research respondents at the
time of graduation, as shown in Figure 2 above, may be summarised in six sets. There was
complete consensus amongst the research respondents that the first set of competencies was
possessed to a high extent at the time of graduation. This included the ability to learn
0 1 2 3 4 5 6 7 8 9 10 11 12 13 14 15 16
Knowledge of other field(s) or discipline(s)Leadership
General knowledgeProblem-solving abilityWorking under pressure
Team work abilityNegotiation
Ability to present ideas and informationInitiative
Ability to write reports and documentsProject or programme management
Communication skillsCritical thinking
Analytical abilityComputer skills
Working independentlyResponsibility
Learning abilityInternet skills
Working with people from different cultures and…Time management
Research skillsLoyalty and integrity
Knowledge of your field(s) or discipline(s)Ability to continuously learn
Low Neutral High

50
continuously and to work with people from different cultures and backgrounds. This also
included knowledge of research psychology, research skills, time management, and loyalty
and integrity.
The second cluster of competencies were rated high by all but one of the research
respondents (nr=15). This included internet and computer skills, the ability to learn and work
independently, and responsibility. The third set of skills was rated high by fourteen of the
research respondents. This included the ability to think critically and analytically, to
communicate, and project or programme management skills. Thirteen of the research
respondents rated the fourth cluster of skills high. This included the ability to write reports
and documents, present ideas and information, to take initiative, to negotiate and to work as
part of a team.
The fifth set of competencies comprised of the ability to work under pressure, solve
problems, general knowledge and leadership. These competencies were rated high as follows:
the ability to work under pressure (nr=12), solve problems (nr=12), general knowledge
(nr=11) and leadership (nr=11). The last competency was the lowest ranking perceived
competency of the research respondents at the time of graduation. This was the knowledge of
other field(s) or discipline(s). Eight research respondents rated this high, seven rated it
neutrally and one rated it low.
According to the South African Department of Education, graduates should possess
the following skills upon completion of their higher education: critical and analytical skills,
problem-solving abilities, communication skills, the ability to deal with change and diversity,
and a tolerance of different worldviews and ideas (DoE, 1997). Most of the respondents rated
each of these variables a four or a five, indicating that they perceived that they possessed
these competencies to a positive extent at the time of graduation. One respondent from each
group felt that they did not possess communication skills at the time of graduation, one
clinical respondent felt that s/he was not competent in critical thinking at the time of
graduation, and one research respondent felt that they were not competent in problem-solving
at the time of graduation. There were one to four respondents across each group that provided
neutral responses for these competencies. However, there was an overall indication that,
according to the DoE, the graduates from the professional Masters programmes in
psychology at the institution possessed the relevant skills upon graduation.
The South African Qualifications Authority identifies responsibility, problem-
solving ability, critical thinking, team work and analytical ability, among others, as key

51
competences of graduates (SAQA, 1998). Again, most of the respondents from both
programmes perceived that they possessed these competencies to a positive extent at the time
of graduation. Two of the clinical respondents and one of the research respondents felt that
they were not competent in team work at the time of graduation. None of the respondents felt
that they were not competent in responsibility at the time of graduation. Only one respondent
from each programme provided neutral responses for responsibility at the time of graduation.
Overall, the results indicated that, according to the SAQA guidelines, graduates from these
two professional Masters programmes in psychology reportedly possessed the relevant skills
upon graduation.
5.3.2 University contribution to competencies
The responses provided by the respondents regarding the extent to which they
perceived the university contributed to the listed competencies were grouped as low (1 and
2), neutral (3) and high (4 and 5) responses, to aid interpretation. The results for the clinical
Masters respondents were shown in Figure 3 below.
Figure 3. Frequencies of the clinical respondents’ perceived contribution by the university to
competencies
0 1 2 3 4 5 6 7 8 9 10 11 12 13
Project or programme managementLeadership
Internet skillsComputer skills
Knowledge of other field(s) or discipline(s)Negotiation
General knowledgeLoyalty and integrity
InitiativeTeam work abilityTime management
ResponsibilityWorking with people from different cultures and…
Working independentlyProblem-solving abilityWorking under pressure
Research skillsAnalytical ability
Communication skillsLearning abilityCritical thinking
Ability to present ideas and informationAbility to continuously learn
Knowledge of your field(s) or discipline(s)Ability to write reports and documents
Low Neutral High

52
As shown in Figure 3, the results for the extent to which the clinical respondents
perceived the contribution made by the university to the listed competencies may be broken
into seven clusters. The first cluster of skills was comprised of the two highest ranked
competencies which the clinical respondents indicated their university contributed towards.
This included the ability to write reports and documents, and knowledge of clinical
psychology. All thirteen of the clinical respondents rated these competencies high.
The second cluster of skills were rated high by all but one of the clinical respondents
(nc=12). This included the ability to learn continuously, to present ideas and information, to
think critically, to learn and to communicate. Eleven of the clinical group rated the third
cluster of competencies high. This included the ability to think analytically, to problem solve,
and to work under pressure. This also included research skills. The fourth cluster of skills was
rated high by ten of the clinical respondents. This included the ability to work independently
and to work with people from different cultures and backgrounds. The fifth set of skills was
rated high by eight of the respondents. This included responsibility and time management
skills. Three respondents rated these neutrally and two rated these low.
The sixth set of skills was more mixed in the graduates’ perceptions of the extent to
which the university contributed to their competencies. These skills were rated high by about
half of the clinical respondents. This included the ability to work as part of a team (nc=7), to
take initiative (nc=7), to negotiate (nc=6), general knowledge (nc=6) and knowledge of other
field(s) or discipline(s) (n=5).
The seventh cluster contained the two lowest ranked competencies based on the
perception of the clinical respondents of the extent to which the university contributed
towards them. This included computer and internet skills, which were rated low by eight of
the clinical respondents. This also included leadership skills, which was rated low by three
respondents, neutrally by seven, and high by three. This lastly included project or programme
management skills, which was rated low by four respondents, neutrally by six and high by
three. The results for the perceived contribution by the university to the competencies for the
research Masters respondents were shown in Figure 4 below.

53
Figure 4. Frequencies of the research respondents’ perceived contribution by the university to
competencies
As shown in Figure 4, the results for the extent to which the clinical respondents
perceived the contribution made by the university to the competencies may be broken into
seven clusters. The first competency, research skills, was the highest ranked competency,
which was rated high by all but one of the respondents (nr=15).
The second cluster of skills was rated high by almost all of the research respondents,
as indicated. This included knowledge of research psychology (nr=14), the ability to think
analytically (nr=13) and the ability to work with people from different cultures and
backgrounds (nr=13). The third set of skills was ranked high by twelve of the research
respondents. This included the ability to present ideas and information, to think critically and
to work as part of a team. The fourth set of competencies was rated high by eleven of the
research respondents. This included the ability to write reports and documents, learn, and
communicate. This also included computer and internet skills.
The fifth cluster of skills was rated high by ten of the research respondents. This
included the ability to learn continuously, take initiative, solve problems and work
independently. This also included knowledge of other field(s) or discipline(s) and
0 1 2 3 4 5 6 7 8 9 10 11 12 13 14 15 16
NegotiationLeadership
Project or programme managementLoyalty and integrity
General knowledgeWorking under pressure
Time managementWorking independently
ResponsibilityProblem-solving ability
Knowledge of other field(s) or discipline(s)Initiative
Ability to continuously learnLearning ability
Internet skillsComputer skills
Communication skillsAbility to write reports and documents
Team work abilityCritical thinking
Ability to present ideas and informationWorking with people from different cultures and…
Analytical abilityKnowledge of your field(s) or discipline(s)
Research skills
Low Neutral High

54
responsibility. The sixth set of skills was rated high by eight or nine of the research
respondents, as indicated. This included time management (nr=9), general knowledge (nr=9),
the ability to work under pressure (nr=9), loyalty and integrity (nr=8) and project or
programme management (nr=8).
The seventh cluster contained the two lowest ranked competencies by the research
respondents, regarding the extent to which the university contributed towards them. This
included leadership and negotiation skills. Eight respondents rated these high. Eight
respondents rated leadership skills neutrally, and two rated it low. Six respondents rated
negotiation skills neutrally, and four rated this low.
Overall, both groups perceived that they possessed the listed competencies to a
higher extent at the time of graduation than the perceived extent to which the university
contributed towards them. This result supported the position that there is a gap between the
skills that graduates actually have upon graduation and ‘graduate skills’ gained through
university training, as posited by Tomlinson (2017). The identified gap in skills suggested
that while the university contributed positively to the development of many of the
competencies, there were other settings or factors that affected the development of these
competencies. If these competencies were not only developed in the university setting, the
results conflict with the narrow focus of employability, where the solution to unemployment
is to increase skills, being the responsibility of the individual in the higher education
institutions (McQuaid et al., 2005; Tomlinson, 2017). The support for a broader context
affecting skills development suggested a broader definition of employability, with the
interaction of various personal and contextual factors, with skills being developed in various
contexts, including the university (Griesel & Parker, 2009; McQuaid & Lindsay, 2005).
5.3.3 Preparatory capacity of degree programmes
Respondents rated the extent to which their Masters study programme at the
university had prepared them for starting work, further learning on the job, performing
current work tasks, potential or future career(s), personal development and the development
of entrepreneurial skills. These responses were grouped according to negative responses (1 or
2), neutral responses (3) and positive responses (4 or 5), to aid interpretation. The results for
the preparatory capacity of the clinical programme were shown in Table 12 below.

55
Table 12. Frequency Table of Preparatory Capacity for Clinical Respondents
Clinical (n=13) Negative Neutral Positive
Further learning on the job 0 1 12
Performing current work tasks 0 1 12
Personal development 0 1 12
Potential or future career(s) 1 0 12
Starting work 0 2 11
Development of entrepreneurial skills 8 2 3
Table 12 indicated that 12 of the 13 clinical respondents felt that the clinical
programme prepared them well for further learning on the job, for performing their current
work tasks, for their personal development and for their potential or future career. One
clinical respondent did not feel that the programme prepared them for their potential or future
career(s). One clinical respondent was neutral about the preparatory nature of the programme
for performing current work tasks, for further learning on the job and for personal
development. Most of the clinical respondents (nc=11) felt that their Masters training
prepared them well for starting work, but two respondents were neutral about this. Only three
respondents felt that the clinical programme facilitated the development of entrepreneurial
skills, and three were neutral to this. The remaining eight respondents felt that the clinical
programme did not facilitate the development of entrepreneurial skills. The results for the
preparatory capacity of research programme were shown in Table 13 below.
Table 13. Frequency Table of Preparatory Capacity for Research Respondents
Research (n=16) Negative Neutral Positive
Further learning on the job 0 2 14
Personal development 0 2 14
Performing current work tasks 1 2 13
Starting work 1 3 12
Potential or future career(s) 1 3 12
Development of entrepreneurial skills 3 10 3
As shown in Table 13, nearly all of the research respondents (nr=14) felt that their
Masters programme prepared them in terms of future learning on the job and their personal
development. The remaining two were neutral as to its contribution. Thirteen research
respondents felt that their research Masters prepared them well for performing their current
tasks, two were neutral about this, and one felt that he/she was not prepared. Similarly, 12
respondents felt that the research Masters programme prepared them well for starting work
and for their potential or future career, with three indicating a neutral response, and one a
negative response. Three of the research respondents felt that their Masters training had

56
developed their entrepreneurial skills, ten were neutral about this, and three felt that
entrepreneurial skills were not developed in the Masters programme.
Across both groups, the Masters programmes were considered good preparation for
starting work, and therefore may be considered as allowing appropriate access to the
workplace. The preparatory nature of the Masters programmes was not just employment
focused, but also allowed for personal development. This result indicated that these degree
programmes were not only focused on skills development, but also facilitated personal
development. The importance of personal development aligns with the identified importance
of personal identity for the transition into the workplace (Griesel & Parker, 2009). The
programme not only prepared them for immediate employment, but for future learning and
career(s) as well. The positively identified preparatory capacity of the Masters programmes in
terms of further learning on the job and potential or future career(s), and therefore
transferability of skills, aligned with the identified importance of transferability of skills and
skilful practices for graduates entering the workplace (Griesel & Parker, 2009). Both groups
generally felt that their studies prepared them well for their current work tasks, which
indicated positive programme relevance to the workplace. An identified gap for both groups
was that their studies did not sufficiently prepare them in terms of the development of
entrepreneurial skills. One of the clinical respondents expressed the following sentiment, “the
study program offered no input on business management or creating self-employment. This
should be integral to any profession that may lead to self-employment”. This sentiment is
underscored by the results on employment that indicated that three of the 13 clinical
respondents (23%) were self-employed, as discussed under section 5.5.1.
5.3.4 Utilisation of competencies in subsequent employment
The responses provided by the respondents regarding the extent to which they
perceived the listed competencies were utilised in their subsequent employment were
grouped as low (1 and 2), neutral (3) and high (4 and 5) responses, to aid interpretation. The
results for the clinical respondents were provided in Figure 5 below.
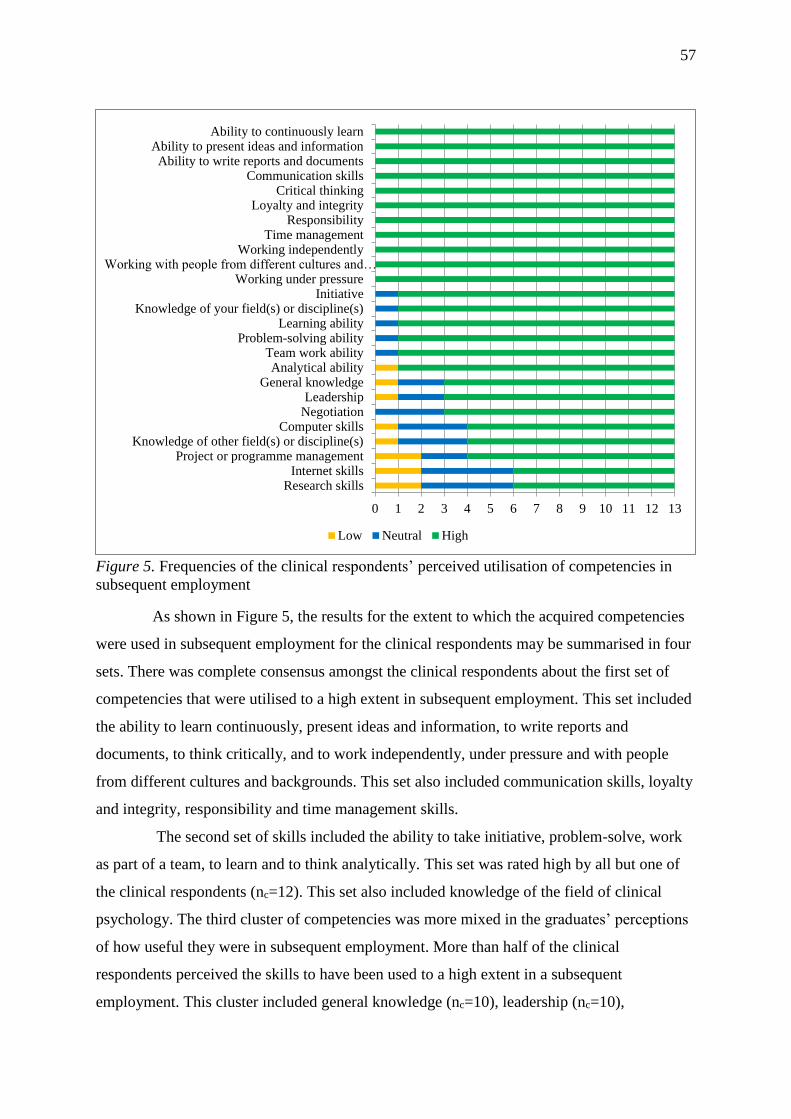
57
Figure 5. Frequencies of the clinical respondents’ perceived utilisation of competencies in
subsequent employment
As shown in Figure 5, the results for the extent to which the acquired competencies
were used in subsequent employment for the clinical respondents may be summarised in four
sets. There was complete consensus amongst the clinical respondents about the first set of
competencies that were utilised to a high extent in subsequent employment. This set included
the ability to learn continuously, present ideas and information, to write reports and
documents, to think critically, and to work independently, under pressure and with people
from different cultures and backgrounds. This set also included communication skills, loyalty
and integrity, responsibility and time management skills.
The second set of skills included the ability to take initiative, problem-solve, work
as part of a team, to learn and to think analytically. This set was rated high by all but one of
the clinical respondents (nc=12). This set also included knowledge of the field of clinical
psychology. The third cluster of competencies was more mixed in the graduates’ perceptions
of how useful they were in subsequent employment. More than half of the clinical
respondents perceived the skills to have been used to a high extent in a subsequent
employment. This cluster included general knowledge (nc=10), leadership (nc=10),
0 1 2 3 4 5 6 7 8 9 10 11 12 13
Research skillsInternet skills
Project or programme managementKnowledge of other field(s) or discipline(s)
Computer skillsNegotiationLeadership
General knowledgeAnalytical ability
Team work abilityProblem-solving ability
Learning abilityKnowledge of your field(s) or discipline(s)
InitiativeWorking under pressure
Working with people from different cultures and…Working independently
Time managementResponsibility
Loyalty and integrityCritical thinking
Communication skillsAbility to write reports and documents
Ability to present ideas and informationAbility to continuously learn
Low Neutral High

58
negotiation (nc=10), computer skills (nc=9), knowledge of other field(s) or discipline(s)
(nc=9) and project or programme management (nc=9). The remainder of the group rated these
skills as having been used to a lesser extent.
The fourth cluster included the lowest ranked skills in terms of the extent to which
the clinical respondents perceived them to be used in their subsequent employment. This set
included internet skills and research skills. Only seven of the clinical respondents reported
that they used internet and research skills to a high extent in their subsequent employment.
There were additionally four neutral and two low responses provided. The results for the
research respondents’ perceived utilisation of the listed competencies in their subsequent
employment were provided in Figure 6 below.
Figure 6. Frequencies of the research respondents’ perceived utilisation of competencies in
subsequent employment
As shown in Figure 6, the results for the extent to which the acquired competencies
were used in subsequent employment for the research respondents can be summarised in four
sets. All the research respondents (nr=16) indicated that their subsequent employment utilised
the first cluster of competencies to a high extent. This included the ability to present ideas
and information, to think analytically and critically, to learn and to work as part of a team.
0 1 2 3 4 5 6 7 8 9 10 11 12 13 14 15 16
Knowledge of other field(s) or discipline(s)Initiative
Loyalty and integrityLeadership
General knowledgeAbility to continuously learn
Computer skillsNegotiation
Working with people from different cultures and…Working under pressureWorking independently
Time managementResponsibility
Project or programme managementProblem-solving ability
Knowledge of your field(s) or discipline(s)Communication skills
Ability to write reports and documentsTeam work ability
Research skillsLearning ability
Internet skillsCritical thinking
Analytical abilityAbility to present ideas and information
Low Neutral High

59
This set also included internet skills and research skills. The second cluster of competencies
were ranked high by all but one respondent (nr=15). This included the ability to write reports
and documents, to solve problems, and to work independently, under pressure and with
people from other backgrounds. This set also included project or programme management
skills, responsibility, time management, negotiation and computer skills.
The third cluster of skills was rated high by all but a few of the research respondents,
as indicated. This included the ability to learn continuously (nr=14), to take initiative (nr=13),
general knowledge (nr=13), leadership skills (nr=13), and loyalty and integrity (nr=13). The
last and lowest ranked competency by the research respondents, in terms of the extent to
which it was used in subsequent employment, was the knowledge of other field(s) or
discipline(s). This was rated high by twelve respondents, neutrally by two, and low by two.
Overall, participants felt strongly that their competencies were utilised in their work.
This result suggested that despite the relative focus on certain skills during training, all of
these skills were utilised in the work place. In the previous section, respondents indicated that
their studies prepared them well for their current work tasks. If these work tasks were
utilising all of these skills, it follows that respondents were able to perform these tasks due to
their appropriate possession of these skills. The resultant ability to perform work tasks
supported the notion that these skills were honed and further developed in settings outside of
the higher education context, likely through work-experience and continuous professional
development (McQuaid et al., 2005; Tomlinson, 2017). The evidence of ongoing career skills
development highlighted the importance of on-the-job learning and continuous professional
development, in order to stay relevant to the field in which one works. This aligned with
research by Broad (2015) and Parekh (2015).
5.3.5 Relation of study to work
Respondents rated the extent to which their field of study related to their area of
work. Responses were grouped as low (1 and 2), neutral (3) and high (4 and 5), to aid
interpretation. Table 14 below reflected the frequencies for both the clinical and research
respondents.
Table 14. Frequency Table of Extent to which Field of Study Related to Field of Work for
Clinical and Research Respondents
Clinical (n=13) Research (n=16)
Low 0 0
Neutral 0 4
High 13 12

60
Table 14 indicated that all of the clinical respondents (nc=13) felt that their field of
study was closely related to their field of work. Twelve of the research respondents felt that
their work was closely related to their training. Four research respondents provided a neutral
response, indicating that they felt their work was less related to their training.
In response to a follow up question, respondents indicated why they took up the
work they were in, if they felt that it was unrelated to their training. One of the response
options provided allowed the differentiation between those who considered their job as
closely linked to their studies and those that did not. The results were shown in Table 15
below.
Table 15. Frequency Table of those who Consider their Job as Closely Linked to their Studies
for Clinical and Research Respondents
Clinical (n=13) Research (n=16)
Consider job closely linked to studies 13 12
Do not consider job closely linked to studies 0 4
As shown in Table 15, all thirteen of the clinical respondents again considered their
job to be closely linked to their studies, as did twelve of the research respondents. The
remaining four of the research respondents did not consider their job to be closely linked to
their studies. The reasons given by these four respondents were indicated in Table 16 below.
Table 16. Frequency Table of Reasons for Working in a Field that was Unrelated to Training
for the Research Respondents
Research
(n=16)
My current job allows me to take into account family needs 3
I have not (yet) been able to find a job more appropriate 2
I was promoted to a position less linked to my studies than my previous position(s) 2
I can get a higher income in my current job 2
My current job offers me more security 2
My current job provides the opportunity for part-time/flexible schedules, etc. 1
My current job enables me to work in a locality, which I prefer 1
In doing this job I have better career prospects 1
At the beginning of the career I envision, I have to accept work that is not/hardly linked to my
study 1
I prefer an occupation which is not closely connected to my studies 0
My current job is more interesting 0
As shown in Table 16, a variety of reasons were given by the four research
respondents for why they engaged in work that they felt was unrelated to training. Three of
61
the research respondents indicated that their current job allowed them the flexibility to
account for family responsibilities. A cluster of reasons were provided by two of the research
respondents each. The first reason was that they had not yet been able to find work that was
more closely linked to their studies. The second reason was that they were promoted to
positions that were less linked to their studies. The third reason was that the work, although
less related to their studies, provided greater earning potential. The fourth reason was that
their current work offered greater security than they had been able to have in work more
related to their studies. Additional reasons included the allowance for part-time or flexible
schedules, preferred locality, better career prospects, and that at the start of a career, work
less linked to study may be more acceptable.
What emerged from these results was that the reasons for working in a field
unrelated to the field of study were of a pragmatic nature. None of these four respondents
said that they preferred an occupation less connected to their studies or that they found their
current job more interesting as reasons for working in a field less closely connected to their
studies. The results showed that all of the clinical respondents felt that their studies were
closely related to their work, and while most of the research respondents agreed, four of the
research respondents did not. The reasons given for taking up work which they consider not
to be closely linked to their studies included practical factors, such as family needs, lack of
access to more appropriate work, promotion, higher income, job security and flexibility.
These aspects may be considered as factors that act as barriers to accessing work appropriate
to field of study, and supports the argument that employability goes beyond skills, but may be
the interaction of various personal and contextual factors (Griesel & Parker, 2009; McQuaid
& Lindsay, 2005). In additional comments by the research respondents, the scarcity of jobs in
the field of psychological research was mentioned, as well as the importance of skills that are
transferable to other fields. The scarcity of skills combined with skill transferability may be
an explanation for why some of the research respondents were employed in work that they
felt was not closely linked to their studies. However, the noted importance of skill
transferability does align with research by Griesel and Parker (2009).

62
5.4 Marketability
5.4.1 Employment search
Respondents were asked to indicate the methods that were useful in their search for
employment. The frequency distribution of which methods the respondents felt were useful
were shown in Table 17 below, grouped by Masters programme.
Table 17. Frequency Table of Types of Useful Employment Search Methods for Clinical and
Research Respondents
Clinical
(n=13)
Research
(n=16)
Total
(N=26)
Applying for an advertised vacancy 10 16 26
Contacting employers without knowing about a vacancy 6 4 10
Being approached by an employer 4 5 9
Enlisting the help of teaching staff at my institution of higher education 2 7 9
Establishing contacts while working during the course of study 5 4 9
Using other personal connections/contacts (e.g. parents, relatives, friends) 3 4 7
Starting my own business/self-employment 5 2 7
Launching advertisements by myself 3 0 3
Contacting a public employment agency 1 0 1
Contacting a commercial employment agency 0 0 0
Enlisting the help of the careers/placement office of my institution of higher
education 0 0 0
As shown in Table 17, almost all of the respondents (nc=10, nr=16) indicated that
applying for advertised vacancies was useful in their search for employment. A second
cluster of methods were helpful for searching for employment for a third of the respondents.
This included contracting employers without knowing about a vacancy (nc=6, nr=4), being
approached by an employer (nc=4, nr=5), enlisting the help of higher education staff (nc=2,
nr=7), and making use of contacts established while studying (nc=5, nr=4).
A third cluster of methods were considered useful for searching for employment by
about a quarter of the respondents. This included utilising personal connections (nc=3, nr=4)
and self-employment through starting a business (nc=5, nr=2). The fourth cluster of methods
was not considered useful by any of the research respondents. Two of these were considered
useful by a few of the clinical respondents, as indicated. This cluster included launching an
advertisement (nc=3, nr=0), utilising a public employment agency (nc=1, nr=0), utilising a
commercial employment agency (nc=0, nr=0), and utilising the careers office at their higher
education institution (nc=0, nr=0).
A variety of methods were considered useful for accessing employment. Applying
for advertised vacancies was considered useful by most of the respondents, which would

63
require knowledge of and access to these advertisements. Many of the methods used to search
for employment required some level of social capital or networking ability, for example,
making use of contacts, teaching staff and employment agencies. This supports the notion put
forward by CHEC (2013) and Tomlinson (2017) that job search methods may be considered
as an indication of social capital or networks that the graduate is able to utilise in order to
access employment. Self-employment was considered useful by more clinical respondents
(nc=5), which highlighted the importance of entrepreneurial skills, outlined under the
preparatory capacity of the Masters programmes in section 5.3.3. The importance of self-
employment was further highlighted in comments by some of the clinical and research
respondents, noting the importance of including an entrepreneurship module in the Masters
training. Relatively few respondents indicated that starting a business had been helpful in
their search for employment; however, this may have been due to insufficient skills or
support available to pursue this.
5.4.2 Increasing workplace marketability
Respondents rated the importance of 12 aspects for increasing their marketability in
the workplace. These responses were grouped as negative (1 or 2), neutral (3) and positive (4
or 5), to aid interpretation. The results were shown in Table 18 for the clinical Masters
programme.
Table 18. Frequency Table of Importance for Increasing Marketability in the Workplace for
Clinical Respondents
Clinical (n=13) Negative Neutral Positive
Field of study 0 0 13
Personality and interpersonal skills 0 1 12
Practical /work experience acquired during the course of study 0 2 11
English proficiency 1 2 10
Main subject/specialisation 1 3 9
Recommendations or references from third parties 2 2 9
Additional language proficiency 1 5 7
Practical /work experience acquired prior to course of study 4 3 6
Computer skills 3 5 5
Reputation of higher education institution 3 5 5
Academic results 5 4 4
Work experience abroad 10 2 1
Table 18 indicated that there were six clusters of aspects deemed variably important
for increasing marketability in the workplace. All the clinical respondents (nc=13) indicated
that their field of study was important for increasing their marketability in the workplace. A
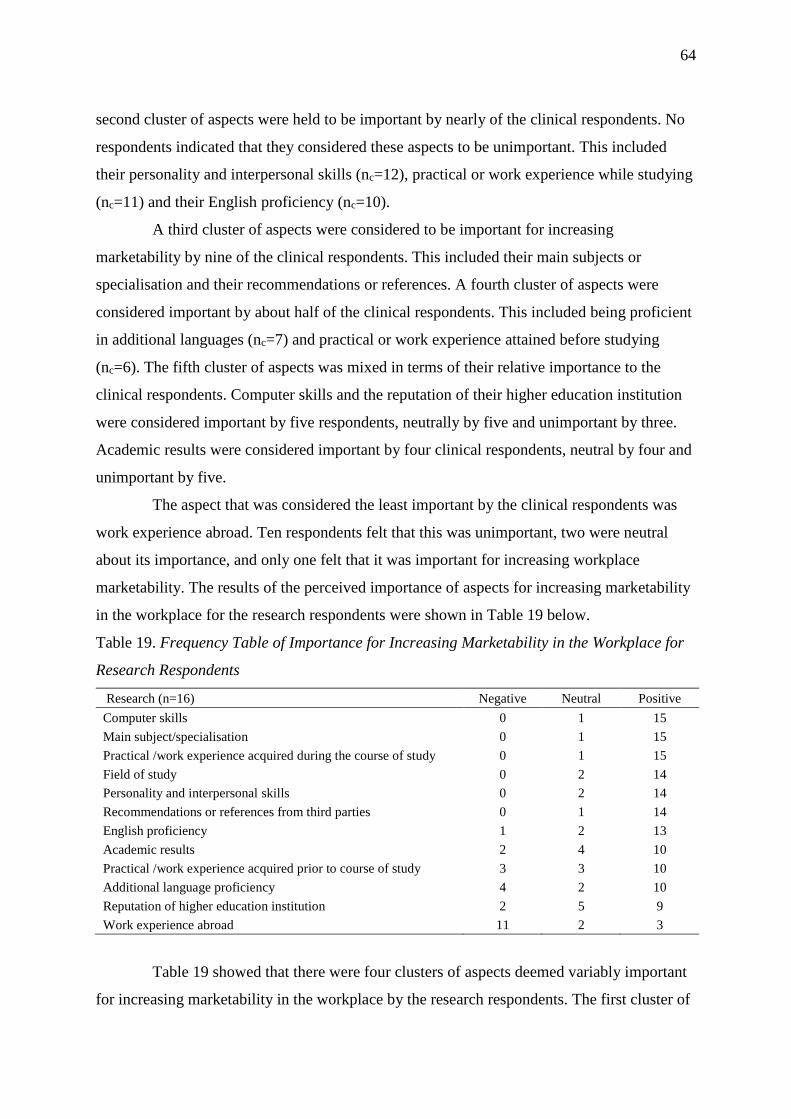
64
second cluster of aspects were held to be important by nearly of the clinical respondents. No
respondents indicated that they considered these aspects to be unimportant. This included
their personality and interpersonal skills (nc=12), practical or work experience while studying
(nc=11) and their English proficiency (nc=10).
A third cluster of aspects were considered to be important for increasing
marketability by nine of the clinical respondents. This included their main subjects or
specialisation and their recommendations or references. A fourth cluster of aspects were
considered important by about half of the clinical respondents. This included being proficient
in additional languages (nc=7) and practical or work experience attained before studying
(nc=6). The fifth cluster of aspects was mixed in terms of their relative importance to the
clinical respondents. Computer skills and the reputation of their higher education institution
were considered important by five respondents, neutrally by five and unimportant by three.
Academic results were considered important by four clinical respondents, neutral by four and
unimportant by five.
The aspect that was considered the least important by the clinical respondents was
work experience abroad. Ten respondents felt that this was unimportant, two were neutral
about its importance, and only one felt that it was important for increasing workplace
marketability. The results of the perceived importance of aspects for increasing marketability
in the workplace for the research respondents were shown in Table 19 below.
Table 19. Frequency Table of Importance for Increasing Marketability in the Workplace for
Research Respondents
Research (n=16) Negative Neutral Positive
Computer skills 0 1 15
Main subject/specialisation 0 1 15
Practical /work experience acquired during the course of study 0 1 15
Field of study 0 2 14
Personality and interpersonal skills 0 2 14
Recommendations or references from third parties 0 1 14
English proficiency 1 2 13
Academic results 2 4 10
Practical /work experience acquired prior to course of study 3 3 10
Additional language proficiency 4 2 10
Reputation of higher education institution 2 5 9
Work experience abroad 11 2 3
Table 19 showed that there were four clusters of aspects deemed variably important
for increasing marketability in the workplace by the research respondents. The first cluster of

65
aspects were deemed important by all but one of the research respondents (nr=15). This
included computer skills, main subject or specialisation, and work experience acquired while
studying. None of the respondents felt that these were unimportant for workplace
marketability.
A second cluster of aspects were considered important by all but two of the research
respondents, who were neutral about the importance (nr=14). This included their field of
study, their personality and interpersonal skills, and recommendations or references. The
third cluster of aspects was considered important by more than half of the respondents. This
included their English proficiency (nr=13), their academic results (nr=10), work experience
acquired before studying (nr=10), their proficiency in additional languages (nr=10), and the
reputation of their higher education institution (nr=9). There was at least one respondent who
considered each of these aspects to be unimportant for increasing workplace marketability.
The aspect which was considered the least important for increasing workplace
marketability by the research respondents, was work experience acquired abroad. Eleven
respondents felt it was unimportant, two were neutral about its importance, and three of the
research respondents felt it was important.
The majority of respondents from both programmes felt that practical work
experience acquired while studying was important for increasing their marketability. The
identified importance of work experience aligned with research by Tomlinson (2017) which
considered work experience as important for increasing one’s employability, as it allowed
access to employers, and thus social capital and networks. The importance of work
experience identified in the present study for increasing marketability also aligned with
research by Dahlgren et al. (2008), which identified the importance of work experience as the
bridge between higher education and the labour market, facilitating the development of a
professional identity through application of what had been learnt in the higher education
setting. The importance of work experience identified above may be considered to align with
the research by Goodman and Tredway (2016) which highlighted the importance of the
practical development of competencies during studies preparing them for the workplace and
thus increasing their marketability and employability. The importance of work experience
was further affirmed by the perceived importance of recommendations or references from
third parties. These may be attained through said work experience, and may be understood in
terms of social capital that highlighted the complex interaction of various factors influencing
employability. Furthermore, both groups felt that their personality and interpersonal skills

66
were important for increasing their marketability. The identified importance of personality
and interpersonal skills highlighted the broader definition of employability that goes beyond
skills, and included personal factors and personality (Griesel & Parker, 2009; McQuaid &
Lindsay, 2005).
5.4.3 Continued professional development
Respondents indicated their agreement with 15 statements regarding CPD. Table 20
below showed the results for the clinical respondents.
Table 20. Frequency Table of Agreement with Statements about Continued Professional
Development for Clinical Respondents
Clinical (n=13) Disagree Neutral Agree
Is important 0 0 13
Allows one to remain current in the field 0 1 12
Assists in maintaining levels of knowledge, skills and ethical attitudes 0 1 12
Assists in acquiring new and updated levels of knowledge, skills and
ethical attitudes 0 1 12
Complements work 0 1 12
Ultimately benefits the patient 0 2 11
Enhances and promotes professional integrity 0 3 10
Has been beneficial 0 3 10
Facilitates career improvement 1 2 10
Addressed perceived gaps in training 0 4 9
Facilitates developing professional connections 0 4 9
Has a measurable benefit for professional practice 1 4 8
Is expensive 1 6 6
Programmes or events are accessible 3 6 4
Takes up a lot of time 3 7 3
Table 20 showed that there were five clusters of statements about CPD activities
with regard to the level of agreement amongst the clinical respondents. There was consensus
among all of the clinical respondents (nc=13) that CPD was important. The second cluster of
statements were agreed upon by all but one of the clinical respondents (nc=12). This included
that CPD allowed one to remain current in the field of clinical psychology, that CPD
complemented their work, and that CPD assisted with maintaining and acquiring new and
updated knowledge, skills and ethical attitudes.
The third cluster of statements was also generally agreed upon by the clinical
respondents. This included that CPD ultimately benefits the patient (nc=11), that CDP
enhanced and promoted professional integrity (nc=10) and was beneficial and facilitated
career improvement (nc=10). A fourth cluster of statements were agreed upon by more than
half of the clinical respondents. Nine of the clinical respondents agreed that CPD has

67
addressed perceived gaps in training and facilitated the development of professional
connections, and four research respondents were neutral about this. Eight respondents agreed
that CPD had a measurable benefit for their professional practice, four were neutral about
this, and one disagreed. This related back to respondents reportedly being able to perform
skills adequately in the work environment that were not fully developed at the time of
graduation.
The fifth set of statements regarded the costs involved, the accessibility and time
commitment required of CPD activities. Six respondents agreed that CDP was expensive, six
were neutral about this, and one disagreed. Four clinical respondents agreed that CDP
programmes or events were accessible, six were neutral about this, and three disagreed. Three
clinical respondents agreed that CDP activities were time consuming, seven were neutral
about this, and three disagreed. Table 21 below showed the results for the research
respondents regarding the statements about CPD.
Table 21. Frequency Table of Agreement with Statements about Continued Professional
Development for Research Respondents
Research (n=16) Disagree Neutral Agree
Assists in maintaining levels of knowledge, skills and ethical attitudes 0 1 15
Assists in acquiring new and updated levels of knowledge, skills and
ethical attitudes 0 1 15
Allows one to remain current in the field 0 2 14
Facilitates career improvement 0 2 14
Is important 0 2 14
Enhances and promotes professional integrity 0 3 13
Facilitates developing professional connections 2 1 13
Complements work 0 4 12
Is expensive 1 3 12
Has a measurable benefit for professional practice 1 4 11
Has been beneficial 1 5 10
Addressed perceived gaps in training 0 7 9
Ultimately benefits the patient 2 5 9
Programmes or events are accessible 3 6 7
Takes up a lot of time 4 7 5
Table 21 showed that there were five clusters of statements with regard to the level
of agreement about CPD activities amongst the research respondents. The first cluster of
statements were agreed to by all but one of the research respondents (nr=15). This included
that CPD assisted in maintaining and acquiring new and updated knowledge, skills and
ethical attitudes, that CPD allowed them to remain current in their field, that CPD facilitated
career improvement and that CPD was important.

68
The second cluster of skills was agreed upon by many of the research respondents.
This included that CPD enhanced and promoted professional integrity (nr=12), facilitated the
development of professional connections (nr=13), complemented their work (nr=12) and was
expensive (nr=12). The third cluster of statements was agreed to by more than half of the
research respondents. This included that CDP had a measurable benefit for professional
practice (nr=11), had been beneficial (nr=10), had addressed perceived gaps in training (nr=9)
and ultimately benefitted the client (nr=9).
The fourth cluster of statements included the accessibility of CPD activities and the
time commitment involved. Seven of the research respondents agreed that CPD programmes
or events were accessible, six provided a neutral response, and three disagreed. Five of the
research respondents agreed that CPD activities were time-consuming, seven were neutral
and four disagreed.
Most of the respondents agreed about the importance of CPD activities. The
identified importance of CPD activities aligned with the identified importance of continuous
learning for increasing long term employability, both in terms of personal development and
professional development identified by McQuaid and Lindsay (2005). The focus on
professional development was shown in the results, as most of both groups agreed that CPD
was important for remaining current in the field, assisting in maintaining and acquiring new
knowledge, skills and attitudes, facilitating career improvement and developing professional
connections. Some of the respondents from both groups did not feel that CPD programmes or
activities were accessible. The potentially limited access to CPD activities aligned with
research by Broad (2015) and Parekh (2015), which identified the ability to access continued
professional development activities and networks as a barrier to the benefits of CPD.
5.5 Most recent or current employment
5.5.1 Dominant activity
Respondents provided information about their current dominant activity. The current
dominant activities of the respondents were presented in Table 22 below, grouped by Masters
programme and with subtotals per response option.

69
Table 22. Frequency Table of Current Dominant Activities of Clinical and Research
Respondents
Clinical (n=13) Research (n=16) Total (N=29)
Employed 10 11 21
Self-employed 3 0 3
Advanced academic study 0 2 2
Child rearing/ family care 0 1 1
Combination 0 1 1
Unemployed, seeking employment 0 1 1
Table 22 showed that the respondents from the clinical programme were all
employed. The dominant employment activity reported by the clinical respondents was
employment in organizations or businesses (nc=10), and three reported being self-employed
(nc=3). The distribution of current dominant activity in the research respondents spanned a
wider range of activities and indicated that not all of the research respondents were
employed. For example, one graduate reported being unemployed, but seeking employment
(nr=1). Two participants reported that they were engaged in advanced academic study (nr=2).
One reported that child rearing or family responsibilities was his or her dominant activity
(nr=1). Only one reported being engaged in a combination of employment, advanced
academic study and child rearing (nr=1). The largest number reported being employed in a
company or organization (nr=11).
It was notable that three of the clinical respondents and none of the research
respondents were currently self-employed. This was notable given the identified limited
preparation in terms of entrepreneurial skills identified by the respondents in section 5.3.3
and the comments by respondents identifying that business or entrepreneurial training should
be included in the Masters programme. It was also notable that three of the research
respondents and none of the clinical respondents were currently engaged in advanced
academic study. There was no literature commenting on the dominant activities of clinical or
research Masters graduates, and as such, whether these patterns were typical among the
broader population of psychological professionals cannot be commented on.
5.5.2 Field of work
Respondents reported on the field in which they work or have most recently worked.
The breakdown of each response option by Masters programme was shown in Table 23
below.

70
Table 23. Frequency Table of Field of Work for Clinical and Research Respondents
Clinical (n=13) Research (n=16) Total (N=29)
Health 8 2 10
Higher Education 1 6 7
Research 0 4 4
Policy 0 2 2
Early Childhood Development 1 0 1
Basic Education 1 0 1
Correctional Services 1 0 1
Social Services 1 0 1
Corporate 0 1 1
Social Development 0 1 1
Table 23 showed that alumni from the clinical programme were employed in clinical
service delivery, education and early childhood development in descending order. Within
clinical service delivery, eight reported working directly in health, which represented the
highest frequency overall. Two respondents reported working in correctional services (nc=1)
and social services (nc=1). Two respondents reported working in the field of education, one in
higher education (nc=1) and one in basic education (nc=1). One respondent reported working
in early childhood development (nc=1).
Alumni from the research programme reported working in a range of employment
contexts. The highest frequency was reported in higher education (nr=6). The second highest
frequency was reported in research (rn=4). Two respondents identified the field of research in
which they worked: one in human and social development research, and the other in market
research. Two respondents did not specify the area of research in which they were employed.
Two respondents reported being employed in health and two reported being employed in
policy. The remaining two respondents in the research respondents reported working in
corporate (nr=1) and social development (nr=1) respectively.
The results indicated that the graduates from these two professional programmes had
skills relevant for accessing a range of employment fields. The access to varied fields may be
considered as an indication that their skills were transferable to various fields. The
transferability of the respondents’ skills allowed them to access a variety of employers, thus
increasing their potential employability, which aligned with McQuaid and Lindsay’s (2005)
findings that transferability of skills was important for increasing long term employability. As
such, the broad range of fields these graduates were able to access indicated the
transferability of their skills and training, and thus their potential long-term employability.

71
5.5.3 Employment sector
Respondents indicated the category into which their current or most recent employer
or institution fell. The frequency of each employer category was shown in Table 24 below,
grouped by Masters programme and with subtotals per response option.
Table 24. Frequency Table of Employer Category for Clinical and Research Respondents
Clinical (n=13) Research (n=16) Total (N=29)
Public 8 9 17
Private 4 3 7
NGO 1 2 3
Parastatal 0 2 2
Table 24 showed that the highest frequency of all the respondents were employed in
the public sector (N=17). The split of those employed in the public sector was eight clinical
respondents and nine research respondents. Seven respondents were employed in the private
sector, including four from clinical and three from research. Three respondents reported that
they were employed in the NGO or non-profit sector, entailing one from the clinical subgroup
and two from the research subgroup. Two respondents from the research subgroup reported
working in parastatal organisations, and no clinical respondents worked in this sector.
There was the largest representation of clinical respondents in the public sector, with
eight of the thirteen clinical respondents reporting employment in the public sector. The
clustering of clinical psychologists in the public sector was in contrast to Cooper (2014) and
the Department of Health (2013) which identified that clinical psychologists were clustered in
the private sector. The public sector clustering may be explained as many of the respondents
were relatively early in their career, and as such may have had access to junior employment
positions in the public sector. It is possible that they may move towards private employment
later on in their careers. It was similarly possible that this cluster of clinical psychologists in
the public sector was only true for the cohort of graduates from the university in the present
study. The potentially unique clustering of the respondents in the public sector in the present
study may be due to the demographics of the individuals. Access to appropriate financial and
social capital, as well as years of experience, are important in order to set up a private
practice (DeAngelis, 2011). For the cohort in the present study, about a third of the clinical
respondents were first generation students. This indication of potential historical
disadvantage and resultant limitation of social networks and resources may have prevented
these graduates from setting up a private practice. As such, the private sector may not have
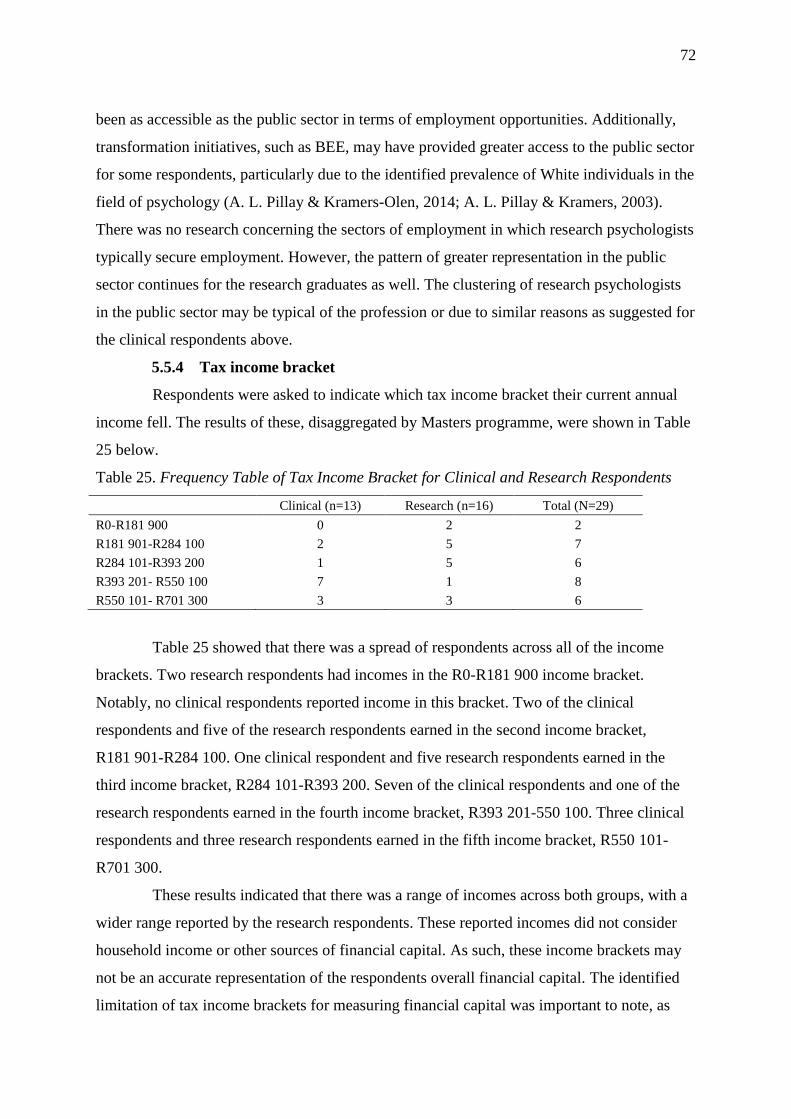
72
been as accessible as the public sector in terms of employment opportunities. Additionally,
transformation initiatives, such as BEE, may have provided greater access to the public sector
for some respondents, particularly due to the identified prevalence of White individuals in the
field of psychology (A. L. Pillay & Kramers-Olen, 2014; A. L. Pillay & Kramers, 2003).
There was no research concerning the sectors of employment in which research psychologists
typically secure employment. However, the pattern of greater representation in the public
sector continues for the research graduates as well. The clustering of research psychologists
in the public sector may be typical of the profession or due to similar reasons as suggested for
the clinical respondents above.
5.5.4 Tax income bracket
Respondents were asked to indicate which tax income bracket their current annual
income fell. The results of these, disaggregated by Masters programme, were shown in Table
25 below.
Table 25. Frequency Table of Tax Income Bracket for Clinical and Research Respondents
Clinical (n=13) Research (n=16) Total (N=29)
R0-R181 900 0 2 2
R181 901-R284 100 2 5 7
R284 101-R393 200 1 5 6
R393 201- R550 100 7 1 8
R550 101- R701 300 3 3 6
Table 25 showed that there was a spread of respondents across all of the income
brackets. Two research respondents had incomes in the R0-R181 900 income bracket.
Notably, no clinical respondents reported income in this bracket. Two of the clinical
respondents and five of the research respondents earned in the second income bracket,
R181 901-R284 100. One clinical respondent and five research respondents earned in the
third income bracket, R284 101-R393 200. Seven of the clinical respondents and one of the
research respondents earned in the fourth income bracket, R393 201-550 100. Three clinical
respondents and three research respondents earned in the fifth income bracket, R550 101-
R701 300.
These results indicated that there was a range of incomes across both groups, with a
wider range reported by the research respondents. These reported incomes did not consider
household income or other sources of financial capital. As such, these income brackets may
not be an accurate representation of the respondents overall financial capital. The identified
limitation of tax income brackets for measuring financial capital was important to note, as

73
according to McQuaid and Lindsay (2005), income may be considered an indication of
financial capital, which was one of the factors identified to influence employability. Due to
the range of incomes presented, it was likely that financial capital would affect the
respondents in different ways. This will be further discussed under section 7.2.2.
5.5.5 Employment positions
Respondents were asked to indicate the number of positions they held before being
appointed to their current position, excluding positions held for less than six months,
positions that were less than 50% part-time employment, and positions held prior to
completion of most recent university training. These results were presented by Masters
programme in Table 26 below.
Table 26. Frequency Table of Number of Positions Prior to Current or Most Recent Position
for Clinical and Research Respondents
Clinical (n=13) Research (n=16) Total (N=26)
0 positions 2 0 2
1 position 7 8 15
2 positions 3 4 7
3 positions 0 1 1
5 positions 0 1 1
7 positions 1 0 1
8 positions 0 1 1
15 positions 0 1 1
Table 26 showed that about half of the respondents from each programme were in
their second employment position, after graduation from their most recent university training
(nc=7, nr=8). Two of the clinical graduates were still employed in their first position since
graduation from their most recent university training. The remaining clinical respondent held
seven positions since graduation. The remaining four research respondents held three, five,
eight and fifteen positions respectively since they graduated with their Masters degrees.
The respondents graduated between three and eight years ago. About half of the
respondents were only in their second employment position after graduation, and two from
the clinical respondents were still in their first employment position. The prevalence of
individuals who had not held many positions since graduation may indicate that they were
able to secure longer-term contracts. There were graduates who held more than five positions,
and one who held fifteen positions. This possibly indicated a greater proportion of short-term
or contract-based employment. The prevalence of individuals who held multiple positions
since graduation may be explained by concurrent contracts, as it was specified that this

74
included positions that were at least 50% part-time. What was unclear was whether these
patterns would persist as their careers progressed. The literature cautioned that immediate or
short-term employment destinations may not be indicative of longer term employment trends
(McCowan & Wyganowska, 2008; Purcell & Elias, 2004). Thus, the results in the present
study were cautiously interpreted and it was observed that many graduates held part-time or
contractual employment concurrently and/or sequentially.
5.5.6 Professional registration
Respondents were asked to indicate their registration status with the HPCSA and
thereafter to indicate which category of registration for which they were eligible. The
interaction of registration status and registration category was shown in Table 27 below.
Table 27. Frequency Table of HPCSA Registration Status for Clinical and Research
Respondents
HPCSA
status Eligible and registered
Eligible, not
registered
Not eligible, not
registered
Category Clinical Research Research &
counsellor Psychometry Clinical Research
Clinical
(n=13) 12 0 0 0 1 0 0
Research
(n=16) 0 6 3 1 0 5 1
Table 27 showed that there were a variety of HPCSA registration statuses and
categories of registrations. All but one of the clinical respondents were eligible for
registration with the HPCSA and registered as Clinical Psychologists. The remaining clinical
respondent was eligible for registration as a Clinical Psychologist, but was not registered.
There was more variation in registration status and category among the research
respondents. Ten research respondents were eligible and registered with the HPCSA, with
varying registrations. Six of these ten were registered as Research Psychologists, three held
dual registrations as Research Psychologists and Counsellors. One was registered as a
Psychometrist. There were five research respondents who were eligible for registration with
the HPCSA as Research Psychologists but were not registered. One research respondent was
not eligible for registration with the HPCSA, and therefore was not registered.
Those who were eligible for registration with the HPCSA had met the requirements,
for example, completed an internship as an accredited internship site and thereafter had
passed the appropriate HPCSA board exam. It was noted that registration must be completed
within a certain timeframe, and must be maintained annually. As such, it was possible that the

75
time in which individuals could register had lapsed, due to time after completion, and
therefore they were not registered. Alternatively, it may be that their registration lapsed, and
therefore they were no longer registered. As such, the data provided was related to current
registration, not past registration or potential future registration. The individual who was not
eligible for registration had likely not completed an accredited internship or had not passed
the board exam. All of the clinical respondents who currently resided in South Africa were
registered with the HPCSA. The individual who was not registered, despite being eligible,
was currently residing outside of South Africa. Professional registration outside of South
Africa was not investigated, but may be relevant for those graduates who reside and/or work
abroad.
There was no literature as to the nature of professional registrations held by
psychologists. The results suggested that the clinical psychology programme was directly
linked to registration as a Clinical Psychologist. The link between registration as a Clinical
Psychologist by graduates from the clinical psychology Masters programme may be due to
the fact that registration with the HPCSA “is a pre-requisite for professional practice”
(http://www.hpcsa.co.za/Registrations/Criteria).
Graduates from the research programme reported various registrations, including
dual registrations. The variety of professional registrations held by graduates from the
research Masters programme may be linked to the variety of forms that research can take, and
the benefit of dual registrations, such as counselling, for conducting research. The results also
indicated that there was a portion of the research respondents who had not pursued
registration with the HPCSA, despite being eligible. The reason for not pursuing registration
with the HPCSA was not explored. However, it may be connected to the type of work
pursued by these graduates, as well as whether HPCSA registration was a pre-requisite for
employment. The lack of professional registration does not mean that these individuals
operated without ethical oversite. All research must go through an ethical review process to
ensure that all appropriate ethical and moral standards have been upheld (Bless et al., 2013).
It may be that some of the research respondents felt that the ethical oversite of research and
ethics committees was sufficient for the work they engaged in. It may be that other
individuals’ work required the broader ethical oversite of a professional body, such as the
HPCSA. In short, registration for graduates from the research programme was not
synonymous with professional competency. The lack of registration did not preclude the
ability to work as a researcher.

76
5.6 Retrospective assessment of study
5.6.1 Rating of study provisions and conditions
Respondents rated 17 aspects of their experience studying at their alma mater. These
responses were grouped as negative (1 or 2), neutral (3) and positive (4 or 5) to aid
interpretation. The aspects were grouped into three categories. The first category, made of up
the eight aspects, had to do with teaching and learning study provisions. The second category,
made up of the next five aspects, related to the university infrastructure and equipment. The
third category, consisting of the last three aspects, was about student welfare. The results of
the clinical respondents’ views of their university experience were shown in Table 28 below.
Table 28. Frequency Table of Rating of University Experience for Clinical Respondents
Clinical (n=13) Negative Neutral Positive N/A
Assistance/advice for final examination 0 2 11 0
Teaching quality of lectures 0 2 11 0
Testing/grading system of examinations 0 3 9 1
Structure of degree program 1 3 9 0
Academic advice offered 0 4 9 0
Provision of supervised practical work experiences 2 3 8 0
Chances to participate in research project(s) 3 2 8 0
Opportunity for out of class contact with teaching staff 1 5 7 0
Support of teaching material 1 6 6 0
Equipment and stocking of libraries 3 3 7 0
Quality of buildings 2 7 4 0
Quality of equipment in laboratories/workshops 4 6 3 0
Availability of technical equipment 8 2 2 1
Contacts with fellow students 1 0 12 0
Chance for students to have an influence on university policies 8 3 1 1
Accommodation facilities on campus 1 4 1 7
Table 28 showed the three groupings of aspects for the clinical respondents. The first
category was that of study provisions for teaching and learning. Overall, this grouping was
rated generally positively by the clinical respondents. The assistance provided for final
examinations and the teaching quality provided by lecturers was rated positively by all, but
two of the clinical respondents (nc=11). Nine of the clinical respondents had a positive
experience of the examination testing system, how the programme was structured, and the
academic advice provided. Eight of the clinical respondents had a positive experience of their
supervised practical work experience and the opportunities to participate in research projects.

77
There were a few individuals who had a negative experience of their supervised practical
work (nc=2) and their participation in research projects (nc=3).
The next category related to the infrastructure and equipment of the university. This
grouping received a more mixed rating. The support of teaching materials (nc=6) and the
library (nc=7) were rated positively by about half of the clinical respondents. The quality of
the buildings received a positive rating from four respondents, a neutral rating from seven,
and a negative rating from two of the clinical respondents. The quality of the equipment in
laboratories or workshops was rated positively by three, neutrally by six, and negatively by
four of the clinical respondents. The availability of technical equipment received the least
favourable rating, with four negative, two neutral and two positive ratings.
The last category was that of student welfare at the university. This group was also
varied in the ratings it received. All but one of the clinical respondents rated the quality of
their contact with other students positively (nc=12). More than half of the clinical respondents
indicated that there was little opportunity for students to influence university policies (nc=8).
Six individuals made use of campus accommodation. One individual had a positive
experience of the accommodation facilities provided, four neutral and one negative. The
results for the research respondents’ rating of their university experiences were shown in
Table 29 below.
Table 29. Frequency Table of Rating of University Experience for Research Respondents
Research (n=16) Negative Neutral Positive N/A
Structure of degree program 0 1 15 0
Assistance/advice for final examination 1 1 14 0
Teaching quality of lectures 0 2 14 0
Academic advice offered 1 2 13 0
Chances to participate in research project(s) 2 1 13 0
Testing/grading system of examinations 0 3 12 1
Provision of supervised practical work experiences 1 3 12 0
Opportunity for out of class contact with teaching staff 1 1 12 2
Possibility for individual structuring of studies 1 7 8 0
Support of teaching material 1 2 13 0
Quality of buildings 3 5 8 0
Equipment and stocking of libraries 2 4 8 2
Availability of technical equipment 4 5 7 0
Quality of equipment in laboratories/workshops 3 6 5 2
Contacts with fellow students 0 1 15 0
Chance for students to have an influence on university policies 5 5 3 3
Accommodation facilities on campus 2 1 1 12

78
Table 29 showed the three groupings of aspects for the research respondents. The
first category was that of teaching and learning study provisions. Overall, this grouping was
rated positively by the research respondents. All but one of the research respondents rated the
structure of the degree programme positively (nr=15). Fourteen of the research respondents
had a positive experience of the assistance provided for final examinations and the quality of
lectures provided. Thirteen of the research respondents provided a positive rating for the
academic advice and the research project opportunities. Twelve of the research respondents
had a positive experience of the examination grading system, their supervised work
experience, and contact with staff members outside of class. There were more mixed views of
the possibility to individually structure the research Masters programme. Eight of the
research respondents rated this positively, seven neutrally, and one negatively.
The next grouping pertained to the infrastructure and equipment of the university.
This grouping received a more mixed rating. Thirteen of the research respondents rated the
support of teaching materials positively. Half of the research respondents (nr=8) provided a
positive rating of the quality of the library and buildings. The availability of technical
equipment was rated positively by seven, neutrally by five and negatively by four of the
research respondents. The quality of the equipment in laboratories or workshops was rated
positively by five, neutrally by six and negatively by three of the research respondents.
The last grouping concerned student welfare at the university. This group was also
varied in the ratings it received. All but one of the research respondents had a positive
experience with their fellow students (nr=15). The opportunity for students to influence
university policies was viewed as not applicable by three; positive by three; neutral by five,
and negative by five research respondents. Four research respondents made use of campus
accommodations. One had a positive experience of the accommodation facilities provided,
one a neutral experience, and two a negative experience.
In the present study, respondents from both Masters programmes indicated a
generally positive rating of the teaching and learning facilities provided in their respective
programmes. Respondents from both Masters programmes provided mixed ratings, in that
there were positive, neutral and negative ratings provided for all aspects of the infrastructure
and equipment of the university. Both Masters groups provided mixed ratings for student
welfare, positive ratings for student contact, and generally less positive view of the
opportunities for students to influence student policies. The groupings of the university
aspects rated above aligned with the research by Mugabushaka et al. (2007).

79
5.6.2 Overall usefulness of studies
Respondents rated the overall usefulness of their studies on five graduate outcomes.
These responses were grouped as to negative (1 or 2), neutral (3) and positive (4 or 5) to aid
interpretation and are shown in Table 30 for the clinical respondents.
Table 30. Frequency Table of Perception of Overall Usefulness of Studies for Clinical
Respondents
Clinical (n=13) Negative Neutral Positive
Development of personality 0 0 13
Finding an adequate job after finishing studies 0 0 13
Fulfilling present professional tasks 0 1 12
Economic development of SA 0 2 11
Future professional development/career 0 2 11
Table 30 showed that overall, the clinical respondents felt that their Masters studies
were useful, based on the five aspects identified. There was unanimous agreement (nc=13)
that their clinical studies were useful for personality development and finding adequate
employment after graduation from their Masters degree. All but one of the clinical
respondents (nc=12) indicated that their studies were useful for completing their current
professional tasks. All but two of the clinical respondents (nc=11) indicated the usefulness of
their studies for the economic development of South Africa and for their development of their
future career. It was important to note that none of the clinical respondents indicated a
negative view for any of the identified aspects. The results of the research respondents’
perceptions of the usefulness of their studies were shown in Table 31 below.
Table 31. Frequency Table of Perception of Overall Usefulness of Studies for Research
Respondents
Research (n=16) Negative Neutral Positive
Fulfilling present professional tasks 0 3 13
Future professional development/career 0 3 13
Development of personality 1 3 12
Finding an adequate job after finishing studies 0 4 12
Economic development of SA 1 6 9
Table 31 showed that overall, the respondents felt that their research Masters studies
were useful, based on the five aspects identified. Almost all of the research respondents
(nr=13) felt that their studies were useful for completing their current professional tasks and
for their professional development and future career. Twelve of the research respondents
indicated the usefulness of their studies for their personality development and for accessing

80
appropriate employment after graduation. One individual felt that his/her studies were
beneficial for his/her personality development. Nine of the research respondents felt that their
studies were useful for the economic development of South Africa, and six were neutral
about this. One participant thought that his/her studies were not useful for the economic
development of South Africa.
Overall, both the clinical and research Masters programmes were deemed useful by
the respondents on three levels: personally, professionally, and nationally. At a personal
level, studies were useful for personality development. On a professional level, studies were
useful for accessing immediate employment, current employment activities, and for future
professional development. At a national level, studies were useful for improving the
economic development of South Africa. The broad usefulness of the professional Masters
programmes highlighted that the educational training provided was indeed sufficient. The
results in section 5.3.2 identified some skills that the university did not sufficiently contribute
towards at the time of graduation. These skills may have been further developed in contexts
outside of the university setting, as respondents reported being competent in them in their
current work, and that their training was sufficient. This finding underscored McQuaid et al.
(2005) and Tomlinson (2017), who reported that skills and graduate attributes were
developed in various contexts in addition to the higher education setting.
6 Conclusions
This study aimed to determine the employment patterns and employability profiles
of alumni from structured professional psychology Masters programmes. Five objectives
were formulated, namely,
1. To establish a demographic profile of the alumni
2. To determine the employment destinations of the alumni
3. To determine the perceived relevance of skills training to the working
environment
4. To determine the percentage of eligible graduates who have completed
registration as health professionals
5. To establish the alumni’s attitude towards their alma mater
In answering the question of what the employment patterns and employability
profiles of the alumni were, the core findings of the present study were that the graduates

81
from both professional Masters programmes were employable and possessed skills that were
both relevant and transferable. These skills allowed them to secure employment across a
variety of fields, and further suggested potential for long-term employability. Their training
prepared them well for accessing employment, for their current work activities, and for their
future professional development.
6.1 Demographic profile
The demographic profile of the respondents to the present study was predominantly
female, as has been identified as typical of the field of psychology. A third of the respondents
were first generation students. This demographic may be due to the demographic profile of
the institution in question, which attracts more individuals from historically disadvantaged
backgrounds. Most of the respondents were located in the same province that they received
their Masters training, suggesting minimal migration of these highly skilled professionals.
6.2 Employment destinations
Most of the graduates from the two Masters programmes were currently employed.
Notably, three of the clinical graduates were self-employed, and three of the research
graduates were pursuing advanced study. These graduates were employed in a range of fields,
suggesting that the skills they possessed were transferable. The transferability of skills may
be considered as a positive indicator of long-term employability. Most of the respondents
were employed in the public sector, despite existing research which indicated that clinical
psychologists are clustered in the private sector. The clustering of clinical respondents in the
public sector may be due to the cohort in question, which may have had access to less social
or financial capital, and therefore less access to private sector employment, in particularly,
private practice or self-employment. As such, the private sector may not have been as
accessible as the public sector in terms of employment opportunities. The clustering the
public sector may be due to transformation initiatives for those from historically
disadvantaged backgrounds, thus making the public sector more accessible than it may be to
the White individuals who historically have made up the bulk of psychological practitioners,
who have therefore been clustered in the private sector. The greater portion of respondents
employed in the public sector may also be because the respondents were still early in their
careers, and may move towards private practice later in their careers. The existing norms for
research psychologists, in term of employment sector, were unknown. The results suggested

82
that it was aligned with that of the clinical psychologists in the current cohort –
predominantly clustered in the public sector.
6.3 Relevance of skills training to working environment
The respondents from both programmes indicated that their studies were useful and
prepared them well, on a personal and professional level. They were well prepared to access
employment, able to conduct their current tasks, and felt as though their training would
continue to assist in their future career and professional development. Additionally, their
training contributed to their personal development. The training received at the university in
question was necessary and relevant for the workplace. However, skills and attributes were
developed in more settings than the university setting. Respondents from both Masters
programmes highlighted the importance of work experience and continued professional
development to remain relevant. Some of the respondents did not feel that their training
adequately developed their entrepreneurial skills. The identified lack of entrepreneurial skills
training was notable, as there was a portion of the clinical respondents who were self-
employed. Some of the respondents suggested that entrepreneurial training would be
beneficial to incorporate into the Masters training for both clinical and research psychology.
Most of the respondents felt that they were working in a field that was closely related to their
field of study. The few that did not feel that their work was related to their studies provided
pragmatic reasons for the change of fields, such as income, family responsibility or
flexibility. Overall, the present study indicated that the skills learned, and training received at
the university in question was relevant for the world of work.
6.4 Proportion registered as health professionals
Most of the respondents were registered with the Health Professions Council of
South Africa. All but one of the respondents was eligible for registration with the HPCSA. A
resultant 92.31% (12 of 13) of the clinical respondents were registered as Clinical
Psychologists. A resultant 66.67% (10 of 15) of the research respondents were registered,
with a variety of registrations, including dual registrations. It was noted that clinical
psychologists were required to be registered with the HPCSA in order to engage in
professional practice. It was notable that even though registration with the HPCSA was not a
requirement for researchers, two thirds of the research graduates were registered. It was also

83
important to note that those who were not registered with the HPCSA were not without
oversight, as all research projects must pass an ethics review process.
6.5 Attitude towards alma mater
There was an overall positive review of the respondents’ experience of studying at
the university in question. The quality of the teaching and learning provided was rated
positively. The infrastructure of the university received a combination of mainly neutral and
positive ratings. The student welfare experienced by the graduates was mixed. The quality of
student contact was overwhelmingly positive, and for those who had utilised campus
accommodation, the most common attitude was neutral. The most varied rating among the
respondents was that of the opportunities for students to influence university policy, with a
range of positive, neutral and negative responses. These generally positive ratings of the
university experience, combined with the noted relevance and usefulness of the training
received; indicated that the respondents had a positive attitude towards their alma mater.
7 Theoretical Formulation of Results
McQuaid and Lindsay (2005) presented an employability framework which
considered the interaction of both supply and demand factors in affecting individual
employability. This included the individual factors of demographics, qualifications,
employability skills and attributes, alongside personal circumstances and external demand
factors. McQuaid and Lindsay’s employability framework was used nominally to interpret
the findings of the present study.
7.1 Individual factors
McQuaid and Lindsay (2005) identified individual factors which included the
employability skills and attributes, qualifications, work experience, demographic
characteristics and job seeking. According to the framework, these interact with personal
circumstances and external factors to influence employability.
7.1.1 Employability skills and attributes
The respondents from both groups perceived that they possessed most of the
employability skills to a positive extent at the time of graduation. Almost all of them
perceived that these employability skills were utilised to a high extent in their subsequent

84
employment. The perceived high utilisation of skills indicated that the respondents had high
levels of the various employability skills. The transferability of these skills was highlighted,
which indicated the potential for long term employability. The respondents completed
professional Masters degrees in either clinical or research psychology. These professional
degrees constitute a formal qualification and a vocation, as evidenced by the eligibility to
register with the HPCSA as a psychologist. Thus this particular cohort of graduates possessed
a knowledge base of work experience and skills that enhanced their employability attributes
as formulated by McQuaid and Lindsay (2005). The respondents’ skills and experience were
affirmed to enhance their employability by the overall positive appraisal of their degree
programmes in terms of relevance to the work place or labour market.
Most of the respondents were currently employed, which suggested that the high
levels of knowledge, skills and qualifications achieved by the respondents made them
employable. The degrees that they possessed contributed towards the attainment of the skills
and work experience, as identified in the results of the present study. It was thus the
interaction of this knowledge – attained both through advanced educational training and
through vocational training and experience – with the official degree title and vocational
experience attained by the individuals that informed their employability.
7.1.2 Demographic characteristics
McQuaid and Lindsay (2005) indicated that demographic factors may mediate
access to employment and therefore one’s employability. Most of the respondents were
female, with seven males and one who reported a non-conforming gender identity. The noted
gender demographic of respondents interacted with the posited feminisation of the field of
psychology (A. L. Pillay & Kramers-Olen, 2014). The greater representation of females in
the field of psychology may indicate that, due to the ‘feminisation’, females were more
readily absorbed into the field. Conversely, the dominance of females in the field of
psychology may mean that males were in higher demand in the field of psychology.
According to the employability framework of McQuaid and Lindsay (2005), gender would
then affect access to employment. Individuals may have the same qualifications, skill set and
experience, yet because of their gender, they may be either more employable or less
employable. No investigation into the causal link between gender and unemployment was
conducted. It is possible that gender, as an individual factor, may impact employability and
destinations.

85
There was a wide age-range of respondents, which, given their current employment
status, suggested that their employability was not determined strictly by their age. In fields,
such as clinical psychology, which require a greater level of emotional maturity, age may be
considered a proxy for maturity. Younger individuals may be considered less employable,
due to a combination of a lack of experience and presumed lower emotional maturity or lack
of life experience. The causal link between age and the other factors was not investigated.
However, there was a wide range of ages, and with almost all of the individuals employed, it
suggested that their age did not affect their employability. It was possible that by virtue of
pursing a Masters degree, having been accepted and completing the degree was an indication
of maturity beyond what age may suggest. The interaction between age and qualification
again highlighted the interaction between vocational skills, training, qualification and
demographics in determining employability, as outlined in the framework by McQuaid and
Lindsay (2005).
With most respondents being South African, it was difficult to determine whether
nationality influenced employability. It was noted that the one individual who was
unemployed and seeking employment was not a South African national, while the other two
foreign alumni were employed. The potentially limited access to social support or networks
as a foreigner may contribute to the ability to access employment. It has been noted that
foreign nationals are precluded from government-funded psychology internships and
additional paperwork is required in order to be cleared for employment (M. Smith, personal
communication, February 19, 2018). These external factors may make it more difficult to
access employment. As such, nationality may inform employability, albeit not alone, but
interacting with personal circumstances and external factors. The causal link between
demographics and employability was not explored. However, the framework by McQuaid
and Lindsay (2005) suggested that these demographic factors may affect the ease with which
individuals were able to access or secure employment.
7.1.3 Job seeking
The methods used by graduates to search for employment, in interaction with the
methods which employers use to advertise vacancies (external factors) was another factor that
mediated access to employment and therefore employability (McQuaid & Lindsay, 2005).
The variety of employment search methods noted by respondents as useful indicated that the
respondents were able to access various mediums through which to apply for employment.
Most of the respondents found applying for advertised vacancies helpful, which suggested an

86
ability to use formal search services or information resources. The additional helpful methods
indicated, including enlisting the help of teaching staff and personal connections, suggested
an ability to make use of informal social networks. Job searching methods interact with the
methods which employers use to advertise vacancies, and whether these align with the
methods used by graduates to search for employment. Given that almost all the respondents
indicated that applying for advertised vacancies had been useful in their search for
employment, it was likely that these graduates had access to the vacancies advertised by
employers. The low proportion of individuals who were able to start their own business
suggested that self-employment was not accessible to all of the respondents. The ability to
pursue self-employment may interact with various other factors, including social and
financial capital, as well as connection to professional networks for referrals. It was likely
that the more limited access to resources, such as financial and social capital, meant that few
of the respondents were able to pursue self-employment as a viable employment option.
Conversely, it may have been an inability to access other forms of employment that made the
pursuit of self-employment necessary. The link between searching for employment, access to
resources and employment pursuits highlighted the multi-facetted nature of employability.
7.2 Personal circumstances
McQuaid and Lindsay (2005) posited that personal circumstances, including
household circumstances and access to resources, interact with individual factors and external
factors to affect employability.
7.2.1 Household circumstances
The results of the present study suggested that household circumstances had affected
the employability of the respondents, as posited by McQuaid and Lindsay (2005). There was
an individual, who despite having the same qualifications and relevant knowledge and
experience, was not employed at the time of the survey. Instead, her dominant activity was
taking care of her family. According to the model, her individual factors were sufficient to
make her employable, but her household circumstances and family responsibility meant that
she was not employable at the time of the survey. Three individuals indicated that they
worked in a field that they did not consider to be closely related to their studies, and that one
of the reasons for this was that it allowed them to take their family responsibilities into
account. As such, household circumstances may affect the type of employment one does

87
seek, thus limiting employability to work that allows for these circumstances to be taken into
account.
These family responsibilities, above and beyond skills and qualifications, limit the
fields of employment that were accessible to these individuals. Family responsibilities were
prioritised, possibly at the cost of relevance of employment to their studies, thus
demonstrating how household circumstances may affect one’s access to employment and
therefore one’s employability.
7.2.2 Access to resources
McQuaid and Lindsay (2005) identified access to financial capital as a factor of
personal circumstances that may affect employability. The income tax brackets of the
respondents showed a spread of earnings from the lowest tax bracket (R0 – R181 900) to the
fifth bracket (R550 101 – R701 300). It was notable that the two individuals that fell in the
lowest income bracket were unemployed. One was the individual who was currently
attending to child rearing or family needs, and the other was the individual was unemployed
and seeking employment.
The interaction between family needs and financial capital was identified as
affecting employability. The individual attending to family responsibility likely considered
this pursuit more important that the limited financial capital that she could personally obtain.
What was unknown was whether the prioritisation of family responsibility was possible
because she had access to additional financial capital through her partner or extended family.
It may have been this access to financial capital that allowed her to remain unemployed and
focus entirely on her family needs. In comparison, another individual was employed, pursing
advanced academic studies and taking care of family responsibilities. In his case, there may
not have been enough financial capital to allow him to focus solely on family responsibilities,
hence the combination of activities. These examples demonstrate how financial capital may
influence access to employment or the ability to remain unemployed.
The need for financial capital may also affect the type of employment accepted. Two
of the four individuals who did not consider their job to be closely linked to their studies
stated that one of the reasons for taking up less related work was that it provided a higher
income. As such, access to what may be deemed appropriate financial capital may be more
important than the relevance of work to their initial field of study. As such, what may be
considered appropriate employment options may be limited by what financial remuneration
was offered, thus affecting individual employability.

88
Access to social capital, in the form of personal, family, community and general
social support networks, were additionally identified as affecting employability by McQuaid
and Lindsay (2005). The variety and type of job search methods utilised by the respondents
indicated appropriate social support networks for accessing employment. Parental education
level has also been linked to social capital (CHEC, 2013), namely as a form of social support,
affecting educational and career aspirations, and access to education and employment
networks (Ball, 2010). The parental education levels of respondents indicated that about a
third of the respondents were first generation students. While not causal, this suggested that
historical disadvantage did not preclude the achievement of postgraduate degrees for this
cohort. This highlighted that it was the interaction of various aspects, not just a single factor,
which affected access to employment and employability. Historical disadvantage was not
directly investigated in the current study, and so the influence that this has on employment
destinations and employability could not be appropriately investigated. It is likely that
racliased and gendered patterns exist, in terms of employability and employment destinations
of the population. This was beyond the scope of this study, but is important area of further
study.
7.3 External factors
McQuaid and Lindsay (2005) included external factors, such as demand factors, in
their framework of employability, which interacted with individual factors and personal
circumstances to influence employability.
The nature of local and national labour market determines the demand factors at play
which influence employment opportunities and thus employability. As already noted, there is
a significant shortage of psychological professions in South Africa (Mashigo, 2017).
Furthermore, these professionals have been noted to be clustered in the private sector of
major city centres (Cooper, 2014; DoH, 2013). Both locally and internationally, the majority
of psychological professionals were female (A. L. Pillay & Kramers-Olen, 2014). These are
broad strokes of the nature of the field of psychology in South Africa.
The labour market, thus affected the demand for individuals with certain
qualifications, of certain demographics, and in certain sectors and fields. With professional
Masters qualifications, the respondents should be in high demand. However, there have been
financial constraints across South Africa, potentially limiting the funding capacity to employ

89
the required numbers of psychological professionals. Thus, it is the interaction of the national
economy with social needs that may affect employment availability.
The existence of supportive factors, such as the BEE initiative may have affected
access to employment. For example, respondents from historically disadvantaged
backgrounds may have had greater access to public sector employment due to these
transformation initiatives. Those from advantaged backgrounds may have less access to the
public sector employment, and thus pursue private sector employment or self-employment. It
was the interaction of demographic factors with external support factors that affected access
to employment, and therefore employability.
Furthermore, as some of the research respondents noted, there was a scarcity of jobs
in the field of psychological research. Their skills may be relevant to various fields, yet their
ability to access various fields was determined by the transferability of the skills they
possessed. This again highlighted the interaction of various factors at play in determining
employability. One may possess the relevant skills, but not be able to transfer these to other
fields, and thus be limited in terms of access to employment. Concurrently, it was the lack of
specific positions matching qualifications that increased the need for transferable skills in the
first place. Graduates from these professional programmes tend to define their professional
identity as psychologists. However, vocational access and employment might require them to
be able to consider their skill set in order to identify suitable employment opportunities,
beyond looking for positions as psychologists.
The need for entrepreneurial skills was highlighted in the results, which may be
understood in terms of the labour market, wherein self-employment may be a solution for the
lack of vacancies. However, without the entrepreneurial skills, social and financial capital
needed to be self-employed, the pursuit of self-employment did not materialise into a viable
employment option for many of the respondents. Again, it was the interaction between skills,
access to resources and the labour market demand that affected the respondents’ access to
certain types of employment.
The nature of the work available, in terms of remuneration and working hours, has
already been demonstrated to be an influencing factor in conjunction with family
responsibility and access to financial capital, in terms of what employment may be deemed
appropriate. Additionally, the recruitment methods used by employers have been
demonstrated to interact with methods used by individuals to search for employment
determining access to said employment.

90
7.4 Overall Employability
This theoretical orientation depicted the complex nature of the employability of the
respondents from the clinical and research psychology Masters programmes. Employability
was determined by the interaction of their skills, qualifications, job search methods, family
responsibilities and access to financial and social capital. These factors additionally interacted
with the nature and demand of the job market, as well as what types of positions were
available and how these were advertised. Combined, these factors determined what positions
may be considered as appropriate and accessible to the individuals in question, and therefore
how employable they were. It was clear that their employability would likely adjust as one or
more of these factors changed, affecting the overall interaction, and therefore the
employability of these individuals.
8 Limitations
The known difficulties of graduate tracer studies included incomplete records, and
resultant small sample sizes and response rates. Every effort was made to overcome these
difficulties, using best practices and recommendations from the literature. However, the
sampling frame was still not complete, and response rates were still moderately low. As such,
the limitation of the present study was that there was reduced power based on the sampling
frame.
Another limitation of the study was that race was excluded from the demographic
questions. A question regarding parental education level was used as a proxy for previous
disadvantage. However, this variable limited the scope of the discussion of the issue of race
and representation to an indirect one.
The discussion of the financial capital of respondents was limited, based on the
variable measured in the survey. The survey used tax income bracket as an indication of
individual earning, however, this did not take household income and other financial capital
into account. As such, the discussion about the financial capital available to the respondents
was limited.
The present study was not able to identify the amount of time taken to complete the
respective Masters programmes, due to an identified phrasing issue in question B9. The
question asked for year of graduation or completion of the Masters degree. It was noted that

91
this question may be ambiguous, as graduation at the identified institution typically takes
place in the academic year after completion. As such, the item did not distinguish between
date of graduation and date of completion. It was therefore not possible to identify how
respondents answered the question, leaving the results vague.
9 Significance
The present study contributed in three areas: to methodology, theory and practice.
9.1 Methodological contribution
The present study followed the best practices recommended for tracer studies, in
particular by conducting a discipline-specific tracer study. One of these recommendations
was the use of a discipline-specific sample from a single university, in order to examine
issues of a specific field. In this case, professional Masters training in research and clinical
psychology were selected as the target programmes within Psychology as a singular
discipline.
A second recommendation was ensuring that respondents had graduated more than
two years before completing the survey, as immediate employment destinations were not
considered indicative of longer term career destinations. The period since graduation was
framed as an inclusion criterion which allowed for only graduates who have been out of
university for two or more years to be sampled. The resultant sample included respondents
who graduated between three to eight years before completing the current survey. Thus, this
ensured that the target population was framed to optimise the findings.
A third recommendation was to focus on employability as well as employment
destinations, in order to gain a more nuanced understanding of access to employment and
employment trends. Careful consideration was taken in the selection and modification of the
survey questionnaire (Appendix B), which allowed for the assessment of both employment
and employability. Furthermore, permission to use and adapt the instrument was sought and
granted by H. Schomburg (Appendix A). In addition, internal consistency was calculated for
the scales used in the instrument. Typically, tracer studies do not report on the internal
consistency or reliability of scales. In the present study, internal consistency scores of
between .72 and .96 were obtained for the respective scales. These scores indicate that the
measure was reliable within the current sample, consistently measuring their underlying

92
concepts. Thus, the present study conformed to best practices and ensured that reliability of
the scales with the current sample was established before the results were presented.
A fourth recommendation was to use incentives and multiple reminders to encourage
participation and increase participation rates. The present study provided an example of best
practice in managing response rates and increasing participation. A target response rate of at
least 30% per stratum and an overall response rate of 50% were set. Each stratum was above
30%: the research programme at 55.17% and the clinical programme at 44.83%. The overall
response rate of 50% was met. The incentives used in the survey increased participation to
well above recorded average response rates for surveys and tracer studies, and were reported
in detail. Detailed reporting increased the replicability of the present study and consisted
methodological rigour and coherence.
Overall, the methodology employed was reported in detail which illustrated
methodological rigour and coherence. The researcher was cognisant that all decisions taken
were methodological decisions and therefore attempted to make these explicit and to report
the motivations consistently. The detailed reporting of the comprehensive methodological
steps taken, incorporating recommendations of the literature, spoke to the rigour with which
the study was conducted. The rigour and reporting indicated and increased the replicability of
the present study. In short, the present study incorporated general best practices from survey
research and tracer studies to provide a template for good practice in graduate tracer study
research.
9.2 Theoretical contribution
It has not been common for graduate tracer studies to explicitly use a theoretical
framework. The present study incorporated McQuaid and Lindsay’s (2005) framework of
employability. The theoretical tenants underlying the framework informed the selection of the
instrument for data collection, as discussed in section 4.7.2. The subscales and comprising
items reflected key elements of the theoretical framework. The theoretical framework also
informed the adaptations to the instrument. Thus, the methodological coherence was
enhanced through the alignment of the framework and the instrument. The present study thus
provided an example of how the theoretical framework may be used to inform data
collection.
The present study also attempted to use the theoretical framework to provide a
formulatory understanding of the findings. The theoretical framework was used nominally in

93
the formulation of the primarily descriptive results of the tracer study. Thus, the present study
contributed significantly to the methodology of tracer studies by providing an example of
how theoretical frameworks may be incorporated into graduate tracer study research.
Challenges were encountered in selecting an appropriate theoretical framework, due
to the lack of examples of graduate tracer studies explicitly utilising a theoretical framework.
As such, there were no best practices to follow of how a framework should be integrated into
a graduate tracer study methodology. General principles of theoretical frameworks were
utilised, but the largely descriptive nature of graduate tracer study results limited the
theoretical interpretation that could be conducted. In short, the present study additionally
provides an example of how a theoretical framework may be integrated into a graduate tracer
study.
The inclusion of a theoretical framework was particularly important, not only for the
methodology, but for the discipline being studied by the researcher. Psychology has been
noted a discipline that includes many abstract constructs and philosophical tenets. Thus, the
inclusion of a theoretical framework was important despite it not being a requirement for
mini-theses.
9.3 Contribution to practice
The present study contributed in various practical ways. The present study
established a database of graduates from the Masters programmes in clinical and research
psychology, for the identified period from the university in question. This was not available
before. The resultant template can be updated annually and provide a more complete
sampling frame for future studies, alumni relations and marketing.
The results of the present study assisted in establishing an employability profile of
these graduates. The results provided feedback on the two professional programmes
regarding employment destinations, the relevance of skills training and perceptions of the
alma mater.
There have been examples of the demographic and employment profiles of clinical
and counselling psychologists in the South African context from the HPCSA registry. The
present study computed data on research psychologists. Thus, the present study contributed to
the expansion of registration categories in alumni research for Psychology graduates. In
addition, the aggregated results from earlier registry-based studies could not track or identify
gendered patterns related to institutional enrolment patterns or demographics. The present

94
study thus provides details about the profession of psychology that had not been previously
explored and that was reflective of the literature on higher education that clearly reflects
racialised and economic patterns in enrolment at institutions.
The present study allowed participants to identify skills that they thought could
enhance the academic offering. A programme recommendation that emerged was the lack of
entrepreneurial skills training in the Masters programmes. The lack of entrepreneurial
training was highlighted by respondents from both Masters programmes. It was
recommended that entrepreneurial training be integrated into the respective Masters
programmes, in order to assist graduates from these programmes to access self-employment
as an option for employment. This finding provides empirical support for the suggestion to
include entrepreneurial skills as an integrated module to professional programmes in the
faculty where the programmes are offered.
A practical contribution was the generation of data on graduate attributes, using an
international instrument. The Standard Instrument for Graduates had not previously been
used in the South African context, and as such, the present study produced the first set of data
for this instrument. Additionally, precedence has been established for the instrument’s
suitability for the South African context, which may be further utilised and modified in future
research.
10 Recommendations
The method of department-based graduate tracer studies utilised was helpful for
assessing specific issues, such as employment, employability and programme development,
and as such may be adapted to various other programmes, departments, faculties or
institutions as applicable. It was recommended that the scales used and adapted in the present
study be further revised and investigated, in terms of reliability and validity, in order to
establish the psychometric properties of the instrument. It was recommended that the present
study be replicated with various populations and samples. Firstly, a replication of the same
programmes in the same institution could be conducted. This would provide insight into the
representation of the current sample, as well as to develop trend-data. Secondly, a replication
at different institutions could be conducted, to access a greater representation of the
population beyond the cohorts included in this study. This would provide insights into the
cohort of psychology Masters graduates as a whole, not just within a single institution.

95
Thereafter, a broader scale study, perhaps of a faculty, an institution or across multiple
institutions may be conducted. This may provide insight into how the various departments
compare. Additional, department-specific questions may be incorporated as needed. Studies
with larger or more representative samples may support inferential statistical analysis,
lending to the exploration of causal and/or predictive relationships regarding employment and
employability. It was also recommended that further investigation into the racialised and
gendered patterns of historical disadvantage and employability be investigated.
Longitudinal graduate tracer studies may provide greater insight into how
employment prospects develop and change over time, how graduates access these various
employment opportunities, and what barriers prevent them from accessing them. The results
from longitudinal studies may provide insight into the fluid nature of employability, as well
as which factors interact at various stages to determine one’s employability. The use of
qualitative research methods may be beneficial in order to gain greater depth of insight into
the more subjective nature of employability, for example, the interaction of factors that
determine one’s un/employment, as well as investigating the decision-making process of
un/employment or employment changes.

96
Reference List
Ahmed, R., & Pillay, A. L. (2004). Reviewing clinical psychologist training in the post-
apartheid period: Have we made any progress? South African Journal of Psychology,
34(4), 630-656.
Aina, L. O., & Moahi, K. (1999). Tracer study of the Botswana library school graduates.
Education for Information, 17, 215-244.
Albertyn, R. M., Kapp, C. A., & Bitzer, E. M. (2008). Profiling exiting postgraduate students'
performance and experiences. South African Journal of Higher Education, 22(4),
749-772.
Asmal, K. (2001). National Plan for Higher Education in South Africa. Pretoria: Ministry of
Education.
Azar, B. (2000). A web of research. Monistor on Psychology, 31(4), 42-44.
Babbie, E. (2011). The basics of social research (5th ed.). Belmont, CA: Wadsworth
Cengage Learning.
Badat, S. (2010). The challenges of transformation in higher education and training
institutions in South Africa. Pretoria: The Development Bank of Southern Africa.
Ball, S. J. (2010). New class inequalities in education: Why education policy may be looking
in the wrong place! Education policy, civil society and social class. International
Journal of Sociology and Social Policy, 30 (3/4), 155–166.
Barrie, S. C. (2006). Understanding what we mean by the generic attributes of graduates.
Higher Education, 51(2), 215-241.
Batistic, S., & Tymon, A. (2017). Networking behaviour, graduate employability: A social
capital perspective. Education and Training, 59(4), 374-388.
Bless, C., Higson-Smith, C., & Sithole, S. L. (2013). Fundamentals of social research
methods: An African perspective (5th ed.). Cape Town: Juta & Co.
Boulos, A. (2016). The labour market relevance of PhDs: An issue for academic research and
policy-makers. Studies in Higher Education, 41(5), 901-913.
doi:10.1080/03075079.2016.1147719
Bridgstock, R. (2009). The graduate attributes we've overlooked: Enhancing graduate
employability through career management skills. Higher education Research &
Development, 28(1), 31-44. doi:10.1080/07294360802444347

97
Broad, J. H. (2015). So many worlds, so much to do: Identifying barriers to engagement with
continued professional development for teachers in the further education and training
sector. London Review of Education, 13(1), 16-30.
Cable, D. A. J. (2013). The career experiences of industrial and organisational psychology
graduates. New Zealand Journal of Psychology, 42(1), 5-12.
Cabrera, A. F., Weerts, D. J., & Zulick, B. J. (2003). Alumni survey: Three
conceptualisations to alumni research. Paper presented at the Métodos de Análisis
de la inserción laboral de los universitarios, Universidad de León, España.
CHE. (2009). Postgraduate studies in South Africa: A statistical profile. Pretoria: Council on
Higher Education.
CHE. (2015). Content analysis of the baseline institutional submissions for Phase 1 of the
Quality Enhancement Project. Pretoria: Council on Higher Education.
CHEC. (2013). Pathways from university to work: A graduate destination survey of the 2010
cohort of graduates from the Western Cape universities. Wynberg: Cape Higher
Education Consortium.
Cloete, N. (2009). Comments on the CHE's 'The State of Higher Education Report' (2009).
Pretoria: Centre for Higher Education Transformation.
Cloete, N. (2014). The South African Higher Education System: Performance and Policy.
Studies in Higher Education, 39(8), 1355-1368. doi:10.1080/03075079.2014.949533
Coetzee, M., & Esterhuizen, K. (2010). Psychological career resources and coping resources
of the young unemployed African graduate: An exploratory study. SA Journal of
Industrial Psychology, 36(1), 1-9.
The constitution of the Republic of South Africa. (1996). Pretoria: Constitutional Assembly.
Cooper, S. (2014). South African psychology 20 years into democracy. South African Journal
of Psychology, 44(3), 261-266. doi:10.1177/0081246314537176
Cosser, M. (2003). Graduate tracer study. In M. Cosser, S. Mc Grath, A. Badroodien, & B.
Maja (Eds.), Technical college representativeness: Learner destinations and labour
market environments in South Africa. Cape Town: HSRC Publishers.
Cosser, M. (2009). The skills cline: Higher Education and the supply-demand complex in
South Africa. Higher Education, 59(1), 43-53. doi:10.1007/s10734-009-9231-z
Cosser, M., & Nenweli, S. (2013). “We’ve got you pegged”: Programme choice in the
transition to, and passage through, higher education. Higher Education, 67(3), 333-
348. doi:10.1007/s10734-013-9655-3
98
Dahlgren, L. O., Handal, G., Szkudlarek, T., & Bayer, M. (2008). Students as journeymen
between cultures of Higher Education and work: A comparative European project on
the transition from Higher Education to working life. Higher Education in Europe,
32(4), 305-316. doi:10.1080/03797720802066005
De Guzman, A. B., & De Castro, B. V. (2008). Employment and employability profile of a
select group of Filipino college graduates. Korean Educational Development
Institute, 5(1), 63-81.
De la Harpe, B., Radloff, A., & Wyber, J. (2000). Quality and generic (professional) skills.
Quality in Higher Education, 6(3), 231-243. doi:10.1080/13538320020005972
DeAngelis, T. (2011). Are you really ready for private practice? gradPSYCH, 9(4), 40-42.
DHET. (2012). Green paper for post-school education and training. Pretoria: DHET.
DoE. (1997). Education White Paper 3: A Programme for the Transformation of Higher
Education. General notice 1196 of 1997. Pretoria: Department of Education.
DoH. (2008). Health Professions Act, 1974: Regulations defining the scope of the profession
of psychology. Pretoria: Department of Health.
DoH. (2013). National mental health policy framework and strategic plan 2013-2020.
Pretoria: Department of Health.
Dommeyer, C. J., Baum, P., Hanna, R. W., & Chapman, K. S. (2004). Gathering faculty
teaching evaluations by in-class and online surveys: Their effects on response rates
and evaluations. Assessment & Evaluation in Higher Education, 29(5), 611-623.
DST. (2007). Innovation towards a knowledge-based economy: Ten-Year Plan for South
Africa (2008 – 2018). Pretoria: Department of Science and Technology.
Du Toit, J., Kraak, A., Favish, J., & Fletcher, L. (2014). From study to work: Methodological
challenges of a graduate destination survey in the Western Cape, South Africa.
Assessment & Evaluation in Higher Education, 29(7), 853-864.
doi:10.1080/02602938.2013.875118
Durrheim, K., & Painter, D. (2006). Collecting quantitative data: Sampling and measuring. In
M. Terre Blanche, K. Durrheim, & D. Painter (Eds.), Research in practice: Applied
methods for the social sciences (2 ed., pp. 132-159). Cape Town: UCT press.
Egesah, O. B., Wahome, M., Langat, E. K., & Wishtemi, B. (2014). University graduate
tracer studies (UNITRACE): Methodological lessons and utilization of selected
results in Kenya. Journal of International Academic Research for Multidisciplinary,
2(8), 305-325.

99
Evans, J. R., & Mathur, A. (2005). The value of online surveys. Internet Research, 15(2),
195-219.
Field, A. (2009). Discovering statistics using SPSS (3rd ed.). London: SAGE Publications
Ltd.
Fricker, R. D., & Schonlau, M. (2002). Advantages and disadvantages of internet research
surveys: Evidence from the literature. Field Methods, 14(4), 347-367.
Gideon, L. (2012). Introduction. In L. Gideon (Ed.), Handbook of survey methodology for the
Social Sciences. New York: Springer.
Goodman, S., & Tredway, G. (2016). Antecedents of perceived graduate employability: A
study of student volunteers in a community-based organisation. SA Journal of
Industrial Psychology, 42(1). doi:10.4102/sajip.v42i1.1315
Gotch, C. (2008). Results of the survey of 2005-2006 alumni. WA: Washington State
University. Retrieved from www.saresearch.wsu.edu/alumniSurvey.
Green, F., & McIntosh, S. (2007). Is there a genuine under-utilisation of skills amongst the
over-qualified? Applied Economics, 39(4), 427-439.
Griesel, H., & Parker, B. (2009). Graduate attributes: A baseline study on South African
graduates from the perspective of employers. Pretoria: HESA & SAQA.
Guthrie, B. (2014). Australian graduate survey 2013: A report of the conduct of the 2013
Australian graduate survey. Melbourne: Graduate Careers Australia Ltd.
Harman, K., & Meek, V. L. (2002). Introduction to special issue: "Merger revisited:
international perspectives on mergers in higher education". Higher Education, 44, 1-
4.
Hayati, N. R., & Muchlish, T. I. (2013). Studies for enhancing graduates relevance and
competitiveness. Review of Higher Education and Self-Learning, 6(20), 33-40.
HESA. (2013). DLHE introduction 2011/12. England: HESA Ltd.
Hinchliffe, G. W., & Jolly, A. (2011). Graduate identity and employability. British
Educational Research Journal, 37(4), 563-584. doi:10.1080/01411926.2010.482200
Hobden, S., & Hobden, P. (2015). A study of the transition pathways of school level
scholarship recipients into work and tertiary education. South African Journal of
Education, 35(3), 1-10. doi:10.15700/saje.v35n3a1054
Holmes, L. (2013). Competing perspective on graduate employability: Possession, position or
process? Studies in Higher Education, 38(4), 538-554.
doi:10.1080/03075079.2011.587140

100
Hughes, C., & Barrie, S. C. (2010). Influences on the assessment of graduate attributes in
higher education. Assessment & Evaluation in Higher Education, 35(3), 325-334.
doi:10.1080/02602930903221485
Ipate, D. M., & Parvu, I. (2010). Employability skills for the knowledge-driven economy.
Paper presented at the 4th World Congress on the Advancement of Scholarly
Research in Science, Economics, Law & Culture, New York.
Jaakkimainen, R. L., Schultz, S. E., Glazier, R. H., Abrahams, C., & Verma, S. (2012).
Tracking family medicine graduates. Where do they go, what services do they
provide and whom do they see? BMC Family Practice, 13(26). doi:10.1186/1471-
2296-13-26
Kaburise, P. (2016). Improving soft skills and communication in response to youth
unemployment. International Journal of African Renaissance Studies - Multi-, Inter-
and Transdisciplinarity, 11(2), 87-101. doi:10.1080/18186874.2016.1248061
Kagee, A., & O'Donovan, A. (2011). Judgements of widely held beliefs about psychological
phenomena among South African and Australian postgraduate students. South
African Journal of Psychology, 41(1), 83-89.
Koen, C. (2006). Higher education and work: Setting a new research agenda. Cape Town:
HSRC Press.
Lambert, A. D., & Miller, A. L. (2014). Lower response rates on alumni surveys might not
mean lower response representativeness. Educational Research Quarterly, 37(3), 38-
51.
Lassey, A. T., Lassey, P. D., & Boamah, M. (2013). Career destination of University of
Ghana medical school graduates of various year groups. Ghana Medical Journal,
47(2), 87-91.
Letseka, M., Cosser, M., Breier, M., & Visser, M. (2010). Student retention & graduate
destination: Higher education & labout market access & success. Cape Town:
HSRC Press.
Lutwama, E., & Kigongo-Bukenya, I. M. N. (2004). A tracer study of the East African
School of Library and Information Science graduates 1995-1999 working in Uganda.
SA Journal of Library and Information Science, 70(2), 99-109.
MacGregor, K. (2014). Higher education in the 20th year of democracy. University World
News, 31(7).

101
Martin, A., & Roodt, G. (2008). Perceptions of organisational commitment, job satisfaction
and turnover intentions in a post-merger South African tertiary institution. SA
Journal of Industrial Psychology, 34(1), 23-31.
Mashigo, H. (2017). Shortage of psychologists hits SA [Press release]. Retrieved from
https://www.psyssa.com/shortage-of-psychologists-hits-sa/
Mason, G., Williams, G., & Cranmer, S. (2009). Employability skills initiatives in higher
education: What effects do they have on graduate labour market outcomes?
Education Economics, 17(1), 1-30. doi:10.1080/09645290802028315
McCowan, C., & Wyganowska, J. (2008). Gathering the real data from creative industries
graduates one year out. Australian Journal of Career Development, 17(1), 29-40.
McGovren, T. V., & Carr, K. F. (1989). Carving out a niche: A review of alumni surveys on
undergraduate psychology majors. Teaching of Psychology, 16(2), 52-57.
McQuaid, R. W., Green, A., & Danson, M. (2005). Introducing employability. Urban
Studies, 42(2), 191-195. doi:10.1080/0042098042000316092
McQuaid, R. W., & Lindsay, C. (2005). The concept of employability. Urban Studies, 42(2),
197-219.
Melink, M., & Pavlin, S. (2009). Employability of graduates and higher education
management systems. Slovenia: DEHEMS.
Moleke, P. (2001). First employment experiences of graduates. In M. Khosa (Ed.),
Empowerment through economic transformation. Durban: African Millennium
Press.
Mubuuke, A. G., Businge, F., & Kiguli-Malwadde, E. (2014). Using graduates as key
stakeholders to inform training and policy in health professions: The hidden
potential of tracer studies. African Journal of Health Professions Education, 6(1),
52-55. doi:10.7196/AJHPE.302
Mugabushaka, A. M., Schomburg, H., & Teichler, U. (2007). Higher Education and work in
Africa: A comparative empirical study in selected countries. Kassel, Germany:
International Centre for Higher Education Research Kassel.
NACE. (2015). First destinations for the college class of 2014. PA: National Association of
Colleges and Employers.
NCSU. (2015). 2015 alumni survey: Introduction, methods, and alumni demographic profile.
Retrieved from https://oirp.ncsu.edu/wordpress/wp-
content/uploads/2015/12/alum15.intro_.pdf (accessed November 21, 2016).

102
Nel, S. (2016). The association between perceived stress, coping styles and personality traits
in a sample of Psychology Honours students. (M. Psych Mini-thesis), University of
the Western Cape, Cape Town.
NPC. (2011a). Diagnostic overview. Pretoria: National Planning Commission.
NPC. (2011b). National development plan: Vision for 2030. Pretoria: National Planning
Commission.
NPC. (2012). Our future - make it work: Executive summary. Pretoria: National Planning
Commission.
Nulty, D. D. (2008). The adequacy of response rates to online and paper surveys: What can
be done? Assessment & Evaluation in Higher Education, 33(3), 301-314.
Offord, Y. (2016). The subjective experiences of students who withdraw from a directed
Masters programme in Psychology at a historically disadvantaged university: A case
study. (MA Psychology Mini-thesis), University of the Western Cape, Cape Town.
Parekh, A. (2015). Continued professional development in rural Africa. The Clinical Teacher,
12(2), 131-132. doi:10.1111/tct.12266
Pather, C. (2015). #RhodesMustFall: No room for ignorance or arrogance. South African
Journal of Science, 111(5/6). doi:10.17159/sajs.2015/a0109
Pillay, A. L., & Kramers-Olen, A. L. (2014). The changing face of clinical psychology intern
training: A 30-year analysis of a programme in KwaZulu-Natal, South Africa. South
African Journal of Psychology, 44(3), 364-374. doi:10.1177/0081246314535683
Pillay, A. L., & Kramers, A. L. (2003). South African clinical psychology, employment
(in)equity and the "brain drain". South African Journal of Psychology, 33(1), 52-60.
Pillay, S. R. (2016). Silence is violence: (Critical) psychology in an era of Rhodes Must Fall
and Fees Must Fall. South African Journal of Psychology, 46(2), 155-159.
doi:10.1177/0081246316636766
Purcell, K., & Elias, P. (2004). Seven years on: Graduate careers in a changing labour
market. England: HECSU, ESRC, IER, ESRU.
Richter, L. M., Griesel, R. D., Durrheim, K., Wilson, M., Surendorff, N., & Asafo-Agyei, L.
(1998). Employment opportunities for psychology graduates in South Africa: A
contemporary analysis. South African Journal of Psychology, 28(1), 1-7.
Robson. (2011). Real world research: A resource for users of social research methods in
applied settings. Chichester: Wiley.

103
Rogan, M., Reynolds, J., du Plessis, U., Bally, R., & Whitfield, K. (2015). Pathways through
university and into the labour market: Report on a graduate tracer study from the
Eastern Cape. Pretoria: LMIP, HSRC, DHET.
SAQA. (1998). Regulations under the South African Qualifications Authority Act, 1995 (Act
No. 58 of 1995). Pretoria: South African Qualifications Authority.
Schomburg, H. (1995). Standard instrument for graduate and employer surveys (Vol. 68,
Education Report). Eschborn: Deutsche Gesellschaft fur Technische
Zusammenarbeit.
Schomburg, H. (2003). Handbook for graduate tracer studies. Kassel, Germany: Centre for
Research on Higher Education and Work.
Schomburg, H., & Teichler, U. (2006). Higher education and graduate employment in
Europe: Results from graduate surveys from twelve countries. In P. Maassen & J.
Muller (Eds.), Higher Education Dynamics (Vol. 15). The Netherlands: Springer.
Schwartz, R. B. (2014). The pursuit of pathways: Combining rigorous academics with career
training. American Educator, (Fall 2014), 24-41.
Sehoole, M. T. C. (2005). The politics of mergers in higher education in South Africa. Higher
Education, 50(1), 159-179. doi:10.1007/s10734-004-6357-x
Senekal, J.-P. (2014). The impact of self-esteem on the working alliance between students and
supervisors and the perception of thesis work as stressful. (M. Psych Mini-thesis),
University of the Western Cape, Cape Town.
Senekal, J. S. (2015). A comparison of graduate tracer studies: In search of an optimal
method. (BSocSci Psychology Honours Mini-thesis), University of KwaZulu-Natal,
Pietermaritzburg.
Setlalentoa, W. N. (2013). Making a transition from High School to University: An educator
point of view. Journal of Psychology in Africa, 23(2), 349-352.
Shongwe, M., & Ocholla, D. N. (2011). A tracer study of LIS graduates from the University
of Zululand, 2000-2009. Mousaion, 29(2), 277-245.
Shrivastava, M., & Shrivastava, S. (2014). Political economy of higher education: Comparing
South Africa to trends in the world. Higher Education, 67, 809-822.
doi:10.1007/s10734-013-9709-6
Siyengo, N. (2015). The educational and psychosocial experiences of first generation
students in higher education. (Master of Education and Educational Support),
Stellenbosch University, Stellenbosch.

104
Sommer, M., & Dumont, K. (2011). Psychosocial factors predicting academic performance
of students at a historically disadvantaged university. South African Journal of
Psychology, 41(3), 386-395.
Stilwell, C. (2004). Alumni perceptions of post graduate Information and Library Science
education programme at the University of Natal, South Africa. SA Journal of Library
and Information Science, 70(1), 20-29.
Stoop, I., & Harrison, E. (2012). Classification of surveys. In L. Gideon (Ed.), Handbook of
survey methodology for the Social Sciences. New York: Springer.
Tomlinson, M. (2017). Forms of graduate capital and their relationship to graduate
employability. Education + Training, 59(4), 338-352. doi:10.1108/et-05-2016-0090
Vaatstra, R., & Vries, R. (2007). The effect of the learning environment on competences and
training for the workplace according to graduates. Higher Education, 53(3), 335-
357. doi:10.1007/s10734-005-2413-4
van Zyl, A. (2013). Teaching the students we have: Two perspectives on first year students at
the University of Johannesburg and the UJ First Year Experience initiative. Paper
presented at the HELTASA 2013, Durban.
Varalakshmi, R. S. R. (2006). Education 21st century LIS professionals - Needs and
expectations: A survey of Indian LIS professionals and alumni. Journal of Education
for Library and Information Science, 47(3), 181-199.
Varnhagen, C. K., Gushta, M., Daniels, J., Peters, T. C., Parmar, N., Law, D., . . . Johnson, T.
(2005). How informed is online informed consent? Ethics & Behavior, 15(1), 37-48.
Wangenge-Ouma, G. (2012). Tuition fees and the challenge of making higher education a
popular commodity in South Africa. Higher Education, 64(6), 831-844.
doi:10.1007/s10734-012-9531-6
Weisberg, H. F. (2005). The total survey error approach: A guide to the new science of
survey research. Chicago: The University of Chicago Press.
Wingfield, B. (2011). Can we improve postgraduate degree throughput rates? South African
Journal of Science, 107(11/12), 1-2.

105
Appendix A: Letter of permission for use and adaptation of instrument
Subject: Query for permission of instrument use
Date: 24 February 2016
Dear Dr Schomburg and Dr Teichler
I have read much of your work on higher education employment and alumni based
research, in particular, "the Higher Education and Graduate Employment".
I am currently doing my Masters in research psychology at the University of the
Western Cape in South Africa, and am considering a similar study to the one you have
conducted, although on a smaller scale. My study will include postgraduate psychology
alumni and focus on employment destinations and perceived relevance of the skills
training.
I was wondering if you would be willing to allow me permission to use the extensive
questionnaire (used in the above mention research) for my research (which I would
need to modify for my context), or if you could point me in the direction of other
relevant instruments I could use?
Thank you for your time.
Regards,
Janine Senekal
Re: Query for permission of instrument use
Date 24 February 2016
Dear Ms Senekal,
You can use the questionnaire and modify it as you like. You can find more on the
INGRADNET web site. Have a look!
http://ingradnet.org/questionnaires.html
Kind regards
Harald Schomburg
Hohnemannstrasse 43
34130 Kassel, Germany
Email [email protected]
Phone +49(0)561.882.0684
Mobile +49(0)170.836.9311
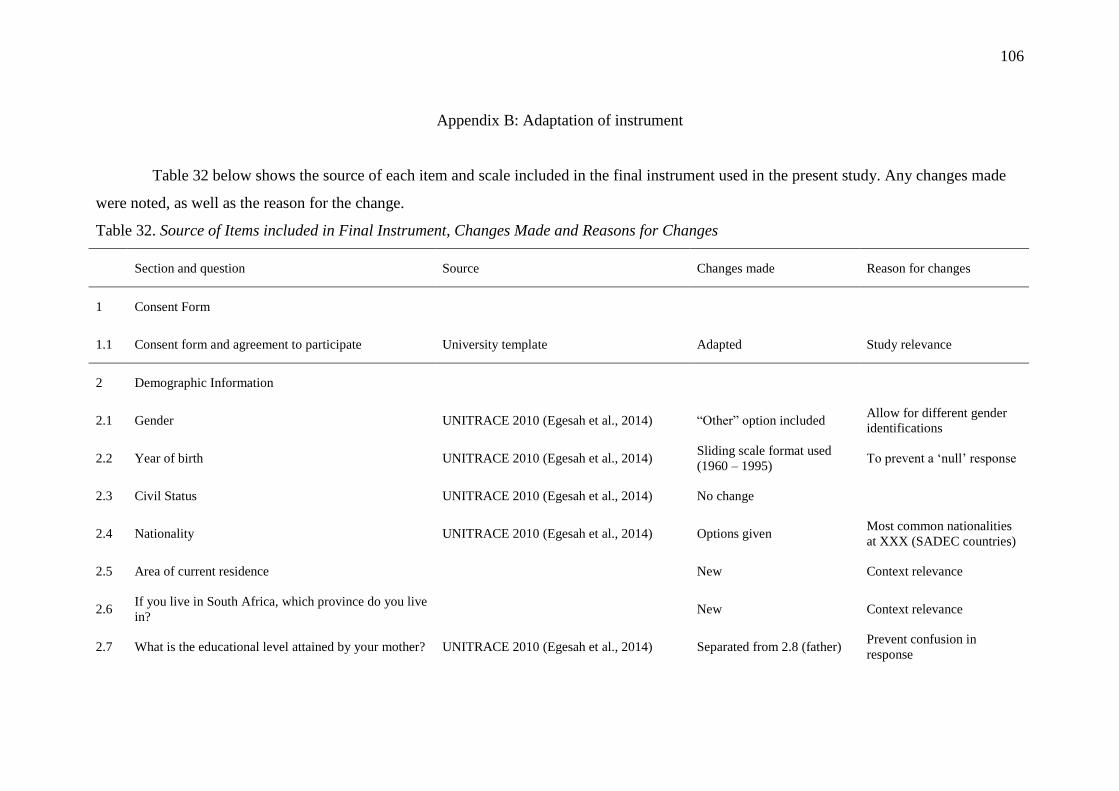
106
Appendix B: Adaptation of instrument
Table 32 below shows the source of each item and scale included in the final instrument used in the present study. Any changes made
were noted, as well as the reason for the change.
Table 32. Source of Items included in Final Instrument, Changes Made and Reasons for Changes
Section and question Source Changes made Reason for changes
1 Consent Form
1.1 Consent form and agreement to participate University template Adapted Study relevance
2 Demographic Information
2.1 Gender UNITRACE 2010 (Egesah et al., 2014) “Other” option included Allow for different gender
identifications
2.2 Year of birth UNITRACE 2010 (Egesah et al., 2014) Sliding scale format used
(1960 – 1995) To prevent a ‘null’ response
2.3 Civil Status UNITRACE 2010 (Egesah et al., 2014) No change
2.4 Nationality UNITRACE 2010 (Egesah et al., 2014) Options given Most common nationalities
at XXX (SADEC countries)
2.5 Area of current residence New Context relevance
2.6 If you live in South Africa, which province do you live
in? New Context relevance
2.7 What is the educational level attained by your mother? UNITRACE 2010 (Egesah et al., 2014) Separated from 2.8 (father) Prevent confusion in
response

107
2.8 What is the educational level attained by your father? UNITRACE 2010 (Egesah et al., 2014) Separated from 2.7 (mother) Prevent confusion in
response
2.9
Complete accordingly for your highest degree level
attained at:
Highest degree level attained from XXX
Highest qualification (regardless of institution)
CHEERS 1999 (Schomburg & Teichler,
2006)
AAU 1996 (Mugabushaka et al., 2007)
Format edited (table, drop-
down options)
Limited to highest degree
attained at XXX and overall
regardless of institution
Simplification; relevance
3 Relationship between Study and Work
3.1 At the time of graduation, to what extent did you have
the following competencies? UNITRACE 2010 (Egesah et al., 2014) Separated from 3.2
Simplification and
clarification
3.2 At the time of graduation, to what extent did the
university contribute to the following competencies? UNITRACE 2010 (Egesah et al., 2014) Separated from 3.1
Simplification and
clarification
3.3 To what extent has your study program at the
university been a good basis for… UNITRACE 2010 (Egesah et al., 2014) No change
3.4
To what extent have the following competencies
acquired during study been utilized in your subsequent
employment?
UNITRACE 2010 (Egesah et al., 2014) No change
3.5 To what extent does your field of study relate to your
area of work? UNITRACE (Egesah et al., 2014) No change
3.6 If you are working in a field that is unrelated to your
training, why did you take it up? UNITRACE 2010 (Egesah et al., 2014) No change
4 Marketability
4.1 Which methods have been useful in your search for
employment?
CHEERS 1999 (Schomburg & Teichler,
2006)
UNITRACE 2010 (Egesah et al., 2014)
General usefulness rather
than methods used Aligned with topic
4.2 How important were the following for increasing your
marketability in the work place?
CHEERS 1999 (Schomburg & Teichler,
2006)
UNITRACE 2010 (Egesah et al., 2014)
General marketability rather
than employer recruitment Aligned with topic
4.3 Continued Professional Development (CPD)… Loosely based on SIG 1995 Q52
(Schomburg, 1995) New Relevance to Psych field

108
5 Most Recent or Current Employment
5.1 What is your current dominant activity? UNITRACE 2010 (Egesah et al., 2014) Phrasing; including other
relevant categories Relevance, clarity
5.2 In which field do you/have you most recently worked? UNITRACE 2010 (Egesah et al., 2014) Limited list to those relevant
for psych graduates Clarification
5.3 Which category does your current/most recent
employer/institution fall? UNITRACE 2010 (Egesah et al., 2014) Phrasing edits Clarity
5.4 In which tax income bracket does your current annual
income fall? UNITRACE 2010 (Egesah et al., 2014)
Edited income brackets
based on SARS tax brackets Relevance, clarity
5.5
How many employment positions have you held
before being appointed to your current / most recent
position?
UNITRACE 2010 (Egesah et al., 2014)
Phrasing edited; exclusions
clarified; format edited:
sliding scale clarified
Relevance, clarity
5.6 Regarding HPCSA registration, please indicate which
is true for you: New Relevance to Psych field
5.7 Which category of registration are you eligible for? New Relevance to Psych field
6 Retrospective Assessment of XXX
6.1 How do you rate the study provision and study
conditions you experienced at XXX? SIG 1995 (Schomburg, 1995) No change
6.2 Altogether: How do you rate the usefulness of your
studies… SIG 1995 (Schomburg, 1995) No change
7 Comments/Suggestions
7.1 Do you have any further comments regarding the
relationship between study program and employment? UNITRACE 2010 (Egesah et al., 2014)
Edited for focus on study
question Clarity, simplification

109
Appendix C: Final instrument
Employment and Employability Profiles of Postgraduate Psychology Alumni
A. Consent Form
I fully understand the research aims, my rights and my role as participant in the study, as well as
issues related to confidentiality, as outlined in the information email.
I hereby express my willingness to participate in this study. I am aware of my right to withdraw at any
time.
I also grant permission to the researcher to disseminate the information obtained in the following
formats:
• Unpublished thesis
• Conference presentation
• Published manuscript or article
I take cognisance that all documents and records will be destroyed at the end of the research process.
1. If you agree to participate in this study, please select the option below.
If you do not wish to participate, please exit the survey.
I agree to participate in this study
I do not agree to participate in this study
B. Demographic Information Please provide the following demographic information:
1. Gender
Female
Male
Other (please specify)
2. Year of birth
_ _ _ _
3. Civil status
Married
Divorced
Single or unmarried
Separated
With partner
Widow(er)
Other (please specify)
4. Nationality
South African
Namibian
Zimbabwean
Other (please specify)

110
5. Area of current residence
South Africa
Abroad (please specify)
6. If you live in South Africa, which province do you live in?
Western Cape
Eastern Cape
Northern Cape
Free State
Mpumalanga
KwaZulu-Natal
Limpopo
North West
Gauteng
Not applicable – I do not live in South Africa
7. What is the educational level attained by your mother?
Without education
Incomplete primary school
Complete primary school
Incomplete high school
Complete high school
Incomplete technical level
Complete technical level
Incomplete higher education
Complete higher education
Incomplete postgraduate
Complete postgraduate
Unknown
Other (please specify)
8. What is the educational level attained by your father?
Without education
Incomplete primary school
Complete primary school
Incomplete high school
Complete high school
Incomplete technical level
Complete technical level
Incomplete higher education
Complete higher education
Incomplete postgraduate
Complete postgraduate
Unknown
Other (please specify)

111
9. Complete accordingly for you highest degree level attained:
Degree level
Year started
(registration)
Year
completed
(graduation)
Department /
School
Major /
Specialisation
Highest
degree level
attained from
XXX
BPsych
_ _ _ _ _ _ _ _
Psychology Clinical
Honours Research
Masters Other
Counselling
PhD Other
Highest
qualification
(regardless of
institution)
BPsych
_ _ _ _ _ _ _ _
Psychology Clinical
Honours Research
Masters Other
Counselling
PhD Other
C. The Relationship between Study and Work
Please provide the following information about the relationship between your current employment
and the most recent education you received at XXX:
1. At the time of graduation, to what extent did you have the following competencies?
Not at all To a very
high extent
Knowledge of your field(s) or
discipline(s)
Knowledge of other field(s) or
disciple(s)
General knowledge
Internet skills
Computer skills
Critical thinking
Research skills
Learning ability
Communication skills
Working under pressure
Time management
Working independently
Team work ability
Problem-solving ability
Negotiation
Analytical ability
Loyalty and integrity
Working with people from different
cultures and backgrounds
Leadership
Responsibility
Initiative
Project/ program management
Ability to present ideas and
information
Ability to write reports and
documents
Ability to continuously learn

112
2. At the time of graduation, to what extent did the university contribute to the following
competencies?
Not at all To a very
high extent
Knowledge of your field(s) or
discipline(s)
Knowledge of other field(s) or
disciple(s)
General knowledge
Internet skills
Computer skills
Critical thinking
Research skills
Learning ability
Communication skills
Working under pressure
Time management
Working independently
Team work ability
Problem-solving ability
Negotiation
Analytical ability
Loyalty and integrity
Working with people from different
cultures and backgrounds
Leadership
Responsibility
Initiative
Project/ program management
Ability to present ideas and
information
Ability to write reports and
documents
Ability to continuously learn
3. To what extent has your study program at the university been a good basis for...?
Not at all
To a very
high extent
Starting work?
Further learning on the job?
Performing your current work tasks?
Potential/ future career(s)?
Your personal development?
Development of entrepreneurial skills?

113
4. To what extent have the following competencies acquired during study been utilised in your
subsequent employment?
Not at all To a very
high extent
Knowledge of your field(s) or
discipline(s)
Knowledge of other field(s) or
disciple(s)
General knowledge
Internet skills
Computer skills
Critical thinking
Research skills
Learning ability
Communication skills
Working under pressure
Time management
Working independently
Team work ability
Problem-solving ability
Negotiation
Analytical ability
Loyalty and integrity
Working with people from different
cultures and backgrounds
Leadership
Responsibility
Initiative
Project/ program management
Ability to present ideas and
information
Ability to write reports and
documents
Ability to continuously learn
5. To what extent does your field of study relate to your field of work?
Not at all To a very
high extent
6. If you are working in a field that is unrelated to your training, why did you take it up?
Multiple responses possible
Not applicable; I consider my job closely linked to my studies
I have not (yet) been able to find a job more appropriate
In doing this job I have better career prospects
I prefer an occupation which is not closely connected to my studies
I was promoted to a position less linked to my studies than my previous position(s)
I can get a higher income in my current job
My current job offers me more security
My current job is more interesting
My current job provides the opportunity for part-time/flexible schedules, etc.
My current job enables me to work in a locality, which I prefer

114
My current job allows me to take into account family needs
At the beginning of the career I envision, I have to accept work that is not/hardly linked to my
study
Other (please specify)
D. Marketability Please provide the following information about your professional marketability
1. Which methods have been useful in your search for employment?
Multiple responses possible
Applying for an advertised vacancy
Contacting employers without knowing about a vacancy
Launching advertisements by myself
Being approached by an employer
Contacting a public employment agency
Contacting a commercial employment agency
Enlisting the help of the careers/placement office of my institution of higher education
Enlisting the help of teaching staff at my institution of higher education
Establishing contacts while working during the course of study
Using other personal connections/contacts (e.g. parents, relatives, friends)
Starting my own business/self-employment
Other (please specify)
2. How important were the following for increasing your marketability in the workplace?
Not at all
important
Very
important
Field of study
Main subject / specialisation
Academic results
Practical/work experience acquired
during the course of study
Practical/work experience acquired
prior to the course of study
Reputation of the institution of
higher education
Work experience abroad
English proficiency
Additional language proficiency
Computer skills
Recommendations/references from
third parties
Personality and interpersonal skills
3. Continued Professional Development (CPD)...
Disagree Agree
Complements my work
Addressed perceived gaps in my training
Facilitates career improvement
Is important
Takes up a lot of time
Is expensive

115
Allows one to remain current in the field
Has been beneficial
Facilitates developing professional connections
Assists in maintaining levels of knowledge, skills and ethical
attitudes
Assists in acquiring new and updated levels of knowledge, skills
and ethical attitudes
Has a measurable benefit for professional practice
Enhances and promotes professional integrity
Programs or events are accessible
Ultimately benefits the patient
E. Most Recent or Current Employment Please provide the following information about your most recent or current employment
1. What is your current dominant activity?
Employed
Self-employed
Not employed, seeking employment
Professional training
Advanced academic study
Child rearing, family care
Other (please specify)
2. In which field do you work/have you most recently worked?
Basic education
Higher education
Early child development
Policy
Corporate
Social services
Social development
Health
Other (please specify)
3. Which category does your current/most recent employer/institution fall?
Public employer
Non-profit organisation/NGO
Private employer
Self-employed
Other (please specify)
4. In which tax income bracket does your current annual income fall?
R0 - R181 900
R181 901 - R284 100
R284 101 - R393 200
R393 201 - R550 100
R550 101 - R701 300
R701 301 and above

116
5. How many employment positions have you held before being appointed to your current/most recent
position?
Exclude:
• Positions held for less than 6 months
• Less than 50% part time employment
• Positions held prior to completion of most recent university training
_ _
6. Regarding HPCSA registration, please indicate which is true for you:
Not eligible and not registered with the HPCSA
Eligible, but not registered with the HPCSA
Eligible and registered with the HPCSA
7. Which category of registration are you eligible for?
Multiple responses possible
Not applicable - I am not eligible for registration with the HPCSA
Student
Intern
Community service
Clinical
Research
Counselling
Other (please specify)
F. Retrospective Assessment of Study at XXX Please assess your most recent experience of studying at XXX:
1. How do you rate the study provision and study conditions you experienced at XXX?
Very
bad
Very
good
N/A
Assistance/advice for your final examinations
Opportunity for out of class contact with teaching
staff
Academic advice offered
Chances to participate in research project(s)
Teaching quality of lectures
Structure of degree program
Testing/grading system of examinations
Possibility for individual structuring of studies
Provision of supervised practical work experience
Contacts with fellow students
Chance for students to have an influence on
university policies
Availability of technical equipment (PCs)
Quality of equipment in laboratories/workshops
Support of teaching material
Equipment and stocking of libraries
Accommodation facilities on the campus
Quality of buildings

117
2. Altogether: How do you rate the usefulness of your studies for...?
Not at
all
useful
Very
useful
Finding an adequate job after finishing your studies?
Fulfilling your present professional tasks?
Your future professional development/career?
The development of your personality?
The economic development of your country?
G. Comments / Suggestions
1. Do you have any further comments regarding the relationship between study program and
employment?
SURVEY COMPLETED I thank you for your cooperation and time.
Due to difficulties compiling recent contact details of alumni, I need your help:
Please will you send me an email with the names and email addresses of any classmates you are still
in contact with to: [email protected]
You are also welcome to contact me with any queries.
Kind regards,
Janine Senekal
University of the Western Cape, Department of Psychology

118
Appendix D: Ethical clearance for conducting research

119
Appendix E: Letter of permission to conduct research from Registrar

120
Appendix F: Information sheet
UNIVERSITY OF THE WESTERN CAPE
Department of Psychology
Private Bag X 17, Bellville 7535, South Africa
Tel: +27 21-959 2283, Fax: 27 21-959 3515
INFORMATION SHEET
Project Title: Employment and employability profiles of postgraduate psychology alumni
from a historically disadvantaged university.
What is this study about?
This study will be conducted by Mrs Janine Senekal and Dr M. Smith from the University of
the Western Cape. We are inviting you to participate in this research project because you
completed postgraduate training in the psychology department at XXX and graduated
between 2008 and 2013. The purpose of this research is to explore the employability
attributes that might predict employment after graduation from a postgraduate course in
psychology.
What will I be asked to do if I agree to participate?
You will be asked, as an alumnus from XXX’s psychology department, to complete an online
survey including demographic variables, current and past employment, as well as perceived
relevance of training to current employment. This survey will take approximately 20 minutes
to complete in an online forum called Survey Monkey.
Would my participation in this study be kept confidential?
The Survey Monkey website allows follow-up emails to be sent to uncompleted surveys
without the researcher accessing the specific email address or details of the participants. This
will further protect the anonymity of responses and privacy of participants. Findings will be
treated confidentiality.
What are the risks of this research?
There are no known risks associated with the participating in this research project
What are the benefits of this research?
The benefits to you include:
• An opportunity to reflect on your training
• An opportunity to reflect on the relevance of your training to your employment
• If you successfully complete the survey, you will be entered into a lucky draw to win
1 of 3 Exclusive Books vouchers worth R150 each, throughout the time the survey is
active, and a grand prize Exclusive Books voucher worth R500.

121
Do I have to be in this research and may I stop participating at any time?
Your participation in this research is completely voluntary. You may choose not to take part
at all. If you decide to participate in this research, you may stop participating at any time. If
you decide not to participate in this study or if you stop participating at any time, you will not
be penalized or lose any benefits to which you otherwise qualify.
Is any assistance available if I am negatively affected by participating in this study?
Appropriate referrals will be made if unforeseen negative impacts arise.
What if I have questions?
This research is being conducted by Mrs Janine Senekal at the Department of Psychology at
the University of the Western Cape. If you have any questions about the research study itself,
you can contact:
Mrs Janine Senekal
Dept. of Psychology, UWC
021-9320453/0820599266
Should you have any questions regarding this study and your rights as a research participant
or if you wish to report any problems you have experienced related to the study, please
contact:
Supervisor: Dr Mario Smith
Dept. of Psychology, UWC
021-9592283
Head of Department: Dr M. Andipatin
Dept. of Psychology, UWC
021-9592283
Dean of the Faculty of Community and Health Sciences:
Prof J. Frantz
University of the Western Cape
Private Bag X17
Bellville 7535
021-959 2631