University of São Paulo “Luiz de Queiroz” College of ...
82
University of São Paulo “Luiz de Queiroz” College of Agriculture Use of fruit processing by-products for the development of cookies: physicochemical, nutritional, technological and sensory aspects Nataly Maria Viva de Toledo Thesis presented to obtain the degree of Doctor in Science. Area: Food Science and Technology Piracicaba 2018
-
Upload
khangminh22 -
Category
Documents
-
view
3 -
download
0
Transcript of University of São Paulo “Luiz de Queiroz” College of ...
University of São Paulo “Luiz de Queiroz” College of Agriculture
Use of fruit processing by-products for the development of cookies: physicochemical, nutritional, technological and sensory aspects
Nataly Maria Viva de Toledo
Thesis presented to obtain the degree of Doctor in Science. Area: Food Science and Technology
Piracicaba 2018
Nataly Maria Viva de Toledo Bachelor of Food Science
Use of fruit processing by-products for the development of cookies: physicochemical, nutritional, technological and sensory aspects
Advisor: Profª. Drª. SOLANGE GUIDOLIN CANNIATTI BRAZACA
Thesis presented to obtain the degree of Doctor in Science. Area: Food Science and Technology
Piracicaba 2018

2
Dados Internacionais de Catalogação na Publicação DIVISÃO DE BIBLIOTECA – DIBD/ESALQ/USP
Toledo, Nataly Maria Viva de
Use of fruit processing by-products for the development of cookies: physicochemical, nutritional technological and sensory aspects / Nataly Maria Viva de Toledo - - Piracicaba, 2018.
81 p.
Tese (Doutorado) - - USP / Escola Superior de Agricultura “Luiz de Queiroz”.
1. Biscoitos 2. Subprodutos como alimentos 3. Fibras 4. Minerais 5. Análise de alimentos 6. Desenvolvimento de produtos I. Título

3
I dedicate this work to my family and friends for
the strength, inspiration and companionship in this journey.
4
ACKNOWLEDGMENTS
Firstly, I would like to thank God, for allowing me to live this experience and be able to share
so important moments together with my relatives and friends.
To my family, for the support, unconditional love, comprehension in the days of absence and
for the incentive to my academic career.
To my boyfriend, Guilherme Tedeschi Benatto for the love, companionship, comprehension
and smiles.
To the “Luiz de Queiroz” College of Agriculture and to the Department of Agroindustry, Foods
and Nutrition for the opportunity to develop our study.
To the University of Murcia for allowing the development of a part of this project, for the
reception and teachings.
To Prof. Solange Guidolin Canniatti Brazaca, Ph.D., for the partnership in all these years of
work, for the friendship, trust, advice and guidance.
To Prof. Gaspar Ros, Ph.D., for the empathy, friendship and for the opportunity of fulfilling one
of the dreams of my life: to know closely the day by day of the Spanish culture! Olé! My great gratitude
and admiration!
To FAPESP (São Paulo Research Foundation) for funding this research and granting the
national scholarship (Process 2014/14049-4), scholarship abroad (Process 2016/08953-5) and research
aid (Process 2015/15507-9).
To Della Natural for kindly providing the fruit by-products used in this research.
To the group NUTBRO (Research Group of Human Nutrition and Food Science, Faculty of
Veterinary, University of Murcia, especially to professors Rubén López Nicolás, Ph.D., and Carmen
Frontela, Ph.D., for the receptivity, attention and shared teachings.
To the team of the Section of Tissue Culture of University of Murcia, especially to Antonia B.
Esclapez, Juana G. Reverte and Pilar G. Párraga for the patience and for the knowledge transmitted.
To Prof. Marina Vieira da Silva for the friendship and teachings during PAE internship.
To my colleagues from the laboratory of Bromatology and Human Nutrition of ESALQ-USP for
the lunches at RUCAS, for the days, nights and weekends of studies on HPLC and cell culture, for the
changes of laboratory, for the meetings with carrot cake and for transforming together the difficulties
into learnings.
To my friends: Paula, Adriano, Samara, Natalia, Elizângela, Priscila, Larissa, Mayra, Susana,
Laura, Gabriela, Zeta, Thais, Rafael, Paulo, Laís, Miriam, Rodrigo, Letícia, Lidi and Fernanda for the
good laughs, advice and special experiences!
To the interns Jessica Mondoni and Larissa Peixoto for the days of work at the laboratory,
dedication, friendship and e a lot of cookie-eating.
To the technician Regina Gonçalves for the assistance and support in the physicochemical
analyses.
To D. Amábile and Mariana for the patience and willingness in helping us with the experiments
performed at the Pilot Plant and Laboratory of Sensory Analysis of ESALQ-USP.

5
To the whole team of the Department of Agroindustry, Foods and Nutrition, especially to the
secretary Regina Marafon, for being so attentive and helpful.
To Bob, Mel (in memoriam), Kito, Samanta for the affection and help in typing.
To all who have contributed, either directly or indirectly, for the accomplishment of this work.

6
“The real voyage of discovery consists not in seeking new landscapes,
but in having new eyes.”
Marcel Proust
7
SUMMARY
RESUMO ............................................................................................................................................................... 9
ABSTRACT ......................................................................................................................................................... 10
1. INTRODUCTION ........................................................................................................................................... 11
REFERENCES .................................................................................................................................................... 13
2. PINEAPPLE, APPLE AND MELON BY-PRODUCTS CAN INCREASE THE CONTENTS OF
PHENOLIC ACIDS AND FLAVONOIDS IN COOKIES AND CONTRIBUTE TO THEIR
ANTIOXIDANT CAPACITY ............................................................................................................................ 15
ABSTRACT ......................................................................................................................................................... 15
2.1. INTRODUCTION ........................................................................................................................................... 15 2.2. MATERIAL AND METHODS ................................................................................................................. 16
2.2.1. Raw material ...................................................................................................................................... 16 2.2.2. Cookies preparation ........................................................................................................................... 17 2.2.3. Characterization of the fruit by-products .......................................................................................... 17
2.2.3.1. Proximate composition ................................................................................................................................. 17 2.2.3.2. Physicochemical analyses ............................................................................................................................ 17 2.2.3.3. Determination of pesticide residues .............................................................................................................. 17
2.2.4. Total phenolics and antioxidant capacity .......................................................................................... 17 2.2.4.1. Extraction ..................................................................................................................................................... 18 2.2.4.2. Total phenolic content .................................................................................................................................. 18 2.2.4.3. Antioxidant capacity ..................................................................................................................................... 18
2.2.5. Identification and quantification of the phenolic acids and flavonoids by HPLC ............................. 19 2.2.6. Statistical analyses ............................................................................................................................. 19
2.3. RESULTS AND DISCUSSION................................................................................................................. 19 2.3.1. Characterization of the fruit by-products .......................................................................................... 19
2.3.1.1. Proximate composition ................................................................................................................................. 20 2.3.1.2. Physicochemical analyses ............................................................................................................................ 22 2.3.1.3. Determination of pesticide residues .............................................................................................................. 24
2.3.2. Total phenolic contents and antioxidant capacity .............................................................................. 24 2.3.3. Phenolic acids and flavonoids ........................................................................................................... 26
2.4. CONCLUSIONS ....................................................................................................................................... 28
REFERENCES .................................................................................................................................................... 29
3. INFLUENCE OF PINEAPPLE, APPLE AND MELON BY-PRODUCTS ON COOKIES:
PHYSICOCHEMICAL AND SENSORY ASPECTS ...................................................................................... 35
ABSTRACT ......................................................................................................................................................... 35
3.1. INTRODUCTION ..................................................................................................................................... 35 3.2. MATERIAL AND METHODS ................................................................................................................. 36
3.2.1. Raw materials .................................................................................................................................... 36 3.2.2. Cookies preparation ........................................................................................................................... 36 3.2.3. Proximate composition ...................................................................................................................... 37 3.2.4. Physicochemical analyses .................................................................................................................. 37 3.2.5. Post-baking properties ....................................................................................................................... 37 3.2.6. Microbiological aspects ..................................................................................................................... 37 3.2.7. Sensory analysis ................................................................................................................................. 38
3.2.7.1. Preference ranking test ................................................................................................................................. 38 3.2.7.2. Acceptance test ............................................................................................................................................. 38
3.2.8. Statistical analyses ............................................................................................................................. 39 3.3. RESULTS AND DISCUSSION................................................................................................................. 39
3.3.1. Proximate composition ...................................................................................................................... 39 3.3.2. Physicochemical analyses .................................................................................................................. 41 3.3.3. Post-baking properties ....................................................................................................................... 42 3.3.4. Sensory analysis ................................................................................................................................. 44
3.4. CONCLUSIONS ....................................................................................................................................... 47
8
REFERENCES .................................................................................................................................................... 47
4. CHANGES IN THE SENSORY PROFILE AND PHYSICOCHEMICAL ASPECTS OF COOKIES
CAUSED BY THE REPLACEMENT OF WHEAT FLOUR BY APPLE, PINEAPPLE AND MELON BY-
PRODUCTS ......................................................................................................................................................... 51
ABSTRACT ......................................................................................................................................................... 51
4.1. INTRODUCTION ...................................................................................................................................... 51 4.2. MATERIAL AND METHODS .................................................................................................................. 52
4.2.1. Raw materials ..................................................................................................................................... 52 4.2.2. Cookie preparation ............................................................................................................................ 52 4.2.3. Physicochemical analyses .................................................................................................................. 53 4.2.4. Quantitative descriptive analysis (QDA) ............................................................................................ 53 4.2.5. Statistical analyses ............................................................................................................................. 55
4.3. RESULTS AND DISCUSSION ................................................................................................................. 55 4.3.1. Physicochemical analyses .................................................................................................................. 55 4.3.2.1. Correlation analysis (CORR) .......................................................................................................... 56 4.3.2.2. Principal component analysis (PCA) and cluster analysis ............................................................. 58
4.4. CONCLUSIONS ........................................................................................................................................ 61
REFERENCES .................................................................................................................................................... 62
5. INOSITOL PHOSPHATES AND TOTAL OXALATE OF COOKIES CONTAINING FRUIT BY-
PRODUCTS AND THEIR INFLUENCE ON CALCIUM, IRON AND ZINC BIOAVAILABILITY BY
CACO-2 CELLS .................................................................................................................................................. 65
ABSTRACT ......................................................................................................................................................... 65
5.1. INTRODUCTION ...................................................................................................................................... 65 5.2. MATERIAL AND METHODS .................................................................................................................. 66
5.2.1. By-products ........................................................................................................................................ 66 5.2.2. Cookies ............................................................................................................................................... 66 5.2.3. Inositol phosphate content ................................................................................................................. 67 5.2.4. Total oxalate content .......................................................................................................................... 67 5.2.5. Estimation of relative mineral bioavailability .................................................................................... 68 5.2.6. In vitro gastrointestinal digestion ...................................................................................................... 68 5.2.7. Caco-2 cells ........................................................................................................................................ 68 5.2.8. Mineral content, solubility, retention, transport, and uptake ............................................................. 69 5.2.9. Statistical analyses ............................................................................................................................. 70
5.3. RESULTS AND DISCUSSION ................................................................................................................. 70 5.3.1. Mineral content .................................................................................................................................. 70 5.3.2. Phytate and oxalate contents .............................................................................................................. 71 5.3.3. Mineral bioavailability by Caco-2 cells ............................................................................................. 73
5.4. CONCLUSIONS ........................................................................................................................................ 76
REFERENCES .................................................................................................................................................... 77
6. GENERAL CONCLUSIONS ......................................................................................................................... 80
9
RESUMO
Aproveitamento de subprodutos do processamento de frutas para desenvolvimento de
cookies: aspectos físico-químicos, nutricionais, tecnológicos e sensoriais
O presente estudo visou caracterizar subprodutos de abacaxi, maçã e melão e avaliar seu potencial como ingrediente para substituição parcial de farinha de trigo em formulações de biscoitos. A adição de subprodutos de frutas contribuiu para elevar o teor de fibras dos biscoitos. O subproduto de melão se destacou por seu conteúdo mineral, enquanto que o subproduto de maçã apresentou resultados mais relevantes para compostos fenólicos e capacidade antioxidante (DPPH e ABTS). Tais comportamentos se refletiram nas formulações de biscoitos. Oito compostos fenólicos (ácido vanílico, ácido gálico, ácido sinápico, ácido salicílico, ácido p-cumárico, catequina, epicatequina e rutina) foram identificados e quantificados por HPLC tanto nos subprodutos como nos biscoitos. Com relação aos fatores antinutricionais e biodisponibilidade mineral, observou-se que a adição de subprodutos de frutas em biscoitos diminuiu os teores de fitato e oxalato e promoveu mudanças na biodisponibilidade de cálcio, ferro e zinco. Frente aos aspectos tecnológicos, observou-se que o uso de subprodutos interferiu na cor dos biscoitos, tornando-os levemente mais escuros e também enfraqueceu a rede de glúten formada, promovendo variações do diâmetro e fator de expansão. Por outro lado, observou-se que quanto maior a concentração de subprodutos, maiores foram os valores de dureza (textura), sendo as amostras consideradas mais firmes e crocantes. Do ponto de vista sensorial, verificou-se que o biscoito com 15% de subproduto de abacaxi foi o que demonstrou maior aceitação, seguido pelos cookies com 15% de subproduto de maçã, controle e 15% de subproduto de melão. Por meio de análise descritiva quantitativa (ADQ), observou-se que a adição de subprodutos de frutas alterou o perfil sensorial dos biscoitos. A partir dos resultados obtidos, concluiu-se que os subprodutos de frutas se apresentam como potenciais ingredientes para formulações de cookies, atribuindo-lhes propriedades físico-químicas, tecnológicas, nutricionais e sensoriais específicas as quais podem variar de acordo com o subproduto empregado.
Palavras-chave: Cookies; Maçã; Abacaxi; Melão; Resíduos; Mineral; Fibras; Biodisponibilidade; Fitato; Oxalato; Caco-2

10
ABSTRACT
Use of fruit processing by-products for the development of cookies: physicochemical,
nutritional, technological and sensory aspects
The present study aimed at characterizing pineapple, apple and melon by-products and evaluating their potential as an ingredient for the partial substitution of wheat flour in cookie formulations. The addition of fruit by-products contributed to rise the cookies fiber content. Melon by-product was prominent for its mineral content, whereas apple by-product presented more relevant results for phenolic compounds and antioxidant capacity (DPPH and ABTS). Such behaviors reflected in the cookie formulations. Eight phenolic compounds (vanillic acid, gallic acid, sinapic acid, salicylic acid, p-coumaric acid, catechin, epicatechin and rutin) were identified and quantified by HPLC in both the by-products and cookies. Regarding the antinutritional factors and mineral bioavailability, it was observed that the addition of fruit by-products in cookies reduced the contents of phytate and oxalate and promoted changes in calcium, iron and zinc bioavailability. Facing the technological aspects, it was observed that the use of by-products interfered in the color of the cookies, making them slightly darker and also weakened the gluten formed, promoting variations in diameter and expansion factor. On the other hand, it was observed that increasing concentrations of by-products led to higher values of hardness, making the cookies firmer and crunchier. In the sensory point of view, it was verified that the cookie with 15% of pineapple by-product demonstrated the highest acceptance, followed by cookies with 15% of apple by-product, control and 15% of melon by-product. By quantitative descriptive analysis (QDA), it was found that the addition of fruit by-products altered the sensory profile of the cookies. From the results obtained, it can be concluded that the fruit by-products are potential ingredients for cookie formulation, attributing to them specific physicochemical, technological, nutritional and sensory properties which can vary according to the by-products employed.
Keywords: Cookie; Apple; Pineapple; Melon; Waste; Mineral; Fiber; Bioavailability; Phytate; Oxalate; Caco-2
11
1. INTRODUCTION
Besides in natura consumption, fruit production has been demonstrating growth, especially by
the expansion of the processed food market, with emphasis for pulps, juices, canned foods, jellies,
candies and minimally-processed fruits. The high demand for these products is related to the current
lifestyle, which requires products of high practicality and convenience. Nevertheless, concomitant with
the rise in the search for these processed foods is the increase in the generation of waste discarded by
the industries, which might lead to environmental damages and represent costs for their correct
treatment and disposal (Jayathilakan et al., 2012).
Fruit processing is considered one of the activities that most generates by-products. It is
estimated that from the total mass of processed fruits, around 50% become agro-industrial waste
(Gómez & Martinez, 2017). Fruit and vegetable by-products usually present significant amounts of
fibers, vitamins, minerals and antioxidant compounds and, therefore, their use has been explored as
alternatives in the development of new food products (Martins, Pinho & Ferreira, 2017; Pasqualone et
al., 2017; Quiles et al., 21018).
Among the fruits usually found in the Brazilian market, pineapple, apple and melon can be
highlighted, which are widely consumed and appreciated given their sensory characteristics; however,
it is observed that their by-products still present scarce use.
Pineapple (Ananas comosus) is a tropical fruit, belonging to the family Bromeliaceae,
originating from South America, including the Brazilian central zone, the northeast of Argentina and
Paraguay (Sampaio, Fumis & Leonel, 2011). Among the predominant cultivars in Brazil are Pérola and
Smooth Cayenne, with pineapple production in the harvest of 2017 reaching around 1.6 million tons,
with emphasis for the States of Pará, Paraíba and Minas Gerais (IBGE, 2017). After pulp
industrialization, pineapple central axis, crown, peel and kernel are the main by-products obtained.
These residues are usually discarded or directed to the generation of alcohol, ascorbic and malic acids,
animal feeds and extraction of the enzyme bromelain (digestive and anti-inflammatory agent)
(Prakitchaiwattana, Boonin & Kaewklin, 2017). As applications for the pineapple by-products, studies
suggest formulations of extrudates (Selani et al., 2014), yogurts (Sah et al., 2016) and beef burgers
(Selani et al., 2016).
Apple (Malus spp.) is original from Asia and Europe and belongs to family Rosaceae. In Brazil,
the most planted cultivars are Gala, Golden Delicious and Fuji, and in the harvest of 2017, the country
produced approximately 1.1 million tons of the fruit (IBGE, 2017). Apple industrial processing, especially
to obtain juice, generates a large amount of by-products, since bagasse (94.5%), seeds (4.4%) and
kernels (1.1%) (Coelho & Wosiacki, 2010). Apple bagasse can be employed for the incorporation of
phenolic compounds, pectin, citric acid and fibers in foods (Perussello et al., 2017)).
Original from the central region of Asia and Africa and belonging to the family Cucurbitaceae,
melon (Cucumis melo L.) is one of the horticultural products that have been minimally processed in
diverse forms: in the form of small balls, slices and cubes with or without peel (Muller et al., 2013). Rio
Grande do Norte is prominent as the largest Brazilian producer, its production having reached, in 2017,
around 400 thousand tons (IBGE, 2017). Among its by-products, the peels can be highlighted, mainly
12
composed of proteins, fibers and minerals such as calcium and potassium; and the seeds, which present
significant amounts of minerals such as iron, zinc, potassium, proteins and lipids, with emphasis for the
linoleic and oleic acids (Storck et al., 2013; Petkova & Antona, 2015). Few studies report the use of
melon by-products for product development. The most usual is the use of peels for the preparation of
jams, glazed candies, liqueurs and jellies, whereas the seeds are consumed as snacks after drying and
seasoning with salt (Miguel et al., 2008).
According to Martins, Pinho and Ferreira (2017), baked goods and biscuits are considered the
best vehicles to increase the nutritional value of food products. This is because they are considered
versatile foods, which can present distinct forms, sizes, types and flavors. Furthermore, they are
affordable and include consumers of several ages and social classes. Biscuits are defined as “products
obtained by the mixture of flour(s), and/or starch(es) with other ingredients, submitted to processes of
kneading and cooking, either fermented or not. They might present several toppings, fillings, formats
and textures” (Brasil, 2005). Their nutritional quality is often considered low for being generally
formulated with only wheat flour and/or other refined flours. Thus, new formulations have been
demonstrating advantages in the use of plant by-products in relation to the functional and nutritional
properties of biscuits and baked goods. De Camargo et al. (2014) used peanut skins to increase the
contents of phenolic compounds and antioxidant capacity of cookies. On the other hand, Souza et al.
(2018) explored the bagasse of custard apple to enhance the mineral profile of cookies. Hemdane et al.
(2015), in turn, investigated the use of by-products from wheat grinding in the preparation of breads and
observed that coarse bran can contribute to rise the content of dietary fibers in the formulations.
It is known that the development of new products requires a comprehensive approach, since
food matrices are complex and provide interactions among several compounds. In this sense, attention
must be given to the antinutritional factors (e.g. phytates and oxalates), substances capable of
interfering in nutrient bioavailability. The concept of bioavailability can be understood as the amount of
nutrient that is absorbed and available for physiological functions. The bioavailability will depend of
digestion, release from the food matrix, absorption by intestinal cells, and transport to body cells
(Etcheverry, Grusak & Fleige, 2012). For being considered less expensive, fast and for offering better
control of the variables than studies with animals or humans, in vitro assays are usually employed for
bioavailability determination, with the use of cell cultures, such as Caco-2, being extensively employed,
because of their morphological and functional characteristics that simulate absorption cells present in
the small intestine mucosa (Sambuy et al., 2005).
Considering this perspective, the need for alternatives to use fruit by-products in the
development of new products can be verified. Therefore, the present study had the purpose of
characterizing fruit by-products (pineapple, apple and melon) and investigating their potential of
application as ingredients in the formulations of cookies, in order to enhance their physicochemical,
nutritional, technological and sensory properties.
Thereby, this thesis consists of five chapters. The first one is an introduction about the study.
In the second chapter, apple, pineapple and melon by-products were characterized through
physicochemical, pesticide residues and phenolic (flavonoids and phenolic acids) content, as well as
the effect of the addition of fruit by-products on cookies in relation to their antioxidant capacity and
13
phenolic profile was evaluated. In the third charpter, the cookies containing fruit by-products were
characterized regarding their physicochemical, microbiological and sensory aspects. This chapter was
also important to select the percentage of by-product used in the cookies. In the chapter four, the
changes in te sensory profile of cookies due to the replacement of wheat flour by fruit by-products were
studied. Finally, the chapter five evaluated the antinutritional factors (phytate and oxalate) present in
fruit by-products and also in cookies and their influence on the bioavailability of calcium, iron and zinc.
REFERENCES
Brasil. Agência Nacional de Vigilância Sanitária. Resolução RDC nº 269, de 22 de setembro de 2005.
Aprova o “Regulamento Técnico para produtos de cereais, amidos, farinhas e farelos.” Diário Oficial
da União. Brasília, DF, 23 de setembro de 2005.
Coelho, L. & Wosiacki, G. (2010). Sensory evaluation of bakery products with the addition of apple
pomace flour. Food Science and Technology (Campinas), 30, 582-588.
De Camargo, A.C., Vidal, C.M.M., Canniatti-Brazaca, S.G. & Shahidi, F. (2014). Fortification of cookies
with peanut skins: effect on the composition, polyphenols, antioxidant properties, and sensory
quality. Journal of Agricultural and Food Chemistry, 62, 11228-11235.
Etcheverry, P., Grusak, M.A. & Fleige, L.E. (2012). Application of in vitro bioaccessibility and
bioavailability methods for calcium, carotenoids, folate, iron, magnesium, polyphenols, zinc, and
vitamins B6, B12, D, and E. Frontiers in Physiology, 3, 1-22.
Gómez, M. & Martinez, M.M. (2017). Fruit and vegetable by-products as novel ingredients to improve
the nutritional quality of baked goods. Critical Reviews in Food Science and Nutrition, 2017, 1-17.
IBGE Instituto Brasileiro de Geografia e Estatística. https://sidra.ibge.gov.br/home/lspa/brasil. Accessed
21 May 2018.
Jayathilakan, K., Sultana, K., Radhakrishna, K. & Bawa, A.S. (2012). Utilization of byproducts and waste
materials from meat, poultry and fish processing industries: a review. Journal of Food Science and
Technology, 49, 278-293.
Martins, Z.E., Pinho, O. & Ferreira, I.M.P.L.V.O. (2017). Food industry by-products used as functional
ingredients of bakery products. Trends in Food Science and Technology, 67, 106-128.
Miguel, A.C.A., Albertini, S., Begiato, G.F., Dias, J.R.P.S. & Spoto, M.H.F. (2008). Agroindustrial use for
the solids wastes deriving from minimally processed melon. Food Science and Technology
(Campinas), 28, 733-737.
Muller, N.G., Fasolo, D., Pinto, F.P., Bertê, R. & Muller, F.C. (2013). Phytochemical potentialities of
melon (Cucumis melo L.) in the northwest region of Rio Grande do Sul – Brazil. Revista Brasileira
de Plantas Medicinais, 15, 194-198.
Pasqualone, A., Laddomada, B., Alfio, S. & Giannone, V. (2017). Almond by-products: extraction and
characterization of phenolic compounds and evaluation of their potential use in composite dough
with wheat flour. LWT- Food Science and Technology, 89, 299-306.
Perussello, C., Zhang, Z., Marzochella, A. & Kumar T.B. (2017). Valorization of apple pomace by
extraction of valuable compounds. Comprehensive Reviews in Food Science and Food Safety, 16,
776-796.
14
Petkova, Z. & Antova, G. (2015). Proximate composition of seeds and seed oils from melon (Cucumis
melo L.) cultivated in Bulgaria. Cogent Food and Agriculture, 1: 1-15.
Prakitchaiwattana, C., Boonin, K. & Kaewklin, P. (2017). De-acidification of fresh whole pineapple juice
wine by secondary malolactic fermentation with lactic acid bacteria. International Food Research
Journal, 24, 223-231.
Quiles, A., Campbell, G.M., Struck, S., Rohm, H. & Hernando, I. (2018). Fiber from fruit pomace: a
review of applications in cereal-based products. Food Reviews International, 34, 1-46.
Sah, B.N., Vasiljevic, T., McKechnie, S. & Donkor, O.N. (2016). Effect of pineapple waste powder on
probiotic growth, antioxidant and antimutagenic activities of yogurt. Journal of Food Science and
Technology, 53, 1698-1708.
Sambuy, Y., De Angelis, I., Ranaldi, G., Scarino, M.L., Stammati, A. & Zucco, F. (2005). The Caco-2
cell line as a model of the intestinal barrier: influence of cell and culture-related factors on Caco-2
cell functional characteristics. Cell Biology and Toxicology, 21, 1-26.
Sampaio, A.C., Fumis, T.F., Leonel, S. (2011). Vegetative growth and fruit characteristics of five cultivars
of pineapple in the Bauru region. Revista Brasileira de Fruticultura, 33, 816-822.
Selani, M.M., Brazaca, S.G.C., Dias, C.T.S., Ratnayake, W.S., Flores, R.A. & Bianchini, A. (2014).
Characterization and potential application of pineapple pomace in an extruded product for fibre
enhancement. Food Chemistry, 163, 23-30.
Selani, M.M., Bianchini, A., Ratnayake, W.S., W.S., Flores, Massarioli, A.P., Alencar, S.M. & Canniatti-
Brazaca, S.G. (2016). Physicochemical, Functional and Antioxidant Properties of tropical fruits co-
products. Plants Foods for Human Nutrition, 71, 137-144.
Souza, F.T.C., Santos, E.R., Silva, J.C., Valentim, I.B., Rabelo, T.C.B., Andrade, N.R.F. & Silva, L.K.S.
(2018). Production of nutritious flour from residue custard apple (Annona squamosa L.) for the
development of new products. Journal of Food Quality, 2018, 1-10.
Storck, C.R., Nunes, G.L., Oliveira, B.B. & Basso, C. (2013). Folhas, talos, cascas e sementes de
vegetais: composição nutricional, aproveitamento na alimentação e análise sensorial de
preparações. Ciência Rural, 43, 537-543.
15
2. PINEAPPLE, APPLE AND MELON BY-PRODUCTS CAN INCREASE THE
CONTENTS OF PHENOLIC ACIDS AND FLAVONOIDS IN COOKIES AND
CONTRIBUTE TO THEIR ANTIOXIDANT CAPACITY
ABSTRACT
Fruit by-products usually present expressive amounts of phenolic compounds and their use has been explored in the development of new food products. This work aimed at determining the physicochemical properties of pineapple (PIB), apple (APB) and melon (MLB) by-products, besides evaluating their influence on the antioxidant capacity and phenolic compounds (phenolic acids and flavonoids) of cookies prepared with 15% of these by-products. The proximate composition showed that carbohydrates and fibers were the most relevant components in the by-products. The low values found for pH (4.19 to 5.48) and water activity (0.17 to 0.19) indicate that these by-products are not easily susceptible to deterioration. The by-products presented light color and tone close to yellow, which is desirable for their application in cookies. The APB by-product presented the highest total phenolic content (5.92 mg GAE/g) and highest antioxidant capacity by the methods DPPH and ABTS, which has reflected in the formulation of cookies. Eight phenolic compounds (vanillic acid, gallic acid, sinapic acid, salicylic acid, p-coumaric acid, catechin, epicatechin and rutin) were identified and quantified by high performance liquid chromatography (HPLC) in both the by-products and cookies. The results found indicate that fruit by-products can be applied in cookies formulations, contributing to their content of phenolic compounds and antioxidant capacity.
Keywords: Phenolic compounds; Polyphenols; Fruits; Biscuit; Waste; Residue; DPPH; ABTS
2.1. INTRODUCTION
It is estimated that after industrial processing, around 50% of the total weight of fruits and
vegetables become residues, which, when inadequately discarded, entail environmental problems and
operational costs. These by-products, however, usually present high nutritional value and considerable
content of bioactive compounds, which are important for a good intestinal functioning, weight control,
reduction in the blood cholesterol levels and a better control of the glycemic and insulin responses
(Gómez & Martinez, 2017). Even with so many attributes, there are still scarce viable alternatives for
the major part of plant by-products, which are usually employed as fertilizers or for animal feeding
(Paraman et al., 2015).
Peels, bagasse, membranes and seeds are the main by-products obtained from fruit
processing. It is known that the appropriate use of these by-products can minimize environmental
damages, add value to products and contribute to a more straightforward and sustainable production
(FAO, 2013). Fruits like apple, pineapple and melon are popularly consumed both in natura and
processed, especially in the production of juices, pulps, jellies and craft candies. These fruits are known
for their significant amounts of bioactive compounds such as fibers, vitamins and polyphenols (Sato et
al., 2010; Storck et al., 2013; Selani et al., 2016).
16
Phenolic compounds are derived from the plant secondary metabolism, and act mainly as a
response to ecological and physiological pressures. They are usually related to plant pigmentation and
can still play an antipathogenic role. In addition to being related to the antioxidant capacity, these
compounds attribute sensory characteristics to the foods, such as color, aromas, bitterness and
astringency (Martins, Pinho & Ferreira, 2017). Several phenolic compounds are described in literature
and, in the case of fruits, the phenolic acids and flavonoids are predominant.
The extraction of phenolic compounds from unconventional parts of foods have been explored
in the last years as an alternative to identify possible natural antioxidants, such as the phenolic
compounds, since their consumption is associated to beneficial effects to health because of incidence
reduction and prevention of chronic degenerative diseases, such as diabetes (Sivamaruthi, Kesika &
Chaiyasut, 2018), hypertension (Albuquerque et al., 2017), heart diseases and some types of cancers
(Ambigaipalan, De Camargo & Shahidi, 2016), and obesity (Zbikowska & Kowalska, 2017).
Given their high acceptance and versatility, baked products and cookies are usually employed
as sources of bioactive compounds and nutrients. Studies demonstrate that formulations enhanced with
plant by-products can contribute to the rise in the content of phenolic compounds and the antioxidant
capacity of these products (De Camargo et al., 2014; Tanska et al., 2016; Bhol, Lanka & Bosco, 2016).
As far as we know, no literature was found focusing on the use of pineapple central axis, apple endocarp
and melon peels as potential sources of antioxidant compounds in cookies formulations.
Therefore, the present work aimed at characterizing pineapple, apple and melon by-products,
besides evaluating their influence on the antioxidant capacity and the phenolic acids and flavonoids of
cookies prepared with 15% of these by-products. It is expected that this new approach will stimulate the
use of unconventional parts of foods, thus avoiding waste, besides adding value to the by-products and
functionality to cookies formulations.
2.2. MATERIAL AND METHODS
2.2.1. By-products
Pineapple (Pérola) central axis, melon peels (Yellow honeydew) and apple (Gala) endocarp
were provided by Della Natural, an industry of minimally-processed foods, located in Engenheiro
Coelho-SP, Brazil. In the same factory, the fruits have undergone a sanitation process with the
application of chlorine dioxide (1 mL/L). The by-products were packed in plastic bags and transported
at -18ºC to the Human Nutrition Laboratory of ESALQ/USP, then stored in freezer (-18°C) for a maximum
of 30 days. The material was dehydrated in an E-C Modulyo freeze-dryer (Apparatus Inc., New York,
USA) for 96h at -40ºC under pressure of 0.998 mbar. Subsequently, the by-products were ground in a
cutting mill (Marconi, Piracicaba, Brazil), sieved at 35 mesh (Abronzinox, 0.425 mm) and stored wrapped
in aluminum foil and plastic bags properly closed and frozen (-18ºC).
17
2.2.2. Characterization of the fruit by-products
2.2.2.1. Proximate composition
Moisture (gravimetric), ashes (gravimetric), proteins (Kjedahl, N x 6.25), and lipids (Sohxlet)
were determined according to AOAC (2005). Fibers (soluble and insoluble) were determined according
to the enzymatic method described by Asp, Johansson and Hallmer (1983). Available carbohydrates
were obtained by difference. All analyses were performed in quadruplicate.
2.2.2.2. Physicochemical analyses
The pH was measured using a potentiometer (Quimis, Q799-D2, São Paulo, Brazil) in the
samples in suspension at 10% (m/v). Water activity was verified using an Aqualab appliance (Series
4TE, Decagon devices Inc., Pullman, WA, USA) at 25ºC. Color parameters such as lightness (L), hue
angle (h) and chroma (C) were read in a colorimeter (Konica Minolta, Chroma Meter, CR-400, Tokyo,
Japan) with a measurement area of 8 mm in diameter, observation angle of 10ºC and standard illuminant
C. For the determination of the granulometry of the flours obtained after by-product grinding, sieves from
20 to 60 mesh were used, submitted to the action of a vibrator for 15 minutes (Coelho & Wosiacki, 2010).
All analyses were performed in triplicate.
2.2.2.3. Determination of pesticide residues
Analysis of pesticide multiresidue determination was performed in the fruit by-product samples
by ultra-high-pressure liquid chromatography and gas chromatography. The analysis was performed by
the company Agrosafety (Piracicaba, SP, Brazil), according to ABNT NBR ISO/IEC 17025. The
pesticides investigated and their Maximum Residue Limits (MRL) were stipulated according to the
recommendations of the authorized monographs bank found in the Brazilian Health Regulatory Agency
(ANVISA) and the Program for the Analysis of Pesticide Residues in Foods (PARA) (Brasil, 2015).
2.2.3. Cookies preparation
For the preparation of the cookies, formulations developed by Toledo et al. (2017) were
adopted. Initially, 105 g of sugar were mixed with 75 g of butter in a planetary mixer (Philips Walita,
RI7915, China) for 10 s. Subsequently, 50 g of eggs were added and the mixture was stirred for further
5 s. Then, 170 g of wheat flour and 30 g of by-products (15% of substitution of wheat flour by by-product
flour) were added. In the case of the control cookie, it was prepared with only wheat flour (200 g). Finally,
10 g of baking powder and 25 g of chocolate were added and mixed for 10 s. The cookies were cut with
a circular mold and baked in an electric oven (Perfecta, VIPAO Coral 4, Curitiba, Brazil) at 180ºC for 10

18
minutes. After cooling, the cookies were stored in plastic film and maintained at room temperature (25ºC)
until the moment of the analyses. Four formulations were prepared, which comprised the control (CCT)
and the cookies with 15% of fruit by-products: pineapple (CPI), apple (CAP) and melon (CML). The
procedure was repeated twice to obtain the batches.
The wheat flour type 1 with 10% of protein (Dona Benta), refined sugar (União), baking powder
(Royal), eggs (Qualitá), salted butter (Scala) and pieces of semisweet chocolate bar with 40% of cocoa
(Nestlé) used in cookie preparation were obtained from the local market in Piracicaba, SP, Brazil.
2.2.4. Total phenolics and antioxidant capacity
2.2.4.1. Extraction
Extracts were prepared from both the fruit by-products and the cookies. The fruit by-products
were used in their dehydrated form. On the other hand, the cookies were ground using mortar and pistil
and were sieved (Abronzinox, 1 mm). For being samples rich in lipids, the cookies were previously
degreased with hexane (m/v, 1:5). The solution was kept under stirring for 5 minutes and the process
was repeated three times. Subsequently, the solvent was discarded and the precipitate was placed on
filter paper and maintained in a laminar flow cabinet until drying (De Camargo et al., 2014). The material
was immediately used for the process of extraction. The extracts of the by-products and cookies were
prepared as described by Bloor (2001). Then, 1g of sample was weighed and 10 mL of the solvent
composed of ethanol:water (80:20 v/v) was added. The mixture was subjected to ultrasonic bath (Ultra
Cleaner, Unique, Indaiatuba, Brazil) at 25ºC for 20 minutes. The material was centrifuged (Nova Técnica
NT 825, Piracicaba, Brazil) at 4000 rpm for 15 minutes, with the supernatant being used for the analyses
of total phenolics, antioxidant capacity and determination of phenolic acids and flavonoids.
2.2.4.2. Total phenolic content
The total phenolic content was determined according to the spectrophotometric method
described by Singleton, Orthofer and Lamuela (1999). The analyses were conducted in triplicate and
the results were expressed in mg gallic acid equivalent (GAE)/g sample.
2.2.4.3. Antioxidant capacity
The antioxidant capacity was evaluated by DPPH assays, according to Brand-Williams,
Cuvelier and Berset (1995), and by ABTS assays, following the methodology described by Re et al.
(1999). In both methods, the analyses were conducted in triplicates and Trolox was used as reference
standard. The results were expressed in μmol of Trolox/g sample.
19
2.2.5. Identification and quantification of the phenolic acids and flavonoids by HPLC
The quantitative and qualitative determination of the phenolic acids and flavonoids was
performed according to He et al. (2011) with adaptations. A high performance liquid chromatography
(HPLC) (Shimadzu 20A, Kyoto, Japan) was used, equipped with a pumping system model LC-20AT,
automatic sample injector model SIL-20AHT, column oven model CTO-20A, communicator model CBM-
20A and UV detector (280 and 370 nm) model SPD-20A. A C18 column (Waters Spherisorb ODS2; 4.6
x 250 mm, 5 μm) was employed for the separation at 40°C maintained by the column oven. The mobile
phases used were A (1% of formic acid in aqueous solution) and B (100% of methanol), which were
eluted in a linear gradient: solvent A from 100 to 40% in 45 minutes and from 40 to 0% in 5 minutes,
returning to 100% in 10 minutes and lastly maintained at 100 % for 5 more minutes. The flow used was
of 0.7 mL/min. The identification of the phenolic compounds was confirmed by the comparison of their
retention times and UV/visible spectrum with those of the authentic materials. For quantification, the
calibration curves were made from authentic standards (Sigma-Aldrich, St Louis, MO, USA). To validate
the method, the linearity, limits of detection (LOD) and quantification (LOQ) were determined.
2.2.6. Statistical analyses
A completely randomized design was used. The data were subjected to analysis of variance
(ANOVA) for the F test and the comparison of means by Tukey’s test (p<0.05). The analyses were
performed by the software Statistical Analysis System (SAS) version 9.2.
2.3. RESULTS AND DISCUSSION
2.3.1. Characterization of the fruit by-products
The fruit by-products were prepared in the form of flour to be used on the cookie’s formulation.
Tests to evaluate the best drying method were perfomed in a forced air circulation oven (60ºC) for 24h
and by freeze drying at -40ºC. The oven drying method, although considered less expensive, was not
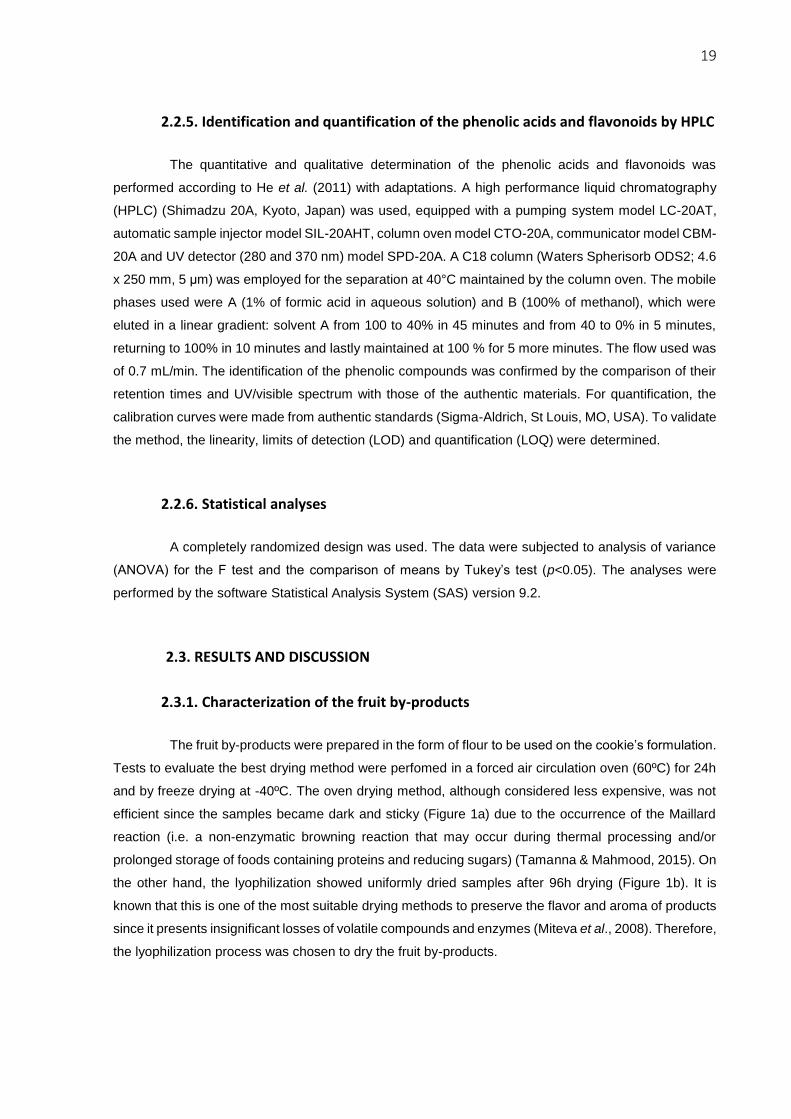
efficient since the samples became dark and sticky (Figure 1a) due to the occurrence of the Maillard
reaction (i.e. a non-enzymatic browning reaction that may occur during thermal processing and/or
prolonged storage of foods containing proteins and reducing sugars) (Tamanna & Mahmood, 2015). On
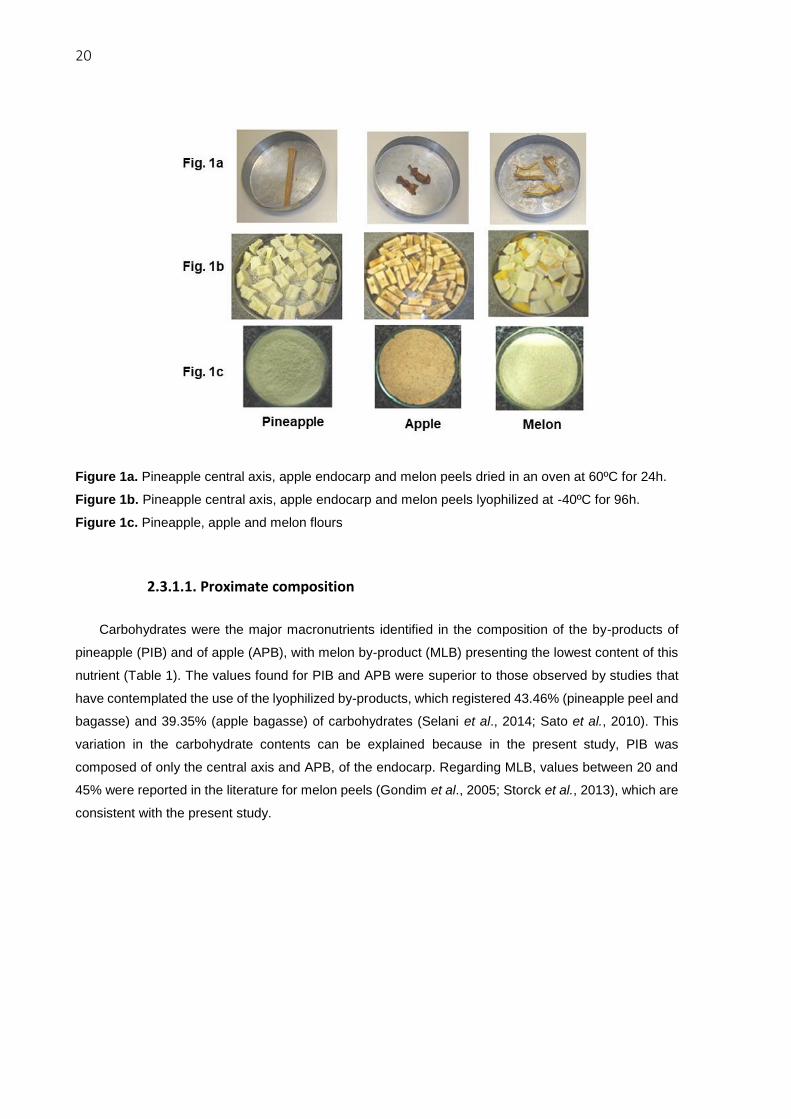
the other hand, the lyophilization showed uniformly dried samples after 96h drying (Figure 1b). It is
known that this is one of the most suitable drying methods to preserve the flavor and aroma of products
since it presents insignificant losses of volatile compounds and enzymes (Miteva et al., 2008). Therefore,
the lyophilization process was chosen to dry the fruit by-products.
20
Figure 1a. Pineapple central axis, apple endocarp and melon peels dried in an oven at 60ºC for 24h.
Figure 1b. Pineapple central axis, apple endocarp and melon peels lyophilized at -40ºC for 96h.
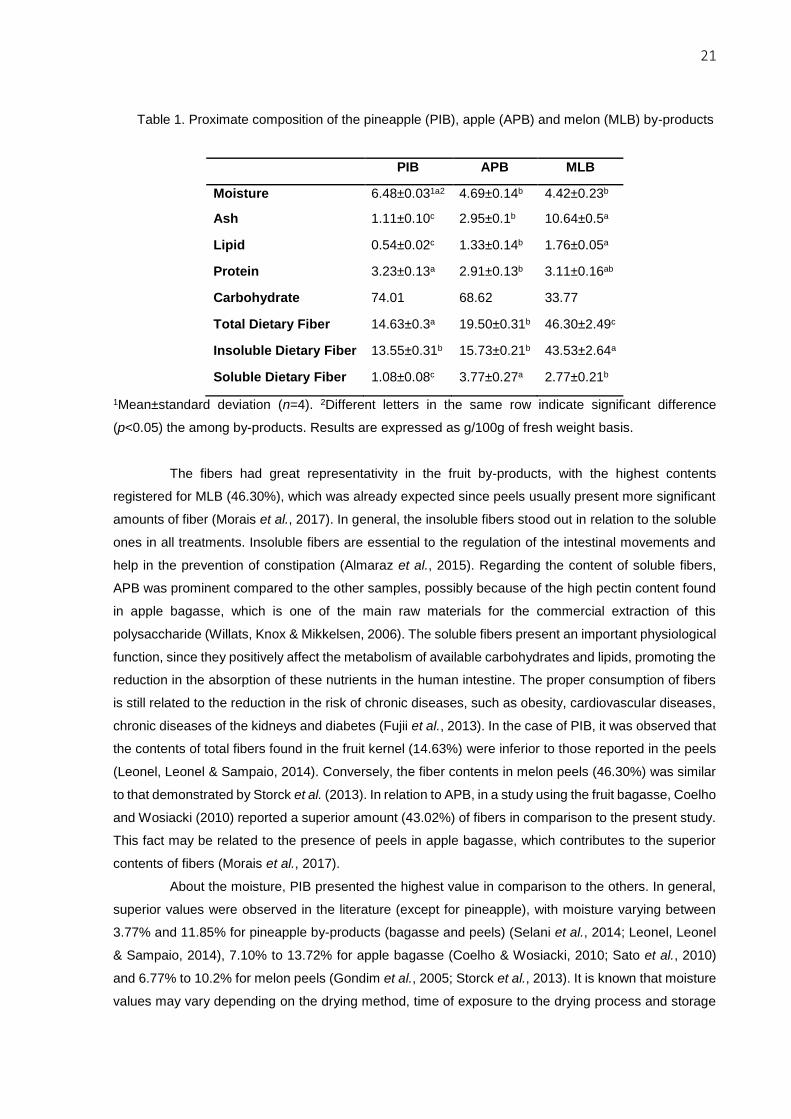
Figure 1c. Pineapple, apple and melon flours
2.3.1.1. Proximate composition
Carbohydrates were the major macronutrients identified in the composition of the by-products of
pineapple (PIB) and of apple (APB), with melon by-product (MLB) presenting the lowest content of this
nutrient (Table 1). The values found for PIB and APB were superior to those observed by studies that
have contemplated the use of the lyophilized by-products, which registered 43.46% (pineapple peel and
bagasse) and 39.35% (apple bagasse) of carbohydrates (Selani et al., 2014; Sato et al., 2010). This
variation in the carbohydrate contents can be explained because in the present study, PIB was
composed of only the central axis and APB, of the endocarp. Regarding MLB, values between 20 and
45% were reported in the literature for melon peels (Gondim et al., 2005; Storck et al., 2013), which are
consistent with the present study.
21
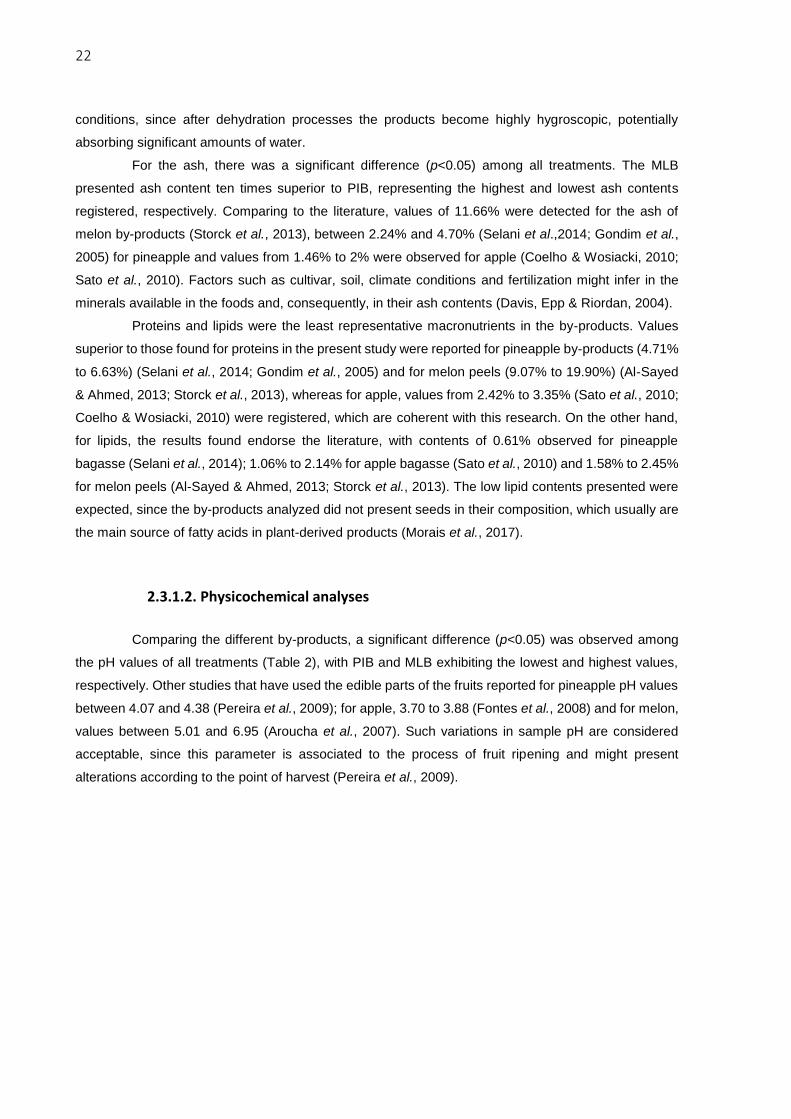
Table 1. Proximate composition of the pineapple (PIB), apple (APB) and melon (MLB) by-products
PIB APB MLB
Moisture 6.48±0.031a2 4.69±0.14b 4.42±0.23b
Ash 1.11±0.10c 2.95±0.1b 10.64±0.5a
Lipid 0.54±0.02c 1.33±0.14b 1.76±0.05a
Protein 3.23±0.13a 2.91±0.13b 3.11±0.16ab
Carbohydrate 74.01 68.62 33.77
Total Dietary Fiber 14.63±0.3a 19.50±0.31b 46.30±2.49c
Insoluble Dietary Fiber 13.55±0.31b 15.73±0.21b 43.53±2.64a
Soluble Dietary Fiber 1.08±0.08c 3.77±0.27a 2.77±0.21b
1Mean±standard deviation (n=4). 2Different letters in the same row indicate significant difference
(p<0.05) the among by-products. Results are expressed as g/100g of fresh weight basis.
The fibers had great representativity in the fruit by-products, with the highest contents
registered for MLB (46.30%), which was already expected since peels usually present more significant
amounts of fiber (Morais et al., 2017). In general, the insoluble fibers stood out in relation to the soluble
ones in all treatments. Insoluble fibers are essential to the regulation of the intestinal movements and
help in the prevention of constipation (Almaraz et al., 2015). Regarding the content of soluble fibers,
APB was prominent compared to the other samples, possibly because of the high pectin content found
in apple bagasse, which is one of the main raw materials for the commercial extraction of this
polysaccharide (Willats, Knox & Mikkelsen, 2006). The soluble fibers present an important physiological
function, since they positively affect the metabolism of available carbohydrates and lipids, promoting the
reduction in the absorption of these nutrients in the human intestine. The proper consumption of fibers
is still related to the reduction in the risk of chronic diseases, such as obesity, cardiovascular diseases,
chronic diseases of the kidneys and diabetes (Fujii et al., 2013). In the case of PIB, it was observed that
the contents of total fibers found in the fruit kernel (14.63%) were inferior to those reported in the peels
(Leonel, Leonel & Sampaio, 2014). Conversely, the fiber contents in melon peels (46.30%) was similar
to that demonstrated by Storck et al. (2013). In relation to APB, in a study using the fruit bagasse, Coelho
and Wosiacki (2010) reported a superior amount (43.02%) of fibers in comparison to the present study.
This fact may be related to the presence of peels in apple bagasse, which contributes to the superior
contents of fibers (Morais et al., 2017).
About the moisture, PIB presented the highest value in comparison to the others. In general,
superior values were observed in the literature (except for pineapple), with moisture varying between
3.77% and 11.85% for pineapple by-products (bagasse and peels) (Selani et al., 2014; Leonel, Leonel
& Sampaio, 2014), 7.10% to 13.72% for apple bagasse (Coelho & Wosiacki, 2010; Sato et al., 2010)
and 6.77% to 10.2% for melon peels (Gondim et al., 2005; Storck et al., 2013). It is known that moisture
values may vary depending on the drying method, time of exposure to the drying process and storage
22
conditions, since after dehydration processes the products become highly hygroscopic, potentially
absorbing significant amounts of water.
For the ash, there was a significant difference (p<0.05) among all treatments. The MLB
presented ash content ten times superior to PIB, representing the highest and lowest ash contents
registered, respectively. Comparing to the literature, values of 11.66% were detected for the ash of
melon by-products (Storck et al., 2013), between 2.24% and 4.70% (Selani et al.,2014; Gondim et al.,
2005) for pineapple and values from 1.46% to 2% were observed for apple (Coelho & Wosiacki, 2010;
Sato et al., 2010). Factors such as cultivar, soil, climate conditions and fertilization might infer in the
minerals available in the foods and, consequently, in their ash contents (Davis, Epp & Riordan, 2004).
Proteins and lipids were the least representative macronutrients in the by-products. Values
superior to those found for proteins in the present study were reported for pineapple by-products (4.71%
to 6.63%) (Selani et al., 2014; Gondim et al., 2005) and for melon peels (9.07% to 19.90%) (Al-Sayed
& Ahmed, 2013; Storck et al., 2013), whereas for apple, values from 2.42% to 3.35% (Sato et al., 2010;
Coelho & Wosiacki, 2010) were registered, which are coherent with this research. On the other hand,
for lipids, the results found endorse the literature, with contents of 0.61% observed for pineapple
bagasse (Selani et al., 2014); 1.06% to 2.14% for apple bagasse (Sato et al., 2010) and 1.58% to 2.45%
for melon peels (Al-Sayed & Ahmed, 2013; Storck et al., 2013). The low lipid contents presented were
expected, since the by-products analyzed did not present seeds in their composition, which usually are
the main source of fatty acids in plant-derived products (Morais et al., 2017).
2.3.1.2. Physicochemical analyses
Comparing the different by-products, a significant difference (p<0.05) was observed among
the pH values of all treatments (Table 2), with PIB and MLB exhibiting the lowest and highest values,
respectively. Other studies that have used the edible parts of the fruits reported for pineapple pH values
between 4.07 and 4.38 (Pereira et al., 2009); for apple, 3.70 to 3.88 (Fontes et al., 2008) and for melon,
values between 5.01 and 6.95 (Aroucha et al., 2007). Such variations in sample pH are considered
acceptable, since this parameter is associated to the process of fruit ripening and might present
alterations according to the point of harvest (Pereira et al., 2009).
23
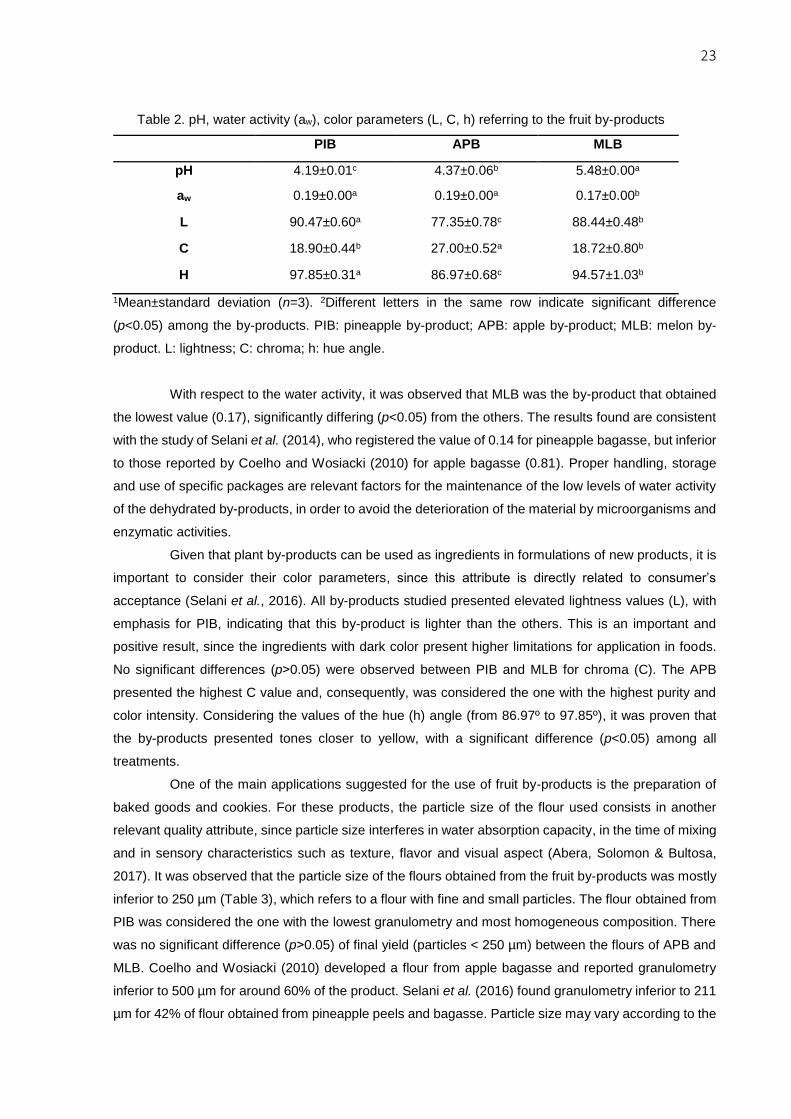
Table 2. pH, water activity (aw), color parameters (L, C, h) referring to the fruit by-products
PIB APB MLB
pH 4.19±0.01c 4.37±0.06b 5.48±0.00a
aw 0.19±0.00a 0.19±0.00a 0.17±0.00b
L 90.47±0.60a 77.35±0.78c 88.44±0.48b
C 18.90±0.44b 27.00±0.52a 18.72±0.80b
H 97.85±0.31a 86.97±0.68c 94.57±1.03b
1Mean±standard deviation (n=3). 2Different letters in the same row indicate significant difference
(p<0.05) among the by-products. PIB: pineapple by-product; APB: apple by-product; MLB: melon by-
product. L: lightness; C: chroma; h: hue angle.
With respect to the water activity, it was observed that MLB was the by-product that obtained
the lowest value (0.17), significantly differing (p<0.05) from the others. The results found are consistent
with the study of Selani et al. (2014), who registered the value of 0.14 for pineapple bagasse, but inferior
to those reported by Coelho and Wosiacki (2010) for apple bagasse (0.81). Proper handling, storage
and use of specific packages are relevant factors for the maintenance of the low levels of water activity
of the dehydrated by-products, in order to avoid the deterioration of the material by microorganisms and
enzymatic activities.
Given that plant by-products can be used as ingredients in formulations of new products, it is
important to consider their color parameters, since this attribute is directly related to consumer’s
acceptance (Selani et al., 2016). All by-products studied presented elevated lightness values (L), with
emphasis for PIB, indicating that this by-product is lighter than the others. This is an important and
positive result, since the ingredients with dark color present higher limitations for application in foods.
No significant differences (p˃0.05) were observed between PIB and MLB for chroma (C). The APB
presented the highest C value and, consequently, was considered the one with the highest purity and
color intensity. Considering the values of the hue (h) angle (from 86.97º to 97.85º), it was proven that
the by-products presented tones closer to yellow, with a significant difference (p<0.05) among all
treatments.
One of the main applications suggested for the use of fruit by-products is the preparation of
baked goods and cookies. For these products, the particle size of the flour used consists in another
relevant quality attribute, since particle size interferes in water absorption capacity, in the time of mixing
and in sensory characteristics such as texture, flavor and visual aspect (Abera, Solomon & Bultosa,
2017). It was observed that the particle size of the flours obtained from the fruit by-products was mostly
inferior to 250 µm (Table 3), which refers to a flour with fine and small particles. The flour obtained from
PIB was considered the one with the lowest granulometry and most homogeneous composition. There
was no significant difference (p˃0.05) of final yield (particles < 250 µm) between the flours of APB and
MLB. Coelho and Wosiacki (2010) developed a flour from apple bagasse and reported granulometry
inferior to 500 µm for around 60% of the product. Selani et al. (2016) found granulometry inferior to 211
µm for 42% of flour obtained from pineapple peels and bagasse. Particle size may vary according to the
24
fruit by-products, methods used for their preparation and considering the destination and application of
the material.
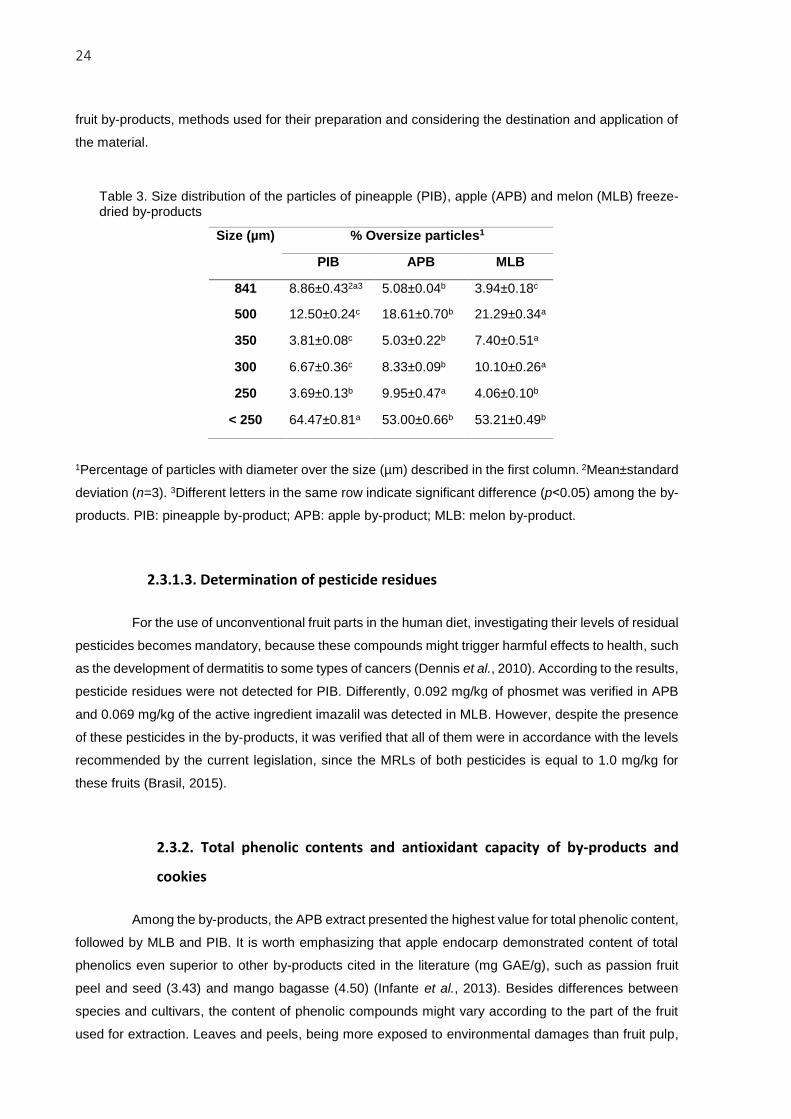
Table 3. Size distribution of the particles of pineapple (PIB), apple (APB) and melon (MLB) freeze-dried by-products
Size (µm) % Oversize particles1
PIB APB MLB
841
8.86±0.432a3 5.08±0.04b 3.94±0.18c
500
12.50±0.24c 18.61±0.70b 21.29±0.34a
350
3.81±0.08c 5.03±0.22b 7.40±0.51a
300
6.67±0.36c 8.33±0.09b 10.10±0.26a
250 3.69±0.13b 9.95±0.47a 4.06±0.10b
< 250 64.47±0.81a 53.00±0.66b 53.21±0.49b
1Percentage of particles with diameter over the size (µm) described in the first column. 2Mean±standard
deviation (n=3). 3Different letters in the same row indicate significant difference (p˂0.05) among the by-
products. PIB: pineapple by-product; APB: apple by-product; MLB: melon by-product.
2.3.1.3. Determination of pesticide residues
For the use of unconventional fruit parts in the human diet, investigating their levels of residual
pesticides becomes mandatory, because these compounds might trigger harmful effects to health, such
as the development of dermatitis to some types of cancers (Dennis et al., 2010). According to the results,
pesticide residues were not detected for PIB. Differently, 0.092 mg/kg of phosmet was verified in APB
and 0.069 mg/kg of the active ingredient imazalil was detected in MLB. However, despite the presence
of these pesticides in the by-products, it was verified that all of them were in accordance with the levels
recommended by the current legislation, since the MRLs of both pesticides is equal to 1.0 mg/kg for
these fruits (Brasil, 2015).
2.3.2. Total phenolic contents and antioxidant capacity of by-products and
cookies
Among the by-products, the APB extract presented the highest value for total phenolic content,
followed by MLB and PIB. It is worth emphasizing that apple endocarp demonstrated content of total
phenolics even superior to other by-products cited in the literature (mg GAE/g), such as passion fruit
peel and seed (3.43) and mango bagasse (4.50) (Infante et al., 2013). Besides differences between
species and cultivars, the content of phenolic compounds might vary according to the part of the fruit
used for extraction. Leaves and peels, being more exposed to environmental damages than fruit pulp,
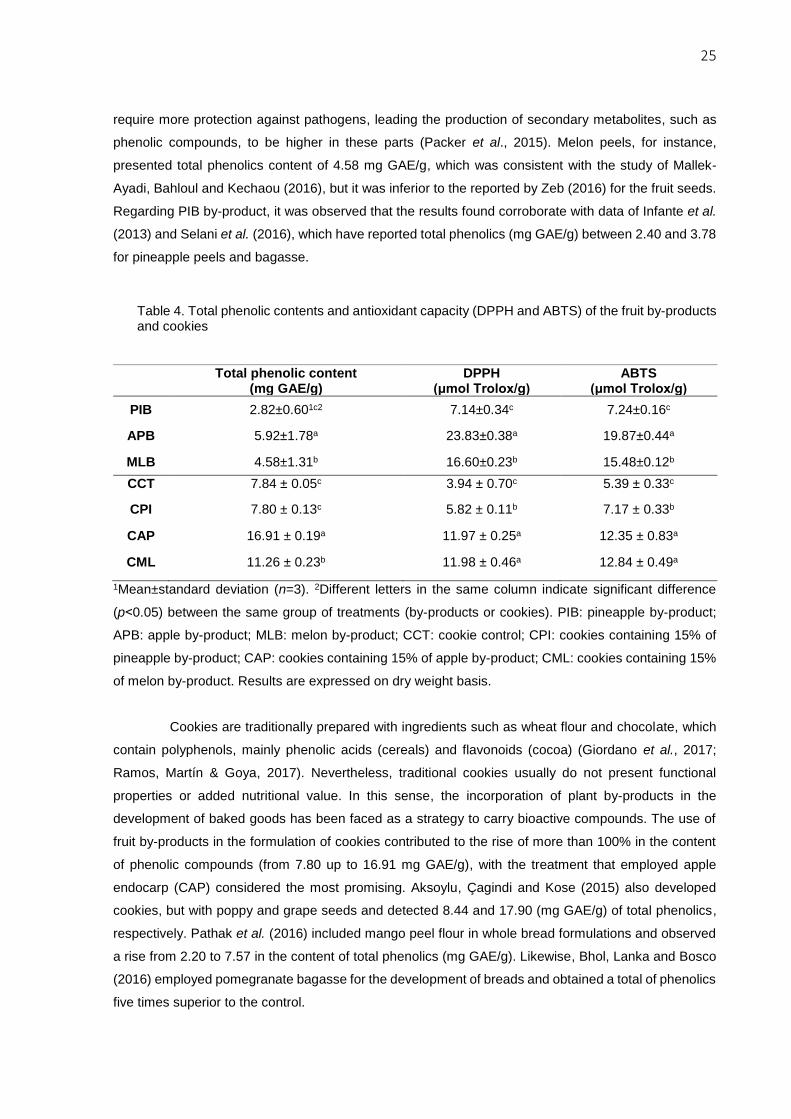
25
require more protection against pathogens, leading the production of secondary metabolites, such as
phenolic compounds, to be higher in these parts (Packer et al., 2015). Melon peels, for instance,
presented total phenolics content of 4.58 mg GAE/g, which was consistent with the study of Mallek-
Ayadi, Bahloul and Kechaou (2016), but it was inferior to the reported by Zeb (2016) for the fruit seeds.
Regarding PIB by-product, it was observed that the results found corroborate with data of Infante et al.
(2013) and Selani et al. (2016), which have reported total phenolics (mg GAE/g) between 2.40 and 3.78
for pineapple peels and bagasse.
Table 4. Total phenolic contents and antioxidant capacity (DPPH and ABTS) of the fruit by-products and cookies
Total phenolic content (mg GAE/g)
DPPH (μmol Trolox/g)
ABTS (μmol Trolox/g)
PIB 2.82±0.601c2 7.14±0.34c 7.24±0.16c
APB 5.92±1.78a 23.83±0.38a 19.87±0.44a
MLB 4.58±1.31b 16.60±0.23b 15.48±0.12b
CCT 7.84 ± 0.05c 3.94 ± 0.70c 5.39 ± 0.33c
CPI 7.80 ± 0.13c 5.82 ± 0.11b 7.17 ± 0.33b
CAP 16.91 ± 0.19a 11.97 ± 0.25a 12.35 ± 0.83a
CML 11.26 ± 0.23b 11.98 ± 0.46a 12.84 ± 0.49a
1Mean±standard deviation (n=3). 2Different letters in the same column indicate significant difference
(p˂0.05) between the same group of treatments (by-products or cookies). PIB: pineapple by-product;
APB: apple by-product; MLB: melon by-product; CCT: cookie control; CPI: cookies containing 15% of
pineapple by-product; CAP: cookies containing 15% of apple by-product; CML: cookies containing 15%
of melon by-product. Results are expressed on dry weight basis.
Cookies are traditionally prepared with ingredients such as wheat flour and chocolate, which
contain polyphenols, mainly phenolic acids (cereals) and flavonoids (cocoa) (Giordano et al., 2017;
Ramos, Martín & Goya, 2017). Nevertheless, traditional cookies usually do not present functional
properties or added nutritional value. In this sense, the incorporation of plant by-products in the
development of baked goods has been faced as a strategy to carry bioactive compounds. The use of
fruit by-products in the formulation of cookies contributed to the rise of more than 100% in the content
of phenolic compounds (from 7.80 up to 16.91 mg GAE/g), with the treatment that employed apple
endocarp (CAP) considered the most promising. Aksoylu, Çagindi and Kose (2015) also developed
cookies, but with poppy and grape seeds and detected 8.44 and 17.90 (mg GAE/g) of total phenolics,
respectively. Pathak et al. (2016) included mango peel flour in whole bread formulations and observed
a rise from 2.20 to 7.57 in the content of total phenolics (mg GAE/g). Likewise, Bhol, Lanka and Bosco
(2016) employed pomegranate bagasse for the development of breads and obtained a total of phenolics
five times superior to the control.

26
The antioxidant capacity of the compounds present in the foods is related to the chemical
structure, which is responsible for redox properties, and which develop a fundamental role in the
adsorption and neutralization of the reactive oxygen species (ROS), eliminating the singlet and triplet
oxygen, or decomposing the peroxides (Cartea et al., 2011). Similarly, to the content of total phenolics,
there was also a significant difference (p˂0.05) among the antioxidant capacity of the by-products,
especially APB. In general, the incorporation of fruit by-products in cookies increased their antioxidant
capacity (Table 4), as demonstrated by the results obtained by DPPH and ABTS assays.
Despite being considered direct methods, it was observed that by the DPPH method, the
values of antioxidant capacity (μmol of Trolox/g) varied between 7.14 and 23.83 for the by-products and
3.94 to 11.98 for the cookies, whereas with the ABTS method, results from 7.24 to 19.87 and between
5.39 and 12.84 were observed for by-products and cookies, respectively. This variation in the results is
attributed to the distinct way for evaluation of the antioxidant capacity of each method, besides being
distinguished in relation to the solubility of the compounds identified: by ABTS assays, both the lipophilic
and hydrophilic compounds can be identified, whereas by DPPH assays, there is a higher sensitivity for
the hydrophilic compounds (Müller, Fröhlich & Böhm. 2011). For both methods, it was observed that the
antioxidant capacity of the by-products was superior to the cookies, which was expected since the fruit
by-products usually present more complex profiles and more expressive amounts of phenolics than the
products based on cereals (Gómez & Martinez, 2017; Giordano et al., 2017). In the case of baked goods
and cookies, the baking step can help in the release of conjugated phenolic acids, contributing to the
content of total phenolic compounds and antioxidant capacity. Other reactions such as Maillard,
caramelization and oxidation of phenols may contribute to the rise in total phenolic compounds in foods
(Ragaee, Seetharaman & Abdel Aal, 2014).
2.3.3. Phenolic acids and flavonoids
Phenolic acids and flavonoids are considered the most abundant phenolic compounds in
foods. Considering the phenolic compounds identified, fruit by-products APB and MLB presented
respectively 7 and 5 phenolic compounds among the 8 analyzed. The MLB was prominent, especially
for the presence of sinapic acid and salicylic acid (Table 5). Among the flavonoids, rutin was the
compound of major relevance in this by-product. Other compounds, such as vanillic acid and catechin,
were also identified, but in lower amounts when compared to the other by-products. Mariod and
Matthaus (2008) also identified expressive amounts of sinapic acid, vanillic acid and catechins but in
melon seeds. Rolim et al. (2018) demonstrated that there are differences among melon by-products,
with a higher occurrence of phenolics in the peels than in the seeds, with a prevalence of gallic acid,
salicylic acid and catechin in the first, whereas in the seeds, higher concentrations of vanillic acid,
salicylic acid and catechin were observed.
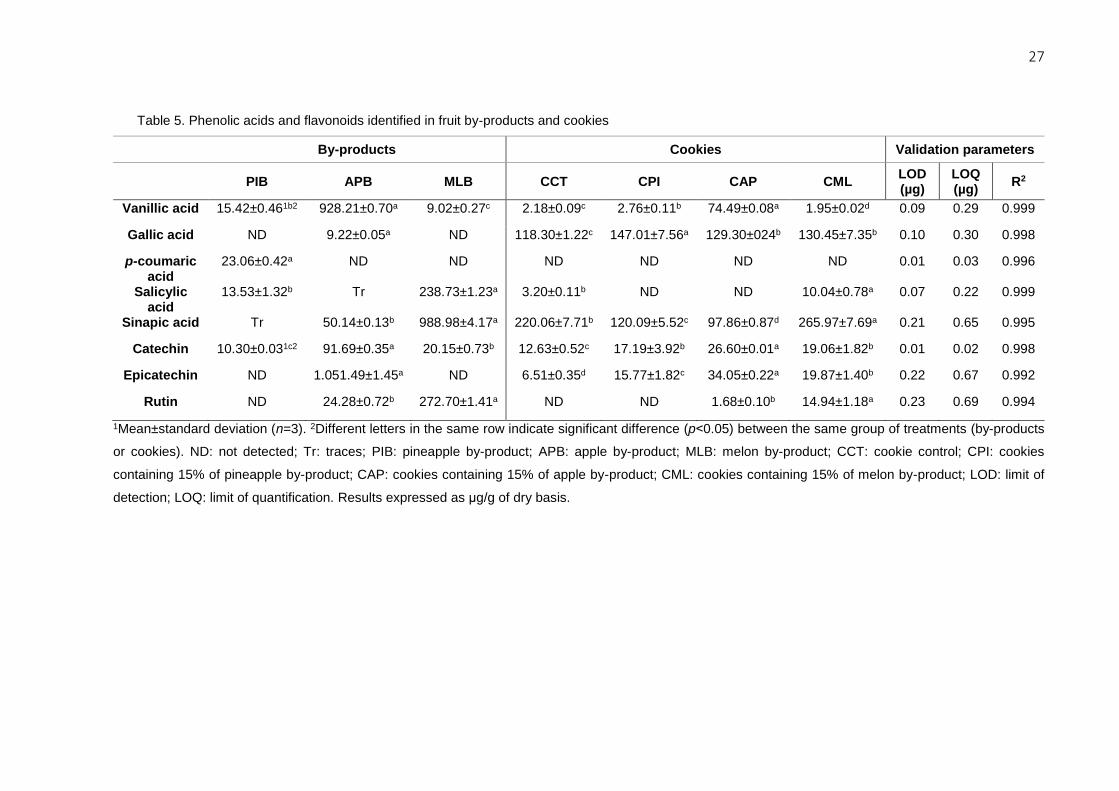
27
Table 5. Phenolic acids and flavonoids identified in fruit by-products and cookies
By-products Cookies Validation parameters
PIB APB MLB CCT CPI CAP CML
LOD (µg)
LOQ (µg)
R2
Vanillic acid 15.42±0.461b2 928.21±0.70a 9.02±0.27c 2.18±0.09c 2.76±0.11b 74.49±0.08a 1.95±0.02d 0.09 0.29 0.999
Gallic acid ND 9.22±0.05a ND 118.30±1.22c 147.01±7.56a 129.30±024b 130.45±7.35b 0.10 0.30 0.998
p-coumaric acid
23.06±0.42a ND ND ND ND ND ND 0.01 0.03 0.996
Salicylic acid
13.53±1.32b Tr 238.73±1.23a 3.20±0.11b ND ND 10.04±0.78a 0.07 0.22 0.999
Sinapic acid Tr 50.14±0.13b 988.98±4.17a 220.06±7.71b 120.09±5.52c 97.86±0.87d 265.97±7.69a 0.21 0.65 0.995
Catechin 10.30±0.031c2 91.69±0.35a 20.15±0.73b 12.63±0.52c 17.19±3.92b 26.60±0.01a 19.06±1.82b 0.01 0.02 0.998
Epicatechin ND 1.051.49±1.45a ND 6.51±0.35d 15.77±1.82c 34.05±0.22a 19.87±1.40b 0.22 0.67 0.992
Rutin ND 24.28±0.72b 272.70±1.41a ND ND 1.68±0.10b 14.94±1.18a 0.23 0.69 0.994
1Mean±standard deviation (n=3). 2Different letters in the same row indicate significant difference (p˂0.05) between the same group of treatments (by-products
or cookies). ND: not detected; Tr: traces; PIB: pineapple by-product; APB: apple by-product; MLB: melon by-product; CCT: cookie control; CPI: cookies
containing 15% of pineapple by-product; CAP: cookies containing 15% of apple by-product; CML: cookies containing 15% of melon by-product; LOD: limit of
detection; LOQ: limit of quantification. Results expressed as μg/g of dry basis.
28
Apple by-product (APB), which represented a more expressive result for total phenolic content
and antioxidant capacity, also demonstrated (Table 5) high amounts of epicatechin and vanillic acid and,
in lower concentrations, catechin, sinapic acid, rutin and gallic acid. Literature indicates that phenolic
acids, such as salicylic, gallic, propylgalate and sinapic are frequent in apple bagasse (Soares et al.,
2008), whereas in the peels, there is predominance of flavonoids such as quercetin, catechin,
epicatechin and procyanidins, besides chlorogenic acid (Assumpção et al., 2018).
On the other hand, pineapple by-product (PIB) presented the least significant amounts of
phenolic compounds, with p-coumaric acid as the most relevant compound, followed by vanillic and
salicylic acids. Regarding flavonoids, only catechin was identified. According to Wen and Wrolstad
(2002) and Bataglion et al. (2015), in pineapple fruit there are phenolic acids such as: p-coumaric, ferulic,
sinapic, caffeic, syringic and p-hydroxybenzoic, whereas among the flavonoids, kaempferol and
quercetin are the most significant.
For the cookies, it was observed that the addition of fruit by-products significantly increased
the concentrations of the phenolic compounds analyzed in relation to the control, except for the salicylic
acid in CPI and CAP (Table 5). The control (CCT), when compared to CPI and CAP, presented higher
concentration of only sinapic acid. Conversely, CML demonstrated values of sinapic and salicylic acids
120% and 313% superior to CCT, respectively, in addition of significant amounts of catechin, epicatechin
and rutin. It is worth mentioning that wheat flour, the main ingredient of the cookies, also presents
relevant amounts of phenolic compounds, with emphasis in the ferulic, sinapic, p-coumaric, syringic and
vanillic acids (Gotti et al., 2018).
For CAP, relevant concentrations of vanillic acid, catechin an epicatechin were verified,
whereas for CPI, there was prevalence of gallic acid, followed by sinapic acid, vanillic acid, epicatechin
and catechin. Hidalgo et al. (2018), studying formulations of biscuits prepared with only wheat flour and
water, identified the predominance of ferulic acid, followed by p-coumaric, vanillic and p-hydroxybenzoic
acids in their formulation. According to Ragaee, Seetharaman and Abdel-Aal (2014), baking might also
affect the proportion of various phenolic compounds because of thermal degradation (e.g. vanillin and
vanillic acid can be produced by the decomposition of ferulic acid). Furthermore, the authors affirm that
the oven might favor the release of some phenolic acids, such as syringic, ferulic, vanillic and p-coumaric
or simple phenolics from wheat flour because of the degradation of conjugated compounds, such as
tannins.
2.4. CONCLUSIONS
Regarding fruit by-products, carbohydrates and fibers were the components present in the
highest amounts, whereas proteins and lipids presented less representative values. It was verified that
all by-products were within the normative standards stipulated for pesticide residues, demonstrating that
the application of these by-products in food products did not represent health risks regarding this aspect.
The low values for pH and water activity reported contribute to the low risk of by-product deterioration
by microbial or enzymatic activity. Furthermore, all by-products presented light color and tone close to
yellow, which is desirable, since the ingredients with dark color might limit the application in cookies.
29
The partial replacement of wheat flour by fruit by-products in cookies positively influenced the
content of total phenolics, antioxidant capacity and the concentration of phenolic acids and flavonoids.
The melon and apple by-products presented more significant amounts of phenolic compounds when
compared to the pineapple by-product, which reflected in the cookies formulations. Therefore, the use
of fruit by-products can be indicated to enhance the quality of cookies with respect to the presence of
phenolic compounds and antioxidant capacity.
REFERENCES
Abera, G., Solomon, W.K. & Bultosa, G. (2017). Effect of drying methods and blending ratios on dough
rheological properties, physical and sensory properties of wheat–taro flour composite bread. Food
Science & Nutrition, 5, 653-661.
Albuquerque, J.G.F, Assis, V.L, Almeida, A.J.P.O., Basilio, I.J.L.D., Luciano, M.N., Meireles, B.R.L.A.,
Cordeiro, A.M.T.M., Araújo, I.G.A., Veras, R.C., Ribeiro, T.P. & Medeiros, I.A. (2017). Antioxidant
and vasorelaxant activities induced by northestern Brazilian fermented grape skins. BCM
Complementary and Alternative Medicine, 17, 1-8.
Almaraz, R.S., Fuentes, M.M., Milla, S.P., Plaza, B.L., Lopez, L.M.B. & Candela, C.G. (2015). Fiber-
type indication among different pathologies. Nutricion Hospitalaria, 31,2372-2383.
Al-Sayed, H.M.A. & Ahmed, A.R. (2013). Utilization of watermelon rinds and sharlyn melon peels as a
natural source of dietary fiber and antioxidants in cake. Annals of Agricultural Science, 58, 83–95.
Ambigaipalan, P., de Camargo, A.C. & Shahidi, F. (2016). Phenolic compounds of pomegranate
byproducts (outer skin, mesocarp, divider membrane) and their antioxidant activities. Journal of
Agricultural and Food Chemistry, 64, 6584-6604.
AOAC Association of Official Analytical Chemists. 2005. Official Methods of Analysis of AOAC
International. 18th ed. Gaithersburg: AOAC International.
Aroucha, E.M.M., Morais, F.A., Nunes, G.H.S., Tomaz, H.V.Q., Sousa, A.E.D. & Neto, F.B. (2007).
Caracterização física e química de melão durante o seu desenvolvimento. Revista Brasileira de
Fruticultura, 29, 296-301.
Aksoylu, Z., Çagindi, O. & Kose, E. (2015). Effects of blueberry, grape seed powder and poppy seed
incorporation on physicochemical and sensory properties of biscuit. Journal of Food Quality, 38,164-
174.
Asp, N. G., Johansson, C. G. & Hallmer, H. (1983). Rapid enzimatic assay of insoluble and soluble
dietary fiber. Journal of Agricultural and Food Chemistry, 31, 476-482.
Assumpção, C.F., Hermes, V.S., Pagno, C., Castagna, A., Mannucci, A., Sgherri, C., Pinzino, C.,
Ranieri, A., Flôres, S.H. & Rios, A.O. (2018). Phenolic enrichment in apple skin following post-
harvest fruit UV-B treatment. Postharvest Biology and Technology, 138, 37-45.
Bataglion, G.A., Da Silva, F.M.A., Eberlin, M.N. & Koolen, H.H.F. (2015). Determination of the phenolic
composition from Brazilian tropical fruits by UHPLC-MS/MS. Food Chemistry, 180, 280-287.
Bhol, S., Lanka, D. & Bosco, S.J.D. (2016). Quality characteristics and antioxidant properties of breads
incorporated with pomegranate whole fruit bagasse. Journal of Food Science and Technology, 53,
1717-1721.
30
Bloor, S. J. (2001). Overview of methods for analysis and identification of flavonoids. Methods in
Enzymology, 335, 3-14.
Brand-Williams, W., Cuvelier, M. E. & Berset, C. (1995). Use of a free radical method to evaluate
antioxidant activity. LWT - Food Science and Technology, 28, 25–30.
Brasil. Agência Nacional de Vigilância Sanitária. (2015). Monografias Autorizadas - Programa de
Análise de Resíduos de Agrotóxicos em Alimentos (PARA). Relatório 2013-2015.
http://portal.anvisa.gov.br/programa-de-analise-de-registro-de-agrotoxicos-para. Accessed 05 May
2018.
Cartea, M.E., Francisco, M., Soengas, P. & Velasco, P. (2011). Phenolic compounds in Brassica
vegetables. Molecules, 16, 251-280.
Coelho, L. & Wosiacki, G. (2010). Sensory evaluation of bakery products with the addition of apple
pomace flour. Food Science and Technology (Campinas), 30, 582-588.
Davis, D.R., Epp, M.D. & Riordan, H.D. (2004). Changes in USDA food composition data for 43 garden
crops, 1950 to 1999. Journal of the American College of Nutrition, 23, 669-682.
De Camargo, A.C., Vidal, C.M.M., Canniatti-Brazaca, S.G. & Shahidi, F. (2014). Fortification of cookies
with peanut skins: effect on the composition, polyphenols, antioxidant properties, and sensory
quality. Journal of Agricultural and Food Chemistry, 62, 11228-11235.
Dennis, L. K., Lynch, C. F., Sandler, D. P. & Alavanja, M. C. R. (2010). Pesticide Use and cutaneous
melanoma in pesticide applicators in the agricultural heath Study. Environmental Health
Perspectives, 118, 812–817.
Fontes, L.C.B., Sarmento, S.B.S., Spoto, M.H.F. & Dias, C.T.S. (2008). Preservation of minimally
processed apple using edible coatings. Food Science and Technology (Campinas), 28: 872-880.
Food and Agriculture Organization- FAO. (2013). Food wastage foodprint, impacts on natural resources.
http://www.fao.org/docrep/018/i3347e/i3347e.pdf. Accessed 21 May 2018.
Fujii, H., Iwase, M., Ohkuma, T., Ogata-Kaizu, S., Ide, H., Kikuchi, Y., Idewaki, Y., Joudai, T., Hirakawa,
Y., Uchida, K., Sasaki, S., Nakamura, U. & Kitazono, T. (2013). Impact of dietary fiber intake on
glycemic control, cardiovascular risk factors and chronic kidney disease in Japanese patients with
type 2 diabetes mellitus: the Fukuoka Diabetes Registry. Nutrition Journal, 12, 1-8.
Giordano, D., Locatelli, M., Travaglia, F., Bordiga, M., Reyneri, A., Coisson, J.D. & Blandino, M. (2017).
Bioactive compound and antioxidant activity distribution in roller-milled and pearled fractions of
conventional and pigmented wheat varieties. Food Chemistry, 233,483-491.
Gómez, M. & Martinez, M.M. (2017). Fruit and vegetable by-products as novel ingredients to improve
the nutritional quality of baked goods. Critical Reviews in Food Science and Nutrition, 2017, 1-17.
Gondim, J.A.M., Moura, M.F.V., Dantas, A.S., Medeiros, R.L.S. & Santos, K.M. (2005). Centesimal
composition and minerals in peels of fruits. Food Science and Technology (Campinas), 25, 825-827.
Gotti, R., Amadesi, E., Fiori, J., Bosi, S., Bregola, V., Marotti, I. & Dinelli, G. (2018). Differentiation of
modern and ancient varieties of common wheat by quantitative capillary electrophoretic profile of
phenolic acids. Journal of Cromatograpy A, 1532, 208-215.
31
He, L., Xu, H., Liu, X., He, W., Yuan, F., Hou, Z. & Gao, Y. (2011). Identification of phenolic compounds
from pomegranate (Punica granatum L.) seed residues and investigation into their antioxidant
capacities by HPLC-ABTS+ assay. Food Research International, 44, 1161-1167.
Hidalgo, A., Ferraretto, A., De Noni, I., Bottani, M., Cattaneo, S., Galli, S. & Brandolini, A. (2018).
Bioactive compounds and antioxidant properties of pseudocereals-enriched water biscuits and
their in vitro digestates. Food Chemistry, 240, 799-807.
Infante, J., Selani, M.M., Toledo, N.M.V., Silveira-Diniz, M.F., Alencar, S.M. & Spoto, M.H.F. (2013).
Atividade antioxidante de resíduos agroindustriais de frutas tropicais. Alimentos e Nutrição, 24, 87-
91.
Leonel, S., Leonel, M. & Sampaio, A.C. (2014). Processamento de frutos de abacaxizeiro cv smooth
cayenne: perfil de açúcares e ácidos dos sucos e composição nutricional da farinha de
cascas. Revista Braileira de Fruticultura, 36, 433-439.
Mallek-Ayadi, S., Bahloul, N. & Kechaou, N. (2017). Characterization, phenolic compounds and
functional properties of Cucumis melo L. peels. Food Chemistry, 15,1691-1697.
Martins, Z.E., Pinho, O. & Ferreira, I.M.P.L.V.O. (2017). Food industry by-products used as functional
ingredients of bakery products. Trends in Food Science and Technology, 67, 106-128.
Mariod, A. & Matthaus, B. (2008). Fatty acids, tocopherols, sterols, phenolic profiles and oxidative
stability of Cucumis melo var. agrestis oil. Journal of Food Lipids, 15, 56-67.
Miteva, D., Nacheva, I., Djakova, A. & Tsvetkov, T.S.V. (2008). Extended safe preservation period of
foods of plant origin through combined technological methods. Bulgarian Journal of Agricultural
Science, 14, 43-47.
Morais, D.R., Rotta, E.M., Sargi, S.C., Bonafe, E.G., Suzuki, R.M., Souza, N.E., Matsushita, M. &
Visentainer, J.V. (2017). Proximate composition, mineral contents and fatty acid composition of
different parts and dried peels of tropical fruits cultivated in Brazil. Journal of the Brazilian Chemical
Society, 28, 308-318.
Müller, L., Fröhlich, K. & Böhm, V. (2011). Comparative antioxidant activities of carotenoids measured
by ferric reducing antioxidant power (FRAP), ABTS bleaching assay (aTEAC), DPPH assay and
peroxyl radical scavenging assay. Food Chemistry, 129, 139-148.
Packer, V.G., Melo, P.S., Bergamaschi, K.B., Selani, M.M., Villanueva, N.D., Alencar, S.M. & Contreras-
Castillo, C.J. (2015). Chemical characterization, antioxidant activity and application of beetroot and
guava residue extracts on the preservation of cooked chicken meat. Journal of Food Science and
Technology, 52, 7409-7416.
Pathak, D., Majumdar, J., Raychaudhuri, U. & Chakraborty, R. (2016). Characterization of
physicochemical properties in whole wheat bread after incorporation of ripe mango peel. Journal of
Food Measurement and Characterization, 10, 554-561.
Paraman, I., Sharif, M.K., Supriyadi, S. & Rizvi, S.S.H. (2015). Agro-food industry byproducts into value-
added extruded foods. Food and Bioproducts Processing, 96, 78-85.
Pereira, M. A. B., Siebeneichler, S.C., Lorençoni, R., Adorian, G.C., Silva, J.C., Garcia, R.B.M.,
Pequeno, D.N.L., Souza, C.M. & Brito, R.F.F. (2009). Qualidade do fruto de abacaxi comercializado
pela Cooperfruto: Miranorte-TO. Revista Brasileira de Fruticultura, 31, 1049-1053.
32
Ragaee, S., Seetharaman, K. & Abdel-Aal, E.S.M. (2014). The impact of milling and thermal processing
on phenolic compounds in cereal grains. Critical Reviews in Food Science and Nutrition, 54, 837-
849.
Ramos, S., Martín, M.A. & Goya, L. (2017). Effects of cocoa antioxidants in type 2 diabetes mellitus.
Antioxidants, 6, 1-16.
Re, R., Pellegrini, N., Proteggente, A., Pannala, A., Yang, M. & Rice-Evans, C. (1999). Antioxidant
activity applying an improved ABTS radical cation decolorization assay. Free Radical Biology and
Medicine, 26, 1231–1237.
Rolim, P.M., Fidelis, G.P., Padilha, C.E.A., Santos, E.S., Rocha, H.A.O. & Macedo, G.R. (2018).
Phenolic profile and antioxidant activity from peels and seeds of melon (Cucumis melo L. var.
reticulatus) and their antiproliferative effect in cancer cells. Brazilian Journal of Medical and
Biological Research, 51, e6069.
Sato, M.F., Vieira, R.G., Zardo, D.M., Falcão, L.D., Nogueira, A. & Wosiacki, G. (2010). Apple pomace
from eleven cultivars: an approach to identify sources of bioactive compounds. Acta Scientiarum,
32, 29-35.
Selani, M.M., Brazaca, S.G.C., Dias, C.T.S., Ratnayake, W.S., Flores, R.A. & Bianchini, A. (2014).
Characterization and potential application of pineapple pomace in an extruded product for fibre
enhancement. Food Chemistry, 163, 23-30.
Selani, M.M., Bianchini, A., Ratnayake, W.S., W.S., Flores, Massarioli, A.P., Alencar, S.M. & Canniatti-
Brazaca, S.G. (2016). Physicochemical, Functional and Antioxidant Properties of tropical fruits co-
products. Plants Foods for Human Nutrition, 71, 137-144.
Singleton, V. L., Orthofer, R. & Lamuela, R. M. (1999). Analysis of total phenols and other oxidation
substrates and antioxidants by means of Folin-Ciocalteau reagent. Methods of Enzymology, 299,
152–178.
Sivamaruthi, B.S., Kesika, P. & Chaiyasut, C. (2018). A comprehensive review on anti-diabetic property
of rice bran. Asian Pacific Journal of Tropical Biomedicine, 8, 79-84.
Soares, M., Welter, L., Gonzaga, L., Lima, A., Mancini-Filho, J. & Fett, R. (2008). Avaliação da atividade
antioxidante e identificação dos ácidos fenólicos presentes no bagaço de maçã cv. Gala. Food
Science and Technology (Campinas), 28, 727-732.
Storck, C.R., Nunes, G.L., Oliveira, B.B. & Basso, C. (2013). Folhas, talos, cascas e sementes de
vegetais: composição nutricional, aproveitamento na alimentação e análise sensorial de
preparações. Ciência Rural, 43, 537-543.
Tamanna, N. & Mahmood, N. (2015). Food processing and Maillard reaction products: effects on human
health and nutrition. International Journal of Food Science, 2015, 526762.
Tanska, M., Roszkowska, B., Sylwester, C., Borowska, E.J., Bojarska, J. & Dabrowska, A. (2016). Effect
of fruit pomace addition on shortbread cookies to improve their physical and nutritional values. Plant
Foods for Human Nutrition, 71, 307-313.
Toledo, N.M.V., Nunes, L.P., Silva, P.P.M., Spoto, M.H.F. & Canniatti-Brazaca, S.G.C. (2017). Influence
of pineapple, apple and melon by-products on cookies: physicochemical and sensory aspects.
International Journal of Food Science and Technology, 52, 1185-1192.
33
Zbikowska, A. & Kowalska, M. (2017). The use of apple fiber as a fat substitute in the manufacture of
bakery products. Journal of Food Science and Preservation, 41, e13241.
Zeb, A. (2016). Phenolic profile and antioxidant activity of melon (Cucumis Melo L.) seeds from
Pakistan. Foods, 5, 1-7.
Wen, L. & Wrolstad, R.E. (2002). Phenolic composition of authentic pineapple juice. Food Chemistry
and Toxicology, 67, 155-161.
Willats, W.G.T., Knox, J. P. & Mikkelsen, J.D. (2006). Pectin: new insights into an old polymer are
starting to gel. Trends in Food Science & Technology, 17, 97-104.

34
35
3. INFLUENCE OF PINEAPPLE, APPLE AND MELON BY-PRODUCTS ON COOKIES:
PHYSICOCHEMICAL AND SENSORY ASPECTS
ABSTRACT
Physicochemical and sensory effects were investigated regarding the partial substitution of wheat flour in cookies with flours made of pineapple, apple and melon by-products, in the concentrations 5%, 10% and 15%. Cookies with 15% of melon flour were prominent in relation to the nutritional aspects, especially about the contents of fibers (4.67% to 6.46%) and ash (1.74% to 2.25%). The use of these by-products resulted in slightly darker cookies, with variations in diameter and in the expansion factor. There was a positive influence of the use of the pineapple by-product concerning consumers’ preference. Additionally, the cookies with 15% of pineapple by-product presented the highest acceptance rate (97%) and buying intention (53%). Therefore, the use of fruit by-products in the development of cookies is a viable alternative which can be explored for nutritional, technological and sensory purposes by the food industry.
Keywords: Fruits; Biscuits; Dietary fiber; Sensory evaluation; Flour
3.1. INTRODUCTION
The production of fruits has been growing mainly because of the expansion of the processed
food market, especially for pulps, nectars, jams, sweets and minimally processed products. The high
demand for these products is related to the current lifestyle, which requires highly practical and
convenient products. Nevertheless, concomitant to the search for processed foods, the production of
residues discarded by the industries increased, which might result in environmental damages and rise
in costs for the industries (Jayathilakan et al., 2012).
Among the main by-products generated after fruit processing are peels, seeds and pomace.
Nowadays, fruit by-products are directed mainly to animal feeding or the pharmaceutical industry.
However, this material might present significant amounts of fibers, vitamins, minerals, phenolic
compounds and antioxidants; hence, it is suggested to be included in human feeding (Sancho et al.,
2015).
In this way, by-products of pineapple, apple and melon could be used as an alternative source
of nutrients in the development of new foods. Bakery products, such as cookies, are considered the best
vehicles to increment the nutritional value, for being versatile and presenting a high popularity and
acceptance (Kurek & Wyrwisz, 2015).
Studies have been exploring the development of baked products containing by-products to
improve nutritionally trivial market products (Mildner-Skudlarz et al., 2013, De Camargo et al., 2014;
Reis, Rai & Abu-Ghannam, 2014). Nonetheless, there are still scarce data in literature referring to the
physicochemical and sensory effects of the addition of by-products from the central axis of the
pineapple, apple’s endocarp and melon peels in bakery products. Pineapple, apple and melon are widely
36
consumed and processed especially for the production of juice and pulp; thus, it becomes relevant to
investigate possible applications of their by-products.
Therefore, the purpose of the present work was to incorporate by-products of fruit processing
in cookies formulations with partial substitution of the wheat flour by flours made of pineapple, apple and
melon by-products.
3.2. MATERIAL AND METHODS
3.2.1. Raw materials
The by-products of pineapple (central axis), apple (endocarp) and melon (peels) were provided
by the industry of minimally-processed foods Della Natural (Engenheiro Coelho, SP, Brazil, 22º29'18" S
and 47º12'54" W). In the factory, the fruits were washed and sanitized with chlorine dioxide (1 mL/L).
The by-products were packed in polyethylene bags, transported and stored at -18ºC for a maximum of
30 days.
To obtain the flour made of fruit by-products, the material was dehydrated in an E-C Modulyo
lyophilizer (Apparatus Inc., New York, USA) (-40ºC, 0.998 mbar, 96 hours). The dehydrated by-products
were then ground in a knife mill (Marconi, Piracicaba, Brazil), sifted through a 35-mesh sieve
(Abronzinox, 0.425 mm) and stored in polyethylene bags, properly closed and frozen (-18ºC).
The other ingredients employed in the cookies formulations, such as: wheat flour type 1 with
10% of protein (Dona Benta), refined sugar (União), baking powder (Royal), eggs (Qualitá), salted butter
(Scala) and pieces of semisweet chocolate bar with 40% of cocoa (Nestlé) were acquired in the local
market of Piracicaba, SP, Brazil (22º 43' 31" S and 47º 38' 57" W).
3.2.2. Cookies preparation
Ten formulations of cookies were developed, one of the treatments being the control cookie
(CCT), which was prepared with only wheat flour, whereas the others were supplemented with by-
products of the fruits: pineapple (CPI), apple (CAP) and melon (CML) in the concentrations 5%, 10%
and 15%.
Initially, 105 g of sugar (sifted) and 75 g of butter (refrigerated and with a firm consistency)
were mixed in a planetary-type mixer (Philips Walita, RI7915, China) for 10 seconds. Then, 50 g of egg
were added and the dough was beaten for another 5 seconds.
A total of 200 g of flour was used to prepare the dough. According to the percentage of by-
product desired in the cookies (0%, 5%, 10% or 15%), the amount in grams of wheat flour and by-
product flour were calculated. The flours, together with 10 g of baking powder and 25 g of small pieces
of semisweet chocolate were integrated into the cookie dough and the mixture was beaten for
approximately 10 seconds or until the complete disappearance of the butter lumps.
37
The dough was then opened on transparent plastic packages with the aid of a roll and cut
using circular stainless-steel molds. The cookies were baked at 180ºC for 10 min in an electric oven
(Perfecta, Ponta Grossa, Brazil). Shortly after, they were cooled at room temperature and stored in glass
containers.
3.2.3. Proximate composition
Ash, protein and lipids were determined according to AOAC (2010). For the determination of
fibers, the method described by Asp, Johansson and Hallmer (1983) was employed. Carbohydrate
content was determined by difference. The analyses were performed in quadruplicates.
3.2.4. Physicochemical analyses
Color analysis was conducted using the colorimeter Chroma Meter CR-400, 8mm diameter
and standard illuminant C, Konica Minolta Sensing (Tokyo, Japan) to obtain the values of lightness(L),
hue angle (h) and chroma (C) of the cookies surface. For pH determination, the samples were ground
and diluted in water in the proportion 10% (w/v), and pH was measured in a potentiometer (Quimis,
Q799-D2, São Paulo, Brazil). Water activity (aw) was determined using an Aqualab instrument (Aqualab
CX 2T Decagon Devices Inc., Pullman, USA). The analyses were performed in quadruplicate.
3.2.5. Post-baking properties
Weight variation in the cookies was evaluated by gravimetry (Marte UX-4200H, Minas Gerais,
Brazil), based on the weight of the cookies before and 1 hour after baking, with the result expressed in
percentage (%). The variation in cookies diameter was evaluated using a digital caliper, before and 1
hour after baking, and the result was expressed in percentage (%). Cookies thickness after baking was
obtained by direct measurement in a digital caliper, with the result expressed in mm (millimeters).
Cookies expansion factor was determined based on the ratio between diameter and thickness of the
cookies after 1 hour of baking. All analyses were conducted using ten cookies samples for each
treatment.
3.2.6. Microbiological aspects
Microbiological analyses were performed for Staphylococcus aureus, Salmonella spp.
and coliforms at 45ºC before sensory evaluation (Downes & Ito, 2001).

38
3.2.7. Sensory analysis
The present study was approved by the Committee on Ethics in Research of the “Luiz de
Queiroz” College of Agriculture, University of São Paulo (Piracicaba, Brazil), under the protocol number
CAAE: 43425215.4.0000.5395. The cookies were prepared 24 hours before the tests, stored in
polyethylene bags and maintained in a desiccator until the moment of the sessions.
Two methods were chosen for the sensory evaluation of the cookies: preference ranking test
and acceptance test. In both, attention was given to the fact that the panelists did not present a history
of allergy to the ingredients involved in the cookies formulations. Panelists were not trained before any
tests.
3.2.7.1. Preference ranking test
The preference ranking test (ISO, 2006) was performed to reduce the number of initial
treatments (n=10) evaluated by the panelists in the acceptance test, avoiding sensory fatigue. Thus, the
treatments of higher preference among the panelists were selected for their future evaluation of
acceptance.
For this test, the sensory team was composed of fifty-six panelists, workers and students of
the “Luiz de Queiroz” College of Agriculture, with age between 18 and 50 years, 77 % of which were
females.
The test was conducted in three sessions, one for each type of cookie (CPI, CAP and CML).
In each session, the panelists received four units of cookies (6g), referring to the by-product percentage
in the formulation (0%, 5%, 10% and 15%), previously coded with random 3-digit numbers and arranged
in rectangular trays. The panelists tried the samples from the left to the right, drank water between them
and placed them in increasing order of preference about their global aspect.
After performing the preference ranking test, for each treatment of cookie with fruit by-product,
those presenting not only the highest preference among the panelists, but also the highest fiber
concentration was selected for use in the acceptance test.
3.2.7.2. Acceptance test
In the acceptance test, the panelist evaluated four samples of cookies, one of them the control
(CCT) and the others containing 15% of each fruit by-product (CPI 15%, CAP 15% and CML 15%), as
these were the samples previously selected by the preference ranking test.
Sixty-two voluntary panelists participated in this test, workers and students of the “Luiz de
Queiroz” College of Agriculture, with age between 18 and 50 years. Of these panelists, 65% were female
and 74% declared to consume cookies at least once a week.
The panelists evaluated the samples using the nine-point hedonic scale (Moraes, 1993), which
varies gradually from 1 (extremely disliked) to 9 (extremely liked). Each panelist evaluated four different
39
cookies units (6g), coded with random 3-digit numbers and arranged in rectangular trays. The panelists
tried the samples from the left to the right, drank water between them and used the hedonic scale to
evaluate the attributes appearance, aroma, flavor, texture and global impression.
Cookies buying intention was assessed by the identification and the justification of the
panelists regarding the samples they would buy. The acceptance rate (AR) was determined for each
treatment, accounting the scores between 6 (slightly liked) and 9 (liked very much) obtained in the
acceptance test for each cookie formulation, and comparing them to the total number of panelists
participating in the test (Equation 1):
AR (%) = (scores between 6 and 9 obtained in the acceptance test) x 100 (1)
Total of panelists in the acceptance test
3.2.8. Statistical analyses
The experimental design adopted in the physicochemical analyses was the completely
randomized. Conversely, in the sensory preference ranking test, the Latin square design (4x4) was
employed, and in the sensory acceptance test, the randomized complete block design was applied. The
program Statistical Analysis System (SAS) model 9.2 was used. The data referring to the
physicochemical analyses and sensory acceptance test were subjected to the analysis of variance
(ANOVA) for test F and to the comparison of means by the Tukey’s test (p<0.05). For the sensory
preference ranking test, the difference between treatments was verified by the Table of Newell and
MacFarlane (p<0.05).
3.3. RESULTS AND DISCUSSION
3.3.1. Proximate composition
Preliminary tests were performed with cookies that presented 17%, 18% and 20% of by-
products. These cookies presented undesirable characteristics regarding raw dough malleability: those
made with melon or apple flour presented a dry, crumbly and heterogeneous dough, while the dough in
which pineapple flour was used had a low consistency and was sticky. In these cases, the
standardization of cookies molding was a parameter impaired by the lack of dough consistency.
Even though food formulation with fruit by-products is desirable, care should be taken
regarding technological problems: mixing properties of the dough (stability, mixing tolerance) and final
product characteristics (volume, color, moisture and hardness) can be affected (Sudha, Vetrimani &
Leelavathi, 2007). Furthermore, high levels of fruit flour were not interesting in sensory terms for
denoting a strong residual flavor (usually a bitter taste). So, for this study the use of fruit flour
concentrations above 15% in the formulations of cookies was considered unfeasible for the
technological and sensory aspects.

40
The ash (Table 1) content is related to the minerals present in the food composition. In general,
it was observed that the addition of fruit flours to the cookies significantly increased (p<0.05) the ash
content, especially in treatments CML, with a significant difference (p<0.05) between CML 5%, CML10%
and CML 15%. Ash content above those present in conventional biscuits are observed when fruit by-
products are employed in the preparation of cookies (Uchoa et al., 2009, Becker et al., 2014; Naknaen
et al., 2016).
Table 1. Proximate composition of cookies made with 0% (CCT), 5%, 10%, and 15% of pineapple (CPI), apple (CAP) and melon (CML) by-products
1Mean±standard deviation (n=4). 2Means with different letters within a column indicate significant
differences (p<0.05). Results are expressed as g/100g of dry basis.
Among the macronutrients, carbohydrates comprised the largest amount. This is justified
because the major ingredient in cookie formulation is wheat flour, which presents 76% of carbohydrates
(USDA, 2013). Carbohydrates values ranged between 63.54 (CML 15%) to 69.41% (CPI 5%). This fact
was already expected, since the pineapple varieties usually present a carbohydrate amount of
approximately 13%, whereas in melons these values are lower, varying from 6.5% to 9% (USDA, 2013).
Lipids, compounds which act as the main energy source to the organism, were the second
class of macronutrients with great representativity. Treatments CPI 15% and CAP 5% presented the
lowest lipid values. According to Jacob and Leelavathi (2007), the lipids are considered essential
ingredients in cookie formulation, being present in concentrations between 30 and 60%, values which
are considerably above those observed in this study. Butter can be considered the major responsible
for the elevated lipid content in cookies, once it is composed of, in average, 81% of it (USDA, 2013).
The proteins were present in amounts of 8.13 to 8.94%, with the lowest value verified for
treatments CPI. The values presented in this study were superior to those observed by Naknaen et al.
(2016), which register variations between 4.84% and 5.54% for cookies with melon peels, but below the
Treatments Ash Protein Lipid Carbohydrate Insoluble
Fiber Soluble
Fiber
CCT 1.53±0.031f2 8.54±0.03d 19.55±0.38a 67.73 1.45±0.15ef 1.20±0.13fg
CPI 5% 1.64±0.02de 8.14±0.02f 18.37±0.20ef 69.41 1.30±0.07f 1.14±0.12fg
CPI 10% 1.53±0.02f 8.13±0.00f 19.17±0.23bc 68.32 1.68±0.12ef 1.17±0.01fg
CPI 15% 1.62±0.05e 8.13±0.01f 17.88±0.14f 69.24 2.08±0.06d 1.05±0.02g
CAP 5% 1.66±0.05de 8.87±0.05b 18.17±0.24f 68.46 1.23±0.13f 1.61±0.25cde
CAP 10% 1.66±0.02de 8.51±0.02d 18.87±0.12d 67.55 1.96±0.21de 1.45±0.10e
CAP 15% 1.70±0.03cd 8.37±0.00e 19.06±0.97ab 66.71 2.52±0.01c 1.64±0.01d
CML 5% 1.74±0.03c 8.64±0.00c 19.28±0.21abc 65.67 2.90±0.14b 1.77±0.08c
CML 10% 1.94±0.04b 8.82±0.02b 18.20±0.11ef 66.00 2.73±0.08b 2.31±0.23b
CML 15% 2.25±0.08a 8.94±0.02a 18.81±0.15d 63.54 3.54±0.19a 2.92±0.14a
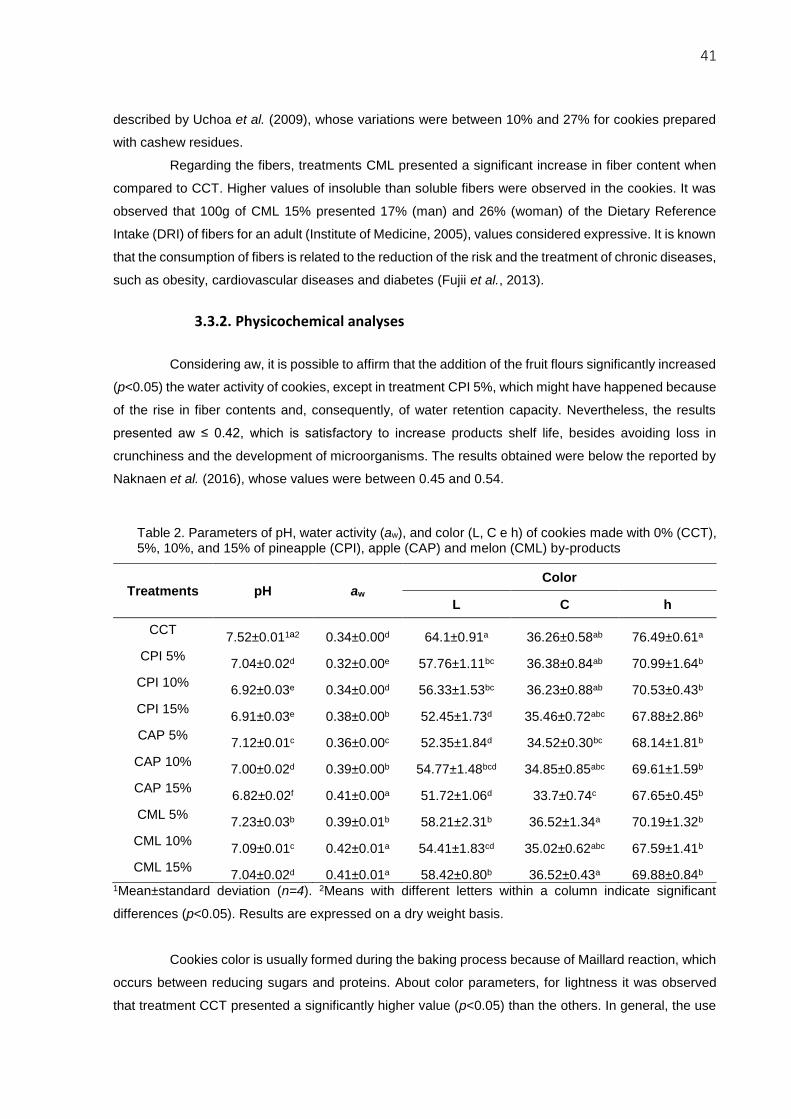
41
described by Uchoa et al. (2009), whose variations were between 10% and 27% for cookies prepared
with cashew residues.
Regarding the fibers, treatments CML presented a significant increase in fiber content when
compared to CCT. Higher values of insoluble than soluble fibers were observed in the cookies. It was
observed that 100g of CML 15% presented 17% (man) and 26% (woman) of the Dietary Reference
Intake (DRI) of fibers for an adult (Institute of Medicine, 2005), values considered expressive. It is known
that the consumption of fibers is related to the reduction of the risk and the treatment of chronic diseases,
such as obesity, cardiovascular diseases and diabetes (Fujii et al., 2013).
3.3.2. Physicochemical analyses
Considering aw, it is possible to affirm that the addition of the fruit flours significantly increased
(p<0.05) the water activity of cookies, except in treatment CPI 5%, which might have happened because
of the rise in fiber contents and, consequently, of water retention capacity. Nevertheless, the results
presented aw ≤ 0.42, which is satisfactory to increase products shelf life, besides avoiding loss in
crunchiness and the development of microorganisms. The results obtained were below the reported by
Naknaen et al. (2016), whose values were between 0.45 and 0.54.
Table 2. Parameters of pH, water activity (aw), and color (L, C e h) of cookies made with 0% (CCT), 5%, 10%, and 15% of pineapple (CPI), apple (CAP) and melon (CML) by-products
Treatments pH aw Color
L C h
CCT 7.52±0.011ª2 0.34±0.00d 64.1±0.91a 36.26±0.58ab 76.49±0.61a
CPI 5% 7.04±0.02d 0.32±0.00e 57.76±1.11bc 36.38±0.84ab 70.99±1.64b
CPI 10% 6.92±0.03e 0.34±0.00d 56.33±1.53bc 36.23±0.88ab 70.53±0.43b
CPI 15% 6.91±0.03e 0.38±0.00b 52.45±1.73d 35.46±0.72abc 67.88±2.86b
CAP 5% 7.12±0.01c 0.36±0.00c 52.35±1.84d 34.52±0.30bc 68.14±1.81b
CAP 10% 7.00±0.02d 0.39±0.00b 54.77±1.48bcd 34.85±0.85abc 69.61±1.59b
CAP 15% 6.82±0.02f 0.41±0.00a 51.72±1.06d 33.7±0.74c 67.65±0.45b
CML 5% 7.23±0.03b 0.39±0.01b 58.21±2.31b 36.52±1.34a 70.19±1.32b
CML 10% 7.09±0.01c 0.42±0.01a 54.41±1.83cd 35.02±0.62abc 67.59±1.41b
CML 15% 7.04±0.02d 0.41±0.01a 58.42±0.80b 36.52±0.43a 69.88±0.84b
1Mean±standard deviation (n=4). 2Means with different letters within a column indicate significant
differences (p<0.05). Results are expressed on a dry weight basis.
Cookies color is usually formed during the baking process because of Maillard reaction, which
occurs between reducing sugars and proteins. About color parameters, for lightness it was observed
that treatment CCT presented a significantly higher value (p<0.05) than the others. In general, the use
42
of fruit by-product flour in cookies formulation resulted in a decrease in L-values, effect also observed
by Naknaen et al. (2016).
Concerning the parameter chroma, CAP 15% demonstrated a significantly lower value
(p<0.05) than the other treatments, with a dull appearance. Observing hue angle (h), it is possible to
affirm that CCT was the only treatment which differed significantly from the others (p<0.05), with the
highest value for this parameter. The hue values varied between 67.59 and 76.49, which means the
samples are closer to the yellow tone.
Other studies have also reported color alterations in cookies when wheat flour was partially
substituted by fruit by-product flours (Becker et al., 2014; Bhat & Ahsan, 2015; Naknaen et al., 2016).
In relation to pH (Table 2), the highest value was observed for treatment CCT and the lowest
for CAP 15%. The addition of fruit flours, in general, significantly reduced (p<0.05) the pH value of the
samples. The results of this study are in accordance with those obtained by Uchoa et al. (2009), who
registered values between 6.5 and 7.1 for cookies prepared with residues of guava and cashew.
The pH values of the cookies influence chemical reactions, such as Maillard reaction,
generating alterations in color, flavor and texture of the product, parameters related to the perception
and sensory acceptance of the consumers (Andrés-Bello et al., 2013). According Pearson’s correlation
coefficient, a correlation between the pH and color was observed for the parameters of lightness (r =
0.800) and also hue angle (r = 0.781). In this way, it can be affirmed that the higher were the pH values,
the closer to white were the lightness values and closer to yellow were the hue angle values.
3.3.3. Post-baking properties
Weight variation in cookies provides data on weight loss during baking and, therefore, is
related to the yield of cookies. Formulation CAP 15% presented the lowest weight variation and, thus,
the highest yield. Among the other treatments, significant differences (p>0.05) were not observed
regarding weight variation between raw and post-baking dough (Table 3).
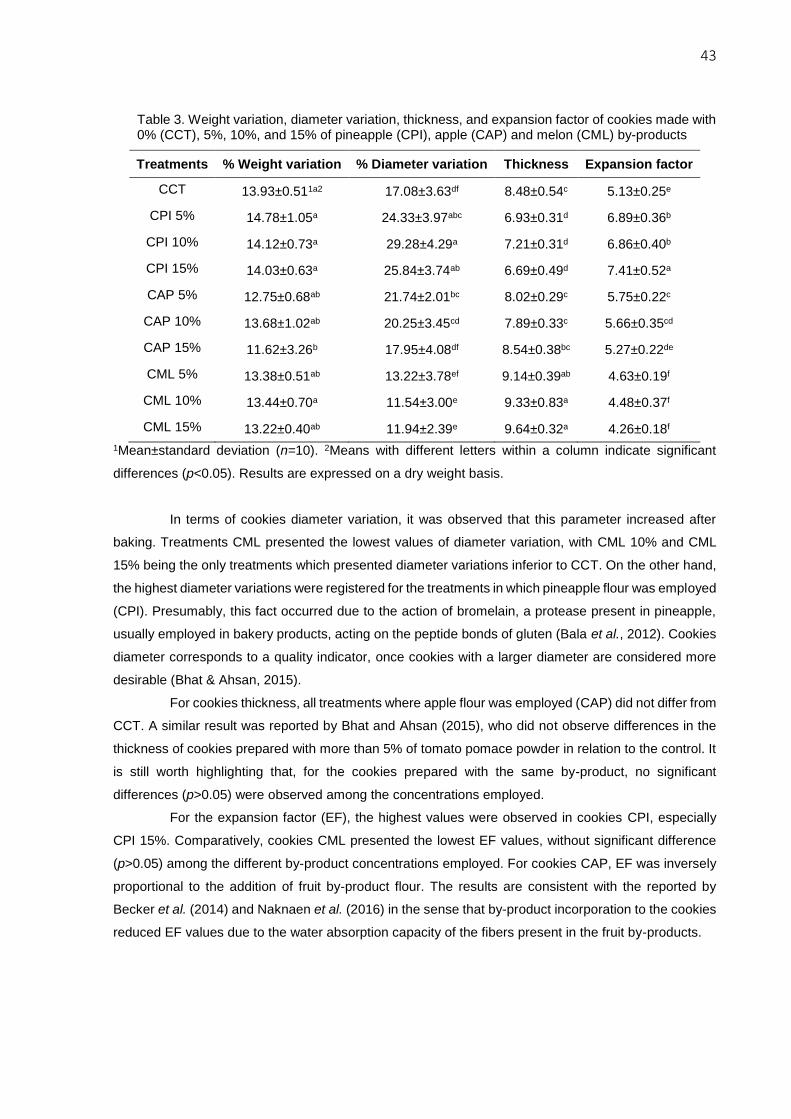
43
Table 3. Weight variation, diameter variation, thickness, and expansion factor of cookies made with 0% (CCT), 5%, 10%, and 15% of pineapple (CPI), apple (CAP) and melon (CML) by-products
Treatments % Weight variation % Diameter variation Thickness Expansion factor
CCT 13.93±0.511a2 17.08±3.63df 8.48±0.54c 5.13±0.25e
CPI 5% 14.78±1.05a 24.33±3.97abc 6.93±0.31d 6.89±0.36b
CPI 10% 14.12±0.73a 29.28±4.29a 7.21±0.31d 6.86±0.40b
CPI 15% 14.03±0.63a 25.84±3.74ab 6.69±0.49d 7.41±0.52a
CAP 5% 12.75±0.68ab 21.74±2.01bc 8.02±0.29c 5.75±0.22c
CAP 10% 13.68±1.02ab 20.25±3.45cd 7.89±0.33c 5.66±0.35cd
CAP 15% 11.62±3.26b 17.95±4.08df 8.54±0.38bc 5.27±0.22de
CML 5% 13.38±0.51ab 13.22±3.78ef 9.14±0.39ab 4.63±0.19f
CML 10% 13.44±0.70a 11.54±3.00e 9.33±0.83a 4.48±0.37f
CML 15% 13.22±0.40ab 11.94±2.39e 9.64±0.32a 4.26±0.18f
1Mean±standard deviation (n=10). 2Means with different letters within a column indicate significant
differences (p<0.05). Results are expressed on a dry weight basis.
In terms of cookies diameter variation, it was observed that this parameter increased after
baking. Treatments CML presented the lowest values of diameter variation, with CML 10% and CML
15% being the only treatments which presented diameter variations inferior to CCT. On the other hand,
the highest diameter variations were registered for the treatments in which pineapple flour was employed
(CPI). Presumably, this fact occurred due to the action of bromelain, a protease present in pineapple,
usually employed in bakery products, acting on the peptide bonds of gluten (Bala et al., 2012). Cookies
diameter corresponds to a quality indicator, once cookies with a larger diameter are considered more
desirable (Bhat & Ahsan, 2015).
For cookies thickness, all treatments where apple flour was employed (CAP) did not differ from
CCT. A similar result was reported by Bhat and Ahsan (2015), who did not observe differences in the
thickness of cookies prepared with more than 5% of tomato pomace powder in relation to the control. It
is still worth highlighting that, for the cookies prepared with the same by-product, no significant
differences (p>0.05) were observed among the concentrations employed.
For the expansion factor (EF), the highest values were observed in cookies CPI, especially
CPI 15%. Comparatively, cookies CML presented the lowest EF values, without significant difference
(p>0.05) among the different by-product concentrations employed. For cookies CAP, EF was inversely
proportional to the addition of fruit by-product flour. The results are consistent with the reported by
Becker et al. (2014) and Naknaen et al. (2016) in the sense that by-product incorporation to the cookies
reduced EF values due to the water absorption capacity of the fibers present in the fruit by-products.
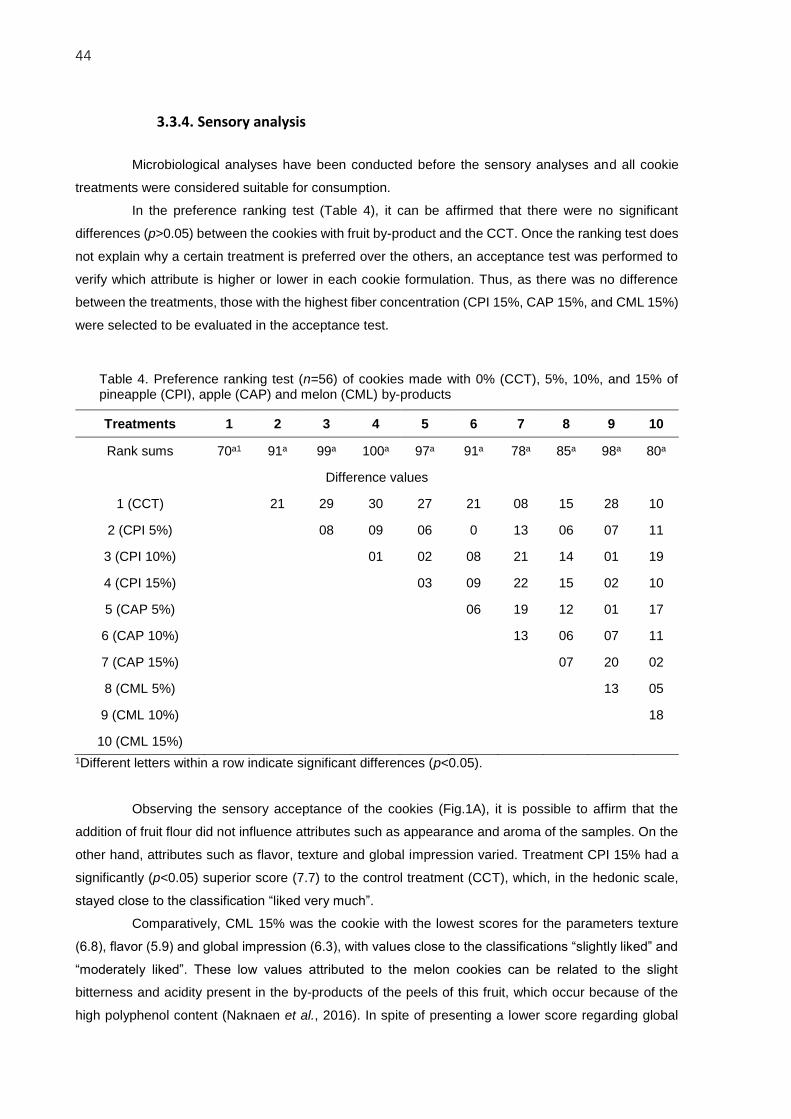
44
3.3.4. Sensory analysis
Microbiological analyses have been conducted before the sensory analyses and all cookie
treatments were considered suitable for consumption.
In the preference ranking test (Table 4), it can be affirmed that there were no significant
differences (p>0.05) between the cookies with fruit by-product and the CCT. Once the ranking test does
not explain why a certain treatment is preferred over the others, an acceptance test was performed to
verify which attribute is higher or lower in each cookie formulation. Thus, as there was no difference
between the treatments, those with the highest fiber concentration (CPI 15%, CAP 15%, and CML 15%)
were selected to be evaluated in the acceptance test.
Table 4. Preference ranking test (n=56) of cookies made with 0% (CCT), 5%, 10%, and 15% of pineapple (CPI), apple (CAP) and melon (CML) by-products
Treatments 1 2 3 4 5 6 7 8 9 10
Rank sums 70a1 91a 99a 100a 97a 91a 78a 85a 98a 80a
Difference values
1 (CCT) 21 29 30 27 21 08 15 28 10
2 (CPI 5%) 08 09 06 0 13 06 07 11
3 (CPI 10%) 01 02 08 21 14 01 19
4 (CPI 15%) 03 09 22 15 02 10
5 (CAP 5%) 06 19 12 01 17
6 (CAP 10%) 13 06 07 11
7 (CAP 15%) 07 20 02
8 (CML 5%) 13 05
9 (CML 10%) 18
10 (CML 15%)
1Different letters within a row indicate significant differences (p<0.05).
Observing the sensory acceptance of the cookies (Fig.1A), it is possible to affirm that the
addition of fruit flour did not influence attributes such as appearance and aroma of the samples. On the
other hand, attributes such as flavor, texture and global impression varied. Treatment CPI 15% had a
significantly (p<0.05) superior score (7.7) to the control treatment (CCT), which, in the hedonic scale,
stayed close to the classification “liked very much”.
Comparatively, CML 15% was the cookie with the lowest scores for the parameters texture
(6.8), flavor (5.9) and global impression (6.3), with values close to the classifications “slightly liked” and
“moderately liked”. These low values attributed to the melon cookies can be related to the slight
bitterness and acidity present in the by-products of the peels of this fruit, which occur because of the
high polyphenol content (Naknaen et al., 2016). In spite of presenting a lower score regarding global

45
impression compared to the other treatments, CML 15% reached a similar mean to the other
formulations observed in literature, which have also been evaluated by the 9-point hedonic scale (Uchoa
et al., 2009; Becker et al., 2014 Naknaen et al., 2016).
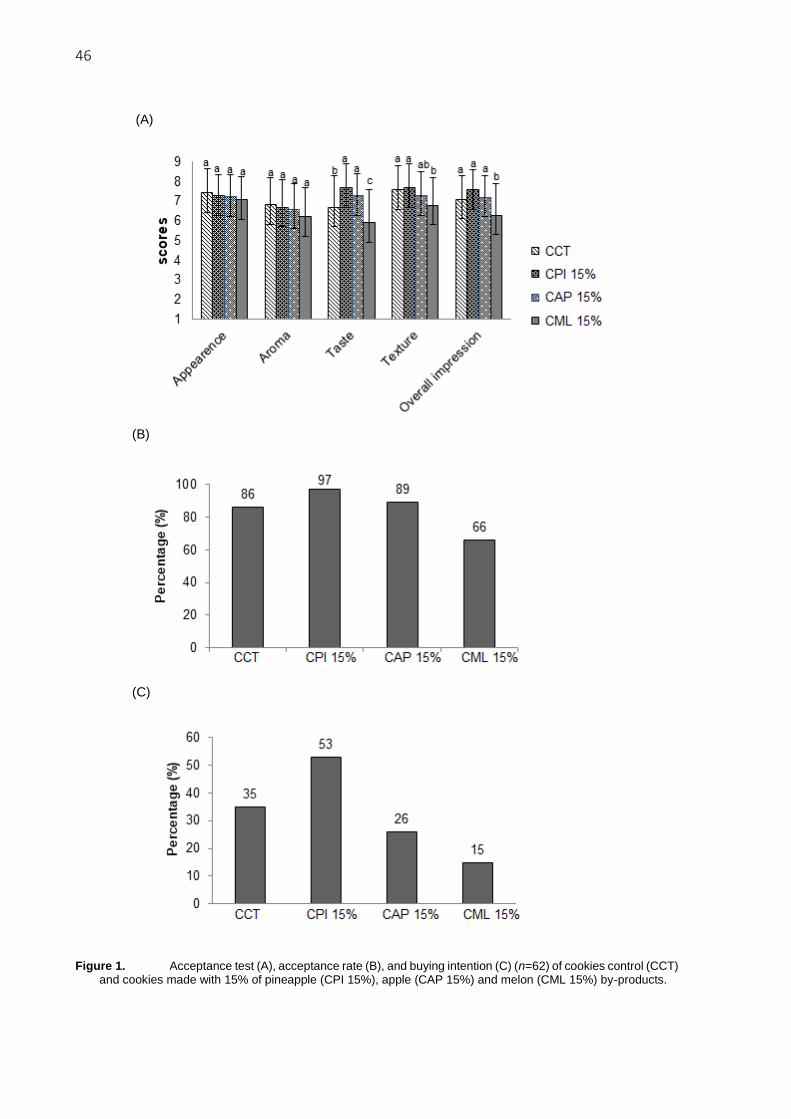
46
(A)
(B)
(C)
Figure 1. Acceptance test (A), acceptance rate (B), and buying intention (C) (n=62) of cookies control (CCT) and cookies made with 15% of pineapple (CPI 15%), apple (CAP 15%) and melon (CML 15%) by-products.
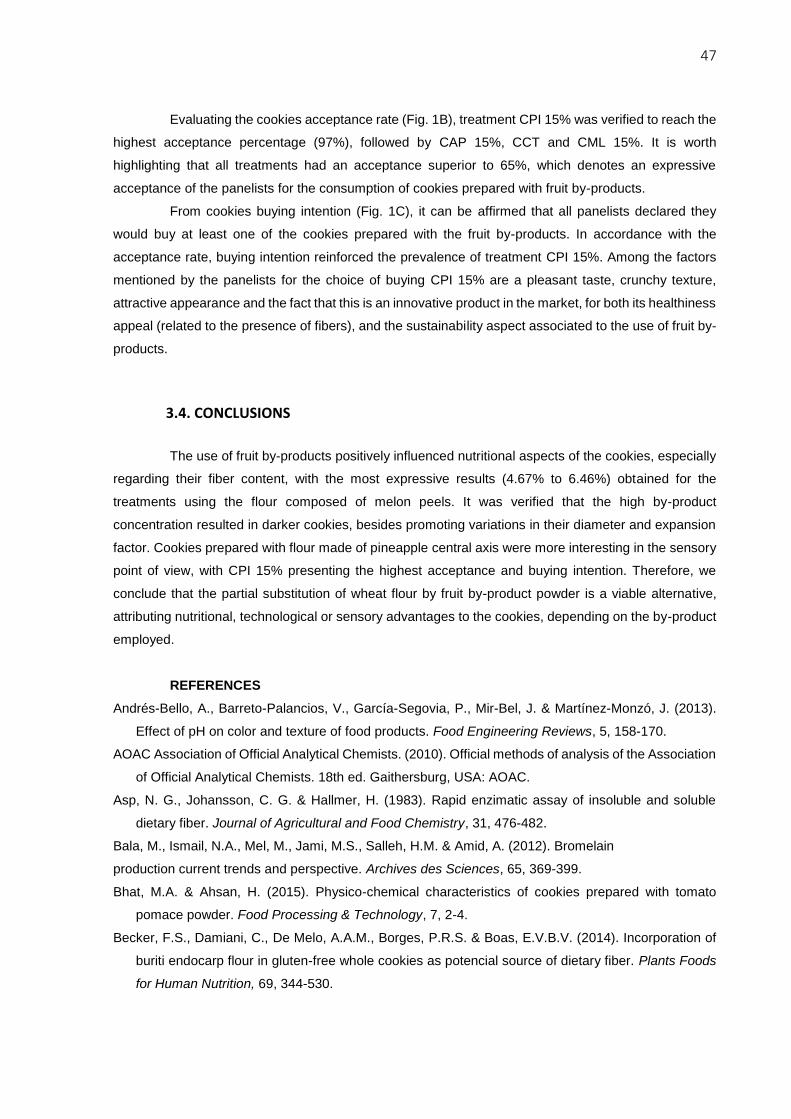
47
Evaluating the cookies acceptance rate (Fig. 1B), treatment CPI 15% was verified to reach the
highest acceptance percentage (97%), followed by CAP 15%, CCT and CML 15%. It is worth
highlighting that all treatments had an acceptance superior to 65%, which denotes an expressive
acceptance of the panelists for the consumption of cookies prepared with fruit by-products.
From cookies buying intention (Fig. 1C), it can be affirmed that all panelists declared they
would buy at least one of the cookies prepared with the fruit by-products. In accordance with the
acceptance rate, buying intention reinforced the prevalence of treatment CPI 15%. Among the factors
mentioned by the panelists for the choice of buying CPI 15% are a pleasant taste, crunchy texture,
attractive appearance and the fact that this is an innovative product in the market, for both its healthiness
appeal (related to the presence of fibers), and the sustainability aspect associated to the use of fruit by-
products.
3.4. CONCLUSIONS
The use of fruit by-products positively influenced nutritional aspects of the cookies, especially
regarding their fiber content, with the most expressive results (4.67% to 6.46%) obtained for the
treatments using the flour composed of melon peels. It was verified that the high by-product
concentration resulted in darker cookies, besides promoting variations in their diameter and expansion
factor. Cookies prepared with flour made of pineapple central axis were more interesting in the sensory
point of view, with CPI 15% presenting the highest acceptance and buying intention. Therefore, we
conclude that the partial substitution of wheat flour by fruit by-product powder is a viable alternative,
attributing nutritional, technological or sensory advantages to the cookies, depending on the by-product
employed.
REFERENCES
Andrés-Bello, A., Barreto-Palancios, V., García-Segovia, P., Mir-Bel, J. & Martínez-Monzó, J. (2013).
Effect of pH on color and texture of food products. Food Engineering Reviews, 5, 158-170.
AOAC Association of Official Analytical Chemists. (2010). Official methods of analysis of the Association
of Official Analytical Chemists. 18th ed. Gaithersburg, USA: AOAC.
Asp, N. G., Johansson, C. G. & Hallmer, H. (1983). Rapid enzimatic assay of insoluble and soluble
dietary fiber. Journal of Agricultural and Food Chemistry, 31, 476-482.
Bala, M., Ismail, N.A., Mel, M., Jami, M.S., Salleh, H.M. & Amid, A. (2012). Bromelain
production current trends and perspective. Archives des Sciences, 65, 369-399.
Bhat, M.A. & Ahsan, H. (2015). Physico-chemical characteristics of cookies prepared with tomato
pomace powder. Food Processing & Technology, 7, 2-4.
Becker, F.S., Damiani, C., De Melo, A.A.M., Borges, P.R.S. & Boas, E.V.B.V. (2014). Incorporation of
buriti endocarp flour in gluten-free whole cookies as potencial source of dietary fiber. Plants Foods
for Human Nutrition, 69, 344-530.
48
De Camargo, A.C., Vidal, C.M.M., Canniatti-Brazaca, S.G. & Shahidi, F. (2014). Fortification of cookies
with peanut skins: effect on the composition, polyphenols, antioxidant properties, and sensory
quality. Journal of Agricultural and Food Chemistry, 62, 11228-11235.
Downes, F.P. & Ito, K. (2001). Compendium of methods for the microbiological examination of food. 4th
ed. Washington, DC: American Public Health Association.
Fujii, H., Iwase, M., Ohkuma, T., Ogata-Kaizu, S., Ide, H., Kikuchi, Y., Idewaki, Y., Joudai, T., Hirakawa,
Y., Uchida, K., Sasaki, S., Nakamura, U. & Kitazono, T. (2013). Impact of dietary fiber intake on
glycemic control, cardiovascular risk factors and chronic kidney disease in Japanese patients with
type 2 diabetes mellitus: the Fukuoka Diabetes Registry. Nutrition Journal, 12, 1-8.
Institute of Medicine. (2005). Dietary references intakes: energy, carbohydrate, fiber, fat, fatty acids,
cholesterol, protein, and amino acids. Washington, DC: National Academies Press, 339-421.
ISO International Organization for Standardization. (2006). ISO 8587:2006. Sensory Analysis –
Methodology – Ranking. Geneva, Switzerland: ISO.
Jacob, J. & Leelavathi, K. (2007). Effect of fat-type on cookie dough and cookie quality. Journal of Food
Engineering, 79, 299-305.
Jayathilakan, K., Sultana, K., Radhakrishna, K. & Bawa, A.S. (2012). Utilization of byproducts and waste
materials from meat, poultry and fish processing industries: a review. Journal of Food Science and
Technology, 49, 278-293.
Kurek, M. & Wyrwisz, J. (2015). The application of dietary fiber in bread products. Journal of Food
Processing & Technology, 6, 1-4.
Mildner-Szkudlarz, S., Bajerska, J., Zawirska-Wojtasiak, R. & Górecka, D. (2013). White grape pomace
as a source of dietary fibre and polyphenols and its effect on physical and nutraceutical
characteristics of wheat biscuits. Journal of the Science of Food and Agriculture, 93, 389-395.
Moraes, M. A. C. (1993). Métodos para avaliação sensorial dos alimentos. 8th ed. Campinas:
UNICAMP, 93 p.
Naknaen, P., Itthisoponkul, T., Sondee, A. & Angsombat, N. (2016). Utilization of watermelon rind waste
as a potential source of dietary fiber to improve health promoting properties and reduce glycemic
index for cookie making. Food Science and Biotechnology, 25, 415-424.
Reis, S.F., Rai, D.K. & Abu-Ghannam, N. (2014). Apple pomace as a potencial ingredient for the
development of new functional foods. International Journal of Food Science & Technology, 49, 1743-
1750.
Sancho, S.O., Silva, A.R.A., Dantas, A.N.S., Magalhães, T.A., Lopes, G.S., Rodrigues, S., Costa, M.C.,
Fernandes, F.A.N. & Silva, M.G.V. (2015). Characterization of the industrial residues of seven fruits
and prospection of their potential application as food supplements. Journal of Chemistry, 2015,
Article ID 264284.
Sudha, M. L., Vetrimani, R. & Leelavathi, K. (2007). Influence of fibre from different cereals on the
rheological characteristics of wheat flour dough and on biscuit quality. Food Chemistry, 100, 1365-
1370.

49
Uchoa, A.M.A., Correia da Costa, J.M., Maia, G.A., Meira, T.B., Sousa, P.H.M. & Brasil, I.M. (2009).
Formulation and physicochemical and sensorial evaluation of biscuit-type cookies supplemented
with fruit powders. Plant Foods for Human Nutrition, 64, 153-159.
USDA United States Department of Agriculture. (2013). USDA Food Composition
Databases. http://ndb.nal.usda.gov/ndb/search/list. Accessed 10 October 2017.

50
51
4. CHANGES IN THE SENSORY PROFILE AND PHYSICOCHEMICAL ASPECTS OF
COOKIES CAUSED BY THE REPLACEMENT OF WHEAT FLOUR BY APPLE,
PINEAPPLE AND MELON BY-PRODUCTS
ABSTRACT
This study aimed to investigate the influence of the replacement of wheat flour by fruit by-products on the sensory profile and physicochemical aspects of cookies. The biscuits were elaborated with 15% of apple, pineapple, and melon by-products, besides to a control treatment. Cookies were evaluated using Quantitative Descriptive Analysis (QDA) by eleven trained panelists through a 10 cm unstructured scale. The attributes analyzed were brown color, characteristic appearance, regular size, characteristic aroma, sweet aroma, fruity aroma, sweet taste, bitter taste, fruity taste, residual taste, bite resistance, crunchiness, and fracturability. The determination of moisture content and hardness were also conducted. The results were submitted to multivariate analysis using correlation, principal component analysis and cluster analysis. The values for moisture (%) ranged from 3.57 to 5.71, whereas for hardness (N) the results were between 44.04 and 72.49. Regarding texture, pineapple cookies presented desirable characteristics as crunchiness, bite resistance and hardness. The melon by-product influenced on the sensory profile of cookies, developing aroma and flavor of fruit; on the other hand, undesirable characteristics such as fracturability, bitter taste and residual flavor were reported in this treatment. Cookies containing apple by-product presented high moisture (5.52%) and consequently developing unsatisfactory crunchiness and bite resistance. It was concluded that the application of fruit by-products on cookies affects their sensory profile. The formulation prepared with pineapple by-product was the treatment that demonstrated more desirable attributes for cookies.
Keywords: Biscuit; Moisture; Hardness; Descriptive quantitative analysis; Residue; Co-product; Waste
4.1. INTRODUCTION
Cookies are popular foods, ready for consumption and with low cost, which usually have great
acceptance. Nevertheless, many of these products are still formulated exclusively with wheat flour or
other refined flours, which offer low nutritional quality due to the low amount of nutrients and high energy
content. Considering that cookies can act as carriers of nutrients, the use of the nutritional
supplementation strategies becomes essential (Saponjac et al., 2016).
Fruits such as apple, pineapple, and melon are popular in the market and are consumed both
in natura and processed, highlighting juices, pulps, jellies and handmade sweets. Fruit processing is
one of the agro-industrial activities that most generate by-products. It is estimated that 25 to 80% of by-
products can be produced depending on the fruit to be processed (Van Dyk et al., 2013). The by-
products obtained commonly present high nutritional value and are rich in fiber, vitamins, minerals and
antioxidant compounds.
Nowadays, there are still few applicable alternatives for most vegetable by-products, which
are frequently used as fertilizer or animal feed (Sancho et al., 2015). The adequate use of these by-
52
products may minimize environmental damage, add value to products and reduce the costs of
industrialization, contributing to a more integrated and sustainable production (Jayathilakan et al., 2012).
Thus, several studies have explored the application of by-products in foods (Sharma et al., 2012, De
Camargo et al., 2004; Ferreira et al., 2015), promoting the reduction of food by-product discards and
creating new forms of integral use of foods.
The development of new food products, however, is a complex process that requires the study
of different aspects, among which, it is possible to emphasize the sensory analysis that is commonly
used to analyze and interpret reactions of the characteristics of foods and as they are perceived by the
senses of sight, smell, flavor, touch, and hearing. The quantitative descriptive sensory analysis is the
most sophisticated of the methodologies available to the sensory professional. Its provide a complete
sensory description of the tested product, that is, the basis for mapping of the similarities and disparity
of different samples. In addition, it allows relating a specific ingredient or variables of the production
process to the sensory attributes (Stone & Sidel, 2004).
Therefore, the present study aimed to investigate the influence of the partial replacement of
wheat flour by flour of different by-products (pineapple, apple, and melon) regarding the physicochemical
characteristics (moisture and texture) and sensory profile of cookies. In this sense, it is expected to
contribute to the incentive of the application of fruit by-products in the development of new food products.
4.2. MATERIAL AND METHODS
4.2.1. Raw materials
The fruit by-products: pineapple (central axis), apple (endocarp) and melon (peel) were
donated by the minimally processed food industry Della Natural (Engenheiro Coelho, SP, Brazil). The
material was dehydrated in E-C Modulyo lyophilizer (Apparatus Inc., New York, USA) for 96 h at -40°C
and pressure of 0.998 mbar. The dehydrated by-products were milled in a knife mill (Marconi,
Piracicaba, Brazil), sieved in 35-mesh sieve (Abronzinox, 0.425 mm) and stored in polyethylene bags,
properly closed and frozen (-18ºC). The other ingredients used in the formulations of cookies, such as
wheat flour (type 1, 10% protein, Dona Benta), refined sugar (União), baking powder (Royal), eggs,
salted butter (Scala) and dark chocolate (40% cocoa, Nestlé) were acquired in the local market of
Piracicaba, SP, Brazil.
4.2.2. Cookie preparation
For the cookie preparation, the methodology proposed by Toledo et al. (2017) was used.
Initially, 105 g of sugar and 75 g of butter were homogenized in a planetary-type mixer (10 s), which
was followed by the addition of 50 g of eggs and the mixture was stirred for 5 s. Then, 170 g of wheat
flour and 30 g of by-product flour (15% replacement of wheat flour per by-products flour) were added in
the dough. For the CCT (control), only wheat flour (200 g) was used. Finally, 10 g of baking powder and

53
25 g of chocolate were added and mixed for 10 s. The cookies were cut with a circular mold and baked
in an electric oven (Perfecta, Ponta Grossa, Brazil) at 180°C for 10 minutes. The samples were stored
in glass containers at room temperature (25ºC) until the physicochemical and sensory analyzes, in order
to avoid changes in the moisture and texture. In total, four formulations were prepared: the control
(CCT), and the cookies added with 15% of fruit by-products: pineapple (CPI), apple (CAP) and melon
(CML). The formulations were performed in three independent batches.
4.2.3. Physicochemical analyses
The moisture was determined by gravimetry according to AOAC (2010) and the analysis was
perfomed in triplicate. The hardness was measured using the TA-XT texturometer (Stable Micro
Systems, Godalming, United Kingdom). The cookies were placed horizontally on a platform and a
rectangular steel sheet with dimensions of 12x7 cm, speed of 5 mm/s and a distance of 7.5 mm was
used to cut them in half. The analysis was performed with 15 cookies for each formulation, 24 h after
their baking. The results were expressed in N (Newton).
4.2.4. Quantitative descriptive analysis (QDA)
The present study was approved by the Research Ethics Committee of the “Luiz de Queiroz”
College of Agriculture, University of São Paulo (Piracicaba, Brazil), under the protocol number CAAE:
43425215.4.0000.5395. The QDA was performed according to Moskowitz (1983), Stone and Sidel
(2004), Meilgaard, Civille and Carr (2006). The attributes of appearance, flavor, aroma, and texture were
evaluated and the data were compiled by the Compusense Five software (2010).
Initially, twenty-one panelists were invited to participate in a pre-selection to assess the ability
in discriminating basic tastes and then to investigate the capacity to detect sweet and bitter flavors
through sequential triangular test analyses. Among the panelists, eighteen obtained 100% of correct
answers in the test and were selected to define the descriptive terminology for the sensory attributes of
cookies. In this step, the CCT and CPI treatments were employed and represented the negative control
(cookie without by-product flour) and the positive control (cookie containing fruit by-product),
respectively. In addition, the CPI was chosen since in previous acceptance test (Toledo et al., 2017), it
was the treatment with fruit by-product that presented the highest acceptability.
From a consensus among the team, the similar descriptive terms that best described the
cookies samples were grouped: brown color (BC), characteristic appearance (CP), regular size (SZ)
and homogeneous appearance (HA) as appearance attributes; characteristic aroma (CA), sweet aroma
(SA) and fruity aroma (FA) as aroma attributes; sweet taste (ST), bitter taste (BT), fruity flavor (FF) and
residual flavor (RF) as flavor attributes; and bite resistance (BR), crunchiness (CC) and fracturability
(FR) as texture attributes. Discrepant terms were eliminated. Then, the reference material (Table 1)
was established and used for training panelists regarding the use of the descriptive terms to describe
and quantify the intensity of each attribute.
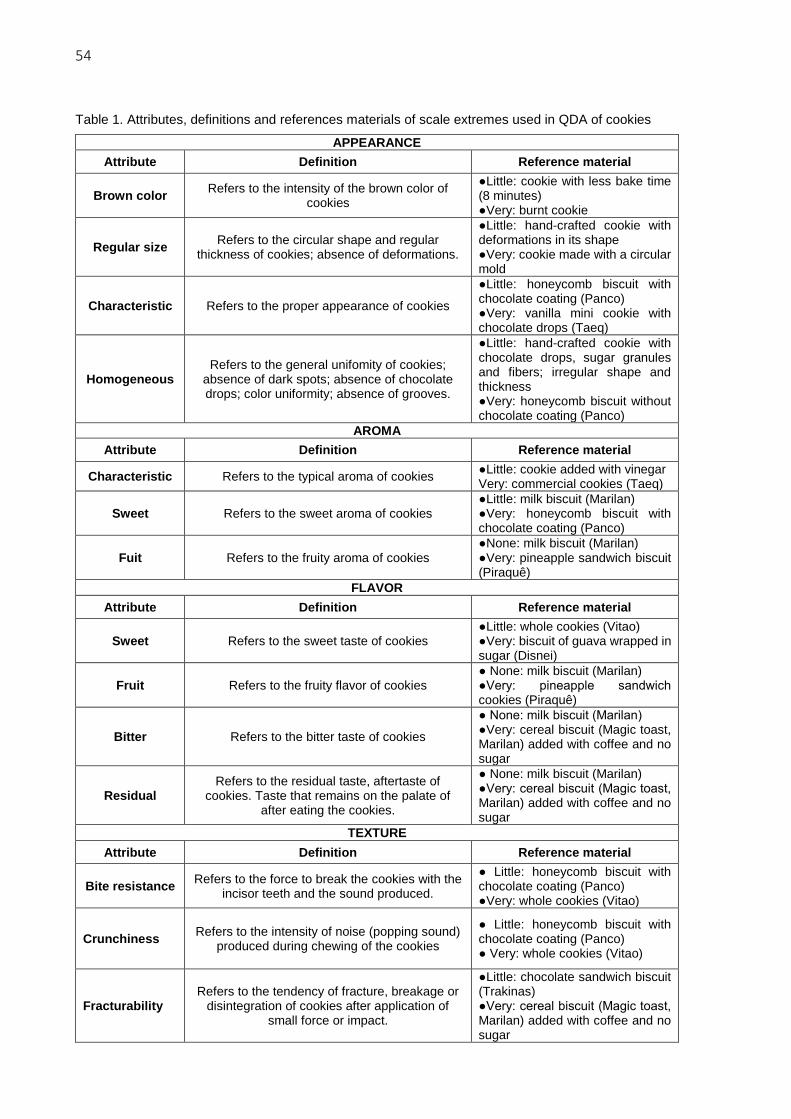
54
Table 1. Attributes, definitions and references materials of scale extremes used in QDA of cookies
APPEARANCE
Attribute Definition Reference material
Brown color Refers to the intensity of the brown color of
cookies
●Little: cookie with less bake time (8 minutes) ●Very: burnt cookie
Regular size Refers to the circular shape and regular
thickness of cookies; absence of deformations.
●Little: hand-crafted cookie with deformations in its shape ●Very: cookie made with a circular mold
Characteristic Refers to the proper appearance of cookies
●Little: honeycomb biscuit with chocolate coating (Panco) ●Very: vanilla mini cookie with chocolate drops (Taeq)
Homogeneous Refers to the general unifomity of cookies;
absence of dark spots; absence of chocolate drops; color uniformity; absence of grooves.
●Little: hand-crafted cookie with chocolate drops, sugar granules and fibers; irregular shape and thickness ●Very: honeycomb biscuit without chocolate coating (Panco)
AROMA
Attribute Definition Reference material
Characteristic Refers to the typical aroma of cookies ●Little: cookie added with vinegar Very: commercial cookies (Taeq)
Sweet Refers to the sweet aroma of cookies ●Little: milk biscuit (Marilan) ●Very: honeycomb biscuit with chocolate coating (Panco)
Fuit Refers to the fruity aroma of cookies ●None: milk biscuit (Marilan) ●Very: pineapple sandwich biscuit (Piraquê)
FLAVOR
Attribute Definition Reference material
Sweet Refers to the sweet taste of cookies ●Little: whole cookies (Vitao) ●Very: biscuit of guava wrapped in sugar (Disnei)
Fruit Refers to the fruity flavor of cookies ● None: milk biscuit (Marilan) ●Very: pineapple sandwich cookies (Piraquê)
Bitter Refers to the bitter taste of cookies
● None: milk biscuit (Marilan) ●Very: cereal biscuit (Magic toast, Marilan) added with coffee and no sugar
Residual Refers to the residual taste, aftertaste of
cookies. Taste that remains on the palate of after eating the cookies.
● None: milk biscuit (Marilan) ●Very: cereal biscuit (Magic toast, Marilan) added with coffee and no sugar
TEXTURE
Attribute Definition Reference material
Bite resistance Refers to the force to break the cookies with the
incisor teeth and the sound produced.
● Little: honeycomb biscuit with chocolate coating (Panco) ●Very: whole cookies (Vitao)
Crunchiness Refers to the intensity of noise (popping sound)
produced during chewing of the cookies
● Little: honeycomb biscuit with chocolate coating (Panco) ● Very: whole cookies (Vitao)
Fracturability Refers to the tendency of fracture, breakage or
disintegration of cookies after application of small force or impact.
●Little: chocolate sandwich biscuit (Trakinas) ●Very: cereal biscuit (Magic toast, Marilan) added with coffee and no sugar
55
After six training sessions, eleven panelists were selected for the final tests according to their
ability at discriminating attributes, the repeatability in the evaluation and consensus with other team
members. The final team was composed by students and employees from the research center, aged
between 17 and 35 years, composed by 55% women, which declared to consume cookies between 1
and 3 times a week. The final sensory evaluation was performed in duplicate (two sessions). The tests
were conducted in the morning, in individual booths equipped with fluorescent lamps. The cookies (10
g) were placed in white ceramic plates coded with three-digit random numbers. The samples (CCT, CPI,
CAP, and CML) were presented in a sequential monadic way. Panelists were asked to rinse their mouths
between the samples and indicate, using a non-structure 10-cm long scale, the sensory intensities
perceived for each attribute.
4.2.5. Statistical analyses
For the physicochemical analyses, a completely randomized design was used, whereas for the
QDA, the randomized complete block design was employed. The physicochemical results were
expressed as mean ± standard deviation. The statistical difference between the means was determined
by Tukey’s test (p<0.05). In the statistical analysis of the data related to the sensory analysis, which are
represented by the variables BC, CP, SZ, HA, CA, SA, FA, ST, BT, FF, RF, BR, CC and FR (sensory
attributes) and by the observations CCT, CPI, CAP and CML (different cookies formulations), a
multivariate analysis technique was used to evaluate concurrently all the of the data set obtained. Thus,
the data were submitted to Principal Components Analysis (PCA), which, based on the matrix of
correlation, enabled the sensory characterization of the cookies. The correlation analysis (CORR)
through the Pearson’s coefficient was determined for the evaluation of the interdependence between
the variables, and calculation of the correlation matrix. For CORR, values higher than │0.70│ were
considered accented indexes (Sokal & Rohlf, 1980).
A cluster analysis was also performed as a multivariate statistical method of data analysis,
allowing the division of the set of observations in a number of homogeneous groups, according to the
criterion of homogeneity of average distance between clusters, with a cutoff at 0.75, based on the
characteristics of each observation. The software used to perform the statistical analyses was the SAS
9.3 (Statistical Analysis System Institute, Cary, NC, USA 2010).
4.3. RESULTS AND DISCUSSION
4.3.1. Physicochemical analyses
Regarding the moisture (Table 2), the control treatment (CCT) presented lower values than
those with fruit by-products in their formulation (except CPI). According to the literature, cookies
elaborated only with wheat flour usually present moisture between 2.55 and 5.84% (Becker et al., 2014;
Naknaen et al., 2016); whereas cookies containing 15% of buriti endocarp flour presented amounts of
56
7.07% (Becker et al., 2014) and cookies with 2.5% peanut skin demonstrated results above 10% (De
Camargo et al., 2014). This increase in the moisture of the cookies is associated with the greater amount
of fibers coming from the by-products present in their formulations. As demonstrated in a previous study
(Toledo et al., 2017), the CAP and CML cookies are richer in fiber when compared to CCT and CPI.
Thus, the high hydrophilic capacity of some types of fibers is known, which may retain water more easily,
modifying the final moisture of the cookies (Canalis et al., 2017).
Table 2. Moisture content and hardness of the control (CCT) and cookies containing 15% of pineapple (CPI), apple (CAP) and melon (CML) by-products.
Moisture (%) Hardness (N)
CCT 4.73±0.101b2 62.82±5.69b
CPI 3.57±0.20c 72.49±6.32a
CAP 5.52±0.29ª 44.04±4.50d
CML 5.71±0.15a 54.48±5.03c
1Mean±standard deviation (n=3). 2Means with different letters within a column indicate significant differences (p<0.05).
As for the texture, it was observed that the CPI presented the highest value for hardness, while
lower values were recorded for CAP and CML. Naknaen et al. (2016) also reported lower hardness for
cookies with fruit by-products (watermelon peel flour). On the other hand, Herken et al. (2017) did not
find significant differences between the hardness of the control treatment and of the cookies with up to
4% addition of mahaleb seeds. Although the replacement of wheat flour by fruit by-products reduces the
amount of available gluten in the dough, unlike other biscuits and baked goods, the development of
gluten is not a necessary step in the manufacture of cookies, which are considered short dough biscuits,
that is, their dough has little extensible feature (Canalis et al., 2017). Therefore, other factors such as
increased moisture, fiber amount, diameter oscillations, thickness and spread ratio of the cookies may
be responsible for changes in the texture of cookies (Herken et al., 2017).
4.3.2. Sensory aspects
4.3.2.1. Correlation analysis (CORR)
The influence of the addition of fruit by-products on cookies is important not only for the
physicochemical aspect but also to evaluate changes in the sensory profile of products. Concerning the
data obtained by the CORR analysis, nine correlations above│0.90│ were observed (Table 3), which
were considered very strong.
57
Table 3. Strong correlations coefficients observed for the variables studied
Variables Correlation coefficients
Brown color – Fruity aroma 0.9032
Brown color – Bitter taste 0.9362
Sweet aroma - Characteristic aroma 0.9717
Sweet aroma – Crunchiness 0.9303
Residual flavor- Fruity aroma 0.9319
Residual flavor – Fruity flavor 0.9136
Residual flavor – Sweet taste -0.9896
Fruity flavor – Bitter taste 0.9862
Fruity flavor – Sweet taste -0.9510
The brown color variable presented very strong positive correlations with the variables fruity
aroma and bitter taste. The addition of the by-products in cookies is associated with the increase in the
concentration of fibers and phenolic compounds (Sharma et al., 2012; De Camargo et al., 2014). Fibers
can promote changes in the color of the products, making them darker and brownish (Becker et al.,
2014; Naknaen et al., 2016); whereas phenolic compounds can generate bitterness and astringency
(Sivam et al., 2010). It is noteworthy the effects caused by the Maillard reaction in the color of the
cookies after baking, especially to the formulations containing fruit by-products. This reaction may occur
as the fruits are sources of reducing sugars (Siti Roha et al., 2013) while eggs and wheat flour (present
in the cookies formulation) act as sources of amino acids, providing changes in the final color of the
biscuits.
As for the fruity aroma, the presence of fruit by-products also tends to highlight this characteristic
in cookies due to the presence of volatile compounds such as esters and terpenes (Zheng et al., 2012;
Yang et al., 2012). The variables fruity aroma and fruity flavor had a very strong positive correlation
with residual flavor, suggesting that the greater the presence of fruit by-products, the greater will be the
residual flavor found in the cookies, possibly due to the presence of phenolic compounds (e.g.
catechins), which are associated with bitter aftertaste (Sivam et al., 2010).
For the sweet aroma, a very strong positive correlation was observed with variables
characteristic aroma and crunchiness. Sugar is one of the most widely used ingredients in cookies
formulations, being sucrose the most industrially used sugar. Among its functions, it is possible to
emphasize the influence on the flavor, aroma, size, color, and texture (Gallagher et al., 2003). During
the preparation of the cookie dough, the sucrose dissolves totally or partially and recrystallizes again
after baked, affecting strongly the texture, and greater amounts of sucrose tend to present products of
harder texture, dry and friable (Handa, Goomer & Siddhu, 2012). It is worth mentioning that some fruit
by-products, such as the central axis of the pineapple, present significant amounts of sugars (2.24%
fructose, 2.56% glucose and 8.92% sucrose) (Siti Roha et al., 2013), which may influence in the
crunchiness and sweet aroma of cookies. Regarding the aroma, Nishibori and Bernhard (1993)
58
demonstrated that sugars such as fructose and glucose can react with beta-alanine in cookies,
producing the 2,3-dihydro-3,5-dihydroxy-6-methyl-4(H)-pyran-4-one (DDMP), which is considered the
main component associated with the sweet aroma in cookies.
Otherwise, the variable sweet taste presented very strong negative correlation with the
variables fruity flavor and residual flavor. These attributes are related to the use of fruit by-products in
cookies. Considering that the same amount of refined sugar was added in all formulations of cookies, it
can be said that the perception of sweet taste was more intense in the samples that did not contain fruit
by-products. It is believed that sweetness can mask the perception of other flavors, and generally the
glucose is the sugar most highly associated with sweetness perception (Chadwick et al., 2016).
4.3.2.2. Principal component analysis (PCA) and cluster analysis
The principal component analysis (PCA) (Figure 1) is represented by the projection of the
variables (Figure 1A) and the observations (Figure 1B). In this study, two PCs were extracted from the
total data set (Table 4), explaining 87.11% of the variance. The first Principal Component (PC1)
explained 57.14% of the statistical variance and was positively correlated with the variables brown color
(BC), homogeneous appearance (HA), fruity aroma (FA), fruity flavor (FF), bitter taste (BT) and residual
flavor (RF) and negatively with the sweet taste (ST) and bite resistance (BR) variables. The second
Principal Component (PC2) explained 29.97% of the statistical variance and was positively correlated
only with the variables of characteristic aroma (CA), sweet aroma (SA), fracturability (FR) and
crunchiness (CC). Variables SZ and CP were not correlated in the PCs because they did not obtain
relevance in the scientific basis of the results.
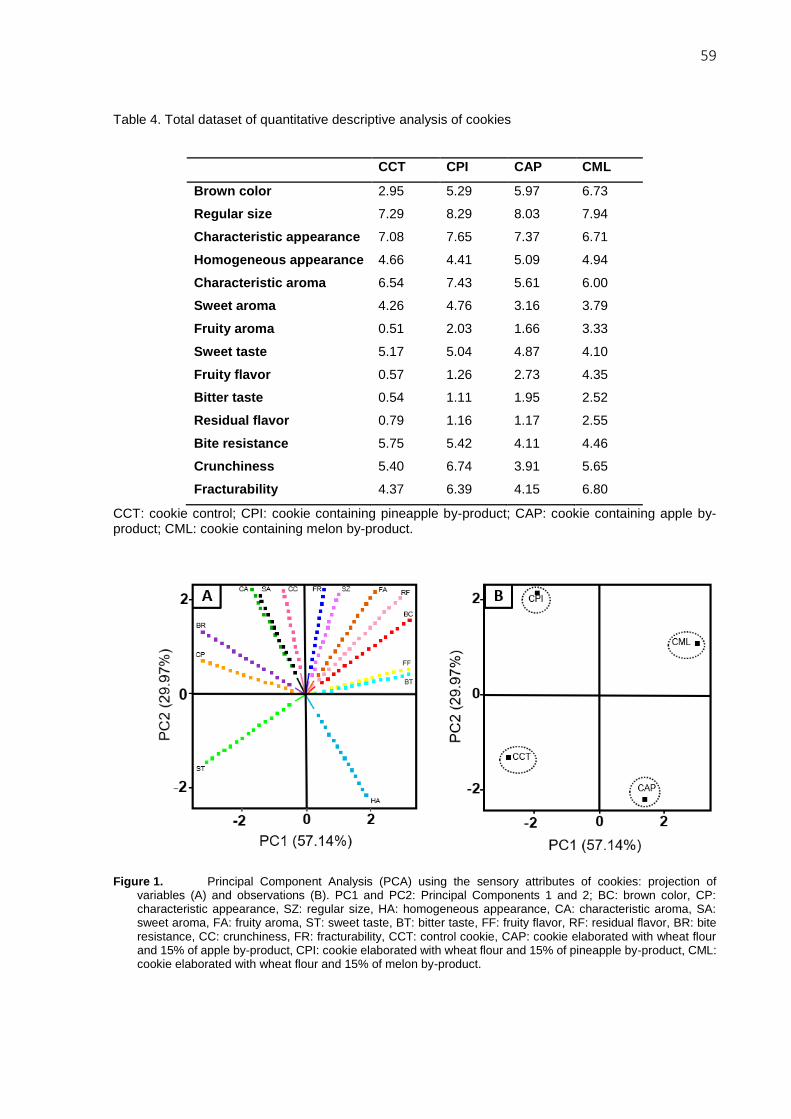
59
Table 4. Total dataset of quantitative descriptive analysis of cookies
CCT CPI CAP CML
Brown color 2.95 5.29 5.97 6.73
Regular size 7.29 8.29 8.03 7.94
Characteristic appearance 7.08 7.65 7.37 6.71
Homogeneous appearance 4.66 4.41 5.09 4.94
Characteristic aroma 6.54 7.43 5.61 6.00
Sweet aroma 4.26 4.76 3.16 3.79
Fruity aroma 0.51 2.03 1.66 3.33
Sweet taste 5.17 5.04 4.87 4.10
Fruity flavor 0.57 1.26 2.73 4.35
Bitter taste 0.54 1.11 1.95 2.52
Residual flavor 0.79 1.16 1.17 2.55
Bite resistance 5.75 5.42 4.11 4.46
Crunchiness 5.40 6.74 3.91 5.65
Fracturability 4.37 6.39 4.15 6.80
CCT: cookie control; CPI: cookie containing pineapple by-product; CAP: cookie containing apple by-product; CML: cookie containing melon by-product.
Figure 1. Principal Component Analysis (PCA) using the sensory attributes of cookies: projection of variables (A) and observations (B). PC1 and PC2: Principal Components 1 and 2; BC: brown color, CP: characteristic appearance, SZ: regular size, HA: homogeneous appearance, CA: characteristic aroma, SA: sweet aroma, FA: fruity aroma, ST: sweet taste, BT: bitter taste, FF: fruity flavor, RF: residual flavor, BR: bite resistance, CC: crunchiness, FR: fracturability, CCT: control cookie, CAP: cookie elaborated with wheat flour and 15% of apple by-product, CPI: cookie elaborated with wheat flour and 15% of pineapple by-product, CML: cookie elaborated with wheat flour and 15% of melon by-product.
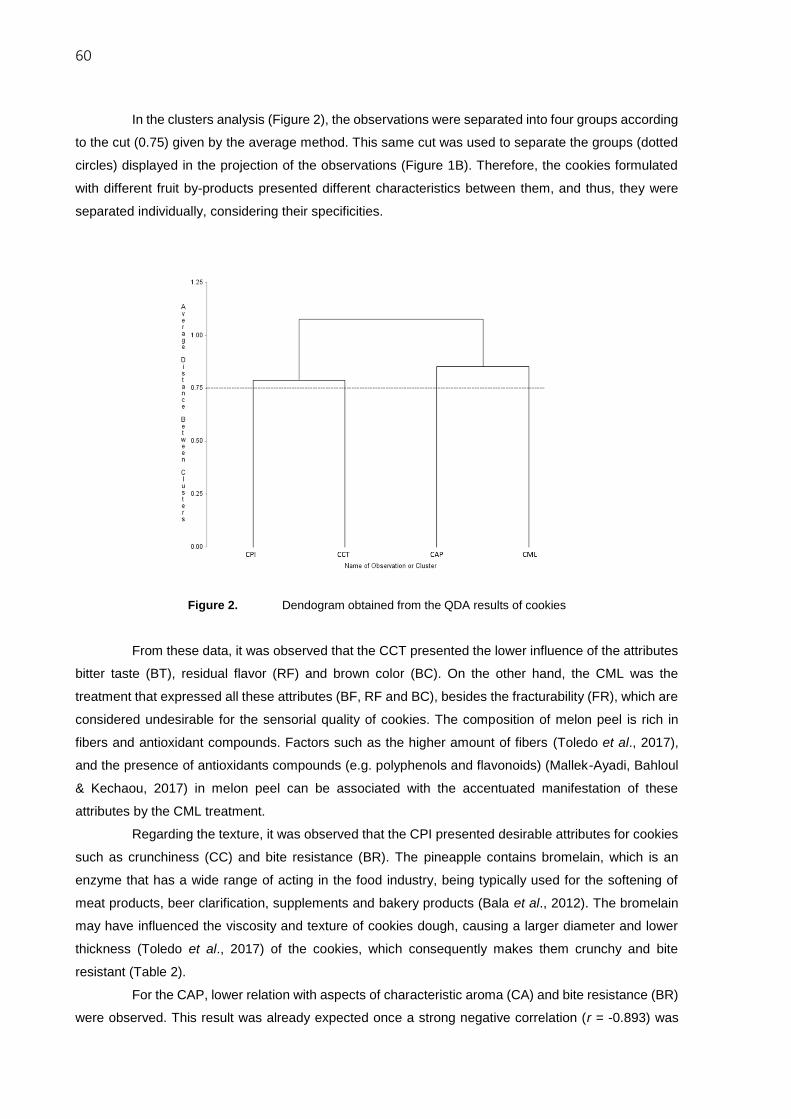
60
In the clusters analysis (Figure 2), the observations were separated into four groups according
to the cut (0.75) given by the average method. This same cut was used to separate the groups (dotted
circles) displayed in the projection of the observations (Figure 1B). Therefore, the cookies formulated
with different fruit by-products presented different characteristics between them, and thus, they were
separated individually, considering their specificities.
Figure 2. Dendogram obtained from the QDA results of cookies
From these data, it was observed that the CCT presented the lower influence of the attributes
bitter taste (BT), residual flavor (RF) and brown color (BC). On the other hand, the CML was the
treatment that expressed all these attributes (BF, RF and BC), besides the fracturability (FR), which are
considered undesirable for the sensorial quality of cookies. The composition of melon peel is rich in
fibers and antioxidant compounds. Factors such as the higher amount of fibers (Toledo et al., 2017),
and the presence of antioxidants compounds (e.g. polyphenols and flavonoids) (Mallek-Ayadi, Bahloul
& Kechaou, 2017) in melon peel can be associated with the accentuated manifestation of these
attributes by the CML treatment.
Regarding the texture, it was observed that the CPI presented desirable attributes for cookies
such as crunchiness (CC) and bite resistance (BR). The pineapple contains bromelain, which is an
enzyme that has a wide range of acting in the food industry, being typically used for the softening of
meat products, beer clarification, supplements and bakery products (Bala et al., 2012). The bromelain
may have influenced the viscosity and texture of cookies dough, causing a larger diameter and lower
thickness (Toledo et al., 2017) of the cookies, which consequently makes them crunchy and bite
resistant (Table 2).
For the CAP, lower relation with aspects of characteristic aroma (CA) and bite resistance (BR)
were observed. This result was already expected once a strong negative correlation (r = -0.893) was
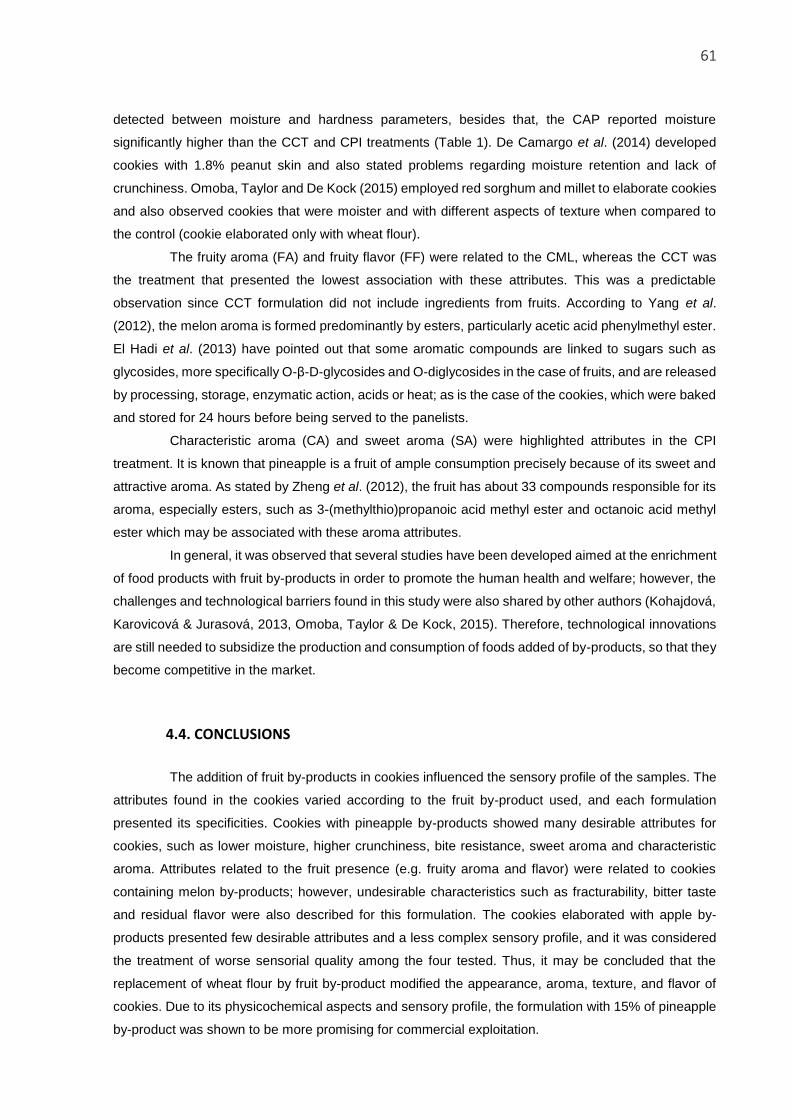
61
detected between moisture and hardness parameters, besides that, the CAP reported moisture
significantly higher than the CCT and CPI treatments (Table 1). De Camargo et al. (2014) developed
cookies with 1.8% peanut skin and also stated problems regarding moisture retention and lack of
crunchiness. Omoba, Taylor and De Kock (2015) employed red sorghum and millet to elaborate cookies
and also observed cookies that were moister and with different aspects of texture when compared to
the control (cookie elaborated only with wheat flour).
The fruity aroma (FA) and fruity flavor (FF) were related to the CML, whereas the CCT was
the treatment that presented the lowest association with these attributes. This was a predictable
observation since CCT formulation did not include ingredients from fruits. According to Yang et al.
(2012), the melon aroma is formed predominantly by esters, particularly acetic acid phenylmethyl ester.
El Hadi et al. (2013) have pointed out that some aromatic compounds are linked to sugars such as
glycosides, more specifically O-β-D-glycosides and O-diglycosides in the case of fruits, and are released
by processing, storage, enzymatic action, acids or heat; as is the case of the cookies, which were baked
and stored for 24 hours before being served to the panelists.
Characteristic aroma (CA) and sweet aroma (SA) were highlighted attributes in the CPI
treatment. It is known that pineapple is a fruit of ample consumption precisely because of its sweet and
attractive aroma. As stated by Zheng et al. (2012), the fruit has about 33 compounds responsible for its
aroma, especially esters, such as 3-(methylthio)propanoic acid methyl ester and octanoic acid methyl
ester which may be associated with these aroma attributes.
In general, it was observed that several studies have been developed aimed at the enrichment
of food products with fruit by-products in order to promote the human health and welfare; however, the
challenges and technological barriers found in this study were also shared by other authors (Kohajdová,
Karovicová & Jurasová, 2013, Omoba, Taylor & De Kock, 2015). Therefore, technological innovations
are still needed to subsidize the production and consumption of foods added of by-products, so that they
become competitive in the market.
4.4. CONCLUSIONS
The addition of fruit by-products in cookies influenced the sensory profile of the samples. The
attributes found in the cookies varied according to the fruit by-product used, and each formulation
presented its specificities. Cookies with pineapple by-products showed many desirable attributes for
cookies, such as lower moisture, higher crunchiness, bite resistance, sweet aroma and characteristic
aroma. Attributes related to the fruit presence (e.g. fruity aroma and flavor) were related to cookies
containing melon by-products; however, undesirable characteristics such as fracturability, bitter taste
and residual flavor were also described for this formulation. The cookies elaborated with apple by-
products presented few desirable attributes and a less complex sensory profile, and it was considered
the treatment of worse sensorial quality among the four tested. Thus, it may be concluded that the
replacement of wheat flour by fruit by-product modified the appearance, aroma, texture, and flavor of
cookies. Due to its physicochemical aspects and sensory profile, the formulation with 15% of pineapple
by-product was shown to be more promising for commercial exploitation.
62
REFERENCES
AOAC Association of Official Analytical Chemists. (2010). Official methods of analysis of the Association
of Official Analytical Chemists. 18th ed. Gaithersburg, USA: AOAC.
Becker, F.S., Damiani, C., De Melo, A.A.M., Borges, P.R.S. & Boas, E.V.B.V. (2014). Incorporation of
buriti endocarp flour in gluten-free whole cookies as potencial source of dietary fiber. Plants Foods
for Human Nutrition, 69, 344-350.
Bala, M., Ismail, N.A., Mel, M., Jami, M.S., Salleh, H.M. & Amid, A. (2012). Bromelain production current
trends and perspective. Archives des Sciences, 65, 369-399.
Canalis, M.S.B., Steffonali, M.E., León, A.E., & Ribotta, P.D. (2017). Effect of different fibers on dough
properties and biscuit quality. Journal of the Science of Food and Agriculture, 97, 1607-1615.
Chadwick, M., Gawthrop, F., Michelmore, R.W., Wagstaff, C. & Methven, L. (2016). Perception of
bitterness, sweetness and liking of different genotypes of lettuce. Food Chemistry, 197, 66-74.
De Camargo, A.C., Vidal, C.M.M., Canniatti-Brazaca, S.G. & Shahidi, F. (2014). Fortification of cookies
with peanut skins: effect on the composition, polyphenols, antioxidant properties, and sensory
quality. Journal of Agricultural and Food Chemistry, 62, 11228-11235.
El Hadi, M.A.M., Zhang, F.J., Fei-Fei, W., Chun-Hua, Z. & Tao, J. (2013). Advances in fruit aroma volatile
research. Molecules, 18, 8200-8229.
Ferreira, M. S. L., Santos, M. C. P., Moro, T. M. A., Basto, G. J., Andrade, R. M. S. & Gonçalves, É. C.
B. A. (2015). Formulation and characterization of functional foods based on fruit and vegetable
residue flour. Journal of Food Science and Technology, 52, 822–830.
Gallagher, E., O’Brien, C.M., Scannell, A.G.M. & Arendt, E.K. (2003). Evaluation of sugar replacers in
short dough biscuit production. Journal of Food Engineering, 56, 261-263.
Handa, C., Goomer, S. & Siddhu, A. (2012). Physicochemical properties and sensory evaluation of
frutoligosaccharide enriched cookies. Journal of Food Science and Technology, 49, 192-199.
Herken, E.N., Simsek, S., Ohm, J.B. & Yurdunuseven, A. (2017). Effect of mahaleb on cookie quality.
Journal of food processing and preservation, 41, e13032.
Jayathilakan, K., Sultana, K., Radhakrishna, K. & Bawa, A.S. (2012). Utilization of byproducts and waste
materials from meat, poultry and fish processing industries: a review. Journal of Food Science and
Technology, 49, 278-293.
Kohajdová, Z., Karovicová, J. & Jurasová, M. (2013). Influence of grapefruit dietary fibre rich powder on
the rheological characteristics of wheat flour dough and on biscuit quality. Acta Alimentaria, 42, 91-
101.
Mallek-Ayadi, S., Bahloul, N. & Kechaou, N. (2017). Characterization, phenolic compounds and
functional properties of Cucumis melo L. peels. Food Chemistry, 221, 1691-1697.
Meilgaard, M. C. Civille, G. V. & Carr, B. T. (2006). Sensory evaluation techniques. 4. ed. Boca Raton,
FL: CRC Press.
Moskowitz, H R. (1983). Product testing and sensory evaluation of foods. Westport, USA: Food and
Nutrition Press.
63
Naknaen, P., Itthisoponkul, T., Sondee, A. & Angsombat, N. (2016). Utilization of watermelon rind waste
as a potential source of dietary fiber to improve health promoting properties and reduce glycemic
index for cookie making. Food Science and Biotechnology, 25, 415-424.
Nishibori, S. & Bernhard, R.A. (1993). Model system for cookies: volatile components formed from the
reaction of sugar and β-alanine. Journal of Agricultural and Food Chemistry, 41, 2374-2377.
Omoba, O.S., Taylor, J.R.N. & de Kock, H.L. (2015). Sensory and nutritive profiles of biscuits from whole
grain sorghum and pearl millet plus soya flour with and without sourdough fermentation. International
Journal of Food Science and Technology, 50, 2554-2561.
Sancho, S.O., Silva, A.R.A., Dantas, A.N.S., Magalhães, T.A., Lopes, G.S., Rodrigues, S., Costa, M.C.,
Fernandes, F.A.N. & Silva, M.G.V. (2015). Characterization of the industrial residues of seven fruits
and prospection of their potential application as food supplements. Journal of Chemistry, 1-8, Article
ID 264284.
Saponjac, V.T., Cetkovic, G., Canadanovic-Brunet, J., Pajin, B., Djilas, S., Petrovic, J., Loncarevic, I.,
Stajcic, S. & Vulic, J. (2016). Sour cherry pomace extract encapsulated in whey and soy proteins:
Incorporation in cookies. Food Chemistry, 207, 27-33.
Siti Roha, A.M., Zainal, S., Noriham, A. & Nadzirah, K.Z. (2013). Determination of sugar content in
pineapple waste variety N36. International Food Research Journal, 20, 1941-1943.
Sivam, A. S., Sun-Waterhouse, D., Quek, S. & Perera, C. O. (2010). Properties of Bread Dough with
Added Fiber Polysaccharides and Phenolic Antioxidants: A Review. Journal of Food Science, 75,
163–174.
Sharma, S., Gupta, J. P., Nagi, H. P. S. & Kumar, R. (2012). Effect of incorporation of corn byproducts
on quality of baked and extruded products from wheat flour and semolina. Journal of Food Science
and Technology, 49, 580–586.
Sokal, R. R. & Rohlf, F. J. (1980). Biometry. J. Wilson & S. Cotter, Eds. 2nd ed. New York, USA: W.H.
Freeman and Company.
Stone, H. & Sidel, J. L. (2004). Sensory evaluation practices. 3rd ed. San Diego, USA: Academic Press.
Toledo, N. M. V., Nunes, L. P., Silva, P. P. M., Spoto, M. H. F. & Canniatti-Brazaca, S. G. (2017).
Influence of pineapple, apple and melon by-products on cookies: physicochemical and sensory
aspects. International Journal of Food Science & Technology, 52, 1185–1192.
Van Dyk, J.S., Gama, R., Morrison, D., Swart, S. & Pletschke, B.I. (2013). Food processing waste:
Problems, current management and prospects for utilisation of the lignocellulose component through
enzyme synergistic degradation. Renewable and Sustainable Energy Reviews, 26, 521-531.
Yang, Y., Yu, Zeyuan, Xu, Y. & Shao, Q. (2012). Analysis of volatile compounds from Oriental melons
(Cucumis melo L.) using headspace SPME coupled with GC-MS. Advanced Materials Research,
554-556, 2102-2105.
Zheng, L.Y., Sun, G.M., Liu, Y.G., Lv, L.L., Yang, W.X., Zhao, W.F. & Wei, C.B. (2012). Aroma volatile
compounds from two fresh pineapple varieties in China. International Journal of Molecular Sciences,
13, 7383-7392.

64
65
5. INOSITOL PHOSPHATES AND TOTAL OXALATE OF COOKIES CONTAINING
FRUIT BY-PRODUCTS AND THEIR INFLUENCE ON CALCIUM, IRON AND ZINC
BIOAVAILABILITY BY CACO-2 CELLS
ABSTRACT
This study aimed to determined inositol phosphates (IP5 and IP6) and oxalate of apple, pineapple, melon by-products and cookies prepared with wheat flour and fruit by-products, besides to evaluate the effect of inositol phosphates (IPs) and oxalate on the bioavailability of calcium, iron and zinc. IPs and oxalate were measured by HPLC-MS/MS. The mineral bioavailability was determined by the molar ratio of phytate and oxalate to minerals and the retention, transport and uptake by Caco-2 cells. Both, phytate and oxalate contents were higher in cookies than in the by-products. The use of pineapple by-product in cookies increased zinc retention (26.40%). Cookies containing melon by-product presented higher uptake for iron (2.14%). For cookies with apple by-product, higher transport (0.06 and 9.71%) and uptake (2.92 and 15.52%) efficiencies were found for calcium and zinc, respectively. In conclusion, the exploitation of fruit by-products could be an alternative to enhance mineral quality of food.
Keywords: Biscuits; Phytate; Oxalic acid; Phytic acid; Antinutrients; Minerals; Uptake; Food waste
5.1. INTRODUCTION
Cookies are important vehicles to increment the nutritional value, besides being versatile and
presenting high popularity and acceptance. Many studies have reported the enrichment of cookies with
bioactive compounds (e.g. fibers, polyphenols, carotenoids, vitamins) and revealed satisfactory results
for technological, nutritional and sensory parameters (Etcheverry, Grusak & Fleige, 2012). However, it
is noted that the enrichment of products is not a simple task since the addition of nutrients does not
necessarily correspond to a reliable indication of the actual nutritional value of the food, as to admit
functionality in the organism the compounds must be available for absorption (Gemede & Ratta, 2014).
In this way, attention must be given to anti-nutritional factors (e.g. phytate, oxalate) that are
chemical compounds naturally present in food and/or feedstuffs. They can exert contrary effect to
optimum nutrition by different mechanisms (e.g. inactivation of nutrients, decrease of the digestive
process or physiological use of food/feed) (Soetan & Oyewole, 2009).
Phytic acid is considered as the major phosporus storage compound in seeds and grains. In
the case of cookies made with wheat flour, it is expected that phytate will be one of the most important
anti-nutritional compounds present. Inositol phosphates demonstrate a strong affinity to chelate
minerals, especially iron, zinc, and calcium. These chelates may originate insoluble salts, which present
poor absorption and low bioavailability (Hurrel, 2004).
Oxalic acid occurs ubiquitously in nature, sometimes as free acid, but also as soluble salts
(e.g. potassium, sodium or ammonium oxalate) or as insoluble ones (e.g. calcium, iron and magnesium
66
oxalate) (Nguyen & Savage, 2013). Oxalate is considered an anti-nutritional factor that when it is
digested, it comes into contact with the nutrients in the gastrointestinal tract, and form oxalic acid binds
with nutrients, rendering them inaccessible to the body. Regularly feeding with large amounts of oxalic
acid can cause nutritional disorders, as well as severe irritation to the gut (Tadele, 2015). Furthermore,
some insoluble salts (e.g. calcium oxalate) have the tendency to precipitate in the kidneys or in the
urinary tract, forming crystals that are linked to the formation of kidney stones (Parmar, 2004).
Therefore, the consumption of phytate and oxalate containing foods can result in low
bioavailability of minerals, and consequently, anemia, rickets, osteoporosis, and immune diseases that
are caused by a deficiency of iron, calcium and zinc (WHO/FAO, 2004). The bioavailability of nutrients
has been measured by different methodologies, including both in vitro and in vivo assays. The simulation
of gastrointestinal digestion followed by the Caco-2 cell assay is a well-validated method that has been
extensively used to evaluate mineral bioavailability. Caco-2 cells are human intestinal adenocarcinoma
cells, which after differentiation, exhibit morphological and functional characteristics of small intestinal
absorptive enterocytes (Sambuy et al., 2005).
Thus, this study aimed to investigate the influence of partial replacement of wheat flour by fruit
by-products on the inositol phosphates and oxalate content of cookies, as well as to verify the effects of
this change on the bioavailability of calcium, iron and zinc. Moreover, this new approach enables an
alternative to the use of food by-products, contributing to the nutritional value and mineral bioavailability
of cereals products.
5.2. MATERIAL AND METHODS
5.2.1. By-products
By-products of pineapple (central axis), apple (endocarp) and melon (peels) were kindly
donated by the industry of minimally-processed foods Della Natural (Engenheiro Coelho, SP, Brazil).
The samples were lyophilized and ground by Sublimar Produtos Liofilizados Ltda. (Tatuí, SP, Brazil)
and were stored at -18ºC.
5.2.2. Cookies
Cookies were prepared using the same conditions reported by Toledo et al. (2017). In total,
four formulations were developed, being one the control cookie (CCT), which was prepared only with
wheat flour, whereas in the others the wheat flour was partially replaced by 15% of fruit by-products:
apple (CAP), melon (CML) and pineapple (CPI). The ingredients used in the cookies formulations were:
wheat flour type 1 with 10% of protein (Dona Benta), refined sugar (União), baking powder (Royal), eggs
(Qualitá), salted butter (Scala) and pieces of semisweet chocolate bar with 40% of cocoa (Nestlé). All
of them were acquired in the local market of Piracicaba, SP, Brazil.
67
5.2.3. Inositol phosphate content
Inositol phosphates (IPs) were extracted as described by Frontela et al. (2009). Samples were
added with 0.5 HCl and kept under stirring for 2h. The extracts were centrifuged and the supernatants
were frozen overnight. In the next day, the supernatants were transferred into 25 mL volumetric flasks
and made up to volume with ultrapure water. Then, it was poured into an anion exchange (SAX) column
(500 mg; Supelco, Bellefonte, PA, USA) connected to a vacuum manifold set (20 mmHg). The column
was washed with 0.05 M HCl, and then eluted with 2 mL of 2 M HCl. Eluted samples were evaporated
to dryness in vacuo at 40ºC and dissolved in ultrapure water (1 mL) and tetrabutylammonium hydroxide
40 wt% in water (15 µL) (Sigma Aldrich, 2052-49-5, Switzerland). Inositol phosphate extractions were
performed in triplicate.
To determine phytate content, it was considered the sum of IP5 and IP6 since these inositol
phosphates present the high binding capacity to minerals. The IPs were determined by HPLC-MS/MS
according to Liu, Villalta and Sturla (2009), using reverse-phase chromatography on an Agilent 1100
series (Agilent Technologies, Santa Clara, CA, USA) equipped with a thermostated micro-well plate
autosampler and a quaternary pump and connected to an Agilent Ion Trap XCT Plus mass spectrometer
(Agilent Technologies) using an electrospray interface (ESI).
Forty microliters of extract were injected into a C18 reverse-phase column (Agilent
Technologies) at 40ºC, and eluted at a flow rate of 200 μL/min. The mobile phase consisted of 0.1%
formic acid in water (solvent A) and 0.1% formic acid in acetonitrile (solvent B). Inositol phosphates were
eluted from 10% to 100% B in 30 min; from 100% to 10% B in 15 min; an isocratic elution of 10% was
employed from 45 to 60 min.
The mass spectrometer was operated in negative ion mode with a capillary spray voltage of
3500 V, and a scan speed of 22000 (m/z)/sec from 50–750 m/z. The nebulizer gas pressure, drying gas
flow rate and drying gas temperature were set at 30 psi, 8 L/min and 350ºC. Control and data acquisition
was performed with Agilent Chemstation Rev B.01.03.SR2. Data were processed using the data
analysis software for LC/MSD Trap version 3.3 (Bruker Daltomik, GmbH, Bremen, Germany).
5.2.4. Total oxalate content
Total oxalate extraction was determined according to Savage et al. (2000). Briefly, 0.1 g of
sample was placed in a 15 mL flask with 5 mL 2 M HCl and incubated in a water bath at 21ºC for 20
min. The extracts were allowed to cool and then transferred quantitatively into 10 mL volumetric flasks
and made up to volume. The extracts were centrifuged (Eppendorf, 5804R, Germany) at 5000 rpm for
15 min. The supernatant was filtered through a 0.45 µm cellulose acetate membrane filter (CHMLAB,
Barcelona, Spain). Oxalate extractions were performed in triplicate.
The HPLC-MS/MS, working conditions and solvent used were the same as those that used
for IP determination, with some modifications. A Supelco Discovery C18 HPLC column (5 µm, 10 x 2.1
mm), thermostated at 40ºC was used, and eluted at a flow of 200 µL/min. Oxalic acid was eluted as
follows: an isocratic elution of 10% B was maintained for 5 min; from 10% to 100% B in 25 min. The
68
column was equilibrated at the starting conditions for 10 minutes before each analytical run. Oxalic acid
(purified grade, 99.999% trace metals basis, 144-62-7, USA). was used for calibration. Different control
samples with known concentrations of oxalic acid (100 to 1 µM) were run in the same conditions.
The mass spectrometer was operated in the same conditions of the IP determinations, but
with a scan speed of 22000 (m/z)/sec from 50-150 m/z, with the target mass located at 90 m/z. The
Smart ICC target was set to 200.000 counts, whereas the maximum accumulating time was 20 m/secs.
5.2.5. Estimation of relative mineral bioavailability
Molar ratios of antinutrient/mineral were used to estimate mineral bioavailability. The molar
ratios were calculated as the millimoles of antinutrient (phytate or oxalate) present in the sample divided
by the millimoles of mineral (iron, calcium, and zinc) present in the sample. The critical values used to
predict the bioavailability were phytate:calcium > 0.24 (Morris & Ellis, 1985), phytate:iron > 1 (Hurrel,
2004), phytate:zinc > 15 (Turnlund et al., 1984), and oxalate:calcium >1 (Suman & Urooj, 2014).
5.2.6. In vitro gastrointestinal digestion
Gastrointestinal digestion was applied to fruit by-products and cookies using the in vitro
method described by Minekus et al. (2014). Simulated Salivary Fluid (SSF), Simulated Gastric Fluid
(SGF) and Simulated Intestinal Fluid (SIF) were prepared, and a final ratio of 1:1 (v/v) was targeted at
all phases. For the oral phase, 4 g of sample were mixed with 2.5 mL of SSF electrolyte stock solution,
0.5 mL salivary α-amylase (Sigma-Aldrich, catalogue no. A1031) solution of 1500 U/mL, 25 µL of 0.3 M
CaCl2 and 975 µL of water. Four parts of oral bolus were mixed with 3 parts of SGF electrolyte stock
solution to obtain a final ratio of 1:1 (v/v) after addition of porcine pepsin (Sigma-Aldrich, catalogue no.
P-7000), CaCl2 and water. Subsequently, four parts of gastric chyme were mixed with 3 parts of SIF
electrolyte stock solution to obtain a final ratio of 1:1 (v/v) after addition of pancreatin (Sigma-Aldrich,
catalogue no. P-1750), bile salts (Sigma-Aldrich, catalogue no. B-8756), CaCl2 and water.
5.2.7. Caco-2 cells
The Caco-2 cells assays were carried out according to Frontela et al. (2009). Caco-2 cells
were obtained from the European Collection of Cell Cultures (ECACC; number 86 010 202, Salisbury,
UK) and used in assays at passages 25-38.
Cells were maintained in 75 cm2 flasks with minimum essential medium (MEM, Gibco BRL
Life Technologies, Paisley, Scotland) with 10% v/v heat-inactivated fetal bovine serum (FBS), 1% v/v
nonessential amino acids, 1% v/v L-glutamine and 1% antibiotic solution (penicillin-streptomycin) at
37°C in an incubator with 5% CO2, 95% air atmosphere and 95% relative humidity. After reaching the
confluence, the cells were detached with trypsin-EDTA solution and seeded onto polycarbonate
69
membrane chamber inserts (24 mm diameter, 0.4 μm pore size; Transwell, Corning, Inc.) at a density
of 50000 cells/cm2 and allowed to differentiate on filters for 21 days. During this period, cells were
maintained in the same conditions above and the medium was changed every 2 days. The experiments
were conducted on day 21 from seeding. Microscopic examination of the cultures revealed that
confluence was reached after 3-4 days of growth.
Prior to the mineral bioavailability assays, the bioavailable fractions were diluted 1:1 (v/v) with
MEM to adjust the osmolality to 280-330 mmol/kg using a vapor pressure osmometer (Wescor, Vapro
5520, USA). The transepithelial electrical resistance (TEER) was measured to verify the integrity of the
cell monolayer before and during the experiments (every hour) and monolayers with resistances higher
than 500 Ω/cm2 were used.
5.2.8. Mineral content, solubility, retention, transport, and uptake
The first step of the experiment consisted to remove the growth medium. Phosphate-buffered
saline (PBS) at 37°C was used to wash the apical and basolateral cell surfaces. Then, 1 mL of soluble
fractions was added to the apical chamber and 1.5 mL of MEM was added to the basal chamber of each
cell monolayer. After 4h of incubation, the basal samples were collected. Each experiment was
conducted with four replicates. To determine the mineral bioavailability, iron, calcium, and zinc contents
were measured in the sample (before digestion), soluble fraction (apical solution), blank (MEM), and in
basal solution were determined by Inductively Coupled Plasma Atomic Emission Spectrometry (ICP-
AES; ICAP 6500 Duo Thermo-One Fast) following the destruction of organic matter.
The following calculations were used to determine mineral bioavailability: solubility
percentages were determined as follows: solubility % = 100 × S/C, where S = soluble mineral content
(μg of mineral/g of sample), and C = total mineral content of the sample (μg of mineral/g of sample). The
mineral retention was estimated by the difference between mineral soluble added and the mineral
amount of the apical and basal chambers after incubation. The retention percentages were calculated
by: retention % = 100 × R/C, where R = mineral retention (μg of mineral/well), and C = mineral soluble
added (μg). Transport (T) was determined by the difference between the mineral amount in basal
chamber of treated samples and the blank. Transport percentages were calculated as transport % =
100 × T/C, where T = cellular transport (μg of mineral/well), and C = mineral soluble added (μg)/well.
The cellular uptake was estimated by the sum of retention and transport. Uptake percentage was
calculated as the percentage of the mineral added which was taken up by the cells and results were
considered as a measure of mineral availability. Due to the differences among samples in terms of the
solubility of minerals after in vitro digestion, mineral transport and uptake were normalized for solubility
as follows: % transport efficiency = (% solubility × % transport)/100, % uptake efficiency = (% solubility
× % uptake)/100.
70
5.2.9. Statistical analyses
Data were expressed as means followed by the standard deviation. The results were subjected
to one-way analysis of variances (ANOVA) and the means were compared using the Tukey’s test
(p<0.05). Pearson’s correlation analysis was performed to investigate the possible correlation between
phytate content; oxalate content; mineral solubility (%); retention (%); uptake (%); and transport (%) by
Caco-2 cells. Statistical analyses were performed with the software SAS - Statistical Analysis System,
version 9.3 (SAS Institute Inc, Cary, NC, USA).
5.3. RESULTS AND DISCUSSION
5.3.1. Mineral content
Data regarding mineral content are shown in Table 1. In general, the replacement of wheat
flour by fruit by-products significantly increased the mineral content of cookies. The melon peels (MLB)
presented the highest mineral content for all minerals, and consequently, cookies that contained this by-
product (CML) showed higher amounts (mg/100g) of iron (5.05), calcium (239) and zinc (0.97).
According to the recommendations of the National Institute of Health (2018), the intake of 100 g of CML
would provide 20-24% of calcium; 28-62% of iron; and 9-12% of zinc for women and men between 19-
70 years old, respectively. Maintaining an adequate calcium intake may reduce the risk of osteoporosis,
osteomalacia, and rickets. The incidence of anemia, and iron deficiency, which may lead to fatigue, and
brain disorders, can be decreased by adding iron into the diet. Zinc deficiency, which can lead to
problems in the immune system, growth retardation, diarrhea, skin lesions, delayed sexual and bone
maturation can also be prevented by zinc intake (WHO/FAO, 2004).
71
Table 1. Mineral content, inositol phosphates (IP5 and IP6) and total oxalate of fruit by-products and cookies
1Mean±standard deviation (n=3). 2Means followed by different lower case letters within a column show statistically significant differences (p<0.05) between the same group of treatments (by-products or cookies). PIB: pineapple by-product; APB: apple by-product; MLB: melon by-product; CCT: cookie control; CPI: cookie containing pineapple by-product; CAP: cookie containing apple by-product; CML: cookie containing melon by-product. Results are expressed in mg/100g.
The use of by-products has been associated with improvements in mineral content of biscuits.
Zouari et al. (2016) reported significant increases in calcium and zinc contents by the incorporation of
sesame peels in cookies. Krishnan et al. (2011) added by-products (seed coat) of finger millet on
biscuits and found values (mg/100g) between 711 to 864 for calcium, 5.5 to 7.5 for iron, and 2.2 to 2.7
for zinc. Cookies with baru (Dipteryx alata Vog.) seeds were elaborated by Caetano et al. (2017) and
presented values (mg/100g) of 234 for calcium; 21.56 for iron; and 10.85 for zinc, results that were
higher than those of our study. Variations in cookies formulations, including the use of different by-
products and food processing may be responsible for the discrepancies between the results found (Cilla,
López-García & Barberá, 2018).
5.3.2. Phytate and oxalate contents
In addition to mineral content, ascertaining the presence of antinutritional factors is important
to mineral bioavailability, since they can compromise the absorption of these elements. Concerning the
phytate, cookies showed higher values (310.87 to 465.06 mg/100g) than fruit by-products (47.47 to
84.54 mg/100g), which was expected because phytic acid is the major storage form of phosphorus in
cereal products (Frontela et al., 2009). The highest phytate content was observed for the cookie
prepared only with wheat flour (CCT) and the lowest for CAP. Similar values were found by Sparvoli et
al. (2016) who analyzed biscuits prepared with partial replacement of wheat flour by bean flour and
found phytate content between 191 to 463 mg/100g. On the contrary, Vitali, Dragojevic and Sebecic
(2008) elaborated biscuits with whole grain wheat flour and apple fiber (17%) and identified 530 mg/100g
of phytate in tea-biscuits. As expected, this value was higher than the result presented by a similar
cookie developed in our study (310.87 mg/100g), containing 15% of apple by-product (CAP). The use
Ca Fe Zn IP5 IP6 IP5+IP6 Oxalate
PIB 36.09±0.451c2 0.84±0.03c 0.67±0.04c 4.23±0.27a 53.80±4.07b 58.04±4.32b 1.82±0.19b
APB 79.82±2.18b 2.39±0.08b 0.99±0.02b 3.83±0.18b 43.63±1.10c 47.47±1.11c 3.02±0.58a
MLB 484.47±10.33a 6.53±0.07a 1.54±0.14a 4.54±0.10a 79.98±3.10a 84.54±3.11a 1.63±0.14b
CCT 119.83±0.30c 3.01±0.15c 0.56±0.05c 193.46±3.99a 271.60±3.57a 465.06±5.10a 5.56±0.37a
CPI 143.18±7.80b 2.98±0.11c 0.68±0.05b 142.65±15.50b 225.92±5.80b 368.57±18.27b 4.06±0.27c
CAP 133.44±7.80b 3.61±0.11b 0.66±0.02bc 116.77±7.73c 194.09±11.57c 310.86±15.31c 4.65±0.23b
CML 239.73±10.22a 5.05±0.14a 0.97±0.04a 163.90±14.77b 219.86±16.14b 383.36±11.66b 3.82±0.15c
72
of whole grain flours may have contributed to higher phytate contents in these biscuits since whole flours
are richer in phytate than white wheat flour (Omoba, Taylor & De Kock, 2015).
Regarding total oxalate, it was noted that cookies also presented higher oxalate contents (3.82
to 5.56 mg/100g) than fruit by-products (1.63 to 3.02 mg/100g). Nevertheless, these amounts were still
considered low, which can be interesting from a nutritional point of view. As well as for phytate content,
CCT was the treatment that demonstrated the highest amount of oxalate, while CPI and CML presented
the lowest values. Literature data showed that total oxalate (mg/100g) may range from 16.8 to 45 for
wheat flour; from 6.5 to 14.3 for bakery products, and 18.6 to 22.3 for biscuits (Holmes & Kennedy,
2000; Siener et al., 2006). In the case of cookies, the low oxalate content is probably related to the
wheat cultivars used in the flour, cookies formulations and processing effects (Holmes & Kennedy, 2000;
Soetan & Oyewole, 2009).
For the by-products, the lowest values of phytate and oxalate were observed for apple (APB)
and melon (MLB), respectively. Nitithan, Komindr and Nichachotsalid (2004) analyzed tropical fruits,
including pineapple, and demonstrated that phytate values in fruits may range from 37 to 90 mg/100g.
In the case of oxalate, values (mg/100g) between 0.6 and 3.5 were found for apple (Holmes & Kennedy,
2000; Ruan et al., 2013); from 1.8 to 8.5 for pineapple (Hernández, Lobo & González, 2009) and 2.7 for
melon (Ruan et al., 2013). For both antinutrients, the results of the present study were in agreement
with the literature.
It is noted that since fruits as apple, melon and pineapple are not usual sources of phytate
and oxalate, the replacement of wheat flour by fruit by-products have the potential to decrease the
antinutrients contents in cookies. Vitali, Dragojevic and Sebecic (2008) replaced 17% of wheat flour by
apple fibers in biscuits and observed a reduction of 7% in phytate content. In the present study,
reductions from 17 to 33% for phytate and from 16 to 31% for oxalate were observed in cookies
containing 15% of fruit by-products. This decrease may be interesting because these compounds have
strong binding affinity to minerals, forming insoluble salts that compromise the absorption and
bioavailability of micronutrients such as calcium, iron and zinc (Gemede & Ratta, 2014).
The mineral bioavailability was estimated by the molar ratio of phytate to calcium, phytate to
iron, phytate to zinc and oxalate to calcium (Table 2). According to Kennefick and Cashman (2000),
phytate has a more pronounced negative effect on calcium bioavailability than oxalate. However,
apparently phytate and oxalate did not compromise Ca bioavailability in samples used in this study since
values found were lower than the suggested critical values (> 0.24 for phytate, and >1 for oxalate).
Similar results for Phy:Ca were observed by Frontela et al. (2009) in infant cereals (0.07 to 0.18); and
by Lazaerte et al. (2015) for bread (0.03) and wheat flour (0.32). Nevertheless, according to Erba et al.
(2017), phytate to calcium molar ratio was not a predictive factor of calcium accessibility in ready-to-eat
food such as biscuits. Therefore, other assays as Caco-2 cell models could be more efficient for
measuring the bioavailability of this mineral. Excepted for melon by-products (MLB), the phytate to iron
molar ratios exceeded the critical value (1.0) and may cause interferences in iron bioavailability.
Guansheng et al. (2005) reported strong phytate interference in the bioavaiability of iron in wheat
products and found values up to 26.46 for Phy:Fe. Similar results were found for zinc, since all cookies
analyzed showed a Phy:Zn above 15 which may lead to a decrease in the bioavailability of this mineral.
73
The values found were in agreement with the literature since for wheat flour products these values may
be between 0.58 and 80.23 (Guansheng et al., 2005; Lazaerte et al., 2015).
Table 2. Molar ratios of phytate to calcium, iron and zinc and of oxalate to calcium of fruit by-products and cookies
Phytate:Ca Phytate:Fe Phytate:Zn Oxalate:Ca
PIB 0.07 4.19 6.15 0.02
APB 0.03 1.21 3.40 0.02
MLB 0.01 0.79 3.90 0.00
CCT 0.17 9.38 58.93 0.02
CPI 0.11 7.53 38.58 0.01
CAP 0.10 5.23 33.42 0.02
CML 0.07 4.61 28.07 0.01
PIB: pineapple by-product; APB: apple byproduct; MLB: melon by-product; CCT: cookie control; CPI: cookie containing pineapple by-product; CAP: cookie containing apple by-product; CML: cookie containing melon by-product.
5.3.3. Mineral bioavailability by Caco-2 cells
It has been reported that Caco-2 cell in vitro model may contribute to evaluate the mineral
bioavailability (Frontela et al., 2009; Vitali et al., 2011; Etcheverry Grusak, & Fleige, 2012). The results
obtained for calcium solubility, retention, transport and uptake are presented in Table 3.
Table 3. Calcium solubility, retention, transport and uptake from fruit by-products and cookies
Solubility (%)
Retention (ug)
Retention (%)
Transport (ug)
Transport efficiency (%)
Uptake (ug)
Uptake efficiency (%)
PIB 32.78±1.051a2 1.04±0.13 0.30±0.0.08a 0.72±0.01 0.20±0.00a 1.76±0.12 4.53±0.01a
APB 34.90±1.95a 0.75±0.26 0.18±0.05b 0.78±0.15 0.10±0.02b 1.53±0.42 1.60±0.43b
MLB 12.07±1.71b 0.68±0.22 0.27±0.07b 0.88±0.06 0.02±0.00c 1.56±0.15 2.30±0.61b
CCT 29.25±1.18a 0.78±0.0.05 0.22±0.01ab 0.78±0.09 0.07±0.01a 1.56±0.05 1.53±0.12b
CPI 17.37±0.90c 0.44±0.17 0.18±0.07ab 0.61±0.03 0.04±0.00b 1.05±0.13 2.42±0.04a
CAP 20.73±1.60b 0.79±0.28 0.27±0.10a 0.85±0.03 0.06±0.01a 1.64±0.17 2.92±0.62a
CML 15.58±0.17c 0.43±0.10 0.11±0.03b 0.84±0.03 0.03±0.00b 1.27±0.07 2.13±0.12ab
1Mean±standard deviation (n=4). 2Means followed by different lower case letters within a column show
statistically significant differences (p<0.05) between the same group of treatments (by-products or
cookies). PIB: pineapple by-product; APB: apple by-product; MLB: melon by-product; CCT: cookie
control; CPI: cookie containing pineapple by-product; CAP: cookie containing apple by-product; CML:
cookie containing melon by-product.
74
As shown in Table 3, lower solubility values were recorded for cookies containing fruit by-
products. Besides the antinutritional factors, these results may be associated with fiber content of
biscuits (Cilla, López-García & Barberá, 2018). In previous assays (Toledo et al., 2017), it was observed
that cookies containing fruit by-products demonstrated higher fiber contents than the control. In the same
way, other studies confirmed that, depending on the amount and type of fiber, calcium solubility could
be affected (Etcheverry, Grusak & Fleige, 2012; Silva et al., 2017). Positive correlation between solubility
and transport efficiency (r = 0.850) was observed for calcium. However, the samples with higher
solubility not necessarily showed the highest uptake, since moderate negative correlation was found
between both these parameters (r =-0.414). The replacement of 15% of wheat flour by pineapple or
apple by-product may significantly increase the calcium uptake efficiency. Similar behavior was
observed by Vitali et al. (2011) for the bioavailability of biscuits enriched with oat fiber.
The values obtained for calcium uptake efficiency varied between 1.53% and 2.92% for
cookies, and from 1.60% to 4.53% for by-products. Amongst fruit by-products, pineapple (PIB) showed
higher solubility (together with APB), retention, transport and uptake. No data had been provided in the
literature on mineral bioavailability of fruits by Caco-2 cells. For cereal products, Vitali et al. (2011)
reported higher values from calcium uptake of biscuits enriched with pseudo-cereals (from 26.39% to
38.95%), while for infant cereals, Frontela et al. (2009) found lower values (between 0.23 and 5.99%)
for calcium uptake efficiency. As it was shown by the molar ratios (Table 2), phytate (r = - 0.385) and
oxalate (r = -0,484) did not strongly correlate with calcium uptake efficiency. Etcheverry, Grusak and
Fleige (2012) confirm that other factors (e.g. presence of dietary fibers, Maillard reaction products,
organic acids, and calcium salts) should be considered to determine calcium bioavailability.
The results obtained for iron bioavailability are summarized in Table 4. Amongst by-products,
the highest solubility percentage was found for pineapple (PIB). Residues of orange and lime were
analyzed by Silva et al. (2017) and significant amounts of soluble iron (54.99% and 19.36%,
respectively) were also found. In relation to the other parameters of bioavailability, PIB also presented
the highest transport and uptake efficiencies values, which was expect, since pineapple usually has
large amounts of organic acids (malic and citric acids) (Hernández, Lobo & González, 2009) that may
contribute to iron absorption (Etcheverry, Grusak & Fleige, 2012).
75
Table 4. Iron solubility, retention, transport and uptake from fruit by-products and cookies
Solubility (%)
Retention (ug)
Retention (%)
Transport (ug)
Transport efficiency
(%)
Uptake (ug)
Uptake efficiency (%)
PIB 37.25±3.461a2 0.20±0.01 6.92±0.80c 0.22±0.05 2.75±0.73a 0.42±0.04 5.31±0.55a
APB 6.72±0.51c 0.36±0.05 22.08±1.08a 0.16±0.05 0.65±0.23b 0.52±0.11 2.14±0.45b
MLB 10.37±0.57b 0.70±0.08 10.29±0.46b ND ND 0.70±0.08 1.07±0.13c
CCT 12.89±0.47a 0.41±0.01 10.58±0.01a ND ND 0.41±0.01 1.36±0.00c
CPI 11.68±0.29c 0.20±0.04 5.81±0.69c ND ND 0.20±0.04 0.68±0.11d
CAP 12.05±0.41bc 0.35±0.03 7.75±0.25b 0.29±0.01 0.80±0.04a 0.64±0.04 1.71±0.05b
CML 12.53±0.44ab 0.61±0.04 10.00±0.28a 0.43±0.03 0.86±0.07a 1.04±0.08 2.14±0.09a
1Mean±standard deviation (n=4). 2Means followed by different lower case letters within a column show
statistically significant differences (p<0.05) between the same group of treatments (by-products or
cookies). PIB: pineapple by-product; APB: apple by-product; MLB: melon by-product; CCT: cookie
control; CPI: cookie containing pineapple by-product; CAP: cookie containing apple by-product; CML:
cookie containing melon by-product.
For cookies, significant differences were observed indicating that the addition of fruit by-
products tends to decrease the iron solubility percentages. As observed by Frontela et al. (2009),
positive correlation was found between iron solubility with cell transport (r = 0.879) and uptake (r = 0.890)
efficiencies. Considering that these parameters can be used as bioavailability predictors, it can be stated
that even with the highest fiber contents (Toledo et al., 2017), the treatments CML and CAP
demonstrated greater iron bioavailability than CCT (control). No strong correlations were observed
between iron uptake efficiency with phytate (r = -0.493) or oxalate (r = -0.469) contents. It suggests that
some other compounds such as proteins (e.g. egg yolk), calcium, zinc, manganese, and tannins,
probably may have acted as inhibitors of iron absorption (Etcheverry, Grusak & Fleige, 2012).
Otherwise, strong positive correlation was observed between solubility and retention (r =
0.982) for cookies. Therefore, as for solubility, no significant differences were observed between CCT
and CML for iron retention. The transport values for CCT and CPI could not be detected due to their
small amounts. Other authors reported retention, transport and uptake efficiencies higher than those
found in our study. Frontela et al. (2009) stated values between 0.66 and 6.05 for uptake efficiency in
infant cereals and attributed the increased of iron bioavailability due to previous phytate treatment. On
the other hand, Vitali et al. (2011) improved iron bioavailability of biscuits adding pseudo-cereals and
reported values from 9.53% to 13.99% in biscuits containing carob and apple fiber, respectively.
Zinc solubility, retention, transport and uptake efficiencies can be observed in Table 5.
Differently of the other minerals analyzed, negative correlations were found between solubility with
transport (r = -0.516) and uptake (r = -0.662) efficiencies. Solubility percentage (%) of by-products
ranged from 44.48 to 57.91, with higher value for APB, followed by MLB and PIB.
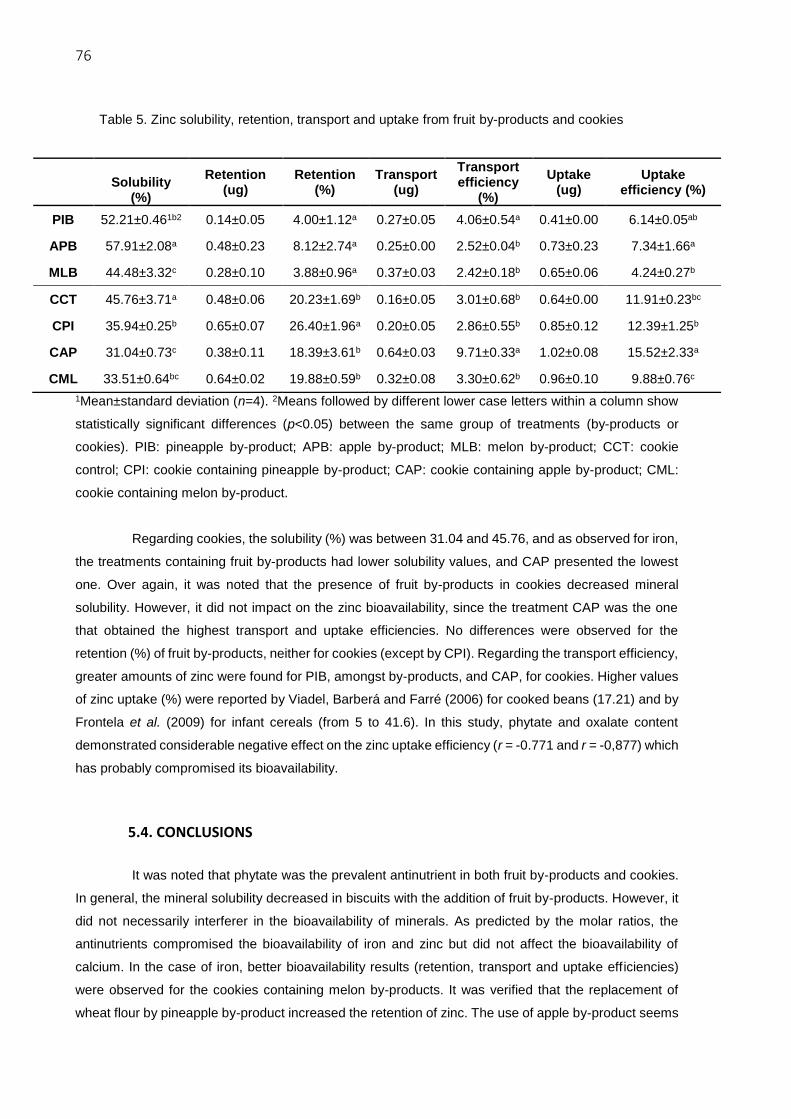
76
Table 5. Zinc solubility, retention, transport and uptake from fruit by-products and cookies
Solubility
(%)
Retention (ug)
Retention (%)
Transport (ug)
Transport efficiency
(%)
Uptake (ug)
Uptake efficiency (%)
PIB 52.21±0.461b2 0.14±0.05 4.00±1.12a 0.27±0.05 4.06±0.54a 0.41±0.00 6.14±0.05ab
APB 57.91±2.08a 0.48±0.23 8.12±2.74a 0.25±0.00 2.52±0.04b 0.73±0.23 7.34±1.66a
MLB 44.48±3.32c 0.28±0.10 3.88±0.96a 0.37±0.03 2.42±0.18b 0.65±0.06 4.24±0.27b
CCT 45.76±3.71a 0.48±0.06 20.23±1.69b 0.16±0.05 3.01±0.68b 0.64±0.00 11.91±0.23bc
CPI 35.94±0.25b 0.65±0.07 26.40±1.96a 0.20±0.05 2.86±0.55b 0.85±0.12 12.39±1.25b
CAP 31.04±0.73c 0.38±0.11 18.39±3.61b 0.64±0.03 9.71±0.33a 1.02±0.08 15.52±2.33a
CML 33.51±0.64bc 0.64±0.02 19.88±0.59b 0.32±0.08 3.30±0.62b 0.96±0.10 9.88±0.76c
1Mean±standard deviation (n=4). 2Means followed by different lower case letters within a column show
statistically significant differences (p<0.05) between the same group of treatments (by-products or
cookies). PIB: pineapple by-product; APB: apple by-product; MLB: melon by-product; CCT: cookie
control; CPI: cookie containing pineapple by-product; CAP: cookie containing apple by-product; CML:
cookie containing melon by-product.
Regarding cookies, the solubility (%) was between 31.04 and 45.76, and as observed for iron,
the treatments containing fruit by-products had lower solubility values, and CAP presented the lowest
one. Over again, it was noted that the presence of fruit by-products in cookies decreased mineral
solubility. However, it did not impact on the zinc bioavailability, since the treatment CAP was the one
that obtained the highest transport and uptake efficiencies. No differences were observed for the
retention (%) of fruit by-products, neither for cookies (except by CPI). Regarding the transport efficiency,
greater amounts of zinc were found for PIB, amongst by-products, and CAP, for cookies. Higher values
of zinc uptake (%) were reported by Viadel, Barberá and Farré (2006) for cooked beans (17.21) and by
Frontela et al. (2009) for infant cereals (from 5 to 41.6). In this study, phytate and oxalate content
demonstrated considerable negative effect on the zinc uptake efficiency (r = -0.771 and r = -0,877) which
has probably compromised its bioavailability.
5.4. CONCLUSIONS
It was noted that phytate was the prevalent antinutrient in both fruit by-products and cookies.
In general, the mineral solubility decreased in biscuits with the addition of fruit by-products. However, it
did not necessarily interferer in the bioavailability of minerals. As predicted by the molar ratios, the
antinutrients compromised the bioavailability of iron and zinc but did not affect the bioavailability of
calcium. In the case of iron, better bioavailability results (retention, transport and uptake efficiencies)
were observed for the cookies containing melon by-products. It was verified that the replacement of
wheat flour by pineapple by-product increased the retention of zinc. The use of apple by-product seems
77
to be also promising due to the high transport and uptake efficiencies found both for calcium and for
zinc. Therefore, it was concluded that the use of fruit by-products in cookies can be interesting to reduce
the antinutrients content (phytate and oxalate), besides contributing with the increase of the
bioavailability of minerals such as calcium, iron and zinc, depending on the by-product used.
REFERENCES
Caetano, K.A., Ceotto, J.M., Ribeiro, A.P.B., Morais, F.P.R., Ferrari, R.A., Pacheco, M.T.B. & Capitani,
C.D. (2017). Effect of baru (Dipteryx alata Vog.) addition on the composition and nutritional quality
of cookies. Food Science and Technology, 37, 239-245.
Cilla, A., López-García, G. & Barberá, R. (2018). In vitro bioavailability of iron and calcium in cereals
and derivatives: A review. Food Reviews International, 34, 1-33.
Erba, D., Manini, F., Meroni, E. & Casiraghi, M. C. (2017). Phytate/calcium molar ratio does not predict
accessibility of calcium in ready-to-eat dishes. Journal of the Science of Food and Agricultural, 97,
3189–3194.
Etcheverry, P., Grusak, M.A. & Fleige, L.E. (2012). Application of in vitro bioaccessibility and
bioavailability methods for calcium, carotenoids, folate, iron, magnesium, polyphenols, zinc, and
vitamins B6, B12, D, and E. Frontiers in Physiology, 3, 1-22.
Frontela, C., Scarino, M.L., Ferruzza, S., Ros, G. & Martínez, C. (2009). Effect of dephynization on
bioavailability of iron, calcium and zinc from infant cereals assessed in the Caco-2 cell model. World
Journal of Gastroenterology, 15, 1977-1984.
Gemede, H.F. & Ratta, N. (2014). Antinutritional factors in plant foods: Potential health benefits and
adverse effects. International Journal of Food Science and Nutrition, 3, 284-289.
Guansheng, M.A., Jin, Y., Piao, J., Kok, F., Guusje, B. & Jacobsen, E. (2005). Phytate, calcium, iron,
and zinc contents and their molar ratios in foods commonly consumed in China. Journal of
Agricultural and Food Chemistry, 53, 10285-10290.
Hernández, Y., Lobo, M.G. & González, M. (2009). Factors affecting sample extraction in the liquid
chromatographic determination of organic acids in papaya and pineapple. Food Chemistry, 114,
734-741.
Holmes, R.P. & Kennedy, M. (2000). Estimation of the oxalate content of foods and daily oxalate intake.
Kindey International, 57, 1662-1667.
Hurrel, R.F. (2004). Phytic acid degradation as a means of improving iron absorption. International
Journal for Vitamin and Nutrition Research, 74, 445-452.
Kennefick, S. & Cashman, K.D. (2000). Investigation of an in vitro model for predicting the effect of food
components on calcium availability from meals. International Journal of Food Science and Nutrition,
51, 45-54.
Krishnan, R., Dharmaraj, U., Manohar, R.S. & Malleshi, N.G. (2011). Quality characteristics of biscuits
prepared from finger millet seed coat based composite flour. Food Chemistry, 129, 499-506.
Lazaerte, C.E., Nils-Gunnar, C., Almgren, A., Sandberg, A.S. & Granfeldt, Y. (2015). Phytate, zinc, iron
and calcium content of common Bolivian food, and implications for mineral bioavailability. Journal of
Food Composition and Analysis, 39, 111-119.
78
Liu, X., Villalta, P.W. & Sturla, S.J. (2009). Simultaneous determination of inositol and inositol
phosphates in complex biological matrices: quantitative ion-exchange chromatography/tandem
mass spectrometry. Rapid Communications in Mass Spectrometry, 23, 705-712.
Minekus, M. Alminger, M., Alvito, P., Ballance, S., Bohn, T., Bourlieu, C., Carrière, F., Boutrou, R.,
Corredig, M., Dupont, D., Dufour, C., Egger, L., Golding, M., Karakaya, S., Kirkhus, B., Le Feunteun,
S., Lesmes, U., Macierzanka, A., Mackie, A., Marze, S., McClements, D.J., Ménard, O., Recio, I.,
Santos, C.N., Singh, R.P., Vegarud, G.E., Wickham, M.S., Weitschies, W. & Brodkorb, A. (2014). A
standardised static in vitro digestion method suitable for food - an international consensus. Food &
Function, 5,1113-1124.
Morris, E. R. & Ellis, R. (1985). Bioavailability of dietary calcium: Effect of phytate on adult men
consuming nonvegetarian diets. In C. Kies (Ed.), Nutritional Bioavailability of Calcium, Washington:
American Chemical Society.
National Institute of Health. (2018). Dietary Reference Intakes (DRIs): Recommended Dietary Allowance
and Adequate Intakes, Elements.
https://www.ncbi.nlm.nih.gov/books/NBK56068/table/summarytables.t3/?report=objectonly.
Accessed 23 April 2018.
Nguyen, H.V.H. & Savage, G.P. (2013). Oxalate content of New Zealand grown and imported fruits.
Journal of Food Composition and Analysis, 31, 180-184.
Nitithan, S., Komindr, S. & Nichachotsalid, A. (2004). Phytate and fiber content in Thai fruits commonly
consumed by diabetic patients. Journal of the Medical Association of Thailand, 87, 1444-1446.
Omoba, O.S., Taylor, J.R.N. & de Kock, H.L. (2015). Sensory and nutritive profiles of biscuits from whole
grain sorghum and pearl millet plus soya flour with and without sourdough fermentation. International
Journal of Food Science and Technology, 50, 2554-2561.
Parmar, M.S. Kidney stones. (2004). British Medical Journal, 328, 1420–1424.
Ruan, Q.Y., Zheng, X.Q., Chen, B.L., Xiao, Y., Peng, X.X., Leung, D.W.M. & Liu, E.E. (2013).
Determination of total oxalate contents of a great variety of foods commonly available in Southern
China using an oxalate oxidase prepared from wheat bran. Journal of Food Composition and
Analysis, 32, 6-11.
Sambuy, Y., De Angelis, I., Ranaldi, G., Scarino, M.L., Stammati, A. & Zucco, F. (2005). The Caco-2
cell line as a model of the intestinal barrier: influence of cell and culture-related factors on Caco-2
cell functional characteristics. Cell Biology and Toxicology, 21, 1-26.
Savage, G.P., Vanhanen, L., Mason, S.M. & Ross, A.B. (2000). Effect of cooking on the soluble and
insoluble oxalate content on some New Zealand food. Journal of Food Composition and Analysis,
13, 201-206.
Siener, R., Honow, R., Voss, S., Seidler, A. & Hesse, A. (2006). Oxalate content of cereals and cereal
Products. Journal of Agricultural and Food Chemistry, 54, 3008-3011.
Silva, J.G.S., Rebellato, A.P., Greiner, R. & Pallone, J.A.L. (2017). Bioaccessibility of calcium, iron and
magnesium in residues of citrus and characterization of macronutrients. Food Research
International, 97, 162-169.
79
Soetan, K.O. & Oyewole, O.E. (2009). The need for adequate processing to reduce the antinutritional
factors in plants used as human foods and animal feeds: A review. African Journal of Food Science,
3, 223-232.
Sparvoli, F., Laureati, M., Pilu, R., Pagliarini, E., Toschi, I., Giuberti, G., Fortunati, P., Draminati, M.G.,
Cominelli, E. & Bollini, R. (2016). Exploitation of common bean flours with low antinutrient content
for making nutritionally enhanced biscuits. Frontiers in Plant Science, 7, 1-14.
Suman, P.F. & Urooj, A. (2014). Nutrients, antinutrients and bioacessible mineral content (in vitro) of
pearl millet as influenced by milling. Journal of Food Science and Technology, 51, 756-761.
Tadele, Y. (2015). Important anti-nutritional substances and inherent toxicants of feeds. Food Science
and Quality Management, 36, 40-48.
Toledo, N.M.V., Nunes, L.P., Silva, P.P.M., Spoto, M.H.F. & Canniatti-Brazaca, S.G.C. (2017). Influence
of pineapple, apple and melon by-products on cookies: physicochemical and sensory aspects.
International Journal of Food Science and Technology, 52, 1185-1192.
Turnlund, J. R., King, J. C., Keyes, W. R., Gong, B. & Michel, M. C. (1984). A stable isotope study of
zinc absorption in young men: Effects on phytate and R-cellulose. American Journal of Clinical
Nutrition, 40, 1071-1077.
Viadel, B., Barberá, R. & Farré, R. (2006). Calcium, iron and zinc uptakes by Caco-2 cells from white
beans and effect of cooking. International Journal of Food Science and Nutrition, 57, 190-197.
Vitali, D., Dragojevic, I.V. & Sebecic, B. (2008). Bioaccessibility of Ca, Mg, Mn and Cu from whole grain
tea-biscuits: impact of proteins, phytic acid and polyphenols. Food Chemistry, 110, 62-68.
Vitali, D., Radic, M., Cetina-Cizmek, B. & Dragojevic, V. (2011). Caco-2 cell uptake of Ca, Mg, and Fe
from biscuits as affected by enrichment with pseudocereal/inulin mixtures. Acta Alimentaria, 40, 480-
489.
Zouari, R., Besbes, S., Ellouze-Chaabouni, S. & Ghribi-Aydi, D. (2016). Cookies from composite wheat-
sesame peels flours: dough quality and effect of Bacillus subtilis SPB1 biosurfactant addition. Food
Chemistry, 94, 758-769.
WHO/FAO. World Health Organization and Food and Agriculture Organization of the United Nations.
(2004). Vitamin and mineral requirements in human nutrition. 2nd ed. Geneva: WHO/FAO.

80
81
6. GENERAL CONCLUSIONS
In general, pineapple, apple and melon by-products demonstrated significant amounts of
phenolic compounds, fibers and minerals, as well as physicochemical (color, water activity, pH,
agrochemical residues) and microbiological properties appropriate for their use as ingredients in new
food formulations.
In the present study, the application of fruit by-products was suggested for the preparation of
cookies and different behaviors were verified for the formulations in relation to the by-products
employed: cookies containing 15% of melon by-products were more prominent regarding the nutritional
aspects, presenting satisfactory amounts of dietary fibers and minerals. On the other hand, cookies with
15% of pineapple by-products were sensorially prominent for presenting a high acceptance and
purchase intention. Formulations containing 15% of apple by-product, in turn, demonstrated a higher
content of total phenolics and a higher antioxidant capacity.
In general, the use of fruit by-products reduced the contents of antinutritional factors such as
phytates and oxalates and contributed to mineral bioavailability in cookies, with pineapple by-product
positively influencing zinc retention, whereas melon by-product presented a relevant iron absorption and
apple by-product contributed to the transport efficiency and calcium and zinc absorption, respectively.
Considering the results found, it was observed that the fruit by-products demonstrated a
relevant contribution for the nutritional, technological and sensory aspects in cookies. It is expected that
the present approach might encourage the use of by-products in the development of new products
aimed at human consumption, attributing to these ingredients a higher added value, and avoiding their
improper disposal.


![Ovidio Coelho ]os6 Queiroz Clpidio Pereira maranhAo Anno ...](https://static.fdokumen.com/doc/165x107/6321d1daae0f5e8191059ef0/ovidio-coelho-os6-queiroz-clpidio-pereira-maranhao-anno-.jpg)