University of Groningen Exploring new ways of measuring the ...
241
University of Groningen Exploring new ways of measuring the economic value of vaccination with an application to the prevention of rotaviral disease Standaert, Baudouin Arnould Claire Ghislain Marie IMPORTANT NOTE: You are advised to consult the publisher's version (publisher's PDF) if you wish to cite from it. Please check the document version below. Document Version Publisher's PDF, also known as Version of record Publication date: 2015 Link to publication in University of Groningen/UMCG research database Citation for published version (APA): Standaert, B. A. C. G. M. (2015). Exploring new ways of measuring the economic value of vaccination with an application to the prevention of rotaviral disease. University of Groningen. Copyright Other than for strictly personal use, it is not permitted to download or to forward/distribute the text or part of it without the consent of the author(s) and/or copyright holder(s), unless the work is under an open content license (like Creative Commons). The publication may also be distributed here under the terms of Article 25fa of the Dutch Copyright Act, indicated by the “Taverne” license. More information can be found on the University of Groningen website: https://www.rug.nl/library/open-access/self-archiving-pure/taverne- amendment. Take-down policy If you believe that this document breaches copyright please contact us providing details, and we will remove access to the work immediately and investigate your claim. Downloaded from the University of Groningen/UMCG research database (Pure): http://www.rug.nl/research/portal. For technical reasons the number of authors shown on this cover page is limited to 10 maximum. Download date: 11-07-2022
-
Upload
khangminh22 -
Category
Documents
-
view
3 -
download
0
Transcript of University of Groningen Exploring new ways of measuring the ...

University of Groningen
Exploring new ways of measuring the economic value of vaccination with an application to theprevention of rotaviral diseaseStandaert, Baudouin Arnould Claire Ghislain Marie
IMPORTANT NOTE: You are advised to consult the publisher's version (publisher's PDF) if you wish to cite fromit. Please check the document version below.
Document VersionPublisher's PDF, also known as Version of record
Publication date:2015
Link to publication in University of Groningen/UMCG research database
Citation for published version (APA):Standaert, B. A. C. G. M. (2015). Exploring new ways of measuring the economic value of vaccination withan application to the prevention of rotaviral disease. University of Groningen.
CopyrightOther than for strictly personal use, it is not permitted to download or to forward/distribute the text or part of it without the consent of theauthor(s) and/or copyright holder(s), unless the work is under an open content license (like Creative Commons).
The publication may also be distributed here under the terms of Article 25fa of the Dutch Copyright Act, indicated by the “Taverne” license.More information can be found on the University of Groningen website: https://www.rug.nl/library/open-access/self-archiving-pure/taverne-amendment.
Take-down policyIf you believe that this document breaches copyright please contact us providing details, and we will remove access to the work immediatelyand investigate your claim.
Downloaded from the University of Groningen/UMCG research database (Pure): http://www.rug.nl/research/portal. For technical reasons thenumber of authors shown on this cover page is limited to 10 maximum.
Download date: 11-07-2022

EXPLORING NEW WAYS OF MEASURING THE ECONOMIC VALUE OF VACCINATIONWITH AN APPLICATION TO THE PREVENTION OF ROTAVIRAL DISEASE
ISBN: Book: 978-90-367-7874-9Ebook: 978-90-367-7873-2
Coverpicture by Carole Billiet, Shetlands, UK, 2011Typesetting: Nynke Tiekstra, ColtsfootMedia, RotterdamPrinted by: Ipskamp Drukkers
The work presented in this thesis was supported fi nancially by GSK Vaccines, Wavre, Belgium.
© Baudouin Standaert. All rights reserved. No part of this publication may be reproduced or transmitted in any form or by any means, electronic or mechanical, including photocopying, recording, or by any information storage or retrieval system, without permission in writing from the author. The copyright of previously published chapters of this thesis remains with the publisher or journal.
Dr Baudouin Standaert was an employee of GSK Vaccine during the development of this thesis. This causes potential confl ict of interest and obviously would hamper any underlying publication being against company strategies/interests. With this starting point, scientifi c integrity and quality was warranted by a supervisory team, peer-reviewed processes for the underlying papers, and a consistent group of co-authors from academia, including Prof J. Mauskopf, (director at ISPOR), Prof M Raes, Prof O Ethgen, and Prof MJ Postma.

Exploring new ways of measuring the economic value of vaccination
with an application to the prevention of rotaviral disease
Proefschrift
ter verkrijging van de graad van doctor aan deRijksuniversiteit Groningen
op gezag van derector magnifi cus prof. dr. E. Sterken
en volgens besluit van het College voor Promoties.
De openbare verdediging zal plaatsvinden op
vrijdag 29 mei 2015 om 14.30 uur
door
Baudouin Arnould Claire Ghislain Marie Standaert
geboren op 18 augustus 1955te Brugge, België

Promotor:Prof. dr. M.J. Postma, MSc, PhDCopromotor:Prof. dr. O. Ethgen, MSc, PhDBeoordelingscommissie:Prof. dr. L.P. Garrison, PhDProf. J. Hutton, BPhilProf. dr. J.C. Wilschut, MSc, PhD

CONTENTS
Executive Summary 6
1 Introduction 8
2 The conventional way of performing the health economic analysis of rotavirus vaccine 11
2.1 Rotavirus disease burden 11 2.2 QALY-measurement 28 2.3 Cost-eff ectiveness 41 2.4 Simple versus more complex 66
3 Impact studies 80
4 Exploring additional hidden values of rotavirus vaccines 122 4.1 Quality of Care improvement 122 4.2 Reduction in absenteeism 122
5 Cost-eff ectiveness analysis (CEA) and exploring for alternative approache 163
6 Limits to our knowledge 208 6.1 What did we learn? 208 6.2 Remaining challenges 210 6.2.1 Treatment versus prevention 210 6.2.2 Developed versus developing countries 214 6.2.3 Optimisation modelling 216 6.3 Final challenges 217
7 Recommendations 219
Samenvatting 223
Acknowledgements 227
Curriculum Vitae 230
List of publications 232

EXECUTIVE SUMMARY
Health economic evaluation of active prevention with new vaccines has been developed based on an approach used in therapeutic medicines, a technique called incremental cost-eff ectiveness analysis. The latter has been derived from cost-benefi t analysis where the value measurement of survival gain is expressed in natural units instead of money. A copy-paste function was used for moving from health economic assessment of treatment to health economic assessment of vaccine prevention. It was initially thought that this was a valid approach as vaccination was found to be considered as one of the most cost-eff ective interventions in health care. However in this thesis I will expose the shortcomings of selecting this approach of incremental cost-eff ectiveness analysis for vaccines. Prevention through vaccination is an activity that should preferentially be evaluated at the level of a population rather than an individual as it is the norm for doing cost-eff ectiveness analysis. Additionally incremental cost-eff ectiveness analysis may not be the best method to value vaccination in low-income countries where infectious diseases are most prevalent. Therefore alternatives in health economic assessment of prevention should be initiated and stimulated in order to propose an analysis that is more complete and accurate.
The thesis starts with the process of using the conventional cost-eff ectiveness analysis of rotavirus vaccination in a developed country. The approach investigated fi rst the fi nancial disease burden, then the QALY-impact of the disease in function of disease severity and patient age, to fi nally calculate the cost-eff ectiveness of the new vaccine using a birth cohort followed in a Markov cohort model design. The model compares the condition of vaccination with no vaccination. A more simplifi ed version, back of the envelop model, is proposed for those countries that have no access to elaborate datasets. Finally the modelling exercises were evaluated against a few vaccine impact studies to demonstrate that the initial model predictions were conservative. By making that comparison new interesting features were discovered related to the disease and the vaccination process that we were unaware about prior the program implementation. One is about the herd eff ect that is present in the age-group too young to be vaccinated. Another is the presence of the natural immunity that develops as a child ages, linked to the exposure to natural infection. As a consequence the natural immunity build-up process interferes with the vaccine effi cacy measurement the way it is calculated suggesting a vaccine waning process that is maybe not present. Finally, there are other sources of infection active in the child population that clearly appears as soon as the infection within the child population is under control through the vaccination program. That will happen in a short time frame of 2, 3 years depending of the vaccine uptake. One may discover that particular feature at best when the comparison is made between a cross-sectional and a cohort analysis of the at-risk population. It leads to the evidence that if the vaccine coverage rate is high but not optimal in the child population, there will be diffi culties to reach a disease stage of elimination in that community despite the massive impact the vaccine has on the disease burden. Much depends also on the way children are
6

7
nurtured during their childhood period going easily to day-care centres when they are very young. All these fi ndings have consequences on the economic value the rotavirus vaccination will demonstrate, but there was more to be discovered.
Two new features about the introduction of rotavirus vaccination in developed countries were identifi ed. One is about the improvement of the quality of care because the vaccine introduction allows for a better patient infl ux in hospital care during winter periods when many other infectious diseases occur within the same age-group normally causing recurrent chaotic conditions in health care delivery every year. The vaccine was able to reduce these diffi cult moments and improves the quality scores of care in hospital bed and personnel management.
Another interesting feature was that we were able to evaluate with real life data the reduction in absenteeism on the work fl oor among working mothers after the introduction of the rotavirus vaccine. The estimated reduction we normally introduce in our model design regarding indirect cost benefi t has now been assessed with those objective data. The match was remarkably close.
For the developing countries some other explorations were done. One was identifying when optimal benefi t may occur when using a 2 dose vaccination scheme instead of a 3 dose under a fi xed vaccination budget when varying the price per dose, the overall vaccine effi cacy, and the coverage rate of the rotavirus vaccine. The evaluation should discourage people to think that more vaccine doses are better rather to select the optimum needed to reach a certain health goal under a fi xed budget. Another project was to identify who else in society could be interested in having vaccination programs well implemented besides the ministry of health and the direct benefi ciaries, and what type of benefi t those other people are looking for, when, and under which circumstances. Extra tax payment or return in investment is what was discovered being the added new benefi t from the perspective of a government instead of the ministry by reducing specifi c child mortality after rotavirus vaccination that will join later the workforce in a country. This evaluation technique has been applied for Egypt but other emerging economies were investigated with the same approach as well.
Finally some new areas of exploration are proposed in the recommendations about health economics of vaccination. They are based on the acquired new knowledge about priority setting and about types of investment in health care. The proposed research should help to better evaluating the full and real monetary value of vaccines in the absence of understanding well what are the right opportunity cost and the right threshold values to be selected in an incremental cost-eff ectiveness analysis for low-income countries. In conclusion there is still much to explore in a domain that is not so easy to get access to because we are unfamiliar with all the diff erent aspects of quality of care measurement, absenteeism, among others. But once getting the data, it proofs that vaccines are a very healthy investment for creating better quality health at the population level.

8
INTRODUCTION
Economics of vaccines revisited. Hum Vaccin Immunother, 2013, 9(5), 1139-41 [1]
What is today the relationship between value of prevention with vaccines and its health economic evaluation worldwide? That is the question I would like to answer in this thesis based on the example of rotavirus vaccination.
By specifying vaccine prevention the fi eld of health economic assessment is narrowed, but it still opens a window of exploration to new research. Doesn’t that sound a little odd?[2] Haven’t we already assessed all the issues around health economics of vaccines since a long time? Almost every economic paper on vaccination will tell that this medical intervention is very cost-eff ective if not to say it is considered as one of the most cost-eff ective one ever introduced into the health care market.
What is meant by cost-eff ective is that vaccines are good value for money [3]. But the way this should be interpreted is broader than just the result of a cost-eff ectiveness analysis where extra payment for extra benefi t is measured. The result often goes into the direction of cost-savings but one still prefers to say it is cost-eff ective. Therefore there are reasons for improvement in what we want to disclose whether vaccination is now cost-eff ective or leads to cost-saving.
Until recently –less than 15 years ago- we used the copy-paste function of the economic assessment of therapeutic interventions applied in the developed world [4]. We used that technique on prevention of the new vaccines coming in the market such as the ones against hemophilus infl uenza B, pneumococcal disease, rotavirus diarrhoea, and cervical cancer. We selected the incremental cost-utility analysis (ICUA) formula for the comparison of diff erent disease management options and applied it on prevention as if the specifi cities of that fi eld were the same as in treatment. Let me highlight through 3 particularities where things get distorted in the results when using the conventional cost-eff ectiveness analysis on prevention with vaccines.
First, the traditional health economic assessment technique came from an area of evaluating diff erent therapies against a same disease with the focus on individual benefi t. There is nothing wrong in doing this, but individual benefi t limits the view on total value of prevention especially in transmissible diseases. Prevention works at the individual level but it then also heavily impacts the next level of evaluation which is the population. At that level there are diff erent rules of epidemiological and of economic assessment that prevail than at the individual level. But we often forget to evaluate the population in our economic assessment of vaccines. The latter disturb the transmission of the pathogen in a susceptible population generating therefore additional indirect benefi t amongst those who are unvaccinated which is called herd protection. That eff ect complicates the modelling of mimicking correctly the impact the vaccine has over time as the
1
MJ Postma
and BA Standaert

9
benefi t at the population level is bigger than the sum of the individual benefi t of the vaccinated persons [5].
Second particularity is the price set for vaccines, highlighted by people unfamiliar with health economics, asking the question why vaccines don’t cost so much. Vaccines prevent many deaths and save so many life years as they primarily act against infectious diseases in children with often high death rates. Should we then put a much higher price on those vaccines than what we are doing now [6]? Worse, if we compare vaccines with other prevention strategies used today such as statins that lower the blood cholesterol levels to prevent cardio-vascular diseases, one might be surprised to observe these specifi c preventative drugs cost more and benefi t less than vaccines. How come? There are reasons that explain this paradox and I will briefl y come back to that in the last chapter.
A related paradox concerns the economic assessment of vaccines in low- versus high-income countries (LICs versus HICs). The absolute benefi t of vaccines is much higher in LICs than in HICs, whereas the payment is much higher in HICs than in LICs. The paradox is there but how to handle that correctly? Traditional economic assessment tools may not give us the full answer here.
Finally, we nicely evaluate the vaccine from within a silo-narrow perspective of the disease, focussing on the health and health care benefi t but neglecting the broader perspective of all societal aspects. We almost forget to look outside the initial box to evaluate the problem into another new box–as said by Luc de Brabandere, ‘it is scary to look outside the fi rst box as there are no references to consider when being outside the familiar box’ [7]. It brings us to underestimating the total value of vaccines. How to cope with undervaluing the total potential of a vaccine?
Bringing these 3 elements together – an economic assessment of the vaccine at the population or public health level we often miss to do; a price considered too low for the value the vaccine might give; a broader value impact by looking into new boxes – it should demonstrate that the economic assessment of vaccines we perform today with the traditional methods is far from being complete. Additional approaches should be sought. They could be more complex than what has conventionally been assessed within the therapeutic fi eld but not always necessarily.
Meanwhile, the health economic assessment of a vaccination program can only be considered complete if we have the strength to think beyond the incremental analysis. Moreover incremental analysis is a technique that is confrontational as it selects between two options only: being cost-eff ective or not.
In practice we rarely apply this duality thinking about medical interventions because it is too restrictive to dismiss one option against the other. As a health care provider we like to maintain access to many ways of action when it comes to manage a disease. With that focus I propose to add an additional way of performing
Chapter 1

Exploring new ways of measuring the economic value of vaccination
10
health economics. It promotes the refl ection about optimisation by looking for combination of diff erent options and working under specifi c constraints while aiming to reach a specifi c health goal within a time frame [8].
It is already applied since a long time in many diff erent sectorial domains of the economy that have a public demand such as handling the environment, making the world of transport effi cient, shifting the energy delivery towards clean and renewable sources. We optimise what is reachable, but work under specifi c constraints of budget and logistics, among others. This is something we haven’t applied enough in health care where major potential exists to be more effi cient.
In the next chapter I will fi rst use the conventional health economic approach of incremental cost-eff ectiveness analysis of rotavirus vaccination (see chapter 2-3). I may come to two evidences when positioning the value of vaccines worldwide. One is that in the developed world the introduction of a new vaccine is about a substitute in the existing health care system and organisation. Therefore all the values or all the benefi ts must be shown to become successful with the substitute (see chapter 4). Maybe cost-benefi t analysis is for vaccines a better option than cost-eff ectiveness analysis in the economic value assessment of the product.
In the developing world is the positioning of a new vaccine diff erent. We are exposed to an add-on program instead of a substitute. The economic value positioning of the vaccine is anymore about what to replace in the health care system, but about priority setting when working under constrained budgets. Here the technique should be about budget optimisation and obtaining a good return on investment (chapter 5).
In the last chapter 6 I give additional refl ections about where to go with these fi ndings and what type of next research steps should be considered.
11
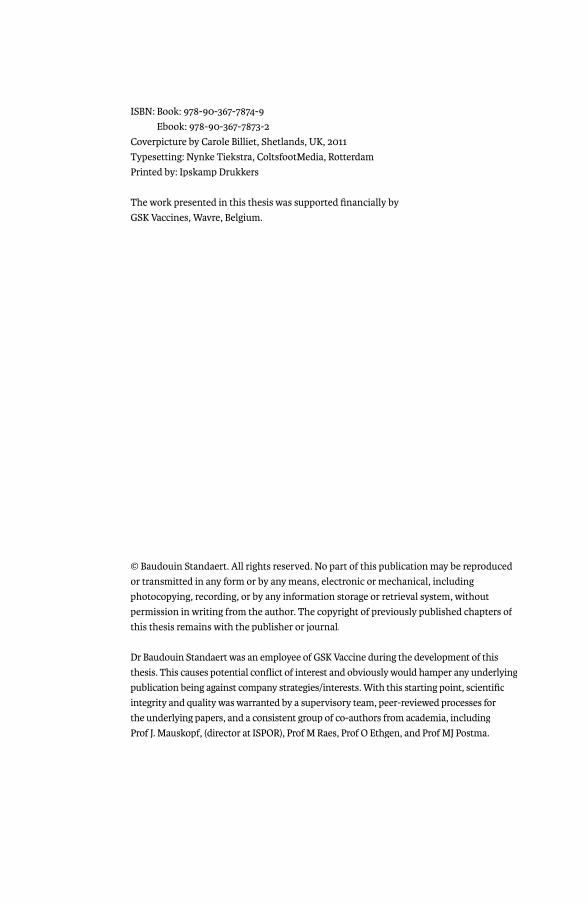
THE CONVENTIONAL WAY OF PERFORMING THE HEALTH ECONOMIC ANALYSIS OF ROTAVIRUS VACCINE
As mentioned in the introduction, the economic assessment of new vaccines has followed the same pathway as the one designed for therapeutic drugs. I applied the technique on rotavirus vaccination following this classic approach. By doing so I was able to present the basic economic value of this vaccine. It allows learning what is appropriate and what can be discovered in addition (see next chapter).
2.1 ROTAVIRUS DISEASE BURDENIn the absence of getting access to very detailed information at country level about the disease burden caused by rotavirus diarrhoea in children which should include cost estimates, I investigated the problem using a modelling approach for 4 diff erent countries in Europe: two big countries (United Kingdom (UK) and France) and two smaller ones (the Netherlands and Belgium). The comparison between the countries is interesting as France and Belgium have a more open health care system where people may have direct access to emergency rooms. This is diff erent for the Netherlands and the UK where stricter control of patients moving to the next health care level is organised through gate-keeping rules set by primary health care physicians. As a result in France and Belgium the disease burden shifts to the health care delivery system in terms of a higher number of hospitalisations and emergency room services, and eventually, a higher medical cost. In the UK and the Netherlands more burden remains at the level of the parents (i.e. the non-professional care-givers) where the indirect cost is higher. It is estimated that the overall cost including direct and indirect cost does not vary that much between the countries and is estimated at around €23.00/yr per child at risk [9].
THE FINANCIAL BURDEN OF ROTAVIRUS DISEASE IN FOUR COUNTRIES OF THE EUROPEAN UNION
PIDJ, 2008, 27: S20-S27
ABSTRACT
BackgroundBackground: Rotavirus disease is associated with a substantial fi nancial burden. Rotavirus gastroenteritis in children under 5 results in considerable medical resource utilization and burden for parents and society.
Methods: For this study a modelling approach was employed to assess the fi nancial burden of rotavirus disease in 4 European Union countries (Belgium, France, the Netherlands, and the United Kingdom). Both direct medical costs to health authorities and indirect costs borne by society, parents and employers are calculated.
2
Baudouin Standaert1
Olof Harlin2
Ulrich Desselberger3Ulrich Desselberger3Ulrich Desselberger
1GlaxoSmithKline Biologicals, Rixensart, Belgium
2Archimed medical communication ag, Zofi ngen, Switzerland
3Department of Medicine, University of Cambridge, Cambridge, UK

Exploring new ways of measuring the economic value of vaccination
12
Results: The Purchasing-Power-Parity (PPP)-adjusted direct cost expressed as a cost per exposure year, per child under fi ve, is highest in France (€ 12.26) and Belgium (€ 11.80) compared with the Netherlands (€ 8.13) and the UK (€ 7.67). The PPP-adjusted indirect cost is estimated to be highest in the UK (€ 15.47) and the Netherlands (€ 15.33) compared with France (€ 11.31) and Belgium (€ 10.24). The sum of the direct medical and indirect costs of rotavirus disease management is estimated to be € 23.11 ± € 0.70/yr per child under 5 years for all 4 countries.
Conclusions: In countries where more emphasis is placed on fi rst-line intervention (UK, the Netherlands), direct costs were lower than in countries where access to second-line healthcare support was more open (Belgium, France). The data suggest that the greater burden of fi nancial responsibility of managing rotavirus disease in children is borne by society (higher in the UK and the Netherlands than in France and Belgium). In Europe investment in rotavirus disease management is substantial, therefore medical and economic benefi ts of a vaccination strategy should be considered to reduce the medical and fi nancial burden associated with acute rotavirus gastroenteritis.
INTRODUCTIONRotavirus disease is associated with a substantial fi nancial burden. The virus is a major cause of acute gastroenteritis (AGE) in infants and children under the age of 5 years worldwide [1-4]. Each year in industrialized countries, rotavirus AGE is responsible for an estimated 223,000 hospitalizations, 1.8 million outpatient visits, and 7.1 million episodes of home care [2]. Thus, rotavirus AGE results in considerable medical resource utilization and substantial costs to national health care payers, families of patients and employers [5]. In Europe, these costs have only been studied in a limited way and in a few countries [6].
Total cost evaluation of a disease has a signifi cant added value if positioned in the right context. This context is normally the evaluation of the total disease burden which, in addition to costs, includes the clinical consequences at population level (epidemiology) and the Quality of Life (QoL) impact. This complete set of information is essential for the economic evaluation of new treatment options emerging in the market and as such it may be requested from health care authorities as part of the assessment for their policies.
The impact of new interventions on clinical outcomes and on QoL is most often measured and reported through randomized clinical trials. Total cost impact in contrast is generally more complex to assess and may be estimated using modelling techniques. This presents some specifi c challenges; one such is to include the appropriate cost items in the analysis to refl ect the cost perspective under consideration such as that of the patient, the health care provider, the third party payer, or the society. Furthermore, it is impossible to report an overall cost across diff erent countries because cost burden is country-specifi c. For instance, a treatment resource may be used more often if it is relatively inexpensive, therefore the treatment uptake will infl uence the disease outcome and total management cost of the disease. Price diff erences between countries may therefore infl uence the total cost picture.

Chapter 2
13
In terms of managing diarrhoea in infants and children caused by rotavirus infection, resource use and cost per case are well documented since the disease itself and the diff erent treatment options are well defi ned [1;3]. The remaining unknowns are the exact frequency of the disease per year, its distribution across various age groups and the proportion of the population following the diff erent treatment patterns available.
There are several methods for capturing epidemiological and fi nancial information relating to a disease. The most accurate is the application of prospective, observational cohort studies with duration of at least one year. An alternative method is the modelling approach that mimics the country-specifi c disease distribution per year plus the country-specifi c treatment options. Modelling allows the prediction of values missing in real life, such as the total number of diarrhoea events and associated emergency visits [7;8].
In the present study, we used the modelling approach to assess the fi nancial burden of rotavirus disease in four countries of the EU: Belgium, France, the Netherlands and the UK. We compared the cost of rotavirus disease in terms of direct medical and indirect costs and explored new ways of reporting the results.
METHODS
Country SelectionCountry SelectionA decision tree model has been selected to investigate the fi nancial burden caused by rotavirus disease in EU countries. We selected countries for which suffi cient reliable back-ground data are available or easily accessible: Belgium, France, the Netherlands and the UK. This selection enabled us to make a comparison between two relatively small and two larger EU countries.
Model selectionWe constructed a Markov cohort model [9] developed in TreeAge software (http://www.treeage.com/) (Figure 1). This model refl ects the change in disease occurrence adjusted by subject age. The model also includes the diff erent treatment patterns for rotavirus disease, and can be adjusted to the pattern specifi c to each country. For example, the Netherlands and the UK have an organized medical telephone service where the caller can obtain treatment advice; this is a form of paid support which is not available in other countries. The model is calibrated to the overall disease frequency estimates by country per year over the diff erent age groups and time periods.
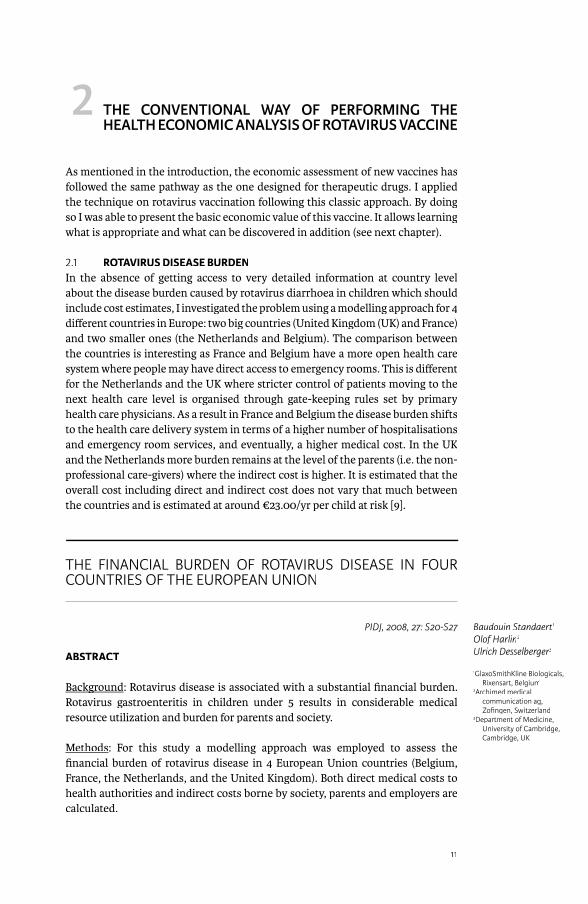
Model assumptionsModel assumptionsModel assumptions specifi c to the disease or country include the following:1) From the underlying disease pattern for rotavirus disease [9-11], a Weibull distribution [12] of probability of infection over the fi rst 70 months of life was constructed with the following parameters: shape coeffi cient 1.5 and scale coeffi cient 24.2 (see Figure 2). These parameter values were confi rmed by a multi-centre prospective study of the burden of rotavirus acute gastroenteritis in Europe, the REVEAL study [13].

14
Figure 1 General cohort m
odel structure for rotavirus diarrhea to estimate cost of illness by country
Choose
No Vaccine
No Vaccine
1st EventJan
pstart
06
3
5
8
1
�
[+]
[+]
[+]
000#
#
#
#
# #
#
#
#
#
#
pSpDeath
phospSD
#
pEmerg
pistL
##
pSpDeath
pSpDeath2
pMA
#
pNRD
pSD
pRotD
phospnonrotD
pDCom
pBF
#
pallmorta
pallmort
2nd EventJan
Alive >60MAlive >60M
Age <60M
_ stage<=59
_ stage>59_ Age >60M
Age >60M
Specific Death
Death
Death
- Death
Death
Death
Alive
Alive
Breast_Feeding
Diarrhea_Comm
u
No_Diarrhea_N
oso
Hospitalisation
Hospitalisation
No_H
ospitalisation- N
o_Hospitalisation
RotaDiarrhea
Severe
Not_Severe
Hom
e
2nd_Line
1st_Line
Emergency
No_Em
ergency- N
o_Emergency
Specific_Death
Specific_Death- Specific_Death
- No_Death
No_Death
- Specific_Death
- No_Death_N
oso_Rota
- No_Specific_Death
- No_Death_N
oso_NonRota
No_Death
No_Specific_Death
No_Death
- Hom
e
Medical_Advice
Clone 5: Non-RotaD
Clone 8: MediAdv
Clone 1: Hospitalisation
Non_RotaDiarrhea
N0_H
ospitalisationN
0_Hospit_N
o_Dia_Noso
Non-N
oso_Roa
Nosocom
-lal_Rota
No Breast_Feeding
Clone 3: Diarrhea
VaccineVaccine
pNVaccinated
L
VV
M
Chapter 2
15
2) Overall frequency data on rotavirus diarrhoea events in children under 5 years old are absent. Only data on children seeking medical advice are available. Unless specifi ed, we assumed conservatively that overall a minimum of 40% of the subjects of one birth cohort would suff er from rotavirus diarrhoea before 5 years of age and that medical advice would be sought for a maximum of one in two sick children. The values are comparative estimates based upon studies conducted in France [9]. They are submitted to sensitivity analysis (see below).
3) Full breastfeeding confers protection against viral diarrhoea events [14;15]. We assumed that at least 50% of infants are breast-fed at birth with an exponential decrease thereafter (beta-scale coeffi cient = 2).
4) Only severely ill children for whom medical advice is sought will be sent to hospital. The severity scale used here is based on a Vesikari score of 11 or more out of 20 points [16].
5) Nosocomial infections occur in a maximum of one-third of young children hospitalized for causes other than community acquired rotavirus diarrhoea, and they are age-dependent [17].
Cost dataTwo cost perspectives are considered in this analysis. One is the authority in a country funding the medical costs; the other is the society which includes all the other costs related directly or indirectly to the management of the disease under study. Unit cost data by country for direct medical costs reimbursed or paid by the health authorities in a country are collected from national databases. However, one
Figure 2 Weibull distribution simulating rotavirus disease frequency as a function of age (months)
0.0055
0.005
0.0045
0.004
0.0035
0.003
0.0025
0.002
0.0015
0.001
0.0005
0
0 10 15 20 25 30 35 40 45 50 55 60 655 70
Prob
abili
ty
Age (months)
X<= 3.345.0%
X <= 50.2995.0%

Exploring new ways of measuring the economic value of vaccination
16
Tabl
e 1
Uni
t cos
ts fo
r diff
eren
t ite
ms i
n th
e tr
eatm
ent o
f dia
rrhe
a pe
r cou
ntry
(exp
ress
ed in
€ 2
006)
1
Una
djus
ted
Net
herl
ands
Fran
ceBe
lgiu
mU
KM
edic
al v
isit
(GP
or P
aedi
atric
ian)
GP:
H
ome
visi
t:21
€ [2
5]41
€ [2
5]70
%30
%G
P:
Ped:
Hom
e vi
sit:
20€
[26]
22.8
7€ [2
6]30
€ [2
6]
67%
17%
16%
GP:
Ped:
16.7
1€
[27]
19.5
8€
[27]
50%
50%
GP:
<1
y>1
y43
.21€
[28]
40.7
9€ [2
8]
Dru
g th
erap
y12
€
10€
[29]
N/A
7.51
€M
edic
al c
alls
10€
[25]
N/A
N/A
22.5
0€ [2
8]Em
erge
ncy
visi
tN
/A22
.87€
[26]
424€
[27]
85.5
0€ [2
8]To
tal h
ospi
taliz
atio
n co
st (c
omm
unity
acq
uire
d)1 8
44€
[25;
30]
1 556
€ [3
1]1 6
96€
[27]
918€
[28]
Tota
l hos
pita
lizat
ion
cost
(nos
ocom
ial i
nfec
tion)
1 712
€ [3
2-34
]2
485€
[35]
84
8€ [2
7]1 0
70€
[36]
PPP-
adju
sted
N
ethe
rlan
dsFr
ance
Belg
ium
UK
Rate
adj
ustm
ent
0.92
3 0.
930
0.86
50.
963
Med
ical
Vis
its (G
P or
Pae
diat
ricia
n)G
P:
Hom
e vi
sit:
19.3
8€37
.84€
70%
30%
GP:
Ped:
Hom
e vi
sit:
18.6
€21
.27€
27.9
€
67%
17%
16%
GP:
Ped:
14.4
5€16
.94€
50%
50%
GP:
<1
y>1
y41
.61€
39.2
8€
Dru
g th
erap
y11
.07€
9.3€
N/A
7.23
€M
edic
al c
alls
9.23
€
N/A
N/A
21.6
6€
Emer
genc
y vi
sit
N/A
21.2
7€
366.
76€
82
.33€
To
tal h
ospi
taliz
atio
n co
st
com
mun
ity a
cqui
red
infe
ctio
n)1 7
02€
1 4
47€
1 4
67€
88
4€
Tota
l hos
pita
lizat
ion
cost
(nos
ocom
ial i
nfec
tion)
1 580
€
2 31
1€
733.
52€
1 0
30€
1 R
efer
ence
s ar
e in
dica
ted
in p
aren
thes
esPP
P, P
urch
asin
g Po
wer
Par
ityN
/A, N
ot a
pplic
able
Chapter 2
17
should be aware that reimbursement costs vary slightly within short time periods in a country and one should therefore check for regular updates of those cost values. Table 1 presents the unit costs for a medical (fi rst-line), emergency, and hospital visit, plus the unit costs for treatment. To perform cross-country comparisons, we adjusted the unit cost values with the Purchasing Power Parity (PPP) health care exchange rates per country provided by the OECD [18]. No discount rate was applied on the cost fi gures as the analysis reports costs per child per year.
Indirect costs were estimated by considering the loss of productivity of the parents of children with rotavirus diarrhoea using the human capital approach [19]. The data for out-of-pocket costs such as additional nappies, co-payment for drugs and medical visits, transport and parking costs are not readily available or are diffi cult to assess at the country level, therefore they were not included in this analysis.
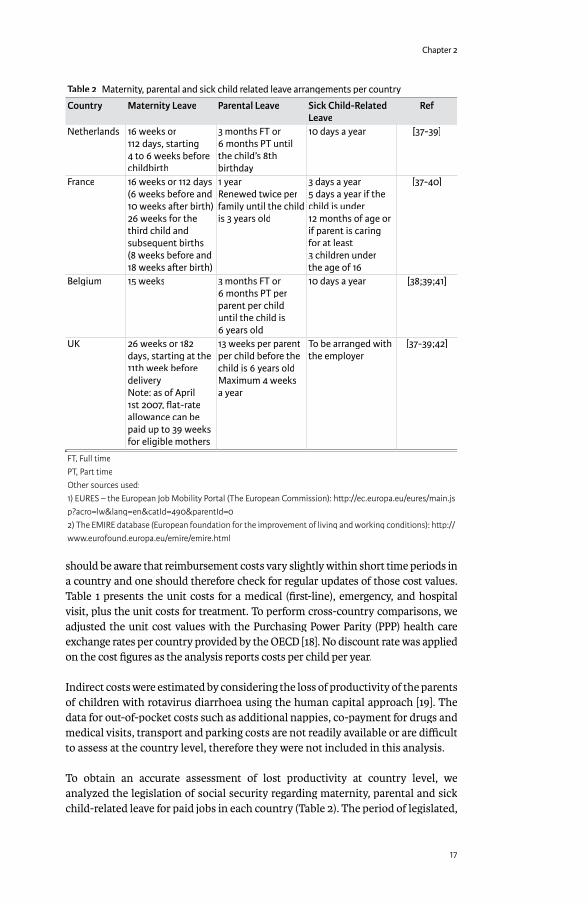
To obtain an accurate assessment of lost productivity at country level, we analyzed the legislation of social security regarding maternity, parental and sick child-related leave for paid jobs in each country (Table 2). The period of legislated,
Table 2 Maternity, parental and sick child related leave arrangements per country
Country Maternity Leave Parental Leave Sick Child-Related Leave
Ref
Netherlands 16 weeks or 112 days, starting 4 to 6 weeks before childbirth
3 months FT or 6 months PT until the child’s 8th birthday
10 days a year [37-39]
France 16 weeks or 112 days (6 weeks before and 10 weeks a� er birth)26 weeks for the third child and subsequent births (8 weeks before and 18 weeks a� er birth)
1 year Renewed twice per family until the child is 3 years old
3 days a year5 days a year if the child is under 12 months of age or if parent is caring for at least 3 children under the age of 16
[37-40]
Belgium 15 weeks 3 months FT or 6 months PT per parent per child until the child is 6 years old
10 days a year [38;39;41]
UK 26 weeks or 182 days, starting at the 11th week before deliveryNote: as of April 1st 2007, fl at-rate allowance can be paid up to 39 weeks for eligible mothers
13 weeks per parent per child before the child is 6 years oldMaximum 4 weeks a year
To be arranged with the employer
[37-39;42]
FT, Full timePT, Part timeOther sources used:1) EURES – the European Job Mobility Portal (The European Commission): h� p://ec.europa.eu/eures/main.jsp?acro=lw&lang=en&catId=490&parentId=02) The EMIRE database (European foundation for the improvement of living and working conditions): h� p://www.eurofound.europa.eu/emire/emire.html

Exploring new ways of measuring the economic value of vaccination
18
paid maternity leave is included in the analysis. This period does not allow for accounting an indirect cost during maternity leave. Due to the lack of detailed data on parental and sick child-related leave these issues are too complex to be considered and accounted for in this model. Therefore we estimate a minimum and maximum value of indirect cost due to the impact of rotavirus diarrhoea for each country in the following way: the model generates the number of days of sick child-related leave (due to the child’s diarrhoea) for one year (post-maternity leave). This value was multiplied by the reported proportion of employed women in the age-range of 15 to 39 years and the average payment per working hour per women per country. Data on women in the workforce were obtained from the offi cial European statistics database for each country (Table 3). These calculations are considered to yield the maximum estimate of indirect cost by country. The minimum estimate assumed that only half the women in the workforce have a paid job during the fi rst and subsequent years post-partum. Many mothers choose part-time work during that period or benefi t from parental leave as authorized in their country. The true value of the indirect cost estimate should fall between the estimates of maximum and minimum values. Lastly, we investigated which group (authorities, employers, and/or employees) paid the most in terms of indirect costs by country.
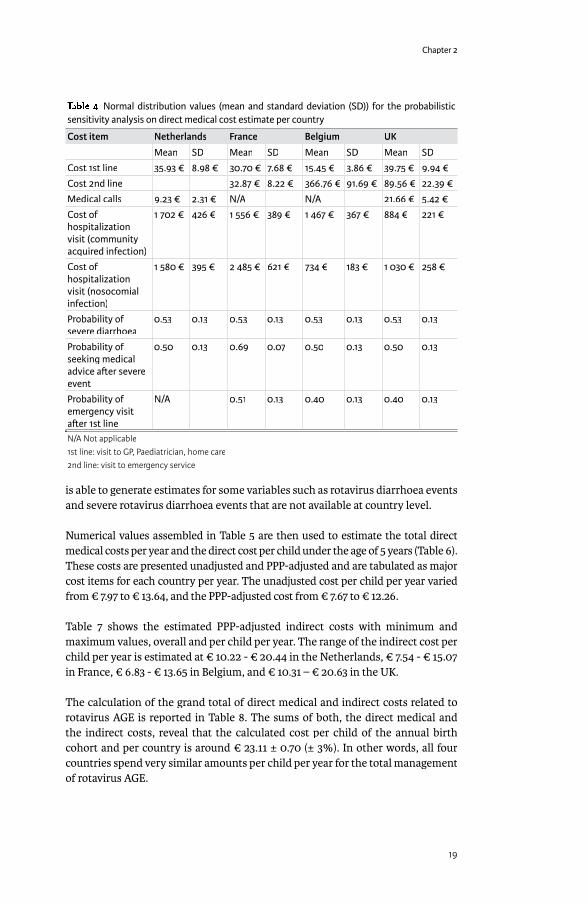
Sensitivity AnalysisSensitivity AnalysisMultiple probabilistic sensitivity analysis is performed on direct medical costs with TreeAge software on two aspects of the input data using distribution estimates: proportion of children with rotavirus AGE and unit cost data (Table 4).
Statistical AnalysisStatistical AnalysisThe overall results are reported as absolute costs in Euros (€), per child under 5 years of age and per country. In the multiple probabilistic sensitivity analysis the model is run in second-order Monte-Carlo simulation [12] with 1,000 iterations for each country and reports a cost distribution per country per child under 5 years of age.
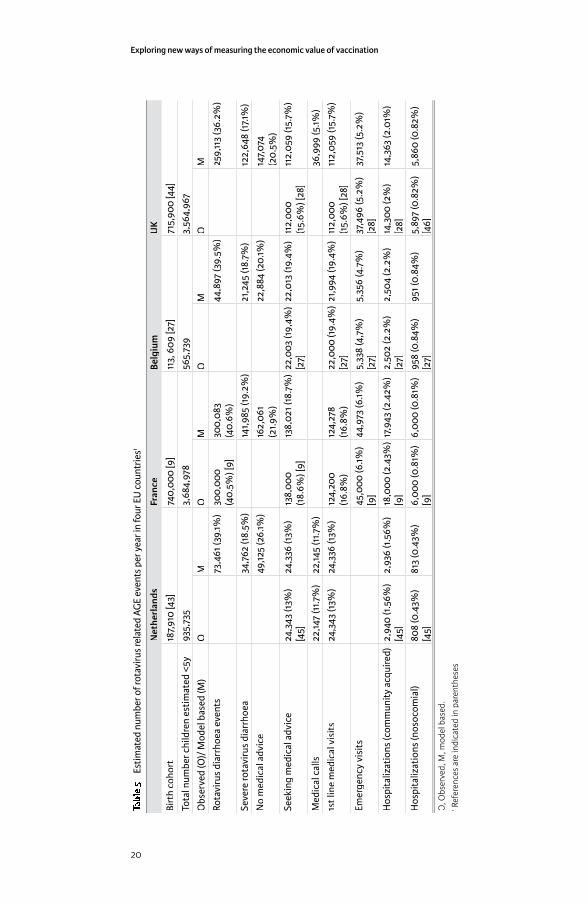
RESULTSThe observed values and modelled annual estimates of the total number of rotavirus-related AGE events in children <5 years of age in each country are shown in Table 5. The model accurately reproduces the known values such as the number of medical visits and the hospitalizations for each country. In addition, the model
Table 3 Proportions of women in the workforce (aged 15-39 years) and average hourly wages per country1
Country Proportion of women in the workforce (%) Average hourly wage (€)Netherlands 75 12.20France 54 12.20Belgium 55 11.55UK 66 14.581 Source: Structure of Earnings Survey (SES) 2002 and Labour Force Survey (EU-LFS) 2002 from the Statistical Offi ce of the European Communities (Eurostat). h� p://ec.europa.eu/eurostat
Chapter 2
19
is able to generate estimates for some variables such as rotavirus diarrhoea events and severe rotavirus diarrhoea events that are not available at country level.
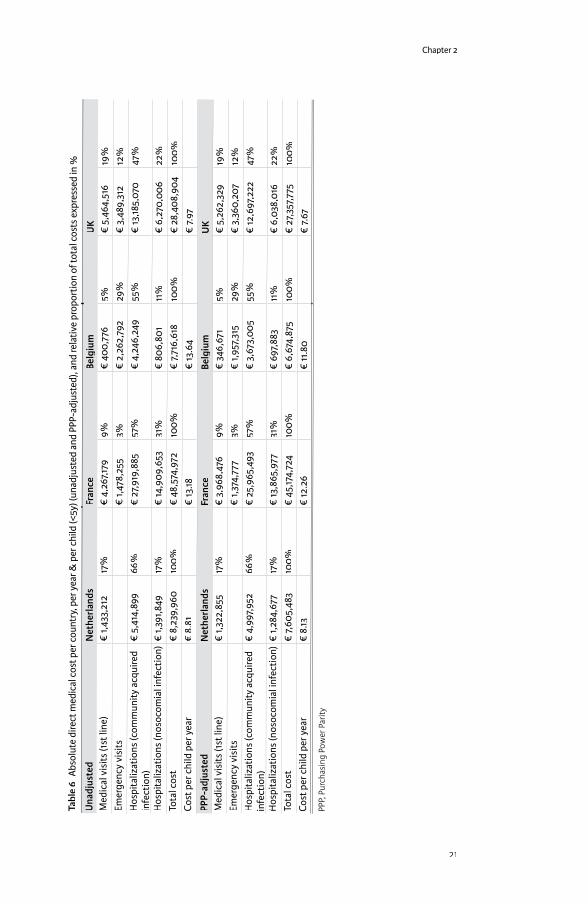
Numerical values assembled in Table 5 are then used to estimate the total direct medical costs per year and the direct cost per child under the age of 5 years (Table 6). These costs are presented unadjusted and PPP-adjusted and are tabulated as major cost items for each country per year. The unadjusted cost per child per year varied from € 7.97 to € 13.64, and the PPP-adjusted cost from € 7.67 to € 12.26.
Table 7 shows the estimated PPP-adjusted indirect costs with minimum and maximum values, overall and per child per year. The range of the indirect cost per child per year is estimated at € 10.22 - € 20.44 in the Netherlands, € 7.54 - € 15.07 in France, € 6.83 - € 13.65 in Belgium, and € 10.31 – € 20.63 in the UK.
The calculation of the grand total of direct medical and indirect costs related to rotavirus AGE is reported in Table 8. The sums of both, the direct medical and the indirect costs, reveal that the calculated cost per child of the annual birth cohort and per country is around € 23.11 ± 0.70 (± 3%). In other words, all four countries spend very similar amounts per child per year for the total management of rotavirus AGE.
Table 4 Normal distribution values (mean and standard deviation (SD)) for the probabilistic sensitivity analysis on direct medical cost estimate per country
Cost item Netherlands France Belgium UK
Mean SD Mean SD Mean SD Mean SD
Cost 1st line 35.93 € 8.98 € 30.70 € 7.68 € 15.45 € 3.86 € 39.75 € 9.94 €
Cost 2nd line 32.87 € 8.22 € 366.76 € 91.69 € 89.56 € 22.39 €
Medical calls 9.23 € 2.31 € N/A N/A 21.66 € 5.42 €
Cost of hospitalization visit (community acquired infection)
1 702 € 426 € 1 556 € 389 € 1 467 € 367 € 884 € 221 €
Cost of hospitalization visit (nosocomial infection)
1 580 € 395 € 2 485 € 621 € 734 € 183 € 1 030 € 258 €
Probability ofsevere diarrhoea
0.53 0.13 0.53 0.13 0.53 0.13 0.53 0.13
Probability of seeking medical advice a� er severe event
0.50 0.13 0.69 0.07 0.50 0.13 0.50 0.13
Probability of emergency visit a� er 1st line
N/A 0.51 0.13 0.40 0.13 0.40 0.13
N/A Not applicable1st line: visit to GP, Paediatrician, home care2nd line: visit to emergency service
Exploring new ways of measuring the economic value of vaccination
20
Tabl
e 5
Est
imat
ed n
umbe
r of r
otav
irus r
elat
ed A
GE
even
ts p
er y
ear i
n fo
ur E
U c
ount
ries1
Net
herl
ands
Fran
ceBe
lgiu
mU
K
Birt
h co
hort
187,
910
[43]
740,
000
[9]
113,
609
[27]
715,
900
[44]
Tota
l num
ber c
hild
ren
estim
ated
<5y
935,
735
3,68
4,97
856
5,73
93,
564,
967
Obs
erve
d (O
)/ M
odel
bas
ed (M
)O
MO
MO
MO
M
Rota
viru
s di
arrh
oea
even
ts73
,461
(39.
1%)
300,
000
(40.
5%) [
9]30
0,08
3 (4
0.6%
)44
,897
(39.
5%)
259,
113
(36.
2%)
Seve
re ro
tavi
rus
diar
rhoe
a34
,762
(18.
5%)
141,9
85 (1
9.2%
)21
,245
(18.
7%)
122,
648
(17.1
%)
No
med
ical
adv
ice
49,12
5 (2
6.1%
)16
2,06
1 (2
1.9%
)22
,884
(20.
1%)
147,
074
(20.
5%)
Seek
ing
med
ical
adv
ice
24,3
43 (1
3%)
[45]
24,3
36 (1
3%)
138,
000
(18.
6%) [
9]13
8,02
1 (18
.7%
)22
,003
(19,
4%)
[27]
22,0
13 (1
9.4%
)11
2,00
0 (1
5.6%
) [28
]11
2,05
9 (1
5.7%
)
Med
ical
cal
ls22
,147
(11.7
%)
22,14
5 (1
1.7%
)36
,999
(5.1%
)
1st l
ine
med
ical
vis
its24
,343
(13%
)24
,336
(13%
)12
4,20
0 (1
6.8%
)12
4,27
8 (1
6.8%
)22
,000
(19.
4%)
[27]
21,9
94 (1
9.4%
)11
2,00
0 (1
5.6%
) [28
]11
2,05
9 (1
5.7%
)
Emer
genc
y vi
sits
45,0
00 (6
.1%)
[9]
44,9
73 (6
.1%)
5,33
8 (4
,7%
) [2
7]5,
356
(4.7
%)
37,4
96 (5
.2%
) [2
8]37
,513
(5.2
%)
Hos
pita
lizat
ions
(com
mun
ity a
cqui
red)
2,94
0 (1
.56%
) [4
5]2,
936
(1.5
6%)
18,0
00 (2
.43%
) [9
]17
,943
(2.4
2%)
2,50
2 (2
.2%
) [2
7]2,
504
(2.2
%)
14,3
00 (2
%)
[28]
14,3
63 (2
.01%
)
Hos
pita
lizat
ions
(nos
ocom
ial)
808
(0.4
3%)
[45]
813
(0.4
3%)
6,00
0 (0
.81%
) [9
]6,
000
(0.8
1%)
958
(0.8
4%)
[27]
951 (
0.84
%)
5,89
7 (0
.82%
) [4
6]5,
860
(0.8
2%)
O, O
bser
ved,
M, m
odel
bas
ed.
1 Ref
eren
ces
are
indi
cate
d in
par
enth
eses
Chapter 2
21
Tabl
e 6
Abso
lute
dire
ct m
edic
al c
ost p
er c
ount
ry, p
er y
ear &
per
chi
ld (<
5y) (
unad
just
ed a
nd P
PP-a
djus
ted)
, and
rela
tive
prop
ortio
n of
tota
l cos
ts e
xpre
ssed
in %
Una
djus
ted
Net
herl
ands
Fran
ceBe
lgiu
mU
KM
edic
al v
isits
(1st
line
)€
1,43
3,21
217
%€
4,2
67,17
99%
€ 4
00,7
765%
€ 5
,464
,516
19%
Emer
genc
y vi
sits
€ 1,
478,
255
3%€
2,2
62,7
9229
%€
3,4
89,3
1212
%H
ospi
taliz
atio
ns (c
omm
unity
acq
uire
d in
fect
ion)
€ 5
,414
,899
66%
€ 2
7,91
9,88
557
%€
4,2
46,2
4955
%€
13,18
5,07
047
%
Hos
pita
lizat
ions
(nos
ocom
ial i
nfec
tion)
€ 1,
391,8
4917
%€
14,9
09,6
5331
%€
806
,801
11%
€ 6
,270
,006
22%
Tota
l cos
t€
8,2
39,9
6010
0%€
48,
574,
972
100%
€ 7,
716,
618
100%
€ 2
8,40
8,90
410
0%Co
st p
er c
hild
per
yea
r€
8.8
1€
13.18
€ 13
.64
€ 7.
97PP
P-ad
just
edN
ethe
rlan
dsFr
ance
Belg
ium
UK
Med
ical
vis
its (1
st li
ne)
€ 1,
322,
855
17%
€ 3
,968
,476
9%€
346
,671
5%€
5,2
62,3
2919
%Em
erge
ncy
visi
ts€
1,37
4,77
73%
€ 1,
957,
315
29%
€ 3
,360
,207
12%
Hos
pita
lizat
ions
(com
mun
ity a
cqui
red
infe
ctio
n)€
4,9
97,9
5266
%€
25,
965,
493
57%
€ 3
,673
,005
55%
€ 12
,697
,222
47%
Hos
pita
lizat
ions
(nos
ocom
ial i
nfec
tion)
€ 1,
284,
677
17%
€ 13
,865
,977
31%
€ 6
97,8
8311
%€
6,0
38,0
1622
%To
tal c
ost
€ 7,
605,
483
100%
€ 4
5,17
4,72
410
0%€
6,6
74,8
7510
0%€
27,
357,
775
100%
Cost
per
chi
ld p
er y
ear
€ 8
.13€
12.2
6€
11.8
0€
7.67
PPP,
Pur
chas
ing
Pow
er P
arity

Exploring new ways of measuring the economic value of vaccination
22
Figure 3 shows the results from the multiple probabilistic sensitivity analysis of PPP-adjusted direct medical costs per child, per country, and per year. The graph shows the cost range over which the direct medical cost might vary in each country. Countries spending more money in direct medical costs have a higher average value with a higher standard deviation or a wider spread in their costs fi gures. The average
Table 7 PPP-adjusted maximum and minimum indirect costs of rotavirus diarrhea per year in each country
Netherlands France Belgium UKMaximum indirect costs € 19,204,365 € 55,786,314 € 7,756.358 € 73,838,944Minimum indirect costs € 9,602,182 € 27,893,157 € 3,878,179 € 36,919,472Maximum per child per year1 € 20.44 € 15.07 € 13.65 € 20.63Minimum per child per year1 € 10.22 € 7.54 € 6.83 € 10.31Average per child per year € 15.33 € 11.31 € 10.24 € 15.47
1 Taking into account the size of the birth cohort, Table 5
Table 8 PPP-adjusted total costs of rotavirus diarrhea per year in each country
Netherlands France Belgium UK Direct costs € 7,605,483 € 45,174,724 € 6,674,875 € 27,357,775(% of total) 35% 52% 53% 33%Average Indirect costs € 14,403,000 € 41,840,000 € 5,817,000 € 55,379,000(% of total) 65% 48% 47% 67%Total costs € 22,008,483 € 87,014,724 € 12,491,875 € 82,736,775Exposure population 935,735 3,684,978 565,739 3,564,967Total costs per child per year € 23.52 € 23.61 € 22.08 € 23.21
Arithmetic mean ± S.D. of total costs per child per year: € 23.11 ± € 0.70 (± 3%)
Figure 3 Probabilistic sensitivity analysis of PPP-adjusted direct medical cost per child, per country, per year
0.22
0.2
0.18
0.16
0.14
0.12
0.1
0.08
0.06
0.04
0.02
0
0 4 6 8 10 12 14 16 18 20 222 24
Prob
abili
ty
Cost/child per year
€ 7.47
€ 8.04
€ 11.97
€ 11.50
NL
F
B
UK
Chapter 2
23
values in the Figure deviate slightly from the reported cost fi gures in Table 6 because the results in the graph are skewed following Monte-Carlo simulation.
DISCUSSIONContrary to what one might expect, estimating the total management cost of a disease at country level is not a straightforward exercise. Although the epidemiology of rotavirus disease, its distribution as a function of age and its annual peak during the winter period may be similar across the diff erent countries, its management and its related costs vary considerably. The use of available healthcare resources depends upon the specifi c structure of each country’s healthcare system. In the UK and the Netherlands, more emphasis is placed on fi rst-line intervention, limiting the use of the more costly second-line healthcare support systems such as emergency services and hospitals. By contrast, Belgium and France provide open access to second-line interventions sooner during the disease process, incurring a higher average direct cost per child for the treatment of rotavirus disease. Consequently, the average direct medical costs per child per year vary by an approximate cost diff erence of € 4.6 between the most and the least expensive countries.
The probabilistic sensitivity analysis suggests that healthcare systems such as those in the Netherlands and the UK may manage rotavirus disease more effi ciently compared with the systems in France and Belgium as they do not seem to have comparatively more diarrhoea cases or specifi c deaths, yet their average global medical management costs per child are lower. This is also refl ected in the curves of Figure 3 where France and Belgium have much larger standard deviations around average costs than the Netherlands and the UK.
In all four countries, 70 to 80% of the total direct medical costs are due to hospitalization including community acquired and nosocomial infections. The indirect costs are, however, highest in the Netherlands and the UK, contrary to what is observed for the direct medical costs. The surprising result is that the total costs of AGE are very similar in all 4 countries studied, with the diff erence between the most and the least expensive country being marginal (€ 1.53). This result demonstrates that a direct medical cost analysis alone would only have revealed part of the total relevant costs. One can conclude that the more emphasis is placed on fi rst-line treatment and parental care of sick children, the higher the indirect costs are for society, as the comparison between the UK and the Netherlands on one hand and France and Belgium on the other demonstrates.
The strength of our comparative analysis is that it follows a standard approach for every country and uses the same basic model with the underlying distribution of the disease as a function of age. It allows for a better comparison across countries. Another advantage is that we are able to estimate an average investment per child per year per country. It is known that for every child born in one of the four countries studied, the health authorities will invest on average between € 7.67 and € 12.26 in direct medical costs against rotavirus disease per year and between € 10.2 and € 15.5 in indirect costs per year. The total costs (direct and indirect) are very similar for all 4 countries at € 23.11 ± 0.7 (± 3%).
Exploring new ways of measuring the economic value of vaccination
24
The limitations of our analysis should also be considered. The cost per unit for each service off ered and the total number of rotavirus disease events has been diffi cult to quantify with suffi cient accuracy. The use of modelling implies that assumptions and uncertainties are introduced into the evaluation. Thus, our modelling approach may be open to criticism regarding the way some data are analyzed and interpreted, particularly with respect to the missing data. Serious disease events may lead to hospitalization whereas mild and moderate events are more often treated at home or in outpatient settings. In that respect, the model introduces limits on the units it generates: the number of emergency visits and hospitalizations should always be lower than the number of serious rotavirus-related AGE events. The sum of subjects staying at home, not seeking medical advice, together with those seeking advice should be equal to the total number of children with rotavirus diarrhoea. Using sensitivity analysis, we tested these uncertainties to observe their combined importance as shown in Figure 3.
Our approach is appropriate or even conservative when the results presented here are compared with recent investigations in Belgium and France [20;21]. For instance, the direct medical and grand total cost for rotavirus disease estimated by Bilcke et al. [20] for Belgium amount to € 7.4 million and € 19.6 million, respectively. Our results of € 7.7 million for direct medical and € 14.5 million (unadjusted cost fi gures in Tables 6 and 8, respectively) for the grand total were in line for the direct medical, but underestimated for the indirect cost as expected. For France, Huet et al. [21] report total direct costs of € 63 million to the National Healthcare Payer rising to € 177 million from the societal perspective compared with € 48.5 million and € 87.1 million, respectively, here. This can in part be explained by the inclusion of out-of-pocket costs by Huet et al. Another important diff erence is that Huet reports a much higher percentage of children with rotavirus AGE seeking medical care compared with this publication. Lorgelly et al. [22] reported the total cost per child from a societal perspective in the UK as £86.33. During the at risk period of 5-years this would equate to approximately € 26 per year, compared with the unadjusted total cost per child per year of € 24 presented in this analysis.
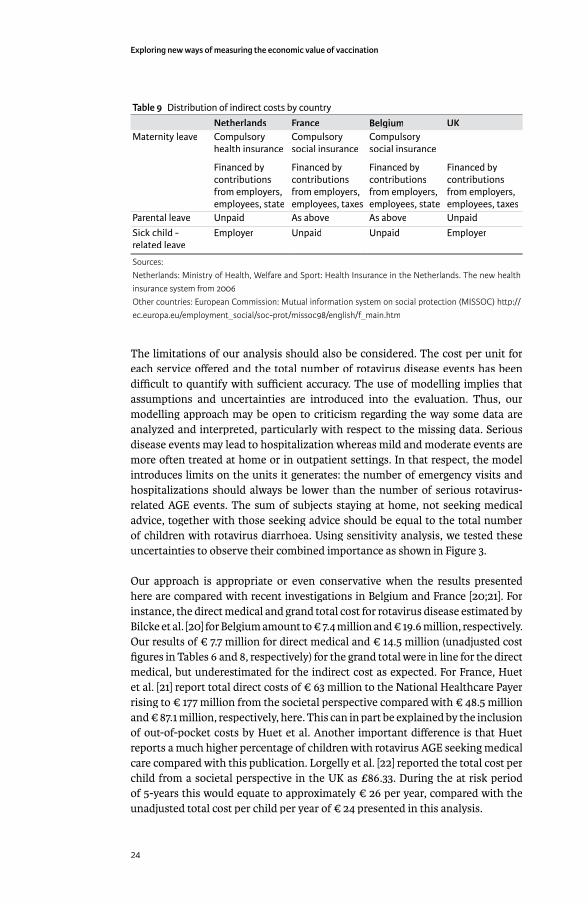
Table 9 Distribution of indirect costs by country
Netherlands France Belgium UKMaternity leave Compulsory
health insurance
Financed by contributions from employers, employees, state
Compulsory social insurance
Financed by contributions from employers, employees, taxes
Compulsory social insurance
Financed by contributions from employers, employees, state
Financed by contributions from employers, employees, taxes
Parental leave Unpaid As above As above UnpaidSick child - related leave
Employer Unpaid Unpaid Employer
Sources:Netherlands: Ministry of Health, Welfare and Sport: Health Insurance in the Netherlands. The new health insurance system from 2006Other countries: European Commission: Mutual information system on social protection (MISSOC) h� p://ec.europa.eu/employment_social/soc-prot/missoc98/english/f_main.htm
Chapter 2
25
Finally, the Netherlands will in general report a lower indirect cost than presented here as they are using the friction cost method [23] to estimate this type of societal cost, which could be half the cost calculated when the human capital method is chosen [19]. Our estimate for indirect costs should be substantiated with additional data to be collected through information supplied by the parents. We expect to have details on this type of data soon. In the absence of accurate data, the cost estimate for parental and sick child-related leave yielded only a range. In this analysis, it was further assumed that only mothers took sick child-related leave.
In healthcare systems such as those of the Netherlands and the UK, much of the fi nancial responsibility of caring for children with rotavirus disease falls on the parents. Indirect costs are often not included in health economic analyses but constitute a considerable burden for families and society. Thus, in countries where fi rst-line management is most promoted, a vaccination policy to prevent rotavirus disease is likely to benefi t individuals and employers more than the healthcare sector. Employers may see the benefi t in off ering a free-of-charge vaccination program to young children of their employees (Table 9). Further data are required before this approach is more thoroughly considered.
Rotavirus infection is a major cause of AGE in children under the age of 5 years [2]. Children with severe diarrheal disease are often hospitalized, contributing a signifi cant cost to the healthcare expenditures in a country. In addition, rotavirus disease causes considerable burden for parents and families who must take time off work or other activities to care for their sick children. Studies in the UK and the US have shown that rotavirus vaccination is a cost-eff ective intervention and can improve the QoL of children and their parents aff ected by rotavirus AGE [22;24]
REFERENCES[1] Parashar UD, Bresee JS, Gentsch JR, Glass RI. Rotavirus. Emerg Infect Dis
1998 Oct;4(4):561-70.[2] Parashar UD, Hummelman EG, Bresee JS, Miller MA, Glass RI. Global illness
and deaths caused by rotavirus disease in children. Emerg Infect Dis 2003 May;9(5):565-72.
[3] Parashar UD, Gibson CJ, Bresse JS, Glass RI. Rotavirus and severe childhood diarrhea. Emerg Infect Dis 2006 Feb;12(2):304-6.
[4] Koopmans M, Brown D. Seasonality and diversity of Group A rotaviruses in Europe. Acta Paediatr Suppl 1999 Jan;88(426):14-9.
[5] Giaquinto C, Van DP, Huet F, Gothefors L, Van der WM. Costs of community-acquired pediatric rotavirus gastroenteritis in 7 European countries: the REVEAL Study. J Infect Dis 2007 May 1;195 Suppl 1:S36-S44.
[6] Van Damme P., Van der Wielen M., Ansaldi F, Desgrandchamps D, Domingo JD, Sanchez FG, et al. Rotavirus vaccines: considerations for successful implementation in Europe. Lancet Infect Dis 2006 Dec;6(12):805-12.
[7] Djuretic T, Ramsay M, Gay N, Wall P, Ryan M, Fleming D. An estimate of the proportion of diarrhoeal disease episodes seen by general practitioners attributable to rotavirus in children under 5 y of age in England and Wales. Acta Paediatr Suppl 1999 Jan;88(426):38-41.
Exploring new ways of measuring the economic value of vaccination
26
[8] Ryan MJ, Ramsay M, Brown D, Gay NJ, Farrington CP, Wall PG. Hospital admissions attributable to rotavirus infection in England and Wales. J Infect Dis 1996 Sep;174 Suppl 1:S12-S18.
[9] Melliez H, Boelle PY, Baron S, Mouton Y, Yazdanpanah Y. [Morbidity and cost of rotavirus infections in France]. Med Mal Infect 2005 Oct;35(10):492-9.
[10] Brandt CD, Kim HW, Rodriguez WJ, Arrobio JO, Jeff ries BC, Stallings EP, et al. Pediatric viral gastroenteritis during eight years of study. J Clin Microbiol 1983 Jul;18(1):71-8.
[11] Fourquet F, Desenclos JC, Maurage C, Baron S. [Acute gastro-enteritis in children in France: estimates of disease burden through national hospital discharge data]. Arch Pediatr 2003 Oct;10(10):861-8.
[12] Law A, Kelton W. Simulation Modeling and Analysis. 3 ed. McGraw Hill Higher Education; 2000.
[13] Giaquinto C, Van DP, Huet F, Gothefors L, Maxwell M, Todd P, et al. Clinical consequences of rotavirus acute gastroenteritis in Europe, 2004-2005: the REVEAL study. J Infect Dis 2007 May 1;195 Suppl 1:S26-S35.
[14] Clemens J, Rao M, Ahmed F, Ward R, Huda S, Chakraborty J, et al. Breast-feeding and the risk of life-threatening rotavirus diarrhea: prevention or postponement? Pediatrics 1993 Nov;92(5):680-5.
[15] Newburg DS, Peterson JA, Ruiz-Palacios GM, Matson DO, Morrow AL, Shults J, et al. Role of human-milk lactadherin in protection against symptomatic rotavirus infection. Lancet 1998 Apr 18;351(9110):1160-4.
[16] Ruuska T, Vesikari T. Rotavirus disease in Finnish children: use of numerical scores for clinical severity of diarrhoeal episodes. Scand J Infect Dis 1990;22(3):259-67.
[17] Gleizes O, Desselberger U, Tatochenko V, Rodrigo C, Salman N, Mezner Z, et al. Nosocomial rotavirus infection in European countries: a review of the epidemiology, severity and economic burden of hospital-acquired rotavirus disease. Pediatr Infect Dis J 2006 Jan;25(1 Suppl):S12-S21.
[18] OECD in Figures 2006-2007. www.oecd.org/infi gureswww.oecd.org/infi gures 2006 [cited 2007 Jul 6](2006-2007 Edition)
[19] Le T, Gibson J, Oxley L. Cost- and income-based measures of human capital. Journal of Economic Surveys 2007;17(3):271-307.
[20] Bilcke J, Beutels P, De Smet F, Hanquet G, Van Ranst M, Van Damme P. Vaccination des nourrissons contre le rotavirus en Belgique. Analyse coût-effi cacité. Centre fédéral d’expertise des soins de santé (KCE); 2007. KCE reports 54B.
[21] Huet F, Largeron N, Trichard M, Miadi-Fargier H, Jasso-Mosqueda G. Burden of paediatric rotavirus gastroenteritis and potential benefi ts of a universal rotavirus vaccination programme with RotaTeq(R) in France. Vaccine 2007;In Press, Uncorrected Proof.
[22] Lorgelly PK, Joshi D, Iturriza GM, Gray J, Mugford M. Exploring the cost eff ectiveness of an immunization programme for rotavirus gastroenteritis in the United Kingdom. Epidemiol Infect 2007 Mar 5;1-12.
[23] Brouwer WB, Koopmanschap MA. The friction-cost method : replacement for nothing and leisure for free? Pharmacoeconomics 2005;23(2):105-11.

Chapter 2
27
[24] Widdowson MA, Meltzer MI, Zhang X, Bresee JS, Parashar UD, Glass RI. Cost-eff ectiveness and potential impact of rotavirus vaccination in the United States. Pediatrics 2007 Apr;119(4):684-97.
[25] Kemmeren JM ., Mangen M-JJ, van Duynhoven YTHP, Havelaar AH. Rotavirus, in Priority setting of foodborne pathogens. Disease burden and costs of selected enteric pathogens. Rijksinstituut voor Volksgezondheid en Milieu (National Institute for Public Health and the Environment): Bilthoven; 2006. RIVM report 330080001/2006.
[26] Offi cial medical tariff list (UCANSS). Ucanss 2006 2007 June 22 [cited 2007 Jul 1]Available from: URL: http://www.ucanss.fr/http://www.ucanss.fr/
[27] Fruytier AC, Van Schoor J, Standaert B. Vaccination with RIX4414 is cost-eff ective in a Belgian setting (Poster PIH3, presented at ISPOR 9th Annual Congress, Copenhagen (DK), October 29, 2006). Ref Type: Generic
[28] Harris JP, Jit M, Cooper D, Edmunds WJ. Evaluating rotavirus vaccination in England and Wales: Part I. Estimating the burden of disease. Vaccine 2007 May 16;25(20):3962-70.
[29] Martinot A, Dumonceaux A, Grandbastien B, Hue V, Leclerc F. Reseau interhospitalier d’evaluation des pratigues medicales dans les aff ections courantes de l’enfant. [Evaluation of the ambulatory treatment of acute diarrhea in infants]. Arch Pediatr 1997 Sep;4(9):832-8.
[30] de Wit MA, Koopmans MP, van der Blij JF, van Duynhoven YT. Hospital admissions for rotavirus infection in the Netherlands. Clin Infect Dis 2000 Sep;31(3):698-704.
[31] National Costs Study 2005. Public hospitals 2005 [cited 2007 Oct 16]Available from: URL: www.atih.sante.fr
[32] Contactisolatie kinderen (Contact isolation children). Dutch Workingparty on Infection Prevention 2004 [cited 2007 Jul 6]Available from: URL: http://http://www.wip.nl/www.wip.nl/
[33] Oostenbrink J, Koopmanschap M, Rutten F. Handleiding voor kostenonderzoek - Methoden en standaard kostprijzen voor economische evaluaties in de gezondheidszorg [Guide to cost research - Methods and standard costs prices for economic evaluatons in healthcare]. College voor zorgverzekeringen (Health Care Insurance board): Amstelveen; 2004.
[34] Oostenbrink R, Moons KG, rksen-Lubsen AG, Grobbee DE, Moll HA. A diagnostic decision rule for management of children with meningeal signs. Eur J Epidemiol 2004;19(2):109-16.
[35] Sermet-Gaudelus I, de La RF, Salomon JL, Lachassine E, Leruez-Ville M, Baujat G, et al. [Rotavirus nosocomial infection in pediatric units. A multicentric observation study]. Pathol Biol (Paris) 2004 Feb;52(1):4-10.
[36] Harrington M, Butler K, Caff erkey M. Rotavirus infection in hospitalised children: incidence and impact on healthcare resources. Ir J Med Sci 2003 Jan;172(1):33-6.
[37] Directionate General of Human Rights. Parental Leave in Council of Europe Member States. 1-50. 2005. Strasbourg, Council of Europe. Ref Type: Generic
Exploring new ways of measuring the economic value of vaccination
28
[38] European Foundation for the Improvement of Living and Working Conditions. Parental leave in European companies: establishment survey on working time 2004-2005. 1-57. 2007. Dublin, Ireland, European Foundation for the Improvement of Living and Working Conditions. Ref Type: Generic
[39] Moss P, O’Brien M. International review of leave policies and related research 2006. Department of Trade and Industry; 2006. [Series ]Employment relations research series no. 57.
[40] Guide sécurité sociale de l’employeur. L’Union des Caisses Nationales de Sécurité Sociale 2006Available from: URL: http://www.ucanss.fr/services/http://www.ucanss.fr/services/textes_documents/gsse/accueil_gsse.htmtextes_documents/gsse/accueil_gsse.htm
[41] Interruption de carrière dans le cadre du congé parental. NEO - National employment offi ce 2007:1-9. Available from: URL: http://www.onem.fgov.http://www.onem.fgov.be/D_opdracht_LBO/Regl/Werknemers/ouderschap/Ov_Cp/ContentFR.be/D_opdracht_LBO/Regl/Werknemers/ouderschap/Ov_Cp/ContentFR.htm#TopOfPagehtm#TopOfPage
[42] Time off for dependants: A guide for employers and employees (UK). Department of Trade and Industry (UK) 2000:1-20. Available from: URL: http://www.berr.gov.uk/fi les/fi le11419.pdfhttp://www.berr.gov.uk/fi les/fi le11419.pdf
[43] Bevolking, geboorte. (Population, birth). Centraal Bureau voor de Statistiek, Voorburg/Heerlen 2007 [cited 2007 Jul 9]Available from: URL: www.statline.cbs.nl
[44] Mid-2005 population estimates. Offi ce of National Statistics 2007Available from: URL: http://www.statistics.gov.uk/statbase/Expodata/Spreadsheets/http://www.statistics.gov.uk/statbase/Expodata/Spreadsheets/D9387.xlsD9387.xls
[45] Al MJ, Goossens L, Hövels AM, Michielsen CP, Standaert B. Cost-eff ectiveness of mass vaccination with a rotavirus vaccine in the Netherlands (Poster PIN19, presented at ISPOR 9th Annual Congress, Copenhagen (DK), October 30, 2006). Ref Type: Generic
[46] Martin A, Stantaert B. Cost eff ectiveness of infant vaccination with Rotarix in the UK. 25th Annual Meeting of the European Society for Paediatric Infectious Diseases, ESPID, Porto, Portugal 2007.
2.2 QALY-MEASUREMENTWhen the fi rst estimates on cost-eff ectiveness of rotavirus vaccination were reported around 1998 when RotaShield came on the market, there was no clear way to include QALYs for the diff erent health states to which children could be exposed to during the management process of rotavirus disease. Diff erent options were explored to get that type of information collected in one or another way.
One proposal was to collect the data through surrogate persons who are classifi ed as most neutral to the situation but still having enough experience with the disease and its consequences to be able to evaluate correctly the situation.
A number of GPs and paediatricians in the UK were interviewed and they were exposed to series of scenarios from mild to severe diseases and that for two
Chapter 2
29
diff erent age-groups (<18 months and >=18 months). This way of working allows getting a good range of utility scores by diff erent health states the disease can go through. This was reported in the following publication [10].
ESTIMATING UTILITY SCORES IN YOUNG CHILDREN WITH ACUTE ROTAVIRUS GASTROENTERITIS IN THE UK
JME, 2008, 11: 471-484.
ABSTRACT
ObjectiveObjective: To estimate utility scores for diff erent severities of acute rotavirus gastroenteritis in children aged <5 years in the UK.
Methods: UK general practitioners (n=25) and paediatricians (n=25) rated four diff erent health state descriptions of acute rotavirus gastroenteritis using the EuroQol (EQ-5D) questionnaire for children aged <18 months and 18 months to 5 years. EQ-5D scores were modifi ed to account for limited self-care and mobility, and converted into utility values using the standard algorithm using UK data.
Results: General practitioners rated the mean utility for primary care cases at 0.781 (SD 0.263) and 0.688 (SD 0.345) for the younger and older age groups, respectively. For hospitalised cases the corresponding scores were 0.425 (SD 0.243) and 0.200 (SD 0.386). Paediatricians rated the mean utility for hospitalised severe cases at 0.595 (SD 0.171) and 0.634 (SD 0.217) in the younger and older groups, respectively, and for hospitalised very severe cases at 0.256 (SD 0.251) and 0.077 (SD 0.340), respectively. In all cases, the utility diff erences between the health states were statistically signifi cant (p<0.0001).
Conclusions: Acute rotavirus gastroenteritis substantially impairs quality of life in children aged <5 years as rated by health professionals. This study provides useful quantitative utility estimates for economic evaluations.
INTRODUCTIONAcute rotavirus gastroenteritis is a highly contagious viral disease that is most common during the winter and mainly aff ects infants and young children less than fi ve years old. The main symptoms of acute rotavirus gastroenteritis are vomiting, fever and profuse watery diarrhoea, which may result in serious dehydration [1] [2]. It has been estimated that almost every child will be infected with the virus before the age of fi ve years [3]. Over 600,000 children will die annually from rotavirus-related illness worldwide [4]. Most of the deaths (over 80%) occur in the developing world.
In industrialised countries death from acute rotavirus gastroenteritis is rare, but the disease burden is substantial. For example, rotavirus is responsible for 50% of
A. Martin1
S. Co� rell2S. Co� rell2S. Co� rell
B. Standaert3
1GlaxoSmithKline Ltd, Stockley Park, Middlesex, UK
2IMS HEOR, London, UK3GlaxoSmithKline Biologicals,
Wavre, Belgium

Exploring new ways of measuring the economic value of vaccination
30
hospital admissions for acute gastroenteritis in children aged <5 years in Australia [5]. In the UK, the number of children aged <5 years hospitalised for acute rotavirus gastroenteritis is estimated to be as high as 17,000 a year, or 5.2 per 1000 [6]. Other developed countries report similar rates; 7.5 per 1000 in Australia, and 3 per 1000 in the European Union [7].
Many rotavirus infections are hospital-acquired. A study in a UK paediatric hospital estimated that rotavirus was responsible for 19% of healthcare-associated acute gastroenteritis [8], and across the European Union countries 21% of in-patient cases of rotavirus gastroenteritis were hospital-acquired [7]. Hospitalised cases of acute rotavirus gastroenteritis have been estimated to cost approximately 900–1800 Euros (€) per case in four European Union countries (Belgium, France, the Netherlands and the UK) [9]. Acute rotavirus gastroenteritis is also a substantial burden on primary care, accounting for up to 29% of the visits to general practitioners (GPs) for infectious intestinal disease in children aged <5 years, or over 150,000 GP visits per year in the UK [10].
There is no specifi c treatment for rotavirus infection [4;4], and the aim of clinical management in most cases is the prevention of dehydration [1]. However, oral rehydration therapy can be diffi cult to administer successfully in children with severe vomiting, which is common in acute rotavirus gastroenteritis [4], and rotavirus gastroenteritis occurs mainly in the winter, when health services are already under pressure. This makes vaccination an attractive option to prevent rotavirus-related illness and hospitalisations [11], with the potential to reduce considerably the associated morbidity and healthcare costs in both primary and secondary care.
A recent study in infants in their fi rst two years of life in six European countries showed that the vaccine RIX4414 (Rotarix™1) was highly eff ective, reducing acute rotavirus gastroenteritis episodes of any severity by 87% [12]. RIX4414 is a monovalent vaccine derived from the most common human rotavirus strain, G1P [13]. It provides cross-protection against most other serotypes and is given in two oral doses. A second rotavirus vaccine, RotaTeq™2, a pentavalent vaccine based on a bovine strain (WC3), has also demonstrated effi cacy and is administered in three oral doses [14]. The research presented in the current paper is applicable to both vaccines. When deciding whether to introduce and fund mass rotavirus vaccination programmes, healthcare providers will require data on the cost-eff ectiveness of vaccination as well as on safety and effi cacy. Cost-utility analysis, in which health benefi ts are expressed in quality-adjusted life-years (QALYs), is a widely accepted approach for assessing the cost-eff ectiveness of healthcare technologies [15], and is applied by bodies such as the UK National Institute for Health and Clinical Excellence (NICE). Calculation of the potential gain in QALYs from implementing a vaccination programme requires a health-related quality of life (HRQL) weighting or utility value for acute rotavirus gastroenteritis health states, on a scale between 0 (death) and 1 (full health).
1 Rotarix™ is a trade mark of the GlaxoSmithKline group of companies2 RotaTeq™ is a trade mark of Merck & Co

Chapter 2
31
Such utility values are presently lacking, because of the diffi culty of obtaining those values from young children and/or their direct environment. A study in Canada presented as an abstract has estimated utility values for children with acute rotavirus gastroenteritis by proxy assessment using the Health Utilities Index Mark 2 (HUI2), but did not distinguish between diff erent severities of illness [16]. A recently published study in Germany has estimated HRQL in young children with diarrhoea by proxy assessment using a visual analogue scale [17]. To our knowledge, no previous study has estimated utility scores for diff erent severities of acute rotavirus gastroenteritis using a recognised HRQL instrument with a validated method for converting the scores into utility values.
The objective of the present study was to estimate utility values for various severities of acute rotavirus gastroenteritis in children aged <5 years in the UK. Results from the study have been presented at the International Society for Pharmacoeconomics and Outcomes Research (ISPOR) 9th Annual European Congress in 2006 [18].
PATIENTS AND METHODSUtility was rated by 25 general practitioners (GPs) and 25 paediatricians as proxy respondents, as infants and young children would be unable to complete a HRQL questionnaire. Physicians were selected instead of parents as they were considered more likely to be able to distinguish between diff erent severities of acute rotavirus gastroenteritis. All respondents were working within the UK National Health Service (NHS) and had a minimum of 5 years and maximum of 25 years of experience. They were drawn from fi ve geographical regions of the UK (Scotland, Wales, South-east England, Midlands and North/North-east England).
Currently there is no disease-specifi c HRQL questionnaire developed for diarrhoea in children and few specifi c instruments are designed to assess the generic HRQL in children aged <5 years [19;20]. HRQL in young children can be assessed using parents or physicians as proxy respondents [19]. Several tools are available for measuring HRQL and utility [21;22]. For the present study we decided to use the EuroQol (EQ5D) questionnaire [23], completed by healthcare professionals acting as patient proxies with the necessary clinical experience to rate the health state of children with acute gastroenteritis. The EQ5D was chosen because it is widely used, was designed to be applicable in multiple countries, and the rating scores derived from it can be converted to utility values using a standard country-specifi c algorithm [24]. The EQ5D rates quality of life in fi ve dimensions or domains: mobility, self-care, usual activities, pain/discomfort and anxiety/depression. Respondents were presented with health state descriptions, representing the clinical presentation of diff erent severities of acute rotavirus gastroenteritis, and asked to rate each health state for infants aged <18 months and children aged 18 months to 5 years. Two age bands were used because most children aged 18 months or over are able to walk and so the mobility domain of the EQ5D is more relevant in this age group. Health state descriptions were checked by a GlaxoSmithKline physician (Dr Norman Begg) with both clinical and public health experience.

Exploring new ways of measuring the economic value of vaccination
32
GPs do not routinely test for rotavirus infection and so were presented with two health state descriptions of acute infectious gastroenteritis, one describing a case severe enough to be referred to hospital, and the other describing a case that could be managed in primary care. The GPs were not asked to decide whether they would refer each case, the criterion of referral was explicit in the health
Table 1 Health state descriptions presented to respondents
General practitioners
Primary care only Referred to hospital
Acute gastroenteritis NOT severe enough to warrant referral for hospital admissionLiquid diarrhoea (loose stools, non-bloody), 1–3 episodes/dayVomiting either not present or infrequentFever may or may not be presentDehydration may be present BUT parents/carers are able to manage rehydration at home ORNo signs of dehydration present and risk of dehydration is LOW
Acute gastroenteritis severe enough to warrant referral for hospital admissionLiquid diarrhoea present (more than usual loose stools, non-bloody), 4 or more episodes/dayVomiting may or may not be presentFever may or may not be presentSigns of dehydration are present AND parents/carers are unable to manage rehydration at homeORThere is a high risk of dehydration (>4 vomits/day; >8 liquid stools/day; child aged <6 months)
Paediatricians
Hospitalised, severe Hospitalised, very severe
Acute rotavirus infection severe enough to warrant admission or at least short-term observationVesikari score ≥10Signs of 3–8% dehydration present OR high risk of dehydrationParents unable to manage rehydration
Acute rotavirus infection severe enough to warrant admission or at least short-term observationVesikari score ≥10Signs of ≥9% dehydration present
Vesikari score described in reference [2]
Table 2 Respondent characteristics
GPs (n=25) Paediatricians (n=25)Number (%) in each region: Scotland Wales South-east England Midlands North/North-east England
5 (20)5 (20)5 (20)5 (20)5 (20)
4 (16)6 (24)6 (24)5 (20)4 (16)
Years of experience: Mean 15.8 9.3 SEM 0.95 1.07 Median 18.0 8.0Number of cases of acute gastroenteritis seen each month: Mean 18.1 20.6 SEM 4.00 4.60 Median 12.0 12.0
GP = general practitioner; SEM = standard error of the mean
Chapter 2
33
state descriptions presented (Table 1). The health state descriptions were based on the major symptoms of acute rotavirus gastroenteritis described in the clinical literature, including frequency of liquid diarrhoea, presence of fever and/or vomiting, the risk of dehydration and the ability of parents to manage rehydration at home [25;26] (Table 1). All GPs were presented with the same two health state descriptions.
Paediatricians were presented with two health state descriptions of acute rotavirus infection with a Vesikari score of at least 10, which indicates a clinical severity suffi cient to be considered for admission to hospital. The two health states were diff erentiated by the severity of dehydration present (Table 1). All paediatricians were presented with the same two health state descriptions.
Respondents were asked to rate the health status of a child in each of the two age bands and each of the described health states in relation to the child’s normal capability in full health. If they felt a domain was not applicable for a child of the given age band, they could mark the domain “not applicable”. Where a respondent marked a domain “not applicable”, this was assigned a default rating of 1, meaning “no impairment”. In the main analysis, the self-care and mobility domains were assigned a rating score of 1 for children aged <18 months, and the domain of self-care a rating score of 1 in children aged 18 months to 5 years, regardless of whether respondents rated these domains. This modifi cation was applied because children aged <5 years would normally have limited capacity for self-care and children aged <18 months would normally have limited mobility, so it may not be valid to attempt to rate the impact of acute rotavirus gastroenteritis on these domains. A secondary analysis considered the raw data scores, without these modifi cations, and both sets of data are presented here.
The raw and modifi ed EQ5D scores were converted to weighted utility values using a published algorithm [24]. This assigns each EQ5D score a utility value based on a survey of a representative sample of the UK population using the time trade-off method.
Descriptive statistics were compiled, including mean, standard deviation, median and 95% confi dence intervals (95% CI). Non-normality was tested using kurtosis and skewness and confi rmed by the Kolmogorov-Smirnov test. Comparisons between diff erent age groups were performed using the Wilcoxon Signed Rank test, as the data were not normally distributed. However, reporting focuses on mean values, as these are of more interest for economic evaluation than medians. P-values ≤0.05 determined statistically signifi cant diff erences. Descriptive summary statistics were analysed using Microsoft Excel and the comparative statistics were analysed using Stata (StataCorp, Texas, US) version 9.
RESULTSA total of 25 GPs and 25 paediatricians participated in the survey. Their distribution across the fi ve geographic regions of the UK is shown in Table 2.
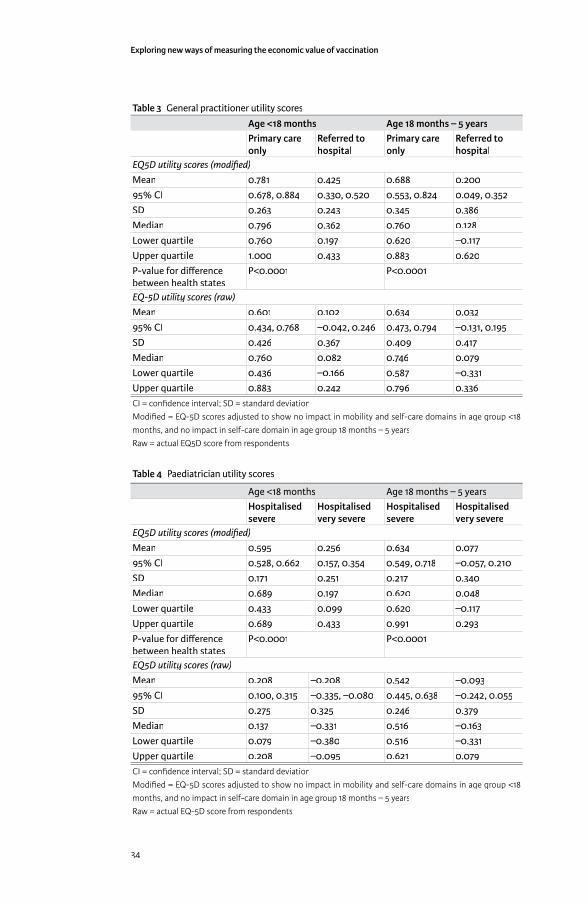
Exploring new ways of measuring the economic value of vaccination
34
Table 3 General practitioner utility scores
Age <18 months Age 18 months – 5 yearsPrimary care only
Referred to hospital
Primary care only
Referred to hospital
EQ5D utility scores (modifi ed)
Mean 0.781 0.425 0.688 0.20095% CI 0.678, 0.884 0.330, 0.520 0.553, 0.824 0.049, 0.352SD 0.263 0.243 0.345 0.386Median 0.796 0.362 0.760 0.128Lower quartile 0.760 0.197 0.620 –0.117Upper quartile 1.000 0.433 0.883 0.620P-value for diff erence between health states
P<0.0001 P<0.0001
EQ-5D utility scores (raw)
Mean 0.601 0.102 0.634 0.03295% CI 0.434, 0.768 –0.042, 0.246 0.473, 0.794 –0.131, 0.195SD 0.426 0.367 0.409 0.417Median 0.760 0.082 0.746 0.079Lower quartile 0.436 –0.166 0.587 –0.331Upper quartile 0.883 0.242 0.796 0.336CI = confi dence interval; SD = standard deviationModifi ed = EQ-5D scores adjusted to show no impact in mobility and self-care domains in age group <18 months, and no impact in self-care domain in age group 18 months – 5 yearsRaw = actual EQ5D score from respondents
Table 4 Paediatrician utility scores
Age <18 months Age 18 months – 5 yearsHospitalised severe
Hospitalised very severe
Hospitalised severe
Hospitalised very severe
EQ5D utility scores (modifi ed)
Mean 0.595 0.256 0.634 0.07795% CI 0.528, 0.662 0.157, 0.354 0.549, 0.718 –0.057, 0.210SD 0.171 0.251 0.217 0.340Median 0.689 0.197 0.620 0.048Lower quartile 0.433 0.099 0.620 –0.117Upper quartile 0.689 0.433 0.991 0.293P-value for diff erence between health states
P<0.0001 P<0.0001
EQ5D utility scores (raw)
Mean 0.208 –0.208 0.542 –0.09395% CI 0.100, 0.315 –0.335, –0.080 0.445, 0.638 –0.242, 0.055SD 0.275 0.325 0.246 0.379Median 0.137 –0.331 0.516 –0.163Lower quartile 0.079 –0.380 0.516 –0.331Upper quartile 0.208 –0.095 0.621 0.079CI = confi dence interval; SD = standard deviationModifi ed = EQ-5D scores adjusted to show no impact in mobility and self-care domains in age group <18 months, and no impact in self-care domain in age group 18 months – 5 yearsRaw = actual EQ-5D score from respondents
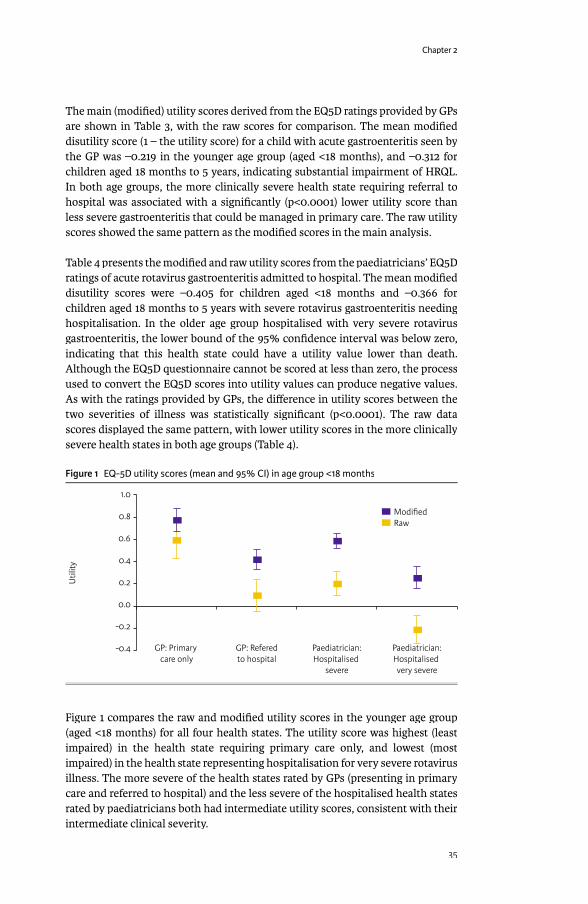
Chapter 2
35
The main (modifi ed) utility scores derived from the EQ5D ratings provided by GPs are shown in Table 3, with the raw scores for comparison. The mean modifi ed disutility score (1 – the utility score) for a child with acute gastroenteritis seen by the GP was –0.219 in the younger age group (aged <18 months), and –0.312 for children aged 18 months to 5 years, indicating substantial impairment of HRQL. In both age groups, the more clinically severe health state requiring referral to hospital was associated with a signifi cantly (p<0.0001) lower utility score than less severe gastroenteritis that could be managed in primary care. The raw utility scores showed the same pattern as the modifi ed scores in the main analysis.
Table 4 presents the modifi ed and raw utility scores from the paediatricians’ EQ5D ratings of acute rotavirus gastroenteritis admitted to hospital. The mean modifi ed disutility scores were –0.405 for children aged <18 months and –0.366 for children aged 18 months to 5 years with severe rotavirus gastroenteritis needing hospitalisation. In the older age group hospitalised with very severe rotavirus gastroenteritis, the lower bound of the 95% confi dence interval was below zero, indicating that this health state could have a utility value lower than death. Although the EQ5D questionnaire cannot be scored at less than zero, the process used to convert the EQ5D scores into utility values can produce negative values. As with the ratings provided by GPs, the diff erence in utility scores between the two severities of illness was statistically signifi cant (p<0.0001). The raw data scores displayed the same pattern, with lower utility scores in the more clinically severe health states in both age groups (Table 4).
Figure 1 EQ-5D utility scores (mean and 95% CI) in age group <18 months
1.0
0.8
0.6
0.4
0.2
0.0
-0.2
-0.4
Util
ity
GP: Primary care only
GP: Referedto hospital
Paediatrician:Hospitalised
severe
Paediatrician:Hospitalised very severe
ModifiedRaw
Figure 1 compares the raw and modifi ed utility scores in the younger age group (aged <18 months) for all four health states. The utility score was highest (least impaired) in the health state requiring primary care only, and lowest (most impaired) in the health state representing hospitalisation for very severe rotavirus illness. The more severe of the health states rated by GPs (presenting in primary care and referred to hospital) and the less severe of the hospitalised health states rated by paediatricians both had intermediate utility scores, consistent with their intermediate clinical severity.
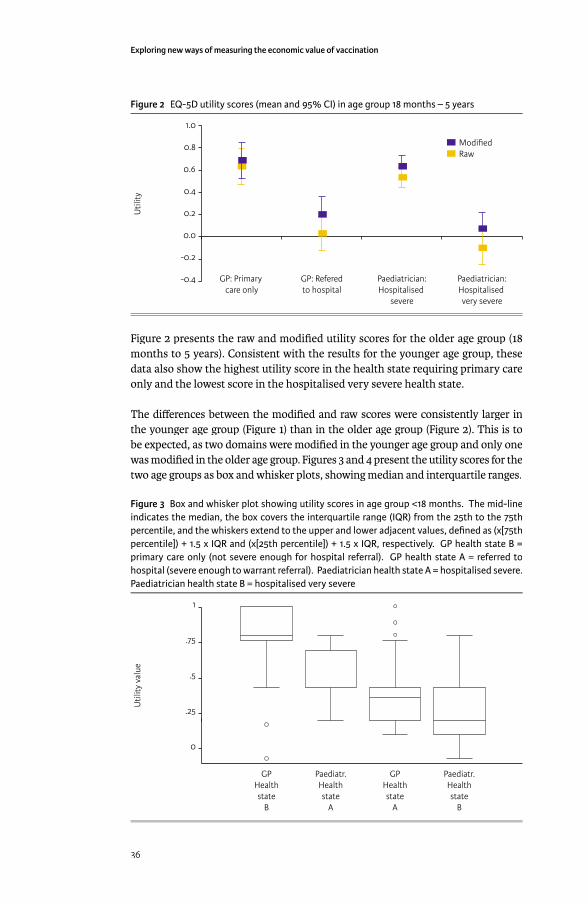
Exploring new ways of measuring the economic value of vaccination
36
Figure 2 EQ-5D utility scores (mean and 95% CI) in age group 18 months – 5 years
1.0
0.8
0.6
0.4
0.2
0.0
-0.2
-0.4
Util
ity
GP: Primary care only
GP: Referedto hospital
Paediatrician:Hospitalised
severe
Paediatrician:Hospitalised very severe
ModifiedRaw
Figure 2 presents the raw and modifi ed utility scores for the older age group (18 months to 5 years). Consistent with the results for the younger age group, these data also show the highest utility score in the health state requiring primary care only and the lowest score in the hospitalised very severe health state.
The diff erences between the modifi ed and raw scores were consistently larger in the younger age group (Figure 1) than in the older age group (Figure 2). This is to be expected, as two domains were modifi ed in the younger age group and only one was modifi ed in the older age group. Figures 3 and 4 present the utility scores for the two age groups as box and whisker plots, showing median and interquartile ranges.
Figure 3 Box and whisker plot showing utility scores in age group <18 months. The mid-line indicates the median, the box covers the interquartile range (IQR) from the 25th to the 75th percentile, and the whiskers extend to the upper and lower adjacent values, defi ned as (x[75th percentile]) + 1.5 x IQR and (x[25th percentile]) + 1.5 x IQR, respectively. GP health state B = primary care only (not severe enough for hospital referral). GP health state A = referred to hospital (severe enough to warrant referral). Paediatrician health state A = hospitalised severe. Paediatrician health state B = hospitalised very severe
1
.75
.5
.25
0
Util
ity v
alue
GPHealthstate
B
Paediatr.Healthstate
A
GPHealthstate
A
Paediatr.Healthstate
B

Chapter 2
37
Figure 4 Box and whisker plot showing utility scores in age group 18 months – 5 years. The mid-line indicates the median, the box covers the interquartile range (IQR) from the 25th to the 75th percentile, and the whiskers extend to the upper and lower adjacent values, defi ned as (x [75th percentile]) + 1.5 x IQR and (x [25th percentile]) + 1.5 x IQR, respectively. GP health state D = primary care only (not severe enough for hospital referral). GP health state C = referred to hospital (severe enough to warrant referral). Paediatrician health state C = hospitalised severe. Paediatrician health state D = hospitalised very severe
1
.75
.5
.25
0
-.25
Util
ity v
alue
GPHealthstate
D
Paediatr.Healthstate
C
GPHealthstate
C
Paediatr.Healthstate
D
DISCUSSIONThis study estimated utility scores for diff erent severities of acute rotavirus gastroenteritis in children aged <5 years in the UK, using GPs and paediatricians as proxy respondents. Each group of health professionals rated two health states of diff ering clinical severity for children in each of two age groups using the EQ-5D questionnaire. The EQ-5D scores were then converted into utility values using the standard algorithm as described by the EuroQoL group [24].
As expected, all four health states in both age groups were associated with impaired HRQL, as indicated by mean and median utility scores. This fi nding suggests that acute rotavirus gastroenteritis imposes a burden of decreased HRQL on patients, and consequently that prevention of infection could provide valuable gains in utility. There was some variation between respondents’ scores, as would be expected (Tables 3 and 4). Exploration of the factors underlying such variations, such as potential diff erences in perception between regions or between rural and urban settings, could be an interesting subject for future study, but is beyond the scope of the present paper. Both GPs and paediatricians rated the more clinically severe health states as having signifi cantly (p<0.0001) lower utility scores than the less severe health states, and this result held true across both age groups. Thus, it appears that the utility score derived from the EQ5D used in this study is able to diff erentiate between diff erent severities of acute rotavirus gastroenteritis, and should therefore be able to provide useful estimates of utility for use in economic evaluations.
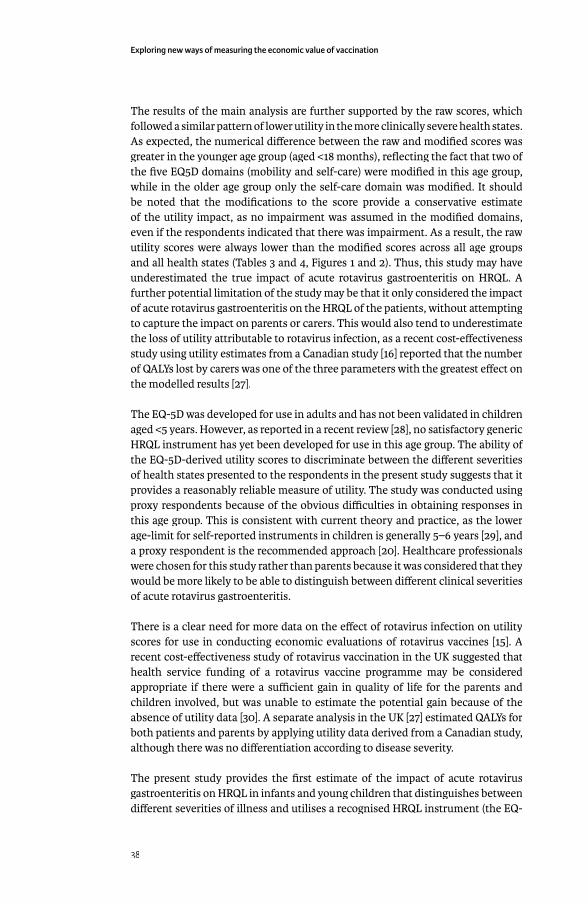
Exploring new ways of measuring the economic value of vaccination
38
The results of the main analysis are further supported by the raw scores, which followed a similar pattern of lower utility in the more clinically severe health states. As expected, the numerical diff erence between the raw and modifi ed scores was greater in the younger age group (aged <18 months), refl ecting the fact that two of the fi ve EQ5D domains (mobility and self-care) were modifi ed in this age group, while in the older age group only the self-care domain was modifi ed. It should be noted that the modifi cations to the score provide a conservative estimate of the utility impact, as no impairment was assumed in the modifi ed domains, even if the respondents indicated that there was impairment. As a result, the raw utility scores were always lower than the modifi ed scores across all age groups and all health states (Tables 3 and 4, Figures 1 and 2). Thus, this study may have underestimated the true impact of acute rotavirus gastroenteritis on HRQL. A further potential limitation of the study may be that it only considered the impact of acute rotavirus gastroenteritis on the HRQL of the patients, without attempting to capture the impact on parents or carers. This would also tend to underestimate the loss of utility attributable to rotavirus infection, as a recent cost-eff ectiveness study using utility estimates from a Canadian study [16] reported that the number of QALYs lost by carers was one of the three parameters with the greatest eff ect on the modelled results [27].
The EQ-5D was developed for use in adults and has not been validated in children aged <5 years. However, as reported in a recent review [28], no satisfactory generic HRQL instrument has yet been developed for use in this age group. The ability of the EQ-5D-derived utility scores to discriminate between the diff erent severities of health states presented to the respondents in the present study suggests that it provides a reasonably reliable measure of utility. The study was conducted using proxy respondents because of the obvious diffi culties in obtaining responses in this age group. This is consistent with current theory and practice, as the lower age-limit for self-reported instruments in children is generally 5–6 years [29], and a proxy respondent is the recommended approach [20]. Healthcare professionals were chosen for this study rather than parents because it was considered that they would be more likely to be able to distinguish between diff erent clinical severities of acute rotavirus gastroenteritis.
There is a clear need for more data on the eff ect of rotavirus infection on utility scores for use in conducting economic evaluations of rotavirus vaccines [15]. A recent cost-eff ectiveness study of rotavirus vaccination in the UK suggested that health service funding of a rotavirus vaccine programme may be considered appropriate if there were a suffi cient gain in quality of life for the parents and children involved, but was unable to estimate the potential gain because of the absence of utility data [30]. A separate analysis in the UK [27] estimated QALYs for both patients and parents by applying utility data derived from a Canadian study, although there was no diff erentiation according to disease severity.
The present study provides the fi rst estimate of the impact of acute rotavirus gastroenteritis on HRQL in infants and young children that distinguishes between diff erent severities of illness and utilises a recognised HRQL instrument (the EQ-
Chapter 2
39
5D) with a validated method (25) for converting to utility scores. As such, it off ers a valuable contribution to research on the potential cost-eff ectiveness of rotavirus vaccination programmes in Europe. Economic modelling studies applying these estimates are underway in several European countries, including the Netherlands [31], Belgium [32], Italy [33] and the UK [34]. These should provide new information to add to previous cost-eff ectiveness studies of rotavirus vaccination that have been based on the Canadian utility estimates that did not distinguish between diff erent severities of rotavirus illness [27;35], or that have considered other outcome measures such as disability-adjusted life-years (DALYs) [36].
In conclusion, the present study provides quantitative utility estimates for young children with varying severities of acute rotavirus gastroenteritis, which should be useful in economic evaluations of rotavirus vaccines.
REFERENCES[1] Eliason BC, Lewan RB. Gastroenteritis in children: principles of diagnosis
and treatment 1. Am Fam Physician 1998 Nov 15;58(8):1769-76.[2] Ruuska T, Vesikari T. Rotavirus disease in Finnish children: use of numerical
scores for clinical severity of diarrhoeal episodes. Scand J Infect Dis 1990;22(3):259-67.
[3] Parashar UD, Hummelman EG, Bresee JS, Miller MA, Glass RI. Global illness and deaths caused by rotavirus disease in children. Emerg Infect Dis 2003 May;9(5):565-72.
[4] Parashar UD, Gibson CJ, Bresee JS, Glass RI. Rotavirus and severe childhood diarrhea. Emerg Infect Dis 2006 Feb;12(2):304-6.
[5] Carlin JB, Chondros P, Masendycz P, Bugg H, Bishop RF, Barnes GL. Rotavirus infection and rates of hospitalisation for acute gastroenteritis in young children in Australia, 1993-1996. Med J Aust 1998 Sep 7;169(5):252-6.
[6] Ryan MJ, Ramsay M, Brown D, Gay NJ, Farrington CP, Wall PG. Hospital admissions attributable to rotavirus infection in England and Wales. J Infect Dis 1996 Sep;174 Suppl 1:S12-S18.
[7] The Pediatric ROTavirus European CommitTee (PROTECT). The paediatric burden of rotavirus disease in Europe. Epidemiol Infect 2006 Oct;134(5):908-16.
[8] Cunliff e NA, Allan C, Lowe SJ, Sopwith W, Booth AJ, Nakagomi O, et al. Healthcare-associated rotavirus gastroenteritis in a large paediatric hospital in the UK. J Hosp Infect 2007;67(3):240-4.
[9] Standaert B, Harlin O, Desselberger U. The fi nancial burden of rotavirus disease in four countries of the European Union. Pediatr Infect Dis J 2008;27(1):S20-S27.
[10] Djuretic T, Ramsay M, Gay N, Wall P, Ryan M, Fleming D. An estimate of the proportion of diarrhoeal disease episodes seen by general practitioners attributable to rotavirus in children under 5 y of age in England and Wales. Acta Paediatr Suppl 1999;88(426):38-41.
[11] Withdrawal of rotavirus vaccine recommendation. MMWR Morb Mortal Wkly Rep 1999 Nov 5;48(43):1007.
Exploring new ways of measuring the economic value of vaccination
40
[12] Vesikari T, Karvonen A, Prymula R, Schuster V, Tejedor JC, Cohen R, et al. Effi cacy of human rotavirus vaccine against rotavirus gastroenteritis during the fi rst 2 years of life in European infants: randomised, double-blind controlled study. Lancet 2007;370(9601):1757-63.
[13] Glass RI, Parashar UD. The promise of new rotavirus vaccines. N Engl J Med 2006 Jan 5;354(1):75-7.
[14] Vesikari T, Matson DO, Dennehy P, Van DP, Santosham M, Rodriguez Z, et al. Safety and effi cacy of a pentavalent human-bovine (WC3) reassortant rotavirus vaccine. N Engl J Med 2006 Jan 5;354(1):23-33.
[15] Rheingans RD, Heylen J, Giaquinto C. Economics of rotavirus gastroenteritis and vaccination in Europe: what makes sense? Pediatr Infect Dis J 2006 Jan;25(1 Suppl):S48-S55.
[16] Senecal M, Brisson M, Lebel M, Yaremko J, Wong R, Gallant L, et al. Burden of rotavirus-associated gastroenteritis in Canadian families: a prospective community based study (abstract P99). Canadian Journal of Infectious Disease and Medical Microbiology 2006;17(6):383.
[17] Huppertz HI, Forster J, Heininger U, Roos R, Neumann HU, Hammerschmidt T. The Parental Appraisal of the Morbidity of Diarrhea in Infants and Toddlers (PAMODI) Survey. Clin Pediatr (Phila) 2008;47(4):363-71.
[18] Martin A, Cottrell S. Estimating utility in rotavirus gastroenteritis in children under fi ve in the UK (abstract PIH19). Value Health 2006;9(6):A258.
[19] Janse AJ, Sinnema G, Uiterwaal CS, Kimpen JL, Gemke RJ. Quality of life in chronic illness: perceptions of parents and paediatricians 1. Arch Dis Child 2005 May;90(5):486-91.
[20] Prosser LA, Hammitt JK, Keren R. Measuring health preferences for use in cost-utility and cost-benefi t analyses of interventions in children: theoretical and methodological considerations. Pharmacoeconomics 2007;25(9):713-26.
[21] Torrance GW, Furlong W, Feeny D, Boyle M. Multi-attribute preference functions. Health Utilities Index 12. Pharmacoeconomics 1995 Jun;7(6):503-20.
[22] Drummond M, Sculpher M, Torrance G, O’Brien B, Stoddart G. Methods for the Economic Evaluation of Health Care Programmes. 3rd ed ed. Oxford University Press: Oxford Medical Publications; 2005.
[23] Brooks R. EuroQol: the current state of play. Health Policy 1996 Jul;37(1):53-72.[24] Dolan P. Modeling valuations for EuroQol health states. Med Care 1997
Nov;35(11):1095-108.[25] Armon K, Stephenson T, MacFaul R, Eccleston P, Werneke U. An evidence
and consensus based guideline for acute diarrhoea management. Arch Dis Child 2001 Aug;85(2):132-42.
[26] Polanco-Marin G, Gonzalez-Losa MR, Rodriguez-Angulo E, Manzano-Cabrera L, Camara-Mejia J, Puerto-Solis M. Clinical manifestations of the rotavirus infection and his relation with the electropherotypes and serotypes detected during 1998 and 1999 in Merida, Yucatan, Mexico. J Clin Virol 2003 Aug;27(3):242-6.
[27] Jit M, Edmunds WJ. Evaluating rotavirus vaccination in England and Wales. Part II. The potential cost-eff ectiveness of vaccination. Vaccine 2007;25(20):3971-9.
Chapter 2
41
[28] Grange A, Bekker H, Noyes J, Langley P. Adequacy of health-related quality of life measures in children under 5 years old: systematic review. J Adv Nurs 2007 Aug;59(3):197-220.
[29] Solans M, Pane S, Estrada MD, Serra-Sutton V, Berra S, Herdman M, et al. Health-Related Quality of Life Measurement in Children and Adolescents: A Systematic Review of Generic and Disease-Specifi c Instruments. Value Health 2007 Dec 17.
[30] Lorgelly PK, Joshi D, Iturriza GM, Gray J, Mugford M. Exploring the cost eff ectiveness of an immunization programme for rotavirus gastroenteritis in the United Kingdom. Epidemiol Infect 2008;136(1):44-55.
[31] Goossens LMA, Standaert B, Hartwig N, Hovels AM, Al MJ. The cost-utility of rotavirus vaccination with Rotarix(TM) (RIX4414) in the Netherlands 1487. Vaccine 2008 Feb 20;26(8):1118-27.
[32] Fruytier A, Van Schoor J, Standaert B. Vaccination with RIX4414 is cost-eff ective in a Belgian setting (abstract PIH3). Value Health 2006;9:A253.
[33] Standaert B, Marocco A, Assael B, Gabutti G, Guarino A, Lopalco P, et al. Analisi di costo-effi cacia della vaccinazione universale in Italia con il vaccino Rix4414 contro i rotavirus. Pharmacoeconomics 2008;10(1):23-35.
[34] Martin A, Standaert B. Cost-eff ectiveness of infant vaccination with Rotarix(TM) in the UK (abstract 586). ESPID 25th Annual Meeting 2007.
[35] Newall AT, Beutels P, Macartney K, Wood J, Macintyre CR. The cost-eff ectiveness of rotavirus vaccination in Australia. Vaccine 2007 Dec 17;25(52):8851-60.
[36] Constenla D, O’Ryan M, Navarrete MS, Antil L, Rheingans RD. [Potential cost eff ectiveness of a rotavirus vaccine in Chile] 1. Rev Med Chil 2006 Jun;134(6):679-88.
2.3 COST-EFFECTIVENESSCost-eff ectiveness of rotavirus vaccination has been assessed using a cohort model that included many diff erent features such as the importance of breast-feeding during the fi rst months after birth, the enclosure of indirect cost specifi ed at the moment of returning from maternity leave, the reduction of the so-called waning process of the vaccine over time, the adjustment of dose compliance and completion (1st and 2nd dose), and a fi xed herd eff ect. The model –called Roxanne (Rotarix Analysis of Economics)- allowed the comparison of a 2 versus 3 dose program that is administrated at diff erent time points or months.
The starting point for the model development was the model fi rst published by Melliez et al. showing the importance of breast feeding to reduce the rotavirus disease burden presented in 2005 before the rotavirus vaccine was available in the market. I have built on that model concept and added the many additional features [11].
Exploring new ways of measuring the economic value of vaccination
42
Interesting was the direct comparison between Melliez’s model published in 2007 [12] on the cost-eff ectiveness analysis of rotavirus vaccination in France with what I did in 2008 [13]. The point I wanted to highlight in the publication was to demonstrate how the change of many diff erent features in a same constructed model can shift the analysis from not-being cost-eff ective to become cost-eff ective. The diff erence was not only related to the data input but as well some structural diff erences between the two models such as the risk period of 3 years for Melliez et al versus 5 years in our model.
Roxanne model has been used and presented in many diff erent forums and in many diff erent countries. It has been part of many submissions at country level for getting reimbursement or participating in tenders. It was also part of an evaluation process organised by the WHO to compare the available rotavirus models worldwide in 2011. The model is accessible and has been made available to many health authorities worldwide [14]; [15]; [16]; [17].
One may be surprised to see that I didn’t publish a cost-eff ectiveness analysis with a dynamic model that includes the herd eff ect of the vaccine. There are two reasons for that. One is that I developed a dynamic model in-house and came to the same results that were presented in the literature by Pitzer et al [18], Atkins et al [19;20], and Atchison et al [21]. There was nothing new to present that was already published. But I was more interested in what real life data should be able to give. Comparing those data with the results of the cohort model for which still today more people are familiar with, was a second motivation to analyse the problem that way instead of using a dynamic model. One issue I had with the dynamic compartmental model for rotavirus vaccination is how to disentangle correctly the diff erent sources of infection and the diff erent ways of getting the immune protection developed in function of age, forced by the vaccine on the one hand and by the exposure to the natural infection on the other hand. An important issue found is that after the age of 5 years the susceptible group became large again possibly leading to new infections but I was not sure if those new infections should lead to severe conditions that need medical attention or not. My suspicion was not because the rotavirus vaccination program was not able to eliminate the virus. So the wild type virus could still circulate in the community and may act as regular booster dose to enhance the immune response. This is further tackled with the impact studies in the next paragraph.
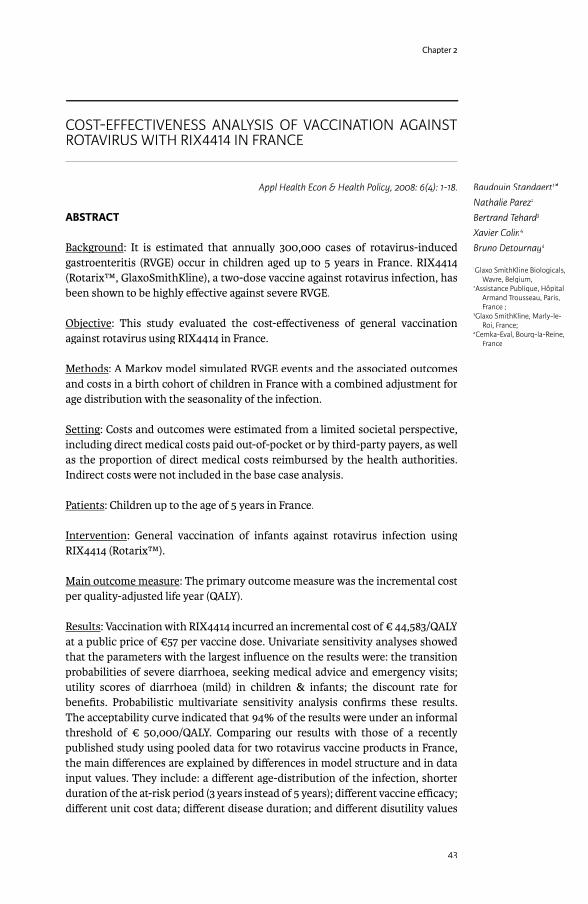
Chapter 2
43
COST-EFFECTIVENESS ANALYSIS OF VACCINATION AGAINST ROTAVIRUS WITH RIX4414 IN FRANCE
Appl Health Econ & Health Policy, 2008: 6(4): 1-18.
ABSTRACT
BackgroundBackground: It is estimated that annually 300,000 cases of rotavirus-induced gastroenteritis (RVGE) occur in children aged up to 5 years in France. RIX4414 (Rotarix™, GlaxoSmithKline), a two-dose vaccine against rotavirus infection, has been shown to be highly eff ective against severe RVGE.
ObjectiveObjective: This study evaluated the cost-eff ectiveness of general vaccination against rotavirus using RIX4414 in France.
Methods: A Markov model simulated RVGE events and the associated outcomes and costs in a birth cohort of children in France with a combined adjustment for age distribution with the seasonality of the infection.
SettingSetting: Costs and outcomes were estimated from a limited societal perspective, including direct medical costs paid out-of-pocket or by third-party payers, as well as the proportion of direct medical costs reimbursed by the health authorities. Indirect costs were not included in the base case analysis.
Patients: Children up to the age of 5 years in France.
Intervention: General vaccination of infants against rotavirus infection using RIX4414 (Rotarix™).
Main outcome measure: The primary outcome measure was the incremental cost per quality-adjusted life year (QALY).
Results: Vaccination with RIX4414 incurred an incremental cost of € 44,583/QALY at a public price of €57 per vaccine dose. Univariate sensitivity analyses showed that the parameters with the largest infl uence on the results were: the transition probabilities of severe diarrhoea, seeking medical advice and emergency visits; utility scores of diarrhoea (mild) in children & infants; the discount rate for benefi ts. Probabilistic multivariate sensitivity analysis confi rms these results. The acceptability curve indicated that 94% of the results were under an informal threshold of € 50,000/QALY. Comparing our results with those of a recently published study using pooled data for two rotavirus vaccine products in France, the main diff erences are explained by diff erences in model structure and in data input values. They include: a diff erent age-distribution of the infection, shorter duration of the at-risk period (3 years instead of 5 years); diff erent vaccine effi cacy; diff erent unit cost data; diff erent disease duration; and diff erent disutility values
Baudouin Standaert1*
Nathalie Parez2Nathalie Parez2Nathalie Parez
Bertrand Tehard3Bertrand Tehard3Bertrand Tehard
Xavier Colin4
Bruno Detournay4
1Glaxo SmithKline Biologicals, Wavre, Belgium,
2Assistance Publique, Hôpital Armand Trousseau, Paris, France ;
3Glaxo SmithKline, Marly-le-Roi, France;
4Cemka-Eval, Bourg-la-Reine, France
Exploring new ways of measuring the economic value of vaccination
44
for the health states in the model. There is a need for agreed standards to improve comparability of results from diff erent studies.
Conclusions: The results demonstrate that a generalized vaccination strategy with RIX4414 would be cost-eff ective in France from a limited societal perspective and depending on the base-line assumptions on disease progression and on utility scores selected. The limited societal perspective includes direct medical costs paid out-of-pocket or by third-party payers as well as the proportion of direct medical costs reimbursed by the health authorities, but does not include indirect costs.
INTRODUCTIONRotavirus infection is a major cause of severe diarrhoea and gastroenteritis in children under the age of 5 years worldwide [1;2]. In the Western world the infection has a seasonal peak during the winter period [3] and the severe consequences of rotavirus gastroenteritis (RVGE) are most frequently observed under the age of 2 years, after which the number of new infections and diarrhea events decreases. Successive infections confer natural immunity [4] and severe rotavirus diarrhea events are rarely seen after the age of 5 years.
Rotavirus is very contagious and its spread is diffi cult to control despite the application of primary hygiene measures. As a result, rotavirus epidemics are a well-known annually recurrent public health problem from November until March of each year. In France the number of diarrhoea events caused by rotavirus infection is estimated at 300,000 each year in children aged up to 5 years [5].
New vaccines against rotavirus, such as RIX4414 (Rotarix™, GlaxoSmithKline Biologicals, Rixensart, Belgium), are now available. A strategy of vaccinating children before the age of 6 months has the potential to provide protection against rotavirus infection over a period of at least two years. RIX4414 is a two-dose oral vaccine [6], and a phase III clinical trial in Europe has shown that this vaccine has a good safety profi le and is highly eff ective against severe RVGE and hospitalizations caused by RVGE [7].
Health authorities need information on cost-eff ectiveness of a vaccination strategy compared with the current situation in order to make reimbursement decisions. In 2005, Melliez et al. published a model of rotavirus infection in France that provided estimates of the costs and burden of illness [5]. Recently, the same group reported a cost-utility evaluation of rotavirus vaccination in France, based on the 2005 model and using pooled data on vaccine effi cacy and cost for two rotavirus vaccine products [8]. We have further developed a similar model by including modifi cations such as a combined age-related and seasonal variation in the infection. Using this model, we conducted a cost-utility evaluation of a rotavirus vaccination strategy using a specifi c vaccine product, RIX4414. In this paper we present the results of our cost-utility analysis and discuss the issues raised from a comparison of the two models.
Chapter 2
45
METHODSWe selected the Markov cohort model that was fi rst published in 2005 by Melliez et al. [5]. The model was constructed in Tree-Age Pro software to simulate rotavirus diarrhoea events and their associated outcomes in a hypothetical birth cohort of children aged up to 5 years (see Figure 1). The basic ‘Melliez et al.’ model structure was robust, but we refi ned it by adjusting the model to enable the calibration of the epidemic spread of the disease as a function of age of the child and to account for seasonality of the infection within one model structure (see Figure 2). In one arm of the model children could be vaccinated with RIX4414, and in the other no rotavirus vaccination was allowed. The modelled costs and outcomes were compared between the two arms to estimate the cost-eff ectiveness of rotavirus vaccination.
To allow for the higher probability of infection during the winter period, the cohort entry was subdivided into monthly entrants with an equal number of subjects born each month from January to December. Monthly age-adjusted transition probabilities for the risk of infection and diarrhea were then applied for the cohort until the age of 5 years. Fully breast-fed children were assumed to be protected against infection. The total running period of the model was the average life-time of a subject in France, in order to capture the vaccine benefi t of avoided deaths caused by rotavirus (number of cycles = 936 months or 78 years).
The tree was constructed as a time-driven, dichotomized event-related process with a cycle time of one month. In each month, the starting cohort has a risk of a fi rst episode of rotavirus-induced diarrhoea. The diarrhoea event could lead to consultation of a medical practitioner, either fi rst line (general practitioner (GP), home care or paediatrician) or second line (emergency visit). A fi rst line medical visit could be followed by an emergency visit and/or by hospitalization. During hospitalization, death caused by the infection could occur. Once discharged from hospital or after a fi rst event, a subject younger than 5 years faced the risk of contracting a second episode of rotavirus infection leading again to diarrhoea. A second infection was assumed never to lead to hospitalization or a second line visit. It was assumed that no further infections would occur after the age of 5 years.
Rotavirus infections can be transmitted between patients in hospital, so children who have been hospitalized for other reasons may be at risk of contracting hospital-acquired (nosocomial) rotavirus infections from rotavirus-infected children in the same paediatric unit. The model added branches to the tree in the “no diarrhoea” arm to allow for the possibility of nosocomial rotavirus-induced diarrhoea in children hospitalized for a non-rotavirus related event. This applied only to the winter period, refl ecting the seasonal peak of rotavirus infection.
The tree was duplicated in the vaccine arm into a vaccinated and a non-vaccinated arm, which allows the model to test diff erent rates of vaccine coverage for budget impact analysis.

Figure 1 Overall m
odel design for the January birth cohort only
death
pRSDeath
Back_Home
#
Hospitalization
pHospSD
Back_Home#
2nd_Event_January1
Emergency_Visit
pEmerg
Back_Home#
2nd_Event_January
1st_Line
p1stL
2nd_Line#Clone 1:
Seeking_Medical_Advice
pSMA
Stay_Home
#2nd_Event_January
8
Severe_Diarrhea
pSevere_Diarrhea
No_Severe_Diarrhea#Clone 8:
5
RotaDiarrhea
pRotaDiarrhea
No_RotaDiarrhea
#Clone 5:
Comm
unity_Acquired_Diarrhea
pDC
omm
death
pRSDeath
rotavirus_specific _death
Back_Home
#2nd_Event_January
Nosocomial_RotaDiarrhea
pNRD
death
pNRSD
eathdeath
Back_Home
#1st _Event_January
No_Nosocomial_RotaDiarrhea
#
Hospitalization
pHosp
No_Hospitalisation
#1st _Event_January
No_Diarrhea
#
No_Breast_Feeding
#
Breast_Feeding
pBF1st _Event_January
Age<=59 mo
_stage<=59 m
o
Age>60 mo
_stage>60 m
oAlive_>60 m
o
Alive
#
death
pAll_mortality
death
4
1st _Event_January
pStart
2nd_Event_January
0Clone 4:
Alive
#Alive_>60 m
o
death
pAll_mortality
death
Alive_>60 mo
0
rotavirus_specific _death
0
death
0
No Vaccine
No VaccinepNVaccinated
[+]
Vaccine
# [+]
Vaccine
Choose
[+] : hidden model structure
pBF : probability breast feeding
pD
Com
m: probability C
omm
unity Acquired Diarrhea
pH
osp: probability Hospitalisation for other reason than rotadiarrhea
pN
RD: probability of N
osocomial rotadiarrhea
pRSD
eath: probability of rotavirus specific death
pSMA: probability of Seeking M
edical Advice
pEmerg: probability of Em
ergency visit
1st Line: G
eneral Practitioner, Pediatrician, Hom
e visit
2nd Line: Em
ergency visit pH
ospSD: probability H
ospitalisation for Severe rotaDiarrhea
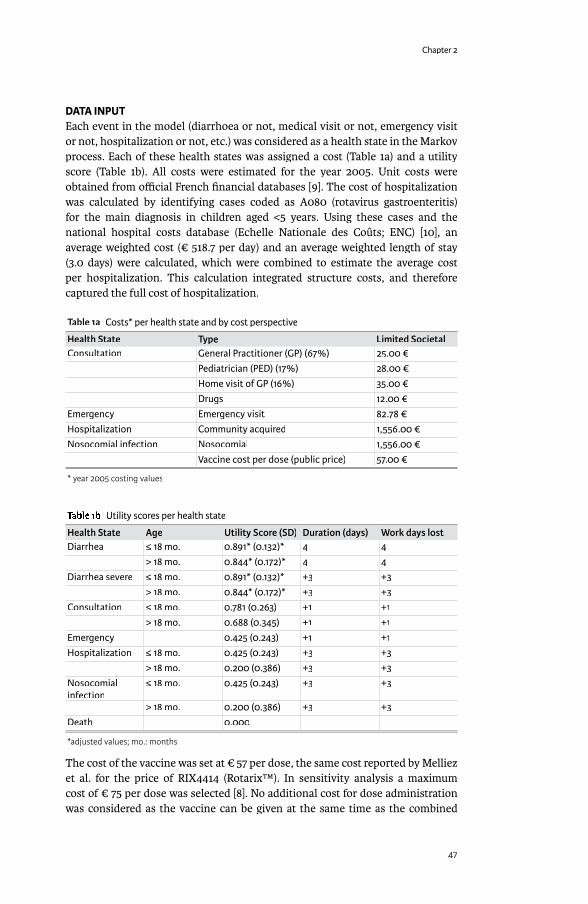
Chapter 2
47
DATA INPUTEach event in the model (diarrhoea or not, medical visit or not, emergency visit or not, hospitalization or not, etc.) was considered as a health state in the Markov process. Each of these health states was assigned a cost (Table 1a) and a utility score (Table 1b). All costs were estimated for the year 2005. Unit costs were obtained from offi cial French fi nancial databases [9]. The cost of hospitalization was calculated by identifying cases coded as A080 (rotavirus gastroenteritis) for the main diagnosis in children aged <5 years. Using these cases and the national hospital costs database (Echelle Nationale des Coûts; ENC) [10], an average weighted cost (€ 518.7 per day) and an average weighted length of stay (3.0 days) were calculated, which were combined to estimate the average cost per hospitalization. This calculation integrated structure costs, and therefore captured the full cost of hospitalization.
Table 1a Costs* per health state and by cost perspective
Health State Type Limited Societal Consultation General Practitioner (GP) (67%) 25.00 €
Pediatrician (PED) (17%) 28.00 €Home visit of GP (16%) 35.00 €Drugs 12.00 €
Emergency Emergency visit 82.78 €Hospitalization Community acquired 1,556.00 €Nosocomial infection Nosocomial 1,556.00 €
Vaccine cost per dose (public price) 57.00 €
* year 2005 costing values
Table 1b Utility scores per health state
Health State Age Utility Score (SD) Duration (days) Work days lostDiarrhea ≤ 18 mo. 0.891* (0.132)* 4 4
> 18 mo. 0.844* (0.172)* 4 4Diarrhea severe ≤ 18 mo. 0.891* (0.132)* +3 +3
> 18 mo. 0.844* (0.172)* +3 +3Consultation ≤ 18 mo. 0.781 (0.263) +1 +1
> 18 mo. 0.688 (0.345) +1 +1Emergency 0.425 (0.243) +1 +1Hospitalization ≤ 18 mo. 0.425 (0.243) +3 +3
> 18 mo. 0.200 (0.386) +3 +3Nosocomial infection
≤ 18 mo. 0.425 (0.243) +3 +3
> 18 mo. 0.200 (0.386) +3 +3Death 0.000
*adjusted values; mo.: months
The cost of the vaccine was set at € 57 per dose, the same cost reported by Melliez et al. for the price of RIX4414 (Rotarix™). In sensitivity analysis a maximum cost of € 75 per dose was selected [8]. No additional cost for dose administration was considered as the vaccine can be given at the same time as the combined
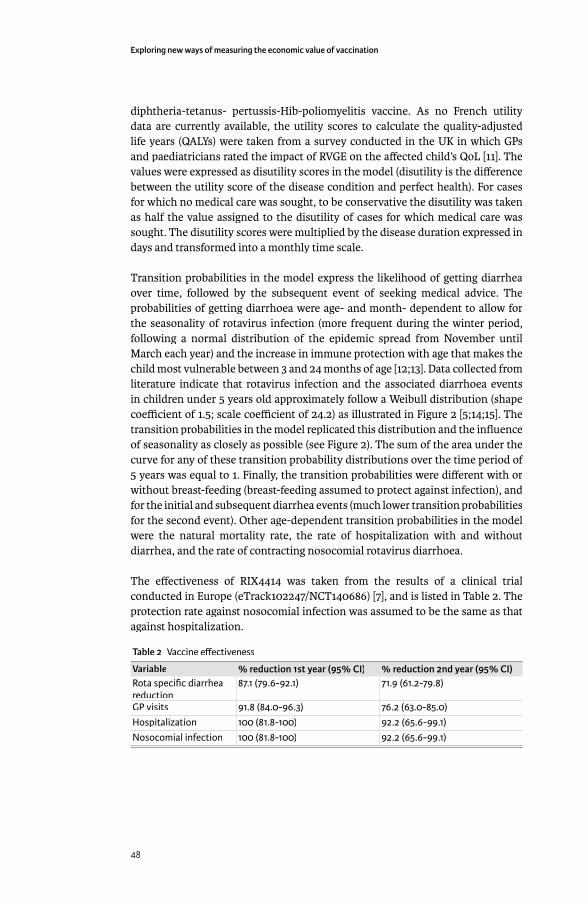
Exploring new ways of measuring the economic value of vaccination
48
diphtheria-tetanus- pertussis-Hib-poliomyelitis vaccine. As no French utility data are currently available, the utility scores to calculate the quality-adjusted life years (QALYs) were taken from a survey conducted in the UK in which GPs and paediatricians rated the impact of RVGE on the aff ected child’s QoL [11]. The values were expressed as disutility scores in the model (disutility is the diff erence between the utility score of the disease condition and perfect health). For cases for which no medical care was sought, to be conservative the disutility was taken as half the value assigned to the disutility of cases for which medical care was sought. The disutility scores were multiplied by the disease duration expressed in days and transformed into a monthly time scale.
Transition probabilities in the model express the likelihood of getting diarrhea over time, followed by the subsequent event of seeking medical advice. The probabilities of getting diarrhoea were age- and month- dependent to allow for the seasonality of rotavirus infection (more frequent during the winter period, following a normal distribution of the epidemic spread from November until March each year) and the increase in immune protection with age that makes the child most vulnerable between 3 and 24 months of age [12;13]. Data collected from literature indicate that rotavirus infection and the associated diarrhoea events in children under 5 years old approximately follow a Weibull distribution (shape coeffi cient of 1.5; scale coeffi cient of 24.2) as illustrated in Figure 2 [5;14;15]. The transition probabilities in the model replicated this distribution and the infl uence of seasonality as closely as possible (see Figure 2). The sum of the area under the curve for any of these transition probability distributions over the time period of 5 years was equal to 1. Finally, the transition probabilities were diff erent with or without breast-feeding (breast-feeding assumed to protect against infection), and for the initial and subsequent diarrhea events (much lower transition probabilities for the second event). Other age-dependent transition probabilities in the model were the natural mortality rate, the rate of hospitalization with and without diarrhea, and the rate of contracting nosocomial rotavirus diarrhoea.
The eff ectiveness of RIX4414 was taken from the results of a clinical trial conducted in Europe (eTrack102247/NCT140686) [7], and is listed in Table 2. The protection rate against nosocomial infection was assumed to be the same as that against hospitalization.
Table 2 Vaccine eff ectiveness
Variable % reduction 1st year (95% CI) % reduction 2nd year (95% CI)Rota specifi c diarrhea reduction
87.1 (79.6-92.1) 71.9 (61.2-79.8)
GP visits 91.8 (84.0-96.3) 76.2 (63.0-85.0)Hospitalization 100 (81.8-100) 92.2 (65.6-99.1)Nosocomial infection 100 (81.8-100) 92.2 (65.6-99.1)
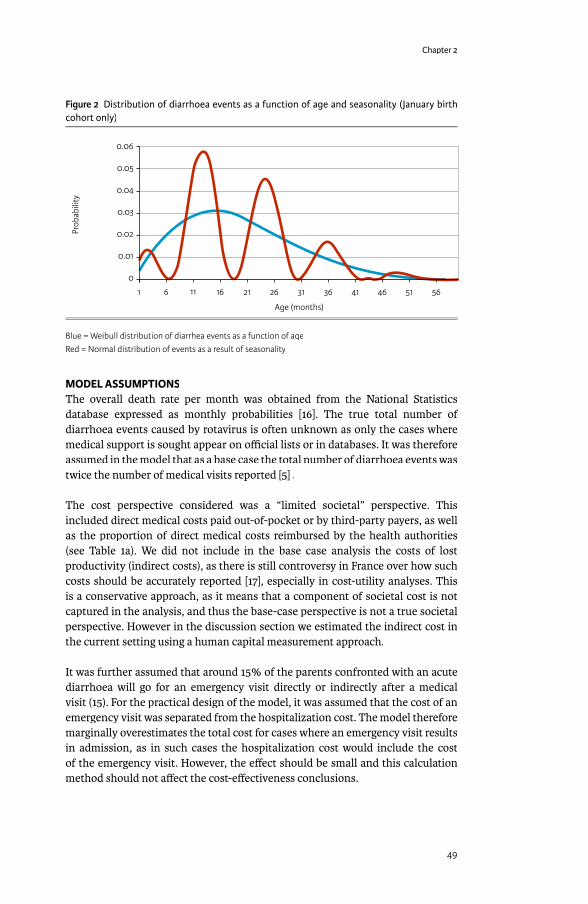
Chapter 2
49
Figure 2 Distribution of diarrhoea events as a function of age and seasonality (January birth cohort only)
0.06
0.05
0.04
0.03
0.02
0.01
0
1 6 11 16 21 26 31 36 41 46 51 56
Prob
abili
ty
Age (months)
Blue = Weibull distribution of diarrhea events as a function of ageRed = Normal distribution of events as a result of seasonality
MODEL ASSUMPTIONSThe overall death rate per month was obtained from the National Statistics database expressed as monthly probabilities [16]. The true total number of diarrhoea events caused by rotavirus is often unknown as only the cases where medical support is sought appear on offi cial lists or in databases. It was therefore assumed in the model that as a base case the total number of diarrhoea events was twice the number of medical visits reported [5] .
The cost perspective considered was a “limited societal” perspective. This included direct medical costs paid out-of-pocket or by third-party payers, as well as the proportion of direct medical costs reimbursed by the health authorities (see Table 1a). We did not include in the base case analysis the costs of lost productivity (indirect costs), as there is still controversy in France over how such costs should be accurately reported [17], especially in cost-utility analyses. This is a conservative approach, as it means that a component of societal cost is not captured in the analysis, and thus the base-case perspective is not a true societal perspective. However in the discussion section we estimated the indirect cost in the current setting using a human capital measurement approach.
It was further assumed that around 15% of the parents confronted with an acute diarrhoea will go for an emergency visit directly or indirectly after a medical visit (15). For the practical design of the model, it was assumed that the cost of an emergency visit was separated from the hospitalization cost. The model therefore marginally overestimates the total cost for cases where an emergency visit results in admission, as in such cases the hospitalization cost would include the cost of the emergency visit. However, the eff ect should be small and this calculation method should not aff ect the cost-eff ectiveness conclusions.

Exploring new ways of measuring the economic value of vaccination
50
Breast feeding as the sole source of nourishment confers protection against RVGE as long as the child receives only breast feeding [18;19]. Fully breast-fed babies were assumed to have 100% protection against RVGE, and the number of fully breast-fed infants was assumed to be 50% at delivery with an exponential decrease over time (β- scale coeffi cient = 2).
In the base-case analysis, the annual discount rate was 3% for costs and 1.5% for the eff ect measure. However, alternative rates were used in the sensitivity analysis as currently recommended in France [17].
A vaccine coverage rate of 85% was used in the base-case. This value was subjected to sensitivity analysis using a coverage range that is normally observed with paediatric vaccines in France.
For all non-rotavirus related hospitalizations, an age-specifi c nosocomial rotavirus-induced diarrhoea rate was included in the model, varying from 3% to a maximum of 5% per age group and limited to events during the winter period only (maximum 6 months per year). A recent literature review reported the rate of nosocomial rotavirus infection ranging from 2.9% to as high as 19.4% of total admissions, with most results in the 2.9–6.6% range [20].
The transition probability for mortality after rotavirus hospitalization was <0.0005 risk of death per rotavirus hospitalization [5].
OUTCOME MEASURESThe primary outcome measure reported was the incremental cost of vaccination (IC) per incremental quality-adjusted life year (IC/QALY). We selected a threshold of less than or equal to € 50,000 per incremental QALY for cost-eff ectiveness [21]. Some alternative incremental cost-eff ectiveness measures are also reported, such as the incremental cost per case averted, per hospitalization averted, and per death avoided.
SENSITIVITY ANALYSISDue to the lack of unequivocal reference values, many variables in the model were subjected to sensitivity analyses. These are shown in Table 3 with the minimum and maximum estimate for each. Probabilistic multivariate sensitivity analyses were also reported for several variables (Table 3). This analysis indicates the range over which variables may fl uctuate and the probability that vaccination remains cost-eff ective.
COMPARISON WITH THE ‘MELLIEZ ET AL.’ MODELWhen comparing our results with the data obtained from Melliez et al. [8], we listed the variables and values that could be identifi ed as diff erent in the two analyses, and then applied distribution variables with uniform distribution ranges of minimum and maximum values (see Table 4) to our model. We then conducted a separate probabilistic multivariate sensitivity analysis to assess which of the variables had the highest impact on the IC/QALY using multiple regression
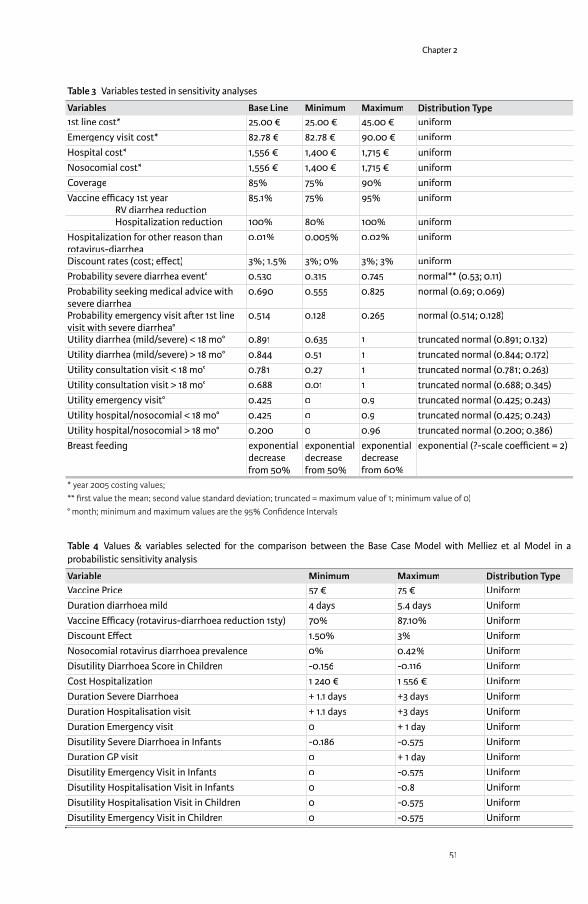
Chapter 2
51
Table 3 Variables tested in sensitivity analyses
Variables Base Line Minimum Maximum Distribution Type1st line cost* 25.00 € 25.00 € 45.00 € uniformEmergency visit cost* 82.78 € 82.78 € 90.00 € uniformHospital cost* 1,556 € 1,400 € 1,715 € uniformNosocomial cost* 1,556 € 1,400 € 1,715 € uniformCoverage 85% 75% 90% uniformVaccine effi cacy 1st year RV diarrhea reduction
85.1% 75% 95% uniform
Hospitalization reduction 100% 80% 100% uniformHospitalization for other reason than rotavirus-diarrhea
0.01% 0.005% 0.02% uniform
Discount rates (cost; eff ect) 3%; 1.5% 3%; 0% 3%; 3% uniformProbability severe diarrhea event° 0.530 0.315 0.745 normal** (0.53; 0.11)Probability seeking medical advice with severe diarrhea
0.690 0.555 0.825 normal (0.69; 0.069)
Probability emergency visit a� er 1st line visit with severe diarrhea°
0.514 0.128 0.265 normal (0.514; 0.128)
Utility diarrhea (mild/severe) < 18 mo° 0.891 0.635 1 truncated normal (0.891; 0.132)Utility diarrhea (mild/severe) > 18 mo° 0.844 0.51 1 truncated normal (0.844; 0.172)Utility consultation visit < 18 mo° 0.781 0.27 1 truncated normal (0.781; 0.263)Utility consultation visit > 18 mo° 0.688 0.01 1 truncated normal (0.688; 0.345)Utility emergency visit° 0.425 0 0.9 truncated normal (0.425; 0.243)Utility hospital/nosocomial < 18 mo° 0.425 0 0.9 truncated normal (0.425; 0.243)Utility hospital/nosocomial > 18 mo° 0.200 0 0.96 truncated normal (0.200; 0.386)Breast feeding exponential
decrease from 50%
exponential decrease from 50%
exponential decrease from 60%
exponential (?-scale coeffi cient = 2)
* year 2005 costing values; ** fi rst value the mean; second value standard deviation; truncated = maximum value of 1; minimum value of 0)° month; minimum and maximum values are the 95% Confi dence Intervals
Table 4 Values & variables selected for the comparison between the Base Case Model with Melliez et al Model in a probabilistic sensitivity analysis
Variable Minimum Maximum Distribution TypeVaccine Price 57 € 75 € UniformDuration diarrhoea mild 4 days 5.4 days UniformVaccine Effi cacy (rotavirus-diarrhoea reduction 1sty) 70% 87.10% UniformDiscount Eff ect 1.50% 3% UniformNosocomial rotavirus diarrhoea prevalence 0% 0.42% UniformDisutility Diarrhoea Score in Children -0.156 -0.116 UniformCost Hospitalization 1 240 € 1 556 € UniformDuration Severe Diarrhoea + 1.1 days +3 days UniformDuration Hospitalisation visit + 1.1 days +3 days UniformDuration Emergency visit 0 + 1 day UniformDisutility Severe Diarrhoea in Infants -0.186 -0.575 UniformDuration GP visit 0 + 1 day UniformDisutility Emergency Visit in Infants 0 -0.575 UniformDisutility Hospitalisation Visit in Infants 0 -0.8 UniformDisutility Hospitalisation Visit in Children 0 -0.575 UniformDisutility Emergency Visit in Children 0 -0.575 Uniform
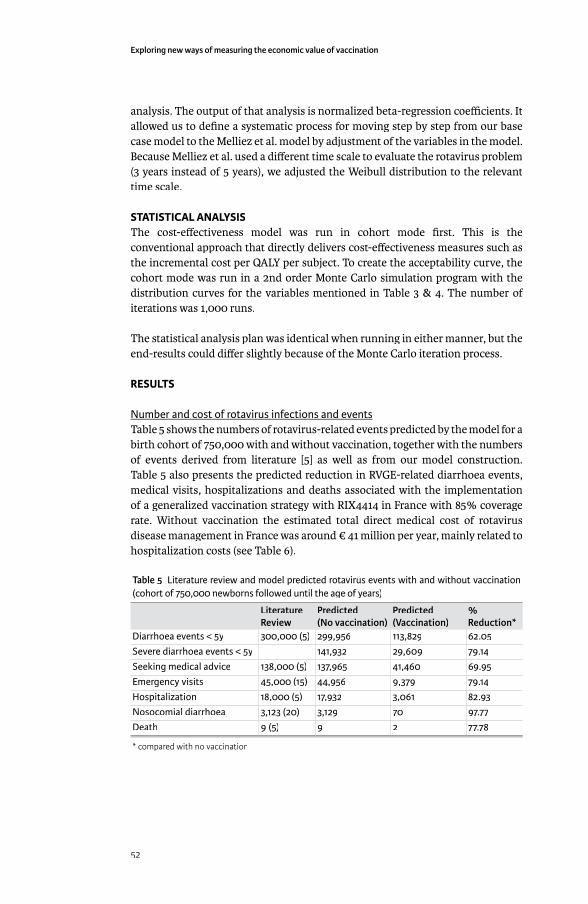
Exploring new ways of measuring the economic value of vaccination
52
analysis. The output of that analysis is normalized beta-regression coeffi cients. It allowed us to defi ne a systematic process for moving step by step from our base case model to the Melliez et al. model by adjustment of the variables in the model. Because Melliez et al. used a diff erent time scale to evaluate the rotavirus problem (3 years instead of 5 years), we adjusted the Weibull distribution to the relevant time scale.
STATISTICAL ANALYSISThe cost-eff ectiveness model was run in cohort mode fi rst. This is the conventional approach that directly delivers cost-eff ectiveness measures such as the incremental cost per QALY per subject. To create the acceptability curve, the cohort mode was run in a 2nd order Monte Carlo simulation program with the distribution curves for the variables mentioned in Table 3 & 4. The number of iterations was 1,000 runs.
The statistical analysis plan was identical when running in either manner, but the end-results could diff er slightly because of the Monte Carlo iteration process.
RESULTS
Number and cost of rotavirus infections and eventsTable 5 shows the numbers of rotavirus-related events predicted by the model for a birth cohort of 750,000 with and without vaccination, together with the numbers of events derived from literature [5] as well as from our model construction. Table 5 also presents the predicted reduction in RVGE-related diarrhoea events, medical visits, hospitalizations and deaths associated with the implementation of a generalized vaccination strategy with RIX4414 in France with 85% coverage rate. Without vaccination the estimated total direct medical cost of rotavirus disease management in France was around € 41 million per year, mainly related to hospitalization costs (see Table 6).
Table 5 Literature review and model predicted rotavirus events with and without vaccination (cohort of 750,000 newborns followed until the age of years)
Literature Review
Predicted (No vaccination)
Predicted(Vaccination)
% Reduction*
Diarrhoea events < 5y 300,000 (5) 299,956 113,829 62.05Severe diarrhoea events < 5y 141,932 29,609 79.14Seeking medical advice 138,000 (5) 137,965 41,460 69.95Emergency visits 45,000 (15) 44,956 9,379 79.14Hospitalization 18,000 (5) 17,932 3,061 82.93Nosocomial diarrhoea 3,123 (20) 3,129 70 97.77Death 9 (5) 9 2 77.78
* compared with no vaccination
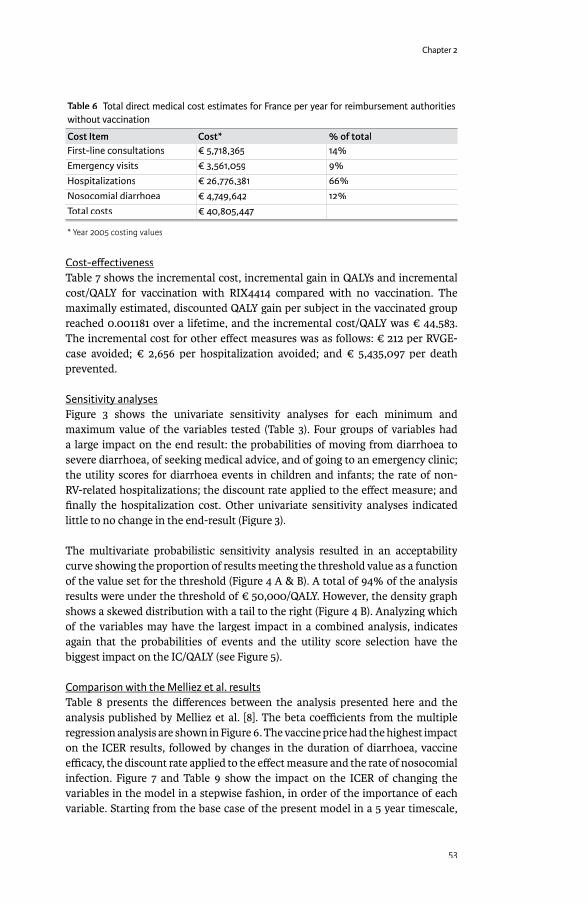
Chapter 2
53
Table 6 Total direct medical cost estimates for France per year for reimbursement authorities without vaccination
Cost Item Cost* % of totalFirst-line consultations € 5,718,365 14%Emergency visits € 3,561,059 9%Hospitalizations € 26,776,381 66%Nosocomial diarrhoea € 4,749,642 12%Total costs € 40,805,447
* Year 2005 costing values
Cost-eff ectivenessTable 7 shows the incremental cost, incremental gain in QALYs and incremental cost/QALY for vaccination with RIX4414 compared with no vaccination. The maximally estimated, discounted QALY gain per subject in the vaccinated group reached 0.001181 over a lifetime, and the incremental cost/QALY was € 44,583. The incremental cost for other eff ect measures was as follows: € 212 per RVGE-case avoided; € 2,656 per hospitalization avoided; and € 5,435,097 per death prevented.
Sensitivity analysesSensitivity analysesFigure 3 shows the univariate sensitivity analyses for each minimum and maximum value of the variables tested (Table 3). Four groups of variables had a large impact on the end result: the probabilities of moving from diarrhoea to severe diarrhoea, of seeking medical advice, and of going to an emergency clinic; the utility scores for diarrhoea events in children and infants; the rate of non-RV-related hospitalizations; the discount rate applied to the eff ect measure; and fi nally the hospitalization cost. Other univariate sensitivity analyses indicated little to no change in the end-result (Figure 3).
The multivariate probabilistic sensitivity analysis resulted in an acceptability curve showing the proportion of results meeting the threshold value as a function of the value set for the threshold (Figure 4 A & B). A total of 94% of the analysis results were under the threshold of € 50,000/QALY. However, the density graph shows a skewed distribution with a tail to the right (Figure 4 B). Analyzing which of the variables may have the largest impact in a combined analysis, indicates again that the probabilities of events and the utility score selection have the biggest impact on the IC/QALY (see Figure 5).
Comparison with the Melliez et al. resultsComparison with the Melliez et al. resultsTable 8 presents the diff erences between the analysis presented here and the analysis published by Melliez et al. [8]. The beta coeffi cients from the multiple regression analysis are shown in Figure 6. The vaccine price had the highest impact on the ICER results, followed by changes in the duration of diarrhoea, vaccine effi cacy, the discount rate applied to the eff ect measure and the rate of nosocomial infection. Figure 7 and Table 9 show the impact on the ICER of changing the variables in the model in a stepwise fashion, in order of the importance of each variable. Starting from the base case of the present model in a 5 year timescale,
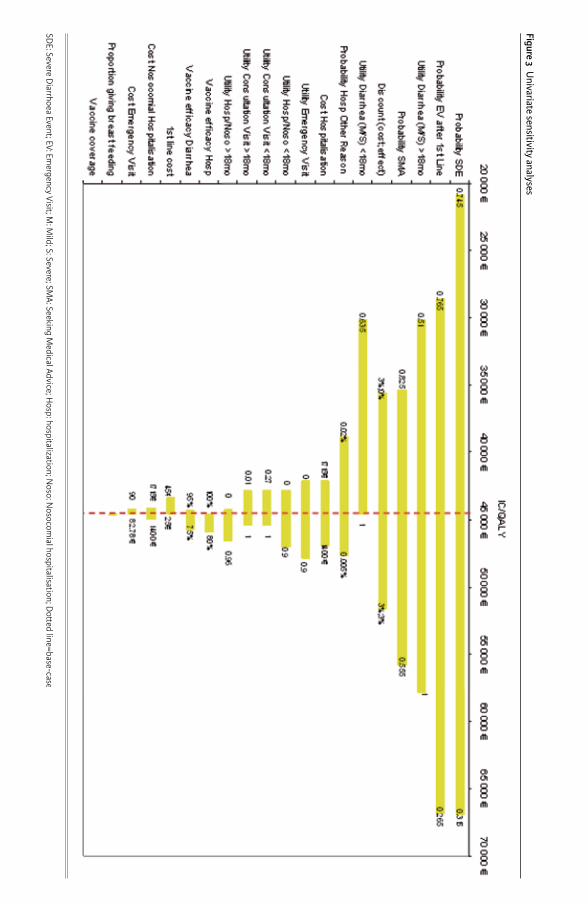
Figure 3 Univariate sensitivity analyses
SDE: Severe D
iarrhoea Event; EV: Emergency Visit; M
: Mild; S: Severe; SM
A: Seeking Medical Advice; H
osp: hospitalization; Noso: N
osocomial hospitalisation; D
o� ed line=base-case

Chapter 2
55
each variable was changed to its corresponding value in the Melliez et al. model and the resulting ICER calculated. By the time all the values had been set to those used by Melliez, the ICER reported by our model was €147,192/QALY. Similarly, starting from a 3-year timescale with all the values set to those used by Melliez, each variable was changed to the value used in the base case of the present model
Figure 4a Acceptability curve by function of the threshold value of 50,000€ per QALY
0 10 20 30 40 50 60 70 80
Accu
mul
ated
Pro
babi
lity
IC/QALY(x 1000 €)
1
0.9
0.8
0.7
0.6
0.5
0.4
0.3
0.2
0.1
0
24.8 94.0%
First line: 50% probabilitySecond line: threshold
Figure 4b Acceptability curve expressed as a density curve by function of the threshold value of 50,000€ per QALY
0 10 20 30 40 50 60 70 80
Prob
abili
ty D
ensi
ty (x
10*
-5)
IC/QALY(x 1000 €)
7.0 58,04
3.5
3
2.5
2
1.5
1
0.5
0
95%
First line: 50% probabilitySecond line: threshold
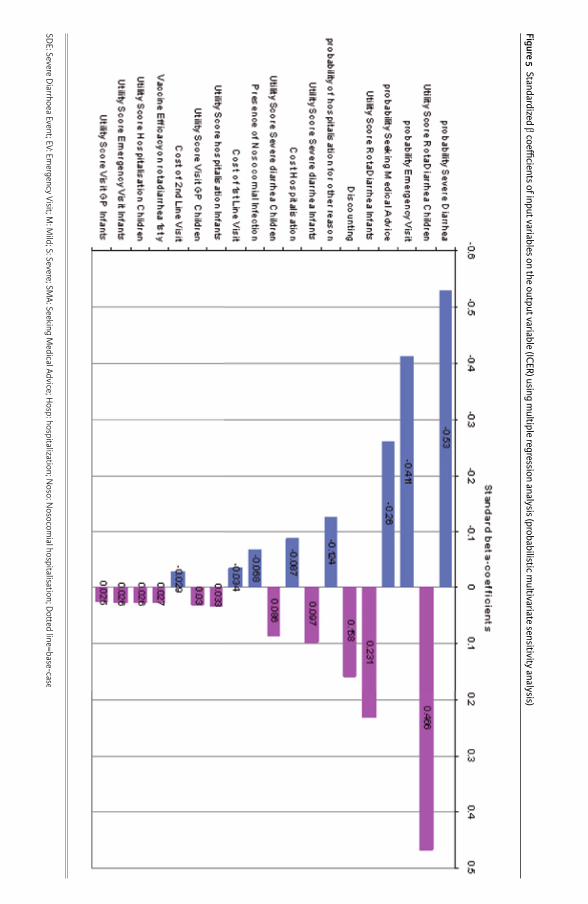
Figure 5 Standardized β coeffi cients of input variables on the output variable (ICER) using multiple regression analysis (probabilistic m
ultivariate sensitivity analysis)
SDE: Severe D
iarrhoea Event; EV: Emergency Visit; M
: Mild; S: Severe; SM
A: Seeking Medical Advice; H
osp: hospitalization; Noso: N
osocomial hospitalisation; D
o� ed line=base-case

Chapter 2
57
and the ICER calculated. When all the variables had been set to the values used in the present model, the ICER reported by the 3-year model was €38,366/QALY (Table 8). This result is more favourable to vaccination than the result produced by the base case of our model, because the number of QALYs is less aff ected by the
Figure 6 Standardized β coeffi cients of input variables on the output variable (ICER) using multiple regression analysis (Melliez comparison analysis)
Figure 7 Comparing the ICER-data of the Melliez and the present base-case results
BctoMel = starting from the base-case of the current model and moving to the input values used by MelliezMeltoBC = 3-year model starting with the values used by Melliez and moving to the input values used in the base-case of the current model
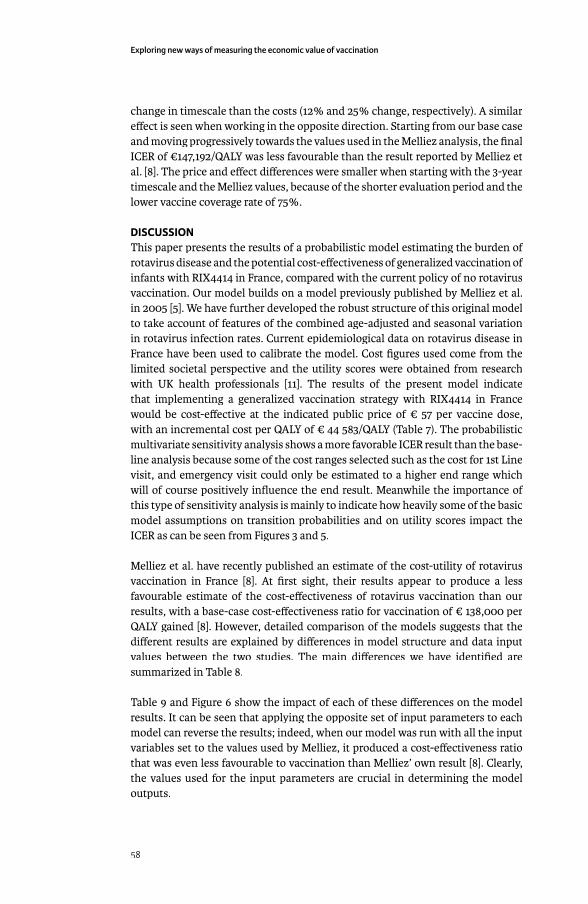
Exploring new ways of measuring the economic value of vaccination
58
change in timescale than the costs (12% and 25% change, respectively). A similar eff ect is seen when working in the opposite direction. Starting from our base case and moving progressively towards the values used in the Melliez analysis, the fi nal ICER of €147,192/QALY was less favourable than the result reported by Melliez et al. [8]. The price and eff ect diff erences were smaller when starting with the 3-year timescale and the Melliez values, because of the shorter evaluation period and the lower vaccine coverage rate of 75%.
DISCUSSIONThis paper presents the results of a probabilistic model estimating the burden of rotavirus disease and the potential cost-eff ectiveness of generalized vaccination of infants with RIX4414 in France, compared with the current policy of no rotavirus vaccination. Our model builds on a model previously published by Melliez et al. in 2005 [5]. We have further developed the robust structure of this original model to take account of features of the combined age-adjusted and seasonal variation in rotavirus infection rates. Current epidemiological data on rotavirus disease in France have been used to calibrate the model. Cost fi gures used come from the limited societal perspective and the utility scores were obtained from research with UK health professionals [11]. The results of the present model indicate that implementing a generalized vaccination strategy with RIX4414 in France would be cost-eff ective at the indicated public price of € 57 per vaccine dose, with an incremental cost per QALY of € 44 583/QALY (Table 7). The probabilistic multivariate sensitivity analysis shows a more favorable ICER result than the base-line analysis because some of the cost ranges selected such as the cost for 1st Line visit, and emergency visit could only be estimated to a higher end range which will of course positively infl uence the end result. Meanwhile the importance of this type of sensitivity analysis is mainly to indicate how heavily some of the basic model assumptions on transition probabilities and on utility scores impact the ICER as can be seen from Figures 3 and 5.
Melliez et al. have recently published an estimate of the cost-utility of rotavirus vaccination in France [8]. At fi rst sight, their results appear to produce a less favourable estimate of the cost-eff ectiveness of rotavirus vaccination than our results, with a base-case cost-eff ectiveness ratio for vaccination of € 138,000 per QALY gained [8]. However, detailed comparison of the models suggests that the diff erent results are explained by diff erences in model structure and data input values between the two studies. The main diff erences we have identifi ed are summarized in Table 8.
Table 9 and Figure 6 show the impact of each of these diff erences on the model results. It can be seen that applying the opposite set of input parameters to each model can reverse the results; indeed, when our model was run with all the input variables set to the values used by Melliez, it produced a cost-eff ectiveness ratio that was even less favourable to vaccination than Melliez’ own result [8]. Clearly, the values used for the input parameters are crucial in determining the model outputs.
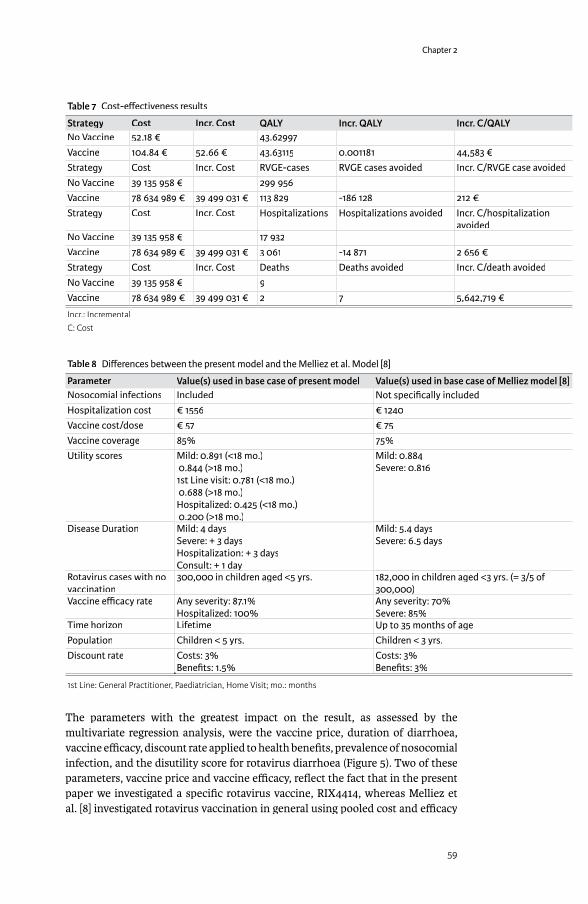
Chapter 2
59
Table 7 Cost-eff ectiveness results
Strategy Cost Incr. Cost QALY Incr. QALY Incr. C/QALYNo Vaccine 52.18 € 43.62997Vaccine 104.84 € 52.66 € 43.63115 0.001181 44,583 €Strategy Cost Incr. Cost RVGE-cases RVGE cases avoided Incr. C/RVGE case avoidedNo Vaccine 39 135 958 € 299 956Vaccine 78 634 989 € 39 499 031 € 113 829 -186 128 212 €Strategy Cost Incr. Cost Hospitalizations Hospitalizations avoided Incr. C/hospitalization
avoidedNo Vaccine 39 135 958 € 17 932Vaccine 78 634 989 € 39 499 031 € 3 061 -14 871 2 656 €Strategy Cost Incr. Cost Deaths Deaths avoided Incr. C/death avoidedNo Vaccine 39 135 958 € 9Vaccine 78 634 989 € 39 499 031 € 2 7 5,642,719 €
Incr.: IncrementalC: Cost
Table 8 Diff erences between the present model and the Melliez et al. Model [8]
Parameter Value(s) used in base case of present model Value(s) used in base case of Melliez model [8]Nosocomial infections Included Not specifi cally includedHospitalization cost € 1556 € 1240Vaccine cost/dose € 57 € 75Vaccine coverage 85% 75%Utility scores Mild: 0.891 (<18 mo.)
0.844 (>18 mo.)1st Line visit: 0.781 (<18 mo.) 0.688 (>18 mo.)Hospitalized: 0.425 (<18 mo.) 0.200 (>18 mo.)
Mild: 0.884Severe: 0.816
Disease Duration Mild: 4 daysSevere: + 3 daysHospitalization: + 3 daysConsult: + 1 dayConsult: + 1 day
Mild: 5.4 daysSevere: 6.5 days
Rotavirus cases with no vaccination
300,000 in children aged <5 yrs. 182,000 in children aged <3 yrs. (= 3/5 of 300,000)
Vaccine effi cacy rate Any severity: 87.1%Hospitalized: 100%Hospitalized: 100%
Any severity: 70%Severe: 85%
Time horizon Lifetime Up to 35 months of agePopulation Children < 5 yrs. Children < 3 yrs.Discount rate Costs: 3%
Benefi ts: 1.5%Costs: 3%Benefi ts: 3%
1st Line: General Practitioner, Paediatrician, Home Visit; mo.: months
The parameters with the greatest impact on the result, as assessed by the multivariate regression analysis, were the vaccine price, duration of diarrhoea, vaccine effi cacy, discount rate applied to health benefi ts, prevalence of nosocomial infection, and the disutility score for rotavirus diarrhoea (Figure 5). Two of these parameters, vaccine price and vaccine effi cacy, refl ect the fact that in the present paper we investigated a specifi c rotavirus vaccine, RIX4414, whereas Melliez et al. [8] investigated rotavirus vaccination in general using pooled cost and effi cacy
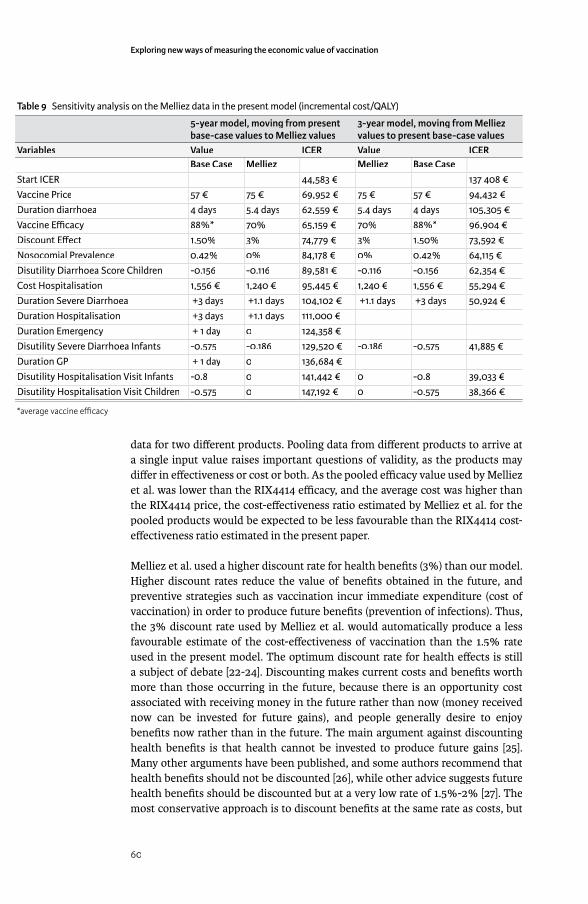
Exploring new ways of measuring the economic value of vaccination
60
data for two diff erent products. Pooling data from diff erent products to arrive at a single input value raises important questions of validity, as the products may diff er in eff ectiveness or cost or both. As the pooled effi cacy value used by Melliez et al. was lower than the RIX4414 effi cacy, and the average cost was higher than the RIX4414 price, the cost-eff ectiveness ratio estimated by Melliez et al. for the pooled products would be expected to be less favourable than the RIX4414 cost-eff ectiveness ratio estimated in the present paper.
Melliez et al. used a higher discount rate for health benefi ts (3%) than our model. Higher discount rates reduce the value of benefi ts obtained in the future, and preventive strategies such as vaccination incur immediate expenditure (cost of vaccination) in order to produce future benefi ts (prevention of infections). Thus, the 3% discount rate used by Melliez et al. would automatically produce a less favourable estimate of the cost-eff ectiveness of vaccination than the 1.5% rate used in the present model. The optimum discount rate for health eff ects is still a subject of debate [22-24]. Discounting makes current costs and benefi ts worth more than those occurring in the future, because there is an opportunity cost associated with receiving money in the future rather than now (money received now can be invested for future gains), and people generally desire to enjoy benefi ts now rather than in the future. The main argument against discounting health benefi ts is that health cannot be invested to produce future gains [25]. Many other arguments have been published, and some authors recommend that health benefi ts should not be discounted [26], while other advice suggests future health benefi ts should be discounted but at a very low rate of 1.5%-2% [27]. The most conservative approach is to discount benefi ts at the same rate as costs, but
Table 9 Sensitivity analysis on the Melliez data in the present model (incremental cost/QALY)
5-year model, moving from present base-case values to Melliez values
3-year model, moving from Melliez values to present base-case values
Variables Value ICER Value ICERBase Case Melliez Melliez Base Case
Start ICER 44,583 € 137 408 €Vaccine Price 57 € 75 € 69,952 € 75 € 57 € 94,432 €Duration diarrhoea 4 days 5.4 days 62,559 € 5.4 days 4 days 105,305 €Vaccine Effi cacy 88%* 70% 65,159 € 70% 88%* 96,904 €Discount Eff ect 1.50% 3% 74,779 € 3% 1.50% 73,592 €Nosocomial Prevalence 0.42% 0% 84,178 € 0% 0.42% 64,115 €Disutility Diarrhoea Score Children -0.156 -0.116 89,581 € -0.116 -0.156 62,354 €Cost Hospitalisation 1,556 € 1,240 € 95,445 € 1,240 € 1,556 € 55,294 €Duration Severe Diarrhoea +3 days +1.1 days 104,102 € +1.1 days +3 days 50,924 €Duration Hospitalisation +3 days +1.1 days 111,000 €Duration Emergency + 1 day 0 124,358 €Disutility Severe Diarrhoea Infants -0.575 -0.186 129,520 € -0.186 -0.575 41,885 €Duration GP + 1 day 0 136,684 €Disutility Hospitalisation Visit Infants -0.8 0 141,442 € 0 -0.8 39,033 €Disutility Hospitalisation Visit Children -0.575 0 147,192 € 0 -0.575 38,366 €
*average vaccine effi cacy

Chapter 2
61
this tends to discriminate against preventive treatment strategies whose benefi ts accrue mainly in the future. In the absence of consensus, we felt that a discount rate of 1.5% for benefi ts refl ected a reasonable compromise.
Melliez et al. used higher utility scores for RVGE than our model, which would produce a lower estimate of the number of QALYs gained by vaccination. The utility values used in our model are derived from a study in which health professionals rated QoL for children with diff erent severities of RVGE using a recognized instrument (the Euro-QoL questionnaire). The values used by Melliez et al. were derived from ratings provided by adult caregivers and the source publication did not diff erentiate between diff erent severities of illness. In both cases, the utility values used were extracted from non-French studies due to the lack of published utility scores for rotavirus gastroenteritis in France. We may question whether selecting physicians is a good alternative for estimating QALY-scores in diseased children instead of parents. It has been reported that medical care-givers overestimate the patient burden but on the other hand they may be best placed to evaluate the total disease impact being confronted on a regular basis with specifi c health and health care problems [28].
Melliez et al. included only RVGE cases in children <3 years of age, whereas our model covers the larger at-risk population of children <5 years of age. This diff erence will aff ect the estimate of the total number of cases of RVGE expected to occur in the population in the absence of vaccination. The number of RVGE cases in children aged <5 years in France was estimated at 300,000 per year by Melliez et al. in an earlier publication [5], and we have applied this estimate in the present study. In their recent model, however, Melliez et al. estimated the number of RVGE cases in children aged <3 years at 182,000 per year [8]. This is diffi cult to reconcile with the earlier estimate. It is approximately 60% of the earlier estimate for the number of cases in children aged <5 years, which would be plausible if the incidence of RVGE remains stable as a function of age. However, the incidence of RVGE approximately follows a Weibull distribution (Figure 2), and so the number of cases expected in children aged <3 years would be nearer to 90% of the number of cases expected in children aged <5 years. The reasons for this apparent discrepancy between the recent Melliez publication and the earlier paper are not clear, and may indicate an underestimate of RVGE cases in the recent model for the age group up to 3 years.
The fact that two modeling studies evaluating similar vaccination strategies in the same country can produce results that at fi rst sight appear to be contradictory illustrates the diffi culties faced in conducting health economic evaluations. A more standardized approach to constructing and populating health economic models would help to make results more easily comparable between diff erent studies [29]. This would help to reduce the confusion caused by publication of apparently confl icting results, which in turn would help to support a rational assessment of the economic value of potential new therapies.
The present analysis may not have captured some potentially important benefi ts of rotavirus vaccination. For example, peaks of rotavirus gastroenteritis that result in

Exploring new ways of measuring the economic value of vaccination
62
medical consultations and hospitalization occur during the same period as other commonly occurring childhood diseases that also result in emergency visits, such as infl uenza and respiratory syncytial virus bronchiolitis [30-32]. It is therefore possible that a reduction in rotavirus-associated emergency consultations and admissions due to vaccination could reduce seasonal pressure on overburdened pediatric emergency wards and physicians’ offi ces, with consequent improvements to patient care. The model also takes no account of any health benefi t obtained from herd protection eff ects in scenarios when vaccine coverage is <100%.
When a parent takes time off work to care for a child with RVGE, the value of the parent’s work is lost. These indirect costs were not included in the base-case analysis as there is still a debate in France about the exact method to apply for estimating such costs [17]. However, the model can estimate the number of days of paid work lost due to caring for a child with rotavirus gastroenteritis after the offi cial period of maternity leave (conservatively assumed here to be one year) at 538 303 days per year, based on the proportion of women who are in full-time paid employment (49% in France [33]). In the developed world with a high proportion of working adults, reduction of indirect costs is likely to be an important benefi t associated with vaccination against paediatric infections [34].
Our results are conservative compared with some other published studies. For example, Huet et al. [35] reported total direct costs for the burden of rotavirus infection in France of € 63 million to the National Healthcare Payer, compared with € 41 million in this analysis. Huet et al. reported a higher hospitalization rate, consistent with data from the REVEAL study [34-36], whereas our approach conservatively assumes the hospitalization rate considered by Melliez in 2005 [5].
There are no clear guidelines in France on valuing hospital costs. The method used (based on the national hospital costs database) is conservatively the same than the one used by Melliez. The approach is likely to underestimate the true hospitalization costs as DRG costs in France are no full hospital costs.
Finally, the utility values applied in the model estimated the QoL impact of rotavirus gastroenteritis only for the aff ected child [11], and thus did not capture the QoL impact on other family members. Parents and carers may be adversely aff ected by the child’s illness, resulting in anxiety, stress, and feelings of exhaustion, as others have suggested [37].
Recent cost-eff ectiveness analyses of the new rotavirus vaccines have been reported in addition to France, for the UK, the Netherlands, Italy and the US [38-41]. The results indicate how diffi cult it is to pool data of two vaccines seemingly equivalent into one economic analysis. In addition the selected cost perspective and the underlying disease epidemiology will highly aff ect the end result of cost-eff ectiveness evaluation by country. But all the analyses suff er from underreporting the disease when not seeking medical advice, unable to defi ne how rotavirus infection aff ects family functioning, and the imprecise evaluation of the individual patient burden. Meanwhile one interesting study recently highlighted about the estimation of fi nancial rotavirus disease burden in
Chapter 2
63
4 countries in the EU. It appears that in open health care systems such as France and Belgium where there is no limit to consult directly 1st or 2nd line health care levels, the estimated direct medical cost of rotavirus diarrhea is higher compared to the more closed systems in the UK and the Netherlands. However the total estimated societal disease burden including direct and indirect costs per child per year for the 4 countries is more or less the same (23.11 €) [42]. It should therefore be recommended that economic assessment of the vaccine should encompass the total disease burden and not the health care impact only.
In conclusion, the present analysis indicates that universal vaccination of infants against rotavirus infection could be cost eff ective in France from a limited societal perspective and based on the assumptions introduced in the model regarding disease development and utility scores selected (94% of modelling scenarios generated an incremental cost-eff ectiveness ratio < € 50,000/QALY). This study supports the fi ndings of the European Rotavirus Vaccination Advisory Committee who advocate, based on currently available evidence, the introduction of rotavirus vaccination into childhood immunization programs [43].
REFERENCES[ 1] Parashar UD, Hummelman EG, Bresee JS, Miller MA, Glass RI. Global illness
and deaths caused by rotavirus disease in children. Emerg Infect Dis 2003 May;9(5):565-72.
[ 2] Soriano-Gabarro M, Mrukowicz J, Vesikari T, Verstraeten T. Burden of rotavirus disease in European Union countries. Pediatr Infect Dis J 2006 Jan;25(1 Suppl):S7-S11.
[ 3] Brandt CD, Kim HW, Rodriguez WJ, Arrobio JO, Jeff ries BC, Stallings EP, et al. Pediatric viral gastroenteritis during eight years of study. J Clin Microbiol 1983 Jul;18(1):71-8.
[ 4] Velazquez FR, Matson DO, Calva JJ, Guerrero L, Morrow AL, Carter-Campbell S, et al. Rotavirus infections in infants as protection against subsequent infections. N Engl J Med 1996;335(14):1022-8.
[ 5] Melliez H, Boelle PY, Baron S, Mouton Y, Yazdanpanah Y. Morbidite et cout des infections a rotavirus en France [Morbidity and cost of rotavirus infections in France]. Med Mal Infect 2005;35(10):492-9.
[ 6] Vesikari T, Karvonen A, Puustinen L, Zeng SQ, Szakal ED, Delem A, et al. Effi cacy of RIX4414 live attenuated human rotavirus vaccine in Finnish infants. Pediatr Infect Dis J 2004;23(10):937-43.
[ 7] Vesikari T, Karvonen A, Prymula R, Schuster V, Tejedor JC, Cohen R, et al. Effi cacy of human rotavirus vaccine against rotavirus gastroenteritis during the fi rst 2 years of life in European infants: randomised, double-blind controlled study. Lancet 2007;370(9601):1757-63.
[ 8] Melliez H, Levybruhl D, Boelle PY, Dervaux B, Baron S, Yazdanpanah Y. Cost and cost-eff ectiveness of childhood vaccination against rotavirus in France. Vaccine 2008 Jan 30;26(5):706-15.
[ 9] Offi cial medical tariff list (UCANSS). http://www.ucanss.fr/http://www.ucanss.fr/ 2007[ 10] Echelle des Couts (ENC). http://www.atih.sante.fr/?id=000370000FFFhttp://www.atih.sante.fr/?id=000370000FFF 2008[ 11] Martin A, Cottrell S. Estimating utility in rotavirus gastroenteritis in
children under fi ve in the UK (abstract PIH19). Value Health 2006;9(6):A258.
Exploring new ways of measuring the economic value of vaccination
64
[ 12] Bresee JS, Glass RI, Ivanoff B, Gentsch JR. Current status and future priorities for rotavirus vaccine development, evaluation and implementation in developing countries. Vaccine 1999 May 4;17(18):2207-22.
[ 13] Clark HF, Offi t PA. Vaccines for rotavirus gastroenteritis universally needed for infants. Pediatr Ann 2004;33(8):536-43.
[ 14] Fourquet F, Desenclos JC, Maurage C, Baron S. [Acute gastro-enteritis in children in France: estimates of disease burden through national hospital discharge data]. Arch Pediatr 2003 Oct;10(10):861-8.
[ 15] Martinot A, Dumonceaux A, Grandbastien B, Hue V, Leclerc F. [Evaluation of the ambulatory treatment of acute diarrhea in infants. Reseau interhospitalier d’evaluation des pratigues medicales dans les aff ections courantes de l’enfant]. Arch Pediatr 1997 Sep;4(9):832-8.
[ 16] French general practitioners’ Sentinelles network. http://websenti.b3e.http://websenti.b3e.jussieu.fr/sentiweb/jussieu.fr/sentiweb/ 2007
[ 17] College des Economistes de la Sante. French guidelines for the economic evaluation of health care technologies. http://www.ces-asso.org/docs/http://www.ces-asso.org/docs/France_Guidelines_HE_Evaluation.PDFFrance_Guidelines_HE_Evaluation.PDF 2004
[ 18] Clemens J, Rao M, Ahmed F, Ward R, Huda S, Chakraborty J, et al. Breast-feeding and the risk of life-threatening rotavirus diarrhea: prevention or postponement? Pediatrics 1993 Nov;92(5):680-5.
[ 19] Newburg DS, Peterson JA, Ruiz-Palacios GM, Matson DO, Morrow AL, Shults J, et al. Role of human-milk lactadherin in protection against symptomatic rotavirus infection. Lancet 1998 Apr 18;351(9110):1160-4.
[ 20] Gleizes O, Desselberger U, Tatochenko V, Rodrigo C, Salman N, Mezner Z, et al. Nosocomial rotavirus infection in European countries: a review of the epidemiology, severity and economic burden of hospital-acquired rotavirus disease. Pediatr Infect Dis J 2006 Jan;25(1 Suppl):S12-S21.
[ 21] Institut de Veille Sanitaire. The fi ght against HIV/AIDS and sexually transmitted infections in France. 10 years of surveillance, 1999-2005. http://http://www.invs.sante.fr/publications/2007/10ans_vih/rapport_vih_sida_10ans-7-www.invs.sante.fr/publications/2007/10ans_vih/rapport_vih_sida_10ans-7-Prevention.pdfPrevention.pdf 2007Prevention.pdf 2007Prevention.pdf
[ 22] Bos JM, Postma MJ, Annemans L. Discounting health eff ects in pharmacoeconomic evaluations: current controversies. Pharmacoeconomics 2005;23(7):639-49.
[ 23] Severens JL, Milne RJ. Discounting health outcomes in economic evaluation: the ongoing debate. Value Health 2004 Jul;7(4):397-401.
[ 24] Smith DH, Gravelle H. The practice of discounting in economic evaluations of healthcare interventions. Int J Technol Assess Health Care 2001;17(2):236-43.
[ 25] Sheldon TA. Discounting in health care decision-making: time for a change? J Public Health Med 1992 Sep;14(3):250-6.
[ 26] Parsonage M, Neuburger H. Discounting and health benefi ts. Health Econ 1992 Apr;1(1):71-6.
[ 27] Torgerson DJ, Raftery J. Economic notes. Discounting. BMJ 1999 Oct 2;319(7214):914-5.
[ 28] Martin A, Cottrell S, Standaert B. Estimating utility scores in young children with acute rotavirus gastroenteritis in the UK. Journal of Medical Economics 2008;11(3):471-84.
Chapter 2
65
[ 29] News from the scientifi c literature: the cost-utility of rotavirus vaccination with Rotarix (RIX4414) in the Netherlands. V&I News - ECDC Newsletter on Vaccines and Immunisation 2008 Feb;(39):3.
[ 30] Hjelt K. [Nosocomial virus infections in pediatric departments. Rotavirus and respiratory syncytial virus]. Ugeskr Laeger 1991 Jul 22;153(30):2102-4.
[ 31] Le Roux P, Marshall B, Toutain F, Mary JF, Pinon G, Briquet E, et al. [Nosocomial viral infections in a pediatric service: example of rotaviral gastroenteritis and respiratory syncytial viral bronchiolitis]. Arch Pediatr 2004 Aug;11(8):908-15.
[ 32] Maille L, Beby-Defaux A, Bourgoin A, Koulmann L, Eucher V, Cardona J, et al. [Nosocomial infections due to rotavirus and respiratory syncytial virus in pediatric wards: a 2-year study]. Ann Biol Clin (Paris) 2000 Sep;58(5):601-6.
[ 33] National Institute for Statistics and Economic Studies [Institut Nationale de la Statistique et des Etudes Economiques]. Activité, emploi et chômage selon le type de ménage et le nombre d’enfants. http://www.insee.fr/fr/ff c/http://www.insee.fr/fr/ff c/chifcle_fi che.asp?ref_id=NATCCF03128&tab_id=490&souspop=2chifcle_fi che.asp?ref_id=NATCCF03128&tab_id=490&souspop=2 2008
[ 34] Giaquinto C, Van Damme P, Huet F, Gothefors L, Van der Wielen M. Costs of community-acquired pediatric rotavirus gastroenteritis in 7 European countries: the REVEAL Study. J Infect Dis 2007;195 Suppl 1:S36-S44.
[ 35] Huet F, Largeron N, Trichard M, Miadi-Fargier H, Jasso-Mosqueda G. Burden of paediatric rotavirus gastroenteritis and potential benefi ts of a universal rotavirus vaccination programme with RotaTeq in France. Vaccine 2007 Aug 21;25(34):6348-58.
[ 36] Giaquinto C, Van Damme P, Huet F, Gothefors L, Maxwell M, Todd P, et al. Clinical consequences of rotavirus acute gastroenteritis in Europe, 2004-2005: the REVEAL study. J Infect Dis 2007;195 Suppl 1:S26-S35.
[ 37] Huppertz HI, Forster J, Heininger U, Roos R, Neumann HU, Hammerschmidt T. The Parental Appraisal of the Morbidity of Diarrhea in Infants and Toddlers (PAMODI) Survey. Clin Pediatr (Phila) 2008;47(4):363-71.
[ 38] Jit M, Edmunds WJ. Evaluating rotavirus vaccination in England and Wales. Part II. The potential cost-eff ectiveness of vaccination. Vaccine 2007;25(20):3971-9.
[ 39] Goossens LMA, Standaert B, Hartwig N, Hovels AM, Al MJ. The cost-utility of rotavirus vaccination with Rotarix(TM) (RIX4414) in the Netherlands 1487. Vaccine 2008 Feb 20;26(8):1118-27.
[ 40] Standaert B, Marocco A, Assael B, Gabutti G, Guarino A, Lopalco P, et al. Analisi di costo-effi cacia della vaccinazione universale in Italia con il vaccino Rix4414 contro i rotavirus. Pharmacoeconomics 2008;10(1):23-35.
[ 41] Widdowson MA, Meltzer MI, Zhang X, Bresee JS, Parashar UD, Glass RI. Cost-eff ectiveness and potential impact of rotavirus vaccination in the United States. Pediatrics 2007 Apr;119(4):684-97.
[ 42] Standaert B, Harlin O, Desselberger U. The Financial Burden of Rotavirus Disease in Four Countries of the European Union. Pediatric Infectious Disease Journal Rotavirus 2008 Jan;217:S20-S27.
[ 43] Van Damme P, Van der Wielen M, Ansaldi F, Desgrandchamps D, Domingo JD, Sanchez FG, et al. Rotavirus vaccines: considerations for successful implementation in Europe. Lancet Infect Dis 2006 Dec;6(12):805-12.

Exploring new ways of measuring the economic value of vaccination
66
2.4 SIMPLE VERSUS MORE COMPLEXHaving the ability to evaluate the rotavirus vaccine and its health economic merits in many diff erent places around the world, I observed that in several countries there is a lack of detailed information about the disease. There are some statistics about the disease burden collected by care-givers amongst children <5 years of age, but many researchers are hesitant to assess the economic value of the new vaccine.
I developed a type of back-of-the envelop calculation method for rotavirus vaccine and made the comparison with the more complex cohort model for Turkey. The fi rst model required only 20 variables and one spread sheet in MS Excel®. The second model has more than 120 variables and has 26 spread sheets in MS Excel®.
With the fi rst model called Roxannette decision makers were able to assess with a number of key variables in which direction the economic value of the vaccine should move, given the price they had foreseen in their budget. It is a helpful tool for a fi rst estimate that may drive as well the research program for collecting additional data missing for running the more advanced model [22].
ESTIMATING AND COMPARING THE CLINICAL AND ECONOMIC IMPACT OF PAEDIATRIC ROTAVIRUS VACCINATION IN TURKEY USING A SIMPLE VERSUS AN ADVANCED MODEL
Vaccine, 2013, 31: 979-986
ABSTRACT
BackgroundBackground: The burden of rotavirus disease is high in Turkey, refl ecting the large birth cohort (>1.2 million) and the risk of disease. Modelling can help to assess the potential economic impact of vaccination. We compared the output of an advanced model with a simple model requiring fewer data inputs. If the results are similar, this could be helpful for countries that have few data available.
Methods: The advanced model was a previously published static Markov cohort model comparing costs and quality-adjusted life-year (QALY) outcomes of vaccination versus no vaccination. In contrast, the simple model used only a decision tree. Both models included data on demography, epidemiology, vaccine effi cacy, resource use, unit costs, and utility scores from national databases and published papers. Only the perspective of the health care payer was considered in the analysis. The simple model had 23 variables, compared with 103 in the advanced model to allow additional comparisons of diff erent vaccine types, dose schemes and vaccine waning.
Results: With the same input data, both models showed that rotavirus vaccination in Turkey would improve health outcomes (fewer QALYs lost to rotavirus disease).
Mustafa BakiraMustafa BakiraMustafa Bakir
Baudouin Standaertb
Ozden Turelc
Ece Bilged
Maarten Postmae
aDepartment of Paediatrics, Marmara University, Pendik,
Istanbul 34899, Turkey.bGlaxoSmithKline Vaccines,
Wavre, Belgium.cKanuni Sultan Suleyman
Training and Research Hospital, Istanbul, Turkey.dGlaxoSmithKline, Turkey,
Istanbul, Turkey.eDepartment of Pharmacy,
University of Groningen, Groningen, The Netherlands.

Chapter 2
67
The projected annual cost off sets were $29.9 million in the simple and $29.4 million in the advanced model. Sensitivity analysis indicated that in both models the main cost driver was disease incidence followed by cost for hospital care and medical visits. Vaccine effi cacy had a smaller eff ect.
Conclusions: Both models reached similar conclusions. Both projected that rotavirus vaccination in Turkey would improve health outcomes and may result in savings in direct healthcare costs to off set the cost of vaccination. The analysis indicated that the simple model can produce meaningful economic results in conditions where few data are available.
Keywords: rotavirus; vaccination; economic evaluation; model; Turkey; paediatric
INTRODUCTIONRotavirus is a major cause of acute gastroenteritis in young children worldwide, with an estimated 453,000 deaths annually in children aged <5 years, mainly in the developing world [1]. Almost every child will be infected with rotavirus before 5 years of age, with peak incidence at age 6–24 months [2;3]. Countries such as Turkey with a large annual birth cohort (>1.2 million) could experience a high rotavirus gastroenteritis (RVGE) burden, with consequences for health outcomes (mortality and morbidity), healthcare spending (medical visits and hospitalisations), and impaired quality of life (e.g. stress for parents) [3-8].
In the absence of detailed information on rotavirus disease in a country, models are helpful tools to explore the potential impact of new interventions such as vaccination [9]. Many models of rotavirus disease and the projected impact of vaccination have been reported, from simple to advanced [10-13]. Advanced models may include specifi c aspects of the clinical impact and cost of rotavirus disease over time and various potential vaccine eff ects, and can compare diff erent vaccine types or estimate indirect vaccine eff ects.
Decision-makers need to choose an appropriate model for economic assessment of interventions in their country [14]. Model selection depends on three issues: the economic question to be answered; the data available to answer that question; and the audience to whom it is addressed. Simple questions should be answered by simple models that are straightforward to understand and accessible by a range of users. Advanced models can answer more complex questions, but require more data, more assumptions, and more skills to construct, understand and interpret the results. However, an advanced model should also be able to answer simple questions, and its results should not diff er greatly from those of the simple model.
In the present paper, we have tested this hypothesis by comparing the results of a simple and an advanced model for estimating cost off sets and gain in quality-adjusted life-years (QALY) for rotavirus vaccination versus no vaccination. We selected Turkey for this study. It is a good example of a country with basic epidemiological data on ambulatory care and hospitalisation that needs to make decisions on healthcare investment. A complete economic assessment, addressing
Exploring new ways of measuring the economic value of vaccination
68
questions about optimal vaccine type, dose regimen and schedule, and the likely size of the vaccine eff ect over time, will require an advanced model. However, a simple model can evaluate the economic impact of rotavirus vaccination in the fi rst instance. If a simple model is shown to produce results similar to those of an advanced model, this should help to raise confi dence that meaningful assessments can be performed in countries with few data available.
MATERIALS AND METHODSWe developed two models, an advanced model and a simple model deduced from it [13;15;16]. The simple model was designed to address three economic questions: the cost-eff ectiveness of rotavirus vaccination in infants versus no vaccination; one-way sensitivity analysis to identify the main results drivers; and the budget impact of introducing vaccination. The advanced model can also perform probabilistic sensitivity analysis and address more complex questions, such as the eff ect of a two- versus three-dose vaccine, diff erent dosing schedules (e.g. 2-3 month dosing versus 3-5 month dosing), waning of vaccine eff ect over time and indirect protection. Because the objective of the present study was to compare the two model types, we present only results for outcomes common to both. The advanced model has been described elsewhere [13]. Its main features are summarised here.
MODEL STRUCTURE AND DESIGN
AdvancedThis static, deterministic, Markov cohort model compared the costs and QALY outcomes of vaccination versus no vaccination of a birth cohort of 1,257,583 infants followed for 5 years in Turkey. The initial model was developed by Melliez and colleagues [17]. We adapted it to address more complex questions, such as dose scheduling, vaccine waning and seasonality [13]. It can include 103 diff erent variables and is presented in 25 Microsoft Excel® worksheets.
SimpleSimpleThe simple model was a static, deterministic, decision-tree model comparing the costs and QALY outcomes of vaccination versus no vaccination of 5 one-year age groups (0-1 year; 1-2 years; 2-3 years; 3-4 years; 4-5 years), with 1,257,583 children per age-group assessed together over a period of one year [18]. Four health states were included: mild (seeking no medical advice), moderate (visiting a general practitioner [GP] at least) or severe (hospitalised) disease, or rotavirus-related death. It has a maximum of 23 diff erent variables and is presented on a single worksheet (A copy of the simple model is provided as a Microsoft Excel® worksheet in Supplementary Material 1).
As well as the smaller number of variables in the simple model, the models diff ered in construction. In the simple model, a population up to age 5 years was modelled over one year, whereas in the advanced model a birth cohort aged with time in cycles of 1 month over 5 years. The advanced model allowed more precision about the timing of events. This increased detail allowed the advanced model to identify more clearly the time and age at which projected vaccine benefi ts occur, which could have consequences for dose scheduling.
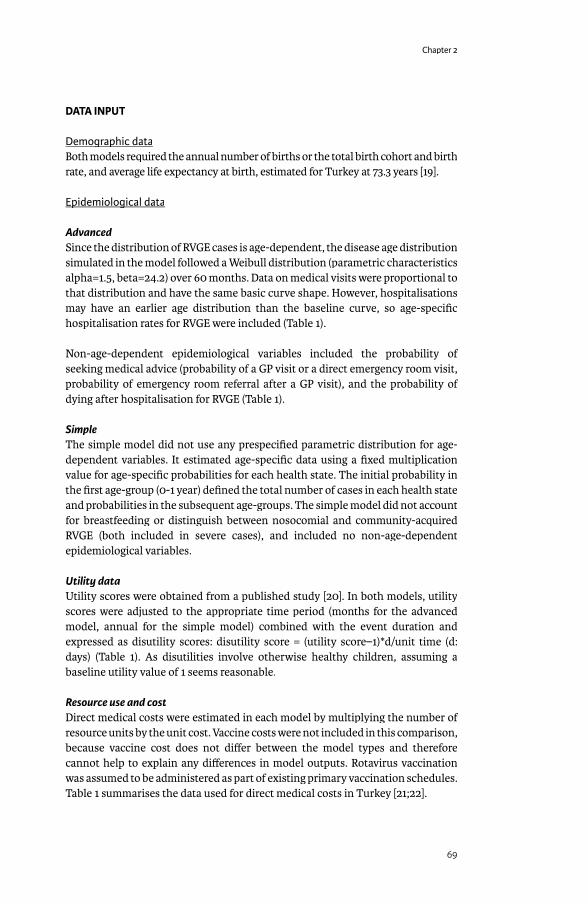
Chapter 2
69
DATA INPUT
Demographic dataDemographic dataBoth models required the annual number of births or the total birth cohort and birth rate, and average life expectancy at birth, estimated for Turkey at 73.3 years [19].
Epidemiological dataEpidemiological data
AdvancedSince the distribution of RVGE cases is age-dependent, the disease age distribution simulated in the model followed a Weibull distribution (parametric characteristics alpha=1.5, beta=24.2) over 60 months. Data on medical visits were proportional to that distribution and have the same basic curve shape. However, hospitalisations may have an earlier age distribution than the baseline curve, so age-specifi c hospitalisation rates for RVGE were included (Table 1).
Non-age-dependent epidemiological variables included the probability of seeking medical advice (probability of a GP visit or a direct emergency room visit, probability of emergency room referral after a GP visit), and the probability of dying after hospitalisation for RVGE (Table 1).
SimpleThe simple model did not use any prespecifi ed parametric distribution for age-dependent variables. It estimated age-specifi c data using a fi xed multiplication value for age-specifi c probabilities for each health state. The initial probability in the fi rst age-group (0-1 year) defi ned the total number of cases in each health state and probabilities in the subsequent age-groups. The simple model did not account for breastfeeding or distinguish between nosocomial and community-acquired RVGE (both included in severe cases), and included no non-age-dependent epidemiological variables.
Utility dataUtility scores were obtained from a published study [20]. In both models, utility scores were adjusted to the appropriate time period (months for the advanced model, annual for the simple model) combined with the event duration and expressed as disutility scores: disutility score = (utility score–1)*d/unit time (d: days) (Table 1). As disutilities involve otherwise healthy children, assuming a baseline utility value of 1 seems reasonable.
Resource use and costDirect medical costs were estimated in each model by multiplying the number of resource units by the unit cost. Vaccine costs were not included in this comparison, because vaccine cost does not diff er between the model types and therefore cannot help to explain any diff erences in model outputs. Rotavirus vaccination was assumed to be administered as part of existing primary vaccination schedules. Table 1 summarises the data used for direct medical costs in Turkey [21;22].

Exploring new ways of measuring the economic value of vaccination
70
Vaccine eff ect
Advanced• The model incorporated both direct and indirect vaccine eff ects, with indirect
eff ects considered only in sensitivity analysis. The advanced model required the following vaccine effi cacy data [23;24]:
• Dose schedule and coverage per dose.• Vaccine effi cacy per dose for mild, moderate, and severe disease assessed over
time (Table 2). Vaccine effi cacy for mild disease is an estimate, as no precise data are yet available.
Table 1 Input data for variables in the model
Parameter Advanced SimpleStarting value a Starting value
Age-dependentProbability of rotavirus diarrhoea ~ 0.019 b, c 0.191Breastfeeding probability ~ 0.752 b Not includedHospitalisation probability for rotavirus diarrhoea ~ 0.087 b 0.10Non-age-dependentProbability of seeking medical advice 1Probability of fi rst-line (GP) visit 0.179Probability of second-line visit 0.821Probability of dying a� er hospitalisation due to RVGE 0.00035Disutility scores [20] Age <18 months (m) Age >18 months (m) (y)Diarrhoea -0.043 -0.027 -0.00285ER visit -0.019 -0.019 -0.00158GP visit -0.010 -0.007Hospitalisation -0.127 -0.095 -0.00925Death -224 d -225 dDirect medical cost Cost Assumptions CostGP consultation $ 20 17% go to GP fi rst $ 20Emergency room visit $ 35 83% go to emergency fi rst $ 35Hospitalisation RVGE $ 400 26% pass through emergency $ 400Vaccine dose coverage and completion1st dose 2 months 95% 95%2nd dose 3 months 100%
a Starting values are country-specifi c and part of the calibration processb Approximate because the values are age-relatedc Probability values diff er because the advanced model has a time frame in months and the simple model has a time frame in years, and because of the way probabilities are handled in each model. In the advanced model, probabilities over a 60-month period (5 years) follow a Weibull distribution, infl uenced in the fi rst six months by breastfeeding, and sum to a cumulative probability of 1 over the period. In the simple model, the starting value is derived from the total number of cases up to the age of 5 years and the proportion of these cases that occur in the fi rst age group (0–1 year).d Discounted at 5% per year. The disutility scores diff er between the advanced and simple model because the way the discount rate is included diff ers between the two models. The disutility score in the simple model is the mean of the two age groups in the advanced model, divided by 12 because the simple model has a time frame in years and the advanced model has a time frame in monthsm: month; d: days; y: years. ER, emergency room; GP, general practitioner; RVGE, rotavirus gastroenteritis

Chapter 2
71
Table 2 Vaccine effi cacy data a� er fi rst and second dose of Rotarix®1 for mild, moderate and severe disease stages over time in the advanced and simple model
Months Vaccine effi cacy in mild diarrhoea
Vaccine effi cacy in moderate diarrhoea
Vaccine effi cacy in severe diarrhoea
Vaccine effi cacy in nosocomial infections
AdvancedBefore dose 1 1 0.0% 0.0% 0.0% 0.0%Dose 1 2 78.4% 80.8% 90.0% 90.0%4 months 4 78.4% 80.8% 90.0% 90.0%6 months 6 16.3% 16.1% 14.9% 14.9%12 months 12 0.1% 0.1% 0.1% 0.1%2 years 24 0.0% 0.0% 0.0% 0.0%Dose 2 3 87.1% 95.8% 100.0% 100.0%2nd year 15 74.0% 76.6% 80.0% 80.0%3rd year 27 62.9% 69.0% 72.0% 72.0%4th year 39 53.5% 62.1% 64.8% 64.8%5th year 51 45.5% 55.9% 58.3% 58.3%6th year 60 41.0% 52.2% 54.5% 54.5%SimpleA� er 2 doses 87% 95% 100% 100%
1 Rotarix is a registered trade mark of the GlaxoSmithKline group of companies
SimpleThe simple model assumed an average vaccine effi cacy value for each health state without diff erentiating by time period or dose number (Table 2), using the maximum vaccine effi cacy after 2 doses in the clinical trial [23]. It did not include indirect eff ects.
Model assumptionsTable 3 shows the key assumptions in both models, the rationale for each assumption and its impact. Outcomes were discounted at 5% and costs at 0% in the simple model and the advanced model base case.
DATA OUTPUTAlthough the advanced model had many more outputs than the simple one, we report here only the outputs common to both:• Rotavirus diarrhoea events within a birth cohort aged ≤5 years: all events;
seeking medical advice; hospitalisations;• Rotavirus-specifi c deaths;• Total direct costs excluding vaccine costs (Cost off set = total rotavirus-related
direct cost without vaccination minus total rotavirus-related direct cost with vaccination);
• Total QALY loss.
Both models considered the payer-only perspective (Ministry of Health). No cost-eff ectiveness result was reported as the analysis did not include vaccine cost.
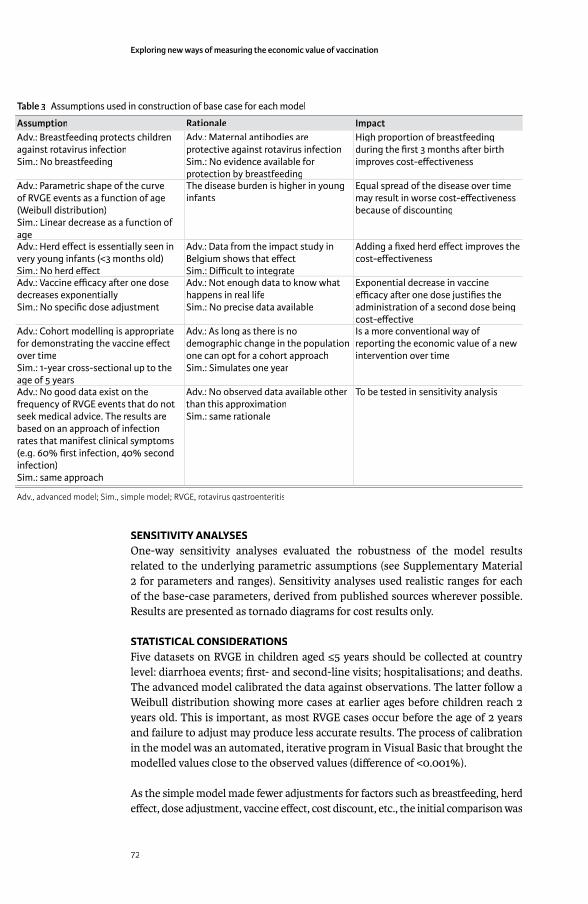
Exploring new ways of measuring the economic value of vaccination
72
SENSITIVITY ANALYSESOne-way sensitivity analyses evaluated the robustness of the model results related to the underlying parametric assumptions (see Supplementary Material 2 for parameters and ranges). Sensitivity analyses used realistic ranges for each of the base-case parameters, derived from published sources wherever possible. Results are presented as tornado diagrams for cost results only.
STATISTICAL CONSIDERATIONSFive datasets on RVGE in children aged ≤5 years should be collected at country level: diarrhoea events; fi rst- and second-line visits; hospitalisations; and deaths. The advanced model calibrated the data against observations. The latter follow a Weibull distribution showing more cases at earlier ages before children reach 2 years old. This is important, as most RVGE cases occur before the age of 2 years and failure to adjust may produce less accurate results. The process of calibration in the model was an automated, iterative program in Visual Basic that brought the modelled values close to the observed values (diff erence of <0.001%).
As the simple model made fewer adjustments for factors such as breastfeeding, herd eff ect, dose adjustment, vaccine eff ect, cost discount, etc., the initial comparison was
Table 3 Assumptions used in construction of base case for each model
Assumption Rationale ImpactAdv.: Breastfeeding protects children against rotavirus infectionSim.: No breastfeeding
Adv.: Maternal antibodies are protective against rotavirus infectionSim.: No evidence available for protection by breastfeedingprotection by breastfeeding
High proportion of breastfeeding during the fi rst 3 months a� er birth improves cost-eff ectiveness
Adv.: Parametric shape of the curve of RVGE events as a function of age (Weibull distribution)Sim.: Linear decrease as a function of ageage
The disease burden is higher in young infants
Equal spread of the disease over time may result in worse cost-eff ectiveness because of discounting
Adv.: Herd eff ect is essentially seen in very young infants (<3 months old)Sim.: No herd eff ect
Adv.: Data from the impact study in Belgium shows that eff ectSim.: Diffi cult to integrateSim.: Diffi cult to integrate
Adding a fi xed herd eff ect improves the cost-eff ectiveness
Adv.: Vaccine effi cacy a� er one dose decreases exponentiallySim.: No specifi c dose adjustment
Adv.: Not enough data to know what happens in real lifeSim.: No precise data available
Exponential decrease in vaccine effi cacy a� er one dose justifi es the administration of a second dose being cost-eff ective
Adv.: Cohort modelling is appropriate for demonstrating the vaccine eff ect over timeSim.: 1-year cross-sectional up to the age of 5 yearsage of 5 years
Adv.: As long as there is no demographic change in the population one can opt for a cohort approachSim.: Simulates one year
Is a more conventional way of reporting the economic value of a new intervention over time
Adv.: No good data exist on the frequency of RVGE events that do not seek medical advice. The results are based on an approach of infection rates that manifest clinical symptoms (e.g. 60% fi rst infection, 40% second infection)Sim.: same approach
Adv.: No observed data available other than this approximationSim.: same rationale
To be tested in sensitivity analysis
Adv., advanced model; Sim., simple model; RVGE, rotavirus gastroenteritis

Chapter 2
73
made with the fewest of these eff ects in the advanced model. This estimated the basic diff erence in cost off set and QALYs between the models, expressed as a percentage. Additional features were then successively added to the advanced model and the percentage deviation from the initial analysis calculated. This was conducted fi rst by evaluating each parameter separately as a one-way sensitivity analysis, then by combining diff erent elements as a multi-way sensitivity analysis. We also reported the results of the advanced model as normally used (including breastfeeding, discounting of costs and eff ect and waning, but excluding herd protection).
RESULTSTable 4 summarises the estimated number of rotavirus cases, cost and cost off set and QALYs lost for vaccination compared with no vaccination projected by each model.
The advanced model was adjusted to be comparable with the simple one (i.e. no cost discount, breastfeeding, herd eff ect or vaccine waning). The number of QALYs gained by vaccination was slightly smaller in the advanced model than in the simple one, because the simple model only discounted the life-years gained when deaths were avoided. The cost off sets were larger in the simple than in the advanced model because of the diff erence in disease age-distribution and diff erences in eff ect and coverage for the fi rst and second doses in the advanced model.
Table 5 shows the eff ect of introducing into the advanced model the features that diff erentiate it from the simple one, adding fi rst breastfeeding, then cost discounting at 5%, then waning, and fi nally herd eff ect with a 10% improvement in vaccine effi cacy. The ‘Combined eff ect’ analysis shows the eff ects of adding
Table 4 Projected numbers of rotavirus cases by severity, rotavirus deaths, cost and cost off set, and QALYs lost for each model type with and without vaccination
Unvaccinated Vaccinated Diff erence (%)SimpleMild 539 280 93 565 –445 715 (83%)Moderate 539 280 52 580 –486 700 (90%)Severe 36 797 1 840 –34 957 (95%)Deaths 13 1 –12 (92%)Cost / Cost off set a $32 480 486 $2 581 784 –$29 898 702 (92%)QALY lost –2 973 –369 2 604 (88%)Advanced (base case)Rotavirus diarrhoea events
539 280 36 688 –502 591 (93%)
1st line 96 554 6 569 –89 985 (93%)2nd line 442 726 30 120 –412 606 (93%)Emergency visit 9 653 657 –8 996 (93%)Hospitalisation 36 797 2 257 –34 540 (94%)Deaths 13 1 –12 (92%)Cost / Cost off set a $32 483 127 $3 110 586 –$29 372 541 (90%)QALY lost –2 663 –254 2 409 (90%)
a Unvaccinated and Vaccinated columns show cost, Diff erence column shows cost off set
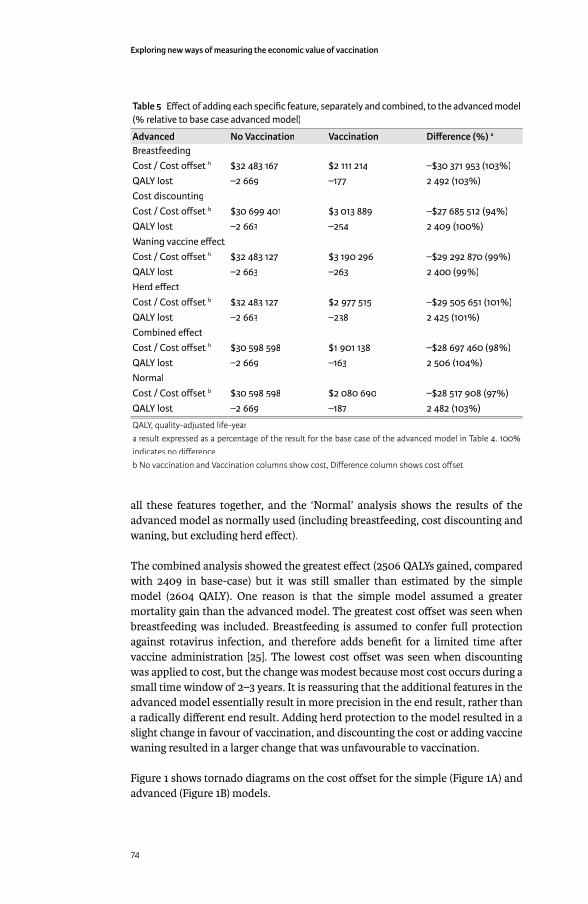
Exploring new ways of measuring the economic value of vaccination
74
all these features together, and the ‘Normal’ analysis shows the results of the advanced model as normally used (including breastfeeding, cost discounting and waning, but excluding herd eff ect).
The combined analysis showed the greatest eff ect (2506 QALYs gained, compared with 2409 in base-case) but it was still smaller than estimated by the simple model (2604 QALY). One reason is that the simple model assumed a greater mortality gain than the advanced model. The greatest cost off set was seen when breastfeeding was included. Breastfeeding is assumed to confer full protection against rotavirus infection, and therefore adds benefi t for a limited time after vaccine administration [25]. The lowest cost off set was seen when discounting was applied to cost, but the change was modest because most cost occurs during a small time window of 2–3 years. It is reassuring that the additional features in the advanced model essentially result in more precision in the end result, rather than a radically diff erent end result. Adding herd protection to the model resulted in a slight change in favour of vaccination, and discounting the cost or adding vaccine waning resulted in a larger change that was unfavourable to vaccination.
Figure 1 shows tornado diagrams on the cost off set for the simple (Figure 1A) and advanced (Figure 1B) models.
Table 5 Eff ect of adding each specifi c feature, separately and combined, to the advanced model (% relative to base case advanced model)
Advanced No Vaccination Vaccination Diff erence (%) a
BreastfeedingCost / Cost off set b $32 483 167 $2 111 214 –$30 371 953 (103%)QALY lost –2 669 –177 2 492 (103%)Cost discountingCost / Cost off set b $30 699 401 $3 013 889 –$27 685 512 (94%)QALY lost –2 663 –254 2 409 (100%)Waning vaccine eff ectCost / Cost off set b $32 483 127 $3 190 296 –$29 292 870 (99%)QALY lost –2 663 –263 2 400 (99%)Herd eff ectCost / Cost off set b $32 483 127 $2 977 515 –$29 505 651 (101%)QALY lost –2 663 –238 2 425 (101%)Combined eff ectCost / Cost off set b $30 598 598 $1 901 138 –$28 697 460 (98%)QALY lost –2 669 –163 2 506 (104%)NormalCost / Cost off set b $30 598 598 $2 080 690 –$28 517 908 (97%)QALY lost –2 669 –187 2 482 (103%)
QALY, quality-adjusted life-yeara result expressed as a percentage of the result for the base case of the advanced model in Table 4. 100% indicates no diff erenceb No vaccination and Vaccination columns show cost, Diff erence column shows cost off set

Chapter 2
75
In both models the main cost driver was disease incidence, followed by disease-related costs. Vaccine effi cacy had a smaller eff ect, perhaps because vaccine effi cacy was high and the input range limited. The advanced model also indicated the importance of cost discounting and dose compliance, but these were not major drivers (Figure 1B).
DISCUSSIONThe results of both the simple and advanced models projected that rotavirus vaccination could produce important cost off sets in hospitalisation and medical visit costs in Turkey. This refl ects the large medical and QALY disease burden associated with rotavirus in Turkey. Reduction of this burden by vaccination may result in estimated cost off sets of up to $29.5 million per year, a decrease of 92% of the current estimated cost of rotavirus disease.
The conclusion was similar using either a simple or an advanced model. This should be expected, as both models should reach the same conclusion when answering simple questions with the same data input, unless there is a problem with the model construct. The simple model produced more optimistic estimates
Figure 1 Tornado diagram on key variables measuring the cost diff erence in (A) the simple model and (B) the advanced model. Black bars show the eff ect of decreasing the parameter value; white bars show the eff ect of increasing the parameter value. Prop, proportion; VE, vaccine effi cacy; y, year
Exploring new ways of measuring the economic value of vaccination
76
than the advanced model in its normal confi guration. This is because the simple model had a simplifi ed approach to discounting and age distribution of rotavirus disease, did not adjust vaccine effi cacy over time, and made no adjustments for fi rst and subsequent vaccine doses.
As the results from both models in the current study indicated that vaccination would reduce medical costs and improve QALYs, the greater precision off ered by the advanced model has limited benefi t except to indicate the potential range of cost off sets and QALYs gained. In other situations where one strategy is both more expensive and more costly than the comparator, the ability of the advanced model to adjust for factors such as breastfeeding, changes in vaccine effi cacy over time and any herd protection may be important to obtain precise estimates of discounted costs, benefi ts and incremental cost-eff ectiveness ratios.
The similarities and small diff erences between the simple and advanced models in the tornado diagrams are of interest. Both models were aff ected by disease incidence and cost variables more than by vaccine effi cacy. The relatively small impact of changes in vaccine effi cacy refl ects the characteristics of rotavirus disease. Rotavirus incidence drops dramatically after the age of 24 months, due to age-related behavioural changes and development of natural immunity after repeated infections, so after this age any change in vaccine effi cacy has only a small eff ect on the results. This illustrates the importance of calibrating the advanced model closely with the data to simulate precisely a disease distribution concentrated in young children (aged <24 months) [13].
Both models can include indirect costs if needed, as lost earnings are associated with time missed from work by parents caring for their children.
Both models used life expectancy at birth, rather than natural mortality rates. This assumption is acceptable if the economic evaluation measures health gain only amongst children, and if no large change is expected in population demographic structure. The same approach is used when developing an age-structured dynamic model [26;27].
Recent observational studies on the impact of rotavirus vaccination in real life have indicated that the decrease in vaccine effi cacy reported in clinical trials may refl ect a reduction in net eff ect due to development of natural immunity over time, rather than a real decrease in vaccine eff ect [28]. This supports the use of vaccine effi cacy maintained over time in the simple model. Long-term studies may provide defi nitive evidence on whether vaccine effi cacy is indeed maintained over time.
Advanced models have often been used in developed countries such as in the US, France, UK, or the Netherlands. However, attempting to make a straightforward comparison between the results of those models from those countries with the Turkish situation may highlight an issue illustrated by a recent review on the cost-eff ectiveness of Rotarix vaccination. The health and economic problem caused by rotavirus diff ers greatly between developed and emerging countries. In developed countries the healthcare cost is high, mainly driven by hospital
Chapter 2
77
costs, and mortality is low. In contrast, emerging markets such as Turkey have a lower cost problem and higher mortality. The review was therefore split into two separate papers, one covering developed countries and one covering developing countries[29]. The economic analysis and the comparison showed that in more developed countries the off sets in QALY loss are limited, due to the low mortality from rotavirus in developed countries. In emerging markets the situation is quite diff erent, as rotavirus mortality is higher and the scope for QALY gains consequently larger. In contrast, the cost off set could be important in both market types. As a consequence it is likely that a new vaccine against rotavirus would be cost-eff ective in emerging markets, whereas in the more developed world cost minimisation drives the economic end result.
This type of analysis has limitations, and we propose the simple model presented here as an exploratory method for obtaining the best estimates possible with limited available data. It should help decision-makers to orient their choices, but the fi ndings will need subsequent confi rmation if vaccination is introduced. It will be helpful to use both models if possible as part of a validation process. The advanced model is more sophisticated than the simple one, and if both produce similar results that should support confi dence in the fi ndings. Conversely, large diff erences in the results may indicate that an explanation should be sought. The simple model with its graphical interface should help decision-makers understand and explain rotavirus disease and the potential impact of rotavirus vaccination. To date, few studies in the literature have compared results between diff erent types of models for the same disease, although it is known that data are scarce in some countries. The present analysis is therefore interesting and helpful for countries that have limited data available, as it shows that they can still perform a meaningful economic analysis of a specifi c infectious disease and a specifi c prevention strategy.
CONCLUSIONSWith a large rotavirus disease burden and high vaccine coverage the health benefi ts of rotavirus vaccination can be overwhelming, producing both improved health outcomes and reduced healthcare costs. If few data are available in a country, the simple model off ers a good fi rst step to estimate the potential eff ects of vaccination, making best use of the data available. The simple model produces results similar to those of a more advanced model when used to answer simple economic questions.
Where more data are available, we recommend using both models in parallel. The combination of two diff erent modelling approaches provides useful validation for the results, and will help to improve understanding of rotavirus disease and its management using new techniques such as vaccination.
REFERENCES[1] Tate JE, Burton AH, Boschi-Pinto C, Steele AD, Duque J, Parashar UD. 2008
estimate of worldwide rotavirus-associated mortality in children younger than 5 years before the introduction of universal rotavirus vaccination programmes: a systematic review and meta-analysis. Lancet Infect Dis 2011 Nov;3099(11):1-6.
Exploring new ways of measuring the economic value of vaccination
78
[2] Bernstein DI. Rotavirus overview. Pediatr Infect Dis J 2009 Mar;28(3 Suppl):S50-S53.
[3] Ceyhan M, Alhan E, Salman N, Kurugol Z, Yildirim I, Celik U, et al. Multicenter prospective study on the burden of rotavirus gastroenteritis in Turkey, 2005-2006: a hospital-based study. J Infect Dis 2009 Nov 1;200 Suppl 1:S234-S238.
[4] Kurugöl Z, Geylani S, Karaca Y, Umay Y, Erensoy S, Vardar F, et al. Rotavirus gastroenteritis among children under fi ve years of age in Ýzmir, Turkey. The Turkish Journal of Pediatrics 2003;45:290-4.
[5] Khoury H, Ogilvie I, El Khoury AC, Duan Y, Goetghebeur MM. Burden of rotavirus gastroenteritis in the Middle Eastern and North African pediatric population. BMC Infect Dis 2011;11:9-20.
[6] Karadag A, Acikgoz ZC, Avci Z, Catal F, Gocer S, Gamberzade S, et al. Childhood diarrhoea in Ankara, Turkey: epidemiological and clinical features of rotavirus-positive versus rotavirus-negative cases. Scand J Infect Dis 2005;37(4):269-75.
[7] Akan H, Izbirak G, Gurol Y, Sarikaya S, Gunduz TS, Yilmaz G, et al. Rotavirus and adenovirus frequency among patients with acute gastroenteritis and their relationship to clinical parameters: a retrospective study in Turkey. Asia Pac Fam Med 2009;8(1):8.
[8] Van der Wielen M., Giaquinto C, Gothefors L, Huelsse C, Huet F, Littmann M, et al. Impact of community-acquired paediatric rotavirus gastroenteritis on family life: data from the REVEAL study. BMC Fam Pract 2010;11:22.
[9] Bilcke J, Beutels P. Reviewing the cost eff ectiveness of rotavirus vaccination: the importance of uncertainty in the choice of data sources. Pharmacoeconomics 2009;27(4):281-97.
[10] Jit M, Bilcke J, Mangen MJ, Salo H, Melliez H, Edmunds WJ, et al. The cost-eff ectiveness of rotavirus vaccination: Comparative analyses for fi ve European countries and transferability in Europe. Vaccine 2009 Oct 19;27(44):6121-8.
[11] Atchison C, Lopman B, Edmunds WJ. Modelling the seasonality of rotavirus disease and the impact of vaccination in England and Wales. Vaccine 2010 Apr 19;28(18):3118-26.
[12] Atkins KE, Shim E, Pitzer VE, Galvani AP. Impact of rotavirus vaccination on epidemiological dynamics in England and Wales. Vaccine 2012 Jan 11;30(3):552-64.
[13] Standaert B, Parez N, Tehard B, Colin X, Detournay B. Cost-eff ectiveness analysis of vaccination against rotavirus with RIX4414 in France. Appl Health Econ Health Policy 2008;6(4):199-216.
[14] Postma MJ, Jit M, Rozenbaum MH, Standaert B, Tu HA, Hutubessy RC. Comparative review of three cost-eff ectiveness models for rotavirus vaccines in national immunization programs; a generic approach applied to various regions in the world. BMC Med 2011;9:84.
[15] Goossens LMA, Standaert B, Hartwig N, Hovels AM, Al MJ. The cost-utility of rotavirus vaccination with Rotarix(TM) (RIX4414) in the Netherlands 1487. Vaccine 2008 Feb 20;26(8):1118-27.

Chapter 2
79
[16] Martin A, Batty A, Roberts JA, Standaert B. Cost-eff ectiveness of infant vaccination with RIX4414 (Rotarix) in the UK. Vaccine 2009 Jul 16;27(33):4520-8.
[17] Melliez H, Boelle PY, Baron S, Mouton Y, Yazdanpanah Y. [Morbidity and cost of rotavirus infections in France]. Med Mal Infect 2005 Oct;35(10):492-9.
[18] Turkish Statistical Institute. Turkey’s Statistical Yearbook 2010. 2011 Apr. 3522.
[19] Turkish Statistical Institute. Life expectancy at birth. http://www.tuik.gov.http://www.tuik.gov.tr/Gosterge.do?id=3712&sayfa=giris&metod=IlgiliGostergetr/Gosterge.do?id=3712&sayfa=giris&metod=IlgiliGosterge 2012 [cited 2011 Jun 8]
[20] Martin A, Cottrell S, Standaert B. Estimating utility scores in young children with acute rotavirus gastroenteritis in the UK. J Med Econ 2008;11(3):471-84.
[21] Turel O, Soysal A, Bakir M. Clinical Characteristics and Direct Medical Cost of Diarrhea among Hospitalised children in Istanbul. ISPOR . 2005. Ref Type: Abstract
[22] Turkish Social Security Institution. Social Insurance and Universal Health Insurance Law, Treatment Guidelines. Appendix no. 8. Offi cial Gazette of Republic of Turkey 2010 Mar 25;Report no. 27532 (updated).
[23] Vesikari T, Karvonen A, Prymula R, Schuster V, Tejedor JC, Cohen R, et al. Effi cacy of human rotavirus vaccine against rotavirus gastroenteritis during the fi rst 2 years of life in European infants: randomised, double-blind controlled study. The Lancet 2007 Nov 24;370(9601):1757-63.
[24] Jit M, Mangen M-JJ, Melliez H, Bilcke J, Salo H, Edmunds WJ. An update to “The cost-eff ectiveness of rotavirus vaccination: Comparative analyses for fi ve European countries and transferability in Europe”. Vaccine 2010;28:7457-9.
[25] Gianino P, Mastretta E, Longo P, Laccisaglia A, Sartore M, Russo R, et al. Incidence of nosocomial rotavirus infections, symptomatic and asymptomatic, in breast-fed and non-breast-fed infants. J Hosp Infect 2002 Jan;50(1):13-7.
[26] Brisson M, Edmunds WJ. Impact of model, methodological, and parameter uncertainty in the economic analysis of vaccination programs. Med Decis Making 2006 Sep;26(5):434-46.
[27] Brisson M, Edmunds WJ. Economic evaluation of vaccination programs: the impact of herd-immunity. Med Decis Making 2003 Jan;23(1):76-82.
[28] Standaert B, Gomez J, Raes M, Debrus S, Velazquez FR, Postma MJ. Impact of rotavirus vaccination on hospitalisations in Belgium: comparing model predictions with observed data. [[In preparation]] 2012.
[29] Plosker GL. Rotavirus vaccine RIX4414 (Rotarix): a pharmacoeconomic review of its use in the prevention of rotavirus gastroenteritis in developed countries. Pharmacoeconomics 2011 May;29(5):439-54.
80
IMPACT STUDIES
The challenge when launching a new vaccine is that the evaluation period of randomized clinical trials often has a short duration for obvious reasons. With short duration I emphasize periods of maximum 2 - 3 years in which the vaccinated group is evaluated separately from the unvaccinated group.
There are two particular points to make here about this approach. One is that there could be additional benefi t beyond the period of observation. It is not because the eff ect of the vaccine is assessed over a certain fi xed period that suddenly it stops once the vaccine is not studied anymore as some authorities were claiming when presenting our clinical trial results. Because one was unable to evaluate that eff ect in a randomized fashion over long enough periods I tried to evaluate the assessment through modelling exercises. But that is a problem for some evaluators on how to precisely model the assumed benefi t over time. Sensitivity analysis could help here as well.
Another way to look at the problem is to check whether the model predictions fi t with reality by designing impact studies [23]. I was able to develop such a study in Belgium called the RotaBIS (Rotavirus vaccine Belgian Impact Study) study among 11 hospital centres spread all over the country. I reported results at 2, 5 and now 7 years after the introduction of the vaccine. The last evaluation allows starting the comparison of a cross-sectional analysis with a follow-up of vaccinated birth-cohorts over time. Interestingly by doing this comparison I observed a diff erence in the source of infection over time, from children in baseline at a very young age to parents or other care-givers over a maintained long period of observation (Standaert B et al., submitted, 2015).
Another interesting point is that by doing these impact studies and analysing the data on an infectious disease with a rapid spread such as rotavirus, it is possible to measure a herd eff ect very early on in the follow-up period of randomised clinical trials. Therefore any trial with duration longer than a year will be under the infl uence of indirect vaccine eff ect if that infection follows an annual epidemic spread. As a consequence lower vaccine effi cacies were obtained in the second year after the vaccine introduction, because of the calculation method used to assess the vaccine effi cacy. The denominator is the number of rotavirus events in the control arm that is decreased due to the herd eff ect [24].
One recommendation I want to make here is that health economists should be closely involved into the development and design of the epidemiologic studies that evaluate the benefi t of vaccines over short and long term periods. They are the ones most interested in understanding and evaluating the indirect benefi t that vaccines create. That particular benefi t often helps bringing the vaccine over the hurdle of becoming cost-eff ective.
3
Chapter 3
81
REDUCTION IN PAEDIATRIC ROTAVIRUS-RELATED HOSPITALIZA-TIONS AFTER UNIVERSAL ROTAVIRUS VACCINATION IN BELGIUM
PIDJ, 2011, 30: e120-e125
ABSTRACT
BackgroundBackground: This study investigated the impact of pediatric vaccination against rotavirus on the number of rotavirus-related hospitalizations of children in Belgium.
Methods: This retrospective database study was conducted at 12 pediatric hospitals in Belgium (546 pediatric beds, 30.6% of Belgian total). Children ≤5 years attending hospital for any reason were eligible if they had a rotavirus stool test at one of the study centers. The number of rotavirus-positive stool tests and hospitalizations for acute gastroenteritis (AGE) were compared for study periods pre-vaccination (June 2004 – May 2006) and post-vaccination (June 2007 – May 2009).
Results: The number of rotavirus-positive stool tests in children aged ≤5 years decreased from an average of 881 in the pre-vaccination period to 368 in the fi rst year post-vaccination and 199 in the second. In children aged 2–24 months the percentage reductions were 65% (95% confi dence interval [CI]: 62%, 69%) and 80% (95% CI: 77%, 83%) in the fi rst and second years after vaccination, respectively, compared with pre-vaccination. In children aged <2 months the reductions were 50% (95% CI: 36%, 64%) and 64% (95% CI: 49%, 76%), respectively, and in children aged >24 months the corresponding values were 20% (95% CI: 14%, 28%) and 64% (95% CI: 56%, 72%). The number of AGE-driven hospital admissions and hospitalization days for AGE declined by 33% and 36%, respectively, from pre-vaccination to the second year post-vaccination in children aged ≤2 years.
Conclusions: Paediatric rotavirus vaccination in Belgium signifi cantly reduced rotavirus-related hospitalizations in the fi rst and second years after the introduction of the vaccine.
INTRODUCTIONRotavirus infection is the leading cause of acute gastroenteritis (AGE) in young children worldwide,[1] and is associated with more severe symptoms and more hospital admissions than gastroenteritis due to other causes.[2] It is estimated to cause over 146,000 hospital admissions per year in children aged <5 years in the World Health Organization (WHO) European region,[3] and over 87,000 per year in the European Union countries.[4] In Belgium, the average number of hospital admissions due to rotavirus gastroenteritis in children aged <5 years was 6,790 per year between 2000 and 2005, and 12–21% of hospital days among children aged <2 years were associated with rotavirus.[5] In children aged <7 years, the incidence of hospitalization due to rotavirus has been estimated at 676 per 100,000 children
Marc Raesa
Danielle Strensb
Anne Vergisonc
Marc Verghoted
Baudouin Standaerte
a Paediatric Department, Virga Jesse Ziekenhuis, Hasselt, Belgium.
b Life Sciences Industry Consulting, Deloi� e, Diegem, Belgium.
c Paediatric Infectious Diseases Unit, Epidemiology and Infection Control Unit, Université-Libre de Bruxelles, Brussels, Belgium.
d Centre Hospitalier Régional de Namur, Namur, Belgium.
e GlaxoSmithKline Biologicals, Wavre, Belgium.
Exploring new ways of measuring the economic value of vaccination
82
in Belgium (5,600 hospitalizations annually).[6] Estimates of the annual economic burden of rotavirus disease in Belgium range from €12.5 million (53% direct medical costs),[7] to €7.7 million in direct costs and a further €12.8 million in indirect costs.[6]
Vaccination against rotavirus is recommended in European guidelines[8;8] and by WHO.[9] Two rotavirus vaccines are currently available in Belgium, a two-dose monovalent human rotavirus vaccine (GSK Biologicals, Rixensart, Belgium)[10;11] and a three-dose pentavalent bovine-derived vaccine (Sanofi Pasteur MSD).[12] The two vaccines have been partially reimbursed (10.3 Euros/dose is charged to the patient) in Belgium since November 2006 and June 2007, respectively. Overall vaccine coverage in Belgium is estimated using sales data at approximately 85%[13] to 90%[14] in 2008–2009. The expected impact of vaccination on rotavirus hospitalizations and costs has been estimated by modeling studies in several countries.[15-18] Field data are important to demonstrate the impact of vaccination in routine practice.
The aim of the present study was to assess the real-world eff ect of vaccination on rotavirus-related hospitalizations in children aged ≤5 years, by comparing data collected before and after the introduction of generalized vaccination in Belgium.
MATERIALS AND METHODSWe conducted a retrospective database study at 12 hospitals in Belgium (9 general hospitals with a pediatric ward, 3 pediatric hospitals). Four were university hospitals. The centers were distributed across the three geographic regions of Belgium (Brussels, Flanders, and Wallonia). The 12 centers had 546 pediatric beds, representing 30.6% of the total of 1793 pediatric beds in Belgium.[19]
Eleven of the participating centers provided information on the laboratory assays used to detect rotavirus. Of these, one used immunofl uorescence assay and the others used rapid immune-chromatographic tests. Two centers reported a change during the study period, using the same type of test but with a product from a diff erent manufacturer. In Belgium a rotavirus antigen test is reimbursed for all children aged ≤2 years.
Data collectionAll children aged ≤5 years who had a rotavirus detection test performed at one of the participating centers from 1 June 2004 to 31 May 2006 (pre-vaccination study period) or 1 June 2007 to 31 May 2009 (post-vaccination study period) were eligible for inclusion. The following information was recorded for each sample: patient’s birth date and gender; sample date; rotavirus test result; date of admission and discharge. Only hospitalized patients were included in the primary analysis.
Multiple samples taken from the same patient in the same AGE episode, defi ned as the same hospitalization or a time lapse of <30 days between two samples, were considered duplicates. If all samples during the episode were all positive or all negative, the fi rst sample was included. If some samples were positive and some negative during the episode, only the fi rst positive sample was included.

Chapter 3
83
Data analysisData analysisThe pre-vaccination study period was defi ned as 1 June 2004 to 31 May 2006. In analyses of the seasonal pattern of rotavirus tests, this was further divided into two study seasons, June 2004–May 2005 and June 2005–May 2006. The fi rst post-vaccination study season was defi ned as 1 June 2007–31 May 2008, and the second post-vaccination study season was defi ned as 1 June 2008–31 May 2009. The number and proportion of rotavirus-positive tests was calculated per month for each study season.
Hospitalization was classed as AGE-driven if the stool sample was collected within 48 hours of hospitalization. The mean length of stay and total number of hospitalization days were calculated for hospitalized patients. Rotavirus infections were considered community-acquired if a stool sample taken within 48 hours of hospital admission was rotavirus-positive.
Owing to changes in data management systems, only nine of the participating centers could provide a complete dataset for all four study seasons. Three centers had incomplete or missing data during the June 2004–May 2005 season. To avoid potential bias introduced by missing data, our main analysis included only the nine centers with complete datasets. To test whether excluding the centers with incomplete data could have infl uenced the results, we conducted a separate analysis including data from all twelve centers.
Data were analyzed by age groups (<2 months, 2–24 months, and >24 months). A further sub-analysis was conducted in children aged ≥33 months, as this age group would have been too old for vaccination. Children aged <1 month on the date of hospital admission were excluded from the analysis of length-of-stay because the full date of birth was not collected in the fi rst study year and this was the only way to exclude premature babies (who tend to have longer duration of hospitalization than other age groups).
We compared the absolute numbers of rotavirus-positive test results between the pre-vaccination study period and each of the two post-vaccination study seasons using the chi-square test assuming that the number of positive tests in the pre-vaccine period is the reference. The underlying assumption about the comparison of the periods pre- and post-vaccination is that the coverage area for each of the hospitals participating in the study is the same across the whole study period. Thus, the most relevant value to compare pre- and post-vaccination is the average absolute number of positive tests observed. The relative proportion of positive tests per season has less meaning if the number of tests taken per season has also decreased, because less pathology is observed overall. Hence, the denominator for comparison is not the number of tests conducted, but the number of positive tests observed in the pre-vaccination period.
For data on the length of stay, we compared the diff erent study periods using the Mann-Whitney U-test. A p-value of <0.05 was considered statistically signifi cant.
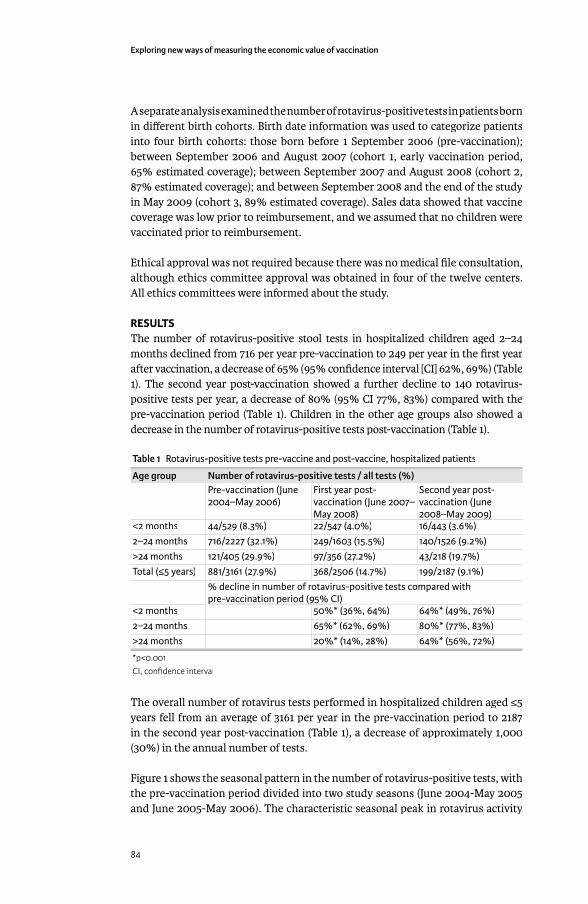
Exploring new ways of measuring the economic value of vaccination
84
A separate analysis examined the number of rotavirus-positive tests in patients born in diff erent birth cohorts. Birth date information was used to categorize patients into four birth cohorts: those born before 1 September 2006 (pre-vaccination); between September 2006 and August 2007 (cohort 1, early vaccination period, 65% estimated coverage); between September 2007 and August 2008 (cohort 2, 87% estimated coverage); and between September 2008 and the end of the study in May 2009 (cohort 3, 89% estimated coverage). Sales data showed that vaccine coverage was low prior to reimbursement, and we assumed that no children were vaccinated prior to reimbursement.
Ethical approval was not required because there was no medical fi le consultation, although ethics committee approval was obtained in four of the twelve centers. All ethics committees were informed about the study.
RESULTSThe number of rotavirus-positive stool tests in hospitalized children aged 2–24 months declined from 716 per year pre-vaccination to 249 per year in the fi rst year after vaccination, a decrease of 65% (95% confi dence interval [CI] 62%, 69%) (Table 1). The second year post-vaccination showed a further decline to 140 rotavirus-positive tests per year, a decrease of 80% (95% CI 77%, 83%) compared with the pre-vaccination period (Table 1). Children in the other age groups also showed a decrease in the number of rotavirus-positive tests post-vaccination (Table 1).
Table 1 Rotavirus-positive tests pre-vaccine and post-vaccine, hospitalized patients
Age group Number of rotavirus-positive tests / all tests (%)Pre-vaccination (June 2004–May 2006)
First year post-vaccination (June 2007–May 2008)May 2008)
Second year post-vaccination (June 2008–May 2009)2008–May 2009)
<2 months 44/529 (8.3%) 22/547 (4.0%) 16/443 (3.6%)2–24 months 716/2227 (32.1%) 249/1603 (15.5%) 140/1526 (9.2%)>24 months 121/405 (29.9%) 97/356 (27.2%) 43/218 (19.7%)Total (≤5 years) 881/3161 (27.9%) 368/2506 (14.7%) 199/2187 (9.1%)
% decline in number of rotavirus-positive tests compared with pre-vaccination period (95% CI)pre-vaccination period (95% CI)pre-vaccination period (95% CI)pre-vaccination period (95% CI)
<2 months 50%* (36%, 64%) 64%* (49%, 76%)2–24 months 65%* (62%, 69%) 80%* (77%, 83%)>24 months 20%* (14%, 28%) 64%* (56%, 72%)
*p<0.001CI, confi dence interval
The overall number of rotavirus tests performed in hospitalized children aged ≤5 years fell from an average of 3161 per year in the pre-vaccination period to 2187 in the second year post-vaccination (Table 1), a decrease of approximately 1,000 (30%) in the annual number of tests.
Figure 1 shows the seasonal pattern in the number of rotavirus-positive tests, with the pre-vaccination period divided into two study seasons (June 2004-May 2005 and June 2005-May 2006). The characteristic seasonal peak in rotavirus activity
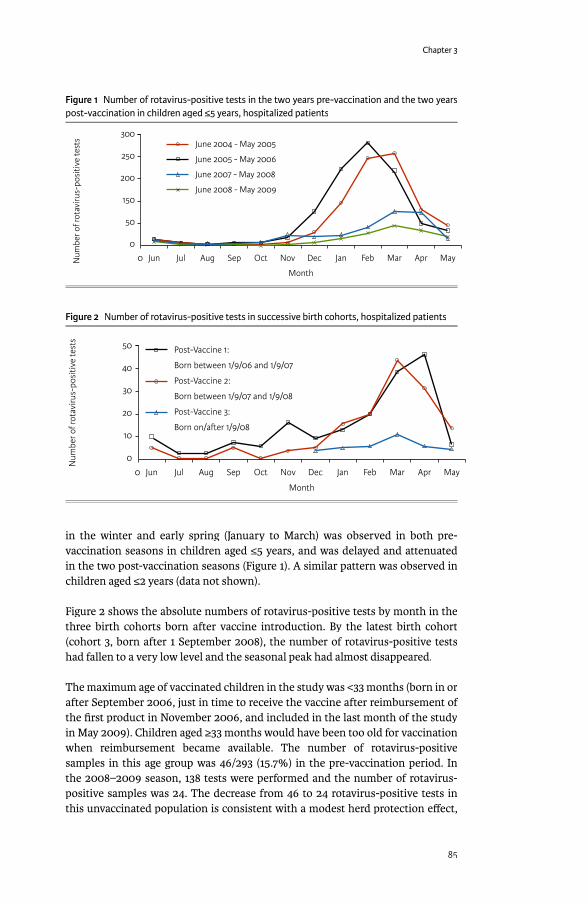
Chapter 3
85
in the winter and early spring (January to March) was observed in both pre-vaccination seasons in children aged ≤5 years, and was delayed and attenuated in the two post-vaccination seasons (Figure 1). A similar pattern was observed in children aged ≤2 years (data not shown).
Figure 2 shows the absolute numbers of rotavirus-positive tests by month in the three birth cohorts born after vaccine introduction. By the latest birth cohort (cohort 3, born after 1 September 2008), the number of rotavirus-positive tests had fallen to a very low level and the seasonal peak had almost disappeared.
The maximum age of vaccinated children in the study was <33 months (born in or after September 2006, just in time to receive the vaccine after reimbursement of the fi rst product in November 2006, and included in the last month of the study in May 2009). Children aged ≥33 months would have been too old for vaccination when reimbursement became available. The number of rotavirus-positive samples in this age group was 46/293 (15.7%) in the pre-vaccination period. In the 2008–2009 season, 138 tests were performed and the number of rotavirus-positive samples was 24. The decrease from 46 to 24 rotavirus-positive tests in this unvaccinated population is consistent with a modest herd protection eff ect,
Figure 1 Number of rotavirus-positive tests in the two years pre-vaccination and the two years post-vaccination in children aged ≤5 years, hospitalized patients
0 Jun Jul Aug Sep Oct Nov Dec Jan Feb Mar Apr MayNum
ber o
f rot
aviru
s-po
sitiv
e te
sts
Month
300
250
200
150
50
0
June 2004 - May 2005
June 2005 - May 2006
June 2007 - May 2008
June 2008 - May 2009
Figure 2 Number of rotavirus-positive tests in successive birth cohorts, hospitalized patients
0 Jun Jul Aug Sep Oct Nov Dec Jan Feb Mar Apr May
Num
ber o
f rot
aviru
s-po
sitiv
e te
sts
Month
50
40
30
20
10
0
Post-Vaccine 1:
Born between 1/9/06 and 1/9/07
Post-Vaccine 2:
Born between 1/9/07 and 1/9/08
Post-Vaccine 3:
Born on/a�er 1/9/08

Exploring new ways of measuring the economic value of vaccination
86
although the numbers are small and a larger study with routine rotavirus testing would be needed to quantify the magnitude of the eff ect. The 24 positive tests in the 2008-2009 period represent 8.2% of the number of tests in the pre-vaccine period (24/293), a decrease of 7.5 percentage points.
Excluding newborn babies (aged <1 month), the number of community-acquired rotavirus infections was 722 in the pre-vaccination period in children aged ≤5 years, decreasing to 278 in the fi rst year post-vaccination (61% decrease vs pre-vaccination) and 158 in the second (78% decrease vs pre-vaccination and a further 43% decrease vs fi rst year post-vaccination). The number of nosocomial rotavirus infections in children aged ≤5 years (excluding newborn babies) decreased from 140 pre-vaccination to 75 in the fi rst year post-vaccination (46% decrease vs pre-vaccination) and 33 in the second (76% decrease vs pre-vaccination and a further 56% decrease vs fi rst-year post-vaccination).
The number of AGE-driven hospital admissions in children aged ≤2 years decreased in both the years post-vaccination compared with the pre-vaccination period (Figure 3), and the diff erence was statistically signifi cant for the second year post-vaccination compared with pre-vaccination (p=0.016). The number of AGE-related hospitalization days also decreased in the two years post-vaccination compared with pre-vaccination, with a decrease in the proportion of days accounted for by rotavirus-positive cases (Figure 3). Mean length of stay in AGE admissions was not statistically signifi cantly diff erent between the study periods (pre-vaccination 5.1 days, fi rst year post-vaccination 5.5 days, p=0.329, second year post-vaccination 5.1 days, p=0.192).
The proportion of rotavirus-positive samples in the study periods was similar in both the 9-centre and 12-centre analyses (Table 2). The same trend for a decrease from the pre-vaccination study periods to the post-vaccination study periods was observed in each of the study centers (data not shown).
Figure 3 Number of AGE-driven hospital admissions and hospitalization days in the two years pre-vaccination and the two years post-vaccination in children aged ≤2 years
Num
ber o
f hos
pita
lisat
ion
days
Num
ber o
f AG
E-dr
iven
adm
issi
ons
0 June 2004-
May 2005
June 2005-
May 2006
June 2007-
May 2008
June 2008-
May 2009
Pre-vaccine Post-vaccine
2500
2000
1500
1000
500
0
Rotavirus-positive
Rotavirus-negative
Number of AGE-driven
admissions
12000
10000
8000
6000
4000
2000
0

Chapter 3
87
Table 2 Comparison of results from the main analysis of 9 centers with complete data sets and the separate analysis including 3 additional centers with incomplete data (12 centers in total)
9 centers(356 pediatric beds)
12 centers(546 pediatric beds)
Pre-vaccinationTotal number of samples per hospital per year 351 357Number of rotavirus-positive samples per hospital per yearhospital per year
98 96
Percentage of samples rotavirus-positive 27.9% 26.9%First year post-vaccination (2007–2008)Total number of samples per hospital per year 278 366Number of rotavirus-positive samples per hospital per yearhospital per year
41 44
Percentage of samples rotavirus-positive 14.7% 12.1%Second year post-vaccination (2008–2009)Total number of samples per hospital per year 243 297Number of rotavirus-positive samples per hospital per yearhospital per year
22 27
Percentage of samples rotavirus-positive 9.1% 9.2%
DISCUSSIONBelgium was one of the earliest countries in Europe to include rotavirus vaccination in its pediatric immunization schedule, and coverage was estimated at approximately 90% in 2008.[14] This rapid uptake and high coverage means that Belgium off ered one of the fi rst opportunities in Europe for a study such as the present one to investigate the real-world eff ect of generalized rotavirus vaccination in routine practice at a national level.
Our results show that in Belgium the number and percentage of rotavirus-positive stool tests in children aged ≤5 years at the study hospitals dramatically decreased in the two years after introduction of generalized rotavirus vaccination. The seasonal peak in the winter and early spring that is characteristic of rotavirus in temperate countries,[1;20] was apparent in both the pre-vaccination years and was reduced and delayed in both the post-vaccination years. This is consistent with a reduction in rotavirus transmission, as observed in the US.[21;22] The eff ect was larger in successive birth cohorts, consistent with increasing vaccination uptake. The number of rotavirus-positive tests also fell in children aged ≥33 months, which would have been too old for vaccination when reimbursement became available.
The before-and-after design is a potential limitation of our study. Our data measure trends in rotavirus disease activity before and after the introduction of vaccination, and could therefore be infl uenced by natural fl uctuations between rotavirus seasons or changes in practice. However, the sustained reduction in rotavirus-positive tests observed in our study is more likely to have been caused by the vaccine. Moreover, a similar reduction in positive tests was observed across all the participating centers. It would be interesting to compare our fi ndings on rotavirus-positive tests with other similar practices, such as tests obtained for respiratory viral infections, and this would be a useful analysis to conduct in a subsequent follow-up study.
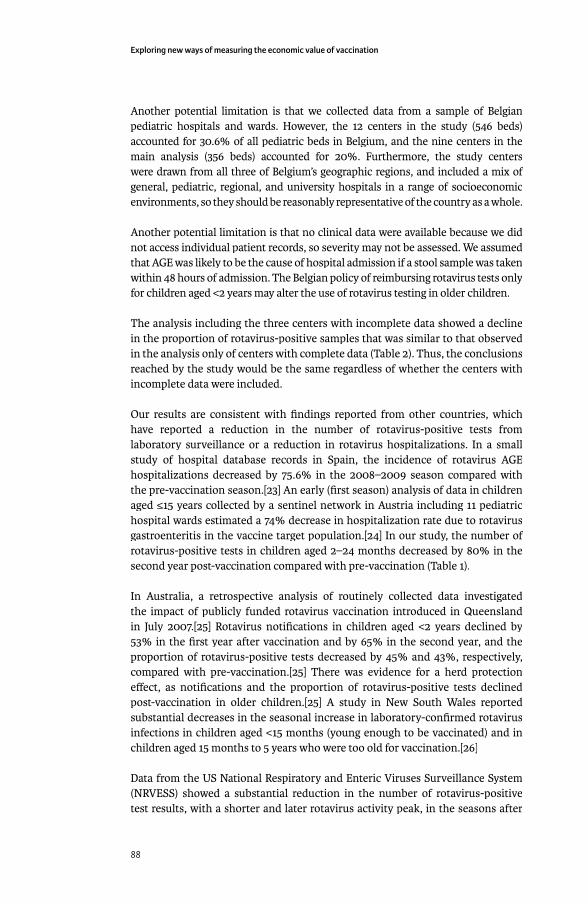
Exploring new ways of measuring the economic value of vaccination
88
Another potential limitation is that we collected data from a sample of Belgian pediatric hospitals and wards. However, the 12 centers in the study (546 beds) accounted for 30.6% of all pediatric beds in Belgium, and the nine centers in the main analysis (356 beds) accounted for 20%. Furthermore, the study centers were drawn from all three of Belgium’s geographic regions, and included a mix of general, pediatric, regional, and university hospitals in a range of socioeconomic environments, so they should be reasonably representative of the country as a whole.
Another potential limitation is that no clinical data were available because we did not access individual patient records, so severity may not be assessed. We assumed that AGE was likely to be the cause of hospital admission if a stool sample was taken within 48 hours of admission. The Belgian policy of reimbursing rotavirus tests only for children aged <2 years may alter the use of rotavirus testing in older children.
The analysis including the three centers with incomplete data showed a decline in the proportion of rotavirus-positive samples that was similar to that observed in the analysis only of centers with complete data (Table 2). Thus, the conclusions reached by the study would be the same regardless of whether the centers with incomplete data were included.
Our results are consistent with fi ndings reported from other countries, which have reported a reduction in the number of rotavirus-positive tests from laboratory surveillance or a reduction in rotavirus hospitalizations. In a small study of hospital database records in Spain, the incidence of rotavirus AGE hospitalizations decreased by 75.6% in the 2008–2009 season compared with the pre-vaccination season.[23] An early (fi rst season) analysis of data in children aged ≤15 years collected by a sentinel network in Austria including 11 pediatric hospital wards estimated a 74% decrease in hospitalization rate due to rotavirus gastroenteritis in the vaccine target population.[24] In our study, the number of rotavirus-positive tests in children aged 2–24 months decreased by 80% in the second year post-vaccination compared with pre-vaccination (Table 1).
In Australia, a retrospective analysis of routinely collected data investigated the impact of publicly funded rotavirus vaccination introduced in Queensland in July 2007.[25] Rotavirus notifi cations in children aged <2 years declined by 53% in the fi rst year after vaccination and by 65% in the second year, and the proportion of rotavirus-positive tests decreased by 45% and 43%, respectively, compared with pre-vaccination.[25] There was evidence for a herd protection eff ect, as notifi cations and the proportion of rotavirus-positive tests declined post-vaccination in older children.[25] A study in New South Wales reported substantial decreases in the seasonal increase in laboratory-confi rmed rotavirus infections in children aged <15 months (young enough to be vaccinated) and in children aged 15 months to 5 years who were too old for vaccination.[26]
Data from the US National Respiratory and Enteric Viruses Surveillance System (NRVESS) showed a substantial reduction in the number of rotavirus-positive test results, with a shorter and later rotavirus activity peak, in the seasons after
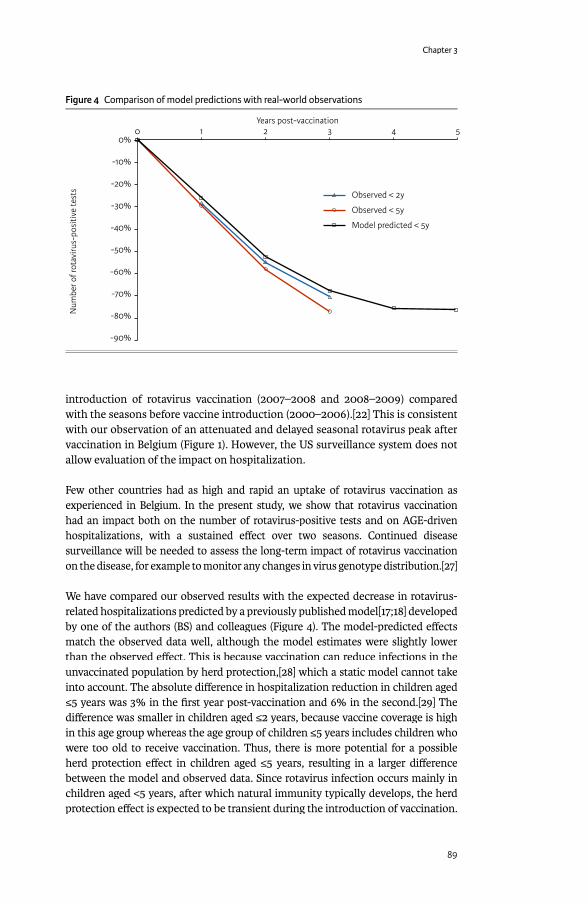
Chapter 3
89
introduction of rotavirus vaccination (2007–2008 and 2008–2009) compared with the seasons before vaccine introduction (2000–2006).[22] This is consistent with our observation of an attenuated and delayed seasonal rotavirus peak after vaccination in Belgium (Figure 1). However, the US surveillance system does not allow evaluation of the impact on hospitalization.
Few other countries had as high and rapid an uptake of rotavirus vaccination as experienced in Belgium. In the present study, we show that rotavirus vaccination had an impact both on the number of rotavirus-positive tests and on AGE-driven hospitalizations, with a sustained eff ect over two seasons. Continued disease surveillance will be needed to assess the long-term impact of rotavirus vaccination on the disease, for example to monitor any changes in virus genotype distribution.[27]
We have compared our observed results with the expected decrease in rotavirus-related hospitalizations predicted by a previously published model[17;18] developed by one of the authors (BS) and colleagues (Figure 4). The model-predicted eff ects match the observed data well, although the model estimates were slightly lower than the observed eff ect. This is because vaccination can reduce infections in the unvaccinated population by herd protection,[28] which a static model cannot take into account. The absolute diff erence in hospitalization reduction in children aged ≤5 years was 3% in the fi rst year post-vaccination and 6% in the second.[29] The diff erence was smaller in children aged ≤2 years, because vaccine coverage is high in this age group whereas the age group of children ≤5 years includes children who were too old to receive vaccination. Thus, there is more potential for a possible herd protection eff ect in children aged ≤5 years, resulting in a larger diff erence between the model and observed data. Since rotavirus infection occurs mainly in children aged <5 years, after which natural immunity typically develops, the herd protection eff ect is expected to be transient during the introduction of vaccination.
Figure 4 Comparison of model predictions with real-world observations
1 2 3 4 50
Num
ber o
f rot
aviru
s-po
sitiv
e te
sts
Years post-vaccination
0%
-10%
-20%
-30%
-40%
-50%
-60%
-70%
-80%
-90%
Observed < 2y
Observed < 5y
Model predicted < 5y
Exploring new ways of measuring the economic value of vaccination
90
When the whole population of children <5 years has been vaccinated, the eff ect of herd protection should decline towards zero, assuming that vaccine coverage in the target population remains high. The close match between our observed fi ndings and model-predicted results supports the validity of our model in Belgium, and shows that modeling can be an eff ective method for estimating the expected eff ect of preventive interventions such as vaccination.
In conclusion, this study showed that rotavirus vaccination in Belgium signifi cantly reduced rotavirus-related hospitalizations in children aged ≤5 years in the fi rst and second years after the introduction of the vaccine. This supports the results of randomized controlled trials and is an example of the substantial reduction in the burden of pediatric hospitalizations that can occur shortly after rotavirus vaccine uptake in a population. Further monitoring of the number of rotavirus infections and rotavirus-related hospitalizations over subsequent years will provide valuable data on the long-term impact of rotavirus vaccination.
ACKNOWLEDGEMENTThis study and preparation of the manuscript was funded by GlaxoSmithKline Biologicals, Belgium.
The authors would like to thank the investigators who participated in this study: Dr Stefaan Van Eldere, Imeldaziekenhuis, Bonheiden; Prof Yvan Vandenplas, UZ Brussel, Jette; Prof Eddy Bodart, Cliniques Universitaires UCL De Mont Godinne, Yvoir; Prof Jean-Paul Misson, CHR de la Citadelle, Liège; Dr Heidi Capiau, AZ Sint Lucas, Gent; Prof José Ramet, UZ Antwerpen, Edegem; Prof Gigi Veereman, Paolaziekenhuis, Antwerpen; Dr Filip Adriaens, Regional Ziekenhuis Jan Yperman, Ieper; Dr Jacques Louis, Clinique Notre Dame, Charleroi.
REFERENCES[1] Parashar UD, Bresee JS, Gentsch JR, Glass RI. Rotavirus. Emerg Infect Dis
1998;4(4):561-70.[2] Gimenez-Sanchez F, Gado-Rubio A, Martinon-Torres F, Bernaola-Iturbe
E. Multicenter prospective study analysing the role of rotavirus on acute gastroenteritis in Spain. Acta Paediatr 2010 May;99(5):738-42.
[3] Williams CJ, Lobanov A, Pebody RG. Estimated mortality and hospital admission due to rotavirus infection in the WHO European region. Epidemiol Infect 2009 May;137(5):607-16.
[4] Soriano-Gabarro M, Mrukowicz J, Vesikari T, Verstraeten T. Burden of rotavirus disease in European Union countries. Pediatr Infect Dis J 2006 Jan;25(1 Suppl):S7-S11.
[5] Raes M, Aerssens P, Alliet P, Gillis P, Verjans MP, Mewis A. Rotavirus gastroenteritis: epidemiological data from a regional hospital in Belgium. Eur J Pediatr 2008 Jan;167(1):71-3.
[6] Bilcke J, Van Damme P., De Smet F., Hanquet G, van Ranst M., Beutels P. The health and economic burden of rotavirus disease in Belgium. Eur J Pediatr 2008 Dec;167(12):1409-19.
Chapter 3
91
[7] Standaert B, Harlin O, Desselberger U. The fi nancial burden of rotavirus disease in four countries of the European Union. Pediatr Infect Dis J 2008;27(1):S20-S27.
[8] Vesikari T, Van Damme P, Giaquinto C, Gray J, Mrukowicz J, Dagan R, et al. European Society for Paediatric Infectious Diseases/European Society for Paediatric Gastroenterology, Hepatology, and Nutrition evidence-based recommendations for rotavirus vaccination in Europe: executive summary. J Pediatr Gastroenterol Nutr 2008 May;46(5):615-8.
[9] World Health Organization. Meeting of the immunization Strategic Advisory Group of Experts, April 2009--conclusions and recommendations. Wkly Epidemiol Rec 2009 Jun 5;84(23):220-36.
[10] Vesikari T, Karvonen A, Puustinen L, Zeng SQ, Szakal ED, Delem A, et al. Effi cacy of RIX4414 live attenuated human rotavirus vaccine in Finnish infants. Pediatr Infect Dis J 2004;23(10):937-43.
[11] Vesikari T, Karvonen A, Prymula R, Schuster V, Tejedor JC, Cohen R, et al. Effi cacy of human rotavirus vaccine against rotavirus gastroenteritis during the fi rst 2 years of life in European infants: randomised, double-blind controlled study. Lancet 2007;370(9601):1757-63.
[12] Vesikari T, Matson DO, Dennehy P, Van Damme P, Santosham M, Rodriguez Z, et al. Safety and effi cacy of a pentavalent human-bovine (WC3) reassortant rotavirus vaccine. N Engl J Med 2006 Jan 5;354(1):23-33.
[13] Raes M, Strens D, Vergison A, Verghote M, Standaert B. Second year post-rotavirus vaccination in Belgium: impact on rotavirus-positive stool samples in hospitalised children. 28th annual meeting, European Society for Paediatric Infectious Diseases (ESPID), Nice, France, May 4-8, 2010.
[14] Van Damme P. Early experience with routine use of rotavirus vaccines in Europe. 8th International Rotavirus Symposium, Istanbul, Turkey, June 3-4, 2008.
[15] Fruytier A, Van Schoor J, Standaert B. Vaccination with RIX4414 is cost-eff ective in a Belgian setting (abstract PIH3). Value Health 2006;9:A253.
[16] Bilcke J, Van Damme P, Beutels P. Cost-eff ectiveness of rotavirus vaccination: exploring caregiver(s) and “no medical care” disease impact in Belgium. Med Decis Making 2009;29(1):33-50.
[17] Standaert B, Parez N, Tehard B, Colin X, Detournay B. Cost-eff ectiveness analysis of vaccination against rotavirus with RIX4414 in France. Appl Health Econ Health Policy 2009;6(4):199-216.
[18] Martin A, Batty A, Roberts JA, Standaert B. Cost-eff ectiveness of infant vaccination with RIX4414 (Rotarix) in the UK. Vaccine 2009 Jul 16;27(33):4520-8.
[19] De Cauwer H, Mortelmans L, d’Orio V. Belgische ziekenhuizen onvoldoende voorbereid op pandemie. hospitals be 2009;7(2):19-24.
[20] Flem E, Vainio K, Dollner H, Midgaard C, Bosse FJ, Rognlien AG, et al. Rotavirus gastroenteritis in Norway: analysis of prospective surveillance and hospital registry data. Scand J Infect Dis 2009;41(10):753-9.
[21] Centers for Disease Control and Prevention (CDC). Delayed onset and diminished magnitude of rotavirus activity--United States, November 2007-May 2008. MMWR Morb Mortal Wkly Rep 2008 Jun 27;57(25):697-700.

Exploring new ways of measuring the economic value of vaccination
92
[22] Centers for Disease Control and Prevention (CDC). Reduction in rotavirus after vaccine introduction--United States, 2000-2009. MMWR Morb Mortal Wkly Rep 2009 Oct 23;58(41):1146-9.
[23] Gimenez-Sanchez F, Salvador-Sanchez J, Cobos-Carrascosa E, Sanchez-Yebra W, Lopez-Ruzafa E, Bonillo-Perales A. Decline in rotavirus hospitalized cases in Spain after the introduction of oral rotavirus vaccines. 27th annual meeting, European Society for Paediatric Infectious Diseases (ESPID), Brussels, Belgium, June 9-13, 2009.
[24] Paulke-Korinek M, Rendi-Wagner P, Kundi M, Kronik R, Kollaritsch H. Universal mass vaccination against rotavirus gastroenteritis: impact on hospitalization rates in Austrian children. Pediatr Infect Dis J 2010 Apr;29(4):319-23.
[25] Lambert SB, Faux CE, Hall L, Birrell FA, Peterson KV, Selvey CE, et al. Early evidence for direct and indirect eff ects of the infant rotavirus vaccine program in Queensland. Med J Aust 2009 Aug 3;191(3):157-60.
[26] Belshaw DA, Muscatello DJ, Ferson MJ, Nurkic A. Rotavirus vaccination one year on. Commun Dis Intell 2009 Sep;33(3):337-40.
[27] Zeller M, Rahman M, Heylen E, De CS, De VS, Arijs I, et al. Rotavirus incidence and genotype distribution before and after national rotavirus vaccine introduction in Belgium. Vaccine 2010 Sep 17;28(47):7507-13.
[28] Atchison C, Lopman B, Edmunds WJ. Modelling the seasonality of rotavirus disease and the impact of vaccination in England and Wales. Vaccine 2010 Apr 19;28(18):3118-26.
[29] Standaert B, Strens D, Van Bellinghen L-A, Van Vlaenderen I. Comparing the model predicted vaccine impact against rotavirus hospitalisation with observed data in Belgium. 13th Annual European Congress, International Society for Pharmacoeconomics and Outcomes Research (ISPOR), Prague, Czech Republic, November 6 to 9, 2010.
Chapter 3
93
IMPACT OF ROTAVIRUS VACCINATION ON HOSPITALISATIONS IN BELGIUM: COMPARING MODEL PREDICTIONS WITH OBSERVED DATA
Plos One, 2013, 8(1): e53864
ABSTRACT
BackgroundBackground: Published economic assessments of rotavirus vaccination typically use modelling, mainly static Markov cohort models with birth cohorts followed up to the age of 5 years. Rotavirus vaccination has now been available for several years in some countries, and data have been collected to evaluate the real-world impact of vaccination on rotavirus hospitalisations. This study compared the economic impact of vaccination between model estimates and observed data on disease-specifi c hospitalisation reductions in a country for which both modelled and observed datasets exist (Belgium).
Methods: A previously published Markov cohort model estimated the impact of rotavirus vaccination on the number of rotavirus hospitalisations in children aged <5 years in Belgium using vaccine effi cacy data from clinical development trials. Data on the number of rotavirus-positive gastroenteritis hospitalisations in children aged <5 years between 1 June 2004 and 31 May 2006 (pre-vaccination study period) or 1 June 2007 to 31 May 2010 (post-vaccination study period) were analysed from nine hospitals in Belgium and compared with the modelled estimates.
Results: The model predicted a smaller decrease in hospitalisations over time, mainly explained by two factors. First, the observed data indicated indirect vaccine protection in children too old or too young for vaccination. This herd eff ect is diffi cult to capture in static Markov cohort models and therefore was not included in the model. Second, the model included a ‘waning’ eff ect, i.e. reduced vaccine eff ectiveness over time. The observed data suggested this waning eff ect did not occur during that period, and so the model systematically underestimated vaccine eff ectiveness during the fi rst 4 years after vaccine implementation.
Conclusions: Model predictions underestimated the direct medical economic value of rotavirus vaccination during the fi rst 4 years of vaccination by approximately 10% when assessing hospitalisation rates as compared with observed data in Belgium.
INTRODUCTIONThe economic assessment of the newer rotavirus vaccines (Rotarix® [Rotarix is a registered trade mark of the GlaxoSmithKline group of companies] and Rotateq™ [Rotateq is a trademark of Merck & Co. Inc.]) at the time of their fi rst introduction in 2006 was largely model-based, in the absence of long-term data on vaccine eff ects [1-3]. Most assessments at that time used static Markov cohort models instead of dynamic models [4], which simplifi ed the model construction, the number of
Baudouin Standaert1
Jorge A Gomez2Jorge A Gomez2Jorge A Gomez
Marc Raes3Marc Raes3Marc Raes
Serge Debrus4
F Raúl Velázquez5F Raúl Velázquez5F Raúl Velázquez
Maarten J Postma6
1GlaxoSmithKline Vaccines, Wavre, Belgium
2GlaxoSmithKline Vaccines Latin America, Victoria, Buenos Aires, Argentina
3Department of Pediatrics, Jessa Hospital, Hasselt, Belgium
4GlaxoSmithKline Vaccines, Wavre, Belgium
5Medical Research Unit on Infectious Diseases, Pediatrics Hospital, National Medical Center-Century XXI, Mexican Institute of Social Security (IMSS), Mexico City, Mexico
6Unit of Pharmacoepidemiology & Pharmacoeconomics (PE2), Department of Pharmacy, University of Groningen, Groningen, The Netherlands

Exploring new ways of measuring the economic value of vaccination
94
assumptions introduced, and the data requirements [5]. Cohort models analyse the vaccine situation at epidemiological steady-state [6] when vaccination is already well established in the population at risk, children less than 5 years old in the case of rotavirus. More recently, there has been a shift towards developing more complex models for estimating the total benefi t of rotavirus vaccines because a herd eff ect after vaccination has been reported from observational data [7-10].
Observational studies have shown that rotavirus infection produces partial immunity after each exposure [11;12], with complete immunity acquired after three to four infections. This partly explains the peculiar distribution of rotavirus disease as a function of age, which forms a bell-shaped curve during the fi rst two years of the birth cohort. A Markov cohort model can replicate the natural history of rotavirus disease in a birth cohort over time, with the highest disease burden occurring in children aged between 6 months and 2 years, followed by a sharp decline up to the age of 5 years, after which natural immunity across the cohort is maintained.
The early economic models of rotavirus vaccination included much uncertainty due to the many unknowns in the data available at the time, such as the impact of rotavirus disease on quality-adjusted life-years (QALY), waning of vaccine effi cacy over time (presumed from clinical trials), and the proportion of rotavirus gastroenteritis cases who do not seek medical care [13]. Such unknowns were modelled using ‘best-guess’ baseline assumptions, tested in sensitivity analyses to evaluate their impact on the incremental cost-eff ectiveness ratio (ICER).
Among these unknowns, vaccine waning is of particular interest. Vaccine effi cacy in the cohort models was derived from clinical trial results for the rotavirus vaccines. The trials indicated higher vaccine effi cacy against rotavirus diarrhoea during the fi rst year than in subsequent years [14]. However, it should be noted that the decrease in vaccine effi cacy measured over time in the European trial was mainly due to a large reduction in rotavirus diarrhoea events reported in the non-vaccinated arm (-42%), rather than due to an increase in the numbers of events in the vaccinated arm as one would expect from vaccine waning over time. This indicated that the vaccine waning assumption in the early models should be re-examined.
The two rotavirus vaccines have now been in use for several years, and real-life data are becoming available. A few follow-up studies after vaccine introduction provide information on real-life vaccine eff ectiveness on specifi c mortality reduction in Mexico and hospitalisation rates in Brazil, US, Australia and some European countries [15-22]. It is now possible to test whether the model-predicted results presented at the time of the product launch were accurate enough to report reliable cost-eff ectiveness data. Clearly, should substantial discrepancies occur between prediction and observation, understanding the possible causes would be valuable to improve the next generation of vaccine models. Few attempts have yet been made in the published literature to compare results predicted by models at vaccine introduction with real-life data observed over time.
Chapter 3
95
Belgium provides a good opportunity to conduct such a comparison for rotavirus vaccination, as modelled estimates and observed data from a follow-up study of four years post-vaccination and two years pre-vaccination are available [18;23]. In a previous paper on the impact of rotavirus vaccination on hospitalisation in Belgium, we reported that the observed reductions in rotavirus hospitalisations after vaccine introduction were greater than those predicted by modelling [18]. In the present analysis, we have explored this discrepancy further using the most recent data from the observational study (up to four years post-vaccination) to identify potential reasons for the diff erences, and have adjusted the modelled ICER for diff erences between predicted and observed data.
METHODS
Model constructionWhen rotavirus vaccination was introduced in Belgium in 2006, a Markov cohort model, mainly based on the model published by Melliez et al. [23;24], assessed at vaccine steady-state the rate of rotavirus acute gastroenteritis (AGE) in a birth cohort by month up to the age of 5 years. The model included diff erent management options typical for the Belgian context such as staying at home, seeking medical advice from a primary care physician or a specialist, visiting the emergency room, or admission to hospital. The distribution of rotavirus AGE cases by age was constructed following a Weibull function [25]. A Weibull distribution with its shape (k = 1.5) and scale (λ= 24.2) parameters allows replication of the distribution of rotavirus disease as a function of age, infl uenced by the gradual disappearance of maternal antibodies after birth and by new rotavirus infections appearing over time that stimulate the development of natural immunity. The two parameters should be adjusted for country-specifi c data using calibration techniques specifying breastfeeding behaviour and the frequency of infection exposure over time.
Vaccine effi cacy data used in the model were taken from a European trial, which showed a decrease in eff ect over time that diff ered between mild (staying at home), moderate (seeking medical advice), and severe (hospitalised) cases [14].
For each level of disease severity, specifi c costs and utility scores were applied [23]. The model compared vaccinated and unvaccinated cohorts and allowed for changes in vaccine coverage. Herd protection was not included. The model estimated the vaccine eff ect on the number of AGE events, medical visits, emergency visits, hospitalisations and deaths in a birth cohort of children up to the age of 5 years. It also reported the overall cost, QALY impact, and ICER for vaccination compared with no vaccination.
Observational studyObservational studyA vaccine impact study was set up one year after the introduction of the rotavirus vaccine in Belgium [18;21]. Full details and the results for the fi rst two years post-vaccination (up to May 2009) have been published elsewhere [18]. Data were collected retrospectively after each rotavirus season from a sample of 12 Belgian
Exploring new ways of measuring the economic value of vaccination
96
hospitals. All children aged ≤5 years who had a rotavirus detection test performed at a participating hospital from 1 June 2004 to 31 May 2006 (pre-vaccination study period) or 1 June 2007 to 31 May 2010 (post-vaccination study period) were eligible. Only hospitalised children were included, and data were analysed for the nine centres with a complete dataset. Ethical approval was not required because there was no medical fi le consultation.
The post-vaccination study period was divided into successive years, each running from June to May (June 2007–May 2008, June 2008–May 2009 and June 2009–May 2010) to cover the winter rotavirus season. The period between 1 June 2006 and 31 May 2007 was not included in our study, because reimbursement for rotavirus vaccination was not available for the whole of this period (partial reimbursement was introduced in Belgium in November 2006 for Rotarix® and in June 2007 for RotaTeq™ [18]). Thus, although June 2006–May 2007 could be considered as the fi rst year post-vaccination, the date of reimbursement meant that it was neither fully pre-vaccination nor fully post-vaccination. In this study we therefore analysed data from the second post-vaccination year (June 2007–May 2008) onwards. For each year the number and the proportion of rotavirus-positive episodes were calculated per week. Hospitalisation was classifi ed as AGE-driven if the stool sample was collected within 48 hours of hospitalisation. The most relevant variable to compare in the pre- and post-vaccination periods is the absolute number of rotavirus-positive episodes observed, assuming no change in catchment area between the study periods for each participating hospital.
Comparison between observed and modelled dataComparison between observed and modelled dataFrom the raw observed data we fi rst calculated the frequency of hospitalisation per week for each of fi ve age groups (0-1 year; 1-2 years; 2-3 years; 3-4 years; 4-5 years) over a period of one year for the pre-vaccination period and for the second (June 2007–May 2008) and fourth (June 2009–May 2010) years post-vaccination. As the data are from a small sample, it is likely that data from a larger sample would follow a smoother distribution. This is represented by adjusting the raw frequencies to smoothed parametric curves using @RISK 5.7 software (Palisade Corporation, US). The software is an add-in program in Microsoft Excel® that uses the collected data as input variables, for which it creates a distribution expressed as a probability density function from a list of around 20 continuous parameterised distributions. Since all probability distribution functions must have a unit area, the software automatically scales the probability values so that the density curve has an area of one. The method of least squares is used to minimize the Root-Mean Square Error between the curve points and the theoretical distribution function selected (RMS Error value < 0.05 or the best Chi-squared statistics noted between the observed data and selected parametric distribution). The fi gures obtained are referred to in this paper as smoothed curves, or adjusted observational data. Because the smoothed curves are parameterised distributions, they are easier to work with when calculating values for the areas under curves.
The original modelled data were derived from a hypothetical birth cohort followed over time from birth to age 5 years, whereas the observed data were derived from
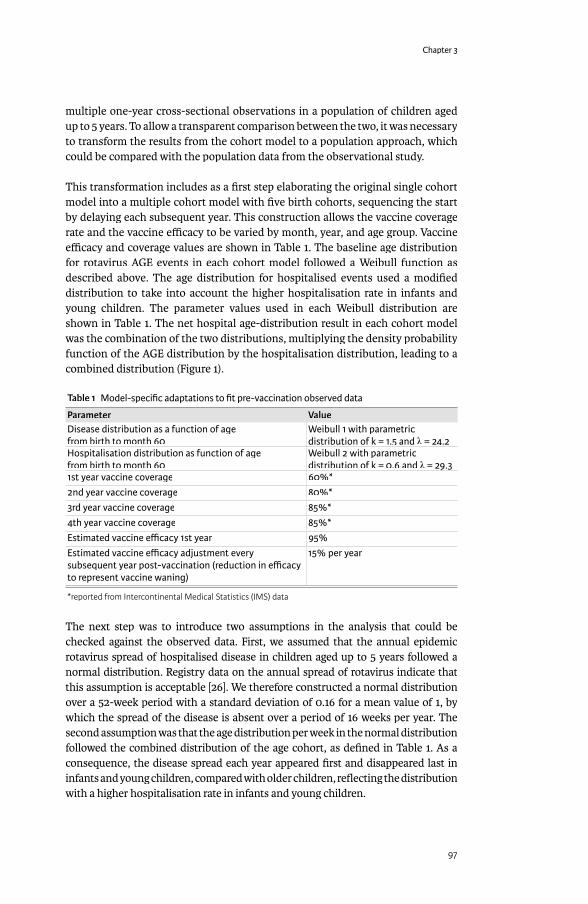
Chapter 3
97
multiple one-year cross-sectional observations in a population of children aged up to 5 years. To allow a transparent comparison between the two, it was necessary to transform the results from the cohort model to a population approach, which could be compared with the population data from the observational study.
This transformation includes as a fi rst step elaborating the original single cohort model into a multiple cohort model with fi ve birth cohorts, sequencing the start by delaying each subsequent year. This construction allows the vaccine coverage rate and the vaccine effi cacy to be varied by month, year, and age group. Vaccine effi cacy and coverage values are shown in Table 1. The baseline age distribution for rotavirus AGE events in each cohort model followed a Weibull function as described above. The age distribution for hospitalised events used a modifi ed distribution to take into account the higher hospitalisation rate in infants and young children. The parameter values used in each Weibull distribution are shown in Table 1. The net hospital age-distribution result in each cohort model was the combination of the two distributions, multiplying the density probability function of the AGE distribution by the hospitalisation distribution, leading to a combined distribution (Figure 1).
Table 1 Model-specifi c adaptations to fi t pre-vaccination observed data
Parameter ValueDisease distribution as a function of age from birth to month 60
Weibull 1 with parametric distribution of k = 1.5 and λ = 24.2λ = 24.2λ
Hospitalisation distribution as function of age from birth to month 60
Weibull 2 with parametric distribution of k = 0.6 and λ = 29.3λ = 29.3λ
1st year vaccine coverage 60%*2nd year vaccine coverage 80%*3rd year vaccine coverage 85%*4th year vaccine coverage 85%*Estimated vaccine effi cacy 1st year 95%Estimated vaccine effi cacy adjustment every subsequent year post-vaccination (reduction in effi cacy to represent vaccine waning)
15% per year
*reported from Intercontinental Medical Statistics (IMS) data
The next step was to introduce two assumptions in the analysis that could be checked against the observed data. First, we assumed that the annual epidemic rotavirus spread of hospitalised disease in children aged up to 5 years followed a normal distribution. Registry data on the annual spread of rotavirus indicate that this assumption is acceptable [26]. We therefore constructed a normal distribution over a 52-week period with a standard deviation of 0.16 for a mean value of 1, by which the spread of the disease is absent over a period of 16 weeks per year. The second assumption was that the age distribution per week in the normal distribution followed the combined distribution of the age cohort, as defi ned in Table 1. As a consequence, the disease spread each year appeared fi rst and disappeared last in infants and young children, compared with older children, refl ecting the distribution with a higher hospitalisation rate in infants and young children.

Exploring new ways of measuring the economic value of vaccination
98
This approach allowed precise measurement of diff erences between the impact of vaccination in the model construct and the observational data. Any diff erences identifi ed between the observation and the modelled results were explored to see if potential explanations could be found. Once potential explanations were identifi ed, we adjusted the model input values to be equivalent to the observed data to estimate adjusted ICERs.
RESULTSFigure 2 shows the pre-vaccination curves for adjusted observed data on the number of hospitalisation events by week and age group (Figure 2A) that were similar to the modelled results from the multiple age-cohort model (Figure 2B). As expected, the pre-vaccination peak in rotavirus hospitalisations was highest in children aged <1 year. In the observed data the peak appeared at approximately the same time of the year (Week 8) in all age groups, consistent with seasonal rotavirus spread and indicating a dependency in rotavirus transmission between age groups. The two assumptions introduced into the multiple cohort model to construct a population approach appeared to hold when comparing the distribution results of the model and the observation data. Moreover, there was close agreement between the observed and modelled numbers of rotavirus hospitalisations by age group per year for the pre-vaccination scenario (Table 2).
In the post-vaccination period, the observed data showed that the seasonal peak in rotavirus hospitalisations was reduced in magnitude and delayed (shifted to the right) in the second year after vaccine introduction for the fi rst two age groups, with further reduction and delay in the fourth year across all age groups (Figure 3A-D).
Figure 1 Probability density functions for defi ning hospitalisation rate as a function of age (pre-vaccination)
0.1
0.09
0.08
0.07
0.06
0.05
0.04
0.03
0.02
0.01
0
0.04
0.035
0.03
0.025
0.02
0.015
0.01
0.005
00 1 4 7 10 16 22 28 34 40 46 52 58
Prob
abili
ty d
ensi
ty h
ospi
talis
atio
n
Prob
abili
ty d
ensi
ty d
iarr
hoea
Age (months)
Hospitalisation
Combined
Diarrhoea events
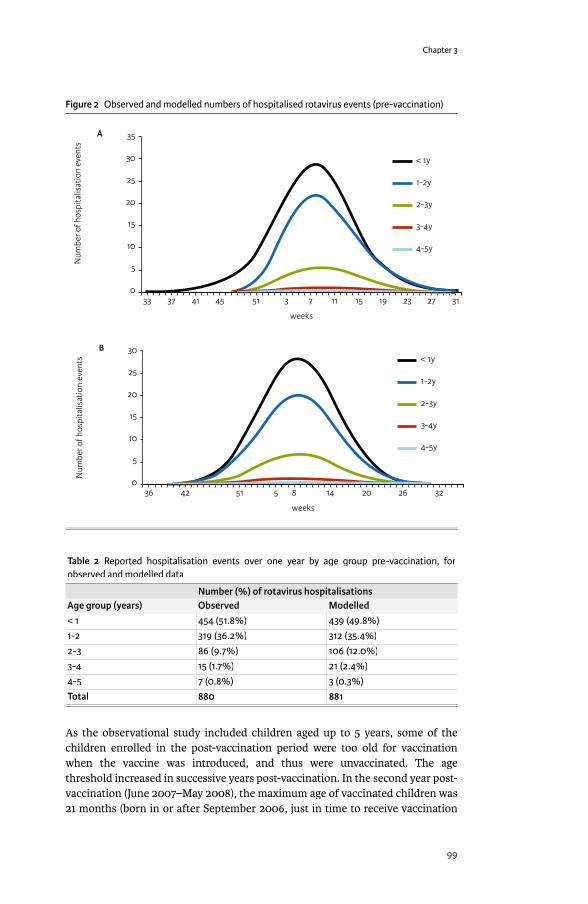
Chapter 3
99
Table 2 Reported hospitalisation events over one year by age group pre-vaccination, for observed and modelled data
Number (%) of rotavirus hospitalisationsAge group (years) Observed Modelled< 1 454 (51.8%) 439 (49.8%)1-2 319 (36.2%) 312 (35.4%)2-3 86 (9.7%) 106 (12.0%)3-4 15 (1.7%) 21 (2.4%)4-5 7 (0.8%) 3 (0.3%)Total 880 881
As the observational study included children aged up to 5 years, some of the children enrolled in the post-vaccination period were too old for vaccination when the vaccine was introduced, and thus were unvaccinated. The age threshold increased in successive years post-vaccination. In the second year post-vaccination (June 2007–May 2008), the maximum age of vaccinated children was 21 months (born in or after September 2006, just in time to receive vaccination
Figure 2 Observed and modelled numbers of hospitalised rotavirus events (pre-vaccination)
35
30
25
20
15
10
5
033 37 41 45 51 3 7 11 15 23 27 3119
Num
ber o
f hos
pita
lisat
ion
even
ts
weeks
A
< 1y
1-2y
2-3y
3-4y
4-5y
30
25
20
15
10
5
042 51 5 8 14 20 26 32
Num
ber o
f hos
pita
lisat
ion
even
ts
weeks
< 1y
1-2y
2-3y
3-4y
4-5y
B
36
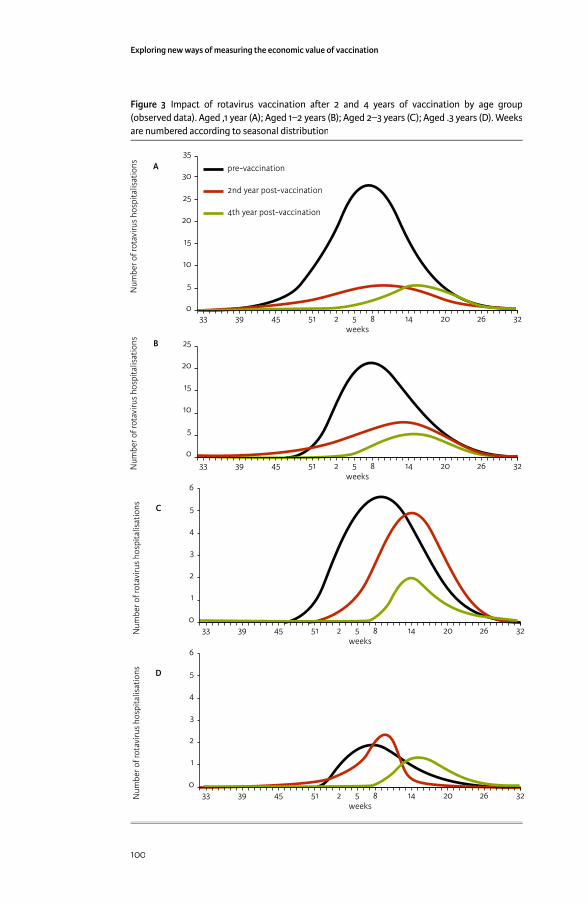
Exploring new ways of measuring the economic value of vaccination
100
Figure 3 Impact of rotavirus vaccination a� er 2 and 4 years of vaccination by age group (observed data). Aged ,1 year (A); Aged 1–2 years (B); Aged 2–3 years (C); Aged .3 years (D). Weeks are numbered according to seasonal distribution
weeks
pre-vaccination
2nd year post-vaccination
4th year post-vaccination
35
30
25
20
15
10
5
045 51 52 8 14 20 26 323933
Num
ber o
f rot
aviru
s ho
spita
lisat
ions A
25
20
15
10
5
0
Num
ber o
f rot
aviru
s ho
spita
lisat
ions
45 51 52 8 14 20 26 323933weeks
B
Num
ber o
f rot
aviru
s ho
spita
lisat
ions
45 51 52 8 14 20 26 323933
6
5
4
3
2
1
0
weeks
C
Num
ber o
f rot
aviru
s ho
spita
lisat
ions D
45 51 52 8 14 20 26 323933
6
5
4
3
2
1
0
weeks

Chapter 3
101
after reimbursement of the fi rst rotavirus vaccine product in November 2006, and included in the last month of that study year in May 2008), and in the fourth year post-vaccination (June 2009–May 2010) the maximum age of vaccinated children was 45 months (born in or after September 2006 and included in the last month of that study year in May 2010). The reduction in hospitalisations post-vaccination compared with pre-vaccination observed in the age groups who were too old to be vaccinated (Table 3), indicated that the vaccine had an indirect protective eff ect.
Table 3 Observed and modelled data pre- and post-vaccination by year and age group
Post-vaccination % reduction from pre-vaccination Age group (years) Pre-vaccination Year 2 Year 4 Adjusted Year 2 Year 4 AdjustedObserved
<1 454 125 77 72% 83%1-2 319 164 72 49% 77%2-3 86 61 17 29% 80%3-4 15 9 10 40% 33%4-5 7 9 3 -29% 57%Total 880 368 179 58% 80%Modelled
<1 439 146 127 127 67% 71% 71%1-2 312 161 111 73 48% 64% 77%2-3 106 106 48 29 0% 55% 73%3-4 21 21 11 7 0% 48% 67%4-5 3 3 3 3 0% 0% 0%Total 881 437 300 239 50% 66% 73%
Number of rotavirus hospitalisations from observed and modelled data. Adjusted data refer to modelled data with vaccine waning removed from the model (i.e. assuming that vaccine effi cacy is the same in subsequent years as in the fi rst year)
There is a second group of children ineligible for vaccination, those too young to receive the vaccine (aged up to 2 months). The number of observed rotavirus gastroenteritis events in this age group also declined in the years after vaccine introduction (Table 4) (Chi-square-test for trend, p <0.01). The results indicated that a herd protection eff ect may also occur in children too young for vaccination, due to reduced transmission of natural rotavirus infection after vaccine introduction.
Table 4 Rotavirus hospitalisations pre- and post-vaccination in infants < 3 months old
Number of rotavirus hospitalisationsAge group Pre-vaccination Post-vaccination
2nd year2nd yearPost-vaccination3rd year3rd year
Post-vaccination4th year4th year
0-1 month 18 12 4 61-2 month 46 8 13 112-3 month 38 23 14 6
(Chi-square for trend: p <0.001).
The overall herd eff ect that occurred in real life was not included in the model. But the more rapid decrease in hospitalisations in the observed data, compared with the model, is also noteworthy because the model assumed a decrease in vaccine effi cacy year on year (Table 1), which was not apparent in the observed data. In
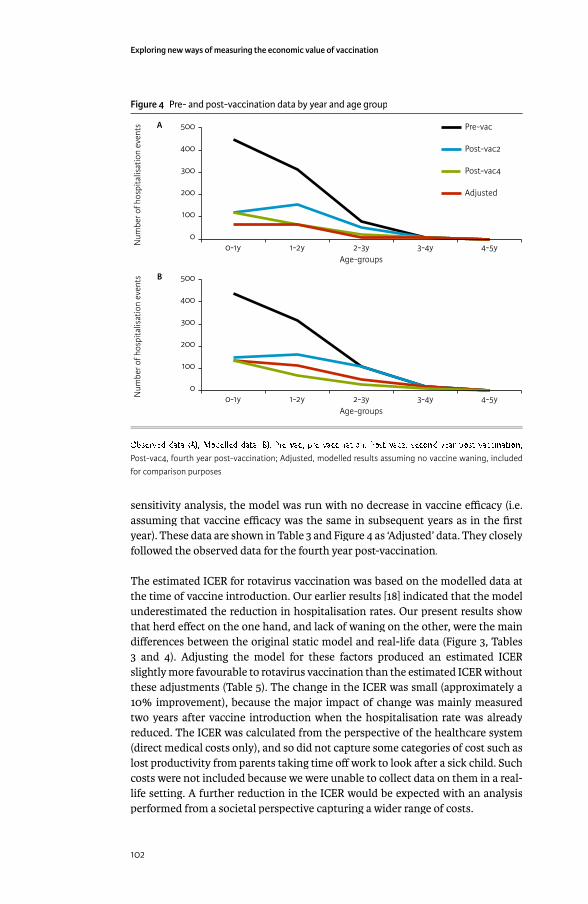
Exploring new ways of measuring the economic value of vaccination
102
sensitivity analysis, the model was run with no decrease in vaccine effi cacy (i.e. assuming that vaccine effi cacy was the same in subsequent years as in the fi rst year). These data are shown in Table 3 and Figure 4 as ‘Adjusted’ data. They closely followed the observed data for the fourth year post-vaccination.
The estimated ICER for rotavirus vaccination was based on the modelled data at the time of vaccine introduction. Our earlier results [18] indicated that the model underestimated the reduction in hospitalisation rates. Our present results show that herd eff ect on the one hand, and lack of waning on the other, were the main diff erences between the original static model and real-life data (Figure 3, Tables 3 and 4). Adjusting the model for these factors produced an estimated ICER slightly more favourable to rotavirus vaccination than the estimated ICER without these adjustments (Table 5). The change in the ICER was small (approximately a 10% improvement), because the major impact of change was mainly measured two years after vaccine introduction when the hospitalisation rate was already reduced. The ICER was calculated from the perspective of the healthcare system (direct medical costs only), and so did not capture some categories of cost such as lost productivity from parents taking time off work to look after a sick child. Such costs were not included because we were unable to collect data on them in a real-life setting. A further reduction in the ICER would be expected with an analysis performed from a societal perspective capturing a wider range of costs.
Figure 4 Pre- and post-vaccination data by year and age group
500
400
300
200
100
0
Num
ber o
f hos
pita
lisat
ion
even
ts
4-5y3-4y2-3y1-2y0-1yAge-groups
A Pre-vac
Post-vac2
Post-vac4
Adjusted
500
400
300
200
100
0
Num
ber o
f hos
pita
lisat
ion
even
ts
Age-groups
B
4-5y3-4y2-3y1-2y0-1y
Observed data (A); Modelled data (B). Pre-vac, pre-vaccination; Post-vac2, second year post-vaccination; Post-vac4, fourth year post-vaccination; Adjusted, modelled results assuming no vaccine waning, included for comparison purposes
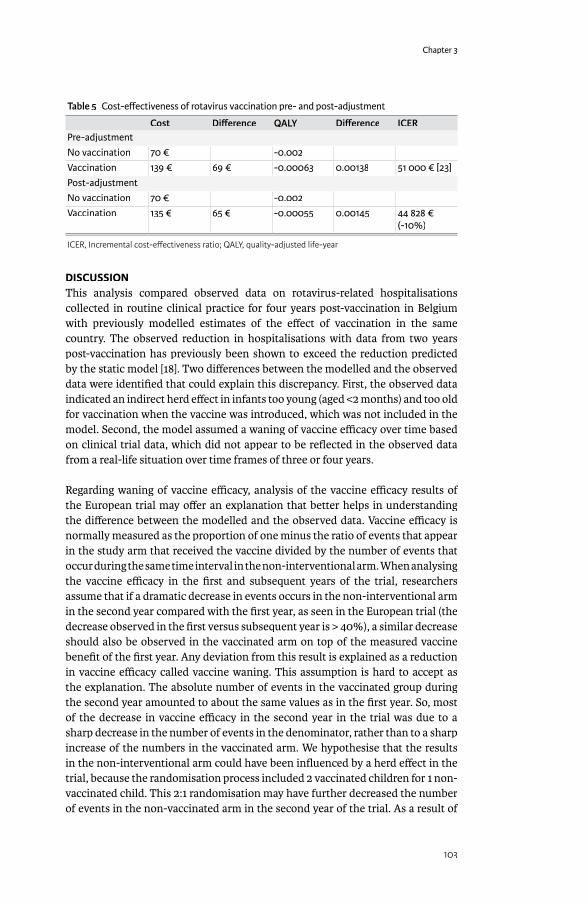
Chapter 3
103
Table 5 Cost-eff ectiveness of rotavirus vaccination pre- and post-adjustment
Cost Diff erence QALY Diff erence ICERPre-adjustment No vaccination 70 € -0.002Vaccination 139 € 69 € -0.00063 0.00138 51 000 € [23]Post-adjustmentNo vaccination 70 € -0.002Vaccination 135 € 65 € -0.00055 0.00145 44 828 €
(-10%)
ICER, Incremental cost-eff ectiveness ratio; QALY, quality-adjusted life-year
DISCUSSIONThis analysis compared observed data on rotavirus-related hospitalisations collected in routine clinical practice for four years post-vaccination in Belgium with previously modelled estimates of the eff ect of vaccination in the same country. The observed reduction in hospitalisations with data from two years post-vaccination has previously been shown to exceed the reduction predicted by the static model [18]. Two diff erences between the modelled and the observed data were identifi ed that could explain this discrepancy. First, the observed data indicated an indirect herd eff ect in infants too young (aged <2 months) and too old for vaccination when the vaccine was introduced, which was not included in the model. Second, the model assumed a waning of vaccine effi cacy over time based on clinical trial data, which did not appear to be refl ected in the observed data from a real-life situation over time frames of three or four years.
Regarding waning of vaccine effi cacy, analysis of the vaccine effi cacy results of the European trial may off er an explanation that better helps in understanding the diff erence between the modelled and the observed data. Vaccine effi cacy is normally measured as the proportion of one minus the ratio of events that appear in the study arm that received the vaccine divided by the number of events that occur during the same time interval in the non-interventional arm. When analysing the vaccine effi cacy in the fi rst and subsequent years of the trial, researchers assume that if a dramatic decrease in events occurs in the non-interventional arm in the second year compared with the fi rst year, as seen in the European trial (the decrease observed in the fi rst versus subsequent year is > 40%), a similar decrease should also be observed in the vaccinated arm on top of the measured vaccine benefi t of the fi rst year. Any deviation from this result is explained as a reduction in vaccine effi cacy called vaccine waning. This assumption is hard to accept as the explanation. The absolute number of events in the vaccinated group during the second year amounted to about the same values as in the fi rst year. So, most of the decrease in vaccine effi cacy in the second year in the trial was due to a sharp decrease in the number of events in the denominator, rather than to a sharp increase of the numbers in the vaccinated arm. We hypothesise that the results in the non-interventional arm could have been infl uenced by a herd eff ect in the trial, because the randomisation process included 2 vaccinated children for 1 non-vaccinated child. This 2:1 randomisation may have further decreased the number of events in the non-vaccinated arm in the second year of the trial. As a result of

Exploring new ways of measuring the economic value of vaccination
104
this observed evidence – a large imbalance in the number of events observed over time in the non-vaccinated arm – the true vaccine effi cacy measured in the trial may be an underestimate compared with vaccine eff ectiveness observed in real life, as seen here in the impact study results. It is of interest that the decrease in the subsequent year seen in the 2:1 randomised trial (>40%) was greater than that observed in a 1:1 randomised trial of rotavirus vaccination conducted in the US, where the reduction from the fi rst year to the second was approximately 15% [27].
Even if we introduce a correction into the model by excluding the waning scenario (adjusted results in Table 3), the model still underestimates the total vaccine benefi t, mainly because of the indirect protection in infants too young to be vaccinated (aged <2 months). This can be seen in Figure 4, where the change in number of hospitalisations between pre-vaccination and the second and fourth years post-vaccination in children aged <1 year was considerably larger in the observed data (Figure 4A) than in the modelled data (Figure 4B). The indirect vaccine effi cacy seen in these very young infants is likely to remain at steady-state level. This analysis also provides indirect information about rotavirus transmission in children. Since rotavirus vaccination appeared to have an indirect protective eff ect on young infants, our results suggest that children in the age range eligible for vaccination can infect younger children.
If vaccination alters the natural transmission of rotavirus in the population outside the at-risk group, it is possible that an age-shift of rotavirus disease could occur, as predicted by dynamic models [7]. However, if the wild-type rotavirus still circulates in the whole population, allowing reinfection and boosting of natural immunity, age-shifts of rotavirus disease may be less likely to happen after introducing vaccination.
Figure 5 Natural immunity and immune response a� er vaccination, showing the net eff ect of vaccination (arrow line)
1
0.9
0.8
0.7
0.6
0.5
0.4
0.3
0.2
0.1
01 7 13 19 25 31 37 43 49 55
Cum
ulat
ive
Imm
unity
Age (months)
Natural immunity
Immune response a�er vaccination
Chapter 3
105
It is not yet known how rotavirus vaccination will aff ect rotavirus transmission. It is, however, likely that reported observations over longer time periods will see less important herd eff ects per year than observed here as soon as the whole at-risk population (children aged <5 years) has been vaccinated.
Our analysis of the observed data suggests that no reduction in vaccine effi cacy (vaccine waning) occurred in real life during the fi rst 4 years. It is known that subjects repeatedly exposed to rotavirus gradually build up natural immunity over time. This has been well illustrated by Velazquez and colleagues [28] and others [29]. The observed age-related disease pattern (more cases in young children than in older ones) refl ects this immunity build-up, together with other factors that could aff ect exposure such as behaviour changes. Therefore the eff ect measured in a clinical trial is not only the vaccination eff ect, but is a diff erence between vaccinated and unvaccinated groups (which can be called a net eff ect) (Figure 5). As natural immunity develops over time in the non-vaccinated group, the net eff ect would change over time, and that could be mistakenly interpreted as vaccine waning. Herd protection eff ects could infl uence the change in net eff ect as natural immunity would be larger in its absence (because exposure to the virus would be larger).
The results presented in this paper indicate that the ICER estimated from the model for vaccination versus no vaccination, using vaccine effi cacy results from randomised controlled trials, may have underestimated the benefi t of rotavirus vaccination. Adjusting for that diff erence would result in a model outcome more closely related to the observed data. The eff ect is marginal from a healthcare system perspective, as the benefi t is mainly seen after two years of vaccine exposure when hospitalisation rates are already low. However, it may have a larger impact on the ICER considered from a societal perspective. We conducted a simulation exercise to explore the potential eff ect if the reduction in hospitalisations observed in this study were also to occur across the whole disease management area of non-hospital medical visits and indirect costs. If non-hospital medical visits and indirect costs are reduced by the same amount as observed for hospitalisations, the ICER results estimated by the model would improve by >30%. Collecting real-life data on non-hospital medical visits and indirect costs to test this prediction would be a valuable area for future research. This fi nding will of course be country-specifi c, depending on the specifi c disease management programmes in place and whether the economic assessment is conducted after reaching the steady-state level.
In conclusion, it is likely that previously published economic models underestimated the total benefi t of rotavirus vaccination, by not including an estimate of herd protection and by including a vaccine waning eff ect that was not refl ected in real-life conditions during the fi rst 4 years of vaccine introduction. These fi ndings could be applicable in other disease areas in which natural immunity develops over time as a result of regular exposure to the infectious agent, although this is not often observed. Static cohort models have major diffi culties in capturing such eff ects and may therefore underestimate the total benefi t of vaccines when introduced in children.
Exploring new ways of measuring the economic value of vaccination
106
REFERENCES[1] Standaert B, Parez N, Tehard B, Colin X, Detournay B. Cost-eff ectiveness
analysis of vaccination against rotavirus with RIX4414 in France. Appl Health Econ Health Policy 2009;6(4):199-216.
[2] Martin A, Batty A, Roberts JA, Standaert B. Cost-eff ectiveness of infant vaccination with RIX4414 (Rotarix) in the UK. Vaccine 2009 Jul 16;27(33):4520-8.
[3] Rozenbaum MH, Mangen MJ, Giaquinto C, Wilschut JC, Hak E, Postma MJ. Cost-eff ectiveness of rotavirus vaccination in the Netherlands; the results of a consensus model. BMC Public Health 2011;11:462.
[4] Jit M, Bilcke J, Mangen MJ, Salo H, Melliez H, Edmunds WJ, et al. The cost-eff ectiveness of rotavirus vaccination: Comparative analyses for fi ve European countries and transferability in Europe. Vaccine 2009 Oct 19;27(44):6121-8.
[5] Dewar DM. Essentials of Health Economics. 1st ed. Burlington, MA: Jones & Bartlett Learning; 2009.
[6] Garnett GP. An introduction to mathematical models in sexually transmitted disease epidemiology. Sex Transm Infect 2002 Feb;78(1):7-12.
[7] Atchison C, Lopman B, Edmunds WJ. Modelling the seasonality of rotavirus disease and the impact of vaccination in England and Wales. Vaccine 2010 Apr 19;28(18):3118-26.
[8] Atkins KE, Shim E, Pitzer VE, Galvani AP. Impact of rotavirus vaccination on epidemiological dynamics in England and Wales. Vaccine 2012 Jan 11;30(3):552-64.
[9] Lopman BA, Curns AT, Yen C, Parashar UD. Infant rotavirus vaccination may provide indirect protection to older children and adults in the United States. J Infect Dis 2011 Oct 1;204(7):980-6.
[10] Van Eff elterre T, Soriano-Gabarro M, Debrus S, Newbern E.C., Gray J. A mathematical model of the indirect eff ects of rotavirus vaccination. Epidemiol Infect 2010 Jun;138(6):884-97.
[11] Desselberger U, Huppertz HI. Immune responses to rotavirus infection and vaccination and associated correlates of protection. J Infect Dis 2011 Jan 15;203(2):188-95.
[12] Velazquez FR. Protective eff ects of natural rotavirus infection. Pediatr Infect Dis J 2009 Mar;28(3 Suppl):S54-S56.
[13] Bilcke J, Beutels P. Reviewing the cost eff ectiveness of rotavirus vaccination: the importance of uncertainty in the choice of data sources. Pharmacoeconomics 2009;27(4):281-97.
[14] Vesikari T, Karvonen A, Prymula R, Schuster V, Tejedor JC, Cohen R, et al. Effi cacy of human rotavirus vaccine against rotavirus gastroenteritis during the fi rst 2 years of life in European infants: randomised, double-blind controlled study. Lancet 2007;370(9601):1757-63.
[15] Richardson V, Hernandez-Pichardo J, Quintanar-Solares M, Esparza-Aguilar M, Johnson B, Gomez-Altamirano CM, et al. Eff ect of rotavirus vaccination on death from childhood diarrhea in Mexico. N Engl J Med 2010 Jan 28;362(4):299-305.
[16] do Carmo GM, Yen C, Cortes J, Siqueira AA, de Oliveira WK, Cortez-Escalante JJ, et al. Decline in diarrhea mortality and admissions after routine childhood rotavirus immunization in Brazil: a time-series analysis. PLoS Med 2011 Apr;8(4):e1001024.
Chapter 3
107
[17] Tate JE, Cortese MM, Payne DC, Curns AT, Yen C, Esposito DH, et al. Uptake, impact, and eff ectiveness of rotavirus vaccination in the United States: review of the fi rst 3 years of postlicensure data. Pediatr Infect Dis J 2011 Jan;30(1 Suppl):S56-S60.
[18] Raes M, Strens D, Vergison A, Verghote M, Standaert B. Reduction in pediatric rotavirus-related hospitalizations after universal rotavirus vaccination in Belgium. Pediatr Infect Dis J 2011 Mar 23;30(7):120-5.
[19] Paulke-Korinek M, Rendi-Wagner P, Kundi M, Kronik R, Kollaritsch H. Universal mass vaccination against rotavirus gastroenteritis: impact on hospitalization rates in Austrian children. Pediatr Infect Dis J 2010 Apr;29(4):319-23.
[20] Quintanar-Solares M, Yen C, Richardson V, Esparza-Aguilar M, Parashar UD, Patel MM. Impact of rotavirus vaccination on diarrhea-related hospitalizations among children < 5 years of age in Mexico. Pediatr Infect Dis J 2011 Jan;30(1 Suppl):S11-S15.
[21] Raes M, Strens D, Vergison A, Verghote M, Standaert B. Third year post-rotavirus vaccination in Belgium: impact on rotavirus-positive stool samples in hospitalised children. Presented at European Society for Paediatric Infectious Diseases (ESPID) 29th annual meeting, The Hague, Netherlands, 7-11 June 2011 2011 [cited 2012 Jun 15]Available from: URL: http://www.kenes.com/espid2011/http://www.kenes.com/espid2011/cd/pdf/O118.pdfcd/pdf/O118.pdf
[22] Buttery JP, Lambert SB, Grimwood K, Nissen MD, Field EJ, Macartney KK, et al. Reduction in rotavirus-associated acute gastroenteritis following introduction of rotavirus vaccine into Australia’s National Childhood vaccine schedule. Pediatr Infect Dis J 2011 Jan;30(1 Suppl):S25-S29.
[23] Fruytier A, Van Schoor J, Standaert B. Vaccination with RIX4414 is cost-eff ective in a Belgian setting (abstract PIH3). Value Health 2006;9:A253.
[24] Melliez H, Boelle PY, Baron S, Mouton Y, Yazdanpanah Y. Morbidite et cout des infections a rotavirus en France [Morbidity and cost of rotavirus infections in France]. Med Mal Infect 2005;35(10):492-9.
[25] Standaert B, Harlin O, Desselberger U. The fi nancial burden of rotavirus disease in four countries of the European Union. Pediatr Infect Dis J 2008;27(1):S20-S27.
[26] Harris JP, Jit M, Cooper D, Edmunds WJ. Evaluating rotavirus vaccination in England and Wales. Part I. Estimating the burden of disease. Vaccine 2007;25(20):3962-70.
[27] Vesikari T, Matson DO, Dennehy P, Van Damme P, Santosham M, Rodriguez Z, et al. Safety and effi cacy of a pentavalent human-bovine (WC3) reassortant rotavirus vaccine. N Engl J Med 2006 Jan 5;354(1):23-33.
[28] Velazquez FR, Matson DO, Calva JJ, Guerrero L, Morrow AL, Carter-Campbell S, et al. Rotavirus infections in infants as protection against subsequent infections. N Engl J Med 1996;335(14):1022-8.
[29] Fischer TK, Valentiner-Branth P, Steinsland H, Perch M, Santos G, Aaby P, et al. Protective immunity after natural rotavirus infection: a community cohort study of newborn children in Guinea-Bissau, west Africa. J Infect Dis 2002 Sep 1;186(5):593-7.

Exploring new ways of measuring the economic value of vaccination
108
MEDIUM- TO LONG-TERM IMPACT OF ROTAVIRUS VACCINATION ON HOSPITAL CARE IN BELGIUM: 7-YEAR FOLLOW-UP PERIOD OF ROTABIS (ROTAVIRUS BELGIUM IMPACT STUDY)ROTAVIRUS BELGIUM IMPACT STUDY)ROTAVIRUS BELGIUM IMPACT STUDY WITH PROJECTIONS.
Submi� ed to BMC Health Services Research, 20 March 2015
ABSTRACT
BackgroundBackground: Rotavirus vaccination has been introduced in Belgium since 2006. A sharp decline in hospitalisations was observed during the fi rst years after vaccine introduction with the high uptake it had (>85%). Our study objective is to investigate whether this hospital decline is maintained and to simulate projections.
Methods: The Rotavirus Belgium Impact Study (RotaBIS) allows an analysis of rotavirus vaccine impact amongst children in 11 hospitals in Belgium over a 9 year period (2005-2013) with 2 years pre- and 7 years post-vaccine introduction. Results are compared by year and by subsequent birth cohort aging up to 5 years. The 2 diff erent analysis methods help dismantling the diff erent (direct and indirect) eff ects of vaccine protection to simulate future hospitalisation trends.
Results: During the whole observation period 40,552 rotavirus detection tests were performed of which 5,832 were positive (14.4%). After rotavirus vaccine introduction a signifi cant reduction in number of tests performed (-35%) was combined with a dramatic drop in numbers of positive test results (-76%). The decreases were spectacular during the fi rst two years of vaccine introduction but after that the decrease fl attens. Comparing cross-sectional with cohort data it shows that the initial drop was heavily infl uenced by the herd eff ect of the vaccine. Cohort analysis demonstrates a low rate of residual disease over time suggesting another infection source than the child population.
Conclusions: Residual disease will be maintained in the community when a same vaccination strategy is continued over time starting vaccination of children only at 6 weeks’ time.
Keywords: rotavirus, vaccination, gastroenteritis, hospitalization, children
INTRODUCTIONRotavirus (RV) infection is the most common cause of diarrhea in young children less than 5 years old across the world [1;2]. The infection has a seasonal epidemic spread in temperate climates with a much higher frequency during the winter [3-5]. Severe consequences of RV gastroenteritis (RVGE) are more often observed in children under the age of 2 years, after which a dramatic drop in the number of diarrhea events is noticed [6]. After the age of 5 years, children have normally acquired a natural immunity so that RV diarrhea is seldom reported [7-9].
B Standaert*
D Strens°
A Alwan°°
M Raes**
*GSK Vaccines, Wavre, Belgium °Realidat, Vilvoorde, Belgium
°°Medstat, Brasschaat, Belgium**Jesse ZIekenhuis,
Hasselt, Belgium

Chapter 3
109
RVGE is very contagious and therefore its spread remains diffi cult to control even with rigorous application of primary hygienic measures [10]. As a result, the RVGE epidemic is a well-known annually recurring public health problem. In Belgium for instance, before the introduction of the vaccine, it was causing a disease burden of around 70,000-75,000 diarrhea events per year in children under the age of 7 years [11;12]. But the RV infection has some interesting features that make the contagion quite unique. RV immunity is built up by successive infection exposures of which the fi rst one is the most severe leading to acute symptoms but the following ones are progressively less severe [9;13].
To reduce this public health burden a radical change in disease management should be considered such as the early stimulation of infants’ immunity between the ages of 6 and 10 weeks, thus providing protection while still being regularly exposed to the virus. This new management strategy uses RV vaccines, which have been available in Europe since 2006 for a two-dose vaccine, Rotarix™ (GlaxoSmithKline Vaccines, Rixensart, Belgium), and since 2007 for a three-dose vaccine, Rotateq® (Merck and Co. Inc, Whitehouse Station, New Jersey, United States). The fi rst dose of the vaccine can be administered from 6 weeks of age, with a minimum interval of 4 weeks between subsequent doses [14;15]. To date, only a few countries in Europe have taken the advantage of the vaccine availability to start reimbursement or to make the vaccine accessible through tenders. Four countries in Western Europe introduced the RV vaccine into their routine immunization schedules soon after the vaccine became available: Austria, Belgium, Finland and Luxemburg [16]. By February 2014, national universal RV vaccination recommendation had been implemented in a few additional countries, including Estonia, Germany, Norway, and the United Kingdom (UK) [17].
Studies from Austria [18;19], Finland [20] and Belgium [21-23] have reported quite impressive reductions in hospitalizations 2-3 years after vaccine introduction combined with a vaccine herd eff ect. The medium- to long-term eff ect of the vaccine within the same at-risk group has not often been reported [24;25]. In the study presented here we report about results of Belgium where the vaccine uptake was very high from start (>85% fi rst year) and where cohorts of children ≤5 years of age were followed from 2005 through 2013 (2 pre-vaccination and 7 post-vaccination years) [26]. Such a long follow-up period should help in better understanding how the vaccine is working in real life conditions. For instance we hypothesize that if there is only one infection source (the children themselves) and the vaccine eff ectiveness remains the same together with a well-maintained high vaccine uptake (>85%), the reduction in RVGE hospitalization rate should continuously decrease year after year leading to an elimination of the disease very soon. This suggestion can now be tested by analyzing the number of hospitalizations seen and expected by year and in each birth cohort over time, and by comparing the diff erences. If there are major deviations between expected and observed results, the shape of the curve could help identifying a likely reason for the diff erence. Sources of curve deviation could include another source of infection not aff ected by the vaccine, vaccine waning, variable vaccine coverage rate, selection bias among some of the participating centers, or a combination of the diff erent reasons.
Exploring new ways of measuring the economic value of vaccination
110
MATERIAL AND METHODS
Data sourceRetrospective hospital database analyses were conducted at the same 11 hospitals in Belgium over an observation period of 9 years (2005-2013). Nine were general hospitals with a pediatric ward and two were pediatric only hospitals. In addition 4 of the 11 centers were university hospitals. The centers were distributed across the country and covered the three regions of Brussels, Flanders and Wallonia. All the centers had combined around 500 pediatric beds, representing 17% of the total of 2,750 pediatric beds in Belgium.
Each participating center provided information on the laboratory assays used to detect RV. We collected in each center the following information: center code; children’s date of birth; children’s age; gender; date of sampling; RV test results (negative, positive); outcome (ambulant or hospitalized); date of hospital admission and discharge; and length of hospital stay in days. The data were pooled anonymously before any analysis occurred. Ethical approval for the study was obtained from each participating hospital, each year we collected the data.
All children aged ≤5 years old who had a RV detection test performed at one of the participating centers from January 1, 2005 to May 31, 2013 were eligible for inclusion in the current analysis. The pre-vaccination study period was defi ned as from January 1, 2005 to December 31, 2006. The period from January 1, 2007 to May 31, 2013 was considered as the post-vaccination period (reimbursement of the vaccine was introduced in November 2006). The number of tests performed and the proportion of RV-positive test results were calculated for each participating center, per month, per year and for 7 diff erent age groups (≤2 months, >2–12 months, >12 months–2 years, >2–3 years, >3–4 years, >4–5 years, >5 years). Children aged <12 months were subdivided into two groups (≤2 months and >2–12 months) because the former group was too young for vaccination but could experience a herd protection eff ect once the vaccine is introduced.
Data analysisData analysis
The data are analysed in two diff erent ways:• cross-sectional by year: the number of hospitalizations during the epidemic
period of each year (January until the end of May) for the 7 age-groups during the period 2005–2013 is summed up and reported annually. The data are compared by age-group and overall per year: pre-vaccination versus post-vaccination (1st
year, 2nd year, nnd year… 7th year post-vaccination).
• by birth cohort followed over time: the number of hospitalizations during the epidemic period is noted in the birth cohort for the fi rst and for each subsequent year of that cohort until the children are getting 5 years old. The results are summed up by year for each birth cohort and for the total follow-up period. The results are compared by subsequent birth cohorts. Using this approach, we could report 3 vaccinated subsequent birth cohorts getting 5 years old and 5
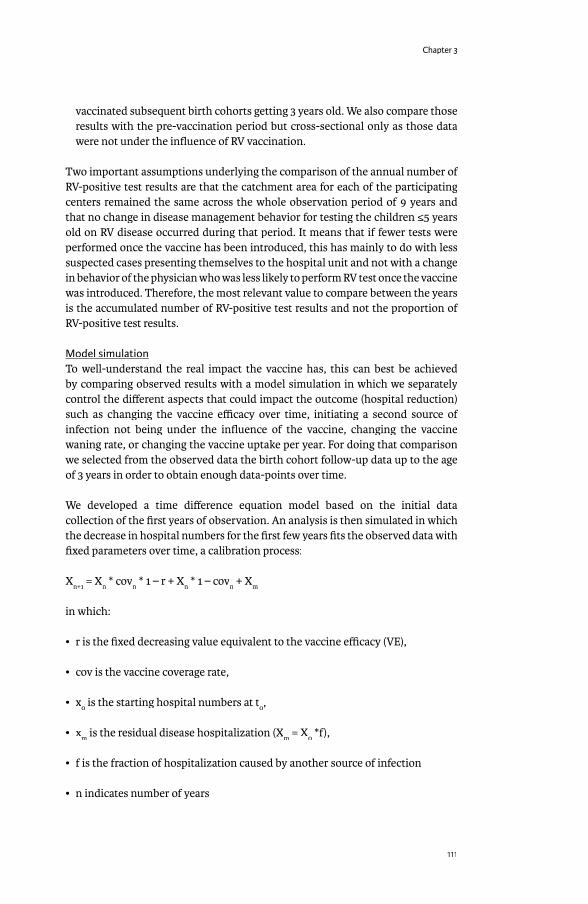
Chapter 3
111
vaccinated subsequent birth cohorts getting 3 years old. We also compare those results with the pre-vaccination period but cross-sectional only as those data were not under the infl uence of RV vaccination.
Two important assumptions underlying the comparison of the annual number of RV-positive test results are that the catchment area for each of the participating centers remained the same across the whole observation period of 9 years and that no change in disease management behavior for testing the children ≤5 years old on RV disease occurred during that period. It means that if fewer tests were performed once the vaccine has been introduced, this has mainly to do with less suspected cases presenting themselves to the hospital unit and not with a change in behavior of the physician who was less likely to perform RV test once the vaccine was introduced. Therefore, the most relevant value to compare between the years is the accumulated number of RV-positive test results and not the proportion of RV-positive test results.
Model simulationTo well-understand the real impact the vaccine has, this can best be achieved by comparing observed results with a model simulation in which we separately control the diff erent aspects that could impact the outcome (hospital reduction) such as changing the vaccine effi cacy over time, initiating a second source of infection not being under the infl uence of the vaccine, changing the vaccine waning rate, or changing the vaccine uptake per year. For doing that comparison we selected from the observed data the birth cohort follow-up data up to the age of 3 years in order to obtain enough data-points over time.
We developed a time diff erence equation model based on the initial data collection of the fi rst years of observation. An analysis is then simulated in which the decrease in hospital numbers for the fi rst few years fi ts the observed data with fi xed parameters over time, a calibration process:
Xn+1
= Xn * cov
n * 1 – r + X
n * 1 – cov
n + X
m
in which:
• r is the fi xed decreasing value equivalent to the vaccine effi cacy (VE),
• cov is the vaccine coverage rate,
• x0 is the starting hospital numbers at t
0,
• xm
is the residual disease hospitalization (Xm
= X0 *f),
• f is the fraction of hospitalization caused by another source of infection
• n indicates number of years

Exploring new ways of measuring the economic value of vaccination
112
With the model we may easily adjust the shape of the simulated curve changing separately the vaccine uptake (cov) at specifi c n time points, the vaccine waning by decreasing r, the residual disease caused by another source of infection by changing f. The simulated shape can then be compared with the observed data and the best fi t is selected for the most plausible scenario of projected future hospitalizations related to the disease.
OutcomesAn annual comparison of cross-sectional data will identify the importance of the herd eff ect generated by the vaccine. Analyzing and comparing successively vaccinated birth cohorts over time will indicate whether the vaccine wanes. Comparison of the summary measures of vaccinated birth cohorts per year with simulated predictions will test the hypothesis about diff erent sources of infection. Finally, the proportional diff erence in RV-positive test results between pre- versus the most recent post-vaccination period analyzed (2012-2013) across the 11 participating centers will identify any selection bias in participating centers that may explain why residual disease could be observed over time. Results are tested for statistical signifi cance using Chi-square tests for trend of proportional data, with a statistical signifi cance level of p<0.05 [27].
RESULTS
Cross-sectional analysisCross-sectional analysisAmong the 11 participating centers 40,552 RV tests were conducted over the observation period of 9 years, with a much higher frequency during the epidemic months. The overall number of RV-positive test results recorded during that period was 5,832 (14.4%). Over the years, the overall number of tests performed signifi cantly decreased from 6,278 tests in 2006 during the pre-vaccination period to 3,893 tests in 2012 during the post-vaccination period, representing a reduction of 38%. Moreover, the absolute number of RV-positive test results decreased from 1,399 tests in 2006 during the pre-vaccination period to 327 tests in 2012 during the post-vaccination period, representing a reduction of 76.6%. The decrease in RV-positive test results was extremely sharp during the fi rst 2-3 years after the introduction of the vaccine and then fl attened over time, compared with the more linear decrease in the number of RV-negative tests over time (Figure 1). The non-linear reduction in the number of RV-positive test results over time was statistically signifi cant (χ2χ2χ =215.95; p<0.0001).
The number of RV-positive test results is shown by age group and year in Figure 2. There was a sharp drop in the number of RV-positive cases in the fi rst year after the introduction of RV vaccination, especially in the vaccinated age groups (>2–12 months and >12 months–2 years) which represent nearly 78% of the entire study population. There was also a drop in the number of positive cases in children who were either too young (≤2 months) or too old (>2 years) to be immunized.
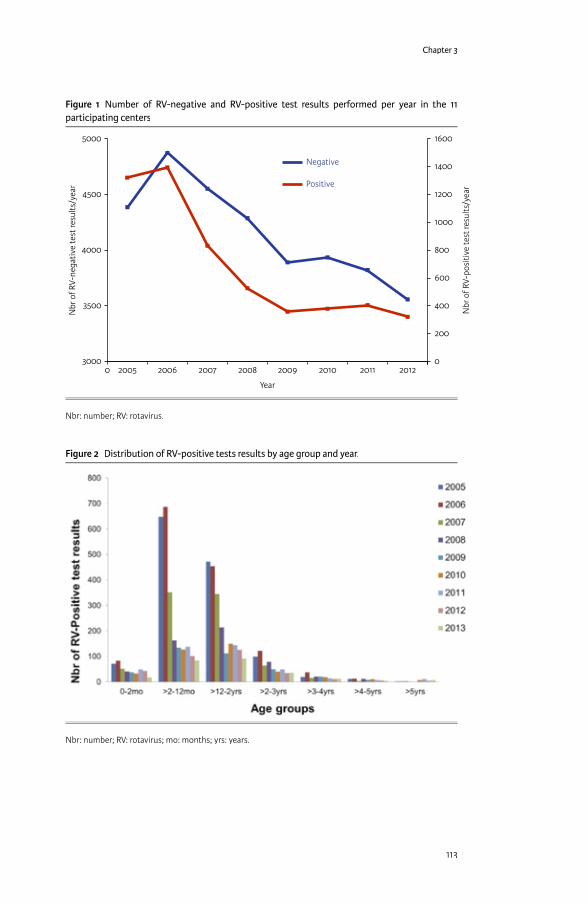
Chapter 3
113
Figure 1 Number of RV-negative and RV-positive test results performed per year in the 11 participating centers
5000
4500
4000
3500
3000
1600
1400
1200
1000
800
600
400
200
00 20122011201020092008200720062005
Nbr
of R
V-ne
gativ
e te
st re
sults
/yea
r
Nbr
of R
V-po
sitiv
e te
st re
sults
/yea
r
Year
Negative
Positive
Nbr: number; RV: rotavirus.
Figure 2 Distribution of RV-positive tests results by age group and year.
Nbr: number; RV: rotavirus; mo: months; yrs: years.
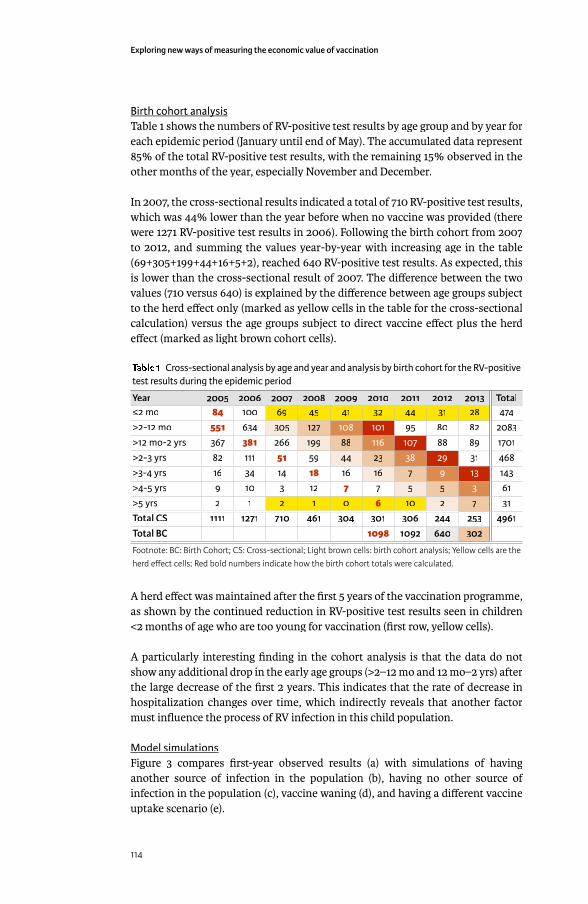
Exploring new ways of measuring the economic value of vaccination
114
Birth cohort analysisBirth cohort analysisTable 1 shows the numbers of RV-positive test results by age group and by year for each epidemic period (January until end of May). The accumulated data represent 85% of the total RV-positive test results, with the remaining 15% observed in the other months of the year, especially November and December.
In 2007, the cross-sectional results indicated a total of 710 RV-positive test results, which was 44% lower than the year before when no vaccine was provided (there were 1271 RV-positive test results in 2006). Following the birth cohort from 2007 to 2012, and summing the values year-by-year with increasing age in the table (69+305+199+44+16+5+2), reached 640 RV-positive test results. As expected, this is lower than the cross-sectional result of 2007. The diff erence between the two values (710 versus 640) is explained by the diff erence between age groups subject to the herd eff ect only (marked as yellow cells in the table for the cross-sectional calculation) versus the age groups subject to direct vaccine eff ect plus the herd eff ect (marked as light brown cohort cells).
Table 1 Cross-sectional analysis by age and year and analysis by birth cohort for the RV-positive test results during the epidemic period
Year 2005 2006 2007 2008 2009 2010 2011 2012 2013 Total≤2 mo 84 100 69 45 41 32 44 31 28 474>2-12 mo 551 634 305 127 108 101 95 80 82 2083>12 mo-2 yrs 367 381 266 199 88 116 107 88 89 1701>2-3 yrs 82 111 51 59 44 23 38 29 31 468>3-4 yrs 16 34 14 18 16 16 7 9 13 143>4-5 yrs 9 10 3 12 7 7 5 5 3 61>5 yrs 2 1 2 1 0 6 10 2 7 31Total CS 1111 1271 710 461 304 301 306 244 253 4961Total BC 1098 1092 640 302
Footnote: BC: Birth Cohort; CS: Cross-sectional; Light brown cells: birth cohort analysis; Yellow cells are the herd eff ect cells; Red bold numbers indicate how the birth cohort totals were calculated.
A herd eff ect was maintained after the fi rst 5 years of the vaccination programme, as shown by the continued reduction in RV-positive test results seen in children <2 months of age who are too young for vaccination (fi rst row, yellow cells).
A particularly interesting fi nding in the cohort analysis is that the data do not show any additional drop in the early age groups (>2–12 mo and 12 mo–2 yrs) after the large decrease of the fi rst 2 years. This indicates that the rate of decrease in hospitalization changes over time, which indirectly reveals that another factor must infl uence the process of RV infection in this child population.
Model simulationsFigure 3 compares fi rst-year observed results (a) with simulations of having another source of infection in the population (b), having no other source of infection in the population (c), vaccine waning (d), and having a diff erent vaccine uptake scenario (e).
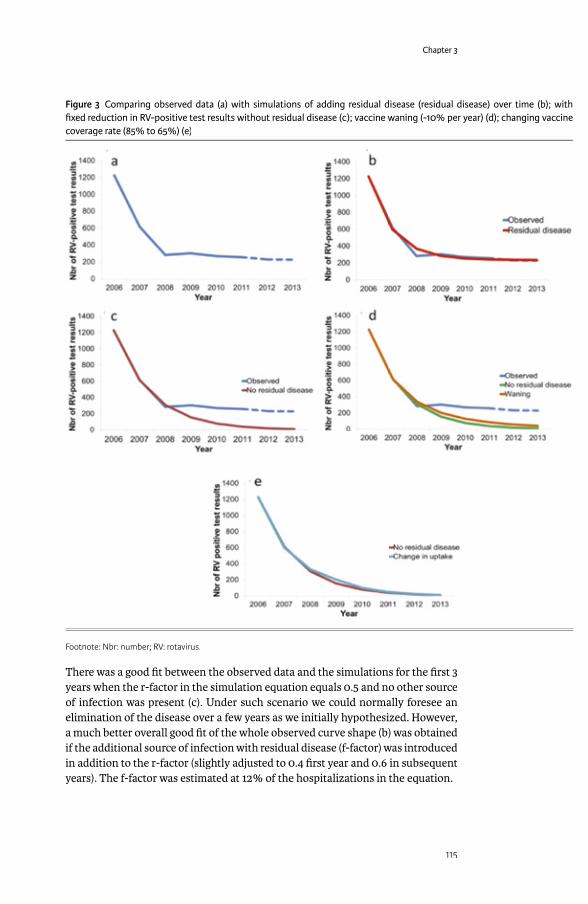
Chapter 3
115
There was a good fi t between the observed data and the simulations for the fi rst 3 years when the r-factor in the simulation equation equals 0.5 and no other source of infection was present (c). Under such scenario we could normally foresee an elimination of the disease over a few years as we initially hypothesized. However, a much better overall good fi t of the whole observed curve shape (b) was obtained if the additional source of infection with residual disease (f-factor) was introduced in addition to the r-factor (slightly adjusted to 0.4 fi rst year and 0.6 in subsequent years). The f-factor was estimated at 12% of the hospitalizations in the equation.
Figure 3 Comparing observed data (a) with simulations of adding residual disease (residual disease) over time (b); with fi xed reduction in RV-positive test results without residual disease (c); vaccine waning (-10% per year) (d); changing vaccine coverage rate (85% to 65%) (e)
Footnote: Nbr: number; RV: rotavirus.
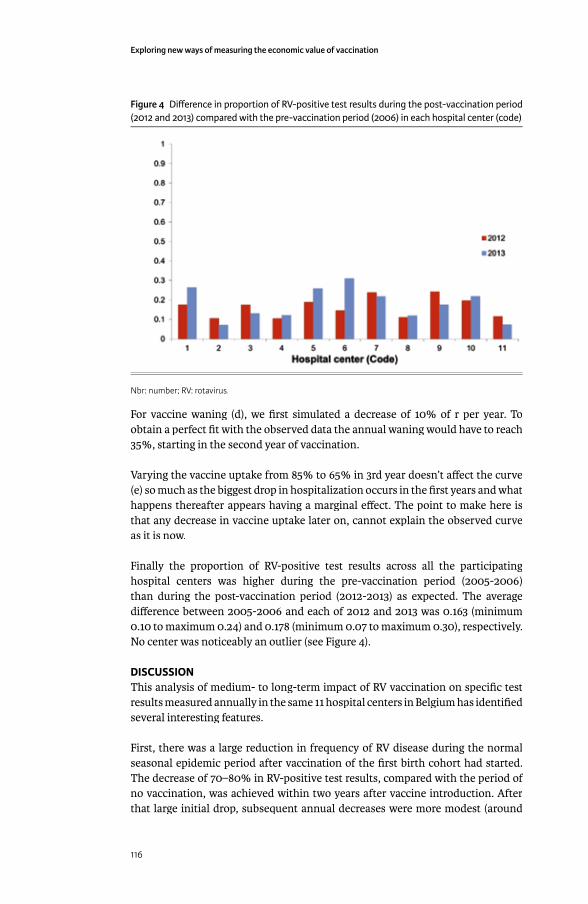
Exploring new ways of measuring the economic value of vaccination
116
For vaccine waning (d), we fi rst simulated a decrease of 10% of r per year. To obtain a perfect fi t with the observed data the annual waning would have to reach 35%, starting in the second year of vaccination.
Varying the vaccine uptake from 85% to 65% in 3rd year doesn’t aff ect the curve (e) so much as the biggest drop in hospitalization occurs in the fi rst years and what happens thereafter appears having a marginal eff ect. The point to make here is that any decrease in vaccine uptake later on, cannot explain the observed curve as it is now.
Finally the proportion of RV-positive test results across all the participating hospital centers was higher during the pre-vaccination period (2005-2006) than during the post-vaccination period (2012-2013) as expected. The average diff erence between 2005-2006 and each of 2012 and 2013 was 0.163 (minimum 0.10 to maximum 0.24) and 0.178 (minimum 0.07 to maximum 0.30), respectively. No center was noticeably an outlier (see Figure 4).
DISCUSSION This analysis of medium- to long-term impact of RV vaccination on specifi c test results measured annually in the same 11 hospital centers in Belgium has identifi ed several interesting features.
First, there was a large reduction in frequency of RV disease during the normal seasonal epidemic period after vaccination of the fi rst birth cohort had started. The decrease of 70–80% in RV-positive test results, compared with the period of no vaccination, was achieved within two years after vaccine introduction. After that large initial drop, subsequent annual decreases were more modest (around
Figure 4 Diff erence in proportion of RV-positive test results during the post-vaccination period (2012 and 2013) compared with the pre-vaccination period (2006) in each hospital center (code)
Nbr: number; RV: rotavirus.
Chapter 3
117
10–15% per age group). A similar early vaccine eff ect (the sharp drop in the fi rst year) was seen in the UK during the fi rst year after the vaccine introduction [28]. The decline was more spectacular during the fi rst year than in the present study. This could be due to the start date of the vaccination campaign in the UK, which was planned by the end of the second quarter the year before the start of the next epidemic season. In Belgium, vaccination began much closer to the next epidemic season, namely in the fourth quarter of the year [29].
Second, in addition to the important direct vaccine eff ect seen in the fi rst vaccinated birth cohort, we also observed during the same period a substantial drop in the unvaccinated age groups (i.e. children too young or too old to be vaccinated, as shown in Table 1). This phenomenon clearly indicates the high transmission rate of the virus between the diff erent age groups, resulting in a high indirect herd eff ect of the vaccine during the fi rst years of the vaccination programme until the whole at-risk group (aged up to 5 years old) is covered.
The overall drop in disease events was spectacular during the fi rst 2 years, because the younger age groups targeted by the vaccine programme are the groups most aff ected by RV disease (peak incidence rates) and are the highest receivers and transmitters of the virus to other age groups. Virus transmission within these age groups and to other age groups was directly and indirectly reduced by the vaccine. Once the at-risk group has been vaccinated, herd eff ects in the older age-groups would be expected to disappear, as children in this group would have been vaccinated when they were younger. This would leave herd eff ects only in children ≤2 months of age (who are too young for vaccination) as an additional benefi t sustained over time.
With 7 years of real-world observations after vaccine introduction, this study provides information about the likely source of infection of RV disease in the child population. The results split by age group in Figure 2 indicate that the role of the vaccine is primarily to stop the spread of the infection within the child population. The vaccine fulfi lls that task very well, as it induces a high herd eff ect across the diff erent unvaccinated age groups during the same period. To obtain such a high vaccine impact, the main source of infection must be within the children themselves as such a high vaccine eff ect can only be obtained if it blocks the root cause of infection transmission. However, the amount of indirect herd eff ect depends heavily on how children are normally nurtured during that period. For example, do they attend day-care centers and at what starting age, do they have regular contact with other children elsewhere, and are diff erent disease patterns observed between diff erent age groups if child management or behavior changes? These questions aff ect the likely sources of infection and patterns of disease transmission between and within age groups, and would be valuable areas for further research. Finally, the diff erent observed rates of disease reduction in subsequent years across diff erent age groups are a signal that diff erent infection forces operate within the child population. The most plausible explanation, simulated in Figure 3, is that there is an additional source of infection that can be clearly seen once most of the herd eff ect has faded away after the vaccine

Exploring new ways of measuring the economic value of vaccination
118
programme has been in place for a few years and all the at-risk children have been vaccinated. This scenario appears much more likely than a vaccine waning scenario, because an annual decrease of 35% in vaccine eff ect starting one year after its introduction must occur to fi t the observed data. Another possibility could be that the vaccination coverage rate fl uctuated over time, but it is unlikely that that potential disturbance may impact so heavily the outcome results. In addition in Belgium the vaccine coverage rate remained stable and quite high during the whole observation period (>86%, IMS data).
These indications of additional sources of infection suggest that the disease and the virus will not be easily eliminated unless the other sources of infection can be targeted by diff erent vaccination strategies.
A cohort analysis illustrates eff ects within the child population over time, including the dynamics of indirect vaccine impact. This type of investigation is more sensitive and better able to identify the real-world benefi t of the vaccine than using vaccine effi cacy data obtained through randomized clinical trials, where the control group may be infl uenced by the herd eff ect. This may reduce the measured vaccine effi cacy, as seen in the European trial [30]. Following a fi rst birth cohort over time should normally demonstrate a larger reduction of RV-positive test results than a fi rst-year cross-sectional evaluation, because the vaccinated birth cohort includes a mixture of direct and indirect vaccine eff ects in each subsequent year if the coverage rate is not 100%. In contrast, the cross-sectional analysis only includes the measured herd eff ect in addition to the fi rst-year direct eff ect of vaccination of a small age group. Thus, we would expect to observe a larger eff ect in the birth cohort analysis than the cross-sectional analysis when comparing the two datasets, which is consistent with the results observed in this study. However, cross-sectional and cohort data would be expected to reach the same end result for the sum of the diff erent at-risk age groups as soon as all the children from all the diff erent at risk age-groups have been vaccinated, approximately 9 years from the start [31;32]. Comparing birth cohort and cross-sectional analyses can also estimate the magnitude of the pure herd eff ect that can be generated by the vaccine in this disease.
Finally, all centers responded to the vaccine in a similar way over time. The observation of a residual disease burden could have been linked to specifi c centers that did not apply the same vaccination strategy in their catchment area, or to potential insourcing in some specifi c areas of unvaccinated children from outside Belgium where vaccination is not yet routinely performed. These possibilities were not measured in the present study.
A limitation of the current study is that we do not fully control the denominator of the study, and thus we assume that the target population has not signifi cantly changed over the 9 years of the study period. For a small country as Belgium with a stable population, this assumption is reasonable. Another assumption is that no change behavior in testing the children for RV infection appeared over time after the introduction of the vaccine.

Chapter 3
119
This analysis may provide the fi rst evidence of another source of RV infection that exists outside the child population. This source appears to be less spectacular in spreading the disease in the child population than transmission within the age group, and may also be less likely to be signifi cantly infl uenced by vaccination because the current vaccination strategy may not directly touch this reservoir.
In conclusion, the results of this study help to fi ll a gap of important information about the impact of RV vaccination over the medium- to long-term. The main features reported are the sustained reduction in hospitalization. A new fi nding that could potentially be important is that there may be diff erent sources of infection in the child population, which may make it diffi cult to reduce the disease to very low levels. A residual disease presence observed over time means that we need to continue to monitor events each year in order to detect any new developments.
ACKNOWLEDGEMENTThe authors would like to thank the investigators of the The Rotavirus Belgium Impact Study (RotaBIS study) group who participated in this study: Marc Verghote, Centre Hospitalier Régional de Namur, Namur; Eddy Bodart, Cliniques Universitaires Université Catholique de Louvain (UCL) de Mont Godinne, Yvoir; Stefaan Van Eldere, Imeldaziekenhuis, Bonheiden; Patricia Vandecandelaere, Regionaal Ziekenhuis Jan Yperman - O.L.Vrouw, Ieper; Peggy Bruynseels, Ziekenhuis Netwerk Antwerpen, Antwerpen; Jose Ramet, Universitair Ziekenhuis Antwerpen, Edegem; Hajer Lassoued, Clinique Notre Dame, Charleroi. The authors thank Gregory Collet (Business and Decision Life Sciences, on behalf of GSK Vaccines) for editorial assistance and manuscript coordination.
REFERENCES[1] Karsten C, Baumgarte S, Friedrich AW, von EC, Becker K, Wosniok W, et al.
Incidence and risk factors for community-acquired acute gastroenteritis in north-west Germany in 2004. Eur J Clin Microbiol Infect Dis 2009 Aug;28(8):935-43.
[2] Parashar UD, Gibson CJ, Bresee JS, Glass RI. Rotavirus and severe childhood diarrhea. Emerg Infect Dis 2006 Feb;12(2):304-6.
[3] Iturriza-Gomara M, Dallman T, Banyai K, Bottiger B, Buesa J, Diedrich S, et al. Rotavirus surveillance in europe, 2005-2008: web-enabled reporting and real-time analysis of genotyping and epidemiological data. J Infect Dis 2009 Nov 1;200 Suppl 1:S215-S221.
[4] Forster J, Guarino A, Parez N, Moraga F, Roman E, Mory O, et al. Hospital-based surveillance to estimate the burden of rotavirus gastroenteritis among European children younger than 5 years of age. Pediatrics 2009 Mar;123(3):e393-e400.
[5] Van DP, Giaquinto C, Huet F, Gothefors L, Maxwell M, Van der WM. Multicenter prospective study of the burden of rotavirus acute gastroenteritis in Europe, 2004-2005: the REVEAL study. J Infect Dis 2007 May 1;195 Suppl 1:S4-S16.
Exploring new ways of measuring the economic value of vaccination
120
[6] Giaquinto C, Van DP, Huet F, Gothefors L, Maxwell M, Todd P, et al. Clinical consequences of rotavirus acute gastroenteritis in Europe, 2004-2005: the REVEAL study. J Infect Dis 2007 May 1;195 Suppl 1:S26-S35.
[7] Bresee JS, Glass RI, Ivanoff B, Gentsch JR. Current status and future priorities for rotavirus vaccine development, evaluation and implementation in developing countries. Vaccine 1999 May 4;17(18):2207-22.
[8] Huilan S, Zhen LG, Mathan MM, Mathew MM, Olarte J, Espejo R, et al. Etiology of acute diarrhoea among children in developing countries: a multicentre study in fi ve countries. Bull World Health Organ 1991;69(5):549-55.
[9] Velazquez FR, Matson DO, Calva JJ, Guerrero L, Morrow AL, Carter-Campbell S, et al. Rotavirus infections in infants as protection against subsequent infections. N Engl J Med 1996 Oct 3;335(14):1022-8.
[10] Diez-Domingo J, Martin IO, Sanz AB, Lopez AG, Martinez CC, Boronat CP, et al. Rotavirus gastroenteritis among children under fi ve years of age in Valencia, Spain. Pediatr Infect Dis J 2006 May;25(5):455-7.
[11] Bilcke J, Beutels P, De Smet F, Hanquet G, Van Ranst M, Van Damme P. KCE reports 54B: Vaccination des nourrissons contre le rotavirus en Belgique – Analyse coût-effi cacité. 2007 Sep. KCE reports 54B.
[12] Bilcke J, Van DP, Beutels P. Cost-eff ectiveness of rotavirus vaccination: exploring caregiver(s) and “no medical care’’ disease impact in Belgium. Med Decis Making 2009 Jan;29(1):33-50.
[13] Velazquez FR. Protective eff ects of natural rotavirus infection. Pediatr Infect Dis J 2009 Mar;28(3 Suppl):S54-S56.
[14] Anderson EJ. Prevention and treatment of viral diarrhea in pediatrics. Expert Rev Anti Infect Ther 2010 Feb;8(2):205-17.
[15] Chandran A, Fitzwater S, Zhen A, Santosham M. Prevention of rotavirus gastroenteritis in infants and children: rotavirus vaccine safety, effi cacy, and potential impact of vaccines. Biologics 2010;4:213-29.
[16] Van DP, Van der WM, Ansaldi F, Desgrandchamps D, Domingo JD, Sanchez FG, et al. Rotavirus vaccines: considerations for successful implementation in Europe. Lancet Infect Dis 2006 Dec;6(12):805-12.
[17] Parez N, Giaquinto C, Du RC, Martinon-Torres F, Spoulou V, Van DP, et al. Rotavirus vaccination in Europe: drivers and barriers. Lancet Infect Dis 2014 May;14(5):416-25.
[18] Paulke-Korinek M, Kundi M, Rendi-Wagner P, de MA, Eder G, Schmidle-Loss B, et al. Herd immunity after two years of the universal mass vaccination program against rotavirus gastroenteritis in Austria. Vaccine 2011 Mar 24;29(15):2791-6.
[19] Paulke-Korinek M, Kollaritsch H, Aberle SW, Zwazl I, Schmidle-Loss B, Vecsei A, et al. Sustained low hospitalization rates after four years of rotavirus mass vaccination in Austria. Vaccine 2013 May 31;31(24):2686-91.
[20] Vesikari T, Sutherland D, Jackson AEM. Report of the ‘European Expert Meeting on Rotavirus Vaccination’, Tampere, Finland, 19-20 May 2009. Vaccine 2009;In Press, Uncorrected Proof.
[21] Hanquet G, Ducoff re G, Vergison A, Neels P, Sabbe M, Van DP, et al. Impact of rotavirus vaccination on laboratory confi rmed cases in Belgium. Vaccine 2011 Jun 24;29(29-30):4698-703.

Chapter 3
121
[22] Raes M, Strens D, Vergison A, Verghote M, Standaert B. Reduction in pediatric rotavirus-related hospitalizations after universal rotavirus vaccination in Belgium. Pediatr Infect Dis J 2011 Jul;30(7):e120-e125.
[23] Zeller M, Rahman M, Heylen E, De CS, De VS, Arijs I, et al. Rotavirus incidence and genotype distribution before and after national rotavirus vaccine introduction in Belgium. Vaccine 2010 Nov 3;28(47):7507-13.
[24] Zlamy M, Kofl er S, Orth D, Wurzner R, Heinz-Erian P, Streng A, et al. The impact of Rotavirus mass vaccination on hospitalization rates, nosocomial Rotavirus gastroenteritis and secondary blood stream infections 1. BMC Infect Dis 2013;13:112.
[25] Vesikari T, Uhari M, Renko M, Hemming M, Salminen M, Torcel-Pagnon L, et al. Impact and eff ectiveness of RotaTeq(R) vaccine based on 3 years of surveillance following introduction of a rotavirus immunization program in Finland 3. Pediatr Infect Dis J 2013 Dec;32(12):1365-73.
[26] Breackman T, Theelen H, Lernout T, Hens N, Roelands M, Hoppenbrouwers K, et al. Rotavirus vaccination coverage and adherence to recommended age among infants in Flanders (Belgium) in 2012. Eurosurveillance 2014 May 22;19(20):1-9.
[27] Fleiss J, Levin B, Paik M. Statistic methods for rates and proportions. Probabilties & Statistics. Hoboken, New Jersay Wiley Series ed. Wikey Series; 2003.
[28] Owain J. Vaccine Knowledge Project. 20-8-2014. 23-12-2014. Ref Type: Internet Communication
[29] Public Health England. Summary of Surveillance of norovirus and rotavirus vaccination. 2014. Ref Type: Internet Communication
[30] Vesikari T, Karvonen A, Prymula R, Schuster V, Tejedor JC, Cohen R, et al. Effi cacy of human rotavirus vaccine against rotavirus gastroenteritis during the fi rst 2 years of life in European infants: randomised, double-blind controlled study. The Lancet 2007 Nov 24;370(9601):1757-63.
[31] Standaert B, Demarteau N, Talbird S, Mauskopf J. Modelling the eff ect of conjugate vaccines in pneumococcal disease: cohort or population models? Vaccine 2010 Nov 19;28 Suppl 6:G30-G38.
[32] Ethgen O, Standaert B. Population- versus cohort-based modelling approaches. Pharmacoeconomics 2012 Mar;30(3):171-81.

122
EXPLORING ADDITIONAL HIDDEN VALUES OF ROTAVIRUS VACCINES
I was able to identify at least two domains that could be of great interest to decision makers related to the introduction of rotavirus vaccines. The evidence of those values could only be measured if the vaccine was already introduced on a large scale for a few years in a country. I like to present here the domains of benefi t/value I have fully explored in depth today.
4.1 QUALITY OF CARE IMPROVEMENTOne is about the benefi t of improving Quality of Care in the hospital environment after introducing the vaccine, B Standaert et al. accepted, 2015. The point we want to make is that during every winter period the pediatric ward is overwhelmed by a huge patient infl ux because many infectious diseases in the very young children happen more or less during the same period. With the introduction of the rotavirus vaccine we have now a possibility to better regulate the patient infl ow into the health care system and as a consequence improve the Quality of Care (QoC) in that environment. I was able to demonstrate that this hidden benefi t generated by this vaccine was overwhelming not only at the level of gastro-enteritis suff ering patients but for the whole pediatric department. To assess well the QoC I proposed a simple method of calculation based on existing data easily accessible in a hospital environment.
4.2 REDUCTION IN ABSENTEEISMThe other interesting benefi t is about the observed reduction in absenteeism amongst working mothers with a fi rst child during the epidemic season of rotavirus diarrhea. I observed a signifi cant reduction amongst the administrative personnel in the City of Antwerp after the introduction of the vaccine in 2006 in Belgium, B Standaert et al, submitted, 2014. The latter is quite interesting as we often claim and simulate in our economic models that there is a high indirect cost among working parents when exposed to infectious diseases in children and that there is much benefi t to be expected from introducing the vaccine for that domain. Here I was able to show the evidence and to quantify the benefi t related to the introduction of the rotavirus vaccine with real life data.
4
Chapter 4
123
IMPROVEMENT IN HOSPITAL QUALITY OF CARE (QOC) AFTER THE INTRODUCTION OF ROTAVIRUS VACCINATION: AN EVALUATION STUDY IN BELGIUM
Accepted by Human Vaccines & Immuno Therapeutics, March 2015
ABSTRACTDuring each winter period hospital emergency rooms and paediatric wards are often overwhelmed by high patient infl ux with infectious diseases leading to chaotic conditions with poor quality of care (QoC) delivery as a consequence. The conditions could be improved if we were able to better control the infl ux by introducing for instance better prevention strategies against some of the most frequent infectious diseases. New prevention strategies using vaccination against rotavirus infection were introduced in Belgium in November 2006. We developed a measure of hospital QoC suitable for assessing the impact of paediatric rotavirus vaccination. The study is retrospective collecting routine data on bed and staff management in one paediatric hospital in Belgium. The data were divided in pre- and post-vaccination periods during rotavirus-epidemic and non-epidemic periods. The scores were constructed using Explanatory Factor Analysis (EFA). All patients enrolled were admitted to the paediatric ward over the period from 1 January 2004 to 31 December 2009. The results of the epidemic period indicated that bed-day occupancy, bed-day turnover and unplanned readmissions for acute gastroenteritis were lower in the post-vaccination compared with the pre-vaccination periods. The QoC scores were therefore signifi cantly lower (indicating improved QoC) after the introduction of rotavirus vaccination, compared with pre-vaccination. The data suggests that the reduction in the winter peak of rotavirus-related hospitalisations after the introduction of the vaccine reduces pressure on hospital resources and improves the quality of hospital care. The fi ndings should be further tested in similar settings.
INTRODUCTIONRotavirus disease places a high demand on European healthcare systems, accounting for 56.2% of hospitalisations and 32.8% of emergency department visits for community-acquired gastroenteritis during the winter epidemic seasons in children aged <5 years [1]. The seasonal rotavirus peak coincides with other paediatric infections, such as respiratory syncytial virus (RSV), infl uenza, pneumococcal disease, and other causes of acute gastro-enteritis (AGE) [2;3]. Each winter, those infections cause a high infl ux of children with communicable diseases into paediatric hospital wards and emergency rooms.
These winter increases in hospitalisations for infectious diseases in young children place a heavy burden on the delivery of medical care [4;5]. Overcrowding and excess workload in hospital care is recognised as a serious problem for patients and staff [6;7]. High patient-to-nurse ratios are related to unfavourable patient outcomes and increased self-reports of staff burnout and job dissatisfaction [8]. In addition to staff stress, the infl ux of infectious disease cases may result in
B Standaert1
A Alwan2
D Strens3
M Raes4
MJ Postma5
1 GlaxoSmithKline Vaccines, Wavre, Belgium
2 MedStat, Antwerp, Belgium3 Realidat, Grimbergen, Belgium4 Jessa Hospital, Hasselt,
Belgium5 University of Groningen,
Groningen, The Netherlands

Exploring new ways of measuring the economic value of vaccination
124
wards crowded over capacity, facilitating pathogen transmission and increasing nosocomial infections [9]. This has been documented by epidemiological data, but the consequences have not been fully investigated [10;11]. Overcrowding leads to high turnovers, with consequent potential for premature discharge and high readmission rates [12-15]. Over-stressed conditions for staff may be associated with high sickness rates requiring recruitment of temporary personnel, which in turn may be associated with a risk of incorrect diagnosis and/or treatment. Thus, the seasonal infl ux of patients with communicable diseases during a short time risks a cascade of sequential problems each winter.
Rotavirus vaccination was introduced in 2006 and off ers the potential for better control of the infl ux of infectious disease cases [16]. Rotavirus vaccination in countries with established vaccination programmes has consistently and signifi cantly reduced the incidence of rotavirus gastroenteritis (RVGE) and associated hospitalisations, emergency department visits and outpatient/physician offi ce visits in the United States (US), Europe and Australia [17-20].
Belgium introduced rotavirus vaccination in November 2006, with an uptake of 85% in the fi rst year [21] and 89% in the second year [22]. This high vaccine uptake is maintained throughout subsequent years where parents are asked for a co-payment of the vaccine of 11.6€ per dose [23]. We have previously investigated the change in winter paediatric hospitalisations from before to after the introduction of rotavirus vaccination [22]. By reducing the seasonal infl ux of urgent RVGE cases into paediatric hospitals, the vaccine could help to reduce the winter pressure on healthcare resources and staff , off ering potential wider benefi ts beyond reduced healthcare costs and quality-of-life gains in improving hospital quality of care (QoC). Such benefi ts would accrue to patients and their families, staff and hospital managers. Patients, who at present may be exposed to overcrowded hospitals with staff operating under stressful conditions, could benefi t from better care provided by a less pressured service. Staff could benefi t from reduced work stress and thus better conditions for optimal delivery of care, and could be less prone to infections. Health authorities and management may benefi t from more effi cient overall operation of the healthcare system, and will be better able to maintain a high quality of hospital care throughout the year.
Can these additional potential benefi ts of rotavirus vaccination on QoC be measured, and could such a measure be used as a benchmark for assessing the value of a new vaccine to hospital care? The objective was to obtain a daily QoC score based on easily accessible variables that refl ect the management of hospital beds and staff . The score should indicate when care management is at risk for a quality drop potentially aff ecting patients and caregivers, and should be able to measure the impact of a vaccine introduction. The following hypothesis was therefore tested. The average daily QoC score in hospital management during winter epidemic seasons is signifi cantly/relevantly worse in pre-vaccination compared with post-vaccination periods with a large score diff erence amongst the AGE population, a moderate score diff erence in the infection-only population and a marginal diff erence score overall.
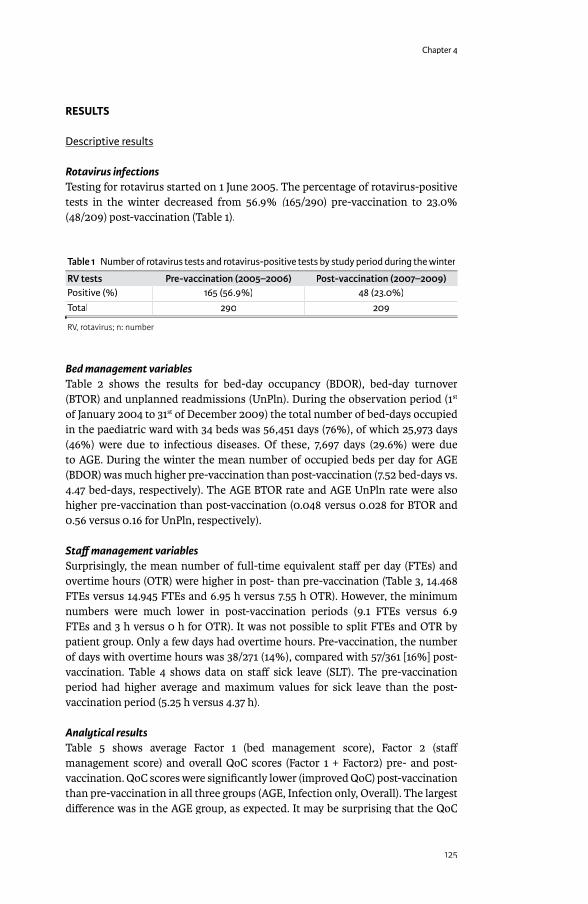
Chapter 4
125
RESULTS
Descriptive resultsDescriptive results
Rotavirus infectionsTesting for rotavirus started on 1 June 2005. The percentage of rotavirus-positive tests in the winter decreased from 56.9% (165/290) pre-vaccination to 23.0% (165/290) pre-vaccination to 23.0% ((48/209) post-vaccination (Table 1).
Table 1 Number of rotavirus tests and rotavirus-positive tests by study period during the winter
RV tests Pre-vaccination (2005–2006) Post-vaccination (2007–2009)Positive (%) 165 (56.9%) 48 (23.0%)Total 290 209
RV, rotavirus; n: number
Bed management variablesTable 2 shows the results for bed-day occupancy (BDOR), bed-day turnover (BTOR) and unplanned readmissions (UnPln). During the observation period (1st
of January 2004 to 31st of December 2009) the total number of bed-days occupied in the paediatric ward with 34 beds was 56,451 days (76%), of which 25,973 days (46%) were due to infectious diseases. Of these, 7,697 days (29.6%) were due to AGE. During the winter the mean number of occupied beds per day for AGE (BDOR) was much higher pre-vaccination than post-vaccination (7.52 bed-days vs. 4.47 bed-days, respectively). The AGE BTOR rate and AGE UnPln rate were also higher pre-vaccination than post-vaccination (0.048 versus 0.028 for BTOR and 0.56 versus 0.16 for UnPln, respectively).
Staff management variablesSurprisingly, the mean number of full-time equivalent staff per day (FTEs) and overtime hours (OTR) were higher in post- than pre-vaccination (Table 3, 14.468 FTEs versus 14.945 FTEs and 6.95 h versus 7.55 h OTR). However, the minimum numbers were much lower in post-vaccination periods (9.1 FTEs versus 6.9 FTEs and 3 h versus 0 h for OTR). It was not possible to split FTEs and OTR by patient group. Only a few days had overtime hours. Pre-vaccination, the number of days with overtime hours was 38/271 (14%), compared with 57/361 [16%] post-vaccination. Table 4 shows data on staff sick leave (SLT). The pre-vaccination period had higher average and maximum values for sick leave than the post-vaccination period (5.25 h versus 4.37 h).
Analytical resultsTable 5 shows average Factor 1 (bed management score), Factor 2 (staff management score) and overall QoC scores (Factor 1 + Factor2) pre- and post-vaccination. QoC scores were signifi cantly lower (improved QoC) post-vaccination than pre-vaccination in all three groups (AGE, Infection only, Overall). The largest diff erence was in the AGE group, as expected. It may be surprising that the QoC
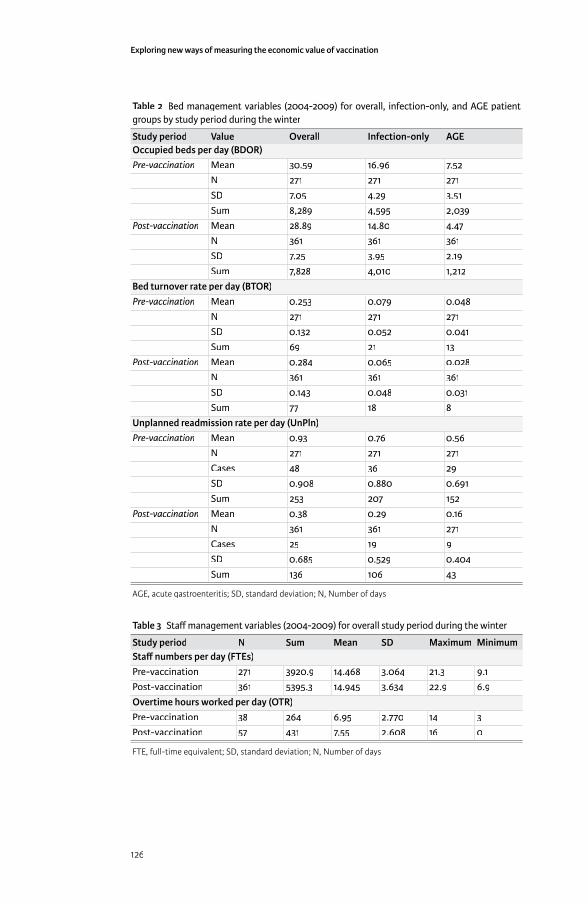
Exploring new ways of measuring the economic value of vaccination
126
Table 2 Bed management variables (2004-2009) for overall, infection-only, and AGE patient groups by study period during the winter
Study period Value Overall Infection-only AGEOccupied beds per day (BDOR)Pre-vaccination Mean 30.59 16.96 7.52
N 271 271 271SD 7.05 4.29 3.51Sum 8,289 4,595 2,039
Post-vaccination Mean 28.89 14.80 4.47N 361 361 361SD 7.25 3.95 2.19Sum 7,828 4,010 1,212
Bed turnover rate per day (BTOR)Pre-vaccination Mean 0.253 0.079 0.048
N 271 271 271SD 0.132 0.052 0.041Sum 69 21 13
Post-vaccination Mean 0.284 0.065 0.028N 361 361 361SD 0.143 0.048 0.031Sum 77 18 8
Unplanned readmission rate per day (UnPln)Pre-vaccination Mean 0.93 0.76 0.56
N 271 271 271Cases 48 36 29SD 0.908 0.880 0.691Sum 253 207 152
Post-vaccination Mean 0.38 0.29 0.16N 361 361 271Cases 25 19 9SD 0.685 0.529 0.404Sum 136 106 43
AGE, acute gastroenteritis; SD, standard deviation; N, Number of days
Table 3 Staff management variables (2004-2009) for overall study period during the winter
Study period N Sum Mean SD Maximum MinimumStaff numbers per day (FTEs)Pre-vaccination 271 3920.9 14.468 3.064 21.3 9.1Post-vaccination 361 5395.3 14.945 3.634 22.9 6.9Overtime hours worked per day (OTR)Pre-vaccination 38 264 6.95 2.770 14 3Post-vaccination 57 431 7.55 2.608 16 0
FTE, full-time equivalent; SD, standard deviation; N, Number of days
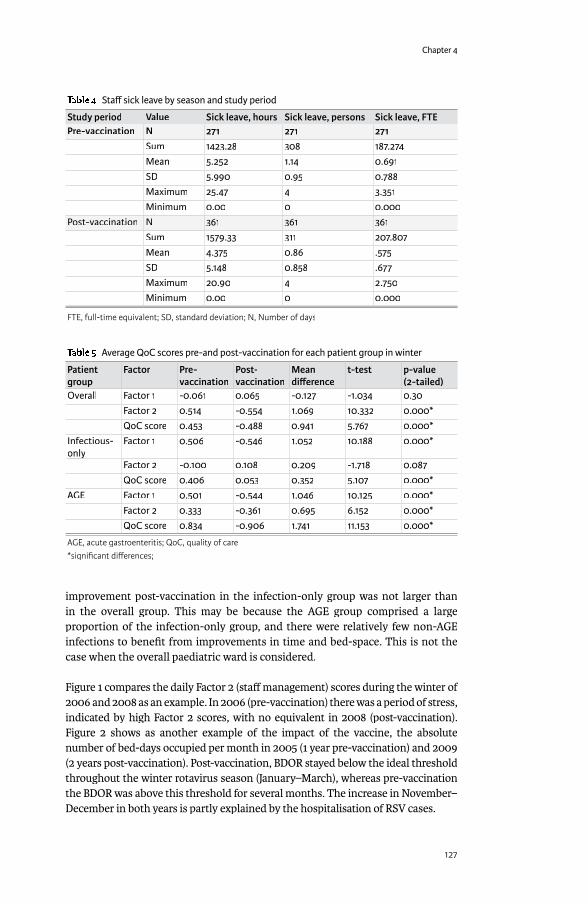
Chapter 4
127
improvement post-vaccination in the infection-only group was not larger than in the overall group. This may be because the AGE group comprised a large proportion of the infection-only group, and there were relatively few non-AGE infections to benefi t from improvements in time and bed-space. This is not the case when the overall paediatric ward is considered.
Figure 1 compares the daily Factor 2 (staff management) scores during the winter of 2006 and 2008 as an example. In 2006 (pre-vaccination) there was a period of stress, indicated by high Factor 2 scores, with no equivalent in 2008 (post-vaccination). Figure 2 shows as another example of the impact of the vaccine, the absolute number of bed-days occupied per month in 2005 (1 year pre-vaccination) and 2009 (2 years post-vaccination). Post-vaccination, BDOR stayed below the ideal threshold throughout the winter rotavirus season (January–March), whereas pre-vaccination the BDOR was above this threshold for several months. The increase in November–December in both years is partly explained by the hospitalisation of RSV cases.
Table 4 Staff sick leave by season and study period
Study period Value Sick leave, hours Sick leave, persons Sick leave, FTEPre-vaccination N 271 271 271
Sum 1423.28 308 187.274Mean 5.252 1.14 0.691SD 5.990 0.95 0.788Maximum 25.47 4 3.351Minimum 0.00 0 0.000
Post-vaccination N 361 361 361Sum 1579.33 311 207.807Mean 4.375 0.86 .575SD 5.148 0.858 .677Maximum 20.90 4 2.750Minimum 0.00 0 0.000
FTE, full-time equivalent; SD, standard deviation; N, Number of days
Table 5 Average QoC scores pre-and post-vaccination for each patient group in winter
Patient group
Factor Pre-vaccination
Post-vaccination
Mean diff erence
t-test p-value (2-tailed)
Overall Factor 1 -0.061 0.065 -0.127 -1.034 0.30Factor 2 0.514 -0.554 1.069 10.332 0.000*QoC score 0.453 -0.488 0.941 5.767 0.000*
Infectious-onlyonly
Factor 1 0.506 -0.546 1.052 10.188 0.000*
Factor 2 -0.100 0.108 0.209 -1.718 0.087QoC score 0.406 0.053 0.352 5.107 0.000*
AGE Factor 1 0.501 -0.544 1.046 10.125 0.000*Factor 2 0.333 -0.361 0.695 6.152 0.000*QoC score 0.834 -0.906 1.741 11.153 0.000*
AGE, acute gastroenteritis; QoC, quality of care*signifi cant diff erences;
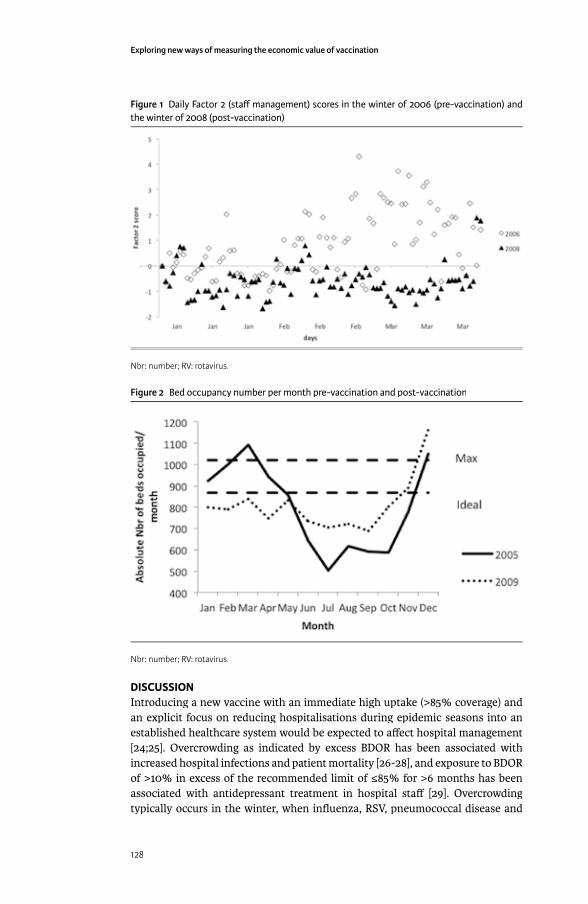
Exploring new ways of measuring the economic value of vaccination
128
DISCUSSIONIntroducing a new vaccine with an immediate high uptake (>85% coverage) and an explicit focus on reducing hospitalisations during epidemic seasons into an established healthcare system would be expected to aff ect hospital management [24;25]. Overcrowding as indicated by excess BDOR has been associated with increased hospital infections and patient mortality [26-28], and exposure to BDOR of >10% in excess of the recommended limit of ≤85% for >6 months has been associated with antidepressant treatment in hospital staff [29]. Overcrowding typically occurs in the winter, when infl uenza, RSV, pneumococcal disease and
Figure 1 Daily Factor 2 (staff management) scores in the winter of 2006 (pre-vaccination) and the winter of 2008 (post-vaccination)
Nbr: number; RV: rotavirus.
Figure 2 Bed occupancy number per month pre-vaccination and post-vaccination
Nbr: number; RV: rotavirus.
Chapter 4
129
rotavirus all circulate together, and can be exacerbated by rapid pathogen spread within the hospital causing high rates of nosocomial infection. However, although the problem of winter pressure is familiar to hospital staff , until now there has been no method to quantify that phenomenon into one single measure. The present study is a fi rst attempt to develop a single QoC score that can quantify stress in healthcare services and can assess the impact of interventions, such as rotavirus vaccine introduction, on service stress.
As this was a retrospective analysis, we used data that were already available. This should allow replication of this analysis in other hospital settings collecting similar data which is the case for bed day management variables but could be more diffi cult for staff management variables that most often are not fully electronically available over a long enough period during pre-vaccination or before 2006 in Belgium. Overcrowding and its adverse eff ects on staff stress should be visible in measures of bed management and staff management, so we concentrated on variables in these areas. Some of these variables should be correlated, e.g. when BDOR is high, BTOR is also likely to be high, which in turn increases the risk of unplanned readmission. The technique of Explanatory Factor Analysis (EFA) allows identifi cation of links between the variables and the integration of several variables into a new measure. In the present study, we pre-defi ned the number of Factors we wanted to work with, one on bed management and one on staff management, to facilitate the construction of an overall QoC score with the right weighting values for each variable in the EFA equation. As expected, the diff erence in winter QoC scores pre- and post-vaccination was highest among AGE patients. Notably, there was also a substantial diff erence for the overall group. This indicates that improved QoC after introduction of rotavirus vaccination benefi ted the paediatric ward as a unit, and not only patients with the specifi c infection targeted by the vaccine. We also explored an analysis of calculating QoC-scores in the non-winter periods expecting no much of a diff erence between the pre- and post-vaccination periods for the 3 patient groups considered and obtaining much lower scores than during the winter periods. Our hypothesis was confi rmed and indicated a way to validate the construction of the score-composition. We report these particular data in the Appendix 1.
The analysis can also be used to identify periods of stress by plotting the daily scores. Our results showed that the daily Factor 2 (staff management) scores indicated an extended period of high stress in the winter of 2006, and bed occupancy indicated an extended period of overcrowding in the winter of 2005. Such information could be used to predict the development of problems and to implement remedial actions.
It should be emphasised that this analysis does not support reductions in personnel numbers in paediatric wards during the winter period now that rotavirus vaccination has been introduced. Instead, it demonstrates that there was considerable stress in paediatric wards prior to vaccine introduction. This stress could have detrimental eff ects on patients, staff and the effi cient operation of the healthcare system. Introducing the rotavirus vaccine has reduced the seasonal
Exploring new ways of measuring the economic value of vaccination
130
peak in rotavirus admissions, thus reducing the winter stress on healthcare services and improving QoC, which should benefi t patients, staff and hospital management overall. But QoC scores are likely to be dynamic, since they are composed of several variables, and it is likely that they will continue to evolve over time.
The technique of EFA to build scores is not new and has especially been applied in the world of sociology [30]. In the medical world it has been used to help classifying patient-groups in function of disease severity levels based on scores constructed through the collection of data from questionnaires [31].
Currently, cost-eff ectiveness analyses of new vaccines have not been able to include any QoC benefi ts of vaccination. The present analysis off ers a way to quantify the QoC benefi t, which may allow its potential impact on hospital costs and quality-adjusted life-years (QALYs) to be incorporated in economic analyses. We are exploring this in future research. However we need to be sure to make links between the level of QoC-scores and the cost of disease management in hospital care or the impact on QALYs amongst the personnel. The latter should preferentially be investigated with prospective data collection. That process doesn’t facilitate the implementation of such a study.
The present study has some limitations. First, it was conducted at a single centre, and the results should be confi rmed in other settings. We are presently investigating the possibility of repeating the project in another hospital in Belgium with access to similar data. However, if we want to expand our research in other countries it will be diffi cult. As of today not many countries in Europe can confi rm the analysis results we have as only a few of them have currently accepted the rotavirus vaccination as a universal mass vaccination program in children including the UK, Austria, and Finland. Moreover by limiting the study to one centre in Belgium it was also not possible to include all the variables we selected for the analysis. For instance we were unable to introduce nosocomial infection rates which are normally an appropriate indicator of stress situations in hospital management. That specifi c event underwent a dramatic observed reduction after the introduction of the vaccine. But because of too low numbers registered during the observation period in this centre, we could not include the variable in the analysis. Another option to circumvent the problem of too low observation units is to change the time unit of observation from day to week or months. This is an option we would like to further explore. Moreover, the EFA approach remains a subject of debate amongst experts [32]. One challenging item is about the fi tting procedures to obtain the regression coeffi cients amongst the variables and the Factors in between, called the Factor loadings. Diff erent approaches exist but there is no method that indicates the best or the worst approach in calculating these values. In this study here we have taken a conservative approach by selecting appropriate data and trying to make the analysis as uniform as possible. Full details are provided in the supplementary Appendix 1 to allow other researchers to replicate the analysis.
Chapter 4
131
Introducing a new vaccine that aff ects a major public health problem could have many healthcare benefi ts beside the improvements of clinical benefi ts such as mortality and morbidity reduction. The new vaccine may also unexpectedly have an impact on other domains of the health care program if that program suff ers as well about overcrowded hospital services during certain periods, stress in care delivery by health care professional, bad management of the beds to be used. These are conditions we often have diffi culties to measure correctly about the deviations of normal practice. The analysis method here described as EFA has just the facility to be able to collect that new information quantitatively in an easy to applied way and it does not require the collection of additional data. It integrates several aspects of healthcare service stress by including both bed-day management and care of staff , which are linked and should therefore be evaluated together. The result of such an approach is that we are now in a position to measure the additional hidden benefi t a vaccine can off er, showing an improved summary score in QoC with better patient care, more staff time, reduced spread of infectious disease in hospitals and more resources to apply on other disease areas. The QoC score can be used to predict periods of stress and identify problems to tackle during day to day management. Using the quantitative QoC score it may help to fi nd more objective ways of analysing the issues of healthcare service stress and the benefi t impact of new interventions.
METHODS
Hospital se� ingHospital se� ingThe study was conducted at the Jessa Hospital in Hasselt, Belgium, which is also part of another rotavirus vaccine study [33]. Rotavirus vaccination was introduced in the region following the recommendation of the Flemish High Committee for Public Health Services (Hoge Gezondheidsraad). The hospital has 34 paediatric beds, and its database was electronically accessible. Its catchment area was uniform during the study period and there were no major management changes, allowing comparisons between pre- and post-vaccination periods. Ethical approval for the study was obtained in December 2012.
VariablesThe hospital’s existing database provided data on the following variables relating to management of patient beds and staff , measured per day that could be used for the construction of the QoC score:
• Bed-day occupancy number and rate (BDOR): Number of beds occupied/number of beds available per day;
• Bed-day turnover rate (BTOR): Number of patients discharged/number of beds available per day;
• Unplanned readmission rate (UnPln): Number of readmissions ≤7 days after discharge/total number of discharges per day;
• Rotavirus test rate and positive results (RVT): Number of tests performed per day and rate of positive test results;
• RVGE nosocomial infection rate (RVNR): number of RVGE nosocomial infections/total number of RVGE hospitalisations per day

Exploring new ways of measuring the economic value of vaccination
132
• RVGE specifi c death rate (RVDR): number of RVGE specifi c deaths/total number of RVGE hospitalisations per day
• Hospitalisation rate (HR): number of hospitalisations/total number of children in the catchment area per day
• Full-time equivalent staff per day (FTE): Total number of hours worked by the personnel per day/7.6;
• Over-time work by the staff per day (OTW): Total number of extra hours taken by the personnel/total number of regular hours per day;
• Sickness leave by the staff per day (SLT): Total number of paid and unpaid sick days/total number of FTEs per day.
• Staff replacement per day (SR): number of replacement of staff /total number of staff present per day.
These variables were analysed descriptively and used to construct the QoC scores. First, the numbers per day were assembled to observe whether their distributions were normal. If not, the data were transformed using log-transformation, square-root or other methods until a normal or near-normal distribution was reached. Quintiles were then calculated in eight groups (5th, 10th, 25th, 50th, 75th, 90th, 95th, >95th) and each variable value per day was given a score of 1–8 according to its quintile category. We selected 8 categories in order to get enough granularity in the spread of the variable values. By not selecting too few or too many categories it may impact the analysis with too many empty cells or not enough sensitive correlation between variables. It should be noted that the end results (average daily QoC-scores) were analysed by grouping period of pre-vaccination and post-vaccination, pooling therefore the numbers of several years. We have also split the evaluation period within a year as rotavirus epidemic period or not. It is expected that the diff erence in QoC scores are enhanced if we consider those periods separately instead of a full year analysis that may dilute the impact with a period where no diff erence in results is expected when comparing pre-post vaccination in the non-epidemic seasons.
Meanwhile the following variables (RVNR; RVDR; HR; SR) were deleted from the fi rst analysis. The event numbers were too small (no deaths and no replacement during the observation period) or showed no meaningful change over time, so these variables were not considered further. This was especially the case for RVNR that with 87 nosocomial infection observations over a 2557 day period was too low to obtain a meaningful result. Pooling results from diff erent hospitals should enhance the analysis or considering a shorter time period for the assessment such as week observations instead of day observation could have been another approach to circumvent the obstacle of too few observations. Meanwhile changing the unit of observation may impact the calculation process when the data have been collected on a day to day basis. But it is certainly an option to consider when the analysing the data of only one center.
Study periodStudy periodData were collected for the period between 1 January 2004 and 31 December 2009, divided into a pre-vaccination period (before November 2006) and a post-
Chapter 4
133
vaccination period (after November 2006). Winter epidemic months were defi ned as 1 January to 31 March.
Between 2004 and 2009, there were 2,557 days of which 632 (24.7%) days were during the winter. Of the winter days, 271 (42.9%) days were during the pre-vaccination period and 361 (57.1%) days were during the post-vaccination period. In the current analysis presented here we only demonstrate the results of the winter or the rotavirus epidemic period. We did an analysis of the non-epidemic period as well but that is reported in the supplement of Appendix 1.
PatientsThe study included data on all patients admitted to the paediatric ward over the study period, stratifi ed into three groups:
• Overall population (all admissions); • Infection-only population (patients admitted for infectious disease of any kind); • AGE population (patients in the infection-only group admitted specifi cally for
AGE).
Data analysisData analysis
DescriptiveSummary descriptive statistics are reported for each variable selected for calculating the QOC scores with no statistical signifi cance level reported per specifi c period evaluated for each variable. We did this on purpose as the focus of the study is on the measurement of the QoC scores and not on the individual variable results used to calculate the QoC scores.
AnalyticalA summary QoC score for hospital care should integrate data from several variables to provide a useful overall measure. Explanatory Factor Analysis (EFA) [34] is a statistical method that assesses whether a number of observed variables are linearly related to a smaller number of unobservable Factors. We used EFA to derive two Factors from the observed variables. A scree plot indicated that only two Factors could be constructed from the data. These two Factors can be summed to produce a summary QoC score if the Factors are independent from each other. Before conducting the EFA, the observed data were standardised into eight quintiles as described above in order to be able to assemble them correctly together.
The EFA was conducted in several steps. First, the dataset was analysed with specifi c tests to assess whether EFA can be applied [35], constructing a correlation matrix for the pairwise correlation coeffi cients between the variables. The EFA should meet three objectives: it should be parsimonious (minimum number of new explanatory Factors created to explain the observed data); the new Factors should be independent of each other as far as possible; and the Factor scores should make sense (e.g. a Factor score about staff management should be driven
Exploring new ways of measuring the economic value of vaccination
134
by variables such as overtime and sick leave). Second, the Principal Component Method (PCM) confi rmed that two explanatory Factors could be derived. Third, each Factor was constructed with specifi c factor loadings using varimax rotation because of the independence of each Fatcor. Finally, the weighting coeffi cient of each variable in the equation that produces the Factor was adjusted after rotation.
Using the seven variables listed above, two new measures were constructed, Factor 1 (bed management) and Factor 2 (staff management). The daily score for each Factor was calculated with a regression equation of all selected variables. The sum of the two Factors is the summary QoC score. Higher scores indicate worse QoC. The Factor scores and QoC scores were compared between pre- and post-vaccination periods using the T-test, for each patient group in each season (winter and non-winter). All analyses were conducted using IBM SPSS Statistics v22.0.IBM SPSS Statistics v22.0.IBM SPSS Statistics
Summary results for each Factor and QoC scores are presented in this paper. A full EFA analysis showing the calculation of the regression coeffi cients and Factors for one period (winter) and one patient group (overall) is provided in the supplementary Appendix 1.
REFERENCES[1] Forster J, Guarino A, Parez N, Moraga F, Roman E, Mory O, et al. Hospital-
based surveillance to estimate the burden of rotavirus gastroenteritis among European children younger than 5 years of age. Pediatrics 2009 Mar;123(3):e393-e400.
[2] Giaquinto C, Van Damme P, Huet F, Gothefors L, Maxwell M, Todd P, et al. Clinical consequences of rotavirus acute gastroenteritis in Europe, 2004-2005: the REVEAL study. J Infect Dis 2007;195 Suppl 1:S26-S35.
[3] Giaquinto C, Van DP. Age distribution of paediatric rotavirus gastroenteritis cases in Europe: the REVEAL study. Scand J Infect Dis 2010;42(2):142-7.
[4] Ducoff re G, Wuillaume F. Surveillance of Infl uenza A and Respiratory Syncytial Virus by the Belgian Sentinal Laboratory Network. Arch Public Health 2010;86(1):83-4.
[5] Eidelman AI, Megged O, Feldman R, Toker O. The burden of respiratory syncytial virus bronchiolitis on a pediatric inpatient service. Isr Med Assoc J 2009 Sep;11(9):533-6.
[6] Aiken LH, Clarke SP, Sloane DM, Sochalski J, Silber JH. Hospital nurse staffi ng and patient mortality, nurse burnout, and job dissatisfaction. JAMA 2002 Oct 23;288(16):1987-93.
[7] Virtanen M, Pentti J, Vahtera J, Ferrie JE, Stansfeld SA, Helenius H, et al. Overcrowding in hospital wards as a predictor of antidepressant treatment among hospital staff . Am J Psychiatry 2008 Nov;165(11):1482-6.
[8] Richardson DB, Mountain D. Myths versus facts in emergency department overcrowding and hospital access block. Med J Aust 2009 Apr 6;190(7):369-74.
[9] Forster AJ, Stiell I, Wells G, Lee AJ, van WC. The eff ect of hospital occupancy on emergency department length of stay and patient disposition. Acad Emerg Med 2003 Feb;10(2):127-33.

Chapter 4
135
[10] Van Damme P, Giaquinto C, Huet F, Gothefors L, Maxwell M, Van der WM. Multicenter prospective study of the burden of rotavirus acute gastroenteritis in Europe, 2004-2005: the REVEAL study. J Infect Dis 2007 May 1;195 Suppl 1:S4-S16.
[11] Van der Wielen M., Giaquinto C, Gothefors L, Huelsse C, Huet F, Littmann M, et al. Impact of community-acquired paediatric rotavirus gastroenteritis on family life: data from the REVEAL study. BMC Fam Pract 2010;11:22.
[12] Keegan AD. Hospital bed occupancy: more than queuing for a bed. Med J Aust 2010 Sep 6;193(5):291-3.
[13] Miles TA, Lowe J. Are unplanned readmissions to hospital really preventable? J Qual Clin Pract 1999 Dec;19(4):211-4.
[14] Ashton CM, Kuykendall DH, Johnson ML, Wray NP, Wu L. The association between the quality of inpatient care and early readmission. Ann Intern Med 1995 Mar 15;122(6):415-21.
[15] Heggestad T, Lilleeng SE. Measuring readmissions: focus on the time factor. Int J Qual Health Care 2003 Apr;15(2):147-54.
[16] Giaquinto C, Dominiak-Felden G, Van DP, Myint TT, Maldonado YA, Spoulou V, et al. Summary of eff ectiveness and impact of rotavirus vaccination with the oral pentavalent rotavirus vaccine: a systematic review of the experience in industrialized countries. Hum Vaccin 2011 Jul;7(7):734-48.
[17] do Carmo GM, Yen C, Cortes J, Siqueira AA, de Oliveira WK, Cortez-Escalante JJ, et al. Decline in diarrhea mortality and admissions after routine childhood rotavirus immunization in Brazil: a time-series analysis. PLoS Med 2011 Apr;8(4):e1001024.
[18] Parez N, Giaquinto C, Du RC, Martinon-Torres F, Spoulou V, Van DP, et al. Rotavirus vaccination in Europe: drivers and barriers. Lancet Infect Dis 2014 May;14(5):416-25.
[19] Van Damme P, Van der Wielen M, Ansaldi F, Desgrandchamps D, Domingo JD, Sanchez FG, et al. Rotavirus vaccines: considerations for successful implementation in Europe. Lancet Infect Dis 2006 Dec;6(12):805-12.
[20] Buttery JP, Lambert SB, Grimwood K, Nissen MD, Field EJ, Macartney KK, et al. Reduction in rotavirus-associated acute gastroenteritis following introduction of rotavirus vaccine into Australia’s National Childhood vaccine schedule. Pediatr Infect Dis J 2011 Jan;30(1 Suppl):S25-S29.
[21] Braeckman T, Van HK, Raes M, Vergison A, Sabbe M, Van DP. Rotavirus vaccines in Belgium: policy and impact. Pediatr Infect Dis J 2011 Jan;30(1 Suppl):S21-S24.
[22] Raes M, Strens D, Vergison A, Verghote M, Standaert B. Reduction in pediatric rotavirus-related hospitalizations after universal rotavirus vaccination in Belgium. Pediatr Infect Dis J 2011 Mar 23;30(7):120-5.
[23] Braeckman T, Theeten H, Lernout T, Hens N, Roelants M, Hoppenbrouwers K, et al. Rotavirus vaccination coverage and adherence to recommended age among infants in Flanders (Belgium) in 2012 1. Euro Surveill 2014;19(20).
[24] Anderson EJ, Rupp A, Shulman ST, Wang D, Zheng X, Noskin GA. Impact of rotavirus vaccination on hospital-acquired rotavirus gastroenteritis in children. Pediatrics 2011 Feb;127(2):e264-e270.
Exploring new ways of measuring the economic value of vaccination
136
[25] Ogilvie I, Khoury H, Goetghebeur MM, El Khoury AC, Giaquinto C. Burden of community-acquired and nosocomial rotavirus gastroenteritis in the pediatric population of Western Europe: a scoping review. BMC Infect Dis 2012;12:62.
[26] Sprivulis PC, Da Silva JA, Jacobs IG, Frazer AR, Jelinek GA. The association between hospital overcrowding and mortality among patients admitted via Western Australian emergency departments. Med J Aust 2006 Mar 6;184(5):208-12.
[27] Tarnow-Mordi WO, Hau C, Warden A, Shearer AJ. Hospital mortality in relation to staff workload: a 4-year study in an adult intensive-care unit. Lancet 2000 Jul 15;356(9225):185-9.
[28] Aiken LH, Clarke SP, Sloane DM, Sochalski J, Silber JH. Hospital nurse staffi ng and patient mortality, nurse burnout, and job dissatisfaction. JAMA 2002 Oct 23;288(16):1987-93.
[29] Virtanen M, Pentti J, Vahtera J, Ferrie JE, Stansfeld SA, Helenius H, et al. Overcrowding in hospital wards as a predictor of antidepressant treatment among hospital staff . Am J Psychiatry 2008 Nov;165(11):1482-6.
[30] James SA, Kleinbaum DG. Socioecologic Stress and Hypertension-related mortality rates in North Carolina. Amer J Public Health 1976;66(4):354-8.
[31] Logie CH, Earnshaw V. Adapting and Validating a Scale to Measure Sexual Stigma among Lesbian, Bisexual and Queer Women 1. PLoS One 2015;10(2):e0116198.
[32] Harman H. Modern Factor Analysis. 3rd edition ed. Chicago: University of Chicago Press; 1976.
[33] Standaert B, Gomez JA, Raes M, Debrus S, Velazquez FR, Postma MJ. Impact of rotavirus vaccination on hospitalisations in Belgium: comparing model predictions with observed data. PLoS One 2013;8(1):e53864.
[34] Kleinbaum D, Kupper L. Applied regression analysis and other multivariable methods. Boston, Massachusetts: Duxburt Press; 1978.
[35] Norusis M. SPSS Professional Statistics 6.1. Chicago, IL: SPSS Inc; 1994.
APPENDIX 1: EXTENDED REPORT ON EFA – ALL WINTER – ALL WINTER –PERIODS (JAN TO MARCH), OVERALL (1) & COMPARISON OF WINTER & NON-WINTER PERIODS (2)
EXTENDED REPORT ON EFA
Variable selectionTwo main groups of evaluation were considered: variables for bed management and variables for staff management.
• Bed management includes 7 variables: bed occupancy rate/day, bed turnover Bed management includes 7 variables: bed occupancy rate/day, bed turnover Bed managementrate/day, unplanned readmission rate/day, RVGE infection rate/day, RVGE nosocomial infection rate/day, RVGE specifi c death rate/day, and hospitalization rate/day per 100,000 children.
Chapter 4
137
• Staff management includes 4 variables: full-time equivalent/day, overtime Staff management includes 4 variables: full-time equivalent/day, overtime Staff managementwork/day, sick-leave/day, staff replacement/day.
Four variables (death rates, hospitalization rates, RVGE nosocomial infection rate, staff replacement), were excluded due to the following reasons:
• No specifi c RVGE deaths were reported during the observation period
• Hospitalization rates per 100,000 people were calculated per age-group (i.e. age-specifi c rates) using the Flanders population as standard population. No much demographic variation was observed during the observation period. In the absence of any variation during the observation period this variable is therefore not suitable for the analysis. The variable could have been useful if important migration was observed or a high change in birth rate per year in the region.
• Too small number of RVGE nosocomial infection were reported (87 cases over the 6 year period)
• No staff replacement was reported during the observation period
Rates for bed-day occupancy (BDOR), bed turnover (BTOR), unplanned readmissions within 7 days after discharge (UnPln), and Full-time equivalent (FTE) were calculated using formulas given in Horton L.A. (2007) by the American Health Information Management Association (AHIMA).
Rates were calculated for 3 groups of patients: all hospitalizations (Overall), infection only (Infection Only), and Acute Gastro Enteritis (AGE). In this exercise here, we only present the calculation of the EFA for Overall and for the winter period only. Normally 6 EFA runs have been done to calculate for every season and every study period the scores.
For RVGE infection (RVGE -WM) the % of positive tests (Nr of positive tests divided by the Nr of RV tests) is calculated for all 775 days between 1/06/2005 through 31/12/2009.
For overtime work (OTR) (= overtime hours/regular hours) and sick-leaves (SLR) (= total paid and unpaid sick days/number of employees in the same period) were calculated per day.
Rates were checked for normality distribution and transformed to obtain normal distributions using log-normal transformation, square-roots transformation or other methods. Results were then subdivided into 8 groups using their percentiles (≤5th, 10th, 25th, 50th, 75th, 90th, 95th, and >95th).
Due to the nature of the data a signifi cant number of days were event-free: no UnPln, no SLR, and no OTR.

Exploring new ways of measuring the economic value of vaccination
138
• As a result 1,120 days (43.8%) for SLR, 2,187 days (85.5%) for OTR, and 1,435 days (56.1%) for UnPln were zeros.
• For RVGE tests 523 out of the 775 days (67.5%) have zero denominators.
Explanatory Factor AnalysisExplanatory Factor AnalysisFactor analysis is a method for investigating whether a number of variables of interest Y
1, Y
2,…, Y
l, are linearly related to a smaller number of unobservable
factors F1, F
2, …, F
k (i.e. latent variables).
Explanatory Factor Analysis (EFA) is used with principal component method (PCM) for the number of factor extractions and direct oblimin (oblique factors or direct oblimin (oblique factors or direct oblimincorrelated factors) or varimax (for orthogonal or independent factors) for factor varimax (for orthogonal or independent factors) for factor varimaxrotation function that selects the variables most closely related to each factor extraction in order to obtain the right weights per variable selected.
Running EFA generates the following outputs:• Correlation matrix depicts correlation coeffi cients between each pair of orrelation matrix depicts correlation coeffi cients between each pair of orrelation matrix
variables. There are two potential problems: • Correlations are not high enough. If a variable seems to have very low
correlations with many other variables, it is excluded from the analysis. • Highly correlated variables are another problem (extreme multi-collinearity
and singularity (variables that are perfectly correlated)). They make it impossible to determine the unique contribution to a factor of the variables that are highly correlated.
• Bartlett’s test of Sphericity tests whether the correlation matrix resembles Bartlett’s test of Sphericity tests whether the correlation matrix resembles Bartlett’s test of Sphericityan identity matrix or is signifi cantly diff erent from an identity matrix. If the test is signifi cant, it means that the correlations between variables are overall signifi cantly diff erent from zero (good news). Non-signifi cant Bartlett’s test is a concern.
• Haitovsky (1969) proposed a signifi cance test whether the determinant is zero (i.e. matrix is singular). If the test is signifi cant it tells that the correlation matrix is signifi cantly diff erent from a singular matrix which implies that there is no severe multi-collinearity.
• Anti-image correlation which gives Kaiser-Meyer-Olkin (KMO) values, is a Anti-image correlation which gives Kaiser-Meyer-Olkin (KMO) values, is a Anti-image correlationmeasure of sampling adequacy (MSA). A value of 0.5 is the bare minimum. If a variable has a KMO <0.50, it must be dropped from the analysis.
• Total variance explained by each variableTotal variance explained by each variableTotal variance explained• Scree plot (component on the x-axis versus their eigenvalues on the y-axis) to Scree plot (component on the x-axis versus their eigenvalues on the y-axis) to Scree plot
select the number of new extraction factors.• Communalities- measures the proportion of variance explained by the extracted
factors given per variable,• Reproduced correlation matrix - gives correlation coeffi cients based on the factor Reproduced correlation matrix - gives correlation coeffi cients based on the factor Reproduced correlation matrix
model. To assess the fi t of the model, we look at the residuals (diff erences between observed and fi tted model). The smaller the residuals, the better the fi t,
Chapter 4
139
• Component correlation matrix - depicts the correlation coeffi cient between the Component correlation matrix - depicts the correlation coeffi cient between the Component correlation matrixextracted factors.
• If the extracted factors are correlated (case one), then assumption of dependent factors is suggested and the oblique rotation (oblimin method) will be used to calculate the appropriate weighting values.
• If the extracted factors are not correlated (case two), then we run factor analysis with the use of an orthogonal factor rotation (varimax method) for independent factors.
• When factors are dependent (case one), we got the Pattern Matrix (contains Pattern Matrix (contains Pattern Matrixthe regression coeffi cients for each variable on each extracted factor), the Structure Matrix (contains correlation coeffi cients between each variable and Structure Matrix (contains correlation coeffi cients between each variable and Structure Matrixfactor), and the Component Score Coeffi cients per variable and per extracted Component Score Coeffi cients per variable and per extracted Component Score Coeffi cientsFactor, for which Factor scores can be calculated per measurement day. Factor scores can be calculated per measurement day. Factor scores
• When factors are independent (case two), we got the Rotated Component Matrix which is the matrix of the factor loadings for each variable into each Matrix which is the matrix of the factor loadings for each variable into each Matrixextracted factor, and the Component Score Coeffi cients Matrix, for which the Factor scores can be calculated.
• Final output is the Factor transformation matrix. If the orthogonal (e.g. varimax) rotation were completely appropriate then we would expect a symmetrical matrix (i.e. same value above and below the diagonal).
Period score calculations• The dataset has been subdivided by months (winter months: 1st of January to
31st of March & other months: 1st of April through 31st December) for defi ning the epidemic periods of rotavirus during the year which it is expected that the Factor scores will be diff erent after the introduction of the vaccine, and by study period (pre- & post-vaccination).
• The rates for bed day management (bed-day occupancy, bed-turnover, and unplanned readmission ≤7 days after discharge) were calculated for Overall, Infection-Only, and AGE hospitalizations.
• The rates for staff management (FTE, Overtime and Average sick-leaves) were calculated for the Overall data only as it was impossible to defi ne staff to infection only and to AGE only during the observation period.
• Factor Analysis of data was repeated 6 times. First three runs during winter months for Overall, Infectious-driven and AGE-driven hospitalizations. Second three runs were during other months for Overall, Infectious-driven and AGE-driven hospitalizations.
• We present here the EFA analysis for winter period only, Overall, as an example.
Factor scoresFollowing an exploratory factor analysis (EFA), factor scores are computed and used in subsequent analyses. Since both principal components and common factor extraction methods is used with EFA, a refi ned method is going to be used, namely the Anderson-Rubin (A-R) method. The A-R method is a variation of the Bartlett procedure, in which the least square formula is adjusted to produce factor scores that are not only uncorrelated with other factors, but also uncorrelated with each other.
Exploring new ways of measuring the economic value of vaccination
140
Computation procedures consist of multiplying the vector of observed variables by the inverse of a diagonal matrix of the variances of the unique factor scores, and the factor pattern matrix of loadings for the observed variables. Results are then multiplied by the inversion of the symmetric square root of the matrix product obtained by multiplying the matrices of eigenvectors and eigenvalues (Formulae below). The resulting factor scores are orthogonal, with a mean of 0 and a standard deviation of 1. The A-R scores are automatically generated in SPSS by selecting the Anderson and Rubin option in the Factor Analysis.
A-R = F1xm
= Z1xn
U-2nxn
Anxm
H-1/2; and Gnxn
= XnxnΛ
Dnxn X’
nxn
where n: is the number of observed variables, m: number of factors, F: the row vector of m estimated factor scores, Z: the row vector of n standardized observed variables, X and X’: matrices of n x n eigenvectors, Λ
D: the n x n matrix of
eigenvalues, G: the matrix product of eigenvalues and eigenvectors, and G-1/2: the inverse of the symmetric square root of G.
The calculated A-R scores per Factor is then used to assess, using two-sided t-test for independent-samples, whether factor scores were statistically diff erent between pre- and post-vaccination periods. Elevated A-R scores per extracted factor, indicates excessive burdens (i.e. higher: bed-day occupancy rates, bed turnover rates, unplanned readmission rates, overtime work, average sick-leaves and more FTE needed).
Levene’s test was used to assess the equality of variances in the A-R scores. If the test was not signifi cant, the two variances are assumed to be equal. Consequently, the t-test will be selected accordingly.
RESULTS
Factor Analysis – winter monthsFactor Analysis – winter monthsDuring the epidemic months (January 1st through March 31st) there were a total of 632 days of which 271 days (43%) were during the pre-vaccination period and 361 days (57%) during the post-vaccination period. As we include the data of testing for RVGE with only 268 days of observation during the winter months, the total analysis for the winter period relies on 268 days of observation.
Frequency distribution of data (percentiles) is shown below in Table 1.
For overall data (n= 268) during winter months, Factor Analysis was repeated 4 times and summary of the results is shown below in Table 2. In the fi nal run (4th), UnPln and OTR were excluded from the analysis due to their individual KMO values being under the bare-minimum of 0.50.
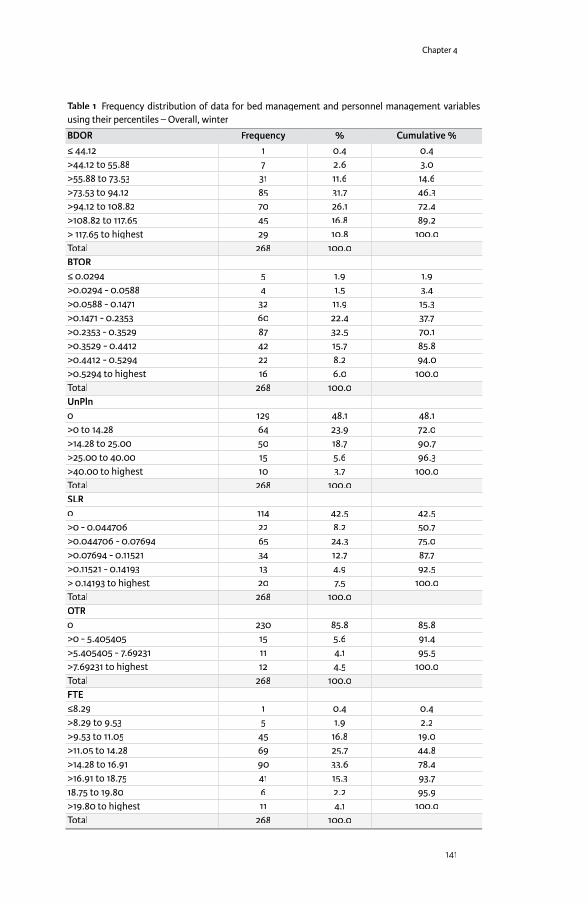
Chapter 4
141
Table 1 Frequency distribution of data for bed management and personnel management variables using their percentiles – Overall, winter
BDOR Frequency % Cumulative %≤ 44.12 1 0.4 0.4>44.12 to 55.88 7 2.6 3.0>55.88 to 73.53 31 11.6 14.6>73.53 to 94.12 85 31.7 46.3>94.12 to 108.82 70 26.1 72.4>108.82 to 117.65 45 16.8 89.2> 117.65 to highest 29 10.8 100.0Total 268 100.0BTOR≤ 0.0294 5 1.9 1.9>0.0294 - 0.0588 4 1.5 3.4>0.0588 - 0.1471 32 11.9 15.3>0.1471 - 0.2353 60 22.4 37.7>0.2353 - 0.3529 87 32.5 70.1>0.3529 - 0.4412 42 15.7 85.8>0.4412 - 0.5294 22 8.2 94.0>0.5294 to highest 16 6.0 100.0Total 268 100.0UnPln 0 129 48.1 48.1>0 to 14.28 64 23.9 72.0>14.28 to 25.00 50 18.7 90.7>25.00 to 40.00 15 5.6 96.3>40.00 to highest 10 3.7 100.0Total 268 100.0SLR0 114 42.5 42.5>0 - 0.044706 22 8.2 50.7>0.044706 - 0.07694 65 24.3 75.0>0.07694 - 0.11521 34 12.7 87.7>0.11521 - 0.14193 13 4.9 92.5> 0.14193 to highest 20 7.5 100.0Total 268 100.0OTR0 230 85.8 85.8>0 - 5.405405 15 5.6 91.4>5.405405 - 7.69231 11 4.1 95.5>7.69231 to highest 12 4.5 100.0Total 268 100.0FTE≤8.29 1 0.4 0.4>8.29 to 9.53 5 1.9 2.2>9.53 to 11.05 45 16.8 19.0>11.05 to 14.28 69 25.7 44.8>14.28 to 16.91 90 33.6 78.4>16.91 to 18.75 41 15.3 93.718.75 to 19.80 6 2.2 95.9>19.80 to highest 11 4.1 100.0Total 268 100.0

Exploring new ways of measuring the economic value of vaccination
142
Varimax rotation (independent factors) was used instead of the oblique rotation (related factors) since the extracted factors were not correlated. Excluding the two variables has improved the results signifi cantly (see last row of Table 2).
Table 2 Summary of the results from running Factor Analysis (Overall data)
Run Nr
Rotation Method
Determinant (R)
KMO Bar� let’s test
df % variance explained
Nr of extracted Factors
MSA* <0.50
1 oblique 0.297 0.576 320.6 21 67.04 3 UnPln-OTR2 varimax 0.297 0.576 320.6 21 67.04 3 UnPln-OTR3 varimax 0.347 0.595 279.9 15 57.70 2 OTR4 varimax 0.379 0.614 256.5 10 66.5 2 None
*measure of sampling adequacy
Table 3 shows the R-matrix (correlation matrix). The fi rst half contains Pearson’s correlation coeffi cients between all pairs of variables whereas the bottom half contains the 1-tailed signifi cance level of these coeffi cients. The correlation between SLR and FTE was statistically not signifi cant. The correlation between RVGE-WM (Winter Months) and BTOR was weak (p= 0.059). The highest correlation coeffi cient was between BDOR and BTOR (r= 0.666). The Anti-image matrix has shown that the measure of sampling adequacy (MSA) for all remaining variables were above the bare minimum of 0.5 (Kaiser, 1974).3
Table 3 The correlation matrix1
Variables BDOR BTOR FTE SLR RVGE-WMBDOR 1.000 0.666 0.270 0.322 0.243BTOR 0.666 1.000 0.312 0.224 0.096FTE 0.270 0.312 1.000 0.006 -0.138SLR 0.322 0.224 0.006 1.000 0.278RVGE-WM 0.243 0.096 -0.138 0.278 1.000Sig.(1-tailed)BDOR 0.000 0.000 0.000 0.000BTOR 0.000 0.000 0.000 0.059FTE 0.000 0.000 0.460 0.012SLR 0.000 0.000 0.460 0.000RVGE-WM 0.000 0.059 0.012 0.000
1: Determinant (R) = 0.379
We re-run the factor analysis for this data without UnPln and we used orthogonal rotation (varimax) since the correlation coeffi cients between the extracted factors were very weak (Component correlation matrix). So, it is reasonable to assume independence between the extracted Factors.
As a result, the determinant of R-matrix has increased to 0.379. The value of this determinant is vital for testing for multicollinearity or singularity that must be > 0.00001.
3 Kaiser, Henry. An Index of Factorial Simplicity. F.Psychometrika, 39, 1, 31-6, Mar 74

Chapter 4
143
With a sample of 268 (N), 5 variables (p) and a determinant of 0.379 gives Haitovsky’s Chi-Square test score of 86.52 with 10 degrees of freedom (p*(p-1)/2). The observed value is greater than the critical value of 23.21 (for 1% level of signifi cance). In addition, the KMO measure of sampling adequacy increased to 0.614, and total variance explained has increased to 66.5% (with two factors). Bartlett’s test of Sphericity (approx. chi-square) of 256.592 (with 10 degrees of freedom) was highly signifi cant indicating that Factor analysis is an appropriate method for analysing the data.
The KMO values for individual variables are given on the diagonal of the anti-image correlation matrix in Table 4 below. KMO values (given along the diagonal) were all above the bare minimum of 0.50 (between 0.563 and 0.736). The partial correlations and covariance are given on the off -diagonal.
Table 4 Anti-image correlations for bed and staff management variables
Variables BDOR BTOR FTE SLR RVGE-WMAnti-image CovarianceBDOR 0.496 -0.312 -0.093 -0.124 -0.136BTOR -0.312 0.535 -0.115 -0.029 0.041FTE -0.093 -0.115 0.856 0.042 0.163SLR -0.124 -0.029 0.042 0.851 -0.176RVGE-WM -0.138 0.041 0.163 -0.176 0.856Anti-image CorrelationBDOR 0.591a -0.607 -0.143 -0.19 -0.212BTOR -0.607 0.598a -0.171 -0.043 0.061FTE -0.143 -0.171 0.681a 0.050 0.191Avg. SL -0.190 -0.043 0.050 0.736a -0.206RVGE-WM -0.212 0.061 0.191 -0.206 0.563a
Table 5 labelled as Total variance explained, gives initial eigenvalues (un-rotated) before extraction, after extraction (Extraction Sums of Squared loadings) and after rotation (Rotation Sums of Squared loading). The list of the eigenvalues associated with each factor before extraction equal nr of variables. The % of variance explained by Factor 1 is 41.1% of the total variance, followed by 25.38% by Factor 2 (i.e. Total variance explained is 66.5%).
Table 5 Total Variance explained
Initial Eigenvalues Extraction SS Loadings Rotation SS LoadingsNbr of ComponentComponent
Total % of variance
Cum. % Total % of variance
Cum. % Total % of variance
Cum. %
1 2.056 41.123 41.123 2.056 41.123 41.123 1.863 37.257 37.2572 1.269 25.379 66.502 1.269 25.379 66.502 1.462 29.246 66.5023 0.709 14.170 80.6724 0.652 13.036 93.7085 0.315 6.292 100.000
SS: Sums of Squared; Extraction method: Principal Component Analysis
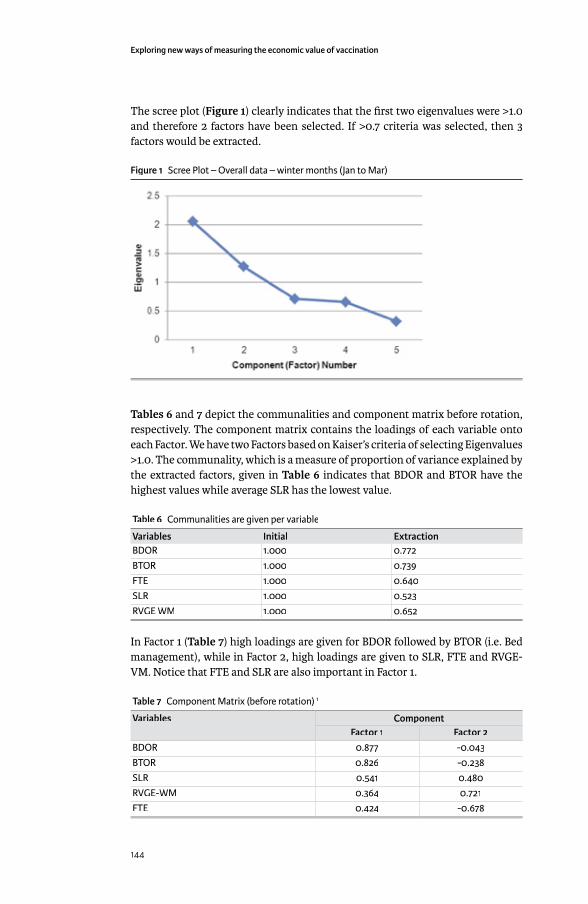
Exploring new ways of measuring the economic value of vaccination
144
The scree plot (Figure 1) clearly indicates that the fi rst two eigenvalues were >1.0 and therefore 2 factors have been selected. If >0.7 criteria was selected, then 3 factors would be extracted.
Figure 1 Scree Plot – Overall data – winter months (Jan to Mar)
Tables 6 and 7 depict the communalities and component matrix before rotation, respectively. The component matrix contains the loadings of each variable onto each Factor. We have two Factors based on Kaiser’s criteria of selecting Eigenvalues >1.0. The communality, which is a measure of proportion of variance explained by the extracted factors, given in Table 6 indicates that BDOR and BTOR have the highest values while average SLR has the lowest value.
Table 6 Communalities are given per variable
Variables Initial ExtractionBDOR 1.000 0.772BTOR 1.000 0.739FTE 1.000 0.640SLR 1.000 0.523RVGE WM 1.000 0.652
In Factor 1 (Table 7) high loadings are given for BDOR followed by BTOR (i.e. Bed management), while in Factor 2, high loadings are given to SLR, FTE and RVGE-VM. Notice that FTE and SLR are also important in Factor 1.
Table 7 Component Matrix (before rotation) 1
Variables ComponentFactor 1 Factor 2
BDOR 0.877 -0.043BTOR 0.826 -0.238SLR 0.541 0.480RVGE-WM 0.364 0.721FTE 0.424 -0.678
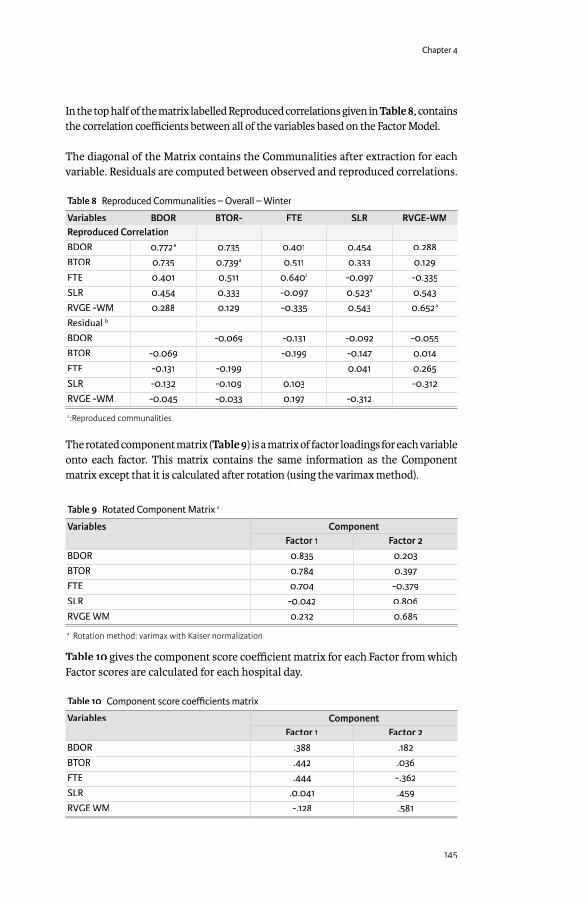
Chapter 4
145
In the top half of the matrix labelled Reproduced correlations given in Table 8, contains the correlation coeffi cients between all of the variables based on the Factor Model.
The diagonal of the Matrix contains the Communalities after extraction for each variable. Residuals are computed between observed and reproduced correlations.
Table 8 Reproduced Communalities – Overall – Winter
Variables BDOR BTOR- FTE SLR RVGE-WMReproduced CorrelationBDOR 0.772a 0.735 0.401 0.454 0.288BTOR 0.735 0.739a 0.511 0.333 0.129FTE 0.401 0.511 0.640a -0.097 -0.335SLR 0.454 0.333 -0.097 0.523a 0.543RVGE -WM 0.288 0.129 -0.335 0.543 0.652a
Residual b
BDOR -0.069 -0.131 -0.092 -0.055BTOR -0.069 -0.199 -0.147 0.014FTE -0.131 -0.199 0.041 0.265SLR -0.132 -0.109 0.103 -0.312RVGE -WM -0.045 -0.033 0.197 -0.312
a:Reproduced communalities
The rotated component matrix (Table 9) is a matrix of factor loadings for each variable onto each factor. This matrix contains the same information as the Component matrix except that it is calculated after rotation (using the varimax method).
Table 9 Rotated Component Matrix a
Variables ComponentFactor 1 Factor 2
BDOR 0.835 0.203BTOR 0.784 0.397FTE 0.704 -0.379SLR -0.042 0.806RVGE WM 0.232 0.685
a: Rotation method: varimax with Kaiser normalization
Table 10 gives the component score coeffi cient matrix for each Factor from which Factor scores are calculated for each hospital day.
Table 10 Component score coeffi cients matrix
Variables ComponentFactor 1 Factor 2
BDOR .388 .182BTOR .442 .036FTE .444 -.362SLR .0.041 .459RVGE WM -.128 .581

Exploring new ways of measuring the economic value of vaccination
146
The fi nal output is the Factor transformation matrix and if the orthogonal rotation was completely appropriate, we expect a symmetrical matrix (see below).
Component Factor 1 Factor 2Factor 1 0.869 0.496Factor 2 - 0.496 0.869
ANDERSON-ROBIN (A-R) FACTOR SCORES & T-TEST FOR EQUALITY OF MEANFactor scores are calculated per extracted Factor using the A-R method. Independent sample t-test is used to assess whether factor scores were statistically diff erent between pre- and post-vaccination for each Factor. Levene’s test was used to assess whether or not the variances can be assumed to be equal. For Factor 1, Levene’s test result of 4.228 was statistically signifi cant, p= 0.041, equal variances cannot therefore be assumed. While for Factor 2, Levene’s test of 0.341 was not signifi cant (p= 0.560), equal variances can be assumed. The results of the t-test are therefore selected accordingly (Table 12). Table 11 depicts descriptive statistics for factor scores per Factor and study period. For Factor 1, average A-R score were similar between Pre- and Post-vaccination (t-test= 1.034; p= 0.302), while for Factor 2, the average A-R scores were signifi cantly higher during the pre-vaccination period compared with post-vaccination (t-test= 10.309; p<0.001).
Table 11 Descriptive statistics for A-R Factor scores per Factor & study period (Overall, Winter)
A-R Scores Study Period N Mean Std. Deviation Std. Error MeanFactor 1 Pre-vac 139 -0.0612 0.9088 0.0770
Post-vac 129 0.0659 1.0894 0.0959Factor 2 Pre-vac 139 0.5145 0.8213 0.0696
Post-vac 129 -0.5544 0.7525 0.0768
Table 12 Independent sample t-test for A-R Factor 1 and 2 scores by study period (pre- versus post-vaccination)
Scores Group
Levene’s test
Sig. Level t-test Sig. (2-tailed)
Mean Diff . Std. Error Diff .
95% CI of the Diff .Lower Upper
A-R Factor 1 4.228 0.041 -1.034 0.302 -0.1272 0.1230 -0.3695 0.1151A-R Factor 2 0.341 0.000 10.332 0.000 1.0690 0.1034 0.8653 1.2727
Comparing the epidemic winter data with the non-epidemic non-winter data
Table 1 Total number of rotavirus tests and rotavirus-positive tests by season and study period
Pre-vaccination (2005–2006) Post-vaccination (2007–2009)RV tests, n RV-
positive tests, n
% RV-positive
RV tests, n RV-positive tests, n
% RV-positive
January to March (winter season)
290 165 56.9% 209 48 23.0%
April to December (non-winter season)
196 41 20.9% 512 86 16.8%
Total 486 216 44.4% 721 134 18.6%
RV, rotavirus; n: number

Chapter 4
147
Table 2 Bed management variables (2004-2009) for overall, infection-only, and AGE patient groups by season and by study period
Season Study period Value Overall Infection-only AGEOccupied beds per day (BDOR)January to March (winter season)
Pre-vaccination Mean 30.59 16.96 7.52N 271 271 271SD 7.05 4.29 3.51Sum 8,289 4,595 2,039
Post-vaccination Mean 28.89 14.80 4.47N 361 361 361SD 7.25 3.95 2.19Sum 7,828 4,010 1,212
April to December (non-winter season)
Pre-vaccination Mean 23.24 9.38 2.46N 611 611 611SD 7.54 4.82 2.11Sum 14,199 5,731 1,504
Post-vaccination Mean 25.15 11.20 2.83N 1039 1039 1039SD 9.10 6.59 2.27Sum 26,135 11,637 2,942
Bed turnover rate per day (BTOR)January to March (winter season)
Pre-vaccination Mean 0.253 0.079 0.048N 271 271 271SD 0.132 0.052 0.041Sum 69 21 13
Post-vaccination Mean 0.284 0.065 0.028N 361 361 361SD 0.143 0.048 0.031Sum 77 18 8
April to December (non-winter season)
Pre-vaccination Mean 0.208 0.043 0.016N 611 611 611SD 0.126 0.039 0.023Sum 127 26 10
Post-vaccination Mean 0.267 0.051 0.020N 1039 1039 1039SD 0.152 0.045 0.026Sum 278 54 21
Unplanned readmission rate per day (UnPln)January to March (winter season)
Pre-vaccination Mean 0.93 0.76 0.56N 271 271 271Cases 48 36 29SD 0.908 0.880 0.691Sum 253 207 152
Post-vaccination Mean 0.38 0.29 0.16N 361 361 271Cases 25 19 9SD 0.685 0.529 0.404Sum 136 106 43
April to December (non-winter season)
Pre-vaccination Mean 0.61 0.31 0.09N 611 611 611Cases 58 30 10SD 0.715 0.545 0.303Sum 370 190 55
Post-vaccination Mean 0.59 0.29 0.11N 1314 1314 1039Cases 130 64 26SD 0.789 0.547 0.344Sum 772 381 113
AGE, acute gastroenteritis; SD, standard deviation; N, Number of days

Exploring new ways of measuring the economic value of vaccination
148
Table 3 Staff management variables (2004-2009) for overall by season and by study period
Season N % Total N
Sum Mean SD Maximum Minimum
Staff numbers per day (FTEs)January to March (winter season)
Pre-vaccination 271 10.6% 3920.9 14.468 3.064 21.3 9.1Post-vaccination 361 14.1% 5395.3 14.945 3.634 22.9 6.9
April to December (non-winter season)
Pre-vaccination 611 23.9% 8549.5 13.993 3.261 22.0 4.9Post-vaccination 1039 51.4% 18198.3 13.850 3.882 23.6 4.8
Overtime hours worked per day (OTR)January to March (winter season)
Pre-vaccination 38 10.2% 264 6.95 2.770 14 3Post-vaccination 57 15.3% 431 7.55 2.608 16 0
April to December (non-winter season)
Pre-vaccination 51 13.7% 346 6.78 2.436 14 4Post-vaccination 226 60.8% 1768 7.82 3.003 20 0
FTE, full-time equivalent; SD, standard deviation; N, Number of days
Table Staff sick leave by season and study period
Season Study period Value Sick leave, hours Sick leave, persons Sick leave, FTEJanuary to March (winter season)
Pre-vaccination N (days) 271 271 271Sum 1423.28 308 187.274Mean 5.252 1.14 0.691SD 5.990 0.95 0.788Maximum 25.47 4 3.351Minimum 0.00 0 0.000
Post-vaccination N (days) 361 361 361Sum 1579.33 311 207.807Mean 4.375 0.86 .575SD 5.148 0.858 .677Maximum 20.90 4 2.750Minimum 0.00 0 0.000
April to December (non-winter season)
Pre-vaccination N (days) 611 611 611Sum 2613.82 578 343.923Mean 4.278 0.95 0.563SD 4.885 0.870 0.643Maximum 20.90 4 2.750Minimum 0.00 0 0.000
Post-vaccination N (days) 1314 1314 1314Sum 7657.50 1548 961.316Mean 5.83 1.18 0.732SD 5.823 0.929 0.763Maximum 28.50 5 3.750Minimum 0.00 0 0.000
FTE, full-time equivalent; SD, standard deviation; N, Number of days
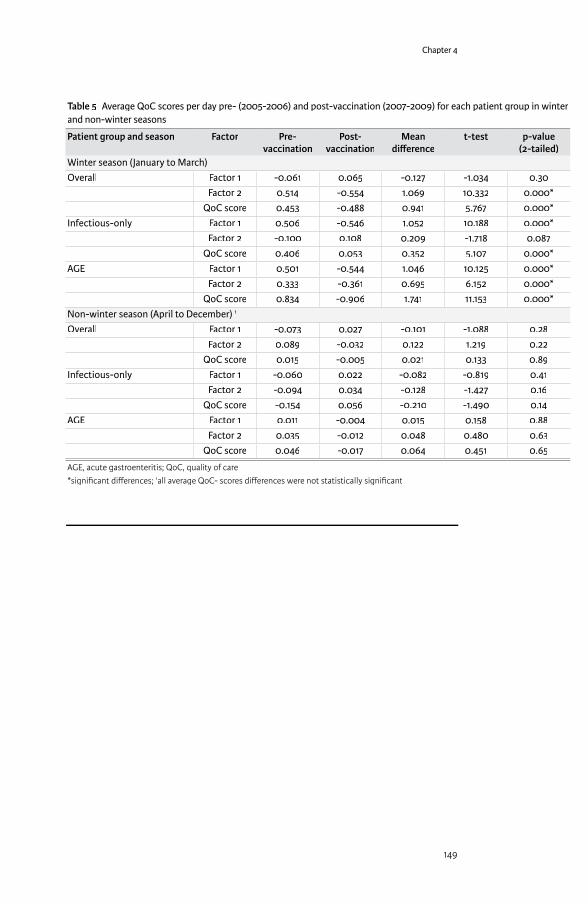
Chapter 4
149
Table 5 Average QoC scores per day pre- (2005-2006) and post-vaccination (2007-2009) for each patient group in winter and non-winter seasons
Patient group and season Factor Pre-vaccination
Post-vaccination
Mean diff erence
t-test p-value (2-tailed)
Winter season (January to March)Overall Factor 1 -0.061 0.065 -0.127 -1.034 0.30
Factor 2 0.514 -0.554 1.069 10.332 0.000*QoC score 0.453 -0.488 0.941 5.767 0.000*
Infectious-only Factor 1 0.506 -0.546 1.052 10.188 0.000*Factor 2 -0.100 0.108 0.209 -1.718 0.087
QoC score 0.406 0.053 0.352 5.107 0.000*AGE Factor 1 0.501 -0.544 1.046 10.125 0.000*
Factor 2 0.333 -0.361 0.695 6.152 0.000*QoC score 0.834 -0.906 1.741 11.153 0.000*
Non-winter season (April to December) 1
Overall Factor 1 -0.073 0.027 -0.101 -1.088 0.28Factor 2 0.089 -0.032 0.122 1.219 0.22
QoC score 0.015 -0.005 0.021 0.133 0.89Infectious-only Factor 1 -0.060 0.022 -0.082 -0.819 0.41
Factor 2 -0.094 0.034 -0.128 -1.427 0.16QoC score -0.154 0.056 -0.210 -1.490 0.14
AGE Factor 1 0.011 -0.004 0.015 0.158 0.88Factor 2 0.035 -0.012 0.048 0.480 0.63
QoC score 0.046 -0.017 0.064 0.451 0.65
AGE, acute gastroenteritis; QoC, quality of care*signifi cant diff erences; 1all average QoC- scores diff erences were not statistically signifi cant
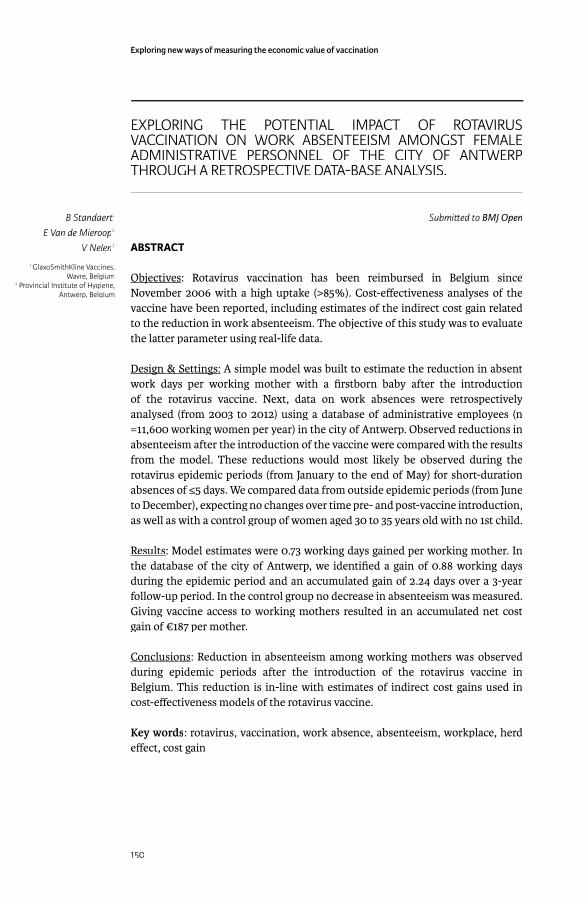
Exploring new ways of measuring the economic value of vaccination
150
EXPLORING THE POTENTIAL IMPACT OF ROTAVIRUS VACCINATION ON WORK ABSENTEEISM AMONGST FEMALE ADMINISTRATIVE PERSONNEL OF THE CITY OF ANTWERP THROUGH A RETROSPECTIVE DATA-BASE ANALYSIS.
Submi� ed to BMJ Open
ABSTRACT
ObjectivesObjectives: Rotavirus vaccination has been reimbursed in Belgium since November 2006 with a high uptake (>85%). Cost-eff ectiveness analyses of the vaccine have been reported, including estimates of the indirect cost gain related to the reduction in work absenteeism. The objective of this study was to evaluate the latter parameter using real-life data.
Design & Settings:Design & Settings: A simple model was built to estimate the reduction in absent work days per working mother with a fi rstborn baby after the introduction of the rotavirus vaccine. Next, data on work absences were retrospectively analysed (from 2003 to 2012) using a database of administrative employees (n =11,600 working women per year) in the city of Antwerp. Observed reductions in absenteeism after the introduction of the vaccine were compared with the results from the model. These reductions would most likely be observed during the rotavirus epidemic periods (from January to the end of May) for short-duration absences of ≤5 days. We compared data from outside epidemic periods (from June to December), expecting no changes over time pre- and post-vaccine introduction, as well as with a control group of women aged 30 to 35 years old with no 1st child.
Results: Model estimates were 0.73 working days gained per working mother. In the database of the city of Antwerp, we identifi ed a gain of 0.88 working days during the epidemic period and an accumulated gain of 2.24 days over a 3-year follow-up period. In the control group no decrease in absenteeism was measured. Giving vaccine access to working mothers resulted in an accumulated net cost gain of €187 per mother.
Conclusions: Reduction in absenteeism among working mothers was observed during epidemic periods after the introduction of the rotavirus vaccine in Belgium. This reduction is in-line with estimates of indirect cost gains used in cost-eff ectiveness models of the rotavirus vaccine.
Key words: rotavirus, vaccination, work absence, absenteeism, workplace, herd eff ect, cost gain
B Standaert1
E Van de Mieroop2
V Nelen2
1 GlaxoSmithKline Vaccines, Wavre, Belgium
2 Provincial Institute of Hygiene, Antwerp, Belgium
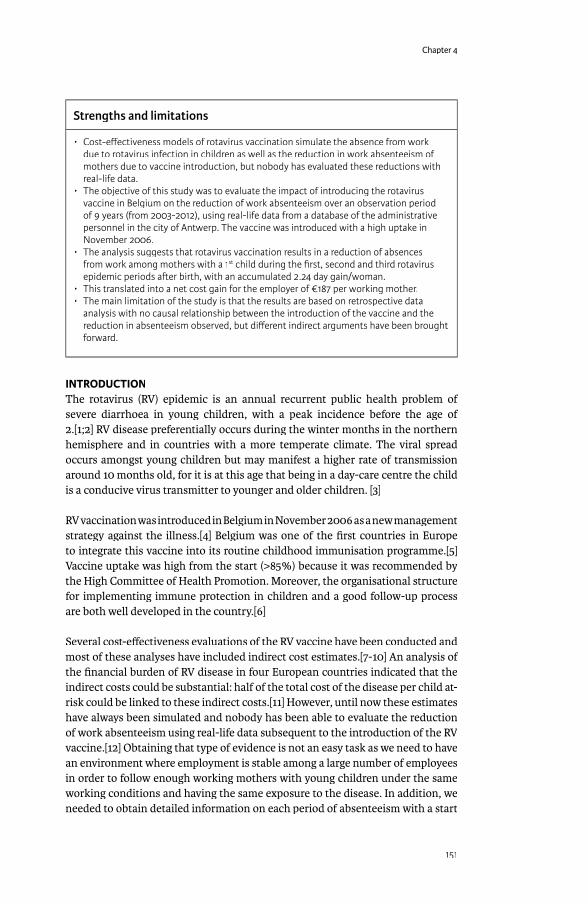
Chapter 4
151
Strengths and limitations
� Cost-eff ectiveness models of rotavirus vaccination simulate the absence from work due to rotavirus infection in children as well as the reduction in work absenteeism of mothers due to vaccine introduction, but nobody has evaluated these reductions with real-life data.
� The objective of this study was to evaluate the impact of introducing the rotavirus vaccine in Belgium on the reduction of work absenteeism over an observation period of 9 years (from 2003-2012), using real-life data from a database of the administrative personnel in the city of Antwerp. The vaccine was introduced with a high uptake in November 2006.
� The analysis suggests that rotavirus vaccination results in a reduction of absences from work among mothers with a 1st child during the fi rst, second and third rotavirus epidemic periods a� er birth, with an accumulated 2.24 day gain/woman.
� This translated into a net cost gain for the employer of €187 per working mother.� The main limitation of the study is that the results are based on retrospective data
analysis with no causal relationship between the introduction of the vaccine and the reduction in absenteeism observed, but diff erent indirect arguments have been brought forward.
INTRODUCTIONThe rotavirus (RV) epidemic is an annual recurrent public health problem of severe diarrhoea in young children, with a peak incidence before the age of 2.[1;2] RV disease preferentially occurs during the winter months in the northern hemisphere and in countries with a more temperate climate. The viral spread occurs amongst young children but may manifest a higher rate of transmission around 10 months old, for it is at this age that being in a day-care centre the child is a conducive virus transmitter to younger and older children. [3]
RV vaccination was introduced in Belgium in November 2006 as a new management strategy against the illness.[4] Belgium was one of the fi rst countries in Europe to integrate this vaccine into its routine childhood immunisation programme.[5] Vaccine uptake was high from the start (>85%) because it was recommended by the High Committee of Health Promotion. Moreover, the organisational structure for implementing immune protection in children and a good follow-up process are both well developed in the country.[6]
Several cost-eff ectiveness evaluations of the RV vaccine have been conducted and most of these analyses have included indirect cost estimates.[7-10] An analysis of the fi nancial burden of RV disease in four European countries indicated that the indirect costs could be substantial: half of the total cost of the disease per child at-risk could be linked to these indirect costs.[11] However, until now these estimates have always been simulated and nobody has been able to evaluate the reduction of work absenteeism using real-life data subsequent to the introduction of the RV vaccine.[12] Obtaining that type of evidence is not an easy task as we need to have an environment where employment is stable among a large number of employees in order to follow enough working mothers with young children under the same working conditions and having the same exposure to the disease. In addition, we needed to obtain detailed information on each period of absenteeism with a start
Exploring new ways of measuring the economic value of vaccination
152
and end date linked to the employee’s family condition when a new child is born. The data should be available over a long enough period of time (at least 5 years) and in electronic format with easy access so that the time periods before and after vaccine introduction can be analysed and compared.
It was postulated that during epidemic RV disease periods working mothers with a 1st child would be absent from work for short durations (≤ 5 days) more often than during non-epidemic periods or after the introduction of the vaccine. In addition working women with no exposure anymore of children to the rotavirus disease should not experience any benefi t of the vaccine expressed as a reduction in work absenteeism. We fi rst constructed a simple, back-of-the-envelope model that could give us guidance in our search of parameters in real-life data sets.
DESIGN AND SETTING
Simple model constructionSimple model constructionThe simple model calculates the expected diff erence in worker absenteeism when comparing exposure versus non-exposure to the RV vaccine. It is expressed as the estimated number of days per year and per working mother with a 1st child. The value measured would then serve as a benchmark for analysing the observed data.
Observed dataWe selected a database from the city of Antwerp which has a suffi cient number of subjects from the target group (n≈11,600 women per year) over a long period of time (from 2003 to 2012). This database collects detailed information on absences from work for all its administrative personnel, including an overall reason with no particular details, duration, and time period of the absence (start and end date). It is also reasonably accurate because the personnel payment data is linked to that system. Moreover, through a unique subject number the database could be linked to other databases in the city which compile information on family composition and the birth dates of children born to each employee. The data were made available after decoding subjects to prevent identifi cation of individuals and after approval of the project and its objectives by the administrative head of the city.
We performed the analysis in three steps. First, to increase the chances of observing a diff erence in absenteeism due to vaccination, we selected a target group of women with a 1st child approximately 10 months of age during the typical epidemic RV season (January through May) of each year. These children are known transmitters of the virus. In a second step, we conducted an annual analysis of the same working mothers but with a 1st child born any time during the year prior to the next epidemic period. We expected a larger diff erence (i.e., less absenteeism) from the fi rst analysis than from the second one. In a third step we selected from the same data-base women aged 30 to 35y old with no 1st child, but working during the same observation period from 2004 to 2012, from January to May. It was hypothesized that these women, considered as a control group, should not benefi t from the rotavirus vaccination and therefore we would not observe any decrease in work absenteeism over time.

Chapter 4
153
Thus, in the fi rst step we selected working women with a 1st child born during the months of April through July on a yearly basis from 2003 to 2011. That number was variable per year. We then recorded short absences from work (≤5 days) which were registered 10 months after the birth of their child. That specifi c period of 10 months postpartum was equal to the normal RV epidemic season. The sum of all work absences during that annual period of time in all years from 2004 to 2012 was then divided by the number of mothers considered the previous year in order to obtain an average value per working mother with a 1st child during the following epidemic period.
We compared the data by year to observe any marked diff erence in work absenteeism after 2006, which was the year RV vaccination was introduced. We also analysed absenteeism data from the same working mothers which was outside the epidemic period, expecting a much lower rate. To be able to compare the same values by time period, we analysed the average value by month for each period (epidemic and non-epidemic).
If an important diff erence was observed in the fi rst step, we would then proceed to the second step of evaluating work absences during each epidemic period among mothers with a 1st child born anytime during the previous year (whole year birth cohort). We again reported the sum of all days absent from work in the postpartum year during epidemic and non-epidemic periods. We hypothesised that if the diff erence in absenteeism was large enough in the fi rst step, it should still be present in the second step and that would facilitate the analysis of other time periods. In addition, we evaluated the same type of absences from work among mothers with a fi rstborn child in its 2nd and 3rd year of life (e.g. absences of mothers with a fi rst child born during 2003 were evaluated in the epidemic periods of 2005 and 2006, respectively). Finally, we compared this observed data with the estimates we had obtained from the simple model. The control group was analysed the same way as the other groups. We report the same type of outcome measure over time which is the average number of days being absent from work per women during the epidemic period per year.
Based on the above results we could calculate the net cost gain per working mother through the average reduction in absenteeism post-vaccination. This was adjusted by the cost of the vaccine, which was considered at €60/dose [13]. The average gross salary for a working mother in the city of Antwerp was estimated at €135/day [14].
To observe a statistically signifi cant diff erence between pre- and post-vaccination absenteeism per working mother, we compared the data by ranking mothers into 6 categories according to the number of days absent from work (0, 1, 2, 3, 4 and 5 days) during the epidemic period. We then applied a statistical ranking test (Mann Whitney U-test with p<0.05). Statistical analyses and the computation of 95% Confi dence Intervals (CI) were done using IBM SPSS Statistics v22.0 and GraphPad v6.
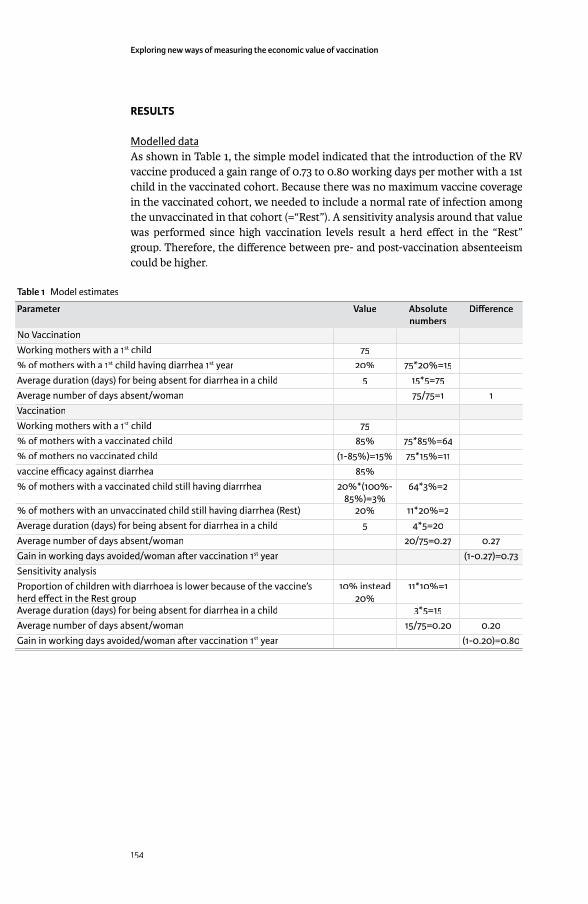
Exploring new ways of measuring the economic value of vaccination
154
RESULTS
Modelled dataAs shown in Table 1, the simple model indicated that the introduction of the RV vaccine produced a gain range of 0.73 to 0.80 working days per mother with a 1st child in the vaccinated cohort. Because there was no maximum vaccine coverage in the vaccinated cohort, we needed to include a normal rate of infection among the unvaccinated in that cohort (=“Rest”). A sensitivity analysis around that value was performed since high vaccination levels result a herd eff ect in the “Rest” group. Therefore, the diff erence between pre- and post-vaccination absenteeism could be higher.
Table 1 Model estimates
Parameter Value Absolute numbers
Diff erence
No VaccinationWorking mothers with a 1st child 75% of mothers with a 1st child having diarrhea 1st year 20% 75*20%=15Average duration (days) for being absent for diarrhea in a child 5 15*5=75Average number of days absent/woman 75/75=1 1VaccinationWorking mothers with a 1st child 75% of mothers with a vaccinated child 85% 75*85%=64% of mothers no vaccinated child (1-85%)=15% 75*15%=11vaccine effi cacy against diarrhea 85%% of mothers with a vaccinated child still having diarrrhea 20%*(100%-
85%)=3%64*3%=2
% of mothers with an unvaccinated child still having diarrhea (Rest) 20% 11*20%=2Average duration (days) for being absent for diarrhea in a child 5 4*5=20Average number of days absent/woman 20/75=0.27 0.27Gain in working days avoided/woman a� er vaccination 1st year (1-0.27)=0.73Sensitivity analysisProportion of children with diarrhoea is lower because of the vaccine’s herd eff ect in the Rest groupherd eff ect in the Rest group
10% instead 20%
11*10%=1
Average duration (days) for being absent for diarrhea in a child 3*5=15Average number of days absent/woman 15/75=0.20 0.20Gain in working days avoided/woman a� er vaccination 1st year (1-0.20)=0.80
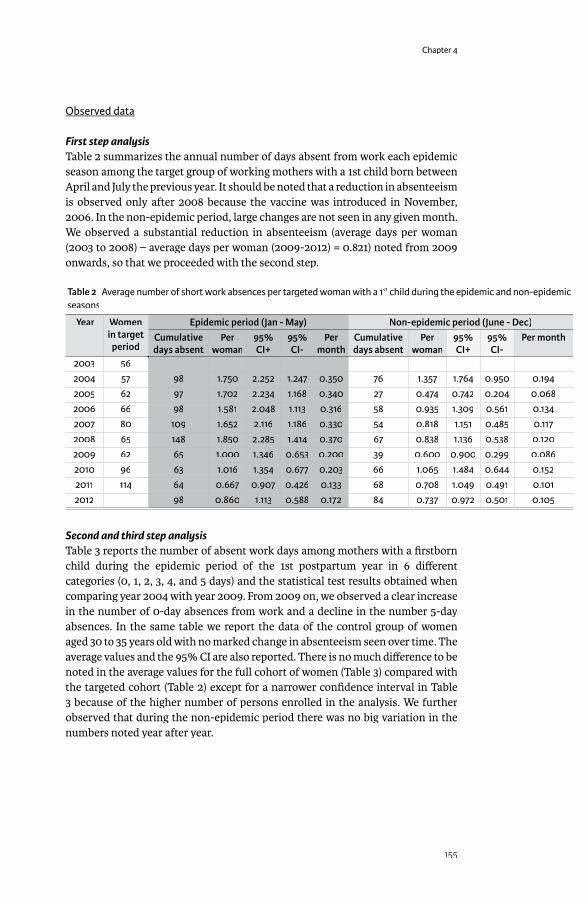
Chapter 4
155
Observed data
First step analysisTable 2 summarizes the annual number of days absent from work each epidemic season among the target group of working mothers with a 1st child born between April and July the previous year. It should be noted that a reduction in absenteeism is observed only after 2008 because the vaccine was introduced in November, 2006. In the non-epidemic period, large changes are not seen in any given month. We observed a substantial reduction in absenteeism (average days per woman (2003 to 2008) – average days per woman (2009-2012) = 0.821) noted from 2009 onwards, so that we proceeded with the second step.
Table 2 Average number of short work absences per targeted woman with a 1st child during the epidemic and non-epidemic st child during the epidemic and non-epidemic st
seasons
Year Women in target
period
Epidemic period (Jan - May) Non-epidemic period (June - Dec)Cumulative days absent
Per woman
95% CI+
95% CI-
Per month
Cumulative days absent
Per woman
95% CI+
95% CI-
Per month
2003 562004 57 98 1.750 2.252 1.247 0.350 76 1.357 1.764 0.950 0.1942005 62 97 1.702 2.234 1.168 0.340 27 0.474 0.742 0.204 0.0682006 66 98 1.581 2.048 1.113 0.316 58 0.935 1.309 0.561 0.1342007 80 109 1.652 2.116 1.186 0.330 54 0.818 1.151 0.485 0.1172008 65 148 1.850 2.285 1.414 0.370 67 0.838 1.136 0.538 0.1202009 62 65 1.000 1.346 0.653 0.200 39 0.600 0.900 0.299 0.0862010 96 63 1.016 1.354 0.677 0.203 66 1.065 1.484 0.644 0.1522011 114 64 0.667 0.907 0.426 0.133 68 0.708 1.049 0.491 0.1012012 98 0.860 1.113 0.588 0.172 84 0.737 0.972 0.501 0.105
Second and third step analysisTable 3 reports the number of absent work days among mothers with a fi rstborn child during the epidemic period of the 1st postpartum year in 6 diff erent categories (0, 1, 2, 3, 4, and 5 days) and the statistical test results obtained when comparing year 2004 with year 2009. From 2009 on, we observed a clear increase in the number of 0-day absences from work and a decline in the number 5-day absences. In the same table we report the data of the control group of women aged 30 to 35 years old with no marked change in absenteeism seen over time. The average values and the 95% CI are also reported. There is no much diff erence to be noted in the average values for the full cohort of women (Table 3) compared with the targeted cohort (Table 2) except for a narrower confi dence interval in Table 3 because of the higher number of persons enrolled in the analysis. We further observed that during the non-epidemic period there was no big variation in the numbers noted year after year.
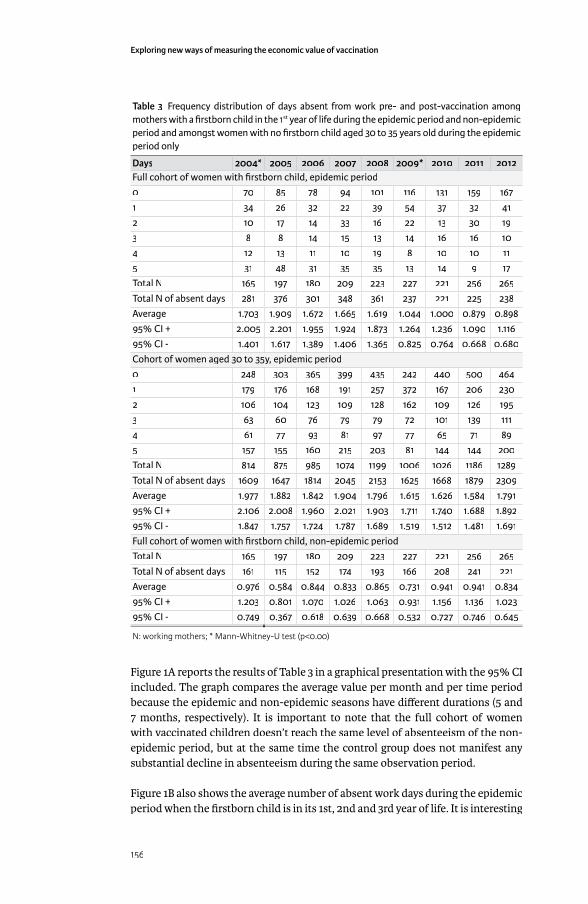
Exploring new ways of measuring the economic value of vaccination
156
Table 3 Frequency distribution of days absent from work pre- and post-vaccination among mothers with a fi rstborn child in the 1st year of life during the epidemic period and non-epidemic st year of life during the epidemic period and non-epidemic st
period and amongst women with no fi rstborn child aged 30 to 35 years old during the epidemic period only
Days 2004* 2005 2006 2007 2008 2009* 2010 2011 2012Full cohort of women with fi rstborn child, epidemic period0 70 85 78 94 101 116 131 159 1671 34 26 32 22 39 54 37 32 412 10 17 14 33 16 22 13 30 193 8 8 14 15 13 14 16 16 104 12 13 11 10 19 8 10 10 115 31 48 31 35 35 13 14 9 17Total N 165 197 180 209 223 227 221 256 265Total N of absent days 281 376 301 348 361 237 221 225 238Average 1.703 1.909 1.672 1.665 1.619 1.044 1.000 0.879 0.89895% CI + 2.005 2.201 1.955 1.924 1.873 1.264 1.236 1.090 1.11695% CI - 1.401 1.617 1.389 1.406 1.365 0.825 0.764 0.668 0.680Cohort of women aged 30 to 35y, epidemic period0 248 303 365 399 435 242 440 500 4641 179 176 168 191 257 372 167 206 2302 106 104 123 109 128 162 109 126 1953 63 60 76 79 79 72 101 139 1114 61 77 93 81 97 77 65 71 895 157 155 160 215 203 81 144 144 200Total N 814 875 985 1074 1199 1006 1026 1186 1289Total N of absent days 1609 1647 1814 2045 2153 1625 1668 1879 2309Average 1.977 1.882 1.842 1.904 1.796 1.615 1.626 1.584 1.79195% CI + 2.106 2.008 1.960 2.021 1.903 1.711 1.740 1.688 1.89295% CI - 1.847 1.757 1.724 1.787 1.689 1.519 1.512 1.481 1.691Full cohort of women with fi rstborn child, non-epidemic periodTotal N 165 197 180 209 223 227 221 256 265Total N of absent days 161 115 152 174 193 166 208 241 221Average 0.976 0.584 0.844 0.833 0.865 0.731 0.941 0.941 0.83495% CI + 1.203 0.801 1.070 1.026 1.063 0.931 1.156 1.136 1.02395% CI - 0.749 0.367 0.618 0.639 0.668 0.532 0.727 0.746 0.645
N: working mothers; * Mann-Whitney-U test (p<0.00)
Figure 1A reports the results of Table 3 in a graphical presentation with the 95% CI included. The graph compares the average value per month and per time period because the epidemic and non-epidemic seasons have diff erent durations (5 and 7 months, respectively). It is important to note that the full cohort of women with vaccinated children doesn’t reach the same level of absenteeism of the non-epidemic period, but at the same time the control group does not manifest any substantial decline in absenteeism during the same observation period.
Figure 1B also shows the average number of absent work days during the epidemic period when the fi rstborn child is in its 1st, 2nd and 3rd year of life. It is interesting

Chapter 4
157
that the same type of decline in absenteeism is observed in subsequent years as for the 1st year postpartum analysis. As already mentioned, reductions in absenteeism started after 2008 following the introduction of the RV vaccine by the end of 2006. If we work with averages over the whole observation period, we can see that prior to the introduction of the vaccine the average number of days absent from work during the epidemic period was an estimated 1.71 days (average value from 2004 to 2008). The average number of days absent from work in the
Figure 1 (A) Average number of short work absences per woman per month for the control group (blue), the full cohort mothers during the epidemic period (red), and during the non-epidemic period (green) and (B) Average number of short work absences per woman in the full cohort in the 1st (red), 2nd (blue) and 3rd (yellow) year postpartum during the epidemic period, and the non-epidemic period (green)
Nbr: number; RV: rotavirus.

Exploring new ways of measuring the economic value of vaccination
158
non-epidemic period was 0.83 days (average value from 2004 to 2012). Thus, the estimated diff erence in absenteeism obtained from switching from no vaccination to vaccination is approximately 0.88 days per working mother with a 1st child in the 1st year of life (1.71 - 0.83); 0.70 days for 2-year old children (1.53 - 0.83); and 0.67 days for 3-year old children (1.50 - 0.83).
The accumulated gain per working mother with a 1st child during the epidemic period is 2.24 days (0.88+0.7+0.67). The absolute gain is diffi cult to measure from the database, which reports fl uctuating numbers and diff erent lengths of duration each year. Table 4 shows the calculated values, which is based on the average numbers we obtained.
Table 4 Estimated gain per working mother with a 1st child over a 3-year period st child over a 3-year period st
Post-partum Pre-vaccination: days absent from work*
Post-vaccination: days absent from work*
Diff erence (days)
Days gained (216 women)*
Average
1st year 1.71 0.83 0.88 1902nd year 1.53 0.83 0.70 1503rd year 1.50 0.83 0.67 144
Sum 4.74 2.49 2.25 484
*Per working woman with a 1st child
The benefi t of vaccination to an employer of an average annual work force of 216 working mothers with a 1st child is a gain of 484 working days over a 3-year period of time. At an average gross monthly salary of €3,000 or €135 per work day, the gross gain is €67,095 for the entire working mother cohort. The employer will spend a total of €26,640 for the vaccine if the cost is an estimated €120 per mother. The net gain is then quickly calculated, which is €40,455 for the cohort or €187 per working mother.
DISCUSSIONMany economic models evaluating the cost-eff ectiveness of paediatric vaccines report the indirect cost impact in sensitivity analyses.[10;15;16] These costs are estimated using the human capital cost evaluation method in which the estimated number of days in productivity loss are multiplied by an average cost per day for the target population under study.[17;18] The approach gives a fi rst indication or exploration about the real value. We know, however, that these vaccination interventions can avoid a great amount of productivity loss, especially among working mothers whose children are at high risk of infection and who are receiving the paediatric vaccines. [19] In the current study, we conducted an investigation of the problem using real-life data and compared that to the results of a simple modelling exercise. The analysis confi rms that there is a measurable reduction in work absenteeism among working mothers after the introduction of the rotavirus vaccine. When looking at the data in greater detail, we observed that this reduction was among cases with a high number of absentee working days (e.g. 5-day absences, see Table 3).

Chapter 4
159
The initial intention of the project was focused primarily on increasing our chances of being successful in the selection of the right target group to show a diff erence in absenteeism which could be linked to the introduction of the rotavirus vaccine. Therefore, we opted for mothers with a 1st child since it is most likely in the Belgian culture that that person would be the fi rst who takes time off work when the child suff ers from an illness. Meanwhile, a critical question remained as to whether the observed reduction in work absenteeism was linked to the rotavirus vaccination introduction as many other reasons for short absences from work may cause a fl uctuation in this parameter. The analysis here gives 5 reasons for the potential link. First, the reduction happened after the introduction of the vaccine in 2006 at the time we would expect to observe a major reduction during the epidemic rotavirus season. Secondly, mothers with a 1st child in their 2nd and 3rd year of life also manifested a reduction in absenteeism starting during the same year (2008), which can be explained by the known herd eff ect post-vaccination. If no herd eff ect was known for this vaccine, we would not observe these additional reductions in the other age groups. Thirdly, the observed reduction per working mother closely matches the modelled estimates (see Table 1), which was surprising. No reduction in work absenteeism was seen during the non-epidemic period, making it unlikely that new rules had been put in place by the employer to minimize short-term absences; otherwise we would have seen a reduction in absenteeism during all time periods after 2008. Finally, women with no exposure of their children to any rotavirus vaccination did not show any reduction in absenteeism during the same observation period. One additional point to mention here is that trying to link the reduction with the fl uctuation of other childhood infections such as infl uenza is diffi cult to make as high epidemic infectious diseases during the pre-vaccine periods resulting in high rates of absenteeism should have been reported in the literature or in local disease reports which was not the case..
Specifi c conditions in retrospective data analyses must be fulfi lled before it is possible to measure the changes observed. Those conditions are: 1) the demographic composition (gender and age) of the study population must remain stable in order to have the same denominator; 2) the rules and conditions for taking time off work must be maintained; 3) the disease must be causing a serious public health problem over a certain period so that a change in working patterns (e.g. absenteeism) can be observed; 4) the new intervention (e.g. the vaccine) must have an immediate high uptake as well as a large and rapid impact on the disease; 5) the data registry must be adequate, of high quality, consistent over time, and easily stored and accessible; 6) and fi nally, the target population must be a well-defi ned group. We cannot work with cultural changes over time (e.g. fathers instead of mothers suddenly becoming the main ones taking care of young children when the latter become sick). We obtained that unique combination of all these diff erent factors in the database of the administrative personnel of the city of Antwerp. For instance, the fact that the data collected on absenteeism was linked to the payment condition of an employee makes the quality of the data very rich. If one of the conditional elements mentioned above is of poor quality, it automatically decreases the value of the whole investigation and the analysis. All the diff erent elements are essential and none of them are more or less important

Exploring new ways of measuring the economic value of vaccination
160
than the others. So it was highly critical that all the diff erent elements were present at the same time in order to fi t the analysis well.
Having a back-of-the-envelope estimate was a very helpful tool in understanding the potential gain to be observed in the real-life database. At the beginning of the study, we were looking at all the days of work absences and all mothers with children. That was not a viable option because the specifi c condition we were looking for was lost in the bigger numbers that were not related to a disease situation among children necessitating short absences from work (i.e., ≤ 5 days). It is also interesting that the observed data in the 1st year of a child’s life was not so diff erent from what we measured with the model. Surprisingly, it appeared that the benefi t was even a little higher in real life than in the model, which could potentially be related to a higher incidence or distribution of the disease than what the model predicted or to a herd eff ect in the vaccinated age group itself. What is clear from the data, however, is that a herd eff ect was realized in other age groups who were unvaccinated when the vaccine was introduced, as reported in Figure 1B. The data confi rmed what we observed in the RotaBIS study, in which we also observed the vaccine making a large impact as soon as it was introduced among unvaccinated age groups.[3] We know that the sample size of working mothers with a fi rst child was small and could be considered as a limitation of the study. However, the analysis made was the best we could made in a country where the vaccine coverage rate for rotavirus vaccines was very high from start.
To our knowledge, this type of analysis is the fi rst one to demonstrate that specifi c eff ect of the RV vaccine using real-life data. The conditions of RV infection provided the opportunity for this to happen: the disease is very contagious, preferentially hits very young children, is mainly incident during a short, epidemic season every year at the same time, and occurs among small children who need care by an adult. That conditional fl ow allows comparison of work absenteeism during epidemic and non-epidemic periods. It reinforces the circumstantial evidence showing a link between the observed reduction in absenteeism and the introduction of the vaccine, but we cannot claim or prove a clear causality from the data here. There are potentially other methods for collecting the same data prospectively, but it would be diffi cult to attain the same quality in the fi nal results if one has to start from nowhere[20]. This is not a clinical trial. It is an analysis of an administrative database, in which the prospect of collecting that type of information in such a rigorous way is not obvious. It should also be clear that the overall benefi t of the vaccine on a reduction in absenteeism in the workplace could be greater than what we measured here with a very specifi c sub-group of working mothers (those with a 1st child). It is likely that we could observe the same benefi t among working mothers with a 2nd or 3rd child who was never previously exposed to RV.
Finally, will the results here discovered in this particular environment be easily transposable to other settings? Given the many conditions necessary to observe and measure the eff ect of a vaccine, it is likely that in other settings other amounts of benefi t will be seen. For example, the facilities needed to be easily absent from work for childhood illness must be present in other places before we can observe the same result.

Chapter 4
161
CONCLUSIONSWorking mothers with a 1st child benefi t from RV vaccination through a reduction in work absenteeism. The model estimates and the observed data fi t well for absences from work during the year following birth. The higher observed gain (0.88- versus 0.72-day gain) could be explained by a herd eff ect of the vaccine. There is possibly an underestimate of the total gain as only a selected group (mothers with a 1st child) was investigated. In the case of the city of Antwerp, the benefi t can be expressed as a cost gain per woman as a cost-benefi t ratio of 1.85 (working days gained/vaccine cost). Confi rmation of these results with datasets from other public organisations in Belgium is expected in the near future.
ACKNOWLEDGEMENTSThe authors wish to thank Carla Lefebvre (independent research and writing consultant) for her assistance in editing this paper.
CONTRIBUTORSHIP STATEMENTBaudouin Standaert has developed the protocol, made the analysis, and the reporting, and wrote the 1st draft of the manuscript. Els Van de Mieroop helped getting access to the data and reviewed the statistical analysis plan, give input into the review of the manuscript. Vera Nelen helped designing the study and reviewed the diff erent drafts of the manuscripts.
DATA SHARING STATEMENTAll data were anonymized before sharing amongst the researchers. The method of analysis and the results were evaluated by all the researchers. Persons who are interested can get access to the data and the method of analysis on request.
REFERENCES[1] Forster J, Guarino A, Parez N, Moraga F, Roman E, Mory O, et al. Hospital-
based surveillance to estimate the burden of rotavirus gastroenteritis among European children younger than 5 years of age. Pediatrics 2009 Mar;123(3):e393-e400.
[2] Soriano-Gabarro M, Mrukowicz J, Vesikari T, Verstraeten T. Burden of rotavirus disease in European Union countries. Pediatr Infect Dis J 2006 Jan;25(1 Suppl):S7-S11.
[3] Standaert B, Gomez JA, Raes M, Debrus S, Velazquez FR, Postma MJ. Impact of rotavirus vaccination on hospitalisations in Belgium: comparing model predictions with observed data. PLoS One 2013;8(1):e53864.
[4] Plosker GL. Rotavirus vaccine RIX4414 (Rotarix): a pharmacoeconomic review of its use in the prevention of rotavirus gastroenteritis in developed countries. Pharmacoeconomics 2011 May;29(5):439-54.
[5] Parez N, Giaquinto C, Du RC, Martinon-Torres F, Spoulou V, Van DP, et al. Rotavirus vaccination in Europe: drivers and barriers. Lancet Infect Dis 2014 May;14(5):416-25.
[6] Raes M, Strens D, Vergison A, Verghote M, Standaert B. Reduction in pediatric rotavirus-related hospitalizations after universal rotavirus vaccination in Belgium. Pediatr Infect Dis J 2011 Mar 23;30(7):120-5.

Exploring new ways of measuring the economic value of vaccination
162
[7] Bilcke J, Beutels P. Reviewing the cost eff ectiveness of rotavirus vaccination: the importance of uncertainty in the choice of data sources. Pharmacoeconomics 2009;27(4):281-97.
[8] Goossens LM, Standaert B, Hartwig N, Hovels AM, Al MJ. The cost-utility of rotavirus vaccination with Rotarix [trade mark] (RIX4414) in the Netherlands. Vaccine 2008;26:1118-27.
[9] Jit M, Bilcke J, Mangen MJ, Salo H, Melliez H, Edmunds WJ, et al. The cost-eff ectiveness of rotavirus vaccination: Comparative analyses for fi ve European countries and transferability in Europe. Vaccine 2009 Oct 19;27(44):6121-8.
[10] Standaert B, Parez N, Tehard B, Colin X, Detournay B. Cost-eff ectiveness analysis of vaccination against rotavirus with RIX4414 in France. Appl Health Econ Health Policy 2009;6(4):199-216.
[11] Standaert B, Harlin O, Desselberger U. The fi nancial burden of rotavirus disease in four countries of the European Union. Pediatr Infect Dis J 2008;27(1):S20-S27.
[12] Giaquinto C, Van DP, Huet F, Gothefors L, Van der WM. Costs of community-acquired pediatric rotavirus gastroenteritis in 7 European countries: the REVEAL Study. J Infect Dis 2007 May 1;195 Suppl 1:S36-S44.
[13] Christiaens T, De Loof G, Maloteaux JM. Gecommentarieerd geneesmiddelenrepertorium 2014. 27th Edition ed. Ghent, Belgium: Federaal Agentschap voor Geneesmiddelen en Gezondheidsproducten (FAGG); 2014.
[14] Bevers T, Collard A, De Spiegeleire M, De Vos D, Gilbert V, Van Hove H. De loonkloof tussen vrouwen en mannen in België, 2010. 1st edition ed. Brussels, belgium: 2011.
[15] De WP, Black S, Borrow R, Pearce D. Modeling the impact of a new vaccine on pneumococcal and nontypable Haemophilus infl uenzae diseases: a new simulation model 1. Clin Ther 2009 Oct;31(10):2152-69.
[16] Farkouh RA, Klok RM, Postma MJ, Roberts CS, Strutton DR. Cost-eff ectiveness models of pneumococcal conjugate vaccines: variability and impact of modeling assumptions 1. Expert Rev Vaccines 2012 Oct;11(10):1235-47.
[17] Hutubessy RC, van Tulder MW, Vondeling H, Bouter LM. Indirect costs of back pain in the Netherlands: a comparison of the human capital method with the friction cost method 1. Pain 1999 Mar;80(1-2):201-7.
[18] Kotsopoulos N, Connolly MP. Is the gap between micro- and macroeconomic assessments in health care well understood? The case of vaccination and potential remedies. Journal of Market Access & health Policy 2014;2:23897.
[19] Alsarraf R, Jung CJ, Perkins J, Crowley C, Alsarraf NW, Gates GA. Measuring the indirect and direct costs of acute otitis media 6. Arch Otolaryngol Head Neck Surg 1999 Jan;125(1):12-8.
[20] Goossens ME, Rutten-van Molken MP, Vlaeyen JW, van der Linden SM. The cost diary: a method to measure direct and indirect costs in cost-eff ectiveness research 2. J Clin Epidemiol 2000 Jul;53(7):688-95.

163
COST-EFFECTIVENESS ANALYSIS (CEA) AND EXPLORING FOR ALTERNATIVE APPROACHES
One of the fi rst questions raised when I started with the health economic analysis of vaccines for developing countries using CEA, is how a decision maker can work with that result if the investment in health care in the country is low, the disease burden therefore large, while the cost-eff ectiveness threshold recommended by the WHO -that is the GDP per capita-, is much too high.
Under such circumstances everything done to reduce the disease burden must be very cost-eff ective at quite a high price for that country. Published data about cost-eff ectiveness results of rotavirus vaccination in Latin-America activated my fi rst suspicion that there is something bizarre with the numbers presented [25]. The analysis showed that one could ask a higher price for the vaccine in low income countries and still be cost-eff ective compared with the price for low middle income countries. The point was that the authors didn’t report any paradox in the analysis presented in table format. I fi rst analysed the same data in a graph to better understand the underlying diff erence between the numbers by diff erent country type. In a next step I explored how the graphs were constructed given the cost and the eff ect elements that were in the analysis. One of the options was to reinvestigate the problem more in depth by making the comparison between diff erent country types across the whole world and not only Latin America with a same vaccine using a same CEA technique. The diff erence by country type remained at the level of the GDP per capita. I wanted to calculate the price range the vaccine will obtain for still remaining cost-eff ective in countries with diff erent GDP levels. I presented that exercise in the next paper [26].
An important fi nding of that analysis is that the CEA in countries that have already maturely invested in health care programs will have a CE-price range for a new intervention that appears reasonable. Extra -payment that can be obtained for the extra-health gain achieved is within an acceptable price band. But this approach is completely out of scope for low-income countries because the investment in health care is too low and the need much too high. Here, other techniques than CEA should be used to defi ne health care priorities linked to an economic assessment that identifi es priority setting, health goals to be achieved within a reasonable time and budget frame.
One of the techniques I proposed to work with is using optimisation modelling. I fi rst explored the approach for the better positioning of the Human Papilloma Virus (HPV) vaccine versus diff erent screening frequency methods and no intervention at all. A very reasonable price level could be identifi ed for emerging and high income markets such as Brazil and the UK [27]. The analysis is quite spectacular for the rich countries as for a same annual budget spent on cervical cancer prevention today but switching the screening frequency to a lower rate while spending the money saved into vaccination, the model predicts an overall benefi t in reducing cervical cancer cases up to 45% per year.
5
Exploring new ways of measuring the economic value of vaccination
164
But the technique of optimisation modelling can be applied under many diff erent conditions and formats. I investigated the problem of a 2 versus 3 dose vaccination scheme under a fi xed budget for rotavirus disease, [28]. Health authorities in many countries work with fi xed annual budgets for their prevention programs in health care. They are sometimes exposed to new deals suggested by international bodies about changing the dosing frequency of vaccination programs. It has been suggested that for Rotarix® to be used in developing countries it may improve the ® to be used in developing countries it may improve the ®
reduction in diarrhoea events by changing the frequency from 2 to 3 doses. When operating under a fi xed budget it doesn’t appear obvious to go for a 3 dose scheme when the recommended dosing scheme is 2. Only under extreme circumstances or a perfect combination of 3 factors (low vaccine coverage rate, high cost diff erence per dose, and high effi cacy increase for the third dose), can the 3 dose program result in a better deal.
In the same area of discovering new economic assessment tools for health care I was able to work closely with Dr Mark Connolly from the University of Groningen in the Netherlands from 2008 onwards. We were both looking for new ways of economic evaluation in health care that helps demonstrating where the benefi t of a health gain obtained through new interventions is an added value for society instead of focussing on the individual benefi t only. The approach should be especially useful for prevention activities such as vaccination. For instance if countries are suff ering from a high child mortality rate because of an infectious disease such rotavirus that is a major cause of infant diarrhoea, what could be the incentive for an authority to go for that vaccination? We have the tendency to look very closely to our own silo program of mortality reduction and the Ministry of Health being the main sponsor for such an intervention for obvious reasons. But we thought that there could be additional benefi t elsewhere than just having the child mortality reduced if we introduce the vaccine. If that additional benefi t is identifi ed elsewhere than there must be a sponsor elsewhere as well.
With Dr Connolly, based on his past experience of exploring new economic approaches in the world of assisted reproduction, we developed what could be seen as an interesting approach for convincing local authorities and not only health authorities to invest in vaccination. The investment can be seen as a method to increase tax payment for the government as a mid to long term benefi t if more children survive. The tax fl ow over time can be huge compared with the small investment one has to do once with vaccination of a child at birth. We fully explored that approach in one publication with Egyptian data that we were able to present to the local health administration [29]. Unfortunately the recent events that occurred in Egypt didn’t give us the full chance to move forward with the project, but the initial responses we received from the health administration of that country at that time were extremely encouraging. They fi nally found a study with results using a language that other decision makers in their governmental organisation could understand: rate of return, net present value, among other terms that is normally used by the fi nance administration. This program on return on investment for vaccines received much attention from the WHO that sponsored a few other projects in low income countries in Vietnam and Ghana [30].
Chapter 5
165
COMPARING COST-EFFECTIVENESS RESULTS FOR THE SAME INTERVENTION ACROSS DIFFERENT COUNTRIES WORLDWIDE: WHAT CAN WE LEARN?
Adv Ther. 2014, 10: 1095-108
ABSTRACT
BackgroundBackground: Cost-eff ectiveness analysis (CEA) using country-specifi c thresholds tied to gross domestic product (GDP) might not be appropriate in countries with low healthcare investment and a high disease burden as a consequence.
Methods: Using data from previously published CEA of rotavirus vaccination across nine countries worldwide, we calculated the cost-neutral price (P
n) for the new
intervention that refl ects the price resulting in no net increase in health care costs compared with the current situation, and the maximum price (P
m) obtained with an
incremental cost-eff ectiveness ratio (ICER) at the threshold value of 1 x GDP/capita.
Results: In countries with low GDP/capita the paradoxical fi nding for rotavirus vaccination is that the P
m is much higher than in countries with a high GDP/capita.
On the other hand, the Pn for the low GDP/capita countries is much lower than for
high GDP/capita countries because of the low investment in health care.
Conclusions: In countries with low healthcare investment and a high disease burden the diff erence between the P
n and P
m for rotavirus vaccine which is the price range
within which the ICER is below the WHO threshold value, is large. One reason could be that the WHO threshold value may not properly account for the local opportunity cost of health care expenditures. Therefore either alternative threshold values should be selected or alternative economic assessment tools should be considered such as budget optimisation or return on investment if we want to communicate about real economic value of new vaccines in those countries.
INTRODUCTIONCurrent economic assessment of a new medical intervention such as a drug, device, or vaccine aims to provide local decision-makers with information on the additional benefi t generated for the additional cost incurred, compared with the existing situation (1;2). This is most commonly conducted using cost-eff ectiveness analysis (CEA), with results expressed with incremental cost-eff ectiveness ratios (ICERs). The ICER can be used to help defi ne an acceptable “value-based” price range for the new intervention, with the maximum acceptable price being the price at which the ICER crosses a defi ned threshold (2). The Gross Domestic Product (GDP) per capita is a well-accepted threshold measure, as proposed and recommended by the World Health Organization (WHO) (3) (4). If the price of the new technology leads to an ICER below the threshold, that price is qualifi ed as being highly cost-eff ective following the interpretation of the WHO-guidelines (5).
Baudouin Standaert1
Olivier Ethgen2
Rachel Emerson3
Maarten Postma4
Josephine Mauskopf5Josephine Mauskopf5Josephine Mauskopf
1GlaxoSmithKline Vaccines, Wavre, Belgium;
2Université de Liège, Liège, Belgium);
3Emerson Consulting, Tervuren, Belgium;
4University of Groningen, Groningen, The Netherlands;
5 RTI Health International, Research Triangle Park, North Carolina, USA

Exploring new ways of measuring the economic value of vaccination
166
CEA is a well-established economic assessment technique in healthcare (6) ; (7), (8). It was initially developed in industrialised countries with mature healthcare systems which had already made considerable investments in healthcare infrastructure. More recently, the use of CEA has been extended to economic evaluations of health interventions in developing countries. For example, CEA results for rotavirus vaccination have been reviewed in developed countries (9) and developing countries (10). These two reviews reported that the vaccine was very cost-eff ective in low-income countries, but the picture was mixed in high-income countries. A similar result was reported by Rheingans et al. (2009) comparing the cost-eff ectiveness and price setting of rotavirus vaccination for diff erent country groups in Latin America from low income (L), via low middle (LM), to upper middle income (UM) (11). They reported that the price per vaccine dose that is cost-eff ective was higher in L countries than in LM and UM countries. This is counter-intuitive, as it would be expected that the maximum price for favourable cost-eff ectiveness would be lower in L countries, refl ecting the lower income and lower resources available for healthcare, compared with higher-income countries. The authors of these papers did not attempt to explain this paradoxical fi nding. The analysis provided here builds on these previous reports by seeking to explore how these apparently paradoxical results could arise.
This paper focuses on rotavirus vaccination as an example. It is an interesting example, as the rotavirus vaccine has been the subject of CEA in a range of countries worldwide, and the benefi ts obtained from the vaccine appear quite diff erent in high- versus low-income countries (12). In low-income countries, the benefi t of vaccination is primarily a reduction in the high mortality rate. In high-income countries, in addition to a reduced need for hospital care the benefi ts are more subtle, such as better time management for working parents (11) (13).
In this paper, fi rst a theoretical framework and interpretation of the “value-based” price range is presented for a new vaccine program. In the next step, an application in practice for rotavirus vaccination using published country-specifi c data for rotavirus to estimate the “value-based” price range in nine countries was conducted. This allowed an analysis of the relationship of the “value-based” price range for each country and the GDP/capita. Finally, the fi ndings are interpreted and recommendations made for alternative/additional economic evaluations.
METHODS
Theoretical FrameworkThe fi rst step demonstrates, using mathematical equations, the relationship between the price of a new intervention, the ICER, the threshold value for cost-eff ectiveness and the cost-neutral price (Pn) and the maximum price (Pm) linked to that threshold.
The relationship between the ICER and the price of a new intervention is expressed as a linear function (y = ax + b), where y (= ICER) is the dependent variable and x (= price or cost of the new intervention) is the independent variable, here the cost

Chapter 5
167
of the vaccine (CostV). This relationship is now considered within the context of a static cohort model for modelling the cost-eff ectiveness of the intervention of the rotavirus vaccine (14). Additional equations and variables help to specify which exact parameters defi ne the slope of the line (a) and which the intercept (b) that is the remaining disease cost after the impact of the new intervention divided by the diff erence in disease outcomes attributable to the new intervention. Calculating the association between the price of the new intervention and the ICER allows testing the price range over which it is still cost-eff ective. This is defi ned here as the price range for which the ICER lies below the threshold value, defi ned as 1 x GDP per capita (3). The linear function also indicates at what price the ICER equals zero (because of no diff erence in total cost with the intervention compared with the total cost without the intervention). This is referred to as the cost-neutral price (Pn). The maximum price (Pm) above which a new product is no longer cost-eff ective is defi ned by the point where the threshold value intersects with the increasing linear function for new interventions that are more eff ective but result in higher total costs than with the current health care program (see Figure 1).
Now, we further elaborate on the mathematical properties of the relationship described above. In its simplest form, the relationship between the ICER and the cost (price) of a new intervention (vaccine) is defi ned by the following equations:
Figure 1 Cost-neutral (Pn) and maximum price (Pm) of the vaccine per dose at a threshold T (for example $40,000/life-year gained)
a, slope; b, intercept; CostV, vaccine cost; Pm, maximum price; Pn, cost-neutral price; ICER, incremental cost-eff ectiveness ratio; T, Threshold.
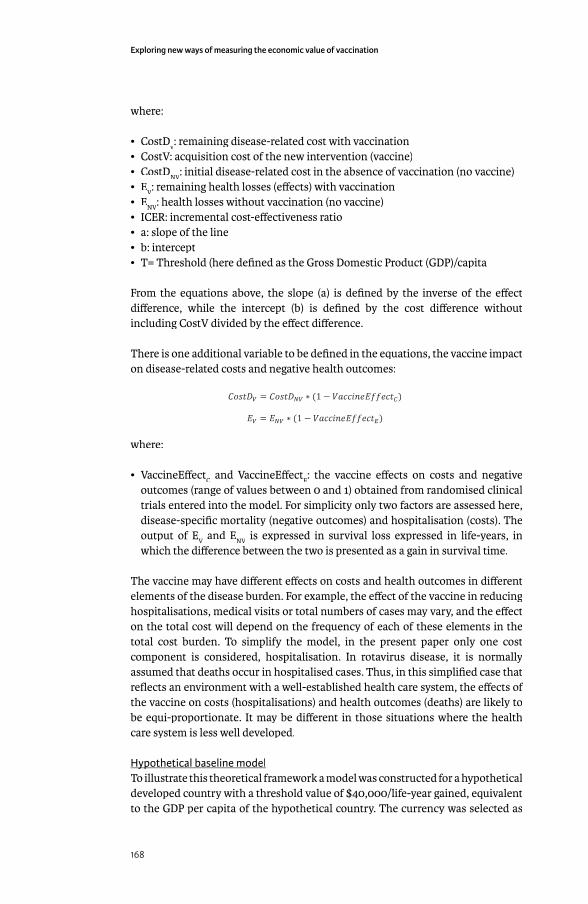
Exploring new ways of measuring the economic value of vaccination
168
where:
• CostDv: remaining disease-related cost with vaccination
• CostV: acquisition cost of the new intervention (vaccine)• CostD
NV: initial disease-related cost in the absence of vaccination (no vaccine)
• EV: remaining health losses (eff ects) with vaccination
• ENV
: health losses without vaccination (no vaccine)• ICER: incremental cost-eff ectiveness ratio• a: slope of the line• b: intercept• T= Threshold (here defi ned as the Gross Domestic Product (GDP)/capita
From the equations above, the slope (a) is defi ned by the inverse of the eff ect diff erence, while the intercept (b) is defi ned by the cost diff erence without including CostV divided by the eff ect diff erence.
There is one additional variable to be defi ned in the equations, the vaccine impact on disease-related costs and negative health outcomes:
where:
• VaccineEff ectC and VaccineEff ect
E: the vaccine eff ects on costs and negative
outcomes (range of values between 0 and 1) obtained from randomised clinical trials entered into the model. For simplicity only two factors are assessed here, disease-specifi c mortality (negative outcomes) and hospitalisation (costs). The output of E
V and E
NV is expressed in survival loss expressed in life-years, in
which the diff erence between the two is presented as a gain in survival time.
The vaccine may have diff erent eff ects on costs and health outcomes in diff erent elements of the disease burden. For example, the eff ect of the vaccine in reducing hospitalisations, medical visits or total numbers of cases may vary, and the eff ect on the total cost will depend on the frequency of each of these elements in the total cost burden. To simplify the model, in the present paper only one cost component is considered, hospitalisation. In rotavirus disease, it is normally assumed that deaths occur in hospitalised cases. Thus, in this simplifi ed case that refl ects an environment with a well-established health care system, the eff ects of the vaccine on costs (hospitalisations) and health outcomes (deaths) are likely to be equi-proportionate. It may be diff erent in those situations where the health care system is less well developed.
Hypothetical baseline modelHypothetical baseline modelTo illustrate this theoretical framework a model was constructed for a hypothetical developed country with a threshold value of $40,000/life-year gained, equivalent to the GDP per capita of the hypothetical country. The currency was selected as
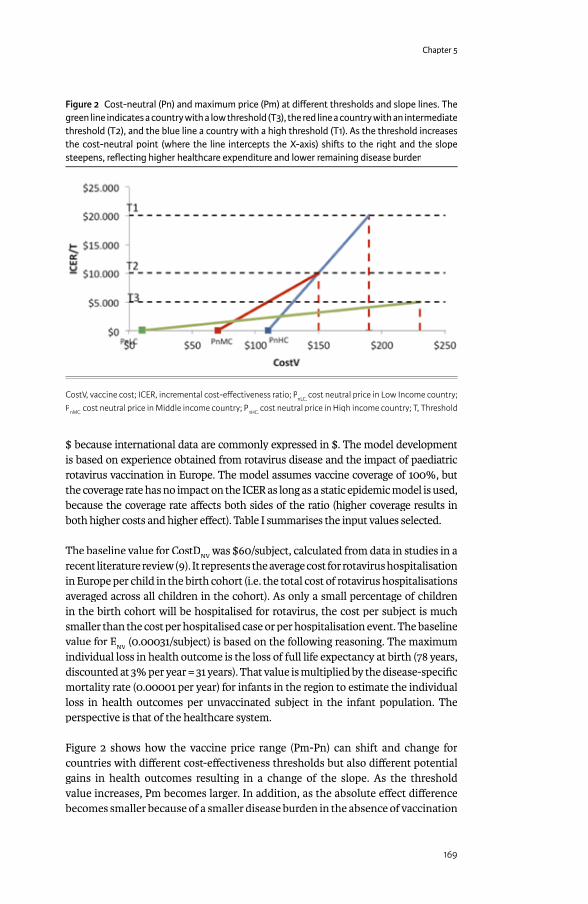
Chapter 5
169
$ because international data are commonly expressed in $. The model development is based on experience obtained from rotavirus disease and the impact of paediatric rotavirus vaccination in Europe. The model assumes vaccine coverage of 100%, but the coverage rate has no impact on the ICER as long as a static epidemic model is used, because the coverage rate aff ects both sides of the ratio (higher coverage results in both higher costs and higher eff ect). Table I summarises the input values selected.
The baseline value for CostDNV
was $60/subject, calculated from data in studies in a NV
was $60/subject, calculated from data in studies in a NV
recent literature review (9). It represents the average cost for rotavirus hospitalisation in Europe per child in the birth cohort (i.e. the total cost of rotavirus hospitalisations averaged across all children in the cohort). As only a small percentage of children in the birth cohort will be hospitalised for rotavirus, the cost per subject is much smaller than the cost per hospitalised case or per hospitalisation event. The baseline value for E
NV (0.00031/subject) is based on the following reasoning. The maximum
NV (0.00031/subject) is based on the following reasoning. The maximum
NV
individual loss in health outcome is the loss of full life expectancy at birth (78 years, discounted at 3% per year = 31 years). That value is multiplied by the disease-specifi c mortality rate (0.00001 per year) for infants in the region to estimate the individual loss in health outcomes per unvaccinated subject in the infant population. The perspective is that of the healthcare system.
Figure 2 shows how the vaccine price range (Pm-Pn) can shift and change for countries with diff erent cost-eff ectiveness thresholds but also diff erent potential gains in health outcomes resulting in a change of the slope. As the threshold value increases, Pm becomes larger. In addition, as the absolute eff ect diff erence becomes smaller because of a smaller disease burden in the absence of vaccination
Figure 2 Cost-neutral (Pn) and maximum price (Pm) at diff erent thresholds and slope lines. The green line indicates a country with a low threshold (T3), the red line a country with an intermediate threshold (T2), and the blue line a country with a high threshold (T1). As the threshold increases the cost-neutral point (where the line intercepts the X-axis) shi� s to the right and the slope steepens, refl ecting higher healthcare expenditure and lower remaining disease burden
CostV, vaccine cost; ICER, incremental cost-eff ectiveness ratio; PnLC, cost neutral price in Low Income country; PnMC, cost neutral price in Middle income country; PnHC, cost neutral price in High income country; T, Threshold
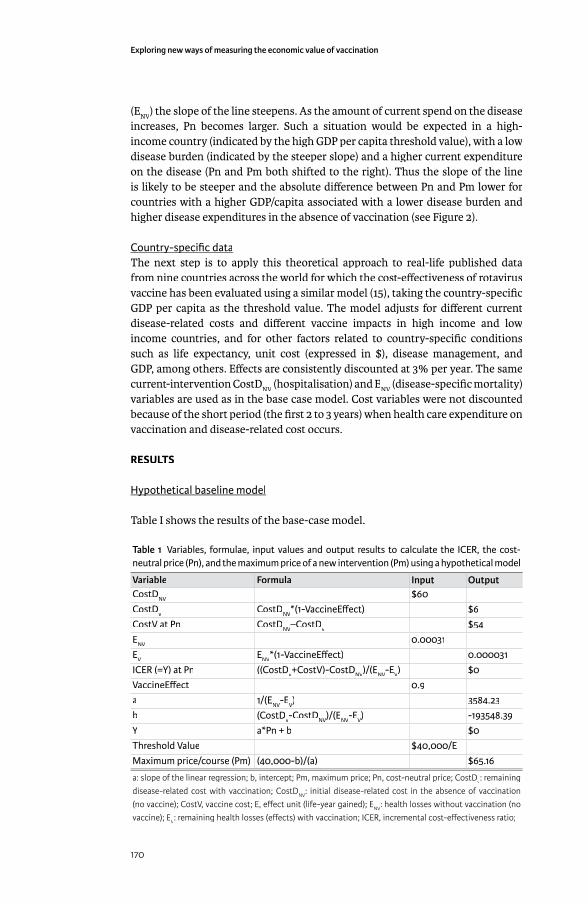
Exploring new ways of measuring the economic value of vaccination
170
(ENV
) the slope of the line steepens. As the amount of current spend on the disease increases, Pn becomes larger. Such a situation would be expected in a high-income country (indicated by the high GDP per capita threshold value), with a low disease burden (indicated by the steeper slope) and a higher current expenditure on the disease (Pn and Pm both shifted to the right). Thus the slope of the line is likely to be steeper and the absolute diff erence between Pn and Pm lower for countries with a higher GDP/capita associated with a lower disease burden and higher disease expenditures in the absence of vaccination (see Figure 2).
Country-specifi c dataCountry-specifi c dataThe next step is to apply this theoretical approach to real-life published data from nine countries across the world for which the cost-eff ectiveness of rotavirus vaccine has been evaluated using a similar model (15), taking the country-specifi c GDP per capita as the threshold value. The model adjusts for diff erent current disease-related costs and diff erent vaccine impacts in high income and low income countries, and for other factors related to country-specifi c conditions such as life expectancy, unit cost (expressed in $), disease management, and GDP, among others. Eff ects are consistently discounted at 3% per year. The same current-intervention CostD
NV (hospitalisation) and E
NV (disease-specifi c mortality)
variables are used as in the base case model. Cost variables were not discounted because of the short period (the fi rst 2 to 3 years) when health care expenditure on vaccination and disease-related cost occurs.
RESULTS
Hypothetical baseline modelHypothetical baseline model
Table I shows the results of the base-case model.
Table 1 Variables, formulae, input values and output results to calculate the ICER, the cost-neutral price (Pn), and the maximum price of a new intervention (Pm) using a hypothetical model
Variable Formula Input OutputCostDNV $60CostDv CostDNV*(1-VaccineEff ect) $6CostV at Pn CostDNV–CostDv $54ENV 0.00031EV ENV*(1-VaccineEff ect) 0.000031ICER (=Y) at Pn ((CostDv+CostV)-CostDNV)/(ENV-EV) $0VaccineEff ect 0.9a 1/(ENV-EV) 3584.23b (CostDv-CostDNV)/(ENV-EV) -193548.39Y a*Pn + b $0Threshold Value $40,000/EMaximum price/course (Pm) (40,000-b)/(a) $65.16
a: slope of the linear regression; b, intercept; Pm, maximum price; Pn, cost-neutral price; CostDv: remaining disease-related cost with vaccination; CostDNV: initial disease-related cost in the absence of vaccination (no vaccine); CostV, vaccine cost; E, eff ect unit (life-year gained); ENV: health losses without vaccination (no vaccine); EV: remaining health losses (eff ects) with vaccination; ICER, incremental cost-eff ectiveness ratio;
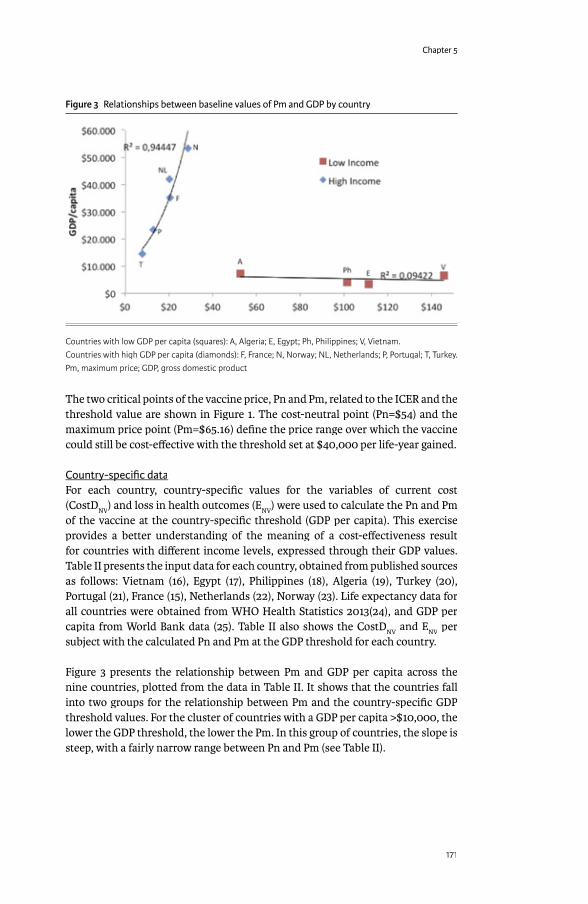
Chapter 5
171
The two critical points of the vaccine price, Pn and Pm, related to the ICER and the threshold value are shown in Figure 1. The cost-neutral point (Pn=$54) and the maximum price point (Pm=$65.16) defi ne the price range over which the vaccine could still be cost-eff ective with the threshold set at $40,000 per life-year gained.
Country-specifi c dataCountry-specifi c dataFor each country, country-specifi c values for the variables of current cost (CostD
NV) and loss in health outcomes (E
NV) were used to calculate the Pn and Pm
of the vaccine at the country-specifi c threshold (GDP per capita). This exercise provides a better understanding of the meaning of a cost-eff ectiveness result for countries with diff erent income levels, expressed through their GDP values. Table II presents the input data for each country, obtained from published sources as follows: Vietnam (16), Egypt (17), Philippines (18), Algeria (19), Turkey (20), Portugal (21), France (15), Netherlands (22), Norway (23). Life expectancy data for all countries were obtained from WHO Health Statistics 2013(24), and GDP per capita from World Bank data (25). Table II also shows the CostD
NV and E
NV per
subject with the calculated Pn and Pm at the GDP threshold for each country.
Figure 3 presents the relationship between Pm and GDP per capita across the nine countries, plotted from the data in Table II. It shows that the countries fall into two groups for the relationship between Pm and the country-specifi c GDP threshold values. For the cluster of countries with a GDP per capita >$10,000, the lower the GDP threshold, the lower the Pm. In this group of countries, the slope is steep, with a fairly narrow range between Pn and Pm (see Table II).
Figure 3 Relationships between baseline values of Pm and GDP by country
Countries with low GDP per capita (squares): A, Algeria; E, Egypt; Ph, Philippines; V, Vietnam. Countries with high GDP per capita (diamonds): F, France; N, Norway; NL, Netherlands; P, Portugal; T, Turkey.Pm, maximum price; GDP, gross domestic product
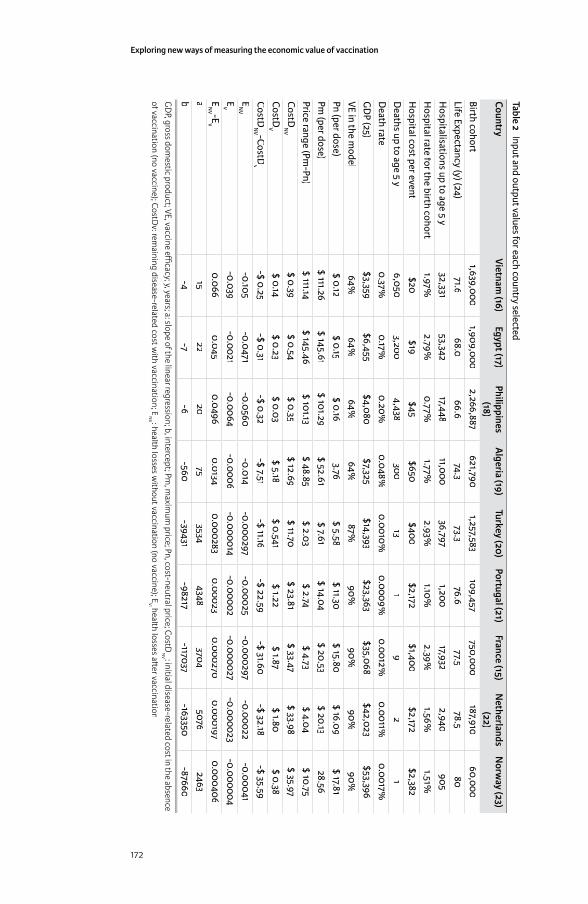
Exploring new ways of measuring the economic value of vaccination
172
Table 2 Input and output values for each country selected
CountryVietnam
(16)Egypt (17)
Philippines (18)
Algeria (19)
Turkey (20)Portugal (21)
France (15)N
etherlands (22)
Norw
ay (23)
Birth cohort1,639,000
1,909,0002,266,887
621,7901,257,583
109,457750,000
187,91060,000
Life Expectancy (y) (24)71.6
68.066.6
74.373.3
76.677.5
78.580
Hospitalisations up to age 5 y
32,33153,342
17,44811,000
36,7971,200
17,9322,940
905H
ospital rate for the birth cohort1.97%
2.79%0.77%
1.77%2.93%
1.10%2.39%
1.56%1.51%
Hospital cost per event
$20$19
$45$650
$400$2,172
$1,400$2,172
$2,382D
eaths up to age 5 y6,050
3,2004,438
30013
19
21
Death rate
0.37%0.17%
0.20%0.048%
0.0010%0.0009%
0.0012%0.0011%
0.0017%G
DP (25)
$3,359$6,455
$4,080$7,325
$14,393$23,363
$35,068$42,023
$53,396VE in the m
odel64%
64%64%
64%87%
90%90%
90%90%
Pn (per dose)$ 0.12
$ 0.15$ 0.16
3.76$ 5.58
$ 11.30$ 15.80
$ 16.09$ 17.81
Pm (per dose)
$ 111.26$ 145.61
$ 101.29$ 52.61
$ 7.61$ 14.04
$ 20.53$ 20.13
28.56Price range (Pm
-Pn)$ 111.14
$ 145.46$ 101.13
$ 48.85$ 2.03
$ 2.74$ 4.73
$ 4.04$ 10.75
CostDN
V$ 0.39
$ 0.54$ 0.35
$ 12.69$ 11.70
$ 23.81$ 33.47
$ 33.98$ 35.97
CostDV
$ 0.14$ 0.23
$ 0.03$ 5.18
$ 0.541$ 1.22
$ 1.87$ 1.80
$ 0.38CostD
NV -CostD
v-$ 0.25
-$ 0.31-$ 0.32
-$ 7.51-$ 11.16
-$ 22.59-$ 31.60
-$ 32.18-$ 35.59
EN
V-0.105
-0.0471-0.0560
-0.014-0.000297
-0.00025-0.000297
-0.00022-0.00041
EV
-0.039-0.0021
-0.0064-0.0006
-0.000014-0.00002
-0.000027-0.000023
-0.000004E
NV -E
V0.066
0.0450.0496
0.01340.000283
0.000230.000270
0.0001970.000406
a15
2220
753534
43483704
50762463
b-4
-7-6
-560-39431
-98217-117037
-163350-87660
GD
P, gross domestic product;VE, vaccine effi cacy;y, years; a: slope of the linear regression; b, intercept; Pm
, maxim
um price; Pn, cost-neutral price; CostD
NV : initial disease-related cost in the absence
of vaccination (no vaccine); CostDv: rem
aining disease-related cost with vaccination; E
NV : health losses w
ithout vaccination (no vaccine); EV: health losses a� er vaccination
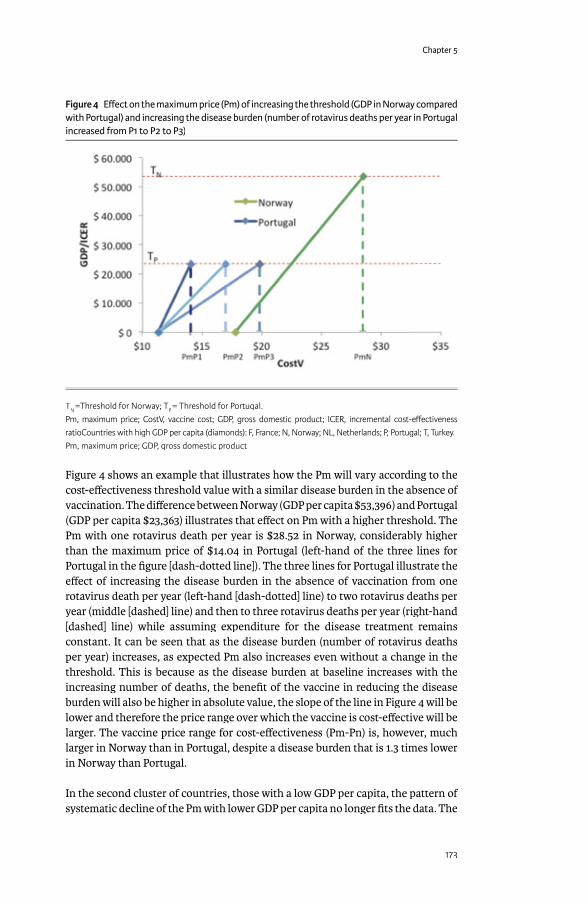
Chapter 5
173
Figure 4 shows an example that illustrates how the Pm will vary according to the cost-eff ectiveness threshold value with a similar disease burden in the absence of vaccination. The diff erence between Norway (GDP per capita $53,396) and Portugal (GDP per capita $23,363) illustrates that eff ect on Pm with a higher threshold. The Pm with one rotavirus death per year is $28.52 in Norway, considerably higher than the maximum price of $14.04 in Portugal (left-hand of the three lines for Portugal in the fi gure [dash-dotted line]). The three lines for Portugal illustrate the eff ect of increasing the disease burden in the absence of vaccination from one rotavirus death per year (left-hand [dash-dotted] line) to two rotavirus deaths per year (middle [dashed] line) and then to three rotavirus deaths per year (right-hand [dashed] line) while assuming expenditure for the disease treatment remains constant. It can be seen that as the disease burden (number of rotavirus deaths per year) increases, as expected Pm also increases even without a change in the threshold. This is because as the disease burden at baseline increases with the increasing number of deaths, the benefi t of the vaccine in reducing the disease burden will also be higher in absolute value, the slope of the line in Figure 4 will be lower and therefore the price range over which the vaccine is cost-eff ective will be larger. The vaccine price range for cost-eff ectiveness (Pm-Pn) is, however, much larger in Norway than in Portugal, despite a disease burden that is 1.3 times lower in Norway than Portugal.
In the second cluster of countries, those with a low GDP per capita, the pattern of systematic decline of the Pm with lower GDP per capita no longer fi ts the data. The
Figure 4 Eff ect on the maximum price (Pm) of increasing the threshold (GDP in Norway compared with Portugal) and increasing the disease burden (number of rotavirus deaths per year in Portugal increased from P1 to P2 to P3)
TN =Threshold for Norway; TP = Threshold for Portugal. Pm, maximum price; CostV, vaccine cost; GDP, gross domestic product; ICER, incremental cost-eff ectiveness ratioCountries with high GDP per capita (diamonds): F, France; N, Norway; NL, Netherlands; P, Portugal; T, Turkey.Pm, maximum price; GDP, gross domestic product
Exploring new ways of measuring the economic value of vaccination
174
baseline disease-related healthcare costs are so low (CostDNV
), and the remaining health burden (E
NV) so high, that the slope factor ‘a’ is also very low (see Table II).
The slope factor is given by the equation:
The slope angle is very shallow because of the high reduction in losses in health outcomes, and the Pn value is close to zero because of the low current expenditure per case for the disease and thus the potential for only minimal cost off sets.
DISCUSSION
An important outcome from the analyses presented in this paper is that the results for rotavirus vaccination split the countries into two clusters with diff erent characteristics using the GDP per capita as a measure of distinction.
Countries with a high GDP/capitaCountries with a high GDP/capitaCEA has been applied mainly in higher income countries for many years now as a technique currently used to compare the value of alternative treatments and/or in combination with threshold values representing willingness to pay for an incremental unit of health as the basis for “value-based” pricing. It is an established method in health economic assessment to help to defi ne the price at which a new intervention is considered good value for money compared with the current standard of care at the individual, most often, patient level (26) (27).
Typically, a new intervention has an impact on both the cost and the eff ect side in the ICER. CEA makes most sense in capturing the value of a new intervention when there is investment in healthcare for the disease of interest but with disease burden still remaining. Under such circumstances a new intervention can achieve both an important cost off set and a reasonable eff ect gain. It is then meaningful to estimate a cost per life-year or quality-adjusted life year gained in relation to a pre-specifi ed threshold within a price range. Such situations are likely to occur within mature healthcare markets. ICER values calculated from CEA can be useful in defi ning the acceptable price range in such countries. The steeper the line in Figure 1, the narrower the price band over which the ICER moves from Pn to Pm. When Pn equals Pm, the focus of price-setting may shift from cost-eff ectiveness to cost savings.
The maximum price in this group of countries is strongly infl uenced by the threshold value (GDP per capita) and the remaining disease burden in the absence of vaccination. As the threshold value increases, the maximum price also increases. In addition, as the disease burden in the absence of vaccination increases, the slope of the line decreases and the maximum price increases even without a change in the threshold, as illustrated in the present analysis using Norway and Portugal as examples.

Chapter 5
175
Countries with low GDP/capitaCountries with low GDP/capitaThe situation is quite diff erent when conducting CEA outside mature healthcare markets. This refl ects an environment with low existing healthcare investment (CostD
NV) and high disease burden (E
NV) as a consequence. The low existing
healthcare expenditure on the disease allows minimal scope for cost off sets, so the Pn is close to zero. The high disease burden has the potential for large reductions in health outcome losses, so an eff ective intervention can be cost-eff ective (as defi ned by the GDP per capita threshold) over a wide price range, because of the low slope.
This wide price range within which rotavirus vaccination is cost-eff ective off ers a possible explanation for the paradoxical results for rotavirus vaccination CEA reported in the literature. Reviews of rotavirus vaccination reported high cost-eff ectiveness in low-income countries and a mixed picture in high-income countries (10). A study in Latin America found that the vaccine price that was apparently cost-eff ective was higher in low-income countries than in middle-income countries (11). Yet it is clear that high prices are not aff ordable or acceptable for low-income countries. The present analysis suggests that the apparently better cost-eff ectiveness results at a relatively high intervention price in countries with low GDP per capita refl ects the large increases in health outcomes possible in such environments.
In situations with high potential increases in health outcomes accompanied by low current health care expenditures, ICER values calculated by conventional CEA have limited value in defi ning a reasonable price band for a new intervention. Even if the estimated ICER value indicates that a high price would be cost-eff ective based on a 1x GDP threshold, the price may be rejected on the basis of the aff ordability of the acquisition cost (28). A price close to the Pn is likely to be preferred by the low-income country, but as the Pn is likely to be very low (because low existing healthcare expenditure off ers minimal scope for cost off sets), such a price might not be seen as reasonable by the seller of the new intervention. Thus, if Pn and Pm defi ne price bands in low-income countries that are questionable at the extremes for both payers and producers, CEA performed under these conditions might not be able to serve the same function in low-income countries as in high-income countries, where CEA is used to help defi ne a reasonable price band.
Although the value of $10,000 GDP per capita that diff erentiates the two groups of countries in this analysis is an arbitrary threshold, it acts as a proxy for the degree of healthcare development in a country. Countries in the group with a high GDP per capita typically have well established healthcare systems with infrastructure already in place. In these countries, the fi xed cost of healthcare infrastructure is already accounted for and variable costs for treatment are well accepted. In these cases decisions about new interventions can be made at the margin using incremental costs and benefi ts for individuals, as described in the ICER calculated by conventional CEA that assumes that prices are a fair representation of opportunity costs. Conversely, in the countries with a low GDP per capita, healthcare infrastructure may be limited and the healthcare system not yet fully developed. Because of this, prices defi ned as acquisition costs may not refl ect the true opportunity cost of the intervention. In these situations,
Exploring new ways of measuring the economic value of vaccination
176
aff ordability and practical considerations such as the alternative possible uses for the additional healthcare investment (including other health investments or non-health investments) are important considerations.
Potential future directionsOur results suggest that CEA is not necessarily the optimum economic analysis method for defi ning a feasible price band for a new intervention in low-income countries (29). Measuring shadow prices could be an alternative if cost-benefi t analysis or CEA are used for economic assessment of new interventions in those situations (30). In low-income environments with low health investment and a high disease burden, almost any improvement in health will require extra spending. The question therefore should be phrased not as a comparison of the new intervention with the existing situation which could be considered as a substitution economy, but as a consideration of which alternative interventions would provide the greatest additional health benefi t for a given amount of extra money spent –an add-on economy instead of substitution (31).
Health problems that aff ect a whole population (as is often the case in low-income countries) should be assessed using economic approaches, tools or techniques that describe the problem well at the population level. In addition the impact of increased spending on health care on other sectors of the economy should be included in the analyses.
Budget optimization modelling (BOM) (32) and return on investment (ROI) (17) are possible alternative economic techniques for estimating the true value of a new intervention in low-income countries. The choice of technique should be driven by the economic question asked, a good understanding of the economic problem to be solved, data availability, and the requirements of the decision-makers who need to understand and use the economic analysis.
BOM is attractive when the problem is one of integrating diff erent management options into a specifi c health goal within certain constraints, such as budgets and/or logistics (33). Its application is not especially complicated. Furthermore, the BOM is well suited to the type of problem that needs to be addressed in low healthcare investment areas. Instead of comparing a new intervention with the existing situation, which as described here has weaknesses when applied to countries with a low GDP/capita, it considers the question of how best to optimise the use of the health investment budget available today. It is essentially a more fl exible and dynamic version of budget impact assessment. However, a limitation of budget optimisation is that it is more diffi cult to evaluate the eff ects of uncertainty than in conventional CEA, because the eff ects of varying the proportions of diff erent interventions in the mix have to be taken into account, as well as uncertainty in the parameters describing each intervention.
ROI analysis is also attractive. It is based on the premise that the health problem must be substantial at population level and compares diff erent investment policies in terms of benefi t within that population projected over time as a function of tax
Chapter 5
177
payment/income for the government. It can compare investment in prevention through vaccination with either doing nothing or increasing healthcare infrastructure to reach the same health benefi t level. However, a limitation is that it considers health benefi ts only in terms of the eff ects on future tax revenues, and does not take into account intangible benefi ts such as the improvement in human welfare arising from reductions in the disease burden.
A further area of uncertainty is whether the average GDP per capita refl ects the right threshold value (34). First, the distribution of GDP per capita in low-income countries is often skewed, and much of the population may receive little benefi t from any healthcare services off ered because they do not have access to them. This issue is not refl ected in the average per-capita GDP value, but is refl ected in the remaining health problem (E
NV). For example, Egypt has a relatively high GDP per
capita, close to the value reported for Algeria, while the disease burden (ENV
) is high and comparable with populations such as the Philippines (see Tables II). Second, GDP per capita does not necessarily relate to the investment a country is willing to make in healthcare, which may be aff ected by other competing priorities.
The present analysis has limitations. Not all the diff erent costs and benefi ts related to rotavirus vaccination have been included in the analysis, as the focus was only on the parameters that drive the main results, hospitalisation and mortality. However, a more detailed assessment is not likely to change the main discrepancy between the clusters of countries with high versus low income. Furthermore, the analysis has only investigated a single intervention and disease, rotavirus vaccination. The next step would be to explore whether other disease areas show similar patterns, which would indicate whether the fi ndings are likely to be generalizable.
In conclusion, the paradoxical results of CEA in countries with low GDP per capita described in this paper, suggest that conventional CEA may have limited applicability for defi ning an acceptable price range in such situations. This may be because current methods for cost-eff ectiveness analyses do not properly account for the opportunity costs of the new intervention in low income countries. Alternative economic methods may be better suited to the economic assessment of healthcare interventions in low-income countries, and this should be explored in greater detail.
ACKNOWLEDGEMENTSThe authors would like to thank Carole Nadin (Fleetwith Ltd) who provided language editing services and many useful discussions on behalf of GlaxoSmithKline Vaccines, Wavre, Belgium, and Nadia Schecroun (Keyrus Biopharma) who provided publication co-ordination and useful discussions on behalf of GlaxoSmithKline Vaccines, Wavre, Belgium.
REFERENCES(1) Birch S, Donaldson C. Applications of cost-benefi t analysis to health care.
Departures from welfare economic theory. J Health Econ 1987 Sep;6(3):211-25.
Exploring new ways of measuring the economic value of vaccination
178
(2) Ng Y-K. Welfare Economics: introduction and development of basic concepts. London: Macmillan; 1983.(3) Shillcutt SD, Walker DG, Goodman CA, Mills AJ. Cost eff ectiveness in low- and middle-income countries: a review of the debates surrounding decision rules. Pharmacoeconomics 2009;27(11):903-17.
(4) Walker DG, Hutubessy R, Beutels P. WHO Guide for standardisation of economic evaluations of immunization programmes. Vaccine 2010 Mar 8;28(11):2356-9.Ref ID: 1662
(5) Thresholds in CEA. 2014. 7Ref Type: Internet Communication (6) Drummond M, Sculpher MJ, Torrance GW, O’Brien BJ, Stoddart GL. Methods
for the economic evaluation of health care programmes. Third Edition ed. Oxford: Oxford university press; 2005.
(7) Gold MR. Cost-Eff ectiveness in Health and Medicine. Oxford: Oxford University Press; 1996.
(8) Weinstein MC, Stason WB. Foundations of cost-eff ectiveness analysis for health and medical practices. N Engl J Med 1977 Mar 31;296(13):716-21.
(9) Plosker GL. Rotavirus vaccine RIX4414 (Rotarix): a pharmacoeconomic review of its use in the prevention of rotavirus gastroenteritis in developed countries. Pharmacoeconomics 2011 May;29(5):439-54. Ref ID: 1667
(10) Plosker GL. Rotavirus vaccine RIX4414 (Rotarix): a pharmacoeconomic review of its use in the prevention of rotavirus gastroenteritis in developing countries. Pharmacoeconomics 2011 Nov;29(11):989-1009. Ref ID: 1665
(11) Rheingans RD, Antil LR, Dreibelbis R, Podewils LJ, Bressee JS, Parashar UD. Economic Costs of Rotavirus Gastroenteritis and Cost-Eff ectiveness of Vaccination in Developing Countries. Journal of Infectious Diseases 2009;200:S16-S27.
(12) Postma MJ, Standaert BA. Economics of vaccines revisited. Hum Vaccin Immunother 2013 Jan 30;9(5).
(13) Tate JE, Patel MM, Steele AD, Gentsch JR, Payne DC, Cortese MM, et al. Global impact of rotavirus vaccines. Expert Rev Vaccines 2010 Apr;9(4):395-407.
(14) Marsh K, Phillips CJ, Fordham R, Bertranou E, Hale J. Estimating cost-eff ectiveness in public health: a summary of modelling and valuation methods9. Health Econ Rev 2012;2(1):17.
(15) Standaert B, Parez N, Tehard B, Colin X, Detournay B. Cost-eff ectiveness analysis of vaccination against rotavirus with RIX4414 in France. Appl Health Econ Health Policy 2008;6(4):199-216.
(16) Tu HA, Rozenbaum MH, Coyte PC, Li SC, Woerdenbag HJ, Postma MJ. Health economics of rotavirus immunization in Vietnam: potentials for favorable cost-eff ectiveness in developing countries. Vaccine 2012 Feb 14;30(8):1521-8.
(17) Connolly MP, Topachevskyi O, Standaert B, Ortega O, Postma MJ. The Impact of Rotavirus Vaccination on Discounted Net Tax Revenue in Egypt. Pharmacoeconomics 2012;30(8):681-95.
(18) Carlos CC, Inobaya MT, Bresee JS, Lagrada ML, Olorosa AM, Kirkwood CD, et al. The burden of hospitalizations and clinic visits for rotavirus disease in children aged <5 years in the Philippines. J Infect Dis 2009 Nov 1;200 Suppl 1:S174-S181.
Chapter 5
179
(19) Tchambaz M, Messaoudi Z, Meziane O, Ammari H. [Detection of rotavirus in the stools of infants aged 0-3 yr (study performed from July 1987 to May 1989)]. Arch Inst Pasteur Alger 1989;57:83-103.
(20) Bakir M, Standaert B, Turel O, Bilge ZE, Postma M. Estimating and comparing the clinical and economic impact of paediatric rotavirus vaccination in Turkey using a simple versus an advanced model. Vaccine 2013 Jan 30;31(6):979-86.
(21) Rodrigues F, Iturriza-Gomara M, Marlow R, Gray J, Nawaz S, Januario L, et al. The evolving epidemiology of rotavirus gastroenteritis in central Portugal with modest vaccine coverage. J Clin Virol 2013 Feb;56(2):129-34.
(22) Goossens LMA, Standaert B, Hartwig N, Hovels AM, Al MJ. The cost-utility of rotavirus vaccination with Rotarix(TM) (RIX4414) in the Netherlands1487. Vaccine 2008 Feb 20;26(8):1118-27.
(23) Flem E, Vainio K, Dollner H, Midgaard C, Bosse FJ, Rognlien AG, et al. Rotavirus gastroenteritis in Norway: analysis of prospective surveillance and hospital registry data. Scand J Infect Dis 2009;41(10):753-9.
(24) World Health Statistics 2013. WHO Library Cataloguing-in-Publication Data; 2013. www.who.int/gho/publications/world_health_statistics/EN_WHS2013_Full.pdf
(25) GDP per capita. 3-8-2013. Ref Type: Internet Communication, en.wikipedia.org/wiki/List_of_countries_by_GDP_(nominal)
(26) Donaldson C, Currie G, Mitton C. Cost eff ectiveness analysis in health care: contraindications. BMJ 2002 Oct 19;325(7369):891-4.
(27) Danzon PM, Towse A, Mulcahy AW. Setting cost-eff ectiveness thresholds as a means to achieve appropriate drug prices in rich and poor countries. Health Aff (Millwood ) 2011 Aug;30(8):1529-38.
(28) Newall AT, Jit M, Hutubessy R. Are current cost-eff ectiveness thresholds for low- and middle-income countries useful? Examples from the world of vaccines1. Pharmacoeconomics 2014 Jun;32(6):525-31.
(29) Babar ZU, Scahill S. Is there a role for pharmacoeconomics in developing countries? Pharmacoeconomics 2010;28(12):1069-74.
(30) Hutton G, Baltussen R. Cost valuation in resource-poor settings. Health Policy Plan 2005 Jul;20(4):252-9.
(31) Singer ME. Cost-eff ectiveness analysis: developing nations left behind. Pharmacoeconomics 2008;26(5):359-61.(32) Demarteau N, Breuer T, Standaert B. Selecting a mix of prevention strategies against cervical cancer for maximum effi ciency with an optimization program. Pharmacoeconomics 2012 Apr;30(4):337-53.
(33) Earnshaw SR, Dennett SL. Integer/linear mathematical programming models: a tool for allocating healthcare resources. Pharmacoeconomics 2003;21(12):839-51.
(34) Dasgupta P. Economics, a very short introduction. Oxford University Press; 2007.
Exploring new ways of measuring the economic value of vaccination
180
EBUDGET CONSTRAINT AND VACCINE DOSING: A MATHEMATICAL MODELLING EXERCISE
Cost Eff ectiveness and Resource Allocation 2014, 12:3
ABSTRACT
BackgroundBackground: Increasing the number of vaccine doses may potentially improve overall effi cacy. Decision-makers need information about choosing the most effi cient dose schedule to maximise the total health gain of a population when operating under a constrained budget. The objective of this study is to identify the most effi cient vaccine dosing schedule within a fi xed vaccination budget from a healthcare payer perspective.
Methods: An optimisation model is developed in which maximizing the disease reduction is the functional objective and the constraint is the vaccination budget. The model allows variation in vaccination dosing numbers, in cost diff erence per dose, in vaccine coverage rate, and in vaccine effi cacy. We apply the model using the monovalent rotavirus vaccine as an example.
Results: With a fi xed budget, a 2-dose schedule for vaccination against rotavirus infection with the monovalent vaccine results in a larger reduction in disease episodes than a 3-dose scheme with the same vaccine under most circumstances. A 3-dose schedule would only be better under certain conditions: a cost reduction of >26% per dose, combined with vaccine effi cacy improvement of ≥5% and a target coverage rate of 75%. Substantial interaction is observed between cost reduction per dose, vaccine coverage rate, and increased vaccine effi cacy. Sensitivity analysis shows that the conditions required for a 3-dose strategy to be better than a 2-dose strategy may seldom occur when the budget is fi xed. The model does not consider vaccine herd eff ect, precise timing for additional doses, or the eff ect of natural immunity development.
Conclusions: Under budget constraint, optimisation modelling is a helpful tool for a decision-maker selecting the most effi cient vaccination dosing schedule. The low dosing scheme could be the optimal option to consider under the many scenarios tested. The model can be applied under many diff erent circumstances of changing dosing schemes with single or multiple vaccines.
BACKGROUND The initial dosing schedule of a new vaccine is based on the results obtained in randomised clinical trials which evaluate the effi cacy at the individual level. When real-world data on eff ectiveness become available questions may be raised over whether the initial dosing schedule is the most appropriate one to achieve the maximum benefi t at the population level from limited available healthcare resources. This is an interesting economic question in which the number, timing and effi cacies of vaccine doses should be assessed in detail. In the analysis
Baudouin A Standaert1,,
Desmond Curran1*,
Maarten J Postma2*
1GlaxoSmithKline Vaccines, Wavre, Belgium
2University of Groningen, Groningen, the Netherlands
Chapter 5
181
presented here we evaluate the impact of a change in number of vaccine doses and the economic value of such a change under the constraint of a fi xed vaccine budget, a situation most likely to occur in low-income countries. We have used the monovalent rotavirus vaccine (Rotarix®a) as a concrete example as it has recently been suggested that the number of doses for this vaccine should be increased in low-income countries [1].
Rotavirus infection results in a high burden of acute gastroenteritis disease in children, especially in low-income countries, with approximately 450,000 deaths that could be prevented each year by vaccination [2]. There are currently two vaccines available against rotavirus [3], but all analyses here performed are presented with the 2-dose attenuated single human rotavirus strain monovalent rotavirus vaccine (Rotarix®) [4;5].
In 2009 the World Health Organization recommended the inclusion of rotavirus vaccination in routine immunization programs worldwide [6]. However, trials and observational studies conducted in low-income countries have reported lower vaccine effi cacy than in high-income countries [7-9]. Many hypotheses have been formulated to explain this, but no defi nitive conclusions have been drawn [10;11]. Nevertheless, the morbidity and mortality impact expected in low-income countries greatly surpasses that in high-income countries, despite the lower inferred vaccine effi cacy [12].
To improve the results of vaccination it has been recently suggested that adding one dose to the existing vaccine dosing schedule could improve overall vaccination effi cacy [1]. However this is by no means certain as 3- dose vaccine effi cacy studies with other rotavirus vaccine products tested in low-resource environments have also reported lower effi cacy estimates compared with wealthier settings [13;14]. In low-income countries where healthcare budgets are tight, a 2-dose schedule could be a more effi cient option than a 3-dose schedule as fewer administrations may reduce the overall vaccination cost [15]. Administration may be particularly expensive in those countries, as the costs of the logistics required to maintain a cold chain may be high [16;17]. A 2-dose schedule may also achieve improved compliance and completion of the total dosing at an earlier time point as it obviously requires fewer doses to obtain full vaccination compared with a 3-dose schedule [18].
Given the considerations above, administering an additional dose could improve the rotavirus vaccine effi cacy, but it raises an economic question of whether this would provide acceptable added value. Traditional health economic analysis would calculate the incremental cost-eff ectiveness ratio (ICER) to explore whether the additional dose is cost-eff ective compared with the current 2-dose schedule. If the analysis indicates that the extra budget needed for reaching the extra benefi t is acceptable under the local constraints, it then requires that extra budget is found to secure the implementation of this new intervention. However, in low-income countries there may be no extra budget available to administer the additional vaccine dose even if it would be cost-eff ective. In such environments,

Exploring new ways of measuring the economic value of vaccination
182
the addition of an extra vaccine dose may be possible only at the expense of cuts elsewhere in the fi xed budget. Conversely, it may be possible to improve the clinical results by increasing the vaccine coverage rate without adding an extra dose. Therefore, it may be more appropriate to consider a diff erent economic approach and to compare the clinical outcomes obtained with a 2-dose schedule with a higher vaccine coverage rate versus the clinical outcomes obtained with a 3-dose schedule at a higher vaccine effi cacy but a lower coverage rate. In other words, given a fi xed budget, when would it be effi cient to move to a 3-dose strategy? The solution to this question is no longer driven by a cost-eff ectiveness threshold but by the fi xed budget: what is the best way to spend money under a fi xed budget in order to obtain a maximum health benefi t? This type of question can best be analysed at the population level (accumulated benefi t and cost), in contrast to cost-eff ectiveness analysis that can be assessed at the individual level. It also seems to be a realistic way for local decision-makers to evaluate the benefi t of vaccination strategies [19].
In this paper we evaluate the potential cost and health eff ect of adding a third dose to the existing 2-dose schedule of the monovalent rotavirus vaccine in low-income countries, using a hypothetical model to explore this. The model uses optimisation theory, in which a wide range of scenarios are explored to fi nd the optimum solution under budget constraint. In sensitivity analysis, we investigate the infl uence of several variables on the results, including vaccine effi cacy, coverage rate, and price per dose.
METHODSThe economic question raised in the introduction, “what is the best way to spend a fi xed budget to obtain the maximum health benefi t from vaccination?” can best be explored using optimisation or mathematical programming models [20]. The exercise is to reach specifi c (functional) objectives or goals under certain constraints. In this setting, the objective function is to maximise health benefi ts. The model has been programmed to evaluate just one particular disease with one intervention type, but diff erent diseases with diff erent interventions assessing a same outcome could be considered as well.
In the particular case of rotavirus disease, the outcome measure, used to assess the benefi t, is the total number of diarrhoea events in the population of children aged <5 years, and the objective is to minimise the number of such events. As a direct consequence of this, mortality and hospitalisation rates due to rotavirus disease would also be reduced. We conducted a cross-sectional analysis with an annual budget, estimating events per year in the at-risk population at steady-state. The latter typically refl ects the situation when disease spread and vaccine effi cacy have reached their equilibrium across the entire at-risk population. The model constraints are:
• Annual vaccination budget is fi xed;• Vaccine effi cacy for a 3-dose strategy ≥ than that for a 2-dose strategy;• Vaccine effi cacy for a 3-dose strategy < 150% of that for a 2-dose strategy;

Chapter 5
183
• Cost per dose for a 3-dose strategy < than that for a 2-dose strategy;
The model assumes a fi xed cost per dose for the administration and for the logistics to maintain the cold chain. The coverage rate allows a variation between 0% and 100%. No discounting is applied as it concerns a budget analysis.
The model construct is developed in Microsoft Excel, using additional Solver tools (Frontline Systems, Inc.) from software specifi cally designed to be integrated as an add-in into Microsoft Excel. The results of the optimisation model indicate which strategy (i.e. a 2- or 3-dose strategy) would produce maximum health benefi ts under a budget constraint. The analysis is conducted from the perspective of the healthcare payer system. A copy of the model is available as a Microsoft Excelspread sheet (see Additional-File-1.xls).
As the current exercise is hypothetical we do not apply it to a specifi c country. The whole analysis is focussed on the relationships between the critical variables and their relative values.
Sensitivity analysis is conducted by varying three key parameters that aff ect the results, vaccine effi cacy, price, and coverage. The relationships between the variables are as follows: the number of overall diarrhoea events avoided by a 2-dose schedule (y) is a function of the vaccine coverage rate (a), the vaccine effi cacy (x) obtained, and the disease population incidence rate (i):
y = a * x * i
The increment (c) to reach the objective function (maximising the reduction in diarrhoea events) with a 3-dose schedule is a function of the change in the vaccine coverage rate (a
1) and the extra vaccine effi cacy (x
1) obtained, compared with a
2-dose schedule, while the population incidence rate remains unchanged:
y + c = [(a + a1) * (x + x
1)] * i
The change in coverage rate (a1) was assumed dependent on the relative price
diff erence per dose between a 2- and a 3-dose vaccine schedule, given a fi xed budget for vaccination. There will automatically be a link with the reduction in vaccine coverage rate, if the price diff erence per dose and per vaccine scheme decreases, as an increase in the vaccine effi cacy (x
1) is then required for the 3-dose
schedule to keep its advantage over the 2-dose schedule.
Sensitivity analysis should demonstrate what price diff erence, what vaccine coverage rate, or what vaccine effi cacy diff erence would be required to achieve a change in the preference between the two dosing schedules. In addition, the change in health outcomes will aff ect the overall management cost of the disease. Changes in vaccine coverage rate and/or vaccine effi cacy would be expected to aff ect the cost drivers for overall disease management costs, such as hospitalisation rate. To address this, we add an evaluation of the budget change for overall disease
Exploring new ways of measuring the economic value of vaccination
184
management as a relative value to the fi xed budget for vaccination as an additional output variable in the sensitivity analysis.
RESULTS
Analysis with fi xed dataAnalysis with fi xed dataTables 1 and 2 provide an example to illustrate the model. Table 1 shows the input data and Table 2 the modelled outputs. This hypothetical example assumed an annual birth cohort of 10,000 children who could be vaccinated. Based on the assessment of disease burden and the fi nancial priorities, the health ministry is assumed to have allocated an annual budget of $200,000 for rotavirus vaccination. The annual incidence rate of rotavirus diarrhoea without vaccination was set at 0.3 per child per year for the at-risk period (from birth up to age 5 years) of the birth cohort, thus an average of 3,000 children per year would be expected to develop diarrhoea without vaccination.
Table 1 Input variables
Parameter ValueTotal vaccination budget $200,000Cost/dose for 2-dose vaccine schedule (strategy A) $13.00Cost/dose for 3-dose vaccine schedule (strategy B) $10.00Diarrhoea incidence rate per child per year 0.30Vaccine effi cacy for 2-dose vaccine schedule (strategy A) 0.60Vaccine effi cacy for 3-dose vaccine schedule (strategy B) 0.65Number of vaccine doses for strategy A 2Number of vaccine doses for strategy B 3Population 10,000Target vaccine coverage rate 75%Average treatment cost per diarrhoea event $50.00
Under strategy A (na=2) the cost per dose was set to $13, and thus the cost per
course of vaccination was $26 (=$13*2). With a target coverage rate of 75%, the cost of vaccination was estimated at $195,000 (=10,000*0.75*$26) which represents 97.5% of the total available vaccination budget. As such, there would be suffi cient budget (i.e. the budget would not be exceeded) and the target coverage rate would be reached. Assuming a vaccine effi cacy of 60%, 900 of the 7,500 children in the vaccinated part of the cohort would be expected to develop diarrhoea, in addition to 750 of the 2,500 children in the unvaccinated part of the cohort, yielding a total of 1,650 diarrhoea cases. Thus, the health benefi t gained by vaccination with a 2-dose schedule would be a reduction of 1,350 diarrhoea cases (a reduction of 45%) for the full birth cohort, compared with no vaccination (Table 2).
Under strategy B (nb
=3), the cost per dose was set to $10 and thus the cost per course of vaccination was $30 (=$10*3). With the same target coverage rate of 75%, the total cost of vaccination would be $225,000 (=10,000*0.75*$30), representing 112.5% of the vaccination budget. Thus, there would be insuffi cient budget (a shortfall of $25,000). This shortfall implies that the budget would have

Chapter 5
185
run out with 833 children among the targeted population still to be vaccinated ($25,000/$30 = 833), and thus the available budget would be suffi cient to vaccinate 6,667 children. Assuming a vaccine effi cacy for the 3-dose schedule of 65%, 700 of the 6,667 children in the vaccinated part of the cohort would still develop diarrhoea, in addition to 1,000 of the 3,333 children in the unvaccinated part of the cohort, yielding a total of 1,700 diarrhoea cases. Thus, the health benefi t gained by vaccination using a 3-dose schedule would be a reduction of 1,300 diarrhoea cases (a reduction of 43.3%), compared with no vaccination (Table 2).
Comparing the two strategies, although the cost per dose was 23% lower with a 3-dose schedule (strategy B), the cost per course was higher ($30 vs $26). The 2-dose schedule (strategy A) was not only cheaper overall ($195,000 vs. $200,000), but also resulted in a greater reduction in diarrhoea events (45% vs 43.3%), despite having a lower vaccine effi cacy than the 3-dose schedule. This is because the lower cost per course with the 2-dose schedule would allow more children to be vaccinated within the available allocated budget.
Sensitivity analysisSensitivity analysisFigures 1, 2, and 3 show the results of sensitivity analyses for a wide range of values tested.
Figure 1 presents the relationship between price per dose and the reduction in diarrhoea events and the total cost of vaccination under the assumptions listed
Table 2 Modelled outputs Using the input variables shown in Table 1
Output variable 2- dose schedule (strategy A) 3- dose schedule (strategy B)Value % Value %
Number of diarrhoea events expected with no vaccination
3000 3000
Vaccine cost $195,000 $225,000Vaccine cost as % of available vaccination budget 97.5% 112.5%Budget shortfall 0 $25,000Number of people in target population not covered because of insuffi cient budgetbecause of insuffi cient budget
0 833
Vaccine effi cacy diff erence 5 %Vaccine cost diff erence 23.1%Number of people covered by current budget 7500 6667Number of diarrhoea events in vaccinated children 900 700Number of diarrhoea events in non-vaccinated children
750 1000
Total number of diarrhoea events with vaccination 1650 1700Treatment Cost $82,500 $85,000Gain (reduction in diarrhoea events compared with no vaccination)
1350 45.0% 1300 43.3%
Total cost $277,500 $285,000
Additional fi lesAdditional fi le 1 – Additional-File-1.xlsA copy of the model used for the analysis in this manuscript with the original input values, as a Microso� Excel workbook. Excel workbook. Excel

Exploring new ways of measuring the economic value of vaccination
186
Figure 1 Eff ect of the diff erence in vaccine cost per dose on budget and eff ect
Reduction in diarrhoea events (le� Y-axis) and relative change of vaccine budget constraint (=100%) (right Y-axis) as a function of the relative cost diff erence per vaccine dose. Assumptions: vaccine budget, $200,000; 2-dose vaccine effi cacy (strategy A), 60%; 3- dose vaccine effi cacy (strategy B), 65%; target vaccine coverage, 75%; 2-dose vaccine cost per dose (strategy A), $13.00; 3- dose vaccine cost per dose (strategy B), allowed to vary.
Figure 2 Eff ect of vaccine effi cacy on total cost and eff ect
Total cost (right Y-axis) and eff ect (reduction in diarrhoea events, le� Y-axis) as a function of vaccine effi cacy. Assumptions: vaccine budget, $195,000; 2-dose vaccine effi cacy (strategy A), 75%; 3-dose vaccine effi cacy (strategy B), allowed to vary; target vaccine coverage, 75%; 2-dose vaccine cost per dose (strategy A), $13.00; 3-dose vaccine cost per dose (strategy B), $10.00
Chapter 5
187
in the legend. Consistent with the illustrative example shown in Table 2, with a 2-dose schedule a 45% reduction in diarrhoea events would be observed at a cost of 97.5% of the vaccination budget. Allowing the cost per dose for strategy B to vary, the fi gure illustrates that a large cost diff erence per dose of >33.3% would be required before the 3-dose schedule would become less costly; this occurs at the point at which the dash dotted line (– . –) crosses the dashed line (– –). A high cost diff erence per dose (>25.9% cheaper) would also be required for the 3-dose schedule to achieve a larger reduction in diarrhoea events than the 2-dose schedule; this occurs when the dotted line (…) crosses the solid line. Thus, a 2-dose vaccine schedule would always be the better choice when the relative cost diff erence does not exceed 25.9%.
There is a small area between a cost diff erence per dose of 25.9% and 33.3% where a larger reduction in diarrhoea events would be observed at a total vaccination cost within the fi xed budget using the 3-dose strategy, while still remaining at the vaccine coverage rate of 75%. This area varies depending on other factors such as the vaccine effi cacy diff erence. In situations where the 3-dose vaccine is cheaper, no additional reduction in diarrhoea events would be observed above the targeted vaccine coverage rate of 75%.
Figure 2 shows the eff ect of adding a treatment cost for a diarrhoea event, set at $50 per event, to estimate an overall cost for disease management (vaccination plus the cost of treating cases) with a vaccination cost of $195,000. For example, in Table 2, 1,650 cases of diarrhoea would be expected to occur with the 2-dose schedule, and the cost of treating these cases would be $82,500 (=1,650*$50). The total cost of the 2-dose strategy A would therefore be $277,500 (vaccine cost of $195,000 + cost of treating cases of $82,500). This value is 42.3% higher than the vaccination budget. Thus, under strategy A, assuming a vaccine effi cacy of 60% a 45% reduction in diarrhoea events (solid line) could be achieved at a total disease management cost of 42.3% (dashed line) over the vaccination budget. Assuming a vaccine effi cacy of 90%, a 67.5% reduction in diarrhoea events (solid line) could be achieved at a total disease management cost of 25% (dashed line) over the vaccination budget.
In Figure 2, it may appear counter-intuitive that a higher vaccine effi cacy is needed with a 3-dose strategy versus a 2-dose vaccination strategy to obtain the same overall result. This refl ects the higher vaccine coverage rate that can be achieved with a 2- dose vaccine strategy under budget constraint. In addition, the total budget would always be lower with a 2-dose schedule than with a 3-dose schedule when the diff erence in price per dose is lower than 33.3% (as shown in Figure 1 and discussed above).
Figure 3 demonstrates the eff ect of target coverage rate on the budget increment and the avoided diarrhoea events. On the left-hand side of the graph, where the target coverage rate is low, there would be suffi cient budget for both strategies. Thus, the 3-dose strategy would prevent more cases (due to its higher effi cacy) but at a higher cost. The cost for the 3- dose strategy (dash-dotted line) would exceed that for the 2-dose strategy (dashed line) at all coverage rates modelled. However, as coverage increases the number of events prevented by the 2-dose strategy (solid line) would

Exploring new ways of measuring the economic value of vaccination
188
overtake the number of events prevented by the 3-dose strategy (dotted line). This is because the maximum coverage rate achievable within the fi xed budget would be higher for the 2-dose schedule (75%) than for the 3-dose schedule (66.7%). Thus, on the right-hand side of the graph where target coverage is high, the 2-dose schedule would prevent more cases than the 3-dose schedule at a lower cost.
DISCUSSION The results of the modelling exercise presented here indicate that when the vaccination budget is constrained a 2-dose schedule for vaccination against rotavirus infection with the monovalent rotavirus vaccine would be expected to produce a larger reduction in disease events than a 3-dose schedule in most circumstances when using the same vaccine. This refl ects the higher coverage rate that can be achieved with a 2-dose schedule than with a 3-dose schedule within a fi xed budget. According to the model the 3-dose schedule would produce results superior to the 2-dose schedule only under the following conditions: large improvement in vaccine effi cacy for the 3- dose schedule compared with the 2-dose schedule; large reduction in cost per dose for the 3-dose schedule compared with the 2-dose schedule; low target vaccine coverage rate. The eff ects of these parameters are closely intertwined. So a situation in which the 3-dose strategy would become superior to the 2-dose strategy may be achieved by a large change in one parameter alone, or by smaller changes in several parameters in combination. We will discuss each parameter separately.
A study in Africa reported vaccine effi cacy against severe rotavirus gastroenteritis of 63.7% for a 3-dose schedule and 58.7% for a 2-dose schedule [21], a diff erence
Figure 3 Eff ect of target vaccine coverage rate on total cost and eff ect
Total cost (right Y-axis) and eff ect (reduction in diarrhoea events, le� Y-axis) as a function of target vaccine coverage rate. Assumptions: vaccine budget, $200,000; 2-dose vaccine effi cacy (strategy A), 60%; 3-dose vaccine effi cacy (strategy B), 65%; 2-dose vaccine cost per dose (strategy A), $13.00; 3-dose vaccine cost per dose (strategy B), $10.00; target vaccine coverage, allowed to vary.

Chapter 5
189
of 5 percentage points. However, it remains uncertain whether adding an extra dose truly improves the overall vaccine effi cacy, as 3-dose vaccine effi cacy studies using other vaccine products / candidates in low-resource environments have also reported lower effi cacy estimates than in wealthier settings [13;14]. The diff erence in vaccine effi cacy in our model was similar to the diff erence observed in the African study (65% versus 60%). Our results indicated that this magnitude of improvement in effi cacy with the 3-dose strategy would result in an overall health gain (fewer diarrhoea events) compared with the 2-dose schedule only with a cost per dose for the 3-dose schedule of at least 25.9% lower than the cost per dose for the 2-dose schedule. The exact value will vary depending on the absolute vaccine effi cacy values used, the budget available and the vaccine coverage rate, and thus will vary according to local circumstances. The smaller the gain in vaccine effi cacy, the larger the cost diff erence per dose required.
Vaccine prices are often negotiated according to the total number of doses ordered by a country. An order for 60,000 doses intended to implement a 3-dose strategy covering 20,000 people may vary relatively little in price compared with an order also for 60,000 doses intended to implement a 2-dose strategy covering 30,000 people. Use of a budget optimisation tool may help decision-makers to identify the optimal strategy in their local environment, taking into account any changes in price as well as the expected change in vaccine effi cacy and coverage.
The results presented here suggest that a 2-dose schedule is likely to be the optimal strategy, due to a higher vaccine coverage rate that the given budget allows. However, the vaccination budget is not the only factor infl uencing coverage rates. Other factors may include education, religious beliefs, attitudes to complementary and alternative medicine, gender-based inequity, civil unrest, the percentage of the population living in urban versus rural areas, accessibility of vaccination and other healthcare programmes, and fi nancial factors [22-25]. Such issues are not insurmountable and high vaccine coverage rates can be achieved in low-income countries, as illustrated by high 3-dose diphtheria-tetanus-pertussis coverage rates in Kenya, Bangladesh and Sri Lanka [26]. Other interventions beyond the vaccination programme may be needed to improve the coverage rate, such as health education, better transportation, reduction in communication barriers to vaccinations, outreach to religious leaders and fi nancial incentives.
Many studies have investigated the problem of optimal vaccine dosing schedules. Some have addressed the question from the opposite direction, evaluating whether a smaller number of doses can achieve the same clinical outcomes. For example, a 2-dose-plus-booster schedule for pneumococcal vaccination is accepted as having similar effi cacy to a 3-dose-plus-booster schedule [27]. In the present analysis, as the eff ectiveness of the 2-dose rotavirus vaccine appears to be reduced in low-income countries the relevant question is whether adding one dose could improve clinical results. The strength of the model presented here is that it explicitly recognises the reality of a fi xed budget. Adding an extra dose requires increasing the number of doses per vaccinee. Under a fi xed budget this either requires an equivalent reduction in price to cover the same number

Exploring new ways of measuring the economic value of vaccination
190
of people or a corresponding reduction in coverage, or a combination of the two. An optimisation model can explore the question of whether increasing vaccine effi cacy by adding an extra dose, or increasing coverage by using a 2-dose schedule, would be the best strategy to maximise the population health gains. It can also quantify the extra budget that would be required to achieve a larger health gain, providing a transparent method of assessing the best strategy for managing disease burden.
The model presented here could be applied to any question about the optimal dose schedule for any vaccine. For instance, the potential switch from a 2-dose to a 1-dose schedule for hepatitis A in Latin America is an important decision that requires careful choice of the optimal administration schedule [28]. The modelling exercise outlined here could provide useful guidance on this question that may be helpful for decision-makers. Additional refi nements may be needed, as the present analysis did not use a dynamic model and did not consider the potential eff ect of an additional vaccine dose on herd protection, or diff erential waning rates for a 1-dose versus a 2-dose vaccine.
The model is simple in its construction and therefore has some limitations. For example, it does not take account of herd eff ects which may be important when considering the impact of changes in coverage. The higher coverage achievable with a 2-dose schedule compared with a 3-dose schedule within a fi xed budget may lead to greater herd protection and thus to a larger diff erence in health benefi t than estimated in the present model. Furthermore, the model does not cover changes in the timing of doses, eff ects of disease spread before the fi nal dose, or natural immunity. In the case of rotavirus infection, natural immunity that develops with repeated infections is a competitor to vaccine-induced immunity, leading to a progressive reduction in the scope for vaccination to provide protection over time [29]. The model also does not take account of factors such as logistics and access to healthcare facilities to administer the additional dose[16]. However, in case of working under a fi xed budget and increasing the number of doses per person, extra administration cost could be limited as a same person who already received vaccine doses will get an additional one. Things could be dramatically diff erent with the reduction of the number of doses per person. The extra administration cost could then be much higher than in the previous situation because one has to reach additional people (increase the coverage rate) with the extra doses available.
Finally, we opted for a limited perspective in the analysis, namely the health care payer. We thought that essentially these people are most interested in the results when operating under a fi xed budget. The societal perspective would only indicate that if a lower vaccine coverage rate was achieved with a 3-dose program, the societal cost could increase.
The optimisation approach here presented is very diff erent from cost-eff ectiveness analysis. Cost-eff ectiveness analysis estimates the incremental cost per unit of incremental benefi t to calculate an ICER value, and compares it with a threshold value considered to represent acceptable cost-eff ectiveness. However, to be meaningful
Chapter 5
191
this threshold must be locally defi ned, taking account of local circumstances. If the threshold is uncertain, the estimated ICER for an intervention may be of limited value in making a decision. Even if the threshold value is accepted, the ICER may not take account of infrastructure expansions required to implement an intervention. For example, a vaccination programme requiring a large increase in cold-chain capacity could be challenging for low-income countries, which in turn could result in a delay to vaccine introduction with consequences for expected health outcomes. Furthermore, an intervention requiring a substantial increase in expenditure – as may be likely with mass population interventions such as vaccination – may exceed the budget available, in which case it may be impractical to implement no matter how favourable the ICER.
The biggest diff erence between a cost-eff ectiveness analysis and an optimisation modelling is that in the latter it can take into account the coverage rate as an important variable to reach a certain health goal. In a cost-eff ectiveness analysis with a static model the vaccine coverage rate may not infl uence the ICER per se. This is diff erent for a budget impact analysis where the vaccine uptake expressed through the coverage rate will impact the budget cycles. However budget impact analysis only informs about the fi nancial spread over time and is not particularly linked to the goal or objective to be achieved within a defi ned period as optimisation modelling is pursuing.
Optimisation modelling, as presented in the exercise here, is clearer and simpler to understand [19]. Instead of a threshold value, it identifi es the strategy that off ers the largest health gain (in the case of a preventive intervention, the lowest number of disease events) within a fi xed budget. This more closely refl ects the reality of healthcare decisions. The number of available healthcare interventions continually increases, yet national healthcare budgets are not unlimited. It can be applied to simple problems such as the comparison between a 2-dose and 3-dose schedule for rotavirus vaccination illustrated here, or more complex issues such as human papillomavirus vaccination [20]. We may even consider the assessment of diff erent vaccines against diff erent diseases in order to prioritize their indication within a clear budget and time frame such as a multi-year vaccine portfolio management program[30].
Further research will be valuable to refi ne the simple model described here to take account of more complex issues such as herd protection eff ects or multi-criteria decision analysis designs.
CONCLUSION Optimisation modelling indicates that within a fi xed budget and for the monovalent rotavirus vaccine, a 2-dose vaccine schedule would be expected to provide better health outcomes in most circumstances than a 3-dose schedule. The model can be used to quantify the conditions of changing dose schedules that would be optimal for any vaccine. It is a more transparent and powerful technique than the more conventional cost-eff ectiveness analysis for evaluation of the economic questions faced by decision-makers, because it explicitly recognises the budget constraint that is a reality in most healthcare systems around the world.
Exploring new ways of measuring the economic value of vaccination
192
REFERENCES[1] Tate JE, Patel MM, Cortese MM, Lopman BA, Gentsch JR, Fleming J, et al.
Remaining issues and challenges for rotavirus vaccine in preventing global childhood diarrheal morbidity and mortality. Expert Rev Vaccines 2012 Feb;11(2):211-20.
[2] Munos MK, Walker CL, Black RE. The eff ect of rotavirus vaccine on diarrhoea mortality. Int J Epidemiol 2010 Apr;39 Suppl 1:i56-i62.
[3] Cherian T, Wang S, Mantel C. Rotavirus vaccines in developing countries: the potential impact, implementation challenges, and remaining questions. Vaccine 2012 Apr 27;30 Suppl 1:A3-A6.
[4] O’Ryan M, Lucero Y, Linhares AC. Rotarix(R): vaccine performance 6 years postlicensure. Expert Rev Vaccines 2011 Dec;10(12):1645-59.
[5] Vesikari T. Rotavirus vaccination: a concise review. Clin Microbiol Infect 2012 Oct;18 Suppl 5:57-63.
[6] World Health Organization. Meeting of the immunization Strategic Advisory Group of Experts, April 2009--conclusions and recommendations. Wkly Epidemiol Rec 2009 Jun 5;84(23):220-36.
[7] Armah GE, Breiman RF, Tapia MD, Dallas MJ, Neuzil KM, Binka FN, et al. Immunogenicity of the pentavalent rotavirus vaccine in African infants. Vaccine 2012 Apr 27;30 Suppl 1:A86-A93.
[8] Cunliff e NA, Witte D, Ngwira BM, Todd S, Bostock NJ, Turner AM, et al. Effi cacy of human rotavirus vaccine against severe gastroenteritis in Malawian children in the fi rst two years of life: a randomized, double-blind, placebo controlled trial. Vaccine 2012 Apr 27;30 Suppl 1:A36-A43.
[9] Steele AD, Neuzil KM, Cunliff e NA, Madhi SA, Bos P, Ngwira B, et al. Human rotavirus vaccine Rotarix provides protection against diverse circulating rotavirus strains in African infants: a randomized controlled trial. BMC Infect Dis 2012;12:213.
[10] Lopman BA, Pitzer VE, Sarkar R, Gladstone B, Patel M, Glasser J, et al. Understanding reduced rotavirus vaccine effi cacy in low socio-economic settings. PLoS One 2012;7(8):e41720.
[11] Lopman BA, Payne DC, Tate JE, Patel MM, Cortese MM, Parashar UD. Post-licensure experience with rotavirus vaccination in high and middle income countries; 2006 to 2011. Curr Opin Virol 2012 Aug;2(4):434-42.
[12] Santosham M. Rotavirus vaccine--a powerful tool to combat deaths from diarrhea. N Engl J Med 2010 Jan 28;362(4):358-60.
[13] Defeat DD. Rotavirus Vaccine Developed in India Demonstrates Strong Effi cacy. http://www.defeatdd.org/node/1107http://www.defeatdd.org/node/1107 2013 [cited 2013 Jun 27]
[14] Zaman K, Dang DA, Victor JC, Shin S, Yunus M, Dallas MJ, et al. Effi cacy of pentavalent rotavirus vaccine against severe rotavirus gastroenteritis in infants in developing countries in Asia: a randomised, double-blind, placebo-controlled trial. Lancet 2010 Aug 21;376(9741):615-23.
[15] Madhi SA, Kirsten M, Louw C, Bos P, Aspinall S, Bouckenooghe A, et al. Effi cacy and immunogenicity of two or three dose rotavirus-vaccine regimen in South African children over two consecutive rotavirus-seasons: a randomized, double-blind, placebo-controlled trial. Vaccine 2012 Apr 27;30 Suppl 1:A44-A51.

Chapter 5
193
[16] Lee BY, Assi TM, Rookkapan K, Wateska AR, Rajgopal J, Sornsrivichai V, et al. Maintaining vaccine delivery following the introduction of the rotavirus and pneumococcal vaccines in Thailand. PLoS One 2011;6(9):e24673.
[17] Lee BY, Cakouros BE, Assi TM, Connor DL, Welling J, Kone S, et al. The impact of making vaccines thermostable in Niger’s vaccine supply chain. Vaccine 2012 Aug 17;30(38):5637-43.
[18] Krishnarajah G, Davis EJ, Fan Y, Standaert BA, Buikema AR. Rotavirus vaccine series completion and adherence to vaccination schedules among infants in managed care in the United States. Vaccine 2012 May 21;30(24):3717-22.
[19] Earnshaw SR, Dennett SL. Integer/linear mathematical programming models: a tool for allocating healthcare resources. Pharmacoeconomics 2003;21(12):839-51.
[20] Demarteau N, Breuer T, Standaert B. Selecting a mix of prevention strategies against cervical cancer for maximum effi ciency with an optimization program. Pharmacoeconomics 2012 Apr;30(4):337-53.
[21] Madhi SA, Cunliff e NA, Steele D, Witte D, Kirsten M, Louw C, et al. Eff ect of human rotavirus vaccine on severe diarrhea in African infants. N Engl J Med 2010 Jan 28;362(4):289-98.
[22] Ciblak MA. Infl uenza vaccination in Turkey: prevalence of risk groups, current vaccination status, factors infl uencing vaccine uptake and steps taken to increase vaccination rate. Vaccine 2013 Jan 7;31(3):518-23.
[23] De Wals P, Petit G, Erickson LJ, Guay M, Tam T, Law B, et al. Benefi ts and costs of immunization of children with pneumococcal conjugate vaccine in Canada. Vaccine 2003 Sep 8;21(25-26):3757-64.
[24] Laval B, Fascia P, Gocko X, Feuillet J, Lucht F. Determinants of vaccination coverage for children and teenagers. Med Mal Infect 2011 Jul;41(7):359-63.
[25] Owino LO, Irimu G, Olenja J, Meme JS. Factors infl uencing immunisation coverage in Mathare Valley, Nairobi. East Afr Med J 2009 Jul;86(7):323-9.
[26] World Health Organization. Global Health Observatory Data Repository. http://apps.who.int/gho/data/node.countryhttp://apps.who.int/gho/data/node.country 2013
[27] Robberstad B, Frostad CR, Akselsen PE, Kvaerner KJ, Berstad AK. Economic evaluation of second generation pneumococcal conjugate vaccines in Norway. Vaccine 2011 Nov 3;29(47):8564-74.
[28] Gentile A. The need for an evidence-based decision-making process with regard to control of hepatitis A. J Viral Hepat 2008 Oct;15 Suppl 2:16-21.
[29] Standaert B, Gomez JA, Raes M, Debrus S, Velazquez FR, Postma MJ. Impact of rotavirus vaccination on hospitalisations in Belgium: comparing model predictions with observed data. PLoS One 2013;8(1):e53864.
[30] Topachevskyi O, Standaert B, Van Bellinghen LA, Van Vlaenderen I. Can a Multi-Criteria Decision (MCD) Optimisation Model Help Decision Makers in the Optimal Selection of Vaccines When Expanding Their Universal Mass Vaccination Programme? The Case of Poland. Value Health 2013 Nov 1;16(7):A615.

Exploring new ways of measuring the economic value of vaccination
194
THE IMPACT OF ROTAVIRUS VACCINATION IN EGYPT ON LONG-TERM GOVERNMENT EXPENDITURE: A LIFETIME NET TAX ASSESSMENT
Pharmacoeconomics 2012; 30 (8): 681-695
ABSTRACT
BackgroundBackground: We evaluate national rotavirus (RV) immunization program costs to estimate how resulting changes in morbidity and mortality will infl uence government fi scal accounts over time. The assumption being that increased childhood survival in vaccinated cohorts leads to increased numbers of children consuming government resource, and an increased number of future tax payers.
Methods: The model framework adopts the Egyptian government perspective for RV immunization costs and all government transfers (eg: education costs, health costs, pensions). To refl ect the government tax revenue we applied a fi xed income tax burden to earnings over the lifetime of vaccinated and unvaccinated cohorts. At each year of the model we derive net taxes (gross taxes less transfers) discounted to the immunization year to refl ect the present value of investment costs.
Results: Lifetime discounted cash fl ows for RV vaccinated and unvaccinated birth cohorts are LE 62,666 million and LE 62,627 million, respectively, at year-25. At year-50 net tax revenues were LE 274,149 million and LE 273,765 million for vaccinated and unvaccinated cohorts, respectively. The internal rate of return for government based on RV vaccination at year-25 and year-50 was 10.6% and 14.9%, respectively. Within the fi rst fi ve years of vaccination small health service cost-savings were achieved attributed to reduced RV-related gastroenteritis cases.
Conclusions: The government perspective is useful for evaluating investments in RV vaccination because of ongoing government transfers and tax receipts attributed to changes in RV attributed morbidity and mortality. Using this approach we illustrate both short-term cost advantages, and long-term economic advantages attributed to RV vaccination.
BACKGROUNDInvestments in health have shown to be one of the most important human capital determinants that infl uence economic growth and development, of which vaccines likely play a signifi cant role [1-3]. Previous analyses have estimated an internal rate of return from investments in vaccination programs ranging between 12% and 18% [1;2]. Investments in vaccination not only save lives, reduce suff ering, and contribute to economic growth, but they also lead to direct savings in healthcare costs worth millions of dollars every year [3]. Recognizing the important public health benefi ts and economic advantages of vaccination
Mark Connolly1, 2,
Oleksandr Topachevskyi3Oleksandr Topachevskyi3Oleksandr Topachevskyi ,
Baudouin Standaert3,
Omayra Ortega4,
Maarten Postma1
1University of Groningen, Groningen, The Netherlands;
2Global Market Access Solutions, St-Prex,
Switzerland;3GlaxoSmithKline Biologicals,
Belgium;4Arizona State University,
Phoenix, USA

Chapter 5
195
programs, the WHO has included vaccines against communicable diseases in the list of essential medicines [4].
The economic benefi ciaries of improved health are worth considering in the context of health investments. In most cases the individuals themselves and society as a whole will benefi t from improved health. This is attributed to several factors including wage increases, and indirectly through improved educational opportunities infl uencing future earnings [1;2;5]. Additionally, governments can also be infl uenced by population health, whereby poor health has the capacity to increase government expenditure in health care and social programs as well as reduce tax-receipts from fewer individuals working [6].Conversely, the same would be true as economies expand because of improved population health, all things equals, governments will receive more tax revenue [7]. The above observations suggest that it may be in the interest of governments to think carefully about healthcare expenditure to optimise economic growth and sustaining public fi nances [8].
Vaccination programs can positively infl uence macroeconomic and microeconomic parameters. Meanwhile the analytical framework commonly used to value health technologies including vaccines mostly ignores the relationship between health investment, human capital, and the economy overall [9;10] Rather emphasis is placed on cost-eff ectiveness analysis where outcomes are expressed using quality- adjusted life years (QALYs) that have a questionable, tangible economic value. A recent review has summarised the weakness of the frameworks normally used for valuing vaccines citing outcome-related productivity gains, behaviour-related productivity gains, and community externalities are often unaccounted for in the evaluations of immunization programs [11] This is particularly relevant to economic studies of rotavirus (RV) where indirect costs can represent 25–80% of total RV costs [12].
In the developed and developing world RV poses a signifi cant humanistic and economic burden, however they are diff erent. There are more health care costs and fewer deaths in the developed world. But the annual deaths in children ≤5 years of age worldwide caused by RV infection are estimated to be 352,000–592,000 per year, with signifi cant economic consequences [13;14] Considering the high mortality and resources used to treat RV gastroenteritis, it is likely that changes in RV attributed gastroenteritis epidemiology will have signifi cant economic consequences. In this study we explore new investment in RV prevention strategies considering two perspectives: (1) societal and (2) governmental. The underlying premise of the governmental perspective is that changes in RV related morbidity and mortality will increase the number of children utilising government resources, as well as increased numbers of working adults, and future tax payers.
Investments in vaccines off er both short and long term economic benefi ts. Furthermore, the benefi ts will accrue to diff erent elements of society depending on the time period considered. For example, in the short-term, families and the health service are likely to benefi t from reduced RV attributed gastroenteritis.
Exploring new ways of measuring the economic value of vaccination
196
However, over time, the government more broadly can benefi t from increased survival, increased working-aged populations increasing numbers of tax payers. To refl ect how the economic perspective changes over time we construct a model that considers both the governmental perspective, and the societal perspective based on RV vaccine investments. The analysis described here is a continuation of a previously reported economic analysis that evaluated healthcare costs in Egypt attributed to RV vaccination from the health service perspective [15]
MATERIALS AND METHODSRV vaccination has been shown to saves lives; therefore we sought to estimate how lives saved can infl uence future government expenditure on social programs such as health, education, and pension costs, as well as infl uencing future tax receipts. This is referred to as the “government perspective” analysis and requires constructing a model that refl ects the life course of average Egyptian citizens taking into consideration average schooling, employment, marriage, wages, pension costs, etc. The model was also constructed to refl ect the societal perspective.
To refl ect the government and societal perspectives we combine three modelling approaches. Namely, budget impact analysis of RV health costs, human capital modelling based on lives saved and lost productivity, and generational accounting which accounts for a range of other government fi scal transfers to citizens such as education, non-RV health costs and pension costs [16-18] The integrated modelling framework allows us to consider ongoing costs that arise from saving lives attributed RV vaccination, as well as the future tax-receipts attributed to children that would have died in the absence of vaccination. Within this framework, lives saved from the government perspective are not only a cost, but also a future revenue source.
Model designModel designThe model considers hypothetical RV vaccinated and unvaccinated birth cohorts [19]. For each cohort, the costs and consequences associated with diff erences in RV related gastroenteritis were estimated. Considering the high RV mortality in Egypt for children <5 this approach was deemed appropriate for comparing RV investment costs that infl uence birth cohorts.[14]. Furthermore, the approach allows for comparing the average life course of children receiving RV vaccination with the life course of cohorts without vaccination to evaluate RV investment costs versus no vaccination. Annual adjustments to the birth cohort for RV specifi c deaths between ages 0–5 year are made based on local epidemiology, and non-RV related deaths from ages 0–100 based on existing life table data [20].
In contrast to most budget impact models that typically complete the analysis fi ve years post-vaccination [21], we attempted to account for ongoing government transfers attributed to vaccinated and unvaccinated cohorts by extending the analysis for 72 years, the average lifetime of an Egyptian citizen. This is particularly relevant considering the survival benefi ts attributed to RV vaccination. From the surviving vaccinated and unvaccinated cohort we estimated government transfers

Chapter 5
197
for education and health expenditure up until the average age of starting work in Egypt at age 15. Throughout the lifetime, per capita expenditure on education and health is used to estimate the economic impact of vaccinated and unvaccinated cohorts on government accounts.
Rotavirus epidemiology Rotavirus epidemiology We calculated incidence rates for children 0–3 years old based on data collected in 4 areas; Abu Homos, Benha, Cairo, and Fayoum, which represent a mix of rural, urban, and sub-urban settings and reported previously [22]. The peak incidence of infection occurs at approximately 10 months of age, which falls within the reported range for the worldwide average peak incidence of between 4 and 36 months [23]. The average incidence for this period was calculated to be 0.19 episodes per child-year. The probability that RV related death would result in children less than fi ve was 0.0018 estimated using a combination of local data and published methodology [24].
Health costsThe costs attributed to non-fatal RV cases were accounted for in the model based on previously reported care-seeking behaviour and treatment costs in Egypt [15]. The costs of care were applied to four diff erent RV health states and treatment scenarios: (1) no treatment; (2) outpatient treatment; (3) hospitalization; and (4) death. Cost of care was based on actual costs accrued by the patients at two hospitals, Benha and Abu Homos, that participated in previously described studies [15] The average cost of hospitalization due to RV, 102 LE, at these two hospitals was used since the former is rural and the latter is peri-urban and Egypt has an even mix of these treatment centres. Both hospitals calculated the same average cost for outpatient care of 23.3 LE. Every year following RV we accounted for healthcare costs, infl ated from the base year to derive the rotavirus budget impact similar to the approach used by other authors [12;21].
Costs attributed to non-RV related health costs over the lifetimes of the RV vaccinated and unvaccinated cohorts were also included in the analysis. The model utilises per capita government costs to which we apply a standard function to account for lower healthcare expenditure in younger ages and higher expenditure in elderly persons. Costs in the base year were LE127 based on 1995 estimates and infl ated every year in the model. However, previous studies have noted that per capita investment costs have not increased signifi cantly over past decade [25;26]. The impact of growth in public health costs were assessed in the sensitivity analysis.
RV coverage and effi cacyRV coverage and effi cacyIn the analysis it was assumed that RV vaccination would be administered within the existing national immunization program because RV can be piggy-backed onto the current Diphtheria, Pertussis, and Tetanus and (DPT) vaccination schedules. Costs are based on two dose administrations delivered within the fi rst year of life. Similar to the model described by Ortega et al, we assume vaccination of the birth cohort of 1,909,000 children in the fi rst year with 98% coverage. No
Exploring new ways of measuring the economic value of vaccination
198
adjustment for early mortality was made so this likely over estimates vaccination costs as a proportion of children would have died before being vaccinated. The impact of vaccination acquisition costs is explored in the sensitivity analysis. RV effi cacy was based on previously published studies [27], and estimates applied in previous Egyptian modelling studies [15].The vaccine price for two injections used in the base analysis was LE154 with low price (LE98) and high price (LE210) points assessed in the model.
Wages and taxesWages and taxesThe human capital component of the model uses the combined male/female age-specifi c wages applied to vaccinated and unvaccinated survivors over their working life (age 15–65). Consistent with the generational accounting methodology wages are infl ated over time based on increases in productivity. Earnings are adjusted based on current unemployment rates in Egypt and held constant over the lifetime of the model. Information on average earnings is obtained from the Egyptian Central Agency for Mobilization and Statistics (CAPMAS). The unemployment rate currently approximately 9% is held constant over the lifetime of the model [28].
Based on current income tax bands and tax receipts a fi xed proportional tax burden of 12% was applied to earnings in the vaccinated and unvaccinated cohorts [29]. An adjustment for tax compliance of approximately 65% was performed [30]. To refl ect the possibility that RV may disproportionately aff ect those from lower socioeconomic groups, and consequently lower wages and tax compliance, we performed a sensitivity analysis based on lowering tax compliance to 20%. Applying a fi xed tax burden to salaries likely underestimates total tax burden. Income tax only represents 15% of total government revenues and ignores consumption taxes, stamp duties and other levies [29]. Average weekly wages for public and private workers are LE327 [28].
Public PensionsPublic pensions costs based on 90% coverage were applied at retirement aged. Public pension benefi t was calculated to start at age 60 years for RV vaccinated and unvaccinated cohorts based on current pension benefi ts and infl ated over time [31].
Productivity lossesProductivity lossesThe societal cost was refl ected by accounting for time off work for parents based on average wage rates [28] Consistent with previous investigators, we assume two days lost productivity for the parent per RV case [32;33]. Lost productivity costs are only applicable in the fi rst year fi ve.
Discounted net taxesEvery year after birth the model estimates age-specifi c government transfers and age-specifi c gross taxes for vaccinated and unvaccinated cohorts. At every age the diff erence between gross transfers and gross taxes are used to derive discounted net tax contributions. The valuation method is based on discounted cash fl ows to estimate the attractiveness of an investment based on the present value of the investment and resulting fi nancial consequences attributed to the investment.

Chapter 5
199
In the early stages of life RV vaccinated and unvaccinated cohorts are net recipients of government transfers and tax contributions are zero, consequently the net tax is negative. From the age of birth to commencing employment, the accumulated net taxes remain negative. As the child ages and enters working age gross taxes increase and government transfers are negligible. RV vaccine costs are evaluated as an investment costs for government expenditure at year 0 for the birth cohort. To refl ect the present value of the investment we calculate the net present value (NPV) of RV investment costs and all subsequent government transfers and taxes over the lifetime of the birth cohort as follows.
Rt = Sum of gross taxes paid by cohort
Et = Sum of age-specifi c direct government expenditure per cohort over
lifetime (e.g., education, healthcare, pension)r = Rate of discount T = Life expectancyK
0= vaccine purchasing costs at birth age (0)
To assess the present value of RV investments costs for government we assess the profi tability index (PI) as follows: Present value future cash fl ows/Initial investment = PI. The standard convention for interpreting PI is that ratios of 1.0 are the lowest acceptable measure, and values lower than 1.0 indicate the project’s present value is less than the initial investment. The internal rate of return (IRR) from positive and negative cash fl ows was also estimated.
TimeframeIn the short-term (5 years) we assess the societal perspective taking into consideration RV treatment costs, and lost productivity of parents caring for children. Over longer time horizons the government perspective is assessed to the average life-expectancy of 72 years to assess the sustained economic eff ects of RV vaccination.
Results Annualised discounted societal costs for vaccinated and unvaccinated cohort are shown in Figure 1. From the societal perspective, costs increase in year-1 attributed to vaccine acquisition costs. However in subsequent years, costs in the vaccinated cohort decrease from reduced RV related gastroenteritis direct medical costs and indirect costs associated with improved productivity. From the societal perspective, the net present value (NPV) of vaccinated and unvaccinated cohorts at 5-years was –LE1,334 million and –LE1,269 million, respectively, with an incremental NPV of –LE 65 million. In the fi rst fi ve years of life diff erences between the societal and government perspective models are minimal; therefore, only societal perspective data are presented.
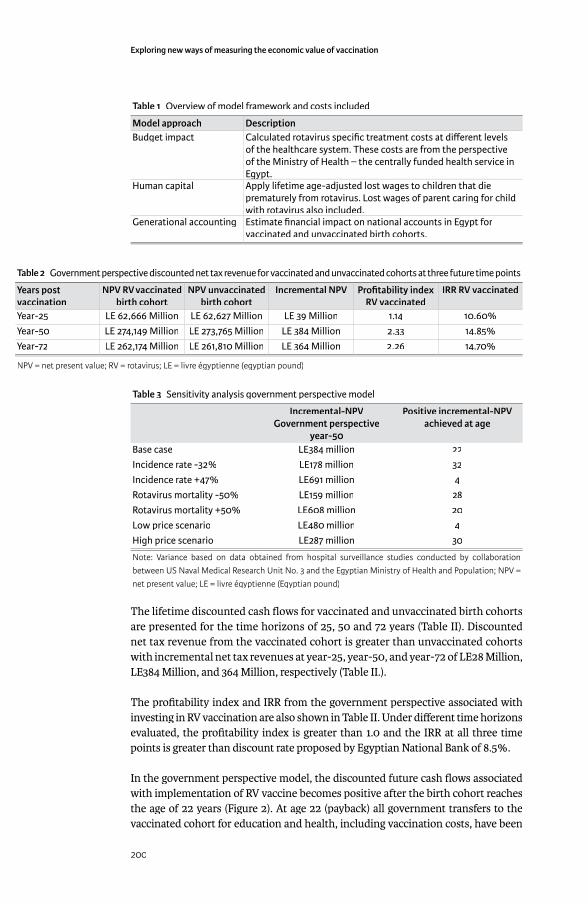
Exploring new ways of measuring the economic value of vaccination
200
Table 1 Overview of model framework and costs included
Model approach DescriptionBudget impact Calculated rotavirus specifi c treatment costs at diff erent levels
of the healthcare system. These costs are from the perspective of the Ministry of Health – the centrally funded health service in Egypt. Egypt.
Human capital Apply lifetime age-adjusted lost wages to children that die prematurely from rotavirus. Lost wages of parent caring for child with rotavirus also included.
Generational accounting Estimate fi nancial impact on national accounts in Egypt for vaccinated and unvaccinated birth cohorts.
Table 2 Government perspective discounted net tax revenue for vaccinated and unvaccinated cohorts at three future time points
Years post vaccination
NPV RV vaccinated birth cohort
NPV unvaccinated birth cohort
Incremental NPV Profi tability index RV vaccinated
IRR RV vaccinated
Year-25 LE 62,666 Million LE 62,627 Million LE 39 Million 1.14 10.60%Year-50 LE 274,149 Million LE 273,765 Million LE 384 Million 2.33 14.85%Year-72 LE 262,174 Million LE 261,810 Million LE 364 Million 2.26 14.70%
NPV = net present value; RV = rotavirus; LE = livre égyptienne (egyptian pound)
Table 3 Sensitivity analysis government perspective model
Incremental-NPVGovernment perspective
year-50
Positive incremental-NPV achieved at age
Base case LE384 million 22Incidence rate -32% LE178 million 32Incidence rate +47% LE691 million 4Rotavirus mortality -50% LE159 million 28Rotavirus mortality +50% LE608 million 20Low price scenario LE480 million 4High price scenario LE287 million 30
Note: Variance based on data obtained from hospital surveillance studies conducted by collaboration between US Naval Medical Research Unit No. 3 and the Egyptian Ministry of Health and Population; NPV = net present value; LE = livre égyptienne (Egyptian pound)
The lifetime discounted cash fl ows for vaccinated and unvaccinated birth cohorts are presented for the time horizons of 25, 50 and 72 years (Table II). Discounted net tax revenue from the vaccinated cohort is greater than unvaccinated cohorts with incremental net tax revenues at year-25, year-50, and year-72 of LE28 Million, LE384 Million, and 364 Million, respectively (Table II.).
The profi tability index and IRR from the government perspective associated with investing in RV vaccination are also shown in Table II. Under diff erent time horizons evaluated, the profi tability index is greater than 1.0 and the IRR at all three time points is greater than discount rate proposed by Egyptian National Bank of 8.5%.
In the government perspective model, the discounted future cash fl ows associated with implementation of RV vaccine becomes positive after the birth cohort reaches the age of 22 years (Figure 2). At age 22 (payback) all government transfers to the vaccinated cohort for education and health, including vaccination costs, have been

Chapter 5
201
paid for by net taxes paid by the cohort. The discounted future cash fl ow starts to become negative as cohorts retire and draw public pensions at age 60.
Sensitivity analysisSensitivity analysisThe univariate sensitivity analyses for diff erences in RV incidence, mortality and vaccine price are described in Table III. In the low price scenario and with increased RV incidence, the NPV for RV vaccination becomes positive at age 4 due to direct and indirect costs saved that cover resources spent on vaccine. Expected NPV under the worst case scenario including reductions in RV incidence, reduced RV mortality and high vaccine pricing, turns positive after vaccinated individuals become 32 years. Under the worst case assumptions individuals need to work approximately 10 years longer in order to off set vaccination costs compared to base case. Altering tax compliance to 20% lowered discounted net tax revenues to LE79,889 million and LE79,821 million in vaccinated and unvaccinated cohorts, and increased the payback age to 35.
DISCUSSIONFew people would dispute the benefi ts of investing in health and its impact on human capital. Despite the fact that human capital formation is directly infl uenced by investments in health, the analytical framework often used for evaluating health programs often ignores the relationship between health and human capital. Instead, measurement tools consistent with welfare economics such as health state preferences and health-related quality of life have become the preferred tools for valuing health gains [9].
Generational accounting is an informative tool used by governments to assess the impact of policy changes on intergenerational tax burden [17]. Furthermore,
Figure 1 Cumulative government expenditure and tax revenue for vaccinated and unvaccinated cohorts in Egypt with cumulative discounted net present value projected to base year. NPV= net present value
RTV = rotavirus vaccine

Exploring new ways of measuring the economic value of vaccination
202
Figure 2 Time-dependent univariate sensitivity analysis for the rotavirus vaccinated cohort at 25, 50 and 72 years. CI = confi dence interval; NPV= net present value; RV= rotavirus
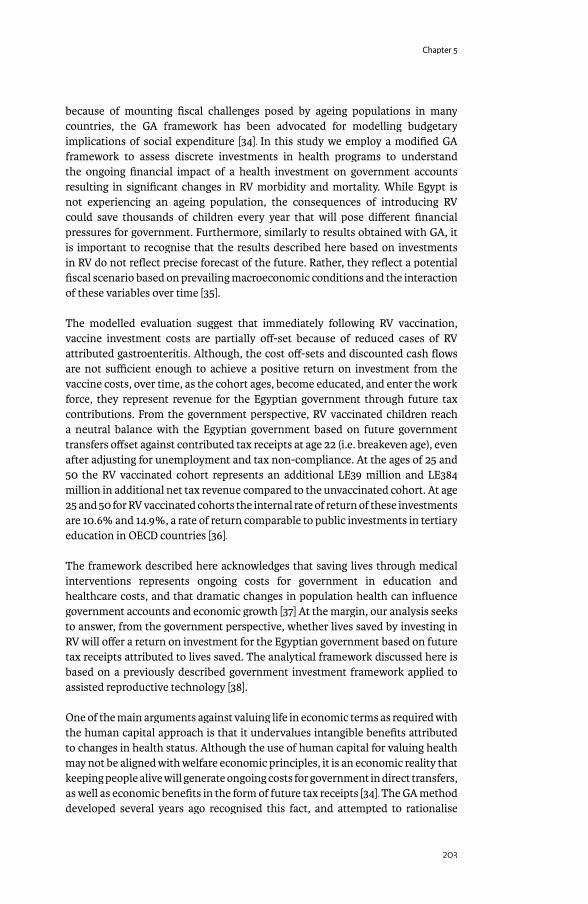
Chapter 5
203
because of mounting fi scal challenges posed by ageing populations in many countries, the GA framework has been advocated for modelling budgetary implications of social expenditure [34]. In this study we employ a modifi ed GA framework to assess discrete investments in health programs to understand the ongoing fi nancial impact of a health investment on government accounts resulting in signifi cant changes in RV morbidity and mortality. While Egypt is not experiencing an ageing population, the consequences of introducing RV could save thousands of children every year that will pose diff erent fi nancial pressures for government. Furthermore, similarly to results obtained with GA, it is important to recognise that the results described here based on investments in RV do not refl ect precise forecast of the future. Rather, they refl ect a potential fi scal scenario based on prevailing macroeconomic conditions and the interaction of these variables over time [35].
The modelled evaluation suggest that immediately following RV vaccination, vaccine investment costs are partially off -set because of reduced cases of RV attributed gastroenteritis. Although, the cost off -sets and discounted cash fl ows are not suffi cient enough to achieve a positive return on investment from the vaccine costs, over time, as the cohort ages, become educated, and enter the work force, they represent revenue for the Egyptian government through future tax contributions. From the government perspective, RV vaccinated children reach a neutral balance with the Egyptian government based on future government transfers off set against contributed tax receipts at age 22 (i.e. breakeven age), even after adjusting for unemployment and tax non-compliance. At the ages of 25 and 50 the RV vaccinated cohort represents an additional LE39 million and LE384 million in additional net tax revenue compared to the unvaccinated cohort. At age 25 and 50 for RV vaccinated cohorts the internal rate of return of these investments are 10.6% and 14.9%, a rate of return comparable to public investments in tertiary education in OECD countries [36].
The framework described here acknowledges that saving lives through medical interventions represents ongoing costs for government in education and healthcare costs, and that dramatic changes in population health can infl uence government accounts and economic growth [37] At the margin, our analysis seeks to answer, from the government perspective, whether lives saved by investing in RV will off er a return on investment for the Egyptian government based on future tax receipts attributed to lives saved. The analytical framework discussed here is based on a previously described government investment framework applied to assisted reproductive technology [38].
One of the main arguments against valuing life in economic terms as required with the human capital approach is that it undervalues intangible benefi ts attributed to changes in health status. Although the use of human capital for valuing health may not be aligned with welfare economic principles, it is an economic reality that keeping people alive will generate ongoing costs for government in direct transfers, as well as economic benefi ts in the form of future tax receipts [34].The GA method developed several years ago recognised this fact, and attempted to rationalise

Exploring new ways of measuring the economic value of vaccination
204
government spending in relation to future revenue and expenditure that are likely to arise from policy decisions. Within the GA framework governments, and specifi cally treasury departments, recognise that total expenditure is linked to the number of people who demand government resources, as well as the number of people that are helping to fi nance the system through taxation. In this respect we have attempted to capture the fact that as vaccination programs are introduced they will save lives and these lives will have an impact on government accounts both positively and negatively over time. Those that doubt need only look at how changes in longevity, generous spending and shrinking working-age populations are starting to raise concerns over sustainability of public fi nances [39]
Since introducing an economic framework to inform resource allocations, considerable debate has focused on the merits of the health service perspective versus the societal perspective to inform decision making [40] In this analysis we circumvent this debate and apply a “government perspective” analysis assessing discounted net tax revenue as the principal economic metric. A government perspective analysing applied to health investments is particularly relevant considering changes in population health can infl uence government expenditure and tax receipts [6]. Furthermore, considering the proportion public funds used to pay for health services in Egypt as well as many other countries, the broader application of a government perspective analysis is justifi able. Additionally, in light of the established relationship between health and economic growth, a government perspective analysis refl ects the fact that any growth attributed to health investments, Cēterīs paribus, will result in increased government tax revenue.
Resource allocation decisions in healthcare are challenging, especially in developing countries, because of the need to balance the needs of many with fi nite resources. Decisions are often based on priorities based on unmet need, burden of illness, fairness, equity and aff ordability. The research presented here is provocative because it assigns future net tax revenue to discrete investments in RV vaccination. Therefore, it is reasonable to ask how decision-makers should respond to information illustrating the potential economic benefi ts attributed to resource allocation decisions. We do not expect decision-makers to abandon the core elements of decision-making. Although one of the aims of our work is to highlight the fi scal consequences associated with investments in health. This is particularly relevant in Egypt because increased birth cohort survivorship suggests ongoing costs; however government can also reap fi nancial benefi t from previous human capital investments in health and education.
All economic models have inherent weaknesses, and the framework described here integrating three modelling approaches is no exception. Modelling long run economic events requires making predictions about future economic conditions that are certain to change. The simplest approach is to hold variables constant over time and test the sensitivity of those variables likely to infl uence the results. In this analysis we have shown that decreases in RV infection rates and increased vaccine prices will prolong the payback period for vaccine investment costs. In contrast, increased RV incidence improves the value of prevention because of reduced
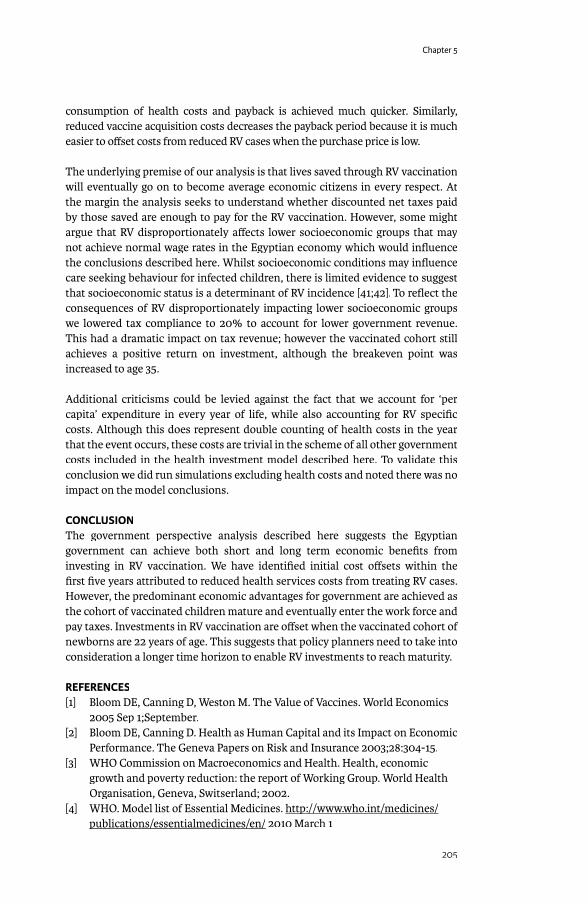
Chapter 5
205
consumption of health costs and payback is achieved much quicker. Similarly, reduced vaccine acquisition costs decreases the payback period because it is much easier to off set costs from reduced RV cases when the purchase price is low.
The underlying premise of our analysis is that lives saved through RV vaccination will eventually go on to become average economic citizens in every respect. At the margin the analysis seeks to understand whether discounted net taxes paid by those saved are enough to pay for the RV vaccination. However, some might argue that RV disproportionately aff ects lower socioeconomic groups that may not achieve normal wage rates in the Egyptian economy which would infl uence the conclusions described here. Whilst socioeconomic conditions may infl uence care seeking behaviour for infected children, there is limited evidence to suggest that socioeconomic status is a determinant of RV incidence [41;42]. To refl ect the consequences of RV disproportionately impacting lower socioeconomic groups we lowered tax compliance to 20% to account for lower government revenue. This had a dramatic impact on tax revenue; however the vaccinated cohort still achieves a positive return on investment, although the breakeven point was increased to age 35.
Additional criticisms could be levied against the fact that we account for ‘per capita’ expenditure in every year of life, while also accounting for RV specifi c costs. Although this does represent double counting of health costs in the year that the event occurs, these costs are trivial in the scheme of all other government costs included in the health investment model described here. To validate this conclusion we did run simulations excluding health costs and noted there was no impact on the model conclusions.
CONCLUSIONThe government perspective analysis described here suggests the Egyptian government can achieve both short and long term economic benefi ts from investing in RV vaccination. We have identifi ed initial cost off sets within the fi rst fi ve years attributed to reduced health services costs from treating RV cases. However, the predominant economic advantages for government are achieved as the cohort of vaccinated children mature and eventually enter the work force and pay taxes. Investments in RV vaccination are off set when the vaccinated cohort of newborns are 22 years of age. This suggests that policy planners need to take into consideration a longer time horizon to enable RV investments to reach maturity.
REFERENCES[1] Bloom DE, Canning D, Weston M. The Value of Vaccines. World Economics
2005 Sep 1;September.[2] Bloom DE, Canning D. Health as Human Capital and its Impact on Economic
Performance. The Geneva Papers on Risk and Insurance 2003;28:304-15.[3] WHO Commission on Macroeconomics and Health. Health, economic
growth and poverty reduction: the report of Working Group. World Health Organisation, Geneva, Switserland; 2002.
[4] WHO. Model list of Essential Medicines. http://www.who.int/medicines/http://www.who.int/medicines/publications/essentialmedicines/en/publications/essentialmedicines/en/ 2010 March 1
Exploring new ways of measuring the economic value of vaccination
206
[5] Contoyannis P, Rice N. The impact of health on wages: evidence from the British Household Panel Survey. Empirical Economics 2001;26(4):599-622.
[6] WHO. WHO guide to identifying the economic consequences of disease and injury. WHO Press, World Health Organisation, Geneva, Switserland; 2009.
[7] Sancak C, Velloso R, Xing J. Tax Revenue Response to the Business Cycle. International Monetary Fund; 2010. IMF Working Paper WP/10/71.
[8] Suhrcke C, Mckee M, Arce R. The contribution of health to the economy in the European Union. European Communities; 2005.
[9] Zentner A, Valasco-Garrido M, Busse R. Methods for the comparative evaluation of pharmaceuticals. GMS Health Technology Assessment; 2005 Dec 9.
[10] National Institute for Health and Clinical Excellence (NICE). Guide to the Methods of Technology Appraisal. 2004 Apr. reference N0515.
[11] Barnighausen T, Bloom DE, Canning D. The economic case for expanding vaccination coverage of children. PGDA Working Paper No 45; 2009 Jul.
[12] Standaert B, Harlin O, Desselberger U. The Financial Burden of Rotavirus Disease in Four Countries of the European Union. Pediatric Infectious Disease Journal Rotavirus 2008 Jan;217:S20-S27.
[13] Gleizes O, Desselberger U, Tatochenko V, Rodrigo C, Salman N, Mezner Z, et al. Nosocomial rotavirus infection in European countries: a review of the epidemiology, severity and economic burden of hospital-acquired rotavirus disease. Pediatr Infect Dis J 2006 Jan;25(1 Suppl):S12-S21.
[14] Parashar UD, Hummelman EG, Bresee JS, Miller MA, Glass RI. Global illness and deaths caused by rotavirus disease in children. Emerg Infect Dis 2003 May;9(5):565-72.
[15] Ortega O, El-Sayed N, Sanders JW, bd-Rabou Z, Antil L, Bresee J, et al. Cost-benefi t analysis of a rotavirus immunization program in the Arab Republic of Egypt. J Infect Dis 2009 Nov 1;200 Suppl 1:S92-S98.
[16] Mauskopf JA, Sullivan SD, Annemans L, Caro J, Mullins CD, Nuijten M, et al. Principles of good practice for budget impact analysis: report of the ISPOR Task Force on good research practices--budget impact analysis. Value Health 2007 Sep;10(5):336-47.
[17] Bonin H, Patxot C. Generational Accounting as a tool to assess Fiscal Sustainability: an overview of the methodology. Institute for the Study of Labor, Germany.; 2004 Jan 1. [Series ]Discussion Paper No 990.
[18] Rice DP, Cooper BS. The economic value of human life. Am J Public Health Nations Health 1967 Nov;57(11):1954-66.
[19] CAPMAS. Quarterly Labor Force Sample Survey. Labor Force, Employment & Unemployment in Egypt. www.capmas.gov.eg/eng_ver/sdds/SDDS3.htmwww.capmas.gov.eg/eng_ver/sdds/SDDS3.htm2010 August 20
[20] WHO Statistics. Egyptian life tables 2008. 23-11-2010. Ref Type: Data File[21] Rose J, Hawthorn RL, Watts B, Singer ME. Public health impact and cost
eff ectiveness of mass vaccination with live attenuated human rotavirus vaccine (RIX4414) in India: model based analysis. BMJ 2009;339:b3653.
[22] Nafi cy AB, bu-Elyazeed R, Holmes JL, Rao MR, Savarino SJ, Kim Y, et al. Epidemiology of rotavirus diarrhea in Egyptian children and implications for disease control. Am J Epidemiol 1999 Oct 1;150(7):770-7.
Chapter 5
207
[23] Parashar UD, Bresee JS, Gentsch JR, Glass RI. Rotavirus. Emerg Infect Dis 1998 Oct;4(4):561-70.
[24] Morris SS, Black RE, Tomaskovic L. Predicting the distribution of under-fi ve deaths by cause in countries without adequate vital registration systems. Int J Epidemiol 2003 Dec;32(6):1041-51.
[25] Gericke CA. Comparison of health care fi nancing in Egypt and Cuba: lessons for health reform in Egypt. East Mediterr Health J 2005 Sep;11(5-6):1073-86.
[26] United Nations Statistics Division. Per capita government expenditure on health _Egypt. 18-10-2010. Ref Type: Data File
[27] Rotavirus vaccine--AVANT immunotherapeutics/GlaxoSmithKline: 89-12, RIX4414. Drugs R D 2004;5(2):113-5.
[28] CAPMAS. Weekly wages for public and private sector. 24-8-2010. Ref Type: Data File
[29] Ministry of Finance (MoF). The Income Tax Law Promulgated by Law no 91 of 2005. 18-8-2010. Ref Type: Data File
[30] OECD Directorate for Financial and Enterprise Aff airs. Competition Policy and the Informal Economy 2009. 18-8-2010. Ref Type: Data File
[31] International Organisation of Pension Supervisors (IOPS). Country Profi les _ Egypt. 22-11-2010. Ref Type: Data File
[32] de Soarez PC, Valentim J, Sartori AMC. Cost-eff ectiveness analysis of routine rotavirus vaccination in Brazil. Rev Panam Salud Publica 2008;23(4):221-30.
[33] Widdowson MA, Meltzer MI, Zhang X, Bresee JS, Parashar UD, Glass RI. Cost-eff ectiveness and potential impact of rotavirus vaccination in the United States. Pediatrics 2007 Apr;119(4):684-97.
[34] Feist K. Generational accounting as a tool for modelling social expenditures in Europe. Futures 2003;35(1):49-59.
[35] Prusvic D, Pavlokova K. Generational Accounting in European Health Care Systems. Journal of Economics and Finance 2010;60(5):378-99.
[36] OECD. Education at a Glance 2008. OECD; 2008.[37] Acemoglu D, Johnson S. Disease and Development: The eff ect of
life expectancy on economic growth. Journal of Political Economy 2007;115(6):925-85.
[38] Connolly MP, Pollard MS, Hoorens S, Kaplan BR, Oskowitz SP, Silber SJ. Long-term economic benefi ts attributed to IVF-conceived children: a lifetime tax calculation. Am J Manag Care 2008 Sep;14(9):598-604.
[39] European Commission Directorate_General for Economic and Financial Aff airs. Sustainability Report 2009. 2009. [Series ]European Economy 9.
[40] Brown J, Buxton M. The economic perspective. Br Med Bull 1998;54(4):993-1009.
[41] Schael IP, Gonzalez R, Salinas B. Severity and age of rotavirus diarrhea, but not socioeconomic conditions, are associated with rotavirus seasonality in Venezuela. J Med Virol 2009 Mar;81(3):562-7.
[42] Kurugöl Z, Geylani S, Karaca Y, Umay Y, Erensoy S, Vardar F, et al. Rotavirus gastroenteritis among children under fi ve years of age in Ýzmir, Turkey. The Turkish Journal of Pediatrics 2003;45:290-4.
208
LIMITS TO OUR KNOWLEDGE
In this last chapter I summarise what we have learned from studying rotavirus vaccination during the past years and from analysing the approach we took in health economics for this vaccine worldwide. I will present in addition what I consider remaining challenges and I will indicate ways I would like to further explore these domains as there is still much to examine and to value.
6.1 WHAT DID WE LEARN?When selecting the subject of health economic analysis of rotavirus vaccination for this thesis I thought at start -and many with me as well- this will be an easy task to accomplish. The analysis is straightforward because the disease happens in a well-defi ned target group -the very young ones- and the results of the vaccine from the European trial were quite impressive, especially when the disease was severe with a 100% reduction in hospitalisation rate during 1st year [31].
Well, that statement about easiness in the analysis is not completely true. Rotavirus disease creates a more complex environment than seen at fi rst sight and the impact the vaccine has is quite sophisticated. But 3 elements came out from the studies we undertook in Belgium that now better clarify how the rotavirus puzzle and its immunisation process fi ts together that was unclear before the vaccine was introduced in the market.
One is that we observed from the trial results that the vaccine effi cacy measured with the formula we all know -[ ]- signifi cantly decreases ]- signifi cantly decreases ]- signifi cantly decreases in the 2nd year compared with the 1nd year compared with the 1nd st year measurement. An explanation for that st year measurement. An explanation for that st
phenomenon easily given was that the vaccine’s effi cacy is waning after one year and that this waning process will continue during the subsequent years. It took much eff ort to convince other parties that the vaccine effi cacy was not waning over time rather the increase in natural immunity in the child population is the reason for a decreased denominator in the formula of measuring the vaccine effi cacy. On top of that an important herd eff ect was present in the control arm of the European trial during the 2nd year of evaluation as the children were randomised 2 to 1. The fi nding nd year of evaluation as the children were randomised 2 to 1. The fi nding nd
that there is no waning in vaccine effi cacy to be suspected after one year –this is based on the comparison between model predicted and observed data-, had major consequences [24]. Many specialists thought that we should go now for a booster dose if the vaccine waning is prominently present in the vaccinated population after 2 years. This booster dose is currently heavily promoted in developing and in emerging markets like India for instance. But the opposite is the truth. Earlier vaccination of the child population in the developing world is a more sensitive way to create more health gain than planning a 3rd dose later on when an already rd dose later on when an already rd
high spread of the natural immunity in the child population will compete with the vaccine immunisation process stimulated by the 3rd dose. Also from an economic rd dose. Also from an economic rd
point of view is a 3rd dose program not such a good option to select when the vaccine rd dose program not such a good option to select when the vaccine rd
prevention budget is limited as we have shown with the optimisation modelling technique.
6
Chapter 6
209
We could have been stronger in our assessment about the post-vaccine fi ndings of ‘no vaccine effi cacy waning’ over time at the moment of the product launch in Europe. But what we missed were reliable and detailed epidemiology data on the natural history of the infection and the disease. These data should have shown the progressive immune protection generated by the natural, subsequent infections with the virus. We had data from Mexico of Dr Raul Velazquez who did a remarkable study on infection rates in a cohort of children in 1996 a few years before the RotaShield vaccine was on the market [32;33]. However, that was all we had. We had no information about the detailed spread of the infection and the disease by specifi c age-groups under 5 years old in Europe. We did not know how the children were normally behaving in their contact patterns when they were very young. Much at the time we started modelling the disease was ‘best guessing’. Still today we have no good explanation why the spread of the virus preferentially occurs during the winter period each year in our world of the northern hemisphere.
Second is that the disease spread has an intimate connection with the vaccine impact through the way children are nurtured during their fi rst year of life: are the children going to a hub site such as day-care centres where the spread of the infection is heavily multiplied or not [33]? Vaccination with a high uptake will stop the spread of the infection in day-care centres not only amongst those vaccinated but especially amongst the unvaccinated children. They could be younger or older than the fi rst target group. As a consequence the drop in hospitalisation when one starts introducing the vaccine at the right moment –no later than the end of the 2nd
quarter of the year prior the next epidemic period-, will be huge during the epidemic period as we have observed now in the UK. In addition we are suspecting that there is another source of rotavirus infection that hits the children besides themselves. These are the professional and non-professional care-givers. As the vaccine doesn’t impact that specifi c source directly, it is likely that the rotavirus will continue being endemic and infecting the child population at a much slower pace than if the infection comes from within the group. At the end it will be diffi cult to reach a ‘disease elimination’ status soon if we keep the vaccination strategy as it is now.
A last interesting fi nding is related to the previous one with the massive hit the vaccine causes on the reduction of hospitalisation. We should have had a better focus on that point from the beginning when we were thinking about rotavirus vaccination: understanding under which circumstances the disease appears and what could be the impact of a huge drop in hospitalisation on the management of this sector in health care after the vaccine introduction. We were maybe a little naïve or blind about the results of the clinical trial with a 100% reduction in hospitalisation. This fi nding was too much considered as if it was another interesting fi nding of the trial but we were not thinking behind the numbers reported. Meanwhile 1/3 of the hospitalisations during the winter period are caused by rotavirus diarrhea, the virus is a major cause of nosocomial infection in hospital care amongst children, the disease happens in a period when other prominent infections occur. Under such circumstances the introduction of the vaccine with a high uptake must create an imbalance into the health care system during the epidemic period. We should have better observed, measured
Exploring new ways of measuring the economic value of vaccination
210
and reported those fi ndings. The imbalance could be a cause of unrest amongst the professional health care workers or it could be considered a major break-through benefi t by the same personnel desperately seeking for a solution against overcrowded wards during each winter period. This is what we analysed with our quality of care study that reports for one hospital in Belgium the in-house benefi t of moving into a vaccination program against rotavirus disease. That change engendered positive consequences on bed-day patient management and on personnel management during the epidemic periods in hospital care.
I could have listed other interesting data observed from all the other research undertaken in many diff erent countries across the world. We measured for the fi rst time the real benefi t of absenteeism reduction amongst working mothers after the introduction of the vaccine. We discovered a high cost at home of a sick child in many middle-income countries where the whole village passes by to nurture the family members. This is a perfect spread of the disease we now can easily stop with the introduction of the vaccine and make important savings at the level of the family unit. We also measured the impact the disease has on the quality of life of parents and particularly on working mothers. All these diff erent studies indicate that a simple disease as rotavirus diarrhea has a much broader societal impact than we ever fi rst thought. The benefi t of vaccination can be more intense than we estimated in our models of economic evaluation as we don’t always capture all the -sometimes small, but critical- values to be expressed into monetary terms or in QALYs in the equation.
6.2 REMAINING CHALLENGESWhile our research has put new light on what was fi rst seen as a simple infection and disease with an easy to value vaccine, I also discovered remaining challenges regarding understanding well what could be the full economic benefi t of the vaccine in diff erent parts of the world. I summarise them hereunder in a few points.
A fi rst challenge is that we transferred without analysing in depth the economic assessment tool of Incremental Cost Utility Analysis (ICUA) performed with therapeutic drugs in a well-established health care market to preventative vaccines in the world of public health that is currently suff ering in having no much of an attractive image. We then also easily transposed the same technique from developed to the developing world. So, we moved around with a health economic evaluation tool that was not well tested whether it was appropriate for the evaluation of new features in new environments.
The question is now why do we think that ICUA is maybe not appropriate for the evaluation of prevention and particularly for the prevention against infectious diseases with vaccines and why will this tool also have diffi culties to be applied in developing countries? Let me fi rst answer the fi rst question about treatment versus prevention.
6.2.1 Treatment versus prevention6.2.1 Treatment versus preventionAs explained in my introduction ICUA has been initiated a while ago within a health care program that at that time was already well focussed on treatment
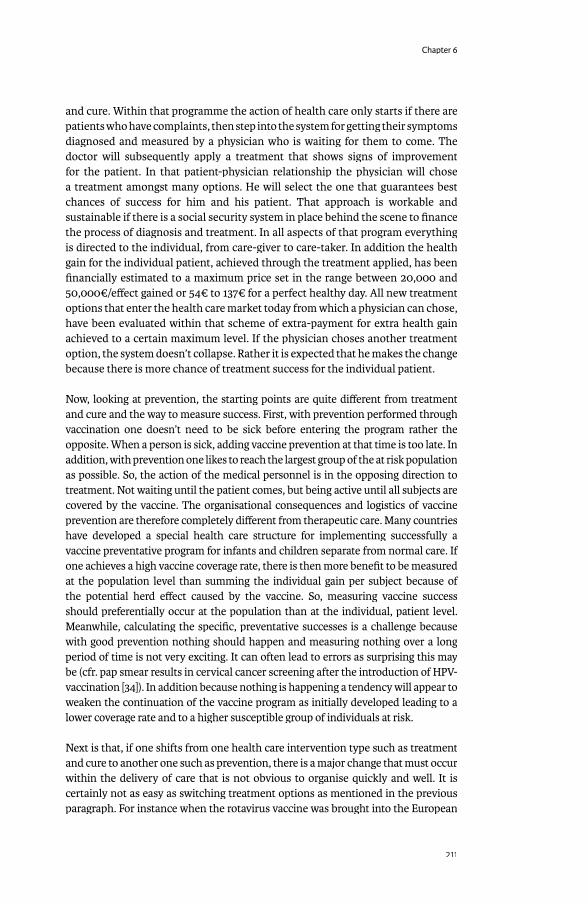
Chapter 6
211
and cure. Within that programme the action of health care only starts if there are patients who have complaints, then step into the system for getting their symptoms diagnosed and measured by a physician who is waiting for them to come. The doctor will subsequently apply a treatment that shows signs of improvement for the patient. In that patient-physician relationship the physician will chose a treatment amongst many options. He will select the one that guarantees best chances of success for him and his patient. That approach is workable and sustainable if there is a social security system in place behind the scene to fi nance the process of diagnosis and treatment. In all aspects of that program everything is directed to the individual, from care-giver to care-taker. In addition the health gain for the individual patient, achieved through the treatment applied, has been fi nancially estimated to a maximum price set in the range between 20,000 and 50,000€/eff ect gained or 54€ to 137€ for a perfect healthy day. All new treatment options that enter the health care market today from which a physician can chose, have been evaluated within that scheme of extra-payment for extra health gain achieved to a certain maximum level. If the physician choses another treatment option, the system doesn’t collapse. Rather it is expected that he makes the change because there is more chance of treatment success for the individual patient.
Now, looking at prevention, the starting points are quite diff erent from treatment and cure and the way to measure success. First, with prevention performed through vaccination one doesn’t need to be sick before entering the program rather the opposite. When a person is sick, adding vaccine prevention at that time is too late. In addition, with prevention one likes to reach the largest group of the at risk population as possible. So, the action of the medical personnel is in the opposing direction to treatment. Not waiting until the patient comes, but being active until all subjects are covered by the vaccine. The organisational consequences and logistics of vaccine prevention are therefore completely diff erent from therapeutic care. Many countries have developed a special health care structure for implementing successfully a vaccine preventative program for infants and children separate from normal care. If one achieves a high vaccine coverage rate, there is then more benefi t to be measured at the population level than summing the individual gain per subject because of the potential herd eff ect caused by the vaccine. So, measuring vaccine success should preferentially occur at the population than at the individual, patient level. Meanwhile, calculating the specifi c, preventative successes is a challenge because with good prevention nothing should happen and measuring nothing over a long period of time is not very exciting. It can often lead to errors as surprising this may be (cfr. pap smear results in cervical cancer screening after the introduction of HPV-vaccination [34]). In addition because nothing is happening a tendency will appear to weaken the continuation of the vaccine program as initially developed leading to a lower coverage rate and to a higher susceptible group of individuals at risk.
Next is that, if one shifts from one health care intervention type such as treatment and cure to another one such as prevention, there is a major change that must occur within the delivery of care that is not obvious to organise quickly and well. It is certainly not as easy as switching treatment options as mentioned in the previous paragraph. For instance when the rotavirus vaccine was brought into the European
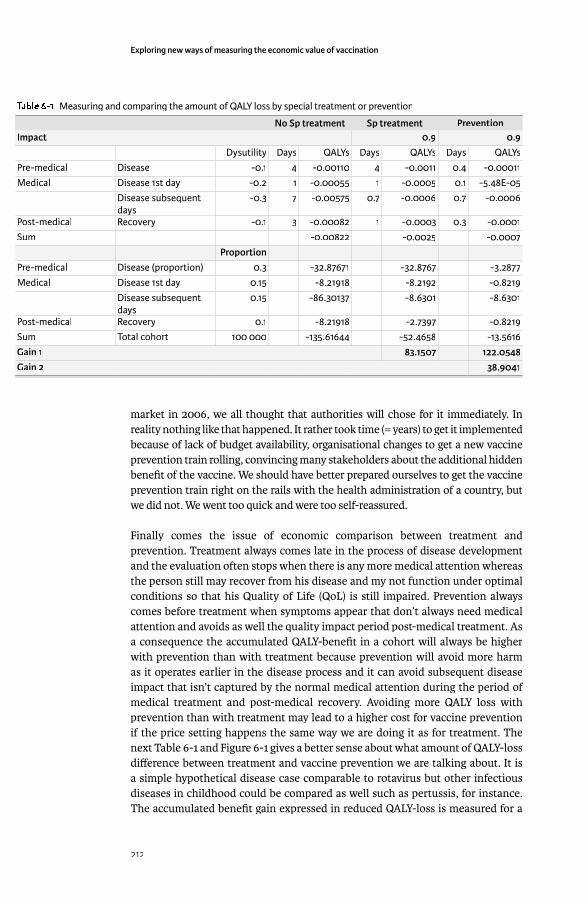
Exploring new ways of measuring the economic value of vaccination
212
market in 2006, we all thought that authorities will chose for it immediately. In reality nothing like that happened. It rather took time (= years) to get it implemented because of lack of budget availability, organisational changes to get a new vaccine prevention train rolling, convincing many stakeholders about the additional hidden benefi t of the vaccine. We should have better prepared ourselves to get the vaccine prevention train right on the rails with the health administration of a country, but we did not. We went too quick and were too self-reassured.
Finally comes the issue of economic comparison between treatment and prevention. Treatment always comes late in the process of disease development and the evaluation often stops when there is any more medical attention whereas the person still may recover from his disease and my not function under optimal conditions so that his Quality of Life (QoL) is still impaired. Prevention always comes before treatment when symptoms appear that don’t always need medical attention and avoids as well the quality impact period post-medical treatment. As a consequence the accumulated QALY-benefi t in a cohort will always be higher with prevention than with treatment because prevention will avoid more harm as it operates earlier in the disease process and it can avoid subsequent disease impact that isn’t captured by the normal medical attention during the period of medical treatment and post-medical recovery. Avoiding more QALY loss with prevention than with treatment may lead to a higher cost for vaccine prevention if the price setting happens the same way we are doing it as for treatment. The next Table 6-1 and Figure 6-1 gives a better sense about what amount of QALY-loss diff erence between treatment and vaccine prevention we are talking about. It is a simple hypothetical disease case comparable to rotavirus but other infectious diseases in childhood could be compared as well such as pertussis, for instance. The accumulated benefi t gain expressed in reduced QALY-loss is measured for a
Table 6-1 Measuring and comparing the amount of QALY loss by special treatment or prevention
No Sp treatment Sp treatment PreventionImpact 0.9 0.9
Dysutility Days QALYs Days QALYs Days QALYsPre-medical Disease -0.1 4 -0.00110 4 -0.0011 0.4 -0.00011Medical Disease 1st day -0.2 1 -0.00055 1 -0.0005 0.1 -5.48E-05
Disease subsequent daysdays
-0.3 7 -0.00575 0.7 -0.0006 0.7 -0.0006
Post-medical Recovery -0.1 3 -0.00082 1 -0.0003 0.3 -0.0001Sum -0.00822 -0.0025 -0.0007
ProportionPre-medical Disease (proportion) 0.3 -32.87671 -32.8767 -3.2877Medical Disease 1st day 0.15 -8.21918 -8.2192 -0.8219
Disease subsequent daysdays
0.15 -86.30137 -8.6301 -8.6301
Post-medical Recovery 0.1 -8.21918 -2.7397 -0.8219Sum Total cohort 100 000 -135.61644 -52.4658 -13.5616Gain 1 83.1507 122.0548Gain 2 38.9041
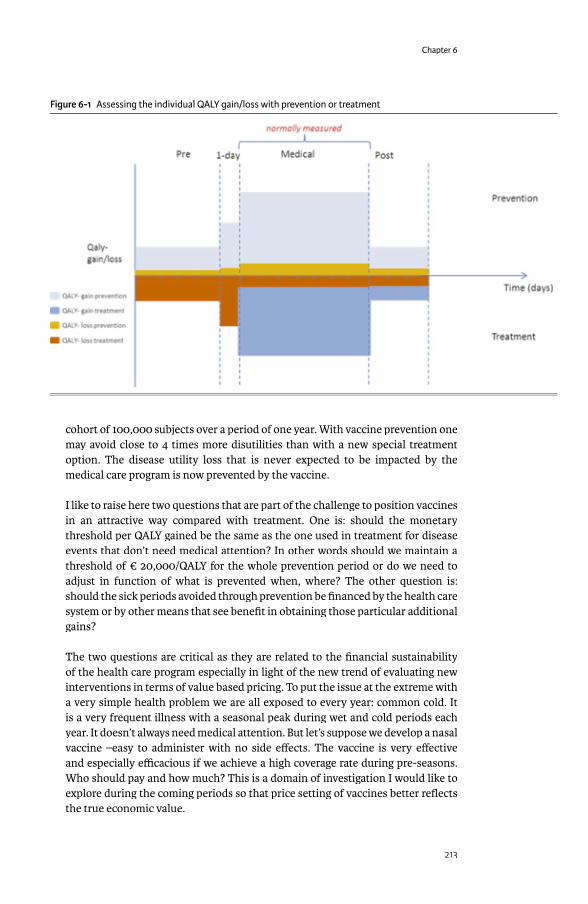
Chapter 6
213
cohort of 100,000 subjects over a period of one year. With vaccine prevention one may avoid close to 4 times more disutilities than with a new special treatment option. The disease utility loss that is never expected to be impacted by the medical care program is now prevented by the vaccine.
I like to raise here two questions that are part of the challenge to position vaccines in an attractive way compared with treatment. One is: should the monetary threshold per QALY gained be the same as the one used in treatment for disease events that don’t need medical attention? In other words should we maintain a threshold of € 20,000/QALY for the whole prevention period or do we need to adjust in function of what is prevented when, where? The other question is: should the sick periods avoided through prevention be fi nanced by the health care system or by other means that see benefi t in obtaining those particular additional gains?
The two questions are critical as they are related to the fi nancial sustainability of the health care program especially in light of the new trend of evaluating new interventions in terms of value based pricing. To put the issue at the extreme with a very simple health problem we are all exposed to every year: common cold. It is a very frequent illness with a seasonal peak during wet and cold periods each year. It doesn’t always need medical attention. But let’s suppose we develop a nasal vaccine –easy to administer with no side eff ects. The vaccine is very eff ective and especially effi cacious if we achieve a high coverage rate during pre-seasons. Who should pay and how much? This is a domain of investigation I would like to explore during the coming periods so that price setting of vaccines better refl ects the true economic value.
Figure 6-1 Assessing the individual QALY gain/loss with prevention or treatment

Exploring new ways of measuring the economic value of vaccination
214
Each vaccine in the market has an important part of its benefi t that has no return on investment to the health care program (see Figure 6-1, the non-measured or intangible benefi t). We often don’t consider these features as critical to be separated from the total medical benefi t because they are underreported or not always transparent in the way they are measured and quantifi ed. Meanwhile this extra gain is part of the individual benefi t as well as part of the societal benefi t. More coverage with a vaccine of the susceptible group will lead to more societal than individual gain. So, if everything within vaccine prevention is preferentially driven towards a level of assessment that is the population instead of the individual, shouldn’t we then look for economic evaluation tools that preferentially assess the benefi t and the cost at that level? Could therefore CBA, a technique that has more a societal ambition in economic evaluation than CUA, be a better option to work with for our economic assessment of vaccine prevention? Again, this is a domain I would like to explore in the coming years.
Finally, one should accept that vaccine positioning in society has evolved over time: from reducing and avoiding deaths, to limiting costly medical interventions and outbreaks, to also gaining in preventing non-medical disease events as we see it today. This can only be well accepted if the economic evaluation is recommended to be initiated at the level of a population. Prevention has of course benefi t or value for the individual but the full value can only be demonstrated at the higher level. The evaluation must have that ambition to look preferentially at the level of a population [35]. Three arguments push me therefore to think and to act in the economic evaluations of vaccines into that direction: the herd eff ect caused by the vaccine; the maximum benefi t that can only be attained with a high vaccine coverage in the population; and more benefi t is obtained than with treatment through the avoidance of disease events that don’t impact directly the health care program but society.
6.2.2 Developed versus developing countries6.2.2 Developed versus developing countriesThe other challenge or question I identifi ed about the appropriateness of ICUA for vaccines is when transposing this analysis tool from the developed to the developing world. More striking for a developing country is that it is still in its infancy of developing a full health care program. Under such circumstances priority setting between diff erent health care development options (public health versus care) is critical with a confrontation between two worlds of applying medicine (prevention versus therapy; societal versus individual). In that type of environment could prevention been cheaper than treatment? Low-income countries may therefore go in the opposing direction of high income countries (see further) and start with public health development before investing in treatment and therapies.
As mentioned in chapter 5 the technique of cost-eff ectiveness analysis is for low-income countries an instrument of economic evaluation that is not so helpful because the right threshold is diffi cult to be identifi ed and the CE-price-range is much too large for making a sensible selection for new interventions. Identifying and communicating that there is a problem is one objective of the paper submitted. Bringing a solution to that problem is the next step to take and to present.
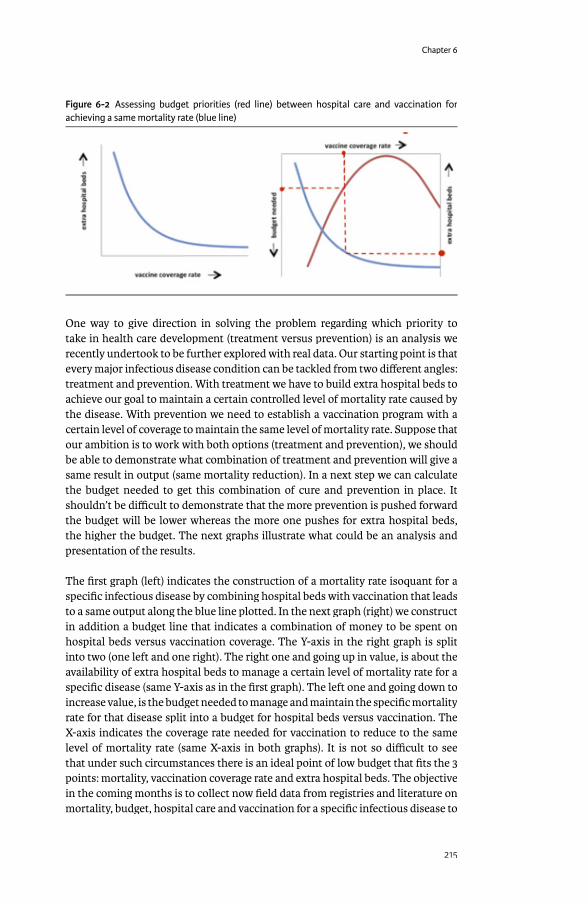
Chapter 6
215
One way to give direction in solving the problem regarding which priority to take in health care development (treatment versus prevention) is an analysis we recently undertook to be further explored with real data. Our starting point is that every major infectious disease condition can be tackled from two diff erent angles: treatment and prevention. With treatment we have to build extra hospital beds to achieve our goal to maintain a certain controlled level of mortality rate caused by the disease. With prevention we need to establish a vaccination program with a certain level of coverage to maintain the same level of mortality rate. Suppose that our ambition is to work with both options (treatment and prevention), we should be able to demonstrate what combination of treatment and prevention will give a same result in output (same mortality reduction). In a next step we can calculate the budget needed to get this combination of cure and prevention in place. It shouldn’t be diffi cult to demonstrate that the more prevention is pushed forward the budget will be lower whereas the more one pushes for extra hospital beds, the higher the budget. The next graphs illustrate what could be an analysis and presentation of the results.
The fi rst graph (left) indicates the construction of a mortality rate isoquant for a specifi c infectious disease by combining hospital beds with vaccination that leads to a same output along the blue line plotted. In the next graph (right) we construct in addition a budget line that indicates a combination of money to be spent on hospital beds versus vaccination coverage. The Y-axis in the right graph is split into two (one left and one right). The right one and going up in value, is about the availability of extra hospital beds to manage a certain level of mortality rate for a specifi c disease (same Y-axis as in the fi rst graph). The left one and going down to increase value, is the budget needed to manage and maintain the specifi c mortality rate for that disease split into a budget for hospital beds versus vaccination. The X-axis indicates the coverage rate needed for vaccination to reduce to the same level of mortality rate (same X-axis in both graphs). It is not so diffi cult to see that under such circumstances there is an ideal point of low budget that fi ts the 3 points: mortality, vaccination coverage rate and extra hospital beds. The objective in the coming months is to collect now fi eld data from registries and literature on mortality, budget, hospital care and vaccination for a specifi c infectious disease to
Figure 6-2 Assessing budget priorities (red line) between hospital care and vaccination for achieving a same mortality rate (blue line)

Exploring new ways of measuring the economic value of vaccination
216
feed the model design for a country that still needs to build up its total health care program. This graph should help designing priority setting for a given budget and a given health goal to be achieved.
6.2.3 Optimisation modelling6.2.3 Optimisation modellingThat brings us to the next analysis performed to identify solutions for the economic assessment of vaccines in low income countries and emerging markets using optimisation modelling. The technique helps solve diff erent issues I have highlighted in the previous paragraphs such as the diffi culty of defi ning a maximum threshold for valuing the QALY/DALY gain, having a too large price range for being cost-eff ective, being unable to combine diff erent intervention options, identifying what is really a relevant combination of options, and at what price level for the new intervention can we work under specifi c constraints. But let’s make it clear from start. Optimisation modelling isn’t the unique solution we were all waiting for that suddenly solves all our problems in the economic assessment of new medical interventions to be introduced in the health care market. Using this technique it will lead to new problems and new challenges to tackle. But the approach helps indicate directions where solutions seem to be better accepted than with ICUA and it helps thinking in a frame of working under specifi c constraints.
Because the big challenge of today for any health care program to be developed whether it is in the developed or in the developing world, is Money, Finance. How to make the health care program progressing and sustainable for the future? One cannot deliver good health care if there is no right price defi ned by which everyone can get access who needs medical support of good quality and that motivate the workers in the system to stay tuned and focussed on their tasks. In addition it must have the incentive for good research by which continuously additional health gain can be achieved. Sometimes the health gain should preferentially to be measured, sustained, and developed at the population level as we are trying to argue here for prevention of infectious diseases through vaccination. But sometimes the health gain can only be achieved and measured at the individual, patient level.
A good health care development program has the right balance between both types of medical interventions. It is not always easy to fi nd that perfect equilibrium because in some environments the approach of the population level through public health with vaccination has been neglected and been overwhelmed by treatment and cure. Sometimes the opposite has been seen that too much public health is promoted where the treatment approach could have done a more effi cient job. This is for me a next big challenge to explore: identifying the world of ideal combination between prevention and treatment for diff erent groups (age, sex, social, and environment) within an attractive budget equilibrium sustained by a good fi nancial support and depending of the health care development status.

Chapter 6
217
6.3 FINAL CHALLENGESFinally, there is one other area of interest, I would like to further explore. To disentangle the cost-eff ectiveness analysis we are doing now into more valuable pieces of better information. I like to express the following refl ection regarding CEA that needs further exploration in depth. A big weakness of ICEA is the way we are using it now. We are blind in trying to achieve incremental health gain with any new intervention we want to bring on the market. If we achieve that goal, we expect to get a price premium for the new intervention that as an end-result will increase the total cost side of the health care budget as long as the ratio of the cost-diff erence divided by the eff ect diff erence is below a certain threshold. What we assume in our way of applying the cost-eff ectiveness threshold is that the QALY-gain occurs independently from the cost-diff erence, which is not always the case. As a matter of fact we often do at double counting. We reduce the cost-side for hospitalisation reduction and improve the QALY side by not going to the hospital. We can skip one of both if we know that the cost we pay in the medical sector for any intervention we have avoided, perfectly refl ects the QALY improvement the new intervention generates. But we know that the prices we are paying are not real market prices and the QALY changes we obtain are an approximation of the value we gain. As an end-result both sides are biased. However working in a cost contained environment we should try to focus the analysis on cost-reduction and cost-off set and less on QALY-gain if that gain is marginal. We should try to identify a threshold when the QALY-gain is anymore marginal or result in a sensitive improvement.
What could be an interesting domain to explore in CEA is to include the level of cost-off set as a barrier to allow an increase in price-setting independent of the QALY-gained. That seems counter-intuitive but we shouldn’t try to deliver a health care program that focus on cost increase how acceptable it is, rather than on a cost-containment strategy. The cost-increase should be allowed for those situations that cause a QALY-gain but with limited cost-off set in order to stimulate a reasonable price setting for any new intervention and research initiative that generates better quality health.
Related to that we should further investigate the statement about why vaccines are considered to be cheap. That question has been raised to me many times. By looking at the problem more in depth it helped to explore two additional features about the use of vaccines today. One is the current investment in vaccination as part of the total health care budget in a high income country. That amount is surprisingly very low: around 0.03% in the UK and the same can be found for France and other European countries using the EOCD data-base analysis. The other is that we observe that in the latter type of countries an expansion of preventative activities against diseases other than the infectious ones occurs these days such as the use of statins against cardio-vascular diseases. What we should try to analyse and to compare are data per prevention technique (vaccine versus drugs) and per broad disease area (infectious diseases versus cardio-vascular diseases) in a country like the UK for which there is a suffi cient number of relevant data available. We should explore the investment rate, the benefi t, the cost-eff ectiveness, and the budget impact analysis per disease area and per intervention type. We may discover two
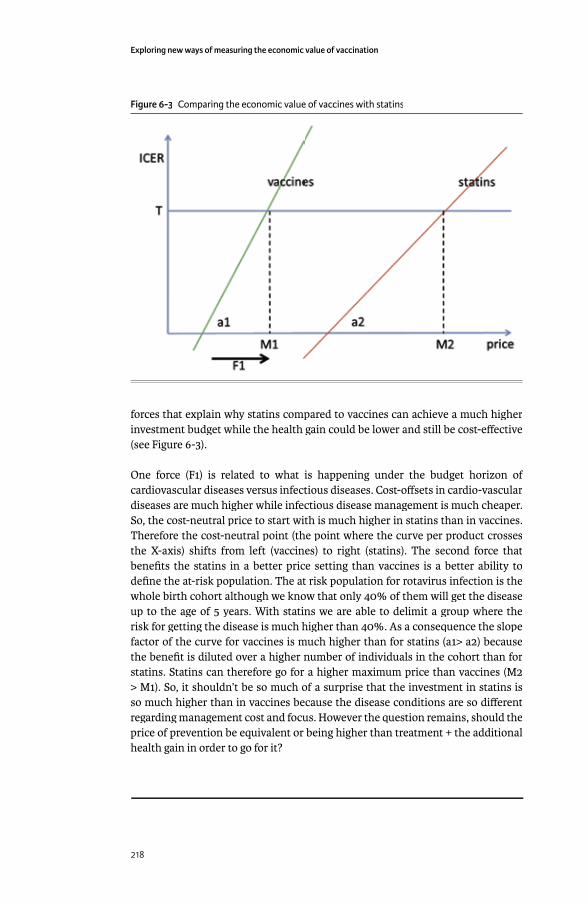
Exploring new ways of measuring the economic value of vaccination
218
forces that explain why statins compared to vaccines can achieve a much higher investment budget while the health gain could be lower and still be cost-eff ective (see Figure 6-3).
One force (F1) is related to what is happening under the budget horizon of cardiovascular diseases versus infectious diseases. Cost-off sets in cardio-vascular diseases are much higher while infectious disease management is much cheaper. So, the cost-neutral price to start with is much higher in statins than in vaccines. Therefore the cost-neutral point (the point where the curve per product crosses the X-axis) shifts from left (vaccines) to right (statins). The second force that benefi ts the statins in a better price setting than vaccines is a better ability to defi ne the at-risk population. The at risk population for rotavirus infection is the whole birth cohort although we know that only 40% of them will get the disease up to the age of 5 years. With statins we are able to delimit a group where the risk for getting the disease is much higher than 40%. As a consequence the slope factor of the curve for vaccines is much higher than for statins (a1> a2) because the benefi t is diluted over a higher number of individuals in the cohort than for statins. Statins can therefore go for a higher maximum price than vaccines (M2 > M1). So, it shouldn’t be so much of a surprise that the investment in statins is so much higher than in vaccines because the disease conditions are so diff erent regarding management cost and focus. However the question remains, should the price of prevention be equivalent or being higher than treatment + the additional health gain in order to go for it?
Figure 6-3 Comparing the economic value of vaccines with statins
219
RECOMMENDATIONS
We are living in an environment that globally becomes more complex. Under such circumstances we cannot expect that we should always be able to apply a uniformed solution to a same problem manifesting diff erently under diff erent circumstances. If we choose for that one option solution, there is a high risk for making mistakes in obtaining the right implementation of the vaccine because of not being economically attractive. We need to remain cautious and take into account the diversity of the environments to analyse and to present economic results adjusted to the local contexts.
What I have tried to demonstrate in this thesis is that fi rst a vaccine has intrinsically a moving benefi t target to be achieved over its life cycle that will impact its economic value assessment at two levels: the individual and the group level. An attractive economic result will therefore be depended where and when the assessment is performed. This is typical for any active prevention program that is initiated when a problem is substantial. From reducing the burden where the economic value of the new intervention will be high to controlling the outbreaks where the economic game of using the intervention is then diff erent and may be more depended on the risk assessment. We often forget about that change in focus linked to the benefi t vaccines can achieve over time. When we introduce a new vaccine in a community, it is not only about reducing specifi c mortality –the vaccine can achieve that sometimes very easily and very quickly-, but the vaccine is mainly brought in because it has the ability to control the disease spread towards a critical helping hand in the process of elimination or even eradicating specifi c disorders. But the economic value and the assessment tool to be used will be diff erent by focus type.
Second is that the vaccines we are working with today are used towards the prevention of infectious or communicable diseases. This has implications for the assessment of the benefi t that doesn’t remain at the level of the individual as we see it for treatment, but at the level of a population or a group. We know that when we introduce a vaccine in a community it will be very diffi cult to reach a full coverage. Because of that we will obtain an indirect benefi t by the vaccine, called the herd eff ect. We need to be sure that we capture well that extra hidden benefi t in our economic assessment. But there are other important additional hidden benefi ts that are economically critical for the value assessment of the vaccine: reduction in productivity loss and improvement in quality of care. Maybe other benefi ts could be discovered as well, we haven’t thought about.
Third is that to be most successful vaccines need to obtain a high coverage. Therefore the logistics must be there to facilitate the access. If the disease burden is huge -and that should be the case anyway otherwise one shouldn’t introduce a new vaccine universally- and the vaccine coverage is high at uptake, it must create an imbalance into the established health care system. In those environments where the health care programs are maturely developed, vaccines will be a ‘substitute’ for substitute’ for substitute’
7
Exploring new ways of measuring the economic value of vaccination
220
the existing situation. The vaccine must then show high added value. We often miss to demonstrate the full picture at launch for obvious reasons. The economic assessment tool can be ICUA, but the shift should now be more in favour of CBA. With vaccines the initial investment is large, the assessment should be at the population level preferentially, and all the societal benefi ts need to be accounted for and not using a silo approach. A much diff erent approach is suggested in an environment where the health care program is not so well developed. In those circumstances the vaccine will be an ‘add on’ project and not a substitute. In an add on’ project and not a substitute. In an add on’‘add on’ environment the driving force is about budget allocation and prioritizing. ‘add on’ environment the driving force is about budget allocation and prioritizing. ‘add on’The new economic tool to be used then is about optimising the resource use and being most effi cient.
Many challenges remain ahead for bringing those new messages across. But that is part of the game of performing the appropriate economic evaluation of vaccines depending of the environment where we are living in.
REFERENCES [1] Postma MJ, Standaert BA. Economics of vaccines revisited. Hum Vaccin
Immunother 2013 May;9(5):1139-41.[2] Parashar UD, Gibson CJ, Bresse JS, Glass RI. Rotavirus and severe childhood
diarrhea. Emerg Infect Dis 2006 Feb;12(2):304-6.[3] Ehreth J. The global value of vaccination. Vaccine 2003 Jan 30;21(7-8):596-600.[4] Van DP, Beutels P. Economic evaluation of vaccination. Pharmacoeconomics
1996;9 Suppl 3:8-15.[5] Mauskopf J, Talbird S, Standaert B. Categorization of methods used in cost-
eff ectiveness analyses of vaccination programs based on outcomes from dynamic transmission models. Expert Rev Pharmacoecon Outcomes Res 2012 Jun;12(3):357-71.
[6] Madsen LB, Ustrup M, Fischer TK, Bygbjerg IC, Konradsen F. Reduced price on rotavirus vaccines: enough to facilitate access where most needed? Bull World Health Organ 2012 Jul 1;90(7):554-6.
[7] de Brabandere L, Iny A. Thinking in new boxes. 1st ed. New York: Random House International Edition (edn); 2013.
[8] Sarker R, Newton C. Optimization Modelling: a practical approach. 1st ed. Taylor & Francis Group: LLC edN. CRC Press.; 2008.
[9] Standaert B, Harlin O, Desselberger U. The Financial Burden of Rotavirus Disease in Four Countries of the European Union. Pediatric Infectious Disease Journal Rotavirus 2008 Jan;217:S20-S27.
[10] Martin A, Cottrell S, Standaert B. Estimating utility scores in young children with acute rotavirus gastroenteritis in the UK. Journal of Medical Economics 2008;11(3):471-84.
[11] Melliez H, Boelle PY, Baron S, Mouton Y, Yazdanpanah Y. [Morbidity and cost of rotavirus infections in France]. Med Mal Infect 2005 Oct;35(10):492-9.
[12] Melliez H, Levybruhl D, Boelle PY, Dervaux B, Baron S, Yazdanpanah Y. Cost and cost-eff ectiveness of childhood vaccination against rotavirus in France. Vaccine 2008 Jan 30;26(5):706-15.
Chapter 7
221
[13] Standaert B, Parez N, Tehard B, Colin X, Detournay B. Cost-eff ectiveness analysis of vaccination against rotavirus with RIX4414 in France. Appl Health Econ Health Policy 2009;6(4):199-216.
[14] Goossens LMA, Standaert B, Hartwig N, Hovels AM, Al MJ. The cost-utility of rotavirus vaccination with Rotarix(TM) (RIX4414) in the Netherlands. Vaccine 2008 Feb 20;26(8):1118-27.
[15] Martin A, Batty A, Roberts JA, Standaert B. Cost-eff ectiveness of infant vaccination with RIX4414 (Rotarix) in the UK. Vaccine 2009 Jul 16;27(33):4520-8.
[16] Postma MJ, Jit M, Rozenbaum MH, Standaert B, Tu HA, Hutubessy RC. Comparative review of three cost-eff ectiveness models for rotavirus vaccines in national immunization programs; a generic approach applied to various regions in the world. BMC Med 2011;9:84.
[17] Knoll S, Mair C, Benter U, Vouk K, Standaert B. Will vaccination against rotavirus infection with RIX4414 be cost-saving in Germany? Health Econ Rev 2013;3(1):27.
[18] Pitzer VE, Atkins KE, de Blasio BF, Van ET, Atchison CJ, Harris JP, et al. Direct and indirect eff ects of rotavirus vaccination: comparing predictions from transmission dynamic models. PLoS One 2012;7(8):e42320.
[19] Atkins KE, Shim E, Pitzer VE, Galvani AP. Impact of rotavirus vaccination on epidemiological dynamics in England and Wales. Vaccine 2012 Jan 11;30(3):552-64.
[20] Atkins KE, Shim E, Carroll S, Quilici S, Galvani AP. The cost-eff ectiveness of pentavalent rotavirus vaccination in England and Wales 1. Vaccine 2012 Nov 6;30(48):6766-76.
[21] Atchison C, Lopman B, Edmunds W. Modelling the seasonality of rotavirus disease and the impact of vaccination in England and Wales. Vaccine 2010 Mar 1;28:3118-26.
[22] Bakir M, Standaert B, Turel O, Bilge ZE, Postma M. Estimating and comparing the clinical and economic impact of paediatric rotavirus vaccination in Turkey using a simple versus an advanced model. Vaccine 2013 Jan 30;31(6):979-86.
[23] Raes M, Strens D, Vergison A, Verghote M, Standaert B. Reduction in pediatric rotavirus-related hospitalizations after universal rotavirus vaccination in Belgium. Pediatr Infect Dis J 2011 Jul;30(7):e120-e125.
[24] Standaert B, Gomez JA, Raes M, Debrus S, Velazquez FR, Postma MJ. Impact of rotavirus vaccination on hospitalisations in Belgium: comparing model predictions with observed data. PLoS One 2013;8(1):e53864.
[25] Rheingans RD, Antil LR, Dreibelbis R, Podewils LJ, Bressee JS, Parashar UD. Economic costs of rotavirus gastroenteritis and cost-eff ectiveness of vaccination in developing countries. Journal of Infectious Diseases 2009;200:S16-S27.
[26] Standaert B, Ethgen O, Emerson R, Postma M, Mauskopf J. Comparing cost-eff ectiveness results for a vaccine across diff erent countries worldwide: what can we learn? 1. Adv Ther 2014 Oct;31(10):1095-108.

Exploring new ways of measuring the economic value of vaccination
222
[27] Demarteau N, Breuer T, Standaert B. Selecting a mix of prevention strategies against cervical cancer for maximum effi ciency with an optimization program. Pharmacoeconomics 2012 Apr;30(4):337-53.
[28] Standaert B, Curran D, Postma J. Budget constraint and vaccine dosing: a methematical modelling exercise. Cost Eff ectiveness and Resource Allocation 2014;12(1):3.
[29] Connolly MP, Topachevskyi O, Standaert B, Ortega O, Postma MJ. The impact of rotavirus vaccination on discounted net tax revenue in Egypt. Pharmacoeconomics 2012;30(8):681-95.
[30] Kotsopoulos N, Connolly MP, Postma MJ, Hutubessy RC. Fiscal consequences of changes in morbidity and mortality attributed to rotavirus immunisation. Vaccine 2013 Nov 4;31(46):5430-4.
[31] Vesikari T, Karvonen A, Prymula R, Schuster V, Tejedor JC, Cohen R, et al. Effi cacy of human rotavirus vaccine against rotavirus gastroenteritis during the fi rst 2 years of life in European infants: randomised, double-blind controlled study. Lancet 2007;370(9601):1757-63.
[32] Velazquez FR, Matson DO, Calva JJ, Guerrero L, Morrow AL, Carter-Campbell S, et al. Rotavirus infections in infants as protection against subsequent infections 2. N Engl J Med 1996 Oct 3;335(14):1022-8.
[33] Ford-Jones EL, Wang E, Petric M, Corey P, Moineddin R, Fearon M. Rotavirus-associated diarrhea in outpatient settings and child care centers. The Greater Toronto Area/Peel Region PRESI Study Group. Pediatric Rotavirus Epidemiology Study for Immunization 1. Arch Pediatr Adolesc Med 2000 Jun;154(6):586-93.
[34] Rogoza RM, Ferko N, Bentley J, Meijer CJ, Berkhof J, Wang KL, et al. Optimization of primary and secondary cervical cancer prevention strategies in an era of cervical cancer vaccination: a multi-regional health economic analysis 2. Vaccine 2008 Sep 15;26 Suppl 5:F46-F58.
[35] Clements BJ, Coady D, Gupta S. Economics of Public Health Care Reform in Advanced and Emerging Economies. 1st edition ed. International Monetary Fund,Publication Services; 2012.

223
SAMENVATTING
De gezondheids-economische analyse van nieuwe vaccins die actieve preventie van specifi eke infectieziekten bewerkstelligen, gebeurt vandaag op basis van wat normaal wordt toepast in de therapeutische wereld, de techniek van toegevoegde kosteneff ectiviteits waarde. De techniek werd afgeleid van kosten-baten analyse waarbij de klinische baten worden uitgedrukt in natuurlijke eenheden in plaats van geld. Een kopie-plak functie werd toegepast en men dacht oorspronkelijk dat men goed zat omdat de eerste resultaten aantoonden dat de eerste vaccins bijzonder kosteneff ectief waren voor de gezondheidszorg. Nochtans de thesis die ik hier verdedig, is dat deze techniek niet optimaal is voor het aantonen van de volledige economische waarde van nieuwe vaccins. Het complete eff ect van een vaccin moet worden bestudeerd op het niveau van een bevolking en niet op het individueel vlak zoals de kosteneff ectiviteits analyse dit normaal vereist. De resultaten van een economische analyse op een bevolkingsniveau zijn verschillend van dit op een individueel niveau omdat de baten anders liggen. Daarenboven is de techniek van kosteneff ectiviteit ook minder waardevol in die landen met lage inkomens waar de meeste infectieziekten veelvuldig voorkomen en waar die techniek faalt om een juiste waardengrens te bepalen. Daarom moeten er andere evaluatietechnieken worden gebruikt en worden gepromoot opdat de economische analyses van vaccins vollediger en accurater worden.
Alvorens deze alternatieven uit de doeken te doen, is het belangrijk dat medische preventie wordt verduidelijkt zoals het vandaag wordt toegepast in onze gezondheidszorg. De evidentie toont aan dat vaccinatie een gezondheidsdoel heeft dat verandert met de tijd. Nieuwe vaccinaties worden eerst ingevoerd om een aantoonbaar ziekteprobleem te drukken of te beperken. Nadien volgt de controle van de ziektespreiding, om mogelijks te eindigen als een bijzondere hulp voor eliminatie en/of uitroeiing van een specifi eke ziekte. De economische waarde van een vaccin zal daarom afhangen van het doel wanneer het wordt ingevoerd in een gemeenschap. De waarde zal anders liggen wanneer het ziekteprobleem endemisch is dan wanneer het vaccin wordt gebruikt om epidemische aanvallen te controleren.
Een ander belangrijk punt dat moet worden bekeken wanneer men de invoering van een nieuw vaccin overweegt is in welk gezondheidszorgsysteem men belandt waar het vaccin wordt voorgesteld. In een wel-uitgerust gezondheidszorgsysteem, zal een nieuw vaccin worden aanzien als een vervanging voor de bestaande behandeling. Als dusdanig moeten alle waarden van het vaccin aantoonbaar worden gemaakt zodra het op de markt komt omdat de competitie met de bestaande faciliteiten groot zal zijn. Zich beperken tot het aantonen van het behalen van meer kwaliteitsvolle levensjaren met het vaccin blijkt onvoldoende te zijn om overtuigend de meerwaarde aan te tonen. In tegendeel om vaccins succesvol op de markt te brengen moeten ook de verborgen waarden worden ontdekt en worden gerapporteerd. Dit is belangrijk voor de ontwikkelde landen. Het probleem ligt volledig anders in ontwikkelingslanden omdat daar de gezondheidszorg nog in volle ontplooiing is.

Exploring new ways of measuring the economic value of vaccination
224
Onder die omstandigheden is het invoeren van een nieuw vaccin geen project rond vervanging van een bestaande behandelingszorg die vermoedelijk ontoereikend is, maar een project dat moet worden toegevoegd aan het bestaande zorgarsenaal. In een toevoegingscenario is de essentiële economische vraag niet of de prijs voor de meerwaarde van het vaccin aanvaardbaar is voor de gemeenschap, maar wat zijn de prioriteiten van het gezondheidszorgprogramma, gegeven het budget dat beschikbaar is. Technieken om prioriteitenstelling vast te leggen is meer essentieel en hulpvaardig onder die omstandigheden.
Al deze verschillende aspecten werden onderzocht, maar de thesis begint met de conventionele benadering van het gebruik van een kosteneff ectiviteitsanalyse voor rotavirus vaccinatie in ontwikkelde landen. De aanpak die werd gevolgd was eerst het onderzoeken van het totale fi nanciële plaatje van de ziekte in 4 Europese landen (Verenigd Koninkrijk, Frankrijk, Nederland, en België). Dan werd de impact van de ziekte onderzocht op de levenskwaliteit in functie van ernst en leeftijd. Uiteindelijk werd een Markov cohort model gebouwd met de gegevens van de voorgaande studies dat een kosten-eff ectiviteitsresultaat leverde voor het vaccin in Frankrijk. Er werd ook een meer eenvoudig model gebouwd met minder gegevens, maar de resultaten met het meer uitgewerkte Markov model waren best vergelijkbaar; althans als we de analyse voor Turkije vergelijken. Zeer interessant was dat de modelgegevens werden vergeleken met impactstudies die in België werden opgezet omdat dit land een van de eerste was in Europa die het vaccin opnam in zijn kindervaccinatieproject en een zeer hoge graad van vaccingebruik aantoonde (>85% eerste jaar). Met die vergelijking konden nieuwe facetten van de ziekte en de werking van het vaccin beter worden begrepen die onvoldoende waren gekend voordat het vaccin op de markt kwam. Eén is dat de indirecte protectie van het vaccin zich ook voordeed in de leeftijdsgroep jonger dan de kinderen die werden gevaccineerd. Een ander merkwaardig feit is het belang van de natuurlijke immuniteit die zich manifesteert met de tijd naarmate de controle groep nieuwe infecties opdeed. Dit proces leidt normaal tot een minder eff ect van het vaccin naarmate de tijd vordert. Men spreekt dan over een krachtverlies van het vaccin, maar dit is te wijten aan de manier waarop die kracht wordt gemeten en niet aan een reële of absolute krachtdaling van het vaccin. De potentie van het vaccin blijft dezelfde en er is geen nood om op latere leeftijd opnieuw te vaccineren omdat zogezegd het eff ect van het vaccin wegkwijnt met de tijd. Uiteindelijk heeft men ook kunnen aantonen dat er verschillende oorsprongen zijn van infectie bij de kinderen. Eén is gelegen bij de kinderen zelf. Zij infecteren iedereen in hun onmiddellijke omgeving en die infectiemethode wordt uitstekend onder controle gehouden met het nieuwe vaccin. Maar de tweede oorsprong ontstaat buiten de kindergroep, en kunnen ouders of mogelijks andere zorgverstrekkers zijn die niet onder de controle staan van het vaccin. Deze tweede oorsprong veroorzaakt dus een latente restinfectie bij de kinderen als er niet optimaal wordt gevaccineerd. Dit wordt best aangetoond wanneer men een onderzoek doet naar de vergelijking tussen een jaarlijkse evaluatie versus een cohort evaluatie. Uiteindelijk zal eliminatie van de ziekte dus moeilijk worden indien men niet streeft naar optimale vaccinatiegraad van de kinderen. Ook hangt veel af van de manier hoe voor de kinderen wordt gezorgd door de families. Worden ze snel en

225
Samenva� ing
massaal naar kinderkribbes gestuurd. Dit heeft gevolgen voor de berekening van de economische waarde van het vaccin, maar er is meer.
Twee nieuwe kwaliteiten over de waarde van het vaccin in ontwikkelde landen werden ontdekt. Eén gaat over de toename in zorgkwaliteit in ziekenhuizen van zodra het vaccin werd geïntroduceerd. Met name wordt met de introductie van het vaccin de patiënten toeloop naar het ziekenhuis beter geregeld in periodes dat er veel kinderopnames gebeuren tijdens de winter. Als gevolg daarvan is er minder chaos en een beter overzicht van wat moet gebeuren en verbetert dit zowel het management van bedden in het ziekenhuis als het management van het personeel. Dit konden we vastleggen met het berekenen en meten van een kwaliteit zorgscore over een periode van 7 jaar (3 jaar voor vaccinatie en 4 jaar nadien). Een ander interessant feit dat werd aangetoond voor de eerste keer is de impact van het vaccin op een dalend werkverlet gemeten bij werkende moeders met een eerste kind. Dit werd getoond met reële gegevens uit de administratie van de stad Antwerpen. We hadden dit eerst met een eenvoudig model berekend over hoe groot de mogelijke winst kon zijn en hebben deze winst ook opgemeten in de database van de stad. Het was indrukwekkend hoe goed beide (model en observatie) gegevens overeenkwamen.
Voor de ontwikkelingslanden werden andere exploraties gedaan. Eén was het gebruik van een optimalisatiemodel om aan te tonen dat optimale baten gemakkelijker worden bereikt met een twee-dosis vaccin in plaats van een drie-dosis vaccin onder een beperkt budget en dit wanneer de prijs van het vaccin verandert, het eff ect van het vaccin, en de vaccinatiegraad. De evaluatie van deze situatie zou beslissingsnemers moeten overtuigen dat onder optimalisatie condities, niet meer dosissen per persoon een eindpunt moeten zijn, maar het bereiken van een specifi ek gezondheidsdoel onder beperkt budget dat helpt het aantal dosissen per persoon te bepalen. Een ander project was te kijken wie in ontwikkelingslanden ook belangstelling heeft voor vaccinatie behalve het Ministerie van Volksgezondheid en wat voor informatie die andere personen wensen te hebben om te worden overtuigd. Blijkt dat regeringen in het algemeen belangstelling hebben als dit kan helpen de belastinginkomsten te verbeteren. Dit is het startsein geworden om een investeringsmodel met belastingvoordeel uit te werken door de introductie van het vaccin en dit toe te passen voor landen zoals Egypte als pilootproject. Maar andere landen staan nu ook op het lijstje om deze techniek toe te passen.
Uiteindelijk worden nog andere, nieuwe voorstellen gemaakt in deze scriptie die moeten worden uitgewerkt in nieuwe programma’s tijdens de komende jaren zoals het in balans brengen zowel budgettair als klinisch in het investeren in extra bedden versus extra vaccinatie. Dit soort balans analyse zou verder de betere positionering van vaccins in die landen bewerkstelligen aangezien vandaag geen duidelijke visie bestaat over wat de reële opportuniteitskost is voor ziektebehandeling in ontwikkelingslanden en dat het gebruik van grenswaarden voor de terugbetaling van nieuwe producten in die landen onvoldoende is uitgewerkt.

Exploring new ways of measuring the economic value of vaccination
226
In conclusie kan men vaststellen dat er nog veel valt te onderzoeken om de volledige, economische waarde van nieuwe vaccins te bepalen. Het onderzoek is niet gemakkelijk omdat we moeten kijken naar toestanden die we normaal niet systematisch evalueren. Nochtans is het belangrijk deze andere facetten te doorgronden omdat dan voor iedereen kan worden aangetoond waarom vaccins zo’n gezonde investering blijken te zijn.

227
ACKNOWLEDGEMENTS
Those who know me well shouldn’t be surprised that at the end I tumbled into the world of vaccines and vaccination because of my fascination for cows and for the diff erent types that exist and graze across the world. Visiting a new country I will immediately investigate two things: identifying the local type of cow if there is one around and fi nding a museum of local modern art. There is no link between both, but it identifi es 2 of my 3 passions. The third one I will reveal at the end of this acknowledgement.
Meanwhile the link between vaccines and cows seems obvious. What is less clear is the ensuing development that I should jump on economics of vaccines and ending writing a doctoral thesis on the subject. Two facts have helped me moving towards that direction at a more mature age. First and foremost were the regular contacts at congresses and the many exchanges of emails and information with a gentle and a very patient academician, working in the north of Holland, who was utterly convinced that I should and could do it. I would like to thank wholeheartedly my promotor, Prof Dr MJ Postma for pushing me over the edge to get where I stand now with a doctoral thesis. Without his help and commitment, I would have been unable to fi nish this work. It is very gracious of him that he embarked in this adventure with me. We made it and I really enjoyed the whole process of elaborating and fi nishing this research. With professor Postma and with my co-promotor, Prof Dr O Ethgen about whom I was so glad to get him on board as well, I was able to pursue this work during a 3 year period. The support of Olivier at the end was extremely precious. His way of giving advice was so tactful and ‘aimable’, typically ‘à la française’. A great thank you to both of you.
My appreciation about this entire eff ort is that it is absolutely worth doing it, for me personally as well as for my direct environment I’m working with. It helps so much to scrutinize on the one hand and to synthesize on the other the many ideas we all have in our heads bringing it back to a clear and simple reasoning that allow moving to new evidence. I would recommend this eff ort to everyone who has the possibility/opportunity to do it. Age shouldn’t be a limiting factor. It rather is an asset as time gives the chance to get a better and deeper grip on the subject and helps selecting the priority in the work to be done. And that was the second factor that motivated me for defending a thesis. There were/are new facts and fi gures to communicate about the health economics of vaccines that should attract the attention of a broad audience so that the product has now a better position about its right economic value which we didn’t discover so well yet. I consider this thesis as a helping tool in a process towards the right economic assessment of vaccines, where still much needs to be done to capture it fully.
This brings me to the second part of my acknowledgement. I have been blessed during my early career to be directed and to receive support by deeply inspiring fi gures and tutors such as Prof Dr W Eylenbosh (†), Prof Dr L Denis, Prof Dr M Lechat (†), Prof Dr P Boyle, Prof Dr P Piot, Dr V Nelen amongst many others. They
Exploring new ways of measuring the economic value of vaccination
228
gave me the right introduction into the world of epidemiology in Belgium, Europe, Africa (Burundi), and Latin America (Suriname). But then suddenly came the switch from epidemiology to economics and another unique group of persons pushed me forward into that new fi eld and into the world of vaccines such as Dr K Torfs, Dr A Alwan, Dr H Erder, and now Prof Dr M Toumi, Prof Dr M. Raes, Dr M Connolly and last but not least Dr J Mauskopf. I am sure that I’m missing many more names on that list and I hope that those not mentioned here will forgive me. Such a list can never be comprehensive but many have helped and inspired me in the work I’m doing now and I would like to express my greatest gratitude for all the support, I received.
Finally there are two groups of people always very close to my heart that may remain so for ever. First, there is that unique team of health economists at GSK Vaccines, with its large network of external experts, with whom I debated a lot during the many meetings we have had over the past 10 years. As a person in charge of leading the department it was easy to organise meetings –not mandatory- but the debate I had with you all was always lively, straight, clear, fresh, challenging, and so helpful for my thinking. Thank you so much to all the Nadias (3), Gen, Rachel, Meghann, Emmanuelle, Katsia, Xiao, Emma, Sharon, Carole, Carla, Danielle, Ilse, Laure-Anne, but also Christophe, Des, Nicolas, Jorge, Rodrigo, Jean-Etienne, Lijoy, Augustin, Stephan, Oscar for creating such a stimulating environment. Three more persons remain to be mentioned here, and they are special. Georges, he has been my ‘compagnon de route’ for more than 15 years now in the world of health economics. I could always count on him whenever and wherever I am/was with very memorable events in Scotland, in Lyon, le Concorde, or in the open offi ce now at GSK. It is always so nice that when meeting people again after a long period, they always gently and spontaneously ask me about Georges. The work he did and how he did it impressed many. The next person I like to thank here is Nathalie. She is the one who always helps whenever the day moves to a next disaster. Her smile, good temper, and unique network always helped the bad mood on Monday morning and she knows me better for that than myself. It is so good to know that this team is like a second family to me. If I still do the job I’m doing today it is because of you: you have always been so nice to me, so responsive, so helpful. Thank you so much for all that great support. The last person to mention in that GSK list is my current boss, Thomas Breuer, who remained curious but much enthusiastic about all the work we initiated in our health economic group. In big organisations like GSK it is critical to have leaders in place in which one can trust and discuss openly. Thomas is such a person. Many thanks for your great support.
The last group to mention is the one I missed most when I’m travelling on Friday evening and I cannot attend our known rendez-vous in the restaurant ‘Den Uil’, my family, my wife and our two boys, Bruno and Eric. These gatherings are so precious to me and to Carole as well. The debates, the jokes, the fun, but sometimes the ‘tristesse’ or the simple presence of being together, the one family event, is such a stimulating force for me and Carole at the end of tiresome weeks. I hope I didn’t cause too many headaches with my focus on cows, paintings, caulifl owers, drone stories, wishes to help changing the world, and ways to see too much the universe

229
Acknowledgements
through health economic glasses with models. But I thought it is good to know that your father is passionate about his work. His work was and is his greatest hobby. But the last who deserves most attention of gratitude here is my wife, Carole. This year we will offi cially be 30 years together, 30 years of great adventure, 30 years of great support in all what I’m doing, and the blessing of being there when I needed it most. Many thanks for all that free giving that we enjoy so much together most during our bird watching walks, my third passion she generously introduced it to me, more than 30 years ago. I was then discovering that a duck is not a duck, but can be a Shelduck, a Mallard, a Teal, a Gadwall, a Wigeon, a Pintail, a Shoveler, a Pochard, and many more beautiful species with impossible names to remember in diff erent languages. To all of you a ‘very big’ thank you that you gave me the chance to develop and fi nish this thesis.
230
CURRICULUM VITAE
Baudouin ACGM Standaert (1955) was born in Bruges, Belgium. He fi rst studied medicine (MD) at the KU Leuven, Belgium, and fi nished the special course in Tropical Medicine at the Instituut voor Tropische Geneeskunde (ITG) in Antwerp, Belgium, in 1982. After his medical degree he immediately went abroad to Suriname with a 1-year scholarship studying the epidemiology of schistosomiasis and the evaluation of road accidents in the city of Paramaribo under the guidance of Prof Dr BJF Oostburg. After that year he came back to join the department of Social Medicine and Epidemiology at the University of Antwerp (UIA), under the supervision of Prof Dr W Eylenbosch. He started there the research on prostate cancer screening using the PSA-test and the ultrasonography of the prostate gland in collaboration with Prof Dr L Denis from the Vrije Universiteit Brussel (VUB). L Denis from the Vrije Universiteit Brussel (VUB). L DenisAfter 3 years he was selected to work in Burundi for initiating the evaluation of the AIDS problem for the AGCD, the Belgian Administration for Cooperation and Development, in an emergency program under the guidance of Prof Dr P Piot(ITG, Antwerp). After 2 years in Africa, he was off ered a position at the WHO in Geneva to work on cluster analysis of AIDS transmission through infected needles in developing countries. He came back in Belgium in 1987 in the department of Disaster Epidemiology of Prof Dr M Lechat at the Université Catholique de M Lechat at the Université Catholique de M LechatLouvain (UCL) in Brussels. The project initiated there was about identifying emergency medical support after cyclone impact in the Solomon Islands in the Pacifi c Ocean. The project was sponsored by the European Commission. After one year, the decision was taken to move to a next level of career development. He became the new director of the Provincial Institute of Hygiene (PIH) in Antwerp in 1988, working in close collaboration with the provincial deputy politically responsible for that Institute, J Geuens. The PIH has a long tradition in working on quality control of water and soil as well as on public health issues in the province. The Institute has around 160 employees split into a lab environment and fi eld work in collecting basic health and environmental information for the province. Many new projects were initiated during that period in developing the institute at the right level of regional, national, and international recognition through new collaborations with universities and other institutes in Belgium and in Europe including Prof Dr L Denis (prostate disease), Prof Dr L Denis (prostate disease), Prof Dr L Denis P Boyle (cancer P Boyle (cancer P Boyleprevention at the International Agency on Research of Cancer (IARC)), and Prof Dr M Lechat (registry of EUROCAT in the province of Antwerp), and Prof Dr M Lechat (registry of EUROCAT in the province of Antwerp), and Prof Dr M Lechat M Barch of the Provincial Institute of Liège (Healthy Cities). During that period B Barch of the Provincial Institute of Liège (Healthy Cities). During that period B BarchStandaert became the representative of Belgium in the scientifi c board of IARC in Lyon, France. After a few years the interest for economic evaluations in health care emerged with the collaboration of K Torfs from the University of Antwerp K Torfs from the University of Antwerp K Torfs(UFSIA). Health economics was at that time a new domain to explore with a clear necessity to value new medical products coming into the health care market. Because B Standaert was still working on prostate diseases pharmaceutical companies were interested in getting his expertise in house. A new critical decision had to be taken in 1995 to move to the industry and to stop working for the public health institute. He took that decision in May 1995 to join AMGEN to become
231
Curriculum Vitae
the fi rst health economist for that biotech company in Europe. Over the years a small health economic team was set up in Brussels with 8 people coordinating all the health economic activities in Europe for AMGEN but reporting directly to the health economic team in the US under the leadership of Dr H Erder. Then the decision was taken by upper management of AMGEN to move the European HE-program from Brussels to Zug in Switzerland in 2005 where the commercial head-quarters for the company in Europe were located. That was the reason for B Standaert to decide to move to another international group in Belgium and to start working on vaccines. In November 2005, B Standaert became the head of the global health economic group of vaccines in GSK Bio, Rixensart, Belgium. He started with a small team of 3 collaborators 9 years ago, fi rst working on the health economic assessment of Rotarix and Cervarix and then later on that of Synfl orix. The group of Health Economics (HE) counts today 18 people and the team works closely with the clinical and the commercial groups of GSK Vaccines worldwide. The overall HE program is supervised by Dr T Breuer, head of the Vaccine Value and Human Science program within Research and Development of GSK Vaccines. The HE-team has a wide experience in developing diff erent types of economic assessment tools going from the very simple back-of-the –envelope models to the more advanced dynamic and macro-economic models for pandemic infectious diseases such as malaria, TB, HIV, Flu. The health economic group also explores new economic evidence away from the conventional cost-eff ectiveness analysis such as optimisation modelling, return on investment, and macro-economic evaluations. Collaboration with many international groups and universities in Belgium and in the Netherlands, in particular the University of Groningen, has been set up to exchange ideas, study results and projects. B Standaert has numerous publications in the many diff erent fi elds he has worked on including prostate diseases, AIDS, cancer, infectious diseases, and public health. He was also during several years the representative of the industry for the working group on economic modelling of the WHO (QUIVERT/IVIR), Geneva, in Switzerland.
232
L IST OF PUBLICATIONS
1. Comparing Cost-Eff ectiveness Results for a Vaccine Across Diff erent Countries Worldwide: What Can We Learn? Baudouin Standaert, Olivier Ethgen, Rachel Emerson, Maarten Postma, Josephine Mauskopf Advances in Therapy. 10/2014, 1095-108
2. Public health impact of accelerated immunization against rotavirus infection among children aged less than 6 months in the United States. Derek Weycker, Mark Andrew Atwood, Baudouin Standaert, Girishanthy Krishnarajah Human vaccines & immunotherapeutics. 04/2014; 10(7).
3. Budget constraint and vaccine dosing: a mathematical modelling exercise. Baudouin A Standaert, Desmond Curran, Maarten J Postma. Cost Eff ectiveness and Resource Allocation 01/2014; 12(1):3. doi: 10.1186/1478-7547-12-3
4. Reassessing the value of vaccines. Till Bärnighausen, Seth Berkley, Zulfi qar A Bhutta, David M Bishai, Maureen M Black, David E Bloom, Dagna Constenla, Julia Driessen, John Edmunds, David Evans, [......], Bruce Y Lee, Sharmila Mhatre, Anne Mills, Anders Nordström, Sachiko Ozawa, Lisa Prosser, Karlee Silver, Christine Stabell Benn, Baudouin Standaert, Damian Walker. The Lancet Global Health. 01/2014; 2(5):e251–e252.
5. Economics of vaccines revisited. Maarten J Postma, Baudouin A Standaert Human vaccines & immunotherapeutics. 01/2013; 9(5).
6. Impact of rotavirus vaccination on hospitalisations in Belgium: comparing model predictions with observed data. Baudouin Standaert, Jorge A Gomez, Marc Raes, Serge Debrus, F Raúl Velázquez, Maarten J Postma. PLoS ONE 01/2013; 8(1):e53864.
7. Will vaccination against rotavirus infection with RIX4414 be cost-saving in Germany? Stefanie Knoll, Christoph Mair, Ursula Benter, Katja Vouk, Baudouin Standaert Health economics review. 01/2013; 3(1):27.
8. Estimating and comparing the clinical and economic impact of pediatric rotavirus vaccination in Turkey using a simple versus an advanced model. Mustafa Bakir, Baudouin Standaert, Ozden Turel, Ece Bilge, Maarten Postma. Vaccine 12/2012;
9. The impact of rotavirus vaccination on discounted net tax revenue in Egypt: a government perspective analysis. Mark P Connolly, Oleksandr Topachevskyi, Baudouin Standaert, Omayra Ortega, Maarten Postma. PharmacoEconomics 08/2012; 30(8):681-95.
10. Categorization of methods used in cost-eff ectiveness analyses of vaccination programs based on outcomes from dynamic transmission models. Josephine Mauskopf, Sandra Talbird, Baudouin Standaert Expert Review of Pharmacoeconomics & Outcomes Research 06/2012; 12(3):357-71.
11. Selecting a mix of prevention strategies against cervical cancer for maximum effi ciency with an optimization program. Nadia Demarteau, Thomas Breuer, Baudouin Standaert. PharmacoEconomics 04/2012; 30(4):337-53.
12. Population- versus cohort-based modelling approaches. Olivier Ethgen, Baudouin Standaert PharmacoEconomics 03/2012; 30(3):171-81.

233
L ist of publications
13. Rotavirus vaccine series completion and adherence to vaccination schedules among infants in managed care in the United States. Girishanthy Krishnarajah, Elizabeth J Davis, Ying Fan, Baudouin A Standaert, Ami R Buikema Vaccine 12/2011; 30(24):3717-22.
14. Public health impact of human papillomavirus vaccination on prevention of cervical cancer in France. Abdelkader El Hasnaoui, Nadia Demarteau, Denis Granados, Baudouin Standaert, Bruno Detournay International Journal of Public Health 06/2011; 57(1):149-58. ·
15. Cost-eff ectiveness of rotavirus vaccination in the Netherlands; the results of a consensus model. Mark H Rozenbaum, Marie-Josee J Mangen, Carlo Giaquinto, Jan C Wilschut, Eelko Hak, Maarten J Postma, CoRoVa-Group as following, Najy Alsayed, Maarten Boomsma, Rachel Emerson, [......], Nathalie Largeron, Marie-Josée J. Mangen, Jelle Mathijnssens, John J Roord, Hans C Rumke, Beaudouin Standaert, Sibilia Quilici, Timo Vesikari, Max Zeller, Bernhard A.M. van der Zeijst BMC Public Health 06/2011; 11:462.
16. Reduction in pediatric rotavirus-related hospitalizations after universal rotavirus vaccination in Belgium. Marc Raes, Danielle Strens, Anne Vergison, Marc Verghote, Baudouin Standaert The Pediatric Infectious Disease Journal 03/2011; 30(7):e120-5.
17. Comparative review of three cost-eff ectiveness models for rotavirus vaccines in national immunization programs; a generic approach applied to various regions in the world. Maarten J Postma, Mark Jit, Mark H Rozenbaum, Baudouin Standaert, Hong-Anh Tu, Raymond C W Hutubessy. BMC Medicine 01/2011; 9:84.
18. A generally applicable cost-eff ectiveness model for the evaluation of vaccines against cervical cancer. Nadia Demarteau, Bruno Detournay, Bertrand Tehard, Abdelkader El Hasnaoui, Baudouin Standaert International Journal of Public Health 11/2010; 56(2):153-62.
19. Modelling the eff ect of conjugate vaccines in pneumococcal disease: cohort or population models? Baudouin Standaert, Nadia Demarteau, Sandra Talbird, Josephine Mauskopf. Vaccine 11/2010; 28 Suppl 6:G30-8.
20. Modelling the economic value of cross- and sustained-protection in vaccines against cervical cancer. Nadia Demarteau, Baudouin Standaert. Journal of Medical Economics 01/2010; 13(2):324-38.
21. Cost-eff ectiveness analysis of a cervical cancer vaccine in fi ve Latin American countries. Lisandro Colantonio, Jorge A Gómez, Nadia Demarteau, Baudouin Standaert, Andrés Pichón-Rivière, Federico Augustovski Vaccine 08/2009; 27(40):5519-29.
22. Cost-eff ectiveness of infant vaccination with RIX4414 (Rotarix) in the UK. A Martin, A Batty, J A Roberts, B Standaert. Vaccine 06/2009; 27(33):4520-8.
23. Conclusion on cost-eff ectiveness of rotavirus vaccination highly dependent on assumptions. Lucas Goossens, Baudouin Standaert, Nico Hartwig, Anke M Hövels, Maiwenn J Al Vaccine 05/2009; 27(19):2531-2.

Exploring new ways of measuring the economic value of vaccination
234
24. Comparison of detailed and succinct cohort modelling approaches in a multi-regional evaluation of cervical cancer vaccination. Donna Debicki, Nicole Ferko, Nadia Demarteau, Steve Gallivan, Chris Bauch, Andrea Anonychuk, Lorenzo Mantovani, Stefano Capri, Cheng-Yang Chou, Baudouin Standaert, Lieven Annemans Vaccine 10/2008; 26 Suppl 5:F16-28.
25. Cost-eff ectiveness of vaccination against cervical cancer: a multi-regional analysis assessing the impact of vaccine characteristics and alternative vaccination scenarios. Eugenio Suárez, Jennifer S Smith, F Xavier Bosch, Pekka Nieminen, Chien-Jen Chen, Saku Torvinen, Nadia Demarteau, Baudouin Standaert Vaccine 10/2008; 26 Suppl 5:F29-45.
26. The cost-utility of rotavirus vaccination with Rotarix (RIX4414) in the Netherlands. Lucas M A Goossens, Baudouin Standaert, Nico Hartwig, Anke M Hövels, Maiwenn J Al Vaccine 03/2008; 26(8):1118-27.
27. Cost-eff ectiveness analysis of vaccination against rotavirus with RIX4414 in France. Baudouin Standaert, Nathalie Parez, Bertrand Tehard, Xavier Colin, Bruno Detournay Applied Health Economics and Health Policy 02/2008; 6(4):199-216.
28. Estimating utility scores in young children with acute rotavirus gastroenteritis in the UK. Alan Martin, Suzanne Cottrell, Baudouin Standaert Journal of Medical Economics. 2008,11: 471-484.
29. Resource use and cost analysis of managing abnormal Pap smears: a retrospective study in fi ve countries. B Rash, P Martin-Hirsch, A Schneider, M Sideri, J Tan, A Torné, B Standaert European journal of gynaecological oncology 01/2008; 29(3):225-32.
30. The Financial Burden of Rotavirus Disease in Four Countries of the European Union Baudouin Standaert, Olof Harlin, Ulrich Desselberger The Pediatric Infectious Disease Journal 12/2007; 27(1):S20-S27.
31. Management of women with abnormal cervical cytology: treatment patterns and associated costs in England and Wales. P Martin-Hirsch, B Rash, A Martin, B Standaert BJOG An International Journal of Obstetrics & Gynaecology 05/2007; 114(4):408-15.
32. Évaluation de l’impact en santé publique de la vaccination contre le HPV dans la prévention du cancer du col en France A. El Hasnaoui, B. Detournay, N. Demarteau, D. Granados, B. Standaert Revue D Epidemiologie Et De Sante Publique - REV EPIDEMIOL SANTE PUBL. 01/2007; 55(1).
33. Estimating resource use and cost of prophylactic management of neutropenia with fi lgrastim. L Annemans, N Van Overbeke, B Standaert, S Van Belle Journal of Nursing Management 06/2005; 13(3):265-74.
34. Economic analysis of fi lgrastim use for patients with acute myeloid leukaemia in the UK: a comparison of collection methods of resource use data. Standaert B, Goldstone J, Lu ZJ, Erder MH, Yin JL. Pharmacoeconomics. 2002;20(10):665-74.
35. [Necessary harmonization of health cost assessment. Autologous peripheral blood progenitor cell transplantation in France]. L Perrier, C Sebban, I Philip, B Standaert, M Morelle, J F Latour, P Biron, T Philip Revue d Épidémiologie et de Santé Publique 10/2002; 50(4):393-403.
235
L ist of publications
36. Summary measures and statistics in the analysis of quality of life data: an example from an EORTC-NCIC-SAKK locally advanced breast cancer study. D Curran, N Aaronson, B Standaert, G Molenberghs, P Therasse, A Ramirez, M Koopmanschap, H Erder, M Piccart European Journal of Cancer 06/2000; 36(7):834-44.
37. Filgrastim in the Treatment of Infected Diabetic Foot Ulcers: Retrospective Cost Analysis of a Phase II Randomised Clinical Trial Edmonds M, Gough A, Solovera J, Standaert B Clinical Drug Investigation 03/1999; 17(4):275-286.
38. PSA: wat betekent een getal? Wauters A, Neels H, Libeer JC, Hamers N, Demedts P, Standaert B, Denis L Tijdschrift Voor Geneeskunde. 01/1998; 54(6):403-407.
39. Prostate volume and cancer in screening programs. B Standaert, A Alwan, V Nelen, L Denis The Prostate 12/1997; 33(3):188-94.
40. The European Randomized Study of Screening for Prostate Cancer: an update. B Standaert, L Denis Cancer 12/1997; 80(9):1830-4.
41. Total healthcare budget: assigning priority and level of asset allocation to the diagnosis and management of urologic diseases. B Standaert. Urology 10/1995; 46(3 Suppl A):4-11.
42. Overall and meal-specifi c macronutrient intake in Belgian primary school children. De Henauw S, Wilms L, Mertens J, Standaert B, De Backer G. Ann Nutr Metab. 1997;41(2):89-97.
43. European randomized study of screening for prostate cancer. Progress report of Antwerp and Rotterdam pilot studies. F H Schröder, L J Denis, W Kirkels, H J de Koning, B Standaert
44. European School of Oncology Advisory report to the European Commission for the “Europe Against Cancer Programme” European Code Against Cancer P. Boyle, U. Veronesi, M. Tubiana, F.E. Alexander, F.Calais da Silva, L.J. Denis, J.M. Freire, M. Hakama, A. Hirsch, R. Kroes, [......], J.J. Pindborg, R. Saracci, C. Scully, B. Standaert, H. Storm, S. Blanco, R. Malbois, N. Bleehen, M. Dicato, S. Plesnicar European Journal of Cancer 02/1995;
45. Economics of BPH: measuring the intangible costs. B Standaert, K Torfs. Progress in clinical and biological research 02/1994; 386:409-18.
46. Geographic and temporal stability of HIV seroprevalence among pregnant women in Bujumbura, Burundi. D C Sokal, T Buzingo, N Nitunga, P Kadende, B Standaert AIDS 11/1993; 7(11):1481-4. ·
47. Screening for prostatic hyperplasia. B Standaert, V Nelen, K Torts, L Denis, E De Smedt The Lancet 12/1991; 338(8775):1155.
48. The association of tuberculosis and HIV infection in Burundi. B Standaert, F Niragira, P Kadende, P Piot AIDS Research and Human Retroviruses 05/1989; 5(2):247-51.
49. [Evaluation of the basic health care pilot project of the Turnhout area]. C Truyen, V Nelen, J Mertens, H De Vriendt, B Standaert Archives belges = Belgisch archief. 02/1989; 47(1-4):11-5.
50. Acquired immunodefi ciency syndrome and human immunodefi ciency virus infection in Bujumbura, Burundi. B Standaert, P Kocheleff , P Kadende, N Nitunga, T Guerna, R Laroche, P Piot Transactions of the Royal Society of Tropical Medicine and Hygiene 02/1988; 82(6):902-4.

Exploring new ways of measuring the economic value of vaccination
236
51. [AIDS and human immunodefi ciency virus infection in Africa]. P Piot, R Colebunders, M Laga, B Standaert, H Taelman, G Van der Groen Verhandelingen - Koninklijke Academie voor Geneeskunde van België 02/1988; 50(6):519-60.
52. [Tropical AIDS and tuberculosis. Apropos of a survey carried out in Bujumbura within the direct setting of HIV-seropositive and -seronegative tuberculous patients]. P Kadende, B Standaert, F Niragira, G Kamamfu, R Laroche Médecine tropicale: revue du Corps de santé colonial 01/1988; 48(1):19-20.
53. The use of transrectal echography for screening on prostate cancer. Results and evaluation. B Standaert, J C Van der Auwera, M Chaban, A Cornet, W Eylenbosch, L Denis. Progress in clinical and biological research 02/1987; 243B:29-36.
54. [Malnutrition and HIV infection in children in a hospital milieu in Burundi].Excler JL, Standaert B, Ngendandumwe E, Piot P. Pediatrie. 1987;42(9):715-8. French.
55. [Cancer registration in Belgium].Standaert B, Eylenbosch WJ. Arch Belg. 1986; 44(3-4):155-74.
56. [Health education in the early detection of prostatic diseases]. Standaert B, Eylenbosch WJ. Arch Belg. 1986; 44(1-2):68-75.

237
RESEARCH INSTITUTE SHARE
This thesis is published within the Research Institute SHARE (Science in Healthy Ageing and healthcaRE) of the University Medical Center Groningen / University of Groningen.
Further information regarding the institute and its research can be obtained from our internetsite: http://www.share.umcg.nl/http://www.share.umcg.nl/.
More recent theses can be found in the list below.((co-) supervisors are between brackets)
2015
Mutsaerts MLifestyle and reproduction(prof JA Land, prof BW Mol, dr A Hoek, dr H Groen)
Sulkers EPsychological adaptation to childhood cancer(prof R Sanderman, prof PF Roodbol, prof ESJM de Bont, dr J Fleer, dr WJE Tissing)
Febrianna SASkin problems related to Indonesian leather & shoe production and the use of footwear in Indonesia(prof PJ Coenraads, prof H Soebono, dr MLA Schuttelaar)
2014
Schneeberger CAsymptomatic bacteruiria and urinary tract infections in women: focus on diabetes mellitus and pregnancy(prof RP Stolk, prof JJHM Erwich, dr SE Geerlings)
Skorvanek, MFatigue, apathy and quality of life in patients with Parkinson’s disease(prof JW Groothoff , prof Z Gdovinova, dr JP van Dijk, dr J Rosenberger)
Kolvek GEtiology and prognosis of chronic kidney disease in children: Roma ethnicity and other risk factors(prof SAReiijneveld, prof L Podracka, dr JP van Dijk, dr J Rosenberger)

Exploring new ways of measuring the economic value of vaccination
238
Mikula PHealth related quality of life in people with multiple sclerosis; the role of coping, social participation and self-esteem(prof JW Groothoff , prof Z Gdovinova, dr JP van Dijk, dr I Nagyova)
Amalia RImproving a school-based dental programme through a sociodental risk group approach(prof RMH Schaub, prof JW Groothoff , prof N Widyanti)
Christoff ers WAHand eczema; interventions and contact allergies(prof PJ Coenraads, dr MLA Schuttelaar)
Troquete NACSTART-ing risk assessment and shared care planning in out-patient forensic psychiatry; results from a cluster randomized controlled trial(prof D Wiersma, prof RA Schoevers, dr RHS van den Brink)
Golea EFunctioning of young individuals with upper limb reduction defi ciencies(prof CK van der Sluis, dr RM Bongers, dr HA Reinders-Messelink)
Nguyen HTMedication safety in Vietnamese hospitals; a focus on medication errors and safety culture(prof K Taxis, prof FM Haaijer-Ruskamp, prof JRBJ Brouwers, dr TD Nguyen)
Lehmann VSinglehood and partnerships in healthy people and childhood cancer survivors; a focus on satisfaction(prof M hagedoorn, prof R Sanderman, dr MA Tuinman)
Jaarsma EASports participation and physical disabilities: taking the hurdle?!(prof JHB Geertzen, prof PU Dijkstra, dr R Dekker)
Ockenburg SL vanPsycholopgical states and physical fates; studying the role of psychosocial stress in the etiology of cardiovascular disease: a nomothetic versus an idiographic approach(prof JGM Rosmalen, prof P de Jonge, prof ROB Gans)
Beijers CGHMUnhealthy behaviors during pregnancy; who continues to smoke and consume alcohol, and is treatment of anxiety and depressive symptoms eff ective?(prof J Ormel, prof CLH Bockting, dr H Burger)

239
Research Institute SHARE
Kerdijk WStrategic choices in curriculum design to facilitate knowledge and competency development(prof J Cohen-Schotanus, prof JW Snoek, dr R Tio)
Spaans FHemopexin activity and extracellular ATP in the pathogenesis of preeclampsia(prof H van Goor, dr MM Faas, dr WW Bakker)
Brinksma ANutritional status in children with cancer(prof PF Roodbol, prof R Sanderman, prof ESJM de Bont, dr WJE Tissing)
Prihodova LPsychological and medical determinants of long-term patient outcomes; a specifi c focus on patients after kidney transplantation and with haemophilia(prof JW Groothoff , dr JP van Dijk, dr I Rajnicova-Nagyova, dr J Rosenberger)
Snippe EUnderstanding change in psychological treatments for depressive symptoms; the individual matters(prof R Sanderman, prof PMG Emmelkamp, dr MJ Schroevers, dr J Fleer)
Groen B Complications in diabetic pregnancy; role of immunology and Advanced Glycation End products(prof TP Links, prof PP van den Berg, dr MM Faas)
Visser LEarly detection and prevention of adolescent alcohol use; parenting and psychosocial factors(prof SA Reijneveld, dr AF de Winter)
Tovote KAAcceptance or challenge? Psychological treatments for depressive symptoms in patients with diabetes(prof R Sanderman, prof PMG Emmelkamp, prof TP Links)
Trippolini MEvaluation of functioning in workers with whiplash-associated disorders and back pain(prof MF Reneman, prof PU Dijkstra, prof JHB Geertzen)
Eriks-Hoogland IEShoulder impairment in persons with a spinal cord injury & associations with activities and participation(prof LHV van der Woude, porf G Stucki, prof MWM Post, dr S de Groot)
Exploring new ways of measuring the economic value of vaccination
240
Suwantika AAEconomic evaluations of non-traditional vaccinations in middle-income countries: Indonesia as a reference case(prof MJ Postma, dr K Lestari)
Behanova MArea- and individual-level socioeconomic diff erences in health and health-risk behaviours; a comparison of Slovak and Dutch cities(prof SA Reijneveld, dr JP van Dijk, dr I Rajnicova-Nagyova, dr Z Katreniakova)
Dekker HTeaching and learning professionalism in medical education(prof J Cohen-Schotanus, prof T van der Molen, prof JW Snoek)
Dontje MLDaily physical activity in patients with a chronic disease(prof CP van der Schans, prof RP Stolk)
For more 2014 and earlier theses visit our website