University of Bradford eThesis - CORE
315
University of Bradford eThesis This thesis is hosted in Bradford Scholars – The University of Bradford Open Access repository. Visit the repository for full metadata or to contact the repository team © University of Bradford. This work is licenced for reuse under a Creative Commons Licence.
-
Upload
khangminh22 -
Category
Documents
-
view
2 -
download
0
Transcript of University of Bradford eThesis - CORE

University of Bradford eThesis This thesis is hosted in Bradford Scholars – The University of Bradford Open Access repository. Visit the repository for full metadata or to contact the repository team
© University of Bradford. This work is licenced for reuse under a Creative Commons
Licence.
AN EMPIRICAL INVESTIGATION OF HOW THE
IMPACT OF THE FOUR SELF-CONGRUITY
TYPES ON BRAND ATTITUDE VARIES
DEPENDING ON AN INDIVIDUAL’S SELF-
CONSTRUALS, COSMOPOLITAN AND LOCAL
ORIENTATION
H. GONZÁLEZ JIMÉNEZ
PhD
2014
AN EMPIRICAL INVESTIGATION OF HOW THE
IMPACT OF THE FOUR SELF-CONGRUITY
TYPES ON BRAND ATTITUDE VARIES
DEPENDING ON AN INDIVIDUAL’S SELF-
CONSTRUALS, COSMOPOLITAN AND LOCAL
ORIENTATION
Héctor GONZÁLEZ JIMÉNEZ
submitted for the degree
of Doctor of Philosophy
Bradford University School of Management
2014

i
Keywords: Self-congruity, Self-construals, Cosmopolitan orientation, Local
orientation, Brand attitude, Consumer behaviour
Abstract
This thesis empirically investigates the impact of an individual‘s dominant independent
self-construal, interdependent self-construal, cosmopolitan and local orientation on the
effect of the four self-congruity types (actual, ideal, social, ideal social) on brand
attitude. A widely used practice among marketers focuses on communicating the notion
that using their brands will bring consumers closer to how they would like to see
themselves, their ideal self-concept (e.g. being a slim person like the models in the ads),
instead of how they actually see themselves, their actual self-concept. However, recent
research shows that there is no ―universality‖ of a superior self-congruity effect.
Specifically, individual-level characteristics (e.g. public self-consciousness) determine
whether actual or ideal self-congruity impacts brand perceptions more strongly (Malär
et al., 2011). This study extends that research by considering (a) all four self-congruity
types and (b) additional individual-level characteristics (independent and interdependent
self-construal, cosmopolitan and local orientation), which are valuable for segmenting
consumer markets within and across countries. Survey data from a non-student sample
were collected in two countries (the US and India). After performing data cleaning
procedures, over 800 usable responses in each country were analysed with the use of
PLS-SEM. The findings show that, as expected, these individual-level characteristics
have an impact in regard to which of the four self-congruity types has the strongest
effect on brand attitude. For instance, for individuals with a local orientation or
interdependent self-construal, actual self-congruity has the strongest effect on brand
attitude. These findings extend self-congruity theory by considering how an individual‘s
dominant independent and interdependent self-construal, cosmopolitan and local
orientation impact the effect of the four self-congruity types on brand attitude.
Moreover, the findings offer marketers insights into which self-concept type they
should try to match with their brand communications when targeting these specific
consumer groups. Details on the contributions as well as managerial implications are
presented.

ii
Acknowledgements
My research is founded on an individual‘s self. Interestingly, the last four years
have been a constant process of self-discovery due to the challenges the PhD journey
entails. It started with what I like to call the ―naïve arrogance of the first year PhD‖,
which seemed to transition into increasing humbleness as the months progressed. The
more I learned and exposed my ideas, the more I realized how much more I need to
learn. However, I believe that accepting the fact that I lacked research experience and
subject knowledge is what kept driving me towards being inquisitive, challenging
myself, seeking advice and ultimately developing into a researcher that stays curious.
Along the PhD journey there have been numerous people that have supported me
greatly in my development as a human being and researcher.
My foremost gratitude is dedicated to both my supervisors: Dr. Fernando
Fastoso and Dr. Kyoko Fukukawa, who have greatly contributed to my maturity in
research. Kyoko Fukukawa is my second supervisor. Although our research areas are
different, rather than a weakness, this was a blessing, as she was able to challenge me to
stick to the bottom line and make my research understandable for a wider audience.
Seemingly simple questions such as why should we care, who cares about it, what is
your key message, and why is it interesting, kept me on my toes and thanks to her I am
able to understand and communicate the bigger picture contribution of my work.
Moreover, besides her academic guidance, her sincere ―how are you Hector, how are
you feeling‖ were really appreciated. Thank you for that Kyoko.
Fernando Fastoso is my principle supervisor. Over the last four years we have
grown close through countless interactions, discussions, questions sessions and laughs
over a tea. Fernando has gone far beyond the call of duty. He challenged me when a
challenge was needed, but also took the time whenever I was in need for some
encouraging words. He was there during moments of uncertainty, struggles, or
insecurity, be it emotional or financial, which are certainly all part of a PhD. Moreover,
he has been integral in my development as a researcher, constantly challenging me to
find solid justifications for my ideas, emphasize rigour, and to improve the structure and
clarity of my writing. Words such as less is more, bottom line, precision, clarity, and
consistency still resonate in my mind. I believe he has shaped me greatly as a researcher
and as his ―research pupil‖ I will take part of Fernando into my future academic career.
I also want to express my sincere thanks to Professor Jon Reast, which came in
as an interim supervisor during a six month research leave of my second supervisor. I
will never forget his encouragement during the process and his ―helicopter perspective‖

iii
analogy on my research. His insights have helped me greatly in communicating the
value of my research, especially during the transfer to PhD status phase.
Other researchers have also influenced my PhD through discussions, their work,
or simply by sharing their insights through an email. I want to offer my thanks to
Professor Harry Triandis, Dr. James Wallace, Dr. Mike Tse, Professor Joseph Sirgy,
Professor Ying-Yi Hong, Dr. Michael Buhrmester, Professor Theodore Singelis, Dr.
Mei-Na Liao, Professor Marko Sarstedt, Dr. James Gaskin and Professor Nina
Reynolds. I want to also thank Professor Kevin Barber, my DRB tutor, for supporting
me with a grant to finance my data collection. Moreover, I want to thank Professor Jeryl
Whitelock for accepting me as her PhD student. Even though she left the University
shortly thereafter, thanks to that acceptance, I was able to embark in this journey.
This acknowledgement is also dedicated to my colleagues and friends. My
fellow PhD colleagues or ―fellow sufferers‖ with whom I shared countless hours in the
office going through various ups and downs over the last few years. Furthermore,
thanks to my friends outside of the School of Management. They kept me sane and
allowed me to escape from the research world once in a while. Special thanks are
granted to the Cecil Castle members, which offered me from time to time an outlet to
unwind. I did not mention any specific names as there are too many, but you all know
who you are.
Last, but certainly not least, my family. Especially, thanks to my Aunt Pilar and
Uncle Tom who played a great part in this endeavour. They opened their home and
hearts in the USA long ago, allowing me to start my higher education at the university
level. Without their support I may have never even received my Bachelor Degree,
which was the start of the academic journey. I also want to mention my cousin Oscar,
who is fighting a much more serious battle than a PhD. Seeing his positive attitude in
times of crisis has helped me to put things into perspective and I even felt guilty
complaining about so called ―difficult‖ times during the PhD. I can‘t conclude this
acknowledgement without mentioning my parents; Mama and Papa. Coming from a
humble background, they worked very hard to offer me a better future. Although they
sometimes did not understand why I would leave a well-paid and secure job to embark
into an uncertain journey, they were always there to support me. I hope that I can make
them proud and all their sacrifices were worth it. Without their endless love and support
I would not be able to follow my dreams. You have planted the seed, watered it and
even now that it is grown, you still take care of it. I can‘t say enough to thank you;
gracias por todo. Finally, while this seems to be the end, in reality the journey has just
begun. I look forward to what is ahead.

iv
Table of Contents
Abstract .............................................................................................................................. i
Acknowledgements ........................................................................................................... ii
List of Tables..................................................................................................................... x
List of Figures ................................................................................................................. xii
List of Abbreviations...................................................................................................... xiii
Chapter 1 – Thesis Introduction .................................................................................. 1
1.1 Introduction ................................................................................................................. 1
1.2 Research Background.................................................................................................. 2
1.3 Self-Congruity Theory ................................................................................................ 4
1.4 Self-Construals ............................................................................................................ 8
1.5 Cosmopolitan and Local Orientation .......................................................................... 9
1.6 Expected Impact of the ILCs on the Self-Congruity Effect and Segmentation Value 9
1.7 Research Gaps ........................................................................................................... 10
1.8 Research Objectives .................................................................................................. 14
1.9 Research Questions ................................................................................................... 14
1.10 Methodology ........................................................................................................... 17
1.11 Research Contributions ........................................................................................... 17
1.12 Thesis Structure ....................................................................................................... 19
1.13 Conclusion .............................................................................................................. 22
Chapter 2 - Literature Review .................................................................................... 23
2.1 Introduction ............................................................................................................... 23
2.2 The Self-Concept ...................................................................................................... 23
2.2.1 Self-Concept Definition ..................................................................................... 23
2.2.2 Self-Concept Characteristics and Self-Motives ................................................. 25
2.3 Self-Congruity Theory .............................................................................................. 28
2.4 Review of Self-Congruity Studies ............................................................................ 29
2.4.1 The Four Self-congruity Types .......................................................................... 30
2.4.2 Individual-Level Characteristics‘ Impact on the Self-Congruity Effect ............ 34
2.4.3 Current State of Self-Congruity Research and Gaps ......................................... 37
2.5 Self-Construals .......................................................................................................... 39
2.5.1 Orthogonal Nature of Self-Construals ............................................................... 40
2.5.2 Self-Construals and Self-Congruity ................................................................... 41
2.6 Cosmopolitan and Local Orientation ........................................................................ 42
2.6.1 Orthogonal Nature of a Cosmopolitan and Local Orientation ........................... 43

v
2.6.2 Cosmopolitan and Local Orientation and Self-Congruity ................................. 43
2.7 Market Segmentation Value of the Individual-Level Characteristics ....................... 45
2.8 Conclusion ................................................................................................................ 46
Chapter 3 - Conceptual Framework and Hypotheses ...................................................... 48
3.1 Introduction ............................................................................................................... 48
3.2 Conceptual Framework and Hypotheses Structure ................................................... 49
3.2.1 Conceptual Framework ...................................................................................... 49
3.2.2 Hypotheses Structure ......................................................................................... 50
3.3 Hypotheses - Dominant Self-Construals (INTSC/INDSC) ...................................... 51
3.3.1 Strongest Effect of Actual versus Ideal Self-Congruity (Private Selves) on
Brand Attitude ............................................................................................................. 52
3.3.2 Strongest Effect of Social versus Ideal Social Self-Congruity (Public Selves) on
Brand Attitude ............................................................................................................. 53
3.3.3 Overall Strongest Self-Congruity Effect on Brand Attitude .............................. 54
3.4 Hypotheses – Dominant Cosmopolitan and Local Orientation................................. 55
3.4.1 Strongest Effect of Actual versus Ideal Self-Congruity (Private Selves) on
Brand Attitude ............................................................................................................. 56
3.4.2 Strongest Effect of Social versus Ideal Social Self-Congruity (Public Selves) on
Brand Attitude ............................................................................................................. 57
3.4.3 Overall Strongest Self-Congruity Effect on Brand Attitude .............................. 58
3.5 Brand Attitude and Purchase Intent .......................................................................... 59
3.6 Conclusion ................................................................................................................ 60
Chapter 4 - Methodology ................................................................................................ 61
4.1 Introduction ............................................................................................................... 61
4.2 Research Philosophy ................................................................................................. 61
4.3 Research Approach and Method ............................................................................... 62
4.4 Data Collection.......................................................................................................... 64
4.4.1 Geographic Scope of the Study and its Rationale .............................................. 64
4.4.2 Population of the Study and Respondents .......................................................... 67
4.4.3 Sampling Frame ................................................................................................. 68
4.4.4 Probability vs. Non-Probability Sampling and Self-Selection Bias .................. 68
4.4.5 Sample Size Considerations ............................................................................... 70
4.4.6 Respondent Contact and Data Collection Equivalence ...................................... 71
4.5 Research Instrument Development and Administration ........................................... 72
4.5.1 Cross-Cultural Data Equivalence ....................................................................... 72
4.5.2 Research Instruments for Preliminary Study I and II......................................... 75
4.5.3 Research Instrument for the Main Study ........................................................... 76
A. Self-Construals Scale and Respondent Categorisation ................................. 77
B. Cosmopolitan and Local Orientation Scale and Respondent Categorisation 78

vi
C. Self-Congruity Measure ................................................................................ 79
D. Brand Attitude Scale and Purchase Intent Scale ........................................... 81
E. Control Variables .......................................................................................... 81
F. Scale Sensitivity ............................................................................................ 82
4.6 Data Analysis Approach ........................................................................................... 83
4.6.1 Preliminary Data Analysis and Non-Response Bias .......................................... 84
4.6.2 Structural Equation Modelling and PLS-SEM Rationale .................................. 85
4.6.3 PLS-SEM Analysis Approach............................................................................ 86
A. Measurement Model ..................................................................................... 87
B. Multi-Group PLS Analysis ........................................................................... 87
C. Common Method Variance (CMV) .............................................................. 88
D. Structural Model ........................................................................................... 90
4.7 Conclusion ................................................................................................................ 92
Chapter 5 - Results Preliminary Study I, II and Pilot Study .................................. 93
5.1 Introduction ............................................................................................................... 93
5.2 Preliminary Study I ................................................................................................... 94
5.2.1 Procedure............................................................................................................ 94
5.2.2 Implications of the Results for Preliminary Study II ......................................... 95
5.3 Preliminary Study II .................................................................................................. 96
5.3.1 Procedure............................................................................................................ 97
5.3.2 Demographic Characteristics US and India ....................................................... 98
A. Cross-National Comparability ...................................................................... 98
B. Within-Country Representativeness ............................................................. 99
5.3.3 Results of Preliminary Study II ........................................................................ 100
A. Television Sets ............................................................................................ 101
B. Soft Drinks .................................................................................................. 102
C. Clothing Apparel......................................................................................... 103
D. Sports Shoes ................................................................................................ 104
5.3.4 Conclusion of Preliminary Study II ................................................................. 105
5.4 Pilot Test Main Study ............................................................................................. 105
5.4.1 Questionnaire Design ....................................................................................... 106
5.4.2 Results Pilot Test ............................................................................................. 106
A. Attention Check .......................................................................................... 107
B. Substituted Values ...................................................................................... 107
C. Reliability of Measurement Scales ............................................................. 108
5.4.3 Implications for the Main Study ...................................................................... 109
5.5 Conclusion .............................................................................................................. 110
Chapter 6 – Results Data Collection and Measurement Models ......................... 111

vii
6.1 Introduction ............................................................................................................. 111
6.2 Data Collection and Cleaning ................................................................................. 111
6.2.1 Attention Check ............................................................................................... 112
6.2.2 Data Input Accuracy and Substituted Values................................................... 112
6.2.3 Normal Distribution and Outliers .................................................................... 113
6.3 External Validity and Respondent Profile............................................................... 114
6.3.1 External Validity .............................................................................................. 114
6.3.2 Demographic Information ................................................................................ 115
A. Cross-National Comparability of the US and Indian Samples ................... 115
B. Sample Representativeness within the Country.......................................... 116
6.3.3 Response Rate and Non-Response Bias ........................................................... 117
6.4 Measurement Models .............................................................................................. 118
6.4.1 Respondent Categorisation into Subsample Models ........................................ 118
6.4.2 Reliability and Validity .................................................................................... 120
A. US Full Sample ........................................................................................... 121
B. India Full Sample ........................................................................................ 123
6.4.3 Multi-group PLS Analysis ............................................................................... 126
6.4.4 Common Method Variance .............................................................................. 127
6.5 Conclusion .............................................................................................................. 129
Chapter 7 – Results Structural Models and Hypotheses ...................................... 130
7.1 Introduction ............................................................................................................. 130
7.2 Results of the Structural Models ............................................................................. 130
7.2.1 United States Full Sample and Four Subsamples ............................................ 132
7.2.2 India Full Sample and Four Subsamples .......................................................... 134
7.2.3 Summary Structural Models US and India ...................................................... 135
7.3 Hypotheses Testing ................................................................................................. 137
7.3.1 Results Self-Construals .................................................................................... 138
A. Hypotheses 1 to 6 ........................................................................................ 138
B. The Moderating Impact of Brand Conspicuousness on the Effect of the Four
Self-Congruity Types on Brand Attitude .............................................................. 140
7.3.2 Results Cosmopolitan and Local Orientation .................................................. 142
A. Hypotheses 7 to 12 ...................................................................................... 142
B. The Moderating Impact of Brand Conspicuousness on the Effect of the Four
Self-Congruity Types on Brand Attitude .............................................................. 144
7.3.3 Brand Attitude and Purchase Intent (H13) ....................................................... 145
7.4 Overview of Hypotheses Results ............................................................................ 146
7.5 Post-Hoc Tests on Demographic Control Variables ............................................... 147
7.6 Conclusion .............................................................................................................. 151
Chapter 8 - Discussion ............................................................................................... 152

viii
8.1 Introduction ............................................................................................................. 152
8.2 Self-Construals (Independent and Interdependent) ................................................. 154
8.2.1 Actual versus Ideal Self-Congruity - Private Selves (H1 and H2) .................. 154
8.2.2 Social versus Ideal Social Self-Congruity - Public Selves (H3 and H4) ......... 156
8.2.3 Overall Strongest Self-Congruity Effect – All Four Types (H5 and H6) ........ 158
8.2.4 Summary Self-Construals ................................................................................ 161
8.3 Cosmopolitan and Local Orientation ...................................................................... 163
8.3.1 Actual versus Ideal Self-Congruity - Private selves (H7 and H8) ................... 163
8.3.2 Social versus Ideal Social Self-Congruity - Public Selves (H9 and H10) ....... 165
8.3.3 Overall Strongest Self-Congruity Effect – All Four Types (H11 and H12) .... 168
8.3.4 Summary Cosmopolitan and Local Orientation ............................................... 169
8.4 Self-Congruity Effects (independent four types) on Brand Attitude (H1 –H12) .... 170
8.5 Brand Attitude Effect on Purchase Intent (H13) ..................................................... 171
8.6 Conclusion .............................................................................................................. 172
Chapter 9 - Conclusion .............................................................................................. 173
9.1 Introduction ............................................................................................................. 173
9.2.1 Extension and Refinement of Self-congruity Theory ...................................... 174
9.2.2 Empirical Evidence of the Interaction Effect between the Various Self-
Congruity Types ........................................................................................................ 175
9.2.3 Cross-National Predictive Validity of INDSC and Local Orientation ............. 177
9.3 Managerial Implications.......................................................................................... 178
9.3.1 Market Segmentation ....................................................................................... 178
9.3.2 Targeted Branding versus Mass Branding: A Marketing Channel Perspective
................................................................................................................................... 179
9.4 Limitations .............................................................................................................. 180
9.5 Future Research Directions ..................................................................................... 182
9.6 Conclusion .............................................................................................................. 186
References ..................................................................................................................... 187
Appendices .................................................................................................................... 217
Appendix 2.1 Examples of Interchangeable use of Self-Concept Related Terms ........ 217
Appendix 2.2 Self-Concept Definitions used in the Literature ..................................... 220
Appendix 2.3 Systematic Literature Review Top Journal List ..................................... 221
Appendix 2.4 Self-Construal Studies (SC) ................................................................... 222
Appendix 2.5 Self-Congruity Studies (Con) ................................................................. 226
Appendix 2.6 Cosmopolitan/Local Orientation Studies (CL) ....................................... 228
Appendix 4.1 MTurk Samples Demographic Information ........................................... 230
Appendix 4.2 Main Study Contact Letter on MTurk .................................................... 231
Appendix 4.3 Preliminary Study II Items to Measure the Constructs .......................... 232
Appendix 4.4 Main Questionnaire Scales ..................................................................... 233
ix
Appendix 5.1 Preliminary Study I Online Questionnaire ............................................. 237
Appendix 5.2 Results Preliminary Study I .................................................................... 241
5.2.1 Results US Sample ........................................................................................... 241
5.2.2 Results Indian Sample ...................................................................................... 242
5.2.3 Brands Mentioned in Preliminary Study I ....................................................... 244
Appendix 5.3 Preliminary Study II Online Questionnaire ............................................ 246
Appendix 5.4 Cronbach‘s α Preliminary Study II ........................................................ 259
Appendix 5.5 Income Distribution Preliminary Study II .............................................. 260
Appendix 5.6 Detailed Results Preliminary Study II .................................................... 261
5.6.1 Results US Sample PS II .................................................................................. 261
5.6.2 Results Indian Sample PS II ............................................................................. 262
Appendix 6.1 Main Study Online Questionnaire .......................................................... 264
Appendix 6.2 Skewness and Kurtosis Main Study ....................................................... 279
Appendix 6.3 Socioeconomic Classes Represented by the US and Indian Samples .... 280
Appendix 6.4 Reliability and Validity of the Subsample Measurement Models .......... 282
6.4.1 US INDSC Subsample ..................................................................................... 282
6.4.2 India INDSC Subsample .................................................................................. 283
6.4.3 US INTSC Subsample ..................................................................................... 284
6.4.4 India INTSC Subsample .................................................................................. 285
6.4.5 US LOC Subsample ......................................................................................... 286
6.4.6 India LOC Subsample ...................................................................................... 287
6.4.7 US COS Subsample ......................................................................................... 288
6.4.8 India COS Subsample ...................................................................................... 289
Appendix 7.1 Figures Structural Models ...................................................................... 290
Appendix 7.2 Results Public versus Private Brands ..................................................... 295
Appendix 8.1 Post-Hoc Test Power Distance and Long-Term Orientation.................. 296
Appendix 8.2 Post-Hoc Test Interaction Effect between Public and Private Self-
congruity Types ............................................................................................................. 298

x
List of Tables
Table 1.1 Overview Research Objectives, Questions and Hypotheses……………….16
Table 3.1 Hypotheses ………………………………….………………….……….......51
Table 4.1 Components of Measure Equivalence ……………………………….……..73
Table 4.2 Preliminary Study II Scales……….…………….…….…………….……....76
Table 4.3 Main Questionnaire Scales ……………………………………….………...77
Table 4.4 Measurement Model Evaluation Criteria………………………….………...87
Table 5.1 Brands Preliminary Study I ………………………………………….……..96
Table 5.2 Demographic Variables US and India – PS II …………………..…..…....100
Table 5.3 ―Don‘t know/Don‘t want to answer‖ Selected Questions ….……………..108
Table 5.4 Cronbach‘s alpha Pilot Test ….…………………………………………….109
Table 6.1 Demographic Characteristics US and India – Main Study ………….……116
Table 6.2 Non-Response Bias ………………………………………….…………….118
Table 6.3 Respondents per Subsample ………………….…………………..……….120
Table 6.4 US Full Sample Reliability and Convergent Validity ….…………………122
Table 6.5 US Full Sample Latent Variable Correlations ………….…………………122
Table 6.6 India Full Sample Reliability and Convergent Validity …….…………….124
Table 6.7 India Full Sample Latent Variable Correlations ………….……………….124
Table 6.8 Metric Invariance Full Sample US vs. India ……………..………………..127
Table 6.9 US and India Full Sample with Marker Variable ―money worries‖ .….…..128
Table 7.1 Collinearity Assessment US ………………………………….…………...132
Table 7.2 Collinearity Assessment India ………………………….…………………134
Table 7.3 R2 and Q
2 Values for all Structural Models …………….………………....136
Table 7.4 Values for f2
and q2 Effect Size for all Structural Models ………………..136
Table 7.5 Self-Construals Results Overall and by Brand Conspicuousness Type .…..141
Table 7.6 COS/LOC Results Overall and by Brand Conspicuousness Type …….…..145
Table 7.7 Path Coefficient Results for Both Brand Types ……………………….….146
Table 7.8 Summary of the Hypotheses ……………………………….…….…….….147
Table 7.9 Results ANOVA for Demographic Variables ……..……………….……...149
Table 7.10 Results Linear Regression Analysis for Demographic Variables ………..149
Table 8.1 Summary of Hypotheses ……………….…………………….…….……....153
Table A2.2 Self-Concept Definitions ……………………………..……………....….220
Table A2.3 Journal Rankings ……………………………………………………..….221

xi
Table A5.2.1 Brands PS I - US Sample …………………………….………………..241
Table A5.2.2 Demographics US – PS I …………….………………….…………….242
Table A5.2.3 Brands PS I - Indian Sample ……….…………………..……………...243
Table A5.2.4 Demographics India - PS I …………..………………………………..243
Table A5.2.5 Brands PS I – US ……………………………………..……………….244
Table A5.2.6 Brands PS I – India ……………………………….…..……………….245
Table A5.4.1 Cronbach‘s alpha PS II – US …………………..………………..…….259
Table A5.4.2 Cronbach‘s alpha PS II – India …………………………………….…..259
Table A5.5.1 Income – US …………………………………………..……….…..…..260
Table A5.5.2 Income – India …………………………….………………..….….…..260
Table A5.6.1 Overall means FAM, PI, and STA in the US …….…………………...262
Table A5.6.2 Overall means FAM, PI, and STA in India …………….…………….263
Table A6.2 Skewness and Kurtosis – US …………………………….…..………….279
Table A6.2 Skewness and Kurtosis – India ……………………………..…….……..279
Table A6.4.1 US INDSC Reliability and Convergent Validity ………….……….....282
Table A6.4.2 US INDSC Latent Variable Correlations …………………..………....282
Table A6.4.3 India INDSC Reliability and Convergent Validity ………..………….283
Table A6.4.4 India INDSC Latent Variable Correlations ………………..……….…283
Table A6.3.5 US INTSC Reliability and Convergent Validity ………...…………....284
Table A6.4.6 US INTSC Latent Variable Correlations ……………….…..………....284
Table A6.4.7 India INTSC Reliability and Convergent Validity ……….….…….…285
Table A6.4.8 India INTSC Latent Variable Correlations ………………..……….…285
Table A6.4.9 US LOC Reliability and Convergent Validity …………………….…286
Table A6.4.10 US LOC Latent Variable Correlations …………….………..….……286
Table A6.4.11 India LOC Reliability and Convergent Validity …………..…….…..287
Table A6.4.12 India LOC Latent Variable Correlations …………………….….......287
Table A6.4.13 US COS Reliability and Convergent Validity …………….….….….288
Table A6.4.14 US COS Latent Variable Correlations ……………………….…..….288
Table A6.3.14 India COS Reliability and Convergent Validity ……………..…….. 289
Table A6.4.15 India COS Latent Variable Correlations ………………...…….…….289
Table A7.2 Path Coefficient Results Public vs. Private Brands ………………….….295
Table A8.1 Controlling for PD and LTO ……….………………………….……...…297
Table A8.2 Interaction Effect between Public and Private Self-Congruity Types .....299
xii
List of Figures
Figure 1.1 Thesis Structure …………………………………………………………...20
Figure 2.1 Relationship between Demographic Variables and ILCs ………………...46
Figure 3.1 Conceptual Framework ……………………………………….…………...50
Figure 4.1 Data Analysis Sequence ……………………………….…………………..83
Figure 4.2 Evaluation Criteria Structural Model …………….…………………….….91
Figure 5.1 Television Sets Brands …………………………………………………...101
Figure 5.2 Soft Drinks Brands ………………………………………………………..102
Figure 5.3 Clothing Apparel Brands …..…………………………………………….103
Figure 5.4 Sports Shoes Brands ……………………………………………….……...104
Figure 6.1 Measurement Model US Full Sample ………………………….………...123
Figure 6.2 Measurement Model India Full Sample ……………………….…………125
Figure 7.1 Structural Models and Hypotheses Analysis Sequence ……….…………132
Figure A2.1 Interchangeable Self-Concept Terms ………………………….……….219
Figure A6.1 Socio-Economic and Products of MTurk Respondents …….………….281
Figure A7.1 US Full Sample Structural Model ……………………….……………..290
Figure A7.2 US INDSC Sample Structural Model ……………….…………….……290
Figure A7.3 US INTSC Sample Structural Model …………………….…………….291
Figure A7.4 US COS Sample Structural Model …………………………………….291
Figure A7.5 US LOC Sample Structural Model …………………………………….292
Figure A7.6 INDIA FULL Sample Structural Model ………………………………292
Figure A7.7 India INDSC Sample Structural Model ………………….…………….293
Figure A7.8 India INTSC Sample Structural Model ………………………………..293
Figure A7.9 India COS Sample Structural Model …………………………….…….294
Figure A7.10 India LOC Sample Structural Model ………………….……………...294

xiii
List of Abbreviations
ANOVA Analysis of Variance
ASC Actual Self-Congruity
AVE Average Variance Extracted
BA Brand Attitude
BL Brand Loyalty
COS Cosmopolitan Orientation
CMV Common Method Variance
CR Composite Reliability
CB-SEM Covariance Based Structural Equation Modelling
EBA Emotional Brand Attachment
f2 Effect Size Coefficient of Determination
INDCOL Individualism/Collectivism
INDSC Independent Self-Construal
INTSC Interdependent Self-Construal
ILCs Individual-Level Characteristics
ISC Ideal Self-Congruity
LOC Local Orientation
LTO Long-Term Orientation
MANOVA Multivariate Analysis of Variance
MI Measurement (Metric) Invariance
PD Power-Distance
PLS-SEM Partial Least Squares Structural Equation Modelling
PI Purchase Intent
Q2 Predictive Relevance
q2
Effect Size Predictive Relevance
RPI Re-Purchase Intent
R2
Coefficient of Determination
SEM Structural Equation Modelling
SSC Social Self-Congruity
ISSC Ideal Social Self-Congruity
1
Chapter 1 – Thesis Introduction
1.1 Introduction
This thesis investigates the impact of individual-level characteristics on the effect of the
four self-congruity types on brand attitude. Research shows that, depending on an
individual‘s characteristics (e.g. public self-consciousness) they have different
motivational needs that determine whether they prefer brands congruent with their
actual or ideal self-concept (Malär et al., 2011). This thesis builds on this research.
Specifically, the objective of this thesis is to offer empirical evidence to determine
which of the four self-congruity types has the strongest effect on brand attitude
depending on an individual‘s dominant independent self-construal (INDSC),
interdependent self-construal (INTSC), cosmopolitan and local orientation.
Investigating this is of practical relevance because it offers insights into which of the
four self-concept types marketers should emphasize in their brand communications to
target consumers with the specific individual-characteristics outlined above, which are
valuable for segmenting consumers within and across countries. The findings of the
study show that as expected these individual-level characteristics determine which self-
congruity type has a stronger effect on brand attitude. In doing so, this thesis extends
self-congruity theory by showing the impact of these individual-level characteristics on
the effect of the four self-congruity types on brand attitude. This chapter is structured as
follows. Section 1.2 discusses the background of the research topic. Sections 1.3 to 1.6
present a summary of the theoretical foundations of the thesis, including an overview of
the empirical self-congruity studies. Section 1.7 gives an overview of the gaps in the
literature. Subsequently, sections 1.8 and 1.9 define the research objectives and research
questions, respectively. This is followed by a brief discussion of the methodology

2
(section 1.10). The chapter then presents the contributions (section 1.11) and an outline
of the thesis (section 1.12), leading to the conclusion of the chapter (section 1.13).
1.2 Research Background
Branded goods can be found in virtually every store around the world and statements
such as ―This brand allows me to express who I am‖ or ―This brand makes me look cool
in front of others‖ are sometimes expressed in regard to the consumption of brands.
These seemingly simple statements point towards the idea that brands are linked very
closely to (1) how consumers see themselves; (2) how they would like to see
themselves; (3) how they perceive themselves to be seen by others; or (4) how they
would like to be seen by others. In the consumer research literature this is referred to as
the self-concept or self-image (Sirgy, 1982). As shown in the aforementioned example,
the self-concept is multidimensional and composed of four types. They are the actual
self-concept, ideal self-concept, social self-concept, and ideal social self-concept
respectively (e.g. Sirgy et al., 2000). Based on these self-expressive properties of a
brand consumers form attitudes towards them that can be more or less positive (Sirgy
and Johar, 1999; Hong and Zinkhan, 1995).
Companies recognize that consumers use brands to express themselves, and they apply
this knowledge in their communication strategies to create positive attitudes towards
their brands. For example, fashion or cosmetics companies (e.g. Lancome) tend to
communicate their brands‘ images in a manner that makes consumers believe that
consuming these brands will make them more attractive, e.g. by using slim, attractive
models in the ads. Hence, consuming this brand allows them to enhance their view of
themselves (ideal self-concept), or how they want to be seen by others (ideal social self-
concept). This branding approach is known as aspirational branding. However, other

3
companies choose to focus rather on communicating the notion that their brand allows
consumers to express a consistent view of who they believe themselves to be (actual
self-concept), or how they believe they are seen by others (social self-concept). For
instance, Unilever‘s Dove ―real beauty‖ campaign used models who look more like
regular people rather than models. This approach is known as authentic branding.
Moreover, research shows that individuals have different motivations (i.e. self-motives)
that influence how strongly each self-concept type affects their attitudes and behaviour
(Leary, 2007; Sirgy et al., 2000). For example, individuals who see themselves as
connected with others are highly motivated to conform to social norms (Locke and
Christensen, 2007) and are therefore likely to have strong positive attitudes towards
brands matching their social self-concept. Consequently, marketers are left with the
question of which of these four self-concept types they should emphasize in their brand
communications to elicit positive attitudes towards their brands in their target groups.
This thesis addresses this question by exploring which of the four self-concept types
marketers should focus on when targeting consumers with characteristics that are
relevant for market segmentation purposes, specifically, a dominant INTSC, INDSC,
cosmopolitan and local orientation (Cannon and Yaprak, 2002; Markus and Kitayama,
1991; Riefler et al., 2012).
A key theory with which to investigate this question is self-congruity theory. The
following sections present a summary of the conceptual foundations of self-congruity
theory (Sirgy, 1982). Moreover, the section discusses the specific individual-level
characteristics considered in this thesis, which are an individual‘s dominant independent
self-construal (INDSC), interdependent self-construal (INTSC), cosmopolitan and local
orientation.

4
1.3 Self-Congruity Theory
Self-congruity theory posits that as the perceived similarity (congruence) between any
of a user‘s actual, ideal, social or ideal self-concept and the brand‘s image increases, the
resultant effect on constructs such as brand attitude, brand loyalty, or emotional brand
attachment will be more positive (Sirgy et al., 1991; Kressmann et al., 2006; Malär et
al., 2011). Self-congruity theory assumes that consumers use brands as a way of
defining themselves and that they purchase brands with a specific image to
express/symbolize their self-concept (Aaker, 1999; Belk, 1988). There are four
independent self-congruity types. According to Sirgy et al. (2000) these are actual self-
congruity and ideal self-congruity, which are both private selves that focus on internal
aspects of an individual‘s self-concept. The other two are social self-congruity and
ideal-social self-congruity, which are both public selves that focus on how others view
an individual‘s self-concept. Human behaviour is guided by the need to satisfy different
self-motivations and the importance an individual places on a specific self-concept type
and corresponding self-congruity type is determined by the motive that guides his/her
behaviour the strongest (e.g. Swann, 1983; Swann et al., 1992; Raskin et al., 1991b;
Sedikides and Gregg, 2008; Sirgy et al., 2000). These are the self-consistency, self-
enhancement/esteem, social-consistency/conformance, and social approval/esteem
motive, respectively. Individuals try to satisfy their self-motive needs through the
consumption of brands that offer them an opportunity to accomplish this (Howard and
Sheth, 1969). For instance, if, among the four self-motives, a consumer‘s behaviour is
guided the strongest by his/her need for social-consistency, the social self-concept will
likely have the strongest effect on his/her attitudes. Consequently, a brand perceived as
congruent with his/her social self-concept allows him/her to satisfy the need for social
consistency, hence prompting a positive attitude towards that brand (Kressmann et al.,
2006; Sirgy and Johar, 1999). However, considering the impact of individual-level

5
characteristics (ILCs) on the self-congruity effect is essential as individuals differ in
their need to satisfy the four self-motives (Malär et al., 2011; Markus and Kitayama,
1991). The differing needs to satisfy each self-motive determine which self-congruity
type is likely to have a stronger effect on brand attitude for an individual. Therefore, if
marketers have insights into which self-congruity type leads to the most positive brand
attitude for consumers with specific individual characteristics, they can try to appeal
with their brand communications to the corresponding self-concept types. For instance,
they may use an authentic branding approach that makes the consumer believe that
consuming the brand offers him/her a means of verifying a consistent view of his/her
actual self-concept.
Over the last two decades, a substantial amount of research has been conducted on self-
congruity theory. Most research has focused on actual self-congruity and shows that
actual self-congruity has a positive effect on brand attitude (e.g. Liu et al., 2012a; Hong
and Zinkhan, 1995), emotional brand attachment (Malär et al., 2011), and brand loyalty
(Sirgy et al., 2008), while some studies show a positive effect of actual and ideal self-
congruity (e.g. Marshall et al., 2008), or a positive effect of all four self-congruity types
on brand related outcomes (e.g. Sirgy and Johar, 1999). In addition, recent research has
sought to establish which self-congruity type has the greatest impact on brand related
outcomes. In this context, several studies have provided evidence that ideal self-
congruity has a stronger effect on brand attitude, purchase intent and re-purchase intent
than actual self-congruity (Graeff, 1996; Hong and Zinkhan, 1995; Marshall et al.,
2008). Nevertheless, a recent study by Malär et al. (2011) challenges the ―universality‖
of a superior self-congruity effect since individuals have different characteristics (e.g.
public self-consciousness levels). The study explains its findings by arguing that

6
depending on their characteristics, individuals seek to satisfy different self-motive
needs, which consequently determine how strongly actual and ideal self-congruity affect
brand perceptions (Malär et al., 2011). However, no study to date has empirically tested
how strongly any individual-level characteristics impact the effect of social and ideal
social self-congruity on brand attitude. Hence, this absence points to a gap in the
literature (GAP 1).
Furthermore, building on Malär et al.‘s (2011) work, two recent studies investigate the
impact of individual-level characteristics, specifically self-construals, on the various
self-congruity effects (Sung and Choi, 2012; Kim and Hyun, 2013). Consumers differ
with respect to perceiving their self as independent of, or interdependent with others,
namely their self-construals (Markus and Kitayama, 1991). These two studies highlight
the importance of studying the impact of self-construals on the effect of the various self-
congruity types on brand perceptions. Specifically, they show that both self-construals
impact the effect of actual self-congruity on brand attitude (Sung and Choi, 2012), and
that an INTSC impacts the effect of the four self-congruity types on purchase intent
(Kim and Hyun, 2013). However, no study to date has empirically tested the impact of
both self-construal types on the effect of ideal, social, and ideal-social self-congruity on
brand attitude, which points to a gap in the literature (GAP 2). Sung and Choi (2012)
tested only the impact of both self-construals on the effect of actual self-congruity on
brand attitude, while Kim and Hyun (2013) tested only the impact of a dominant INTSC
on the effect of the four self-congruity types on purchase intent, but did not test the
impact of a dominant INDSC on the effect of the four self-congruity types on any
brand-related outcomes (i.e. brand attitude).

7
Moreover, some individuals are open to diverse cultural experiences, while others
perceive their home culture as ultimate reality, namely having a dominant cosmopolitan
or local orientation, which are also valuable individual-level characteristics for market
segmentation (Riefler et al., 2012). However, a review of the literature shows that no
study to date has empirically tested the impact of an individual‘s dominant
cosmopolitan and local orientation on the effect of any of the four self-congruity types
on brand attitude. This points to another gap in the literature (GAP 3).
In addition, research shows that the self-congruity effect on brand perceptions depends
on a brand‘s conspicuousness type, i.e. whether the brand is consumed in public or in
private settings (Sirgy and Johar, 1999). For publicly consumed brands the effect of
ideal self-congruity on brand attitude is stronger than that of actual self-congruity, while
for privately consumed brands no difference was found (Graeff, 1996). Researchers
have proposed (e.g. Sirgy et al., 2000) that the effect of public self-congruity types
(social and ideal social) on brand perceptions is stronger for publicly consumed brands
than the effect of private self-congruity types (actual and ideal). When a brand is
consumed publicly, consumers seek to impress others through their act of consumption,
an act that is not as prevalent when the brand is consumed in private (Dolich, 1969;
Kressmann et al., 2006). However, there is a lack of empirical evidence to support this
claim. Therefore, researchers (i.e. Kim and Hyun, 2013) have stated that future studies
should consider the distinction between the two brand conspicuousness types in their
research design when looking at the effect of all four self-congruity types on brand
attitude.

8
In summary, this thesis considers the impact of a consumer‘s dominant independent
self-construal, interdependent self-construal, cosmopolitan and local orientation on the
effect of the four self-congruity types on brand attitude. The following section describes
these individual-level characteristics, their expected impact on the self-congruity effect
and the benefits for market segmentation.
1.4 Self-Construals
Self-construals are individual-level cultural characteristics, which are determined by
cultural surroundings such as traditions, religions, life philosophies and socialization
processes. Self-construals are conceptually related to Hofstede‘s (1980) individualism-
collectivism dimensions (Markus and Kitayama, 1991; Sharma, 2010). Individualism-
collectivism is used at the country level while independent-interdependent self-construal
is used at the individual-level (Polyorat and Alden, 2005a). Individuals with a dominant
independent self-construal (INDSC) focus on unique personal traits and attributes as
well as de-emphasizing others. Individuals with a dominant interdependent self-
construal (INTSC) place an emphasis on social aspects of their self-concept and how the
self-concept is related to others (Escalas and Bettman, 2005; Markus and Kitayama,
1991). Rather than representing two extremes of the continuum like individualism-
collectivism at the country level, it has been shown in numerous empirical studies that
self-construals are orthogonal and that both types can co-exist within an individual
(Singelis, 1994; Polyorat and Alden, 2005b; Oyserman et al., 2002). However, as
individuals tend to score higher on one self-construal than on the other, researchers refer
to the stronger self-construal as the ―dominant‖ one (e.g. Agrawal and Maheswaran,
2005). The dominant self-construal consequently influences how the self-concept

9
guides an individual‘s attitude and behaviour. Details of the conceptual and
methodological implications are explained in chapters 2 and 4, respectively.
1.5 Cosmopolitan and Local Orientation
Research shows that some individuals are open to diverse cultural experiences, while
others perceive their home culture as ultimate reality, i.e. having a dominant
cosmopolitan or local orientation (Cleveland et al., 2011b; Riefler et al., 2012). An
individual with a dominant cosmopolitan orientation is described as "an open-minded
individual whose consumption orientation transcends particular cultures, localities or
communities and who appreciates diversity including trying products and services from
a variety of countries" (Riefler and Diamantopoulos, 2009, p. 415). Individuals with a
dominant local orientation, however, feel that they belong to their local community and
focus on local activities, events and products, while seeing their home culture as
ultimate reality (Riefler et al., 2012; Cannon and Yaprak, 2002). While a cosmopolitan
and local orientations co-exists within an individual, one orientation is often stronger
than the other; this is the individual‘s dominant orientation (Zhang and Khare, 2009).
The dominant cosmopolitan or local orientation consequently influences how the self-
concept guides an individual‘s attitude and behaviour.
1.6 Expected Impact of the ILCs on the Self-Congruity Effect
and Segmentation Value
It is important to consider the impact of these ILCs on the effect of the four self-
congruity types on brand attitude for the following reason. The four self-congruity types
function on the basis of an individual‘s need to satisfy four self-motives, and the
consumption of a self-congruent brand offers a means of satisfying this need.

10
Individuals differ in their need to satisfy the four different self-motives, which
consequently determines which self-motive has the strongest influence on an
individual‘s behaviour and attitude towards a brand. Empirical evidence shows that the
need to satisfy each of the four self-motives varies based on an individual‘s dominant
INTSC, INDSC, cosmopolitan or local orientation (e.g., Ralston et al., 1996; Aaker and
Lee, 2001; Locke and Christensen, 2007; Cleveland et al., 2011a). Therefore, it is
expected that an individual‘s dominant INTSC, INDSC, cosmopolitan and local
orientation will impact the effect of the four self-congruity types on brand attitude.
Moreover, empirical evidence shows that an individual‘s dominant INTSC and INDSC
correlate with several demographic (e.g. ethnicity, income, gender) and geographic
variables (Ahluwalia, 2008). For instance, income is positively related to consumers
with a dominant INDSC (Kim, 2005). Furthermore, Riefler et al. (2012) show that an
individual‘s dominant cosmopolitan and local orientation correlate with demographic
variables such as age, education and location. Hence, knowing which self-congruity
type will elicit the strongest positive attitude towards a brand among consumers with
these ILCs offers valuable insights for marketing practitioners in regard to their
segmentation and brand positioning strategies. The next section gives an overview of
the gaps in the literature, which this thesis aims to fill, thereby extending self-congruity
theory.
1.7 Research Gaps
This section elaborates on the three gaps outlined above in section 1.4. It discusses the
gaps and highlights why it is important to investigate them.

11
GAP 1: No study to date has empirically tested how strongly any individual-level
characteristics impact the effect of social and ideal social self-congruity on brand
attitude. Testing the effect of the social and ideal social self-concept (public selves) and
corresponding self-congruity types on brand attitude is important, as some individuals
(e.g. dominant INTSC) see their selves rather as connected than independent of one
another (Trafimow et al., 1991; Triandis, 1989; Kim et al., 1996). Therefore, social and
ideal social self-congruent brands are likely to have a stronger effect on brand attitude
than actual or ideal self-congruent brands for these individuals.
GAP 2: No study to date has empirically tested the impact of both self-construal types
on the effect of ideal, social, and ideal-social self-congruity on brand attitude. Sung and
Choi (2012) tested only the impact of both self-construals on the effect of actual self-
congruity on brand attitude, while Kim and Hyun (2013) tested only the impact of a
dominant INTSC on the effect of the four self-congruity types on purchase intent, but
did not consider a dominant INDSC. Testing the impact of both self-construals on the
effect of all four self-congruity types on brand attitude is important because individuals
with a dominant INTSC and INDSC differ in their need to satisfy the self-motives that
guide how strongly the four self-congruity types are likely to impact attitudes. Hence,
an individual‘s dominant INDSC and INDSC are likely to have a different impact on
the effect of the four self-congruity types on brand attitude. In addition, this thesis
addresses the limitations1 outlined by Kim and Hyun (2013) in their study. Specifically,
this thesis also considers individuals with a dominant INDSC, not just INTSC, using
1 Kim and Hyun outlined four limitations in their study, which they highlighted for consideration in future
research. First, they only tested the impact of an INTSC on the effect of the four self-congruity types on
purchase intent and not an INDSC. Second, they only considered publicly consumed brands in their
research design and not privately consumed brands. Third, they tested their conceptual framework only in
a collectivist country (i.e. South Korea) and not in an individualist country. Fourth, they used purchase
intent as an endogenous variable and recommended that future research also consider judgement-type
decision variables such as brand attitude.

12
both privately and publicly consumed brands in its research design. Furthermore, it tests
the external validity of the conceptual framework in two different countries (the US and
India) rather than just in South Korea. Lastly, this thesis tests the effect of the four self-
congruity types on brand attitude rather than purchase intent as the outcomes of the self-
congruity effects may vary (Sirgy, 1982).
GAP 3: No study to date has empirically tested the impact of an individual‘s dominant
cosmopolitan and local orientation on the effect of any of the four self-congruity types
on brand attitude. Testing the impact of an individual‘s dominant cosmopolitan and
local orientation on the effect of the four self-congruity types on brand attitude is
important because individuals with a dominant cosmopolitan and local orientation differ
in their need to satisfy the self-motives that guide how strongly the four self-congruity
types are likely to impact attitudes. Hence, an individual‘s dominant cosmopolitan and
local orientation is likely to impact the effect of the four self-congruity types on brand
attitude.
Moreover, besides testing which of the four self-congruity types has the strongest
overall effect on brand attitude for these consumer types, it is also important to
investigate which self-congruity type has the strongest effect on brand attitude within
private selves and public selves, hence considering this conceptual distinction (Aguirre-
Rodriguez et al., 2011). Such a conceptual distinction is also sensible for marketers.
Marketers seek to position their brand in the market by defining their brand‘s image
through brand communications (Roth, 1995). A successful brand is based on a brand
image that allows consumers to satisfy their self-expression needs, which will lead to
positive brand perceptions (Park et al., 1986; Kressmann et al., 2006). However,

13
marketers need to consider that some products and their brand image are more apt to be
communicated using themes depicting social/public situations, while others are more
apt to be communicated using themes depicting private situations (Roth, 1995; Graeff,
1996). This distinction is important as, for instance, social self-congruity types, which
are elicited through brand communications using social/public situations, are likely to
have a stronger impact than private self-congruity types for publicly consumed brands
(Sirgy et al., 2000). Therefore, marketers should also consider the distinction between
private and public selves when positioning and communicating their brands as well as
considering which self-congruity type has the strongest overall impact on brand attitude.
Consequently, insights into which self-congruity type within private selves (actual vs.
ideal) and public selves (social vs. ideal social) has a stronger impact on brand attitude
offers marketers additional options when designing their brand communications.
In summary, this thesis aims to fill the gaps outlined above. In doing so it extends self-
congruity theory by offering empirical evidence on which of the four self-congruity
types has the strongest effect on brand attitude (within private selves, within public
selves, and overall of all four self-types) if a consumer‘s INDSC, INTSC, cosmopolitan
and local orientation are considered. Furthermore, the results will provide marketers
with valuable segmentation insights. Specifically, it offers them insights into which of
the four self-congruity types they should emphasize with their brand communication
strategies to elicit the most positive brand attitude when targeting these specific
consumer groups (e.g. dominant cosmopolitan orientation). Additionally, research
shows that brand attitude does not always have a positive effect on purchase intent (e.g.
Bagozzi, 1992; Zarantonello and Schmitt, 2010). Thus, it is important to test whether
brand attitude has a positive impact on purchase intent in the context of this study for
consumers with a dominant INTSC, INDSC, cosmopolitan and local orientation.

14
1.8 Research Objectives
This thesis aims to extend self-congruity theory by empirically investigating the impact
of an individual‘s dominant INTSC, INDSC, cosmopolitan and local orientation on the
effect of the four self-congruity types on brand attitude. Moreover, it offers marketers
insights into which of the four self-congruity types they should emphasize in their brand
communications when targeting consumer groups with a dominant INTSC, INDSC,
cosmopolitan and local orientation. The three specific objectives are as follows:
Objective One: First, the thesis aims to offer empirical evidence on which of the four
self-congruity types (within private selves, within public selves, and overall of all four
self-types) has the strongest effect on brand attitude if an individual‘s dominant INDSC
and INTSC are considered.
Objective Two: Second, the thesis aims to offer empirical evidence on which of the
four self-congruity types (within private selves, within public selves, and overall of all
four self-types) has the strongest effect on brand attitude if an individual‘s dominant
cosmopolitan and local orientation are considered.
Objective Three: Third, the thesis aims to offer empirical evidence on whether brand
attitude has a positive effect on purchase intent when considering the aforementioned
ILCs.
1.9 Research Questions
Five research questions are formulated to address the three objectives of this thesis. The
research questions are as follows:

15
Objective One
RQ1: Within private self-congruity types (actual vs. ideal) and within public
self-congruity types (social vs. ideal social), which one has the strongest impact
on brand attitude considering an individual‘s dominant INTSC and INDSC (H1
to H4)?
RQ2: Which of the four self-congruity types has the strongest overall impact on
brand attitude considering an individual‘s dominant INTSC and INDSC (H5 and
H6)?
Objective Two
RQ3: Within private self-congruity types (actual vs. ideal) and within public
self-congruity types (social vs. ideal social), which one has the strongest impact
on brand attitude considering an individual‘s dominant cosmopolitan and local
orientation (H7 to H10)?
RQ4: Which of the four self-congruity types has the strongest overall impact on
brand attitude considering an individual‘s dominant cosmopolitan and local
orientation (H11 and H12)?
Objective Three
RQ5: Is there a positive relationship between brand attitude and purchase intent
(H13)?
Table 1.1 gives an overview of the research objectives, research questions and
corresponding hypotheses.

16
Table 1.1 Overview Research Objectives, Research Questions and Corresponding Hypotheses.
Objectives (O) Research Questions (RQ) Hypotheses (H) O1: The thesis aims to offer
empirical evidence on which of the
four self-congruity types (within
private selves, within public selves,
and overall of all four self-types) has
the strongest effect on brand attitude
if an individual‘s dominant INDSC
and INTSC are considered.
RQ1: Within private self-congruity types
(actual vs. ideal) and within public self-
congruity types (social vs. ideal social),
which one has the strongest impact on brand
attitude considering an individual‘s
dominant INTSC and INDSC (H1 to H4)?
H1: For an individual with a dominant INTSC actual self-congruity has a stronger
effect on BA than ideal self-congruity.
H2: For an individual with a dominant INDSC ideal self-congruity has a stronger
effect on BA than actual self-congruity.
H3: For an individual with a dominant INTSC social self-congruity has a stronger
effect on BA than ideal social self-congruity.
H4: For an individual with a dominant INDSC ideal social self-congruity has a
stronger effect on BA than social self-congruity.
RQ2: Which of the four self-congruity types
has the strongest overall impact on brand
attitude considering an individual‘s
dominant INTSC and INDSC (H5 and H6)?
H5: Overall, among the four self-congruity types, for an individual with a dominant
INDSC ideal self-congruity has the strongest effect on brand attitude.
H6: Overall, among the four self-congruity types, for an individual with a dominant
INTSC, social self-congruity has the strongest effect on BA.
O2: The thesis aims to offer
empirical evidence on which of the
four self-congruity types (within
private selves, within public selves,
and overall of all four self-types) has
the strongest effect on brand attitude
if an individual‘s dominant
cosmopolitan and local orientation
are considered.
RQ3: Within private self-congruity types
(actual vs. ideal) and within public self-
congruity types (social vs. ideal social),
which one has the strongest impact on brand
attitude considering an individual‘s
dominant cosmopolitan and local orientation
(H7 to H10)?
H7: For an individual with a dominant COS orientation ideal self-congruity has a
stronger effect on BA than actual self-congruity.
H8: For an individual with a dominant LOC orientation actual self-congruity has a
stronger effect on BA than ideal self-congruity.
H9: For an individual with a dominant COS orientation ideal social self-congruity
has a stronger effect on BA than social self-congruity.
H10: For an individual with a dominant LOC orientation social self-congruity has a
stronger effect on BA than ideal social self-congruity.
RQ4: Which of the four self-congruity types
has the strongest overall impact on brand
attitude and considering an individual‘s
dominant cosmopolitan and local orientation
(H11 and H12)?
H11: Overall, among the four self-congruity types, for an individual with a dominant
COS orientation ideal self-congruity has the strongest effect on BA.
H12: Overall, among the four self-congruity types, for an individual with a dominant
LOC orientation social self-congruity has the strongest effect on BA.
O3: The thesis aims to offer
empirical evidence on whether brand
attitude has a positive effect on
purchase intent when considering the
aforementioned ILCs.
RQ5: Is there a positive relationship
between brand attitude and purchase intent
(H13)?
H13: There is a positive relationship between brand attitude and purchase intent.

17
1.10 Methodology
From a methodological perspective these questions are addressed as follows. This thesis
takes the philosophical position of positivism. A quantitative approach is used to
analyse the data collected through an online questionnaire. A non-student sample is
acquired through the Amazon MTurk online platform (Buhrmester et al., 2011). To
establish the cross-national validity of the proposed conceptual framework, data are
collected from two countries (the US and India) that differ in terms of their individual‘s
levels of long-term orientation and power distance (Hofstede, 2012). Four consumer
brands are selected through two preliminary studies and tests are conducted to ensure
the cross-national comparability of the brands and relevance to the respondents.
Specifically, tests are conducted to assure that the brands chosen are perceived similarly
in regard to familiarity, product involvement and prestige/status (Malär et al., 2011;
Kent and Allen, 1994; Kirmani et al., 1999). Subsequently, the main questionnaire is
developed and pilot tested. The scales used have all been developed and validated in
previous studies. The data are analysed with a two-stage Partial Least Squares Structural
Equation Modelling (PLS-SEM) approach (Lohmöller, 1989a). Step one validates the
research instrument and step two evaluates the structural model and empirically tests the
hypotheses (Anderson and Gerbing, 1988).
1.11 Research Contributions
This thesis offers theoretical contributions to self-congruity theory. Moreover, it has
managerial implications.
18
First, from a theoretical perspective, this thesis extends self-congruity theory by
providing empirical evidence on the impact of an individual‘s dominant INTSC and
INDSC on the effect of all four self-congruity types on brand attitude. Specifically,
the thesis offers empirical evidence within private self-congruity types (actual vs. ideal),
public self-congruity types (social vs. ideal social), and overall of the four self-
congruity types on which one has the strongest impact on brand attitude considering an
individual‘s dominant INTSC and INDSC. Second, this thesis extends self-congruity
theory by providing empirical evidence on the impact of an individual‘s dominant
cosmopolitan and local orientation on the effect of all four self-congruity types on
brand attitude. Specifically, the thesis offers empirical evidence within private self-
congruity types (actual vs. ideal), public self-congruity types (social vs. ideal social),
and overall of the four self-congruity types on which one has the strongest impact on
brand attitude considering an individual‘s cosmopolitan and local orientation.
Overall, empirical evidence on how these ILCs impact the four self-congruity types that
affect brand attitude offers an extended understanding of the self-congruity effect, hence
extending self-congruity theory. Moreover, the results of this thesis also have also
managerial implications, which are discussed below.
First, from a managerial perspective, this thesis offers marketers insights into which of
the four self-congruity types they should try to match with their brand positioning
strategies when targeting and segmenting consumer groups based on their dominant
INDSC, INTSC, cosmopolitan and local orientation. For instance, the findings of this
thesis show that individuals with a dominant local orientation, such as those living in
rural areas and focusing on local traditions, have the most positive attitude towards

19
brands with an image congruent with their actual self-concept. Therefore, marketers
targeting such consumers are advised to use authentic branding approaches that make
consumers believe that using their brand allows them to verify their actual self-concept
(e.g. using regular-sized models in an advertisement). Conversely, the findings show
that individuals with a dominant cosmopolitan orientation have the most positive
attitude towards brands congruent with their ideal self-concept. Hence, marketers should
use aspirational branding approaches (e.g. using slim and attractive models in an
advertisement) that make consumers believe that using their brand allows them to foster
their ideal self-concept.
Second, this thesis offers marketers insights into how to communicate with consumers
through targeted messages that match the self-concept type that has the strongest effect
on their brand attitude, while also selecting the appropriate marketing channels to reach
them. Research shows that consumers with a dominant cosmopolitan orientation or
independent self-construal display a predisposition to using new technologies,
innovative products and online shopping (Westjohn et al., 2009; Ma et al., 2013).
Consequently, marketers can use the insights provided by this thesis to choose specific
marketing channels such as web-based social media that are predominantly used by
their target segment (e.g. cosmopolitans), and to customize their brand communications
accordingly.
1.12 Thesis Structure
This thesis is composed of nine chapters along with appendices and references. Figure
1.1 offers an overview.

20
Figure 1.1 Thesis Structure
Thesis Introduction
Literature Review
Theoretical
Foundations
Theoretical
Foundations Previous Empirical
Findings
Previous Empirical
Findings Gaps in the
Literature
Gaps in the
Literature
Conceptual Framework & Hypotheses
Methodology
Research
Design
Research
DesignData CollectionData Collection Data
Analysis
Data
Analysis
Results Preliminary Studies I, II and Pilot Test
Cross-National Comparability of
Brands (US vs. Indian Samples)
Cross-National Comparability of
Brands (US vs. Indian Samples)2 Publicly & 2 Privately Consumed
Brands; 4 Product Categories
2 Publicly & 2 Privately Consumed
Brands; 4 Product Categories
Results Data Collection and Measurement Models
Respondent
Profile
Respondent
ProfileData Collection &
Cleaning
Data Collection &
CleaningMeasurement
Models
Measurement
Models
Results Structural Models and Hypotheses
Structural Models
US & India
Structural Models
US & India13 Hypotheses
Results
13 Hypotheses
Results Post-Hoc Tests
Demographics
Post-Hoc Tests
Demographics
Discussion
Conclusion
SummarySummary ContributionsContributionsLimitations &
Future Research
Limitations &
Future Research
The current chapter (Thesis Introduction) has offered on overview of the research
background and briefly introduced the conceptual foundations of the thesis. Moreover,
it has offered a summary of the current state of self-congruity research and gaps in the
literature, the research objectives, research questions, methodology, and contributions of
the thesis.
Chapter two is the Literature Review. It discusses in detail the conceptual foundations
of the self-concept and self-congruity theory, and an individual‘s dominant INDSC,
INTSC, cosmopolitan and local orientation. Moreover, it critically reviews the relevant

21
literature and identifies the gaps therein. In doing so it offers the theoretical foundations
for the conceptual framework and hypotheses which are discussed in the following
chapter.
Chapter three is the Conceptual Framework and Hypotheses. It explains the
theoretical links between the four self-congruity types, INTSC, INTSC, cosmopolitan
and local orientation, brand attitude and purchase intent. Moreover, it presents the
thirteen hypotheses of the thesis.
Chapter four is the Methodology. It presents the philosophical stance of the thesis,
research approach, geographic rationale, data collection methods, questionnaire design,
and approaches used to analyse the data.
Chapter five is the Results Preliminary Studies I, II and Pilot Study. This chapter
presents the steps taken and results of the data analysis of the two preliminary studies,
which focus on selecting the brands for the main study. Moreover, it offers the results of
the pilot study of the main study questionnaire.
Chapter six is the Results Data Collection and Measurements Models of the Main
Study. It offers information on the data collection and cleaning procedures, respondent
profiles, and the results of the measurement models.
Chapter seven is the Results Structural Models and Hypotheses of the Main Study.
It presents the results of the structural models, 13 hypotheses and post-hoc tests of the
demographic variables.

22
Chapter eight is the Discussion. It discusses the theoretical underpinnings of the results
and links the findings with the existing literature.
Chapter nine is the Conclusion. It briefly summarizes the study and discusses its
contributions. Furthermore, if sets out the limitations of the study and offers directions
for future research.
1.13 Conclusion
This chapter presented the research background and importance of the current thesis. In
addition, it introduced the conceptual foundations of this thesis, the current state of self-
congruity research and gaps in the literature. Furthermore, it presented the research
objectives and resulting research questions as well as a brief description of the applied
methodological approach. This was followed by the contributions of the study,
concluding with the structure of the thesis. Chapter 2 (Literature Review) offers a more
detailed discussion on the conceptual foundations of this thesis as well as a critical
review of the relevant literature, which sets the stage for the conceptual framework and
hypotheses presented in chapter 3.

23
Chapter 2 - Literature Review
2.1 Introduction
This chapter offers a detailed review of the literature on the main concepts of this thesis
that create the foundation for the conceptual framework presented in Chapter 3. This
chapter is structured as follows. Section 2.2 presents the conceptual foundations of the
self-concept. Section 2.3 discusses the conceptual foundations of self-congruity theory
and offers a review of the corresponding literature. Subsequently, section 2.4 offers a
synthesis of the current state of self-congruity research and research gaps. Sections 2.5
to 2.7 present the individual-level characteristics used in this thesis and discuss the
importance of considering their impact on the self-congruity effect. Section 2.8 offers
the conclusion of the chapter.
2.2 The Self-Concept
The self-concept is a key construct in consumer behaviour, because consumers use
brands as a means of self-expression and consequently form attitudes towards them
(Grubb and Grathwohl, 1967; He and Mukherjee, 2007; Sung and Choi, 2012; Belk,
1988). This section defines the self-concept and presents its main characteristics,
including the conceptual link between self-motives and the self-concept.
2.2.1 Self-Concept Definition
Although the self-concept has received extensive attention in past research (e.g. E.
Hupfer and Detlor, 2007; Mehta, 1999a; Torelli, 2006), there is still a lack of agreement
with respect to how the self-concept is defined. From a review of the marketing

24
literature it becomes evident that the terms ‗self-identity‘ (e.g. Swaminathan et al.,
2007), ‗self-image‘ (e.g. Sung and Choi, 2012) and ‗self-view‘ (e.g. Sprott et al., 2009),
are used synonymously with self-concept (for details on this review and examples see
Appendix 2.1). A widely used definition (e.g. Mehta, 1999a; Hogg et al., 2000; Yim et
al., 2007) is adopted in this thesis and states that self-concept represents the ―totality of
an individual‘s thoughts and feelings having reference to himself as an object‖
(Rosenberg, 1979, p. 7). This definition arguably encompasses the various views of
previous researchers (e.g. Cooley, 1964; Hattie, 1992; James, 1890; Mead, 1934).
Specifically, it entails how an individual processes internalized (private) aspects of the
self-concept as well as the importance placed on social interaction as part of the self-
concept formation process (Appendix 2.2 offers an overview of the various self-concept
definitions used in the literature).
Following previous research, this thesis adopts a cognitive perspective of the self-
concept (e.g. Oyserman et al., 2002; Cury et al., 2006; Ahluwalia, 2008; Bolton et al.,
2010). This is due to the fact that research on self-construals, which are an integral
conceptual element of this thesis, emerged from the cognitive research domain. A
cognitive perspective conceives the self-concept as a knowledge structure containing the
total amount of information an individual encodes about him/herself across the lifespan
(Markus, 1977; Linville and Carlston, 1994). Adopting a cognitive perspective of the
self-concept is important because the cognitive appraisal of the self-concept is a strong
driver of the control and direction human behaviour takes (Burn, 1979).

25
2.2.2 Self-Concept Characteristics and Self-Motives
Historically a variety of different ideas about characteristics of the self-concept have
emerged in the literature (Markus and Wurf, 1987). Initially researchers conceived the
self-concept as a mono-dimensional entity, specifically the actual self-concept (e.g.
Birdwell, 1968; Grubb and Stern, 1971). However, today it is widely agreed that it is a
multi-dimensional entity composed of four types (Sirgy, 1982; Sirgy, 1985). This view
has been adopted in numerous self-congruity studies over the last decade and is also
adopted in this thesis (e.g. He and Mukherjee, 2007; Sirgy et al., 2000; Kang et al.,
2011; Kressmann et al., 2006).
According to Sirgy (1982; 1985) the four self-concept types are as follows: The first
two are the actual self-concept, which is defined as how consumers see themselves and
the ideal (desired) self-concept, which focuses on how consumers would like to see
themselves. The actual and ideal self-concept are both also known as private selves
which consist of cognitions that focus solely on internal aspects of an individual‘s self-
concept without the inclusion of others (Greenwald and Pratkanis, 1984). The other two
self-concept types are the social self-concept, which refers to how consumers believe
they are seen by others and the ideal social self-concept, which focuses on how
consumers would like to be seen by others. The social and ideal social self-concept are
both also known as public selves as they focus on cognitions of how others view an
individual‘s self-concept (Greenwald and Pratkanis, 1984). Individuals have all four self-
concept types and each of them independently influences an individual‘s behaviour and
attitudes (Markus and Wurf, 1987; Markus and Nurius, 1986). However, how strongly
each of these four self-concept types impact behaviour and attitudes depends on what
motivates a particular individual (i.e. his/her self-motives). This is due to the fact that
human behaviour is guided by different self-motives (Markus and Wurf, 1987; Aguirre-
Rodriguez et al., 2011; James, 1890; Lecky, 1945). Leary (2007) describes self-motives

26
as the inclination to establish and maintain a particular state of the self-concept (e.g.
actual, ideal self-concept). That is, self-motives are the mechanisms/foundations on
which the four self-concept types function and each of the four self-concept types is
based on satisfying an underlying self-motive need. Numerous studies have shown that
the importance that an individual places on a specific self-concept type is determined by
the self-motive that guides the individual‘s behaviour and attitudes (e.g. Swann, 1983;
Swann et al., 1992; Raskin et al., 1991b; Sedikides and Gregg, 2008). The four self-
motives are described below.
In regard to the actual self-concept the self-consistency motive is the underlying motive
(Aguirre-Rodriguez et al., 2011). The self-consistency motive, sometimes called the
self-verification motive (Swann, 1983), is based on the premise that individuals are
motivated to act in ways that allow them to maintain an image congruent with their
existing self-concept. Individuals try to resist change to their (actual) self-concept
because of an ―inborn preference for things that are predictable, familiar, stable, and
uncertainty reducing‖ (Swann, 1983, p.34). With respect to the ideal self-concept, the
self-enhancement motive, sometimes called the self-esteem motive is the underlying
motive (e.g. Sirgy et al., 2000). It posits that individuals are motivated to enhance their
feelings of personal self-worth to boost their self-esteem (Sedikides and Strube, 1997).
The goal of the individual is to reach a desired or ideal state of the self-concept, because
humans attempt to enhance their feeling of self-regard in a positive manner (Rosenberg,
1979).
In regard to the social self-concept, the social consistency/conformance motive is the
underlying motive. It indicates that individuals are motivated to maintain an image
others have of them (Sirgy et al., 2000; Swann, 1983), because this allows them to

27
verify their social self-concept (Swann Jr. et al., 2003). With respect to the ideal social
self-concept, the social approval/esteem motive is the underlying motive. It posits that
individuals are motivated to do things that may cause others to think highly of them
(Sirgy et al., 2000). They self-enhance to pursue positive self-esteem in the search for
social approval or acceptance (Raskin et al., 1991b), which is relevant in fostering their
ideal social self-concept.
Individuals have a need to satisfy all of these four self-motives (Zinkhan and Hong,
1991; Swann, 1983). However, they differ in regard to how strongly they feel the need
to satisfy each self-motive. This consequently determines which self-concept type has
the strongest effect on an individual‘s behaviour and attitude (Markus and Kitayama,
1991; Malär et al., 2011; He and Mukherjee, 2007). Therefore, if marketers understand
the self-motive needs of consumers with specific individual characteristics (e.g.
interdependent self-construal) they can emphasize in their brand communications the
corresponding self-concept type that is likely to elicit the strongest positive attitudes
towards their brands. For instance, some individuals see themselves as connected to
(interdependent) rather than independent of others (Trafimow et al., 1991). Therefore,
for an individual who perceives his/her self-concept to be connected to others, his/her
need for social-consistency or social approval is likely to guide attitudes stronger than
satisfying his/her need for self-consistency or self-enhancement. In this case, the
individual‘s social and ideal social selves (public selves) are likely to have a stronger
effect on his/her attitude and behaviour than the actual and ideal selves (private selves).
In summary, there are four self-concept types that independently influence an
individual‘s behaviour and attitude (Sirgy and Johar, 1999). This is due to the fact that
there are four self-motives on which the four self-concept types function and that guide

28
an individual‘s behaviour and attitude (Leary, 2007; Aguirre-Rodriguez et al., 2011).
Individuals have all four self-motives, but they vary in their need to satisfy the four self-
motives depending on their individual characteristics (e.g. dominant interdependent
self-construal). Therefore, individual-level characteristics determine which self-concept
type is likely to have a stronger effect on their attitudes.
The next section describes Sirgy‘s (1982) self-image/product image congruity theory, or
self-congruity theory for short (e.g. Kang et al., 2011; Kressmann et al., 2006; Ekinci
and Riley, 2003). Self-congruity theory is integral to this thesis as it is based on the
match between a consumer‘s self-concept (any of the four types) and a brand‘s image,
and how this match (congruity) consequently affects brand attitudes. Therefore, it offers
the theoretical foundation on which to investigate which of the four self-congruity types
leads to the strongest brand attitude for consumers with specific individual
characteristics (e.g. dominant cosmopolitan orientation).
2.3 Self-Congruity Theory
Self-congruity theory posits that as the perceived similarity (congruence) between a
user‘s self-concept (any of the four types) and the brand‘s image increases, the resultant
brand attitude will be more positive (Sirgy et al., 1991). Self-congruity theory assumes
that consumers use a brands image as a way to define themselves and that they purchase
brands with a specific image to express/symbolize their self-concept (Aaker, 1999;
Belk, 1988). The two interacting elements of self-congruity are (a) the self-concept and
(b) brand‘s image. The self-concept has been defined in the previous section. The
second element, brand image or brand-user image (Sirgy et al., 1997), is described as a
stereotyped perception of the generalized user of a particular brand, represented by
29
human characteristics (e.g. classy, sporty, dynamic) associated with that brand user
(Sirgy, 1982; Parker, 2009). The importance of the four self-motives in determining
how strongly each self-concept type affects an individual‘s behaviour and attitude is
also relevant for self-congruity theory. Individuals try to satisfy their self-motive needs
and the consumption of brands allows them to accomplish this (Howard and Sheth,
1969). For instance, if a consumer has a strong need for social consistency, the social
self-concept will likely have a strong effect on his/her attitudes. Consequently, a brand
perceived as congruent with his/her social self-concept allows him/her to satisfy the
need for social consistency, hence prompting a positive attitude towards that brand
(Kressmann et al., 2006; Sirgy and Johar, 1999).
2.4 Review of Self-Congruity Studies
Over the last two decades the literature2 on self-congruity theory has evolved by testing
the effect of self-congruity on various brand-related outcomes. Numerous studies have
empirically confirmed the positive effect of self-congruity on brand related outcomes
such as brand attitude, brand loyalty and purchase intent (e.g. Liu et al., 2012a;
Kressmann et al., 2006; Hong and Zinkhan, 1995). This section offers a critical review
of the key findings of studies applying self-congruity theory. After discussing these
studies the section concludes with a synthesis of the current state of self-congruity
theory and research gaps. This offers the foundation upon which this thesis aims to
extend self-congruity theory further.
2 In order to establish what the current state in of self-congruity research, the main focus of the literature
review was on studies concentrating on brand related outcomes and were published from the year 2000
onwards in highly regarded marketing, international business/marketing, advertising and consumer
psychology journals. A list of those journals can be found in Appendix 2.3. However, other studies that
were cited within those studies and deemed of relevance were also included as a second step. Such an
approach was intended to generate an updated overview of the empirical findings in this particular area of
research, which was valuable in establishing a research question/s that can contribute to the current
debates.

30
2.4.1 The Four Self-congruity Types
To a large extent studies focus only on testing the effect of actual self-congruity on
brand-related outcomes. Specifically, there is empirical evidence that actual self-
congruity has a positive effect on brand attitude and purchase intent (e.g. Aaker, 1999;
Hogg et al., 2000; Liu et al., 2012a) and brand loyalty (e.g. Kressmann et al., 2006;
Mazodier and Merunka, 2011). However, the psychology literature offers evidence that
individuals are also motivated to self-enhance to reach a more desired or ideal view of
their self-concept (James, 1890; Sedikides and Strube, 1997). Therefore, researchers
also became interested in studying also the effect of ideal self-congruity on brand
related outcomes. Studies show that ideal self-congruity also has a positive effect on
brand attitude and purchase intent (Graeff, 1996; Hong and Zinkhan, 1995), brand re-
purchase intent (Marshall et al., 2008) and emotional brand attachment (Malär et al.,
2011). In addition, research has sought to establish which self-congruity type has the
greatest impact on brand-related outcomes. Such an investigation is important because it
offers marketers insights into which self-concept type they should emphasize in their
brand communications to elicit the most positive brand perceptions (e.g. using slim
models in an ad in order to appeal to a consumer‘s ideal self-concept). In this context,
several studies have provided evidence that ideal self-congruity has a stronger effect on
brand attitude and purchase intent (Graeff, 1996; Hong and Zinkhan, 1995), brand re-
purchase intent (Marshall et al., 2008), and emotional brand attachment (Malär et al.,
2011) than actual self-congruity. These researchers explain their findings on the basis
that the motivation/need of an individual to self-enhance to foster a positive or ideal
image of him/herself is stronger than his/her need for self-consistency. Considering that
ideal self-congruent brands allow individuals to satisfy their need to self-enhance, the
effect of ideal self-congruity on brand-related outcomes is therefore stronger than the
actual self-congruity effect.

31
Two studies show that all four self-congruity types have a positive effect on brand
attitude (Sirgy and Johar, 1999) and coffee store attitude/repurchase intent (Kang et al.,
2011). However, these two studies do not test which of the four self-congruity types has
the strongest effect on the brand-related outcomes. Rather, they use an overall score by
aggregating the four self-congruity types. Explicit reasons for aggregating the various
self-congruity types rather than treating them independently are not provided, but this
approach was likely due to the focus of their study. Specifically, they focus on
comparing the effect of self-congruity as a whole versus the effect of functional
congruity on the aforementioned constructs. Functional congruity is the match between
the consumer‘s beliefs about brand utilitarian attributes (e.g. technical aspects and
performance) and the consumer‘s referent attributes (Sirgy and Johar, 1999).
Conceiving self-congruity as a whole entails a conceptual limitation as it does not
account for the independent effect of each self-congruity type (Aguirre-Rodriguez et al.,
2011; Markus and Wurf, 1987). Moreover, it does not offer insights into which self-
concept type marketers should try to emphasize in their brand communications to elicit
the most positive attitude towards their brand. Kang et al. (2011, p.9) acknowledge this
as a limitation of their study and highlight that future work should investigate the effects
of the four self-congruity types on consumer attitudes independently as ―such a step will
provide more precise information for marketers in brand positioning and segmentation‖.
This thesis follows up on Kang et al.‘s (2011) suggestion and focuses on investigating
the independent effects of each of the four self-congruity types on brand attitude.
In addition, previous studies also show that the self-congruity effect on brand
perceptions depends on a brand‘s conspicuousness type, i.e. whether the brand is
consumed in public or in private settings (Sirgy and Johar, 1999). Empirical evidence
shows that the self-congruity effect on brand attitude for privately consumed brands is

32
weaker compared to publicly consumed brands (Sirgy and Johar, 1999). More
specifically, for publicly consumed brands the effect of ideal self-congruity on brand
attitude is stronger than for actual self-congruity, while for privately consumed brands
no difference was found (Graeff, 1996). Moreover, researchers have suggested (e.g.
Sirgy et al., 2000) that the effect of public self-congruity types (social and ideal social)
on brand perceptions is stronger for publicly consumed brands than the effect of private
self-congruity types (actual and ideal). When a brand is consumed publicly, consumers
seek to impress others through their act of consumption, which is not as prevalent when
the brand is consumed in private (Dolich, 1969; Kressmann et al., 2006). Hence, it is
likely that brand conspicuousness also moderates the self-congruity effect on brand
attitude when comparing the four self-congruity types. For example, for individuals
whose behaviour and attitude are guided more strongly by their social self-concept
(social consistency motive) than by their actual self-concept (self-consistency motive), a
publicly consumed brand might have a stronger impact on brand attitude than a
privately consumed brand. Therefore, it is important to consider the distinction between
the two brand conspicuousness types in a study‘s research design when investigating at
the effect of all four types of self-congruity on brand attitude (the implications for the
research design in this thesis are offered in Chapter 4, Section 4.5.3).
A recent meta-analysis by Aguirre et al. (2011) offers an extensive overview of the self-
congruity effect and addresses the issue of which self-congruity types have the strongest
impact on consumer attitudes. Specifically, they show that actual and ideal self-
congruity (private self-types) have a stronger impact on consumer attitudes than social
and ideal social self-congruity (public self-types). They argue that private self-concept
types incorporate and also reflect social standards, as positive social selves also induce

33
self-esteem for their private selves (Leary et al., 1998). However, their findings should
not be seen as conclusive with regard to which self-congruity type has a stronger effect
on consumer attitudes. Sung and Choi (2012) highlight that self-congruity theory has
rarely been tested on samples that go beyond the US. This also applies to the studies
used by Aguirre Rodriguez et al. (2011) in their meta-analysis. Considering that the
majority of individuals in Western countries (e.g. US) have a dominant INDSC (Aaker
and Schmitt, 2001) and that self-construals were not considered in this meta-analysis,
the results are likely to be biased towards individuals with a dominant INDSC. For
instance, consumers with a dominant INTSC have a strong need for social
consistency/conformance and social approval (Locke and Christensen, 2007). Thus, it is
likely that social and ideal social self-congruity (public self-types) have a stronger
impact on consumer attitude for individuals with a dominant INTSC, which would be in
conflict with the results offered by Aguirre-Rodriguez et al. (2011). Specifically, out of
45 studies used in the meta-analysis, only five studies went beyond private selves and
measured the effect of public selves on consumer attitudes. Moreover, of those five
studies only one study (i.e. Ibrahim and Najjar, 2008) was not based on a Western
sample (three US and one Australian). Therefore, the findings of the meta-analysis
provide only a limited view of the self-congruity effect (independent four types), as it
did not consider the impact of individual-level characteristics, for instance, both self-
construal.
Thus, it is essential to test the impact of individual-level characteristics (ILCs) on the
self-congruity effect as individuals differ in their need to satisfy the four self-motives
(Malär et al., 2011; Markus and Kitayama, 1991). The differing needs to satisfy each
self-motive subsequently determine which self-congruity type is likely to have the
strongest effect on brand attitude for an individual. Therefore, there can be no universal

34
self-congruity effect that applies to all individuals, which in recent years has motivated
an interest among researchers to investigate the impact of ILCs on the self-congruity
effect. The next section offers a critical review of these studies.
2.4.2 Individual-Level Characteristics’ Impact on the Self-Congruity
Effect
Malär et al.‘s (2011) findings show that an individual‘s product involvement levels,
self-esteem and public self-consciousness impact how strongly actual self-congruity and
ideal self-congruity affect brand perceptions. They argue that each of these individual-
level variables has a vital motivating impact on how strongly actual and ideal self-
congruity affects brand perceptions. For instance, individuals with low self-esteem
levels have a stronger need to self-enhance (self-enhancement motive) than those with
already high self-esteem levels. This is based on the human need to feel good about
oneself and to boost ones self-esteem (Rosenberg, 1979). Thus, consumers with low
self-esteem prefer brands congruent with their ideal self-concept rather than their actual
self-concept. This is due to the fact that ideal self-congruent brands offer individuals
with low self-esteem a means of satisfying their need to self-enhance and boost their
self-esteem. In contrast, individuals with high self-esteem levels prefer brands that
match their actual self-concept as they are already content with their actual self-image.
Two studies investigate the impact of self-construals on how strongly the various self-
congruity effects affect brand-related outcomes (Sung and Choi, 2012; Kim and Hyun,
2013), which highlights the importance of considering self-construals. Sung and Choi
(2012) offer empirical evidence of a positive effect of actual self-congruity on brand
attitude for Korean as well as US respondents. Specifically, respondents from the US

35
sample, who have a dominant INDSC, demonstrate a stronger effect of actual self-
congruity on brand attitude than Korean respondents with a dominant INTSC. This
finding is explained on the basis of higher self-consistency needs among individuals
from the US (Suh, 2002), which impacts the effect of actual self-congruity on brand
attitude. However, Sung and Choi (2012) contrast the results based on respondents from
different countries (US vs. South Korea), who have a different dominant self-construal.
Thus, their comparison is rather on a country level than on a self-construal level. This
approach entails a limitation, as individuals from the US and South Korea differ in
terms of cultural variables such as long-term orientation and power distance (Hofstede,
2012). For instance, individuals with high long-term orientation (LTO) tend to be
motivated to foster connections and avoid conflict in order to conform with others rather
than to self-enhance (Ryu and Moon, 2009; Bearden et al., 2006). The tendency to focus
on conformity is likely to influence the actual self-congruity effect on brand attitude.
Therefore, it is possible that besides self-construals, other factors pertaining to each of
the two countries (e.g. LTO differences) influence the results significantly. Furthermore,
their study did not set out to investigate the impact of an INTSC and INDSC on the
effect of ideal, social and ideal social self-congruity types on brand attitude; rather they
simply considered actual self-congruity. Hence, they do not offer insights into which of
the four self-congruity types has a stronger impact on brand attitude depending on an
individual‘s INTSC and INDSC self-construal.
Kim and Hyun (2013) build on Sung and Choi‘s (2012) research and consider the
impact of an INTSC on the effect of the four self-congruity types on purchase intent.
They show that for Korean respondents (a collectivist country) with a dominant INTSC
the effect of social and ideal social self-congruity on purchase intent are stronger than
the effect of actual and ideal self-congruity. The rationale offered for this outcome is

36
that individuals from collectivist countries with a dominant INTSC have an emphasized
need to satisfy public self-motives (i.e. social conformance, social approval) rather than
private self-motives (i.e. self-consistency, self-enhancement). Therefore, brands
congruent with their two public selves allow them to satisfy these needs and are more
likely to be purchased than those congruent with their two private selves. However, Kim
and Hyun (2013) highlight four limitations of their study. First, they only tested
individuals with a dominant INTSC. Future research should also consider the impact of
an individual‘s dominant INDSC on the effect of the four self-congruity types on brand
perceptions. Individuals with an INDSC have different self-motive needs from those
with an INTSC; thus, it is likely that the self-congruity effects on brand perceptions will
differ. Second, they used only publicly consumed brands in their research design.
Considering that brand conspicuousness type affects the self-congruity effect (Graeff,
1996), future research should also incorporate privately consumed brands in the
research design to offer more generalizable results. Third, the hypotheses were tested
only in a collectivist country (South Korea). To test the external validity of the
conceptual framework, future research should test whether the relationships also hold in
an individualist country (e.g. the US). Fourth, their endogenous variable was purchase
intent, which is considered a choice-type decision variable. They highlight that future
research should also consider judgement-type decision variables such as brand attitude,
as the outcomes of the self-congruity effects may vary (Sirgy, 1982). For instance, a
consumer may have very positive attitude towards the Ferrari automobile based on
his/her judgement of the brand, but he/she will not consciously make an effort or choice
to purchase a Ferrari, due to limited financial resources. Building on the study by Kim
and Hyun (2013), this thesis accounts for the four limitations outlined. Specifically, it
also considers individuals with a dominant INDSC and uses publicly and privately
consumed brands in its research design. Moreover, it tests the external validity of its

37
conceptual framework in two different countries (the US and India) and tests the effect
of the four self-congruity types on brand attitude rather than purchase intent. Appendix
2.5 offers an overview of all the self-congruity studies reviewed.
2.4.3 Current State of Self-Congruity Research and Gaps
In synthesis, the literature offers empirical evidence that the four self-congruity types
have an independent effect on brand perceptions (e.g. Kressmann et al., 2006; Sirgy and
Johar, 1999). Recent research challenges the view that there is a universal self-congruity
effect (e.g. Malär et al., 2011; Kim and Hyun, 2013), hence, increasing the importance
of investigating how ILCs impact the effect of the four self-congruity types on brand
perceptions. Besides the theoretical knowledge of how these ILCs impact the self-
congruity effect, it offers marketers insights into which self-concept type they should try
to emphasize in their brand communications to elicit the strongest positive attitude from
consumers (Kang et al., 2011). However, although some studies have considered the
impact of ILCs on the self-congruity effect, there are still various gaps in the literature.
First, no study has empirically investigated the impact of any ILCs on the effect of
social and ideal social self-congruity (public self-concept types) on brand attitude.
Previous research only tested the impact of ILCs (e.g. product involvement levels) on
the effect of actual and ideal self-congruity on brand perceptions (Malär et al., 2011).
Testing the impact of both public self-congruity types on brand attitude is important as
some individuals (e.g. those with a dominant INTSC) see their selves as connected to
rather than independent from one another (Markus and Kitayama, 1991). Therefore,
social and ideal social self-congruent brands are likely to have a stronger effect on brand
attitude than actual or ideal self-congruent brands for these individuals.

38
Second, no study to date has empirically tested the impact of both self-construal types
on the effect of ideal, social, and ideal-social self-congruity on brand attitude. Sung
and Choi (2012) tested only the impact of both self-construal types on the effect of
actual self-congruity on brand attitude, while Kim and Hyun (2013) tested the impact of
an INTSC on the effect of the four self-congruity types on purchase intent, which
should be differentiated from brand attitude as the outcomes of the self-congruity effects
may vary (Sirgy, 1982). Testing the impact of both self-construal types on the effect of
all four self-congruity types on brand attitude is important because individuals with a
dominant INTSC and INDSC differ in their need to satisfy the self-motives that
determine how strongly the four self-congruity types are likely to impact attitudes.
Hence, an individual‘s dominant INDSC and INDSC are likely to have a different
impact on the effect of the four self-congruity types on brand attitude.
Third, no study to date has empirically tested the impact of an individual‘s
cosmopolitan and local orientation on the effect of any of the four self-congruity
types on brand attitude. Such an investigation is important because individuals with a
dominant cosmopolitan and local orientation differ in their need to satisfy the self-
motives that determine how strongly the four self-congruity types are likely to impact
attitudes. Hence, an individual‘s dominant cosmopolitan and local orientation is likely
to impact the effect of the four self-congruity types on brand attitude.
This thesis aims to fill these gaps. In doing so, the findings aim to extend self-congruity
theory by showing the impact of a dominant INTSC, INDSC, cosmopolitan and local
orientation on the effect of the four self-congruity types on brand attitude. It will
thereby explain the research questions on which self-congruity type (within private

39
selves, within public selves, and overall of all four self-types) leads to the strongest
brand attitude for these specific consumer types.
The following section presents in detail the conceptual foundations of a dominant
INTSC and INDSC as well as cosmopolitan and local orientation and why these
individual-level characteristics are expected to impact the effect of the four self-
congruity types on brand attitude. Moreover, it discusses the importance of considering
the impact of these ILCs on the self-congruity effect from a segmentation perspective.
2.5 Self-Construals
Self-construals are individual-level cultural characteristics; they are determined by
cultural surroundings such as traditions, religions, life philosophies and socialization
processes and are conceptually related to Hofstede‘s (1980) individualism-collectivism
dimensions (Markus and Kitayama, 1991; Sharma, 2010). Individualism-collectivism is
used at the country level and independent-interdependent self-construal at the individual
level (Polyorat and Alden, 2005b). Individuals with a dominant independent self-
construal (INDSC) focus on unique personal traits and attributes as well as de-
emphasizing others. Individuals with a dominant interdependent self-construal (INTSC)
place an emphasis on social aspects of their self-concept and how the self-concept is
related to others (Escalas and Bettman, 2005; Markus and Kitayama, 1991). Research
offers support for the influence of self-construals in a variety of contexts and disciplines
such as psychology, communications and marketing (e.g. Hannover et al., 2006;
Gudykunst et al., 1996; Zhang, 2009). For instance, in the marketing domain, there is
empirical evidence that self-construals impact a consumer‘s perception of prices
fairness and his/her repurchase intention (Bolton et al., 2010), acceptance of brand

40
extensions (Ahluwalia, 2008), and brand associations (NG and Houston, 2006), to name
a few.
Moreover, studies show (e.g. Aaker and Lee, 2001) that in individualist cultures, a large
proportion of individuals tend to have a dominant independent self-construal (INDSC).
Conversely, individuals are more likely to have a dominant interdependent self-
construal (INTSC) in collectivist cultures (Markus and Kitayama, 1991; Triandis,
2004). In the past, studies used Hofstede‘s country-level dimensions to explain
differences in the results between individuals from two countries by making post-hoc
assumptions that these differences can be explained by a specific cultural dimension
(e.g. individualism-collectivism). However, committing such an ―ecological fallacy‖ is
problematic, as it assumes that country-level variables (ecological indices) also apply to
all individuals within that country (Bond, 2002). Therefore, various researchers insist
that individual-level differences (i.e. self-construals) should be measured, rather than
assuming that all people within a country are the same (Kim et al., 1996; Escalas and
Bettman, 2005). With respect to individual-level cultural measures, Triandis et al.‘s
(1985) allocentrism and idiocentrism are equivalent to INTSC and INDSC. However,
self-construal is the more widely used concept of the two in marketing studies (e.g.
Ahluwalia, 2008; Bolton et al., 2010; Escalas and Bettman, 2005) and is therefore also
used in this thesis.
2.5.1 Orthogonal Nature of Self-Construals
Rather than representing two extremes of the continuum like individualism-collectivism
at the country level, it has been shown in numerous studies that self-construals are
orthogonal and can co-exist within an individual (Singelis, 1994; Polyorat and Alden,
2005b; Oyserman et al., 2002). While both self-construal dimensions are orthogonal,
researchers consider them in combination, i.e. in terms of a dominant effect.

41
Specifically, individuals tend to score higher on one self-construal than the other, which
researchers refer to as the ―dominant‖ self-construal that guides an individual‘s
behaviour and attitudes (e.g. Agrawal and Maheswaran, 2005). However, considering
that both self-construals co-exist within an individual, it is theoretically possible for an
individual to register a high or low score in both self-construals. For instance, some
studies show that in countries where there has been a rapid economic development and
foreign influx (e.g. China, India), it is possible for young individuals to score high on
both self-construals (e.g. Aaker and Lee, 2001). These individuals would be considered
bi-cultural in terms of self-construals. This has conceptual implications when one
investigates how self-construals impact the self-congruity effect on brand attitude, as
described in the following section.
2.5.2 Self-Construals and Self-Congruity
In regard to self-congruity, categorizing individuals by their dominant self-construal is
conceptually important for the following reason. Individuals differ in regard to the
strength of their need to satisfy each of the four self-motives that guide their behaviour.
This consequently determines which self-congruity type is likely to have the strongest
effect on brand attitude. Research shows that, depending on their dominant self-
construal, individuals differ in their needs to satisfy each of the four self-motives (e.g.
Aaker and Schmitt, 2001; Markus and Kitayama, 1991; Locke and Christensen, 2007;
Kurman, 2001). Thus, depending on an individual‘s dominant self-construal, s/he is
likely to differ with regards to which self-congruity type has the strongest effect on
his/her brand attitude. For example, empirical evidence shows that individuals with a
dominant INTSC are likely to have a stronger need for self-consistency than for self-
enhancement (Markus and Kitayama, 1991; Locke and Christensen, 2007). Hence, these
individuals are likely to favour brands that are congruent with their actual self-concept

42
over those matching their ideal self-concept. Such findings would offer new insights
into the effects of these two self-congruity types on brand attitude, because previous
studies that did not consider the impact of self-construals show that ideal self-congruity
has a stronger effect on brand attitude rather than actual self-congruity (e.g. Graeff,
1996). Moreover, according to past research, individuals are expected to have a
dominant self-construal (e.g. Hannover et al., 2006; Sung and Choi, 2012). However, in
cases where they are bi-cultural in terms of self-construal (no dominant type), the
differences concerning to which self-congruity type leads to stronger brand attitude may
be insignificant. This is due to the fact that for bi-cultural individuals the need to satisfy
the underlying self-motives of the four self-congruity types is likely to be similar. For
instance, a similar need for self-consistency and self-enhancement is likely to lead to a
similar effect of actual and ideal self-congruity on brand attitude. Appendix 2.4 offers a
detailed review of the studies considering an individual‘s dominant INTSC and INDSC.
Besides self-construals this thesis also investigates which self-congruity type has the
strongest effect on brand attitude considering an individual‘s dominant cosmopolitan
and local orientation. The following section discusses the conceptual foundations of a
cosmopolitan and local orientation.
2.6 Cosmopolitan and Local Orientation
Research shows that some individuals are open to diverse cultural experiences, while
others perceive their home culture as ultimate reality, i.e. they have a dominant
cosmopolitan or local orientation (Cleveland et al., 2011b; Riefler et al., 2012). An
individual with a dominant cosmopolitan orientation is described as "an open-minded
individual whose consumption orientation transcends particular cultures, localities or

43
communities and who appreciates diversity including trying products and services from
a variety of countries" (Riefler and Diamantopoulos, 2009, p. 415). Individuals with a
dominant local orientation, on the other hand, feel that they belong to their local
community and focus on local activities, events and products, while seeing their home
culture as ultimate reality (Riefler et al., 2012; Cannon and Yaprak, 2002).
2.6.1 Orthogonal Nature of a Cosmopolitan and Local Orientation
Various researchers propose that cosmopolitan and local orientation are on opposite
sides of the spectrum, being bi-polar (e.g. Yeĝenoĝlu, 2005; Beck, 2002). Conversely,
others argue against the bi-polar nature of an individual‘s cosmopolitan and local
orientation. They state that rather than being on opposite sides of the spectrum, the two
orientations can co-exist in an individual (Arnett, 2002; Kurasawa, 2004). Thus, they
propose that as self-construals, an individual‘s cosmopolitan and local orientation is
orthogonal. To shed light on this debate a recent study by Cleveland et al. (2011b)
tested these propositions and offers empirical evidence that both orientations can co-
exist within an individual. As a result, it is possible for an individual to register a high
or low score on both orientations. However, one orientation is often stronger than the
other, which researchers refer to as the ―dominant‖ orientation (Zhang and Khare, 2009)
that consequently guides their attitude and behaviour. This has conceptual implications
for investigations into how they impact the self-congruity effect on brand perceptions,
as described in the following section.
2.6.2 Cosmopolitan and Local Orientation and Self-Congruity
In regard to self-congruity, categorizing individuals by their dominant cosmopolitan and
local orientation is conceptually important for the following reason. Research shows
that, depending on their dominant cosmopolitan or local orientation, individuals differ

44
in their need to satisfy each of the four self-motives on which the four self-congruity
types function (e.g. Ralston et al., 1996; Cleveland et al., 2011a). Thus, depending
whether they have a dominant cosmopolitan or local orientation, individuals are likely
to differ with regard to which self-congruity type has the strongest effect on brand
attitude. For instance, research that does not consider the impact of an individual‘s
characteristics shows that ideal self-congruity has a stronger effect on brand attitude
than actual self-congruity (Hong and Zinkhan, 1995). However, there is empirical
evidence that an individual with a local orientation places more importance on self-
consistency than on self-enhancement (Ralston et al., 1996). Hence, it is expected that
individual‘s with a dominant local orientation have a more positive attitude towards
brands that match their actual self-concept rather than their ideal self-concept. If an
individual is considered bi-cultural in regard to his/her cosmopolitan and local
orientation, it is possible that no significant differences between the effects of the
various self-congruity types on brand attitude will be found. This is due to the fact that
for bi-cultural individuals the need to satisfy the underlying self-motives of the four
self-congruity types may be similar. For instance, a similar need for self-consistency
and self-enhancement is likely to lead to a similar effect of actual and ideal self-
congruity on brand attitude. Appendix 2.6 provides details on the review of the studies
considering an individual‘s cosmopolitan and local orientation. Besides their theoretical
relevance in the marketing literature, these ILCs also offer a valuable source for market
segmentation and are therefore of interest to marketing practitioners.
45
2.7 Market Segmentation Value of the Individual-Level
Characteristics
In contrast to the conventional approach of segmenting consumer markets only at the
country level, numerous scholars have highlighted the importance of identifying and
serving consumers groups with similar needs and behaviours, irrespective of country
boundaries (Wedel and Kamakura, 1999; Douglas and Craig, 2011). This is due to the
fact that interactions between people and markets have intensified with globalisation,
hence, specific consumer groups are developing similar needs and behaviours and can
consequently be grouped into segments (Merz et al., 2008; Cleveland et al., 2011b).
Specifically, consumers differ in terms of perceiving their self as independent of or
interdependent with others, namely their self-construal (Markus and Kitayama, 1991).
Empirical evidence shows that an individual‘s dominant self-construals correlate with
several demographic (e.g. income, gender) and geographic variables (Ahluwalia, 2008).
Moreover, some individuals are open to diverse cultural experiences, while others
perceive their home culture as ultimate reality, i.e. they have a cosmopolitan or local
orientation (Riefler et al., 2012). Riefler et al. (2012) shows that a consumers dominant
cosmopolitan and local orientations correlate with demographic variables such as age,
education and location. Hence, knowing which self-congruity type is likely to elicit the
most positive brand attitude among individuals with these characteristics offers valuable
segmentation insights for marketers within and across countries. Figure 2.1 provides an
overview of the empirically validated relationships between various demographic
variables and these individual-level characteristics.

46
Figure 2.1 Relationships between Demographic Variables and ILCs
Sources: Cleveland et al. (2011b), Guimond et al. (2006), Kim (2005), Norris (1999),
Riefler et al. (2012), and Zhang (2009)
2.8 Conclusion
This chapter discussed the conceptual foundations of the self-concept and self-congruity
theory. It also discussed the current state of self-congruity theory and gaps in the
literature. Moreover, the chapter raised the importance of considering the impact of
individual-level variables on the effect of the four self-congruity types on brand attitude.
Specifically, it showed the importance of focusing on an individual‘s dominant INTSC,
INDSC, cosmopolitan and local orientation. The following chapter offers the conceptual
framework and hypotheses of this thesis. It describes in detail how an individual‘s
dominant INTSC, INDSC, cosmopolitan and local orientation are expected to impact
the effect of each of the four self-congruity types on brand attitude. Hence, the chapter

47
addresses the research questions of this thesis (outlined in chapter 1) on which of the
four self-congruity types (within private self-concept types, within public self-concept
types, and overall of all four self-concept types) has the strongest effect on brand
attitude considering the aforementioned ILCs.

48
Chapter 3 - Conceptual Framework and Hypotheses
3.1 Introduction
This chapter presents the conceptual framework derived from the literature and the 13
hypotheses of this thesis. The conceptual framework is used to investigate which of the
four self-congruity types (within private self-types, within public self-types and overall
of all four self-types) has the strongest effect on brand attitude for individuals with a
dominant independent self-construal (INDSC), interdependent self-construal (INTSC),
cosmopolitan orientation, and local orientation. The chapter is organized as follows.
Section 3.2 describes the conceptual framework and rationale behind the hypotheses
structure. Section 3.3 presents six hypotheses pertaining to how an individual‗s
dominant INTSC and INDSC are expected to impact the effect of the four self-
congruity types on brand attitude. Section 3.4 offers six hypotheses pertaining to how an
individual‘s dominant cosmopolitan and local orientation are expected to impact the
effect of the four self-congruity types on brand attitude. Section 3.5 presents a
hypothesis on the expected relationship between brand attitude and purchase intent.
Finally, section 3.6 offers the conclusion of the chapter.

49
3.2 Conceptual Framework and Hypotheses Structure
This section presents the conceptual framework and rationale for the hypotheses
structure.
3.2.1 Conceptual Framework
Figure 3.1 presents the conceptual framework of this thesis, which is founded on the
constructs explained in the previous chapter. The principal assumption is that
consumers use brands as a way to define themselves, and they purchase brands with a
specific image to express their self-concept (Aaker, 1999; Belk, 1988). As illustrated
below, actual, ideal, social, and ideal social self-congruity impact a consumer‘s brand
attitude independently (Sirgy and Johar, 1999). Human behaviour is guided by the need
to satisfy different self-motivations and the importance an individual places on a
specific self-congruity type is determined by the motive that guides his/her behavior and
attitude the strongest (Sirgy et al., 2000; Malär et al., 2011). Specifically, the self-
consistency motive is the underlying self-motive of actual self-congruity, while the self-
enhancement motive serves the same function for ideal self-congruity, social-
consistency motive for social self-congruity, and the social approval/esteem motive for
ideal social self-congruity (Sirgy et al., 2000). Depending on their dominant INTSC,
INDSC, cosmopolitan and local orientation, individuals differ in their need to satisfy the
four self-motives that determine which of the four self-congruity types has a stronger
effect on attitudes (Aaker and Schmitt, 2001; Ralston et al., 1996; Locke and
Christensen, 2007; Cleveland et al., 2011a; Kurman, 2001). Therefore, it is expected
that an individual‘s dominant INTSC, INDSC, cosmopolitan and local orientation will
influence which of the four self-congruity types has the strongest effect on brand
attitude. Findings on which self-congruity type is likely to elicit the most positive brand
attitude for individuals with these characteristics offers marketers valuable insights into
segmentation within and across countries (e.g. Ahluwalia, 2008; Riefler et al., 2012).

50
Figure 3.1 Conceptual Framework
Actual self-congruity (ASC)
A. Self-concept Brand Image
A. Self-congruity: satisfaction of the
need for self-consistency
BA
Ideal self-congruity (ISC)
I. Self-concept Brand Image
I. Self-congruity: satisfaction of the
need for self-enhancement
Social self-congruity (SSC)
S. Self-concept Brand Image
S. Self-congruity: satisfaction of the
need for social-consistency/conformance
Ideal social self-congruity (ISSC)
I.S. Self-concept Brand Image
I.S. Self-congruity: satisfaction of the
need for social-approval/esteem
INTSC INDSC
H1: BA ASC >BA ISC H2: BA ISC >BA ASC
H3: BA SSC >BA ISSC H4: BA ISSC >BA SSC
COS LOC
H5: BA ISC >BA ASC,SSC,
ISSCH6: BA SSC >BA ASC,ISC,
ISSC
H7: BA ISC >BA ASC H8: BA ASC >BA ISC
H10: BA SSC >BA ISSCH9: BA ISSC >BA SSC
H12: BA SSC >BA ASC, ISC,
ISSC
H11: BA ISC >BA ASC,SSC,
ISSC
Contains the Hypotheses relating
to the constructs in the box
PI
H13:
+
Individual-Level Characteristics
3.2.2 Hypotheses Structure
The conceptual framework above is used to empirically test the impact of an
individual‘s dominant INTSC, INDSC (H1-H4), cosmopolitan and local orientation
(H7-H10) on the effect of the four self-congruity types on brand attitude within private
and public selves (e.g. public selves: social self-congruity vs. ideal social self-
congruity). Moreover, the conceptual frameworks also tests which of the four self-
congruity types has the strongest overall effect on brand attitude for individuals with a
dominant INTSC and INDSC (H5 and H6), cosmopolitan and local orientation (H11
and H12). Besides considering the strongest overall self-congruity effect on brand
attitude, marketers can also benefit by accounting for the conceptual distinction between
private and public selves (Aguirre-Rodriguez et al., 2011). Specifically, as described in

51
chapter 1 (Sections 1.3 and 1.7), some products and their brand image are more apt to
be communicated using themes in social/public situations, while others are more apt to
be communicated using themes in private situations (Roth, 1995). Hence, it is important
for marketers to know whether within private selves, actual or ideal self-congruity has a
stronger effect on brand attitude and whether within public selves, social or ideal social
self-congruity has a stronger effect on brand attitude for consumer with specific
individual characteristics. In addition, the thesis tests the relationship between brand
attitude and purchase intent (H13) to evaluate whether there is a direct relationship
between these constructs in the context of this study. Table 3.1 gives an overview of the
13 hypotheses.
Table 3.1 Hypotheses
Dominant
INTSC/INDSC
Dominant
Cosmopolitan/Local
Orientation
Private selves (actual vs. ideal self-
congruity)
H1, H2 H7, H8
Public selves (social vs. ideal social
self-congruity)
H3, H4 H9, H10
Overall strongest self-congruity effect H5, H6 H11, H12
Brand attitude Purchase intent H13
3.3 Hypotheses - Dominant Self-Construals (INTSC/INDSC)
The following section presents the six hypotheses pertaining to how a dominant INTSC
and INDSC impact the effect of the four self-congruity types on brand attitude.

52
3.3.1 Strongest Effect of Actual versus Ideal Self-Congruity (Private
Selves) on Brand Attitude
Markus and Kitayama (1991, p.224) state that, with regard to individuals with a
dominant INTSC "the nail that stands out gets pounded down". This indicates that
conforming and maintaining consistency at a social, but also private, level motivates
individuals with an dominant INTSC more than standing out and self-enhancing in
order to be seen as unique (Markus and Kitayama, 1991). This reasoning is in line with
self-verification theory (Swann, 1983), which posits that people‘s ability to recognize
how they are perceived by others is integral to successful social relationships (Stryker,
1981). Subsequently, how they are perceived by others is then integrated into
internalized aspects of their self-concept, motivating these individuals to verify a
consistent view of their actual self-concept (Swann et al., 1992). Conversely, it has been
shown that individuals with an INDSC have a pronounced need for self-enhancement of
personal attributes (Kurman, 2001). They focus on differentiating and expressing
themselves as they want to be unique (Aaker and Schmitt, 2001; Escalas and Bettman,
2005) and are oriented towards self-promotion (Aaker and Lee, 2001). These
individuals have a strong need to self-enhance to boost their self-esteem and to cultivate
their ideal view of their self-concept (Sedikides and Strube, 1995a). In summary,
individuals with a dominant INTSC versus INDSC have a strong need for self-
consistency and self-enhancement, respectively. Considering that the self-motive that
guides the behaviour of an individual determines which self-congruity type is likely to
have a stronger effect on brand attitude, brands that allow these individuals to satisfy
their respective self-motive needs should be perceived more positively. Therefore:
H1: For an individual with a dominant INTSC actual self-congruity has a stronger
effect on brand attitude than ideal self-congruity.

53
H2: For an individual with a dominant INDSC ideal self-congruity has a stronger effect
on brand attitude than actual self-congruity.
3.3.2 Strongest Effect of Social versus Ideal Social Self-Congruity
(Public Selves) on Brand Attitude
According to Wu (1994), in many East Asian societies, where individuals are likely to
have a dominant INTSC (Singelis and Sharkey, 1995), internal or private selves are
referred to as the ―small self‖, which should be subordinated to the ―greater self‖. This
―greater self‖ focuses on commitment to others, such as family, in-groups and society as
a whole. Individuals with an INTSC subordinate their personal goals to collective goals
(Triandis et al., 1988; Locke and Christensen, 2007). This indicates that, for individuals
with a dominant INTSC, maintaining a consistent view of their social self-concept in
regard to how they are seen by others is of the utmost importance. Such a notion is in
agreement with the social consistency/conformance motive, stating that people are
motivated to maintain an image that others have of them (Sirgy et al., 2000; Swann,
1983), as it allows them to verify their social self (Swann Jr. et al., 2003). In contrast,
rather than fitting in for the purpose of social consistency, individuals with an INDSC
are motivated to self-enhance in social contexts as they want to be unique or pursue
goals that make them stand out in the eyes of others to foster their ideal social self-
concept (Sedikides and Gregg, 2008; Gudykunst et al., 1996). Moreover, narcissism,
which by definition involves strong feelings of pride and a lack of modesty, has also
been shown to be prevalent among individuals with a dominant INDSC and affect the
development of the ideal social self-concept (Raskin et al., 1991b). This is due to the
fact that they both share similar core features of high self-focus (Konrath et al., 2009).
In line with these arguments, the social approval/esteem motive posits that people are

54
motivated to do things that will cause others to think highly of them (Johar and Sirgy,
1991). Self-enhancing with the goal of boosting their self-esteem through social
approval offers them an outlet to foster their ideal social self-concept (Raskin et al.,
1991b). In summary, individuals with an INTSC versus INDSC have a strong need for
social consistency/conformance and social approval/esteem, respectively. Considering
that the self-motive that guides the behaviour of an individual determines which self-
congruity type is likely to have a stronger effect on brand attitude, brands that allow
these individuals to satisfy their heightened self-motive needs should be perceived more
positively. Therefore:
H3: For an individual with a dominant INTSC social self-congruity has a stronger
effect on brand attitude than ideal social self-congruity.
H4: For an individual with a dominant INDSC ideal social self-congruity has a
stronger effect on brand attitude than social self-congruity.
3.3.3 Overall Strongest Self-Congruity Effect on Brand Attitude
Individuals have a need to maintain a consistent view of themselves in private and
public contexts (Swann et al., 1992). However, those with a dominant INDSC treat the
self-concept as an independent entity and are likely to focus on private selves such as
the actual and ideal self-concept rather than public selves such as the social and ideal
social self-concept (Markus and Kitayama, 1991). Moreover, individuals with a
dominant INDSC have a pronounced need for the self-enhancement motive to enhance
their personal attributes (Kurman, 2001) and focus on expressing themselves as they
want to be unique (Escalas and Bettman, 2005). This entails them having a strong need
to self-enhance to cultivate their ideal self-concept, which supersedes their need to
foster their actual self-concept (Sedikides and Strube, 1995b). Individuals with a
dominant INTSC see their self as connected and part of others rather as an independent

55
entity (Markus and Kitayama, 1991). Thus, they place more importance on their public
than private selves. Moreover, they focus on maintaining consistency with others, such
as family, in-groups and society as a whole, while subordinating their personal goals to
collective goals (Triandis et al., 1988; Locke and Christensen, 2007). Therefore, for
individuals with a dominant INTSC, maintaining a consistent view of their social self-
concept in regard to how they are seen by others is of the utmost importance. This is
likely to supersede their need to self-enhance in social contexts to foster their ideal
social self-concept. Such a predisposition is in line with the social
consistency/conformance motive (Sirgy et al., 2000), the underlying motive of social
self-congruity. Overall, individuals with a dominant INDSC versus INTSC have a
strong need for self-enhancement and social consistency/conformance, respectively.
Thus, brands that allow these individuals to satisfy their heightened self-motive needs
should be perceived more positively. Therefore:
H5: Overall, among the four self-congruity types, for an individual with a dominant
INDSC ideal self-congruity has the strongest effect on brand attitude.
H6: Overall, among the four self-congruity types, for an individual with a dominant
INTSC social self-congruity has the strongest effect on brand attitude.
3.4 Hypotheses – Dominant Cosmopolitan and Local
Orientation
The following section presents the six hypotheses pertaining to how a dominant
cosmopolitan and local orientation impact the effect of the four self-congruity types on
brand attitude.

56
3.4.1 Strongest Effect of Actual versus Ideal Self-Congruity (Private
Selves) on Brand Attitude
Individuals with a dominant cosmopolitan orientation (COS) and those with a dominant
local orientation (LOC) differ in their self-conception (Kashima et al., 2004).
Individuals with a cosmopolitan orientation have been said to choose brands as a means
of asserting a cosmopolitan self-image (Thompson and Tambyah, 1999a). They engage
in diverse cultural experiences outside their own culture as they are motivated to self-
actualize, and these experiences represent an opportunity for them to self-enhance and
boost their self-esteem (Cannon and Yaprak, 2002; Cleveland et al., 2011a). COS are
interested in engaging in symbolic behaviours (e.g. brand consumption) to express
themselves and are motivated to self-enhance their ideal self-concept (Cannon and
Yaprak, 2002; Riefler et al., 2012). In contrast to COS, individuals with a dominant
local orientation interests tend to be confined to their community (Haas, 2006; Riefler et
al., 2012). LOC are less open to change, in particular in regard to relationships with
others as they try to avoid uncertainties (Ralston et al., 1996). When those relationships
with others are challenged deep uncertainty arises, affecting the self-image of a LOC
(Ossewaarde, 2007). In line with self-verification theory (Swann, 1983), LOC seek a
stable and consistent self-view as it offers them a means of defining their existence in a
personal and social context. Furthermore, stable self-views make people more
predictable to others (Goffman, 1959), leading to an interaction effect as this
predictability will then stabilize how others respond to them. Consequently, this fosters
a consistent social environment that in turn further stabilizes private aspects of the
individual‘s self-concept (Swann Jr. et al., 2003). As a result, this is likely to have an
uncertainty-reducing effect on a LOC, because being able to predict how social
interactions will play out in the future will give him/her a sense of consistency and also
allow him/her to verify his/her actual self-concept. In summary, individuals with a
dominant COS versus LOC orientation emphasize self-enhancement and self-

57
consistency, respectively. Considering that the self-motive that guides the behaviour of
an individual determines which self-congruity type is likely to have a stronger effect on
brand attitude, brands that allow these individuals to satisfy their heightened self-motive
needs should be perceived more positively. Therefore:
H7: For an individual with a dominant cosmopolitan orientation ideal self-congruity
has a stronger effect on brand attitude than actual self-congruity.
H8: For an individual with a dominant local orientation actual self-congruity has a
stronger effect on brand attitude than ideal self-congruity.
3.4.2 Strongest Effect of Social versus Ideal Social Self-Congruity
(Public Selves) on Brand Attitude
According to Thompson and Tambyah (1999a), COS consider their drive to
comprehend and integrate cultural differences as part of an identity-enhancing process
to reach an idealized view of their self-concept. For example, COS believe that
integrating cultural events and practices during their travels enforces an identity-
enhancing distinction between themselves and other, conventional, tourists. This is in
line with the proposition that cosmopolitanism is increasingly understood as a social
ideal (Hollinger, 1995). Hence, COS seek self-enhancing experiences that allow them to
express this ideal view in social contexts. Such self-enhancing activities that boost an
individual‘s self-esteem in a social context are in line with the social approval/esteem
motive (Sirgy et al., 2000; He and Mukherjee, 2007). In contrast, LOC have been shown
to display patterns of conformity (Ralston et al., 1996; Riefler et al., 2012). Conformity
means that people will tend to converge on similar behaviour because they are affected
by social norms (Wang and Lin, 2003). The inclination of LOC to adhere to normative
beliefs and to conform to expectations established within their social environment

58
(Deutsch and Gerard, 1955), rather than standing out to satisfying egocentric self-needs,
indicates that a socially consistent view of their self is of great importance for them.
This resonates with the premise of the social consistency/conformance motive, which
posits that individuals are motivated to verify an image they perceive others have of
them (Sirgy et al., 2000). In summary, individuals with a dominant COS versus LOC
orientation emphasize a need for social approval/esteem and social
consistency/conformance, respectively. Thus, brands that allow these individuals to
satisfy their self-motive needs should be perceived more positively. Therefore:
H9: For an individual with a dominant cosmopolitan orientation ideal social self-
congruity has a stronger effect on brand attitude than social self-congruity.
H10: For an individual with a dominant local orientation social self-congruity has a
stronger effect on brand attitude than ideal social self-congruity.
3.4.3 Overall Strongest Self-Congruity Effect on Brand Attitude
Individuals with a dominant cosmopolitan orientation demonstrate a desire for
independence and establish their own individuality through consumption (Cleveland et
al., 2011a). This suggests that COS are likely to place more importance on their private
than on their public selves. They choose brands as a means of asserting a cosmopolitan
self-image (Thompson and Tambyah, 1999b) and engage in diverse cultural experiences
as an opportunity to self-enhance to foster their ideal self-view (Cannon and Yaprak,
2002). This is in line with the self-enhancement motive, the underlying motive of ideal
self-congruity (Sedikides and Strube, 1997). Therefore, cosmopolitans are likely to seek
experiences (e.g., consumption of specific brands) that allow them to enhance their
feelings of self-worth and cultivate their ideal self-concept (Ralston et al., 1996).
Individuals with a dominant local orientation built their self-concept around their

59
community or immediate social system (Riefler et al., 2012). They are influenced by
relationships with others and place great importance on consensus (Cannon and Yaprak,
2002). This suggests that they place more importance on their public than on their
private selves. They are inclined to adhere to normative beliefs and display patterns of
conformity established within their social environment rather than standing out to
satisfy more egocentric self-needs (Ralston et al., 1996). This indicates that their
motivation towards social consistency to foster their social self-concept is likely to
supersede their need to self-enhance in social contexts. Overall, individuals with a
dominant COS versus LOC orientation emphasize a need for self-enhancement and
social consistency/conformance, respectively. Thus, brands that allow these individuals
to satisfy their self-motive needs should be rated more positively. Therefore:
H11: Overall, among the four self-congruity types, for an individual with a dominant
cosmopolitan orientation ideal self-congruity has the strongest effect on brand attitude.
H12: Overall, among the four self-congruity types, for an individual with a dominant
local orientation social self-congruity has the strongest effect on brand attitude.
3.5 Brand Attitude and Purchase Intent
Attitude is ―[…] a learned predisposition to respond in a consistently favourable or
unfavourable manner with respect to a given object (Fishbein and Ajzen, 1975, p.6),
while purchase intent is described as ―an individual‘s conscious plan to make an effort
to purchase a brand‖ (Spears and Singh, 2004, p.56). Fishbein and Ajzen (1975) stated
that attitudes influence behaviour through behavioural intentions. According to Park et
al. (2010), brand attitudes have implications for purchase intent. Although a few studies
have shown discrepant results between brand attitude and purchase intent (e.g. Bagozzi,

60
1992), empirical evidence from numerous studies indicates a general consensus that
brand attitude has a positive effect on purchase intent (Bennett and Harrell, 1975;
Mackenzie and Spreng, 1992; Spears and Singh, 2004) Therefore:
H13: There is a positive relationship between brand attitude and purchase intent.
3.6 Conclusion
This chapter presented the conceptual framework of this thesis and thirteen hypotheses.
Twelve hypotheses are outlined that allow the testing of the impact of an individual‘s
dominant INTSC, INDSC, cosmopolitan and local orientation on the effect of the four
self-congruity types on brand attitude. Moreover, one further hypothesis tests the effect
of brand attitude on purchase intent. The following chapter discusses the research
design of the study and methods used to test these hypotheses.

61
Chapter 4 - Methodology
4.1 Introduction
This chapter presents the methods and procedures used to empirically test the
conceptual framework (Figure 4.1) and the 13 hypotheses presented in chapter three. To
test these 13 hypotheses, this thesis uses a quantitative approach and data collected
through an online survey. The chapter is structured as follows. First, section 4.2
introduces the adopted research philosophy. Section 4.3 discusses the research
approach. Section 4.4 offers a discussion of the data collection and sampling
procedures. Section 4.5 discusses the development of the research instrument. Section
4.6 describes the steps taken to analyse the data, including issues pertaining to reliability
and validity. Finally, section 4.7 presents a summary with some concluding remarks.
4.2 Research Philosophy
There are different views on how the world functions and what is considered ―truth‖.
The two main research philosophies (or paradigms) on opposite sides of the spectrum
are ―positivism‖ and ―interpretivism‖ (Collis and Hussey, 2003). These can be
described from an epistemological as well as an ontological perspective. Epistemology
is about how things are known to be true. The central question is how claims of truth
are made, measured or acquired (Bryman and Bell, 2007). Ontology is concerned with a
person‘s world view and perceptions about objects or realities in this world. The central
question concerns whether social reality is objective or subjective in its nature (Bryman,
2004). Furthermore, there are a number of assumptions associated with ―positivism‖
and ―interpretivism‖.

62
Positivism is rooted in the natural sciences and is concerned with objective knowledge,
or facts, that can be gathered from observations that are assumed to represent reality. It
is assumed to be free of personal values, is largely based on quantitative data and causal
relationships, and is often concerned with the testing of hypotheses (Bryman, 2004;
Robson, 2002). Interpretivism assumes that reality cannot be defined objectively and
that social phenomena are part of people‘s mind and their interpretations. It claims that
understanding is constructed through interaction between the researcher and the subjects
and that quantitative measurement cannot explain the real meaning of social behaviour
(Bryman, 2004; Saranktos, 1998).
From an ontological perspective the researcher assumes that reality is objective in its
nature and independent of the researcher. Moreover, from an epistemological
perspective it is assumed that this reality can be measured objectively regardless of the
personal view of the researcher and that it is based on data. Hence, this thesis adopts a
positivist view to test the 13 hypotheses by estimating causal relationships between the
variables in the conceptual framework. This approach is also in line with previous
research testing the effects of self-congruity on brand perceptions (e.g. Malär et al.,
2011; Sung and Choi, 2012).
4.3 Research Approach and Method
This thesis uses a quantitative approach. According to Malhotra (2004), a quantitative
approach is a research methodology that intends to quantify data in order to analyse
them with statistical tools. Hence, it allows the researcher to establish statistical
evidence on the strengths of the relationships between the variables. Even though
quantitative methods are limited in terms of providing in-depth explanations, which are

63
likely to be sought with a qualitative approach, they are well suited to testing
hypotheses and providing evidence of reliability and validity (Hair et al., 2003).
Furthermore, a qualitative approach is generally used to explore phenomena and
develop theories, while quantitative approaches tend to focus on testing those theories
(Bryman, 1988). Punch (1998) argues that the method chosen to conduct the research
should be in accordance with the research questions and the objective of the study.
Theory exists already on the phenomena of interest in this study. Therefore, a
quantitative method such as a survey is deemed to be the most appropriate research
method, specifically, a self-administered online questionnaire. Hair et al. (2003, p. 265)
describe it as ―a data collection technique in which the respondent reads the survey
questions and records his or her own responses without the presence of a trained
interviewer‖. Survey-questionnaires have been claimed to be quick, efficient,
inexpensive, and concerned with investigating causal relationships, and they can be
administered to a large sample (Churchill, 1995; Hair et al., 2003; Zikmund, 2003).
Thus, a questionnaire fits the purpose of this thesis. Moreover, following previous
studies (e.g. Aaker and Lee, 2001; Hamilton and Biehal, 2005; Hupfer and Detlor,
2006) a web-based questionnaire was used to collect the data. Web-based questionnaires
have been claimed to have advantages as they are inexpensive and reduce errors in data
transfer and coding (van Gelder et al., 2010). Additionally, they reduce the risk of
missing values because the online questionnaire can be programmed to prevent the
respondent from moving to the next page before he/she has answered all the previous
questions (Tabachnick and Fidell, 2007).
64
4.4 Data Collection
This section describes the rationale behind the ―where‖ (geographic scope) and the
―who‖ (respondent selection, sampling) in regard to data collection.
4.4.1 Geographic Scope of the Study and its Rationale
The hypotheses are tested using consumers from the US and India. The use of these two
countries is relevant (a) because they offer two culturally distinct research grounds that
allow the testing of the external validity of the conceptual framework and (b), because
they are likely to offer sufficient variability in terms of the individual-level
characteristics used in this thesis.
First, according to Hofstede (2012) the US and India differ significantly in regards to
Long-term Orientation (LTO), and Power Distance (PD). It is important to consider
these differences because they are likely to impact the effect of the four self-congruity
types on brand attitude. LTO is ―the extent to which a society exhibits a pragmatic
future-oriented perspective rather than a conventional historic or short-term point of
view‖ {de Mooij, 2010 #252`, p. 85}. According to Hofstede (2012) India is considered
a long term-oriented country (LTO score= 61), while the US ranks at the lower end of
the scale (LTO score =29). For example, individuals with high LTO tend to be
motivated to foster connections and avoid conflict in order to conform with others rather
than to self-enhance (Ryu and Moon, 2009; Bearden et al., 2006). Consequently, due to
the emphasized motivation towards maintaining consistency with others of high LTO
individuals, they are likely to have more positive attitudes towards brands matching
their social self-concept than their ideal self-concept. PD is defined as the ―extent to
which less powerful members of a society accept and expect that power is distributed
unequally‖(de Mooij, 2010, p.75). Hofstede (2012) states that Power Distance tends to

65
be fairly high in India (PD score= 77) compared to the US (PD score= 40). For
example, individuals with high PD place great importance on conformity in social
contexts and adhere to normative standards to maintain social order rather than focusing
on standing out and displaying their uniqueness (Hofstede, 2001; Oyserman, 2006; Jung
et al., 2009). Since the focus of high PD individuals is to seek conformity in social
contexts rather than self-enhancing to boost their self-esteem, it is likely that brands
congruent with their social self-concept will be perceived more positively than those
matching their idea self-concept. Given these large differences between the US and
India, replication of the results in the two countries, which differ in terms of the
aforementioned dimensions, will further attest to the external validity of the proposed
conceptual framework (Steenkamp et al., 2003; Van de Vijver and Leung, 1997).
Hence, the research takes a step towards a universal framework (Berry, 1989). More
details on the LTO and PD measures provided in the survey instrument section 4.5.4.
Second, the selected countries are likely to provide respondents whose input will allow
the testing of the impact of the individual-level characteristics outlined (dominant
INTSC/INDSC, cosmopolitan/local orientation) on the effect of the four self-congruity
types on brand attitude within each country. The US and India are deemed appropriate
for the following reason. The US has generally been described as an individualist
country where it is likely that the dominant self-construal that guides the self-concept of
an individual is largely independent (Cross et al., 2000). However, the US is considered
to be a culturally diverse country (Fearon, 2003; Banks, 2008). Within the US
individuals with roots in collectivist as well as individualist countries co-exist, making it
likely that those with a dominant INTSC as well as INDSC will be found. This notion
has been supported by empirical evidence from various studies (e.g. Escalas and

66
Bettman, 2005). In terms of a dominant cosmopolitan or local orientation, the research
is also expected to encounter individuals who display both these tendencies in the US.
For example, in cities such as New York, people are more likely to have a more
dominant cosmopolitan orientation (Donald et al., 2009), while in other more rural areas
within the US individuals are more likely to have a dominant local orientation (Barcus
and Brunn, 2010; Massey, 2008). India has generally been described as a collectivist
country where the dominant self-construal that guides self-concept related processes is
largely interdependent (Cross et al., 2000). However, previous studies have provided
empirical evidence that Indian culture is neither predominantly individualist nor
predominantly collectivist (e.g. Mishra, 1994; Sinha and Tripathi, 1994) as it has
experienced modernization, economic growth and a significant increase in foreign
media during the last few decades (Harris, 2005; Pick and Dayaram, 2006; Derné,
2008). Hence, it can be assumed that within India some individuals are guided more by
a dominant INDSC, while others have a dominant INTSC. With respect to a
cosmopolitan and local orientation, the research is also expected to find individuals who
display both these tendencies in India. For example, intercultural exchanges, curiosity
towards others overseas through the use of social online networks, and the embracing of
Western practices exemplify the fact that Indians are integrating cosmopolitan
dispositions as part of their self-concept (Jensen et al., 2011; Jensen, 2011; Arnett,
2002). However, not all Indians are displaying a cosmopolitan orientation or are
adapting Western traits and behaviours. Rather, it has been argued that a process of
cultural hybridity is taking place (Arnett, 2002). This means that Indians are also
encouraged to embrace the ―local‖ alongside the ―foreign‖ (Robertson, 1995), indicating
that both tendencies can be found among them.

67
In summary, using the US and India as research grounds allows the testing of the effects
of individual-level variables within each country and then determining whether or not a
different country explains additional variance, hence offering an analytically rigorous
approach in terms of country selection (Kirkman et al., 2006).
4.4.2 Population of the Study and Respondents
In research the population is described as the entire body of units of interest being
investigated by the researcher (Parasuraman et al., 2007). As described above, India and
the US served as the research ground for this study. Hence, for the proposed thesis:
The population of the study is considered to be young adult Indian and US individuals.
Young adult consumers (aged 18-40) have been said to be a critical consumer segment
for various brands as their purchasing power and propensity to spend on brands has
increased (O'Cass and Choy, 2008; Hwang and Kandampully, 2012). Therefore, they
are an important population to consider. Young adult consumers offer a wider spectrum
in regard to current spending power than a typical undergraduate student sample, which
is generally in the late teens and early 20s (Khan and Bamber, 2007).
Hence, the respondents of the study were mainly young adults (80+ % aged 18-40)
within India and the US drawn from the online panel described in the next section.

68
4.4.3 Sampling Frame
Amazon‘s Mechanical Turk (MTurk) was used as a source for the data in this thesis.
MTurk is a data collection platform that is frequented by individuals (aged 18 or over)
to perform tasks such as writing product descriptions, translations, and web-page design
as well as filling out surveys for small sums of money. The MTurk platform contains
approximately 500,000 individuals from over 100 countries (Ipeirotis, 2010). However,
almost 90% are from the US and India (Ross et al., 2010). Numerous studies suggest
that data obtained via MTurk are at least as reliable as those obtained via traditional data
sources and that MTurk participants are significantly more diverse than typical
American undergraduate student samples (for detailed reviews see Buhrmester et al.,
2011; Paolacci et al., 2010). For example, approximately 80% of MTurk participants are
between the ages of 18 and 40, with 41% being above 25. Hence, they offer a wider age
spectrum than a typical undergraduate student sample (Ross et al., 2010). More details
on the demographics of MTurk samples used in past research can be found in Appendix
4.1. The validity of MTurk as a data source is further substantiated by Mason and Suri
(2012), who conclude that the internal consistency of self-reported demographics on
MTurk is high. MTurk has also been used in recent marketing and psychology studies
published in highly regarded journals, which is indicative of its acceptance by
academics (e.g. Wilkie and Bodenhausen, 2012; Lewis and Bates, 2011; Bagchi and Li,
2011; Anderson et al., 2012; Yan and Muthukrishnan, 2013).
4.4.4 Probability vs. Non-Probability Sampling and Self-Selection Bias
Sampling methods are classified as probability (e.g. random) versus non-probability
sampling (e.g. convenience). Researchers generally agree that probability sampling
should be favoured over non-probability sampling as it is more likely to accurately

69
represent accurately the population of interest (Parasuraman et al., 2007; Douglas et al.,
1994). Realistically, however, probability sampling has been said to be ―a luxury
afforded to few cross-cultural researchers‖ (Cavusgil and Das, 1997, p. 80). Therefore,
in international research, non-probability sampling is used in a large proportion of
studies (Reynolds et al., 2003; Samiee and Jeong, 1994). Despite of this prevalence, it is
important to be aware of the drawbacks of non-probability samples. For instance, non-
probability samples lead often to homogeneous samples that are extracted from
subgroups of the population. Therefore, the results can be critiqued for their lack of
generalizability as they are not representative of the overall population (Douglas et al.,
1994; Wilson, 2012). However, while not perfectly representative of the overall
population, MTurk samples are demographically significantly more diverse than
traditional non-probability samples, which are often based on undergraduate student
samples (Buhrmester et al., 2011; Mason and Suri, 2012). MTurk offers a large
sampling frame (approximately 500,000 users) with respondents representing both
genders and various age groups from all over the US and India (Mason and Suri, 2012;
Ipeirotis, 2010). It offers a built in selection qualification that allows researchers to
automatically select respondents by country, hence, it was possible to screen between
Indian and US respondents (Buhrmester et al., 2011). It should be noted that the
researcher did not directly influence which respondents participated in the survey, as the
task was posted on MTurk and respondents decided whether to participate or not.
Hence, the potential impact of self-selection bias needs to be considered. According to
James (2006, p. 561) self-selection bias is ―the failure to recognize when observed
differences in groups are the result of self-selection rather than the characteristics of the
group or individuals within the group‖. MTurk samples contain a higher proportion of
individuals who are unemployed compared to the overall population, specifically 24%
versus 8% (Ross et al., 2010; Shapiro et al., 2013). Hence, a respondent‘s income is

70
likely to be correlated with self-selection bias. This study controlled for the impact of
various demographic variables, including income, showing that income had no
significant impact on the results of the study (for details see chapter 7, section 7.5).
Moreover, this study also controlled for non-response bias, which is related to self-
selection bias (Oberski, 2008). The results show that non-response bias is unlikely to
impact the data of this study (for details see chapter 6, section 6.3.3). Therefore, self-
selection bias is unlikely to significantly bias the results in this study.
4.4.5 Sample Size Considerations
Numerous researchers suggest that sample sizes should be estimated prior to conducting
a study (Churchill and Iacobucci, 2002; Frazier et al., 2004). However, others argue that
calculating the sample size beforehand is often not feasible, because an estimate of the
key variables at stake is necessary and difficult to assess before actual data are collected
(Craig and Douglas, 2005). For example, with a potential sample that is considerably
heterogeneous, there is a need for a larger sample, while a potentially more homogenous
sample is likely to reduce this number (Robson, 2002). Nevertheless, depending on the
statistical procedure applied for the analysis of the data the minimum numbers may vary
(Robson, 2002). Considering that Partial Least Squares Structural Equation Modelling
(PLS-SEM) was used to analyse the data (details in section 4.6.2) the sample size needs
to be adequate in regards to this data analysis method. Hair et al. (2014) recommend
following the guidelines established by Cohen (1992), which take statistical power and
effect sizes into account. The structural model of this thesis has a maximum of four
arrows pointing at a construct in the model (four self-congruity types brand attitude).
Therefore, considering the criteria established by Cohen (1992), in order to detect
minimum coefficient of determination (R2) values of 0.10 at significance levels of 5%,
the minimum sample size required was 137 for the current study. However, to test the

71
hypotheses in this study it was necessary to split the sample into subsamples based on a
consumer‘s individual-level characteristics (e.g. dominant local orientation). Thus, as it
was not known a priori how many consumers would be categorized in each subsample,
the full sample needed to be large enough to be subsequently split it into subsamples of
more than 137 respondents. Consequently, over 800 usable cases were collected in each
country (US and India). All the sub-samples contained more than 137 respondents (see
chapter 6, section 6.4.1), hence meeting the sample size criterion.
4.4.6 Respondent Contact and Data Collection Equivalence
As outlined by Buhrmester et al. (2011) respondents were contacted via a post on the
MTurk platform with an invitation to complete a survey located on an external web-
based survey (i.e. Bristol Online Survey). Potential respondents were able to read the
advertised tasks on MTurk; those who were interested participated in the web-based
survey for which they were paid upon successful completion. In line with Dillman‘s
(2007) suggestion to facilitate the survey process for the respondent and improve
completion rates, the cover letter for the survey was kept short. It contained a short
introduction about the purpose of this study, indicating that it is for a PhD project
intended to study consumer attitudes towards various brands. The cover letter used for
the main study can be found in Appendix 4.2.
Following Hult et al.‘s (2008) recommendations, this study accounted for potential
issues that could arise in terms of data collection equivalence when collecting data in
two countries. Specifically, MTurk was used to collect data in the US and India.
Therefore, the study accounted for administration equivalence by using the same
method to contact the respondents and while collecting the data (online questionnaire).

72
In addition, the study accounted for sampling frame comparability, by ensuring that the
samples in both locations (US and India) paralleled each other, as well as minimizing
the time lapse between data collection in both countries. Overall, these measures limited
the threats to the validity of the data (Hult et al., 2008).
4.5 Research Instrument Development and Administration
Following previous research, two preliminary studies were conducted to select the
brands used in the main study (e.g. Sirgy and Johar, 1999; Sung and Choi, 2012). This
section discusses the research instruments for preliminary studies I and II and the main
study. It discusses cross-cultural data equivalence issues, pilot-testing of the
questionnaire, and the scales used in the questionnaires.
4.5.1 Cross-Cultural Data Equivalence
The issue of comparability of the data is of great importance when collecting data in
two countries, as in this thesis. Therefore, researchers need to evaluate whether an emic
or etic approach is more appropriate. According to Craig and Douglas (2005) the emic
approach assumes that attitudes and behaviour are unique to a culture and need to be
studied within the specific context of the country. Conversely, the etic approach is
focused on identifying and evaluating universal attitudes and behaviours, irrespective of
any specific country. International marketing research generally adopts an etic approach
and therefore emphasizes the development of measures that are as comparable as
possible across countries and cultures (Craig and Douglas, 2005). In line with an etic
approach, this thesis used measurement scales that have previously been validated in a
cross-cultural context.

73
This thesis accounted for measure equivalence and construct equivalence (Hult et al.,
2008). These equivalence measures are important to determine the cross-national
stability of the conceptual framework (Reynolds et al., 2003). According to Mullen
(1995) measure equivalence is concerned with the comparability of the
operationalization of the constructs considering the scaling, wording, and scoring of
measures among different populations. Measure equivalence (Table 4.1) entails three
components: (1) translation, (2) calibration, and (3) metric equivalence.
Table 4.1 – Components of Measure Equivalence
Translation
Equivalence
MTurk respondents from India and the US used an English questionnaire
(e.g. Wilkie and Bodenhausen, 2012; Eriksson and Simpson, 2010). Tasks
on MTurk are in English and the majority of users in India have been
educated in schools where English is the medium of instruction (Khanna
et al., 2010). Therefore, translation equivalence is unlikely to be an issue
of concern in this study.
Calibration
Equivalence
Calibration equivalence focuses on equality between physical and
perceptual measures across cultures (Hult et al., 2008). As stated by Hult
et al. (2008, p. 1036) ―calibration equivalence is closely tied to translation
equivalence to ensure comparability of measures across cultures‖. As the
questionnaire was administered only in English, there should be few
problems in regards to calibration equivalence. Nevertheless, to ensure the
comparability of concepts and measures between both national cultures an
three graduate students familiar with both cultures were asked for their
opinion during the pilot test (Sekaran, 1983).
Metric Equivalence Measurement invariance (metric invariance) refers to ―whether or not,
under different conditions of observing and studying phenomena,
measurement operations yield measures of the same attribute‖ (Horn and
McArdle, 1992, p. 117). Simply put, measurement invariance needs to be
achieved to ensure that the obtained paths compared between the models
are comparable in terms of the causal relationships they represent. The
most common approach to establishing metric equivalence is post-data
collection (Mullen, 1995; Steenkamp and Baumgartner, 1998). Following
previous research using PLS-SEM (Eberl, 2010), measurement invariance
was tested by using t-tests to compare the factor loadings of the US and
Indian measurement models.

74
Craig and Douglas (2005) state that construct equivalence refers to whether an object,
behaviour or concept is the same in different contexts and cultures. In the pre-data
collection phase as recommended by Hult et al. (2008), studies that applied the
constructs in the countries to be used as research grounds were reviewed. Consequently,
scales were selected that have been previously validated in both cultural settings3. As an
additional step, three graduate students, who were familiar with both cultures and two
experienced academics, checked the final version of the questionnaire to ensure that it is
appropriate in both cultural contexts. This step was performed to verify that the
questionnaire also maintains the same meaning of the concepts of interest and validity
of the constructs (Kivela et al., 1999). Post-data collection issues of construct
equivalence included an assessment of reliability and validity (Hult et al., 2008). These
steps are discussed in more detail in the analysis section 4.6.3.
Moreover, as recommended by numerous researchers (Kent, 1993; Reynolds and
Diamantopoulos, 1998; Zikmund, 2003) a pilot study of the questionnaire was
conducted. The questionnaire was pilot-tested among young Indian and US adults, who
represent the potential respondents of the study. Feedback was provided with regards to
structure, language and duration of the questionnaire. Chapter 5 discusses the details of
the pilot study.
3 Empirical studies measuring self-construal or self-congruity in the US have been reviewed (see for
example, Aaker and Schmitt, 2001; Sung and Choi, 2012). In the case of India no empirical studies on
self-construals and self-congruity in highly regarded marketing, international business, or psychology
journals were found. However, the scales to be applied in this study have also been validated also in other
countries such as Nepal, China, and South Korea (see for example, Agrawal and Maheswaran, 2005;
Bolton et al,, 2010; Kang et al., 2011). Empirical research on COS/LOC is very scarce and the scales used
have not been applied in India yet. However, the scale used has been validated in various countries,
including Singapore and Austria (Riefler et al., 2012).

75
4.5.2 Research Instruments for Preliminary Study I and II
Following previous research, two preliminary surveys to select the brands used in the
main study were conducted (e.g. Sirgy and Johar, 1999; Sung and Choi, 2012).
The objective of preliminary study I was to select four publicly and four privately
consumed brands for each country (US and India), with which the respondents were
familiar, and which could subsequently be used in preliminary study II. Specifically,
this study used brands from sport shoes and clothing apparel product categories as
publicly consumed brands (Chang, 2010; Lee and Shavitt, 2006; Giebelhausen and
Lawson, 2010; Belk, 2003; Parker, 2009). Brands from soft drinks and television sets
product categories were used as privately consumed brands (Hong and Zinkhan, 1995;
Jamal and Al-Marri, 2007; Essoussi and Merunka, 2007a; Parker, 2009). Considering
publicly and privately consumed brands from various product categories enhances the
external validity of the results (Eisenhardt, 1989). Chapter 5 provides details on the
procedures and results.
The objective of preliminary study II was to select the final four brands that were used
in the main study of this thesis. In line with previous work (Sung and Choi, 2012) the
goal was to select brands that are perceived similarly (conceptually equivalent) by
respondents from both countries. Considering that brands can be perceived differently
depending on a consumer‘s cultural background at the national level (Foscht et al.,
2008), it is important to ensure that the results of the main study are comparable across
both countries. Previous research has shown that brand familiarity, perceived product
involvement, and brand prestige/status impact brand perceptions (Mo and Roux, 2009;
Parker et al., 2008; Jain et al., 2007). Therefore, the eight brands selected in preliminary
study I were tested to ensure that the brands chosen for the main study are perceived

76
similarly across these three factors among respondents from the US and India. The
brand in each product category that displayed the most similar results between the
samples from both countries in terms of perceived brand familiarity, product
involvement (high vs. low), and prestige (high vs. low) was selected for the main study.
Details on the exact procedures and results are provided in Chapter 5. Table 4.2 gives an
overview of the scales used. The items of these scales can be found in Appendix 4.3.
Table 4.2 – Preliminary Study II Scales
Scales used
Brand familiarity Kent and Allen‘s (1994) three-item brand familiarity scale.
Product involvement Malär et al.‘s (2011) five-item product involvement scale.
Brand prestige/status Kirmani et al.‘s (1999) two-item brand prestige/status scale.
4.5.3 Research Instrument for the Main Study
This section presents a detailed discussion of each scale used in the questionnaire. The
section is divided into the following six parts: (1) Self-construals; (2) Cosmopolitan and
local orientation; (3) Four self-congruity types; (4) Brand attitude and purchase intent;
(5) Control variables and demographics and (6) Scale sensitivity. Table 4.3 gives an
overview of all the scales used.

77
Table 4.3 – Main Questionnaire Scales
Conceptual Framework
Constructs
Scale Used
Independent and
interdependent self-construals
24-item self-construal scale (Singelis, 1994). 12 items
for each self-construal type.
Cosmopolitan and local
orientation
12-item cosmopolitan orientation scale (Riefler et al.,
2012). 6-item local orientation scale (Riefler et al.,
2012).
Four self-congruity types Direct score formula; 2 items for each self-congruity
type (Sirgy et al., 1997).
Brand attitude 4-item brand attitude scale (Sung and Choi, 2012).
Purchase intent 3-item purchase intent scale (Choi and Miracle,
2004).
Control Variables
Power-distance 7-item power distance scale (Jung and Kellaris,
2006).
Long-term orientation 8-item long-term orientation scale (Bearden et
al.,2006)
Demographics
Age
Gender
Income
Education
The items of each scale can be found in Appendix 4.4
Following the suggestions by Borque and Fielder (2003), to improve the response rate
demographic questions were placed at the end of the questionnaire.
A. Self-Construals Scale and Respondent Categorisation
In this thesis, Singelis‘s (1994) scale was used to measure an individual‘s self-
construals. This is in line with previous studies that have shown good construct and
predictive validity of the scale across various countries (e.g. Zaff et al., 2002; Aaker and
Schmitt, 2001; Sung and Choi, 2012; Barone et al., 2010; Grace and Cramer, 2003).
The Singelis (1994) scale has a total of 24 items (12 statements each to measure an

78
interdependent self-construal and an independent self-construal). It measures self-
construal on a seven-point Likert-type scale (1=strongly disagree; 7=strongly agree).
Following previous studies (e.g. Escalas and Bettman, 2005; Polyorat and Alden,
2005b) both types of self-construal were measured within each country (US and India).
This measurement approach was chosen because it has been shown that within any
country consumers with a more dominant INTSC or INDSC exist (Markus and
Kitayama, 1991). To account for the orthogonal nature of self-construals, following
previous research respondents were categorised as dominant INDSC or dominant
INTSC (Lee et al., 2011; Hannover et al., 2006; Holland et al., 2004; Wu et al., 2011).
The procedure works as follows. First, the average scores for each participant in regard
to his/her INDSC and INTSC were calculated. A relative self-construal index was then
created for each participant by subtracting their independence score from their
interdependence score. Respondents with a positive (negative) score were categorised as
having an interdependent (independent) self-construal. Additionally, in order to account
for the issue that some respondents may register a high or low score on both self-
construals, those with a final index of zero were dropped from the sample.
B. Cosmopolitan and Local Orientation Scale and Respondent
Categorisation
An individual‘s cosmopolitan and local orientation was measured with scales by Riefler
et al. (2012). The scales have been shown to have satisfactory reliability and validity
(discriminant and convergent) among a variety of populations (student and non-student)
and countries (e.g. Singapore, Austria). The scale to measure a cosmopolitan orientation
has 12 items, while the scale to measure a local orientation has 6 items. Items are
measured with a seven-point Likert-type scale (1=strongly disagree; 7=strongly agree).
It has been shown that an individual can display tendencies towards both a

79
cosmopolitan and a local orientation as they can co-exist within the individual
(Cleveland et al., 2011b). However, empirical research on an individual‘s cosmopolitan
and local orientation is scarce to date (Cleveland et al., 2013). Hence, approaches taken
by previous researchers to categorise respondents are not available. Furthermore, as
with self-construals the orthogonal nature of an individual‘s cosmopolitan and local
orientation needs to be considered. Therefore, it was decided to use the same approach
as that used with self-construal to categorize respondents as having a dominant
cosmopolitan or dominant local orientation.
C. Self-Congruity Measure
There are two approaches to measuring self-congruity. These are the gap-score formula
and direct-score formula. This thesis uses the direct-score formula. The rationale for
selecting this approach and procedure is explained below.
Self-congruity can be measured with the gap-score formula or the direct-score formula
(Sirgy and Su, 2000). The gap-score formula measures an individual‘s perception of
his/her self-image and his/her perception about his/her self-image in regard to the
product/brand image in order to mathematically compute a discrepancy score. This
leads to a self-congruence measure that indicates a degree of match or mismatch
(congruence/incongruence) between the individual‘s self-image and the perceived self-
image in regard to the product/brand image. However, while the gap-score formula has
been used in past research (e.g. Mehta, 1999b; Hong and Zinkhan, 1995), more recent
studies have generally focused on using the direct-score formula (e.g. He and
Mukherjee, 2007; Kang et al., 2011; Malär et al., 2011; Liu et al., 2012b). This is likely
due to empirical evidence showing that the direct-score formula overcomes the
limitations of the gap-score formula and demonstrates superior predictive validity

80
across various product types and consumer populations (for details see Sirgy et al.,
1997). The direct-score formula method prompts respondents to indicate the global4
perception of degree of match or mismatch between their self-image and the
brand/product user image. Hence, it measures self-congruity directly. This is
operationalized with the following scenario (Sirgy et al., 1997, p.232):
―Take a moment to think about ―brand/product X‖. Think about the kind
of person who typically uses ―brand/product X‖. Imagine this person in
your mind and then describe this person using one or more personal
adjectives such as stylish, classy, masculine, sexy, old, athletic, or
whatever personal adjectives you can use to describe the typical use of
―brand/product X‖. Once you have done this, indicate your agreement or
disagreement with the following statement. This ―brand/product X‖ is
consistent with how I see myself (my actual self).‖
A seven-point Likert-type scale (1=Strongly Disagree, 7=Strongly Agree) is used for
this purpose. To measure ideal self-congruity, social self-congruity and ideal social self-
congruity the respective words are adjusted in the last sentence of the scenario above
(e.g. this ―brand/product X‖ is consistent with how I would like to see myself; my ideal
self).
4 Global here does not refer to global vs. local. Global refers to an overall image perception, instead of
various single image dimensions.

81
D. Brand Attitude Scale and Purchase Intent Scale
Brand attitude is described as a psychological construct that involves an assessment of
the strength of the attitude and requires substantial processing regarding the brand (Park
et al., 2010). Following prior research (e.g. Dabholkar and Bagozzi, 2002; Kang et al.,
2011) a semantic-differential scale is used in this thesis. Specifically, this thesis used
Sung and Choi‘s (2012) four-item scale to measure brand attitude.
Purchase intent has been defined as ―an individual‘s conscious plan to make an effort
to purchase a brand‖ (Spears and Singh, 2004). In accordance with previous studies, this
thesis uses a semantic differential scale (e.g. Mehta, 1999b; Spears and Singh, 2004;
Wilcox et al., 2009). Specifically, this thesis used Choi and Miracle‘s (2004) three-item
scale to measure purchase intent.
E. Control Variables
This thesis used various demographic variables as control variables, which have been
shown to influence the individual-level characteristics tested. The demographic
variables used are age, gender, income and education. They are important for the
following reasons. First, age is relevant as it has been shown to affect self-construals,
because there is a positive relationship between age and an INTSC (Zhang, 2009; Kim,
2005). Second, gender has been shown to affect the degree of cosmopolitanism, as
females score higher than males in terms of cosmopolitanism (Cleveland et al., 2009).
Third, income has been shown to be positively related to an INDSC (Kim, 2005).
Fourth, education has been shown to be positively related to cosmopolitanism (Riefler
et al., 2012). The specific post-hoc analysis procedures for the control variables are
described in chapter 7, section 7.5.

82
Moreover, individuals from the US and India are likely to differ in terms of power
distance and long-term orientation (Hofstede, 2012). However, rather than assuming
that these differences exist, the two variables were also measured. Section 4.4.1
discussed the rationale for considering these variables and their potential impact on the
tested relationships. First, in line with previous research (e.g. Jung et al., 2009), this
thesis used the scale developed by Jung and Kellaris (2006) to measure power distance.
Second, following previous studies (e.g. Kopalle et al., 2010), this thesis used the scale
developed by Bearden et al. (2006) to measure long-term orientation.
F. Scale Sensitivity
Sensitivity has been defined as ―the degree to which a scale of measurement can
discriminate meaningful differences in characteristics [variables] of interest‖ (Webb,
2002, p. 148). As recommended by numerous researchers this thesis used 7-item scales
(e.g. Preston and Colman, 2000). Numerous studies have shown that scales with a
midpoint benefit from greater reliability than even-numbered scales (Adelson and
McCoach, 2012; Graeff, 1999). Considering scales with a midpoint, research indicates
that 7-item scales are ideal as they provide increased sensitivity compared to 3- or 5-
item scales (Green and Rao, 1970; Miller, 1956; Preston and Colman, 2000; Webb,
2002). Moreover, the limitations arising from misinterpretations of the midpoint
selection were reduced by providing clear labels on the scale items (i.e. neither agree
nor disagree) and the inclusion of a separate response option labelled ―Don‘t
know/Don‘t want to answer‖ (Tsang, 2012).

83
4.6 Data Analysis Approach
This section presents the data analysis approach used in this thesis. The data analysis
started with a preliminary data analysis (e.g. data cleaning) to prepare the data for
subsequent analysis. This was followed by PLS-SEM analysis to validate the
measurement instrument, evaluate the structural model and to test the hypotheses.
Figure 4.1 presents the data analysis sequence.
Figure 4.1 Data Analysis Sequence
Data Analysis Sequence
Preliminary Data Analysis
Two-stage PLS-SEM Approach
Stage 1. Measurement Instrument
Validity (internal)
Sensitivity and External Validity
Stage 2. Evaluate SEM Model and test Hypotheses
Reliability
Content- and Face Validity
Construct Validity
Convergent Validity
Discriminant Validity
Common Method Variance
Approach
Literature Review and Expert Opinions
Composite Reliability
Examination of accuracy, data cleaning,
non-response bias
Factor Loadings Significant and Average
Variance Extracted (AVE)
Marker Variable Technique
Multi-item scale and two Country Study
Various Predictive Capabilities Criteria (e.g.
R2, Q2 and path coefficients)
AVE2 > Intercorrelations of Constructs
Multi-Group PLS Analysis
(Measurement Invariance)
T-test Factor Loadings Comparison
Source: Developed by the author (2014)
84
4.6.1 Preliminary Data Analysis and Non-Response Bias
According to Aaker et al. (2006) the quality of statistical analysis is affected by how
well the data are prepared and converted into a form suitable for analysis. The data were
analysed with a widely accepted software package, namely SPSS version 20 (Zikmund,
2003). Following the suggestions by Tabachnick and Fidell (2007), the data was
cleaned before proceeding to the analysis of the data sets the data were cleaned using
the following three steps: (a) checking the respondents attention, based on the attention
check question included in the questionnaire (Oppenheimer et al., 2009); (b) an
examination of data input accuracy (Malhotra, 1999); and (c) an examination of normal
distribution and outliers (Hair et al., 1998). Details of these steps and the procedures can
be found in chapter 6, section 6.2. Moreover, the potential effect of non-response bias
was also assessed (Armstrong and Overton, 1977).
Non-response bias arises in surveys if the answers of respondents differ from the
potential answers of those who did not answer, called non-respondents (Hair et al.,
2006; Biemer and Lyberg, 2003). Following the approach used in previous research
(e.g. Homburg et al., 2010; Malär et al., 2011) potential non-response bias in the data
was tested by comparing construct means for early and late respondents (Armstrong and
Overton, 1977). The latter are assumed to be similar to non-respondents (Simsek et al.,
2007). Specifically, the means of the constructs in the model pertaining to early and late
respondents were compared with the use of t-tests (Dada and Watson, 2013). This was
done by checking the specific date of responses of each participant in comparison to the
time when the contact email with the questionnaire was sent. Hence, if the differences
between construct means for both groups do not differ significantly, non-response bias
is unlikely to affect the data.

85
4.6.2 Structural Equation Modelling and PLS-SEM Rationale
Structural Equation Modelling (SEM) has been described as ―a family of statistical
models that seek to explain the relationships among multiple variables (Hair et al.,
2010, p. 634). When considering SEM, there are two different methods: covariance-
based methods (CB-SEM; Jöreskog, 1978) and variance based partial least squares
(PLS-SEM; Lohmöller, 1989b). Researchers have argued that neither of these two SEM
methods is better than the other in offering reliable and valid results. Rather, as shown
in various reviews, the appropriateness of each SEM method depends on the focus of
the research, the properties of the model and data properties (for details, see Hair et al.,
2011; Hair et al., 2012; Henseler et al., 2009). It has been argued that PLS-SEM is
generally more suited to exploratory purposes, while CB-SEM is more appropriate for
theory-testing (Hair et al., 2011). However, empirical evidence shows that PLS-SEM is
a viable option for theory-testing and should be chosen over CB-SEM as it will offer
more precise results (e.g. Hair et al., 2011; Reinartz et al., 2009) when two conditions
are met: (1) The model contains constructs with fewer than three indicators; and (2) the
sample size for testing the model contains fewer than 250 observations.
First, when the number of indicators for at least one construct in the model is small (i.e.
one or two), PLS-SEM should be favoured over CB-SEM. Constructs built on one or
two indicators reflect a locally underidentified variable when using CB-SEM, which is
likely to lead to measurement error (Little et al., 2002). With CB-SEM every construct
should be measured using at least three or four indicators to ensure valid results
(Baumgartner and Homburg, 1996). Conversely, a construct‘s measurement properties
are less restrictive with PLS-SEM; hence, when constructs are built on one or two
indicators, PLS-SEM should be used as it offers more precise results compared to CB-
SEM (Hair et al., 2011). This thesis used a previously validated scale to test the four
self-congruity types (i.e. Sirgy et al., 1997). Each self-congruity type is measured with

86
two indicators. Therefore, to benefit from the widely adopted and cross-nationally
validated scales used in this study it was deemed necessary to choose PLS-SEM over
CB-SEM.
Second, Reinartz et al. (2009, p. 342) offer empirical evidence that PLS-SEM rather
than CB-SEM ―should be the method of choice for all situations in which the number
of observations is lower than 250‖. Moreover, they further specify that if the
measurement model contains constructs with two indicators, as in this thesis, PLS-SEM
should always be used with samples smaller than 400. If these sample size criteria are
not considered, the use of CB-SEM will result in biased test statistics leading to Type II
error (Hu and Bentler, 1995; Reinartz et al., 2009). To test the hypotheses in this study,
sub-samples of the overall data set in each country were used (e.g. individuals with a
dominant cosmopolitan orientation). Therefore, it was necessary to split the full samples
into smaller subsamples for each consumer type. Considering that four of the eight sub-
samples in this study contained fewer than 400 cases it was deemed necessary to use
PLS-SEM to ensure that the results are valid and reliable. For details on the subsample
size see chapter 6, section 6.4.1.
4.6.3 PLS-SEM Analysis Approach
Anderson and Gerbing (1988) recommend a two-stage Structural Equation Modelling
approach by estimating the measurement and structural model separately (Hair et al.,
2010). This approach allows an accurate representation of the reliability of the items
relevant to each construct. Hence, this approach avoids any interaction between
structural and measurement models (Hair et al., 1995). After conducting the preliminary
data analysis, the first step of the PLS-SEM approach was conducted. First the
measurement models were tested. Second, multi-group PLS-SEM analysis was

87
conducted to establish whether the measures are comparable across the US and Indian
samples. Third, the potential effect of common method variance on the data was
assessed.
A. Measurement Model
Following the approach suggested by Anderson and Gerbing (1988) the measurement
models were examined for reliability and construct validity (convergent and
discriminant validity). Table 4.4 shows the corresponding evaluation criteria. The same
approach and criteria have been used in numerous marketing studies over the last
decade (e.g. Ekinci et al., 2008; O'Cass and Grace, 2008; Malär et al., 2011; Sattler et
al., 2010). Chapter 6 presents the details on the results of each measurement model.
Table 4.4 Measurement Models Evaluation Criteria
Criteria and Source
Reliability Composite Reliability > 0.7 (Nunnally and Bernstein, 1994) Construct Validity Convergent Validity
Factor Loadings > 0.708 and significant (Hair et al., 2014)
Average Variance Extracted (AVE) > 0.5 (Fornell and Larcker,
1981).
Discriminant Validity
Square root of the AVE > intercorrelations of the construct with
any other construct (Barclay et al., 1995; Fornell and Larcker,
1981)
B. Multi-Group PLS Analysis
To establish the cross-cultural applicability of the models, multi-group analysis was
performed for the US and Indian measurement models. Chin (2000) argues that in order
to perform multi-group analysis in a PLS-SEM context, the following three assumptions
should be met: (1) the data should not strongly violate a normal distribution; (2) the
models must achieve acceptable R2 values of the endogenous constructs (details below
in section D), since there is no other overall parametric criterion (i.e. Goodness of fit) in

88
PLS-SEM in contrast to CB-SEM (Eberl, 2010); and (3) there should be measurement
invariance (MI), which is explained below. Therefore, the data were evaluated if they fit
these three criteria.
Considering that this thesis collected data from the US and India, measurement
invariance was considered in the analysis. Measurement invariance, also called ―metric
invariance‖ (Vandenberg and Lance, 2000), refers to ―whether or not, under different
conditions of observing and studying phenomena, measurement operations yield
measures of the same attribute‖ (Horn and McArdle, 1992, p. 117). Simply put,
measurement invariance needs to be achieved to ensure that the obtained paths
compared between the models are comparable in terms of the causal relationships they
represent. This condition is met if, in the measurement model the latent variable‘s factor
loadings on the indicators do not differ significantly across groups (Chen, 2007).
Following previous research using PLS-SEM (Eberl, 2010), measurement invariance
was tested by using t-tests to compare the factor loadings of the US and Indian full
sample models. Chapter 6, section 6.4.3 provides the results of this test.
C. Common Method Variance (CMV)
In line with Sheng et al. (2011), Common Method Variance (CMV) was tested. CMV
has been described by Podsakoff et al. (2003, p. 879) as ―variance that is attributable to
the measurement method rather than to the constructs the measures represent‖.
Considering that the data for all the model variables came from single respondents in a
one-off survey, common method variance may have influenced some of the
relationships in the PLS path model. However, various precautions were taken in order
to limit the potential for CMV. First, in line with the suggestions provided by
MacKenzie and Podsakoff (2012) procedural measures were taken in the design of the

89
survey to reduce the likelihood of CMV. These included keeping respondents motivated
by explaining why their participation and honest answers are important and changing
question formats in the survey (Viswanathan, 2005; Krosnick, 1999). Second, statistical
methods were used on a post-hoc basis to test whether CMV was prevalent. To test for
the potential existence of common method bias, the correlational marker variable
technique proposed by Lindell and Whitney (2001) was used. The correlational marker
variable technique relies on the inclusion of a ‗marker variable‘, which is theoretically
unrelated to the variables/constructs in the model. The idea behind this technique is that
the impact of this marker variable on the correlations in the model provides a reasonable
proxy for CMV. It is the shared variance between the marker and the other
variables/constructs in the model (with which the marker is not otherwise expected to be
related) that is believed to be representative of CMV. Lindell and Whitney propose
using the following equation to remove shared variance between the marker and other
variables.
rYiM = (rYi –rS) / (1-rS)
rYiM = correlation between independent and dependent variables controlling for CMV
(the ―corrected‖ correlation)
rYi = observed correlation between independent and dependent variable suspected of
being contaminated by CMV
rS = smallest observed correlation between the marker variable and one of the variables
with which it is expected to be theoretically unrelated.
After performing this calculation for each path coefficient, the resulting ‗‗corrected‘‘
correlations should be closer approximations to true relationships than the uncorrected
correlations. Consequently, if the relationships tested (path coefficients and significance
levels) are not affected to a significant extent; CMV can be assumed not to be an issue
of concern. ‗A respondent‘s money worries‘ (Cernkovich et al., 2008) was selected as

90
the marker variable, since it is conceptually unrelated to both the independent and
dependent variables.
D. Structural Model
The structural model in PLS-SEM was evaluated based on criteria that are determined
by the model‘s predictive capabilities of the endogenous variables/constructs, rather
than using measures of goodness of fit as in CB-SEM (Hair et al., 2014). The predictive
capabilities of the structural model are determined following the recommendations by
Hair et al. (2014; 2012). Specifically, before evaluating the structural model, the
collinearity between the predictor constructs was assessed by testing the tolerance levels
and Variance Inflation Factor (VIF). Collinearity means that there are high correlations
between the predictor constructs, indicating that they represent similar types of
information. Hence, they affect the predictive relevance of each predictor construct.
Subsequently, Hair et al. (2014) recommend that researchers use five criteria explained
below to evaluate the quality of the structural model.
First, the quality of the structural model is determined by the coefficient of
determination based on r-square values (R2), which measures the predictive accuracy of
the model on the endogenous constructs. Second, the quality of the structural model is
also determined by the predictive relevance of the model to the endogenous constructs,
which is based on the Stone-Geisser‘s Q2 value (Geisser, 1974; Stone, 1974). R
2 and Q
2
values within the expected boundaries are indicative that the model as a whole (i.e. all
four self-congruity types) has good predictive capabilities on brand attitude. Third, the
f2 effect size provides information on how much a specific predictor construct
contributes to the R2
of the endogenous construct. Fourth, the q2 effect size indicates
how much each predictor construct contributes to the Q2
value. f2 and q
2 values within

91
the expected boundaries are indicative that each individual exogenous construct (i.e.
each of the four self-congruity types) has a substantive predictive impact on brand
attitude. Fifth, following previous research (e.g. Hennig-Thurau et al., 2007; Ekinci et
al., 2008) t-values established on the basis of 500 bootstrapping runs determine the
significance and relevance of the path coefficients5. The significance and relevance of
the path coefficients shows the strength of the relationship between each of the four
self-congruity types and brand attitude and allows the hypotheses in this thesis to be
tested (e.g. for an individual with a dominant cosmopolitan orientation, ideal self-
congruity has a stronger effect on brand attitude than actual self-congruity). Figure 4.2
shows the steps taken and acceptable thresholds for each criterion.
Figure 4.2 Evaluation Criteria Structural Model
Source: Cohen, 1988; Falk and Miller, 1992; Hair et al. 2014
5 The path coefficient and corresponding significance levels are used to test the hypotheses that determine
which type of self-congruity has a stronger effect on brand attitude.

92
4.7 Conclusion
This chapter provided an overview of the philosophical position (positivism) and
research approach (quantitative) adopted in this thesis. It discussed the data collection
methods (online-survey) and the geographic rationale (India and US), as well as issues
relevant to sampling. Subsequently, it offered a detailed description of the procedures
used and the questionnaires for the two preliminary studies and main study, including
issues pertaining to cross-national comparability of the two country samples. Next, it
described the preliminary data analysis approach. This was followed by a description of
the data analysis method (PLS-SEM) used to empirically test the measurement model
(including metric invariance and CMV), structural model and the hypotheses. The next
chapter offers a detailed discussion of the two preliminary studies and the pilot study of
the main study questionnaire.

93
Chapter 5 - Results Preliminary Study I, II and Pilot Study
5.1 Introduction
This chapter presents the results of preliminary study I, preliminary study II and the
pilot study for the main questionnaire. Following previous research (e.g. Sirgy and
Johar, 1999; Sung and Choi, 2012) two preliminary studies were conducted to select a
total of four brands (two publicly and two privately consumed) and their respective
products for the main study. Specifically, the objective of preliminary study I was to
select four publicly and four privately consumed brands for each country (US and
India), with which the respondents are familiar (Kent and Allen, 1994). The purpose of
choosing privately and publicly consumed brands was to offer more generalizable
results than previous research (i.e. Kim and Hyun, 2013) by accounting for the potential
impact of brand conspicuousness in the research design. The product categories for
publicly consumed brands are sports shoes and clothing apparel (Murray, 2002;
Netemeyer et al., 1995; Parker, 2009; Giebelhausen and Lawson, 2010; Chang, 2010).
Privately consumed brands are represented by soft drinks and television sets (Graeff,
1996; Parker, 2009; Essoussi and Merunka, 2007b). The objective of preliminary study
II was to select the final four brands that will be used in the main study and that are
perceived similarly (cross-nationally comparable) in both countries (US and India). The
objective of the pilot test was to improve the main study questionnaire to a state that
limits the potential drawbacks due to problems with structure or language ambiguities,
hence improving the validity and reliability of the research instrument (Churchill,
1995). The chapter is structured as follows. Section 5.2 presents the results of
preliminary study I. Section 5.3 offers the results of preliminary study II. Section 5.4

94
presents the results of the pilot test of the main study questionnaire. Finally, section 5.5
provides the conclusion section of the chapter.
5.2 Preliminary Study I
This section discusses the applied procedure and implications of preliminary study I.
5.2.1 Procedure
As outlined in chapter 4 section 4.4.6, respondents were contacted and recruited through
Amazon‘s Mechanical Turk (MTurk) online platform. They were provided with a short
description of the survey on MTurk, and those interested in participating proceeded via
a hyperlink to the actual web-survey hosted externally (a copy of the online
questionnaire can be found in Appendix 5.1). Following previous research the
respondents were paid a small monetary incentive for participating (Buhrmester et al.,
2011; Mason and Suri, 2012). The same approach was used in both countries (US:
n=36; India: n=34) and the data were collected during the same week of March 2013. In
line with Sung and Choi (2012), respondents in the US and India were asked to name
any five brands with which they are familiar for each of the four selected product
categories. After creating a list of all the brands highlighted by the respondents,
frequency of mention was used by the researcher to select the two most frequently
named brands for each product category (Parker, 2009). Details of the results in the US
and India can be found in Appendix 5.2

95
5.2.2 Implications of the Results for Preliminary Study II
The following considerations in the US and India were made concerning which brands
to select for preliminary study II.
Table 5.1 gives an overview of the brands selected in the US and India. Among US
respondents, in the clothing apparel category the brands Levi‘s (n=12) and Lee (n=10)
received the highest number of mentions, followed by GAP (n=8). However, both
Levi‘s and Lee are known mainly for denim (jeans) products, while GAP offers a wider
array of clothing apparel. Hence, to offer more variability in terms of the selected
brands and the products they represent, it was decided to select Levi‘s and GAP for the
next study (preliminary study II).
Indian respondents mentioned Nike (28) and Reebok (28) the same number of times in
the sports shoes category. Consequently, in order to choose between Nike and Reebok
the order of mention by the respondents was considered. Overall, 22 respondents
mentioned both brands when asked to list five sport shoe brands. However, even though
they were not instructed to rank the brands, 15 respondents listed the brand Nike before
Reebok (7 listed Reebok before Nike). This may indicate that they are more familiar
with Nike than Reebok; therefore, Nike was selected for preliminary study II.
Furthermore, in the clothing apparel category the brand Peter England produces only
men’s clothing (www.peterengland.com). Hence, using this brand in the proposed study
would compromise the validity of the results, as the brand is not directly relevant for
female respondents. Therefore, it was decided to use the brands Benetton (n=6) and
Levi‘s (n=8) in the clothing apparel category. Benetton offers clothing for male and
female consumers. Moreover, while the brands Lee and Wrangler received the same
number of mentions as Benetton, they are mainly known for denim (jeans) products,
while Benetton offers a wider array of clothing apparel. Hence, to offer more variability

96
in terms of the selected brands to ensure that they are relevant for respondents of both
genders, it was decided to select Levi‘s and Benetton for the next study (preliminary
study II). The following brands were used in preliminary study II for the Indian sample.
Table 5.1 Brands Preliminary Study I
Product Category US India
Sport Shoes Nike Adidas Adidas Nike
Clothing Apparel Levi‘s Gap Levi‘s Benetton
Soft Drinks Coca Cola Pepsi Coca Cola Pepsi
Television Sets Sony Samsung Samsung Sony
Interestingly, with the exception of one brand (Benetton), in the clothing apparel
category respondents in the US as well as India mentioned the same two brands most
frequently in all product categories. This indicates that the selected brands are well
known in both countries. Looking towards the main study, the main consideration was
to ensure that the brands to be selected are conceptually equivalent so that the results
can be compared across both countries. Therefore, a second preliminary study was
conducted. The eight brands in each country that were selected as a result of preliminary
study I served as the basis for preliminary study II.
5.3 Preliminary Study II
Following previous research (e.g. Sirgy and Johar, 1999; Sung and Choi, 2012), the
objective of preliminary study II was to select the final four brands for the main study
that are perceived similarly in both countries (US and India), hence ensuring that the
results are comparable across both countries. Specifically, in preliminary study II the
selected brands were assessed in regard to their perceived brand familiarity, product
involvement, and prestige/status (Kent and Allen, 1994; Kirmani et al., 1999; Malär et
al., 2011). The following sections provide an overview of the procedure used to conduct

97
preliminary study II, demographic characteristics of the sample, and the results obtained
from the respondents in the US and India. In addition, it offers the implications of these
results for the main study.
5.3.1 Procedure
Respondents were contacted and recruited through Amazon‘s Mechanical Turk
(MTurk) online platform (details on MTurk are provided in chapter 4, section 4.4.3).
The same procedures as in preliminary study I were used. To assure administration
equivalence (Hult et al., 2008) the same approach was used in both countries (US and
India) and the data were collected during the same week of March 2013.
Following previous research, 7-point Likert-type and semantic differential scales were
used in the questionnaire to measure product involvement, brand familiarity and
perceived brand prestige/status (Malär et al., 2011; Kent and Allen, 1994; Kirmani et
al., 1999). The data were collected with an online survey tool, the Bristol Online Survey
(BOS) software (a copy of the online questionnaire can be found in Appendix 5.3).
Subsequently, the collected data were coded adopting a range from 1 to 7 to capture the
responses of the 7-point scales used. In addition, as recommended by Tsang (2012) a
―Don‘t know/Do not want to answer‖ option was included, which was coded as an ―8‖.
After transferring the data from the online questionnaire into SPSS (version 20), the
procedure suggested by Tabachnick and Fidell (2007) was applied to screen the data
from both countries (US and India). This procedure included the following three steps:
First, an examination of data input accuracy; second, an analysis of missing data; and,
third, an examination of normal distribution and outliers. No issues pertaining to data
input accuracy and missing values were encountered. This is due to the fact that the
BOS survey tool allowed the data to be transferred automatically to SPSS (version 20)

98
and specified that all questions had to be answered before respondents could move to
the next page. The data were normally distributed as skewness values were in the
accepted range from -1 to +1 and the kurtosis was within a range from -3 to +3 (Muthén
and Kaplan, 1985; Tabachnick and Fidell, 2007; Hair et al., 2007). Box plots showed
that no outliers were present in the data (Hair et al., 1998).
Cronbach‘s alpha was used to assess the internal reliability of the scales applied to
measure product involvement, brand familiarity and perceived brand prestige/status.
The Cronbach‘s alpha values in the US and India ranged from .792 to .972 across all the
tested brands, which is indicative of good to excellent internal reliability (George and
Mallery, 2003; Kline, 1999). A detailed overview by country and brand is provided in
Appendix 5.4.
5.3.2 Demographic Characteristics US and India
This section discusses the cross-national comparability and within country
representativeness of the sample, along with its demographic characteristics.
A. Cross-National Comparability
Following Hult et al.‘s (2008) recommendation the goal was to obtain samples in the
US and India that are cross-nationally comparable. Both samples are comparable in
terms of age as they mainly contain respondents in their mid-20s to early-30s and are
thus representative of young adults (Hwang and Kandampully, 2012). Differences
between the two country samples were found in terms of education, gender and income.
The most noticeable difference was in the income levels between US and Indian
respondents (details in Table 5.2 and Appendix 5.5). This was not surprising and is also

99
representative of the countries as a whole in terms of income, looking beyond this
MTurk sample (CIA, 2013; Census, 2010; MRSI, 2011). However, although the
samples are different in terms of these demographic variables, this is likely not to pose a
problem for the following reason. The specific purpose of these two preliminary studies
was to select brands that are relevant for respondents from both countries and perceived
similarly along the tested dimensions (e.g. perceived status/prestige). Thus, the potential
impact of demographic differences on the main study is limited. Moreover, post-hoc
tests were conducted in the main study to test whether age, gender, income and
education have an impact on the tested relationships. No significant impact was found
(details in chapter 7).
B. Within-Country Representativeness
The obtained samples display a fairly heterogeneous sample with respect to
demographic characteristics, while reflecting the characteristics of young adults in the
US and Indians with relatively high socioeconomic status compared to the overall
Indian population (CIA, 2013; MRSI, 2011; Census, 2010). Although the obtained
samples in the US and India do not offer a perfectly representative sample of the
corresponding populations, they are more representative of the population than many
traditional subject pools such as student or other convenience samples (Buhrmester et
al., 2011; Paolacci et al., 2010). Details of the demographic characteristics can be found
in Table 5.2.
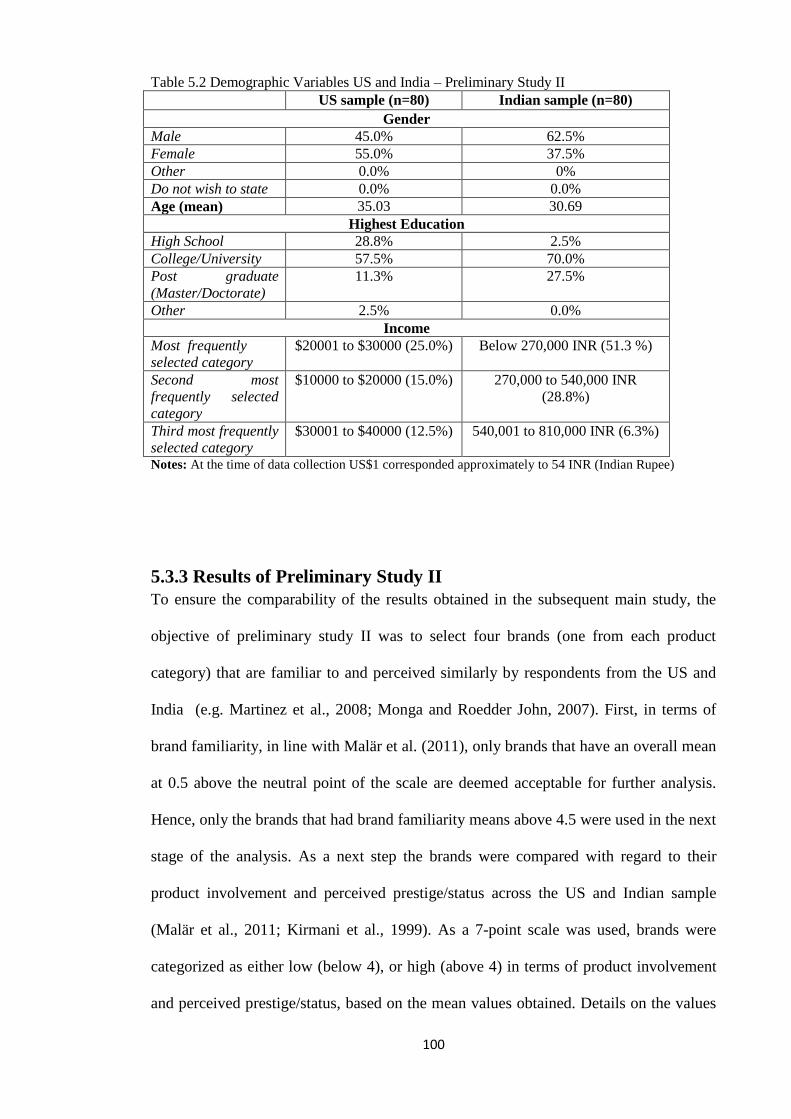
100
Table 5.2 Demographic Variables US and India – Preliminary Study II
US sample (n=80) Indian sample (n=80)
Gender Male 45.0% 62.5% Female 55.0% 37.5% Other 0.0% 0% Do not wish to state 0.0% 0.0% Age (mean) 35.03 30.69
Highest Education High School 28.8% 2.5% College/University 57.5% 70.0% Post graduate
(Master/Doctorate) 11.3% 27.5%
Other 2.5% 0.0% Income
Most frequently
selected category $20001 to $30000 (25.0%) Below 270,000 INR (51.3 %)
Second most
frequently selected
category
$10000 to $20000 (15.0%) 270,000 to 540,000 INR
(28.8%)
Third most frequently
selected category $30001 to $40000 (12.5%) 540,001 to 810,000 INR (6.3%)
Notes: At the time of data collection US$1 corresponded approximately to 54 INR (Indian Rupee)
5.3.3 Results of Preliminary Study II
To ensure the comparability of the results obtained in the subsequent main study, the
objective of preliminary study II was to select four brands (one from each product
category) that are familiar to and perceived similarly by respondents from the US and
India (e.g. Martinez et al., 2008; Monga and Roedder John, 2007). First, in terms of
brand familiarity, in line with Malär et al. (2011), only brands that have an overall mean
at 0.5 above the neutral point of the scale are deemed acceptable for further analysis.
Hence, only the brands that had brand familiarity means above 4.5 were used in the next
stage of the analysis. As a next step the brands were compared with regard to their
product involvement and perceived prestige/status across the US and Indian sample
(Malär et al., 2011; Kirmani et al., 1999). As a 7-point scale was used, brands were
categorized as either low (below 4), or high (above 4) in terms of product involvement
and perceived prestige/status, based on the mean values obtained. Details on the values

101
obtained for each brand in both countries can be found in Appendix 5.6. Based on these
categorisations, the brand that displayed the most similar characteristics in each product
category across both countries was chosen for the main study. Two-dimensional plots
(involvement versus prestige/status) using the data from preliminary study II were used
to facilitate the selection process. Below are plots for each of the four product
categories.
A. Television Sets
Based on the results obtained both brands are considered high prestige/status and
high involvement among respondents from the US and India, indicating that they are
perceived similarly. Specifically, the television set plot (Figure 5.1) shows that the
brand Sony is perceived more similarly than Samsung among US and Indian
respondents and was therefore chosen for the main study.
Figure 5.1 Television Sets Brands
High Involvement
Low Involvement
High Status
Low Status41
1
2
2
3
3 5
5
6
6 7
7
Sony-US
Sony-INSams.-IN
Sams.-US
Brand
Familiarity
Sams-IN=6,23
Sams-US=5,25
Sony-IN=5,97
Sony-US=5,43
Two-dimensional (involvement versus status) plot for the television sets

102
B. Soft Drinks
As illustrated in the soft drinks plot (Figure 5.2), the brands Pepsi and Coca Cola are
both perceived as high prestige/status among US and Indian respondents. With
regard to involvement levels, Indian respondents perceive both brands as high
involvement, while US respondents perceive them as low involvement. However,
the perception of the brand Coca Cola (M=3.98) in the US is borderline to the high
involvement category (above 4). In addition, as shown below, the overall means
obtained for Coca Cola‘s involvement and prestige/status between the Indian and
US sample are closer than for the brand Pepsi. Therefore, it was decided to choose
the brand Coca Cola for the main study.
Figure 5.2 Soft Drinks Brands
High Involvement
Low Involvement
High Status
Low Status41
1
2
2
3
3 5
5
6
6 7
7
Cola-US
Cola-IN
Pepsi-US
Pepsi-IN
Brand
Familiarity
Cola-IN=5,95
Cola-US=5,83
Pepsi-IN=5,83
Pepsi-US=5,72
Two-dimensional (involvement versus status) plot for the soft drinks

103
C. Clothing Apparel
As mentioned previously, the brands GAP (US) and Benetton (India) do not fit the
established brand familiarity criteria set at a minimum overall mean score of 4.5.
Therefore, they were not deemed appropriate for further analysis. The clothing
apparel plot (Figure 5.3) illustrates that the brand Levi‘s is considered high
prestige/status and high involvement by respondents in the US and India, thus
indicating that this brand is perceived similarly in both countries. Therefore, the
brand Levi’s was selected for the main study.
Figure 5.3 Clothing Apparel Brands
High Involvement
Low Involvement
High StatusLow Status 41
1
2
2
3
3 5
5
6
6 7
7
GAP-US
Benet.-IN
Levi‘s-US
Levi‘s-IN
Brand
Familiarity
Levi‘s-IN=5,11
Levi‘s-US=4,96
Benetton-IN=3,58
GAP-US=4,25
Two-dimensional (involvement versus status) plot for the clothing apparel

104
D. Sports Shoes
As shown in the sports shoes plot (Figure 5.4), the brand Adidas is perceived as high
prestige/status and low involvement among US respondents, while Indian respondents
perceived Adidas as high prestige/status and high involvement. On the other hand, the
brand Nike is perceived as high prestige/status and high involvement by respondents
from both countries. Furthermore, the difference in overall means between both
countries with regard to prestige/status and involvement for the brand Nike is also
smaller than Adidas, indicating that Nike is perceived more similarly than Adidas. As a
result, the brand Nike was selected for the main study.
Figure 5.4 Sport Shoes Brands
High Involvement
Low Involvement
High StatusLow Status 41
1
2
2
3
3 5
5
6
6 7
7
Nike-IN
Nike-US
Adid-US
Adid-IN
Two-dimensional (involvement versus status) plot for the sport shoes
Brand Familiarity
Nike-IN=5,41
Nike-US=5,24
Adidas-IN=5,17
Adidas-US=4,61

105
5.3.4 Conclusion of Preliminary Study II
To conclude, the preceding sections described the procedure, results and implications of
the conducted study. Based on the results of preliminary study II, the following brands
were used in the main study in the US and India:
Sport Shoes: Nike
Clothing apparel: Levi‘s
Soft drinks: Coca Cola
Television sets: Sony
Taking into account the fact that the same brands were selected and also perceived
similarly among respondents from both countries, the comparability of the results in the
main study was warranted. Before proceeding to the main study, a pilot test of the main
study questionnaire was conducted. The details are presented in the following section.
5.4 Pilot Test Main Study
As suggested by various researchers (Kent, 1993; Reynolds and Diamantopoulos, 1998;
Zikmund, 2003) a pilot-test of the questionnaire for the main study was conducted. The
objective of the pilot test was to improve the questionnaire to a state that limits the
potential drawbacks due to problems with structure or language ambiguities, hence
improving the validity and reliability of the research instrument (Churchill, 1995). This
section provides information on the steps taken to design and evaluate the questionnaire.
Moreover, it offers the results of the pilot test. Finally, it presents the insights gained
from the pilot test and its implications for the main study.

106
5.4.1 Questionnaire Design
All the scales used in the questionnaire have been previously validated in numerous
studies, hence reducing the likelihood of potential problems with validity and reliability.
Nevertheless, it was important to ensure that the questionnaire had no defects that might
have compromised its validity and reliability (e.g. terminology, structure, flow, and
instructions). To test a questionnaire Parasuraman et al. (2007) recommend conducting
personal interviews to gather feedback on the questionnaire, followed by a pilot test on
the target sample. Following these recommendations, personal interviews with six
doctoral researchers were conducted to gather feedback on the questionnaire with
respect to any potential problems with the aforementioned issues. In addition, feedback
was also gathered from four US and Indian graduate students, who are representative of
the study‘s population. Consequently, the highlighted potential problems were fixed
(e.g. education classifications on the demographic information section). As a second
step a pilot test was conducted using the same online platform (MTurk) that was used in
the main study.
5.4.2 Results Pilot Test
The pilot questionnaire was posted on the MTurk online platform following the same
procedure used in preliminary study I and II. A total of 112 questionnaires were
collected during the same week of May 2013 from US (n=51) and Indian (n=61)
respondents. The subsequent analysis of these questionnaires included three steps, as
follows: (1) checking the respondents attention, based on the attention check included in
the questionnaire; (2) inspecting the data set for values that should not be included
directly in the analysis as they will distort the results (i.e. ―Don‘t know/don‘t want to
answer‖ option); and (3) evaluating the reliability of the measurement scales used
(Cronbach‘s alpha).

107
A. Attention Check
In line with Oppenheimer et al.‘s (2009) suggestion an ―attention check‖ question was
included in the questionnaire to assess whether respondents are actually reading the
questions or are simply ―clicking‖ through the questionnaire. The following question
was posed approximately halfway through the survey: ―I hope this survey is interesting
and I still have your attention. To show me that I still have your attention, please select
"C" below‖. Out of the 112 respondents, 12 did not select option ―C‖, indicating that
they were not paying attention or reading the questions. These respondents were
excluded from further analysis, leaving a total of 100 cases.
B. Substituted Values
As outlined in chapter 4, section 4.5.4 the dataset was evaluated to determine how many
question-items had been affected by the ―Don‘t know/Don‘t want to answer‖ option,
which was coded as an ―8‖. To prevent these values from affecting the results, they
were treated as missing values. Following the suggestion by various researchers (i.e.
Tsikriktsis, 2005; Hair et al., 1998) the ―total mean substitution approach‖ was used to
deal with these values. With this approach the mean score of all respondents for the
affected question-item is used to replace the affected value, thus retaining all
respondents. Table 5.3 provides a detailed overview of how many questions-items were
affected by the ―Don‘t know/Don‘t want to answer‖ option. As shown, there are a total
of 122 question items in the questionnaire. An evaluation of the results by question-item
shows that only one item (Q30) was affected in five cases/respondents (5%). This is
below 10%, which is suggested as the upper threshold for using this approach
(Tsikrikstis, 2005). The other question-items were affected by fewer than five
respondents, thus indicating that there are no major issues with regard to question

108
ambiguity. This suggests that the respondents seemed to understand the questions or felt
comfortable enough to select an option on the seven-point scale.
Table 5.3 ―Don‘t know/Don‘t want to answer‖ Selected Questions
Specific question item# affected in
questionnaire (total 122 items)
Selected „Don’t know/Don’t
want to answer“ out of 100
respondents
4,5,6, 9, 15,16,17,21,28, 33, 34,38, 41,49,
51,52,53,54, 66, 70, 78, 79, 86, 89,90,91,
97,105,107, 111,112,113,114, 117,118,121 (n=36)
One
12,13,20,23,31,35,37,40,44,50,55,59,64,67,68,
71,72,88,94,101,103 (n=21) Two
7,11,22,24,27,36,42,56,65,93,95,115 (n=12) Three
29,39,57,80,92 (n=5) Four
30 (n=1) Five
C. Reliability of Measurement Scales
All the scales used have been validated previously in numerous studies. Nevertheless, it
was decided to evaluate the reliability of each measure in the context of this study. For
this purpose Cronbach‘s alpha was used. Almost all scales had excellent scores above
the recommended cut-off point of .70 (George and Mallery, 2003; Kline, 1999) and are
therefore suitable for the main study. Only a few measures scored below this value.
Specifically, the independent self-construal (.668) and purchase intent (.668) scales.
Considering that previous studies showed acceptable Cronbach‘s alphas for these scales,
these results may have been affected by the small sample size used in this pilot study.
Furthermore, Bowling (2002) states that values of 0.5 and higher are considered
acceptable. Hence, they were retained for the main study. Table 5.4 provides an
overview of the Cronbach‘s alpha.

109
Table 5.4 Cronbach‘s Alpha Pilot Test
Overall NIKE Sony Levi’s Coca
Cola
Independent self-
construal .830
Interdependent self-
construal .668
Local orientation .808
Cosmopolitan
orientation .887
Actual self-congruity .867 .908 .895 .866 .905 Ideal self-congruity .856 .912 .911 .875 .917 Social self-congruity .868 .889 .896 .856 .921 Ideal social self-
congruity .863 .908 .913 .930 .925
Brand attitude .721 .925 .891 .927 .943 Purchase intent .668 .892 .893 .898 .943 Power/Distance .887
Long-term
orientation .844
Money worries .801
5.4.3 Implications for the Main Study
Overall, as mentioned above, some minor changes with regard to wording and structure
were made to the questionnaire to improve its flow and clarity. For instance, the
descriptions used to capture the educational background of respondent had to be
adjusted, as different terms are used in the US and India for equivalent educational
degrees. This is to ensure that the questions are clear for the respondents in the main
study. However, the scales measuring the constructs of the study (conceptual framework
constructs) did not require any changes. Furthermore, considering that only five per cent
or less of each question-item was affected by the ―Don‘t know/Don‘t want to answer
option‖ it was decided to retain this option for the main study. This allows the
interpretation of the mid-point (4) as a neutral response that reflects the respondents‘
opinions (Tsang, 2012). To conclude, as no major modifications were made to the
research instrument (questionnaire), a further pilot test was considered unnecessary.

110
5.5 Conclusion
This chapter discussed the procedures and results of preliminary studies I and II. Four
brands that are perceived similarly by respondents from both countries were selected as
a result of these two studies (Nike, Levi‘s, Sony, and Coca Cola). Moreover, the chapter
presented the procedures and results of the pilot test of the main study questionnaire.
The following chapter presents the results of the main study in the US and India.

111
Chapter 6 – Results Data Collection and Measurement Models
6.1 Introduction
This chapter presents the results of the data collection and the measurement models
based on the studies in the US and India. Overall, all the measurement models
demonstrate satisfactory reliability and convergent and discriminant validity.
Furthermore, the analysis showed that the data are not compromised by non-response
bias and common method variance, while partial measurement invariance between the
two country models was established. The chapter is structured as follows. Section 6.2
presents information on data collection and data cleaning procedures. Section 6.3 offers
an overview of the respondent profiles, external validity considerations, and the test for
non-response bias. Section 6.4 presents the methods used to test and validate the
measurement models, including the test for common method variance and multi-group
PLS analysis. This is followed by the conclusion section of the chapter (section 6.5).
6.2 Data Collection and Cleaning
The questionnaire was posted on the MTurk online platform following the same
procedure used in preliminary studies one and two and the pilot study (chapter 5). Data
were collected during the span of one month (late May to late June 2013) in both
countries. A total of 860 questionnaires were collected from US respondents and 1053
from Indian respondents. After performing the data cleaning procedures, which are
explained below, 828 and 824 cases were retained for further analysis in the US and
India respectively. A copy of the questionnaire can be found in Appendix 6.1.

112
Following the suggestion by Tabachnick and Fidell (2007), the data were cleaned before
the researcher proceeded to the analysis of the data sets using the following three steps:
(1) checking the respondents attention based on the attention check included in the
questionnaire; (2) an examination of data input accuracy, missing values and an
inspection of the data set for values resulting from the ―Don‘t know/don‘t want to
answer‖ option; and (3) an examination of normal distribution and outliers.
6.2.1 Attention Check
As outlined in chapter 5, section 5.4.2 an ―attention check‖ question was included in the
questionnaire to assess whether respondents were actually reading the questions or are
simply ―clicking‖ through the questionnaire. Of the US respondents 32 (3.7%) did not
select option ―C‖, indicating that they were not paying attention or reading the
questions. In the Indian sample 229 (21.8%) did not select option ―C‖. These
respondents were excluded from further analysis leaving a total of 828 usable cases in
the US and 824 usable cases in India.
6.2.2 Data Input Accuracy and Substituted Values
No issues pertaining to data input accuracy and missing values were found. This is due
to the fact that the BOS survey tool allowed the transfer of the data automatically to
SPSS (version 20) and to specify that all questions had to be answered before
respondents could move to the next page. Moreover, consistent with the pilot test, the
dataset was evaluated to determine how many question-items had been affected by the
―Don‘t know/Don‘t want to answer‖ option, which was coded as an ―8‖ (i.e. Tsikriktsis,
2005; Hair et al., 1998). The maximum number of cases affected for a particular item
was around seven per cent, while the majority were between one and three per cent.
This is below 10%, which is suggested as the upper threshold for using the total mean

113
substitution approach (Tsikrikstis, 2005). Therefore, the mean score of all respondents
for the affected question-items was used to replace the affected value, thus retaining all
respondents.
6.2.3 Normal Distribution and Outliers
Due to the use of seven-point scales in the study (Likert-type and semantic differential),
the presence of extreme outliers is virtually impossible (Treiblmaier and Filzmoser,
2009). The only variable in the data set that did not have specific boundaries (i.e. 1-7)
that could lead to outliers was age. Less than two per cent of the cases were identified as
outliers in the US and Indian sample in terms of age. In line with Hair et al.‘s (1998)
suggestion that outliers should only be removed if there is evidence that they are not
representative of the population, and to retain as many data as possible for further
analysis, these outliers were retained in the sample.
In addition, to assess the normality of the data, tests to determine skewness and kurtosis
were conducted. None of the kurtosis values in the US and Indian sample were outside
the suggested -3 to +3 range (Tabachnick and Fidell, 2007). Furthermore, out of a total
of thirteen scales used in each country, none in the US and only two in India had
skewness values outside the -1 to +1 range (Local Orientation Scale = -1.114, Ideal
Self-Congruity Scale = -1.055). Therefore, based on the criteria established by
numerous researchers (i.e. Hair et al., 2007; Muthén and Kaplan, 1985), the obtained
data can be considered broadly normally distributed. Appendix 6.2 offers an overview
of the obtained skewness and kurtosis values for the data sets in each country.

114
6.3 External Validity and Respondent Profile
The following section provides an overview of the external validity of the conceptual
framework as well as demographic information on the respondents. Moreover, it offers
information on the response rate and potential implications of non-response bias.
6.3.1 External Validity
To test the external validity of the conceptual framework of this study, the relationships
were tested in two different country contexts (e.g. Steenkamp et al., 2003; Polyorat and
Alden, 2005b). Specific details on the rationale for selecting respondents from the US
and India are provided in the methodology chapter (chapter 4, section 4.4.1). Therefore,
in addition to the constructs of the model, an individual‘s power distance (PD) and long-
term orientation (LTO) were measured among respondents in both countries. These two
constructs were selected because they are likely to have an effect on the tested
relationships. Hence, if the relationships tested in this study are confirmed in both
countries with respondents that display different levels of PD and LTO, this will be a
further attest the external validity of the proposed conceptual framework. PD and LTO
were measured with multi-item scales (Jung and Kellaris, 2006; Bearden et al., 2006).
Subsequently, the single-item values for each scale were added up and an average was
computed resulting in single values for the PD and LTO scales. As anticipated, the
results of the analysis showed that respondents in India displayed higher values for PD
and LTO than US respondents (PD: India = 5.11, SD = 1.07 vs. US = 4.17, SD = 1.38;
LTO: India = 5.80, SD = 0.84 vs. US = 5.31, SD = 1.03). A t-test indicated that these
differences are significant (p < 0.001). Given these large differences, the research
setting provides a stringent test of the generalizability of the tested relationships.

115
6.3.2 Demographic Information
The discussion of the demographic characteristics of the sample is divided into two
sections. The first section discusses the cross-national comparability of the US and
Indian samples. This is followed by a discussion of the representativeness of each
sample within the US and India.
A. Cross-National Comparability of the US and Indian Samples
As suggested by Hult et al. (2008) the goal was to obtain samples in the US and India
that are cross-nationally comparable. The two samples are comparable in terms of age
as they mainly contain respondents in their mid-20s to mid-30s, who represent young
adults (Hwang and Kandampully, 2012). Differences between the two country samples
were found in terms of gender, education and income, with the most noticeable
difference being in the income levels between US and Indian respondents (details in
Table 6.1). This is also representative of the country as a whole in terms of income,
looking beyond this MTurk sample (CIA, 2013; Census, 2010; MRSI, 2011). However,
income differences between the US and Indian samples are unlikely to pose a problem
in the research design, because two preliminary studies (chapter 5) were conducted that
selected brands that are potentially consumed by respondents from both samples. In
addition, Appendix 6.3 offers a detailed description of the specific socio-economic
classes represented within each country based on the study‘s samples and their
relevance in regard to consumption of the products and corresponding brands tested.

116
B. Sample Representativeness within the Country
The US and Indian MTurk samples in this study are fairly heterogeneous with respect to
demographic characteristics within each country. Specifically, they represent the
characteristics of young adults in the US and Indians with relatively high
socioeconomic status compared to the overall Indian population (CIA, 2013; MRSI,
2011; Census, 2010). Therefore, the applicability of the results obtained in this study
may be limited to young adults in both countries, especially those from higher
socioeconomic strata in India. Details of the demographic characteristics can be found
in Table 6.1.
Table 6.1 Demographic Characteristics US and India – Main Study
US sample Indian sample
Gender
Male 45.2% 60.4%
Female 54.1% 39.4%
Other 0.2% 0%
Do not wish to
state
0.5% 0.1%
Age (mean)
32.97 29.62
Highest Education
High School 31.6% 4.9%
College/University 56.5% 62.9%
Post graduate
(Master/Doctorate)
8.8% 32.4%
Other 3.0% 0.4%
Income
Most frequently
selected category
$20001 to $30000
(17.9%)
Below 270,000
INR (48.7%)
Second most
frequently selected
category
$10000 to $20000
(15.0%)
270,000 to 540,000
INR (24.5%)
Third most
frequently selected
category
Below $10000
(13.6%)
540,001 to 810,000
INR (9.6%)
Notes: At the time of data collection US$1 corresponded approximately to 54 INR (Indian Rupee)

117
6.3.3 Response Rate and Non-Response Bias
With MTurk samples it is not possible to calculate a response rate. This is due to the
fact that it is not known how many of the approximately 500,000 MTurk users actually
saw the advertisement for the survey, but subsequently choose not to participate. Only
the number of those that opted to participate in the survey is registered by the system.
However, respondents recruited via MTurk are significantly more likely to complete the
survey than respondents recruited via online discussion forums (Paolacci et al., 2010).
Paolacci et al. (2010) showed that the use of MTurk to obtain responses strongly
diminishes the potential for non-response error in online research, which results from a
failure to collect complete information on all units in the selected sample. This is
important, as a reduction in non-response error also reduces the potential for non-
response bias (Canada, 1998).
In addition, a test on the potential effect of non-response bias was conducted. Non-
response bias arises in surveys if the respondents‘ answers differ from the potential
answers of those who did not answer, called non-respondents (Hair et al., 2006; Biemer
and Lyberg, 2003). Following the approach used in previous research (e.g. Homburg et
al., 2010; Malär et al., 2011) potential non-response bias in the data was tested by
comparing construct means for early and late respondents (Armstrong and Overton,
1977). Specifically, the means of the constructs in the model pertaining to early (first
two weeks) and late respondents (later two weeks) were compared using t-tests (Dada
and Watson, 2013). Table 6.2 shows that the means6 of all the constructs do not differ
significantly when comparing early versus late respondents. Therefore, it is concluded
that non-response bias is unlikely to be a problem in the data of both countries.
6 Section 6.4 shows that the measurement models from both countries demonstrate satisfactory reliability
and validity, while partial metric invariance was established. Hence, it is appropriate to contrast the
obtained means.

118
Table 6.2 Non-Response Bias
US sample Indian sample ER
mean
(n=520)
LR mean
(n=308)
t-stat p-value ER
mean
(n=594)
LR
mean
(n=230)
t-stat p-value
ASC 3.58 3.50 0.998 0.319 5.31 5.26 0.709 0.478
ISC 3.63 3.54 1.057 0.291 5.33 5.23 1.339 0.181
SSC 3.36 3.26 1.120 0.263 5.27 5.23 0.544 0.587
ISSC 3.55 3.45 1.051 0.293 5.32 5.31 0.212 0.832
BA 5.22 5.14 1.027 0.305 5.66 5.63 0.549 0.583
PI 5.11 4.99 1.599 0.110 5.73 5.68 0.718 0.473
Acronyms: ASC = Actual self-congruity; ISC = Ideal self-congruity; SSC = Social self-congruity;
ISSC = Ideal social self-congruity; BA = Brand attitude; PI = Purchase intent; ER = Early respondents;
LR = Late respondents
6.4 Measurement Models
The measurement models of the US and Indian samples were tested to evaluate their
reliability and validity. Furthermore, they were also tested with regard to metric
invariance between the models based on the two country samples (section 6.4.3) and for
the potential effect of common method variance (section 6.4.4). In addition, to test the
hypotheses (chapter 7) four sub-sample models had to be created in each country (US
and India). The procedure is explained below. Therefore, the reliability and validity of
the subsample measurement models was also evaluated. These subsample models are
based on the following: (a) individuals with a dominant independent self-construal
(INDSC); (b) interdependent self-construal (INTSC); (c) local orientation (LOC); and
(d) cosmopolitan orientation (COS).
6.4.1 Respondent Categorisation into Subsample Models
Following previous studies (e.g. Huber et al., 2010; Bodey and Grace, 2007; O'Cass and
Grace, 2008; Fisher and Grégoire, 2006) to test the hypotheses of this thesis (chapter 7)
the full sample in each country had to be split into various subsamples based on a

119
consumer‘s individual-level characteristics. This is due to the nature of the study, as it is
intended to investigate how a consumer‘s specific individual characteristics (e.g.
dominant interdependent self-construal or dominant cosmopolitan orientation) will
impact the effect of the four types of self-congruity on brand attitude.
To categorise respondents as having either a dominant INDSC or INTSC (Escalas and
Bettman, 2005; Bolton et al., 2010) the orthogonal nature of self-construals needs to be
considered. This means that rather than being on opposite sides of the spectrum, both
self-construal types are independent of each other and individuals can theoretically
register high or low scores on both. This thesis adopted an approach that takes this into
consideration and that was used in previous studies on self-construals (e.g. Pöhlmann et
al., 2007; Lee et al., 2011; Hannover et al., 2000; Hannover et al., 2006; Holland et al.,
2004). The following steps were taken. First, the average scores for each participant in
regard to their INDSC and INTSC were calculated. Then a relative self-construal index
was created for each participant by subtracting their independence score from their
interdependence score. Respondents with a positive (negative) score were categorised as
having a dominant interdependent (independent) self-construal. Respondents with a
score of zero were dropped from the sample. The same procedure was followed to
categorise respondents as having either having a dominant cosmopolitan orientation or a
local orientation. Table 6.3 provides an overview of the number of respondents in each
sub-sample and the respondents that were dropped from further analysis as they had an
index of zero. The smallest percentage of respondents that had to be dropped due to an
index of zero was in the US self-construals category, specifically, 51 (4.5%) of the total
sample size in the US (n=828). The largest percentage to be dropped was in the India
COS/LOC category, specifically, 100 (12.1%) of the total sample size in India (n=824).
However, this does not constitute a problem for the further analysis as the number of

120
respondents retained for each subsample (smallest: n = 195) satisfies the sample size
requirements to analyse the model7 in this thesis with the use of PLS-SEM (Hair et al.,
2011).
Table 6.3 Respondents per Subsample
Samples US India
Full sample after data cleaning 828 824
Self-construal (INTSC and INDSC)
Dropped (INTSC/INTSC index =
0)
37 93
INTSC subsample 278 493
INDSC subsample 513 238
Cosmopolitan and Local Orientation
Dropped (COS/LOC index = 0) 51 100
COS subsample 428 195
LOC subsample 349 529 Acronyms: INTSC = Interdependent self-construal; INDSC = Independent self-construal;
COS = Cosmopolitan orientation; LOC= Local orientation
6.4.2 Reliability and Validity
This section presents the procedures to test the validity and reliability of each
measurement model based on the US and Indian samples. Following the approach
suggested by Anderson and Gerbing (1988) the measurement models were examined
with PLS-SEM for reliability and convergent and discriminant validity before testing
the structural models. Specifically, reliability was assessed using composite reliability
estimates (Werts et al., 1974). It is stated that the scales are reliable if the composite
reliability scores for all constructs exceed the cut-off value of 0.7 (Nunnally and
Bernstein, 1994). Consistent with previous research (e.g. Ekinci et al., 2008) convergent
validity was examined through factor loadings‘ significance and average variance
extracted (AVE). Factor loadings above the suggested threshold of 0.708 as well as
AVE scores for each latent variable above 0.50 are indicative of convergent validity
7 According to Cohen (1992) the minimum sample size to analyse the model of this thesis should be 137.
For details see the methodology chapter, section 4.4.5.

121
(Fornell and Larcker, 1981). Following previous research (e.g. Huber et al., 2010;
Sattler et al., 2010) discriminant validity was assessed by evaluating whether the square
root of the AVE exceeds the intercorrelations of the construct with any other construct.
This is provided if the diagonal elements are greater than the off-diagonal elements
(Barclay et al., 1995; Fornell and Larcker, 1981). Additionally, multi-group PLS
analysis assessing measurement invariance between the two country samples was
performed (Chin, 2000). Furthermore, the measurement instrument was tested for
common method variance (CMV) by using the marker variable technique proposed by
Lindell and Whitney (2001). The results are presented by country (US and India) as
each dataset was collected as an independent sample.
A. US Full Sample
As shown in Table 6.4, the composite reliability scores for all constructs exceed8 the
cut-off value of 0.70 (Nunnally and Bernstein, 1994), indicating that the scales are
reliable. Factor loadings are all higher than the suggested 0.708 and significant (p <
0.001), while all AVE values are above 0.50, thus establishing convergent validity
(Fornell and Larcker, 1981). With respect to discriminant validity, the square root of the
AVE for each latent variable was greater than the corresponding latent variable
correlations (see Table 6.5). Overall, the results suggest that each latent variable has
sufficient convergent and discriminant validity. Figure 6.1 shows the US full sample
measurement model.
8 It should be noted that the composite reliability (CR) values in the models tested in this study are often
at 0.95 and above. This suggests that the indicators measure a similar concept. However, such high CR
values are not uncommon in marketing studies that investigate self-congruity effects and use similar
measures as shown in previous studies (e.g. Ekinci et al., 2006; Malär et al., 2011).

122
Table 6.4 US Full Sample Reliability and Convergent Validity
Indicator Mean St.
dev.
Factor
Loading
Composite
Reliability AVE
ASC 1 3.76 1.25 0.97 0.97 0.94
2 3.34 1.25 0.96
ISC 1 3.69 1.27 0.98 0.98 0.96
2 3.50 1.27 0.98
SSC 1 3.37 1.25 0.99 0.98 0.97
2 3.27 1.29 0.98
ISSC 1 3.57 1.31 0.98 0.98 0.98
2 3.46 1.32 0.99
BA 1 5.22 1.06 0.93 0.97 0.90
2 5.10 1.03 0.96
3 5.06 1.02 0.95
4 4.97 1.05 0.94
PI 1 4.97 1.21 0.94 0.95 0.87
2 4.88 1.15 0.96
3 5.35 1.10 0.90 Notes: All factor loadings are significant at the p < 0.001 level.
Acronyms: ASC = Actual self-congruity; ISC = Ideal self-congruity; SSC = Social self-congruity;
ISSC = Ideal social self-congruity; BA = Brand attitude; PI = Purchase intent
Table 6.5 US Full Sample Latent Variable Correlations ASC BA ISC ISSC PI SSC
ASC 0.9695 0.0000 0.0000 0.0000 0.0000 0.0000
BA 0.5159 0.9487 0.0000 0.0000 0.0000 0.0000
ISC 0.8218 0.5279 0.9798 0.0000 0.0000 0.0000
ISSC 0.8034 0.5010 0.8579 0.9899 0.0000 0.0000
PI 0.5442 0.8150 0.5308 0.5138 0.9327 0.0000
SSC 0.8214 0.4427 0.7999 0.8101 0.4908 0.9849 Acronyms: ASC = Actual self-congruity; ISC = Ideal self-congruity; SSC = Social self-congruity;
ISSC = Ideal social self-congruity; BA = Brand attitude; PI = Purchase intent

123
Figure 6.1 Measurement Model US Full Sample
ISC
ASC
ISSC
SSC
ASC1
ISSC1
ASC2
BA3
PI3PI2PI1
ISSC2
SSC2
SSC1
ISC2
ISC1
BA2BA1 BA4
BA PI
0.97
0.96
0.96
0.98
0.99
0.98
0.98
0.98
0.99
0.95
0.96
0.940.93
0.94 0.90
Acronyms: ASC = Actual self-congruity; ISC = Ideal self-congruity;SSC = Social self-congruity; ISSC = Ideal social self-congruity; BA = Brand attitude; PI = Purchase intent
B. India Full Sample
Table 6.6 shows that the composite reliability scores are all above 0.70, indicating that
the scales are reliable (Nunnally and Bernstein, 1994). The factor loadings are above
0.708 (p < 0.001) and the AVE scores are above 0.50, hence establishing convergent
validity for the Indian full sample measurement model (Fornell and Larcker, 1981). The
latent variables display sufficient discriminant validity, as the square roots of the AVE
for each latent variable are greater than the correlation of the construct with any of the
remaining constructs (see Table 6.7). Overall, the results indicate that convergent and
discriminant validity has been attained. Figure 6.2 shows the Indian full sample
measurement model.
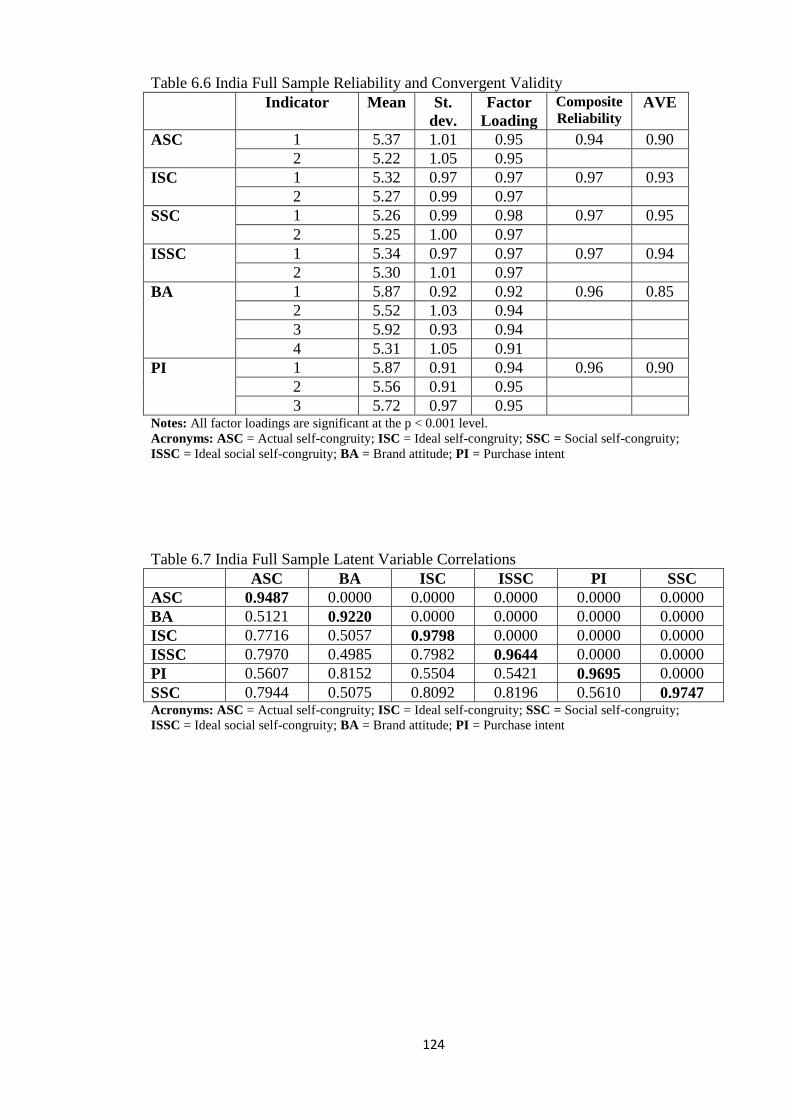
124
Table 6.6 India Full Sample Reliability and Convergent Validity
Indicator Mean St.
dev.
Factor
Loading
Composite
Reliability AVE
ASC 1 5.37 1.01 0.95 0.94 0.90
2 5.22 1.05 0.95
ISC 1 5.32 0.97 0.97 0.97 0.93
2 5.27 0.99 0.97
SSC 1 5.26 0.99 0.98 0.97 0.95
2 5.25 1.00 0.97
ISSC 1 5.34 0.97 0.97 0.97 0.94
2 5.30 1.01 0.97
BA 1 5.87 0.92 0.92 0.96 0.85
2 5.52 1.03 0.94
3 5.92 0.93 0.94
4 5.31 1.05 0.91
PI 1 5.87 0.91 0.94 0.96 0.90
2 5.56 0.91 0.95
3 5.72 0.97 0.95 Notes: All factor loadings are significant at the p < 0.001 level.
Acronyms: ASC = Actual self-congruity; ISC = Ideal self-congruity; SSC = Social self-congruity;
ISSC = Ideal social self-congruity; BA = Brand attitude; PI = Purchase intent
Table 6.7 India Full Sample Latent Variable Correlations ASC BA ISC ISSC PI SSC
ASC 0.9487 0.0000 0.0000 0.0000 0.0000 0.0000
BA 0.5121 0.9220 0.0000 0.0000 0.0000 0.0000
ISC 0.7716 0.5057 0.9798 0.0000 0.0000 0.0000
ISSC 0.7970 0.4985 0.7982 0.9644 0.0000 0.0000
PI 0.5607 0.8152 0.5504 0.5421 0.9695 0.0000
SSC 0.7944 0.5075 0.8092 0.8196 0.5610 0.9747 Acronyms: ASC = Actual self-congruity; ISC = Ideal self-congruity; SSC = Social self-congruity;
ISSC = Ideal social self-congruity; BA = Brand attitude; PI = Purchase intent

125
Figure 6.2 Measurement Model India Full Sample
ISC
ASC
ISSC
SSC
ASC1
ISSC1
ASC2
BA3
PI3PI2PI1
ISSC2
SSC2
SSC1
ISC2
ISC1
BA2BA1 BA4
BA PI
0.95
0.95
0.96
0.97
0.98
0.97
0.97
0.97
0.97
0.94 0.94 0.910.92
0.950.94 0.95
Acronyms: ASC = Actual self-congruity; ISC = Ideal self-congruity;SSC = Social self-congruity; ISSC = Ideal social self-congruity; BA = Brand attitude; PI = Purchase intent
It should be noted that the same analysis of the measurement models was performed on
all of the subsample models (e.g. dominant COS orientation, dominant INTSC). The
models contain the same variables and indicators as the full sample models but are
based on the four different subgroups of the sample in this study. All the sub-sample
based measurement models in both countries also displayed satisfactory reliability and
convergent validity and discriminant validity scores based on the same criteria as the
full sample models in the US and India. The detailed results of all the subsample models
can be found in Appendix 6.4.

126
6.4.3 Multi-group PLS Analysis
To establish the cross-cultural applicability of the model, multi-group analysis was
performed for the US and Indian full samples. Chin (2000) argues that in order to
perform multi-group analysis in a PLS context, the following three assumptions should
be met: (1) the data should not strongly violate a normal distribution; (2) the models
considered have to achieve an acceptable R2 of the endogenous constructs, since there is
no other overall parametric criterion in PLS as in CB-SEM (Eberl, 2010); and (3) there
should be measurement invariance (MI).
As discussed in section 6.2.3 and shown in Appendix 6.2, the first criterion is met as the
data are only in light violation of a normal distribution. Furthermore, all the models also
achieved acceptable R2 of all their endogenous constructs. Hence, they satisfy the
second requirement (details in chapter 7, section 7.2). The third criterion is that
measurement invariance, also called ―metric invariance‖ (Vandenberg and Lance, 2000)
is established. This condition is met if in the measurement model the latent variable‘s
factor loadings on the indicators do not differ significantly across groups (Chen, 2007).
Following previous research using PLS (Eberl, 2010), measurement invariance was
tested by using t-tests to compare the factor loadings of the US and Indian full sample
models. The results of this test show (Table 6.8) that out of the 15 indicators in the
model, 6 were found to be variant (p < 0.05). In an ―ideal‖ scenario researchers should
strive for full measurement invariance in order to ensure that the results of the tested
relationships are fully comparable and not affected by differences in measurement.
However, it has been stated that full measurement invariance is considered only a
―reasonable ideal… a condition to be striven for, not one to be fully realized‖ (Horn,
1991, p. 125). Byrne et al. (1989) stated that partial metric invariance is reasonably
supported if at least one of the indicators for each construct is invariant. Hence,

127
following this criterion and consistent with previous studies (e.g. Cleveland et al.,
2011b), the results obtained indicate that partial metric invariance is established.
Table 6.8 Metric Invariance Full Sample US vs. India
Factor loading Indicator
Invariant
Construct
Invariant
Indicator US India t-
statistic
p-value
(2tailed)
ASC1 0.97 0.95 4.682 0.000 No
Partial ASC2 0.96 0.95 1.120 0.263 Yes
ISC1 0.98 0.97 1.747 0.081 Yes
Full ISC2 0.98 0.97 1.812 0.070 Yes
SSC1 0.99 0.98 3.405 0.001 No
Partial SSC2 0.98 0.97 1.868 0.062 Yes
ISSC1 0.98 0.97 1.589 0.112 Yes
Full ISSC2 0.99 0.97 5.394 0.000 No
BA1 0.93 0.92 0.846 0.398 Yes
Partial BA2 0.96 0.94 2.346 0.019 No
BA3 0.95 0.94 1.464 0.144 Yes
BA4 0.94 0.91 3.289 0.001 No
PI1 0.94 0.94 0.000 1.000 Yes
Partial PI2 0.96 0.95 1.886 0.060 Yes
PI3 0.90 0.95 3.989 0.000 No
9/15
invariant
Partial
metric
invariance Acronyms: ASC = Actual self-congruity; ISC = Ideal self-congruity; SSC = Social self-congruity;
ISSC = Ideal social self-congruity; BA = Brand attitude; PI = Purchase intent
6.4.4 Common Method Variance
Following previous research (Sheng et al., 2011), to test for the potential existence of
common method bias, the correlational marker variable technique proposed by Lindell
and Whitney (2001) was used. The correlational marker variable technique relies on the
inclusion of a marker variable, which is theoretically unrelated to the
variables/constructs in the model. A respondent‘s money worries (Cernkovich et al.,
2008) was selected as the marker variable since it is conceptually unrelated to both the
independent and dependent variables (Cronbach‘s alpha: US = 0.81; India = 0.82). It is
the shared variance between the marker and the other variables/constructs in the model
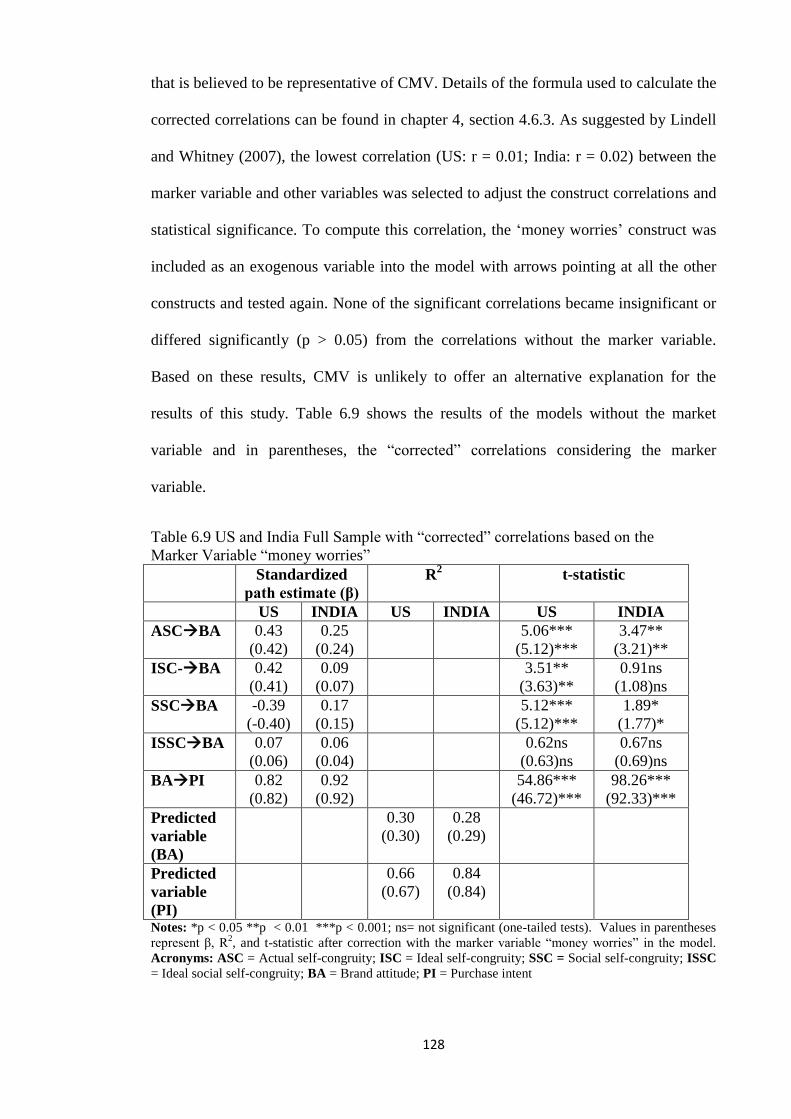
128
that is believed to be representative of CMV. Details of the formula used to calculate the
corrected correlations can be found in chapter 4, section 4.6.3. As suggested by Lindell
and Whitney (2007), the lowest correlation (US: r = 0.01; India: r = 0.02) between the
marker variable and other variables was selected to adjust the construct correlations and
statistical significance. To compute this correlation, the ‗money worries‘ construct was
included as an exogenous variable into the model with arrows pointing at all the other
constructs and tested again. None of the significant correlations became insignificant or
differed significantly (p > 0.05) from the correlations without the marker variable.
Based on these results, CMV is unlikely to offer an alternative explanation for the
results of this study. Table 6.9 shows the results of the models without the market
variable and in parentheses, the ―corrected‖ correlations considering the marker
variable.
Table 6.9 US and India Full Sample with ―corrected‖ correlations based on the
Marker Variable ―money worries‖
Standardized
path estimate (β)
R2
t-statistic
US INDIA US INDIA US INDIA
ASCBA 0.43
(0.42)
0.25
(0.24) 5.06***
(5.12)***
3.47**
(3.21)**
ISC-BA 0.42
(0.41)
0.09
(0.07) 3.51**
(3.63)**
0.91ns
(1.08)ns
SSCBA -0.39
(-0.40)
0.17
(0.15) 5.12***
(5.12)***
1.89*
(1.77)*
ISSCBA 0.07
(0.06)
0.06
(0.04) 0.62ns
(0.63)ns
0.67ns
(0.69)ns
BAPI 0.82
(0.82)
0.92
(0.92) 54.86***
(46.72)***
98.26***
(92.33)***
Predicted
variable
(BA)
0.30
(0.30)
0.28
(0.29)
Predicted
variable
(PI)
0.66
(0.67)
0.84
(0.84)
Notes: *p < 0.05 **p < 0.01 ***p < 0.001; ns= not significant (one-tailed tests). Values in parentheses
represent β, R2, and t-statistic after correction with the marker variable ―money worries‖ in the model.
Acronyms: ASC = Actual self-congruity; ISC = Ideal self-congruity; SSC = Social self-congruity; ISSC
= Ideal social self-congruity; BA = Brand attitude; PI = Purchase intent

129
6.5 Conclusion
The results presented in this chapter indicate that all the measurement models in both
countries (full sample and sub-samples) demonstrate satisfactory reliability and
convergent and discriminant validity. In addition, it has been shown that neither non-
response bias nor common method variance is affecting the results of the study.
Moreover, partial metric invariance has been established between the measurement
models of both countries. Thus, it enables the comparison of the results presented in the
following chapter. Specifically, the following chapter offers the results of the structural
models and hypotheses.

130
Chapter 7 – Results Structural Models and Hypotheses
7.1 Introduction
This chapter presents the results of the structural models and hypotheses. All the
structural models display good predictive power on brand attitude. Six out of thirteen
hypotheses are supported in both countries (US and India). Three show partial support
(US or India) and four are not supported in either country. The results of the hypotheses
show that an individual‘s dominant INTSC, INDSC, cosmopolitan and local orientation
have an impact on which of the four self-congruity types has the strongest effect on
brand attitude. Moreover, the results confirm a positive effect of brand attitude on
purchase intent. The chapter is structured as follows: Section 7.2 offers the results of the
structural model for the full sample models and the four subsample models (e.g. US
INDSC sub-sample, India COS sub-sample) in each country (US and India). Section 7.3
shows the results of the hypotheses. Section 7.4 presents an overview of all the
hypotheses and corresponding results. This is followed by post-hoc tests of the
demographic control variables (section 7.5), leading to the conclusion section of the
chapter (section 7.6).
7.2 Results of the Structural Models
The following section discusses the results of the structural models for the full US and
Indian sample as well as the corresponding four subsamples in each country based on
the individual-level characteristics tested in this thesis. The structural model in PLS-

131
SEM is evaluated based on criteria that are determined by the model‘s predictive
capabilities of the exogenous constructs (i.e. four self-congruity types) on the
endogenous construct (i.e. brand attitude), rather than using measures of goodness of fit
as in CB-SEM (Hair et al., 2014). Hair et al. (2014; 2012) suggest first evaluating the
collinearity between the predictor constructs in the structural model. Subsequently, Hair
et al. (2014) recommend that, in order to evaluate the structural model fully, five criteria
need to be considered (see chapter 4, section 4.6.3 for detailed descriptions). R2 and Q
2
values within the expected boundaries are indicative that the model as a whole (i.e. all
four self-congruity types) has good predictive capabilities of brand attitude. Moreover,
f2 and q
2 values within the expected boundaries are indicative that each individual
exogenous construct (i.e. each of the four self-congruity types) has a substantive
predictive impact on brand attitude. The significance and relevance of the path
coefficients shows the strength of the relationship between each of the four self-
congruity types and brand attitude. The following section discusses the results of each
criterion in detail9. Figure 7.1 shows the steps taken and acceptable thresholds for each
of these measures.
9 The path coefficient results and corresponding significance levels are presented in the hypothesis testing
section (Table 7.3 and 7.4) rather than in the structural models results section. This is due to the fact that
the strength of the path coefficients was used to test the hypotheses that determine which type of self-
congruity has a stronger effect on brand attitude.

132
Figure 7.1 Structural Models and Hypotheses Analysis Sequence
Source: Cohen, 1988; Falk and Miller, 1992; Hair et al. 2014
7.2.1 United States Full Sample and Four Subsamples
The results of the collinearity test on the US models show that collinearity between the
predictor constructs is unlikely to be an issue of concern in this study. The tolerance
levels for all four predictor constructs are above the suggested threshold of 0.20, and the
VIF values are below 5.00 (highest ISC 4.88). Details can be found in Table 7.1.
Table 7.1 Collinearity Assessment US samples
Constructs Tolerance VIF Actual self-congruity 0.23 4.28 Ideal self-congruity 0.21 4.88 Social self-congruity 0.24 4.13 Ideal social self-congruity 0.22 4.65
As shown in Table 7.3, the R2 values of brand attitude for all the models (US full
sample and the four sub-samples) suggest that the models explain approximately

133
between 23% (US LOC) and 34% (US INDSC) of the variance in this variable.
According to Cohen (1988), these values are considered medium (23%) and large
(34%). Moreover, brand attitude explains approximately between 62% (US LOC) and
67% (US INTSC) of the variance in purchase intent, which is considered a large effect
(Cohen, 1988). Overall, these values suggest that the US full sample model and four
subsample models exhibit good explanatory power of brand attitude and purchase intent
(Cohen, 1988; Falk and Miller, 1992).
Furthermore, Table 7.3 shows the Q2 values. The results show that the values for all the
models are above the threshold of zero, indicating that the models have satisfactory
predictive relevance on brand attitude (Hair et al., 2014). Specifically, Q2 values of the
four self-congruity types on brand attitude are between 0.21 (US LOC) and 0.30 (US
INDSC). The Q2 values of brand attitude on purchase intent are between 0.54 (US
LOC) and 0.58 (US INTSC). Therefore, the predictive relevance of the US full sample
model and four subsample models is considered medium to large for brand attitude and
large for purchase intent (Hair et al., 2014).
In addition, the effect size of each predictor/exogenous construct (ASC, ISC, SSC, and
ISSC) on the R2 and Q
2 of the endogenous construct brand attitude was calculated.
Table 7.4 shows the respective f2 and q
2 effect sizes. The majority of the predictor
constructs demonstrate small effect sizes by themselves on brand attitude (f2 = 0.02 to
0.07; q2 = 0.02 to 0.06). It should be highlighted that ISSC in particular had no
noticeable effects on brand attitude in the US full sample model and any of the four
subsample models. These findings on the effect sizes are in line with the path
coefficient effects of ISSC on brand attitude (Table 7.7), which in most models were
also not significant.

134
7.2.2 India Full Sample and Four Subsamples
The results of the collinearity test on the Indian models show that collinearity between
the predictor constructs is unlikely to be an issue of concern in this study. As suggested
by Hair et al. (2014), the tolerance levels for all four predictor constructs are above the
threshold of 0.20 and the VIF values are below 5.00 (highest ISC 4.04). Details can be
found in Table 7.2.
Table 7.2 Collinearity Assessment Indian samples
Constructs Tolerance VIF Actual self-congruity 0.29 3.42 Ideal self-congruity 0.25 4.04 Social self-congruity 0.25 3.95 Ideal social self-congruity 0.27 3.67
Table 7.3 presents the R2 values of brand attitude for all the models (Indian full sample
and the four sub-samples) tested. The results suggest that the models explain
approximately between 28% (India full sample) and 31% (India LOC) of the variance in
this variable. These values are considered large (Cohen, 1988). Moreover, brand attitude
explains approximately between 79% (India INTSC) and 85% (India INDSC) of the
variance in purchase intent, which are categorized as large (Cohen, 1988). In summary,
these values indicate that the Indian full sample model and four sub-sample models
exhibit good explanatory power of brand attitude and purchase intent (Cohen, 1988;
Falk and Miller, 1992).
Table 7.3 shows that the Q2 values for all the models are above the threshold of zero,
indicating that the models demonstrate satisfactory predictive relevance on brand
attitude (Hair et al., 2014). In particular, Q2 values of the four self-congruity types on
brand attitude are between 0.21 (India INTSC) and 0.26 (India INDSC and LOC). The
Q2 values of brand attitude on purchase intent are between 0.68 (India INTSC) and 0.74
(India INDSC and full sample). Therefore, the predictive relevance of the Indian full

135
sample model and four subsample models is considered medium for brand attitude and
large for purchase intent (Hair et al., 2014).
Furthermore, the effect size of each predictor/exogenous construct (ASC, ISC, SSC, and
ISSC) on the R2 and Q
2 of the endogenous construct brand attitude was calculated.
Table 7.4 shows the corresponding f2 and q
2 effect sizes. The majority of the predictor
constructs show small effect sizes by themselves on brand attitude (f2 = 0.02 to 0.04; q
2
= 0.02 to 0.04). It should be highlighted that consistent with the US sample based
models, ISSC in particular had no noticeable effects on brand attitude in any of the
models based on the Indian sample. Likewise, the findings on the effect sizes are in line
with the path coefficient effects of ISSC on brand attitude (Table 7.7), which in most
models were also not significant.
7.2.3 Summary Structural Models US and India
The previous section showed that all the structural models in the US and India (full
sample and subsamples) demonstrate good predictive capabilities of brand attitude.
According to the criteria established by Hair et al. (2014), all the R2 and Q
2 values
across all models are considered medium to large, which is indicative that the structural
models are of good predictive quality. Moreover, the f2 and q
2 values from all the
structural models in both countries show that the majority of predictor constructs have
an individual impact in predicting brand attitude, but that these individual effects are
small. Surprisingly, ISSC did not show any noticeable effects on brand attitude, which
highlights that this construct is not relevant in predicting brand attitude. Table 7.3 and
7.4 below offer an overview of the results obtained for all the structural models. The

136
results of the path coefficients are presented in the following section, as they are used to
test the hypotheses. Figures of the structural models for all the subsample models can be
found in Appendix 7.1.
Table 7.3 R2 and Q
2 Values for all Structural Models
US
R2 /Q
2 4SCT ->BA R
2/Q
2 BA-> PI
US full sample 0.30/0.27 0.66/0.57
US INDSC 0.34/0.30 0.65/0.57
US INTSC 0.33/0.29 0.67/0.58
US COS 0.32/0.29 0.65/0.55
US LOC 0.23/0.21 0.62/0.54
India
R2 /Q
2 4SCT ->BA R
2/Q
2 BA->PI
India full sample 0.28/0.24 0.84/0.74
India INDSC 0.30/0.26 0.85/0.74
India INTSC 0.29/0.21 0.79/0.68
India COS 0.29/0.24 0.83/0.72
India LOC 0.31/0.26 0.83/0.72 Acronyms: INDSC = Independent self-construal; INTSC = Interdependent self-construal;
COS = Cosmopolitan orientation; LOC = Local orientation: BA = Brand attitude; PI = Purchase intent
4SCT = four self-congruity types
Table 7.4 Values for f2
and q2 Effect Size for all Structural Models
f2
BA q2
BA f2
BA q2
BA
US full
sample
India full
sample
ASCBA 0.0276 0.0247 ASCBA 0.0282 0.0271
ISCBA 0.0267 0.0251 ISCBA 0.0014 0.0013
SSCBA 0.0251 0.0233 SSCBA 0.0242 0.0239
ISSCBA 0.0070 0.0000 ISSCBA 0.0014 0.0013
US Sub-Sample Models
f2 BA q
2 BA f
2 BA q
2 BA
US INDSC US COS
ASCBA 0.0258 0.0257 ASCBA 0.147 0.0168
ISCBA 0.0713 0.0600 ISCBA 0.0306 0.0382
SSCBA 0.0288 0.0257 SSCBA 0.0266 0.0296
ISSCBA 0.0061 0.0043 ISSCBA 0.0015 0.0014
US INTSC US LOC
ASCBA 0.0370 0.0388 ASCBA 0.0390 0.0390
ISCBA 0.0089 0.0070 ISCBA 0.0143 0.0126
SSCBA 0.0296 0.0254 SSCBA 0.0429 0.0377
ISSCBA 0.0015 0.0014 ISSCBA 0.0013 0.0130

137
India Sub-Sample Models
f2 BA q
2 BA f
2 BA q
2 BA
INDIA
INDSC
India COS
ASCBA 0.0286 0.0275 ASCBA 0.0098 0.0211
ISCBA 0.0215 0.0231 ISCBA 0.0366 0.0311
SSCBA 0.0000 0.0000 SSCBA 0.0112 0.0092
ISSCBA 0.0000 0.0000 ISSCBA 0.0056 0.0040
India
INTSC
India LOC
ASCBA 0.0435 0.380 ASCBA 0.0302 0.0268
ISCBA 0.0013 0.0115 ISCBA 0.0000 0.0013
SSCBA 0.0284 0.0225 SSCBA 0.0158 0.0154
ISSCBA 0.0022 0.0064 ISSCBA 0.0014 0.0013 Acronyms: INDSC = Independent self-construal; INTSC = Interdependent self-construal;
COS = Cosmopolitan orientation; LOC = Local orientation: BA = Brand attitude
7.3 Hypotheses Testing
To test the individual hypotheses, four models based on four subsamples were used in
each country. For example, H1 focuses on individuals with a dominant INTSC. Hence,
this hypothesis was tested using the INTSC subsample. Considering that the hypotheses
of this thesis do not focus on a specific brand conspicuousness type, in line with Hong
and Zinkhan (1995) the hypothesis results presented (i.e. supported, partially supported,
and not supported) are based on the overall results of both brand conspicuousness types
and in both countries (US and India). Table 7.8 offers details on the overall results for
the brands tested. Hypotheses 1 to 6 focus on the dominant self-construal
(INDSC/INTSC), hypotheses 7 to 12 on the dominant cosmopolitan/local orientation
and hypothesis 13 on the relationship between brand attitude and purchase intent. A
detailed overview of the path coefficients and significance levels can be found in Table
7.7
138
7.3.1 Results Self-Construals
This section presents the results of hypotheses 1 to 6. Moreover, it offers a short
discussion of how brands conspicuousness impacts the hypotheses.
A. Hypotheses 1 to 6
H1 - Supported
Hypothesis 1 posits that, for an individual with a dominant INTSC, actual self-congruity
has a stronger effect on brand attitude than ideal self-congruity. The results among US
respondents (ASC: β 0.51, p < 0.001 vs. ISC: β 0.33, p < 0.001) and Indian respondents
(ASC: β 0.40, p < 0.01 vs. ISC: β -0.07, p > 0.05) lend support to H1. A t-test10
shows
that the differences in path coefficients between actual and ideal self-congruity are
statistically significant in both countries (US: t= 2.09, p < 0.05; India: t=3.61, p <
0.001).
H2 – Partially Supported
H2 expects that for individuals with a dominant INDSC, ideal self-congruity will have a
stronger effect on brand attitude than actual self-congruity. Among US respondents, H2
was supported (ISC: β 0.74, p < 0.001 vs. ASC: β 0.37, p < 0.01). This difference is
statistically significant (US: t= 2.84, p < 0.01). However, while for Indian respondents
ideal self-congruity also had a stronger effect than actual self-congruity on brand
attitude (ISC: β 0.25, p < 0.05 vs. ASC: β 0.24, p < 0.01), the difference was rather
small and not statistically significant (India: t= 0.09, p > 0.05). Therefore, H2 is
partially supported.
10
The same test was also applied to the other models evaluated below in order to establish whether the
difference is statistically significant.
139
H3 – Supported
H3 postulates that for individuals with a dominant INTSC, social self-congruity has a
stronger effect on brand attitude than ideal social self-congruity. Support for H3 was
found in the US and Indian sample (US SSC: β -0.43, p < 0.001 vs. ISSC: β -0.14, p >
0.05; India SSC: β 0.22, p < 0.05 vs. ISSC: β 0.00, p > 0.05). Interestingly, however, the
effect of social self-congruity on brand attitude was negative for US individuals. This
indicates that for US individuals with a dominant INTSC, as social self-congruity
increases it has a negative effect on brand attitude. A t-test shows that the differences in
path coefficients between social and ideal social self-congruity are statistically
significant in both countries (US: t= 4.37, p < 0.001; India: t= 2.82, p < 0.01).
H4 – Not Supported
H4 expects that for individuals with a dominant INDSC, ideal social self-congruity will
have a stronger effect on brand attitude than social self-congruity. However, H4 was not
supported in either the US or India. Contrary to expectations, the effect of ideal social
self-congruity on brand attitude was not significant (US-SSC: β -0.38, p < 0.01 vs. US-
ISSC: β -0.20, p > 0.05; India-SSC: β 0.05, p > 0.05 vs. India-ISSC: β 0.03, p > 0.05).
H5 – Partially Supported
H5 expects that for individuals with a dominant INDSC, of the four self-congruity
types, ideal self-congruity will have the strongest effect on brand attitude. The results
from the US support H5 (ISC: β 0.74, p < 0.001 vs. SSC: β -0.38, p < 0.01). The
difference in strength of the path coefficient of ideal self-congruity to the second
strongest (social self-congruity) was significant (t= 7.20, p < 0.001). In India the result
was in line with the hypothesized relationship. However, it should be noted that the
difference in the path coefficient values between the strongest (ISC: β 0.25) and the

140
second strongest type of self-congruity (ASC: β 0.24) was not significant (t= 0.09, p >
0.05). Thus, H5 is partially supported.
H6 – Not Supported
H6 suggests that for individuals with a dominant INTSC, of the four self-congruity
types, social self-congruity has the strongest effect on brand attitude. However, contrary
to expectations, actual self-congruity had the strongest overall effect on brand attitude in
both countries (ASC-US: β 0.51, p < 0.001 and ASC-India: β 0.40, p < 0.01). The
difference in the path coefficient values between the strongest (ASC) and the second
strongest type of self-congruity (SSC) was significant (US: t= 6.1; p < 0.001; India: t=
2.3; p < 0.05). Therefore, the data do not lend support to H6.
B. The Moderating Impact of Brand Conspicuousness on the Effect of
the Four Self-Congruity Types on Brand Attitude
This thesis used brands from both conspicuousness types (public vs. private) in its
research design. Therefore, it explored whether brand conspicuousness accounts for
differences in the results of hypotheses that were partially supported (H2, H5) or not
supported (H4, H6). To test the effect of public versus private brands, the structural
models were tested again using the data from the public and private brands respectively.
This had no effect on the sample sizes of each sub-sample, as data on both brand
conspicuousness types were collected from all respondents.
A post-hoc test11
controlling for brand conspicuousness type shows that there are indeed
differences between publicly and privately consumed brands in the partially supported
11
It should be noted that in order to decide whether a hypothesis is supported the same approach used
above to test all brand types was used. This means that even if the relationship tested was in the
hypothesized direction, it is only considered ―supported‖ if the difference of the path coefficients between
the self-congruity effects on brand attitude are statistically significant.

141
and not-supported hypotheses. Only H6 remained not supported with all brand
conspicuousness types. Table 7.5 offers an overview of the partially supported and not
supported hypotheses pertaining to self-construals with regards to their overall outcome
(all brands) and by brand conspicuousness type (public vs. private). The results by
brand conspicuousness type call for future research to investigate in more detail the
impact of brand conspicuousness on the four self-congruity types and consumer
attitudes considering self-construals. Appendix 7.2 offers details by brand
conspicuousness type on the path coefficients and significance levels for each tested
relationship.
Table 7.5 Self-Construals Results Overall and by Brand Conspicuousness Type
Hypothesized
relationships
Results
US India
All
brands
Public Private All
brands
Public Private
H2: For an individual
with a dominant INDSC,
ideal self-congruity has a
stronger effect on BA than
actual self-congruity.
Supported Supported Not
supported
Not
supported
Supported Not
supported
H4: For an individual
with a dominant INDSC
ideal social self-congruity
has a stronger effect on
BA than social self-
congruity.
Not
supported
Not
supported
Not
supported
Not
supported
Not
supported
Supported
H5: Overall, among the
four self-congruity types,
for an individual with a
dominant INDSC, ideal
self-congruity has the
strongest effect on BA.
Supported Supported Not
supported
Not
supported
Supported Not
supported
H6: Overall, among the
four self-congruity types,
for an individual with a
dominant INTSC, social
self-congruity has the
strongest effect on BA.
Not
supported
Not
supported
Not
supported
Not
supported
Not
supported
Not
supported

142
7.3.2 Results Cosmopolitan and Local Orientation
This section presents the results of hypotheses 7 to 12. Moreover, it offers a short
discussion of how brands consciousness impacts the hypotheses.
A. Hypotheses 7 to 12
H7 – Supported
H7 posits that, for an individual with a dominant cosmopolitan orientation, ideal self-
congruity has a stronger effect on brand attitude than actual self-congruity. Support for
H7 was found among US respondents (ISC: β 0.50, p < 0.01 vs. ASC: β 0.33, p < 0.01)
and Indian respondents (ISC: β 0.35, p < 0.05 vs. ASC: β 0.15, p > 0.05). The
differences in path coefficients between ideal and actual self-congruity were statistically
significant in both countries (US: t= 2.28, p < 0.05; India: t= 2.39, p <0.05).
H8 – Partially Supported
H8 expects that for individuals with a dominant local orientation, actual self-congruity
will have a stronger effect on brand attitude than ideal self-congruity. No support for H8
was found among US respondents. While actual self-congruity had a stronger effect on
brand attitude than ideal self-congruity (ASC: β 0.46, p < 0.001 vs. ISC: β 0.36, p <
0.05), the difference was statistically not significant (US: t= 1.28, p > 0.05). Support
was found among the Indian respondents (ASC: β 0.32, p < 0.01 vs. ISC: β -0.00, p >
0.05) and the difference was statistically significant (India: t= 3.88, p < 0.001).
Therefore, the data lend partial support to H8.

143
H9 – Not Supported
H9 postulates that for individuals with a dominant cosmopolitan orientation, ideal social
self-congruity has a stronger effect on brand attitude than social self-congruity. H9 was
not supported in either country as the path coefficient between ideal social self-
congruity and brand attitude was not significant (ISSC-US: β 0.08, p > 0.05 and ISSC-
India: β -0.15, p > 0.05).
H10 – Supported
H10 expects that for individuals with a dominant local orientation, social self-congruity
will have a stronger effect on brand attitude than ideal social self-congruity. H10 was
supported among Indian (SSC: β 0.19, p < 0.05 vs. ISSC: β 0.07, p > 0.05) and US
respondents (SSC: β -0.43, p < 0.001 vs. ISSC: β 0.07, p > 0.05). The SSC effect on
brand attitude was significant, while the ISSC effect on brand attitude was not
significant. Surprisingly, however, the effect of social self-congruity on brand attitude
was negative among US respondents. This indicates that for individuals with a dominant
local orientation, as social self-congruity increases it has a negative effect on brand
attitude.
H11 – Supported
H11 suggests that, for individuals with a dominant cosmopolitan orientation, of the four
self-congruity types, ideal self-congruity has the strongest effect on brand attitude. H11
was supported in both countries (ISC-US: β 0.50, p < 0.01; ISC-India: β 0.35, p < 0.05).
The differences in path coefficients to the next strongest type of self-congruity (SSC)
were significant in both countries (US: t= 6.13, p < 0.001; India: t= 2.01, p < 0.05).

144
H12 – Not Supported
H12 postulates that, for individuals with a dominant local orientation, of the four self-
congruity types, social self-congruity has the strongest effect on brand attitude. H12 is
not supported in either country, as actual self-congruity had the strongest effect on
brand attitude (ASC-US: β 0.46, p < 0.001 and ASC-India: β 0.32, p < 0.01). The
difference to the next strongest type of self-congruity (SSC) was statistically significant
(US: t= 6.62 p < 0.001; India: t= 2.03, p < 0.05).
B. The Moderating Impact of Brand Conspicuousness on the Effect of
the Four Self-Congruity Types on Brand Attitude
This thesis used brands from both conspicuousness types (public vs. private) in its
research design. Therefore, it explored whether brand conspicuousness accounts for
differences in the results of hypotheses that were partially supported (H8) or not
supported (H9, H12). To test the effect of public versus private brands, the structural
model was tested again using the data from the public and private brands respectively.
This had no effect on the sample sizes of each sub-sample, as data of both brand
conspicuousness types were collected from all respondents.
A post-hoc test controlling for brand conspicuousness type shows that there are indeed
differences between publicly and privately consumed brands in the partially supported
and not-supported hypotheses. Only H12 remained not supported with both brand
conspicuousness types. Table 7.6 offers an overview of the partially and non-supported
hypotheses pertaining to individuals with COS and LOC orientations with regards to
their overall outcome (all brands) and by brand conspicuousness type (public vs.
private). The results by brand conspicuousness type call for future research to
investigate in more detail the impact of brand conspicuousness on the four self-

145
congruity types and consumer attitudes considering a cosmopolitan and local
orientation. Appendix 7.2 gives details by brand conspicuousness type on the path
coefficients and significance levels for each tested relationship.
Table 7.6 COS/LOC Results Overall and by Brand Conspicuousness Type
Hypothesized
relationships
Results
US India
All
brands
Public Private All
brands
Public Private
H8: For an individual
with a dominant LOC
orientation actual self-
congruity has a stronger
effect on BA than ideal
self-congruity.
Not
supported
Not
supported
Supported Supported Supported Supported
H9: For an individual
with a dominant COS
orientation ideal social
self-congruity has a
stronger effect on BA than
social self-congruity.
Not
supported
Not
supported
Supported Not
supported
Not
supported
Not
supported
H12: Overall, among the
four self-congruity types,
for an individual with a
dominant LOC
orientation, social self-
congruity has the
strongest effect on BA.
Not
supported
Not
supported
Not
supported
Not
supported
Not
supported
Not
supported
7.3.3 Brand Attitude and Purchase Intent (H13)
H13 – Supported
Hypothesis 13 postulates that there is a positive relationship between brand attitude and
purchase intent. Support for H13 was found in all the sub-models tested, irrespective of
an individual‘s dominant self-construals (INDSC/INTSC), cosmopolitan and local
orientation. Furthermore, support was found for both countries (US and India) and
brand consumption types (public vs. private consumption). Therefore, it can be
concluded that in the context of this study there is a significant positive effect of brand
attitude on purchase intent.

146
Table 7.7 Path Coefficient Results for Both Brand Types
US
ASC
BA
t-stat ISC
BA
t-stat SSC
BA
t-stat ISSC
BA
t-stat BA
PI t-stat
US full
sample 0.43 5.27*** 0.42 3.57** -0.39 5.39*** 0.07 0.63ns 0.82 49.18
***
US
INDSC 0.37 2.89** 0.74 4.40*** -0.38 2.94** -0.20 1.21ns 0.81 27.47
***
US
INTSC 0.51 4.39*** 0.33 1.89* -0.43 4.34*** -0.14 0.86ns 0.82 47.87
***
US COS 0.33 2.45** 0.50 2.78** -0.37 3.16** 0.08 0.46ns 0.81 37.05***
US LOC 0.46 3.73*** 0.36 1.98* -0.43 4.41*** 0.07 0.44ns 0.79 26.34***
India
ASC
BA
t-stat ISC
BA
t-stat SSC
BA
t-stat ISSC
BA
t-stat BA
PI t-stat
India full
sample 0.25 3.43** 0.09 0.95ns 0.17 1.86* 0.06 0.64ns 0.92 95.15
***
India
INDSC 0.24 2.85** 0.25 2.23* 0.05 0.35ns 0.03 0.24ns 0.92 93.85
***
India
INTSC 0.40 2.84** -0.07 0.39ns 0.22 1.80* 0.00 0.01ns 0.89 35.64
***
India
COS 0.15 1.20ns 0.35 2.07* 0.20 1.58ns -0.15 1.03ns 0.91 70.52
***
India
LOC 0.32 3.36** -0.00 0.02ns 0.19 1.74* 0.07 0.59ns 0.91 68.67
***
Notes: *p < 0.05 **p < 0.01 ***p < 0.001; ns= not significant (two-tailed tests). Acronyms: ASC = Actual self-congruity; ISC = Ideal self-congruity; SSC = Social self-congruity;
ISSC = Ideal social self-congruity; BA = Brand attitude; PI = Purchase intent: INTSC = Interdependent
self-construal; INDSC = Independent self-construal; COS = Cosmopolitan orientation; LOC= Local
orientation
7.4 Overview of Hypotheses Results
Table 7.8 provides an overview of all the hypotheses results. Six hypotheses received
support in both countries; hence, they are fully supported. Three of the hypotheses were
partially supported as they received support in only one of the countries. Specifically,
H2 and H5 were only supported in the US, while H8 was only supported in India.
Finally, four hypotheses were not supported. The implications of these results are
discussed in chapter eight.

147
Table 7.8 Summary of the Hypotheses
Hypothesized relationships Results
US India Overall
Self-Construals H1: For an individual with a dominant INTSC, actual self-
congruity has a stronger effect on BA than ideal self-
congruity.
Supported Supported
Supported
H2: For an individual with a dominant INDSC, ideal self-
congruity has a stronger effect on BA than actual self-
congruity.
Supported Not
Supported Partially
Supported
H3: For an individual with a dominant INTSC, social self-
congruity has a stronger effect on BA than ideal social self-
congruity.
Supported Supported Supported
H4: For an individual with a dominant INDSC, ideal social
self-congruity has a stronger effect on BA than social self-
congruity.
Not
Supported
Not
Supported Not
Supported
H5: Overall, among the four self-congruity types, for an
individual with a dominant INDSC, ideal self-congruity has
the strongest effect on brand attitude.
Supported Not
Supported Partially
Supported
H6: Overall, among the four self-congruity types, for an
individual with a dominant INTSC, social self-congruity has
the strongest effect on BA.
Not
Supported
Not
Supported Not
Supported
Cosmopolitan and Local Orientation H7: For an individual with a dominant COS orientation,
ideal self-congruity has a stronger effect on BA than actual
self-congruity.
Supported Supported Supported
H8: For an individual with a dominant LOC orientation,
actual self-congruity has a stronger effect on BA than ideal
self-congruity.
Not
Supported
Supported Partially
Supported
H9: For an individual with a dominant COS orientation,
ideal social self-congruity has a stronger effect on BA than
social self-congruity.
Not
Supported
Not
Supported Not
Supported
H10: For an individual with a dominant LOC orientation,
social self-congruity has a stronger effect on BA than ideal
social self-congruity.
Supported Supported Supported
H11: Overall, among the four self-congruity types, for an
individual with a dominant COS orientation, ideal self-
congruity has the strongest effect on BA.
Supported Supported Supported
H12: Overall, among the four self-congruity types, for an
individual with a dominant LOC orientation, social self-
congruity has the strongest effect on BA.
Not
Supported
Not
Supported Not
Supported
Brand Attitude and Purchase Intent H13: There is a positive relationship between brand attitudes
and purchase intent.
Supported Supported Supported
7.5 Post-Hoc Tests on Demographic Control Variables
To understand whether demographic variables influence the constructs in the various
models presented in the previous sections, Multivariate Analysis of Variance
(MANOVA) tests were conducted.

148
According to Hair et al. (1998), MANOVA is an extension of Analysis of Variance
(ANOVA) that accommodates more than one dependent variable. MANOVA is used to
measure the differences for two or more metric dependent variables based on
categorical (nonmetric) variables, which are the independent variables. The advantage
of using MANOVA over multiple single ANOVA tests, is that it accounts for
correlations between the dependent variables, hence, offering more precise results
(Field, 2009). In this study, the effect of the independent variables (gender, education,
and income as categorical variables) on the constructs in the model (ASC, ISC, SSC,
ISSC, BA, and PI), which are the dependent variables, were tested. For this purpose,
MANOVA tests were run for each independent variable on all the dependent variables.
These tests were performed on the models in both countries (US and India).
Subsequently, if the MANOVA tests showed that any of the demographic variables had
a significant effect (Wilks‘ test) on the constructs in the model, general linear ANOVA
tests were used to analyse the specific constructs influenced by the demographic
variable. Age was measured as a continuous (metric) variable in the survey. Thus, rather
than MANOVA and ANOVA, linear regressions were used, with age as the
independent variable and the constructs in the model as the dependent variables (ASC,
ISC, SSC, ISSC, BA, and PI).
The aforementioned tests were performed on all variables and for all the models, but
only the variables that showed a significant effect in a specific model are presented in
the Tables below. The variables that did not present any significant effects were omitted
from further discussion. The tests show that only gender and age have a significant
effect (p < 0.05) on any of the constructs in the various models (details in Tables 7.9
and 7.10). However, it should be highlighted that the contributions of the adjusted
coefficient of determination (R²) were all below 3.5% for the demographic variables

149
that were found to have an effect on the constructs in the various models. This value is
below the threshold of 19 %, which would be considered a weak contribution (Henseler
et al., 2009). Hence, in the context of this study it is concluded that the effect of the
tested demographic is not strong enough to noticeably affect how the four self-congruity
types impact brand attitude.
Table 7.9 Results - ANOVA for Demographic Variables
Source Sum of
Squares
df Mean
Squares
F R2 Sig. (p)
US full sample Gender-ASC 11.575 3 3.858 2.646 0.01 0.048
Error 1201.387 824 1.458
Gender-SSC 17.340 3 5.780 3.729 0.013 0.011
Error 1277.37 824 1.550 Acronyms: ASC = Actual self-congruity; ISC = Ideal self-congruity; SSC = Social self-congruity;
ISSC = Ideal social self-congruity; BA = Brand attitude
Table 7.10 Results - Linear Regression Analysis for Demographic Variables
US full sample Sum of
Squares
df Mean
Squares
F R2 Sig. (p)
Age-ASC 9.715 1 9.715 6.669 0.008 0.010
Error 1203.25 826 1.457
Age-ISC 7.098 1 7.098 4.613 0.006 0.032
Error 1271.12 826 1.539
Age-ISSC 6.823 1 6.823 4.046 0.005 0.045
Error 1392.71 826 1.686
Age-BA 18.128 1 18.128 19.050 0.023 0.000
Error 786.025 826 0.952
US LOC sample Age-BA 6.134 1 6.134 7.596 0.021 0.006
Error 280.23 347 0.808
US INDSC sample Age-BA 10.267 1 10.267 10.360 0.020 0.001
Error 506.418 511 0.991
US INTSC
sample
Sum of
Squares
df Mean
Squares
F R2 Sig. (p)
Age-ASC 6.935 1 6.935 5.789 0.021 0.017
Error 330.62 276 1.198
Age-ISC 12.615 1 12.615 10.039 0.035 0.002
Error 346.826 276 1.257
Age-SSC 7.336 1 7.336 5.612 0.020 0.019
Error 360.74 276 1.307
Age-ISSC 13.238 1 13.238 9.545 0.033 0.002
Error 382.78 276 1.387
Age-BA 7.302 1 7.302 8.828 0.031 0.003
Error 228.29 276 0.827

150
India full sample Age-ISC 5.589 1 5.589 6.230 0.008 0.013
Error 727.63 811 0.897
Age-SSC 6.873 1 6.873 7.335 0.009 0.007
Error 759.96 811 0.937
Age-ISSC 7.018 1 7.018 7.519 0.009 0.006
Error 756.878 811 0.933
India INTSC
sample
Age-ISC 4.275 1 4.275 4.999 0.010 0.026
Error 413.892 484 0.855
Age-SSC 3.948 1 3.948 4.357 0.009 0.037
Error 438.58 484 0.906
Age-ISSC 6.232 1 6.232 6.732 0.014
Error 448.06 484 0.926
India INDSC
sample
Age-SSC 6.255 1 6.255 6.323 0.026 0.013
Error 231.48 234 0.989
Age-BA 5.619 1 5.619 6.431 0.027 0.012
Error 204.46 234 0.874
Age-PI 3.413 1 3.413 3.965 0.017 0.048
Error 201.44 234 0.861
India LOC
sample
Age-ASC 4.421 1 4.421 4.365 0.008 0.037
Error 525.60 519 1.013
Age-ISC 4.626 1 4.626 4.860 0.009 0.028
Error 494.07 519 0.952
Age-SSC 5.223 1 5.223 5.286 0.010 0.022
Error 512.81 519 0.988
Age-SSC 5.407 1 5.407 5.603 0.011 0.018
Error 500.833 519 0.965 4.911 0.009 0.027
Age-BA 3.924 1 3.924
Error 414.71 519 0.799
Age-PI 4.550 1 4.550 5.667 0.011 0.018
Error 416.74 519 0.803 Acronyms: ASC = Actual self-congruity; ISC = Ideal self-congruity; SSC = Social self-congruity;
ISSC = Ideal social self-congruity; BA = Brand attitude

151
7.6 Conclusion
As shown in this chapter, the results of the structural models indicated that the models
have good predictive power. Furthermore, the hypotheses showed that an individual‘s
dominant INTSC, INDSC, cosmopolitan and local orientation impact the effect that the
four self-congruity types have on brand attitude. Support was found in six of the
hypotheses in both countries, strengthening the validity of the results. Three received
partial support and four were not supported. As predicted, brand attitude was also
shown to have a positive effect on purchase intent. Lastly, the demographic variables
tested were shown to have a negligible effect on the relationships tested. The next
chapter provides a detailed discussion of the implications of the obtained results.

152
Chapter 8 - Discussion
8.1 Introduction
This chapter discusses the findings of the thesis on how an individual‘s dominant
INTSC, INDSC (H1 to H6), cosmopolitan and local orientation (H7 to H12) impact the
effect of the four self-congruity types on brand attitude. Furthermore, the thesis
discusses the impact of brand attitude on purchase intent (H13). Specifically, it
addresses the following five research questions (RQ):
RQ1: Within private self-congruity types (actual vs. ideal) and within public
self-congruity types (social vs. ideal social), which one has the strongest impact
on brand attitude considering an individual‘s INTSC and INDSC (H1 to H4)?
RQ2: Which of the four self-congruity types has the strongest overall impact on
brand attitude considering an individual‘s INTSC and INDSC (H5 and H6)?
RQ3: Within private self-congruity types (actual vs. ideal) and within public
self-congruity types (social vs. ideal social), which one has the strongest impact
on brand attitude considering an individual‘s cosmopolitan and local orientation
(H7 to H10)?
RQ4: Which of the four self-congruity types has the strongest overall impact on
brand attitude considering an individual‘s cosmopolitan and local orientation
(H11 and H12)?
RQ5: Is there a positive relationship between brand attitude and purchase intent
(H13)?
The chapter is structured as follows. Sections 8.2 and 8.3 discuss the findings pertaining
to an independent/interdependent self-construal, and cosmopolitan/local orientation,

153
respectively. Section 8.4 offers a summary of the effect of the four self-congruity types
on brand attitude. Section 8.5 discusses the effect of brand attitude on purchase intent,
leading to the conclusion of the chapter (Section 8.6). Table 8.1 below presents an
overview of all the hypotheses and the corresponding results.
Table 8.1 Summary of Hypotheses
Hypothesized relationships Results
US India Overall
Self-Construals H1: For an individual with a dominant INTSC actual
self-congruity has a stronger effect on BA than ideal
self-congruity.
Supported Supported
Supported
H2: For an individual with a dominant INDSC ideal
self-congruity has a stronger effect on BA than actual
self-congruity.
Supported Not
Supported Partially
Supported
H3: For an individual with a dominant INTSC social
self-congruity has a stronger effect on BA than ideal
social self-congruity.
Supported Supported Supported
H4: For an individual with a dominant INDSC ideal
social self-congruity has a stronger effect on BA than
social self-congruity.
Not
Supported
Not
Supported Not
Supported
H5: Overall, among the four self-congruity types, for an
individual with a dominant INDSC ideal self-congruity
has the strongest effect on brand attitude.
Supported Not
Supported Partially
Supported
H6: Overall, among the four self-congruity types, for an
individual with a dominant INTSC, social self-congruity
has the strongest effect on BA.
Not
Supported
Not
Supported Not
Supported
Cosmopolitan and Local Orientation H7: For an individual with a dominant COS orientation
ideal self-congruity has a stronger effect on BA than
actual self-congruity.
Supported Supported Supported
H8: For an individual with a dominant LOC orientation
actual self-congruity has a stronger effect on BA than
ideal self-congruity.
Not
Supported
Supported Partially
Supported
H9: For an individual with a dominant COS orientation
ideal social self-congruity has a stronger effect on BA
than social self-congruity.
Not
Supported
Not
Supported Not
Supported
H10: For an individual with a dominant LOC
orientation social self-congruity has a stronger effect on
BA than ideal social self-congruity.
Supported Supported Supported
H11: Overall, among the four self-congruity types, for
an individual with a dominant COS orientation ideal
self-congruity has the strongest effect on BA.
Supported Supported Supported
H12: Overall, among the four self-congruity types, for
an individual with a dominant LOC orientation social
self-congruity has the strongest effect on BA.
Not
Supported
Not
Supported Not
Supported
Brand Attitude and Purchase Intent H13: There is a positive relationship between brand
attitude and purchase intent.
Supported Supported Supported

154
8.2 Self-Construals (Independent and Interdependent)
The discussion in this section is structured around the hypotheses and focuses on the
impact of an individual‘s dominant INTSC and INDSC on the effect of private self-
congruity types (H1 and H2), public self-congruity types (H3 and H4) and the strongest
overall self-congruity effect on brand attitude (H5 and H6).
8.2.1 Actual versus Ideal Self-Congruity - Private Selves (H1 and H2)
This study supports the expectation that, for individuals with a dominant INTSC actual
self-congruity will have a stronger effect on brand attitude than ideal self-congruity
(H1). The result is consistent across both countries (US and India). Therefore, this is the
first study to empirically confirm that individuals with a dominant INTSC prefer brands
congruent with their actual self-concept and that marketers should use an authentic
branding approach (e.g. using regular-sized models in ads) to target these individuals.
The finding suggests that as individuals with a dominant INTSC have an emphasized
need for self-consistency (Markus and Kitayama, 1991), this heightened self-
consistency need may determine a preference for brands congruent with their actual
self-concept (Sirgy, 1982; Swann, 1983).
The results of the study offer only partial support for the expectation that for individuals
with a dominant INDSC ideal self-congruity will have a stronger effect on brand
attitude than actual self-congruity (H2). Support for this expectation is found only
among US respondents, and not among Indian respondents. The results from the US are
the first to empirically confirm that individuals with a dominant INDSC prefer brands
congruent with their ideal self-concept. This finding is consistent with previous research
on US samples that in contrast to this study, did not consider the impact of self-
construals on how actual and ideal self-congruity affect brand perceptions (Hong and

155
Zinkhan, 1995). Unexpectedly, while the effect of ideal self-congruity and actual self-
congruity on brand attitude is positive and significant among Indian respondents, the
difference is statistically not significant. This finding suggests that knowledge on self-
construals as a predictor of attitude needs to be further refined for individuals from
understudied countries such as India (Cross et al., 2011). For instance, future research
should investigate the underlying motivations that drive individuals with a dominant
INDSC from India. Two potential reasons are proposed to explain this unexpected
finding. First, the differences in the outcomes between the two country samples could
be attributable to higher levels of power-distance (PD) and/or long-term orientation
(LTO) in India compared to the US (Hofstede, 2012). Individuals with high levels of
PD and LTO are driven by a need to maintain conformity and self-consistency rather
than self-enhancement in order to stand out (Jung et al., 2009; Oyserman, 2006;
Bearden et al., 2006; Ryu and Moon, 2009). However, a post-hoc test controlling for the
impact of PD and LTO shows that their effect on the tested relationships is not
significant. H2 is still not supported among Indian respondents, even when controlling
for PD and LTO. Appendix 8.1 provides the details of the analysis. A second potential
explanation is that cultural differences between the US and Indian respondents with
respect to models of agency (Kitayama and Cohen, 2007) may be responsible for the
unexpected results. Models of agency are frameworks of ideas and practices that guide
actions and reflect understandings of how and why people act in certain ways in order to
be considered a ―good person‖ within their social networks (Stephens et al., 2007).
Savani et al. (2008) show that, due to culturally different models of agency, Indian
individuals are less motivated to express their consumption choices compared to US
individuals. This exemplifies a less pronounced need to self-enhance to stand out among
Indians compared to US individuals. Rather, Indians focus on self-consistent behaviour,
as they are influenced by a wider array of actors in their consumption decision-making

156
processes (e.g. social actors that drive them to engage in self-consistent behaviour).
Thus, this offers a potential explanation for why the impact of actual and ideal self-
congruity on brand attitude was similar among Indian respondents with a dominant
INDSC. Future research should empirically test whether differences in models of
agency are indeed responsible for the obtained findings.
8.2.2 Social versus Ideal Social Self-Congruity - Public Selves (H3 and
H4)
The results support the expectation that social self-congruity will have a stronger effect
on brand attitude than ideal social self-congruity for individuals with a dominant INTSC
(H3). The result is consistent across both countries. Therefore, this thesis further
corroborates that individuals with a dominant INTSC use brands congruent with their
social self-concept as a means of maintaining the image others have of them (i.e. Kim
and Hyun, 2013). Specifically, Kim and Hyun (2013) tested respondents from an Asian
country (South Korea), while this thesis also corroborates the findings for respondents
from another cultural context (i.e. US and India). Moreover, they focused only on
publicly consumed goods, while this thesis offers more comprehensive results that
considered both brand conspicuousness types (public and privately consumed goods).
Hence, this thesis offers empirical results that are more generalizable than Kim and
Hyun‘s (2013) study in terms of sampling grounds and type of goods.
Contrary to expectations, the results from both countries do not lend support for the
view that, for individuals with a dominant INDSC, ideal social self-congruity has a
stronger effect on brand attitude than social self-congruity (H4). Previous research in
psychology shows that individuals with a dominant INDSC have a heightened

157
motivation to self-enhance for self-advancement purposes in social settings to foster
their ideal social self-concept (Sedikides and Gregg, 2008; Raskin et al., 1991a).
However, the findings of this study indicate that this does not apply to a brand context.
Individuals with a dominant INDSC do not prefer to use brands congruent with their
ideal social self-concept as a means of self-enhancement in social settings. In this case,
as hypothesized, ideal social self-congruity is likely to have the strongest effect on
brand attitude. In fact, for US respondents the effect of social self-congruity on brand
attitude is significant and stronger – rather than weaker – than the effect of ideal social
self-congruity. Unexpectedly, the effect of social self-congruity on brand attitude was
negative among US respondents. Moreover, among Indian respondents the effect of
ideal social self-congruity on brand attitude was not significant. Specifically, the finding
from the US sample challenges the premise of self-congruity theory, which posits that
as the perceived similarity (congruence) between a user‘s self-concept (any of the four
types) and the brand‘s image increases, the resultant effect on brand attitude will be
positive (Sirgy, 1982). Overall, the findings from both countries indicate that for
individuals with a dominant INDSC, both public self-congruity types (social and ideal
social) have neither a positive nor a significant effect on brand perceptions. Hence, the
findings suggest that there is a need to refine self-congruity theory by considering the
impact of INDSC on the effect of public self-congruity types on brand attitude.
Considering the results of this study, there may be an alternative explanation for the
outcome. The negative effect of social self-congruity on brand attitude among US
respondents may be explained by the notion that individuals experience reactance (i.e.,
opposing feeling) when there is a threat to their freedom of individuality. Specifically,
they experience reactance when they make choices on how to distinguish their self-
concept from others (Johnson and Buboltz, 2000). As individuals with a dominant
INDSC display higher levels of reactance than those with an INTSC (Graupmann et al.,

158
2012; Jonas et al., 2009), it is possible that individuals with an INDSC perceive
compliance with social norms, by choosing a socially congruent brand as a threat to
their individual freedom. This may lead to a negative effect on attitude towards brands
that are congruent with their public selves. Future research should test whether this
assumption is indeed responsible for the obtained results.
8.2.3 Overall Strongest Self-Congruity Effect – All Four Types (H5 and
H6)
The results offer partial support for the expectation that for individuals with a dominant
INDSC, ideal self-congruity will have the strongest overall effect on brand attitude
(H5). Support was found among US respondents but not among Indian respondents.
Specifically, the relationships tested are positive and significant among Indian
respondents, but the difference in strength of the ideal self-congruity and the next
strongest effect (actual self-congruity) on brand attitude is not significant. This suggests
that the need of Indian respondents with a dominant INDSC for self-consistency and
self-enhancement is similar. Therefore, ideal self-congruity and actual self-congruity
have the joint strongest effect on brand attitude. Overall, the findings indicate that US
and Indian respondents with a dominant INDSC place great importance on consuming
brands that match their ideal self-concept. However, the divergent results between the
two country samples indicate that the predictive validity of an INDSC on how the four
self-congruity types impact brand attitude is limited beyond the US. Therefore, this
suggests that knowledge on self-construals as a predictor of attitude needs to be further
refined for individuals from understudied countries such as India (Cross et al., 2011).
Thus, future research should explore the underlying motivations that drive individuals
with a dominant INDSC from India. There are two potential explanations for the

159
divergent results. First, consistent with H2, post-hoc tests controlling for PD and LTO
were conducted, as differences in the outcomes between the two country samples could
be attributable to higher levels of power-distance (PD) and/or long-term orientation
(LTO) in India compared to the US (Hofstede, 2012). However, the results showed that
PD and LTO have no significant impact on how strongly the four self-congruity types
affect brand attitude for Indian respondents. H5 is still not supported among Indian
respondents, even when controlling for PD and LTO. Appendix 8.1 provides details on
this analysis. Second, an alternative explanation for the similarity in how strongly ideal
and actual self-congruity affect brand attitude can be derived from the fact that Indian
and US individuals have different models of agency (Kitayama and Cohen, 2007). Due
to culturally different models of agency (e.g. actions people take to be considered a
―good‖ person within the social network), Indian individuals are less motivated to self-
enhance when consuming a brand to express their self-concept compared to US
individuals (Savani et al., 2008). Indians are rather motivated to adopt self-consistent
behaviours, as they are influenced by a wider array of actors in their consumption
decision-making processes (e.g. social actors that drive them to engage in self-
consistent behaviour). Their focus on self-consistent behaviour may be responsible for
the results of H5, considering that the self-consistency motive is the underlying motive
of actual self-congruity (Sirgy et al., 2000). Future research should empirically test
whether differences in models of agency are responsible for the different outcomes
between the US and Indian samples.
The results do not support the expectation that for individuals with a dominant INTSC,
social self-congruity will have the strongest effect on brand attitude (H6). Rather, actual
self-congruity has the strongest overall effect on brand attitude in both countries. This
expectation was derived from research suggesting that individuals with a dominant

160
INTSC prefer brands matching their social self-concept rather than focusing on their
private selves, specifically their actual self-concept (Kim and Hyun, 2013). In contrast,
this study offers empirical evidence that individuals with a dominant INTSC are more
motivated to use brands congruent with their actual self-concept than with the other
three self-concept types. It should be noted that, in contrast to this study, the study by
Kim and Hyun (2013) only tests respondents from an Asian country (South Korea) and
uses only publicly consumed brands in its research design. Moreover, their endogenous
variable was purchase intent, which should be differentiated from brand attitude as the
self-congruity effect can differ depending on these two constructs (Sirgy, 1982).
Consequently, this thesis is the first to offer empirical evidence of the hypothesized
relationship for individuals with a dominant INTSC from Asian and Western countries
(US and India), while considering both brand consciousness types in the research
design. Thus, this thesis offers empirical results that are more generalizable than
previous work and highlights that differences in the tested effects exist when both brand
conspicuousness types are considered. There may be an alternative explanation for the
outcome in this thesis. It has been suggested that private self-concept types, such as the
actual self-concept, also reflect social standards, because they serve as a ―sociometer‖
that is affected by social inclusion and exclusion (Stinson et al., 2010, p. 993). This also
sheds new light on previous claims that the various self-concept types can impact
decision-making processes independently (Markus and Wurf, 1987). Arguably, it is still
important to investigate the independent effects of each self-congruity type on consumer
attitudes to obtain a more precise picture of which self-concept type should be matched
when promoting brands (Kang et al., 2011). However, the results of this study suggest
that the potential interaction effect of public and private selves affects the self-congruity
effect on brand attitude and therefore warrants consideration. A post-hoc test shows a
significant interaction effect between public and private selves, hence supporting this
161
potential explanation. Appendix 8.2 offers the details of the analysis. Moreover, a recent
meta-analysis of self-congruity studies by Aguirre et al. (2011) offers empirical
evidence that private self-concept types have a stronger effect on consumer responses
towards self-congruent brands compared to public self-concept types. While that meta-
analysis was, with the exception of one study (i.e. Ibrahim and Najjar, 2008),
exclusively based on North American samples, where respondents are likely to have a
dominant INDSC (Aaker and Schmitt, 2001), the results of this thesis are the first to
offer empirical evidence that this holds for individuals with an INTSC. Hence, this
thesis extends self-congruity theory by showing that for individuals with a dominant
INTSC and INDSC, actual and ideal self-congruity have a stronger effect on brand
attitude than public self-congruity types. How widely applicable this notion is to
consumers with different characteristics is yet to be determined, and this is a task for
future studies, but the obtained results are indicative of a trend into the aforementioned
direction.
8.2.4 Summary Self-Construals
This study explains which self-congruity type (within private self-congruity types,
public self-congruity types, and overall of all four self-congruity types) has the strongest
impact on brand attitude when an individual‘s dominant INTSC and INDSC are
considered. The results confirm that an individual‘s dominant INTSC and INDSC have
an impact on which self-congruity type has the strongest effect on brand attitude.
Consequently, this thesis extends self-congruity theory by considering the impact of an
individual‘s INTSC and INDSC on the effect of the four self-congruity types on brand
attitude. The results highlight (a) the need for consumer researchers to test the impact
of additional individual-level characteristics on the four self-congruity types to further

162
extend self-congruity theory and (b) the need for marketers to adjust brand promotion
strategies based on individual-level characteristics (i.e. self-construals), rather than
applying the commonly used aspirational branding strategies (e.g. using slim models).
Aspirational branding seeks to make consumers believe that consuming the promoted
brand will bring them closer to realizing their ideal self-concept. For instance, for an
individual with a dominant INTSC, actual self-congruity has a stronger impact on brand
attitude than ideal self-congruity. Furthermore, the results show that actual self-
congruity has the strongest overall impact on brand attitude for individuals with a
dominant INTSC rather than the expected social self-congruity (Markus and Kitayama,
1991). This result is unexpected and challenges prior research, which shows that
individuals with a dominant INTSC are inclined to purchase brands congruent with their
public selves, specifically the social and ideal social self-concept (i.e. Kim and Hyun,
2013). Considering, the differences in the research design between this thesis and Kim
and Hyun‘s (2013) study (e.g. South Korean sample vs. US and Indian sample; only
publicly consumed brands vs. both brand conspicuousness types), this thesis is the first
to offer empirical evidence that, for individuals with a dominant INTSC, actual self-
congruity leads to the strongest brand attitude. The divergent results between this thesis
and Kim and Hyun‘s (2013) study also highlight that factors such as brand
conspicuousness are influencing the relationships in question.
With regard to consumers with a dominant INDSC, the results were as expected.
Specifically, ideal self-congruity has the strongest impact on brand attitude for
consumers with a dominant INDSC. Overall, the results of the thesis highlight the
importance for marketers to focus on private self-concept types (actual and ideal) to
elicit positive brand perceptions through their brand communications. The results of this

163
study also have implications for the expected effects of self-construals on consumer
attitudes. Self-construals are considered key influencers on an individual‘s decision-
making processes (Markus and Kitayama, 1991). However, the divergent results in H2
and H5 between the US and Indian samples suggest that the predictive validity of an
individual‘s INDSC on how the four self-congruity types impact brand attitude is
limited beyond the US. Therefore, this suggests that knowledge on an INDSC as a
predictor of attitude needs to be further refined for individuals from understudied
countries such as India who have specific cultural and socioeconomic characteristics
(Cross et al., 2011).
8.3 Cosmopolitan and Local Orientation
This section discusses the findings pertaining to the impact of an individual‘s dominant
cosmopolitan and local orientation on the effect of private self-congruity types (H7 and
H8), public self-congruity types (H9 and H10) and the strongest overall self-congruity
effect on brand attitude (H11 and H12).
8.3.1 Actual versus Ideal Self-Congruity - Private selves (H7 and H8)
The findings from both countries support the expectation that, for individuals with a
dominant cosmopolitan orientation, ideal self-congruity will have a stronger effect on
brand attitude than actual self-congruity (H7). Therefore, this study is the first to offer
empirical support for the proposition that individuals with a dominant cosmopolitan
orientation are motivated to engage in symbolic behaviour (e.g. consumption of a
brand) that allows them to boost their self-esteem and enhance their ideal self-concept
(Ralston et al., 1996; Cannon and Yaprak, 2002). Consequently, aspirational branding
approaches that make a consumer believe that consuming the brand allows them to

164
realize their ideal self-concept are likely to lead to strong positive brand attitude for
consumers with a dominant cosmopolitan orientation.
The results offer only partial support for the expectation that for individuals with a
dominant local orientation, actual self-congruity will have a stronger effect on brand
attitude than ideal self-congruity (H8). Specifically, support for this expectation is found
only among Indian respondents and not US respondents. While the effect of actual self-
congruity on brand attitude is stronger than the ideal self-congruity effect for US
respondents, the difference in strength is not statistically significant. This result suggests
that, for US consumers with a dominant local orientation, brands congruent with either
their actual or ideal self-concepts produce similar outcomes in terms of the attitude
towards brands. This finding questions the predictive validity of an individual‘s
dominant local orientation on the effect of actual and ideal self-congruity on brand
attitude among US consumers. The application of a consumer‘s dominant local
orientation as a predictor of consumer attitude and behaviour is still in its infant stage in
the marketing domain (i.e. Riefler et al., 2012). Coupled with the findings of this thesis,
this suggests that knowledge, specifically the underlying motivations of individuals with
a local orientation when consuming brands, need to be examined further by conducting
tests in a wider array of countries and consumptions contexts. A potential explanation
for the divergent results between the two country samples is that the US culture is
characterized by lower PD and LTO levels than the Indian culture (Hofstede, 2012).
Therefore, US consumers are less guided by self-consistency and conformance, which
could impact the tested relationships (Bearden et al., 2006; Jung et al., 2009).
Nevertheless, the results of a post-hoc test controlling for PD and LTO show that these
factors do not have a significant effect on the tested relationships (p > 0.05). H8 is still
not supported among US respondents, even when controlling for PD and LTO.

165
Appendix 8.1 provides details of the analysis. An alternative explanation for the
divergent results between the two country samples may be provided by Higgin‘s (1987)
self-discrepancy theory. Higgins (1987) states that individuals differ with regard to
which self-concept type is likely to have a stronger effect on their attitude and behaviour
(e.g. actual vs. ideal). Translated to self-congruity, this specific self-concept type is
likely to determine which self-congruity type has a stronger impact on brand attitude.
However, self-discrepancy theory posits that individuals are motivated to reduce the gap
(discrepancy) between the actual and ideal self-concept to remove disparity, which
could lead to emotional conflict. Research shows that individuals from Western cultures
(e.g. US) demonstrate smaller gaps between their actual and ideal self-concept than
individuals from Asian cultures (Heine and Lehman, 1999). Thus, the possibility that
US consumers in this sample may have a small gap (discrepancy) between their actual
and ideal self-concept, offers a potential explanation for why their attitudes towards
brands matching their actual as well as ideal self-concept are similar. Future research
should measure the discrepancy between the two self-concept types to assess whether it
is responsible for the obtained results.
8.3.2 Social versus Ideal Social Self-Congruity - Public Selves (H9 and
H10)
The results from both countries do not support the expectation that, for individuals with
a dominant cosmopolitan orientation, ideal social self-congruity will have a stronger
effect on brand attitude than social self-congruity (H9). The effects of both public self-
congruity types on brand attitude are not significant for Indian respondents. Moreover,
for US respondents with a dominant cosmopolitan orientation, rather than the ideal
social self-congruity effect, only the effect of social self-congruity on brand attitude is

166
significant. Unexpectedly, this effect is negative. This result challenges the premise of
self-congruity theory, which posits that, as the perceived similarity (congruence)
between a user‘s self-concept (any of the four types) and the brand‘s image increases,
the resultant effect on brand attitude will be positive (Sirgy et al., 2000). Previous
research has offered empirical evidence of a positive effect of social self-congruity on
consumer attitudes (He and Mukherjee, 2007; Sirgy and Johar, 1999). The findings of
this thesis question previous research and suggest that there is a need to refine self-
congruity theory by considering the impact of an individual‘s dominant cosmopolitan
orientation on the effect of social self-congruity on brand attitude. Specifically, the
findings suggest that, for individuals with a dominant cosmopolitan orientation, as the
perceived similarity (congruence) between a user‘s social self-concept and the brand‘s
image increases, the resultant effect on brand attitude will be negative. Furthermore, the
empirical results of this study suggest that the proposition that individuals with a
dominant cosmopolitan orientation have a heightened motivation to self-enhance in
social settings to boost their self-esteem and foster their ideal social self-concept
(Hollinger, 1995) does not translate to a brand consumption context. In this case, as
hypothesized, ideal social self-congruity is likely to have the strongest effect on brand
attitude. Social comparison theory (Festinger, 1954) offers a potential explanation for
the surprising results of the negative effect of social self-congruity on brand attitude.
Individuals make comparisons between their social self-concept and ideal social
expectations (e.g. being as slim as the models in advertisements). Hence, when they
compare themselves to what they perceive as a social expectation, which is an out of-
reach or upward social comparison, this can lead to negative feelings such as inferiority
or envy (Gilbert et al., 1995). Applying this idea to this study, when the brand image is
perceived as too distant from the individual‘s social self-concept, it can then have a
negative effect on the attitude towards that brand.

167
With regard to individuals with a dominant local orientation, the results from both
countries support the expectation that social self-congruity will have a stronger effect on
brand attitude than ideal social self-congruity (H10). These findings are the first to lend
empirical support to the proposition that individuals with a dominant local orientation
are inclined towards brands congruent with their social self-concept, as this would offer
them a means to display patterns of conformity consistent with social norms (Ralston et
al., 1996; Wang and Lin, 2003). However, there was a noticeable difference between the
findings in the US and India. Specifically, even though the effect of social self-
congruity on brand attitude was also stronger for US respondents than the ideal social
self-congruity effect, surprisingly, the effect was negative. As outlined in the previous
discussion (H9), this finding challenges the premise that self-congruity leads to positive
consumer attitudes. Thus, it suggests that a refinement of self-congruity theory may be
necessary by also considering the impact of a dominant local orientation on the effect of
social self-congruity on brand attitude. A potential explanation for the results of this
thesis can be derived from the sample used in this study. MTurk samples from the US
contain a higher proportion of individuals who are unemployed compared to the overall
population (Ross et al., 2010; Shapiro et al., 2013). Specifically, approximately 24% of
US MTurk respondents are unemployed compared to 8% of the US population overall
(Shapiro et al., 2013; Statistics, 2012). Unemployment has been shown to be positively
related to stress, which is subsequently related to anti-social behaviour (Santiago et al.,
2011; Adler and Rehkopf, 2008). Translated to this study, not complying with or
declining to pursue social conformance - the underlying motive of social self-congruity
(Sirgy et al., 2000) – could be interpreted as anti-social behaviour. Therefore, this offers
a conceivable explanation for the negative attitude towards social self-congruent brands
among US respondents.

168
8.3.3 Overall Strongest Self-Congruity Effect – All Four Types (H11
and H12)
The results from both countries support the expectation that, for individuals with a
dominant cosmopolitan orientation, ideal self-congruity will have the strongest effect on
brand attitude (H11). This finding offers empirical support for the proposition that
individuals integrate cosmopolitan values into their self-concept and seek experiences
(e.g. consumption of a specific brand) that allow them to self-enhance to cultivate their
ideal self-concept (Cannon and Yaprak, 2002; Earle and Cvetkovich, 1997). Translated
to this study, brands that allow them to foster their ideal self-concept are perceived more
positively than those matching the other self-congruity types.
With respect to individuals with a dominant local orientation, the findings from both
countries do not support the expectation that social self-congruity will have the
strongest overall effect on brand attitude (H12). Rather, the findings show that actual
self-congruity has the overall strongest effect on brand attitude. Therefore, this thesis
offers the first empirical evidence of this effect. Previous scholars proposed that for
individuals with a dominant local orientation, maintaining social conformance and
adhering to normative beliefs is of the utmost importance (Cannon and Yaprak, 2002).
In this case, social self-congruity is likely to have the strongest effect on brand attitude.
However, considering that actual self-congruity has the strongest effect on brand
attitude, this may indicate that, for individuals with a dominant local orientation, their
motivation to maintain a self-consistent view through brand consumption to verify their
actual self-concept is even stronger. A potential explanation for this unexpected result
may be drawn from the psychology domain. The rationale is founded on the argument
that private selves (actual and ideal) act as ―sociometers‖ that also incorporate social
standards (Stinson et al., 2010, p. 993) and therefore have a stronger effect on brand

169
attitude. A post-hoc test was conducted to explore this potential explanation. The result
shows a significant interaction effect between public and private selves, hence
supporting this potential explanation. Appendix 8.2 presents the details of the analysis.
This finding is consistent with the results obtained for H6, which shows that, for
individuals with a dominant INTSC, actual self-congruity has a stronger effect on brand
attitude, rather than the expected social self-congruity. These results emphasize the
importance of matching, in brand communications, the actual self-concept rather than
the social self-concept when targeting consumers with a dominant local orientation.
While generalizations beyond this study should be made with care, the findings offer
support for individuals with a dominant cosmopolitan and local orientation as well as
those with an INTSC and INDSC.
8.3.4 Summary Cosmopolitan and Local Orientation
This study answers the research questions on which self-congruity type (within private
self-congruity types, public self-congruity types, overall of the four self-congruity
types) has the strongest impact on brand attitude for consumers with a dominant
cosmopolitan versus local orientation. The results confirm that an individual‘s dominant
cosmopolitan or local orientation has an impact on which self-congruity type has the
strongest effect on brand attitude. Consequently, this thesis extends self-congruity
theory by considering the impact of an individual‘s dominant cosmopolitan and local
orientation on the effect of the four self-congruity types on brand attitude. The findings
emphasise that consumer researchers and marketers need to account for these
individual-level characteristics when considering which self-congruity types lead to the
strongest brand attitude. This thesis is the first to confirm empirically that, as expected,
consumers with a dominant cosmopolitan orientation respond most favourably to brands
congruent with their ideal self-concept. Interestingly, the empirical evidence of this
170
thesis shows that even individuals with a dominant local orientation – who were thought
to emphasize their social selves (Cannon and Yaprak, 2002) – respond more favourably
to brands matching a private self-concept type, specifically the actual self-concept. This
result was unexpected, but offers new insights. When targeting consumers with a
dominant local orientation, marketers should use brand communications that make
consumers believe that consuming the brand allows them to verify their actual self-
concept (e.g. using models that look like regular people), rather than using an
aspirational branding approach. Overall, the findings emphasize the need to customize
promotional messages in order to elicit the most positive attitude towards a brand when
targeting specific consumer groups. Moreover, the divergent results between the two
country samples (i.e. H8) suggest that the predictive validity of an individual‘s
dominant local orientation is limited beyond India. Considering that researchers have
only recently begun to empirically investigate the effects of an individual‘s
cosmopolitan and local orientation in a marketing context (e.g. Cleveland et al., 2011b;
Riefler et al., 2012), knowledge on an individual‘s local orientation as a predictor of
attitude needs to be further refined. Nevertheless, the results of this study offer a step in
this direction and further enrich the literature that considers the effect of a consumer‘s
cosmopolitan and local orientation on consumer attitudes.
8.4 Self-Congruity Effects (independent four types) on Brand
Attitude (H1 –H12)
In line with previous research (Graeff, 1996; Sirgy and Johar, 1999; Liu et al., 2012a)
the findings of this thesis offer further evidence that a brand image congruent with a
consumer‘s actual and ideal self-concept leads to a positive brand attitude. Specifically,
this thesis considered consumers with a dominant INTSC, INDSC, cosmopolitan and
local orientation. Hence, this thesis extends self-congruity theory by testing the impact

171
of these individual-level characteristics on how the four self-congruity types affect
brand attitude. Unexpectedly, the effect of social self-congruity on brand attitude was
either negative or not significant for the consumer types tested in this thesis (e.g.
dominant INDSC). This finding challenges previous research showing a positive effect
of social self-congruity on consumer attitudes (e.g. He and Mukherjee, 2007) and the
premise of self-congruity theory, which indicates that self-congruity (any of the four
types) leads to a positive brand attitude (Sirgy, 1982). Thus, this thesis also refines self-
congruity theory by showing a negative social self-congruity effect on brand attitude
when the tested individual-level characteristics are considered. Moreover, the effect of
ideal social self-congruity on brand attitude was not significant for any consumer type
tested in this thesis. Overall, considering these findings and the fact that only a few
studies to date have tested the impact of public selves on consumer attitude, more
empirical research is needed to gain a better understanding of how the two public selves
(social and ideal social) impact brand attitude as well as other brand-related outcomes.
8.5 Brand Attitude Effect on Purchase Intent (H13)
This thesis tested the effect of brand attitude on purchase intent. The results support the
view that there is a positive relationship between brand attitude and purchase intent
(H13). Specifically, the hypothesized relationship is supported across the four tested
consumer types and in both countries (US and India). These findings are in agreement
with previous research that tested the effect of brand attitude on purchase intent in
various consumer contexts (e.g. Bennett and Harrell, 1975; Mackenzie and Spreng,
1992; Spears and Singh, 2004). The findings further strengthen the theoretical link
between attitudes towards an object (e.g. brand) and behavioural intent (Fishbein and
Ajzen, 1974).

172
8.6 Conclusion
This chapter offers theoretical explanations of the findings obtained in the previous
chapter. It discusses the impact of an individual‘s INTSC, INDSC, cosmopolitan and
local orientation on the effect of the four self-congruity types on brand attitude.
Moreover, it discusses the effect of brand attitude on purchase intent. Overall, the thesis
offers empirical evidence that extends self-congruity theory by showing the impact of
individual-level characteristics (i.e. dominant INDSC, INDSC, cosmopolitan and local
orientation) on the effect of the four self-congruity types on brand attitude. Specifically,
is offers empirical evidence that, (a) as expected an individual‘s dominant INTSC,
INDSC, cosmopolitan and local orientation impact which self-congruity type (within
private selves, public selves and overall) has the strongest effect on brand attitude and
(b) private self-congruity types (actual and ideal) have a stronger effect on brand
attitude than public self-congruity types (social and ideal social). This finding is
consistent for consumers with an independent or interdependent self-construal and a
cosmopolitan or local orientation. Moreover, the thesis indicates that (c) other factors
pertaining to the two countries tested, besides an INDSC, INTSC or a cosmopolitan and
local orientation, are likely to impact the tested relationships. In addition, this thesis
refines self-congruity theory by showing a negative effect of social self-congruity on
brand attitude among US consumers, which challenges the premise of self-congruity
theory that individuals have positive attitudes towards brands congruent with their
social self-concept. The theoretical underpinnings drawn from the findings and research
design of this study offer various theoretical contributions. Furthermore, numerous
managerial implications can be derived. These are presented in the following chapter.

173
Chapter 9 - Conclusion
9.1 Introduction
The objective of this thesis is to investigate which of the four self-congruity types
(within private self-types, within public self-types and overall of all four self-types) has
the strongest effect on brand attitude for individuals with a dominant independent self-
construal (INDSC), interdependent self-construal (INTSC), cosmopolitan orientation
and local orientation. This thesis adopts a positivist approach and uses an online
questionnaire to collect data from a non-student sample of US and Indian respondents.
Two preliminary studies were conducted to ensure that the brands selected for the main
study are cross-nationally comparable. As a result, two publicly (Nike and Levi‘s) and
two privately (Coca Cola and Sony) consumed brands from four different product
categories (sports shoes, clothing apparel, soft drinks, and television sets) were selected
for the main study. Data for the main study were collected during June 2013. After data
cleaning procedures had been performed, 828 and 824 usable cases were analysed in the
US and India respectively. PLS-SEM was used to analyse the data. All measurement
models displayed satisfactory reliability and validity. Moreover, partial metric
invariance was established, while tests showed that non-response bias and common
method variance are unlikely to affect the data. The structural models all had
satisfactory predictive capabilities. Out of the 13 hypotheses, six were fully supported,
three received partial support and four were not supported. After testing the hypotheses,
the results were discussed and linked to the existing literature. This concluding chapter
is structured as follows. Section 9.2 presents the theoretical contributions. Section 9.3
presents the managerial implications of the thesis. Section 9.4 discusses the limitations

174
of the thesis. Section 9.5 presents future research directions, leading to the conclusion of
the chapter (section 9.6).
9.2.1 Extension and Refinement of Self-congruity Theory
Self-congruity theory posits that, as the perceived match (congruence) between a user‘s
self-concept and the brand‘s image increases, the resultant effect on brand attitude will
be positive (Sirgy, 1982). This thesis makes a contribution to knowledge on self-
congruity theory by providing empirical evidence that explains the research questions
on which self-congruity type - within private self-congruity types (actual vs. ideal),
within public self-congruity types (social vs. ideal social), and overall of all four self-
congruity types - has the strongest impact on brand attitude considering an individual‘s
INTSC, INDSC, cosmopolitan and local orientation. Specifically, the findings of this
thesis (a) extend and (b) refine self-congruity theory.
First, building on previous work (i.e. Malär et al., 2011; Kim and Hyun, 2013; Sung and
Choi, 2012), this thesis is the first to show empirically the impact of an individual‘s
dominant INTSC and INDSC on the effect of ideal, social and ideal social self-
congruity on brand attitude. Consequently, this thesis extends self-congruity theory by
accounting for the effect of all four self-congruity types on brand attitude under
consideration of both self-construal types. Previous studies only investigated the impact
of INTSC and INDSC on the effect of actual self-congruity on brand attitude (Sung and
Choi, 2012), or the impact of an INTSC on the effect of four self-congruity types on
purchase intent (Kim and Hyun, 2013). Moreover, this thesis extends self-congruity
theory by showing that brand conspicuousness (public vs. private) moderates the impact
of the four self-congruity types on brand attitude for the consumer segments tested.
Previous research by Kim and Hyun (2013) used only publicly consumed brands in the

175
research design. Furthermore, this is the first study to offer empirical evidence that a
consumer‘s cosmopolitan and local orientation impact the effect of any of the four self-
congruity types on brand attitude. Therefore, this thesis extends self-congruity theory
by showing that the impact of an individual‘s cosmopolitan and local orientation on the
effect of the four self-congruity types on brand attitude needs to be considered.
Second, this study refines self-congruity theory by providing empirical evidence that
social self-congruity does not lead to a positive brand attitude for the consumer
segments tested. Self-congruity theory posits that, as the perceived similarity
(congruence) between a user‘s self-concept (any of the four types) and the brand‘s
image increases, the resultant effect on brand attitude will be positive (Sirgy, 1982).
Previous studies show a positive effect of social self-congruity on consumer attitudes
(e.g. He and Mukherjee, 2007; Ibrahim and Najjar, 2008). However, these studies did
not test the impact of individual-level characteristics on the effect of social self-
congruity on consumer perceptions, an omission that offers a limited view of the social
self-congruity effect. Conversely, the findings of this study highlight the importance of
testing the impact of individual-level characteristics on the effect of social self-
congruity on brand perceptions and suggest that future research should consider the
impact of additional individual-level characteristics.
9.2.2 Empirical Evidence of the Interaction Effect between the Various
Self-Congruity Types
This thesis contributes to self-congruity theory by showing an interaction effect between
the various self-congruity types. Social psychologists argue that private self-concept
types also integrate social factors (Leary et al., 1998; Stinson et al., 2010). Hence, they

176
suggest that private self-concept types influence decision-making processes pertaining
to an individual‘s self-concept to a greater extent than public self-concept types, which
is due to an interaction effect between private and public self-concept types. The
findings of this thesis are the first to offer empirical evidence that this notion also
applies in a brand consumption context. Consequently, the findings extend knowledge
on self-congruity theory by showing an interaction effect of the four self-congruity
types and how they impact brand attitude, while considering an individual‘s INTSC,
INDSC, cosmopolitan and local orientation. Specifically, empirical evidence of the f2
and q2 values (details in chapter 7, Table 7.4) shows that the effect size of each
individual self-congruity type (e.g. actual self-congruity) on brand attitude is just a
fraction of the overall effect of all four self-congruity types, as represented by the R2
(explanatory power) and Q2 (predictive relevance) values of the model (detailed values
in chapter 7, Table 7.3). A post-hoc test showed that there is a significant interaction
effect between public and private self-congruity types. Details can be found in appendix
8.2. This finding sheds new light on previous claims that the various self-concept types
impact decision-making processes independently (Markus and Wurf, 1987). Therefore,
besides efforts to investigate the independent effects of each self-congruity type on
consumer attitudes to obtain a more precise picture of which self-concept type should be
matched when promoting brands (Kang et al., 2011), the potential interaction effect of
private and public self-congruity types in a consumer context warrants further
investigation. This interaction effect offers a potential explanation for why contrary to
what was hypothesized, even for individuals with a dominant INTSC (H6) and local
orientation (H12), actual self-congruity has the strongest effect on brand attitude rather
than the expected social self-congruity.

177
9.2.3 Cross-National Predictive Validity of INDSC and Local
Orientation
This thesis contributes to knowledge on the cross-national predictive validity of an
individual‘s dominant INDSC and local orientation on the effect of the four self-
congruity types on brand attitude. The divergent results between the two country
samples suggest that besides INDSC (H2, H5) and local orientation (H8) other factors
are likely to impact the tested relationships. This has implications with regard to the
predictive validity of an individual‘s (a) INDSC and (b) local orientation. First,
knowledge on self-construals is mainly based on comparisons between North
Americans (i.e. US) and East Asians such as Japanese and Chinese (Cross et al., 2011).
Therefore, as empirically evidenced in this thesis (H2 and H5), an INDSC may not have
the expected effects for individuals from other countries (i.e. Indians). Specifically, the
findings suggest that, beyond US samples, the predictive validity of an INDSC on the
effect of actual and ideal self-congruity on brand attitude needs to be examined further.
Second, empirical research on the local orientation construct as a predictor of consumer
attitude and behaviour is still in its infant stage in the marketing domain (i.e. Riefler et
al., 2012). Specifically, the findings in this thesis question the predictive validity of an
individual‘s dominant local orientation on the effect of actual and ideal self-congruity
on brand attitude among US consumers. Therefore, it suggests that the current
knowledge base, specifically the underlying motivations of individuals with a local
orientation when consuming brands, requires further examination. This entails
conducting additional studies in a wider array of countries and consumption contexts.
Overall, this thesis offers empirical insights that create the foundation for further
research on the cross-national predictive capabilities of an individual‘s INDSC and local
orientation on the effect of the four self-congruity types on consumer attitude.

178
9.3 Managerial Implications
The results of this study have also important implications for marketing practitioners.
Two implications are highlighted in this thesis and are described below.
9.3.1 Market Segmentation
The findings of this thesis offer marketers insights into the segmentation of consumers
markets within and across countries. In contrast to the conventional approach of
segmenting consumer markets only at the country level, numerous scholars have raised
the importance of identifying and serving consumers groups who have similar needs
and behaviours, irrespective of country boundaries (Wedel and Kamakura, 1999;
Douglas and Craig, 2011). This is due to the fact that interactions between people and
markets have intensified with globalisation; hence, specific consumer groups are
developing similar needs and behaviours and can consequently be grouped into
segments (Merz et al., 2008; Cleveland et al., 2011b). Therefore, marketers are
interested in individual-level characteristics that allow them to segment consumers
within and across countries, based on similar needs and behaviours (Cleveland et al.,
2011b). Specifically, an individual‘s dominant INTSC, INDSC, cosmopolitan and local
orientation correlate with various demographic characteristics such as age, living in
rural or urban areas, and income levels (Cleveland et al., 2011b; Riefler et al., 2012;
Zhang, 2009; Kim, 2005). Therefore, these individual-level characteristics offer a viable
segmentation basis. Knowing which self-congruity type leads to stronger brand attitude
for individuals with a dominant INTSC, INDSC, cosmopolitan or local orientation
provides marketers with valuable insights. It allows marketers to design brand
communication strategies that match the self-concept type that is likely to lead to the
strongest brand attitude when targeting consumers with the aforementioned individual-
level characteristics. Thus, marketers have insights on when into use authentic (actual

179
and social self-congruity) versus aspirational (ideal and ideal social self-congruity)
branding approaches in their brand communications. For instance, the findings of this
thesis show that individuals with a dominant local orientation have the most positive
attitude towards brands with an image congruent with their actual self-concept.
Therefore, marketers are advised to use authentic branding approaches (e.g. using
regular-sized models in an advertisement) that make consumers believe that using their
brand allows them to verify their actual self-concept. Conversely, the findings show that
individuals with a dominant cosmopolitan orientation have the most positive attitude
towards brands congruent with their ideal self-concept. Hence, marketers should use
aspirational branding approaches that make consumers believe that using their brand
allows them to foster their ideal self-concept (e.g. using slim and attractive models in an
advertisement).
9.3.2 Targeted Branding versus Mass Branding: A Marketing Channel
Perspective
The insights obtained from this thesis allow marketers to communicate with consumers
through targeted messages that match the self-concept type that has the strongest effect
on their brand attitude, while also selecting the appropriate marketing channels to reach
them. Marketers are moving away from mass marketing that uses the same brand
messaging for all consumer segments to more targeted branding approaches (Malär et
al., 2011). In particular, new technologies and online platforms (e.g. mobile and web)
offer marketers opportunities to reach specific consumer segments with customized ads
that fit their brand consumption needs with respect to their self-concept (Hollenbeck and
Kaikati, 2012). For instance, consumers with a dominant cosmopolitan orientation or
independent self-construal display a predisposition to using new technologies,
innovative products and online shopping (Westjohn et al., 2009; Ma et al., 2013).

180
Consequently, marketers can use the insights provided by this study to choose specific
marketing channels, such as web-based social media that are predominantly used by
their target segment (e.g. cosmopolitans) and customize their brand communications
accordingly. For example, marketers can choose aspirational versus authentic branding
approaches depending on the target segment.
9.4 Limitations
Although extensive consideration and effort was invested in the research design and
selecting an appropriate sample of respondents, there remain some limitations to this
study. This section discusses these limitations.
First, the findings of this study may have been biased by the fact that the level of
unemployment among MTurk respondents in the US is higher than that in the overall
population. Specifically, research has shown that 24% of US MTurk respondents are
unemployed compared to 8% of the US population overall (Shapiro et al., 2013;
Statistics, 2012). Unemployed individuals are prone to suffer from stress, which
subsequently affects their conception of social selves and is related to anti-social
behaviour (Santiago et al., 2011; Adler and Rehkopf, 2008). Considering that brands are
also used to express public/social selves, the higher proportion of unemployed
individuals in this study compared to the overall population may have affected the way
in which social and ideal social self-congruity impact brand attitude. Specifically, this
study found a negative effect of social self-congruity on brand attitude. Therefore, it
remains unknown whether the use of a sample that reflected more closely the
employment properties of the overall population might have offered similar results.

181
Second, the results of this thesis may have been biased by the fact that the four brands
used in this thesis were perceived as high-involvement brands. This thesis used two
preliminary studies to select brands that are perceived similarly in terms of the brand
familiarity, product involvement, and perceived prestige/status (details in chapter 5).
This step was performed to ensure that the results of the thesis are comparable between
the two countries; however, it resulted in the selection of brands that are perceived as
high-involvement. Research has shown that a brands product involvement level
moderates the effect of actual and ideal self-congruity on brand perceptions (Malär et
al., 2011). Specifically, low product involvement has a positive moderating effect of
actual self-congruence on brand perceptions, while it has a negative moderating effect
of ideal self-congruity on brand perceptions. Therefore, the effect of actual and ideal
self-congruity on brand attitude might have differed for the consumer groups tested had
brands with low involvement levels been considered. Future research should also
investigate the impact of low involvement brands on the relationships tested.
A third limitation of this study is that the four brands used in this thesis (Nike, Sony,
Coca Cola and Levi‘s) are all global brands (Interbrand, 2012). The brands used in this
study were chosen by the respondents from both countries in order to ensure that they
are familiar with the brands and are therefore in a position to judge their attitudes
towards them (see preliminary study I and II). However, research shows that individuals
with a dominant local orientation have more positive attitudes towards local products
and their brands than individuals with a dominant cosmopolitan orientation (Cleveland
et al., 2011b). Thus, the inclusion of local brands into the research design might have
offered stronger brand attitudes towards the brands for individuals with a local
orientation. Consequently, future research should test whether the results differ for local
brands.

182
Fourth, this study asked respondents to respond to four different self-congruity
scenarios (four self-congruity types), which may have led to respondent fatigue.
Precautions were taken in the questionnaire design to avoid a cognitive overlap between
the various self-congruity types, hence allowing respondents to make brand attitude
judgements for each independent self-congruity type. This was done by placing
questions pertaining to other measures (i.e. long-term orientation) between each of the
self-congruity scenarios, which consequently served as a pause between each scenario.
Nevertheless, respondent fatigue may still have influenced the results as respondents
had to conceptualize and answer questions pertaining to four distinct self-congruity
scenarios. Future research might randomize the question order or use a questionnaire
administered by a person, who can make breaks between each scenario, thus reducing
potential bias due to respondent fatigue.
9.5 Future Research Directions
Researchers raised the need for future research that tests how individual-level
characteristics impact the effect of the four self-congruity types on consumer attitude
(He and Mukherjee, 2007) and to test the independent effects of all four self-congruity
types on consumer attitudes (Kang et al., 2011). Moreover, Kim and Hyun (2013)
highlighted the need to consider privately as well as publicly consumed brands in the
research design to produce results that are more generalizable, while also testing the
external validity of the conceptual framework in Western and Eastern countries. This
thesis addressed all the aforementioned issues. Nevertheless, there are still various areas
that deserve attention in future research.

183
First, it would be interesting to address the limitations of the current study in future
work. Therefore, it would be beneficial were future research to use samples that more
closely reflect the characteristics of the overall population (e.g. employment levels).
This would allow researchers to account for the potential impact of unemployment-
induced stress, which may affect how brands are used to express social selves and the
resulting brand attitude (Ji et al., 2004; Santiago et al., 2011). Furthermore, testing a
wider array of brands derived from different product categories would aid the
generalizability of the study (Jamal and Al-Marri, 2007; Parker, 2009). Special focus
should be placed on including brands into the research design that are perceived as low-
involvement. This is important as product involvement levels have been shown to
impact brand perceptions (Malär et al., 2011) and this thesis tested only brands
perceived as high product involvement. Moreover, empirical evidence shows that
individuals with a dominant local orientation have more positive attitudes towards local
products and brands than those with a dominant cosmopolitan orientation (Cleveland et
al., 2011b). Hence, future research should investigate whether the result might differ
with regard to how strongly the four self-congruity types impact brand perceptions for
consumers with a dominant cosmopolitan and local orientation when considering global
versus local brands.
Second, prior studies have shown that the type of consumption (public vs. private) has
an impact on how strongly actual and ideal self-congruity impact on brand perceptions
(Hong and Zinkhan, 1995; Graeff, 1996). The results of this thesis also offer support for
social and ideal social self-congruity as the research design accounted for publicly and
privately consumed brands, hence providing more generalizable results than previous
research (i.e. Kim and Hyun, 2013). A post-hoc test was performed on the partially and
184
not-supported hypotheses and the results showed that brand conspicuousness type
impacts the results in these hypotheses. Therefore, it is suggested that future research
explore the underlying reasons why brand conspicuousness affects the tested
relationships. Qualitative research approaches could be used to explore these
phenomena more deeply.
Third, the results of the R2 and Q
2 values, which represent the explanatory power and
predictive relevance of the structural model showed that overall the structural models
considering all four self-congruity types have medium-to-large predictive power of
brand attitude (chapter 7, Table 7.3). However, the corresponding f2 and q
2 values show
that even though each individual self-congruity types (e.g. actual self-congruity) has an
effect on brand attitude, this ―stand alone‖ effect and the resulting predictive power of
the corresponding self-congruity type on brand attitude is rather small compared to the
R2 and Q
2 values. The results of a post-hoc test indicate that an interaction effect
between public and private self-congruity types strongly accentuates the overall effect
compared to their independent effect. Therefore, researchers should investigate more
than just the independent effects of each self-congruity type on consumer attitudes in
order to obtain a more precise picture of which self-concept type should be matched
when promoting brands (Kang et al., 2011). Future research should also investigate the
potential interaction effect of private and public self-congruity types and how it impacts
brand perceptions.
Fourth, three hypotheses were supported only in one of the two countries tested, and
were hence only partially supported. Specifically, the findings indicate that the
predictive capabilities of a consumer‘s dominant INDSC (H2 and H5) on how actual

185
and ideal self-congruity types impact brand attitude are limited beyond samples from
the US. To date, most research, beyond self-congruity studies considering an INDSC,
has been based on samples from the US, Japan and China (Cross et al., 2011). Future
research should consider differences in models of agency (Kitayama and Cohen, 2007)
between these countries, as what individuals perceive as ―good‖ behaviour within their
social networks, may impact the relationships tested. Moreover, the findings also
indicate that the predictive capabilities of a consumer‘s dominant local orientation (H8)
on how actual and ideal self-congruity impact brand attitude are limited beyond India.
Knowledge about consumers‘ dominant local orientation is still in its infancy stage, as
research considering this construct is still quite limited (Riefler et al., 2012). Future
research should test the effect of an individual‘s dominant INDSC and local orientation
on attitude and behaviour in more country contexts, while considering qualitative
research approaches to explore the underlying motivations of these individuals. Such
investigations would offer a more precise picture of what guides the behaviour and
attitudes of individuals with these particular characteristics.
Fifth, and unexpectedly, H4 showed that social self-congruity had the strongest effect
on brand attitude for US consumers with a dominant INDSC. Surprisingly, the social
self-congruity effect was negative, while the effects of the other three self-congruity
types on brand attitude, as expected, were positive. In the discussion chapter it was
suggested that this effect might be explained by the concept of reactance of the self,
which is based on the notion that individuals experience reactance when there is a threat
to their freedom (Jonas et al., 2009). Hence, it is possible that individuals with an
INDSC perceive compliance with social norms, by choosing a socially congruent brand
as a threat to their freedom. This may lead to a negative effect on brand attitude. Future
research could use priming techniques with scenarios that depict a potential threat to a

186
consumer‘s freedom and subsequently test whether this is indeed affecting the impact of
social self-congruity on brand attitude.
9.6 Conclusion
In conclusion, this thesis has provided empirical evidence to explain which self-
congruity type (within private self-congruity types, public self-congruity types, and
overall of all four self-congruity types) has the strongest impact on brand attitude when
an individual‘s dominant INTSC, INDSC, cosmopolitan and local orientation are
considered. The findings pertaining to how the tested individual-level characteristics
impact the effect of the four self-congruity types on brand attitude have theoretical and
practical applications as described previously. They offer exciting avenues for academic
research such as considering the impact of other individual-level variables on the self-
congruity effect, or accounting for the potential interaction effect between the various
self-congruity types. Moreover, the findings also provide concrete evidence to support
the development of brand positioning strategies for targeting consumers with a
dominant INTSC, INDSC, cosmopolitan or local orientation.

187
References
AAKER, D. A., KUMAR, V. & DAY, G. S. 2006. Marketing Research, New
Jersey, Wiley.
AAKER, J. 1999. The Malleable Self: The Role of Self-Expression in Persuasion.
Journal of Marketing Research, 36, 45-57.
AAKER, J. & LEE, A. Y. 2001. ―I‖ seek pleasures and ―we‖ avoid pains: The role
of self-regulatory goals in information processing and persuasion. Journal of
Consumer Research, 28, 33-49.
AAKER, J. & SCHMITT, B. 2001. Culture-Dependent Assimilation and
Differentiation of the Self: Preferences for Consumption Symbols in the
United States and China. Journal of Cross-Cultural Psychology, 32, 561-
576.
ADELSON, J. L. & MCCOACH, D. B. 2012. Measuring the mathematical attitudes
of elementary students: The effects of a 4-point or 5-point Likert-type scale.
Educational and Psychological Measurement,, 70, 796-807.
ADLER, N. E. & REHKOPF, D. H. 2008. U.S. disparities in health: Descriptions,
causes, and mechanisms. Annual Review of Public Health, 29, 235-252.
AGRAWAL, N. & MAHESWARAN, D. 2005. The Effects of Self-Construal and
Commitment on Persuasion. Journal of Consumer Research, 31, 841-849.
AGUIRRE-RODRIGUEZ, A., BOSNJAK, M. & SIRGY, M. J. 2011. Moderators of
the self-congruity effect on consumer decision-making: A meta-analysis.
Journal of Business Research, 65, 1179–1188.
AHLUWALIA, R. 2008. How far can a brand stretch? understanding the role of
self-construal. Journal of Marketing Research, 45, 337-350.
ALDEN, D. L., KELLEY, J. B., RIEFLER, P., LEE, J. A. & SOUTAR, G. N. 2013.
The Effect of Global Company Animosity on Global Brand Attitudes in
Emerging and Developed Markets: Does Perceived Value Matter? Journal of
International Marketing, 21, 17-38.
ANDERSON, C., WILLER, R., KILDUFF, G. J. & BROWN, C. E. 2012. The
origins of deference: When do people prefer lower status? Journal of
Personality and Social Psychology, 102, 1077-1088.

188
ANDERSON, J. C. & GERBING, D. W. 1988. Structural equation modeling in
practice: a review and recommended two-step approach. Psychological
Bulletin, 103, 411-423.
ARMSTRONG, J. S. & OVERTON, T. S. 1977. Estimating Nonresponse Bias in
Mail Surveys. Journal of Marketing Research, 14, 396-402.
ARNETT, J. J. 2002. The psychology of globalization. American Psychologist, 57,
774-783.
BAGCHI, R. & LI, X. 2011. Illusionary Progress in Loyalty Programs: Magnitudes,
Reward Distances, and Step-Size Ambiguity. Journal of Consumer
Research, 37, 888-901.
BAGOZZI, R. P. 1992. The Self-Regulation of Attitudes, Intentions, and Behavior.
Social Psychology Quarterly, 55, 178-204.
BANKS, J. A. 2008. Diversity, Group Identity, and Citizenship Education in a
Global Age. Educational Researcher, 37, 129-139.
BARCLAY, D., HIGGINS, C. & THOMPSON, R. 1995. The partial least squares
approach to causal modeling: personal computer adoption and use as an
illustration. Technology Studies, 2, 85–309.
BARCUS, H. R. & BRUNN, S. D. 2010. PLACE ELASTICITY: EXPLORING A
NEW CONCEPTUALIZATION OF MOBILITY AND PLACE
ATTACHMENT IN RURAL AMERICA. Geografiska Annaler: Series B,
Human Geography, 92, 281-295.
BARONE, M. J. & ROY, T. 2010. Does exclusivity always pay off? exclusive price
promotions and consumer response. Journal of Marketing, 74, 121-132.
BARONE, M. J., ROY, T. & 2010. Does exclusivity always pay off? exclusive
price promotions and consumer response. Journal of Marketing, 74, 121-
132.
BARTON, C., KOSLOW, L., FROMM, J. & EGAN, C. 2012. Consumer insight:
consumer products millenial passions. Boston Consulting Group.
BAUMGARTNER, H. & HOMBURG, C. 1996. Applications of structural equation
modeling in marketing and consumer research: A review. International
Journal of Research in Marketing, 13, 139-161.
BEARDEN, W., MONEY, R. & NEVINS, J. 2006. A measure of long-term
orientation: Development and validation. Journal of the Academy of
Marketing Science, 34, 456-467.

189
BECK, U. 2002. The cosmopolitan society and its enemies. Theory, Culture &
Society, 7, 295-310.
BEINHOCKER, E. D., FARRELL, D. & ZAINULBHAI, A. S. 2007. Tracking the
growth of India‘s middle class. The McKinsey Quarterly, August.
BELK, R. W. 1988. Possessions and the Extended Self. Journal of Consumer
Research, 15, 139-168.
BELK, R. W. Year. Shoes and self. In: KELLER, P. A. & ROOK, D. W., eds.
Advances in Consumer Research, 2003 Valdosta, GA. 27-33.
BENNETT, P. D. & HARRELL, G. D. 1975. The Role of Confidence in
Understanding and Predicting Buyers' Attitudes and Purchase Intentions.
Journal of Consumer Research, 2, 110-117.
BERRY, J. W. 1989. Imposed etics–emics-derived etics: The operationalization of
a compelling idea. International Journal of Psychology, 24, 721–735.
BIEMER, P. P. & LYBERG, L. E. 2003. Introduction to Survey Quality, Hoboken,
New Jersey, John Wiley & Sons.
BIRDWELL, A. E. 1968. A Study of the Influence of Image Congruence on
Consumer Choice. The Journal of Business, 41, 76-88
BJERKE, R. & POLEGATO, R. 2006. How well do advertising images of health
and beauty travel across cultures? A self-concept perspective. Psychology
and Marketing, 23, 865-884.
BODEY, K. & GRACE, D. 2007. Contrasting ―complainers‖ with ―non-
complainers‖ on attitude toward complaining, propensity to complain, and
key personality characteristics: A nomological look. Psychology and
Marketing, 24, 579-594.
BOLTON, L. E., TAT KEH, H. & ALBA, J. W. 2010. How do price fairness
perceptions differ across culture. Journal of Marketing Research, 47, 564-
576.
BOND, M. H. 2002. Reclaiming the individual from Hofstede's ecological analysis -
-A 20-year odyssey: Comment on Oyserman et al. (2002). Psychological
Bulletin, 128, 73-77.
BOURQUE, L. B. & FIELDER, E. P. 2003. How to conduct self-administered and
mail survey. In: FINK, A. (ed.) The Survey Kit 2nd ed. Thousand Oaks: Sage
Publication.
190
BOWLING, A. 2002. Research Methods in Health. In Investigating health and
health services, Buckingham, Open University Press.
BRYMAN, A. 1988. Quality and Quantity in Social Research, London, Unwin
Hyman.
BRYMAN, A. 2004. Social Research Methods, New York, Oxford University
Press.
BRYMAN, A. & BELL, E. 2007. Business Research Methods, New York, Oxford
University Press.
BUHRMESTER, M., KWANG, T. & GOSLING, S. D. 2011. Amazon's Mechanical
Turk: A New Source of Inexpensive, Yet High-Quality, Data? Perspectives
on Psychological Science, 6, 3-5.
BURN, R. B. 1979. The self-concept in theory, measurement, development, and
behavior, London, Longman.
BYRNE, B. M., SHAVELSON, R. J. & MUTHÉN, B. 1989. Testing for the
equivalence of factor covariance and mean structures: The issue of partial
measurement invariance. . Psychological Bulletin, 105, 456-466.
CANADA, S. 1998. Statistics Canada Quality Guidelines. 3rd ed. Ottawa.
CANNON, H. M. & YAPRAK, A. 2002. Will the real-world citizen please stand
up! The many faces of cosmopolitan consumer behavior. Journal of
International Marketing, 30, 30-52.
CAVUSGIL, S. T. & DAS, A. 1997. Methodological issues in empirical cross-
cultural research: A survey of the management literature and a framework.
Management International Review, 37, 71–96.
CENSUS, U. 2010. People and Households [Online]. US Departmetn of
Commerce. [Accessed September 7th 2013].
CERNKOVICH, S. A., LANCTÔT, N. & GIORDANO, P. C. 2008. Predicting
Adolescent and Adult Antisocial Behavior Among Adjudicated Delinquent
Females. Crime & Delinquency, 54, 3-33.
CHANG, C. 2006. Cultural Masculinity/Femininity Influences on Advertising
Appeals. Journal of Advertising Research, 46, 315.
CHANG, C. 2010. Making unique choices or being like others: How priming self -
concepts influences advertising effectiveness. Psychology and Marketing,
27, 399-415.

191
CHANG, C. & LI, H. 2010. Why Are Childlike Portrayals Appealing in East Asia?
A Cross-Cultural Comparison between Taiwan and the U.S. International
Journal of Advertising, 29, 451.
CHAPLIN, N. L. & JOHN, R. D. 2005. The Development of Self-Brand
Connections in Children and Adolescents. Journal of Consumer Research,
32, 119-129.
CHEBAT, J., SIRGY, M. & STJAMES, V. 2006. Upscale image transfer from
malls to stores: A self-image congruence explanation. Journal of Business
Research, 59, 1288-1296.
CHEN, F. F. 2007. Sensitivity of Goodness of Fit Indexes to Lack of Measurement
Invariance. Structural Equation Modeling: A Multidisciplinary Journal, 14,
464-504.
CHIN, W. W. 2000. Frequently asked questions – Partial Least Squares & PLS-
Graph [Online]. Available: http://disc-nt.cba.uh.edu/chin/plsfac.htm
[Accessed July 15th 2013].
CHOI, Y. K. & MIRACLE, G. E. 2004. The effectiveness of comparitive
advertising in korea and the united states. Journal of Advertising, 22, 75-87.
CHURCHILL, G. A. 1995. Marketing Research Methodological Foundation,
Orlando, Florida, The Dryden Press.
CHURCHILL, G. A., JR. & IACOBUCCI, D. 2002. Marketing research:
Methodological foundations Fort Worth, TX, Harcourt.
CIA. 2013. The World Factbook [Online]. Central Intelligence Agency. Available:
https://www.cia.gov/library/publications/the-world-factbook/geos/in.html
[Accessed January 7th 2013].
CLEVELAND, M., ERDOĞAN, S., ARıKAN, G. & POYRAZ, T. 2011a.
Cosmopolitanism, individual-level values and cultural-level values: A cross-
cultural study. Journal of Business Research, 64, 934-943.
CLEVELAND, M., LAROCHE, M. & PAPADOPOULOS, N. 2009.
Cosmopolitanism, Consumer Ethnocentrism, and Materialism: An Eight-
Country Study of Antecedents and Outcomes. Journal of International
Marketing, 17, 116-146.
CLEVELAND, M., LAROCHE, M., TAKAHASHI, I. & ERDOĞAN, S. 2013.
Cross-Linguistic Validation of a Unidimensional Scale for
Cosmopolitanism. Journal of Business Research, 67, 268–277.

192
CLEVELAND, M., PAPADOPOULOS, N. & LAROCHE, M. 2011b. Identity,
demographics, and consumer behaviors: International market segmentation
across product categories. International Marketing Review, 28, 244-266.
COHEN, J. 1988. Statistical Power Analysis for the Behavioral Sciences, Hillsdale,
NJ, Lawrence Erlbaum.
COHEN, J. A. 1992. A power primer. Psychological Bulletin, 112, 155-159.
COLLIS, J. & HUSSEY, R. 2003. Business Research: A Practical Guide for
Undergraduate and Postgraduate Students, Palgrave, Macmillan.
COOLEY, C. H. 1964. Human Nature and the Social Order, New York, Schocken
Books.
CRAIG, C. S. & DOUGLAS, S. 2005. International Marketing Research,
Chichester, John Wiley.
CROSS, S. E., BACON, P. L. & MORRIS, M. L. 2000. The relational-
interdependent self-construal and relationships. Journal of Personality and
Social Psychology, 78, 791-808.
CROSS, S. E., HARDIN, E. E. & GERCEK-SWING, B. 2011. The What, How,
Why, and Where of Self-Construal. Personality and Social Psychology
Review, 15, 142-179.
CURY, F., ELLIOT, A. J., DA FONSECA, D. & MOLLER, A. C. 2006. The
social-cognitive model of achievement motivation and the 2 × 2 achievement
goal framework. Journal of Personality and Social Psychology, 90, 666-679.
DABHOLKAR, P. A. & BAGOZZI, R. P. 2002. An Attitudinal Model of
Technology-Based Self-Service: Moderating Effects of Consumer Traits and
Situational Factors. Journal of the Academy of Marketing Science, 30, 184-
201.
DADA, O. & WATSON, A. 2013. Entrepreneurial orientation and the franchise
system: Organisational antecedents and performance outcomes. European
Journal of Marketing, 47, 790-812.
DE MOOIJ, M. 2010. Global Marketing and Advertising: Understanding Cultural
Paradoxes, Thousand Oaks, CA, SAGE Publications.
DERNÉ, S. D. 2008. Globalization on the ground, media and the transformation of
culture, class, and gender in India, New Dehli, SAGE.
DESHPANDE, A. & SPEARS, D. 2012a. Working Paper. Delhi School of
Economics.

193
DESHPANDE, A. & SPEARS, D. 2012b. Working Paper Delhi School of
Economics.
DEUTSCH, M. & GERARD, H. B. 1955. A study of Nomative and Informational
Social Influences upon Individual Judgement Journal of Abnormal and
Social Psychology, 629-636.
DILLMAN, D. A. 2007. Mail and Internet Surveys: The Tailored Design Method,
New Jersey, John Wiley Co.
DOLICH, I. J. 1969. Congruence Relationships between Self Images and Product
Brands. Journal of Marketing Research, 6, 80-84.
DONALD, S. H., KOFMAN, E. & KEVIN, C. 2009. Branding cities:
Cosmopolitanism, parochialism, and social change, New York, Routledge.
DOUGLAS, S. P. & CRAIG, C. S. 2011. The role of context in assessing
international marketing opportunities. International Marketing Review, 28,
150-162.
DOUGLAS, S. P., MORRIN, M. A. & CRAIG, C. S. 1994. Cross-national
consumer research traditions. In: LAURENT, G., LILIEN, G. L. & PRAS,
B. (eds.) Research Traditions in Marketing. Boston: Kluwer Academic.
E. HUPFER, M. & DETLOR, B. 2007. Beyond gender differences: Self-concept
orientation and relationship-building applications on the Internet. Journal of
Business Research, 613-619.
EARLE, T. C. & CVETKOVICH, G. 1997. Culture, cosmopolitanism and risk
management. Risk Analysis, 17, 55-65.
EBERL, M. 2010. An Application of PLS in Multi-group Analysis – The Need for
Differentiated Corporate-level Marketing in the Mobile Communications
Industry. In: ESPOSITO, V. V., CHIN, W. W., HENSELER, J. & WANG,
H. (eds.) Handbook of Partial Least Squares: Concepts, Methods, and
Applications. Heidelberg: Springer.
EISENHARDT, K. M. 1989. Building Theories from Case Study Research.
Academy of Management Review, 14, 532-550.
EKINCI, Y., DAWES, P. L. & MASSEY, G. R. 2008. An extended model of the
antecedents and consequences of consumer satisfaction for hospitality
services. European Journal of Marketing, 42, 35 - 68.

194
EKINCI, Y. & RILEY, M. 2003. An investigation of self-concept: actual and ideal
self-congruence compared in the context of service evaluation. Journal of
Retailing and Consumer Services, 10, 201-214.
ERIKSSON, K. & SIMPSON, B. 2010. Emotional reactions to losing explain
gender differences in entering a risky lottery. Judgment and Decision
Making, 5, 159–163.
ESCALAS, J. E. 2004. Narrative processing: Building consumer connections to
brands. Journal of Consumer Psychology, 14, 168-180.
ESCALAS, J. E. & BETTMAN, J. R. 2005. Self-construals, reference groups, and
brand meaning. Journal of Consumer Research, 32, 378-389.
ESSOUSSI, L. H. & MERUNKA, D. 2007a. Consumers' product evaluations in
emerging markets: Does country of design, country of manufacture, or brand
image matter? International Marketing Review, 24, 409-426.
ESSOUSSI, L. H. & MERUNKA, D. 2007b. Consumers‘ product evaluations in
emerging markets Does country of design, country of manufacture, or brand
image matter? International Marketing Review, 24, 409-426.
EUROMONITOR 2008. Annual Gross Income - India. Euromonitor International.
FALK, R. F. & MILLER, N. B. 1992. A primer for soft modeling., Akron, OH, US,
University of Akron Press.
FEARON, J. D. 2003. Ethnic and Cultural Diversity by Country. Journal of
Economic Growth, 8, 195-222.
FESTINGER, L. 1954. A Theory of Social Comparison Processes,‘‘. Human
Relations, 7, 117-140.
FIELD, A. 2009. Discovering Statistics Using SPSS, Los Angeles, SAGE.
FISHBEIN, M. & AJZEN, I. 1974. Attitudes towards objects as predictors of single
and multiple behavioral criteria. Psychological Review, 81, 59-74.
FISHBEIN, M. & AJZEN, I. 1975. Belief, Attitude, Intention and Behavior: An
Introduction to Theory and Research, Addision-Wesley, Reading, MA,
USA.
FISHER, R. J. & GRÉGOIRE, Y. 2006. Gender differences in decision satisfaction
within established dyads: Effects of competitive and cooperative behaviors.
Psychology and Marketing, 23, 313-333.

195
FORNELL, C. & LARCKER, D. F. 1981. Evaluating Structural Equation Models
with Unobservable Variables and Measurement Error. Journal of Marketing
Research, 18, 39-50.
FOSCHT, T., MALOLES III, C., SWOBODA, B., MORSCHETT, D. & SINHA, I.
2008. The impact of culture on brand perceptions: a six-nation study.
Journal of Product & Brand Management, 17, 131 - 142.
FRAZIER, P. A., TIX, A. P. & BARRON, K. E. 2004. Testing Moderator and
Mediator Effects in Counseling Psychology Research. Journal of Counseling
Psychology, 51, 115-134.
GAO, L., WHEELER, S. C. & SHIV, B. 2009. The ―Shaken Self‖: Product Choices
as a Means of Restoring Self‐View Confidence. Journal of Consumer
Research, 36, 29-38.
GEISSER, S. 1974. A predictive approach to the random effects model. Biometrika,
61, 101-107.
GEORGE, D. & MALLERY, P. 2003. SPSS for Windows step by step: A simple
guide and reference. 11.0 update, Boston, Allyn & Bacon.
GIEBELHAUSEN, M. & LAWSON, S. 2010. Sneakerheads and Customr Kicks:
Insights into Symbolic Mass Customization. In: PILLER, F. T. & TSENG,
M. M. (eds.) Handbook of Research in Mass Customization and
Personalization.
GILBERT, D. T., GIESLER, R. B. & MORRIS, K. A. 1995. When comparisons
arise. Journal of Personality and Social Psychology, 69, 227-236.
GOFFMAN, E. 1959. The Presentation of Self in Everyday Life, New York, Anchor
Books.
GRACE, S. L. & CRAMER, K. L. 2003. The elusive nature of self-measurement:
The self-construal versus the twenty statements test. Journal of Social
Psychology, 143, 649–668.
GRAEFF, T. R. 1996. Image Congruence Effects on Product Evaluations: The Role
of Self-Monitoring and Public/Private Consumption. Psychology &
Marketing, 13, 481-499.
GRAEFF, T. R. Year. Uninformed Response Bias in Measuring Consumers‘ Brand
Attitudes. In: ARNOULD, E. J. & SCOTT, L. M., eds. Advances in
Consumer Research, 1999 Provo, Utah. 632-639.

196
GRAUPMANN, V., JONAS, E., MEIER, E., HAWELKA, S. & AICHHORN, M.
2012. Reactance, the self, and its group: When threats to freedom come from
the ingroup versus the outgroup. European Journal of Social Psychology,
42, 164-173.
GREEN, P. E. & RAO, V. R. 1970. Rating scales and information recovery: How
many scales and response categories to use? . Journal of Marketing, 34, 33-
39.
GREENWALD, A. G. & PRATKANIS, A. R. 1984. The self. In: WYER, R. S. &
SRULL, T. K. (eds.) Handbook of Social Cognition. Hillsdale, NJ: Erlbaum.
GRUBB, E. L. & GRATHWOHL, H. L. 1967. Consumer Self-Concept, Symbolism
and Market Behavior: A Theoretical Approach. The Journal of Marketing,
31, 22-27.
GRUBB, E. L. & STERN, B. L. 1971. Self-Concept and Significant Others. Journal
of Marketing Research, 8, 382-385
GUDYKUNST, W. B., MATSUMOTO, Y., TING-TOOMEY, S., NISHIDA, T.,
KIM, K. & HEYMAN, S. A. M. 1996. The Influence of Cultural
Individualism-Collectivism, Self Construals, and Individual Values on
Communication Styles Across Cultures. Human Communication Research,
22, 510-543.
GUIMOND, S., CHATARD, A., MARTINOT, D., CRISP, R. J. &
REDERSDORFF, S. 2006. Social comparison, self-stereotyping, and gender
differences in self-construals. Journal of Personality and Social Psychology,
90, 221-242.
HAAS, M. R. 2006. Acquiring and applying knowledge in transnational teams: The
roles of cosmopolitans and locals. Organization Science, 17, 367-384.
HAIR, J., SARSTEDT, M., RINGLE, C. & MENA, J. 2012. An assessment of the
use of partial least squares structural equation modeling in marketing
research. Journal of the Academy of Marketing Science, 40, 414-433.
HAIR, J. F., ANDERSON, R. E., TATHAM, R. L. & BLACK, W. C. 1995.
Multivariate Data Analysis with Readings, Englewood Cliffs, NJ, Prentice
Hall.
HAIR, J. F., BUSH, R. P. & ORTINAU, D. J. 2006. Marketing research: Within a
changing information environment, Boston McGraw-Hill/Irwin.

197
HAIR, J. F., HULT, G. T. M., RINGLE, C. M. & SARSTEDT, M. 2014. A Primer
on Partial Least Squares Structural Equatio Modeling (PLS-SEM), London,
SAGE.
HAIR, J. F., RINGLE, C. M. & SARSTEDT, M. 2011. PLS-SEM: Indeed a Silver
Bullet. The Journal of Marketing Theory and Practice 19, 139-152
HAIR, J. F. J., ANDERSON, R. E., TATHAM, R. L. & BLACK, W. C. 1998.
Multivariate Data Analysis, Upper Saddle River, New Jersey, Prentice Hall.
HAIR, J. F. J., BLACK, W. C., BABIN, B. J. & ANDERSON, R. E. 2010.
Multivariate Data Analysis: A Global Perspective, Boston, Pearson.
HAIR, J. F. J., BUSH, R. & ORTINAU, D. 2003. Marketing Research Boston,
McGraw-Hill.
HAIR, J. F. J., MONEY, A. H., SAMOUEL, P. & PAGE, M. 2007. Research
Methods for Business, Hoboken, New Jersey, John Wiley & Sons.
HAMILTON, R. W. & BIEHAL, G. J. 2005. Achieving your goals or protecting
their future? the effects of self-view on goals and choices. Journal of
Consumer Research, 32, 277-283.
HANNOVER, B., BIRKNER, N. & PÖHLMANN, C. 2006. Ideal selves and self-
esteem in people with independent or interdependent self-construal.
European Journal of Social Psychology, 36, 119-133.
HANNOVER, B., KÜHNEN, U. & BIRKNER, N. 2000. Independentes und
interdependentes Selbstwissen als Determinante von Assimilation und
Kontrast bei kontextuellem Priming [Independent and interdependent self-
knowledge as a determinant of assimilation versus contrast in contextual
priming]. Zeitschrift für Sozialpsychologie, 31, 44–56.
HARRIS, J. 2005. Emerging Third World powers: China, India and Brazil. Race &
Class, 46, 7-27.
HATTIE, J. 1992. Self-concept, Hillsdale, NJ, Erlbaum.
HE, H. & MUKHERJEE, A. 2007. I am, ergo I shop: does store image congruity
explain shopping behaviour of Chinese consumers? Journal of Marketing
Management, 23, 443-460.
HEATH, A. P. & SCOTT, D. 1998. The self-concept and image congruence
hypothesis: An empirical evaluation in the motor vehicle market. European
Journal of Marketing, 32, 1110-1123.

198
HEINE, S. J. & LEHMAN, D. R. 1999. Culture, Self-Discrepancies, and Self-
Satisfaction. Personality and Social Psychology Bulletin, 25, 915-925.
HENNIG-THURAU, T., HENNING, V. & SATTLER, H. 2007. Consumer File
Sharing of Motion Pictures. Journal of Marketing, 71, 1-18.
HENSELER, J., RINGLE, C. M. & SINKOVICS, R. R. 2009. The Use of Partial
Least Squares Path Modeling in International Marketing. Advances in
International Marketing, 20, 277-320.
HIGGINS, E. T. 1987. Self-Discrepancy: A Theory Relating Self and Affect.
Psychological Review, 94, 319-340.
HOFSTEDE, G. 1980. Culture's consequences: International differences in work-
related values, Bevery Hills, CA, Sage.
HOFSTEDE, G. 2012. GEERT HOFSTEDE [Online]. Available: http://geert-
hofstede.com [Accessed 12 August 2014].
HOFSTEDE, G. H. 2001. Culture’s Consequences: Comparing Values, Behaviors,
Institutions, and Organizations Across Nations., Thousand Oaks, CA, Sage
Publications.
HOGG, M. K., COX, A. J. & KEELING, K. 2000. The impact of self-monitoring
on image congruence and product/brand evaluation. European Journal of
Marketing, 34, 641-666.
HOLLAND, R. W., ROEDER, U. R., VAN BAAREN, R. B., BRANDT, A. C. &
HANNOVER, B. 2004. Don‘t stand so close to me: The effects of self–
construal on interpersonal closeness. Psychological Science, 15, 237–242.
HOLLENBECK, C. R. & KAIKATI, A. M. 2012. Consumers' use of brands to
reflect their actual and ideal selves on Facebook. International Journal of
Research in Marketing, 29, 395-405.
HOLLINGER, D. A. 1995. Postethnic America: Beyond Multiculturalism, New
York, Basic Books.
HOMBURG, C., KLARMANN, M. & SCHMITT, J. 2010. Brand awareness in
business markets: When is it related to firm performance? International
Journal of Research in Marketing, 27, 201-212.
HONG, J. W. & ZINKHAN, G. M. 1995. Self-Concept and advertising
effectiveness: the influence of congruency, conspicuousness, and response
mode. Psychology & Marketing, 12, 53-77.

199
HORN, J. L. 1991. Comments on Issue in Factorial Invariance. In: COLLINS, L.
M. & HORN, J. L. (eds.) Best Methods for the Analysis of Change.
Washington D.C.: American Psychological Association.
HORN, J. L. & MCARDLE, J. J. 1992. A practical and theoretical guide to
measurement invariance in aging research. Experimental Aging Research,
105.
HOWARD, J. A. & SHETH, J. N. 1969. The theory of buyer behavior, New York,
Wiley.
HU, L.-T. & BENTLER, P. M. 1995. Evaluating model fit. In: H., H. R. (ed.)
Structural equation modeling: Concepts, issues, and application. Thousand
Oaks, California: Sage.
HUBER, F., VOLLHARDT, K., MATTHES, I. & VOGEL, J. 2010. Brand
misconduct: Consequences on consumer–brand relationships. Journal of
Business Research, 63, 1113-1120.
HULT, G. T. M., KETCHEN, D. J., JR, GRIFFITH, D., FINNEGAN, C. A.,
GONZALEZ-PADRON, T., HARMANCIOGLU, N., HUANG, Y., TALAY,
M. B. & CAVUSGIL, S. T. 2008. Data equivalence in cross-cultural
international business research: assessment and guidelines. Journal of
International Business Studies, 39, 1027-1044.
HUPFER, M. E. & DETLOR, B. 2006. Gender and Web information seeking: A
self-concept orientation model. Journal of the American Society for
Information Science and Technology, 57, 1105-1115.
HWANG, J. Y. & KANDAMPULLY, J. 2012. The role of emotional aspects in
younger consumer-brand relationships. Journal of Product & Brand
Management, 21, 98-108.
IBRAHIM, H. & NAJJAR, F. 2008. Assessing the effects of self-congruity,
attitudes and customer satisfaction on customer behavioural intentions in
retail environment. Marketing Intelligence & Planning, 26, 207-227.
INTERBRAND. 2012. Best Global Brands [Online]. Available:
http://www.interbrand.com/de/best-global-brands/Best-Global-Brands-
2011.aspx [Accessed April 10th 2013].
IPEIROTIS, P. 2010. Demographics of Mechanical Turk. New York University.
ISAKSEN, K. J. & ROPER, S. 2008. The impact of branding on low-income
adolescents: A vicious cycle? Psychology and Marketing, 25, 1063-1087.

200
JAIN, S. P., DESAI, K. K. & MAO, H. 2007. The influence of chronic and
situational self-construal on categorization. Journal of Consumer Research,
34, 66-76.
JAMAL, A. & AL-MARRI, M. 2007. Exploring the effect of self-image congruence
and brand preference on satisfaction: the role of expertise. Journal of
Marketing Management, 23, 613-629.
JAMES, H. S. J. 2006. Self-Selection Bias in Business Ethics Research. Business
Ethics Quarterly, 16, 559-577.
JAMES, W. 1890. The Principles of Psychology, New York, Henry Folt and
Company.
JENSEN, L. 2011. Navigating Local and Global Worlds: Opportunities and Risks
for Adolescent Cultural Identity Development. Psychological Studies, 56,
62-70.
JENSEN, L. A., ARNETT, J. J. & MCKENZIE, J. 2011. Globalization and Cultural
Identity
Handbook of Identity Theory and Research. In: SCHWARTZ, S. J., LUYCKX, K.
& VIGNOLES, V. L. (eds.). Springer New York.
JI, L.-J., ZHANG, Z. & NISBETT, R. E. 2004. Is It Culture or Is It Language?
Examination of Language Effects in Cross-Cultural Research on
Categorization. . Journal of Personality and Social Psychology, 87, 57-65.
JOHAR, J. & SIRGY, M. 1991. Value-Expressive versus Utilitarian Advertising
Appeals: When and Why to Use Which Appeal. Journal of Advertising, 20,
23-33.
JOHNSON, P. & BUBOLTZ, W. 2000. Differentiation of Self and Psychological
Reactance. Contemporary Family Therapy, 22, 91-102.
JONAS, E., GRAUPMANN, V., KAYSER, D. N., ZANNA, M., TRAUT-
MATTAUSCH, E. & FREY, D. 2009. Culture, self, and the emergence of
reactance: Is there a ―universal‖ freedom? Journal of Experimental Social
Psychology, 45, 1068-1080.
JÖRESKOG, K. 1978. Structural analysis of covariance and correlation matrices.
Psychometrika, 43, 443-477.
JUNG, J. M. & KELLARIS, J. J. 2006. Responsiveness to authority appeals among
young French and American consumers. Journal of Business Research, 59,
735-744.

201
JUNG, J. M., POLYORAT, K. & KELLARIS, J. J. 2009. A cultural paradox in
authority-based advertising. International Marketing Review, 26, 601-632.
KANG, J., TANG, L., LEE, J. Y. & BOSSELMAN, R. H. 2011. Understanding
customer behavior in name-brand Korean coffee shops: The role of self-
congruity and functional congruity. International Journal of Hospitality
Management.
KASHIMA, Y., KOKUBO, T., KASHIMA, E. S., BOXALL, D., YAMAGUCHI, S.
& MACRAE, K. 2004. Culture and Self: Are There Within-Culture
Differences in Self Between Metropolitan Areas and Regional Cities?
Personality and Social Psychology Bulletin, 30, 816-823.
KENT, R. A. 1993. Marketing Research in Action, London, Routledge.
KENT, R. J. & ALLEN, C. T. 1994. Competiting interface in consumer memory
foradvertising: The role of brand familiarity. Journal of Marketing, 58, 97-
105.
KHAN, H. & BAMBER, D. 2007. ―Market Entry Using Country-of-Origin
Intelligence in an Emerging Market. Journal of Small Business and
Enterprise Development, 14, 22-35.
KHANNA, S., RATAN, A., DAVIS, J. & THIES, W. 2010. Evaluating and
improving the usability of Mechanical Turk for low-income workers in
India. Proceedings of the First ACM Symposium on Computing for
Development. London, United Kingdom.
KIM, H.-Y. 2005. The influence of self-construals on consumer decision making
styles - A study of young Korean college students. PhD, University of
Nebraska.
KIM, J.-H. & HYUN, Y. J. 2013. The importance of social and ideal social
dimensions in self-congruity research. Asian Journal of Social Psychology,
16, 39-49.
KIM, M. S., HUNTER, J. E., MIYAHARA, A., HORVATH, A. M., BRESNAHAN,
M. & YOON, H. J. 1996. Individual vs. culture-level dimensions of
individualism and collectivism: Effects on preferred conversational styles.
Communication Monographs, 63.
KIRKMAN, B. L., LOWE, K. B. & GIBSON, C. B. 2006. A quarter consequences
of "culture's consequences": a review of empirical research incorporating

202
hofstede's cultural values framework. Journal of International Business
Studies, 37, 285-320.
KIRMANI, A., SOOD, S. & BRIDGES, S. 1999. The Ownership Effect in
Consumer Responses to Brand Line Stretches. Journal of Marketing, 63, 88-
101.
KITAYAMA, S. & COHEN, D. 2007. Handbook of cultural psychology, New
York, Guilford Press.
KIVELA, J., REECE, J. & INBAKARAN, R. 1999. Consumer research in the
restaurant envi-ronment. Part 2: Research design and analytical methods.
International Journal of Contemporary Hospitality Management, 11, 269–
286.
KLINE, P. 1999. The handbook of psychological testing London, Routledge.
KONRATH, S., BUSHMAN, B. J. & GROVE, T. 2009. Seeing My World in a
Million Little Pieces: Narcissism, Self-Construal, and Cognitive-Perceptual
Style. Journal of Personality, 77, 1197-1228.
KOPALLE, P. K., LEHMANN, D. R. & FARLEY, J. U. 2010. Consumer
Expectations and Culture: The Effect of Belief in Karma in India. Journal of
Consumer Research, 37, 251-263.
KRESSMANN, F., SIRGY, M., HERRMANN, A., HUBER, F., HUBER, S. &
LEE, D. 2006. Direct and indirect effects of self-image congruence on brand
loyalty. Journal of Business Research, 59, 955-964.
KROSNICK, J. A. 1999. Survey Research. Annual Review of Psychology, 50, 537–
567.
KURASAWA, F. 2004. A Cosmopolitanism from Below: Alternative Globalization
and the Creation of a Solidarity without Bounds. European Journal of
Sociology / Archives Européennes de Sociologie, 45, 233-255.
KURMAN, J. 2001. Self-Enhancement: Is it Restricted to Individualistic Cultures?
Personality and Social Psychology Bulletin, 27, 1705-1716.
LEARY, M. R. 2007. Motivational and Emotional Aspects of the Self. Annual
Review of Psychology, 58, 317-344.
LEARY, M. R., HAUPT, A. L., STRAUSSER, K. S. & CHOKEL, J. T. 1998.
Calibrating the sociometer: The relationship between interpersonal
appraisals and the state self-esteem. Journal of Personality and Social
Psychology, 74, 1290-1299.

203
LECKY, P. 1945. Self-consistency; a theory of personality, Washington, DC, US,
Island Press.
LEE, K. & SHAVITT, S. 2006. The Use of Cues Depends on Goals: Store
Reputation Affects Product Judgments When Social Identity Goals Are
Salient. Journal of Consumer Psychology, 16, 260-271.
LEE, S., LEE, A. Y. & KERN, M. C. 2011. Viewing time through the lens of the
self: The fit effect of self-construal and temporal distance on task
perception. European Journal of Social Psychology, 41, 191-200.
LEWIS, G. J. & BATES, T. C. 2011. From left to right: How the personality system
allows basic traits to influence politics via characteristic moral adaptations.
British Journal of Psychology, 102, 546-558.
LINDELL, M. K. & WHITNEY, D. J. 2001. Accounting for Common Method
Variance in Cross-Sectional Research Designs. Journal of Applied
Psychology, 86, 114-121.
LINVILLE, P. W. & CARLSTON, D. E. 1994. Social cognition of the self. In:
DEVINE, P. G., HAMILTON, D. L. & OSTROM, T. M. (eds.) Social
cognition: Impact on social psychology. San Diego: Academic Press.
LITTLE, T. D., CUNNINGHAM, W. A., SHAHAR, G. & WIDAMAN, K. F. 2002.
To Parcel or Not to Parcel: Exploring the Question, Weighing the Merits.
Structural Equation Modeling: A Multidisciplinary Journal, 9, 151-173.
LIU, F., LI, J., MIZERSKI, D. & SOH, H. 2012a. Self-congruity, brand attitude,
and brand loyalty: a study on luxury brands. European Journal of
Marketing, Vol. 46, 922-937.
LIU, F., LI, J., MIZERSKI, D. & SOH, H. 2012b. Self-congruity, brand attitude,
and brand loyalty: a study on luxury brands. European Journal of
Marketing, Vol. 46 922-937.
LOCKE, K. D. & CHRISTENSEN, L. 2007. Re-construing the relational-
interdependent self-construal and its relationship with self-consistency.
Journal of Research in Personality, 41, 389-402.
LOHMÖLLER, J.-B. 1989a. Latent variable path modeling with partial least
squares., Heidelberg, Physica.
LOHMÖLLER, J.-B. 1989b. Latent variable path modeling with partial least
squares., Heidelberg, Physica.

204
MA, Z., YANG, Z. & MOURALI, M. 2013. Consumer Adoption of New Products:
Independent versus Interdependent Self-Perspectives. Journal of Marketing.
MACKENZIE, S. B. & PODSAKOFF, N. P. 2012. Common
MethodBiasinMarketing:Causes,Mechanisms,andProcedural Remedies.
Journal of Retailing, 88, 542–555.
MACKENZIE, S. B. & SPRENG, R. A. 1992. How Does Motivation Moderate the
Impact of Central and Peripheral Processing on Brand Attitudes and
Intentions? Journal of Consumer Research, 18, 519-529.
MALÄR, L., KROHMER, H., HOYER, W. D. & NYFFENEGGER, B. 2011.
Emotional Brand Attachment and Brand Personality: The Relative
Importance of the Actual and the Ideal Self. Journal of Marketing, 75, 35-
52.
MALHOTRA, N. K. 1999. Marketing Research: an Applied Orientation, Upper
Saddle River, New Jersey, Prentice Hall.
MALHOTRA, N. K. 2004. Marketing research: An applied orientation, New
Jersey, Pearson Education International.
MANDEL, N. 2003. Shifting selves and decision making: the effects of self-
construal priming on consumer risk-taking. Journal of Consumer Research,
30, 30-40.
MARKUS, H. 1977. Self-schemas and processing information about the self.
Journal of Personality and Social Psychology, 35, 63-78.
MARKUS, H. & NURIUS, P. 1986. Possible Selves. American Psychologist, 41,
954-969.
MARKUS, H. & WURF, E. 1987. The Dynamic Self-Concept: A Social
Psychological Perspective. Annual Review of Psychology, 38, 299-337.
MARKUS, H. R. & KITAYAMA, S. 1991. Culture and the self: Implications for
cognition, emotion, and motivation. Psychological Review, 98, 224-253.
MARSHALL, R., NA, W., STATE, G. & DEUSKAR, S. 2008. Endorsement
Theory: How Consumers Relate to Celebrity Models. Journal of Advertising
Research, 48, 564.
MARTINEZ, E., POLO, Y. & DE CHERNATONY, L. 2008. Effect of brand
extension strategies on brand image: A comparative study of the UK and
Spanish markets. International Marketing Review, 25, 107 - 137.
205
MASON, W. & SURI, S. 2012. Conducting behavioral research on Amazon‘s
Mechanical Turk. Behavior Research Methods, 44, 1-23.
MASSEY, D. S. 2008. New Faces in New Places: The Changing Geography of
American Immigration., New York, Russell Sage Foundation.
MAZODIER, M. & MERUNKA, D. 2011. Achieving brand loyalty through
sponsorship: the role of fit and self-congruity. Journal of the Academy of
Marketing Science, 1-14.
MEAD, G. H. 1934. Mind, Self, & Society: From the Standpoint of a Social
Behaviorist, Chicago, The University of Chicago Press.
MEHTA, A. 1999a. Using self-concept to assess advertising effectiveness. Journal
of Advertising Research, 39, 81-89.
MEHTA, A. 1999b. Using Self-Concept to Assess Advertising Effectiveness.
Journal of Advertising Research, 81-89.
MERZ, M. A., HE, Y. & ALDEN, D. L. 2008. A categorization approach to
analyzing the global consumer culture debate. International Marketing
Review, 25, 166-182.
MILLER, G. A. 1956. The magical number seven, plus or minus two: Some limits
on our capacity for processing information. Psychological Review, 63, 81-
97.
MISHRA, R. C. 1994. Individualist and collectivist orientations across generations.
In: KIM, U., TRIANDIS, H. C., KAGITCIBASI, C., CHOI, S.-C. & YOON,
G. (eds.) Individualism and collectivism: Theory, method, and applications.
Thousand Oaks, CA: Sage.
MO, T. & ROUX, E. 2009. Exploring Chinese consumer values and attitudes
towards luxury brand consumption. European Journal of Marketing, 38,
423-432.
MONGA, A. B. & ROEDDER JOHN, D. 2007. Cultural Differences in Brand
Extension Evaluation: The Influence of Analytic versus Holistic Thinking.
Journal of Consumer Research, 33, 529-536.
MRSI 2011. Socio-Economic Classification 2011: The New SEC System. Mumbai:
The Market Research Society of India & Media Research Users Council.
MULLEN, M. R. 1995. Diagnosing Measurement Equivalence in Cross-National
Research. Journal of International Business Studies, 26, 573-596.

206
MURRAY, J. B. 2002. The politics of consumption: A re-inquiry on Thompson and
Haytko's (1997)"Speaking of Fashion. Journal of Consumer Research, 29,
427-440.
MUTHÉN, B. & KAPLAN, D. 1985. A comparison of some methodologies for the
factor analysis of non-normal Likert variables. British Journal of
Mathematical and Statistical Psychology, 38, 171-189.
NETEMEYER, R. G., BURTON, S. & LICHTENSTEIN, D. R. 1995. Trait Aspects
of Vanity: Measurement and Relevance to Consumer Behavior. Journal of
Consumer Research, 21, 612-626
NG, S. & HOUSTON, M. J. 2006. Exemplars or beliefs? the impact of self-view on
the nature and relative influence of brand associations. Journal of Consumer
Research, 32, 519-529.
NIJSSEN, E. J. & DOUGLAS, S. P. 2011. Consumer World-Mindedness and
Attitudes Toward Product Positioning in Advertising: An Examination of
Global Versus Foreign Versus Local Positioning. Journal of International
Marketing, 19, 113-133.
NUNNALLY, J. C. & BERNSTEIN, I. H. 1994. Psychometric Theory, New York,
McGraw-Hill.
O'CASS, A. & CHOY, E. 2008. Chinese generation Y consumers' involvement in
fashion clothing. Journal of Product and Brand Management, 17, 341-352.
O'CASS, A. & GRACE, D. 2008. Understanding the role of retail store service in
light of self-image–store image congruence. Psychology and Marketing, 25,
521-537.
OBERSKI, D. 2008. Self-selection bias versus nonresponse bias in the Perceptions
of Mobility survey: a comparison using multiple imputation. Voorburg.
OPPENHEIMER, D. M., MEYVIS, T. & DAVIDENKO, N. 2009. Instructional
Manipulation Checks: Detecting Satisficing to Increase Statistical Power.
Journal of Experimental Social Psychology, 45, 867-872.
ORTH, U. R., MALKEWITZ, K. & BEE, C. 2010. Gender and personality drivers
of consumer mixed emotional response to advertising. Journal of Current
Issues and Research in Advertising, 32, 69-80.
OSSEWAARDE, M. 2007. Cosmopolitanism and the Society of Strangers. Current
Sociology, 55, 367-388.

207
OYSERMAN, D. 2006. High Power, Low Power, and Equality: Culture Beyond
Individualism and Collectivism. Journal of Consumer Psychology, 16, 352–
356.
OYSERMAN, D., COON, H. M. & KEMMELMEIER, M. 2002. Rethinking
individualism and collectivism: Evaluation of theoretical assumptions and
meta-analyses. Psychological Bulletin, 128, 3-72.
PAOLACCI, G., CHANDLER, J. & IPEIROTIS, P. G. 2010. Running experiments
on Amazon Mechanical Turk. Judgement and Decision Making, 5, 411-419.
PARASURAMAN, A., GREWAL, D. & KRISHNAN, R. 2007. Marketing
research, NY, Houghton Mifflin Company.
PARK, C. W., JAWORSKI, B. J. & MACINNIS, D. J. 1986. Strategic brand
concept-image management. Journal of Marketing, 50, 135-45.
PARK, C. W., MACINNIS, D. J., PRIESTER, J., EISINGERICH, A. B. &
IACOBUCCI, D. 2010. Brand Attachment and Brand Attitude Strength:
Conceptual and Empirical Differentiation of Two Critical Brand Equity
Drivers. Journal of Marketing, 74, 1-17.
PARKER, B. T. 2009. A comparison of brand personality and brand user-imagery
congruence. Journal of Consumer Marketing, 26, 175-184.
PARKER, R. S., HERMANS, C. M. & SCHAEFER, A. D. 2008. Teens' attitudes
towards clothing brands in general: a cross-cultural exploration. Journal of
International Business and Economics, 8.
PICK, D. & DAYARAM, K. 2006. Globalisation, reflexive modernisation, and
development: the case of India. Society and Business Review, 1, 171-183.
PODSAKOFF, P. M., MACKENZIE, S. B., LEE, J.-Y. & PODSAKOFF, N. P.
2003. Common Method Biases in Behavioral Research: A Critical Review of
the Literature and Recommended Remedies. Journal of Applied Psychology,
88, 879-903.
PÖHLMANN, C., CARRANZA, E., HANNOVER, B. & IYENGAR, S. S. 2007.
Repercussions of Self–Construal for Self–Relevant and Other–Relevant
Choice. Social Cognition, 25, 284-305.
POLYORAT, K. & ALDEN, D. 2005a. Self-construal and need-for-cognition
effects on brand attitudes and purchase intentions in response to comparative
advertising in Thailand and the United States. Journal of Advertising, 34,
37-48.

208
POLYORAT, K. & ALDEN, D. L. 2005b. Self-construal and need-for-cognition
effects on brand attitudes and purchase intentions in response to comparative
advertising in Thailand and the United States. Journal of Advertising, 34,
37-48.
PRESTON, C. C. & COLMAN, A. M. 2000. Optimal number of response
categories in rating scales: Reliability, validity, discriminating power, and
respondent preferences. Acta Psychologica, 104, 1-15.
PUNCH, K. F. 1998. Introduction to Social Research: Quantitative and Qualitative
Approaches, London, Sage.
RALSTON, D. A., KAI-CHENG, Y., WANG, X., TERPSTRA, R. & WE, H. 1996.
The cosmopolitan Chinese manager: Findings of a study on managerial
values across the six regions of China. Journal of International
Management, 2, 79-109.
RASKIN, R., NOVACEK, J. & HOGAN, R. 1991a. Narcissistic self-esteem
management. Journal of Personality and Social Psychology, 60, 911-918.
RASKIN, R., NOVACEK, J. & HOGAN, R. 1991b. Narcissistic self-esteem
management. . Journal of Personality and Social Psychology, 60, 911-918.
REINARTZ, W., HAENLEIN, M. & HENSELER, J. 2009. An empirical
comparison of the efficacy of covariance-based and variance-based SEM.
International Journal of Research in Marketing, 26, 332-344.
REYNOLDS, N. & DIAMANTOPOULOS, A. 1998. The effect of pretest method
on error detection rates. European Journal of Marketing, 32, 480-498.
REYNOLDS, N. L., SIMINTIRAS, A. & DIAMANTOPOULOS, A. 2003. A
theoretical justification of sampling choices in international marketing
research: Key issues and guidelines for researchers. Journal of International
Business Studies, 34, 80-89.
RIEFLER, P. & DIAMANTOPOULOS, A. 2009. Consumer cosmopolitanism:
Review and replication of the CYMYC scale. Journal of Business Research,
62, 407-419.
RIEFLER, P., DIAMANTOPOULOS, A. & SIGUAW, J. A. 2012. Cosmopolitan
consumers as a target group for segmentation. Journal of International
Business Studies, 43, 285-305.

209
ROBERTSON, R. 1995. Glocalization: Time-space and Homogeneity-
heterogeneity. In: FEATHERSTONE, M., LASH, S. & ROBERTSON, R.
(eds.) Global Modernities. London: Sage.
ROBSON, C. 2002. Real world research: a resource for social scientists and
practitioner-researchers, Oxford, Blackwell Publishing.
ROSENBERG, M. 1979. Conceiving the self, New York, Basic Books.
ROSS, J., IRANI, L., SILBERMAN, M. S., ZALDIVAR, A. & TOMLINSON, B.
2010. Who are the crowdworkers?: shifting demographics in mechanical
turk. CHI '10 Extended Abstracts on Human Factors in Computing Systems.
Atlanta, Georgia, USA.
ROTH, M. S. 1995. The Effects of Culture and Socioeconomics on the Performance
of Global Brand Image Strategies. Journal of Marketing Research, 32, 163-
175.
RYU, S. & MOON, C. W. 2009. Long-Term Orientation As A Determinant Of
Relationship Quality Between Channel Members. International Business &
Economics Research Journal, 8, 1-10.
SAMIEE, S. & JEONG, I. 1994. Cross-cultural research in advertising: An
assessment of methodologies. Journal of the Academy of Marketing Science,
22, 205-217.
SANTIAGO, C. D., WADSWORTH, M. E. & STUMP, J. 2011. Socioeconomic
status, neighborhood disadvantage, and poverty-related stress: Prospective
effects on psychological syndromes among diverse low-income families.
Journal of Economic Psychology, 32, 218-230.
SARANKTOS, S. 1998. Social Research, London Machmillan.
SATTLER, H., VÖLCKNER, F., RIEDIGER, C. & RINGLE, C. M. 2010. The
impact of brand extension success drivers on brand extension price
premiums. International Journal of Research in Marketing, 27, 319-328.
SAVANI, K., MARKUS, H. R. & CONNER, A. L. 2008. Let your preference be
your guide? Preferences and choices are more tightly linked for North
Americans than for Indians. Journal of Personality and Social Psychology,
95, 861-876.
SEDIKIDES, C. & GREGG, A. P. 2008. Self-Enhancement: Food for Thought.
Perspectives on Psychological Science, 3, 102-116.

210
SEDIKIDES, C. & STRUBE, M. J. 1995a. The Multiply Motivated Self.
Personality and Social Psychology Bulletin, 21, 1330-1335.
SEDIKIDES, C. & STRUBE, M. J. 1995b. The Multiply Motivated Self.
Personality and Social Psychology Bulletin, 21, 1330–1335.
SEDIKIDES, C. & STRUBE, M. J. 1997. Self-Evaluation: To Thine Own Self Be
Good, To Thine Own Self Be Sure, To Thine Own Self Be True, and To
Thine Own Self be Better. In: MARK, P. Z. (ed.) Advances in Experimental
Social Psychology. Academic Press.
SEKARAN, U. 1983. Methodological and Theoretical Issues and Advancements in
Cross-Cultural Research. Journal of International Business Studies, 14, 61-
73.
SHAPIRO, D. N., CHANDLER, J. & MUELLER, P. A. 2013. Using Mechanical
Turk to Study Clinical Populations. Clinical Psychological Science, 1, 213-
220.
SHARMA, P. 2010. Measuring personal cultural orientations: scale development
and validation. Journal of the Academy of Marketing Science, 38, 787-806.
SHENG, S., ZHOU, K. Z. & LI, J. J. 2011. The Effects of Business and Political
Ties on Firm Performance: Evidence from China. Journal of Marketing, 75,
1-15.
SHUKLA, P. 2010. Status consumption in cross-national context: Socio-
psychological, brand and situational antecedents. International Marketing
Review, 27, 108-129.
SHUKLA, P. 2011. Impact of interpersonal influences, brand origin and brand
image on luxury purchase intentions: Measuring interfunctional interactions
and a cross-national comparison. Journal of World Business, 46, 242–252.
SIMSEK, Z., VEIGA, J. F. & LUBATKIN, M. H. 2007. The Impact of Managerial
Environmental Perceptions on Corporate Entrepreneurship: Towards
Understanding Discretionary Slack's Pivotal Role. Journal of Management
Studies, 44, 1398-1424.
SINGELIS, T. M. 1994. The measurement of independent and interdependent self -
construals. Personality and Social Psychology Bulletin, 2, 580-591.
SINGELIS, T. M. & SHARKEY, W. F. 1995. Culture, Self-Construal, and
Embarrassability. Journal of Cross-Cultural Psychology, 26, 622-644

211
SINHA, D. & TRIPATHI, R. C. 1994. Individualism in a collectivist culture: A
case of coexistence of opposites. In: KIM, U., TRIANDIS, H. C.,
KAGITCIBASI, C., CHOI, S.-C. & YOON, G. (eds.) Individualism and
collectivism: Theory, method, and applications. Thousand Oaks, CA:: Sage.
SIRGY, M. 1982. Self-Concept in Consumer Behavior: A Critical Review. Journal
of Consumer Research, 9, 287-300.
SIRGY, M. & JOHAR, J. 1999. Toward and Integrated Model of Self-Congruity
and Functional Congruity. European Advances in Consumer Research, 4,
252-256.
SIRGY, M., LEE, D., JOHAR, J. & TIDWELL, J. 2008. Effect of self-congruity
with sponsorship on brand loyalty. Journal of Business Research, 61, 1091-
1097.
SIRGY, M. & SU, C. 2000. Destination Image, Self-Congruity, and Travel
Behavior: Toward an Integrative Model. Journal of Travel Research, 38,
340-353.
SIRGY, M. J. 1985. Using self-congruity and ideal congruity to predict purchase
motivation. Journal of Business Research, 13, 195-206.
SIRGY, M. J., GREWAL, D., MANGELBURG, T. F., PARK, J. O., CHON, K. S.,
CLAIREBORN, C. B., JOHAR, J. S. & BERKMAN, H. 1997. Assesing the
predictive validity of two methods of measuring self image congruity.
Journal of the Academy of Marketing Science, 25, 229-241.
SIRGY, M. J., GREWAL, D. & MANGLEBURG, T. 2000. Retail environment,
self-congruity, and retail patronage: an integrative model and a research
agenda. Journal of Business Research, 49, 127-138.
SIRGY, M. J., JOHAR, J. S., SAMLI, A. C. & CLAIBORNE, C. B. 1991. Self-
Congruity: Predictors of Consumer Behavior. Journal of the Academy of
Marketing Science, 19, 363-375.
SPEARS, N. & SINGH, S. N. 2004. Measuring Attitude Toward the Brand and
Purchase Intentions. Journal of Current Issues & Research in Advertising,
26, 53-66.
SPROTT, D., CZELLAR, S. & SPANGENBERG, E. 2009. The importance of a
general measure of brand engagement on market behavior: development and
validation of a scale. Journal of Marketing Research, 46, 92-104.

212
STATISTICS, U. S. B. O. L. 2012. Labor force statistics from the Current
Population Survey [Online]. Available:
http://data.bls.gov/timeseries/LNS14000000 [Accessed 22nd December
2013].
STEENKAMP, J. B. E., BATRA, R. & ALDEN, D. L. 2003. How perceived brand
globalness creates brand value. Journal of International Business Studies,
33, 35-47.
STEENKAMP, J. E. M. & BAUMGARTNER, H. 1998. Assessing measurement
invariance in crossnational consumer research. Journal of Consumer
Research, 25, 78-90.
STEPHENS, N. M., MARKUS, H. R. & TOWNSEND, S. S. M. 2007. Choice as an
act of meaning: The case of social class. . Journal of Personality and Social
Psychology, 93, 814-830.
STINSON, D. A., LOGEL, C., HOLMES, J. G., WOOD, J. V., FOREST, A. L.,
GAUCHER, D., FITZSIMONS, G. M. & KATH, J. 2010. The regulatory
function of self-esteem: Testing the epistemic and acceptance signaling
systems. Journal of Personality and Social Psychology, 99, 993-1013.
STONE, M. 1974. Cross-validatory choice and assessment of statistical predictions.
Journal of the Royal Statistical Society, 36, 111-147.
STRIZHAKOVA, Y., COULTER, R. A. & PRICE, L. L. 2008. Branded Products as
a Passport to Global Citizenship: Perspectives from Developed and
Developing Countries. Journal of International Marketing, 16, 57-85.
STRYKER, S. 1981. Symbolic interactionism, Menlo Park, CA,
Benjamin/Cummings.
SUH, E. M. 2002. Culture, identity consistency, and subjective well-being. Journal
of Personality and Social Psychology, 83, 1378-1391.
SUNG, Y. & CHOI, S. M. 2012. The Influence of Self-Construal on Self-Brand
Congruity in the United States and Korea. Journal of Cross-Cultural
Psychology, 43, 151-166.
SWAMINATHAN, V., PAGE, K. L. & GÜRHAN-CANLI, Z. 2007. "My" brand or
"our" brand: the effects of brand relationship dimensions and self-construal
on brand evaluations. Journal of Consumer Research, 34, 248-259.

213
SWANN JR., W. B., RENTFROW, P. J. & GUINN, J. S. 2003. Self-Verification:
The Search for Coherence. In: LEARY, M. R. & TANGNEY, J. P. (eds.)
Handbook of Self and Identity. New York: Guilford Press.
SWANN, W. B., JR. 1983. Self-Verification: Bringing Social Reality into Harmony
with the Self. In: SULS, J. & GREENWALD, A. G. (eds.) Social
Psychological Perspectives on the Self. Hillsdale, NJ: Lawrence Erlbaum
Associates.
SWANN, W. B., STEIN-SEROUSSI, A. & GIESLER, R. B. 1992. Why people
self-verify. Journal of Personality and Social Psychology, 62, 392-401.
TABACHNICK, B. G. & FIDELL, L. S. 2007. Using Multivariate Statistics,
Boston, Pearson Education.
THOMPSON, C. J. & TAMBYAH, S. K. 1999a. Trying to be cosmopolitan.
Journal of Consumer Research, 26, 214-240.
THOMPSON, C. J. & TAMBYAH, S. K. 1999b. Trying to be Cosmopolitan.
Journal of Consumer Research, 26, 214-241.
THOMPSON, W. & HICKEY, J. 2005. Society in Focus, Boston. MA, Pearson,
Allyn & Bacon.
TORELLI, C. J. 2006. Individuality or Conformity? The effect of independent and
interdependen self-concepts on public judgments. Journal of Consumer
Psychology, 16, 240-248.
TRAFIMOW, D., TRIANDIS, H. C. & GOTO, S. G. 1991. Some Tests of the
Distinction Between the Private Self and the Collective Self. Journal of
Personality and Social Psychology, 60, 649-655.
TREIBLMAIER, H. & FILZMOSER, P. 2009. Benefits from using continuous
rating scales in online survey research. Technische Universitt Wien,
Forschungsbericht.
TRIANDIS, H. C. 1989. The self and social behavior in differing cultural contexts.
Psychological Review, 96, 506-520.
TRIANDIS, H. C. 2004. The Many Dimensions of Culture. The Academy of
Management Executive, 18, 88-93.
TRIANDIS, H. C., BONTEMPO, R., VILLAREAL, M. J., ASAI, M. & LUCCA, N.
1988. Individualism and collectivism: Cross-cultural perspectives on self-
ingroup relationships. Journal of Personality and Social Psychology, 54,
323-338.

214
TRIANDIS, H. C., LEUNG, K., VILLAREAL, M. J. & CLACK, F. I. 1985.
Allocentric versus idiocentric tendencies: Convergent and discriminant
validation. Journal of Research in Personality, 19, 395-415.
TSANG, K. K. 2012. The use of midpoint on Likert Scale: The implications for
educational research. Hong Kong Teachers’ Centre Journal, 11, 121-130.
TSIKRIKTSIS, N. 2005. A review of techniques for treating missing data in OM
survey research. Journal of Operations Management, 24, 53–62.
TU, L., KHARE, A. & ZHANG, Y. 2012. A short 8-item scale for measuring
consumers‘ local–global identity. International Journal of Research in
Marketing, 29, 35–42.
USAKLI, A. & BALOGLU, S. 2011. Brand personality of tourist destinations: An
application of self-congruity theory. Tourism Management, 32, 114-127.
VAN DE VIJVER, F. J. R. & LEUNG, K. 1997. Methods and data analysis of
comparative research. In: BERRY, J. W., POORTINGA, Y. H. & PANDEY,
J. (eds.) Handbook of Cross-Cultural Psychology, Vol 1: Theory and
Method. Boston: Allyn and Bacon.
VAN GELDER, M. M. H. J., BRETVELD, R. W. & ROELEVELD, N. 2010. Web-
based Questionnaires: The Future in Epidemiology? American Journal of
Epidemiology, 172, 1292-1298.
VANDENBERG, R. J. & LANCE, C. E. 2000. A review and synthesis of the
measurement invariance literature: suggestions, practices, and
recommendations for organizational research. Organizational Research
Methods, 3, 4-69.
VISWANATHAN, M. 2005. Measurement Error and Research Design, Thousand
Oaks, CA, Sage Publications.
WANG, J.-C. & LIN, J.-P. Year. Are Personalization Systems Really Personal? -
Effects of Conformity in Reducing Information Overload. In: R.R.
SPRAGUE, J., ed. the 36th Hawaii International Conference on Systems
Sciences (HICSS‘03), 0-7695-1874-5/03., 2003. Computer Society Press, 10
pages.
WEBB, J. R. 2002. Understanding and Designing Marketing Research, London,
The Dryden Press.

215
WEDEL, M. & KAMAKURA, A. W. 1999. Market Segmentation: Conceptual and
Methodological Foundations, Dordrecht, Netherlands. , Kluwer Academic
Publishing
WERTS, C. E., LINN, R. L. & JÖRESKOG, K. G. 1974. Intraclass Reliability
Estimates: Testing Structural Assumptions. Educational and Psychological
Measurement, 34, 25-33.
WESTJOHN, S. A., ARNOLD, M. J., MAGNUSSON, P., ZDRAVKOVIC, S. &
ZHOU, J. X. 2009. Technology readiness and usage: a global-identity
perspective. Journal of the Academy of Marketing Science, 37, 250-265.
WESTJOHN, S. A., SINGH, N. & MAGNUSSON, P. 2012. Responsiveness to
Global and Local Consumer Culture Positioning: A Personality and
Collective Identity Perspective. Journal of International Marketing, 20, 58-
73.
WILCOX, K., KIM, H. M. & SEN, S. 2009. Why Do Consumers Buy Counterfeit
Luxury Brands? Journal of Marketing Research, 46, 247-259.
WILKIE, J. E. B. & BODENHAUSEN, G. V. 2012. Are numbers gendered? .
Journal of Experimental Psychology: General, 141, 206-210.
WILSON, A. 2012. Marketing Research: An integrated approach, Essex, Pearson
Education.
WOLBURG, J. M. & POKRYWCZYNSKI, J. 2001. A Psychographic Analysis of
Generation Y. Journal of Advertising Research, 41, 33–53.
WU, D. Y. H. 1994. Self and collectivity: Socialization in Chinese preschools. In:
AMES, R. T., DISSANAYAKE, W. & KASULIS, T. P. (eds.) Self as person
in Asian theory and practice Albany: State University of New York.
WU, E. C., CUTRIGHT, K. M. & FITZSIMONS, G. J. 2011. How Asking 'Who
Am I?' Affects What Consumers Buy: The Influence of Self-Discovery on
Consumption. Journal of Marketing Research, 48, 296-307.
YAN, D. & MUTHUKRISHNAN, A. V. 2013. Killing Hope with Good Intentions:
The Effects of Consolation Prizes on Preference for Lottery Promotions.
Journal of Marketing Research.
YEĜENOĜLU, M. 2005. Cosmopolitanism and nationalism in a globalized world.
Ethnic and Racial Studies, 28, 103-131.

216
YIM, C., CHAN, K. & HUNG, K. 2007. Multiple reference effects in service
evaluations: Roles of alternative attractiveness and self-image congruity.
Journal of Retailing, 83, 147-157.
ZAFF, J. F., BLOUNT, R., PHILLIPS, L. & LINDSEY, C. 2002. The Role of
Ethnice Identity and Self-Construal of Coping among African American and
Caucasian American Seventh Graders: An Exploratory Analysis of Within-
Group Variance. Adolescence, 37, 751-773.
ZARANTONELLO, L. & SCHMITT, B. H. 2010. Using the brand experience scale
to profile consumers and predict consumer behaviour. Journal of Brand
Management, 17, 532-540.
ZHANG, J. 2009. The effect of advertising appeals in activating self-construals.
Journal of Advertising, 38, 63-81.
ZHANG, Y. & KHARE, A. 2009. The Impact of Accessible Identities on the
Evaluation of Global versus Local Products. Journal of Consumer Research,
36, 524-537.
ZIKMUND, W. G. 2003. Business Research Method Cincinnati, Ohio,
Thomson/South-Western.
ZINKHAN, G. M. & HONG, J. W. 1991. Self Concept and Advertising
Effectiveness: A Conceptual Model of Congruency Conspicuousness, and
Response Mode. In: HOLMAN, R. H. & SOLOMON, M. R. (eds.) Advances
in Consumer Research. Ann Arbor: Association for Consumer Research.

217
Appendices
Appendix 2.1 Examples of Interchangeable use of Self-
Concept Related Terms
In their article Yim, Chan and Hung (2007, p. 149) stated: ―Self-image (or self-
concept) may be defined as ―the totality of the individual‘s thoughts and
feelings having reference to himself as an object‖ (Rosenberg 1979, p. 7).‖
Gao et al. (2009, p.30) stated: ―Self-view confidence refers to the certainty that
one has in one's self-concept and in one's thoughts related to the self (DeMarree,
Petty, and Briñol 2007; Pelham 1991).‖
Barone & Roy (2010, p. 130) mentioned in their work: ―For example,
consumers in the United States tend to have independent self-views, while
those in other countries (e.g., Mediterranean nations) typically exhibit
interdependent self-construals (Oyserman, Coon, and Kemmelmeier 2002).‖
Wolburg and Pokrywczynsk (2001, p. 40) show a close link between self-
concept and self-image declaring: ―Perhaps one of the most important
findings for advertisers is that advertising appeals that are congruent with
viewers' self-concepts are superior to incongruent appeals. Mehta (1999)
reported that purchase intent was stronger for respondents whose self-image
and perceived brand image were congruent.‖
A further example found in Zhu and Meyers-Levy‘s article (2009, p. 38)
indicates the following: “Self-construal theory holds that people possess
multiple views about how the self relates to others and the environment
(Markus and Kitayama 1991). Furthermore, even if ones self-view is
chronically accessible, people can be induced to activate a different self-view
temporarily (Singelis 1994).‖
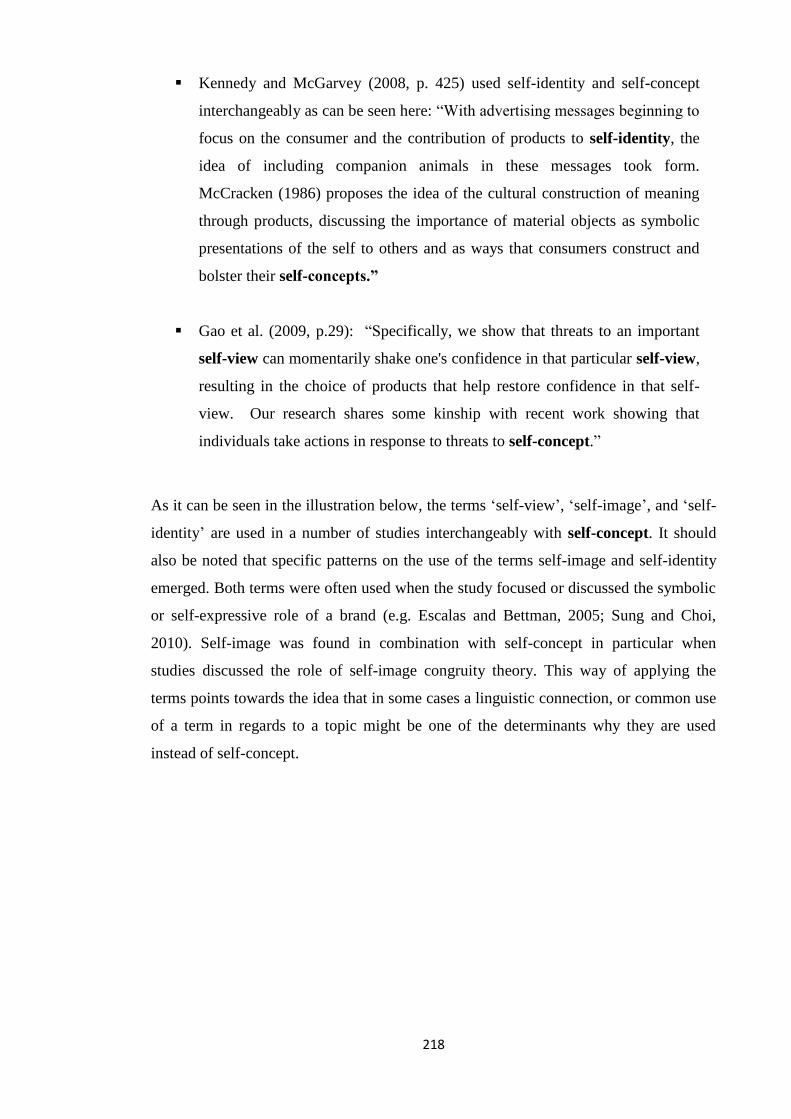
218
Kennedy and McGarvey (2008, p. 425) used self-identity and self-concept
interchangeably as can be seen here: ―With advertising messages beginning to
focus on the consumer and the contribution of products to self-identity, the
idea of including companion animals in these messages took form.
McCracken (1986) proposes the idea of the cultural construction of meaning
through products, discussing the importance of material objects as symbolic
presentations of the self to others and as ways that consumers construct and
bolster their self-concepts.”
Gao et al. (2009, p.29): ―Specifically, we show that threats to an important
self-view can momentarily shake one's confidence in that particular self-view,
resulting in the choice of products that help restore confidence in that self-
view. Our research shares some kinship with recent work showing that
individuals take actions in response to threats to self-concept.‖
As it can be seen in the illustration below, the terms ‗self-view‘, ‗self-image‘, and ‗self-
identity‘ are used in a number of studies interchangeably with self-concept. It should
also be noted that specific patterns on the use of the terms self-image and self-identity
emerged. Both terms were often used when the study focused or discussed the symbolic
or self-expressive role of a brand (e.g. Escalas and Bettman, 2005; Sung and Choi,
2010). Self-image was found in combination with self-concept in particular when
studies discussed the role of self-image congruity theory. This way of applying the
terms points towards the idea that in some cases a linguistic connection, or common use
of a term in regards to a topic might be one of the determinants why they are used
instead of self-concept.

219
Figure A2.1 Interchangeable Self-Concept Terms
Self-
concept
Self-image (b)
Self-identity (a)Self-view
Use of Terminology in Branding Studies with a Self-Concept Focus
a. often used in studies that discuss the symbolic function of brands
b. often used in combination with self-congruity studies, or
the symbolic function of brands
Used interchangeably
6,12,7,13,8
9,14,4,15,16,17,1
8,19,20,21,22
6,7,8,9
1,2,3,4 5,6,7,8,9,10
,4,11
Studies used as the basis for this evaluation:
1. Sprott et al. (2009)
2. NG and Houston (2006)
3. Gao et al. (2009)
4. Sung and Choi (2012)
5. Swaminathan et al. (2007)
6. Escalas and Bettman (2005)
7. Escalas (2004)
8. Isaksen and Roper (2008)
9. Kressmann et al. (2006)
10. Wolburg and Pokrywczynski (2001)
11. Orth et al. (2010)
12. Nguyen-Chaplin and Roedder-John (2005)
13. Bjerke and Polegato (2006)
14. Sirgy et al. (2008)
15. Marshall et al. (2008)
16. Sirgy et al. (1997)
17. Usakli and Baloglu (2011)
18. Hong and Zinkhan (1995)
19. Hogg et al. (2000)
20. Heath and Scott (1998)
21. O‘Cass and Grace (2008)
22. Mehta (1999)
Sources: Bjerke and Polegato (2006), Escalas (2004), Escalas and Bettman (2005), Gao
(2009), Heath and Scott (1998), Hogg et al. (2000), Hong and Zinkhan (1995), Isaksen
and Roper (2008), Kressmann et al. (2006), Ng and Houston (2006), Marshall et al.
(2008), Metha (1999), Nguyen-Chaplin and Roedder-John (2005), O‘Cass and Grace
(2008), Orth et al. (2010), Sirgy et al. (1997), Sirgy et al. (2008), Sprott et al. (2009),
Sung and Choi (2012), Swaninathan et al. (2007), Usakli and Baloglu (2011), and
Wolburg and Pokrywczynski (2001).

220
Appendix 2.2 Self-Concept Definitions used in the Literature
Table A2.2 Self-Concept Definitions
Author, Date Self-concept descriptions Cooley (1964) The self is the ability of the person to see himself or herself
through the reactions of others, and others to appraise and react to
the person as an object like other persons.
Epstein (1973) The self-concept is defined as the vehicle by which people construe
themselves and their experiences
Frey and Carlock (1982) The self-concept is defined as the individual‘s attitudes toward self.
Hattie (1992)
The self-concept is a person‘s cognitive appraisals of attributes
about him or herself.
James (1890) The self is defined as an object of self-perception and self-
knowledge. An individual‘s self is the total sum of all that he or
she can tell about him or her. It includes the interaction of one‘s
thoughts, feelings, perceptions, and aspirations critical in the
formation of the self-concept
Mead (1934) The self-concept is acquired through social interaction with
significant others and peers in which they take on the attitude of
these others toward them.
Metha (1999) The self-concept as a person‘s perception of himself.
Rosenberg (1979) The self-concept is ―the totality of the individual‘s thoughts and
feelings having reference to himself as an object‖ (p.7)

221
Appendix 2.3 Systematic Literature Review Top Journal List
Table A2.3 Journal Rankings
Marketing Journals (Hult et al., 1997)
Journal of Marketing
Journal of Marketing Research
Journal of Consumer Research
Journal of Retailing
Journal of the Academy of Marketing
Science
Marketing Science
Harvard Business Review
Journal of Business Research
International Business- and
International Marketing Journals
(DuBois and Reeb, 2000)
International Marketing Review
Journal of International Business Studies
Journal of World Business
Journal of International Marketing
Management International Review
Advertising Journals (Henthorne et al.,
1998; Royne Stafford, 2005
Journal of Advertising
Journal of Advertising Research
Journal of Current Issues & Research in
Advertising
International Journal of Advertising
Additional Journals
In addition it was decided to include two marketing related psychology journals that
were also mentioned in Hult et al.‘s (1997) list and were cited frequently in articles
relating to the self-concept and marketing in the previously mentioned journals. These
were Psychology & Marketing and the Journal of Consumer Psychology.

222
Appendix 2.4 Self-Construal Studies (SC)
Ref Author, Date,
Journal
Main Findings Focus Self-
construal/INDCOL
relationship
Focus on chronic or salient cultural self-
construal & notes
1SC Melnyk et al. (2009),
Journal of Marketing
Women were more loyal to individual employees (relational) than men, while men
(collective) were more loyal than women to companies. This effect is mediated by
self-construal in terms of relational versus collective interdependence.
Relational vs. collective
loyalty. Focus only on the
INTSC and two versions of
it. The relational and the
collective.
No findings. Chronic self-construal.
2SC Chang (2006), Journal
of Advertising
Research
Participants from the United States, considered to be a predominantly "masculine"
culture, liked the utilitarian appeal advertisement better and rated it more believable
than the image appeal advertisement. Taiwanese, considered a predominantly
"androgynous" culture, responded equally well to both advertising appeal types.
Advertising appeals
response. The role of self-
construal (masculinity vs.
femininity).
No findings. Chronic gender self-construal
3SC Barone and Roy
(2010), Journal of
Marketing
Exclusive deals are favoured over inclusive offers (St. 1). This is particularly
pronounced for those adopting independent self-construal (St. 2).
The effect of INDSC &
INTSC on exclusive and
inclusive sales promotions.
No findings Chronic and salient self-construal. Those with a chronic
INDSC showed an even stronger effect in the primed INDSC
scenario, indicating that the chronic INDSC s might have an
enhancing effect. Hence, showing the importance of
considering the chronic self-construal.
4SC BOLTON et al. (2010),
Journal of Marketing
St1: Collectivists are oriented toward relationships and therefore are more sensitive
to price comparisons that evoke self-relevant in-groups. Individualists were
relatively insensitive to the in-group/out-group distinction. St.2: The effects of self-
construal were consistent with the INDCOL results on price fairness.
The role of INDSC &
INTSC in perceived price
fairness and repurchase
intention.
Self-construal = INDCOL
(US vs. China) findings.
Chronic and salient self-construal. However, only primed
within the US. Chronic measured in US and China. Note:
INDSC were not sig. different between US and China.
5SC Ahluwalia (2008),
Journal of Marketing
Research
St1: High INTSC leads to a superior ability to uncover relationships among stimuli
(e.g. an extension and its parent brand), thus more likely to enhance the perceived fit
of an extension and the likelihood of its acceptance than low INTSC. However,
these effects are likely to emerge only under conditions in which the INTSC
consumer is motivated to elaborate extensively on the extension information.
St2:primed INDSC and INTSC confirms st1. results.
The role of INDSC &
INTSC on the stretchability
of a brand. (Brand
extension)
No findings St1. Chronic INTSC (high vs. low). St2. Primed INDSC and
INTSC. Limitation: Focus only on low INTSC vs. high
INTSC. Low INTSC does not equal INDSC, but wasn‘t pointed
out. St2. confirms the effects tested, and therefore equates
INDSC with low interdependent. Conceptually flawed?
6SC Polyorat and Alden
(2005), Journal of
Advertising
INDSC exerts a stronger moderating effect than INTSC in both countries of
comparative vs. non comparative ads on BA and PI. The effect is observed for
consumers with low but not high need for cognition. Results in Thailand and US
matched closely.
The role of INDSC &
INTSC on purchase
intentions and brand
attitudes in response to
comparative advertising.
INDCOL not measured.
However, evidence that self-
construal differences exist within
both countries, hence implying
that
Self-construal ≠ INDCOL
assumption when not measured.
Chronic self-construal. Two countries. Individual-level analysis
within both countries.
7SC Mandel (2003), Journal
of Consumer Research
Individuals whose INTSC were activated were more risk-seeking in their financial
choices and less risk-seeking in their social choices than were those whose INDSC
were activated. The size of the consumer's social network mediated these effects.
The effect of INDSC &
INTSC on risk taking.
No findings. Salient self-construal (USA). In the limitations section
arguments to consider the orthogonal structure of self-construal
are raised for future studies.
8SC Zhang (2009), Journal
of Advertising
Chinese GEN X consumers showed a shift in self-construal towards INTSC
(INTSC) in response to individualistic (collectivistic) advertisements. This self-
shifting effect emerged only among bi-culturals, but was reverse of what is expected
(COL ad –> INDSC). Age moderates the degree to which peoples INDSC or
INTSC are activated. Young Chinese are more prone to shift as they are more bi-
cultural than older Chinese. However, not all GENX are bi-cultural, some are mono-
cultural and for those the effects were not evident.
How advertising appeals can
activate INTSC or INTSC
when comparing young and
old Chinese consumers.
Among bi-culturals findings
indicate Self-construal ≠
INDCOL
Indirect priming of salient self-construal (consequent variable).
US respondents used as a reference point, but differences
between young and old US consumers were not found. Bi-
cultural phenomenon more evident in China.
9SC Agrawal and
Maheswaran (2005),
Journal of Consumer
Research
Brand commitment moderates the effectiveness of appeals consistent with the
consumers' chronic and salient self-construal in the US and Nepal. Under low
commitment, evaluations were influenced by the primed self-construal. However,
under high commitment the collectivist (vs. individualist) appeal consistent with
chronic INTSC (INDSC) was evaluated more favourably regardless of the prime.
How salient and chronic
self-construal moderated by
brand commitment can
influence brand attitudes.
Assumes INDCOL/self-construal
link
Self-construal = INDCOL
Salient and chronic self-construal is assumed due to country
(US=INDSC; Nepal=INTSC) measured with Singelis scale. The
chronic self-construal overrides the primed effect.

223
Ref Author, Date,
Journal
Main Findings Focus Self-
construal/INDCOL
relationship
Focus on chronic or salient cultural self-
construal & notes
10SC Krishna et al. (2008),
Journal of Consumer
Research
Americans demonstrate greater bias in spatial perception tasks involving numerosity
judgments than Chinese that process context related information better and are less
biased. Self-construal, when manipulated through unrelated priming tasks, can
affect spatial judgment in the same manner as inherent self-construal does in both
countries (US and HK).
The effect of INDSC &
INTSC on spatial
judgement.
Assumes chronic self-construal
based on country culture. No
INDCOL mentioned.
China= INTSC
US= INDSC
Salient and chronic self-construal.
Limitation: self-construal orientation was assumed based on
country (China vs. US), but not measured. Priming done within
two countries.
11SC Choi and Miracle
(2004), Journal of
Advertising
National culture influences the effectiveness of comparative advertising, but also
self-construal have mediating effects on attitudes toward the advertisement for both,
indirect comparative advertising and non-comparative advertising. Self-construal
mediates the influence of national culture on advertising effectiveness. Self-
construal is more crucial than national culture for predicting these attitudes.
“Advertising messages may often need to be fine-tuned to target consumers with
independent or interdependent self-construal.. Even within a country with a
collectivistic culture, if a product is targeted to an audience with independent self-
construal, the results of the present study indicate that comparative advertising can
be an effective message strategy.”
The mediating effect of
INDSC & INTSC on the
effectiveness of comparative
advertising.
Self-construal = INDCOL
INDCOL assumed based on
country, Vague evidence, due to
limited data provided in the
study.
Chronic self-construal
The analysis showed a link between INDCOL and self-
construal. Higher INTSC in Korea and higher INDSC in US.
Limitation: Did not provide the orthogonal view of self-
construal or data breaking it down into all self-construal
categories (e.g. High INTSC, Low INTSC, High INDSC, Low
INDSC).
12SC Jain et al. (2007),
Journal of Consumer
Research
Collectivists judged paired products as less similar than individualists did, but only
at the higher level of a category hierarchy (studies 1 and 2). Further, collectivists
were more context driven in product ratings in a categorization task (study 3). Study
4 focused on high-level pairs and found that under high involvement, chronic self-
construal dominated judgments, while under low involvement chronic and salient
self-construal interacted.
How chronic and situational
self-construal (independent
& interdependent) influence
product categorization.
Verbally equates self-construal
with INDCOL.
Chronic and salient: Ethnicity within the US used for chronic
self-construal. Limitation: ethnicity used as proxy, but self-
construal not measured.
Equates verbally INDCOL with self-construal. But talks about
self-construal in the conceptual part of the study.
13SC Swaminathan et al.
(2007), Journal of
Consumer Research
Under a primed INDSC self-concept connection is more important, while under
primed INTSC, brand country-of-origin connection is more important. In summary,
the impact of self-concept connection varies based on self-construal using
Fournier‘s (1998) self-concept connection scale. Also, when self-concept
connection is high, consumers tend to discount and counter argue negative
information, but this effect is greater in INDSC conditions.
The impact of self construal
on self-concept connection
and brand country of origin
connection.
No findings. Salient self-construal
14SC Edson-Escalas and
Bettman (2005),
Journal of Consumer
Research
Brands with images consistent with an in-group enhance self-brand connections for
all consumers, whereas brands with images that are consistent with an out-group
have a stronger negative effect on INDSC versus INTSC consumers because INTSC
care more about the in-group than out-group. It is proposed that this differential
effect is due to stronger self-differentiation goals for consumers with a more
pronounced INDSC. Greater effects are found for more symbolic than for less
symbolic brands.
The role of INDSC &
INTSC on the reference
groups effect on self-brand
connection.
No direct findings.
Limitations section points
towards a discrepancy with
INDCOL findings from previous
studies.
Self-construal ≠ INDCOL
Chronic self-construal.
Study 1 assumes self-construal based on ethnicity within US,
but used four of Singelis (1994) scale items to verify it.
Conservative measure, as white were sig. more INDSC, but
Asian and Hispanics not sig. more INTSC. Study 2 uses the full
Singelis scale among general student population not focusing on
ethnicity and constructs self-construal categories.
15SC Chang and Li (2010),
Journal of Advertising
TW showed more warm feelings, stronger self-brand connection and more
favourable attitudes towards the ad and the brand, following exposure to the
childlike- than adult portrayal. On the other hand, American participants did not
show differences in their responses to the two portrayals. It is suggested that they
found the childlike image to be less relevant to their IND self-concept.
The role of culturally shaped
self-concept (INDSC &
INTSC) on responses to ads
featuring children or adults
(TW vs. USA)
Self-construal = INDCOL
However, measurement was
vague and likely to be
conceptually flawed.
Chronic self-construal
Assumption based on country (Taiwan vs. US). Measured self-
construal, but only provided score for INTSC, which was higher
in TW. INDSC score not shown, which is indicative that they
maybe assumed bi-polar view of self-construal, which is likely
to be flawed.
16SC Hamilton and Biehal
(2005), Journal of
Consumer Research
Consumers with an INTSC (INDSC) focused on prevention (promotion) oriented
product benefits and those with an INTSC, who are more interested in avoiding
losses than in achieving gains, select less risky alternatives than those with an
INDSC. However, information about previous choices (status quo alternatives)
moderates the goal-mediated effect of self-view on choice.
The effect of an INDSC &
INTSC on investment goals
and choices
No findings. Salient self-construal focus. However, first measured chronic
self to establish that there were no clear differences. Then self-
construal primes were performed. Unique approach to make
sure the effects is due to the primes and not the underlying
chronic self-construal.

224
Ref Author, Date,
Journal
Main Findings Focus Self-
construal/INDCOL
relationship
Focus on chronic or salient cultural self-
construal & notes
17SC NG and Houston
(2006), Journal of
Consumer Research
As those with INDSC focus on the ―traitedness‖ of behaviour and attributes of
objects, brand beliefs are relatively more accessible than exemplars to them. On the
contrary, as those with an INTSC emphasize the role of contextual factors and the
interrelatedness of events, exemplars (e.g. Sony TV) are relatively more accessible
to them than brand beliefs (e.g. Sony is good). In the case of subcategory exemplars
a greater influence on brand attitudes is found among those with an INTSC.
The impact of INTSC &
INDSC on brand-
associations, attitude, and
extensions
Self-construal = INDCOL
Chronic and salient self-construal
Chronic Assumption based on country, but not measured.
Limitation: Singapore is arguably not COL. However, primed
results confirmed those of the chronic scenario.
18SC Aaker and Lee (2001),
Journal of Consumer
Research
Individuals with an accessible INDSC are more persuaded by promotion-focused
information that is consistent with an approach goal, while those with an INTSC are
more persuaded by prevention focused information that is consistent with an
avoidance goal. These have also an effect on BA. Results were confirmed for the
chronic and primed self-construal. However, the primed self-construal was decisive
in both countries. Self-construal was a stronger predictor than country culture
(INDCOL).
The role of INTSC &
INDSC on persuasion
considering prevention and
promotion focused goals
Self-construal ≠ INDCOL
Chronic and salient self-construal. For chronic, HK and US
used as culture proxy, but also measured with Singelis (1994)
scale. US higher INDSC than INTSC. Chinese, both equal.
Limitation: Surprisingly, US INTSC was higher than Chinese
INTSC. They justified this saying they focused on the self-
construal that was more accessible for the individual within
each country itself. Therefore, it is possible that the prime did
not really override the chronic for Chinese, as they seemed bi-
cultural.
19SC Chang (2010), Psychology &
Marketing
Ad effectiveness and BA was enhanced by larger product assortment only when the
INDSC was primed and by the presence of consensus information only when the
INTSC was primed. The effects were robust across product types (private vs.
public)
How primed INTSC &
INDSC affect advertising
effectiveness.
No findings Salient self-construal. Limitation pointed out in study: ―This
study assessed situationally primed interdependence, but
baseline (chronic) interdependence might also have influenced
the results.” In TW, the chronic self-construal might be more
INT., hence, the chronic might have an overriding effect.
20SC Torelli (2006), Journal
of Consumer
Psychology
Respondents relied on others‘ beliefs only when their INTSC was primed and they
expected they might need to explain their judgments to others. When an INDSC was
primed, expectations to communicate judgments had no effect. Culture-based
differences in INDCOL had no impact on these effects.
The effect of INTSC &
INDSC on public
judgements.
Self-construal ≠ INDCOL
But INDCOL not measured.
Salient and chronic self-construal. Chronic assumption based
on ethnicity in the US, but was not measured. Limitation
pointed out: ―Although country of origin has traditionally been
used as a proxy for cultural orientation (i.e., Aaker & Lee,
2001), a more stable measure of chronic accessibility of self-
concepts might have been more appropriate for this purpose“
21SC Lee and Shavitt (2006),
Journal of Consumer
Psychology
Store reputation had an effect on product judgments when either a consumers‘
social-image goals are directly heightened or an INTSC, characterized by a greater
concern with social identity, is salient. For symbolic products both self-construal did
not show significant differences.
The role of INTSC &
INDSC of store reputations
impact on product
judgements
No findings Primed self-construal focus
22SC Aaker and Schmitt
(2001), Journal of
Cross-Cultural
Psychology
Individuals with a chronic INDSC hold attitudes that allow them to express that they
are distinct from others, while those with an INTSC are more likely to hold attitudes
that demonstrate points of similarity with their peers. Even though there was a
relationship between national culture and self-construal, culture was not a
significant predictor, but self-construal was a significant predictor of brand attitudes
and preferences. The nature of the self-construal mediates the relationship between
culture-based values and expressed preferences.
The impact of INTSC &
INTSC on self-expression
and brand attitudes.
Not clear. Do not focus
exclusively on INDCOL and use
―culture‖ as overarching term.
However, make hints towards
INDCOL attributes.
Chronic self-construal
Use country (St1: US vs. China) and ethnicity (inside US) as
proxy for chronic self-construal, but use 4 Singelis measures to
confirm it. They point out that self-construal is not bi-polar, but
don‘t consider this in their research. Note: Interesting measure
of self-construal.
.
23SC Sung and Choi (2012),
Journal of Cross-
Cultural Psychology
The self-congruity effect on BA is confirmed for the Korean and US sample.
However, the effect is stronger for US respondents. It is argued that self-construal
moderates this effect. Note: However, it could be argued that other country level
cultural factors impact the effect.
The Influence of Self-
construal on the Self-brand
congruity effect on BA in
the United States and Korea.
Self-construal = INDCOL
They are linked in the study, but
the data is just partially
supportive.
Chronic self-construal.
Use country as proxy for chronic self-construal (US vs. Korea)
and measure it with Singelis (1994) scale.
INDSC difference significant between countries, but INTSC not
significant.

225
Ref Author, Date,
Journal
Main Findings Focus Self-
construal/INDCOL
relationship
Focus on chronic or salient cultural self-
construal & notes
24SC Kim et al. (2013),
Asian Journal of Social
Psychology
Social and ideal social self-congruity effects on PI are stronger than the actual and
ideal self-congruity effects for individuals with a dominant interdependent self-
construal. Actual and ideal self-congruity have a stronger effect on PI than social
and ideal social when an INDSC is primed. Social and ideal social self-congruity
has a stronger effect on PI than actual and ideal self-congruity when an INTSC is
primed. However, while the results inare in the hypothesized direction in the primed
scenarios the differences are not all statistically significant.
The effects of public selves
(social and ideal social) on
PI.
Self-construal=INDCOL Chronic self-construal and primed self-construal. Study
conducted only in one collectivist country (South Korea).
24IN
D
Litvin and Goh (2003),
Journal of Vacation
Marketing
Actual and ideal self-congruity had a stronger positive effect of satisfaction with
Singapore as a destination for IND tourist than COL. In particular for IND, the
positive effect on satisfaction as the result of ideal self-congruity was more
prominent than for COL tourists.
The effect of INDCOL
between self-congruity on
travel destination
satisfaction.
No self-construal data Split the sample into INDCOL based on top 30% and lowest 30
%. Assume bi-polar structure. No measures taken, only
assumed by country affiliations.
25IN
D
Quester et al. (2000),
Journal of Consumer
Marketing
In contrast to the H‘s, AUS showed functional products matching their ideal self and
status products matching their actual self. Malay showed the opposite, with
functional products matching their actual self and status products matching their
ideal self more strongly.
The effect of culture on how
actual and ideal self-
congruity impacts product
evaluations (functional vs.
status)
No self-construal data This study makes country assumptions based on Hofstede‘s
dimensions, but outlines more than INDCOL. They do not show
BA or PI. They just show that perception of different product
types varies by culture in the way those consumers see those
products matching their ideal or actual self. Based on previous
literature they say that it might affect PI.

226
Appendix 2.5 Self-Congruity Studies (Con)
Ref Author, Date,
Journal
Main Findings Focus Type of self-concept Dependent Variable
1con Chebat et al. (2006),
Journal of Business
Research
The social class image of a mall impacts the quality perception of stores within that mall;
the effect is explained using self-congruity theory. Shopping at upscale malls is likely to
lead to higher levels of self-congruity than shopping at downscale malls. Hence, the higher
the self-congruity the more likely the stores would be perceived as also having high quality.
The effect of self-image congruence on image
transfer from malls to stores
Actual Store-image quality perception
2con Aaker (1999) Journal
of Marketing Research
Chronic as well as situational made accessible traits (personality) positively affect brand
attitudes if self-congruity is given. These effects are moderated by the level of self-
monitoring
The effects of chronic and salient personality traits
in a self-congruity context.
Actual Brand preference/attitude and
usage likelihood
3con Chebat (1999) Journal
of Advertising
Research
Self-image congruity has a positive effect on purchase intent. The effect of self-congruity on purchase intent Actual Purchase intent
4con Kressmann et al.
(2006) , Journal of
Business Research
They found evidence that self-congruity (Actual and ideal) has a direct positive effect on
brand loyalty. Additionally, they also showed and indirect effect of self-congruity on brand
loyalty through functional congruity, brand relationship quality and product involvement.
Effects of self-image congruency on brand loyalty Actual and ideal, but scores
averaged (perhaps because
focus was on comparing with
funct. congruity).
Brand loyalty
5con Sirgy et al. (2008),
Journal of Business
Research
It was found that self-congruity with a sponsorship event positively influences brand
loyalty. This effect is positively moderated by customer awareness and involvement with
the event.
Effect of self-congruity with sponsorship on brand
loyalty
Actual Brand loyalty
6con Mazodier and Merunka
(2011), Journal of the
Academy of Marketing
Science
Self-congruity with an event positively impacts brand loyalty through event and brand
affect. Also, self-congruity between the event and the brand has a positive effect on brand
affect, through attitude toward the sponsorship, and on brand trust, consequently
influencing brand loyalty.
Effect of self-congruity with sponsorship on brand
loyalty
Actual Brand loyalty
7con Orth et al. (2010),
Journal of Current
Issues and Research in
Advertising
They found that women exhibit a higher degree of mixed emotions than men when there is
an incongruity between the perceived ad theme and their self-concept. Interestingly, even
under these conditions their attitude towards the advertised brand was still more favourable
than men‘s; showing that high levels of mixed emotions do not necessarily lead to a
negative perception of a brand and that the effect of self-congruity on brand attitudes varies
based on a personal characteristic such as gender.
The role of self concept (personality) congruity on
emotional response to ads between gender.
Actual Brand attitude
8con Hogg et al. (2000),
European Journal of
Marketing
They showed that the effect of self-congruity on purchase intent can also be moderated by
the level of self-monitoring of an individual. Depending if an individual is a low- or high
self-monitor they place more importance on consuming products considered to be
congruent with how they want to express themselves in a private- or public setting,
respectively.
The role of self-congruity in public and private
settings and the moderating impact of self-
monitoring
Actual Purchase intent
9con Hong and Zinkhan
(1995) Psychology &
Marketing
Self-congruity with an ad has a positive effect on brand attitudes and purchase intent. The
relative effect of ideal self-congruity is stronger than actual self-congruity.
The role of actual and ideal self-congruity on BA
and PI.
Actual and ideal Brand attitudes/purchase intent
10con Graeff (1996)
Psychology and
Marketing
It was shown that self-monitoring is positively moderates the effect of self-congruity on
brand attitudes of publicly consumer brands. This effect is stronger for ideal self-
congruence than actual self-congruence. For privately consumed brands actual- and ideal
congruity do not differ in their effect on BA.
The moderating role of self-monitoring between
actual- and ideal self-congruity and BA.
Actual and ideal Brand attitudes
11con Marshall et al. (2008),
Journal of Advertising
Research
Self-image congruity has an effect on re-purchase behaviour. Furthermore, the effect was
argued to be stronger for ideal self-congruity, but the discrepancy between the consumers
actual self-image the advertised self-image should not be too large.
The effect of incongruity of self-image and models
featured in ads on post-purchase dissonance.
Actual and ideal (social scale
provided, but not results
discussed)
Re-purchase intent
12con Sirgy and Johar (1999),
European Advances in
Consumer Research
Self-congruity (all four types aggregated) has a positive effect on BA. This effect is is
positively moderated by brand conspicuousness and brand uniqueness. Functional congruity
also shows a positive effect on BA. This effect is positively moderated by product
involvement and product differentiation.
The effect of self-congruity and functional
congruity on BA.
Actual, ideal, social, ideal
social (functional cong)
Brand attitudes

227
Ref Author, Date,
Journal
Main Findings Focus Type of self-concept Dependent Variable
13con Malär et al. (2011),
Journal of Marketing
Actual self-congruity has a stronger effect on emotional brand attachment than ideal self-
congruity. The effects of actual self-congruity on EBA are positively moderated by product
involvement, a consumer‘s self-esteem level and public self-consciousness but decrease the
impact for ideal self-congruity.
The effect of actual- and ideal self-congruity on
EBA
Actual and ideal Emotional brand attachment
14con He and Mukherjee
(2007), Journal of
Marketing
Management
Actual- and social self-congruity had a more significant positive impact on store loyalty
than ideal- and ideal social self-congruity. They attributed these variations to cultural
differences in the importance placed on the self-related motives by Chinese consumers and
the subsequent impact it has on the self-congruity effect (e.g. Chinese emphasising social-
consistency vs. North Americans focusing on enhancing their self-esteem).
The effects of the four types of self-congruity on
satisfaction, perceived value store loyalty.
Actual, ideal, social, ideal
social
Store loyalty (antecedents
satisfaction and perceived
value)
15con Ibrahim and Najjar
(2007), Innovative
Marketing
Among Tunisian consumers all four types of self-congruity had a positive effect on
satisfaction, overall attitudes, and purchase intent towards a retail store, but with social self-
congruity having the strongest positive impact on the measured constructs.
The effects of all four types of self-congruity on
store constructs.
Actual, ideal, social, ideal
social
Store satisfaction, overall
attitudes, purchase intent store
16con Kang et al. (2011),
International Journal of
Hospitality
Management
Self-congruity (four types aggregated) and functional congruity has a positive effect on
attitudes towards coffee shops in South Korea. The moderating role of prior experience was
also tested, but not significant. All four types of self-congruity were measured, but the
authors merged the scores to show an overall effect of self-congruity on attitudes towards
branded stores.
The effects of four types of self-congruity and
functional congruity on attitudes and repurchase
intent
Actual, ideal, social, ideal
social, functional.
Store attitudes, and re-purchase
intent.
17con Sung and Choi (2012),
Journal of Cross-
Cultural Psychology
The self-congruity effect on BA is confirmed for the Korean and US sample. However, the
effect is stronger for US respondents. It is argued that self-construal moderates this effect.
Note: However, it could be argued that other country level cultural factors impact the
effect. Focus on brand personality.
The Influence of Self-construal on the Self-brand
congruity effect on BA in the United States and
Korea.
Actual Brand attitudes
18con Kim et al. (2013),
Asian Journal of Social
Psychology
Social and ideal social self-congruity effects on PI are stronger than the actual and ideal
self-congruity effects for individuals with a dominant interdependent self-construal.
Actual and ideal self-congruity have a stronger effect on PI than social and ideal social
when an INDSC is primed. Social and ideal social self-congruity has a stronger effect on PI
than actual and ideal self-congruity when an INTSC is primed. However, while the results
inare in the hypothesized direction in the primed scenarios the differences are not all
statistically significant.
The effects of public selves (social and ideal social)
on PI.
Actual, ideal, social, ideal
social
Purchase intent
19con Liu et al. (2012),
European Journal of
Marketing
The study finds that user and usage imagery congruity are stronger predictors for brand
attitude and brand loyalty than brand personality congruity. This applies to the context of
the luxury fashion brands. . Both user and usage imagery congruity demonstrate significant
effects in brand attitude and brand loyalty. No significant effect of BPC in either brand
attitude or brand loyalty is found.
The effect of brand personality congruity , brand
user imagery congruity and brand usage imagery
congruity on BA and BLfor two luxury fashion
brands
Actual Brand attitudes and Brand
loyalty
20con Hollenbeck and
Kaikati. (2012),
International Journal of
Research in Marketing
Consumer use Facebook as a means of self-expression. Specifically, they use brands to
express both actual and ideal self types, but tend to seek brands on their profiles that
represent more their ideal rather than actual self.
To explore how consumers use Facebook as a
means of self-expression.
Actual, ideal Exploratory study

228
Appendix 2.6 Cosmopolitan/Local Orientation Studies (CL)12
Ref Author, Year,
Journal
Main Findings Country
Context
Sample
type
Sample
size
Product type Method Notes
1CL Cleveland and
Laroche (2007),
Journal of Business
Research
The study focuses on the development and validation of a multidimensional scale for the
measurement of acculturation to global consumer culture. Furthermore, it examines the
nature of local and global cultural influences on consumer behaviour. Note: The study
focuses on COS and equates it with global and EID with local.
Canada Students 162 No specific product. Emp. questionnaire,
SEM
2CL Cleveland et al.
(2011), International
Marketing Review
Their findings show that consumers are complementing an identity rooted in their
traditional (local) culture with one that is globally-oriented (COS). That means, COS and
local do not have to be mutually exclusive and can both be prevalent in a consumer. The
influence of demographic and psychographic variables can vary, across product
categories as well as countries.
Greece,
Hungary,
Sweden,
Mexico,
Chile,
Canada,
Korea,
India.
General
pop
2015 Various product groups
and lifestyle behaviours
Emp. questionnaire,
SEM
EID (Cleveland and
Chang, 2009), COS,
Cleveland and Laroche ,
2007).
3CL Westjohn et al.
(2009), Journal of the
Academy of
Marketing Science
In the U.S. sample, they found a significant direct effect between cosmopolitanism and
technology readiness, but not usage. Similar results were found in China. Global
identification has no direct relationship with technology readiness in the U.S. sample, but
a significant direct effect on technology usage. Among Chinese cosmopolitanism is
significantly related with technology readiness, but not directly with technology usage.
US and
China
General
pop
US: 336
Chi:150
Technology usage,
readiness
Emp. questionnaire,
SEM
Scales used: Cos —
Paroch(Yoon et al.
1996); Global
Identity — National
Identity (Der-Karabetian
and Ruiz 1997)
4CL Zhang and Khare
(2009), Journal of
Consumer Research
Their results show that consumers with an accessible global identity prefer a global over
local products, while those consumers with an accessible local identity prefer a local
over global product. Global (local) products are products with the same specifications
(tailored for local markets) and packaging for consumers from around the world.
US Students H1: 97
St1: 167
St2: 124
Palm pilot, agricultural
product
Emp. questionnaire
ANOVA
Chronic (Zhang and
Khare, 2009) and
Identity prime (Srull
and Wyer‘s, 1980)
5CL Tu et al. (2012) ,
International Journal
of Research in
Marketing
The study developed an 8-item global- local identity scale based on six studies of student
and non-student samples from three countries. They tested the relationship of
global/local identity with related constructs such as consumer ethnocentrism,
nationalism, and global consumption orientation. The scale's ability to predict
consumers’ preference between local and global products was also shown.
US, China,
UK
Student and
non-student
US: 253
+45+87
China: 120
UK:
221+180
Palm pilot Emp, questionnaire,
SEM
6CL
Cleveland et al.
(2011), Journal of
Business Research
Cosmopolitanism is more strongly related to Schwartz's individual and cultural level
values than with either Hofstede's cultural dimensions or demographics. Overall they
found a positive relationship between COS and benevolence, self-direction,
universalism, affective and intellectual autonomy, egilatariaism, harmony and females.
While there was a negative relationship with power and security.
Canada and
Turkey
Students CA: 511
T: 327
No products Emp. questionnaire,
MANCOVA
7CL Cleveland et al.
(2013), Journal of
Business Research
The scale was shown to be cross-cultural validity across languages. More specifically in
four countries and five languages. Hence, confirming the cross-lingual applicability of
the cosmopolitanism scale.
Japan,
Lebanon,
Turkey,
Canada
Students
and general
pop
1538 Emp. questionnaire,
SEM
12
It should be noted that this table includes also studies that focused on akin constructs to a cosmopolitan orientation (e.g. global identity, world-mindness) to provide a more
comprehensive picture of this research area.

229
Ref Author, Year,
Journal
Main Findings Country
Context
Sample
type
Sample
size
Product/brand Method Notes
8CL Cleveland et al
(2009) Journal of
International
Marketing
They tested the relationship between Materialism, Cosmopolitanism and Consumer
ethnocentrism as well as their individual relationship on a number of behaviours and
product categories. The findings supported the cross-cultural applicability of the
constructs. However, the relationship with various demographic variables varies between
samples. This pattern also emerges across the various product categories and national
groups.
Greece,
Hungary,
Sweden,
Mexico,
Chile,
Canada,
Korea,
India.
General
pop
2015 Various products Emp. questionnaire,
SEM
9CL Nijssen and Douglas
(2011), Journal of
International
Marketing
They found that consumer world-mindedness has a positive impact on attitudes toward
ads reflecting a global consumer culture positioning or foreign CCP CCP or FCCP, (b)
results in a preference and have a negative impact on attitudes toward ads reflecting a
local consumer culture positioning. CCP. Furthermore, consumer exposure to other
cultures (e.g. travel) positively moderates the relationship between consumer world-
mindedness and attitudes toward ads with a FCCP. Note: consumer world-mindness
related to COS in the study conceptually.
Netherlands General
pop
St1: 100
St2: 100
Ads with local vs. global
themes
Emp. questionnaire,
PLS
Consumer world-
mindedness from
(Nijssen and Douglas,
2008), scale items very
consumption focused
10CL Westjohn et al.,
(2012), Journal of
International
Marketing
They found that the collective identities of a consumer‘s global and national identity are
strongly related to how they respond to global and local consumer culture positioning
(GCCP and LCCP, respectively). Furthermore, it was shown that personality predisposes
people to adopt collective identities. The personality traits of openness to experience and
agreeableness are significantly related to global and national identity, respectively. Note:
Global and national identity equated with COS and Parochials.
US Students
and general
pop
540 Coca Cola, MC
Donalds, NiKe. Local
and global ad themes
Emp. questionnaire,
SEM
Global and national
identification (Der-
Karabetian and Ruiz
1997), mentioned that
similar to Zhang and
Khare, 2009
11CL Strizhakova et al.
(2008) , Journal of
International
Marketing
They found that the belief in global citizenship has a positive effect on the importance
placed on branded products. Cultural openness has a positive effect on believe on global
citizenship. Note: cultural openness is linked to COS.
US,
Romania,
Ukraine,
Russia
Students 1261 Durable and non-durable
consumer goods, local
and global brands
Emp. Survey
questionnaire, SEM
Cultural openness
(Sharma, Shimp, and
Shin, 1995).
12CL Riefler et al. (2012),
Journal of
International
Business Studies
COS consumers showed higher willingness to purchase foreign products than non-
cosmopolitans. Furthermore, COS has a positive correlations with consumer
innovativeness, education, and international experience. A negative correlation was
found with age, risk aversion, and social identity need. No gender differences, but more
COS in urban locations than rural areas.
Canada,
Austria;
INT;
Singapore
Students
and general
pop
Scale: 539
+ 442+
222+444
+43; COS
vs LOC
seg: 206
(SG)
Coke, Colgate,
Whirpool, Sony
Emp survey
questionnaire +
interview
questionnaire, SEM,
ANOVA
13CL Alden et al. (2013),
Journal of
International
Marketing
Global company animosity and perceived value of global brands act as mediators of the
cosmopolitanism, localism, consumer ethnocentrism, and materialism effect on global
brand attitudes in the majority of cases. Differences at the country level are found.
Brazil,
South
Korea,
Germany
Non-
student
sample
B: 206
G:200
SK:189
Nike, Sony and Nestel Emp. Questionnaire,
SEM

230
Appendix 4.1 MTurk Samples Demographic Information
Source: Ross et al. (2010)

231
Appendix 4.2 Main Study Contact Letter on MTurk
Dear participant,
I am a PhD student at the Bradford University School of Management, UK. I am
conducting research on consumer perceptions of different brands. I would appreciate it
if you could spend about 15 minutes to complete the following questionnaire. Please
note that the data will be used only for academic purposes and only in aggregated form.
The information provided will be handled with the strictest confidence and will not be
passed onto anyone else. If you have any questions in regards to the study you can
contact me at the email below my name. To proceed to the questionnaire please ―click‖
on the link below. Thank you very much for your time and help.
Sincerely,
Hector Gonzalez Jimenez
“CLICK ON THIS LINK TO OPEN THE QUESTIONNAIRE”

232
Appendix 4.3 Preliminary Study II Items to Measure the
Constructs
1. Brand Familiarity
Kent and Allen‘s (1994) brand familiarity scale. This scale is based on the following
three-items:
1. ―I feel very familiar with brand X‖
2. ―I feel very experienced with brand X‖
3. ―I know the product[s] of brand X‖
The range of familiarity was measured between 7 (maximum familiarity) and 1 (no
familiarity).
2. Product (Brand) Involvement
To measure product involvement the scale used in Malär et al‘s. (2011) study was used.
This measure is based on the following 5-items:
1. Because of my personal attitudes, I feel that this is a product/brand that ought to
be important to me.
2. Because of my personal values, I feel that this is a product/brand that ought to be
important to me.
3. This product/brand is very important to me personally.
4. Compared with other products/brands, this product/brands is important to me
5. I‘m interested in this product/brand.
Respondents were provided with the name of the respective brands on the questionnaire.
They received guidance on what is meant with product: ―Product‖ refers to the product
that is connected to the brand (e.g. product ―sport shoes‖ for the brand ―Nike‖). Their
responses were measured with 7-point Likert-type scales (1=Strongly Disagree,
7=Strongly Agree).
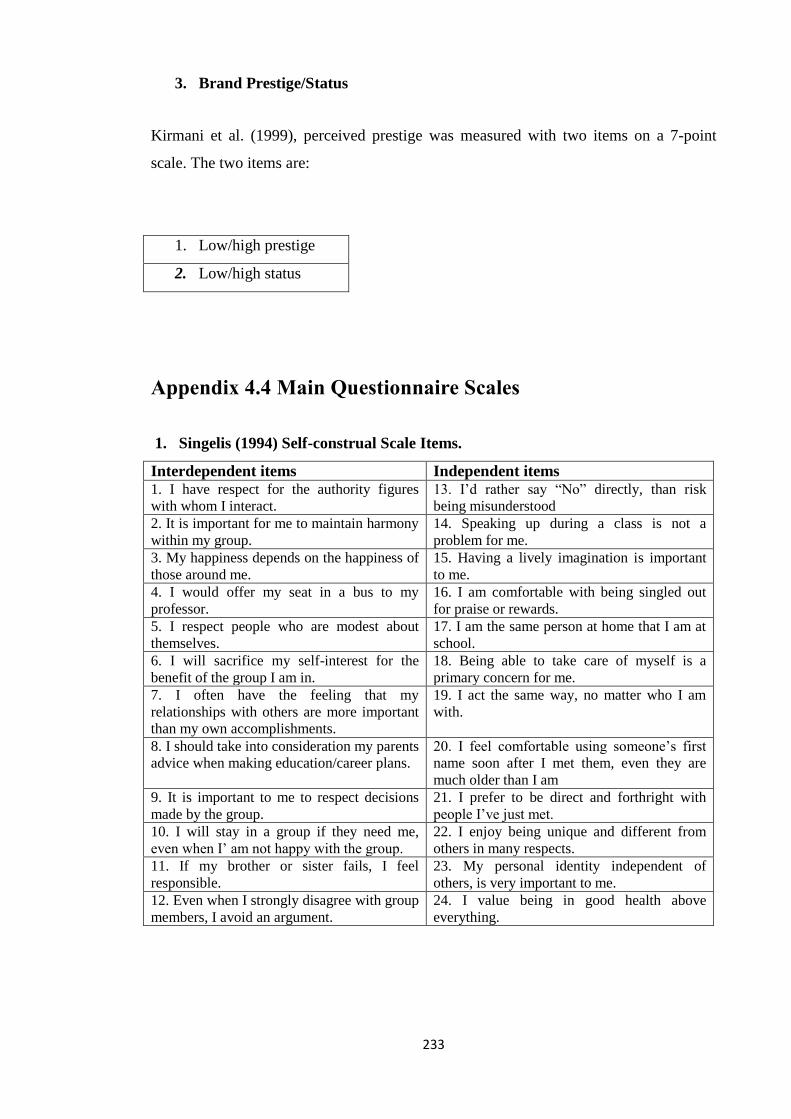
233
3. Brand Prestige/Status
Kirmani et al. (1999), perceived prestige was measured with two items on a 7-point
scale. The two items are:
1. Low/high prestige
2. Low/high status
Appendix 4.4 Main Questionnaire Scales
1. Singelis (1994) Self-construal Scale Items.
Interdependent items Independent items 1. I have respect for the authority figures
with whom I interact.
13. I‘d rather say ―No‖ directly, than risk
being misunderstood
2. It is important for me to maintain harmony
within my group.
14. Speaking up during a class is not a
problem for me.
3. My happiness depends on the happiness of
those around me.
15. Having a lively imagination is important
to me.
4. I would offer my seat in a bus to my
professor.
16. I am comfortable with being singled out
for praise or rewards.
5. I respect people who are modest about
themselves.
17. I am the same person at home that I am at
school.
6. I will sacrifice my self-interest for the
benefit of the group I am in.
18. Being able to take care of myself is a
primary concern for me.
7. I often have the feeling that my
relationships with others are more important
than my own accomplishments.
19. I act the same way, no matter who I am
with.
8. I should take into consideration my parents
advice when making education/career plans.
20. I feel comfortable using someone‘s first
name soon after I met them, even they are
much older than I am
9. It is important to me to respect decisions
made by the group.
21. I prefer to be direct and forthright with
people I‘ve just met.
10. I will stay in a group if they need me,
even when I‘ am not happy with the group.
22. I enjoy being unique and different from
others in many respects.
11. If my brother or sister fails, I feel
responsible.
23. My personal identity independent of
others, is very important to me.
12. Even when I strongly disagree with group
members, I avoid an argument.
24. I value being in good health above
everything.

234
2. Riefler et al. (2012) Cosmopolitan and Local Orientation Scale Items
Cosmopolitan Orientation Local Orientation 1. When traveling, I make a conscious effort to
get in touch with the local culture and
traditions.
1. News from my home country interests me a
lot.
2. I like having the opportunity to meet people
from many different countries.
2. I pay much attention to local news.
3. I like to have contact with people from
different cultures.
3. I appreciate the importance of following
traditions.
4. I have got a real interest in other countries. 4. I like having traditional dishes from my
home country.
5. Having access to products coming from
many different countries is valuable to me.
5. I have close bonds to the people in my
home country.
6. The availability of foreign products in the
domestic market provides valuable diversity. 6. I like being in my home country.
7. I enjoy being offered a wide range of
products coming from various countries.
8. Always buying the same local products
becomes boring over time.
9. I like watching movies from different
countries.
10. I like listening to music of other cultures.
11. I like trying original dishes from other
countries.
12. I like trying out things that are consumed
elsewhere in the world.
3. Sirgy et al. (1997) Self-Congruity Measure
This is operationalized with the following scenario (Sirgy et al., 1997, p.232):
―Take a moment to think about ―brand/product X‖. Think about the kind of
person who typically uses ―brand/product X‖. Imagine this person in your
mind and then describe this person using one of more personal adjectives
such as stylish, classy, masculine, sexy, old, athletic, or whatever personal
adjectives you can use to describe the typical use of ―brand/product X‖. Once
you have done this, indicate your agreement or disagreement to the following
statement. This ―brand/product X‖ is consistent with how I see myself (my
actual self).‖
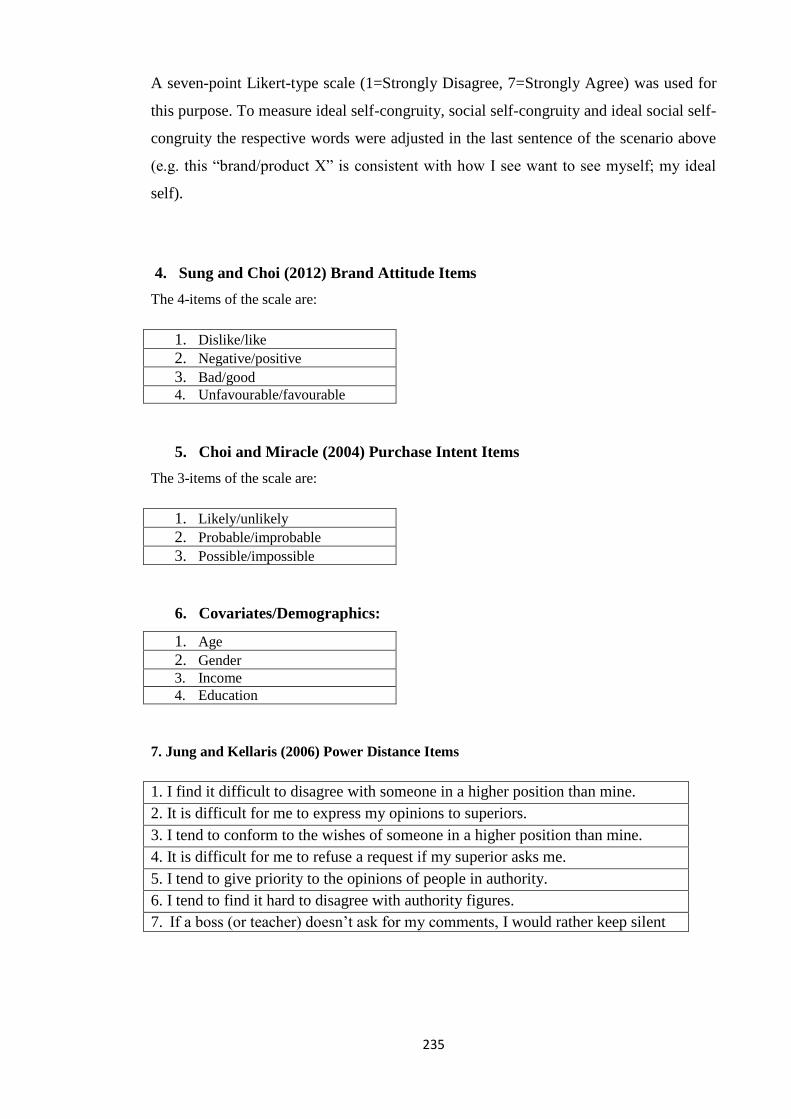
235
A seven-point Likert-type scale (1=Strongly Disagree, 7=Strongly Agree) was used for
this purpose. To measure ideal self-congruity, social self-congruity and ideal social self-
congruity the respective words were adjusted in the last sentence of the scenario above
(e.g. this ―brand/product X‖ is consistent with how I see want to see myself; my ideal
self).
4. Sung and Choi (2012) Brand Attitude Items
The 4-items of the scale are:
1. Dislike/like
2. Negative/positive
3. Bad/good 4. Unfavourable/favourable
5. Choi and Miracle (2004) Purchase Intent Items
The 3-items of the scale are:
1. Likely/unlikely
2. Probable/improbable
3. Possible/impossible
6. Covariates/Demographics:
1. Age
2. Gender 3. Income
4. Education
7. Jung and Kellaris (2006) Power Distance Items
1. I find it difficult to disagree with someone in a higher position than mine.
2. It is difficult for me to express my opinions to superiors.
3. I tend to conform to the wishes of someone in a higher position than mine.
4. It is difficult for me to refuse a request if my superior asks me.
5. I tend to give priority to the opinions of people in authority.
6. I tend to find it hard to disagree with authority figures.
7. If a boss (or teacher) doesn‘t ask for my comments, I would rather keep silent

236
Bearden et al. (2006) Long-Term Orientation Items
1. Respect for tradition is important to me.
2. I plan for the long term.
3. Family heritage is important to me.
4. I value a strong link to my past.
5. I work hard for success in the future.
6. I don't mind giving up today's fun for success in the future.
7. Traditional values are important to me.
8. Persistence is important to me.

237
Appendix 5.1 Preliminary Study I Online Questionnaire13
13
It should be noted that the copies of the online questionnaires in the Appendix are the ones used for the US sample. The questionnaires for the Indian samples do only differ
slightly in the demographic information section (i.e. income/currency).

238

239
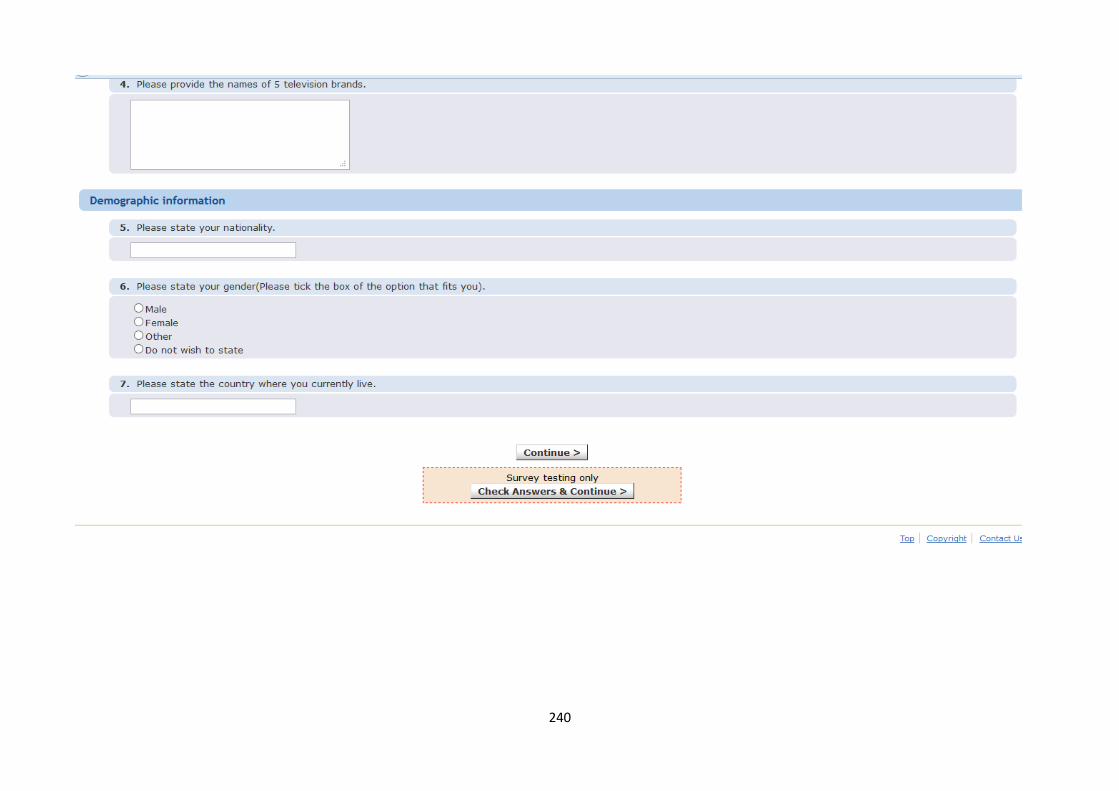
240

241
Appendix 5.2 Results Preliminary Study I
5.2.1 Results US Sample
Table A5.2.1 offers an overview of the brands most frequently mentioned in each of the
four product categories by respondents in the US. The table shows the five most
frequently - and total number - of brands mentioned in each category. An extensive list
of brands mentioned by the respondents for each product category can be found in Table
A5.2.5. The two most frequently mentioned brands have been highlighted in bold
(Table A5.2.1). These are the brands that were used for preliminary study II.
Specifically, in the sport shoes category the brands Nike (n=33) and Adidas (n=33)
were the most frequently mentioned. For clothing apparel, respondents mentioned the
brands Levi‘s (n=12) and Lee (n=10) most frequently. Coca Cola (n=36) and Pepsi
(n=36) were the most frequently mentioned brands in the soft drink category. For
television sets the brands Sony (n=30) and Samsung (n=20) were provided by the
largest number of respondents.
Table A5.2.1 Brands most Frequently Mentioned in the US (n=36)
Publicly consumed brands Privately consumed brands Categories Sport
Shoes
Freq. Clothing
apparel
Freq. Soft drink Freq. Television
set
Freq.
Nike 33 Levi’s 12 Coca Cola 36 Sony 30
Adidas 33 Lee 10 Pepsi 36 Samsung 20
Reebok 21 GAP 8 Sprite 18 Panasonic 16
Puma 18 Old
Navy
6 Mountain
Dew
18 Toshiba 15
New
Balance
11 Ralph
Lauren
6 Dr. Pepper 17 LG 15
. . . . . . . .
. . . . . . . .
. . . . . . . .
Total
number of
brands
mentioned
28 83 33 28

242
Table A5.2.2 provides demographic details on the sample. All respondents were US
citizens and resided in the US. It should be noted that MTurk provides a filter function
that allows only respondents that match the selected geographic criteria to answer the
survey, therefore, assuring that respondents fit the desired characteristics. In terms of
gender there were slightly more female than male respondents. This is in line with
previous studies using MTurk (Buhrmester et al., 2011; Ross et al., 2010).
Table A5.2.2 Demographics US – PS I
Frequency
Nationality
US 36 (100 %)
Country of
Residence
US 36 (100 %)
Gender
Male 16 (44.4 %)
Female 20 (55.6 %)
Other 0
Do not wish to state 0
5.2.2 Results Indian Sample
Table A5.2.3 provides an overview of the brands most frequently mentioned in each of
the four product categories by respondents in India. It shows the five most frequently,
and total number, of brands mentioned in each category. An extensive list of all the
brands mentioned by the respondents in each product category was not included and can
be found in Table A5.2.6. The two most frequently mentioned brands have been
highlighted in bold (Table A5.2.3). These two brands were used in preliminary study II.
Specifically, Adidas (n=33), Nike (n=28) and Reebok (n=28) where the brands most
frequently mentioned in the sport shoe category. With regard to clothing apparel,
respondents mentioned the brands Peter England (n=11) and Levi‘s (n=7) most
frequently. In the soft drinks category Coca Cola (n=31) and Pepsi (n=31) were the
most frequently mentioned brands. For television sets the brands Samsung (n=32) and
Sony (n=28) were provided by the largest number of respondents.

243
Table A5.2.3 Brands most Frequently Mentioned in India (n=34) Publicly consumed brands Privately consumed brands Categories Sport
Shoes
Freq. Clothing
apparel
Freq. Soft drink Freq. Television
set
Freq.
Adidas 33 Peter
England
11 Coca Cola 31 Samsung 32
Nike 28 Levi’s 8 Pepsi 31 Sony 28 Reebok 28 Benetton 6 Fanta 13 LG 27 Puma 27 Lee 6 Mountain
Dew
13 Philips 17
Fila 11 Wrangler 6 Sprite 12 Panasonic 16 . . . . . . . . . . . . . . . . . . . . . . . .
Total
number of
brands
mentioned
30 91 27 24
Table A5.2.4 offers demographic details on the Indian sample. All respondents were
Indian citizens and resided in India. In terms of gender there were slightly more male
than female respondents. This is in line with previous studies using MTurk samples
from India (Deshpande and Spears, 2012b; Ipeirotis, 2010).
Table A5.2.4 Demographics India - PS I
Frequency
Nationality
India 35 (100 %)
Country of
Residence
India 35 (100 %)
Gender
Male 20 (58.8 %)
Female 14 (41.2 %)
Other 0
Do not wish to state 0
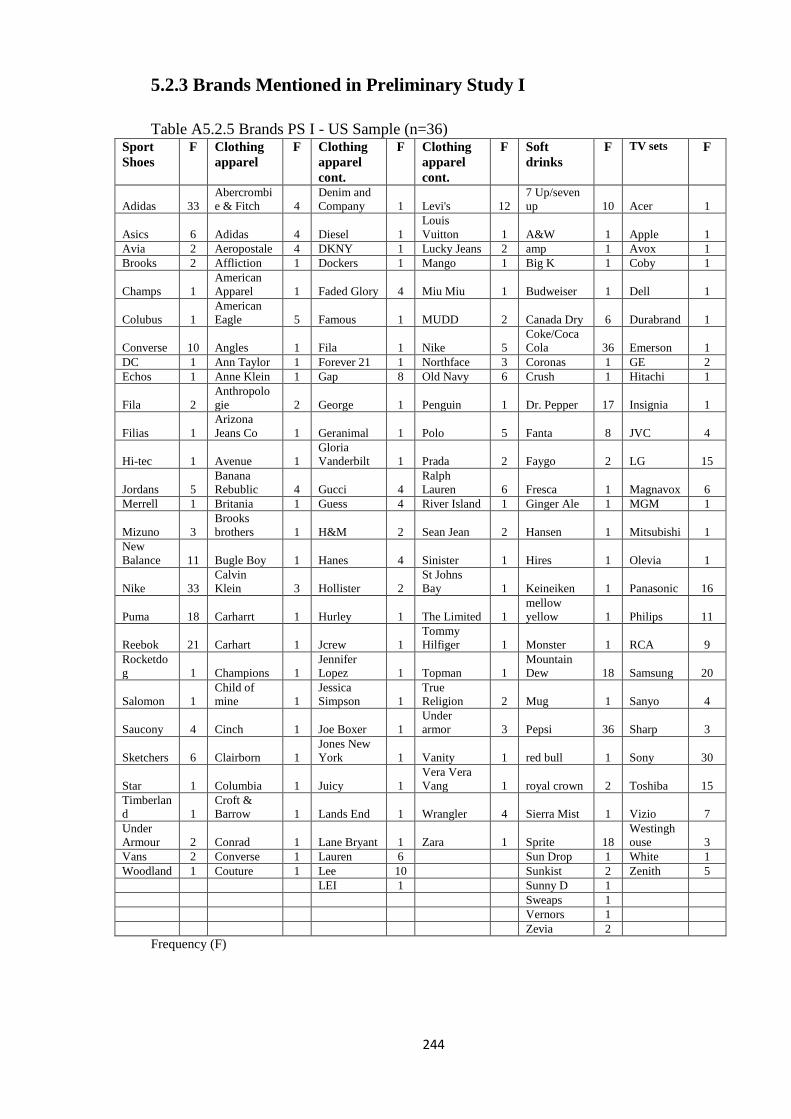
244
5.2.3 Brands Mentioned in Preliminary Study I
Table A5.2.5 Brands PS I - US Sample (n=36)
Sport
Shoes
F Clothing
apparel
F Clothing
apparel
cont.
F Clothing
apparel
cont.
F Soft
drinks
F TV sets F
Adidas 33
Abercrombi
e & Fitch 4
Denim and
Company 1 Levi's 12
7 Up/seven
up 10 Acer 1
Asics 6 Adidas 4 Diesel 1
Louis
Vuitton 1 A&W 1 Apple 1
Avia 2 Aeropostale 4 DKNY 1 Lucky Jeans 2 amp 1 Avox 1
Brooks 2 Affliction 1 Dockers 1 Mango 1 Big K 1 Coby 1
Champs 1
American
Apparel 1 Faded Glory 4 Miu Miu 1 Budweiser 1 Dell 1
Colubus 1
American
Eagle 5 Famous 1 MUDD 2 Canada Dry 6 Durabrand 1
Converse 10 Angles 1 Fila 1 Nike 5
Coke/Coca
Cola 36 Emerson 1
DC 1 Ann Taylor 1 Forever 21 1 Northface 3 Coronas 1 GE 2
Echos 1 Anne Klein 1 Gap 8 Old Navy 6 Crush 1 Hitachi 1
Fila 2
Anthropolo
gie 2 George 1 Penguin 1 Dr. Pepper 17 Insignia 1
Filias 1
Arizona
Jeans Co 1 Geranimal 1 Polo 5 Fanta 8 JVC 4
Hi-tec 1 Avenue 1
Gloria
Vanderbilt 1 Prada 2 Faygo 2 LG 15
Jordans 5
Banana
Rebublic 4 Gucci 4
Ralph
Lauren 6 Fresca 1 Magnavox 6
Merrell 1 Britania 1 Guess 4 River Island 1 Ginger Ale 1 MGM 1
Mizuno 3
Brooks
brothers 1 H&M 2 Sean Jean 2 Hansen 1 Mitsubishi 1
New
Balance 11 Bugle Boy 1 Hanes 4 Sinister 1 Hires 1 Olevia 1
Nike 33
Calvin
Klein 3 Hollister 2
St Johns
Bay 1 Keineiken 1 Panasonic 16
Puma 18 Carharrt 1 Hurley 1 The Limited 1
mellow
yellow 1 Philips 11
Reebok 21 Carhart 1 Jcrew 1
Tommy
Hilfiger 1 Monster 1 RCA 9
Rocketdo
g 1 Champions 1
Jennifer
Lopez 1 Topman 1
Mountain
Dew 18 Samsung 20
Salomon 1
Child of
mine 1
Jessica
Simpson 1
True
Religion 2 Mug 1 Sanyo 4
Saucony 4 Cinch 1 Joe Boxer 1
Under
armor 3 Pepsi 36 Sharp 3
Sketchers 6 Clairborn 1
Jones New
York 1 Vanity 1 red bull 1 Sony 30
Star 1 Columbia 1 Juicy 1
Vera Vera
Vang 1 royal crown 2 Toshiba 15
Timberlan
d 1
Croft &
Barrow 1 Lands End 1 Wrangler 4 Sierra Mist 1 Vizio 7
Under
Armour 2 Conrad 1 Lane Bryant 1 Zara 1 Sprite 18
Westingh
ouse 3
Vans 2 Converse 1 Lauren 6 Sun Drop 1 White 1
Woodland 1 Couture 1 Lee 10 Sunkist 2 Zenith 5
LEI 1 Sunny D 1
Sweaps 1
Vernors 1
Zevia 2
Frequency (F)

245
Table A5.2.6 Brands PS I - Indian Sample (n=34) Sport
shoes
F Clothing
apparel
F Clothing
apparel
cont.
F Clothing
apparel
cont.
F Soft
drinks
F Television
set
F
Adidas 33 7 For
Mankind 1 Cruso 1 Provogue 1 7up 10 Acer 1
Action 3 Aaron
Chang
Fashion 1 Diesel 2 Puma 4 Appy 4 Akai 7
Asics 3 Adidas 4 Dockers 1 Ramraj 1 Bovonto 1 Arcam 1
Bata 7
Aditi 1 Ecco 1 Raymond 5
Campa
Cola 1 Blue star 1
Bugatti 1 Aeffe 1 Fabinda 1 Real 1 Coca Cola 31 BPL 4
Columbus 1 Aero 1 Fila 1 Reebok 4 Dr. Pepper 1 Haier 1
Converse 2 Aeropostale 1 Gini Gony 1 Reliance 1 Fanta 13 Keltron 1
Cyke 1 Akademiks
Clothing 1 Gucci 2
Rockstar
Jeans 1 Fizz 3 Lenovo 1
Diadora 1 Allen 1 Hex 1 Sculler 1 Frooti 1 LG 27
Diesel 1 Allen Solley 2 HoffMan 1 Shifatex 1 Gold Spot 1 Mitsubishi 1
Dunlop 1 American
Apparel 1 Hollister 1 Shiny 1 Kingfisher 1 Onida 15
Fila 11 Anna Sui
Fashion 1 Indigo 1 Silver line 1 Kinley 1 Panasonic 16
Forest 1 Apple
Bottom
Clothing 1 Jack Wills 1 Smith 1 Lazza 1 Philips 17
Fusion 1
Armani 2
John
phillippe 1 Solly 1 Limca 8 Salora 1
Jordan 2 Arrow 4 Lee 6 SPA 1 Mazza 2 Samsung 32
Lacoste 1 Ash City 1 Levi's 8 Tata 1 Mirinda 5 Sansui 2
Lee cooper 2 Azzure
Denim 1 Lewis 1 Terrain 1
Mountain
dew 13 Sony 28
Liberty 4
BeBe 1 Liliput 1
Tommy
Hilfiger 2 Nimbooz 2 TCL 1
Lotto 3 Benneton 6 Live-in 1 Union 1 Pepsi 31 Thomson 1
New
Balance
1
Bill Blass 1 Louis 1
Van
Husean 5 Rasna 1 Toshiba 3
Nike 28
Billabong 1
Louis
Philippe 2 Vikas 1 real 1 Videocon 10
Paragon 2
Black 2
Marks &
Spencer 1 Vimal 1 Slice 2 Vizio 1
Pride 1 Bombay
dyeing 1 Nike 3 Vishudh 1 Sprint 1 Westinghouse 1
Puma 27 Burberry 1 Nixon 1 Volcom 1 Sprite 12 Whirpool 1
Red chief 1 Burton 1 Otto 1 Wilson 1 Thums up 6
Reebok 28 Calvin
Klein 5 Pagis 1 Woodland 1 Tropicana 1
Vans
Shoes
1
Camray 1
Pan
America 1 Wrangler 6 Zevia 1
Vittoria 1 Clandestine
Industries 1
Park
Avenue 2 Zara 1
VKC 1
Colorplus 1
Peter
England 11
Walker 1 Cotton
County 1 Poe 1
Couture 1 Prada 1
Crocodile 2
Frequency (F)

246
Appendix 5.3 Preliminary Study II Online Questionnaire

247

248

249

250

251

252

253

254

255

256

257

258

259
Appendix 5.4 Cronbach’s α Preliminary Study II
Table A5.4.1 Cronbach‘s alpha PS II - US
Involvement Familiarity Prestige/Status
Overall Cronbach‘s α
.837 .850 .846
By brand
Coca Cola .962 .920 .919
Pepsi .959 .903 .917
Sony .952 .936 .955
Samsung .937 .930 .945
GAP .966 .926 .972
Levi’s .956 .927 .948
Nike .966 .894 .932
Adidas .968 .916 .928
Table A5.4.2 Cronbach‘s alpha PS II – India
Involvement Familiarity Prestige/Status
Overall Cronbach‘s α
.780 .847 .816
By brand
Coca Cola .937 .898 .838
Pepsi .925 .861 .913
Sony .898 .896 .802
Samsung .830 .911 .870
Benetton .938 .843 .843
Levi’s .892 .922 .917
Nike .869 .792 .887
Adidas .879 .830 .873
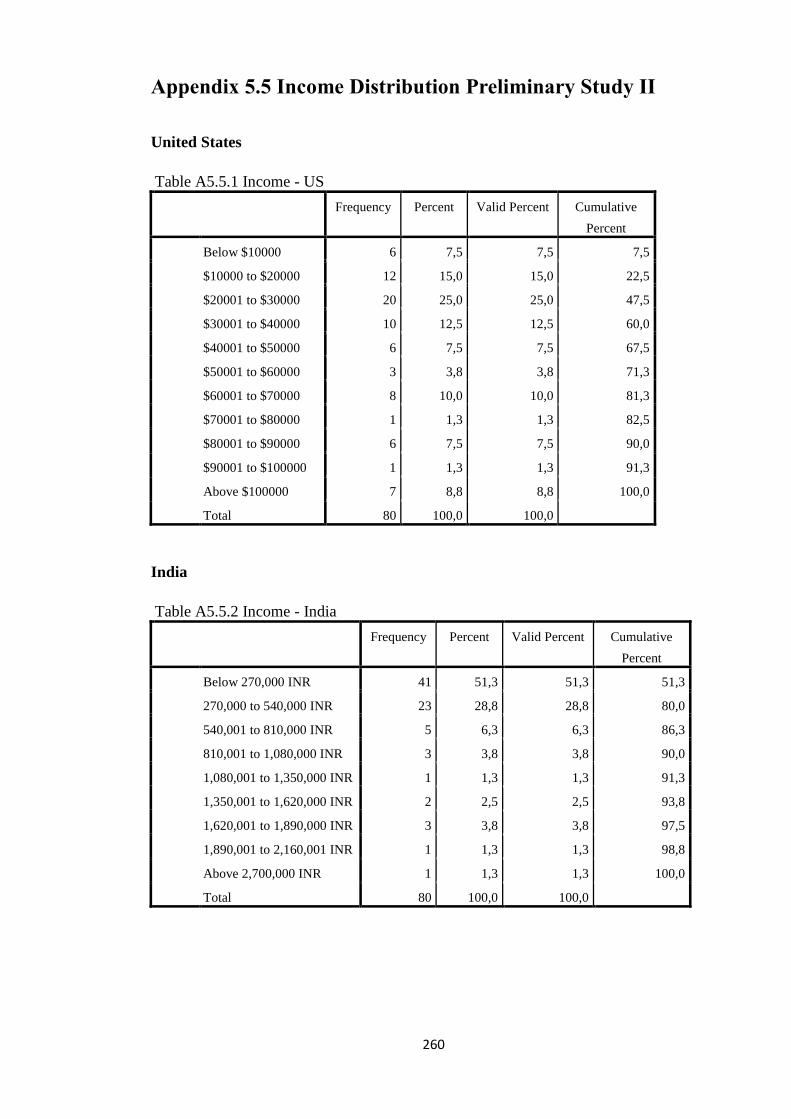
260
Appendix 5.5 Income Distribution Preliminary Study II
United States
Table A5.5.1 Income - US
Frequency Percent Valid Percent Cumulative
Percent
Below $10000 6 7,5 7,5 7,5
$10000 to $20000 12 15,0 15,0 22,5
$20001 to $30000 20 25,0 25,0 47,5
$30001 to $40000 10 12,5 12,5 60,0
$40001 to $50000 6 7,5 7,5 67,5
$50001 to $60000 3 3,8 3,8 71,3
$60001 to $70000 8 10,0 10,0 81,3
$70001 to $80000 1 1,3 1,3 82,5
$80001 to $90000 6 7,5 7,5 90,0
$90001 to $100000 1 1,3 1,3 91,3
Above $100000 7 8,8 8,8 100,0
Total 80 100,0 100,0
India
Table A5.5.2 Income - India
Frequency Percent Valid Percent Cumulative
Percent
Below 270,000 INR 41 51,3 51,3 51,3
270,000 to 540,000 INR 23 28,8 28,8 80,0
540,001 to 810,000 INR 5 6,3 6,3 86,3
810,001 to 1,080,000 INR 3 3,8 3,8 90,0
1,080,001 to 1,350,000 INR 1 1,3 1,3 91,3
1,350,001 to 1,620,000 INR 2 2,5 2,5 93,8
1,620,001 to 1,890,000 INR 3 3,8 3,8 97,5
1,890,001 to 2,160,001 INR 1 1,3 1,3 98,8
Above 2,700,000 INR 1 1,3 1,3 100,0
Total 80 100,0 100,0

261
Appendix 5.6 Detailed Results Preliminary Study II
5.6.1 Results US Sample PS II
Table A5.6.1 offers an overview of the overall mean scores obtained with regards to
brand familiarity (FAM), product involvement (PI) and perceived prestige/status (STA)
for the US sample. In terms of brand familiarity, in line with Malär et al. (2011), brands
that have overall mean at 0.5 above the neutral point of the scale are deemed acceptable
for further analysis. Hence, the cut-off point is set at 4.5. Only the brand GAP (M=4.25)
did not fit this criteria. Thus, the brand GAP was excluded from further analysis.
Furthermore, brands were categorized as either low (below 4), or high (above 4) in
terms of product involvement and perceived prestige/status, based on the neutral point
of the 7-point scales used (neutral=4). Consequently, with respect to product
involvement, the brands Sony, Samsung, Levi’s, and Nike were categorised as high
involvement. The brands Coca Cola, Pepsi, GAP, and Adidas were categorised as low
involvement. In terms of perceived brand prestige/status all eight brands were
categorised as high prestige/status. The purpose of this preliminary study was to select
brands from both countries that are perceived similarly for the main study. Investigating
the effects of high versus low prestige/status brands is not the focus of this study.
Hence, the fact that all the brands that are classified as high prestige/status was not
considered a drawback for the purpose of the main study.

262
Table A5.6.1 Overall means FAM, PI, and STA in the US (n=80)
Consumption
type
Product
category
Brands Overall
Mean scores
Categorisation
Brand
Familiarity
Privately
consumed Soft drinks
Coca Cola 5.83 Acceptable
Pepsi 5.72 Acceptable
Television sets
Sony 5.43 Acceptable
Samsung 5.25 Acceptable
Publicly
consumed
Clothing
apparel
GAP 4.25 Not acceptable
Levi‘s 4.96 Acceptable
Sport shoes
Nike 5.24 Acceptable
Adidas 4.61 Acceptable
Product
Involvement
Privately
consumed Soft drinks
Coca Cola 3.98 low
Pepsi 3.70 low
Television sets
Sony 4.59 high
Samsung 4.34 high
Publicly
consumed
Clothing
apparel
GAP 3.27 low
Levi‘s 4.02 high
Sport shoes
Nike 4.19 high
Adidas 3.65 low
Prestige/Status
Privately
consumed Soft drinks
Coca Cola 4.95 high
Pepsi 4.85 high
Television sets
Sony 5.68 high
Samsung 5.42 high
Publicly
consumed Clothing
apparel
GAP 4.38 high
Levi‘s 4.86 high
Sport shoes
Nike 5.39 high
Adidas 4.84 high
5.6.2 Results Indian Sample PS II
Table 5.6.2 provides an overview of the overall mean scores obtained with regards to
brand familiarity, product involvement and perceived prestige/status for the Indian
sample. Applying the same criteria as in the US sample, with regards to brand
familiarity only the brand Benetton (M=3.58) did not score above the acceptable value
of 4.5. Therefore the brand Benetton was excluded from further analysis. In terms of
product involvement, all eight brands have an overall mean above 4 and were therefore
categorised as high involvement for the Indian sample. The same applies to perceived
brand prestige/status, therefore, all eight brands were categorised as high prestige/status
based on the obtained overall mean scores. Considering that obtaining brands that are

263
comparable across both countries was the goal of this preliminary study rather than
testing the effects of high vs. low prestige/status, this was not considered a drawback.
Table A5.6.2 Overall means FAM, PI, and STA in India (n=80)
Consumption
type
Product
category
Brands Overall
mean scores
Categorisation
Brand
Familiarity
Privately
consumed Soft drinks
Coca Cola 5.95 Acceptable
Pepsi 5.83 Acceptable
Television sets
Sony 5.97 Acceptable
Samsung 6.23 Acceptable
Publicly
consumed Clothing
apparel
Benetton 3.58
Not
acceptable
Levi’s 5.11 Acceptable
Sport shoes
Nike 5.41 Acceptable
Adidas 5.17 Acceptable
Product
Involvement
Privately
consumed Soft drinks
Coca Cola 4.70 high
Pepsi 4.59 high
Television sets
Sony 5.64 high
Samsung 5.69 high
Publicly
consumed
Clothing
apparel
Benetton 4.67 high
Levi’s 5.26 high
Sport shoes
Nike 5.32 high
Adidas 5.15 high
Prestige/Status
Privately
consumed Soft drinks
Coca Cola 5.25 high
Pepsi 5.21 high
Television sets
Sony 6.12 high
Samsung 5.92 high
Publicly
consumed Clothing
apparel
Benetton 4.79 high
Levi’s 5.42 high
Sport shoes
Nike 5.99 high
Adidas 5.75 high

264
Appendix 6.1 Main Study Online Questionnaire

265

266

267

268

269

270

271

272

273

274

275

276

277

278

279
Appendix 6.2 Skewness and Kurtosis Main Study
Table A6.2 Skewness and Kurtosis - US
Constructs Mean Std. Deviation Skewness Kurtosis INTSC 4.807 0.786 -0.140 0.696 INDSC 5.183 0.797 -0.323 0.642 LOC 5.277 1.063 -0.694 0.817 COS 5.368 1.046 -0.813 0.642 ASC 3.552 1.211 0.084 -0.086 ISC 3.596 1.243 -0.072 -0.296 SSC 3.320 1.251 0.229 -0.169 ISSC 3.515 1.301 0.045 -0.397 BA 5.189 0.986 -0.524 0.658 PI 5.065 1.077 -0.523 0.235
PD 4.169 1.378 -0.235 -0.376 LTO 5.305 1.034 -0.522 1.172 Acronyms: INTSC=interdependent self-construal; INDSC=independent self-construal; LOC=locals;
COS=cosmopolitans; ASC= actual self-congruity; ISC= ideal self-congruity; SSC= social self-congruity;
ISSC= ideal social self-congruity; BA= brand attitude; PI= purchase intent; PD= power distance; LTO=
long-term orientation
Table A6.2 Skewness and Kurtosis - India
Constructs Mean Std. Deviation Skewness Kurtosis INTSC 5.633 0.752 -0.654 0.369 INDSC 5.427 0.744 -0.432 0.184 LOC 6.001 0.822 -1.114 1.507 COS 5.674 0.831 -0.895 1.007 ASC 5.296 0.976 -0.874 1.428 ISC 5.298 0.947 -1.055 2.033 SSC 5.256 0.969 -0.937 1.737 ISSC 5.317 0.966 -0.970 1.731 BA 5.653 0.906 -0.590 0.371 PI 5.715 0.901 -0.579 0.097
PD 5.112 1.066 -0.853 0.771 LTO 5.798 0.838 -0.895 0.709 Acronyms: INTSC=interdependent self-construal; INDSC=independent self-construal; LOC=locals;
COS=cosmopolitans; ASC= actual self-congruity; ISC= ideal self-congruity; SSC= social self-congruity;
ISSC= ideal social self-congruity; BA= brand attitude; PI= purchase intent; PD= power distance; LTO=
long-term orientation

280
Appendix 6.3 Socioeconomic Classes Represented by the US
and Indian Samples
In line with Shukla‘s work14
(2010; 2011), in order to assure that the samples from both
countries are comparable in terms of income and the impact it has on consumption
patterns of consumer goods, socio-economic classifications were used. MTurk
respondents in the US are similar to young adult working and low middle class
individuals based on Thompson and Hickey (2005) classification (Ipeirotis, 2010;
Paolacci et al., 2010). On the other hand, Indian MTurk respondents are rather
representative of young adults with high socioeconomic status (Khanna et al., 2010;
Ipeirotis, 2010); specifically, A2, A3, and B1 categories based on the SEC classification
(for details see MRSI, 2011). Even the respondents in both countries differ in terms of
socio-economic classes they are comparable as the product categories and
corresponding brands chosen for this study are relevant for both country samples.
Figure A6.1 provides an overview on the comparability of MTurk respondents in both
countries. It focuses on their representativeness of specific socio-economic classes
within each country and their relevance in regards to consumption of the
products/brands to be tested. The X- and Y-axes illustrate the socio-economic classes of
the overall population that are represented by a majority of MTurk respondents in India
and the US respectively15
. In addition, the area between the two axes provides examples
of product categories that are likely to be owned or consumed by a majority of young
adults pertaining to these different socio-economic classes in both countries (for details
see Euromonitor, 2008; Barton et al., 2012; MRSI, 2011; Beinhocker et al., 2007). The
highlighted product categories and corresponding brands, which were chosen through
two empirical studies (see Chapter 5), are the ones used in this thesis. Based on the
evidence provided it can be assumed that the product categories and corresponding
brands tested are relevant for respondents from the outlined social-classes in each
country; hence, making the samples comparable.
14
Shukla (2007, 2010) compared the UK and India. This study adopts the same approach by using socio-
economic classifications in the US and India.
15 It should be noted that in the US the socio-economic classification by Thompson and Hickey (2005) is
based on income, with 68% of US MTurk respondents having incomes in the working- and low middle
class range (Ipeirotis, 2010). The SEC classification in India is based on education of the chief earner in
the household and their consumption patterns rather than income, with Indian MTurk respondents fitting
the characteristics of the illustrated categories (Ipeirotis, 2010, Khanna et al., 2010).

281
Figure A6.1 Socio-Economic and Products of MTurk Respondents
Sources: Thomson and Hickey (2005), Barton et al. (2012), Beinhocker et al. (2007),
Deshpande and Spears (2012a), Euromonitor (2008), Ipeirotis (2010), Khanna et al.
(2010), and MRSI (2011).
US
Po
pu
latio
n
US
MT
urk
India MTurk
Indian Population
Lo
w M
iddle
Cla
ss
Work
ing
Cla
ss
B1 A1A3 A2
Product categories*
* These product categories are examples of product categories highlighted in the reviewed sources and should not be seen as a
complete list, as additional product categories are likely to be shared by consumers in both countries.
Washing machine
Telephone
Refrigerator
Motorcycle
Car
Computer
Camera
Television set
DVD
Branded apparel
Carbonated soft drinks
Branded footwear

282
Appendix 6.4 Reliability and Validity of the Subsample
Measurement Models
6.4.1 US INDSC Subsample
Consistent with the previous models (Chapter 6), for the US INDSC subsample the
composite reliability scores for all constructs exceeded the cut-off value of 0.70,
indicating that the scales are reliable (see Table A6.4.1). Factor loadings are higher than
the suggested 0.707 and significant (p < 0.001). All AVE values are above 0.50
establishing the measure's convergent validity. With regards to discriminant validity, the
square root of the AVE for each latent variable was greater than the corresponding
latent variable correlations (see Table A6.4.2). Overall, the results suggest that each
latent variable has sufficient convergent and discriminant validity.
Table A6.4.1 US INDSC Reliability and Convergent Validity
Indicator Mean St.
dev.
Factor
Loading
Composite
Reliability AVE
ASC 1 3.82 1.15 0.97 0.96 0.93
2 3.36 1.14 0.96
ISC 1 3.78 1.16 0.97 0.97 0.94
2 3.56 1.19 0.97
SSC 1 3.38 1.15 0.98 0.98 0.97
2 3.27 1.19 0.98
ISSC 1 3.66 1.21 0.98 0.98 0.97
2 3.52 1.22 0.98
BA 1 5.24 1.01 0.93 0.97 0.89
2 5.14 0.96 0.96
3 5.42 0.95 0.94
4 5.10 0.98 0.94
PI 1 5.03 1.19 0.94 0.96 0.89
2 4.92 1.10 0.96
3 5.39 1.04 0.90 Notes: All factor loadings are significant at the p < 0.001 level.
Acronyms: ASC = Actual self-congruity; ISC = Ideal self-congruity; SSC = Social self-congruity;
ISSC = Ideal social self-congruity; BA = Brand attitude; PI = Purchase intent
Table A6.4.2 US INDSC Latent Variable Correlations
ASC BA ISC ISSC PI SSC
ASC 0.9643 0.0000 0.0000 0.0000 0.0000 0.0000 BA 0.5011 0.9434 0.0000 0.0000 0.0000 0.0000 ISC 0.7737 0.5544 0.9695 0.0000 0.0000 0.0000 ISSC 0.7530 0.4915 0.8478 0.9849 0.0000 0.0000 PI 0.5293 0.8048 0.5138 0.4650 0.9434 0.0000 SSC 0.8146 0.4162 0.7484 0.7641 0.4681 0.9849 Acronyms: ASC = Actual self-congruity; ISC = Ideal self-congruity; SSC = Social self-congruity;
ISSC = Ideal social self-congruity; BA = Brand attitude; PI = Purchase intent

283
6.4.2 India INDSC Subsample
Table A6.4.3 shows that the measures convergent validity is attained for the Indian
INDSC subsample. Composite reliability scores are all above 0.70, factor loadings
above 0.707 (p < 0.001) and AVE scores above 0.50. Similarly, the latent variables
display sufficient discriminant validity as the square roots of the AVE for each latent
variable are greater than the correlation of the construct with any of the remaining
constructs (see Table A6.4.5). Overall, the results indicate that convergent and
discriminant validity has been attained.
Table A6.4.3 India INDSC Reliability and Convergent Validity
Indicator Mean St.
dev.
Factor
Loading
Composite
Reliability AVE
ASC 1 5.40 0.96 0.95 0.95 0.90
2 5.20 1.04 0.95
ISC 1 5.29 0.93 0.97 0.96 0.93
2 5.25 0.99 0.96
SSC 1 5.22 0.96 0.97 0.97 0.94
2 5.21 1.00 0.97
ISSC 1 5.31 0.97 0.97 0.97 0.94
2 5.25 1.02 0.97
BA 1 5.86 0.92 0.92 0.96 0.86
2 5.55 0.99 0.94
3 5.93 0.90 0.94
4 5.33 1.03 0.92
PI 1 5.87 0.90 0.94 0.96 0.89
2 5.56 0.95 0.95
3 5.74 0.95 0.94 Notes: All factor loadings are significant at the p < 0.001 level.
Acronyms: ASC = Actual self-congruity; ISC = Ideal self-congruity; SSC = Social self-congruity;
ISSC = Ideal social self-congruity; BA = Brand attitude; PI = Purchase intent
Table A6.4.4 India INDSC Latent Variable Correlations
ASC BA ISC ISSC PI SSC
ASC 0.9487 0.0000 0.0000 0.0000 0.0000 0.0000 BA 0.5275 0.9274 0.0000 0.0000 0.0000 0.0000 ISC 0.8155 0.5332 0.9644 0.0000 0.0000 0.0000 ISSC 0.7940 0.5079 0.8085 0.9695 0.0000 0.0000 PI 0.5523 0.8210 0.5544 0.5395 0.9434 0.0000 SSC 0.8007 0.5137 0.8203 0.8263 0.5500 0.9695 Acronyms: ASC = Actual self-congruity; ISC = Ideal self-congruity; SSC = Social self-congruity;
ISSC = Ideal social self-congruity; BA = Brand attitude; PI = Purchase intent

284
6.4.3 US INTSC Subsample
As shown in Table A6.4.5 the composite reliability scores for all constructs surpass the
cut-off value of 0.70, testament of the scales reliability. Factor loadings are higher than
the suggested 0.707 and significant (p < 0.001). In addition, all AVE values are above
0.50 establishing the measure's convergent validity. With respect to discriminant
validity the square root of the AVE for each latent variable is greater than the
corresponding latent variable correlations (see Table A6.4.6). Overall, the results
suggest that each latent variable has sufficient convergent and discriminant validity in
the US INTSC subsample.
Table A6.3.5 US INTSC Reliability and Convergent Validity
Indicator Mean St.
dev.
Factor
Loading
Composite
Reliability AVE
ASC 1 3.75 1.28 0.97 0.97 0.94
2 3.34 1.30 0.97
ISC 1 3.67 1.31 0.98 0.98 0.96
2 3.48 1.30 0.98
SSC 1 3.37 1.29 0.99 0.98 0.97
2 3.28 1.33 0.98
ISSC 1 3.54 1.35 0.98 0.98 0.98
2 3.45 1.35 0.99
BA 1 5.21 1.07 0.93 0.97 0.90
2 5.09 1.05 0.96
3 5.33 1.03 0.95
4 5.05 1.07 0.95
PI 1 4.93 1.21 0.93 0.95 0.86
2 4.86 1.16 0.96
3 5.34 1.12 0.89 Notes: All factor loadings are significant at the p < 0.001 level.
Acronyms: ASC = Actual self-congruity; ISC = Ideal self-congruity; SSC = Social self-congruity;
ISSC = Ideal social self-congruity; BA = Brand attitude; PI = Purchase intent
Table A6.4.6 US INTSC Latent Variable Correlations
ASC BA ISC ISSC PI SSC
ASC 0.9695 0.0000 0.0000 0.0000 0.0000 0.0000 BA 0.5455 0.9487 0.0000 0.0000 0.0000 0.0000 ISC 0.8389 0.5410 0.9798 0.0000 0.0000 0.0000 ISSC 0.8258 0.5244 0.8626 0.9899 0.0000 0.0000 PI 0.5683 0.8207 0.5537 0.5460 0.9274 0.0000 SSC 0.8246 0.4691 0.8214 0.8277 0.5118 0.9849 Acronyms: ASC = Actual self-congruity; ISC = Ideal self-congruity; SSC = Social self-congruity;
ISSC = Ideal social self-congruity; BA = Brand attitude; PI = Purchase intent

285
6.4.4 India INTSC Subsample
Table A6.4.7 shows that the measures convergent validity is attained for the Indian
INTSC subsample. Composite reliability scores are all above 0.70, factor loadings
above 0.707 (p < 0.001) and AVE scores surpass the threshold of 0.50. The latent
variables display sufficient discriminant validity as the square roots of the AVE for each
latent variable are greater than the correlation of the construct with any of the remaining
constructs (see Table A6.4.8). Overall, the results indicate that convergent and
discriminant validity has been attained.
Table A6.4.7 India INTSC Reliability and Convergent Validity
Indicator Mean St.
dev.
Factor
Loading
Composite
Reliability AVE
ASC 1 5.30 1.10 0.96 0.95 0.91
2 5.24 1.08 0.95
ISC 1 5.36 1.05 0.97 0.97 0.94
2 5.26 1.01 0.97
SSC 1 5.30 1.03 0.98 0.98 0.96
2 5.28 1.02 0.98
ISSC 1 5.35 1.00 0.97 0.97 0.94
2 5.34 1.04 0.97
BA 1 5.88 0.94 0.92 0.95 0.83
2 5.42 1.11 0.93
3 5.87 1.02 0.94
4 5.23 1.07 0.91
PI 1 5.85 0.94 0.93 0.96 0.90
2 5.51 1.01 0.95
3 5.66 1.00 0.94 Notes: All factor loadings are significant at the p < 0.001 level.
Acronyms: ASC = Actual self-congruity; ISC = Ideal self-congruity; SSC = Social self-congruity;
ISSC = Ideal social self-congruity; BA = Brand attitude; PI = Purchase intent
Table A6.4.8 India INTSC Latent Variable Correlations
ASC BA ISC ISSC PI SSC
ASC 0.9539 0.0000 0.0000 0.0000 0.0000 0.0000 BA 0.5263 0.9110 0.0000 0.0000 0.0000 0.0000 ISC 0.8303 0.4803 0.9695 0.0000 0.0000 0.0000 ISSC 0.8553 0.4804 0.8286 0.9695 0.0000 0.0000 PI 0.6245 0.8383 0.5716 0.5518 0.9487 0.0000 SSC 0.8445 0.4971 0.8393 0.8491 0.5874 0.9798 Acronyms: ASC = Actual self-congruity; ISC = Ideal self-congruity; SSC = Social self-congruity;
ISSC = Ideal social self-congruity; BA = Brand attitude; PI = Purchase intent

286
6.4.5 US LOC Subsample
Consistent with the previous models, for the US LOC subsample the composite
reliability scores for all constructs exceed the cut-off value of 0.70, indicating that the
scales are reliable. Factor loadings are higher than the suggested 0.707 and significant
(p < 0.001). All AVE values are above 0.50 establishing the measure's convergent
validity (see Table A6.4.9). With regards to discriminant validity, the square root of the
AVE for each latent variable is greater than the corresponding latent variable
correlations (see Table A6.4.10). Overall, the results suggest that, each latent variable
has sufficient convergent and discriminant validity.
Table A6.4.9 US LOC Reliability and Convergent Validity
Indicator Mean St.
dev.
Factor
Loading
Composite
Reliability AVE
ASC 1 4.09 1.14 0.97 0.96 0.93
2 3.58 1.17 0.95
ISC 1 3.98 1.18 0.98 0.97 0.95
2 3.75 1.18 0.97
SSC 1 3.63 1.18 0.99 0.98 0.97
2 3.53 1.21 0.98
ISSC 1 3.84 1.23 0.98 0.98 0.98
2 3.73 1.25 0.99
BA 1 5.49 0.94 0.93 0.97 0.90
2 5.38 0.96 0.95
3 5.60 0.94 0.95
4 5.33 1.00 0.95
PI 1 5.22 1.11 0.94 0.96 0.88
2 5.13 1.09 0.96
3 5.52 1.06 0.91 Notes: All factor loadings are significant at the p < 0.001 level.
Acronyms: ASC = Actual self-congruity; ISC = Ideal self-congruity; SSC = Social self-congruity;
ISSC = Ideal social self-congruity; BA = Brand attitude; PI = Purchase intent
Table A6.4.10 US LOC Latent Variable Correlations
ASC BA ISC ISSC PI SSC
ASC 0.9644 0.0000 0.0000 0.0000 0.0000 0.0000 BA 0.4258 0.9487 0.0000 0.0000 0.0000 0.0000 ISC 0.8379 0.4359 0.9747 0.0000 0.0000 0.0000 ISSC 0.8201 0.4108 0.8482 0.9899 0.0000 0.0000 PI 0.5083 0.7899 0.4927 0.4792 0.9380 0.0000 SSC 0.8045 0.3310 0.8214 0.8254 0.4309 0.9849 Acronyms: ASC = Actual self-congruity; ISC = Ideal self-congruity; SSC = Social self-congruity;
ISSC = Ideal social self-congruity; BA = Brand attitude; PI = Purchase intent

287
6.4.6 India LOC Subsample
Table A6.4.11 shows that the measures convergent validity is attained for the Indian
LOC sub-sample. Composite reliability scores are all above 0.70, factor loadings
surpass 0.707 (p < 0.001) and AVE scores are greater than the threshold of 0.50. The
latent variables display sufficient discriminant validity as the square roots of the AVE
for each latent variable are greater than the correlation of the construct with any of the
remaining constructs (see Table A6.4.12). Overall, the results indicate that convergent
and discriminant validity has been attained.
Table A6.4.11 India LOC Reliability and Convergent Validity
Indicator Mean St.
dev.
Factor
Loading
Composite
Reliability AVE
ASC 1 5.37 1.04 0.96 0.95 0.91
2 5.23 1.06 0.95
ISC 1 5.30 1.00 0.97 0.97 0.94
2 5.23 1.01 0.97
SSC 1 5.22 1.02 0.98 0.98 0.95
2 5.21 1.02 0.98
ISSC 1 5.29 0.99 0.98 0.98 0.95
2 5.26 1.03 0.98
BA 1 5.86 0.91 0.92 0.95 0.84
2 5.51 1.02 0.92
3 5.89 0.94 0.94
4 5.30 1.03 0.92
PI 1 5.85 0.91 0.94 0.96 0.89
2 5.54 0.97 0.95
3 5.70 0.98 0.94 Notes: All factor loadings are significant at the p < 0.001 level.
Acronyms: ASC = Actual self-congruity; ISC = Ideal self-congruity; SSC = Social self-congruity;
ISSC = Ideal social self-congruity; BA = Brand attitude; PI = Purchase intent
Table A6.4.12 India LOC Latent Variable Correlations
ASC BA ISC ISSC PI SSC
ASC 0.9539 0.0000 0.0000 0.0000 0.0000 0.0000 BA 0.5381 0.9165 0.0000 0.0000 0.0000 0.0000 ISC 0.8238 0.5107 0.9695 0.0000 0.0000 0.0000 ISSC 0.8094 0.5149 0.7922 0.9747 0.0000 0.0000 PI 0.5876 0.8109 0.5630 0.5571 0.9434 0.0000 SSC 0.8047 0.5228 0.8132 0.8185 0.5801 0.9747 Acronyms: ASC = Actual self-congruity; ISC = Ideal self-congruity; SSC = Social self-congruity;
ISSC = Ideal social self-congruity; BA = Brand attitude; PI = Purchase intent

288
6.4.7 US COS Subsample
As shown in Table A6.4.13, the composite reliability scores for all constructs surpass
the cut-off value of 0.70, testament of the scales are reliability. Factor loadings are
higher than the suggested 0.707 and significant (p < 0.001). Moreover, all AVE values
are above 0.50 establishing the measure's convergent validity. With regards to
discriminant validity the square root of the AVE for each latent variable is greater than
the corresponding latent variable correlations (see Table A6.4.14). Overall, the results
suggest that each latent variable has sufficient convergent and discriminant validity in
the US COS subsample.
Table A6.4.13 US COS Reliability and Convergent Validity
Indicator Mean St.
dev.
Factor
Loading
Composite
Reliability AVE
ASC 1 3.44 1.21 0.97 0.97 0.94
2 3.06 1.20 0.95
ISC 1 3.41 1.25 0.98 0.98 0.96
2 3.23 1.25 0.97
SSC 1 3.10 1.22 0.99 0.98 0.98
2 2.99 1.26 0.98
ISSC 1 3.29 1.29 0.99 0.98 0.97
2 3.18 1.30 0.99
BA 1 4.96 1.08 0.93 0.97 0.90
2 4.87 1.02 0.97
3 5.14 1.01 0.96
4 4.84 1.03 0.94
PI 1 4.72 1.24 0.94 0.95 0.86
2 4.64 1.14 0.96
3 5.17 1.11 0.88 Notes: All factor loadings are significant at the p < 0.001 level.
Acronyms: ASC = Actual self-congruity; ISC = Ideal self-congruity; SSC = Social self-congruity;
ISSC = Ideal social self-congruity; BA = Brand attitude; PI = Purchase intent
Table A6.4.14 US COS Latent Variable Correlations
ASC BA ISC ISSC PI SSC
ASC 0.9695 0.0000 0.0000 0.0000 0.0000 0.0000 BA 0.5252 0.9487 0.0000 0.0000 0.0000 0.0000 ISC 0.8326 0.5490 0.9798 0.0000 0.0000 0.0000 ISSC 0.8058 0.5169 0.8606 0.9849 0.0000 0.0000 PI 0.5269 0.8055 0.5193 0.4963 0.9274 0.0000 SSC 0.8238 0.4575 0.8019 0.8194 0.4837 0.9899 Acronyms: ASC = Actual self-congruity; ISC = Ideal self-congruity; SSC = Social self-congruity;
ISSC = Ideal social self-congruity; BA = Brand attitude; PI = Purchase intent

289
6.4.8 India COS Subsample
Table A6.4.14 shows that the measures convergent validity is attained for the Indian
COS subsample. Composite reliability scores are all above 0.70, factor loadings are
greater than 0.707 (p < 0.001) and AVE scores exceed the threshold of 0.50. The latent
variables display satisfactory discriminant validity as the square roots of the AVE for
each latent variable are greater than the correlation of the construct with any of the
remaining constructs (see Table A6.4.15). Overall, the results indicate that convergent
and discriminant validity has been attained.
Table A6.3.14 India COS Reliability and Convergent Validity
Indicator Mean St.
dev.
Factor
Loading
Composite
Reliability AVE
ASC 1 5.31 0.92 0.96 0.92 0.85
2 5.17 0.99 0.93
ISC 1 5.35 0.84 0.97 0.95 0.91
2 5.32 0.90 0.96
SSC 1 5.33 0.87 0.98 0.95 0.91
2 5.29 0.92 0.96
ISSC 1 5.42 0.87 0.98 0.95 0.90
2 5.32 0.96 0.97
BA 1 5.86 0.94 0.92 0.95 0.84
2 5.50 1.02 0.95
3 5.97 0.92 0.95
4 5.28 1.02 0.90
PI 1 5.88 0.90 0.94 0.96 0.88
2 5.52 0.96 0.95
3 5.73 0.89 0.92 Notes: All factor loadings are significant at the p < 0.001 level.
Acronyms: ASC = Actual self-congruity; ISC = Ideal self-congruity; SSC = Social self-congruity;
ISSC = Ideal social self-congruity; BA = Brand attitude; PI = Purchase intent
Table A6.4.15 India COS Latent Variable Correlations
ASC BA ISC ISSC PI SSC
ASC 0.9220 0.0000 0.0000 0.0000 0.0000 0.0000 BA 0.4831 0.9165 0.0000 0.0000 0.0000 0.0000 ISC 0.8258 0.5193 0.9539 0.0000 0.0000 0.0000 ISSC 0.7618 0.4504 0.8247 0.9487 0.0000 0.0000 PI 0.5595 0.8111 0.5565 0.5039 0.9381 0.0000 SSC 0.7731 0.4910 0.8151 0.8274 0.5407 0.9539 Acronyms: ASC = Actual self-congruity; ISC = Ideal self-congruity; SSC = Social self-congruity;
ISSC = Ideal social self-congruity; BA = Brand attitude; PI = Purchase intent

290
Appendix 7.1 Figures Structural Models
Figure A7.1 US Full Sample Structural Model
Figure A7.2 US INDSC Sample Structural Model
ISC
ASC
ISSC
SSC
BA PI
Acronyms: ASC = Actual self-congruity; ISC = Ideal self-congruity;SSC = Social self-congruity; ISSC = Ideal social self-congruity;BA = Brand attitude; PI = Purchase intent; Notes: *p < 0.05, **p < 0.01, ***p < 0.001; ns= not significant (one-tailed tests).
0.43***
0.42**
-0.39***
0.07ns
0.82***
R2=0.30 R2=0.66
ISC
ASC
ISSC
SSC
BA PI
Acronyms: ASC = Actual self-congruity; ISC = Ideal self-congruity;SSC = Social self-congruity; ISSC = Ideal social self-congruity;BA = Brand attitude; PI = Purchase intent; Notes: *p < 0.05, **p < 0.01, ***p < 0.001; ns= not significant (one-tailed tests).
0.37**
0.74***
-0.38**
-0.20ns
0.81***
R2=0.34 R2=0.65

291
Figure A7.3 US INTSC Sample Structural Model
Figure A7.4 US COS Sample Structural Model
ISC
ASC
ISSC
SSC
BA PI
Acronyms: ASC = Actual self-congruity; ISC = Ideal self-congruity;SSC = Social self-congruity; ISSC = Ideal social self-congruity;BA = Brand attitude; PI = Purchase intent; Notes: *p < 0.05, **p < 0.01, ***p < 0.001; ns= not significant (one-tailed tests).
0.51***
0.33*
-0.43***
-0.14ns
0.82***
R2=0.33 R2=0.67
ISC
ASC
ISSC
SSC
BA PI
Acronyms: ASC = Actual self-congruity; ISC = Ideal self-congruity;SSC = Social self-congruity; ISSC = Ideal social self-congruity;BA = Brand attitude; PI = Purchase intent; Notes: *p < 0.05, **p < 0.01, ***p < 0.001; ns= not significant (one-tailed tests).
0.33**
0.50**
-0.37**
0.08ns
0.81***
R2=0.32 R2=0.65

292
Figure A7.5 US LOC Sample Structural Model
Figure A7.6 INDIA FULL Sample Structural Model
ISC
ASC
ISSC
SSC
BA PI
Acronyms: ASC = Actual self-congruity; ISC = Ideal self-congruity;SSC = Social self-congruity; ISSC = Ideal social self-congruity;BA = Brand attitude; PI = Purchase intent; Notes: *p < 0.05, **p < 0.01, ***p < 0.001; ns= not significant (one-tailed tests).
0.46***
0.36*
-0.43***
0.07ns
0.79***
R2=0.23 R2=0.62
ISC
ASC
ISSC
SSC
BA PI
Acronyms: ASC = Actual self-congruity; ISC = Ideal self-congruity;SSC = Social self-congruity; ISSC = Ideal social self-congruity;BA = Brand attitude; PI = Purchase intent; Notes: *p < 0.05, **p < 0.01, ***p < 0.001; ns= not significant (one-tailed tests).
0.25**
0.09ns
0.17*
0.06ns
0.92***
R2=0.28 R2=0.84

293
Figure A7.7 India INDSC Sample Structural Model
Figure A7.8 India INTSC Sample Structural Model
ISC
ASC
ISSC
SSC
BA PI
Acronyms: ASC = Actual self-congruity; ISC = Ideal self-congruity;SSC = Social self-congruity; ISSC = Ideal social self-congruity;BA = Brand attitude; PI = Purchase intent; Notes: *p < 0.05, **p < 0.01, ***p < 0.001; ns= not significant (one-tailed tests).
0.24**
0.25*
0.05ns
0.03ns
0.92***
R2=0.30 R2=0.85
ISC
ASC
ISSC
SSC
BA PI
Acronyms: ASC = Actual self-congruity; ISC = Ideal self-congruity;SSC = Social self-congruity; ISSC = Ideal social self-congruity;BA = Brand attitude; PI = Purchase intent; Notes: *p < 0.05, **p < 0.01, ***p < 0.001; ns= not significant (one-tailed tests).
0.40**
-0.07ns
0.22*
0.00ns
0.89***
R2=0.29 R2=0.79

294
Figure A7.9 India COS Sample Structural Model
Figure A7.10 India LOC Sample Structural Model
ISC
ASC
ISSC
SSC
BA PI
Acronyms: ASC = Actual self-congruity; ISC = Ideal self-congruity;SSC = Social self-congruity; ISSC = Ideal social self-congruity;BA = Brand attitude; PI = Purchase intent; Notes: *p < 0.05, **p < 0.01, ***p < 0.001; ns= not significant (one-tailed tests).
0.15ns
0.35*
0.20ns
-0.15ns
0.91***
R2=0.29 R2=0.83
ISC
ASC
ISSC
SSC
BA PI
Acronyms: ASC = Actual self-congruity; ISC = Ideal self-congruity;SSC = Social self-congruity; ISSC = Ideal social self-congruity;BA = Brand attitude; PI = Purchase intent; Notes: *p < 0.05, **p < 0.01, ***p < 0.001; ns= not significant (one-tailed tests).
0.91***
0.32**
-0.00ns
0.19*
0.07ns
R2=0.31 R2=0.83

295
Appendix 7.2 Results Public versus Private Brands
Table A7.2 Path Coefficient Results Public (pub) vs. Private Brands (priv)
US
ASC
BA
t-stat ISC
BA
t-stat SSC
BA
t-stat ISSC
BA
t-stat BA
PI
t-stat
US full
sample pub 0.24 3.38** 0.45 4.96*** -0.15 2.33** 0.03 0.37ns 0.79 37.01
***
US full
sample priv 0.41 4.64*** 0.22 1.92* -0.22 2.73** 0.15 1.46ns 0.83 62.18
***
US INDSC
pub 0.29 2.72** 0.62 4.77*** -0.30 2.86** -0.05 0.35ns 0.78 16.57
***
US INDSC
priv 0.45 3.39** 0.31 2.12* -0.19 1.36ns 0.01 0.06ns 0.84 39.03
***
US INTSC
pub 0.33 3.82*** 0.39 3.06** -0.12 1.49ns -0.00 0.01ns 0.79 36.49
***
US INTSC
priv 0.43 4.21*** 0.35 2.31* -0.40 4.03*** 0.17 1.42ns 0.83 45.30
***
US COS
pub 0.14 1.31ns 0.63 5.21*** -0.11 1.20ns -0.07 0.54ns 0.78 31.88
***
US COS
priv 0.46 3.32** 0.03 0.14ns -0.21 1.56ns 0.30 1.94* 0.82 42.80
***
US LOC
pub 0.32 3.28** 0.35 2.58** -0.26 2.66** 0.08 0.55ns 0.75 17.08
***
US LOC
priv 0.43 3.72*** 0.28 1.74* -0.27 2.60** 0.06 0.36ns 0.85 35.88
***
India
ASC
BA
t-stat ISC
BA
t-stat SSC
BA
t-stat ISSC
BA
t-stat BA
PI
t-stat
India full
sample pub 0.24 3.39** 0.04 0.51ns 0.20 2.67** 0.05 0.55ns 0.87 71.69
***
India full
sample priv 0.26 4.37*** 0.16 2.49** 0.11 1.74* 0.11 1.67* 0.91 95.46
***
India
INDSC pub 0.21 2.25* 0.28 1.98* 0.15 1.30ns -0.01 0.05ns 0.86 64.09
***
India INDSC priv
0.25 4.06*** 0.13 1.66* 0.04 0.50ns 0.21 2.51** 0.88 101.47***
India
INTSC pub 0.36 2.63** -0.12 0.87ns 0.24 2.15* 0.03 0.21ns 0.84 32.70
***
India
INTSC priv 0.39 3.73*** 0.17 1.35ns 0.13 1.13ns -0.05 0.37ns 0.89 40.93
***
India COS
pub 0.19 1.45ns 0.26 1.89* 0.11 0.90ns -0.02 0.13ns 0.89 50.60
***
India COS
priv 0.26 2.63** 0.27 2.28* 0.20 1.83 -0.05 0.43ns 0.89 40.77
***
India LOC
public 0.24 2.57** -0.02 0.17ns 0.24 2.34** 0.07 0.70ns 0.86 54.18
***
India LOC
priv 0.31 4.34*** 0.09 1.18ns 0.12 1.52ns 0.13 1.83* 0.91 78.39
***
Notes: *p < 0.05 **p < 0.01 ***p < 0.001; ns= not significant (two-tailed tests). Acronyms: ASC = Actual self-congruity; ISC = Ideal self-congruity; SSC = Social self-congruity;
ISSC = Ideal social self-congruity; BA = Brand attitude; PI = Purchase intent: INTSC = Interdependent
self-construal; INDSC = Independent self-construal; COS = Cosmopolitan orientation; LOC= Local
orientation

296
Appendix 8.1 Post-Hoc Test Power Distance and Long-Term
Orientation
US and Indian consumers display differing levels of power-distance and long-term
orientation (Hofstede, 2012). The results of H2, H5, and H8 showed divergent results
between two country samples (US and India). This is likely due to the fact that an
individual‘s power distance and long-term orientation levels are impacting the tested
relationships, as they determine how strongly an individual focuses on the self-motives
that drive the various self-congruity types. For instance, high long-term orientation
levels have been linked to an emphasized need towards social-consistency (Bearden et
al., 2006). Hence, it is likely that it will impact the effect of social self-congruity on
brand attitude. In order to account for the potential effects of these two factors on the
three hypotheses that displayed divergent results between the two countries a post-hoc
test was conducted controlling for their impact. To test the impact of power distance and
long-term orientation the hypotheses were tested with and without the control variable
in the corresponding structural model. Subsequently, the path coefficients values were
compared with a t-test. Table A8.1 offers an overview of the results with and without
the control variables. No significant differences (p > 0.05) were found in any of the tests
conducted. Therefore, it is concluded that an individual‘s PD and LTO levels are
unlikely to impact the tested relationships.
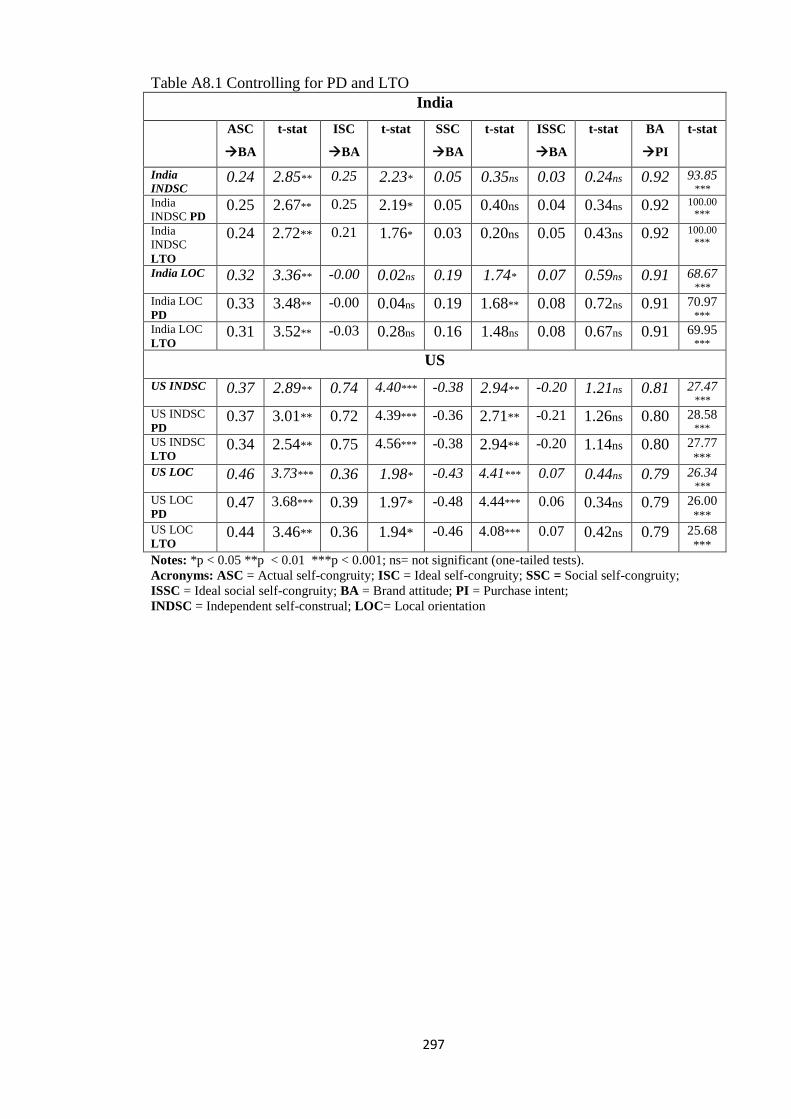
297
Table A8.1 Controlling for PD and LTO
India
ASC
BA
t-stat ISC
BA
t-stat SSC
BA
t-stat ISSC
BA
t-stat BA
PI
t-stat
India
INDSC 0.24 2.85** 0.25 2.23* 0.05 0.35ns 0.03 0.24ns 0.92 93.85
*** India
INDSC PD 0.25 2.67** 0.25 2.19* 0.05 0.40ns 0.04 0.34ns 0.92 100.00
*** India
INDSC
LTO
0.24 2.72** 0.21 1.76* 0.03 0.20ns 0.05 0.43ns 0.92 100.00
***
India LOC 0.32 3.36** -0.00 0.02ns 0.19 1.74* 0.07 0.59ns 0.91 68.67***
India LOC
PD 0.33 3.48** -0.00 0.04ns 0.19 1.68** 0.08 0.72ns 0.91 70.97
*** India LOC
LTO 0.31 3.52** -0.03 0.28ns 0.16 1.48ns 0.08 0.67ns 0.91 69.95
***
US
US INDSC 0.37 2.89** 0.74 4.40*** -0.38 2.94** -0.20 1.21ns 0.81 27.47***
US INDSC
PD 0.37 3.01** 0.72 4.39*** -0.36 2.71** -0.21 1.26ns 0.80 28.58
*** US INDSC
LTO 0.34 2.54** 0.75 4.56*** -0.38 2.94** -0.20 1.14ns 0.80 27.77
*** US LOC 0.46 3.73*** 0.36 1.98* -0.43 4.41*** 0.07 0.44ns 0.79 26.34
*** US LOC
PD 0.47 3.68*** 0.39 1.97* -0.48 4.44*** 0.06 0.34ns 0.79 26.00
*** US LOC
LTO 0.44 3.46** 0.36 1.94* -0.46 4.08*** 0.07 0.42ns 0.79 25.68
*** Notes: *p < 0.05 **p < 0.01 ***p < 0.001; ns= not significant (one-tailed tests). Acronyms: ASC = Actual self-congruity; ISC = Ideal self-congruity; SSC = Social self-congruity;
ISSC = Ideal social self-congruity; BA = Brand attitude; PI = Purchase intent;
INDSC = Independent self-construal; LOC= Local orientation

298
Appendix 8.2 Post-Hoc Test Interaction Effect between Public
and Private Self-congruity Types
The unexpected results of H6 and H12 showed that actual self-congruity rather than
social self-congruity has the strongest effect on brand attitude for individuals with a
dominant INTSC and dominant LOC orientation, respectively. This finding suggests
that there is a potential interaction effect between public and private selves that
enhances how strongly private self-congruity types impact brand attitude. Following the
suggestions by Hair et al. (2014) a post-hoc test was conducted to test for an interaction
effect. The variables that are expected to interact are treated as predictor (e.g. ASC) and
continuous moderator (e.g. SSC) variables of brand attitude. Subsequently, the
moderator variable is mean centred by using the corresponding function in SmartPLS.
This process subtracts the latent variables mean from each observation, consequently
shifting the reference point to an average value that allows interpreting the effects. After
performing this step, the significance level of the interaction effect is re-assessed by
using 500 bootstrapping runs. Subsequently, the PLS algorithm is run again to evaluate
the strength of the interaction effect. For more details on the procedure see Hair et al.
(2014) pages 257 to 270. Table A8.2 gives an overview of the results. With the
exception of the US LOC sample (H12), all the interaction effects between public and
private self-congruity types were significant, hence supporting the potential explanation,
that public self-congruity types enhance the effect of private self-congruity types on
brand attitude.

299
Table A8.2 Path Coefficient Results of Interaction Effects
H6
US – INTSC
Sample
SSC t-stat ISSC t-stat
ASC 0.08 1.65* 0.07 1.47ns
ISC 0.07 1.76* 0.08 1.79*
India –
INTSC
Sample
SSC t-stat ISSC t-stat
ASC 0.19 2.95** 0.22 2.57**
ISC 0.22 3.48** 0.18 2.74**
H12
US – LOC
Sample
SSC t-stat ISSC t-stat
ASC 0.05 0.69ns 0.06 0.76ns
ISC 0.06 0.89ns 0.07 1.07ns
India – LOC
Sample
SSC t-stat ISSC t-stat
ASC 0.24 5.11*** 0.22 4.48***
ISC 0.23 4.71*** 0.23 4.49*** Notes: *p < 0.05 **p < 0.01 ***p < 0.001; ns= not significant (one-tailed tests). Acronyms: ASC = Actual self-congruity; ISC = Ideal self-congruity; SSC = Social self-congruity;
ISSC = Ideal social self-congruity; BA = Brand attitude; INTSC = Interdependent self-construal;
LOC= Local orientation