Université de Montréal Résine échangeuse d'ions en mode ...
218
Université de Montréal Résine échangeuse d’ions en mode biologique pour l’enlèvement de matières organiques naturelles des eaux de surface Par Zhen Liu Département de chimie, Faculté des arts et des sciences Thèse présentée en vue de l’obtention du grade de Doctorat (Ph.D.) en chimie Août, 2021 © Zhen Liu, 2021
-
Upload
khangminh22 -
Category
Documents
-
view
2 -
download
0
Transcript of Université de Montréal Résine échangeuse d'ions en mode ...
Université de Montréal
Résine échangeuse d’ions en mode biologique pour l’enlèvement de matières organiques
naturelles des eaux de surface
Par
Zhen Liu
Département de chimie, Faculté des arts et des sciences
Thèse présentée en vue de l’obtention du grade de Doctorat (Ph.D.) en chimie
Août, 2021
© Zhen Liu, 2021

Université de Montréal
Unité académique : Département de chimie, Faculté des arts et des sciences
Cette thèse intitulée
Résine échangeuse d’ions en mode biologique pour l’enlèvement de matières organiques naturelles des eaux de surface
Présenté par
Zhen Liu
A été évaluée par un jury composé des personnes suivantes
Kevin J. Wilkinson Président-rapporteur
Sébastien Sauvé
Directeur de recherche
Benoit Barbeau Codirecteur
Jesse Shapiro
Membre du jury
Jean-François Blais Examinateur externe

I
Résumé
La matière organique naturelle (MON) est omniprésente dans les eaux de surface. Bien que
l’exposition à la MON via l’eau potable soit commune et ne soit pas associée à des effets directs
sur la santé humaine, la MON peut avoir des impacts négatifs sur la production d’eau potable,
tels que la contribution aux goûts et odeurs, le développement du biofilm dans les systèmes de
distribution et la formation de sous-produits de désinfection. La résine échangeuse d’ions en
mode biologique (en anglais : Biological ion exchange, BIEX) est un processus prometteur pour
l’enlèvement de la MON des eaux de surface. Il s’agit d’opérer la résine échangeuse d’ions dans
un réacteur à lit fixe avec une régénération peu fréquente de sorte qu’une communauté
microbienne peut se développer sur la surface de résine et ainsi contribuer à l’enlèvement de la
MON par biodégradation. Néanmoins, les mécanismes de l’enlèvement de la MON dans le BIEX
et la faisabilité de son application dans l’usine de production d’eau potable demeurent inconnus.
Ainsi, l’objectif de cette thèse est 1) de comprendre et favoriser l’application du BIEX pour
l’enlèvement de la MON des eaux de surface et 2) de résumer les stratégies qui peuvent alléger
la gestion de la saumure engendrée par la régénération de résines. Les résines en forme chlorure
et bicarbonate ont été d’abord évaluées pour l’application du BIEX où le pilote de BIEX a été
alimenté par l’eau de surface pendant 9 mois sans régénération. Les résultats ont démontré que
l’échange d’ions est le mécanisme dominant pour le BIEX, i.e., la MON échange avec les ions
préchargés (i.e., chlorure et bicarbonate) et les ions préretenus (i.e., sulfate). En plus, les résines
colonisées ont été prélevées du pilote et testées en laboratoire où les résines colonisées ont été
mises en contact avec les composés de modèles (i.e., micropolluants organiques). Les résultats
ont démontré que la biodégradation contribuait à l’enlèvement de micropolluants organiques sur
les résines colonisées, mais le degré de biodégradation dépend des caractères de micropolluants
organiques et la communauté microbienne sur les résines. Ensuite, le BIEX a été évalué en
parallèle du charbon actif biologique (CAB) en filtration secondaire dans l’usine de production
d’eau potable de Sainte-Rose. Les résultats ont démontré que bien que le BIEX ait réalisé un
enlèvement du carbone organique dissous (COD) plus élevé par rapport à celui du CAB, il a une

II
perte de charge plus significative et le rétrolavage de BIEX s’avère être plus complexe par rapport
à celui de CAB. Finalement, une revue de littérature a été menée afin d’identifier les stratégies
sur l’opération de résine et la gestion de saumure, et ainsi d’alléger la gestion de la saumure
engendrée par la régénération de résines échangeuses d’ions. En somme, cette thèse permet de
comprendre les mécanismes de l’enlèvement de la MON dans le BIEX, évaluer la faisabilité de son
application dans l’usine de production d’eau potable ainsi qu’identifier les stratégies qui peuvent
alléger la gestion de la saumure engendrée par la régénération de résines échangeuses d’ions.
Mots-clés : matière organique naturelle, sous-produits de désinfection, micropolluants, résine
échangeuse d’ions, adsorption, biodégradation, BIEX, gestion de saumure, traitement de l’eau
potable.

III
Abstract
Natural organic matter (NOM) is ubiquitous in surface water. Although the exposure to NOM via
drinking water is common and is not associated with direct effects on human health, NOM can
cause negative impacts on drinking water treatment, such as contribution to taste and odors,
development of biofilms in distribution systems and formation of disinfection by-products.
Biological ion exchange (BIEX) is a promising process for the removal of NOM from surface waters.
It involves operating the ion exchange resin in a fixed bed reactor with infrequent regeneration
so that a microbial community can develop on the resin surface and thus contribute to the
removal of NOM by biodegradation. However, the mechanisms for the removal of NOM in BIEX
and the feasibility of its application in the drinking water plant remain unknown. Therefore, the
general objective of this thesis is 1) to understand and promote the application of BIEX for the
removal of NOM from surface water and 2) to summarize the strategies that can alleviate the
management of the brine generated by the regeneration of resins. Chloride and bicarbonate-form
resins were first evaluated for the BIEX application where the BIEX pilot was fed with surface
water for 9 months without regeneration. The results demonstrated that ion exchange is the
dominant mechanism in BIEX, i.e., NOM exchanges with preloaded ions (i.e., chloride and
bicarbonate) and pre-retained ions (i.e., sulfate). In addition, the colonized resins were harvested
from the pilot and tested in the laboratory where the colonized resins were in contact with the
model compounds (i.e., organic micropollutants). The results demonstrated that biodegradation
contributes to the removal of organic micropollutants on colonized resins, but the extent of
biodegradation depends on the characteristics of the organic micropollutants and the microbial
community on the resins. Then, BIEX was evaluated in parallel with biological activated carbon
(BAC) at the second-stage filtration of the Sainte-Rose drinking water treatment plant. The results
demonstrated that although BIEX achieved higher dissolved organic carbon (DOC) removal
compared to BAC, it had a more significant pressure drop and the backwash of BIEX filters was
proved to be more complex compared to that of BAC. Finally, a literature review was carried out
to identify strategies on resin operation and brine management, and thus alleviate the
management of the brine generated by the regeneration of ion exchange resins. Overall, this
IV
thesis allows understanding the mechanisms for the removal of NOM in BIEX, evaluating the
feasibility of its application in drinking water production plants as well as identifying the strategies
that can alleviate the management of the brine generated by the regeneration of ion exchange
resins.
Keywords: natural organic matter, disinfection by-products, micropollutants, ion exchange
resins, adsorption, biodegradation, BIEX, brine management, drinking water treatment.

V
Table des matières
Résumé ............................................................................................................................... I
Abstract ............................................................................................................................ III
Table des matières ............................................................................................................ V
Liste des tableaux ........................................................................................................... XII
Liste des figures ............................................................................................................. XIV
Liste des sigles et abréviations ..................................................................................... XVIII
Remerciements .............................................................................................................. XXI
Chapitre 1 – Introduction ................................................................................................... 1
1.1 Matière organique naturelle ....................................................................................................... 1
1.1.1 Définition et classement ............................................................................................................................. 1
1.1.2 Impact en eau potable ................................................................................................................................ 4
1.1.3 Mesure et caractérisation ........................................................................................................................... 5
1.1.4 Source et occurrence .................................................................................................................................. 8
1.2 Procédés de traitement pour l’enlèvement de la MON .............................................................. 10
1.2.1 Coagulation ............................................................................................................................................... 11
1.2.2 Adsorption ................................................................................................................................................ 11
1.2.3 Filtration membranaire ............................................................................................................................. 12
1.2.4 Processus d’oxydation avancée ................................................................................................................ 13
1.2.5 Biodégradation ......................................................................................................................................... 14
1.2.6 Échange d’ions .......................................................................................................................................... 16
VI
1.2.7 Résine échangeuse d’ions en mode biologique ........................................................................................ 22
1.3 Problématiques, objectifs, hypothèses et structure de la thèse ................................................. 23
1.3.1 Problématiques ......................................................................................................................................... 23
1.3.2 Objectifs et hypothèses ............................................................................................................................ 24
1.3.3 Structure de la thèse ................................................................................................................................. 25
Références ...................................................................................................................................... 27
Chapitre 2 – Operating bicarbonate-form versus chloride-form ion exchange resins without
regeneration for natural organic matter removal ............................................................. 38
Abstract .......................................................................................................................................... 38
2.1 Introduction .............................................................................................................................. 39
2.2 Methods and materials .............................................................................................................. 41
2.2.1 Resin preconditioning ............................................................................................................................... 41
2.2.2 Pilot location and source water characteristics ........................................................................................ 42
2.2.3 Pilot design and operation ........................................................................................................................ 42
2.2.4 Analytical methods ................................................................................................................................... 42
2.2.5 Calculation of BIEX loadings ...................................................................................................................... 43
2.2.6 Statistical analysis ..................................................................................................................................... 44
2.3 Results and discussion ............................................................................................................... 44
2.3.1 BIEX loading during pilot study ................................................................................................................. 44
2.3.2 NOM removal ........................................................................................................................................... 45
2.3.3 BDOC removal ........................................................................................................................................... 47
2.3.4 THM and HAA precursors removal ........................................................................................................... 49
2.3.5 NOM hydrophobicity ................................................................................................................................ 50
2.3.6 NOM fractionation .................................................................................................................................... 51
VII
2.3.7 Implications for IX operation for NOM removal ....................................................................................... 53
2.4 Conclusions ............................................................................................................................... 54
2.5 Supplementary materials ........................................................................................................... 55
References ...................................................................................................................................... 58
Chapitre 3 – Removal of organic micropollutants from surface waters by biological ion exchange
resins ............................................................................................................................... 64
Abstract .......................................................................................................................................... 64
3.1 Introduction .............................................................................................................................. 65
3.2 Materials and methods .............................................................................................................. 67
3.2.1 Biological ion exchange (BIEX) resins characteristics ................................................................................ 67
3.2.2 Raw water characteristics ......................................................................................................................... 67
3.2.3 Target micropollutants ............................................................................................................................. 67
3.2.4 Batch tests ................................................................................................................................................ 69
3.2.5 Analytical methods ................................................................................................................................... 70
3.2.6 Data analysis ............................................................................................................................................. 70
3.2.6.1 Micropollutant removal kinetics ....................................................................................................... 70
3.2.6.2 Suspect screening of transformation products ................................................................................. 71
3.3 Results and discussion ............................................................................................................... 72
3.3.1 Organic micropollutant concentrations in the raw water ........................................................................ 72
3.3.2 Micropollutant removal during batch tests .............................................................................................. 73
3.3.3 Suspect screening of transformation products ......................................................................................... 78
3.3.4 Implications on the application of ion exchange resins ............................................................................ 80
3.4 Conclusions ............................................................................................................................... 81
VIII
3.5 Supplementary materials ........................................................................................................... 81
References ...................................................................................................................................... 90
Chapitre 4 – Biological ion exchange as an alternative to biological activated carbon for drinking
water treatment .............................................................................................................. 95
Abstract .......................................................................................................................................... 95
4.1 Introduction .............................................................................................................................. 96
4.2 Materials and Methods ............................................................................................................. 98
4.2.1 Pilot location and source water characteristics ........................................................................................ 98
4.2.2 Pilot plant design and operation ............................................................................................................... 99
4.2.3 Analytical methods ................................................................................................................................. 101
4.3 Results ..................................................................................................................................... 102
4.3.1 Head loss accumulation .......................................................................................................................... 102
4.3.2 NOM removal ......................................................................................................................................... 103
4.3.3 Removal of THM and HAA precursors .................................................................................................... 106
4.3.4 Impact of BIEX on inorganic anions ........................................................................................................ 106
4.3.5 Removal of ammonia .............................................................................................................................. 108
4.4 Discussion ................................................................................................................................ 109
4.4.1 Head loss in the BIEX filter ...................................................................................................................... 109
4.4.2 NOM removal mechanisms in the BIEX filter .......................................................................................... 110
4.4.3 Ammonia release in the BIEX filter ......................................................................................................... 114
4.5 Conclusion ............................................................................................................................... 114
4.6 Supplementary materials ......................................................................................................... 115
References .................................................................................................................................... 118

IX
Chapitre 5 – Alleviating the burden of ion exchange brine in water treatment: from operational
strategies to brine management .................................................................................... 123
Abstract ........................................................................................................................................ 123
5.1 Introduction ............................................................................................................................ 123
5.2 Ion exchange brine characteristics ........................................................................................... 125
5.3 Ion exchange operational strategies to facilitate brine management ....................................... 130
5.3.1 Resin selection strategies ....................................................................................................................... 130
5.3.2 Resin contactor configuration ................................................................................................................. 132
5.3.3 Novel ion exchange operational mode ................................................................................................... 132
5.3.4 Novel ion exchange regeneration strategies .......................................................................................... 133
5.3.4.1 Segmented regeneration ................................................................................................................ 133
5.3.4.2 Alternative regenerants to NaCl ..................................................................................................... 134
5.3.4.2.1 Alternative regenerants for cation exchange resins ............................................................... 134
5.3.4.2.2 Alternative regenerants for anion exchange resins ................................................................ 135
5.3.4.3 No-chemical-addition regeneration ................................................................................................ 136
5.3.4.3.1 Biological regeneration ........................................................................................................... 136
5.3.4.3.2 Electrochemical regeneration ................................................................................................. 137
5.3.4.3.3 Thermal regeneration ............................................................................................................. 138
5.4 Ion exchange brine management ............................................................................................. 139
5.4.1 Ion exchange brine reuse ........................................................................................................................ 139
5.4.1.1 Direct reuse ..................................................................................................................................... 139
5.4.1.2 Treatment strategies for reuse ....................................................................................................... 140
5.4.1.2.1 Treatment strategies for hardness-laden brine ...................................................................... 141
5.4.1.2.2 Treatment strategies for arsenic-laden brine .......................................................................... 142
5.4.1.2.3 Treatment strategies for chrome-laden brine ......................................................................... 142
X
5.4.1.2.4 Treatment strategies for NOM-laden brine ............................................................................ 143
5.4.1.2.5 Treatment strategies for trace organic pollutants-laden brine ............................................... 144
5.4.1.2.6 Treatment strategies for nitrate- and perchlorate-laden brine .............................................. 145
5.4.2 Ion exchange brine disposal .................................................................................................................... 148
5.4.2.1 Direct disposal ................................................................................................................................. 149
5.4.2.2 Treatment strategies for disposal ................................................................................................... 150
5.5 Discussion and Conclusions ...................................................................................................... 151
References .................................................................................................................................... 154
Chapitre 6 – Conclusions et perspectives ........................................................................ 170
6.1 Conclusions ............................................................................................................................. 170
6.2 Perspectives ............................................................................................................................ 173
Annexe A – Biological ion exchange as an alternative to biological activated carbon for natural
organic matter removal: impact of temperature and empty bed contact time (EBCT) .... 176
Abstract ........................................................................................................................................ 176
A.1 Introduction ............................................................................................................................ 177
A.2 Materials and Methods ........................................................................................................... 179
A.2.1 Feed water .............................................................................................................................................. 179
A.2.2 Filtration media ...................................................................................................................................... 180
A.2.3 Bench-scale systems ............................................................................................................................... 180
A.2.4 Analytical Methods ................................................................................................................................. 181
A.2.5 Data analysis ........................................................................................................................................... 182
A.3 Results and discussion ............................................................................................................. 183
A.3.1 DOC removal ........................................................................................................................................... 183

XI
A.3.2 Impact of temperature and EBCT on DOC removal ................................................................................ 185
A.3.3 Impact of temperature on DOC removal kinetics ................................................................................... 186
A.3.4 Implication on the operation of biofilters for NOM removal ................................................................. 190
A.4 Conclusion .............................................................................................................................. 191
References .................................................................................................................................... 191

XII
Liste des tableaux
Tableau 1.1 - Fractions de la MON par rapport à la polarité et la charge (Health Canada, 2020). 3
Tableau 1.2 - Carbone organique total (COT) dans les eaux brutes pour différentes provinces et
territoires canadiens (Canada Health, 2020). ................................................................................. 9
Table S2.1 - Raw water physicochemical characteristics (April. 2019 – January. 2020). .............. 56
Table S2.2 - Source water natural organic matter (NOM) fractions expressed in percentage of
dissolved organic carbon (DOC). ................................................................................................... 57
Table 3.1 - Organic micropollutants selected for the present study. ........................................... 68
Table 3.2 - Micropollutant concentrations in the raw water prior to resin harvesting. Values and
error bars respectively correspond to average and standard deviation of monthly measurements.
...................................................................................................................................................... 72
Table 3.3 - Rate constants (k) and coefficients of determination (R2) for the kinetic models of
micropollutant removal during batch tests. Fitting with R2 lower than 0.25 was designated as not
available. ....................................................................................................................................... 77
Table 3.4 - Estimated concentrations of theobromine and 1-hydroxyibuprofen during the batch
test. ............................................................................................................................................... 79
Table S3.1 - Raw water characteristics ......................................................................................... 82
Table S3.2 - Potential transformation products of selected micropollutants based on the
literature. ...................................................................................................................................... 85
Table 4.1 - Influent water characteristics (average ± standard deviation) during the pilot study
period (April 11, 2018 to January 07, 2019) ................................................................................. 99
Table 4.2 - Media characteristics for IX, three different GAC and BAC used in this study ......... 101
Table 5.1 - Physicochemical characteristics of ion exchange brine following a single regeneration
.................................................................................................................................................... 127
Table A1 - Feed water physicochemical characteristics. Values and confidence interval
respectively correspond to average and standard deviation of measurements during the study
period. ......................................................................................................................................... 179

XIII
Table A2 - Normalized DOC removal rate constants, normalized residual DOC concentrations and
temperature activity coefficients for BIEX and BAC filters. The confidence interval as well as values
in the paratheses corresponds to the standard error of the estimated parameters. ................ 188

XIV
Liste des figures
Figure 1.1 - Structures moléculaires hypothétiques pour l’acide humique et l’acide fulvique
(Stevenson, 1982; Buffle, 1977). ..................................................................................................... 2
Figure 1.2 - Aperçu des processus de traitement pour l’enlèvement de la MON. ....................... 11
Figure 1.3 - Configuration de réacteur pour la résine échangeuse d’ions. (A) : Procédé MIEX; (B) :
Procédé SIX; (C) Procédé FIX; (D) Contacteur à lit fixé. ................................................................. 19
Figure 2.1 - Cumulative loading (eq/L of resin) in the (A) bicarbonate-form BIEX (BIEX-B) and (B)
chloride-form BIEX (BIEX-C) for four anions and dissolved organic carbon (DOC) throughout the
study period (≈ 24 000 BV or 250 days). No regeneration occurred during this period. ............ 45
Figure 2.2 - (A) Normalized effluent dissolved organic carbon concentrations (DOC/DOC0) of
bicarbonate-form BIEX (BIEX-B) and chloride-form BIEX (BIEX-C) filters throughout the study
period (≈ 24 000 BV or 250 days). (B) conceptional displacement of different solutes in the BIEX-
B filter in primary ion exchange, secondary ion exchange and exhaustion phases. NOM was broken
up into three conceptional fractions with an affinity sequence of NOM3>SO42->NOM2>HCO3-
>NOM1. ......................................................................................................................................... 47
Figure 2.3 - Biodegradable dissolved organic carbon (BDOC) removal in bicarbonate-form BIEX
(BIEX-B) and chloride-form BIEX (BIEX-C) filters. .......................................................................... 48
Figure 2.4 - Natural organic matter (NOM) reactivities (expressed as µg disinfection by-products
per mg Cl2 consumed) in raw water, bicarbonate-form BIEX (BIEX-B) and chloride-form BIEX (BIEX-
C) effluents from 5 300 to 11 000 bed volumes (i.e., secondary IX). ............................................ 50
Figure 2.5 - Normalized effluent specific ultraviolet absorbance at 254 nm (SUVA/SUVA0) of
bicarbonate-form BIEX (BIEX-B) and chloride-form BIEX (BIEX-C) filters throughout the study
period (≈ 24 000 BV or 250 days). ............................................................................................... 51
Figure 2.6 - Removals of natural organic matter (NOM) fractions in bicarbonate-form BIEX (BIEX-
B). .................................................................................................................................................. 52
Figure S2.1 - Average heterotrophic biomass measured by 14C glucose respiration test as a
function of media depth and empty bed contact time (EBCT) of the bicarbonate-form BIEX (BIEX-

XV
B) and the chloride-form BIEX (BIEX-C) filters at 10 000 BV. Error bars represent the maximum and
the minimum biomass value of triplicate analysis. ....................................................................... 55
Figure S2.2 - Disinfection by-product concentrations (B) in raw water, chloride-form BIEX (BIEX-
C) and bicarbonate-form BIEX (BIEX-B) effluents from 5 300 to 11 000 bed volumes (i.e., secondary
IX). ................................................................................................................................................. 55
Figure S2.3 - Removals of natural organic matter (NOM) fractions in chloride-form BIEX (BIEX-C).
...................................................................................................................................................... 56
Figure S2.4 - Ammonia nitrogen concentration in raw water, chloride-form BIEX (BIEX-C) and
bicarbonate-form BIEX (BIEX-B) effluents from June to August (4 600 – 12 000 bed volumes).
Water temperature: 13-26 °C. ...................................................................................................... 56
Figure 3.1 - Micropollutants removal during batch tests under biotic and abiotic conditions.
Trendlines correspond to the kinetic model (pseudo-1st or pseudo-2nd order) fitted to the data.
Kinetic parameters of the fitted models are summarized in Table 3. Error bars were omitted due
to overlapping with data points. ................................................................................................... 76
Figure 3.2 – Normalized micropollutant concentrations after 24 h batch test. Error bars
correspond to the minimum and maximum values between test groups and controls. CAF:
caffeine; E2: Estradiol; IBU: ibuprofen; NAP: naproxen; THI: thiamethoxam; ATZ: atrazine; PFOA:
perfluorooctanoic acid; PFOS: perfluorooctanesulfonic acid. ...................................................... 78
Figure S3.1 - Micropollutant recovery of different types of filters. .............................................. 83
Figure S3.2 - Chromatographic separation at m/z 181.07255 (positive mode). ........................... 87
Figure S3.3 - Isotopic pattern at m/z 181.07255 (positive mode). ............................................... 87
Figure S3.4 - Fragmentation spectra at 4.01 min for m/z 181.07255 with specific fragments of
theobromine. ................................................................................................................................ 88
Figure S3.5 - Chromatographic separation at m/z 221.11666 (negative mode). ......................... 89
Figure S3.6 - Isotopic pattern at m/z 221.11666 (negative mode). .............................................. 89
Figure S3.7 - Fragmentation spectra at 5.09 min for m/z 221.11666 with specific fragments of 1-
hydroxyibuprofen. ........................................................................................................................ 90

XVI
Figure 4.1 - Schematic overview of the pilot plant consisting of five parallel columns: BIEX, three
GAC filters and one BAC filter. The pilot is fed with coagulated/settled/filtered/ozonated surface
waters from the Sainte-Rose drinking water treatment plant. .................................................. 100
Figure 4.2 - Head loss accumulation for the BIEX, three GAC and the BAC filter after (i) 30 min of
operation following a backwash (D1), (ii) seven days of operation (D7) and (iii) fourteen days of
operation (D14). ......................................................................................................................... 103
Figure 4.3 - Normalized DOC concentrations (Ceffluent/Cinfluent) in the effluents of the BIEX filter,
three GAC filters and one BAC filter for the study period from April 11, 2018 to January 07, 2019.
.................................................................................................................................................... 104
Figure 4.4 - Distribution of total DOC removal (0.87, 0.76, 0.73, 0.71, 0.52 mg C/L) in the upper
(30 cm) vs. lower layer (150 cm) for BIEX, GAC1, GAC2, GAC3 and BAC, realized at about 21 000
BV. ............................................................................................................................................... 105
Figure 4.5 - Distribution of (A) THM-UFC and (B) HAA5-UFC precursors in the influent and effluents
of the filter media under investigation. Period: 18 000 to 32 000 BV. Numbers indicate the average
concentrations. ........................................................................................................................... 106
Figure 4.6 - Evolution of the anion concentrations on the resin during 34 000 BV. ................... 108
Figure 4.7 - Normalized ammonia concentration in the effluents of the BIEX filter, three GAC filters
and one BAC filter for the study period from April 11, 2018 to January 7, 2019. ...................... 109
Figure 4.8 - Displacement of NOM fractions in the BIEX filter a) virgin IEX; b) NOM3, sulfate and
NOM2 replace chloride while NOM1 is nonexchangeable; c) NOM3 and sulfate replace NOM2
leading to the DOC release in the BIEX filter; d) NOM3 replaces sulfate, which explains the long-
term performance of NOM removal in the BIEX filter. N.B. The anion on each band presents the
dominant species but not the only one. ..................................................................................... 112
Figure S4.1 - Normalized UVA254 (UVAout/UVAin) in the effluents of the BIEX filter, three GAC filters
and one BAC filter for the study period from April 11, 2018 to January 7, 2019. ...................... 115
Figure S4.2 - Ammonia removal as function of media depth (or EBCT), profile realized in warm
waters (week 21, » 20 000 BV, T = 21°C) for BIEX filter, three GAC filters and one BAC filter. .. 116
Figure S4.3 - A thick layer of biomass formed on the top of BIEX media, which proved to be difficult
to breakdown during the backwash. .......................................................................................... 117
XVII
Figure S4.4 - Schematic presentation of a) virgin IX with loosely-packed and uniform morphology
at the beginning of test; 2) inter-chain or intra-chain ion bridging induced by multivalent anions
after long period of operation; ................................................................................................... 118
Figure 5.1 - Ion exchange (IX) plant design workflow integrated with IX operational strategies and
IX brine management. ................................................................................................................ 153
Figure A1 - Bench-scale biofiltration system (single filter illustrated). ....................................... 181
Figure A2 - Typical normalized DOC in the BIEX and BAC filter effluents for the different
temperature considered. Results presented for Port 3 corresponding to an EBCT of 30 min. .. 184
Figure A3 - Average DOC removal in BIEX and BAC filters during steady state (after about 40 days
of operation) for the different conditions investigated. Error bars correspond the standard error
of averages during the steady state period. ............................................................................... 186
Figure A4 - Normalized DOC vs. EBCT at different temperatures. Note that the normalized DOC
data is the same as in Figure A3 but presented with equation A1 fitted to the data. Confidence
intervals were omitted because of overlapping with data symbols. .......................................... 188
Figure A5 - Rate constants vs temperature. Note that the rate constants are the same as those
listed in table 2 but presented with equation 2 fitted to the data. Confidence intervals were
omitted because of overlapping with data symbols. .................................................................. 190

XVIII
Liste des sigles et abréviations
AIX : Anion exchange resins
ATP : Adenosine triphosphate
BB : Building blocks
BDOC : Biodegradable dissolved organic carbon
BIEX : Biological ion exchange
BP : Biopolymers
CIX : Cation exchange resins
DBP : Disinfection by-products
DOC : Dissolved organic carbon
EBCT : Empty bed contact time
EEM : Excitation-emission matrice
HAA : Haloacetic acids
HS : Humics
IX : Ion exchange resins
LC-OCD : Liquid chromatography – organic carbon detector
LMW acids : low molecular weight acids
LMW neutrals : low molecular weight neutrals
MWCO : Molecular weight cut-off
MIEX : Magnetic ion exchange
NOM : Natural organic matter
XIX
SBA : Strong base anion exchange
SUVA : Specific ultraviolet absorbance
THM : Trihalomethane
UV : Ultraviolet
WBA : Weak base anion exchange
WTP : Water treatment plants
CAB : Charbon actif biologique
CAG : Charbon actif en grain
CAP : Charbon actif en poudre
COA : Carbone organique assimilable
COD : Carbone organique dissous
CODB : Carbone organique dissous biodégradable
COP : Carbone organique particulaire
COT : Carbone organique total
DCO : Demande chimique en oxygène
MOB : Matière organique biodégradable
MON : Matière organique naturelle
MF : Microfiltration
NF : Nanofiltration
OI : Osmose inverse
SPD : Sous-produits de désinfection
UF : Ultrafiltration

XX
À mon épouse Xiameng Feng, ma mère Xiuzhi Zhang et mon père Yuping Liu.

XXI
Remerciements
Tout d’abord, je tiens à exprimer mes reconnaissances à mon directeur Dr. Sébastien Sauvé et co-
directeur Dr. Benoit Barbeau. Pour Dr. Sébastien Sauvé, je vous remercie de m’avoir donné le
ticket pour ce voyage formidable à l’Université de Montréal. On dit « 知遇之恩 » en chinois, c’est-
à-dire que je serais toujours reconnaissant pour votre gentillesse de reconnaître ma valeur et me
recruter dans votre équipe. Pour Dr. Benoit Barbeau, je vous remercie de m’avoir guidé et
encouragé pendant ce voyage impeccable. On dit « 教诲之恩 » en chinois, c’est-à-dire que je
serais toujours reconnaissant pour vos conseils et critiques, ceux qui m’ont bénéficié au cours de
mon doctorat et me bénéficieront certainement à l’avenir.
Ensuite, j’aimerais exprimer mes remerciements à Dr. Pierre Bérubé et Dr. Madjid Mohseni de
l’Université de Colombie Britannique pour vos suggestions sur mes projets de recherche.
J’aimerais particulièrement remercier Dr. Pierre Bérubé de m’avoir inclus dans votre projet de
recherche et m’avoir fait confiance pour la rédaction de l’article.
En plus, j’aimerais remercier nos collaborateurs, l’usine de production d’eau potable de Pont-Viau
et de Sainte-Rose, pour leurs soutiens sur le terrain. Je remercie également le programme
FONCER-TEDGIEER (Technologies environnementales de décontamination et gestion intégrée des
eaux et effluents résiduaires) pour la bourse doctorale.
Par ailleurs, je remercie Dr. Kim Lompe, Dr. Isabelle Papineau et Dr. Morgan Solliec pour leurs
suggestions et critiques sur mes plans expérimentaux et mes articles. Vos professionnalismes et
rigueurs sur la recherche m’ont inspiré énormément. C’était un grand plaisir et honneur d’avoir
travaillé avec vous. D’ailleurs, je remercie Yves Fontaine, Mireille Blais, Tetiana Elyart, Julie
Philibert, Jacinthe Mailly, Gabriel St-Jean et Dr. Sung Vo Duy pour leurs soutiens techniques, que
ce soit sur le terrain ou au laboratoire, ainsi que leurs patiences pendant nos communications. Je
remercie également les stagiaires Élise Renault, Pauline Morasse et Maxime Combes pour leurs
aides pour la maintenance des pilotes et les travaux au laboratoire.

XXII
Pour mon épouse Xiameng Feng, je suis très chanceux de t’avoir avec moi le longue du chemin de
ma vie. Tu n’es pas seulement ma conjointe mais aussi ma confidente. Je te remercie pour tes
accompagnements, encouragements et confiances. Grâce à toi, cela me fait plus d’envie
d’imaginer l’avenir.
Pour mes parents, je vais vous écrire en chinois. 感谢父母的养育之恩,感谢父母在物质和精
神上对我一如既往的支持。每当我遇到困难或是人生的重要选择时,你们都能给予我鼓励,
打消我的疑虑,让我更加坚定地走下去。是你们不服输、不放弃、坚毅、强大的内心造就
了我现在独立、上进的人格。我自认为并不是一个聪明绝顶的人, 但是我是一个爱“做梦”
并且愿为之默默努力的人。感谢父母在我“做梦”的时候,给予我力量和勇气,让我无所
畏惧,大胆地去追梦。
1
Chapitre 1 – Introduction
1.1 Matière organique naturelle
1.1.1 Définition et classement La matière organique naturelle (MON) est définie comme une matrice complexe des substances
organiques présentes dans les eaux, les sédiments et les sols. Les composés de MON varient
énormément en termes de taille, d’hydrophobicité et de structure. Par exemple, chaque composé
de MON peut comprendre une combinaison unique de groupes fonctionnels, y compris
benzéniques, phénoliques, carboxyliques, hydroxyles, amines, estériques, nitrogénés (Gjessing,
1976). La composition de la MON varie d’abord géographiquement parce que la concentration et
les caractéristiques de la MON dépendent de son origine laquelle est dictée par les conditions
géographiques (dont l’hydrographie, la pédologie et la végétation) ainsi que les conditions
climatiques (Fabris et al., 2008). En plus, la composition de la MON varie temporellement pour
une même location dû à la variation climatique saisonnière (Simith and Kamal, 2009). Par
exemple, les précipitations, les ruissellements de fonte des neiges, les inondations et les
sécheresses contribuent à la variation saisonnière de la composition de la MON (Delpla et al.,
2009).
Étant donné la complexité de la composition de la MON, les composés de MON sont rarement
étudiés individuellement. En revanche, la MON est communément étudiée de façon collective
afin d’identifier des caractéristiques propres à la MON. Premièrement, la MON est constituée en
de substances non-humiques et de substances humiques. Les composés de substances non-
humiques ont des formules moléculaires distinctes avec des identités uniques, tels que glucides,
graisses, cires, alcanes, peptides, acides aminés, protéines, lipides et acides organiques (Adusei-
Gyamfi et al., 2019), alors que les substances humiques n’ont pas de formule moléculaire unique.
L’analyse élémentaire démontre que les substances humiques sont composées principalement
de carbone (55%-57%), oxygène (34%-36%), hydrogène (4%-6%), azote (0,9%-3%) et sulfure
(0,4%-1,8%) (Rice and MacCarthy, 1991; Pettit, 2004; Bravo et al., 2017). Les groupes
2
fonctionnels, tels que carboxyle, phénol et alcool, sont les plus fréquemment présents dans les
substances humiques. Les substances humiques peuvent être d’avantage divisées en trois
fractions : 1) l’humine (masse molaire : 100 kDa -10 000 kDa) est insoluble dans l’eau quel que
soit le pH; 2) l’acide humique (masse molaire : 0,5 kDa-100 kDa) est soluble à pH > 2 et 3) l’acide
fulvique (masse molaire : 0,2 kDa-10 kDa) est soluble dans toutes les conditions de pH (Sillanpää,
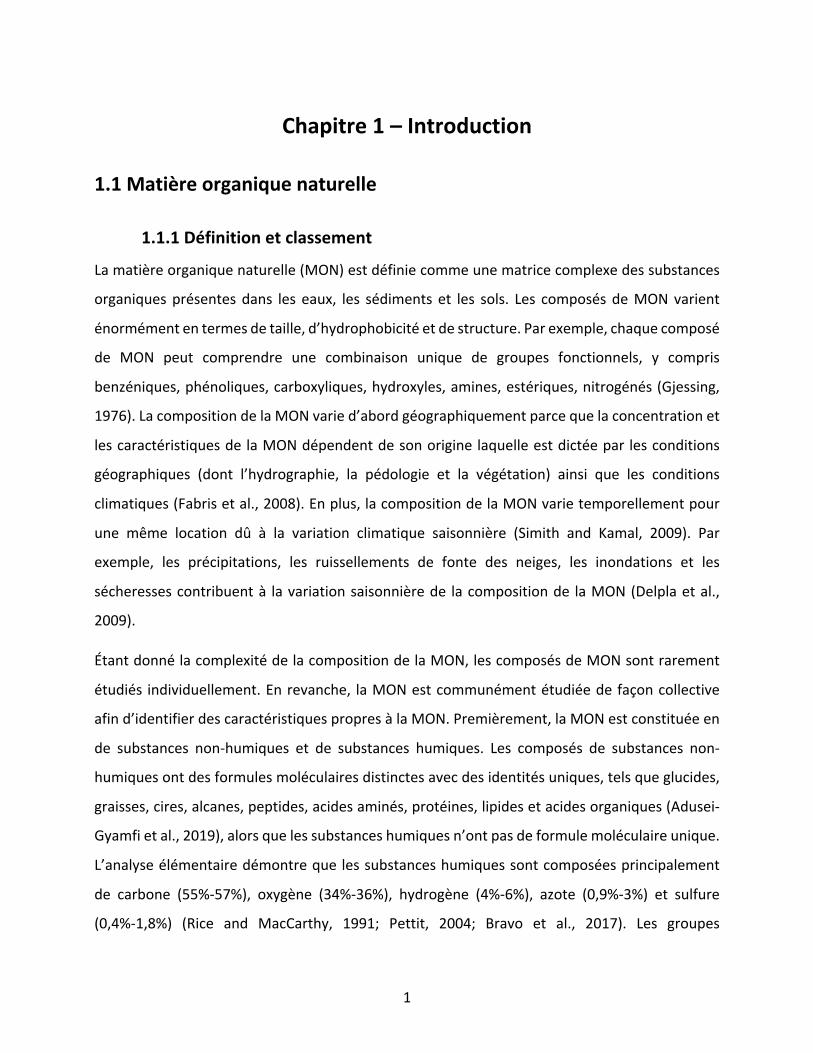
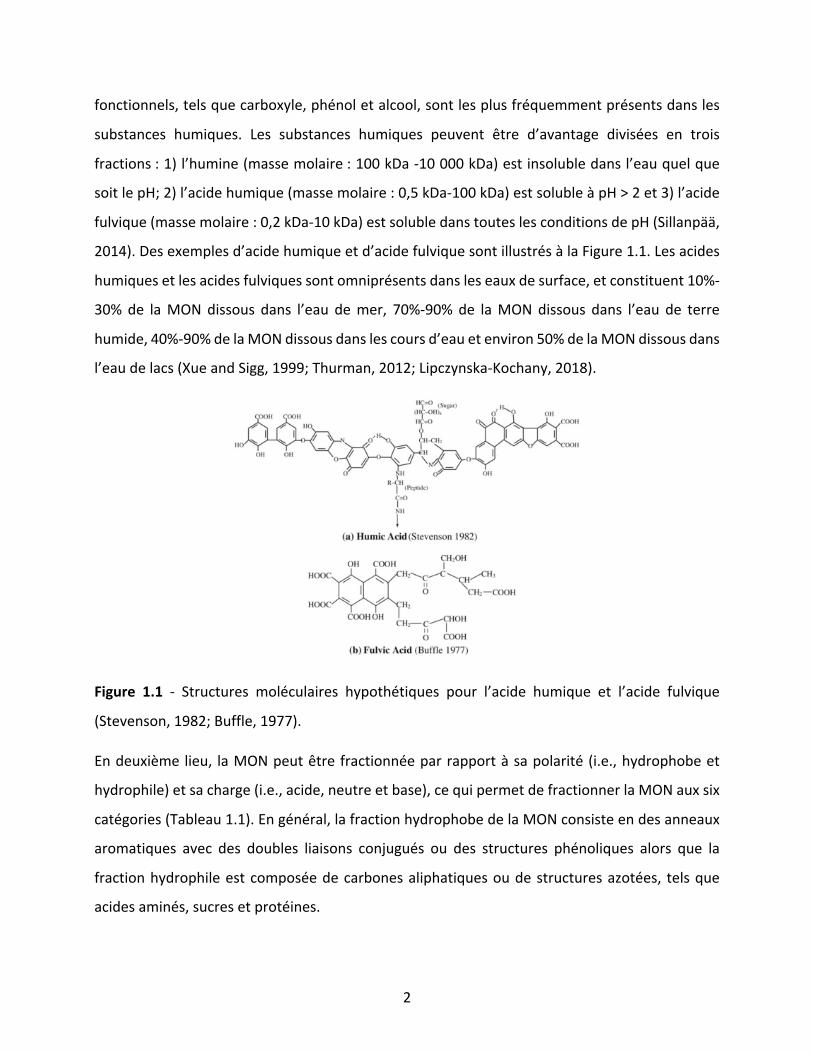
2014). Des exemples d’acide humique et d’acide fulvique sont illustrés à la Figure 1.1. Les acides
humiques et les acides fulviques sont omniprésents dans les eaux de surface, et constituent 10%-
30% de la MON dissous dans l’eau de mer, 70%-90% de la MON dissous dans l’eau de terre
humide, 40%-90% de la MON dissous dans les cours d’eau et environ 50% de la MON dissous dans
l’eau de lacs (Xue and Sigg, 1999; Thurman, 2012; Lipczynska-Kochany, 2018).
Figure 1.1 - Structures moléculaires hypothétiques pour l’acide humique et l’acide fulvique
(Stevenson, 1982; Buffle, 1977).
En deuxième lieu, la MON peut être fractionnée par rapport à sa polarité (i.e., hydrophobe et
hydrophile) et sa charge (i.e., acide, neutre et base), ce qui permet de fractionner la MON aux six
catégories (Tableau 1.1). En général, la fraction hydrophobe de la MON consiste en des anneaux
aromatiques avec des doubles liaisons conjugués ou des structures phénoliques alors que la
fraction hydrophile est composée de carbones aliphatiques ou de structures azotées, tels que
acides aminés, sucres et protéines.

3
Tableau 1.1 - Fractions de la MON par rapport à la polarité et la charge (Health Canada, 2020).
Fraction Classe de composés
Hydrophobe
Acides Acides forts : acides humiques et fulviques, acides alkyl monocarboxyliques et
dicarboxyliques de haute masse moléculaire, acides aromatiques
Acides faibles : Phénols, tannins, acides alkyl monocarboxyliques et dicarboxyliques de
moyenne masse moléculaire
Bases Protéines, amines aromatiques, amines alkyl de haute masse molaire
Neutres Hydrocarbures (par exemple, terpénoïdes), aldéhydes, méthylcétones et alcools
alkyliques de masse moléculaire élevé, éthers, furanes, pyrrols
Hydrophile
Acides Acides hydroxyles, sucres, sulfoniques, acides alkyl monocarboxyliques et
dicarboxyliques de base masse moléculaire
Bases Acides aminés, purines, pyrimidines, alkylamines de base masse moléculaire
Neutres Protéines, glucides (par exemple, polysaccharides, alcools alkyliques de faible poids
moléculaire, aldéhydes et cétones), cellulose et dérivés de la cellulose
En troisième lieu, la MON peut être classée par rapport aux tailles moléculaires en utilisant la
technique de filtration membranaire en série ou la chromatographie d’exclusion stérique. Huber
et al. (2011) ont ainsi suggéré de répartir la MON en cinq fractions en utilisant la chromatographie
d’exclusion stérique couplée à un détecteur de carbone organique en ligne (en l’anglais : liquid
chromatography-organic carbon detector, LC-OCD). Les auteurs ont ensuite caractérisé les cinq
fractions, i.e., 1) les biopolymères (masse molaire >>20,000 Da), tels que polypeptides,
polysaccharides, protéines et sucres aminés; 2) les substances humiques (masse molaire : environ
1000 Da), y compris les acides humiques et fulviques; 3) les blocs de construction (masse molaire :
300-500 Da), qui sont les hydrolysats des substances humiques; 4) les acides de faible masse
moléculaire (masse molaire : <300 Da) et 5) les composés neutres de faible masse moléculaire
(masse molaire : <300 Da), tels que alcools, aldéhydes, cétones, sucres et acides aminés. Cette
méthode de fractionnement est souvent utilisée pour la caractérisation de la MON pour le
traitement de l’eau dû à l’utilité des informations obtenues pour optimiser les procédés de
traitement.
4
Finalement, les composés de MON se distinguent par rapport à leur biodégradabilité. Les
composés, tels que glucides, acides aminés et protéines sont facilement biodégradables tandis
que les substances humiques sont difficiles à biodégrader. Pettit (2004) a conclu que les
substances humiques peuvent même persister dans l’environnement pour des siècles sans
biodégradation significative.
1.1.2 Impact en eau potable Bien que l'exposition à la MON soit commune et ne soit pas associée à des effets directs sur la
santé humaine, la présence et les caractéristiques de la MON auront des impacts importants sur
la production de l'eau potable. Tout d'abord, la MON peut entraîner une augmentation des
plaintes de consommateurs car elle peut contribuer à la couleur, aux goûts et aux odeurs
indésirables de l'eau potable (Edzwald, 2010; Thurman, 2012). En deuxième lieu, la MON peut
contribuer indirectement aux impacts sur la santé humaine. Par exemple, la MON forme des sous-
produits de désinfection (SPD) réglementés et non réglementés lorsqu’elle réagit avec les
désinfectants (Tian et al., 2013). Certains sous-produits de désinfection (SPD) se sont avérés être
cancérogènes pour les humains et néfastes pour les écosystèmes (Krasner et al., 2006). De plus,
la MON favorise le développement de biofilms dans les systèmes de distribution en fournissant
de nutriments, ce qui permet de protéger de organismes pathogènes (e.g., légionelles) et ainsi
détériorer la qualité de l’eau (Hijnen et al., 2018). En troisième lieu, la MON peut également
perturber les procédés de traitement de l’eau. Par exemple, la MON peut forcer à augmenter la
dose de coagulant requise pour le traitement de l’eau et ainsi augmenter la production de boues.
La MON peut également réduire la durée de fonctionnement de filtres et donc augmenter la
fréquence de rétro-lavage et ainsi diminuer l’efficacité de filtre. Elle peut entraîner le colmatage
de membranes, augmenter la pression transmembranaire et la consommation d’énergie pour
l’opération de membranes. Enfin, une fraction de la MON entre en compétition avec les
micropolluants organiques lors de la mise en œuvre des procédés d’adsorption sur charbon actif.

5
1.1.3 Mesure et caractérisation Paramètres généraux. Bien que les nombreux composés organiques qui contribuent à la MON ne
puissent pas être mesurés directement, il existe un certain nombre de paramètres généraux qui
peuvent être utilisés pour fournir une indication de la concentration de la MON. Les paramètres
généraux les plus couramment utilisés comprennent le carbone organique total (COT), le carbone
organique dissous (COD), la demande chimique en oxygène (DCO), l'absorbance ultraviolette (UV)
et la couleur.
Le carbone organique total (COT) est la somme du carbone organique particulaire (COP) et dissous
(COD). Une définition opérationnelle largement acceptée du COD est le carbone organique dans
un échantillon d'eau filtrée à travers un filtre de 0.45 µm. Le COT et le COD sont les paramètres
les plus pratiques à utiliser dans le domaine du traitement de l’eau (Edzwald, 2010).
Généralement, toutes les méthodes de quantification du carbone organique dans l'eau
impliquent l'oxydation. Avant l’invention d’analyseurs de COT, un agent oxydant était ajouté et la
quantité d'agent utilisée exprimait la concentration de carbone présent (i.e., DCO). Dans les
techniques modernes, divers types d'oxydation sont utilisés (combustion, rayonnement, agents
oxydants et oxydation supercritique) et le CO2 engendré est mesuré par spectroscopie infrarouge
(IR) (Matilainen et al., 2011).
La spectroscopie d'absorption ultraviolette (UV) est la mesure de l'atténuation d'un faisceau de
lumière après son passage à travers un échantillon ou après réflexion sur une surface
d'échantillon. Bien que les absorptivités molaires varient en raison de la gamme de chromophores
présents dans la structure de la MON, toute longueur d'onde de 220 à 280 nm est considérée être
approprié pour les mesures de la MON (Matilainen et al., 2011). Les différentes longueurs d'onde
peuvent identifier de différents chromophores de la MON. Par exemple, l'absorbance à 220 nm
est associée à la fois aux chromophores carboxyliques et aromatiques, tandis que l'absorbance à
254 nm est typique pour les groupes aromatiques avec divers degrés d'activation (Korshin et al.,
2009). UV254 a été identifié comme une mesure de substitution potentielle pour la mesure du
DOC malgré la tendance à surreprésenter le caractère aromatique.

6
Bien que la couleur puisse être mesurée à l’aide de comparateurs visuels, elle est plus
couramment mesurée à l'aide de méthodes spectrophotométriques. Par exemple, les chercheurs
ont utilisé l'absorbance de la lumière visible à 420 nm comme mesure de la couleur organique
(Ekström et al., 2011 ; Weyhenmeyer et al., 2014). Cependant, une longueur d'onde comprise
entre 450 nm et 465 nm a été proposée comme méthode spectrophotométrique standard (APHA
et al., 2017). La présence de particules en suspension (par exemple, argile, oxydes de fer et de
manganèse) peut donner aux eaux une couleur apparente et un échantillon filtré à travers un
filtre de 0.45 µm est défini de manière opérationnelle comme la couleur vraie. La comparaison
des résultats de couleur vraie et apparente peut aider les opérateurs à déterminer si les plaintes
de couleur sont liées à la MON ou à des particules.
Techniques de caractérisation. Bien que les paramètres généraux soient souvent faciles à
mesurer, les informations sur le caractère de la MON présente dans l’eau demeurent à
investiguer. À ce jour, diverses techniques sont disponibles afin d’explorer le caractère de la MON.
Le SUVA (UV absorbance spécifique) est défini comme l'absorbance UV d'un échantillon donné à
254 nm divisée par la concentration en COD de l'échantillon. Ce rapport décrit l'hydrophobie et
l'hydrophilie de la MON dans l'eau; un SUVA >4 indique un caractère principalement hydrophobe
et surtout aromatique, alors qu'un SUVA <2 illustre un caractère principalement hydrophile
(Edzwald, 2010). Le calcul de SUVA est largement utilisé pour évaluer le caractère de la MON car
il est facile et peu coûteux à déterminer, et il est un bon indicateur pour les changements de la
qualité de l'eau de source (Westerhoff et al., 1999; Imai et al., 2001; Weishaar et al., 2003;
Reckhow et al., 2007).
La spectroscopie de fluorescence est aussi une technique en plein essor pour caractériser la MON.
Il s’agit d’exciter les molécules d'analyte par irradiation à une certaine longueur d'onde, et le
rayonnement émis est mesuré à une autre longueur d'onde. La fluorescence peut donner un
aperçu des caractéristiques chimiques de la MON, car elle est fonction de la structure moléculaire
et de groupes fonctionnels (Hudson et al., 2008). Spécifiquement, une conformation moléculaire
particulière appelée le fluorophore est caractérisée par des longueurs d'onde d'excitation et
d'émission spécifiques. Ces fluorophores sont utiles pour décrire la composition structurelle des
7
substances humiques (Baker et al., 2008 ; Zhang et al., 2008 ; Bieroza et al., 2009). Parmi les
spectroscopies de fluorescence, la spectrophotométrie EEM (i.e., excitation-emission matrice) à
fluorescence tridimensionnelle est une technique de plus en plus populaire en raison de la
simplicité de la mesure et la possibilité de l’utiliser comme outil de détection en temps réel. L'EEM
est un spectre 3D dans lequel l'intensité de fluorescence peut être présentée en fonction de la
longueur d'onde d'excitation et d'émission (Valencia et al., 2013). Le spectre EEM visualise une
gamme de fluorophores différents avec une longueur d'onde d'excitation et d'émission allant de
∼200 à ∼500 nm, ce qui est plus révélateur que la technique traditionnelle à balayage unique
(Spencer et al., 2007). La fluorescence EEM fournit des informations précieuses sur l'élimination
de différentes fractions de MON dans le traitement de l'eau (Jeong et al., 2013; Lee et al., 2013;
Sanchez et al., 2014). L'eau brute typique contient deux pics de fluorescence majeurs, décrits
comme des maxima de fluorescence de type humique et de type protéine (Baghoth et al., 2009)
ou trois pics appelés les fluorophores de type de tryptophane, fulvique et humique (Spencer et
al., 2007 ; Baker et al., 2008 ; Hudson et al., 2008).
Les composés de la MON peuvent être fractionnés à l'aide de résines échangeuses d’ions
disponibles dans le commerce (e.g., XAD-8, XAD-4) tel que mentionné précédemment.
Cependant, la mesure des six fractions de MON (tableau 1.1) demande beaucoup de temps et de
travail (Minor et al., 2014). Les composés de la MON peuvent également être physiquement
fractionnés, tel que mentionné précédemment, en fonction de la différence de taille moléculaire
en utilisant une membrane ou la chromatographie d'exclusion stérique (Koudjonou et al., 2005).
Les fractions peuvent être ensuite analysées par une détection du carbone organique et/ou de
l'azote organique (i.e., LC-OCD-OND) (Huber et al., 2011). Le fractionnement par membrane est
souvent complexe à opérer, sans mentionner que le colmatage des membranes reste un obstacle
pour la caractérisation de la MON.
Tests biologiques. Plusieurs indicateurs ont été développés afin de décrire la teneur en MON
biodégradable (MOB) dans l'eau. Le carbone organique assimilable (COA) évalue le potentiel de
l'eau pour soutenir la repousse microbienne dans un système de distribution d'eau potable (Van
Der Kooij et al., 1982) tandis que le COD éliminé par l'activité microbienne est défini comme le
carbone organique dissous biologique (CODB) (Joret et Lévi, 1986). Le COA est la partie du CODB

8
qui est le plus facilement converti en biomasse par les bactéries, tandis que le CODB est la partie
du carbone organique qui est utilisées par des micro-organismes hétérotrophes pour les activités
métaboliques, tels que la production d'énergie, la croissance de la biomasse (Terry et Summers,
2018). Dans les eaux de surface, le ratio COA/COT varierait de 0,2 % à 38,3 % et avait une médiane
de 2,8 % tandis que le ratio CODB/COT varierait de 1 % à 72 % avec une médiane à 20 % (Terry et
Summers, 2018).
1.1.4 Source et occurrence La MON présente dans les eaux de surface peut provenir des processus naturels ou des activités
anthropogéniques.
Tout d’abord, la source naturelle de la MON peut être allochtone ou autochtone. La MON
allochtone est dérivée de l’écosystème terrestre, i.e., la MON présente dans les sols, tels que
l’humus du sol, la litière végétale, la biomasse microbienne, les animaux en décomposition, les
exsudats racinaires, est transportée dans les cours d’eau par le ruissellement et/ou la
précipitation (Kalbitz et al., 2000). La MON allochtone est principalement composée de
substances humiques, et elle a tendance à être de nature hydrophobe et réfractaire à la
biodégradation (Edzwald, 2010). La MON autochtone quant à elle est dérivée de la production et
la décomposition de la biomasse microbienne et végétale dans les sources d’eau (Nguyen et al.,
2002; Zhou et al., 2014). Les algues planctoniques s’avèrent être une contribution importante
pour les grands lacs tandis que les macrophytes sont de contributeurs importants pour les petits
lacs (Bertilsson and Jones, 2003; Wetzel, 2003). La prolifération d’algues et de cyanobactéries
représente une source importante de la MON autochtone, et peut être nocive pour la santé
humaine étant donné que plusieurs cyanotoxines s’avèrent toxiques pour les humains et les
animaux (Watson et al., 2016). La contribution de la MON autochtone à la MON totale du cours
d’eau varie de 5% à 100% selon les conditions géographiques et climatiques (Bertilsson and Jones,
2003; Wetzel, 2003; Tomlinson et al., 2016). Les composés de la MON autochtone consiste en
mono- et polysaccharides, acides aminés, peptides, protéines, acides nucléiques, acides
organiques, lipides et acides gras (Pivokonsky et al., 2006 ; Henderson et al., 2008). La MON

9
autochtone a tendance à être de nature plus hydrophile et plus facilement biodégradable
(Edzwald, 2010).
La source anthropogénique de la MON est constituée principalement des rejets d’eaux usées, des
eaux pluviales, du ruissellement de champs agricoles et des rejets industrielles. La MON
anthropogénique s’avère être de nature plus hydrophile et plus riche en azote (Imai et al., 2001).
Les concentrations de la MON (présentes sous forme de carbone organique total, COT) dans l'eau
brute représentent l'effet net des processus hydrologiques et biogéochimiques dans le bassin
versant ou l'aquifère (Eckhardt and Moore, 1990). Le tableau 1.2 résume le COT des eaux brutes
à travers des provinces et territoires canadiens. En général, le COT varie spatialement tel que
mentionné précédemment, et le COT de l’eau de surface démontre une concentration plus élevée
que celle de l’eau souterraine. C’est parce que la matière organique est assujettie à l’adsorption
et la biodégradation lorsque l’eau souterraine traverse les sols (Thurman, 1985; Aiken and
Cotsaris, 1995; Aitkenhead-Peterson et al., 2003). La MON de l’eau souterraine s’avère être de
nature plus hydrophile et plus réfractaire à la biodégradation (Diem et al., 2013).
Tableau 1.2 - Carbone organique total (COT) dans les eaux brutes pour différentes provinces et
territoires canadiens (Canada Health, 2020).
Provinces canadiennes et territoires Carbone organique total (mg C/L)
Eaux souterraines Eaux de surfaces
Terre-Neuve-et-
Labradora
Nombre d’échantillons 322 833
Médiane 1,2 6,5
Moyenne 2,0 7,0
90ième centile 4,3 11,4
Nouvelle-Écosse
Nombre d’échantillons 53 136
Médiane 1,2 4,6
Moyenne 2,3 5,8
90ième centile 6,7 10,9
Nouveau-Brunswick Nombre d’échantillons 893 324

10
Médiane 2,0 4,8
Moyenne 2,1 4,8
90ième centile 3,4 6,0
Québec
Nombre d’échantillons 129 91
Médiane 2,8 6,0
Moyenne 3,1 6,2
90ième centile 5,1 9,7
Manitoba
Nombre d’échantillons 564 456
Médiane 2,9 10,9
Moyenne 4,0 11,6
90ième centile 8,2 16,2 a : Les données pour Terre-Neuve-et-Labrador sont du carbone organique dissous.
1.2 Procédés de traitement pour l’enlèvement de la MON
Afin de sélectionner, concevoir et exploiter de manière appropriée des procédés de traitement
de l'eau, une compréhension des variations de la concentration et du caractère de la MON est
nécessaire. Pour ce faire, les exploitants de services d’eau devraient idéalement avoir des
connaissances au sujet de la MON présente dans leur source d’eau, y compris 1) la source et
l’occurrence de la MON; 2) les interactions avec d’autre composés dans l’eau (tel que l’ion
bromure) et avec les produits chimiques utilisés pour le traitement; 3) les interactions avec les
procédés de traitement; et 4) les impacts sur le système de distribution (Health Canada, 2020).
Une étude de traitabilité spécifique à la source devrait être menée pour évaluer et comparer les
options de traitement pour l'élimination de la MON dans une source d’eau spécifique (Kastl et al.,
2016). L'étude de traitabilité doit inclure des essais au laboratoire ou à l'échelle pilote en tenant
compte des objectifs concomitants de qualité de l'eau, tels que les risques microbiens, les SPD, la
stabilité biologique et le contrôle de corrosion. De nombreux procédés de traitement peuvent
aider à éliminer la MON de l’eau brute (Figure 1.2) (Sillanpää, 2014). Ces options de traitement
sont revues en détail dans les sections suivantes.

11
Figure 1.2 - Aperçu des processus de traitement pour l’enlèvement de la MON.
1.2.1 Coagulation Mécanismes et type de coagulant. Deux mécanismes sont impliqués pendant la coagulation : 1)
les composés de la MON sont neutralisés par les coagulants positivement chargés et forment ainsi
des précipités insolubles; 2) les composés de la MON peuvent être adsorbés sur les flocs de
coagulants (Edzwald et al., 2011). Le choix du coagulant dépend des caractéristiques de l’eau à
traiter. Les coagulants couramment utilisés comprennent les coagulants à base d’aluminium et
de fer, des floculants de polymères inorganiques, des polyélectrolytes organiques et des
coagulants composites (Sillanpää, 2014).
Avantages et inconvénients. La coagulation est la méthode la plus couramment utilisée pour
l’enlèvement de la MON étant donné son bon rapport d’efficacité-prix dans la plupart des
applications. Cependant, l’application de coagulant doit être soigneusement analysée en fonction
de la source, car la coagulation ne peut éliminer que certaines fractions de la MON. Par exemple,
la MON allochtone a tendance à être de nature hydrophobe et peut être généralement enlevée
par la coagulation, tandis que la MON hydrophile a tendance à être plus difficile à traiter par la
coagulation (Volk et al., 2002; Chow et al., 2004). En effet, pour les sources d’eau riches en MON
neutre et hydrophile, la coagulation sera inefficace (Chow et al., 2006). Par conséquent, il est
important d'effectuer des jar-tests et/ou de tests du potentiel de formation de SPD pour
déterminer la faisabilité de la coagulation pour l'élimination de la MON.
1.2.2 Adsorption Mécanismes et type d’adsorbant. Les composés organiques peuvent être adsorbés sur la surface
d’adsorbants par la force van der Waals et l’interaction thermodynamique (Worch, 2012).
L'adsorbant le plus couramment utilisé pour le traitement de l'eau est le charbon actif, qui peut
Processus de traitement pour l’enlèvement de la MON
Coagulation Adsorption Filtration Membranaire
Oxydation avancée
Échange d’ionsBiodégradation

12
être appliqué sous forme de charbon actif en poudre (CAP) ou en grain (CAG). Le CAP est souvent
appliqué en lit fluidisé alors que le CAG est appliqué en lit fixé. Le charbon actif a une structure
poreuse et peut fournir une grande surface spécifique, ce qui permet d’avoir une capacité de
sorption élevée pour les substances organiques (Simpson, 2008).
Avantages et inconvénients. L’adsorption est une technologie efficace pour l'élimination de la
MON et d'autres polluants organiques présents dans l’eau (i.e., micropolluants organiques). Les
adsorbants, tel que le charbon actif, est facile à opérer et demandent peu de produits chimiques.
Cependant, le charbon actif n'a pas été largement utilisé comme stratégie principale pour le
contrôle de la MON, car la capacité d'adsorption du charbon actif a tendance à s'épuiser
rapidement et la régénération (par exemple régénération par la chaleur) peut être coûteuse
(Prévost et al., 1998). Donc, l’adsorption est utilisée en tant que processus supplémentaire afin
d’améliorer l’élimination de la MON, particulièrement pendant la saison de goûts et d’odeurs en
été (par exemple, pendant la saison de la floraison d’algues).
1.2.3 Filtration membranaire Mécanismes et type de membrane. La filtration membranaire est un processus alternatif pour
l’enlèvement de la MON. Quatre types de membranes à pression sont actuellement utilisées dans
le traitement de l'eau potable : la microfiltration (MF), l'ultrafiltration (UF), la nanofiltration (NF)
et l'osmose inverse (OI). Les membranes sont généralement classées selon le type des substances
qu'elles éliminent, la pression de fonctionnement et la taille des pores ou la masse moléculaire
coupée (en anglais : molecular weight cut-off, MWCO). MF et UF sont appelés membranes à basse
pression et sont utilisées pour l'élimination de particules/agents pathogènes. Le mécanisme
d'élimination prédominant est l'exclusion de taille pour les membranes MF et UF. NF et RO quant
à eux sont appelés membranes à haute pression et sont utilisées pour l'élimination de la MON et
de substances inorganiques (par exemple sodium, chlorure, calcium et magnésium). Le
mécanisme d'élimination prédominant est la différence de diffusivité et la force électrostatique.
En général, plus de 50% des molécules de MON ont une masse moléculaire < 1 kDa et 80% ont
une masse moléculaire < 10 kDa (Sillanpää et al., 2015). Par conséquent, MF (MWCO : > 100 kDa)

13
et UF (MWCO : 1 kDa – 100 kDa) ne peuvent pas suffisamment enlever la MON, et une membrane
NF étanche est nécessaire pour éliminer la MON (MWCO : 200-300 Da) (Sillanpää et al., 2014).
Avantages et inconvénients. La filtration membranaire est facile à opérer et demande peu de
produits chimiques (similaire à l’adsorption). Cependant, il est important de considérer le
potentiel de colmatage car la MON colmate les membranes, ce qui entraîne une augmentation
de pression et une diminution de débit. Un rétrolavage avec/sans produits chimiques est
nécessaire afin de maintenir la performance de membrane. Les indicateurs du potentiel de
colmatage comprennent un faible SUVA, une fraction hydrophile élevée, une concentration
élevée en azote dissous ou une concentration élevée en biopolymères (Lee et al., 2006; Amy,
2008; Croft, 2012; Kimura et al., 2014; Siembida-Lösch et al., 2014).
1.2.4 Processus d’oxydation avancée Mécanismes et type de processus. Les processus d’oxydation avancée consistent à enlever la
MON par la réaction oxydante avec les radicaux. De nombreuses configurations sont disponibles,
y comprise ozone/UV, ozone/H2O2, UV/ H2O2 et la réaction Fenton. Il faut noter que les processus
d'oxydation avancée sont d’abord utilisés pour la désinfection et/ou la dégradation des
contaminants organiques ciblés, et ils n’ont pas été utilisé en tant que stratégie principale pour
l’enlèvement de la MON (Sillanpää et al., 2014).
Avantages et inconvénients. Les processus d’oxydation avancés suivi par un traitement
biologique peuvent diminuer la fraction de la MON biodégradable dans l’eau traitée, ce qui
permet d’augmenter la biostabilité de l’eau pendant la distribution. Cependant, bien que les
processus d'oxydation avancée puissent, en principe, éliminer une fraction de la MON, ils peuvent
également augmenter la formation de SPD ou produire nouveau SPD (Bond et al., 2011). Par
exemple, bien que l’ozonation puisse éliminer une fraction de la MON, elle peut aussi former du
bromate dans une eau contenant du bromure. Donc, l’utilisation des processus d’oxydation
avancée pour l’enlèvement de la MON devrait être évaluée soigneusement avant sa mise en
place.
14
1.2.5 Biodégradation Mécanismes et type de processus. Le traitement biologique a pour but d’enlever la fraction
biodégradable de la MON (i.e., MOB) dont profitent les micro-organismes hétérotrophes. Trois
configurations du traitement biologique sont disponibles, i.e., la filtration par les berges, la
filtration rapide sur média granulaire et la filtration lente sur sable. La filtration par les berges
consiste à localiser des puits d'approvisionnement en eau verticaux ou horizontaux près d'une
rivière afin d’utiliser la berge et l'aquifère adjacent comme filtre naturel et ainsi enlever la MON
par adsorption et biodégradation (Kuehn et Mueller, 2000; Ray et al., 2002). La filtration rapide
(vitesse de filtration : > 4 m/h) consiste à utiliser des filtres à média granulaire (par exemple sable,
anthracite et charbon actif granulaire) sans l’utilisation d’un désinfectant pendant l’opération, et
la MOB peut être biodégradée par la communauté microbienne qui se développe sur la surface
de média. Le charbon actif biologique (CAB) est le type de filtration rapide le plus couramment
utilisé pour l’enlèvement de la MOB. Le CAB est souvent placé après le traitement conventionnel
(i.e., coagulation-floculation-décantation-filtration) en tant que processus de polissage.
D’ailleurs, le CAB est souvent utilisé après l’ozonation (i.e., ozone – charbon actif biologique) étant
donné que l’ozonation peut transformer la MON à la MOB et ainsi rendre la MON plus facilement
biodégradable. La filtration lente sur sable consiste à traiter de l'eau brute qui s'écoule par
gravité à faible vitesse (vitesse de filtration : < 0.5 m/h) à travers un lit de sable. Pendant
l’opération, la croissance microbienne se développe dans le lit de sable et le support de gravier.
En plus, les bactéries et les matières organiques présentes dans la source d'eau s'accumulent au-
dessus du filtre à sable pour former un « schmutzdecke » (une couche de limon riche en
microorganismes et matières organiques). Par conséquent, la croissance microbienne à l'intérieur
du filtre et du schmutzdecke contribuent à l’enlèvement de la MON par l’adsorption et la
biodégradation. (Logsdon et al., 2002).
Facteurs impactant la performance de biodégradation. La performance de biodégradation en
termes d’enlèvement de la MOB dépend de plusieurs facteurs. D’abord, l’efficacité de
biodégradation dépend de la concentration de MOB dans l’eau à traiter. La MON réfractaire à la
biodégradation ne répond pas au traitement biologique sauf si un processus d’oxydation est
utilisé afin de la rendre plus biodégradable. En deuxième lieu, le type de média filtrant aurait un

15
impact sur la performance de biodégradation. Le charbon actif granulaire (CAG) s’est avéré être
plus performant par rapport à l’anthracite et au sable dû à sa structure poreuse, un avantage qui
permet de supporter plus de biomasse (Emelko et al., 2006). En troisième lieu, la température
aurait un impact direct sur la performance de biodégradation étant donné que la croissance
microbienne est fonction de la température. Une baisse de température peut entraîner la baisse
de la performance de biodégradation, un défi important pour l’opération de filtres biologiques
aux pays nordiques. En quatrième lieu, les conditions opérationnelles, tels que le temps de
contact (présenté en empty bed contact time, EBCT) et les processus de rétro-lavage, sont
importants pour la performance de la filtration biologique. Une exposition plus longue de l’eau à
traiter avec la biomasse peut rendre un enlèvement plus significatif (Liu et al., 2017). Le rétro-
lavage implique généralement d’appliquer l’air et l’eau avec ou sans oxydant pour enlever les
particules. Les résultats ont démontré que le filtre biologique est plus performant lorsque
l’oxydant ne présente pas dans l’eau de lavage (Basu et al., 2016). Finalement, les nutriments sont
un facteur vital pour la performance de biodégradation. La croissance microbienne peut être
limitée dû au manque de nutriments. Une formule moléculaire empirique a été proposée pour
les cellules bactériennes (i.e., C60H87O23N12P) (Basu et al., 2016). Les filtres biologiques peuvent
ainsi être bonifiés par l’ajout de nutriments afin de booster la croissance microbienne (Liu et al.,
2017).
Avantages et inconvénients. La filtration biologique est un processus économique, et elle est
facile à opérer. Elle peut non seulement éliminer de la MOB, mais aussi éliminer de micropolluants
organiques et de contaminants inorganiques (par exemple l’azote ammoniacal, le fer et le
manganèse). Cependant, la filtration biologique ne peut pas être utilisée en tant que stratégie
principale pour l’enlèvement de la MON du fait qu’elle peut seulement enlever la partie
biodégradable de la MON (i.e., 5%-20%) (Terry and Summers, 2018). D’ailleurs, sa performance
est fortement impactée par la température, un défi majeur pour les pays nordiques où la
température varie énormément durant l’année.
16
1.2.6 Échange d’ions Contexte en résine échangeuse d’ions. Les résines échangeuses d'ions (en anglais : ion exchange
resins, IX) sont des billes de plastique synthétiques. La structure de IX est constituée de polymères
sur lesquels de groupes fonctionnels sont fixés de façon permanente (Bolto et al., 2002). Comme
les groupes fonctionnels sont chargés, les contre-ions sont attachés aux groupes fonctionnels afin
de maintenir la neutralité électrique. Les contre-ions sont mobiles et peuvent entrer et sortir de
résines. Les résines échangeuses d’ions consistent généralement en deux groupes selon la charge
du contre-ion, i.e., les résines échangeuses de cations (CIX) et les résines échangeuses d'anions
(AIX). Les résines échangeuses de cations sont souvent utilisées pour l'adoucissement de l'eau
tandis que les résines échangeuse d’anions sont utilisées pour enlever la MON et les anions
inorganiques.
Mécanismes de l’enlèvement de la MON. Puisque les molécules de MON contiennent
généralement un groupe d’acide carboxylique ou un groupe phénol dans leurs structures, elles
peuvent perdre de protons lors de l'hydrolyse. Par conséquent, la majorité de la MON est chargée
négativement dans l'eau et est donc échangeable contre les résines échangeuses d’anions
(Cornelissen et al., 2008). Deux mécanismes sont impliqués dans l'enlèvement de la MON par les
résines, i.e., 1) les parties négativement chargées de la MON peuvent échanger avec les contre-
ions sur la résine (i.e., échange d’ions); 2) les parties non-ioniques de la MON peuvent être
adsorbées sur la surface de résine par les forces van der Waals, les liaisons hydrogène et les
interactions thermodynamiques (i.e., adsorption) (Fu et Symons, 1990; Bolto et al., 2002; Tan et
Kilduff, 2007). Cependant, Fu et Simons (1990) ont constaté que l'adsorption n’avait pas lieu de
manière significative pour la fraction de MON de grande masse moléculaire (> 1k Da), et que
l'échange d'ions était le mécanisme dominant pendant le processus d’échange d’ions.
Configuration de réacteur pour la résine échangeuse d’ions. Les contacteurs à lit mobile ont été
proposés pour la résine afin d’enlever la MON de l’eau turbide. Le processus MIEX (en anglais :
Magnetic Ion EXchange) consiste à utiliser des réacteurs à flux complètement mélangé pour
enlever la MON en mode continu (Figure 1.3A). Le processus consiste généralement en : 1) 10-30
min de temps de contact avec une vitesse de rotation lente (vitesse de la pointe < 5 m/sec) et; 2)
le processus de séparation des résines pour le recyclage et la régénération des résines (Slunjski

17
et al., 2000). Cette configuration a reçu des intérêts intensifs depuis 2000, mais il faut noter que
son application est limitée aux résines MIEX, une résine particulière qui est incrustée de particules
d’oxydes de fer (Boyer, 2015). Par ailleurs, une autre configuration de réacteur à lit mobile a été
proposée en 2010 par PWN Technologies aux Pays-Bas (figure 1.3B) (Koreman et Galjaard, 2016).
Dans ce processus, les résines sont injectées à l'eau brute et s’écoulent dans un réacteur à flux de
bouchon (temps de contact : 10-30 min). Ensuite, les résines sont séparées, régénérées et
stockées dans le réservoir de résine avant la prochaine injection. Tous les types de résine
échangeuse d'anions peuvent s’adapter au procédé SIX, une différence majeure par rapport au
procédé MIEX (Koreman et Galjaard, 2016). Finalement, l’échange d'ions en lit fluidisé (en
anglais : fluidized ion exchange, FIX) est une autre configuration de réacteur à lit mobile
(Cornelissen et al., 2009) (figure 1.3C). Dans ce processus, l'eau brute est pompée dans un
réacteur à courant ascendant à un débit constant de sorte que les résines sont fluidisées dans le
contacteur. Ce procédé a été testé avant une membrane d'ultrafiltration, et les résultats ont
indiqué que le procédé FIX pouvait atténuer le colmatage de la membrane causé par la MON
(Cornelissen et al., 2009). Néanmoins, il existe encore peu études sur l’application du FIX à pleine
échelle, et la performance de celle-ci demeure inconnue.
Le réacteur à lit fixe consiste à traiter l’eau brute à flux descendant par la gravité. Les rétrolavages
à contre-courant sont nécessaires afin de réduire l'impact du colmatage. Les résultats de l’analyse
du cycle de vie ont montré que les réacteurs à lit fixe consomment moins d'énergie et de résines
mais nécessitent plus de sels pour la régénération par rapport au procédé MIEX (Amini et al.,
2015). Cependant, les auteurs ont également indiqué que l'entretien des résines pour les
réacteurs à lit fixe est un facteur clé afin de réduire leurs impacts environnementaux. Une bonne
gestion de résines (par exemple une fréquence de régénération appropriée et une bonne
stratégie de rétrolavage) peut rendre le réacteur à lit fixe plus économique et respectueux de
l’environnement par rapport au réacteur à lit mobile.
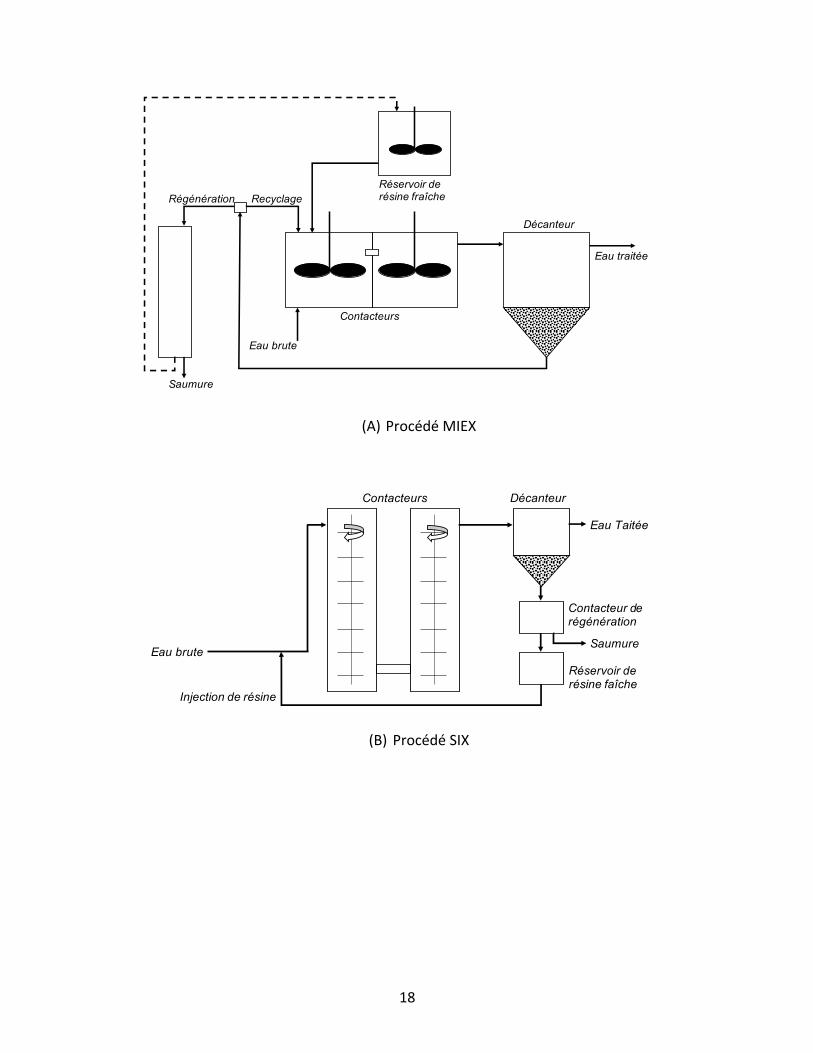
18
(A) Procédé MIEX
(B) Procédé SIX
Réservoir de résine fraîche
Contacteurs
Eau brute
Décanteur
Eau traitée
RecyclageRégénération
Saumure
Eau brute
Contacteurs Décanteur
Eau Taitée
Contacteur de régénération
Saumure
Réservoir de résine faîche
Injection de résine
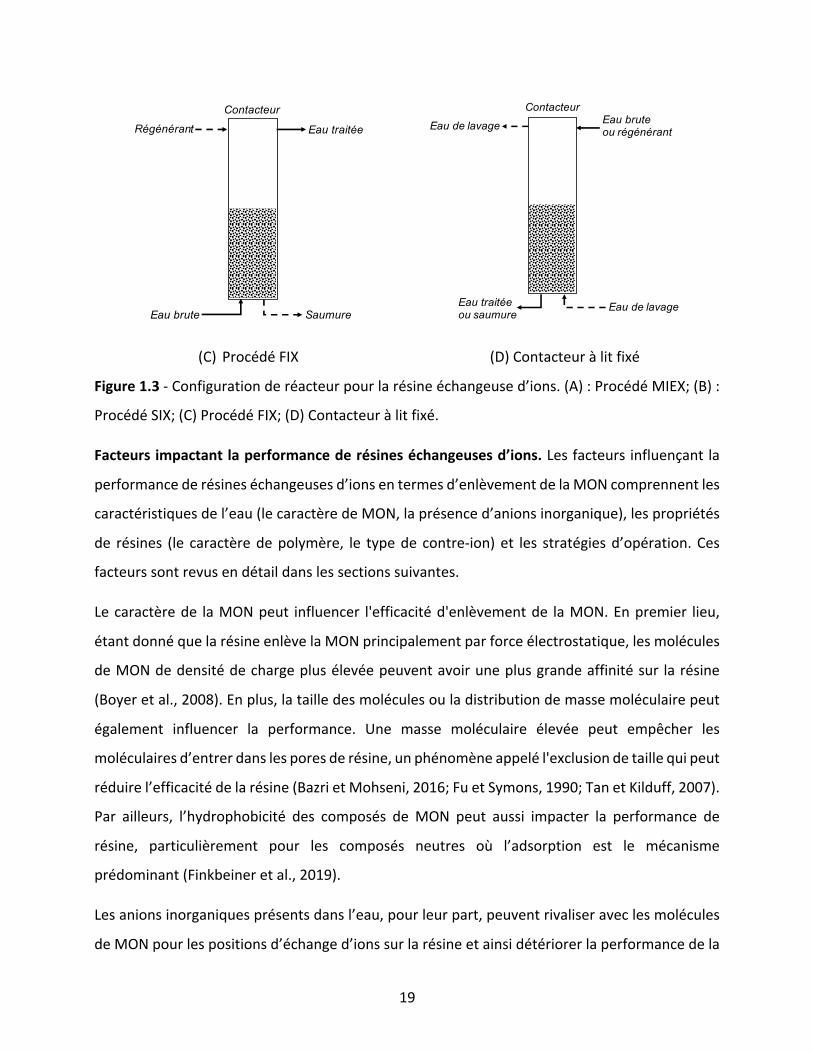
19
(C) Procédé FIX (D) Contacteur à lit fixé
Figure 1.3 - Configuration de réacteur pour la résine échangeuse d’ions. (A) : Procédé MIEX; (B) :
Procédé SIX; (C) Procédé FIX; (D) Contacteur à lit fixé.
Facteurs impactant la performance de résines échangeuses d’ions. Les facteurs influençant la
performance de résines échangeuses d’ions en termes d’enlèvement de la MON comprennent les
caractéristiques de l’eau (le caractère de MON, la présence d’anions inorganique), les propriétés
de résines (le caractère de polymère, le type de contre-ion) et les stratégies d’opération. Ces
facteurs sont revus en détail dans les sections suivantes.
Le caractère de la MON peut influencer l'efficacité d'enlèvement de la MON. En premier lieu,
étant donné que la résine enlève la MON principalement par force électrostatique, les molécules
de MON de densité de charge plus élevée peuvent avoir une plus grande affinité sur la résine
(Boyer et al., 2008). En plus, la taille des molécules ou la distribution de masse moléculaire peut
également influencer la performance. Une masse moléculaire élevée peut empêcher les
moléculaires d’entrer dans les pores de résine, un phénomène appelé l'exclusion de taille qui peut
réduire l’efficacité de la résine (Bazri et Mohseni, 2016; Fu et Symons, 1990; Tan et Kilduff, 2007).
Par ailleurs, l’hydrophobicité des composés de MON peut aussi impacter la performance de
résine, particulièrement pour les composés neutres où l’adsorption est le mécanisme
prédominant (Finkbeiner et al., 2019).
Les anions inorganiques présents dans l’eau, pour leur part, peuvent rivaliser avec les molécules
de MON pour les positions d’échange d’ions sur la résine et ainsi détériorer la performance de la
Eau brute
Eau traitée
Contacteur
Régénérant
SaumureEau traitéeou saumure
Eau bruteou régénérant
Contacteur
Eau de lavage
Eau de lavage

20
résine. Par exemple, nombreuses études ont démontré que l’enlèvement de la MON par IX
diminuait lorsque la concentration de sulfate augmentait (Ates et Incetan, 2013; Boyer et Singer,
2006; Tan et Kilduff, 2007). D’ailleurs, Tan et Kilduff (2007) ont constaté que l’augmentation de
la concentration de sulfate dans l'eau brute pouvait modifier la fraction de la MON enlevée par la
résine, i.e., les résines changent leurs préférences à la MON de haute masse molaire lorsque la
concentration de sulfate augmente. Une explication probable serait que les molécules de MON à
haute masse molaire auraient une densité de charge plus élevée, ce qui les rend plus
favorablement échangées contre les résines (Tan et Kilduff, 2007). En plus, Croué et al. (1999) ont
observé que la présence du bicarbonate et du chlorure dans l'eau peut augmenter l’enlèvement
de la MON en raison de la déshydratation de la MON. Ce phénomène, appelé « l’effet de salting
out », peut changer l’hydrophobicité de molécules de MON et ainsi les rendre plus facile à
adsorber sur la résine. Néanmoins, il faut aussi noter qu’une haute concentration de chlorure ou
de bicarbonate peut diminuer l’enlèvement de la MON dû à la compétition. Finalement, l'effet de
cations sur la performance d’échange d’ions a été peu exploré dans la littérature, sauf que la
présence de fer dans l'eau peut provoquer un colmatage de résine et ainsi diminuer la capacité
de résine (Hongve et al., 1999).
Le caractère du polymère de résine influence également la performance en termes d’enlèvement
de la MON. En premier lieu, de nombreuses études ont suggéré que l’enlèvement de la MON
augmentait avec la teneur en eau dans la structure de résine (Bolto et al., 2002; Cornelissen et
al., 2008). Une explication raisonnable serait qu'une teneur élevée en eau dans la structure de
résine peut favoriser la diffusion des molécules de MON dans les pores de résine. Par ailleurs, le
matériel de polymère peut également impacter l’enlèvement de la MON. La résine polyacrylique
s’avère plus efficace que celle en polystyrène parce qu’elle est plus hydrophile et favorise ainsi la
diffusion des molécules (Bolto et al., 2002; Fu et Symons, 1990). D’ailleurs, la résine d’une
structure macroporeuse est généralement plus performante que celle en gel dû à la facilité de
diffusion dans les pores de résine (Bolto et al., 2002). Enfin, bien que la capacité d'échange d'ions
soit un facteur important, une valeur élevée à elle seule est peu susceptible de favoriser
l’enlèvement de la MON. Cornelissen et al. (2008) ont démontré que la résine avec la capacité
d’échange la plus élevée avait la pire performance pendant leurs tests.

21
Le type de contre-ion impacte également la performance des résines en termes d’enlèvement de
la MON; Un contre-ion plus sélectif contre la résine peut diminuer l’efficacité du traitement. Le
chlorure est le contre-ion le plus conventionnel pour la résine échangeuse d’anions dû fait que :
1) le chlorure est chimiquement inerte dans l'eau; 2) le chlorure a une affinité faible sur la résine
de sorte que les anions ciblés peuvent être favorablement échangés avec le chlorure; 3) la
régénération avec le chlorure de sodium est économique et facile à opérer (Rokicki et Boyer
2011). Cependant, puisque le rejet de la saumure de chlorure pose un risque pour les
écosystèmes et les systèmes d’égout (dû à la salinité élevée) (Matošić et al., 2000 ; Rokicki et
Boyer, 2011), de nombreuses études ont été consacrées à trouver des contre-ions alternatifs. Le
bicarbonate a été proposé en tant que contre-ion alternatif au chlorure pour la résine échangeuse
d’anion, parce que 1) le bicarbonate a une affinité similaire au chlorure sur la résine; 2) le rejet
de la saumure chargée de bicarbonate est plus facile étant donné qu’il est chimiquement bénin
(Hu et Boyer, 2017 ; Maul et al., 2014 ; Ness et Boyer, 2017 ; Rokicki et Boyer, 2011 ; Walker et
Boyer, 2011). Cependant, le bicarbonate de sodium a une efficacité de régénération inférieure à
celle du chlorure de sodium principalement en raison de sa faible solubilité dans l'eau (96 g
NaHCO3/L à 20°C) (Hu et Boyer, 2017 ; Matošić et al., 2000 ; Ness et Boyer, 2017). Par conséquent,
l'enlèvement de la MON par la résine en forme bicarbonate peut diminuer plus rapidement que
celle en forme chlorure au cours du service. D’ailleurs, Jelinek et al. (2004) ont constaté des
précipitations formées dans l'eau traitée lorsque la concentration de calcium était supérieure à
100 mg/L. Par ailleurs, le sulfate a été testé en tant que contre-ion pour la résine échangeuse
d’anion. Puisque le sulfate a une affinité plus grande que le chlorure sur la résine, l’enlèvement
de la MON par la résine en forme sulfate est inférieur à celui par la résine en forme chlorure (33%
vs 42%) (Verdickt et al., 2012). Cependant, l’utilisation de la résine en forme de sulfate peut éviter
l'enlèvement indésirable des anions inorganiques (par exemple : le nitrate, le sulfate et le
bicarbonate).
La stratégie d’opération est aussi un facteur important en ce qui concerne la performance de
résine pour l’enlèvement de la MON. Par exemple, une dose de résine plus grande dans un
réacteur à lit mobile ou un EBCT plus long dans un réacteur à lit fixe peut augmenter l’efficacité
de traitement. Un rétrolavage plus fréquent pour le réacteur à lit fixe peut diminuer le colmatage
22
du filtre et ainsi améliorer l’efficacité de traitement. La stratégie de régénération, telle que la
concentration de régénérant, la fréquence de régénération, aurait également un impact sur
l'enlèvement de la MON. Une régénération plus fréquente peut directement augmenter
l’efficacité de traitement, mais cela va aussi engendrer plus de saumure qui nécessite une gestion
soigneuse.
Avantages et inconvénients. Les processus d’échange d’ions possèdent plusieurs avantages par
rapport à d’autre processus dédiés à l’enlèvement de la MON. D’abord, les processus d’échange
d’ions sont faciles à opérer, particulièrement pour le réacteur à lit fixe. En plus, les processus
d’échange d’ions sont efficaces et peuvent constituer la stratégie principale pour l’enlèvement de
la MON ou ils peuvent être intégrés dans les chaînes de traitement de l'eau existantes. Une revue
de littératures détaillée a été réalisée pour évaluer les études précédentes sur l’enlèvement de la
MON par IX (Levchuk et al., 2018). Par ailleurs, les résines échangeuses d’ions sont régénérables
et leurs régénérations peuvent être effectuées sur site. Cependant, cette régénérabilité entraîne
également l'inconvénient majeur du processus IX, i.e., le processus de régénération peut produire
une saumure qui contient une concentration élevée en chlorure et le rejet de cette saumure est
restreint selon les règlementations environnementales applicables.
1.2.7 Résine échangeuse d’ions en mode biologique En 2017, un nouveau processus appelé « résine échangeuse d’ions en mode biologique » (en
anglais : biological ion exchange, BIEX) a été proposé afin d’enlever la MON de l’eau de surface
(Schulz et al., 2017). Il s’agit d’opérer la résine échangeuse d’ions dans un réacteur à lit fixe avec
une régénération peu fréquente de sorte qu’une communauté microbienne peut se développer
sur la surface de résine et ainsi contribuer à l’enlèvement de la MON par biodégradation. Dans
un test à l’échelle laboratoire, Schulz et al. (2017) ont constaté qu’un filtre de résine biotique
enlevait 60 % de la MON alors qu’un filtre de résine abiotique enlevait 40 % de la MON. Ensuite,
le charbon actif biologique (CAB) et la résine en mode biologique (BIEX) ont été comparés en
termes d’enlèvement de la MON à l’échelle du laboratoire (Winter et al., 2018) et du pilote (Amini
et al., 2018). Les résultats ont démontré que le filtre BIEX avait réalisé un enlèvement plus grand
par rapport au CAB (labo : 56% vs 15 %; pilot : 62% vs 7%). Ces résultats démontrent que le filtre
23
BIEX peut être une stratégie pour l’enlèvement de la MON. D’ailleurs, puisque la régénération est
menée moins fréquemment, la quantité de sel et la production de saumure ont été réduits
énormément, un avantage qui peut rendre l’utilisation de résine plus respectueux de
l’environnement par rapport au mode d’application conventionnel. Cependant, les mécanismes
de l’enlèvement de la MON dans le filtre BIEX et sa faisabilité à l’usine de traitement de l’eau
demeure inconnus.
1.3 Problématiques, objectifs, hypothèses et structure de la thèse
1.3.1 Problématiques Bien que certaines études aient été faites sur le BIEX avant commencer cette recherche, il n’y
avait que peu d’études élucidant les mécanismes de l’enlèvement de la MON pour le BIEX. Schulz
et al. (2017) ont démontré que le filtre de résine biologique (i.e., BIEX) enlevait plus de COD (20%)
par rapport à un filtre abiotique. Cependant, pendant leur test, l’azoture (négativement chargé)
a été ajouté dans l’affluent du filtre abiotique afin de réprimer la croissance microbienne, ce qui
pouvait rivaliser avec les molécules de MON et ainsi baisser l’enlèvement de la MON par l’échange
d’ions. Autrement dit, la performance réalisée par le filtre abiotique a été sous-estimée, et la
contribution de la biomasse dans le filtre BIEX demeure incertaine. Dans la recherche
subséquente, les chercheurs ont pu quantifier la biomasse présente dans le BIEX par la méthode
d’ATPmétrie (Adénosine Triphosphate, ATP) (Winter et al., 2018; Amini et al., 2018). Les résultats
ont démontré que la quantité de biomasse était similaire ou même plus grande par rapport au
filtre CAB sur la surface du filtre. Cependant, une preuve directe qui démontre la relation entre
l’activité microbienne et l’élimination de la MON est manquante. Finalement, Amini et al. (2018)
ont supposé que l’échange d’ions secondaires contribue aussi à l’enlèvement de la MON dans le
filtre BIEX, i.e., la MON échange avec les anions inorganiques pré-retenues à la suite de
l’épuisement du chlorure. Cependant, les concentrations d’anions n’ont pas été suivies dans les
études précédentes (Winter et al., 2018; Amini et al., 2018), et les mécanismes d’échanges d’ions
secondaires demeurent inconnus.
24
L’intégration du processus d’échange d’ions à la filière du traitement de l’eau demeure un défi
pour l’utilisation de résines. Le procédé MIEX est souvent placé au début de la filière de
traitement étant donné que la résine peut enlever la MON dans l’eau turbide, une stratégie qui
bénéficie aux processus subséquents (par exemple la baisse de la consommation de produits
chimiques). Par ailleurs, Grefte et al. (2013) ont démontré que le MIEX peut être aussi placé au
milieu (avant ozonation) ou à la fin (après la filtration lente par sable) d’une chaîne de traitement
(coagulation, décantation, filtration, ozonation, adoucissement, CAB et filtration lente par sable)
avec des performances similaires. Bien que l’application du MIEX à la filière du traitement de l’eau
ait été bien étudiée, l’application du réacteur à lit fixe a été peu explorée.
Finalement, pendant la conception du processus d’échange d’ions, les ingénieurs et les
chercheurs ne considèrent actuellement que les paramètres opérationnels, et l’impact négatif
causé par la saumure n’est souvent pas anticipé avant mettre le processus en place. De
nombreuses études ont été consacrées à optimiser l’opération de résine et la gestion de saumure
autre que la filtration BIEX afin d’alléger la gestion et l’impact de la saumure engendrée par la
régénération de résines. Néanmoins, une revue de ces mesures et un schéma de conception qui
inclut l’opération de résines et la gestion de saumure sont manquants.
1.3.2 Objectifs et hypothèses L’objectif général de cette thèse est 1) de comprendre et favoriser l’application de la résine
échangeuse d’ions en mode biologique (i.e., BIEX) pour l’enlèvement de la MON des eaux de
surface et 2) décrire et analyser les stratégies qui peuvent alléger la gestion de la saumure
engendrée par la régénération de résines. Les objectifs spécifiques et les hypothèses
correspondantes sont présentés ci-dessous :
Objectif 1 : Évaluer la performance de l’enlèvement de la MON pour les filtres BIEX en forme
bicarbonate et en forme chlorure.
Hypothèses : 1) les résines opérées en mode biologique enlèvent de la MON par l’échange d’ions
et la biodégradation; 2) La MON peut échanger avec les anions pré-retenus par la suite de
l’épuisement des anions pré-chargées (i.e., bicarbonate et chlorure); 3) La performance du BIEX
en forme bicarbonate est similaire à celle du BIEX en forme chlorure.

25
Objectif 2 : Évaluer l’enlèvement des composés de modèle (i.e., micropolluants organiques) sur
la résine en mode biologique et ainsi valider l’occurrence de biodégradation.
Hypothèses : 1) les composés biodégradables peuvent être biodégradés sur la résine en mode
biologique; 2) les composés négativement chargés peuvent échanger contre la résine en mode
biologique; 3) Les résines en mode biologique n’enlèvent pas de composés neutres et non-
biodégradables.
Objectif 3 : Évaluer la performance du filtre BIEX en filtration secondaire dans l’usine de
production d’eau avec une référence du filtre CAB.
Hypothèses : 1) le filtre BIEX est plus performant que le filtre CAB en termes d’enlèvement de la
MON; 2) le filtre BIEX est plus performant que le filtre CAB en termes d’enlèvement de
précurseurs de sous-produit de désinfection; 3) le filtre BIEX est similaire au filtre CAB en termes
d’enlèvement de l’azote ammoniacal; 4) le filtre BIEX a une plus grande perte de charge par
rapport au filtre CAB.
Objectif 4 : Résumer les stratégies sur l’opération de résine et la gestion de saumure et ainsi
proposer un nouveau schéma de conception pour le processus d’échange d’ions.
Hypothèses : 1) De nombreuses stratégies sur l’opération de résines (autres que le BIEX) existent
dans la littérature qui peuvent réduire l’impact négatif causé par la saumure; 2) De nombreuses
stratégies sur la gestion de saumure existent dans la littérature qui peuvent réduire l’impact
négatif causé par la saumure; 3) Une conception comprenant l’opération de résine et la gestion
de saumure peut réduire l’impact environnemental du processus d’échange d’ions.
1.3.3 Structure de la thèse Le chapitre 1 présente d’abord une revue de littératures en ce qui concerne la matière organique
naturelle et les processus de traitement pour l’enlèvement de la matière organique naturelle.
Ensuite, les problématiques, les objectifs et les hypothèses de cette étude sont présentés à la fin
du chapitre 1.
Le chapitre 2 aborde l’objectif 1 via une étude du pilote à longue terme (9 mois) à l’usine de
production d’eau potable de Pont-Viau (Laval). Les concentrations de COD, CODB et des anions

26
ont été suivies dans les affluents et les effluents du pilote, ce qui permet d’élucider l’effet
d’échange d’ions pour le filtre BIEX. La référence de l’article est présentée ci-dessous :
Liu, Z., Papineau, I., Mohseni, M., Peldszus, S., Bérubé, P. R., Sauvé, S., & Barbeau, B. (2021). Operating Bicarbonate-Form versus Chloride-Form Ion Exchange Resins without Regeneration for Natural Organic Matter Removal. ACS ES&T Water, 2021 1 (6), 1456-1463
Le chapitre 3 aborde l’objectif 2 via une étude en batch qui évalue l’enlèvement de composés de
modèle avec différentes charges et biodégrabilité par la résine biotique et abiotique. L’article est
en révision au journal de Science of the Total Environment.
Le chapitre 4 aborde l’objectif 3 via une étude du pilote à l’usine de production d’eau potable à
Sainte-Rose. La performance du filtre BIEX a été comparée avec les filtres de charbon actif
pendant une longue durée d’opération (9 mois), ce qui permet d’évaluer l’application du BIEX
dans l’usine de production d’eau. La référence de l’article est présentée ci-dessous :
Liu, Z., Lompe, K. M., Mohseni, M., Bérubé, P. R., Sauvé, S., & Barbeau, B. (2020). Biological ion exchange as an alternative to biological activated carbon for drinking water treatment. Water Research, 168, 115148.
Le chapitre 5 aborde l’objectif 4 via une revue de littérature au sujet des stratégies sur l’opération
de résine et la gestion de saumure, ce qui permet d’alléger le fardeau de la saumure produite par
la régénération de résines. La référence de l’article est présentée ci-dessous :
Liu, Z., Haddad, M., Sauvé, S., & Barbeau, B. (2021). Alleviating the burden of ion exchange brine in water treatment: from operational strategies to brine management. Water Research, 205, 117728.
Le chapitre 6 présente les conclusions principales de cette étude et propose des perspectives
pour l’avenir.
L’annexe A aborde une étude sur l’impact de température et EBCT pour les filtres BIEX et CAB.
Les essais ont été menés par les collaborateurs de l’Université de Colombie Britannique, et
l’article a été rédigé par moi. La référence de l’article est présentée ci-dessous :
Liu, Z., Mills, E. C., Mohseni, M., Barbeau, B., & Bérubé, P. R. (2022). Biological ion exchange as an alternative to biological activated carbon for natural organic matter removal: Impact of temperature and empty bed contact time (EBCT). Chemosphere, 288, 132466.

27
Références Adusei-Gyamfi, J., Ouddane, B., Rietveld, L., Cornard, J. P., & Criquet, J. (2019). Natural organic
matter-cations complexation and its impact on water treatment: A critical review. Water Res, 160,
130-147. doi:10.1016/j.watres.2019.05.064
Aiken, G., & Cotsaris, E. (1995). Soil and Hydrology - Their Effect on Nom. Journal American Water
Works Association, 87(1), 36-45. Retrieved from <Go to ISI>://WOS:A1995QC35000005
Aitkenhead-Peterson, J. A., McDowell, W. H., & Neff, J. C. (2003). Sources, production, and
regulation of allochthonous dissolved organic matter inputs to surface waters. In Aquatic
ecosystems (pp. 25-70): Elsevier.
Amini, A., Kim, Y., Zhang, J., Boyer, T., & Zhang, Q. (2015). Environmental and economic
sustainability of ion exchange drinking water treatment for organics removal. Journal of Cleaner
Production, 104, 413-421. doi:10.1016/j.jclepro.2015.05.056
Amini, N., Papineau, I., Storck, V., Berube, P. R., Mohseni, M., & Barbeau, B. (2018). Long-term
performance of biological ion exchange for the removal of natural organic matter and ammonia
from surface waters. Water Res, 146, 1-9. doi:10.1016/j.watres.2018.07.057
Amy, G., & Cho, J. (1999). Interactions between natural organic matter (NOM) and membranes:
Rejection and fouling. Water Science and Technology, 40(9), 131-139. doi:Doi 10.1016/S0273-
1223(99)00649-6
Association, A. P. H., Association, A. W. W., Federation, W. P. C., & Federation, W. E. (2017).
Standard methods for the examination of water and wastewater (Vol. 2): American Public Health
Association.
Ates, N., & Incetan, F. B. (2013). Competition Impact of Sulfate on NOM Removal by Anion-
Exchange Resins in High-Sulfate and Low-SUVA Waters. Industrial & Engineering Chemistry
Research, 52(39), 14261-14269. doi:10.1021/ie401814v

28
Baghoth, S., Dignum, M., Grefte, A., Kroesbergen, J., & Amy, G. (2009). Characterization of NOM
in a drinking water treatment process train with no disinfectant residual. Water Science and
Technology: Water Supply, 9(4), 379-386.
Baker, A., Tipping, E., Thacker, S. A., & Gondar, D. (2008). Relating dissolved organic matter
fluorescence and functional properties. Chemosphere, 73(11), 1765-1772.
doi:10.1016/j.chemosphere.2008.09.018
Basu, O. D., Dhawan, S., & Black, K. (2016). Applications of biofiltration in drinking water
treatment - a review. Journal of Chemical Technology and Biotechnology, 91(3), 585-595.
doi:10.1002/jctb.4860
Bazri, M. M., & Mohseni, M. (2016). Impact of natural organic matter properties on the kinetics
of suspended ion exchange process. Water Res, 91, 147-155. doi:10.1016/j.watres.2015.12.036
Bertilsson, S., & Jones Jr, J. B. (2003). Supply of dissolved organic matter to aquatic ecosystems:
autochthonous sources. In Aquatic ecosystems (pp. 3-24): Elsevier.
Bieroza, M., Baker, A., & Bridgeman, J. (2009). Relating freshwater organic matter fluorescence
to organic carbon removal efficiency in drinking water treatment. Sci Total Environ, 407(5), 1765-
1774. doi:10.1016/j.scitotenv.2008.11.013
Bolto, B., Dixon, D., Eldridge, R., King, S., & Linge, K. (2002). Removal of natural organic matter by
ion exchange. Water Res, 36(20), 5057-5065. doi:10.1016/s0043-1354(02)00231-2
Bond, T., Goslan, E. H., Parsons, S. A., & Jefferson, B. (2011). Treatment of disinfection by-product
precursors. Environmental Technology, 32(1-2), 1-25. doi:10.1080/09593330.2010.495138
Boyer, T. H. (2015). Removal of Dissolved Organic Matter by Magnetic Ion Exchange Resin. Current
Pollution Reports, 1(3), 142-154. doi:10.1007/s40726-015-0012-2
Boyer, T. H., & Singer, P. C. (2006). A pilot-scale evaluation of magnetic ion exchange treatment
for removal of natural organic material and inorganic anions. Water Res, 40(15), 2865-2876.
doi:10.1016/j.watres.2006.05.022
29
Boyer, T. H., Singer, P. C., & Aiken, G. R. (2008). Removal of dissolved organic matter by anion
exchange: effect of dissolved organic matter properties. Environ Sci Technol, 42(19), 7431-7437.
doi:10.1021/es800714d
Bravo, A. G., Bouchet, S., Tolu, J., Bjorn, E., Mateos-Rivera, A., & Bertilsson, S. (2017). Molecular
composition of organic matter controls methylmercury formation in boreal lakes. Nat Commun,
8(1), 14255. doi:10.1038/ncomms14255
Buffle, J., & JAE, B. (1977). LES SUBSTANCES HUMIQUES ET LEURS INTERACTIONS AVEC LES IONS
MINERAUX.
Canada, H. (2020). Guidance on Natural Organic Matter in Drinking Water. Water and Air Quality
Bureau, Healthy Environments and Consumer Safety Branch, Health Canada, Ottawa, Ontario.
(Catalogue No. H144-67/2020E-PDF).
Chow, C., Fabris, R., Wilkinson, K., Fitzgerald, F., & Drikas, M. (2006). Characterising NOM to assess
treatability.
Chow, C. W. K., Fabris, R., Drikas, M., & Holmes, M. (2005). A case study of treatment performance
and organic character. Journal of Water Supply Research and Technology-Aqua, 54(6), 385-395.
Retrieved from <Go to ISI>://WOS:000232992200005
Cornelissen, E. R., Beerendonk, E. F., Nederlof, M. N., van der Hoek, J. P., & Wessels, L. P. (2009).
Fluidized ion exchange (FIX) to control NOM fouling in ultrafiltration. Desalination, 236(1-3), 334-
341. doi:10.1016/j.desal.2007.10.084
Cornelissen, E. R., Moreau, N., Siegers, W. G., Abrahamse, A. J., Rietveld, L. C., Grefte, A., . . .
Wessels, L. P. (2008). Selection of anionic exchange resins for removal of natural organic matter
(NOM) fractions. Water Res, 42(1-2), 413-423. doi:10.1016/j.watres.2007.07.033
Croué, J.-P., Violleau, D., Bodaire, C., Legube, B. J. W. s., & technology. (1999). Removal of
hydrophobic and hydrophilic constituents by anion exchange resin. 40(9), 207-214.
30
Delpla, I., Jung, A. V., Baures, E., Clement, M., & Thomas, O. (2009). Impacts of climate change on
surface water quality in relation to drinking water production. Environ Int, 35(8), 1225-1233.
doi:10.1016/j.envint.2009.07.001
Diem, S., Rudolf von Rohr, M., Hering, J. G., Kohler, H. P., Schirmer, M., & von Gunten, U. (2013).
NOM degradation during river infiltration: effects of the climate variables temperature and
discharge. Water Res, 47(17), 6585-6595. doi:10.1016/j.watres.2013.08.028
Eckhardt, B. W., & Moore, T. R. (1990). Controls on Dissolved Organic-Carbon Concentrations in
Streams, Southern Quebec. Canadian Journal of Fisheries and Aquatic Sciences, 47(8), 1537-1544.
doi:DOI 10.1139/f90-173
Edzwald, J. K. (2010). Water Quality and Treatment A Handbook on Drinking Water: McGrawHill.
Ekstrom, S. M., Kritzberg, E. S., Kleja, D. B., Larsson, N., Nilsson, P. A., Graneli, W., & Bergkvist, B.
(2011). Effect of acid deposition on quantity and quality of dissolved organic matter in soil-water.
Environ Sci Technol, 45(11), 4733-4739. doi:10.1021/es104126f
Emelko, M. B., Huck, P. M., Coffey, B. M., & Smith, E. F. (2006). Effects of media, backwash, and
temperature on full‐scale biological filtration. Journal‐American Water Works Association,
98(12), 61-73.
Fabris, R., Chow, C. W., Drikas, M., & Eikebrokk, B. (2008). Comparison of NOM character in
selected Australian and Norwegian drinking waters. Water Res, 42(15), 4188-4196.
doi:10.1016/j.watres.2008.06.023
Finkbeiner, P., Moore, G., Tseka, T., Nkambule, T. T. I., Kock, L., Jefferson, B., & Jarvis, P. (2019).
Interactions between Organic Model Compounds and Ion Exchange Resins. Environ Sci Technol,
53(16), 9734-9743. doi:10.1021/acs.est.9b02139
Fu, P. L. K., & Symons, J. M. (1990). Removing Aquatic Organic-Substances by Anion-Exchange
Resins. Journal American Water Works Association, 82(10), 70-77. Retrieved from <Go to
ISI>://WOS:A1990ED74100012
Gjessing, E. T. (1976). Physical and chemical characteristics of aquatic humus.

31
Grefte, A., Dignum, M., Cornelissen, E., & Rietveld, L. (2013). Natural organic matter removal by
ion exchange at different positions in the drinking water treatment lane. Drinking Water
Engineering and Science, 6(1), 1-10.
Henderson, R. K., Baker, A., Parsons, S. A., & Jefferson, B. (2008). Characterisation of algogenic
organic matter extracted from cyanobacteria, green algae and diatoms. Water Res, 42(13), 3435-
3445. doi:10.1016/j.watres.2007.10.032
Hijnen, W. A. M., Schurer, R., Bahlman, J. A., Ketelaars, H. A. M., Italiaander, R., van der Wal, A.,
& van der Wielen, P. (2018). Slowly biodegradable organic compounds impact the biostability of
non-chlorinated drinking water produced from surface water. Water Res, 129, 240-251.
doi:10.1016/j.watres.2017.10.068
Hongve, D., Baann, J., Becher, G., & Beckmann, O. A. (1999). Experiences from operation and
regeneration of an anionic exchanger for natural organic matter (NOM) removal. Water Science
and Technology, 40(9), 215-221. doi:Doi 10.1016/S0273-1223(99)00659-9
Hu, Y., & Boyer, T. H. (2017). Integrated bicarbonate-form ion exchange treatment and
regeneration for DOC removal: Model development and pilot plant study. Water Res, 115, 40-49.
doi:10.1016/j.watres.2017.02.013
Huber, S. A., Balz, A., Abert, M., & Pronk, W. (2011). Characterisation of aquatic humic and non-
humic matter with size-exclusion chromatography--organic carbon detection--organic nitrogen
detection (LC-OCD-OND). Water Res, 45(2), 879-885. doi:10.1016/j.watres.2010.09.023
Hudson, N., Baker, A., Ward, D., Reynolds, D. M., Brunsdon, C., Carliell-Marquet, C., & Browning,
S. (2008). Can fluorescence spectrometry be used as a surrogate for the Biochemical Oxygen
Demand (BOD) test in water quality assessment? An example from South West England. Science
of The Total Environment, 391(1), 149-158.
Imai, A., Fukushima, T., Matsushige, K., & Kim, Y. H. (2001). Fractionation and characterization of
dissolved organic matter in a shallow eutrophic lake, its inflowing rivers, and other organic matter
sources. Water Res, 35(17), 4019-4028. doi:10.1016/s0043-1354(01)00139-7
32
Jeong, S., Kim, S. J., Kim, C. M., Vigneswaran, S., Nguyen, T. V., Shon, H. K., . . . Kim, I. S. (2013). A
detailed organic matter characterization of pretreated seawater using low pressure
microfiltration hybrid systems. Journal of Membrane Science, 428, 290-300.
doi:10.1016/j.memsci.2012.11.019
Joret, J., & Levi, Y. J. T. d. C. (1986). Méthode rapide d'évaluation du carbone éliminable des eaux
par voie biologique. 39(510), 3-9.
Kalbitz, K., Solinger, S., Park, J. H., Michalzik, B., & Matzner, E. (2000). Controls on the dynamics
of dissolved organic matter in soils: A review. Soil science, 165(4), 277-304. doi:Doi
10.1097/00010694-200004000-00001
Kastl, G., Sathasivan, A., & Fisher, I. (2016). A selection framework for NOM removal process for
drinking water treatment. Desalination and Water Treatment, 57(17), 7679-7689.
doi:10.1080/19443994.2015.1044476
Kimura, K., Tanaka, K., & Watanabe, Y. (2014). Microfiltration of different surface waters
with/without coagulation: Clear correlations between membrane fouling and hydrophilic
biopolymers. Water Research, 49, 434-443. doi:10.1016/j.watres.2013.10.030
Koreman, E., & Galjaard, G. (2016). NOM-removal at SWTP Andijk (Netherlands) with a New Anion
Exchange Process, called SIX®.
Korshin, G., Chow, C. W., Fabris, R., & Drikas, M. (2009). Absorbance spectroscopy-based
examination of effects of coagulation on the reactivity of fractions of natural organic matter with
varying apparent molecular weights. Water Res, 43(6), 1541-1548.
doi:10.1016/j.watres.2008.12.041
Koudjonou, B., Prevost, M., & Merlet, N. (2005). Characterization of organic matter in water
resources and supplies. Biodegradable organic matter in drinking water treatment and
distribution. PL Michele Prevost, Pierre Servais, Jean-Claude Joret (eds), American Water Works
Association.
Kuehn, W., & Mueller, U. (2000). Riverbank filtration - An overview. Journal American Water
Works Association, 92(12), 60-+. Retrieved from <Go to ISI>://WOS:000168836400017

33
Lee, D. J., Cheng, Y. L., & Wong, R. J. (2013). Characteristics of natural organic matters in raw and
treated drinking water: Comparison study. Journal of the Taiwan Institute of Chemical Engineers,
44(1), 103-110. doi:10.1016/j.jtice.2012.10.001
Lee, N., Amy, G., & Croue, J. P. (2006). Low-pressure membrane (MF/UF) fouling associated with
allochthonous versus autochthonous natural organic matter. Water Res, 40(12), 2357-2368.
doi:10.1016/j.watres.2006.04.023
Levchuk, I., Màrquez, J. J. R., & Sillanpää, M. (2018). Removal of natural organic matter (NOM)
from water by ion exchange–a review. Chemosphere, 192, 90-104.
Lipczynska-Kochany, E. (2018). Effect of climate change on humic substances and associated
impacts on the quality of surface water and groundwater: A review. Sci Total Environ, 640-641,
1548-1565. doi:10.1016/j.scitotenv.2018.05.376
Liu, C., Olivares, C. I., Pinto, A. J., Lauderdale, C. V., Brown, J., Selbes, M., & Karanfil, T. (2017). The
control of disinfection byproducts and their precursors in biologically active filtration processes.
Water Res, 124, 630-653. doi:10.1016/j.watres.2017.07.080
Logsdon, G. S., Kohne, R., Abel, S., & LaBonde, S. (2002). Slow sand filtration for small water
systems. Journal of Environmental Engineering and Science, 1(5), 339-348.
Matilainen, A., Gjessing, E. T., Lahtinen, T., Hed, L., Bhatnagar, A., & Sillanpaa, M. (2011). An
overview of the methods used in the characterisation of natural organic matter (NOM) in relation
to drinking water treatment. Chemosphere, 83(11), 1431-1442.
doi:10.1016/j.chemosphere.2011.01.018
Matošić, M., Mijatović, I., Hodžić, E. J. C., & quarterly, b. e. (2000). Nitrate removal from drinking
water using ion exchange-comparison of chloride and bicarbonate form of the resins. 42(2), 141-
146.
Maul, G. A., Kim, Y., Amini, A., Zhang, Q., & Boyer, T. H. (2014). Efficiency and life cycle
environmental impacts of ion-exchange regeneration using sodium, potassium, chloride, and
bicarbonate salts. Chemical Engineering Journal, 254, 198-209. doi:10.1016/j.cej.2014.05.086

34
Minor, E. C., Swenson, M. M., Mattson, B. M., & Oyler, A. R. (2014). Structural characterization of
dissolved organic matter: a review of current techniques for isolation and analysis. Environ Sci
Process Impacts, 16(9), 2064-2079. doi:10.1039/c4em00062e
Ness, A., & Boyer, T. H. J. J. A. W. W. A. (2017). Pilot‐Scale Evaluation of Bicarbonate‐Form
Anion Exchange for DOC Removal in Small Systems. 109(12), 13-26.
Nguyen, M. L., Baker, L. A., & Westerhoff, P. (2002). DOC and DBP precursors in western US
watersheds and reservoirs. Journal American Water Works Association, 94(5), 98-112. Retrieved
from <Go to ISI>://WOS:000175623100009
Pettit, R. E. (2004). Organic matter, humus, humate, humic acid, fulvic acid and humin: their
importance in soil fertility and plant health. CTI Research, 10, 1-7.
Pivokonsky, M., Kloucek, O., & Pivokonska, L. (2006). Evaluation of the production, composition
and aluminum and iron complexation of algogenic organic matter. Water Res, 40(16), 3045-3052.
doi:10.1016/j.watres.2006.06.028
Prévost, M., Gauthier, C., Hureïki, L., Desjardins, R., & Servais, P. (1998). Removal of amino acids,
biodegradable organic carbon and chlorine demand by biological filtration in cold water.
Environmental Technology, 19(9), 903-911.
Ray, C., Grischek, T., Schubert, J., Wang, J. Z., & Speth, T. F. (2002). A perspective of riverbank
filtration. Journal American Water Works Association, 94(4), 149-+. Retrieved from <Go to
ISI>://WOS:000174914900019
Reckhow, D., Rees, P., Nüsslein, K., Makdissy, G., Devine, G., Conneely, T., . . . Bryan, D. (2007).
Long-term variability of BDOM and NOM as precursors in watershed sources. American Water
Works Association Research Foundation, Denver, CO. Long-term variability of BDOM and NOM as
precursors in watershed sources. American Water Works Association Research Foundation,
Denver, CO., -.
Rice, J. A., & Maccarthy, P. (1991). Statistical Evaluation of the Elemental Composition of Humic
Substances. Organic Geochemistry, 17(5), 635-648. doi:Doi 10.1016/0146-6380(91)90006-6

35
Rokicki, C. A., & Boyer, T. H. (2011). Bicarbonate-form anion exchange: affinity, regeneration, and
stoichiometry. Water Res, 45(3), 1329-1337. doi:10.1016/j.watres.2010.10.018
Sanchez, N. P., Skeriotis, A. T., & Miller, C. M. (2013). Assessment of dissolved organic matter
fluorescence PARAFAC components before and after coagulation-filtration in a full scale water
treatment plant. Water Res, 47(4), 1679-1690. doi:10.1016/j.watres.2012.12.032
Schulz, M., Winter, J., Wray, H., Barbeau, B., & Berube, P. (2017). Biologically active ion exchange
(BIEX) for NOM removal and membrane fouling prevention. Water Science and Technology-Water
Supply, 17(4), 1178-1184. doi:10.2166/ws.2017.016
Siembida‐Lösch, B., Anderson, W. B., Bonsteel, J., & Huck, P. M. (2014). Pretreatment impacts
on biopolymers in adjacent ultrafiltration plants. Journal‐American Water Works Association,
106(9), E372-E382.
Sillanpää, M. (2014). Natural organic matter in water: Characterization and treatment methods:
Butterworth-Heinemann.
Simpson, D. R. (2008). Biofilm processes in biologically active carbon water purification. Water
Res, 42(12), 2839-2848. doi:10.1016/j.watres.2008.02.025
Slunjski, M., Cadee, K., & Tattersall, J. (2000). MIEX® resin water treatment process. Proceedings
of Aquatech, 26-29.
Smith, E., & Kamal, Y. (2009). Optimizing treatment for reduction of disinfection by-product (DBP)
formation. Water Science and Technology: Water Supply, 9(2), 191-198.
Spencer, R. G., Bolton, L., & Baker, A. (2007). Freeze/thaw and pH effects on freshwater dissolved
organic matter fluorescence and absorbance properties from a number of UK locations. Water
Res, 41(13), 2941-2950. doi:10.1016/j.watres.2007.04.012
Stevenson, F. J. (1994). Humus chemistry: genesis, composition, reactions: John Wiley & Sons.
Tan, Y., & Kilduff, J. E. (2007). Factors affecting selectivity during dissolved organic matter removal
by anion-exchange resins. Water Res, 41(18), 4211-4221. doi:10.1016/j.watres.2007.05.050
36
Terry, L. G., & Summers, R. S. (2018). Biodegradable organic matter and rapid-rate biofilter
performance: A review. Water Res, 128, 234-245. doi:10.1016/j.watres.2017.09.048
Tian, C., Liu, R., Liu, H., & Qu, J. (2013). Disinfection by-products formation and precursors
transformation during chlorination and chloramination of highly-polluted source water:
significance of ammonia. Water Res, 47(15), 5901-5910. doi:10.1016/j.watres.2013.07.013
Tomlinson, A., Drikas, M., & Brookes, J. D. (2016). The role of phytoplankton as pre-cursors for
disinfection by-product formation upon chlorination. Water Res, 102, 229-240.
doi:10.1016/j.watres.2016.06.024
Valencia, S., Marin, J. M., Restrepo, G., & Frimmel, F. H. (2013). Application of excitation-emission
fluorescence matrices and UV/Vis absorption to monitoring the photocatalytic degradation of
commercial humic acid. Sci Total Environ, 442, 207-214. doi:10.1016/j.scitotenv.2012.10.058
Van Der Kooij, D., Visser, A., & Hijnen, W. J. J. A. W. W. A. (1982). Determining the concentration
of easily assimilable organic carbon in drinking water. 74(10), 540-545.
Verdickt, L., Closset, W., D'Haeseleer, V., & Cromphout, J. (2012). Applicability of ion exchange for
NOM removal from a sulfate-rich surface water incorporating full reuse of the brine. Water
Science and Technology-Water Supply, 12(6), 878-887. doi:10.2166/ws.2012.065
Volk, C., Wood, L., Johnson, B., Robinson, J., Zhu, H. W., & Kaplan, L. (2002). Monitoring dissolved
organic carbon in surface and drinking waters. J Environ Monit, 4(1), 43-47. doi:10.1039/b107768f
Walker, K. M., & Boyer, T. H. (2011). Long-term performance of bicarbonate-form anion
exchange: removal of dissolved organic matter and bromide from the St. Johns River, FL, USA.
Water Res, 45(9), 2875-2886. doi:10.1016/j.watres.2011.03.004
Watson, S. B., Miller, C., Arhonditsis, G., Boyer, G. L., Carmichael, W., Charlton, M. N., . . . Wilhelm,
S. W. (2016). The re-eutrophication of Lake Erie: Harmful algal blooms and hypoxia. Harmful
Algae, 56, 44-66. doi:10.1016/j.hal.2016.04.010
Weishaar, J. L., Aiken, G. R., Bergamaschi, B. A., Fram, M. S., Fujii, R., & Mopper, K. (2003).
Evaluation of specific ultraviolet absorbance as an indicator of the chemical composition and

37
reactivity of dissolved organic carbon. Environ Sci Technol, 37(20), 4702-4708.
doi:10.1021/es030360x
Westerhoff, P., Aiken, G., Amy, G., & Debroux, J. (1999). Relationships between the structure of
natural organic matter and its reactivity towards molecular ozone and hydroxyl radicals. Water
Research, 33(10), 2265-2276. doi:Doi 10.1016/S0043-1354(98)00447-3
Wetzel, R. G. (2003). Dissolved organic carbon: detrital energetics, metabolic regulators, and
drivers of ecosystem stability of aquatic ecosystems. In Aquatic Ecosystems (pp. 455-477):
Elsevier.
Weyhenmeyer, G. A., Prairie, Y. T., & Tranvik, L. J. (2014). Browning of boreal freshwaters coupled
to carbon-iron interactions along the aquatic continuum. PLOS ONE, 9(2), e88104.
doi:10.1371/journal.pone.0088104
Winter, J., Wray, H. E., Schulz, M., Vortisch, R., Barbeau, B., & Berube, P. R. (2018). The impact of
loading approach and biological activity on NOM removal by ion exchange resins. Water Res, 134,
301-310. doi:10.1016/j.watres.2018.01.052
Worch, E. (2021). Adsorption technology in water treatment: de Gruyter.
Xue, H. B., & Sigg, L. (1999). Comparison of the complexation of Cu and Cd by humic or fulvic acids
and by ligands observed in lake waters. Aquatic Geochemistry, 5(4), 313-335. doi:Doi
10.1023/A:1009679819002
Zhang, T., Lu, J., Ma, J., & Qiang, Z. (2008). Fluorescence spectroscopic characterization of DOM
fractions isolated from a filtered river water after ozonation and catalytic ozonation.
Chemosphere, 71(5), 911-921. doi:10.1016/j.chemosphere.2007.11.030
Zhou, S., Shao, Y., Gao, N., Deng, Y., Li, L., Deng, J., & Tan, C. (2014). Characterization of algal
organic matters of Microcystis aeruginosa: biodegradability, DBP formation and membrane
fouling potential. Water Res, 52, 199-207. doi:10.1016/j.watres.2014.01.002

38
Chapitre 2 – Operating bicarbonate-form versus chloride-form
ion exchange resins without regeneration for natural organic
matter removal
Abstract
Ion exchange (IX) is a promising drinking water treatment process for natural organic matter
(NOM) removal. However, standard IX processes require frequent regenerations with
concentrated NaCl solution, producing a brine that requires costly and complicated disposal
methods. To alleviate the burden of IX brine, we previously proposed operating IX with infrequent
regeneration to favor biomass development on the resins and thus benefit NOM removal through
biomass contribution, a process referred to as biological ion exchange (BIEX). The objective of the
present study is to evaluate the performance of BIEX filtration for NOM removal from primary IX
to complete exhaustion using bicarbonate-form and chloride-form IX resins. Parallel pilot-scale
bicarbonate-form and chloride-form BIEX were fed with surface water (dissolved organic carbon
(DOC) = 7 mg C/L) for 9 months without regeneration. The results demonstrated that bicarbonate-
form BIEX achieved a marginally lower DOC removal (median: 49 % vs. 53 %), a higher
biodegradable DOC (BDOC) removal (average: 50 % vs. 33 %) and a similar disinfection by-product
precursor removal compared to chloride-form BIEX. Overall, BIEX filtration using bicarbonate-
form and chloride-form IX resins offers a similar NOM removal efficiency and eases spent brine
management.
Keywords: Biological ion exchange; Bicarbonate-form ion exchange; Biofiltration; natural organic
matter; NOM fractionation; sustainability.

39
2.1 Introduction Natural organic matter (NOM) removal is of paramount importance for drinking water production
as it causes aesthetic problems such as color, odor and taste, leads to the formation of harmful
disinfection by-products (DBP), disrupts water treatment processes (e.g., membrane fouling) and
contributes to biofilm regrowth in distribution systems (Edzwald et al., 2010; Richardson et al.,
2007; Tian et al., 2013; Peleato et al., 2017; Hijnen et al., 2018;). Using strong base ion exchange
(IX) is an efficient option to remove NOM (Kim and Symons, 1991; Tan et al., 2005; Zhang et al.,
2019; MacKeown et al., 2020). IX removes NOM through two main mechanisms which are driven
by the functional groups of NOM moieties. Charged groups can sorb to IX functional groups
through electrostatic interactions whereas uncharged groups may adsorb onto the IX surface
through the Van der Waal force or hydrophobic interactions (Bolto et al., 2002; Fu and Symons,
1990; Li and SenGupta, 2004). IX offers several advantages as a process used for NOM removal.
First, it can target hydrophilic NOM which is not readily removed by conventional processes (e.g.,
coagulation and activated carbon) (Matilainen et al., 2010; Shutova et al., 2020). Second, IX has
proven to be flexible in terms of operational mode, reactor configurations and integration within
existing treatment trains (Greft et al., 2013). It can also be adapted into a broad spectrum of
applications varying from household point-of-use to full scale drinking water treatment plants
(WTP) (Amini et al., 2015). Third, IX can be regenerated on-site using concentrated NaCl solution
(e.g., 12 %w/v) as opposed to activated carbon which is usually regenerated off-site using energy-
intensive thermal processes (Ledesma et al., 2014). Yet, the drawback of IX regenerability is the
production of a highly concentrated chloride brine whose direct disposal to the environment is
restricted due to its high salinity (Levchuk et al., 2018). As a result, despite its ease of use and
great NOM removal efficiency, the implementation of IX processes is limited by the burden of
brine management and disposal (Sillanpää, 2014).
In an effort to prolong the service time of IX and reduce the production of brine, it has been
proposed to operate fixed-bed IX filters over an extended period of time without regeneration to
favor biomass development on the surface of IX beads and thereby benefit NOM removal through
biodegradation, i.e., biological ion exchange (BIEX) (Amini et al., 2018). Lab-scale experiments
indicated that in the absence of regeneration, biodegradation contributed to NOM removal as

40
BIEX achieved a higher dissolved organic carbon (DOC) removal than its abiotic counterpart
operated in parallel (BIEX: 60 % vs. Abiotic-IX: 40 %) (Schulz et al., 2017). BIEX also exceeded NOM
removal efficiency of biological activated carbon (BAC) filters at lab-scale (BIEX: 56 % vs. BAC: 15
%) as well as at pilot-scale (BIEX: 62 % vs. BAC: 5 %) (Amini et al., 2018; Winter et al., 2018).
Although BIEX proved to be less efficient than a conventional IX filter which was regenerated on
a weekly basis (IX: 80 % vs. BIEX: 62 %), this novel mode demonstrated the possibility of
significantly reducing the IX brine production (i.e., 331 days without regeneration) while
maintaining a high NOM removal (Amini et al., 2018).
Another alternative to ease brine management is to resort to the use of bicarbonate salt as an IX
regenerant (i.e., bicarbonate-form IX) as opposed to chloride salt. Bicarbonate brine can be
directly disposed into sewers or, in some cases, the environment as bicarbonate has little impact
on flora and fauna (Rokicki et al., 2011; Maul et al., 2014). Bicarbonate-form IX has a similar
affinity for DOC compared to chloride-form IX and the treated water is less corrosive due to the
release of bicarbonate as opposed to the release of chloride (Nguyen et al., 2010; Walker and
Boyer, 2011; Ishii and Boyer, 2011; Ness and Boyer, 2017). However, the real application of
bicarbonate-form IX remains limited as NaHCO3 is more expensive than NaCl and has a lower
solubility in water/regeneration efficiency which may progressively lower NOM removal
efficiency as the number of regeneration increases (Walker and Boyer, 2011; Hu et al., 2016; Ness
and Boyer, 2017; Hu and Boyer, 2017).
Consequently, it is of great interest to study the operation of bicarbonate-form IX in BIEX mode
as it could not only greatly reduce regeneration frequency but also ease brine disposal. This is of
paramount importance for drinking water utilities, and more important for small communities
located in remote areas which would otherwise depends on chemical/brine transportation.
However, as none of the previous studies assessed bicarbonate-form IX operated in biological
mode (BIEX), its NOM removal efficiency under such operational conditions remains unknown.
Hence, the objective of the present study is to evaluate the NOM removal performance of
bicarbonate-form IX operated in BIEX mode with a benchmark of chloride-form IX operated in
BIEX mode. To better understand the underlying mechanisms that come into play, anion loading
on IX, DOC removal, treated water biostability (biodegradable DOC), metabolic activity of

41
heterotrophic biomass on the media, DBP precursor removal, specific ultraviolet absorbance at
254nm (SUVA) and NOM fractionation in influent and effluent were assessed. The present study
is the first to evaluate the advantages and limitations of implementing bicarbonate-form IX resins
operated in BIEX mode at pilot-scale.
2.2 Methods and materials
2.2.1 Resin preconditioning The resin type used in this study is Purolite® A860, a type-I strong base anion exchange resin with
polyacrylic and quaternary ammonium as backbone and functional group, respectively. The
average diameter of Purolite® A860 resin is of 0.75 mm according to the supplier. Based on
previous measurements, the ion exchange capacity is quantified as 0.68 eq/L of resin and the
virgin resin is initially loaded with chloride (Amini et al., 2018). Batch preconditioning of both
chloride-form and bicarbonate-form IX was carried out in a lab-scale 10-L beaker prior to its
transfer to pilot-scale packed-bed filters. The preconditioning of chloride-form IX consisted of
three steps. The virgin IX was first mixed with 120 g/L NaCl solution (volume ratio = 1 L of resin:3
L of brine) at 250 rpm for 30 min. Then, it was mixed with demineralized water (volume ratio =
1:3) at 250 rpm for 5 min to wash out the excess chloride on resin surface. Finally, resin beads
were soaked in demineralized water (to evite ion exchange before test) before use (within 48h).
Contrary to chloride-form IX, bicarbonate-form IX are not commercially available. Consequently,
bicarbonate-form IX was prepared using chloride-form IX which was first mixed with 80 g/L
NaHCO3 solution (volume ratio = 1:3) at 250 rpm for 30 min. Then, the IX beads were mixed in
demineralized water (volume ratio = 1:3) at 250 rpm for 5 min to wash out the excess bicarbonate
on resin surface. A conversion rate was used to evaluate the conversion efficiency from chloride-
form IX to bicarbonate-form IX, which is defined as the chloride quantity in the brine (i.e., the
NaHCO3 solution after regeneration) divided by the theoretical chloride capacity on the IX beads.
These two steps were repeated three times in order to achieve a final conversion rate of 97 %
(data not shown). After conversion, the bicarbonate-form IX beads were soaked in demineralized
water before use (within 48h).
42
2.2.2 Pilot location and source water characteristics The pilot-scale columns were set up at the Pont-Viau drinking water treatment plant (Laval,
Canada) and were directly fed with raw water from Des Prairies River which is characterised by a
moderate DOC concentration (≈7.0 mg C/L), a neutral pH (≈7.2) and a low sulfate concentration
(5.6 mg/L) (Table S2.1). The pilot-scale columns were operated over a 9-month period (from April
2019 to January 2020).
2.2.3 Pilot design and operation Two polyvinyl chloride (PVC) columns (inner diameter of 101.6 mm) containing 0.6 m (≈ 4.8 L) of
either bicarbonate-form IX or chloride-form IX were co-currently operated for 250 days without
regeneration (hereafter BIEX-B and BIEX-C filter). The filtration rate was maintained at 2.4 m/h (4
bed volumes/h) throughout the study, which corresponded to an empty bed contact time (EBCT)
of 15 min. Columns were backwashed on a weekly basis with air (2 min at 55 m/h) and then
followed by unchlorinated treated (20 m/h) water from the WTP. Filter backwash was terminated
either based on wash water turbidity (≤10 NTU) or when a total backwash volume of 50 L (≈ 10
bed volumes) was reached.
2.2.4 Analytical methods Water temperature, pH and turbidity were monitored on-site on a weekly basis. Temperature
and pH were measured with a multimeter (HACH HQ40D), and turbidity was quantified with a
turbidity meter (Hach 2100) using Standard Method 2130 (APHA, 2017). Influent and effluent
samples were also collected on a weekly basis to assess DOC (TOC meter, Sievers 5310C, GE water,
USA) and UV254 absorbance (Ultrospec 3100pro, GE Healthcare, USA). Biodegradable DOC (BDOC),
which consists of measuring the DOC reduction in water samples incubated for 30 days with an
inoculum of suspended bacteria from the raw water, was assessed in parallel according to the
method developed by Servais et al. (1989) and optimised by Markarian et al. (2010). To assess
influent and effluent NOM reactivity, trihalomethane (THM) and haloacetic acids (HAA)
precursors were assessed on a weekly basis from June to August according to the Uniform
Formation Conditions test (UFC) (i.e., by maintaining a free chlorine residual of 1.0 ± 0.5 mg Cl2/L
after a contact time of 24h at pH 8.0 and 20°C) (Summers et al., 1996). HAA5 extraction was done
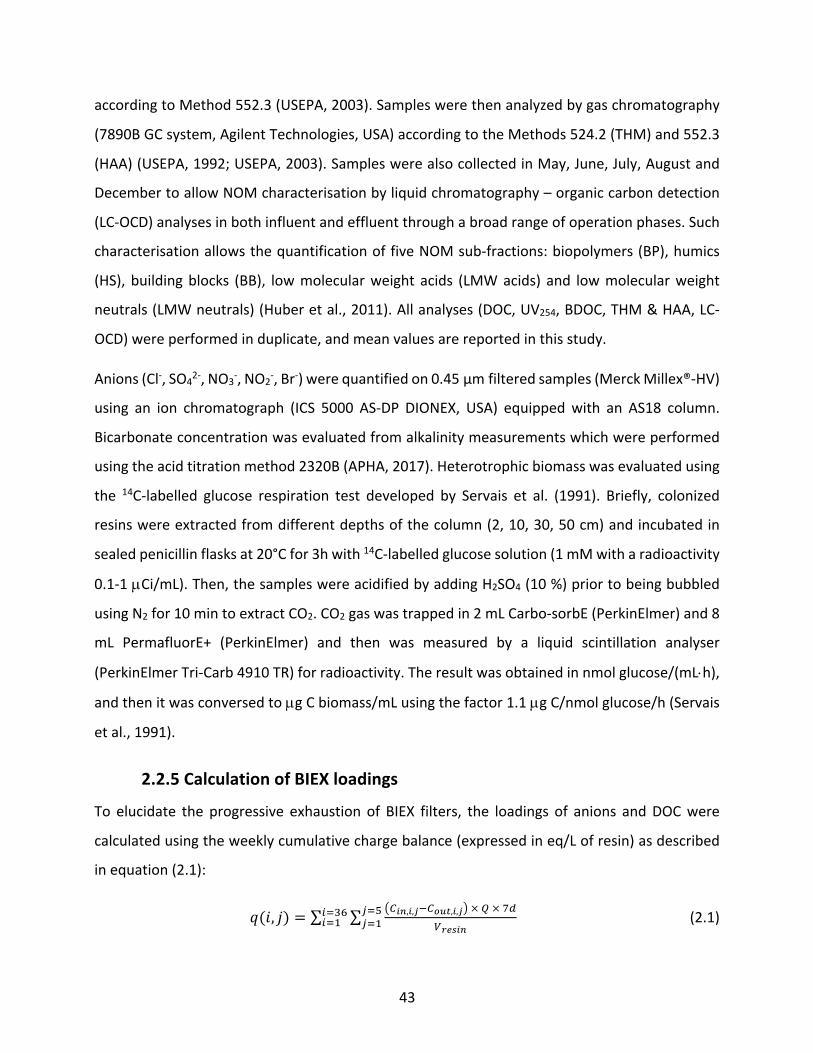
43
according to Method 552.3 (USEPA, 2003). Samples were then analyzed by gas chromatography
(7890B GC system, Agilent Technologies, USA) according to the Methods 524.2 (THM) and 552.3
(HAA) (USEPA, 1992; USEPA, 2003). Samples were also collected in May, June, July, August and
December to allow NOM characterisation by liquid chromatography – organic carbon detection
(LC-OCD) analyses in both influent and effluent through a broad range of operation phases. Such
characterisation allows the quantification of five NOM sub-fractions: biopolymers (BP), humics
(HS), building blocks (BB), low molecular weight acids (LMW acids) and low molecular weight
neutrals (LMW neutrals) (Huber et al., 2011). All analyses (DOC, UV254, BDOC, THM & HAA, LC-
OCD) were performed in duplicate, and mean values are reported in this study.
Anions (Cl-, SO42-, NO3-, NO2-, Br-) were quantified on 0.45 μm filtered samples (Merck Millex®-HV)
using an ion chromatograph (ICS 5000 AS-DP DIONEX, USA) equipped with an AS18 column.
Bicarbonate concentration was evaluated from alkalinity measurements which were performed
using the acid titration method 2320B (APHA, 2017). Heterotrophic biomass was evaluated using
the 14C-labelled glucose respiration test developed by Servais et al. (1991). Briefly, colonized
resins were extracted from different depths of the column (2, 10, 30, 50 cm) and incubated in
sealed penicillin flasks at 20°C for 3h with 14C-labelled glucose solution (1 mM with a radioactivity
0.1-1 µCi/mL). Then, the samples were acidified by adding H2SO4 (10 %) prior to being bubbled
using N2 for 10 min to extract CO2. CO2 gas was trapped in 2 mL Carbo-sorbE (PerkinElmer) and 8
mL PermafluorE+ (PerkinElmer) and then was measured by a liquid scintillation analyser
(PerkinElmer Tri-Carb 4910 TR) for radioactivity. The result was obtained in nmol glucose/(mL×h),
and then it was conversed to µg C biomass/mL using the factor 1.1 µg C/nmol glucose/h (Servais
et al., 1991).
2.2.5 Calculation of BIEX loadings To elucidate the progressive exhaustion of BIEX filters, the loadings of anions and DOC were
calculated using the weekly cumulative charge balance (expressed in eq/L of resin) as described
in equation (2.1):
#(%, ') = ∑ ∑ !"!",!,$#"%&',!,$$×'×()*()*!"
+,-+,.
/,01/,. (2.1)

44
where q (i,j) is the total accumulative loading (eq/L) of solute j in BIEX filter after week i. Five
solutes were considered in this equation: DOC, chloride, bicarbonate, sulfate and nitrate. Nitrite
and bromide were neglected from this analysis given that their concentrations in raw water were
below the limit of detection throughout the study period (NO2- < 0.2 mg/L; Br- < 0.1 mg/L). Cin, i, j
and Cout, i, j respectively represent the weekly concentration of solute j at week i in the influent
and effluent. Q is the daily flow (460 L/day) and Vresin is the volume of resin in the columns (4.8 L).
DOC charge density was assumed to be 10 meq/g C, a common value for NOM at neutral pH based
on Boyer et al. (2008).
2.2.6 Statistical analysis A Shapiro-Wilk test was used to confirm the normality of the data at a significance level of p >
0.05 before conducting the hypothesis tests. Based on the outcome, the hypothesis test was
conducted using either a paired t-test or a paired Wilcoxon test for normally and non-normally
distributed data, respectively. The null hypothesis was bicarbonate-form BIEX and chloride-form
BIEX were identical for the tested metrics at a significance level of p > 0.05. All statistical analyses
were conducted in the software R (version 3.6.3).
2.3 Results and discussion
2.3.1 BIEX loading during pilot study During the operation of BIEX columns, both NOM and background anions in feed water were
exchanged onto IX resins, and the BIEX loading of these solutes evolves with the bed volumes
(BV) of operation (Figure 2.1A). Prior to 5 000 BV, bicarbonate was continuously released until it
was exhausted. Meanwhile, DOC and sulfate continuously increased on the IX resins whereas
chloride first increased on the IX resins and then rapidly decreased until exhaustion (≈ 5 000 BV).
Little nitrate was exchanged onto the IX resins (max loading: 0.03 eq/L resin) mainly due to its low
concentration in feed waters (mean concentration 0.9 mg/L). Consequently, the dominant
mechanism on BIEX-B, prior to 5 000 BV, involved DOC and sulfate exchanging for bicarbonate.
As the exchange capacity was due to pre-charged bicarbonate, this phase is termed primary IX.
From 5 000 to 15 000 BV, sulfate that was previously retained during the primary IX phase began

45
to be exchanged with DOC. Other anions (chloride, bicarbonate and nitrate) remained
insignificantly loaded on the IX resin. Given that DOC was removed by exchanging with sulfate,
we have defined this phase as secondary IX. Subsequent to 15 000 BV, the IX resin was deemed
to be fully loaded with NOM since the IX loading with respect to bicarbonate and sulfate was
considered to be exhausted. However, a continuous increase of DOC loading was observed, which
is hypothesized to be attributable to the contribution of biomass (biosorption, biodegradation,
bioregeneration). The BIEX-C filter exhibited a very similar loading pattern to BIEX-B (Figure 2.1B),
with the exception of chloride which was initially charged onto the IX resins and whose
concentration gradually decreased until exhaustion during the primary IX. By the end of the study,
DOC loading on the IX resin in BIEX-C filter was 0.73 eq/L resin as opposed to 0.68 eq/L resin in
the BIEX-B filter. This higher loading was attributed to the slightly higher NOM removal in BIEX-C
filter, which will be presented in the next section.
Figure 2.1 - Cumulative loading (eq/L of resin) in the (A) bicarbonate-form BIEX (BIEX-B) and (B)
chloride-form BIEX (BIEX-C) for four anions and dissolved organic carbon (DOC) throughout the
study period (≈ 24 000 BV or 250 days). No regeneration occurred during this period.
2.3.2 NOM removal Effluent DOC was normalized to influent DOC to account for the variation of DOC concentration
in the BIEX effluents (DOC/DOC0). The normalized DOC concentrations are presented as a function
of bed volumes in Figure 2.2A. Prior to 5 000 BV (i.e., primary IX), DOC was efficiently removed
B
0
0.2
0.4
0.6
0.8
0 5000 10000 15000 20000 25000
Anio
n lo
adin
g (e
q/L
resi
n)
Bed volumes
DOCChlorideBicarbonateSulfateNitrate
A Primary IX
Secondary IX
Exhaustion
0
0.2
0.4
0.6
0.8
0 5000 10000 15000 20000 25000
Anio
n lo
adin
g (e
q/L
resi
n)
Bed volumes
Primary IX
Secondary IX Exhaustion
IX capacity IX capacity
HCO3-Cl-
NO3-SO42-
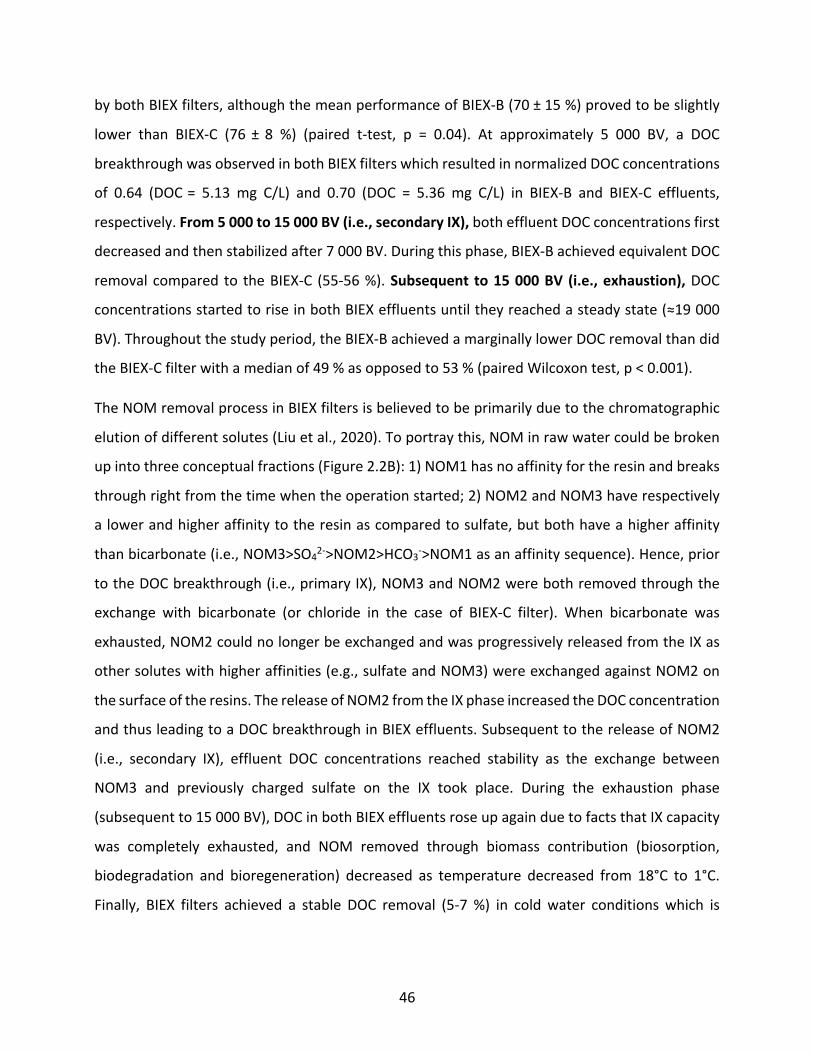
46
by both BIEX filters, although the mean performance of BIEX-B (70 ± 15 %) proved to be slightly
lower than BIEX-C (76 ± 8 %) (paired t-test, p = 0.04). At approximately 5 000 BV, a DOC
breakthrough was observed in both BIEX filters which resulted in normalized DOC concentrations
of 0.64 (DOC = 5.13 mg C/L) and 0.70 (DOC = 5.36 mg C/L) in BIEX-B and BIEX-C effluents,
respectively. From 5 000 to 15 000 BV (i.e., secondary IX), both effluent DOC concentrations first
decreased and then stabilized after 7 000 BV. During this phase, BIEX-B achieved equivalent DOC
removal compared to the BIEX-C (55-56 %). Subsequent to 15 000 BV (i.e., exhaustion), DOC
concentrations started to rise in both BIEX effluents until they reached a steady state (≈19 000
BV). Throughout the study period, the BIEX-B achieved a marginally lower DOC removal than did
the BIEX-C filter with a median of 49 % as opposed to 53 % (paired Wilcoxon test, p < 0.001).
The NOM removal process in BIEX filters is believed to be primarily due to the chromatographic
elution of different solutes (Liu et al., 2020). To portray this, NOM in raw water could be broken
up into three conceptual fractions (Figure 2.2B): 1) NOM1 has no affinity for the resin and breaks
through right from the time when the operation started; 2) NOM2 and NOM3 have respectively
a lower and higher affinity to the resin as compared to sulfate, but both have a higher affinity
than bicarbonate (i.e., NOM3>SO42->NOM2>HCO3->NOM1 as an affinity sequence). Hence, prior
to the DOC breakthrough (i.e., primary IX), NOM3 and NOM2 were both removed through the
exchange with bicarbonate (or chloride in the case of BIEX-C filter). When bicarbonate was
exhausted, NOM2 could no longer be exchanged and was progressively released from the IX as
other solutes with higher affinities (e.g., sulfate and NOM3) were exchanged against NOM2 on
the surface of the resins. The release of NOM2 from the IX phase increased the DOC concentration
and thus leading to a DOC breakthrough in BIEX effluents. Subsequent to the release of NOM2
(i.e., secondary IX), effluent DOC concentrations reached stability as the exchange between
NOM3 and previously charged sulfate on the IX took place. During the exhaustion phase
(subsequent to 15 000 BV), DOC in both BIEX effluents rose up again due to facts that IX capacity
was completely exhausted, and NOM removed through biomass contribution (biosorption,
biodegradation and bioregeneration) decreased as temperature decreased from 18°C to 1°C.
Finally, BIEX filters achieved a stable DOC removal (5-7 %) in cold water conditions which is

47
believed to be fully due to the biomass contribution (biosorption, biodegradation and
bioregeneration).
Figure 2.2 - (A) Normalized effluent dissolved organic carbon concentrations (DOC/DOC0) of
bicarbonate-form BIEX (BIEX-B) and chloride-form BIEX (BIEX-C) filters throughout the study
period (≈ 24 000 BV or 250 days). (B) conceptional displacement of different solutes in the BIEX-
B filter in primary ion exchange, secondary ion exchange and exhaustion phases. NOM was broken
up into three conceptional fractions with an affinity sequence of NOM3>SO42->NOM2>HCO3-
>NOM1.
2.3.3 BDOC removal Evaluation of BDOC removal allows an appreciation of the treated water biostability of both BIEX
filters. Over the course of the study, BDOC concentrations remained stable in raw water with 0.42
0
5
10
15
20
25
30
0.0
0.2
0.4
0.6
0.8
1.0
1.2
0 5000 10000 15000 20000 25000Te
mpe
ratu
re (°
C)
DOC/
DOC 0
Bed volume
BIEX-BBIEX-C
Temp.
Primary IX Secondary IX ExhaustionA
B
HCO3-
NOM3
SO42-
NOM2
NOM3
NOM3
SO42-
Primary IX Secondary IX Exhaustion
NOM1 NOM2NOM1
SO42-NOM2NOM1
NOM3SO42-NOM2NOM1
Mean DOC0 = 7 ± 0.7 mg C/L

48
± 0.15 mg C/L (i.e., 6 ± 2 % of DOC). BDOC removals in both BIEX filters followed a similar trend
throughout the study (Figure 2.3). Briefly, during primary IX, BDOC removal in the BIEX-B filter
decreased from 80 % to 23 % following the similar trend to DOC removal in the filter, suggesting
that BDOC removal was mainly due to ion exchange during primary IX. During secondary IX (i.e.,
subsequent to 52 days of operation), BDOC removal in the BIEX-B filter was significantly improved
to 70 % as temperature increased from 13°C (5 000 BV) to 26°C (11 000 BV) whereas DOC removal
remained stable from 7 000 to 11 000 BV. The improvement of BDOC removal was attributed to
biomass contribution (biosorption, biodegradation and bioregeneration) in warm water
conditions. However, as BDOC is only a marginal fraction of influent DOC in the current study (6
% of influent DOC), such improvement had limited impact on the overall DOC removal. Finally,
during exhaustion phase, BDOC removal in the BIEX-B filter dropped to 19 % as temperature
decreased to 2°C. Overall, average BDOC removal in BIEX-B filter (50 %) constantly proved to be
higher than BIEX-C (33 %) (paired t-test, p = 0.02). The higher BDOC removal in the BIEX-B filter
might be attributed to the favorable pH conditions as the release of bicarbonate led to a more
alkaline effluent than did the chloride one (mean pH:7.3 vs. 6.8 during primary IX).
Figure 2.3 - Biodegradable dissolved organic carbon (BDOC) removal in bicarbonate-form BIEX
(BIEX-B) and chloride-form BIEX (BIEX-C) filters.
To verify if the higher BDOC removal in the BIEX-B filter was due to the higher microbial activities,
the extent of bacterial colonization was assessed. Resins were extracted at 2, 10, 30, 50 cm filter
0
5
10
15
20
25
30
0%
20%
40%
60%
80%
100%
0 5000 10000 15000 20000 25000
Tem
pera
ture
(°C)
BDO
C re
mov
al
Bed volumes
BIEX-B
BIEX-C
Temp.
Primary IX
Secondary IX Exhaustion
BDOC0 = 0.42 ± 0.15 mg C/L

49
bed depth after 10 000 BV. A 14C glucose respiration test was performed on each sample to
quantify the spatial distribution of heterotrophic biomass (expressed in µg C/mL resin) in both
BIEX filters (Figure S2.1). The BIEX-B filter had a lower heterotrophic biomass than the BIEX-C filter
in the upper layers of the filter bed (2 and 10 cm deep or a corresponding EBCT of 0.5 min and
2.5 min) while no significant difference was observed for the bottom layers (30 and 50 cm deep
corresponding to 7.5 min and 12.5 min EBCT) of the two BIEX filters (p = 0.43-0.45). This result
indicates that the measurement of heterotrophic biomass by 14C glucose respiration test did not
correspond to the BDOC removal in biofilters, a conclusion which is consisted with previous
studies using other biomass assessment methods on BAC filters, such as phospholipid analysis
and adenosine triphosphate analysis (Wang et al., 1995; Urfer et al., 1997; Emelko et al., 2006;
Pharand et al., 2014). Therefore, more studies are needed to elucidate the relationship between
biomass activity and the BDOC removal.
2.3.4 THM and HAA precursors removal DBP precursor removals were assessed on a weekly basis, but solely after DOC breakthrough to
study the removal during secondary IX (5 300 - 11 000 BV) (i.e., subsequent to media
colonization). THM-UFC (mean value: 434 µg/L with 97 % chloroform and 3 %
bromodichloromethane) and HAA5-UFC (mean value: 391 µg/L with 41 % dichloroacetic acid and
59 % trichloroacetic acid) concentrations in raw water remained stable throughout the study
period. Both BIEX filters achieved similar THM-UFC or HAA5-UFC concentrations in the effluent
throughout the study period with a median of 125 THM-UFC µg/L or 110 HAA5-UFC µg/L (Figure
S2.2), suggesting that both BIEX filters had similar DBP precursors removal for the study period.
To allow a further comparison of THM or HAA precursors removal in BIEX-B and BIEX-C filters, the
NOM reactivity (DBP concentration per unit of chlorine demand) was calculated (Figure 2.4). The
THM or HAA precursor removal was equivalent for both BIEX filters as no significant differences
in THM (p = 0.19) or HAA5 reactivities (p = 0.70) in both BIEX effluents were observed. Moreover,
little differences were observed amongst THM and HAA speciation in both BIEX effluents for
chloroform (p = 0.33), bromodichloromethane (p = 0.18), dichloroacetic acid (p = 0.52) and
trichloroacetic acid (p = 0.57). These results confirmed that the mechanisms involved in the
removal of DBP precursors by both BIEX filters do not differ.
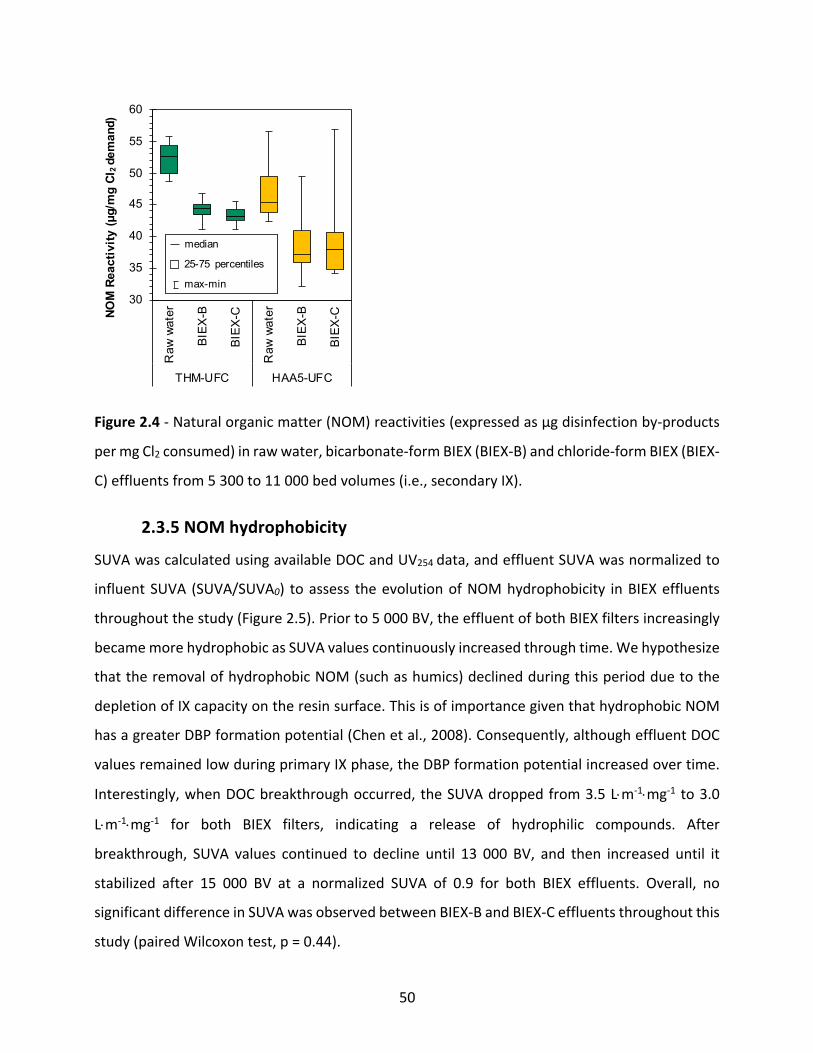
50
Figure 2.4 - Natural organic matter (NOM) reactivities (expressed as µg disinfection by-products
per mg Cl2 consumed) in raw water, bicarbonate-form BIEX (BIEX-B) and chloride-form BIEX (BIEX-
C) effluents from 5 300 to 11 000 bed volumes (i.e., secondary IX).
2.3.5 NOM hydrophobicity SUVA was calculated using available DOC and UV254 data, and effluent SUVA was normalized to
influent SUVA (SUVA/SUVA0) to assess the evolution of NOM hydrophobicity in BIEX effluents
throughout the study (Figure 2.5). Prior to 5 000 BV, the effluent of both BIEX filters increasingly
became more hydrophobic as SUVA values continuously increased through time. We hypothesize
that the removal of hydrophobic NOM (such as humics) declined during this period due to the
depletion of IX capacity on the resin surface. This is of importance given that hydrophobic NOM
has a greater DBP formation potential (Chen et al., 2008). Consequently, although effluent DOC
values remained low during primary IX phase, the DBP formation potential increased over time.
Interestingly, when DOC breakthrough occurred, the SUVA dropped from 3.5 L×m-1×mg-1 to 3.0
L×m-1×mg-1 for both BIEX filters, indicating a release of hydrophilic compounds. After
breakthrough, SUVA values continued to decline until 13 000 BV, and then increased until it
stabilized after 15 000 BV at a normalized SUVA of 0.9 for both BIEX effluents. Overall, no
significant difference in SUVA was observed between BIEX-B and BIEX-C effluents throughout this
study (paired Wilcoxon test, p = 0.44).
30
35
40
45
50
55
60
Raw
wat
er
BIEX
-B
BIEX
-C
Raw
wat
er
BIEX
-B
BIEX
-C
THM-UFC HAA5-UFC
NOM
Rea
ctiv
ity (µ
g/m
g Cl
2 de
man
d)
median
25-75 percentiles
max-min

51
Figure 2.5 - Normalized effluent specific ultraviolet absorbance at 254 nm (SUVA/SUVA0) of
bicarbonate-form BIEX (BIEX-B) and chloride-form BIEX (BIEX-C) filters throughout the study
period (≈ 24 000 BV or 250 days).
2.3.6 NOM fractionation LC-OCD analyses were conducted at 2 592, 5 280, 8 064, 10 656 and 22 752 BV on both BIEX
influent and effluent to compare the removal of NOM fractions during three phases: primary IX,
secondary IX and exhaustion. NOM fractions in raw water remained relatively stable throughout
this study (Table S2.2). To better understand the affinity of various NOM fractions during the
operation of BIEX filters, removals (1-C/C0) of the various NOM fractions are calculated as a
function of bed volumes (96 BV = 1 day). Globally, BIEX-B (Figure 2.6) and BIEX-C (Figure S2.3) had
similar evolution with respect to different NOM fractions throughout the study period. Briefly, in
the BIEX-B filter, HS is the preferred NOM fraction eliminated although the initial removal
efficiency (≈ 90 %) decreased to 66 % at breakthrough (5 280 BV) and then increased back to 90
% during secondary IX. In comparison, BB were also preferably removed during primary IX (78 %)
but were released from the BIEX filter at breakthrough (-62 %). Additionally, BB were no longer
removed from the BIEX filters during secondary IX or exhaustion phases. Initial LMW neutrals
removal by the BIEX-B filter (41 %) decreased to 15 % at breakthrough and recovered to 25 %
after breakthrough. Finally, BP (22 %) and LMW acids (20 %) were removed in the BIEX-B filter to
the similar extent and remained stable throughout the study.
0
0.2
0.4
0.6
0.8
1
1.2
0 5000 10000 15000 20000 25000
SUVA
/SUV
A 0
Bed volume
BIEX-B
BIEX-C
Mean SUVA0 = 3.5 ± 0.2 L/(m・mg)
Primary IX Secondary IX Exhaustion

52
Figure 2.6 - Removals of natural organic matter (NOM) fractions in bicarbonate-form BIEX (BIEX-
B).
According to the LC-OCD analysis, BB, HS and LMW neutrals all surged during the DOC
breakthrough, an evidence proving that NOM released from IX at the breakthrough (i.e., NOM2)
is mainly found within these three NOM fractions. Moreover, subsequent to DOC breakthrough,
BB were no longer removed by both BIEX filters. This may be attributable to its low charge density
as it is also hardly removed by coagulation (Huber et al., 2011). The number-averaged molecular
mass (Mn) of effluent HS (calculated from the LC-OCD) reveals a drop from 1800 Da prior to
breakthrough to 1000 Da at breakthrough. Such data demonstrate that HS in NOM2 has a lower
molecular weight (MW) than in NOM1. This observation corroborates previously reported data
where the major NOM fractions that surged during DOC breakthrough proved to possess a low
apparent molecular weight (AMW) of 0.5-1 kDa (Kim and Symons, 1991). This change in HS MW
in BIEX effluent at DOC breakthrough was accompanied with a sudden decrease of SUVA values.
This indicates that NOM2 is relatively more hydrophilic than the NOM in the BIEX effluent right
before the breakthrough. These observations lead us to conclude that NOM2 is composed of
molecules which exhibit lower charge density, lower MW and lower aromaticity than NOM3.
Nevertheless, LC-OCD and SUVA analysis does not allow a perfect discrimination among the
conceptional NOM1, NOM2 and NOM3. Given the confounding effect of biomass colonization
-100%
-75%-50%-25%
0%25%
50%75%
100%
0 5000 10000 15000 20000 25000
Rem
oval
Bed volumesBP HSBB LMW acidsLMW neutrals
Primary IX
Secondary IX
Exhaustion

53
and loading state of IX resins, more studies are needed to elucidate the NOM elution in BIEX
filters.
2.3.7 Implications for IX operation for NOM removal NOM removal in IX filters is usually correlated to the number of bed volumes, i.e., we can run an
IX filter just within the primary IX phase to maximize NOM removal. However, the IX filter will
need to be regenerated more often (≈ 4 000 BV for this source water) and thus will produce more
spent brine, which is undesirable from an operational, financial and environmental standpoint. In
order to better balance the treatment efficiency against brine production, we suggest 1) putting
BIEX filters off-line during the DOC breakthrough (4 000 BV-6 000 BV) to avoid the surge of DOC;
2) pursue filter operation until ≈ 15 000 BV before launching a regeneration to maximize IX
treatment capacity. To minimize the offline period, the throughput on the IX contactor (BV/h)
could be increased to accelerate the transition phase from primary to secondary IX. As a result,
the IX service cycle could be prolonged by 9 000 BV (considering putting the IX back online from
6 000 BV to 15 000 BV), which corresponds to a 3.25-fold increase of cycle length. Additionally,
operating IX in BIEX mode is expected to have similar DOC removal compared to conventional
operation mode (i.e., with regeneration) for the same BV of treated water. This is due to the fact
that regeneration of IX resins does not allow a complete recover of IX capacity and hence the
treatment efficiency in conventional mode would decrease as the service cycle increases
(Bassandeh et al., 2013). Further, biomass would establish itself on the IX resins due to the
prolonged service time and thus benefit the removal of BDOC and ammonia (Figure S2.4). Finally,
it should be noted that the metrics of BIEX performance are determined on a case-by-case basis,
which depends on feed water characteristics (e.g., sulfate concentration and NOM properties).
Lab-scale pretests are recommended to investigate the NOM elution profile prior to real
application.
Although BIEX can significantly improve the service time of IX resins, one still needs to regenerate
the resins when the efficiency no more satisfies the treatment objective. As bicarbonate salt has
a lower solubility in water/regeneration efficiency than chloride salt, BIEX regenerated with
bicarbonate salt may experience DOC removal efficiency decline as the operation cycle increases.

54
Our lab-scale tests demonstrated that the regeneration efficiency using bicarbonate salt (1 M/L)
is approximately 60% of that using chloride salt (1 M/L) for resins operated for approximately
13000 BV (data not shown). Therefore, the regeneration strategies using bicarbonate salt are yet
to be optimized prior to implementation for BIEX resins. To this end, BIEX filters can be thoroughly
regenerated with chloride regenerant (e.g., 12 %w/v) in an intermittent manner, and in order to
minimize brine production, such chloride regenerant could be directly reused several times
without any efficiency decline before disposal (Medina et al., 2018). Caustic can also be used to
help recovering IX capacity from exhausted resins. Additional research will be needed to identify
the optimal regeneration conditions for resins operated in BIEX mode.
2.4 Conclusions The present study is the first to assess NOM removal efficiencies of BIEX filters using bicarbonate
and chloride-form IX resins from primary ion exchange to complete exhaustion. Results
demonstrate that, as opposed to its chloride-form counterpart, bicarbonate-form BIEX achieved
a slightly lower DOC removal (median: 49 % vs. 53 %), a higher biodegradable DOC (BDOC)
removal (average: 50 % vs. 33 %) and a similar disinfection by-product precursor removal. BIEX
filters using bicarbonate-form and chloride-form IX resins offer similar NOM removal efficiencies
and ease spent brine management. BIEX filters can be regenerated with bicarbonate or chloride
solution when the efficiency no more satisfies the treatment objective. However, the
regeneration efficiency using bicarbonate salt is yet to be assessed for BIEX resins considering the
lower solubility of bicarbonate salt than chloride salt in water. Future studies need to identify the
optimal regeneration strategy for BIEX resins according to the type of counter-ion used for ion
exchange.
Acknowledgement
The authors would like to thank Yves Fontaine, Mireille Blais, Tetiana Elyart and Pont-Viau
drinking water treatment plant personnel for their support with piloting. We also acknowledge
Elise Renault, Julie Philibert, Jacinthe Mailly and Gabriel St-Jean for their assistance in sample
analysis. We also acknowledge Xiameng Feng for the review and helpful suggestions for this
paper.
55
2.5 Supplementary materials
Figure S2.1 - Average heterotrophic biomass measured by 14C glucose respiration test as a
function of media depth and empty bed contact time (EBCT) of the bicarbonate-form BIEX (BIEX-
B) and the chloride-form BIEX (BIEX-C) filters at 10 000 BV. Error bars represent the maximum and
the minimum biomass value of triplicate analysis.
Figure S2.2 - Disinfection by-product concentrations (B) in raw water, chloride-form BIEX (BIEX-
C) and bicarbonate-form BIEX (BIEX-B) effluents from 5 300 to 11 000 bed volumes (i.e., secondary
IX).
0
5
10
15
0
10
20
30
40
50
60
0 5 10 15 20
Empt
y be
d co
ntac
t tim
e (m
in)
Med
ia d
epth
(cm
)
Bacterial biomass (µg C/ml resin)
BIEX-BBIEX-C
Temperature: 25°C
BDOC: 0.25 mg C/L
Dissolved oxygen:
7.66 mg O2/L
Limit of detection:
0.5 µg C/mL resin
0
100
200
300
400
500
600
THM
-UFC
HAA
-UFC
THM
-UFC
HAA
-UFC
THM
-UFC
HAA
-UFC
Raw water BIEX-C BIEX-B
Disi
nfec
tion
by-p
rodu
ct (
µg/L
)
median
25-75 %
max-min
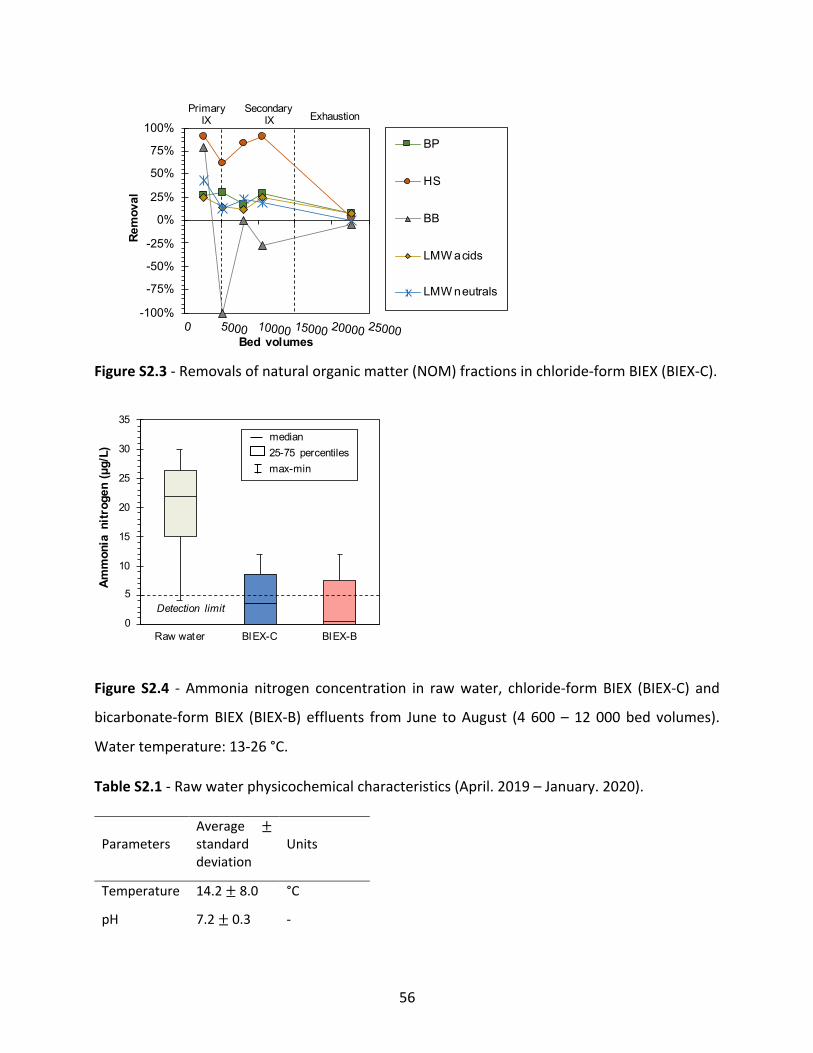
56
Figure S2.3 - Removals of natural organic matter (NOM) fractions in chloride-form BIEX (BIEX-C).
Figure S2.4 - Ammonia nitrogen concentration in raw water, chloride-form BIEX (BIEX-C) and
bicarbonate-form BIEX (BIEX-B) effluents from June to August (4 600 – 12 000 bed volumes).
Water temperature: 13-26 °C.
Table S2.1 - Raw water physicochemical characteristics (April. 2019 – January. 2020).
Parameters Average ± standard deviation
Units
Temperature 14.2 ± 8.0 °C
pH 7.2 ± 0.3 -
Primary IX
Secondary IX Exhaustion
-100%
-75%
-50%
-25%
0%
25%
50%
75%
100%
0 5000 10000 15000 20000 25000
Rem
oval
Bed volumes
BP
HS
BB
LMW acids
LMW neutrals
0
5
10
15
20
25
30
35
Raw water BIEX-C BIEX-B
Amm
onia
nitr
ogen
(µg/
L)
median25-75 percentilesmax-min
Detection limit

57
Turbidity 13.3 ± 10.9 NTU
DOC 7.0 ± 0.7 mg C/L
UV254 0.24 ±0.03 cm-1
BDOC 0.42 ±0.15 mg C/L
Chloride 6.6 ± 3.2 mg/L
Sulfate 5.6 ± 1.5 mg/L
Nitrate 0.9 ± 0.5 mg/L
Nitrite < 0.2 mg/L
Bromide < 0.1 mg/L
Alkalinity 27.7 ± 7.4 mg CaCO3/L
Hardness 27.0 mg CaCO3/L
Ammonia 20.1 ± 8.5 µg NH3-N/L
Table S2.2 - Source water natural organic matter (NOM) fractions expressed in percentage of
dissolved organic carbon (DOC).
NOM fractions Concentration
(µg C/L) * DOC Percentage
Dissolved organic carbon
(DOC) 7001 ± 605 100%
Biopolymers
(BP) 199 ± 32 3%
Humics
(HS) 4852 ± 411 69%
Building blocks
(BB) 870 ± 41 13%
Low molecular weight acids (LMW acids) 191 ± 10 3%
Low molecular weight neutrals 511 ± 62 7%

58
(LMW neutrals)
*Average ± standard deviation.
References
Amini, A., Kim, Y., Zhang, J., Boyer, T., & Zhang, Q. (2015). Environmental and economic
sustainability of ion exchange drinking water treatment for organics removal. Journal of Cleaner
Production, 104, 413-421. doi:10.1016/j.jclepro.2015.05.056
Amini, N., Papineau, I., Storck, V., Berube, P. R., Mohseni, M., & Barbeau, B. (2018). Long-term
performance of biological ion exchange for the removal of natural organic matter and ammonia
from surface waters. Water Res, 146, 1-9. doi:10.1016/j.watres.2018.07.057
Association, A. P. H., Association, A. W. W., Federation, W. P. C., & Federation, W. E. (2017).
Standard methods for the examination of water and wastewater (Vol. 2): American Public Health
Association.
Bassandeh, M., Antony, A., Le-Clech, P., Richardson, D., & Leslie, G. (2013). Evaluation of ion
exchange resins for the removal of dissolved organic matter from biologically treated paper mill
effluent. Chemosphere, 90(4), 1461-1469. doi:10.1016/j.chemosphere.2012.09.007
Bolto, B., Dixon, D., Eldridge, R., King, S., & Linge, K. (2002). Removal of natural organic matter by
ion exchange. Water Res, 36(20), 5057-5065. doi:10.1016/s0043-1354(02)00231-2
Boyer, T. H., Singer, P. C., & Aiken, G. R. (2008). Removal of dissolved organic matter by anion
exchange: effect of dissolved organic matter properties. Environ Sci Technol, 42(19), 7431-7437.
doi:10.1021/es800714d
Chen, C., Zhang, X. J., Zhu, L. X., Liu, J., He, W. J., & Han, H. D. (2008). Disinfection by-products and
their precursors in a water treatment plant in North China: Seasonal changes and fraction
analysis. Sci Total Environ, 397(1-3), 140-147. doi:10.1016/j.scitotenv.2008.02.032
del Moral, L. L., Choi, Y. J., & Boyer, T. H. (2020). Comparative removal of Suwannee River natural
organic matter and perfluoroalkyl acids by anion exchange: Impact of polymer composition and
mobile counterion. Water Research, 115846.
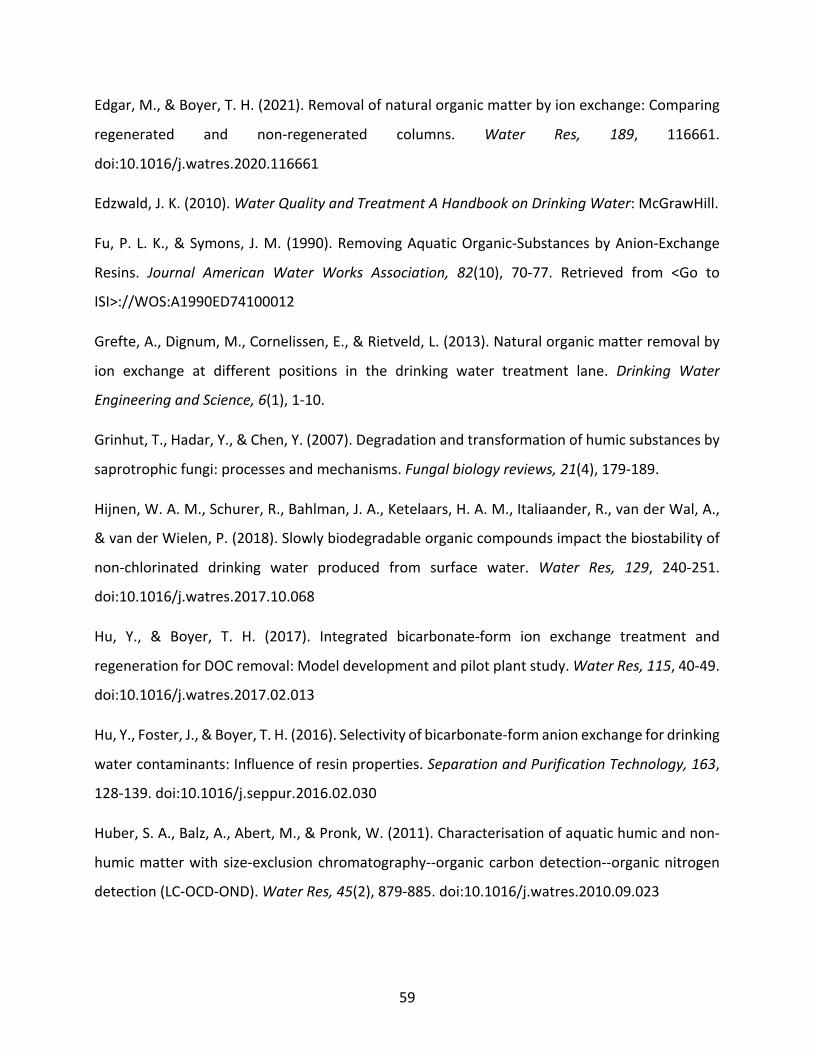
59
Edgar, M., & Boyer, T. H. (2021). Removal of natural organic matter by ion exchange: Comparing
regenerated and non-regenerated columns. Water Res, 189, 116661.
doi:10.1016/j.watres.2020.116661
Edzwald, J. K. (2010). Water Quality and Treatment A Handbook on Drinking Water: McGrawHill.
Fu, P. L. K., & Symons, J. M. (1990). Removing Aquatic Organic-Substances by Anion-Exchange
Resins. Journal American Water Works Association, 82(10), 70-77. Retrieved from <Go to
ISI>://WOS:A1990ED74100012
Grefte, A., Dignum, M., Cornelissen, E., & Rietveld, L. (2013). Natural organic matter removal by
ion exchange at different positions in the drinking water treatment lane. Drinking Water
Engineering and Science, 6(1), 1-10.
Grinhut, T., Hadar, Y., & Chen, Y. (2007). Degradation and transformation of humic substances by
saprotrophic fungi: processes and mechanisms. Fungal biology reviews, 21(4), 179-189.
Hijnen, W. A. M., Schurer, R., Bahlman, J. A., Ketelaars, H. A. M., Italiaander, R., van der Wal, A.,
& van der Wielen, P. (2018). Slowly biodegradable organic compounds impact the biostability of
non-chlorinated drinking water produced from surface water. Water Res, 129, 240-251.
doi:10.1016/j.watres.2017.10.068
Hu, Y., & Boyer, T. H. (2017). Integrated bicarbonate-form ion exchange treatment and
regeneration for DOC removal: Model development and pilot plant study. Water Res, 115, 40-49.
doi:10.1016/j.watres.2017.02.013
Hu, Y., Foster, J., & Boyer, T. H. (2016). Selectivity of bicarbonate-form anion exchange for drinking
water contaminants: Influence of resin properties. Separation and Purification Technology, 163,
128-139. doi:10.1016/j.seppur.2016.02.030
Huber, S. A., Balz, A., Abert, M., & Pronk, W. (2011). Characterisation of aquatic humic and non-
humic matter with size-exclusion chromatography--organic carbon detection--organic nitrogen
detection (LC-OCD-OND). Water Res, 45(2), 879-885. doi:10.1016/j.watres.2010.09.023
60
Ishii, S. K. L., & Boyer, T. H. (2011). Evaluating the secondary effects of magnetic ion exchange:
Focus on corrosion potential in the distribution system. Desalination, 274(1-3), 31-38.
doi:10.1016/j.desal.2011.01.061
Kim, P. H. S., & Symons, J. M. (1991). Using Anion-Exchange Resins to Remove Thm Precursors.
Journal American Water Works Association, 83(12), 61-68. Retrieved from <Go to
ISI>://WOS:A1991GV11300011
Ledesma, B., Roman, S., Alvarez-Murillo, A., Sabio, E., & Gonzalez, J. F. (2014). Cyclic
adsorption/thermal regeneration of activated carbons. Journal of Analytical and Applied Pyrolysis,
106, 112-117. doi:10.1016/j.jaap.2014.01.007
Levchuk, I., Rueda Marquez, J. J., & Sillanpaa, M. (2018). Removal of natural organic matter (NOM)
from water by ion exchange - A review. Chemosphere, 192, 90-104.
doi:10.1016/j.chemosphere.2017.10.101
Liu, Z., Lompe, K. M., Mohseni, M., Berube, P. R., Sauve, S., & Barbeau, B. (2020). Biological ion
exchange as an alternative to biological activated carbon for drinking water treatment. Water
Res, 168, 115148. doi:10.1016/j.watres.2019.115148
MacKeown, H., Gyamfi, J. A., Delaporte, M., Schoutteten, K. V. K. M., Verdickt, L., Ouddane, B., &
Criquet, J. (2020). Removal of disinfection by-product precursors by ion exchange resins. Journal
of Environmental Chemical Engineering, 104602.
Markarian, A., Carriere, A., Dallaire, P. O., Servais, P., & Barbeau, B. (2010). Hybrid membrane
process: Performance evaluation of biological PAC. Journal of Water Supply Research and
Technology-Aqua, 59(4), 209-220. doi:10.2166/aqua.2010.087
Matilainen, A., Vepsalainen, M., & Sillanpaa, M. (2010). Natural organic matter removal by
coagulation during drinking water treatment: a review. Adv Colloid Interface Sci, 159(2), 189-197.
doi:10.1016/j.cis.2010.06.007
Maul, G. A., Kim, Y., Amini, A., Zhang, Q., & Boyer, T. H. (2014). Efficiency and life cycle
environmental impacts of ion-exchange regeneration using sodium, potassium, chloride, and
bicarbonate salts. Chemical Engineering Journal, 254, 198-209. doi:10.1016/j.cej.2014.05.086

61
Medina, B. B., Boyer, T., & Indarawis, K. (2018). Evaluating Options for Regenerant Brine Reuse in
Magnetic Ion Exchange Systems. Journal American Water Works Association, 110(5), E2-E10.
doi:10.1002/awwa.1046
Ness, A., & Boyer, T. H. J. J. A. W. W. A. (2017). Pilot‐Scale Evaluation of Bicarbonate‐Form
Anion Exchange for DOC Removal in Small Systems. 109(12), 13-26.
Nguyen, C. K., Stone, K. R., Dudi, A., & Edwards, M. A. (2010). Corrosive microenvironments at
lead solder surfaces arising from galvanic corrosion with copper pipe. Environ Sci Technol, 44(18),
7076-7081. doi:10.1021/es1015185
Niquette, P., Prévost, M., Maclean, R. G., Thibault, D., Coallier, J., Desjardins, R., & Lafrance, P.
(1998). Backwashing first‐ stage sand– BAC filters. Journal ‐ American Water Works
Association, 90(1), 86-97.
Richardson, S. D., Plewa, M. J., Wagner, E. D., Schoeny, R., & Demarini, D. M. (2007). Occurrence,
genotoxicity, and carcinogenicity of regulated and emerging disinfection by-products in drinking
water: a review and roadmap for research. Mutat Res, 636(1-3), 178-242.
doi:10.1016/j.mrrev.2007.09.001
Rokicki, C. A., & Boyer, T. H. (2011). Bicarbonate-form anion exchange: affinity, regeneration, and
stoichiometry. Water Res, 45(3), 1329-1337. doi:10.1016/j.watres.2010.10.018
Schulz, M., Winter, J., Wray, H., Barbeau, B., & Berube, P. (2017). Biologically active ion exchange
(BIEX) for NOM removal and membrane fouling prevention. Water Science and Technology-Water
Supply, 17(4), 1178-1184. doi:10.2166/ws.2017.016
Servais, P., Anzil, A., & Ventresque, C. (1989). Simple method for determination of biodegradable
dissolved organic carbon in water. Appl Environ Microbiol, 55(10), 2732-2734.
doi:10.1128/aem.55.10.2732-2734.1989
Servais, P., Billen, G., Ventresque, C., & Bablon, G. P. (1991). Microbial activity in GAC filters at the
Choisy‐le‐Roi treatment plant. Journal‐American Water Works Association, 83(2), 62-68.
62
Sillanpää, M. (2014). Natural organic matter in water: Characterization and treatment methods:
Butterworth-Heinemann.
Summers, R. S., Hooper, S. M., Shukairy, H. M., Solarik, G., & Owen, D. (1996). Assessing the DBP
yield: Uniform formation conditions. Journal American Water Works Association, 88(6), 80-93.
Retrieved from <Go to ISI>://WOS:A1996UR42100019
Tan, Y. R., Kilduff, J. E., Kitis, M., & Karanfil, T. (2005). Dissolved organic matter removal and
disinfection byproduct formation control using ion exchange. Desalination, 176(1-3), 189-200.
doi:10.1016/j.desal.2004.10.019
Tian, C., Liu, R., Liu, H., & Qu, J. (2013). Disinfection by-products formation and precursors
transformation during chlorination and chloramination of highly-polluted source water:
significance of ammonia. Water Res, 47(15), 5901-5910. doi:10.1016/j.watres.2013.07.013
USEPA. (1992). Method 524.2: Measurement of Purgeable Organic Compounds in Water by
Capillary Column Gas Chromatography/Mass Spectrometry, Revision 4.1. Cincinnati, OH.
USEPA. (2003). Method 552.3 Determination of haloacetic acids and dalapon in drinking water by
liquid-liquid microextraction, derivatization, and gas chromatography with electron capture
detection. Methods for the Determination of Organic Compounds in Drinking Water.
van den Brink, P., Satpradit, O. A., van Bentem, A., Zwijnenburg, A., Temmink, H., & van
Loosdrecht, M. (2011). Effect of temperature shocks on membrane fouling in membrane
bioreactors. Water Res, 45(15), 4491-4500. doi:10.1016/j.watres.2011.05.046
Verdickt, L., Closset, W., D'Haeseleer, V., & Cromphout, J. (2012). Applicability of ion exchange for
NOM removal from a sulfate-rich surface water incorporating full reuse of the brine. Water
Science and Technology-Water Supply, 12(6), 878-887. doi:10.2166/ws.2012.065
Walker, K. M., & Boyer, T. H. (2011). Long-term performance of bicarbonate-form anion
exchange: removal of dissolved organic matter and bromide from the St. Johns River, FL, USA.
Water Res, 45(9), 2875-2886. doi:10.1016/j.watres.2011.03.004

63
Winter, J., Wray, H. E., Schulz, M., Vortisch, R., Barbeau, B., & Berube, P. R. (2018). The impact of
loading approach and biological activity on NOM removal by ion exchange resins. Water Res, 134,
301-310. doi:10.1016/j.watres.2018.01.052
Zhang, X. Y., Xiao, X. Z., Zheng, S. K., & Wang, W. (2019). Achieving no spent brine discharge in an
anion exchange resin-based fixed-bed process for typical DOM removal. Chemical Engineering
Research & Design, 149, 121-128. doi:10.1016/j.cherd.2019.07.008
64
Chapitre 3 – Removal of organic micropollutants from surface
waters by biological ion exchange resins
Abstract
Biological ion exchange (BIEX) refers to operating ion exchange (IX) filters with infrequent
regeneration to favor the microbial growth on resin surface and thereby contribute to the
removal of organic matter through biodegradation. However, the extent of biodegradation on
BIEX resins is still debatable due to the difficulty in discriminating between biodegradation and
IX. The objective of the present study was to evaluate the performance of BIEX resins for the
removal of organic micropollutants and thereby validate the occurrence of biodegradation. The
removals of biodegradable micropollutants (neutral: caffeine and estradiol; negative: ibuprofen
and naproxen) and nonbiodegradable micropollutants with different charges (neutral: atrazine
and thiamethoxam; negative: PFOA and PFOS) were respectively monitored during batch tests
with biotic and abiotic BIEX resins. Results demonstrated that biodegradation contributed to the
removal of caffeine, estradiol, and ibuprofen, confirming that biodegradation occurred on the
BIEX resins. Furthermore, biodegradation contributed to a lower extent to the removal of
naproxen probably due to the absence of an adapted bacterial community. The removal of
naproxen, PFOS, and PFOA were attributable to ion exchange with previously retained natural
organic matter on BIEX resins. Nonbiodegradable and neutral micropollutants (atrazine and
thiamethoxam) were minimally (6%-10%) removed during the batch tests. Overall, the present
study corroborates that biomass found on BIEX resins contribute to the removal of
micropollutants through biodegradation.
Keywords: Ion exchange resins; Biological ion exchange (BIEX); Biodegradation; Natural organic
matter (NOM); Micropollutants; PFAS
65
3.1 Introduction A large number of organic micropollutants such as pesticides, pharmaceuticals, steroidal
hormones, and industrial chemicals enter surface waters via stormwater runoffs and treated
wastewater discharge. As several of these micropollutants are persistent in the environment and
recalcitrant to drinking water treatment processes, many have been detected in treated drinking
water worldwide (Coupe and Blomquist, 2004; Wang et al., 2011; Husk et al., 2019). Although
micropollutants are often found at trace concentrations (i.e., ng/L to μg/L) in drinking water,
there has been a rising concern over the long-term effects on human health arising from the
exposure to a mixture of micropollutants. Consequently, the number of micropollutants to be
regulated in drinking water is on the rise. For example, the USEPA has recently announced its
regulatory determinations for 8 micropollutants out of the 109 contaminants found on the
Contaminant Candidate List 4 (USEPA, 2021).
Biologically active filtration (i.e., biofiltration) has been investigated as a treatment option for the
removal of organic micropollutants because it is a simple and environmentally friendly process
(Zearley and Summers, 2012; Benner et al., 2013). Granular filters loaded with adsorptive media
(e.g., granular activated carbon) or non-adsorptive media (e.g., sand and anthracite) gradually
convert into biofilters when no disinfectants are used during the operation, that is,
microorganisms will establish themselves on the surface of filtration media and develop a biofilm
(Zearley and Summers, 2012). Upon filtration, micropollutants can sorb onto the biofilm present
on the granular media surface and be subjected to biodegradation by direct catabolism or co-
metabolism (Benner et al., 2013). For instance, a wide variety of organic micropollutants proved
to be amenable to biofiltration, such as 2-methylisoborneo, geosmin, caffeine, carbamazepine,
diclofenac, and 2,4-D (Nerenberg et al., 2000; Reungoat et al., 2011; Zearley and Summers, 2012;
Nord and Bester, 2020).
In 2017, we proposed a novel biofiltration process using ion exchange (IX) resins as biomass
support for natural organic matter (NOM) removal (Schulz et al., 2017). Specifically, when
operating fixed bed IX filters without regeneration, microorganisms colonize the surface of resins
and develop a biofilm. This novel approach, referred to as biological ion exchange (BIEX), has been

66
demonstrated to achieve a higher NOM removal than conventional biological activated carbon
(BAC) filters in a lab-scale study (BIEX: 56% vs BAC: 15%) (Winter et al., 2018) and in a pilot-scale
study (BIEX: 62% vs BAC: 5%) (Amini et al., 2018). The superior performance achieved by BIEX was
later primarily attributed to ion exchange with sulfate and, to a lesser extent, biodegradation (Liu
et al., 2020; Zimmerman et al., 2021). However, given that previous studies were devoted to
investigating the performance of BIEX for NOM removal, its performance for the removal of
organic micropollutants has not yet been explored.
Mass balance studies were conducted for the BIEX filters to elucidate the mechanisms that come
into play (Amini et al., 2018; Liu et al., 2020). The authors reported that biomass contribution
accounts for a maximum of 30% of NOM removal in BIEX filters. However, the mechanism for
such contribution is still open to debate. Winter et al. (2018) reported that resins harvested from
the BIEX filters were biologically active, but the relation between biological activities and the
removal of NOM was not verified. Furthermore, DNA sequencing tests conducted with BIEX resins
suggested that heterotrophic bacteria are diverse in the BIEX filter (Edgar and Boyer, 2021), but
a direct proof of their contribution to the overall organic matter removal is yet to be made.
The overall objective of the present study was to evaluate the removal of organic micropollutants
by BIEX resins and thereby validate the biodegradation of organic micropollutants on BIEX resins.
Exhausted IX resins were harvested from a BIEX pilot and used for lab-scale batch tests where
biodegradable and nonbiodegradable micropollutants with different charges (neutral and
negative) were spiked into batch reactors to study their biotic and abiotic decay in the presence
of suspended BIEX resins. Suspect screening of transformation products was performed using
ultra-high-performance liquid chromatography coupled to high-resolution mass spectrometry
(UHPLC-HRMS). The present study reports the first investigation of the performance of BIEX resins
for organic micropollutants removal.

67
3.2 Materials and methods
3.2.1 Biological ion exchange (BIEX) resins characteristics Exhausted ion exchange resins were harvested from a pilot plant at the Pont-Viau drinking water
treatment plant (Laval, Canada) (Liu et al., 2021). The pilot plant consists of a fixed bed IX filter
loaded with polyacrylic type I macroporous strong base anion exchange resins (Purolite® A860,
Purolite, Philadelphia, USA). The IX filter was continuously fed with untreated surface water from
the Des Prairies River (Laval, Canada) and was operated without regeneration of the resins. After
5 months of operation, resins were harvested from the IX filter at the depth of 10 cm. At the
moment of IX resins harvesting, no anion release (e.g., chloride or sulfate) was observed in the
effluent at the harvesting location (data not shown), confirming that the resin capacity was fully
exhausted at the depth of extraction, and the IX resins used in the present study were mainly
loaded with NOM (Liu et al., 2021). Moreover, a 14C glucose respiration rate test conducted on
the extracted resins revealed that the resins had a heterotrophic biomass density of
approximately 15 µg C/mL resins (typical values for BAC are 9-14 µg C/mL) (Liu et al., 2021),
demonstrating that resins used in the present study were biologically active.
3.2.2 Raw water characteristics Surface water from the Des Prairies River was filtered in the lab through 0.45 μm disk membrane
(Supor® 450 PES, PALL, Port Washington, USA) and stored in the dark at 4°C before use. The water
demonstrated a moderate dissolved organic carbon (DOC) concentration (7.0 mg C/L), a neutral
pH, and low anion concentrations (chloride: 6.6 mg/L; sulfate: 5.6 mg/L). Other information on
raw water characteristics can be found in Table S3.1.
3.2.3 Target micropollutants Organic micropollutants were selected according to their biodegradability and charge state at pH
7. Biodegradable and nonbiodegradable micropollutants were selected to study the effect of
biodegradation. The biodegradability was predicted by the linear regression model and the non-
linear regression model, that is, BIOWIN and BIOWIN2 (EnviroSim Associates limited, Hamilton,
Canada). Generally, biodegradation probability ranges from 0 to 1 in the BIOWIN and BIOWIN2

68
models, with 0 suggesting the organic micropollutant is unlikely biodegradable and 1 suggesting
the organic micropollutant is easily biodegradable (Howard et al., 1992). In the present study,
micropollutants with a probability smaller than 0.5 were defined as nonbiodegradable and those
having a probability greater than 0.5 were defined as biodegradable. Furthermore, neutral and
negatively charged micropollutants were included in each group, because molecules with higher
affinity to the resin than previously retained anions can potentially be exchanged onto IX resins
even though the resin capacity is exhausted (Liu et al., 2020). Therefore, 8 organic micropollutants
including steroid hormones, pharmaceuticals, pesticides, and poly- and perfluoroalkyl substances
(PFAS) were selected (Table 3.1). Based on the selection metrics, these micropollutants were
divided into four groups: biodegradable and neutral (caffeine and estradiol), biodegradable and
negative (ibuprofen and naproxen), nonbiodegradable and neutral (atrazine and thiamethoxam),
as well as nonbiodegradable and negative (perfluorooctanoic acid (PFOA) and
perfluorooctanesulfonic (PFOS)).
Table 3.1 - Organic micropollutants selected for the present study.
Compound Structure pKaa Biowin1/B
iowin2b
Classification
(pH = 7)
Caffeine
(CAF)
-1.16
(strongest
basic)
0.6551/
0.5625
Biodegradable and
neutral
17b-Estradiol
(E2)
10.33 0.8178/
0.6452
Biodegradable and
negative Ibuprofen
(IBU) 4.85
0.8314/
0.8672

69
Naproxen
(NAP)
4.19 0.8972/
0.9611
Thiamethoxam
(THI)
0.4
(strongest
basic)
0.0789/
0.0014 Nonbiodegradable
and neutral Atrazine
(ATZ)
14.48 0.0045/
0.0000
Perfluorooctanoic
acid (PFOA) -4.2 -/0.0000
Nonbiodegradable
and negative Perfluorooctanesul
fonic acid (PFOS) -3.32 -/-
a: acid dissociation constant (pKa) data is cited from chemicalize.com (2020); b: data predicted using Estimation
Programs Interface Suite (US EPA, 2020); -: not available.
3.2.4 Batch tests Raw water was spiked with analytical grade organic micropollutants (Sigma Aldrich, St. Louis, MO)
to achieve a concentration of 10 µg/L for each selected micropollutant. Blank tests demonstrated
that micropollutant concentrations remained unchanged throughout the test (24 h), suggesting
that selected micropollutants were stable in the raw water (data not shown).
Batch tests were respectively conducted under two conditions, that is, (1) Biotic condition: 15 mL
BIEX resins were suspended in 241 mL spiked water within a 250 mL sterilized amber glass bottle;
(2) Abiotic condition: 15 ml BIEX resins were first incubated with 1.2 mL formaldehyde (37% w/v)
in a 250 ml sterilized amber glass bottle for 3h prior to the addition of 240 mL spiked water. Our
pretests demonstrated that formaldehyde inhibited microbial glucose respiration by 98%
subsequent to a 3-hour incubation using a volume ratio (media : formaldehyde) of 12.5 (Liu et al.,

70
2021). Notably, formaldehyde is a neutral substance that is not exchangeable on the BIEX resins
during the incubation.
For each condition of the batch test, 8 amber glass bottles were prepared corresponding to 6
contact times (i.e., 1, 3, 10, 30, 240, 1440 min), 1 quality control (QC) (i.e., a replicate for t = 1440
min) and 1 blank reactor (only containing spiked water). All bottles were shaken at 200 rpm on a
horizontal shaker at room temperature (22 °C). When reaching the desired contact time, samples
were immediately filtered through 0.22-μm pore size glass fiber syringe filters (Kinesis KX, Vernon
Hills, USA) and stored at 4 °C prior to micropollutant analyses. Glass fiber filters were selected
over other types of filters due to their superior recovery of the target micropollutants (Figure
S3.1).
3.2.5 Analytical methods Raw water and water samples subsequent to the batch tests were analyzed using on-line solid
phase extraction (SPE) followed by ultra-high-performance liquid chromatography equipped with
a reverse-phase column (C18, 100 mm ´ 2.1 mm, dp = 1.9 µm) coupled with high-resolution mass
spectrometry (UHPLC-HRMS) (Thermo Fisher Scientific, Waltham, MA). The results were used to
calculate micropollutant removal during batch tests and identify transformation products. More
details on the analytical method used for micropollutants analysis can be found in the
supplementary materials. All analyses were conducted in duplicate, and only mean values are
reported in this paper as data demonstrated a low variability (average relative standard deviation
< 3%).
3.2.6 Data analysis
3.2.6.1 Micropollutant removal kinetics
Batch tests data were fitted to a pseudo-first-order kinetics (commonly used to describe
biodegradation removal) and a pseudo-second-order kinetics (commonly used to describe
removal by sorption) through nonlinear regression. The normalized pseudo-first order kinetics
model can be expressed as:

71
""+= +2 = ,#3,4 (3.1)
where C0 and C are the initial micropollutant concentration (µg/L) and the micropollutant
concentration subsequent to the reaction time t (min), respectively; Cn is the normalized
micropollutant concentration; k1 is the pseudo-first-order rate constant (min-1).
Normalized sorption pseudo-second-order kinetic model can be expressed as follows.
-5. = (.#"")(""#")-/"+)(.#")-/"+)
(3.2)
where C0 and Ceq are the initial micropollutant concentration and the concentration at equilibrium
(µg/L), respectively; Cn is the normalized concentration; k2 is the pseudo-second order kinetics
rate constant (µg/(g.h)).
3.2.6.2 Suspect screening of transformation products
The identification of transformation products related to the selected organic micropollutants was
carried out following the same procedures as in our previous study (Solliec et al., 2021). Briefly,
an in-house database was first developed based on published scientific literature and includes 37
known transformation products related to the spiked micropollutants (Table S2). Then, Xcalibur
software was used to investigate the raw data spectra and identify the transformation products
based on the exact mass, the isotopic pattern, the fragmentation pattern, and the retention time.
Thereafter, the exact masses and MS/MS spectra of the potential transformation products were
compared with spectral database (i.e., METLIN and Mass Bank) or a MS-spectrum prediction
software (i.e., CFM-ID 3.0 - University of Alberta, Edmonton, Canada). This identification process
leads to a confidence level of 2 according to Schymanski et al. (2014). Finally, the concentration
of identified transformation products was estimated by semi-quantitation with the help of the
calibration curve of parent compounds. More details on the identification process are available
in the supplementary materials.

72
3.3 Results and discussion
3.3.1 Organic micropollutant concentrations in the raw water Raw water was monitored monthly to investigate the background concentrations of selected
organic micropollutants. Overall, prior to resin harvesting, caffeine, ibuprofen, atrazine, PFOA,
and PFAS were detected in raw water with a range of 4-166 ng/L whereas 17b-estradiol,
naproxen, and thiamethoxam were below detection limit (Table 3.2). The presence of some
biodegradable micropollutants in the source water likely resulted in the development of microbial
communities on BIEX resins which could degrade these micropollutants (Rolph et al., 2019). For
example, as IX resins were exposed to caffein-containing raw water during several months of
operation, caffeine-degrading bacteria may have developped on the BIEX resins. By contrast, as
naproxen was absent in the raw water, bacteria adapted to naproxen degradation were less likely
to be present on the BIEX resins.
Table 3.2 - Micropollutant concentrations in the raw water prior to resin harvesting. Values and
error bars respectively correspond to average and standard deviation of monthly measurements.
Groups Micropollutants Concentration in raw water (ng/L)
Biodegradable and neutral
Caffeine
(CAF)
166 ± 7
17b-Estradiol
(E2)
< 0.1
Biodegradable and negative
Ibuprofen
(IBU)
128 ± 4
Naproxen
(NAP)
< 0.1
Nonbiodegradable and
neutral
Thiamethoxam
(THI)
< 0.09
Atrazine 4 ± 2

73
(ATZ)
Nonbiodegradable and
negative
PFOA 4 ± 1
PFOS 50 ± 5
3.3.2 Micropollutant removal during batch tests Figure 3.1 summarized the removal of micropollutants in the biotic condition (i.e., BIEX with active
biomass) and the abiotic condition (i.e., BIEX media with inactivated biomass) during the batch
test. Concentrations at different contact times were normalized to the concentration of blank
samples (C/C0). Data were fitted to pseudo-first-order and pseudo-second-order kinetics to
determine fitted rate constants and coefficients (Table 3.3). In the following text, the analysis of
organic micropollutant removal is grouped according to the class of micropollutants.
Biodegradable and neutral micropollutants. No caffeine removal was observed under the abiotic
condition whereas a gradual decrease of caffeine was observed under the biotic condition. The
biotic removal of caffeine could be effectively modeled with a pseudo-first-order kinetics (R2 =
0.93). Given the fact that the only difference between the biotic and abiotic conditions was the
microbial activity, the results indicate that the removal of caffeine by the exhausted BIEX resins
was due to biodegradation. High caffeine removal through biodegradation has also been reported
for other types of biofilters (e.g., slow sand filtration) (Zhang et al., 2019; Hermes et al., 2019).
By contrast, estradiol was gradually removed over time under both abiotic and biotic conditions.
Estradiol removal under abiotic and biotic conditions were well described with a pseudo-second-
order kinetics (R2 = 0.68-0.69) even though estradiol removal under the abiotic condition was
better described with a pseudo-first-order kinetics (R2 = 0.92). A faster removal (k2: 0.34 vs 0.06)
was observed under the biotic condition compared to the abiotic condition, suggesting that
microbial activities contributed to the removal of estradiol through biodegradation. Abtahi et al.
(2018) reported a similar result where estradiol was removed to a higher extent under biotic
conditions than abiotic conditions for a moving bed biofilm reactor. Furthermore, complete
estradiol removal was observed under the abiotic condition at the end of the batch test (24 h),

74
revealing that the abiotic mechanism (i.e., sorption) also came to play. As estradiol is a neutral
compound, mechanisms other than IX must have contributed to its removal. Zhang and Zhou
(2004) reported that estradiol can be directly adsorbed onto the IX resin surface through Van der
Waals forces or hydrophobic interactions.
Biodegradable and negative micropollutants. Minimal removal (i.e., 14% after 24 h) was
observed for ibuprofen under the abiotic condition, even though ibuprofen is a negatively
charged compound. Meanwhile, complete removal was observed after 24 h in the biotic reactor.
The removal of ibuprofen under the biotic condition could be effectively modeled with a pseudo-
first-order kinetics (R2 = 0.99) whereas the removal under the abiotic condition could be modeled
with a pseudo-second-order kinetics (R2 =0.74). The greater extent of removal under the biotic
condition compared to the abiotic condition demonstrated that biodegradation is the main
mechanism for the removal of ibuprofen on BIEX resins whereas sorption/IX processes did not
significantly contribute to the removal of ibuprofen. This is possibly due to its low affinity for the
resins. Past studies also demonstrated that ibuprofen was removed to a greater extent in
biofilters than their abiotic counterparts (Paredes et al., 2016), suggesting that biodegradation is
a viable approach for removing ibuprofen from water.
Naproxen was removed to a similar extent under the abiotic and biotic conditions (normalized
concentration at 24 h = 0.51-0.62). The removals of naproxen under biotic and abiotic conditions
were effectively modeled with a pseudo-second-order kinetics (R2 = 0.95-0.97). The similar
removal in the biotic and abiotic conditions suggests that abiotic processes played a major role in
the removal of naproxen on BIEX resins. Given that the molecule is negatively charged, the
removal of naproxen is attributed to ion exchange with previously retained NOM on the resins.
Microbial activity had a minor contribution even though naproxen was initially defined as
biodegradable in the present study. We hypothesized that the low biodegradation of naproxen
was due to the absence of an adapted microbial community on the BIEX resins, which is consistent
with the fact that naproxen was not detected in the raw water. In summary, biodegradation
contributed to the removal of caffeine, estradiol, and ibuprofen but contributed minimally to the
removal of naproxen on the BIEX resins, revealing that the biodegradation of micropollutants on
75
the BIEX resins simultaneously depends on the characteristics of organic micropollutants and the
microbial communities colonizing the media.
Nonbiodegradable and neutral micropollutants. For both biotic and abiotic conditions, low
removals (6%-10%) were observed during batch tests for thiamethoxam and atrazine. Neither
pseudo-first-order or pseudo-second-order kinetics could be fitted to the data. The observed
removal was unlikely due to IX, as these compounds are neutral. Therefore, the minimal removal
was attributed to sorption processes. Previous studies also reported limited removal of
thiamethoxam and atrazine when using biofiltration for drinking water treatment (Hallé et al.,
2015; Gomez-Herrero et al., 2020), suggesting that alternative treatment would be needed to
remove these micropollutants.
Nonbiodegradable and negative micropollutants. Similar patterns were observed for PFOA
removal under abiotic and biotic conditions which suggests that abiotic processes were the
dominant removal mechanism. PFOA data under abiotic and biotic conditions were better
modeled with a pseudo-second-order kinetics, respectively (R2 = 0.74-0.83). Similarly, PFOS was
removed to a similar extent under the biotic and abiotic conditions. The removals of PFOS under
abiotic and biotic conditions were also better modeled with a pseudo-second-order kinetics,
respectively (R2 = 0.70-0.77). As expected, biodegradation offered a minimal contribution to the
removal of PFOA and PFOS due to their strong resistance to biodegradation (Liou et al., 2010; Li
et al., 2019). On the other hand, ion exchange is well known to be an effective method to remove
PFOA and PFOS (Dixit et al., 2019). Therefore, the removal of PFOA and PFOS is most likely
achieved through ion exchange due to their higher affinity than previously retained NOM on the
resins. In summary, batch tests with nonbiodegradable micropollutants confirmed that negative
micropollutants can be removed by BIEX resins through ion exchange if the contaminants have a
higher affinity than previously retained anions on the resin.

76
Figure 3.1 - Micropollutants removal during batch tests under biotic and abiotic conditions.
Trendlines correspond to the kinetic model (pseudo-1st or pseudo-2nd order) fitted to the data.
0.0
0.2
0.4
0.6
0.8
1.0
1.2
1 100 10000
Caffeine Estradiol
Ibuprofen Naproxen
Thiamethoxam
PFOA PFOS
0.0
0.2
0.4
0.6
0.8
1.0
1.2
1 100 10000
Atrazine
Biodegradable and neutral
Biodegradable and negative
Nonbiodegradable and negative
Nonbiodegradable and neutral
0.0
0.2
0.4
0.6
0.8
1.0
1.2
1 100 10000
C/C
0
0.0
0.2
0.4
0.6
0.8
1.0
1.2
1 100 10000
0.0
0.2
0.4
0.6
0.8
1.0
1.2
1 100 100000.0
0.2
0.4
0.6
0.8
1.0
1.2
1 100 10000
Biotic
Abiotic
Modeling(Biotic)Modeling(Abiotic)
0.0
0.2
0.4
0.6
0.8
1.0
1.2
1 100 10000
Time (min)
0.0
0.2
0.4
0.6
0.8
1.0
1.2
1 100 10000

77
Kinetic parameters of the fitted models are summarized in Table 3. Error bars were omitted due
to overlapping with data points.
Table 3.3 - Rate constants (k) and coefficients of determination (R2) for the kinetic models of
micropollutant removal during batch tests. Fitting with R2 lower than 0.25 was designated as not
available.
Micropollutants Test
Condition
Pseudo-first order Pseudo-second order
k1 (min-1) R2 k2 (µg/(g.h)) R2
Caffeine Biotic 0.0007 0.93 0.002 0.49
Abiotic Not available Not available
Estradiol Biotic 0.002 0.63 0.34 0.68
Abiotic 0.003 0.92 0.06 0.69
Ibuprofen Biotic 0.003 0.99 0.008 0.95
Abiotic Not available 4.2 0.74
Naproxen Biotic 0.0003 0.46 0.24 0.95
Abiotic Not available 0.85 0.97
Thiamethoxam Biotic Not available Not available
Abiotic Not available Not available
Atrazine Biotic Not available Not available
Abiotic Not available Not available
PFOA Biotic 0.0002 0.52 0.41 0.83
Abiotic 0.0002 0.66 0.26 0.74
PFOS Biotic 0.0008 0.58 0.32 0.70
Abiotic 0.0007 0.59 0.18 0.77

78
Micropollutant concentrations after 24-h batch tests are summarized in Figure 3.2. Estradiol was
removed to the greatest extent under either abiotic or biotic conditions due to sorption
processes. Caffeine and ibuprofen were only efficiently removed under the biotic condition
(normalized concentration: 0.3 and 0.02, respectively) thanks to the presence of acclimated
biomass on the BIEX resins. Minimal difference was observed for naproxen (p > 0.05, t-test),
PFOA, and PFOS between biotic and abiotic conditions as they were mainly removed through ion
exchange with previously retained NOM. Atrazine and thiamethoxam were not amenable to BIEX
resins as sorption processes, biodegradation, and ion exchange are all inefficient for their
removal. Overall, the order of organic micropollutant removal extent under the biotic condition
is estradiol > ibuprofen > PFOS > caffeine > naproxen > PFOA > atrazine > thiamethoxam.
Figure 3.2 – Normalized micropollutant concentrations after 24 h batch test. Error bars
correspond to the minimum and maximum values between test groups and controls. CAF:
caffeine; E2: Estradiol; IBU: ibuprofen; NAP: naproxen; THI: thiamethoxam; ATZ: atrazine; PFOA:
perfluorooctanoic acid; PFOS: perfluorooctanesulfonic acid.
3.3.3 Suspect screening of transformation products Two transformation products were identified from the in-house database using the suspect
screening approach (Figure S3.2-3.7). The concentrations of theobromine and 1-
hydroxyibuprofen during the batch test were estimated using the standard curve of the parent
0.0
0.2
0.4
0.6
0.8
1.0
1.2
CAF E2
IBU
NAP
THI
ATZ
PFOA
PFOS
C/C
0
AbioticBiotic
Biodegradable Nonbiodegradable

79
ions (i.e., caffeine and ibuprofen) (Table 3.4). Theobromine was identified as a potential
biotransformation product of caffeine as it mainly results from biodegradation processes (Suzuki
and Waller, 1984). Theobromine was not found in the raw water and the abiotic condition except
for the contact time of 1440 min (i.e., 24h), whereas it was observed throughout the batch test
conducted under the biotic condition. No clear trend was observed for the variation of
theobromine under the biotic condition, hypothetically owing to the low concentrations
measured. The contrasting results of theobromine under the abiotic and biotic conditions
corroborate that biodegradation is an active mechanism for the removal of caffeine on the BIEX
resins.
By contrast, 1-hydroxyibuprofen was observed under both biotic and abiotic conditions (Table
3.4). Previous studies reported that 1-hydroxyibuprofen was a biotransformation product of
ibuprofen (Salgado et al., 2020). In the present study, the presence of 1-hydroxyibuprofen in the
abiotic condition was due to the biodegradation of ibuprofen in the raw water (i.e., before
micropollutant spiking) according to our suspect screening results (concentration estimated: 20
ng/L). No significant difference can be observed between the abiotic and the biotic condition
(p>0.05) possibly due to the fast biodegradation of 1-hydroxyibuprofen under the biotic
condition. Rutere et al. (2020) also reported minimal concentration detected for 1-
hydroxyibuprofen in their ibuprofen biodegradation study, suggesting that 1-hydroxyibuprofen is
a biotransformation intermediate of ibuprofen.
Table 3.4 - Estimated concentrations of theobromine and 1-hydroxyibuprofen during the batch
test.
Contact time (min)
Estimated concentration (ng/L)
Transformation products Abiotic condition Biotic condition
Theobromine
1 Not found 7 ± 3
3 Not found 3 ± 2
10 Not found 8 ± 1
30 Not found 3 ± 5

80
240 Not found 1 ± 1
1440 3 ± 3 5 ± 2
1 20 ± 5 37 ± 3
3 29 ± 3 25 ± 4
10 16 ± 1 38 ± 6
1-hydroxyibuprofen 30 31 ± 8 26 ± 6
240 31 ± 20 50 ± 3
1440 36 ± 8 34 ± 24
3.3.4 Implications on the application of ion exchange resins Conventional use of ion exchange resins for NOM removal implies frequent regeneration with
high concentration of NaCl solution (8%-12%w/v). The regeneration produces a highly
concentrated brine of which the disposal can be costly and difficult (Levchuk et al., 2018).
Although regeneration allows recovering resin exchange capacity, it also removes biofilms on the
resin surface. Operating ion exchange resins with a lower regeneration frequency, i.e., in
biological ion exchange (BIEX) mode, is an alternative to the conventional strategy of operation
for NOM removal applications, given that NOM can still be removed through secondary ion
exchange (i.e., exchange with sulfate) subsequent to the exhaustion of primary ion exchange
capacity (i.e., exchange with chloride) (Liu et al., 2020; Edgar and Boyer, 2020; Zimmerman et al.,
2021). With less frequent regeneration, microbial communities can fully develop on the resin
surface. Although past studies have stated that bacteria may bind the ion exchange sites and
potentially decrease the treatment efficiency (Wachinski, 2006; Edgar and Boyer, 2020), the
present study demonstrated that biomass on resins can also contribute to the removal of
biodegradable micropollutants. Therefore, ion exchange resins are a promising alternative to
conventional media (e.g., activated carbon) as a biomass support in biofiltration processes. Future
studies will need to systematically compare the cost-efficiency of using ion exchange resins as
biomass support compared to conventional media for biofiltration. The first full-scale application
81
of BIEX has been put in operation in Middle River (BC, Canada) in 2019. Monitoring its
performance is underway to confirm the superiority of BIEX over BAC filtration for both NOM as
well as organic micropollutant removal.
3.4 Conclusions
The present study evaluated micropollutant removal using biological ion exchange (BIEX) resins.
Results indicate that biodegradation can contribute to the removal of caffeine, estradiol, and
ibuprofen, corroborating that biodegradation is a removal mechanism on BIEX resins. However,
the extent of biodegradation also depends on the presence of an adapted microbial community
on the resin surface given that we observed a lower contribution from biodegradation for the
removal of naproxen which was not present in the source water. The removals of naproxen, PFOA,
and PFOS were attributable to ion exchange with previously retained natural organic matter
(NOM) on the resins. Finally, nonbiodegradable and neutral compounds, that is thiamethoxam
and atrazine, were not effectively removed by the BIEX resins, suggesting that alternative
treatment options should be considered to target these molecules. Future study should compare
the cost-benefit of IX resins versus the other traditional media (e.g., sand, anthracite, and
activated carbon) used for biofiltration.
Acknowledgements
We would like to thank the technical support of Sung Vo Duy, Jacinthe Mailly, Julie Philibert, and
Yves Fontaine. This work was completed at part of the NSERC-Industrial Chair in Drinking Water
at Polytechnique Montréal with the financial support of its partners, namely City of Montréal,
Veolia Water Technologies Canada Inc., City of Laval, City of Longueuil and the City of Repentigny.
All experiments were completed at CREDEAU laboratories, a research infrastructure supported
by the Canadian Foundation for Innovation (CFI).
3.5 Supplementary materials

82
Table S3.1 - Raw water characteristics
Parameters Unit Average
pH - 7.2
Turbidity NTU 13.3
Dissolved organic matter (DOC) mg C/L 7.0
UV254 cm-1 0.24
Biodegradable DOC (BDOC) mg C/L 0.42
Biopolymers (BP) μg C/L 218
Humic substances (HS) μg C/L 4769
Building Blocks (BB) μg C/L 866
Low molecular weight acids (LMW acids) μg C/L 189
Low molecular weight neutrals (LMW neutrals) μg C/L 536
Chloride mg/L 6.6
Sulfate mg/L 5.6
Nitrate mg/L 0.9
Nitrite mg/L < 0.2
Bromide mg/L < 0.1
Alkalinity mg CaCO3/L 27.7
Hardness mg CaCO3/L 27.0
Ammonia μg NH3-N/L 20.1
Filter Selection. Spiked water and filtrated spiked water were analyzed in triplicate using UHPLC-
HRMS to evaluate the micropollutants recovery rates for each type of filters (Figure S3.1). Overall,
the glass fiber filter (GFF) showed to have the best recovery rates for all selected micropollutants
with an average of 98 ± 3 %.
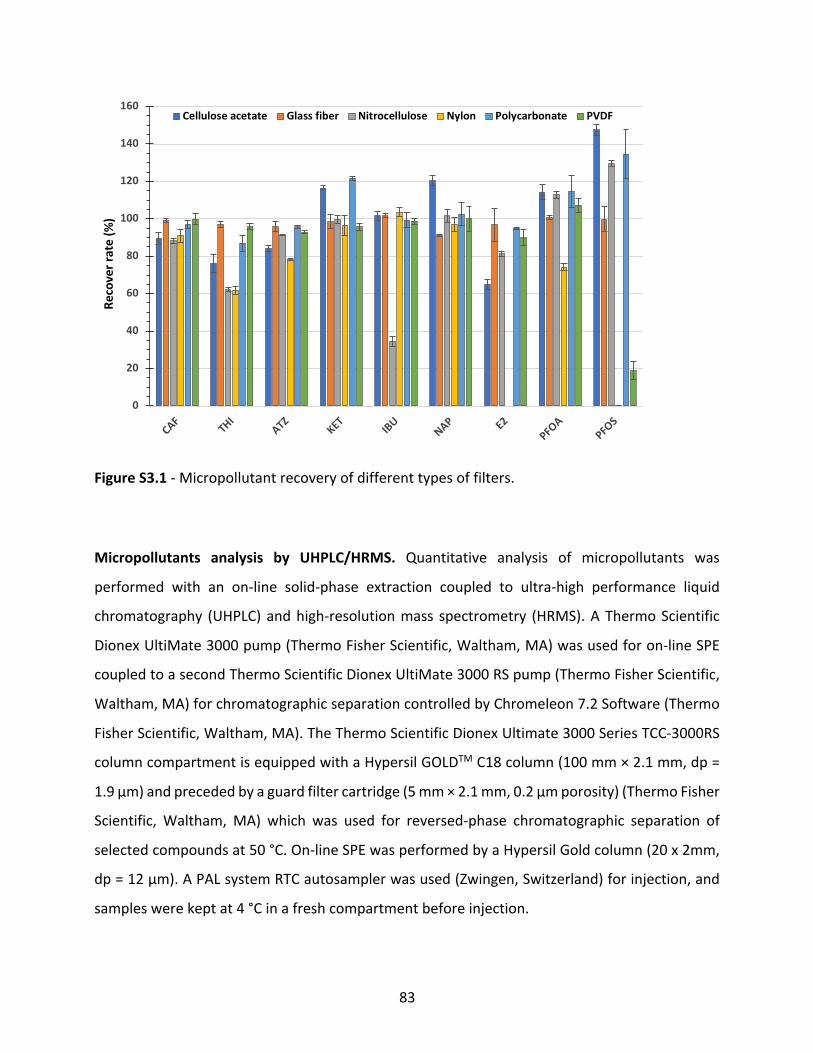
83
Figure S3.1 - Micropollutant recovery of different types of filters.
Micropollutants analysis by UHPLC/HRMS. Quantitative analysis of micropollutants was
performed with an on-line solid-phase extraction coupled to ultra-high performance liquid
chromatography (UHPLC) and high-resolution mass spectrometry (HRMS). A Thermo Scientific
Dionex UltiMate 3000 pump (Thermo Fisher Scientific, Waltham, MA) was used for on-line SPE
coupled to a second Thermo Scientific Dionex UltiMate 3000 RS pump (Thermo Fisher Scientific,
Waltham, MA) for chromatographic separation controlled by Chromeleon 7.2 Software (Thermo
Fisher Scientific, Waltham, MA). The Thermo Scientific Dionex Ultimate 3000 Series TCC-3000RS
column compartment is equipped with a Hypersil GOLDTM C18 column (100 mm × 2.1 mm, dp =
1.9 µm) and preceded by a guard filter cartridge (5 mm × 2.1 mm, 0.2 µm porosity) (Thermo Fisher
Scientific, Waltham, MA) which was used for reversed-phase chromatographic separation of
selected compounds at 50 °C. On-line SPE was performed by a Hypersil Gold column (20 x 2mm,
dp = 12 µm). A PAL system RTC autosampler was used (Zwingen, Switzerland) for injection, and
samples were kept at 4 °C in a fresh compartment before injection.
0
20
40
60
80
100
120
140
160
CAF THIATZ
KET IBUNAP E2
PFOA
PFOS
Reco
ver r
ate
(%)
Cellulose acetate Glass fiber Nitrocellulose Nylon Polycarbonate PVDF

84
The on-line SPE pre-concentration step was done as follows. 1 mL of water samples was injected
in the injection loop with a loading speed set at 1 mL/min. Then, the column is washed with milli-
Q water (with 0.1% HCOOH) during 2 min at 1 mL/min. Following the sample loading step, the
SPE column was then back flushed with MeOH during 5 min at 1.5 mL/min (with 0.1% HCOOH)
and the elution was transferred using the analytical pump gradient directly through the analytical
column. The chromatographic separation was achieved with mobile phase A, which consisted of
Milli-Q water and mobile phase B, which consisted of MeOH (analytical grade) with 0.1 mM NH4F
(prepared daily) at a flow rate of 0.450 uL/min. The gradient of separation was starting and kept
at 40% B for 2 min, and then the MeOH was increased to 100% from 2 to 7 min and was held
constant at 100% for 1 min. Then, the mobile phases were brought back to initial conditions and
maintained for 2 min for column conditioning before the next injection. A heated electrospray
ionization interface (HESI-II) operated in positive/negative switching mode was used for the
ionization of selected and potential transformation product compounds. Standard parameters
were chosen so as not to limit the ionization of candidates during the chromatographic separation
course. The ionization spray voltage was set at +/-4000V; capillary temperature was set at 275 °C;
the vaporizer temperature was set at 300 °C; sheath gas and auxiliary gas flow were set at 50 and
30 arbitrary units, respectively. HRMS detection was performed by a quadrupole-Orbitrap (Q-
Exactive) mass spectrometer controlled by the Xcalibur 3.0 software (Thermo Fisher Scientific,
Waltham, MA). Instrument calibration in positive mode was done every 7 days using both LTQ
Velos ESI Positive and Negative Ion Calibration Solution (Pierce Biothechnology Inc. Rockford, IL)
by direct infusion to get mass accuracies for all target compounds within the 5 ppm range during
analysis. The Q-Exactive parameter values of resolving power, automatic gain control (AGC), and
ion time (IT) were chosen to improve selectivity and sensitivity during the measurement of
samples and were set respectively at 3x10⁶ ion capacity and 50 ms filling. Each sample was
analyzed in full scan acquisition (m/z 150-600) with a resolving power of 70,000 FWHM (m/z 200).
In order to identify potential transformation products, the data-dependent acquisition (DDA)
mode was running on samples to collect fragmentation information. The scan cycle of the DDA
mode was composed of a full scan acquisition (m/z 150-600) with a resolving power of 70,000
FWHM (m/z 200) and fragmentation events with a resolving power of 17,500 FWHM (m/z 200).

85
For the fragmentation mode, the AGC was set at 2x10⁵ ion capacity and the IT parameter were
set at 100 ms. The intensity threshold was fixed at 1x10⁴ to trigger the fragmentation with
stepped NCE set at 20, 30 and 40 (arbitrary unit). The precursor ions were filtered by the
quadrupole at an isolation width of 0.4 FWHM at m/z 200. The top ten most abundant ions were
selected for fragmentation and a single loop count were used for multiplexing.
Table S3.2 - Potential transformation products of selected micropollutants based on the
literature.
Transformation products Associated compound
Elemental composition Ionization [M+H]+
or [M-H]-
Diethylatrazine Atrazine C6H10ClN5 Positive 188.07030
Deisopropylatrazine Atrazine C5H8ClN5 Positive 174.05465
Diaminoatrazine Atrazine C3H4ClN5 Positive 146.02335
Hydroxyatrazine Atrazine C8H15N5O Positive 198.13549
Clothianidine Thiamethoxam C6H8ClN5O2S Positive 250.01655
Paraxanthine Caffeine C7H8N4O2 Positive 181.07255
Theobromine Caffeine C7H8N4O2 Positive 181.07255
Theophylline Caffeine C7H8N4O2 Positive 181.07255
N-nitrosodimethyl amine Caffeine C2H6N2O Positive 75.05583
N-nitrosomethylethylamine Caffeine C3H8N2O Positive 89.07148
N-nitrosodiethylamine Caffeine C4H10N2O Positive 103.08713
N-nitrosodibutylamine Caffeine C8H18N2O Positive 159.14973
N-nitrosopiperidine Caffeine C5H10N2O Positive 115.08713
N-nitrosomorpholine Caffeine C4H8N2O2 Positive 117.06640
N-nitrosopyrrolidine Caffeine C4H8N2O Positive 101.07148
Estrone Estradiol C18H22O2 Negative 269.15415
2-Hydroxyestrone Estradiol C18H24O2 Negative 271.16981
4-Hydroxyestrone Estradiol C18H22O3 Negative 285.14907
4-Methoxyestrone Estradiol C19H24O3 Negative 299.16472
16α-Hydroxyestrone Estradiol C18H22O3 Negative 285.14907
17α-Epiestriol Estradiol C18H24O3 Negative 287.16472
Estriol Estradiol C18H24O3 Negative 287.16472
17-α-ethinylestradiol Estradiol C20H24O2 Negative 295.16980
2-Methoxyestrone Estradiol C19H24O3 Negative 299.16472
17ß-Estradiol-3- glucuronide Estradiol C24H32O8 Negative 447.20189
Estradiol-3-sulfate Estradiol C18H24O5S Negative 351.12662
Ibuprofen glucuronide Ibuprofen C19H26O8 Negative 381.15494
2-Hydroxyibuprofen Ibuprofen C13H18O3 Negative 221.11777
3-Hydroxyibuprofen Ibuprofen C13H18O3 Negative 221.11777
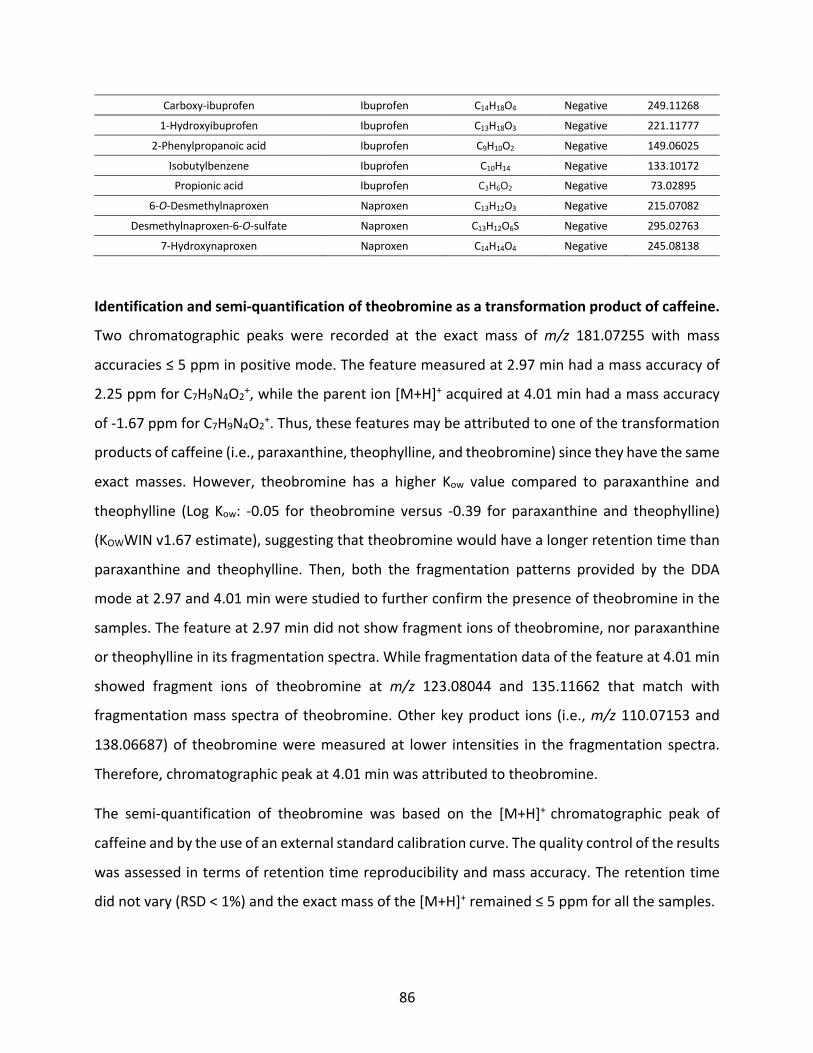
86
Carboxy-ibuprofen Ibuprofen C14H18O4 Negative 249.11268
1-Hydroxyibuprofen Ibuprofen C13H18O3 Negative 221.11777
2-Phenylpropanoic acid Ibuprofen C9H10O2 Negative 149.06025
Isobutylbenzene Ibuprofen C10H14 Negative 133.10172
Propionic acid Ibuprofen C3H6O2 Negative 73.02895
6-O-Desmethylnaproxen Naproxen C13H12O3 Negative 215.07082
Desmethylnaproxen-6-O-sulfate Naproxen C13H12O6S Negative 295.02763
7-Hydroxynaproxen Naproxen C14H14O4 Negative 245.08138
Identification and semi-quantification of theobromine as a transformation product of caffeine.
Two chromatographic peaks were recorded at the exact mass of m/z 181.07255 with mass
accuracies ≤ 5 ppm in positive mode. The feature measured at 2.97 min had a mass accuracy of
2.25 ppm for C7H9N4O2+, while the parent ion [M+H]+ acquired at 4.01 min had a mass accuracy
of -1.67 ppm for C7H9N4O2+. Thus, these features may be attributed to one of the transformation
products of caffeine (i.e., paraxanthine, theophylline, and theobromine) since they have the same
exact masses. However, theobromine has a higher Kow value compared to paraxanthine and
theophylline (Log Kow: -0.05 for theobromine versus -0.39 for paraxanthine and theophylline)
(KOWWIN v1.67 estimate), suggesting that theobromine would have a longer retention time than
paraxanthine and theophylline. Then, both the fragmentation patterns provided by the DDA
mode at 2.97 and 4.01 min were studied to further confirm the presence of theobromine in the
samples. The feature at 2.97 min did not show fragment ions of theobromine, nor paraxanthine
or theophylline in its fragmentation spectra. While fragmentation data of the feature at 4.01 min
showed fragment ions of theobromine at m/z 123.08044 and 135.11662 that match with
fragmentation mass spectra of theobromine. Other key product ions (i.e., m/z 110.07153 and
138.06687) of theobromine were measured at lower intensities in the fragmentation spectra.
Therefore, chromatographic peak at 4.01 min was attributed to theobromine.
The semi-quantification of theobromine was based on the [M+H]+ chromatographic peak of
caffeine and by the use of an external standard calibration curve. The quality control of the results
was assessed in terms of retention time reproducibility and mass accuracy. The retention time
did not vary (RSD < 1%) and the exact mass of the [M+H]+ remained ≤ 5 ppm for all the samples.

87
Figure S3.2 - Chromatographic separation at m/z 181.07255 (positive mode).
Figure S3.3 - Isotopic pattern at m/z 181.07255 (positive mode).
RT: 0.00 - 9.00 SM: 7G
0 1 2 3 4 5 6 7 8 9Time (min)
0
5
10
15
20
25
30
35
40
45
50
55
60
65
70
75
80
85
90
95
100
Rel
ativ
e A
bund
ance
4.01
2.97
NL: 1.27E5m/z= 181.07074-181.07436 F: FTMS + p ESI Full ms [50.0000-600.0000] MS PI_DDA
PI_DDA #1321 RT: 2.97 AV: 1 NL: 1.03E6T: FTMS + p ESI Full ms [50.0000-600.0000]
180.5 180.6 180.7 180.8 180.9 181.0 181.1 181.2 181.3 181.4 181.5 181.6m/z
0
5
10
15
20
25
30
35
40
45
50
55
60
65
70
75
80
85
90
95
100
Rel
ativ
e A
bund
ance
181.08617
181.12263181.06084
181.00073
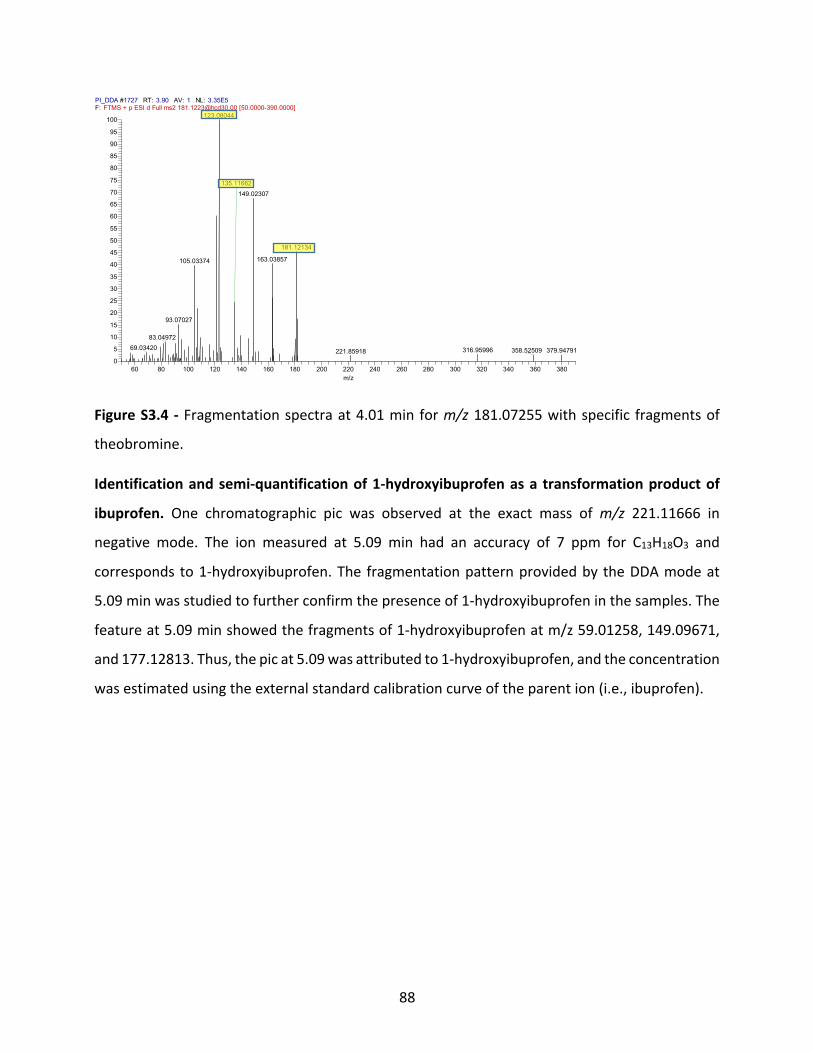
88
Figure S3.4 - Fragmentation spectra at 4.01 min for m/z 181.07255 with specific fragments of
theobromine.
Identification and semi-quantification of 1-hydroxyibuprofen as a transformation product of
ibuprofen. One chromatographic pic was observed at the exact mass of m/z 221.11666 in
negative mode. The ion measured at 5.09 min had an accuracy of 7 ppm for C13H18O3 and
corresponds to 1-hydroxyibuprofen. The fragmentation pattern provided by the DDA mode at
5.09 min was studied to further confirm the presence of 1-hydroxyibuprofen in the samples. The
feature at 5.09 min showed the fragments of 1-hydroxyibuprofen at m/z 59.01258, 149.09671,
and 177.12813. Thus, the pic at 5.09 was attributed to 1-hydroxyibuprofen, and the concentration
was estimated using the external standard calibration curve of the parent ion (i.e., ibuprofen).
PI_DDA #1727 RT: 3.90 AV: 1 NL: 3.35E5F: FTMS + p ESI d Full ms2 [email protected] [50.0000-390.0000]
60 80 100 120 140 160 180 200 220 240 260 280 300 320 340 360 380m/z
0
5
10
15
20
25
30
35
40
45
50
55
60
65
70
75
80
85
90
95
100
Rel
ativ
e Ab
unda
nce
123.08044
149.02307
181.12134
163.03857105.03374
135.11662
93.07027
83.0497269.03420 316.95996 379.94791358.52509221.85918

89
Figure S3.5 - Chromatographic separation at m/z 221.11666 (negative mode).
Figure S3.6 - Isotopic pattern at m/z 221.11666 (negative mode).
RT: 0.00 - 9.01 SM: 7G
0 1 2 3 4 5 6 7 8 9
Time (min)
0
5
10
15
20
25
30
35
40
45
50
55
60
65
70
75
80
85
90
95
100
Relative A
bundance
5.09
3.843.38
4.734.11
5.343.10
5.93
2.31
NL: 1.43E6
m/z=
221.11666-
221.11888 F: FTMS
- p ESI Full ms
[50.0000-600.0000]
MS NI_DDA
NI_DDA #2102 RT: 5.09 AV: 1 NL: 2.16E6T: FTMS - p ESI Full ms [50.0000-600.0000]
220.6 220.8 221.0 221.2 221.4 221.6 221.8 222.0 222.2 222.4 222.6 222.8 223.0 223.2 223.4 223.6m/z
0
5
10
15
20
25
30
35
40
45
50
55
60
65
70
75
80
85
90
95
100
105
110
115
120
Rel
ativ
e Ab
unda
nce
221.11852
222.12181
223.13416
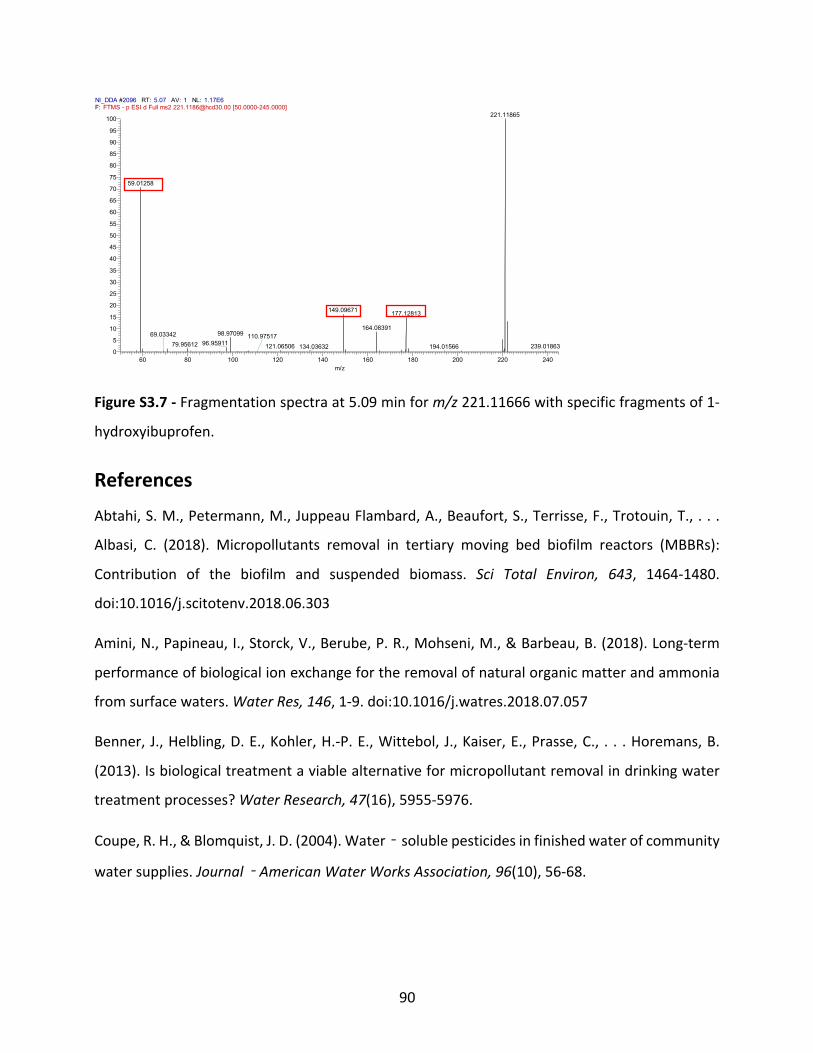
90
Figure S3.7 - Fragmentation spectra at 5.09 min for m/z 221.11666 with specific fragments of 1-
hydroxyibuprofen.
References
Abtahi, S. M., Petermann, M., Juppeau Flambard, A., Beaufort, S., Terrisse, F., Trotouin, T., . . .
Albasi, C. (2018). Micropollutants removal in tertiary moving bed biofilm reactors (MBBRs):
Contribution of the biofilm and suspended biomass. Sci Total Environ, 643, 1464-1480.
doi:10.1016/j.scitotenv.2018.06.303
Amini, N., Papineau, I., Storck, V., Berube, P. R., Mohseni, M., & Barbeau, B. (2018). Long-term
performance of biological ion exchange for the removal of natural organic matter and ammonia
from surface waters. Water Res, 146, 1-9. doi:10.1016/j.watres.2018.07.057
Benner, J., Helbling, D. E., Kohler, H.-P. E., Wittebol, J., Kaiser, E., Prasse, C., . . . Horemans, B.
(2013). Is biological treatment a viable alternative for micropollutant removal in drinking water
treatment processes? Water Research, 47(16), 5955-5976.
Coupe, R. H., & Blomquist, J. D. (2004). Water‐soluble pesticides in finished water of community
water supplies. Journal‐American Water Works Association, 96(10), 56-68.
NI_DDA #2096 RT: 5.07 AV: 1 NL: 1.17E6F: FTMS - p ESI d Full ms2 [email protected] [50.0000-245.0000]
60 80 100 120 140 160 180 200 220 240m/z
0
5
10
15
20
25
30
35
40
45
50
55
60
65
70
75
80
85
90
95
100
Rel
ativ
e Ab
unda
nce
221.11865
59.01258
149.09671 177.12813
164.0839198.97099
96.9591179.95612 239.01863121.06506
69.03342
194.01566134.03632110.97517

91
Dialynas, E., & Diamadopoulos, E. (2012). The effect of biomass adsorption on the removal of
selected pharmaceutical compounds in an immersed membrane bioreactor system. Journal of
Chemical Technology and Biotechnology, 87(2), 232-237. doi:10.1002/jctb.2703
Dixit, F., Dutta, R., Barbeau, B., Berube, P., & Mohseni, M. (2021). PFAS removal by ion exchange
resins: A review. Chemosphere, 272, 129777. doi:10.1016/j.chemosphere.2021.129777
Edgar, M., & Boyer, T. H. (2021). Removal of natural organic matter by ion exchange: Comparing
regenerated and non-regenerated columns. Water Res, 189, 116661.
doi:10.1016/j.watres.2020.116661
Gomez‐Herrero, E., Lebik‐ElHadi, H., Ait‐Amar, H., Tobajas, M., Rodriguez, J. J., & Mohedano,
A. F. (2020). Thiamethoxam removal by Fenton and biological oxidation. Journal of Chemical
Technology & Biotechnology, 95(4), 913-921.
Halle, C., Huck, P. M., & Peldszus, S. (2015). Emerging Contaminant Removal by Biofiltration:
Temperature, Concentration, and EBCT Impacts. Journal American Water Works Association,
107(7), E364-E379. doi:10.5942/jawwa.2015.107.0086
Hermes, N., Jewell, K. S., Schulz, M., Muller, J., Hubner, U., Wick, A., . . . Ternes, T. A. (2019).
Elucidation of removal processes in sequential biofiltration (SBF) and soil aquifer treatment (SAT)
by analysis of a broad range of trace organic chemicals (TOrCs) and their transformation products
(TPs). Water Res, 163, 114857. doi:10.1016/j.watres.2019.114857
Howard, P. H., Boethling, R. S., Stiteler, W. M., Meylan, W. M., Hueber, A. E., Beauman, J. A., &
Larosche, M. E. (1992). Predictive Model for Aerobic Biodegradability Developed from a File of
Evaluated Biodegradation Data. Environmental Toxicology and Chemistry, 11(5), 593-603. doi:Doi
10.1897/1552-8618(1992)11[593:Pmfabd]2.0.Co;2
Husk, B., Sanchez, J. S., Leduc, R., Takser, L., Savary, O., & Cabana, H. (2019). Pharmaceuticals and
pesticides in rural community drinking waters of Quebec, Canada - a regional study on the
susceptibility to source contamination. Water Quality Research Journal of Canada, 54(2), 88-103.
doi:10.2166/wqrj.2019.038
92
Levchuk, I., Rueda Marquez, J. J., & Sillanpaa, M. (2018). Removal of natural organic matter (NOM)
from water by ion exchange - A review. Chemosphere, 192, 90-104.
doi:10.1016/j.chemosphere.2017.10.101
Li, F., Duan, J., Tian, S., Ji, H., Zhu, Y., Wei, Z., & Zhao, D. (2019). Short-chain Per-and Polyfluoroalkyl
Substances in Aquatic Systems: Occurrence, Impacts and Treatment. Chemical Engineering
Journal, 122506.
Liou, J. S., Szostek, B., DeRito, C. M., & Madsen, E. L. (2010). Investigating the biodegradability of
perfluorooctanoic acid. Chemosphere, 80(2), 176-183. doi:10.1016/j.chemosphere.2010.03.009
Liu, Z., Lompe, K. M., Mohseni, M., Berube, P. R., Sauve, S., & Barbeau, B. (2020). Biological ion
exchange as an alternative to biological activated carbon for drinking water treatment. Water
Res, 168, 115148. doi:10.1016/j.watres.2019.115148
Liu, Z., Papineau, I., Mohseni, M., Peldszus, S., Bérubé, P. R., Sauvé, S., & Barbeau, B. (2021).
Operating Bicarbonate-Form versus Chloride-Form Ion Exchange Resins without Regeneration for
Natural Organic Matter Removal. ACS ES&T Water.
Nerenberg, R., Rittmann, B. E., & Soucie, W. J. (2000). Ozone/biofiltration for removing MIB and
geosmin. Journal American Water Works Association, 92(12), 85-+. Retrieved from <Go to
ISI>://WOS:000168836400019
Nord, N. B., & Bester, K. (2020). Can the removal of pharmaceuticals in biofilters be influenced by
short pulses of carbon? Sci Total Environ, 707, 135901. doi:10.1016/j.scitotenv.2019.135901
Paredes, L., Fernandez-Fontaina, E., Lema, J. M., Omil, F., & Carballa, M. (2016). Understanding
the fate of organic micropollutants in sand and granular activated carbon biofiltration systems.
Sci Total Environ, 551-552, 640-648. doi:10.1016/j.scitotenv.2016.02.008
Reungoat, J., Escher, B. I., Macova, M., & Keller, J. (2011). Biofiltration of wastewater treatment
plant effluent: effective removal of pharmaceuticals and personal care products and reduction of
toxicity. Water Res, 45(9), 2751-2762. doi:10.1016/j.watres.2011.02.013

93
Rolph, C. A., Villa, R., Jefferson, B., Brookes, A., Choya, A., Iceton, G., & Hassard, F. (2019). From
full-scale biofilters to bioreactors: Engineering biological metaldehyde removal. Sci Total Environ,
685, 410-418. doi:10.1016/j.scitotenv.2019.05.304
Salgado, R., Brito, D., Noronha, J. P., Almeida, B., Bronze, M. R., Oehmen, A., . . . Barreto Crespo,
M. T. (2020). Metabolite identification of ibuprofen biodegradation by Patulibacter
medicamentivorans under aerobic conditions. Environmental Technology, 41(4), 450-465.
doi:10.1080/09593330.2018.1502362
Schulz, M., Winter, J., Wray, H., Barbeau, B., & Berube, P. (2017). Biologically active ion exchange
(BIEX) for NOM removal and membrane fouling prevention. Water Science and Technology-Water
Supply, 17(4), 1178-1184. doi:10.2166/ws.2017.016
Schymanski, E. L., Jeon, J., Gulde, R., Fenner, K., Ruff, M., Singer, H. P., & Hollender, J. (2014).
Identifying small molecules via high resolution mass spectrometry: communicating confidence.
In: ACS Publications.
Suzuki, T., & Waller, G. R. (1984). Biodegradation of Caffeine - Formation of Theophylline and
Theobromine from Caffeine in Mature Coffea-Arabica Fruits. Journal of the Science of Food and
Agriculture, 35(1), 66-70. doi:DOI 10.1002/jsfa.2740350111
USEPA. (2020). Estimation Programs Interface Suite™ for Microsoft® Windows, v 4.11 United
States Environmental Protection Agency, Washington, DC, USA.
USEPA. (2021). Announcement of Final Regulatory Determinations for Contaminants on the
Fourth Drinking Water Contaminant Candidate List. (2021-04184). Washington, DC, USA
Wachinski, A. M. (2006). Ion exchange treatment for water: American Water Works Association.
Wang, C., Shi, H., Adams, C. D., Gamagedara, S., Stayton, I., Timmons, T., & Ma, Y. (2011).
Investigation of pharmaceuticals in Missouri natural and drinking water using high performance
liquid chromatography-tandem mass spectrometry. Water Res, 45(4), 1818-1828.
doi:10.1016/j.watres.2010.11.043
94
Winter, J., Wray, H. E., Schulz, M., Vortisch, R., Barbeau, B., & Berube, P. R. (2018). The impact of
loading approach and biological activity on NOM removal by ion exchange resins. Water Res, 134,
301-310. doi:10.1016/j.watres.2018.01.052
Zearley, T. L., & Summers, R. S. (2012). Removal of trace organic micropollutants by drinking water
biological filters. Environ Sci Technol, 46(17), 9412-9419. doi:10.1021/es301428e
Zhang, L., Carvalho, P. N., Bollmann, U. E., Ei-Taliawy, H., Brix, H., & Bester, K. (2019). Enhanced
removal of pharmaceuticals in a biofilter: Effects of manipulating co-degradation by carbon
feeding. Chemosphere, 236, 124303. doi:10.1016/j.chemosphere.2019.07.034
Zhang, Y., & Zhou, J. L. (2005). Removal of estrone and 17beta-estradiol from water by adsorption.
Water Res, 39(16), 3991-4003. doi:10.1016/j.watres.2005.07.019
Zimmermann, K., Wright, J., Berube, P., Barbeau, B., & Mohseni, M. (2021). Biological ion
exchange capable of sulphate-based secondary ion exchange during long-term DOC removal.
Water Res, 196, 117036. doi:10.1016/j.watres.2021.117036

95
Chapitre 4 – Biological ion exchange as an alternative to
biological activated carbon for drinking water treatment
Abstract
Biological ion exchange (BIEX) has proved to remove natural organic matter (NOM) better than
biological activated carbon (BAC). This raises the question if BIEX can be integrated into a full-
scale drinking water treatment plant to remove NOM and ammonia. In this study, a pilot plant
consisting of one BIEX filter, three GAC filters and one BAC filter was set up as second-stage
filtration at the Sainte-Rose drinking water treatment plant (Laval, Canada). The pilot plant was
operated for a period of nine months without regeneration of the ion exchange resins. The
influent water showed low DOC (2.5 mg/L) and high sulfate concentrations (28.2 mg/L). Except
for a short peak of DOC released at about 1 000 BV, the BIEX filter achieved a nearly constant
removal of 29 - 36 % over the whole study period. The DOC removals of GAC were similar to BIEX
at < 8000 BV but then stabilized at 13 - 24 % after 8 000 BV. Most DOC removal in the BIEX filter
was achieved at the top 30 cm layer (81 %) compared to 62 - 66 % removal in the GAC/BAC filters
in the same layer. After the rapid exhaustion of the primary ion exchange capacity (< 1 000 BV),
sulfate displaced the fraction of NOM with lower affinity than sulfate, corresponding to the initial
DOC release in the BIEX filter. The fraction of NOM with higher affinity than sulfate can still replace
sulfate, which explains the good long-term performance of the BIEX filter. BIEX released ammonia
with an average of 15 % in warm water condition, probably related to the small diameter of the
column which limited backwash effectiveness.
Keywords: biological ion exchange; biological activated carbon; natural organic matter; anion
exchange resin; nitrification
96
4.1 Introduction Removing natural organic matter (NOM) is one of the main objectives during drinking water
treatment as NOM may cause taste, odor and color issues (Edzwald 2010, Thurman 2012),
membrane and filter fouling (Gibert et al. 2013, Kennedy et al. 2008, Kim and Dempsey 2013),
formation of disinfection by-products (DBPs) (Krasner et al. 2006, Richardson et al. 2007, Brezinski
et al. 2019) as well as biofilm growth in the distribution system (Hijnen et al. 2018). Water
treatment plants (WTPs) currently employ different techniques for NOM removal, including
coagulation/flocculation (Matilainen et al. 2010), activated carbon adsorption (Velten et al. 2011),
and biofiltration (Korth et al. 2001). Among these options, NOM removal through biofiltration has
received considerable attention due to its low maintenance cost and ease of operation. Rapid-
rate biofilters can be designed using various filtration media to act as a support for the
development of biomass. Among them, granular activated carbon (GAC) has been shown to offer
better performance compared to inert medias (e.g., sand, anthracite), an advantage related to
their sorptive capacity. After the exhaustion of this capacity, the GAC transitions into the so-called
biological mode (i.e. biological activated carbon or BAC) which can also offer high NOM removal
in cold water due to their higher surface area or porosity available for biomass growth and the
potential bio-regeneration of the adsorption capacity (Basu et al. 2016). Nevertheless, NOM
removal with BAC filtration is fairly limited (5 % - 20 % DOC removal) and the kinetics is highly
impacted by temperature (Terry and Summers 2018). For this reason, biofiltration is not typically
used as the sole NOM removal process within a treatment train unless the source water naturally
offers a low NOM content.
Recently, we have reported that ion exchange (IX) resins can be used as an alternative media for
biofiltration (Schulz et al. 2017). Firstly, IX resins remove NOM by anion exchange with a counter-
ion (usually chloride). Then, similar to a GAC filter, a progressive depletion of exchange sites is
observed while the surface of the resin is colonised by biofilm which participates in NOM
reduction via biodegradation. During a lab-scale study (Schulz et al. 2017), IX filters were fed with
a 5 mg C/L surface water with low mineral anion content for a period of one year. We observed
an average DOC removal of 60 % for an IX filter and 40 % for an IX filter made abiotic through
continuous sodium azide injection. The development of biofilm was proposed as the reason for

97
this increased performance and the process was referred to as biological ion exchange or BIEX. In
a follow-up lab-scale study using the same source water, BIEX was shown to provide superior DOC
removals (56 ± 7 %) compared to a BAC filter (15 ± 5 %) (Winter et al. 2018). This performance
was confirmed in a pilot study (Amini et al. 2018), where four types of filters (IX, BIEX, GAC and
BAC) were fed for 331 days (without regeneration of BIEX) using a river water of high DOC (7 - 8
mg C/L) and low anionic mineral content (5 - 8 mg SO4-2/L). During summer conditions after five
months of operation (≈840 bed volumes), BIEX achieved 62 % DOC removal whereas the BAC
filter achieved only 7 %. Nitrification in the BIEX filter was as efficient as in the BAC filter,
confirming that the BIEX media was biologically active. IX was exhausted significantly later than
GAC (90 d vs. < 7 d, respectively). While a carbon mass balance calculated after 331 days of
operation showed that about 31 % of DOC removal in the BIEX filter was due to biodegradation,
the high performance of BIEX could not be explained by biodegradation alone. Secondary ion
displacements (e.g., NOM displacing sulfate) was proposed as an important mechanism to explain
BIEX performance after initial anion exchange process with chloride was exhausted. However,
more studies are needed to elucidate the competition of NOM with sorbed anions after the
exhaustion of the initial IX capacity.
Resin suppliers consider biomass growth on resin a nuisance as it may cause excessive fouling in
the IX filter (Flemming 1987). Hence, conventional IX are regularly regenerated using a highly
concentrated salt solution (usually 10 - 12 % w/v NaCl solution) to regain the ion exchange
capacity and alleviate biofouling phenomena. Regeneration produces a brine containing high
concentrations of sodium chloride and NOM which has to be disposed of (Levchuk et al. 2018).
Direct disposal of brine to the aquatic environment or to the sewer is prohibited in many
jurisdictions, since high concentrations of chloride can cause corrosion of plumbing, have
detrimental effects on biological wastewater treatment processes and can be toxic to the aquatic
fauna and flora (Rokicki and Boyer 2011). BIEX provides a novel ion exchange operation strategy
since it implies greatly reducing the frequency of regeneration. Operating IX in BIEX mode could
also potentially lengthen the service life of the resin, which is strongly dependent on the number
of regeneration cycles (Hochmuller 1984).
98
Up to now, we have only evaluated BIEX as a standalone process using surface waters with low
mineral content as we targeted applications in small rural systems given the simplicity of
operation. The high performance achieved so far has raised the question as whether BIEX could
also be an attractive option for large-scale WTPs. For such application, it is anticipated that BIEX
filters would be located after coagulation and settling. Therefore, a lower influent DOC would be
expected compared to the conditions tested so far. If alum is used as coagulant, high sulfate
concentrations in the feed water are expected which may be in competition with NOM for IX sites.
Thus, the general objective of this study was to investigate the potential of a BIEX filter to replace
a second-stage BAC filter as a polishing process for simultaneous NOM removal and nitrification.
Specifically, we compared BIEX with four alternative GAC (three fresh and one exhausted). NOM,
DBP precursors, ammonia removals as well as head loss rates served as metrics to compare their
performances.
4.2 Materials and Methods
4.2.1 Pilot location and source water characteristics This study was conducted for a period of nine months at the Sainte-Rose drinking water treatment
plant (Laval, Canada). With a daily production capacity of 110 000 m3, the plant is fed by the Mille-
Iles River and employs coagulation (alum), flocculation, sedimentation, sand-anthracite filtration,
ozonation, BAC filtration and chlorination. We set up pilot filters after ozonation, in parallel to the
full-scale BAC filtration. The influent to the pilot showed low turbidity (» 0.5 NTU) and low DOC
(» 2.5 mg C/L) (Table 4.1). The concentration of sulfate (» 28.2 mg/L) was high due to the use of
alum as a coagulant (average dosage » 40 mg /L). This condition of operation corresponds to a
sulfate/DOC ratio of 11.2 (28.2 mg/L : 2.5 mg/L). These characteristics contrasted strongly with
our previous assay (Amini et al. 2018) where a BIEX filter was fed with raw waters with a DOC of
7 - 8 mg C/L and 5 - 8 mg/L of sulfate which translates into a sulfate/DOC ratio roughly ten times
lower (0.6 - 1.1).

99
Table 4.1 - Influent water characteristics (average ± standard deviation) during the pilot study
period (April 11, 2018 to January 07, 2019)
Parameters Unit Value*
Temperature °C 14.1 ± 9.2
Turbidity NTU ~ 0.5
DOC mg C/L 2.5 ± 0.2
UVA254 cm-1 0.019 ±
0.007
SUVA L/mg×m ~ 0.76
pH - 6.5 ± 0.4
Chloride mg/L 7.7 ± 4.4
Sulfate mg/L 28.2 ± 4.5
Alkalinity CaCO3 mg/L 12.1 ± 7.7
Ammonia µg N/L 78.0 ± 26.0 *average ± standard deviation
4.2.2 Pilot plant design and operation The pilot plant consisted of five parallel columns (CPVC, 5.08 cm diameter), each being filled with
a 30 cm sand sublayer (0.6 L) and a 150 cm top layer (3.0 L) of either GAC, BAC or IX (fig. 4.1). The
five top layer media investigated in this study (Table 4.2) were: 1) virgin, type-I macroporous
strong base anion exchange resin with an acrylic quaternary amine backbone in chloride form
(Puroliteâ A860, IX capacity: 0.8 eq/L), 2) three virgin wood-based activated carbons (Calgon
Acticarboneâ BGX, Nucharâ WV-B30, Jacobi PICABIOL-HP120) and 3) exhausted activated carbon
(Jacobi PICABIOL-2). The latter was recovered from a full-scale BAC filter at the Chomedey
drinking water treatment plant (Laval, Canada), where it had been in operation for 2 years. Only
wood-based or lignite GAC media were tested during this study as past research conducting at
this location had shown their superiority over mineral-based GAC with respect to nitrification.
Four sampling nozzles were located on each of the columns at different depths (10 cm, 30 cm, 60
cm, 150 cm) to profile the column performance (fig. 4.1). The columns were operated under
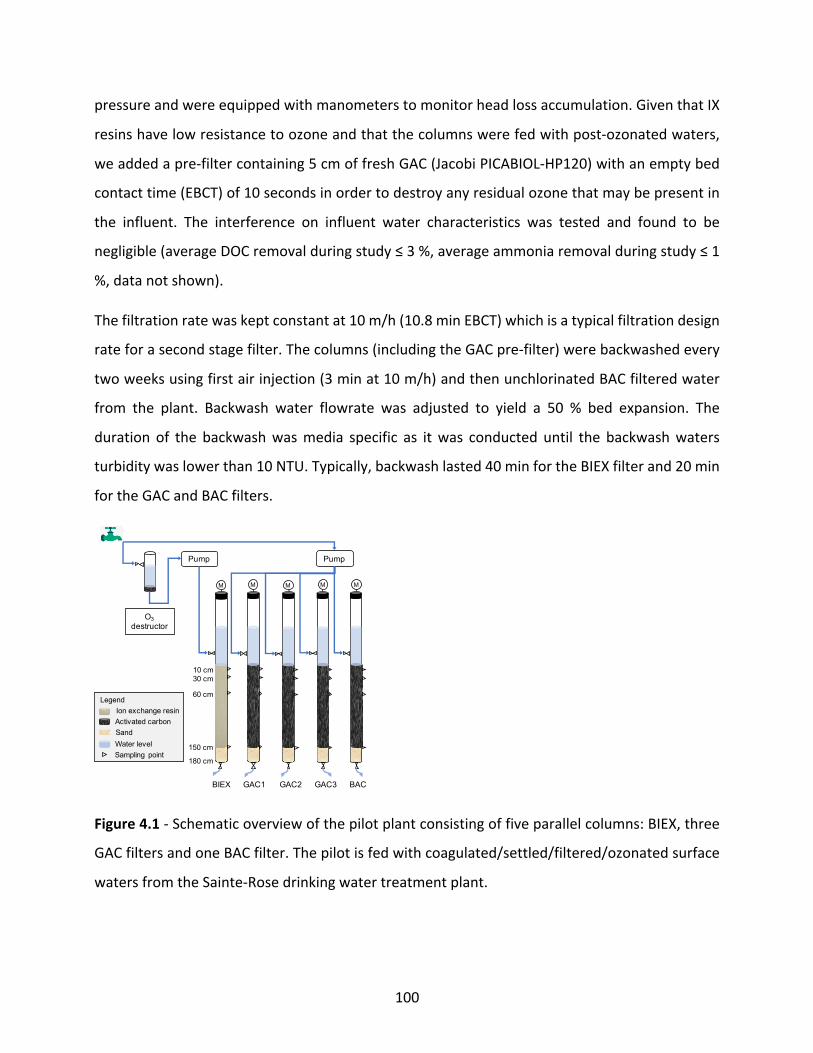
100
pressure and were equipped with manometers to monitor head loss accumulation. Given that IX
resins have low resistance to ozone and that the columns were fed with post-ozonated waters,
we added a pre-filter containing 5 cm of fresh GAC (Jacobi PICABIOL-HP120) with an empty bed
contact time (EBCT) of 10 seconds in order to destroy any residual ozone that may be present in
the influent. The interference on influent water characteristics was tested and found to be
negligible (average DOC removal during study ≤ 3 %, average ammonia removal during study ≤ 1
%, data not shown).
The filtration rate was kept constant at 10 m/h (10.8 min EBCT) which is a typical filtration design
rate for a second stage filter. The columns (including the GAC pre-filter) were backwashed every
two weeks using first air injection (3 min at 10 m/h) and then unchlorinated BAC filtered water
from the plant. Backwash water flowrate was adjusted to yield a 50 % bed expansion. The
duration of the backwash was media specific as it was conducted until the backwash waters
turbidity was lower than 10 NTU. Typically, backwash lasted 40 min for the BIEX filter and 20 min
for the GAC and BAC filters.
Figure 4.1 - Schematic overview of the pilot plant consisting of five parallel columns: BIEX, three
GAC filters and one BAC filter. The pilot is fed with coagulated/settled/filtered/ozonated surface
waters from the Sainte-Rose drinking water treatment plant.
PumpPump
BIEX GAC1 GAC2 GAC3 BAC
O3destructor
Ion exchange resin Activated carbonSandWater level
Legend
Sampling point
10 cm30 cm
60 cm
150 cm
180 cm
M M M M M

101
Table 4.2 - Media characteristics for IX, three different GAC and BAC used in this study
Abbreviations Media Diameter
(mm)
D10
(mm) Cu
Surface area
(m2/g)
BIEX Puroliteâ A860 0.3-1.2 0.5 1.7 2.19
GAC1 Calgon Acticarboneâ BGX 0.5-0.7 0.6 1.8 1550-1650
GAC2 Nucharâ WV-B30 0.8-1.1 1.0 1.8 1400-1600
GAC3 Jacobi PICABIOL-HP120 1.2-1.4 1.3 1.4 1400
BAC Jacobi PICABIOL-2 1.2-1.4 1.3 1.4 1600
Cu: Uniformity coefficient = d60/d10; D10: measured with a MASTERSIZER 3000 (Malvern, UK);
Other information was provided by suppliers.
4.2.3 Analytical methods Influent and effluent water characteristics were sampled weekly for the study period.
Temperature, pH, and dissolved oxygen were measured on-site with a multimeter (HACH HQ40D).
DOC and UVA254 samples were first prefiltered with a syringe filter (0.45 µm Merck Millex®-HV)
prior to analysis on a TOC-meter (Sievers 5310C, GE water, USA) or a spectrophotometer
(Ultrospec 3100pro, GE Healthcare, USA). Anions (nitrate, chloride, sulfate) were measured with
an ion chromatograph (ICS 5000 AS-DP DIONEX, USA) equipped with an AS18 column. Bicarbonate
concentration was evaluated from alkalinity measurements which were performed using the acid
titration method 5.10 (USEPA 2012). THM and HAA5 precursors were measured after chlorination
according to the Uniform Formation Conditions technique (UFC) (Summers et al. 1996), i.e., by
maintaining a free chlorine residual of 1.0 ± 0.5 mg Cl2/L after a contact time of 24h at pH 8.0 and
20 °C. They were analyzed by gas chromatography (7890B GC system from Agilent Technologies,
USA) according to methods 524.2 (THM) and 552.3 (HAA) (USEPA 2003). Ammonia concentrations
(in µg N/L) were quantified in triplicate using the indophenol colorimetric method NF T90-015
(AFNOR 2000) with a 5 cm spectrophotometric cell in order to achieve a detection limit of 5 µg
N/L.

102
4.3 Results
4.3.1 Head loss accumulation Head losses were recorded after (i) 30 min of operation following a backwash (D1), (ii) seven days
of operation (D7) and (iii) fourteen days of operation (D14) (fig. 4.2). The BIEX filter was composed
of a finer media which explains why it generated the highest head loss compared to GAC and BAC
filters. The median BIEX head losses were 1.48 m for D1, 3.44 m for D7 and 3.60 m for D14, which
translates into a head loss accumulation of 2.12 m after fourteen days. As a comparison, GAC1,
which had higher head loss than the other GAC, exhibited a median head loss of only 0.72, 0.73
and 0.81 m for D1, D7 and D14 conditions, respectively (accumulation of 0.09 m after fourteen
days). The other filters GAC2, GAC3 and BAC had lower head losses with values between 0.36 -
0.59 m for all the monitored conditions with an accumulation of only 0.11 - 0.16 m after fourteen
days. Overall, the head loss accumulation after 14 days was low and very similar for all GAC/BAC
media tested. On the other hand, the head loss of BIEX filter after fourteen days of operation
fluctuated between 2.19 m (minimum) and 5.63 m (maximum) during the study. Such head losses
are high compared to the typical maximum allowable head loss (2.4 m) in a gravity-fed granular
media filter according to (Kawamura 2000). This also explains why we decided to operate the
filters under pressure rather than by gravity. Finally, we observed that most of the head loss
accumulation in the BIEX filter occurred during the first week of operation, a phenomenon which
differed from the other GAC/BAC filters. We suspect that the BIEX media was not fully compacted
after 30 min of operation following the backwash.
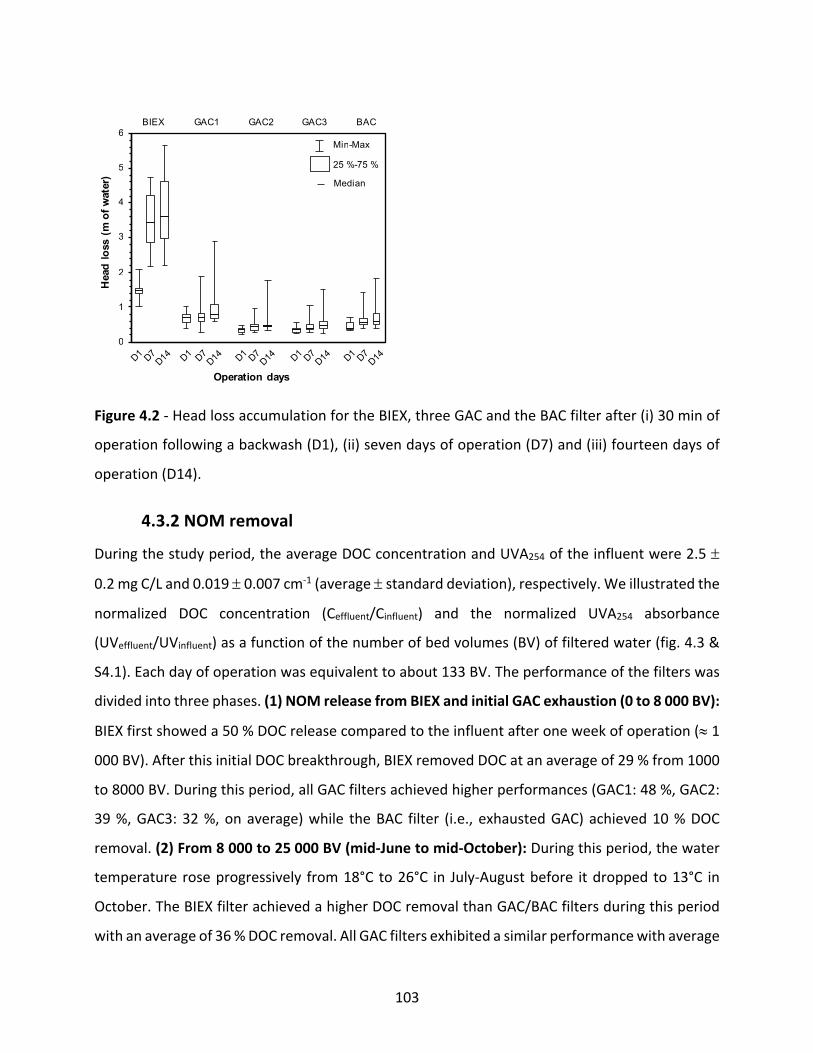
103
Figure 4.2 - Head loss accumulation for the BIEX, three GAC and the BAC filter after (i) 30 min of
operation following a backwash (D1), (ii) seven days of operation (D7) and (iii) fourteen days of
operation (D14).
4.3.2 NOM removal
During the study period, the average DOC concentration and UVA254 of the influent were 2.5 ±
0.2 mg C/L and 0.019 ± 0.007 cm-1 (average ± standard deviation), respectively. We illustrated the
normalized DOC concentration (Ceffluent/Cinfluent) and the normalized UVA254 absorbance
(UVeffluent/UVinfluent) as a function of the number of bed volumes (BV) of filtered water (fig. 4.3 &
S4.1). Each day of operation was equivalent to about 133 BV. The performance of the filters was
divided into three phases. (1) NOM release from BIEX and initial GAC exhaustion (0 to 8 000 BV):
BIEX first showed a 50 % DOC release compared to the influent after one week of operation (» 1
000 BV). After this initial DOC breakthrough, BIEX removed DOC at an average of 29 % from 1000
to 8000 BV. During this period, all GAC filters achieved higher performances (GAC1: 48 %, GAC2:
39 %, GAC3: 32 %, on average) while the BAC filter (i.e., exhausted GAC) achieved 10 % DOC
removal. (2) From 8 000 to 25 000 BV (mid-June to mid-October): During this period, the water
temperature rose progressively from 18°C to 26°C in July-August before it dropped to 13°C in
October. The BIEX filter achieved a higher DOC removal than GAC/BAC filters during this period
with an average of 36 % DOC removal. All GAC filters exhibited a similar performance with average
0
1
2
3
4
5
6
D1 D7 D14 D1 D7 D1
4 D1 D7 D14 D1 D7 D1
4 D1 D7 D14
Headloss(mofwater)
Operation days
BIEX GAC1 GAC2 GAC3 BAC
Min-Max
25 %-75 %
Median

104
DOC removals of 24 %, 22 %, 21% for GAC1, GAC2 and GAC3, respectively. These performances
were slightly superior to the BAC filter which achieved 17 % removal during this period, an
indication that the GAC filters still exhibited a small adsorption capacity. (3) From 25 000 to 37
000 BV (October-January): During this period, the temperature declined from 13 to 1°C. The BIEX
filter maintained an average DOC removal of 30 %. In contrast, the average DOC removals
declined to 16 %, 13 % and 15 % for GAC1, GAC2 and GAC3, respectively, while the BAC filter
achieved 13 % removal. In summary, apart from the initial DOC release observed at about 1 000
BV, BIEX offered equivalent performance to GAC (< 8 000 BV) or superior (> 8 000 BV) to GAC or
BAC filtration. Among the three tested GAC, GAC1 showed higher performance than GAC2 and
GAC3 (p < 0.05) while GAC2 and GAC3 showed no significant difference with regards to DOC
removal (p > 0.05).
Figure 4.3 - Normalized DOC concentrations (Ceffluent/Cinfluent) in the effluents of the BIEX filter,
three GAC filters and one BAC filter for the study period from April 11, 2018 to January 07, 2019.
With respect to UV254 absorbance (fig. S4.1), removals fluctuated as they were directly impacted
by the ozonation conditions preceding the pilot filters. The ozone residual concentration in the
influent varied from a minimum of 0.07 mg O3/L to a maximum of 0.6 mg O3/L (according to the
0
5
10
15
20
25
30
0.0
0.2
0.4
0.6
0.8
1.0
1.2
1.4
1.6
0 5000 10000 15000 20000 25000 30000 35000 40000
Tem
pera
ture
(°C
)
Nor
mal
ized
con
cent
ratio
n of
DO
C (C
efflu
ent/C
influ
ent)
Bed Volume
BIEX GAC1
GAC2 GAC3
BAC Temp
Days of operation
Cinfluent=2.20 ±0.18 mg/L
Cinfluent=2.44±0.14 mg/L
Cinfluent=2.77 ±0.12 mg/L
0 50 100 150 200 250 300

105
on-line monitor of the plant). Nevertheless, the trend in UV254 removal in the BIEX filter exhibited
a similar pattern to the one of DOC removal. For example, BIEX surpassed the other filters at
about 8000 BV and became the most efficient media until the end of the study. For the entire
study period, BIEX provided the best UVA254 removal with an average of 48 % compared to GAC1
(31 %), GAC2 (28 %), GAC3 (25 %) and BAC (15 %). The fact that the UVA254 in BIEX effluent was
sustained for a very long period, independent of water temperature, suggests that removal of
aromatic NOM through ion exchange was an active mechanism throughout the study.
We realized a profile study to monitor DOC removal across the filter beds at about 21 000 BV =
154 days of operation (fig. 4.4). In the BIEX filter, the upper 30 cm layer (1.8 min EBCT) made up
for 81 % of the DOC removal while the other 150 cm (9 min EBCT) accounted for the remaining
19 %. However, in the case of the activated carbon filters, all filters showed similar patterns where
62 - 66 % of the total DOC removal was achieved in the top 30 cm while the remainder (34 - 38
%) was removed in the lower 150 cm layer. The rapid removal kinetic of BIEX is more consistent
with ion exchange than biodegradation. This finding also indicates that the BIEX filter would be a
more robust process than BAC filtration given that NOM is removed more effectively inside the
filter.
Figure 4.4 - Distribution of total DOC removal (0.87, 0.76, 0.73, 0.71, 0.52 mg C/L) in the upper
(30 cm) vs. lower layer (150 cm) for BIEX, GAC1, GAC2, GAC3 and BAC, realized at about 21 000
BV.
0%
20%
40%
60%
80%
100%
BIEX GAC1 GAC2 GAC3 BAC0-30 cm 30-180 cm

106
4.3.3 Removal of THM and HAA precursors From August 22, 2018 to January 7, 2019 (18 000 BV to 37 000 BV), we monitored THM and HAA5
precursors biweekly in the influent and effluents (fig. 4.5). The average influent THM-UFC and
HAA5-UFC concentrations were 60 µg/L and 68 µg/L, respectively. BIEX achieved the highest THM
and HAA precursors reductions with an average of 48 % and 66 %, respectively. Meanwhile, all
GAC filters had similar performance with average reductions of 28 - 33 % for THM-UFC and 45 -
48 % for HAA5-UFC. Removal of THM and HAA precursors averaged 28 % and 44 %, respectively
in the BAC. The precursors removal performance was consistent with the observed DOC and
UVA254 removals for the five filters, confirming the higher NOM removal performance in the BIEX
filter.
(A) (B)
Figure 4.5 - Distribution of (A) THM-UFC and (B) HAA5-UFC precursors in the influent and effluents
of the filter media under investigation. Period: 18 000 to 32 000 BV. Numbers indicate the average
concentrations.
4.3.4 Impact of BIEX on inorganic anions The major inorganic anions concentrations were monitored weekly in the influent and BIEX
effluent. The average influent concentrations (± standard deviation) of sulfate, chloride,
bicarbonate and nitrate for the study period were: 28.2 ± 4.5 mg/L, 7.7 ± 4.4 mg/L, 14.8 ± 9.4
mg/L and 1.1 ± 0.6 mg/L, respectively. Given that ion exchange resin was initially charged with
chloride, the average concentration of chloride in the BIEX effluent was higher than in the influent
(9.1 ± 11.7 mg/L). In order to understand the dynamics of ion exchange occurring on the resins,
20
30
40
50
60
70
80
Influent BIEX GAC1 GAC2 GAC3 BAC
THM-UFC
(µg/L)
min-max
25 %-75 %average
60μg
/L31
μg/L 38
μg/
L
41 μg
/L
40 μ
g/L
42 μg
/L
10
20
30
40
50
60
70
80
90
Influent BIEX GAC1 GAC2 GAC3 BAC
HAA5-UFC
(µg/L)
68 μg
/L23
μg/
L 34 μ
g/L
36 μg
/L
34 μg
/L
36 μg
/L
min-max
25 %-75 %average
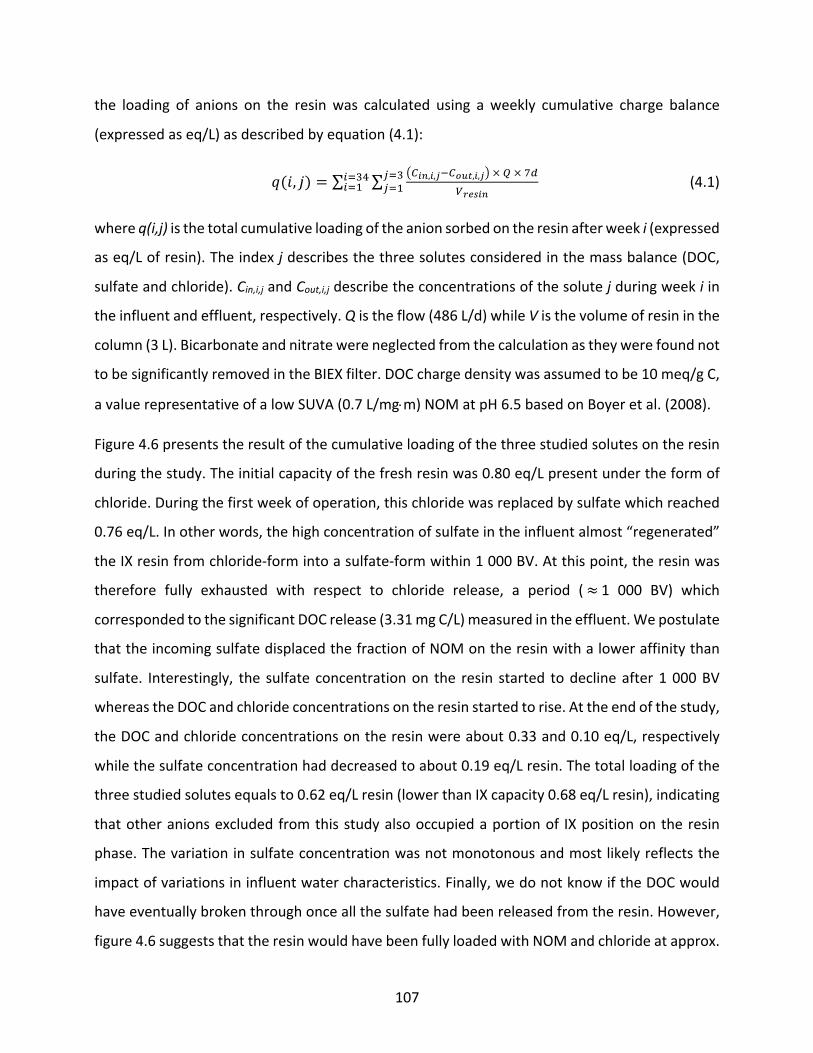
107
the loading of anions on the resin was calculated using a weekly cumulative charge balance
(expressed as eq/L) as described by equation (4.1):
#(%, ') = ∑ ∑ !"!",!,$#"%&',!,$$×'×()*()*!"
+,0+,.
/,09/,. (4.1)
where q(i,j) is the total cumulative loading of the anion sorbed on the resin after week i (expressed
as eq/L of resin). The index j describes the three solutes considered in the mass balance (DOC,
sulfate and chloride). Cin,i,j and Cout,i,j describe the concentrations of the solute j during week i in
the influent and effluent, respectively. Q is the flow (486 L/d) while V is the volume of resin in the
column (3 L). Bicarbonate and nitrate were neglected from the calculation as they were found not
to be significantly removed in the BIEX filter. DOC charge density was assumed to be 10 meq/g C,
a value representative of a low SUVA (0.7 L/mg×m) NOM at pH 6.5 based on Boyer et al. (2008).
Figure 4.6 presents the result of the cumulative loading of the three studied solutes on the resin
during the study. The initial capacity of the fresh resin was 0.80 eq/L present under the form of
chloride. During the first week of operation, this chloride was replaced by sulfate which reached
0.76 eq/L. In other words, the high concentration of sulfate in the influent almost “regenerated”
the IX resin from chloride-form into a sulfate-form within 1 000 BV. At this point, the resin was
therefore fully exhausted with respect to chloride release, a period (≈ 1 000 BV) which
corresponded to the significant DOC release (3.31 mg C/L) measured in the effluent. We postulate
that the incoming sulfate displaced the fraction of NOM on the resin with a lower affinity than
sulfate. Interestingly, the sulfate concentration on the resin started to decline after 1 000 BV
whereas the DOC and chloride concentrations on the resin started to rise. At the end of the study,
the DOC and chloride concentrations on the resin were about 0.33 and 0.10 eq/L, respectively
while the sulfate concentration had decreased to about 0.19 eq/L resin. The total loading of the
three studied solutes equals to 0.62 eq/L resin (lower than IX capacity 0.68 eq/L resin), indicating
that other anions excluded from this study also occupied a portion of IX position on the resin
phase. The variation in sulfate concentration was not monotonous and most likely reflects the
impact of variations in influent water characteristics. Finally, we do not know if the DOC would
have eventually broken through once all the sulfate had been released from the resin. However,
figure 4.6 suggests that the resin would have been fully loaded with NOM and chloride at approx.

108
40 000 BV. Considering that IX filters are typically regenerated after 48 - 72 h of operation (500-1
000 BV), the BIEX mode of operation would translate into very low regeneration costs.
Figure 4.6 - Evolution of the anion concentrations on the resin during 34 000 BV.
4.3.5 Removal of ammonia
During the study period, the average concentration (± standard deviation) of ammonia in the
influent was 78 ± 26 µg N/L. We monitored the effluent ammonia concentration of the five filters
(fig. 4.7). Before 11 weeks (» 10 000 BV), BIEX, GAC1, GAC2 and GAC3 showed negligible ammonia
removals with averages of 0 %, 9 %, 13 % and 10 %, respectively. Meanwhile, the BAC filter
released ammonia with an average of 19 % during this period. We postulate that this may have
been due to a period of the nitrifying biomass reacclimating to its new environment given that it
was collected from a first stage biofilter. As water temperature continued to rise, GAC1 and GAC2
were the first filters to nitrify (11 weeks » 10 000 BV) while GAC3 and BAC followed the same
trend one week later (12 weeks » 11 000 BV). From 15 to 25 weeks (14 000 - 24 000 BV), all GAC
and BAC filters provided excellent ammonia removals (98 - 99 %) under warm water condition
(17 - 26°C). On the other hand, the BIEX filter released an average 15 % ammonia from weeks 11
to 25, i.e., during summer conditions. After 25 weeks (» 24 000 BV), as temperature declined
below 15°C, ammonia removal first declined in the BAC filter which eventually completely lost
treatment capacity after 32 weeks or 4 weeks of operation below 10°C. The GAC1, 2 and 3 filters
also suffered from the decline of temperature but were still nitrifying 14%, 49% and 32%
0
0.1
0.2
0.3
0.4
0.5
0.6
0.7
0.8
0.9
0 10000 20000 30000 40000
Ani
on c
once
ntra
tion
on th
e re
sin
(eq/
L re
sin)
Bed Volume
DOCChlorideSulfate
0 50 100 150 200 250 300Days of operation
Initial chloride release
IEX capacity = 0.8 eq/L

109
respectively after 35 weeks (or 7 weeks below 10°C). Meanwhile, the BIEX continued to show no
ammonia removal during this period. Overall, for the entire study period, GAC2 had the best
performance with an average removal of 68 % while GAC1 and GAC3 showed an equivalent (p >
0.05) performance, with an average of 59 % removal.
Figure 4.7 - Normalized ammonia concentration in the effluents of the BIEX filter, three GAC filters
and one BAC filter for the study period from April 11, 2018 to January 7, 2019.
4.4 Discussion
4.4.1 Head loss in the BIEX filter The BIEX filter had the highest head loss compared to GAC and BAC filters mainly due to the
smaller resin bead size. Operation in a pressurized vessel is thus advisable. Alternatively, the use
of larger IX bead size could be an option to mitigate head loss, although using larger beads may
extend the mass transfer zone inside the resin particles (Ball and Harries 1989). Future research
will also need to address the design conditions required to properly backwash BIEX filters. The
development of a crust in the upper layer is a phenomenon that will need to be managed with
proper air/water backwash and probably more frequent backwash than what was done during
this study (i.e., once every 2 weeks) to reduce the head loss accumulation in BIEX filters.
0
5
10
15
20
25
30
0.0
0.2
0.4
0.6
0.8
1.0
1.2
1.4
1.6
0 5000 10000 15000 20000 25000 30000 35000 40000
Tem
pera
ture
(°C
)
Nor
mol
ized
con
cent
ratio
n of
am
mon
ia(C
efflu
ent/C
influ
ent)
Bed Volume
BIEX GAC1GAC2 GAC3BAC Temp
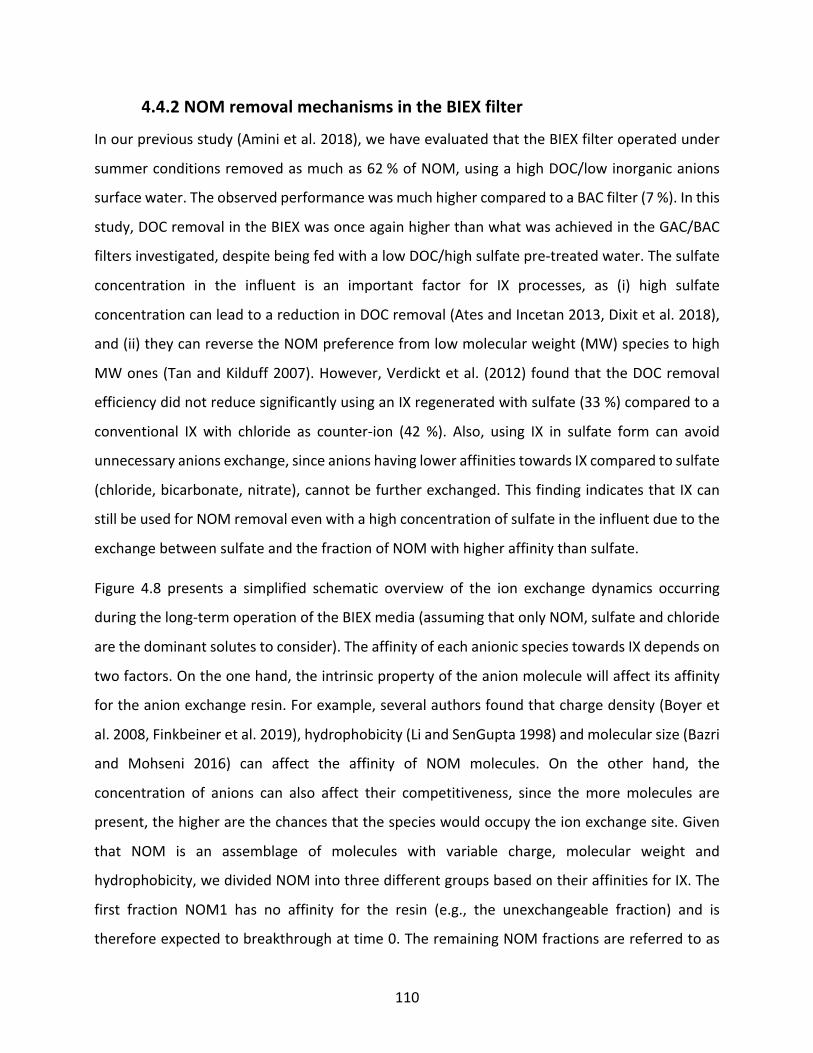
110
4.4.2 NOM removal mechanisms in the BIEX filter In our previous study (Amini et al. 2018), we have evaluated that the BIEX filter operated under
summer conditions removed as much as 62 % of NOM, using a high DOC/low inorganic anions
surface water. The observed performance was much higher compared to a BAC filter (7 %). In this
study, DOC removal in the BIEX was once again higher than what was achieved in the GAC/BAC
filters investigated, despite being fed with a low DOC/high sulfate pre-treated water. The sulfate
concentration in the influent is an important factor for IX processes, as (i) high sulfate
concentration can lead to a reduction in DOC removal (Ates and Incetan 2013, Dixit et al. 2018),
and (ii) they can reverse the NOM preference from low molecular weight (MW) species to high
MW ones (Tan and Kilduff 2007). However, Verdickt et al. (2012) found that the DOC removal
efficiency did not reduce significantly using an IX regenerated with sulfate (33 %) compared to a
conventional IX with chloride as counter-ion (42 %). Also, using IX in sulfate form can avoid
unnecessary anions exchange, since anions having lower affinities towards IX compared to sulfate
(chloride, bicarbonate, nitrate), cannot be further exchanged. This finding indicates that IX can
still be used for NOM removal even with a high concentration of sulfate in the influent due to the
exchange between sulfate and the fraction of NOM with higher affinity than sulfate.
Figure 4.8 presents a simplified schematic overview of the ion exchange dynamics occurring
during the long-term operation of the BIEX media (assuming that only NOM, sulfate and chloride
are the dominant solutes to consider). The affinity of each anionic species towards IX depends on
two factors. On the one hand, the intrinsic property of the anion molecule will affect its affinity
for the anion exchange resin. For example, several authors found that charge density (Boyer et
al. 2008, Finkbeiner et al. 2019), hydrophobicity (Li and SenGupta 1998) and molecular size (Bazri
and Mohseni 2016) can affect the affinity of NOM molecules. On the other hand, the
concentration of anions can also affect their competitiveness, since the more molecules are
present, the higher are the chances that the species would occupy the ion exchange site. Given
that NOM is an assemblage of molecules with variable charge, molecular weight and
hydrophobicity, we divided NOM into three different groups based on their affinities for IX. The
first fraction NOM1 has no affinity for the resin (e.g., the unexchangeable fraction) and is
therefore expected to breakthrough at time 0. The remaining NOM fractions are referred to as

111
NOM2 and NOM3 which respectively describes the NOM fractions with either a lower or higher
affinity than sulfate. Initially, the resin is loaded with chloride ions (fig. 4.8a) which are exchanged
for NOM3, sulfate and NOM2 (fig. 4.8b). Once the chloride capacity is exhausted (» 1 000 BV in
this study), NOM2 is displaced by sulfate (fig. 4.8c). Meanwhile, NOM3 continues to displace
sulfate which explains the long-term performance of the resin for NOM removal (fig. 4.8d). The
unexchangeable NOM (NOM1) was 0.48 mg C/L (22 % of the NOM in the influent). The removal
efficiency stabilized at about 29 % (NOM3) after the DOC release peak, which means that NOM2
accounted for about 49 % of the overall NOM in the influent. Even though NOM1 and NOM2 were
no longer removable after the DOC breakthrough, BIEX filter can still yield 29 - 36 % DOC removal
until the end of the study. Such phenomenon had already been reported by Fu and Symons (1990)
who observed that an anion exchange filter was still removing DOC after breakthrough due to
displacement of sulfate. Typically, IX filters are regenerated near the sulfate breakthrough to
avoid organic matter leakage (Kim and Symons 1991), an operation strategy requiring frequent
regeneration and thus producing a concentrated brine. In this study, the IX filter achieved a
prolonged NOM removal after the sulfate breakthrough mainly due to the exchange between
sulfate and the NOM fraction with higher affinity than sulfate. This performance was similar or
better than those of GAC/BAC filters for a period of at least 35 000 BV. Hence, we suggest 1)
setting IX filters off-line during a short period (e.g., 800 – 900 BV) to avoid the NOM leakage; and
2) operating IX filters beyond the sulfate breakthrough to remove NOM by secondary ion
exchange as well as biodegradation to avoid frequent regeneration (i.e., BIEX mode).

112
Figure 4.8 - Displacement of NOM fractions in the BIEX filter a) virgin IEX; b) NOM3, sulfate and
NOM2 replace chloride while NOM1 is nonexchangeable; c) NOM3 and sulfate replace NOM2
leading to the DOC release in the BIEX filter; d) NOM3 replaces sulfate, which explains the long-
term performance of NOM removal in the BIEX filter. N.B. The anion on each band presents the
dominant species but not the only one.
A mass balance was performed at 34 000 BV to confirm the proposed mechanism of NOM removal
according to equation (4.2).
LNOM = DOC × PNOM3 × Vwater × CD (4.2)
where LNOM is the cumulative loading of NOM on the resin (eq/L resin) due to the IX mechanism.
DOC is the average DOC concentration in the influent during the study (2.5 mg C/L). PNOM3 is the
percentage of NOM3 in the influent NOM (about 29 %), a fraction that can continually accumulate
on the resin. Vwater is the volume of water considered in the mass balance (34 000 BV). CD is the
charge density of NOM3 (9.0 - 10.6 meq/g C), a range estimated based on Boyer et al. (2008) at
pH 6.5 (transphilic acids excluded). Consequently, the cumulative loading of NOM due to the IX
mechanism at 34 000 BV is estimated to be 0.22 - 0.26 eq/L resin. A similar calculation was
performed for sulfate (28.2 mg/L), which showed that the breakthrough of sulfate is expected at
1 362 BV, similar to the observed sulfate breakthrough during this study (approx. 1 000 BV).
However, we obtained a higher loading value of NOM (0.33 eq/L resin) according to equation (1),
Cl-
Cl-
SO42-
NOM2
NOM3
SO42-
NOM2
NOM3
SO42-
NOM3
Cl-NOM1
NOM1NOM2
SO42-NOM1NOM2
a) b) c) d)

113
a calculation that includes all mechanisms of NOM removal in the BIEX filter. Therefore, NOM
removal in addition to IX mechanism is estimated to be 0.07 - 0.11 eq/L resin (i.e., 21 - 33 % of
the total NOM removal), which is speculated to be due to the biomass contribution (e.g.,
biosorption, biodegradation, bioregeneration). However, more studies are still needed to
elucidate the contribution of biodegradation during the operation of IX filters in BIEX mode.
From our previous study (Amini et al. 2018), NOM1, NOM2 and NOM3 are respectively estimated
to be 20 %, 3 % and 77 % of the overall influent NOM, a different breakdown compared to the
current study (22 %, 49 %, 29 %) which is mainly due to the sulfate/DOC concentration in the
influents. In this study, we had a higher sulfate concentration in the influent compared to Amini
et al. (2018) (28.2 mg/L vs. 5 - 8 mg/L), which leads to a higher proportion of NOM2 and lower
proportion of NOM3. This higher proportion of NOM2 favored a net DOC release whereas the
lower proportion of NOM3 results in a lower NOM removal performance after DOC breakthrough
compared to our previous study (29 % vs. 62 %). To conclude, higher sulfate concentrations in the
influent can increase the NOM2 proportion and decrease NOM3 proportion to the overall influent
NOM, which then translates into a higher DOC breakthrough and lower NOM removal efficiency
after DOC breakthrough. Although we hypothesize that NOM2/NOM3 ratios are mostly
determined by the competition (i.e., sulfate/DOC ratio), the NOM characteristics can also play an
important role. For example, Kim and Symons (1991) found that the NOM fraction with < 0.5 K
MW was badly removed throughout the column test (NOM1) while 0.5 - 1 K and 1 - 5 K MW
fractions were the major organic fractions that surged during DOC breakthrough (NOM2).
However, more studies are needed to elucidate to what extent other NOM characteristics (charge
density, hydrophobicity) also play a role in the sulfate/NOM competition.
Evaluating the coupling of ozonation with BIEX was of interest in our study. Firstly, ozonation
fractionates higher MW organic matter with a corresponding increase in lower MW organic
matter (Amy et al. 1988). This shall facilitate the diffusion of organic matter into the resin pores
and reduce the size-exclusion phenomenon. In addition, ozonation also enhances NOM
biodegradability (Hozalski et al. 1999), and thus should enhance biodegradation on the BIEX
media. However, IX resins are incompatible with dissolved ozone. In this study, we employed a
GAC filter with a short EBCT as a preventive measure to protect BIEX. In a full-scale application, it

114
would be more cost-effective to quench the ozone residual chemically or plan for a longer
retention time before entering into a BIEX filter in order to let the ozone residual decay naturally.
4.4.3 Ammonia release in the BIEX filter In our previous study (Amini et al. 2018), we found that BIEX had a similar ammonia removal
efficiency compared to BAC while in this study we obtained results where the BIEX filter released
15 % ammonia in warm waters. Our results also demonstrate that this ammonia release
originated from the top 10 cm layer where most NOM was removed (fig. S4.2), and a thick
biomass layer was observed (fig. S4.3). Also, during the biweekly backwash of the BIEX filter, air
injection could barely break down the solid crust of the thick biomass layer. The crust broke into
smaller IX resin agglomerates, a phenomenon mainly due to the insufficient air injection rate and
small column diameter. Further, the influent water characteristics in the former study (untreated
surface waters) may also explain the successful nitrification obtained in 2018, since pH, alkalinity,
micronutrients (P, Cu etc.) were more favorable to nitrification than in our present study.
4.5 Conclusion
This was the first pilot study evaluating the application of BIEX as a second-stage filter within a
drinking water treatment plant fed with low DOC/high sulfate pretreated surface water. We
highlight the following findings:
• Despite the 50 % DOC release observed at about 1 000 BV, BIEX achieved similar (< 8 000
BV) or higher performance (> 8 000 BV) compared to GAC/BAC filters with 29 - 36 % DOC
removal.
• In the BIEX filter, after the rapid exhaustion of primary ion exchange capacity (< 1 000 BV),
sulfate replaced the fraction of NOM with lower affinity than sulfate (NOM2) leading to
the DOC release.
• In the BIEX filter, the exchange between the fraction of NOM with higher affinity than
sulfate (NOM3) and sulfate is the dominant mechanism to explain the long-term
performance of NOM removal.

115
• Within the top 30 cm layer (1.8 min EBCT), BIEX filter achieved 81 % of the total DOC
removal whereas GAC/BAC filters realized only 62 - 66 % at the same depth.
• BIEX released ammonia in warm water conditions with an average of 15 %, a phenomenon
may due to the small diameter of the column and the improper backwash.
Future studies will need to address the design conditions as well as backwash strategies to
properly wash a BIEX filter.
Acknowledgement
The authors would like to thank Yves Fontaine and Mireille Blais for their support in pilot plant
installation. We also acknowledge Julie Philibert, Jacinthe Mailly, Gabriel St-Jean for the
assistance of chemical analysis. We appreciate Sainte-Rose drinking water treatment plant for
their site support to the pilot plant. Finally, we acknowledge the CREATE Program in
environmental decontamination technologies and integrated water and wastewater
management (TEDGIEER) for the Ph.D. Scholarship awarded to Zhen Liu.
4.6 Supplementary materials
Figure S4.1 - Normalized UVA254 (UVAout/UVAin) in the effluents of the BIEX filter, three GAC filters
and one BAC filter for the study period from April 11, 2018 to January 7, 2019.
0.0
0.2
0.4
0.6
0.8
1.0
1.2
1.4
1.6
0 5000 10000 15000 20000 25000 30000 35000 40000
Nor
mal
ized
abs
orba
nce
of U
VA25
4(U
VAef
fluen
t/UVA
Inff
uent
)
Bed Volume
BIEX GAC1
GAC2 GAC3
BAC

116
Ammonia removal profile study. Ammonia removal profiles (fig. S4.2) were also performed in
warm waters (at week 21 » 20 000 BV). In the BIEX filter, we identified that ammonia release
originated from the upper 10 cm (0.6 min EBCT). In this section of the media, a thick layer of
biofilm was detectable visually (fig. S4.3). This layer proved to be difficult to breakdown during
backwash due to the small diameters of the column which limited backwash effectiveness. For
the other filters, nitrification was completed within the first 60 cm (3.6 min EBCT) in GAC2, GAC3
and BAC and even faster in GAC1 where ammonia was fully removed within the upper 30 cm (1.8
min EBCT).
Figure S4.2 - Ammonia removal as function of media depth (or EBCT), profile realized in warm
waters (week 21, » 20 000 BV, T = 21°C) for BIEX filter, three GAC filters and one BAC filter.
0 2 4 6 8 10
0
0.2
0.4
0.6
0.8
1
1.2
1.4
0 30 60 90 120 150 180
EBCT (min)
Nor
mal
ized
con
cent
ratio
n of
am
mon
ia
(Cpr
ofil/C
influ
ent)
Media Depth (cm)
BIEXGAC1GAC2GAC3BAC
SandBIEX, BAC or GAC
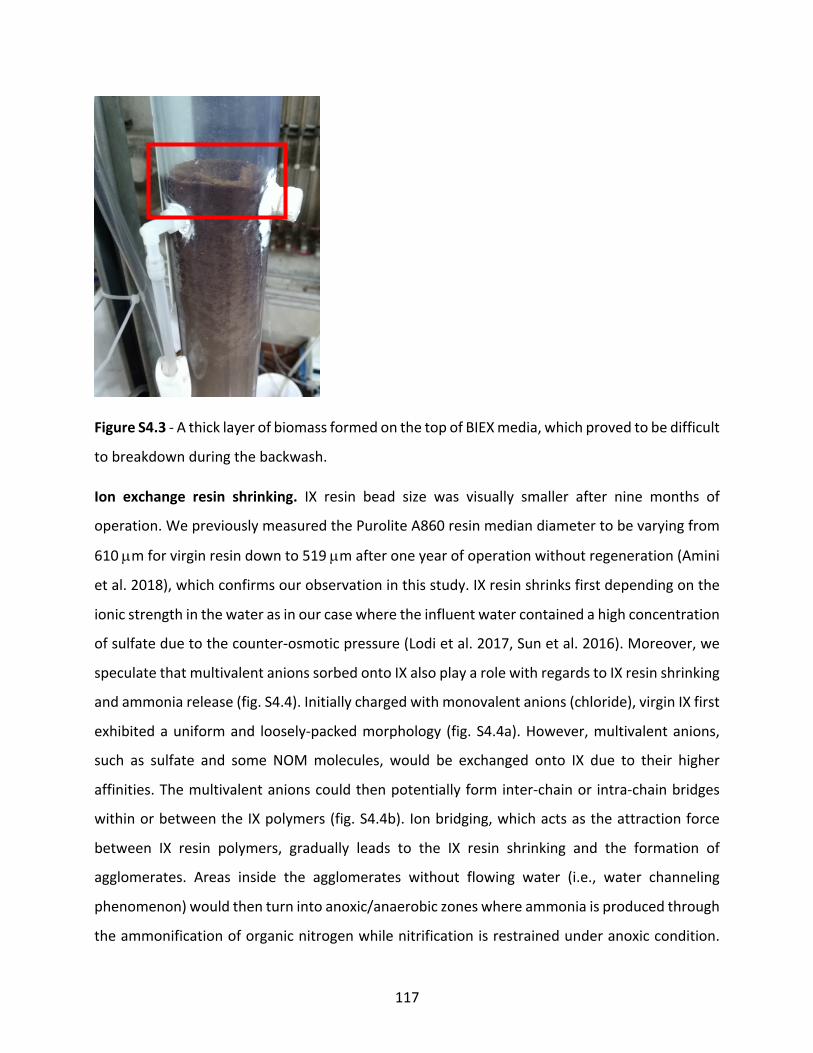
117
Figure S4.3 - A thick layer of biomass formed on the top of BIEX media, which proved to be difficult
to breakdown during the backwash.
Ion exchange resin shrinking. IX resin bead size was visually smaller after nine months of
operation. We previously measured the Purolite A860 resin median diameter to be varying from
610 µm for virgin resin down to 519 µm after one year of operation without regeneration (Amini
et al. 2018), which confirms our observation in this study. IX resin shrinks first depending on the
ionic strength in the water as in our case where the influent water contained a high concentration
of sulfate due to the counter-osmotic pressure (Lodi et al. 2017, Sun et al. 2016). Moreover, we
speculate that multivalent anions sorbed onto IX also play a role with regards to IX resin shrinking
and ammonia release (fig. S4.4). Initially charged with monovalent anions (chloride), virgin IX first
exhibited a uniform and loosely-packed morphology (fig. S4.4a). However, multivalent anions,
such as sulfate and some NOM molecules, would be exchanged onto IX due to their higher
affinities. The multivalent anions could then potentially form inter-chain or intra-chain bridges
within or between the IX polymers (fig. S4.4b). Ion bridging, which acts as the attraction force
between IX resin polymers, gradually leads to the IX resin shrinking and the formation of
agglomerates. Areas inside the agglomerates without flowing water (i.e., water channeling
phenomenon) would then turn into anoxic/anaerobic zones where ammonia is produced through
the ammonification of organic nitrogen while nitrification is restrained under anoxic condition.
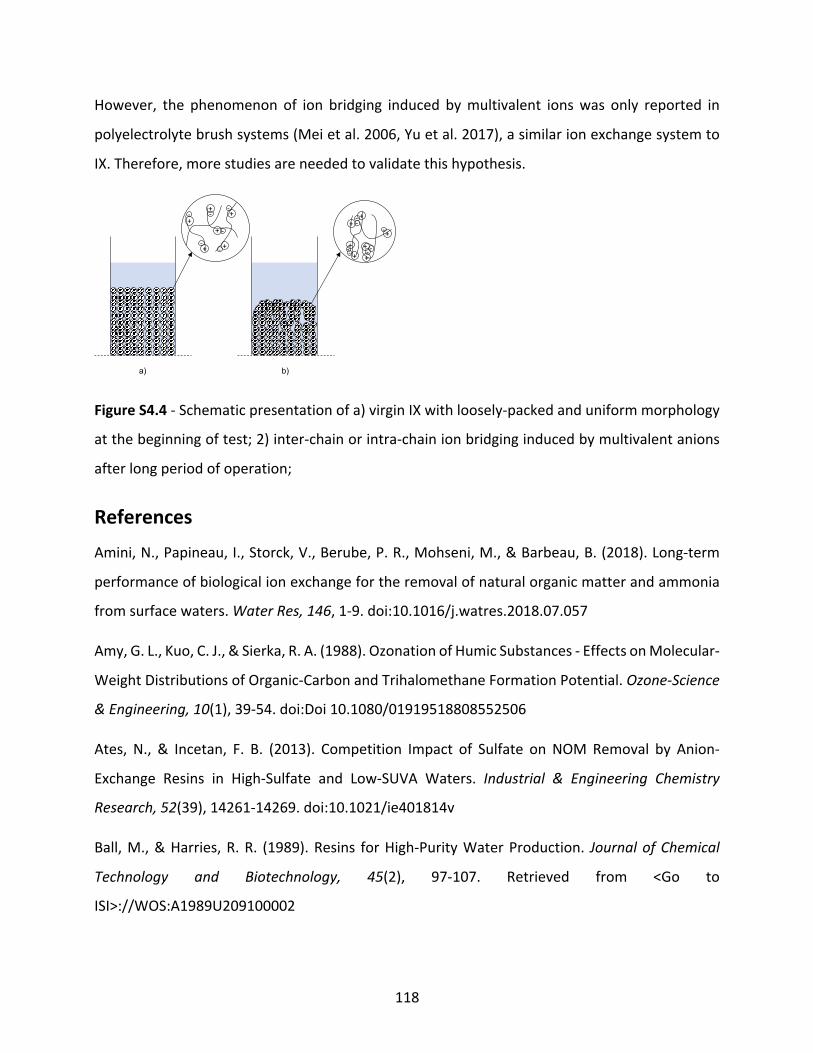
118
However, the phenomenon of ion bridging induced by multivalent ions was only reported in
polyelectrolyte brush systems (Mei et al. 2006, Yu et al. 2017), a similar ion exchange system to
IX. Therefore, more studies are needed to validate this hypothesis.
Figure S4.4 - Schematic presentation of a) virgin IX with loosely-packed and uniform morphology
at the beginning of test; 2) inter-chain or intra-chain ion bridging induced by multivalent anions
after long period of operation;
References Amini, N., Papineau, I., Storck, V., Berube, P. R., Mohseni, M., & Barbeau, B. (2018). Long-term
performance of biological ion exchange for the removal of natural organic matter and ammonia
from surface waters. Water Res, 146, 1-9. doi:10.1016/j.watres.2018.07.057
Amy, G. L., Kuo, C. J., & Sierka, R. A. (1988). Ozonation of Humic Substances - Effects on Molecular-
Weight Distributions of Organic-Carbon and Trihalomethane Formation Potential. Ozone-Science
& Engineering, 10(1), 39-54. doi:Doi 10.1080/01919518808552506
Ates, N., & Incetan, F. B. (2013). Competition Impact of Sulfate on NOM Removal by Anion-
Exchange Resins in High-Sulfate and Low-SUVA Waters. Industrial & Engineering Chemistry
Research, 52(39), 14261-14269. doi:10.1021/ie401814v
Ball, M., & Harries, R. R. (1989). Resins for High-Purity Water Production. Journal of Chemical
Technology and Biotechnology, 45(2), 97-107. Retrieved from <Go to
ISI>://WOS:A1989U209100002
+
+
+ +
+
+ -
--
---
++--
++--
+-
+--+
a) b)

119
Basu, O. D., Dhawan, S., & Black, K. (2016). Applications of biofiltration in drinking water
treatment - a review. Journal of Chemical Technology and Biotechnology, 91(3), 585-595.
doi:10.1002/jctb.4860
Bazri, M. M., & Mohseni, M. (2016). Impact of natural organic matter properties on the kinetics
of suspended ion exchange process. Water Res, 91, 147-155. doi:10.1016/j.watres.2015.12.036
Boyer, T. H., Singer, P. C., & Aiken, G. R. (2008). Removal of dissolved organic matter by anion
exchange: effect of dissolved organic matter properties. Environ Sci Technol, 42(19), 7431-7437.
doi:10.1021/es800714d
Brezinski, K., Gorczyca, B., & Sadrnourmohammadi, M. (2019). Ion-exchange for trihalomethane
control in potable water treatment - a municipal water treatment case study in Rainy River,
Ontario, Canada. Water Quality Research Journal of Canada, 54(2), 142-160.
doi:10.2166/wqrj.2018.134
Dixit, F., Barbeau, B., & Mohseni, M. (2018). Simultaneous uptake of NOM and Microcystin-LR by
anion exchange resins: Effect of inorganic ions and resin regeneration. Chemosphere, 192, 113-
121. doi:10.1016/j.chemosphere.2017.10.135
Edzwald, J. K. (2010). Water Quality and Treatment A Handbook on Drinking Water: McGrawHill.
Finkbeiner, P., Moore, G., Tseka, T., Nkambule, T. T. I., Kock, L., Jefferson, B., & Jarvis, P. (2019).
Interactions between Organic Model Compounds and Ion Exchange Resins. Environ Sci Technol,
53(16), 9734-9743. doi:10.1021/acs.est.9b02139
Flemming, H. C. (1987). Microbial-Growth on Ion-Exchangers. Water Research, 21(7), 745-756.
doi:Doi 10.1016/0043-1354(87)90149-7
Fu, P. L. K., & Symons, J. M. (1990). Removing Aquatic Organic-Substances by Anion-Exchange
Resins. Journal American Water Works Association, 82(10), 70-77. Retrieved from <Go to
ISI>://WOS:A1990ED74100012
120
Gibert, O., Lefevre, B., Fernandez, M., Bernat, X., Paraira, M., & Pons, M. (2013). Fractionation
and removal of dissolved organic carbon in a full-scale granular activated carbon filter used for
drinking water production. Water Res, 47(8), 2821-2829. doi:10.1016/j.watres.2013.02.028
Hijnen, W. A. M., Schurer, R., Bahlman, J. A., Ketelaars, H. A. M., Italiaander, R., van der Wal, A.,
& van der Wielen, P. (2018). Slowly biodegradable organic compounds impact the biostability of
non-chlorinated drinking water produced from surface water. Water Res, 129, 240-251.
doi:10.1016/j.watres.2017.10.068
Hochmuller, K. (1984). Shock test for the determination of the resistance of ion exchange resins
to osmotic and hydromechanical stress. In (pp. 472): Ellis Horwood, Chichester.
Hozalski, R. M., Bouwer, E. J., & Goel, S. (1999). Removal of natural organic matter (NOM) from
drinking water supplies by ozone-biofiltration. Water Science and Technology, 40(9), 157-163.
doi:Doi 10.1016/S0273-1223(99)00652-6
Kawamura, S. (2000). Integrated design and operation of water treatment facilities: John Wiley &
Sons.
Kennedy, M. D., Kamanyi, J., Heijman, B. G. J., & Amy, G. (2008). Colloidal organic matter fouling
of UF membranes: role of NOM composition & size. Desalination, 220(1-3), 200-213.
doi:10.1016/j.desal.2007.05.025
Kim, H. C., & Dempsey, B. A. (2013). Membrane fouling due to alginate, SMP, EfOM, humic acid,
and NOM. Journal of Membrane Science, 428, 190-197. doi:10.1016/j.memsci.2012.11.004
Kim, P. H. S., & Symons, J. M. (1991). Using Anion-Exchange Resins to Remove Thm Precursors.
Journal American Water Works Association, 83(12), 61-68. Retrieved from <Go to
ISI>://WOS:A1991GV11300011
Korth, A., Bendinger, B., Czekalla, C., & Wichmann, K. J. A. h. e. h. (2001). Biodegradation of NOM
in rapid sand filters for removing iron and manganese. 29(5), 289-295.

121
Krasner, S. W., Weinberg, H. S., Richardson, S. D., Pastor, S. J., Chinn, R., Sclimenti, M. J., . . .
Thruston, A. D., Jr. (2006). Occurrence of a new generation of disinfection byproducts. Environ Sci
Technol, 40(23), 7175-7185. doi:10.1021/es060353j
Levchuk, I., Rueda Marquez, J. J., & Sillanpaa, M. (2018). Removal of natural organic matter (NOM)
from water by ion exchange - A review. Chemosphere, 192, 90-104.
doi:10.1016/j.chemosphere.2017.10.101
Li, P., & Sengupta, A. K. (1998). Genesis of selectivity and reversibility for sorption of synthetic
aromatic anions onto polymeric sorbents. Environmental Science & Technology, 32(23), 3756-
3766. doi:DOI 10.1021/es980628y
Lodi, G., Storti, G., Pellegrini, L. A., & Morbidelli, M. (2017). Ion exclusion chromatography: model
development and experimental evaluation. Industrial & Engineering Chemistry Research, 56(6),
1621-1632.
Matilainen, A., & Sillanpaa, M. (2010). Removal of natural organic matter from drinking water by
advanced oxidation processes. Chemosphere, 80(4), 351-365.
doi:10.1016/j.chemosphere.2010.04.067
Mei, Y., Lauterbach, K., Hoffmann, M., Borisov, O. V., Ballauff, M., & Jusufi, A. (2006). Collapse of
spherical polyelectrolyte brushes in the presence of multivalent counterions. Physical Review
Letters, 97(15), 158301.
Richardson, S. D., Plewa, M. J., Wagner, E. D., Schoeny, R., & Demarini, D. M. (2007). Occurrence,
genotoxicity, and carcinogenicity of regulated and emerging disinfection by-products in drinking
water: a review and roadmap for research. Mutat Res, 636(1-3), 178-242.
doi:10.1016/j.mrrev.2007.09.001
Rokicki, C. A., & Boyer, T. H. (2011). Bicarbonate-form anion exchange: affinity, regeneration, and
stoichiometry. Water Res, 45(3), 1329-1337. doi:10.1016/j.watres.2010.10.018
Schulz, M., Winter, J., Wray, H., Barbeau, B., & Berube, P. (2017). Biologically active ion exchange
(BIEX) for NOM removal and membrane fouling prevention. Water Science and Technology-Water
Supply, 17(4), 1178-1184. doi:10.2166/ws.2017.016

122
Summers, R. S., Hooper, S. M., Shukairy, H. M., Solarik, G., & Owen, D. (1996). Assessing the DBP
yield: Uniform formation conditions. Journal American Water Works Association, 88(6), 80-93.
Retrieved from <Go to ISI>://WOS:A1996UR42100019
Sun, Z.-Y., Ura, T., Matsuura, H., Kida, K., & Jyo, A. (2016). Dowex 1X4 and Dowex 1X8 as substitute
of Diaion MA03SS in simulated moving bed chromatographic separation of sulfuric acid and
sugars in concentrated sulfuric acid hydrolysates of bamboo. Separation and Purification
Technology, 166, 92-101.
Tan, Y., & Kilduff, J. E. (2007). Factors affecting selectivity during dissolved organic matter removal
by anion-exchange resins. Water Res, 41(18), 4211-4221. doi:10.1016/j.watres.2007.05.050
Terry, L. G., & Summers, R. S. (2018). Biodegradable organic matter and rapid-rate biofilter
performance: A review. Water Res, 128, 234-245. doi:10.1016/j.watres.2017.09.048
Thurman, E. M. (2012). Organic geochemistry of natural waters (Vol. 2): Springer Science &
Business Media.
Velten, S., Knappe, D. R., Traber, J., Kaiser, H. P., von Gunten, U., Boller, M., & Meylan, S. (2011).
Characterization of natural organic matter adsorption in granular activated carbon adsorbers.
Water Res, 45(13), 3951-3959. doi:10.1016/j.watres.2011.04.047
Verdickt, L., Closset, W., D'Haeseleer, V., & Cromphout, J. (2012). Applicability of ion exchange for
NOM removal from a sulfate-rich surface water incorporating full reuse of the brine. Water
Science and Technology-Water Supply, 12(6), 878-887. doi:10.2166/ws.2012.065
Winter, J., Wray, H. E., Schulz, M., Vortisch, R., Barbeau, B., & Berube, P. R. (2018). The impact of
loading approach and biological activity on NOM removal by ion exchange resins. Water Res, 134,
301-310. doi:10.1016/j.watres.2018.01.052
Yu, J., Jackson, N. E., Xu, X., Brettmann, B. K., Ruths, M., De Pablo, J. J., & Tirrell, M. (2017).
Multivalent ions induce lateral structural inhomogeneities in polyelectrolyte brushes. Science
advances, 3(12), eaao1497.

123
Chapitre 5 – Alleviating the burden of ion exchange brine in
water treatment: from operational strategies to brine
management
Abstract
Ion exchange (IX) using synthetic resins is a cost-efficient technology to cope with a wide range
of contaminants in water treatment. However, implementing IX processes is constrained by the
regeneration of IX resins that generates a highly concentrated brine (i.e., IX brine), the disposal
of which is costly and detrimental to ecosystems. In an effort to make the application of IX resins
more sustainable in water treatment, substantial research has been conducted on the
optimization of IX resins operation and the management of IX brine. The present review critically
evaluates the literature surrounding IX operational strategies and IX brine management which
can be used to limit the negative impacts arising from IX brine. To this end, we first analyzed the
physicochemical characteristics of brines from the regeneration of IX resins. Then, we critically
evaluated IX operational strategies that facilitate brine management, including resin selection,
contactor selection, operational modes, and regeneration strategies. Furthermore, we analyzed
IX brine management strategies, including brine reuse and brine disposal (without or with
treatment). Finally, a novel workflow for the IX water treatment plant design that integrates IX
operational strategies and IX brine management is proposed, thereby highlighting the areas that
make IX technology more sustainable for water treatment.
Keywords: Ion exchange resins; Water treatment; Waste management; Brine reuse; Brine
disposal; Sustainability
5.1 Introduction
Contaminants are removed by IX resins via two main mechanisms which are driven by the
functional groups of contaminants. Charged groups can be exchanged onto the IX functional
groups through electrostatic interactions whereas uncharged groups can be adsorbed onto resin
124
surface through Van der Waal force or hydrophobic interactions. For example, polyvalent metals,
such as calcium, magnesium, copper are mainly removed through ion exchange using cation
exchange (CIX) resins (Edzwald, 2010). While natural organic matter (NOM) and organic
micropollutants (e.g., polyperfluoroalkyl substances and microcystins) are removed through both
ion exchange and adsorption using anion exchange (AIX) resins (Liu et al., 2020; Dixit et al., 2021).
The use of IX resins for water treatment has numerous advantages over other treatment
technologies. First, the operation of IX resins is flexible in terms of application scale, allowing the
implantation of IX resins for both small-scale (e.g., household point-of-use) and large-scale (e.g.,
water treatment plants (WTP)) applications. Second, IX resins are simple to operate; they are
usually operated in fixed-bed contactors with a short empty bed contact time (EBCT) (e.g., 2-8
min). Third, some IX resins are reusable and can be regenerated on-site using typically a highly
concentrated NaCl brine (e.g., 8%-12% w/v) to recover the IX capacity (Edzwald, 2010). However,
as the majority of the regenerant ends up in the brine, the ion exchange brine (i.e., IX brine) is
composed of a high concentration of NaCl. The disposal of such brine is costly, and its direct
discharge to the environment adversely impacts ecosystems (Rokicki and Boyer, 2011; Ness and
Boyer, 2017). Consequently, the management of IX brine has become a bottleneck in the
application of IX resins for water treatment, with some WTP abandoning IX processes due to the
lack of a proper IX brine management scheme (Levchuk et al., 2018).
In contrast to other separation processes (e.g., membrane and distillation), where residual
management has been reviewed in detail in the last decade (Mezher et al., 2011; Pramanik et al.,
2017; Panagopoulos et al., 2019), no similar effort has been made to review IX processes, even
though a large number of studies have been devoted to overcoming barriers in IX brine
management. Therefore, the main objective of this review is to critically evaluate IX operational
strategies and IX brine management that can be used to limit the negative impacts imposed by IX
brine. To this end, first, we summarize the physicochemical characteristics and chemical
composition of IX brine generated from both CIX and AIX processes. Second, we assess IX
operational strategies and IX brine management reported in scientific literature. Finally, we
propose a novel workflow for an IX water treatment plant design that integrates IX operational
strategies and IX brine management.

125
5.2 Ion exchange brine characteristics
Table 5.1 summarizes the reported physicochemical characteristics and chemical composition of
IX brine following a single regeneration (i.e., without multiple brine reuse). Generally, IX brine
following a single regeneration has a neutral or slightly basic pH of 7-8 and a high electrical
conductivity (~100 mS/cm) because of the use of concentrated fresh brine (e.g., 35-150 g NaCl/L).
The chemical composition of IX brine varies widely owing to the diversity of factors coming into
play. First, the chemical composition of IX brine depends on the target contaminants removed
during the treatment cycle as well as the IX operational conditions (e.g., IX filter run time, type of
fresh brine, duration of rinsing cycle after regeneration). A longer run time accumulates more
contaminants, leading to a higher concentration in the IX brine. On the other hand, a longer
rinsing cycle post-regeneration can dilute the IX brine. Second, the physicochemical
characteristics of the feed water, as well as the upstream pretreatment, are expected to impact
the chemical composition of the brine. During the treatment cycle, both the target contaminants
and competing ions were removed. Accordingly, the IX brine is a mixture of brine, target
contaminants, competing ions, and other background ions present in the make-up water. Overall,
given the confounding factors contributing to the chemical composition, IX brine characteristics
should be studied on a case-by-case basis.
In addition to IX brine from a single regeneration, a number of studies have documented IX brine
characteristics following multiple brine reuses. As expected, contaminants and non-target ions
(e.g., sulfate and bicarbonate) accumulated as the number of reuse cycles increased. For example,
sulfate, bicarbonate, and nitrate were found to accumulate in the IX brine while using anion
exchange resins to remove nitrate (Bea et al., 2002) and arsenic (Clifford et al., 2003). However,
the concentrations of non-target ions tended to stabilize if no treatment was conducted during
reuse. Lehman et al. (2008) noted that sulfate and bicarbonate accumulated in the brine of AIX
(used to remove nitrate and perchlorate) until they reached stable concentrations after 13-15
cycles. Similarly, Duan et al. (2020) found that the loading of bicarbonate on the AIX resin (used
to remove nitrate) reached a stable condition after 10 cycles. Although Duan et al. (2020)
reported that no significant impact on the IX performance was observed for sulfate accumulation
in the brine, one should note that their conclusion was based on a short operation period (96 BV).

126
The accumulation of non-target anions, such as sulfate, can deteriorate the IX treatment
efficiency (especially for long-term operation) or shorten the service time of IX resins as
mentioned by Liu and Clifford (1996). Therefore, it is often recommended to apply treatment
strategies for IX brine prior to multiple reuses, a topic that will be discussed later in the present
review.
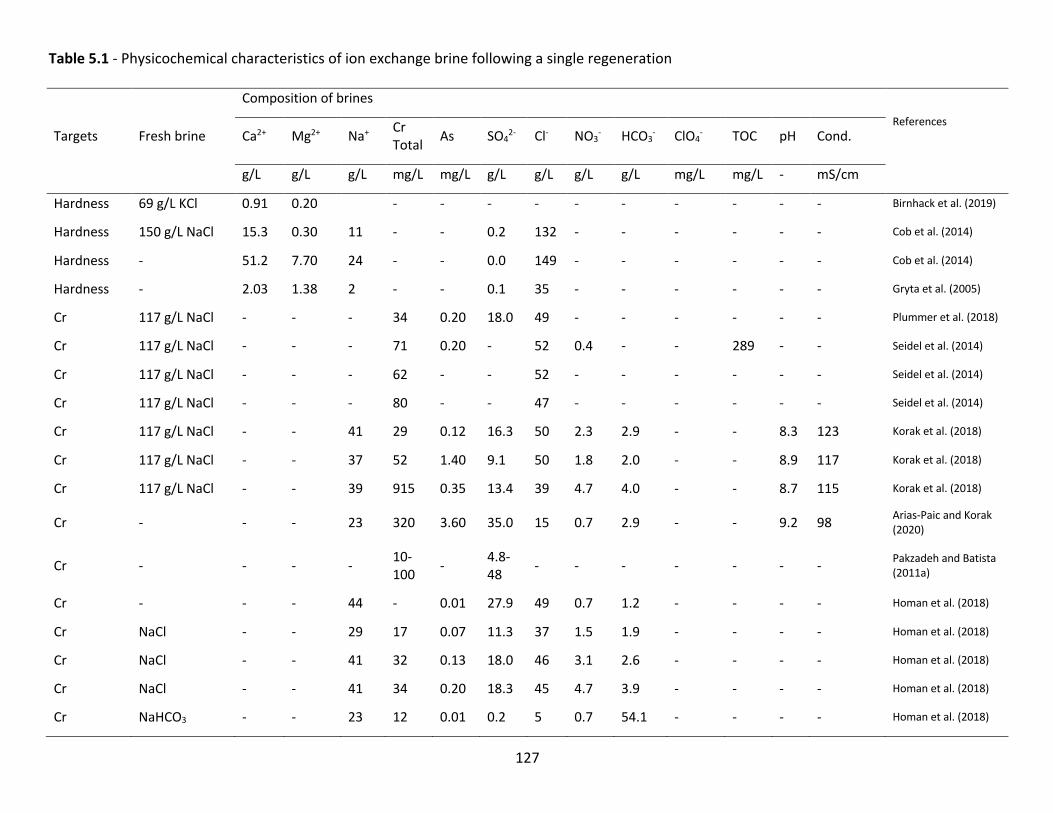
127
Table 5.1 - Physicochemical characteristics of ion exchange brine following a single regeneration
Targets Fresh brine
Composition of brines
References Ca2+ Mg2+ Na+ Cr
Total As SO42- Cl- NO3
- HCO3- ClO4
- TOC pH Cond.
g/L g/L g/L mg/L mg/L g/L g/L g/L g/L mg/L mg/L - mS/cm
Hardness 69 g/L KCl 0.91 0.20 - - - - - - - - - - Birnhack et al. (2019)
Hardness 150 g/L NaCl 15.3 0.30 11 - - 0.2 132 - - - - - - Cob et al. (2014)
Hardness - 51.2 7.70 24 - - 0.0 149 - - - - - - Cob et al. (2014)
Hardness - 2.03 1.38 2 - - 0.1 35 - - - - - - Gryta et al. (2005)
Cr 117 g/L NaCl - - - 34 0.20 18.0 49 - - - - - - Plummer et al. (2018)
Cr 117 g/L NaCl - - - 71 0.20 - 52 0.4 - - 289 - - Seidel et al. (2014)
Cr 117 g/L NaCl - - - 62 - - 52 - - - - - - Seidel et al. (2014)
Cr 117 g/L NaCl - - - 80 - - 47 - - - - - - Seidel et al. (2014)
Cr 117 g/L NaCl - - 41 29 0.12 16.3 50 2.3 2.9 - - 8.3 123 Korak et al. (2018)
Cr 117 g/L NaCl - - 37 52 1.40 9.1 50 1.8 2.0 - - 8.9 117 Korak et al. (2018)
Cr 117 g/L NaCl - - 39 915 0.35 13.4 39 4.7 4.0 - - 8.7 115 Korak et al. (2018)
Cr - - - 23 320 3.60 35.0 15 0.7 2.9 - - 9.2 98 Arias-Paic and Korak (2020)
Cr - - - - 10-100 - 4.8-
48 - - - - - - - Pakzadeh and Batista (2011a)
Cr - - - 44 - 0.01 27.9 49 0.7 1.2 - - - - Homan et al. (2018)
Cr NaCl - - 29 17 0.07 11.3 37 1.5 1.9 - - - - Homan et al. (2018)
Cr NaCl - - 41 32 0.13 18.0 46 3.1 2.6 - - - - Homan et al. (2018)
Cr NaCl - - 41 34 0.20 18.3 45 4.7 3.9 - - - - Homan et al. (2018)
Cr NaHCO3 - - 23 12 0.01 0.2 5 0.7 54.1 - - - - Homan et al. (2018)
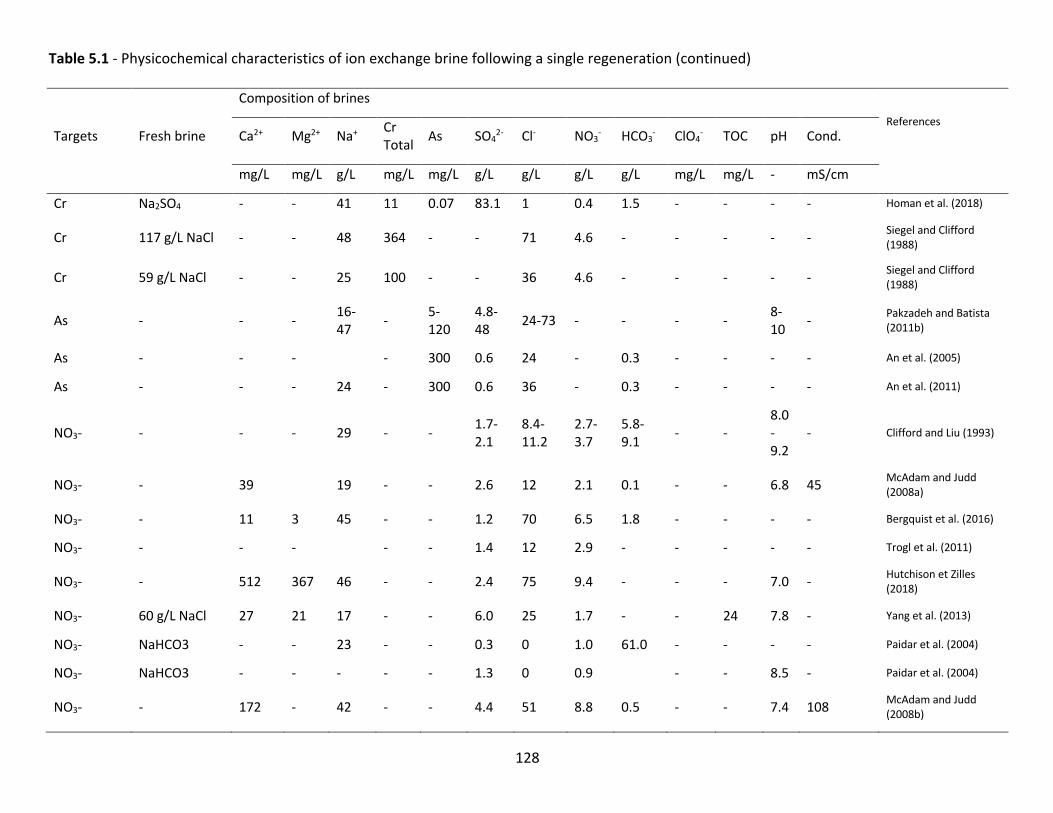
128
Table 5.1 - Physicochemical characteristics of ion exchange brine following a single regeneration (continued)
Targets Fresh brine
Composition of brines References
Ca2+ Mg2+ Na+ Cr Total As SO4
2- Cl- NO3- HCO3
- ClO4- TOC pH Cond.
mg/L mg/L g/L mg/L mg/L g/L g/L g/L g/L mg/L mg/L - mS/cm
Cr Na2SO4 - - 41 11 0.07 83.1 1 0.4 1.5 - - - - Homan et al. (2018)
Cr 117 g/L NaCl - - 48 364 - - 71 4.6 - - - - - Siegel and Clifford (1988)
Cr 59 g/L NaCl - - 25 100 - - 36 4.6 - - - - - Siegel and Clifford (1988)
As - - - 16-47 - 5-
120 4.8-48 24-73 - - - - 8-
10 - Pakzadeh and Batista (2011b)
As - - - - 300 0.6 24 - 0.3 - - - - An et al. (2005)
As - - - 24 - 300 0.6 36 - 0.3 - - - - An et al. (2011)
NO3- - - - 29 - - 1.7-2.1
8.4-11.2
2.7-3.7
5.8-9.1 - -
8.0-9.2
- Clifford and Liu (1993)
NO3- - 39 19 - - 2.6 12 2.1 0.1 - - 6.8 45 McAdam and Judd (2008a)
NO3- - 11 3 45 - - 1.2 70 6.5 1.8 - - - - Bergquist et al. (2016)
NO3- - - - - - 1.4 12 2.9 - - - - - Trogl et al. (2011)
NO3- - 512 367 46 - - 2.4 75 9.4 - - - 7.0 - Hutchison et Zilles (2018)
NO3- 60 g/L NaCl 27 21 17 - - 6.0 25 1.7 - - 24 7.8 - Yang et al. (2013)
NO3- NaHCO3 - - 23 - - 0.3 0 1.0 61.0 - - - - Paidar et al. (2004)
NO3- NaHCO3 - - - - - 1.3 0 0.9 - - 8.5 - Paidar et al. (2004)
NO3- - 172 - 42 - - 4.4 51 8.8 0.5 - - 7.4 108 McAdam and Judd (2008b)

129
Table 5.1 - Physicochemical characteristics of ion exchange brine following a single regeneration (continued)
Targets Fresh brine
Composition of brines
References Ca2+ Mg2+ Na+ Cr Total As SO4
2- Cl- NO3- HCO3
- ClO4- TOC pH Cond.
mg/L mg/L g/L mg/L mg/L g/L g/L g/L g/L mg/L mg/L - mS/cm
NO3- - - - 40 - - 9.0 46 10.0 11.0 - - 7.7 113 Arias-Paic and Korak (2020)
ClO4- 70 g/L NaCl 40 1 - - - 4.7 32 2.4 8.5 2.0 - 7.4 - Liu et al. (2013)
ClO4- - 22 3 - - - 1.6 1.6 - 3.5 - - 92 Hiremath et al. (2006)
ClO4- - - - 53-100 - - 0.6-6 0.4-
4.0 11.0 4.3 5-10 Hiremath et al. (2006)
COD 35 g/L NaCl - - 15 - - 7.5 13 0.3 7.1 - - - - Vaudevire et al. (2019)
Colorant - - - 20 - - 30 - - - 5000 - - Wadley et al. (1995)
NO3-/Hard. - 52 - - - - 5.7 43 15.1 1.2 - 7.4 125 McAdam and Judd (2008b)
*Cond.: Conductivity (mS/cm); TOC: total organic carbon; -: data not available.
130
5.3 Ion exchange operational strategies to facilitate brine management
5.3.1 Resin selection strategies
While the selection of resins first depends on the target contaminants and feed water
characteristics (e.g., pH and background ions), the properties of selected resins can impact brine
management for a given application. For example, strong basic anion exchange (SBA) resins are
usually regenerated with concentrated sodium chloride solution whereas weak basic anion
exchange (WBA) resins are mostly regenerated with caustic soda solution. The brine management
strategies for these two resins can be significantly different given the different brine corrosivity.
The resin backbone materials can also impact the regeneration strategy. For example, as
polystyrene resins are more hydrophobic than polyacrylic ones (Levchuk et al., 2018), they may
favor the uptake of a given contaminant but negatively impact regeneration efficacy. Therefore,
resin properties should be taken into account during the selection of resins to anticipate the best
brine management strategy. Generally, bench- or pilot-scale tests are often conducted to identify
the most efficient resin for a given application. Some commercial software can offer the
comparison of different resins, such as LewaPlusÒ (Lanxess), WAVE (Dupont), Resinex Design
Software (Jacobi) and PRSM™ (Purolite). The cost associated with IX brine management can be
significantly reduced by maximizing treatment efficiency and reducing regeneration frequency.
Therefore, selecting the most efficient IX resin for a given treatment objective can be the most
effective solution to reduce the management cost of IX brine (Plummer et al., 2018).
Furthermore, modifying the resin structure to reduce brine production is also of high interest and
has received attention from IX resin suppliers and researchers. For example, the Shallow Shell™
Technology (SST®), patented by Purolite, is an alternative CIX for conventional IX resins used in
water softening and demineralization. Briefly, unlike conventional strong acidic cation exchange
(SAC) resins, the SST® resin is produced with an inert center eliminating the IX sites that are slower
and more difficult to reach, more difficult to regenerate, and more likely to suffer from pore
plugging (Purolite, 2014). By doing so, the supplier states that regeneration of SST® resins requires
15% less salt and 50% less water for rinse and dilution (Purolite 2014). The city of Chilton

131
(Wisconsin, USA) renewed its softeners with SST® resin and found that the salt usage decreased
by approximately 32% and that the water consumption used for a regeneration cycle decreased
by 16% compared to conventional resins (WTP production capacity: 2600 m3/day) (Olsen, 2015).
Nonetheless, Olsen (2015) also noted that regeneration became more frequent because of the
reduced resin capacity, with an average of 2.9 times per day using SST® resins vs. 2.5 times per
day using conventional resins (an increase of 16%). More frequent regeneration may have an
impact on equipment costs as more softeners must be provisioned if they are more often off-
duty. In 2016, Arar (2016) reported that the performance was similar between conventional IX
resins and SST® resins for the removal of copper, but the SST® resins demonstrated a higher
regeneration efficiency than conventional resins (100% vs. 80% using 2 M H2SO4). Site-specific
validation is still required to compare the overall costs of operating SST® resins and conventional
resins for a given application.
The application of single-use resins is on the rise in the water treatment sector (especially for
PFAS and perchlorate removal) thanks to the simplified operation and maintenance and the
current limitations regarding the disposal of contaminated brine (Choe et al., 2013; Dixit et al.,
2020). The exhausted single-use resins are usually incinerated off-site, which eliminates the
generation of IX brine. A life cycle assessment study comparing the environmental impact of
regenerable IX vs single-use IX for perchlorate removal shows that the single-use resin is more
environmentally sustainable and more economic than regenerable IX (Choe et al., 2013).
Additionally, the authors also demonstrated that, for regenerable IX systems, the dominant
contribution to environmental impact comes from the salt used for regeneration (> 80%), and
strategies to treat and recycle the brine significantly reduce the environmental impact of
regenerable IX systems (Choe et al., 2013; Choe et al., 2015). Furthermore, given the fact that
resin manufacturing has been identified as an important contributor to the overall environmental
impact of IX systems according to life cycle assessment (Choe et al., 2013; Amini et al., 2015),
resin reuse should always be encouraged as long as the brine management scheme is more
sustainable than resin replacement. A thorough life cycle assessment needs to be conducted on
a case-by-case basis to compare the environmental impact of single-use resins and regenerable
resins given that the outcome is impacted by several input factors.

132
5.3.2 Resin contactor configuration
Fixed-bed contactors are by far the most common configuration for IX resins due to the simple
operation. Two variants of implementation are used in the industry: 1) Standard dual train
configuration where one IX contactor is on-line while a second contactor is standby or undergoing
regeneration; 2) Lead-lag configuration in which feed water passes through the first contactor
(i.e., lead contactor) and then the second contactor (i.e., lag contactor). The lead contactor is
taken offline for regeneration when the breakthrough occurs in the effluent. Following
regeneration, the lead-lag reactor configuration is inverted: the regenerated former lead
contactor returns to the service at the lag position and the former lag contactor becomes the new
lead contactor (Hosea et al., 1988). The lead-lag configuration can not only offer a higher removal
than standard dual train configuration but also maximize the IX operation capacity prior to
regeneration, an advantage that can benefit brine management by reducing regeneration
frequency.
Moving-bed contactors, on the other hand, offers a configuration where the resin is either
fluidized or moving inside the reactor. Such configurations have attracted attention over the last
decade due to their ability to remove NOM from turbid raw waters. Examples of these include
magnetic ion exchange (MIEX) (Slunjski et al., 2000), fluidized ion exchange (FIX) (Cornelissen et
al., 2009) and suspended ion exchange (SIX) (Metcalfe et al., 2015). A life cycle assessment study
comparing fixed-bed IX contactors and the MIEX process suggested that fixed-bed IX contactors
consume more salt and produce more brine than the MIEX process (Amini et al., 2015).
Nonetheless, the authors attributed this observation to the improper maintenance of resins for
the fixed-bed contactors. Further investigations are still required to systematically compare fixed-
bed contactors and moving-bed contactors in terms of brine management.
5.3.3 Novel ion exchange operational mode
A novel operational mode for AIX resins for NOM removal was first proposed by Schulz et al.
(2017). This strategy, referred to as biological ion exchange (BIEX), involves operating AIX resins
with infrequent regeneration to promote the microbial colonization of resins, thereby prolonging
IX service time through biodegradation (Schulz et al., 2017). In a pilot-scale study where the BIEX
133
filter had not been regenerated for 330 days, the BIEX filer achieved slightly lower dissolved
organic carbon (DOC) removal compared to its weekly regenerated counterpart (62% vs. 80%)
(Amini et al., 2018). NOM removal in the BIEX filter was attributed to a combination of ion
exchange, especially secondary ion exchange, where NOM exchanges with pre-retained sulfate
and biodegradation (Liu et al., 2020). Mass balance studies revealed that at most, 30% of NOM
removal was attributed to the biodegradation (Amini et al., 2018; Liu et al., 2020). Although
running IX resins in BIEX mode could significantly reduce brine production, one should note that
NOM removal is lower than the conventional mode (i.e., with regular regeneration). Therefore,
BIEX is only applicable when the reduced NOM removal performance still meets the treatment
objective. The regeneration frequency for a BIEX filter is site-specific and depends on the feed
water characteristics. For example, in a study by Amini et al. (2018), water treated with BIEX was
able to comply with the Québec trihalomethane (THM) standard (80 µg/L) for one month whereas
another pilot test carried out in the Middle River (BC, Canada) was able to operate with BIEX for
1 year without regeneration while meeting the THM standard (Zimmermann et al., 2020). Overall,
source waters with low sulfate concentrations (e.g., 3-5 mg/L) are ideal for the BIEX process.
5.3.4 Novel ion exchange regeneration strategies
5.3.4.1 Segmented regeneration
Segmented regeneration, patented by Ionex SG, is an alternative to conventional regeneration
aimed at eluting the contaminant loaded on IX resins in the smallest possible volume of IX brine.
This technique has been mainly applied to AIX resins for the removal of chromium and nitrate
(Plummer et al., 2018). Briefly, the segmented regeneration consists of 1) using a regenerant of
low concentration (e.g., 0.2 M NaCl) to first elute secondary ions (e.g., sulfate and bicarbonate)
and 2) using a regenerant at high concentrations (e.g., 2 M NaCl) to elute chromium or nitrate
from the IX resin (Waite, 2018). The low-concentration IX brine, that is, the brine containing non-
target ions, can be reused or even recycled to the head of the treatment train (Korak et al., 2017).
Regarding the high-concentration regeneration, a chromatographic peak of the contaminant is
eluted and therefore concentrated in a smaller volume of brine. Meanwhile, high-concentration
IX brine that contains little contaminant can be reused for the next cycles along with the rinsing

134
water (Plummer al., 2018). This strategy has already been applied to full-scale AIX systems in
California, and the volume of IX brine to be discharged was reduced by > 80% compared to a
conventional regeneration method (Plummer et al., 2018). However, prior to full-scale
application, this approach requires laboratory pretests on a case-by-case basis to investigate the
elution profile achieved during regeneration.
5.3.4.2 Alternative regenerants to NaCl
NaCl is by far the most common solution for regenerating IX resins because of the affordable and
chemically inert features of NaCl. However, given the stricter jurisdictions on wastewater
discharge and concerns over ecosystem impairment, many studies have pursued greener
alternatives to NaCl. It is worth noting that the trade-off between IX operation performance and
IX regeneration performance should be fully considered when selecting alternative regenerant. A
more selective regenerant (compared to NaCl) could offer a better contaminant elution during IX
regeneration, however, it could also lower the IX operation performance in the following cycles
due to the higher affinity to resins. Relative resin selectivity for ions can be found in de Dardel
and Arden (2008).
5.3.4.2.1 Alternative regenerants for cation exchange resins
Potassium salts (e.g., KCl) have been suggested for the regeneration of softeners as an alternative
to NaCl to regenerate CIX resins because of their 1) lower harmful impact on the environment; 2)
favorable increase of potassium in the human diet as opposed to sodium; 3) value for irrigation
and soil properties; and 4) excellent solubility in water (254 g KCl/L at 20 °C) (Birnack et al. 2019).
In 2014, Maul et al. (2014) evaluated the regeneration efficiency and the environmental impacts
of IX brine for four types of salt (NaCl, KCl, NaHCO3, KHCO3). They concluded that potassium salts
(KCl and KHCO3) have a higher efficiency than sodium salts for CIX regeneration, and the use of
KCl brine for irrigation could offset the demand for potassium-based fertilizers. However, the use
of KCl salt may increase the environmental burden compared to NaCl salt based on the study of
the life cycle assessment (Maul et al., 2014). In addition, the higher cost of KCl salts (3-5 times
more expensive than NaCl) still hinders its application, especially for large water utilities (Birnack
et al., 2019).

135
In 2016, Li et al. (2016a) proposed a softening process using CIX resins in aluminum (Al3+)-form
rather than sodium (Na+). Given that the precipitation of aluminum hydroxide occurs quickly in
water, using aluminum-form IX resins simultaneously removes hardness and alkalinity. The
mechanisms are expressed by equations (5.1-5.3).
2(# − %&!")!()!#*********************** + 3-.$# → 3(# − %&!")$-.$#*********************** + 2()!# (5.1)
2()!# + 61$& → 2()(&1)!(2) ↓ +61# (5.2)
61# + 61-&!" → 61$& + 6-&$(4) ↑ (5.3)
Although the use of aluminum-form resins for softening is counterintuitive because of the
trivalence of aluminum, Li et al. (2016) demonstrated that aluminum-form resins removed
hardness to a 20% lower effluent concentration than the resin in sodium form. In addition, unlike
regeneration with NaCl, where a high concentration must be used, a lower concentration (3% w/v
AlCl3) is sufficient for regeneration (quantity of Al required for regenerant: hardness to be
removed ≈ 1:1), demonstrating its advantage in IX brine management. Nevertheless, aluminum
hydroxide precipitation was observed on the surface of the resins both after exhaustion and after
regeneration with AlCl3, a phenomenon that may lower the resin performance for subsequent
cycles. Therefore, the viability of this solution for long-term operation has yet to be
demonstrated.
5.3.4.2.2 Alternative regenerants for anion exchange resins
The most studied alternative for AIX resins is sodium bicarbonate (NaHCO3) for two reasons: 1)
bicarbonate has a similar affinity to chloride on AIX resins (Rokicki and Boyer, 2011); and 2)
bicarbonate is less environmentally detrimental than chloride and can be discharged to the
environment or into the sewer (Jelinek et al., 2004). The performance of bicarbonate-form AIX
resins has been investigated for the removal of NOM in a lab-scale study (Walker and Boyer,
2011). The authors demonstrated that bicarbonate-form AIX had the same performance as
chloride-form AIX for NOM removal at the beginning of the test. However, because of the lower
regeneration efficiency of the bicarbonate solution, DOC removal by bicarbonate-form resins was
7%-18% lower than their chloride-form counterparts after 21 service cycles. Moreover,

136
bicarbonate-form AIX resins have also been evaluated for the removal of chromium (VI). Matosic
et al. (2000) reported that bicarbonate-form resins achieved a slightly lower removal of chromium
(VI) than their chloride-form counterparts, whereas Li et al. (2016b) reported a similar
performance between bicarbonate- and chloride-form resins for the same application propose.
Overall, the lower solubility of NaHCO3 in water (approximately 100 g/L vs. 360 g/L for NaCl at 25
°C) would limit the maximum concentration of regenerant that can be used, and the cost of
NaHCO3 salt is approximately 3 times more expensive than NaCl salt (based on the 2020 prices in
Montreal, Canada for an NSF-certified product). Therefore, the application of bicarbonate salt as
an alternative regenerant for AIX resins remains limited.
Two alternative regenerants have been proposed for the recovery of perchlorate from AIX resins.
Given that the high affinity of perchlorate for AIX resins makes it difficult to use NaCl as a
regenerant, Gu et al. (2001) proposed using tetrachloroferrate (FeCl4-) as an alternative and
achieved approximately 100% recovery with 5 L regenerant/L resin. Furthermore, Gutiettre et al.
(2008) suggested using iodide as an alternative to recover perchlorate from exhausted resins.
However, the management of such brine is difficult, not to mention the high cost of iodide salts
and the absence of NSF-certified products.
5.3.4.3 No-chemical-addition regeneration
Discovering the chemical-free regeneration technique has been a goal of IX research since the
initial discovery of this technology. Chemical-free regeneration eliminates the transport of
chemicals (i.e., salts). These methods can be divided into three groups based on their
mechanisms: biological, electrochemical, and thermal regeneration, which will be reviewed in
detail in the following sections.
5.3.4.3.1 Biological regeneration
With a biological approach, the regeneration of exhausted resins and the destruction of the
contaminant loaded on the resins occur simultaneously by directly contacting the spent resins
with an active biomass. To date, this method has been mostly evaluated for perchlorate- and
nitrate-laden IX resins, given that the target contaminant must be biodegradable. Wang et al.
(2008) were the first to present this idea with the aim of regenerating a resin loaded with
137
perchlorate and repeatedly regenerated resins loaded with perchlorate or nitrate. The
mechanism of biological regeneration consists of desorbing the perchlorate or nitrate from the
resin prior to biodegrading perchlorate to chloride and nitrate to N2 with an acclimated biomass
(Xiao et al., 2010; Ebrahimi and Roberts, 2013; Ebrahimi and Roberts, 2015; Sharbatmaleki et al.,
2015). Although biological regeneration is technically viable, the long regeneration time and the
need for washing procedures to remove biomass from the resin surface limit its full-scale
application (Venkatesen et al., 2010).
5.3.4.3.2 Electrochemical regeneration
Some studies have resorted to using electrodialysis with bipolar membranes (EDBM) to produce
acid or base solutions for the on-site regeneration of IX resins. This method was successfully
tested for CIX and AIX resins in full-scale applications. For example, Bolton (1992) investigated the
on-site generation of acids and bases via EDBM and then successfully applied the generated acid
and base into full-scale CIX and AIX contactors with efficiency similar to that of conventional
chemical regeneration. Similarly, Chen et al. (2016) used EDBM to generate HCl and NaOH from
a NaCl solution (100 mM), and then used the acid to regenerate weak acid cation (WAC) softeners
and the base was used to promote the crystallization of CaCO3 and Mg(OH)2. Consequently, Chen
et al., (2016) reported that the energy required to produce the acid and the base was an order of
magnitude lower than that required to purchase the chemical. Although chemicals (e.g., 100 mM
NaCl) are still needed in the process of EDBM, their usage can be significantly reduced compared
to conventional IX regeneration with a high concentration of NaCl. In addition, the on-site
production of regenerants could offer an advantage for remote communities, which would
otherwise depend on long-distance transportation of chemicals (Bolton, 1992). However, an
economic analysis comparing this method to conventional chemical regeneration is still needed
as the capital expenditure for implementing EDBM may prohibit the viability of this strategy.
Furthermore, Xing et al. (2007) evaluated electrodeionization (EDI) for in situ regeneration of
resins loaded with chromium (VI) and recovered it as chromic acid. Briefly, AIX resins first adsorb
chromium (VI) during the treatment cycle and after the saturation of chromium (VI) on the resin
phase, the electricity supply is triggered in the IX chamber to regenerate resins through water
138
electrolysis (with OH-). In their work, the regeneration cycle was maintained for 24 h using a
current of 0.25 A. Approximately 93% of the IX capacity was recovered, an efficiency similar to
chemical regeneration. Later, Su et al. (2013, 2014) developed a novel process based on the
principle of EDI but without the use of ion exchange membranes and referred to it as membrane-
free electrodeionization. This process produces high-purity water and consists of (i) a service cycle
where mixed-bed resins (i.e., CIX and AIX) remove impurities from water and (ii) a regeneration
cycle where resins are regenerated by H+ and OH- generated through water electrolysis. However,
membrane-free electrodeionization has mainly been studied for the production of high purity
water and has been only tested with synthetic water of high quality (10-70 μS/cm in conductivity,
e.g., osmosis permeate) (Shen et al., 2014; Hu et al., 2015; Hu et al., 2016). Therefore, the
feasibility and stability of this process for municipal and industrial feed remain uncertain.
5.3.4.3.3 Thermal regeneration
With thermal methods, resins are regenerated at high temperatures using hot water
(approximately 80 °C) (Bolto et al., 1978). This process was first applied to a mixed bed of weak
base anion exchange (WBA) and weak acid cation (WAC) exchange resins (Battaerd et al., 1973).
Later, a novel resin material that simultaneously incorporated the functional groups of WBA and
WAC resins (i.e., Sirotherm resin) was developed (Bolto and Jackson, 1983). The Sirotherm resin
is thermally regenerable, which means that the resin is capable of eliminating ions in an aqueous
solution at room temperature and then desorbing ions at high temperatures due to unfavorable
thermodynamics (Bolto and Jackson, 1983). However, this process failed during trials at the
industrial scale and research on this subject was suspended (CSIROpedia, 2014). In 2009, a new
thermally regenerable resin crosslinked with polyacrylic acid and ethoxylated polyethyleneimine
was synthesized (Chanda et al., 2009). This resin was successfully tested for 10 cycles for the
desalination of brackish water (Chanda et al., 2010). However, the results showed that the IX
capacity decreased by a factor of 8 when the temperature increased from 30 °C to 80 °C (Chanda
et al., 2010), suggesting that the resin can only be partially regenerated. To improve the efficiency
of thermal regeneration, Chandrasekara and Pashley (2015) used ammonium bicarbonate to
regenerate the Sirotherm resin and demonstrated the feasibility of thermally recycling
ammonium bicarbonate during regeneration. Briefly, exhausted resins were soaked in

139
ammonium bicarbonate solution (2 M) at 20 °C for 15 h, and then the resins were heated to 80
°C for 1 h to decompose ammonium bicarbonate while returning the resins to their initial form
(i.e., tertiary amine and carboxylic acid). Carbon dioxide and ammonia gases were recovered and
used for subsequent regeneration. However, this process is still in the development phase, and a
full-scale demonstration is needed to prove its feasibility for carbon dioxide and ammonia gas
recovery. Overall, thermal regeneration requires further development.
5.4 Ion exchange brine management
5.4.1 Ion exchange brine reuse
IX brine can potentially be reused as a regenerant because of its high salt content. Reusing brine
for IX regeneration allows for the direct reduction of salt usage and water consumption (Verdickt
et al., 2011; Flodman and Dvorak, 2012). Therefore, given the great economic and environmental
benefits of reuse, one should always consider IX brine reuse when designing the IX brine
management scheme. However, it is also worth noting that a loss of treatment performance may
occur if the recycled regenerant is of low quality. A reduction in treatment efficiency may lead to
an increase in the regeneration frequency, which could completely or partially offset the benefits
of reuse. Salt makeup and/or pH adjustment may be required before the direct reuse of the IX
brine. In cases where direct reuse is not feasible, pretreatment strategies may have to be
considered prior to brine reuse. In this section, we summarize past studies on direct IX brine reuse
(with or without NaCl addition) and treatment strategies for the reuse of IX brine.
5.4.1.1 Direct reuse
The IX brine can sometimes be reused directly without any makeup with fresh salts. Clifford et al.
(2003) investigated the direct reuse of NaCl brine (117 g/L) for the regeneration of arsenic-laden
AIX resins, and the IX brine was successfully reused for six times without any efficiency decline.
Similarly, Medina et al. (2018) evaluated the direct reuse of IX brine for the regeneration of NOM-
laden AIX resins with a saturated regenerant (360 g/L NaCl), and successfully reused the brine for
three times with little impact on IX performance. Duan et al. (2020) reused the IX brine to
regenerate nitrate-laden AIX resins for 23 times, however they reported that the nitrate removal

140
efficiency gradually decreased from 100% to 38%. Overall, direct reuse of IX brine without any
chemical makeup is feasible, but the number of reuses needs to be defined on a case-by-case
basis.
Make-up with salt (e.g., NaCl) and/or pH adjustment (e.g., with NaOH) are common practices to
improve regeneration efficiency during the direct reuse of brine. Clifford et al. (2003) successfully
reused IX brine to regenerate arsenic-laden AIX resins for 14 cycles with salt compensation of 58.5
g NaCl/L before each reuse. For the same application purpose, An et al. (2005) achieved 7 cycles
of reuse with stable arsenic recovery (> 95 %) with pH adjustment to 9.2-10 before each reuse.
Kim and Symons (1991) reported that the total organic carbon (TOC) in the treated effluent
remained stable for nine operation cycles when reusing IX brine with readjustment each time to
2 M NaCl and 1.5 M NaOH. However, during direct brine reuse to regenerate AIX resins charged
with chromium, Plummer et al. (2018) noted that the resins were not fully regenerated in the
second reuse cycle, even though they compensated the brine to 117 g NaCl/L. Foldman and
Dvorak (2012) investigated the reuse of IX brine for softener regeneration with compensation of
saturated NaCl solution (360 g/L) and concluded that the benefits of reuse came at the cost of
reduced performance for the system. Accordingly, the feasibility of reuse must be investigated
on a case-by-case basis, as its success depends on initial regenerant concentration, operational
mode, raw water characteristics, and target contaminants.
5.4.1.2 Treatment strategies for reuse
In cases where direct reuse of IX brine is not feasible, some studies have sought to verify whether
treatment strategies would allow the reuse of IX brine. The objectives of brine treatment are to:
1) remove impurities (e.g., contaminants or non-target ions) from IX brine to improve brine reuse
efficacy; or 2) recover valuable resources (e.g., NaCl, CaCl2 and MgCl2) from IX brine for reuse or
resell. Substantial research has been devoted to the development of eco-efficient treatment
strategies for IX brine. These strategies are grouped and critically reviewed in the following
subsections based on the target contaminants.

141
5.4.1.2.1 Treatment strategies for hardness-laden brine
Taking advantage of reverse osmosis (RO) brine. To remove hardness from CIX brine, Cob et al.
(2014) combined RO brine (loaded with sodium and bicarbonate) with hardness-laden IX brine.
The authors demonstrated that more than 99% of CaCO3 was precipitated with a pH adjustment
to 11, and the remaining IX brine (loaded with sodium chloride) could be reused for the
regeneration of CIX resins. Furthermore, Vanoppen et al. (2016) demonstrated the possibility of
directly using an RO brine to regenerate a CIX filter with minor addition of NaCl (2.5 g/L). However,
despite being economical, this method is only suitable for situations where CIX and RO systems
simultaneously exist in the treatment process, such as at a seawater desalination plant where CIX
is implemented prior to RO to remove hardness.
Resource recovery by hybrid processes. Numerous treatment strategies have sought to recover
valuable resources from hardness-laden IX brine. Birnhack et al. (2019) successfully applied a
hybrid process consisting of nanofiltration (NF), dia-NF, and RO to recover potassium salt from a
KCl brine. Gryta et al. (2005) investigated the use of membrane distillation (MD) to recover NaCl
from brine, however they found that MD performance was deteriorated due to fouling (e.g., Ca,
Mg, and Si) and the separation of NaCl from the salt mixture was a challenge. Micari et al., (2019a)
successfully extracted a pure NaCl solution from the softener brine using a treatment train of NF,
crystallization, and multi-effect distillation (MED). A techno-economic assessment was conducted
for the treatment train (Micari et al., 2019a), as well as the MED process (Micari et al., 2019b).
The authors reported that: 1) the lowest treatment cost of 4.9 USD/m3 brine could be achieved
with an NF recovery rate of 25%; 2) the evaporator is the most important contributor to the
process operating cost (30% of total cost); and 3) plane multi-effect distillation (MED without the
use of a thermo-compressor) supplied with recycled heat at a pressure of 1 bar was the most
economical way to operate the evaporator. Furthermore, eutectic crystallization has been
proposed as an alternative to evaporative crystallization for salt recovery from IX brine because
it consumes 6-7 times less energy than evaporative crystallization (Van der Ham et al., 1998, Lewis
et al., 2010, Fernandez-Torres et al., 2012). In a laboratory-scale study, Cob et al. (2014)
investigated the use of eutectic crystallization to treat softener brine. The authors were able to
obtain ice and NaCl crystals by lowering the temperature to -29.4 °C. Additionally, the authors

142
concluded that a powerful scraping system was needed to avoid scaling caused by ice. More
recently, a feasibility study was conducted by Ahmad et al. (2017) to investigate the potential of
eutectic crystallization for the treatment of softener brine. The authors reported that the
presence of impurities (e.g., Ca and Mg) lowered the eutectic temperature for NaCl crystallization
but reduced scaling in the reactor, which improved the efficiency of energy transfer. From an
economic point of view, they concluded that eutectic crystallization led to a similar cost compared
to evaporative crystallization due to its high capitalization costs.
5.4.1.2.2 Treatment strategies for arsenic-laden brine
Coagulation and adsorption. Coagulation is a viable approach for removing arsenic from IX brine.
Clifford et al. (2003) successfully used FeCl3 to remove arsenic (As) from IX brine, and the authors
reported that arsenic removal depends on the initial arsenic concentration, pH of the brine, and
Fe/As ratio applied. An et al. (2005) also used FeCl3 to remove arsenic from IX brine, and the
treated brine was reused for regeneration without any decline in the performance of IX. Pakzadeh
and Batista (2011b) simulated the arsenic removal process in IX brine using a surface
complexation model and found that alkalinity and ionic strength are expected to affect the
efficiency of FeCl3. In addition to coagulation, An et al. (2011) developed starch-bridged magnetite
nanoparticles to adsorb arsenic from the brine. The authors concluded that arsenic was fully
eliminated under optimal conditions (Fe/As ratio = 7.6, contact time = 1 h). Nevertheless, the
method was only demonstrated with a synthetic brine (300 mg/L As with 6% NaCl w/w); its
performance using a real IX brine and the cost of application at an industrial scale remains
unknown.
5.4.1.2.3 Treatment strategies for chrome-laden brine
Reduction-coagulation-filtration. Regarding the treatment of chromium (VI) loaded with IX brine,
a reduction-coagulation-filtration process is widely used with many reactants that have been
evaluated for such applications, including sulfite in acidic conditions (Siegel and Clifford, 1988),
ferrous iron (Siegel and Clifford, 1988; Li et al., 2016b; Homan et al., 2018; Plummer et al., 2018),
hydrazine (Siegel and Clifford, 1988), polysulfides (Pakzadeh and Batista, 2011a; Plummer et al.,
2018), bisulfite, and stannous sulfide (Plummer et al., 2018). Among them, ferrous iron has been
143
shown to be the most cost-effective (Siegel and Clifford, 1988; Plummer et al., 2018), though it
does not work in a bicarbonate brine (Homan et al., 2018).
5.4.1.2.4 Treatment strategies for NOM-laden brine
Coagulation and adsorption. Coagulation has been proven to be an efficient method for
removing NOM from IX brine. For example, Verdickt et al. (2011) used FeCl3 and post-filtration to
purify the brine before reuse. Subsequent to the adjustment of conductivity and pH (i.e., adding
NaCl/NaOH), the recycled brine was successfully reused 14 times with little impact on the IX
performance. Similarly, Medina et al. (2018) investigated the use of alum as a coagulant for NOM
removal in the brine. Although the treatment enabled three reuse cycles, the authors observed
that the regeneration efficiency was lower than that of brine direct reuse because of the
introduction of sulfate ions (from alum), which are strong competitors to NOM on IX resins.
Instead of using coagulants, Zhang et al. (2019) proposed using powdered activated carbon (PAC,
5 g/L) to adsorb dissolved organic matter (DOM) in IX brine after every 6-7 service cycles. The
treatment allowed a DOM removal of approximately 80% in the brine, and the brine was
successfully reused for 50 service cycles. However, the PAC must be filtered out from the solution
prior to reusing the treated brine, which makes this option more complex. Overall, the practice
of coagulation or PAC adsorption is feasible for IX brine laden with NOM, but the requirement of
post-filtration, the concern over other inorganic ion accumulation in the brine (e.g., sulfate), and
the disposal of sludge (or saturated media) still need careful consideration.
Resource recovery by thermal and/or electrodialysis processes. Numerous studies have sought
to recover NOM and/or salt from IX brine for reuse. Vaudevire et al. (2013) evaluated the dynamic
vapor recompression (DVR) process to recover salts from NF-concentrated IX brine. The authors
reported the co-precipitation of NaCl, Na2CO3, and Na2SO4 when the concentration factor
exceeded 10. However, the authors also noted that it was impossible to separate NaCl from the
salt mixture. Kabsch-Korbutowicz et al. (2011) first demonstrated the feasibility of using
electrodialysis (ED) to recover NaCl from a synthetic IX brine, although a fraction of NOM was
shown to pass through the IX membrane and contaminate the recycled NaCl solution. Vaudevire
et al. (2019) demonstrated a two-step ED process to recover NOM and NaCl solutions: the first
144
stage consisted of recovering NaCl using a selective monovalent AIX membrane, while the second
stage consisted of separating multivalent anions from the solution loaded with NOM by a
standard IX membrane. Haddad et al. (2019) compared the performance of conventional and
selective monovalent IX ED membranes. The results showed that selective monovalent IX
membranes could recover NaCl of high purity with an energy requirement of approximately 2
kWh/kg NaCl. In addition, the authors also tested the use of a pulsed electric field to intensify the
separation and reduce membrane fouling, but the benefit was only noted for the conventional IX
membrane. More recently, Haddad et al. (2021) combined ED with membrane distillation (MD),
and they demonstrated that MD was a viable option to concentrate the purified NaCl produced
by ED. Overall, ED is a promising technique for NOM-laden brine treatment, but its application is
currently hindered by the capitalization costs of the equipment and the fact that the treated brine
still requires a post-concentration step to raise the concentration of NaCl to the required level for
the regeneration (i.e., 8%-12%w/w).
Resource recovery by membranes processes. Numerous studies have sought to use membrane
processes to recover resources from NOM-laden IX brine. Wadley et al. (1995) successfully
applied NF to recover NaCl from an IX brine generated from a decolorization process. Kabsch-
Korbutowicz et al. (2011) evaluated six ultrafiltration membranes (UF) and two NF membranes to
recover NaCl from a NOM-laden brine, and the results demonstrated that tight UF (5 kDa) and NF
were capable of providing a permeate (i.e., NaCl solution) of satisfactory quality; however, NOM
fouling was an important issue because the high salinity imposed an extremely high operating
pressure (120 bar). More recently, Caltran et al. (2020) demonstrated that ceramic NF yielded
less fouling than polymeric NF during the separation of NOM from IX brine. However, the poor
rejection of sulfate, especially at high ionic strength, is problematic, given that sulfate may lower
the performance of AIX during the following service cycles. Overall, using membrane processes
to recover salt and NOM from IX brine is a promising process and deserves further study.
5.4.1.2.5 Treatment strategies for trace organic pollutants-laden brine
Electrochemical processes. Few studies have investigated the treatment strategies for PFAS in IX
brine. Schaefer et al. (2020) reported that PFAS-laden IX brine is amenable to electrochemical

145
treatment using boron-doped diamond anodes, but the treatment performance depends on the
fresh regenerant type. Chloride regenerant inhibits the electrochemical treatment of PFAS, as
chloride will also be oxidized at the anodes to perchlorate. Singh et al. (2020) successfully
degraded PFAS-precursors and long- and short-chain PFASs from IX brine using a sequential
plasma reactor, indicating that plasma treatment is promising for PFAS treatment from IX brine.
Resource recovery. Organic solvents, such as methanol and ethanol, can be used to regenerate
PFAS-laden resins with or without the addition of inorganic salts (Dixit et al., 2021). The organic
solvent can be recovered by distillation and reused for the next regeneration cycle (Singh et al.,
2020). One should note that such a strategy is only applicable for industrial applications where
the presence of a solvent residue in treated water is not causing any health concern. Furthermore,
the feasibility and sustainability of this strategy also remain to be evaluated at full-scale.
5.4.1.2.6 Treatment strategies for nitrate- and perchlorate-laden brine
The treatment strategies for nitrate and perchlorate are similar, that is, the contaminants are
chemically or biologically reduced to reduced forms so that the brine can be reused for the
following cycles.
Catalytic reduction. Catalytic reduction is a technique that has received considerable attention
for this subject. Pintar et al. (2001) first developed a catalyst (Pd-Cu/γ-Al2O3) that successfully
treated a nitrate-loaded brine using H2 as an electron donor. In their subsequent study (Pintar
and Batista, 2006), they modified the process into a two-stage treatment where the first stage
was dedicated to the reduction of nitrate to nitrite with the help of Pd-Cu/γ-Al2O3 and the second
stage reduced nitrite to nitrogen gas using the monometallic catalyst Pd/γ-Al2O3. This process
reduced the production of ammonium compared to the prior designs. Similarly, Liu et al. (2013)
proposed a two-step process to treat an IX brine loaded with nitrate and perchlorate; nitrate was
reduced to nitrogen gas in the first stage, while perchlorate was reduced to chloride using a Re-
Pd/C catalyst. More recently, another catalyst has been successfully developed by synthesizing
palladium and indium on activated carbon (Pd-In/C) to reduce nitrate in IX brine (Choe et al.,
2015). Meanwhile, numerous reactor configurations have been proposed to increase the stability
and the performance of catalytic reduction, such as batch reactors (Choe et al., 2015), fixed-bed

146
column reactors (Choe et al., 2015; Bergquist et al., 2016), and trickle bed reactors (Bergquist et
al., 2017). In addition, Yang et al. (2013) investigated the feasibility of photocatalytic reduction
using TiO2 as a catalyst and formic acid as an electron donor for the treatment of nitrate in IX
brine. They observed that the presence of sulfate in the brine is the dominant factor preventing
the treatment, that is, there exists a competition between sulfate and nitrate on TiO2 sites.
Overall, despite being feasible, catalytic reduction is usually complicated to operate and a long-
term techno-economic analysis of these processes is still lacking.
Zero-valent iron nanoparticles. Zero-valent iron nanoparticles (Fe0) are capable of reducing
nitrate (Choe et al., 2000) and perchlorate (Moore et al., 2003) to their reduced forms. However,
the small size of the nanoparticles (1-100 nm) promoted their agglomeration and thus reduced
their reactivity. To resolve this problem, He and Zhao (2005) and He et al. (2007) proposed
modifying the nanoparticles using soluble starch or carboxymethyl sodium cellulose (CMC) as
stabilizers. These stabilizers can increase the specific surface area, physical stability, and the
reaction kinetics of Fe0 nanoparticles. In subsequent studies, researchers demonstrated the
feasibility of using stabilized Fe0 to degrade nitrate (Xiong et al., 2007) and perchlorate (Xiong et
al., 2009) in an IX brine, even though the reaction rates were limited when the NaCl concentration
exceeded 60 g/L. Further studies are needed to resolve the complex issue of the recovery and the
disposal of nanoparticles before real application.
Electrolysis. Some studies have assessed electrolysis as an alternative to remove nitrate from IX
brine. Paidar et al. (2004) developed an electrolysis reactor where a simulated bicarbonate brine
was circulated in inert media with titanium (Ti) as the anode and copper (Cu) as the cathode.
Subsequent to the reduction of nitrate to ammonium and oxygen at the cathode (Cu), the treated
brine was successfully reused for the regeneration of IX resins. In another study, Dortsiou et al.
(2009) compared tin (Sn) and bismuth (Bi) as cathodes for the electrolysis treatment of a
simulated bicarbonate brine while using platinum anode in both cases. The authors reported that
the type of cathode electrode had an impact on the final reduction products for nitrate. The final
reduction products of nitrate were mostly nitrogen gas (47%) and nitrous oxide (41%) when Sn
was used as the cathode. While, only 28% of nitrogen gas and 39 % ammonium was produced
147
when Bi was used as the cathode. More recently, Duan et al. (2020) used an electrolysis system
to treat chloride brine using iron (Fe) as cathode and IrO2-RuO2/Ti as anode. They found that
ammonium generated by the reduction of nitrate was oxidized to nitrogen gas due to the
presence of chlorine (i.e., breakpoint chlorination), a by-product generated during the electrolysis
of chloride at the anode. Overall, electrolysis is an appealing technology for the treatment of
nitrate-laden IX brine. Future investigations should assess the scale-up cost and the sustainability
of this method for brine treatment.
Biodegradation. Biodegradation allows the removal of nitrate (van der Hoek and Klapwijk, 1989)
and perchlorate (Logan et al., 2001) from IX brine. The greatest challenge of this method is related
to the high salinity of the brine, which inhibits bacterial growth. To solve this problem, halophilic
bacterial communities have been isolated from various high-salinity environments, such as
seawater, marine sediments, salt marshes, and biofilm/sludge from a seawater filter (Logan et al.,
2001; Okeke et al., 2002; Cang et al., 2004). These strains were then enriched in the laboratory
and acclimated to the brine environment. Given that biodegradation is a redox process, some
reactions may benefit from the addition of an electron donor, such as methanol (Clifford and Liu,
1993), ethanol (McAdam et al., 2010), acetate (Lehman et al., 2008), lactate, and glycerol (Peyton
et al., 2001), of which the treatment efficiency depends on the pH and salinity. The addition of
these electron donors complicates the reuse of brine for drinking water applications due to carry-
over concerns. Several reactor configurations have been tested with varying degrees of success
for the treatment of nitrate, perchlorate, or the simultaneous removal of these two substances,
such as an upflow sludge blanket (Van der Hoek and Klapwijk, 1989), a sequential batch reactor
(Clifford and Liu, 1993; Lehman et al., 2008), a fluidized bed reactor (Patel et al., 2008; Xiao et al.,
2010), a membrane bioreactor (McAdam and Judd, 2008; McAdam et al., 2010), and a membrane
biofilm reactor with H2 as the electron donor (Chung et al., 2007; Sahu et al., 2009). To optimize
biological treatment, Lin et al. (2007) reported that the addition of divalent cations (Ca2+, Mg2+)
stabilizes the bacterial culture and promotes perchlorate biodegradation. Li et al. (2015)
suggested using a mixture of bicarbonate and chloride regenerants to increase the alkalinity of
the brine, which would stabilize the denitrification process. Two groups of investigators also
demonstrated the possibility of encapsulating bacteria (Trogl et al., 2011) or enzymes (Hutchison
148
et al., 2013) to protect them from high salinity while allowing the degradation of nitrate and
perchlorate in the brine. So far, these methods have only been demonstrated at the lab scale.
Overall, biodegradation is a promising process for the treatment of nitrate and/or perchlorate-
laden IX brine.
Hybrid processes. Finally, hybrid processes were tested to remove nitrate and other impurities
to improve the regeneration efficiency of the recycled brine. Bae et al. (2002) tested a treatment
system consisting of biological denitrification, biological reduction of sulfate, sand filtration, and
granular activated carbon (GAC) filtration; the brine was reused for 24 times with a performance
comparable to that of the fresh brine. Later, the authors suggested using precipitation and
coagulation (with BaCl2 and FeCl3) to replace the biological sulfate reduction process (Bae et al.,
2004), and the brine was reused for 11 times with success. Klas et al. (2015) applied a sequential
batch denitrification bioreactor followed by ozonation for suspended solids and DOC removal.
The system operated reliably for over a year and achieved steady performance.
Resource recovery. Few studies have investigated the feasibility of resource recovery from
nitrate- and perchlorate-laden IX brine. Vaudevire et al. (2013) investigated the use of dynamic
vapor recompression (DVR) to recover salts from denitrified IX brine but failed to separate NaCl
from the salt mixture. Huo et al. (2020) successfully used a hybrid hydrogenation/MD process to
treat an IX brine containing a high concentration of nitrate. Briefly, nitrate was first reduced to
ammonia in the presence of a low-cost catalyst (Ru/C), and the ammonia was then recovered by
MD as (NH4)2SO4, which is a valuable commercial fertilizer.
5.4.2 Ion exchange brine disposal
Although brine reuse is beneficial for IX brine management, brine disposal is still a common
management solution, especially for the cases where: 1) IX brine reuse is neither possible or
economically viable (e.g., small-scale communities) or 2) recycled brine reaches its end of life and
the disposal of such brine is inevitable. The choice of disposal strategy is site-specific, depending
on costs, volume of brine, level of treatment required before release, physicochemical
characteristics of brine, local hydrogeological conditions, public acceptability, and local
regulations (Jensen and Darby, 2016).

149
5.4.2.1 Direct disposal
Direct disposal to a nearby surface water body is a simple and economical measure. However,
this option can only be considered when no harmful contaminants are present in the brine (e.g.,
arsenic-laden brine). Mitigation measures should be considered before disposal, such as the use
of diffusers, mixing systems, or mixing zones to dilute the brine, so that the discharge of brine
may conform to local discharge criteria (e.g., for chloride).
On-site evaporation ponds are a suitable alternative for the disposal of IX brine. Briefly, when the
water evaporates due to solar heat and the wind effect in the pond, the solutes in the brine
precipitate at the bottom of the pond and this precipitate (i.e., saline sludge) must be periodically
recovered and transported elsewhere (e.g., landfill). An improved design, namely the salinity
gradient solar pond, has been proposed (Tinos and Culligan, 2012) for the disposal of desalination
brine; however, the feasibility of IX brine still needs investigation. In all cases, building a pond is
affordable (when the land is available), and the operation requires little maintenance. Jensen and
Darby (2016) demonstrated that the on-site evaporation ponds are the cheapest solution in
California among the four strategies studied when the system capacity is greater than 8 m3/h (35
GPM). However, it should be noted that this technique is only suitable for arid or semi-arid regions
where local climatic conditions are favorable (e.g., low humidity and high rate of evaporation).
A popular alternative is to discharge the IX brine into sewerage systems. This is particularly
feasible for small water treatment facilities. However, brine dilution and pH adjustment are
usually necessary prior to discharge to minimize the harmful impacts on water pipes, as well as
on the biological processes used by wastewater treatment plants (Rokicki and Boyer, 2011; Liu et
al., 2013). For remote areas where sewer systems are not available, transportation of IX brine to
the wastewater treatment plant can be an economical option. Jensen and Darby (2016) reported
that transportation to a coastal wastewater treatment plant is the cheapest option when the
water treatment plant has a design capacity lower than 8 m3/h (35 GPM).
Injecting IX brine into deep aquifers (500-1500 m) isolated from freshwater aquifers is suitable
for inland sites. However, the use of this measure strongly depends on the local geological
conditions (e.g., the existence of a confined aquifer, the transmissivity of the soil), brine

150
characteristics, and public perception (Jensen and Darby, 2016), as well as having high costs and
potential risk of groundwater contamination. Therefore, this option is hardly realistic for small
systems, and this measure is an alternative for large systems when other solutions are not
available. Finally, land application in agricultural fields, parks, or golf courses is a potential option
to dispose of IX brine, especially when the brine contains beneficial nutrients, such as potassium,
NOM, and nitrate. However, dilution with fresh water is certainly necessary prior to land
application to mitigate the detrimental impact arising from high salt concentrations, making this
solution less attractive compared to other methods.
Overall, although direct disposal methods are simple to put in place, the adverse impacts of the
high salinity and harmful contaminants on the aquatic ecosystem should be fully considered
before disposal. Treatment strategies and/or dilution strategies should be considered before
disposal to lower the potential negative impacts on ecosystems.
5.4.2.2 Treatment strategies for disposal
Fewer treatment strategies have been tested for direct disposal compared to reuse. Most studies
have been devoted to reducing the volume of IX brine to favor the transportation. To begin with,
NF processes have been sought to reduce the brine volume, and numerous studies have
demonstrated that NF can reduce the brine volume by up to 85%-90% prior to its disposal
depending on the operating conditions (Schippers et al., 2004; Cartier et al., 1997; Salehi et al.,
2011; Korak et al., 2018). However, membrane fouling remains an important challenge for NF
processes. To alleviate this issue, Leong et al. (2016) successfully coupled NF with a vibratory
shear system to reduce the deposition of solutes on the surface of the membrane. Furthermore,
Ghasemipanah (2013) successfully used RO to recover water from IX brine for irrigation purposes
while reducing the brine volume. Arias-Paic and Korak (2020) proposed using forward osmosis
(FO) as an alternative to RO and NF to concentrate the brine prior to disposal. Briefly, as the
presence of a salt saturator in IX plants offers a source of chemical potential for FO, IX brine can
be concentrated by the saturated salt solution. Consequently, the authors reported that FO could
reduce the brine volume by 65%-85%. In addition to membrane processes, evaporation
crystallization can be used to further concentrate the brine, demonstrating the possibility of zero-
liquid-discharge for IX brine management (Vaudevire et al., 2013).

151
5.5 Discussion and Conclusions Ion exchange (IX) with synthetic resins is a flexible, simple-to-operate, and cost-efficient
technology that can cope with a wide range of contaminants. However, IX brine arising from the
regeneration of IX resins is still a limiting factor, and the management of such by-products has
become a real bottleneck for the application of IX resins in the water treatment sector. Currently,
IX plant designs mainly consist of operational parameter calculations (e.g., flow rate, bed volume,
and running time), and a proper brine management strategy is often overlooked during the IX
plant design phase. Consequently, it is of paramount importance to integrate IX operational
strategies as well as brine management schemes in IX plant design to make the process more
sustainable.
Although it is easy to design an IX system based on the source water characteristics, defining an
optimal IX brine strategy requires treatability or pilot studies, a cost that is too often difficult to
justify for small projects. In our opinion, it would be desirable for legislators to force designers to
address the issue of IX brine management. Many solutions reviewed (e.g., switching from NaCl to
NaHCO3) involve higher operating costs but had much lower potential environmental impacts,
but it is doubtful that the industry will adopt greener alternatives unless it is required by
regulation or otherwise promoted.
Based on the IX operational strategies and IX brine management reviewed in the present paper,
a novel design workflow for IX plants is proposed as follows (Figure 5.1). First, IX operational
strategies that facilitate the management of the IX brine should be considered. When choosing
the resin during the design phase, one should select a resin that works as efficiently as possible
for the intended purpose. This requires stakeholders to test different resins from different
manufacturers for the same application and to choose the most efficient one. Second, when
designing the cycle length, if the IX process is used for NOM removal, one could consider
operating IX resins in biological mode (BIEX), which can fully exploit the IX capacity for NOM
removal and reduce the regeneration frequency. Third, during the regeneration phases,
segmented regeneration has been shown to largely reduce the brine volume, and its investigation
is encouraged, especially for chromium and nitrate removal. On the other hand, despite being

152
promising, chemical-free regeneration (i.e., biological, electrolytic, and thermal methods) is still
under development, and more studies are needed to test the feasibility of full-scale applications.
Finally, alternative regenerants, such as bicarbonate salts for AIX resins and potassium salts for
CIX resins, are also encouraged to reduce the environmental impact.
Subsequent to determining the regeneration strategy, a regeneration pretest in the lab or at a
pilot-scale is strongly suggested to characterize the IX brine. This practice would benefit the IX
brine management strategy design in the following way: 1) direct reuse of IX brine could be
evaluated; 2) treatment methods could be designed if brine direct reuse is not feasible. It is worth
noting that direct reuse of IX brine is the most economically beneficial approach due to its savings
on water/salt usage as well as operation and maintenance (O&M) costs as long as regeneration
efficiency and treatment performance are not affected. IX brine treatment prior to reuse certainly
increases capital costs, but the reduction in salt and water consumption lowers the O&M costs
(Lehman et al., 2008). Nonetheless, non-monetary factors should also be considered when
choosing the best treatment method, such as process maturity, operational complexity, process
footprint, and contamination of IX vessels (Plummer et al., 2018). Overall, although IX brine
treatment followed by reuse for IX resin regeneration is potentially viable, it is still necessary to
design the treatment scheme on a case-by-case basis considering the local regulations and
conditions.
IX brine disposal is still the main option for cases where: 1) brine reuse strategies are not
economically feasible or 2) the reused brine has reached its end of life. The brine disposal
methods depend on cost, brine volume, brine characteristics, local hydrogeological conditions,
climate conditions, public acceptability, and local regulations. Treatment methods (e.g.,
membrane or evaporation) are available to reduce the brine volume or even achieve zero liquid
discharge. Overall, this review provides a vast list of options to mitigate the adverse impacts of IX
brine on the environment. Engineers and legislators are encouraged to proactively consider these
novel ideas, which will help reduce the environmental footprint of IX systems.
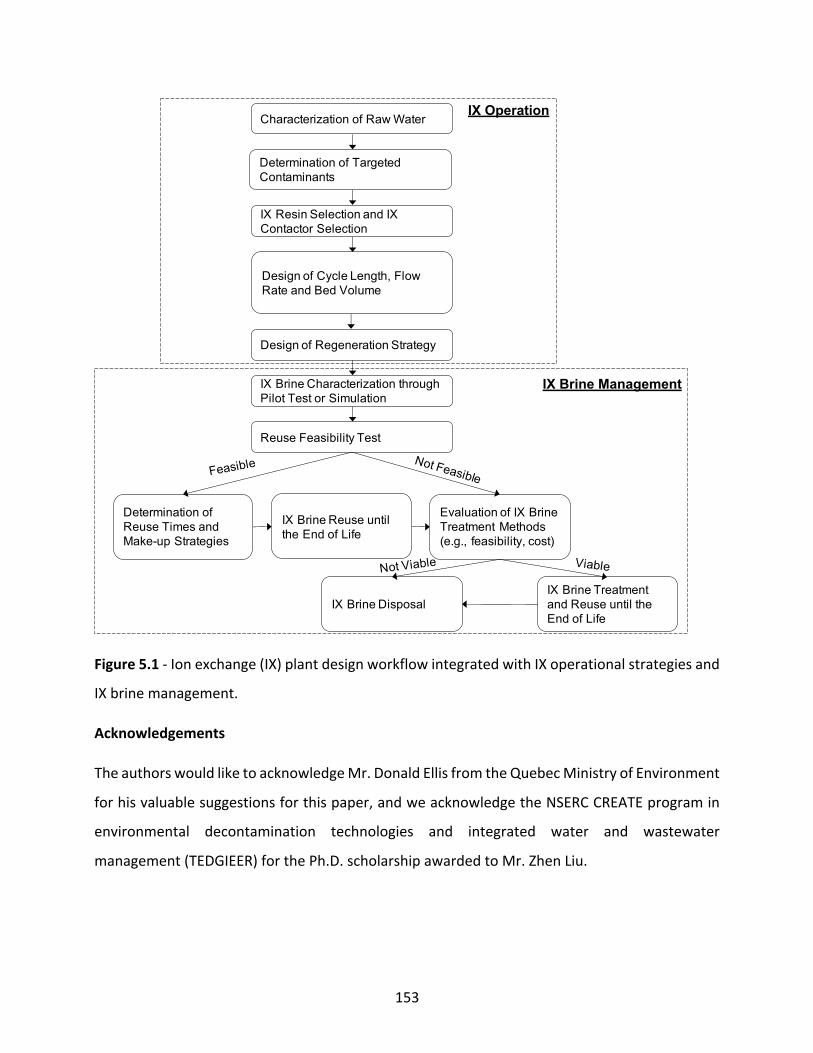
153
Figure 5.1 - Ion exchange (IX) plant design workflow integrated with IX operational strategies and
IX brine management.
Acknowledgements
The authors would like to acknowledge Mr. Donald Ellis from the Quebec Ministry of Environment
for his valuable suggestions for this paper, and we acknowledge the NSERC CREATE program in
environmental decontamination technologies and integrated water and wastewater
management (TEDGIEER) for the Ph.D. scholarship awarded to Mr. Zhen Liu.
Determination of Targeted Contaminants
IX Resin Selection and IX Contactor Selection
Design of Cycle Length, Flow Rate and Bed Volume
Design of Regeneration Strategy
IX Brine Characterization through Pilot Test or Simulation
Reuse Feasibility Test
Determination of Reuse Times and Make-up Strategies
Evaluation of IX Brine Treatment Methods (e.g., feasibility, cost)
IX Brine Treatment and Reuse until the End of Life
IX Brine Disposal
Feasible Not Feasible
Not Viable Viable
IX Brine Reuse until the End of Life
Characterization of Raw WaterIX Operation
IX Brine Management
154
References Ahmad, A., Huiting, H., Harmsen, D., Petrutiu, D., & Toussaint, V. (2017). Treatment of Spent
Cation Exchange Regenerant with Eutectic Freeze Crystallisation.
Amini, N., Papineau, I., Storck, V., Berube, P. R., Mohseni, M., & Barbeau, B. (2018). Long-term
performance of biological ion exchange for the removal of natural organic matter and ammonia
from surface waters. Water Res, 146, 1-9. doi:10.1016/j.watres.2018.07.057
An, B., Liang, Q., & Zhao, D. (2011). Removal of arsenic(V) from spent ion exchange brine using a
new class of starch-bridged magnetite nanoparticles. Water Res, 45(5), 1961-1972.
doi:10.1016/j.watres.2011.01.004
An, B., Steinwinder, T. R., & Zhao, D. (2005). Selective removal of arsenate from drinking water
using a polymeric ligand exchanger. Water Research, 39(20), 4993-5004.
Arar, Ö. (2016). Shallow Shell resin versus traditional resin: A case study for Cu (II) removal.
Anadolu Üniversitesi Bilim Ve Teknoloji Dergisi A-Uygulamalı Bilimler ve Mühendislik, 17(3), 530-
542.
Arias-Paić, M. S., & Korak, J. A. (2020). Forward osmosis for ion exchange waste brine
management. Environmental Science & Technology Letters, 7(2), 111-117.
Bae, B. U., Jung, Y. H., Han, W. W., & Shin, H. S. (2002). Improved brine recycling during nitrate
removal using ion exchange. Water Research, 36(13), 3330-3340. doi:Pii S0043-1354(02)00012-X
Doi 10.1016/S0043-1354(02)00012-X
Bae, B. U., Kim, C. H., & Kim, Y. I. (2004). Treatment of spent brine from a nitrate exchange process
using combined biological denitrification and sulfate precipitation. Water Science and
Technology, 49(5-6), 413-419. Retrieved from <Go to ISI>://WOS:000221464200054
Battaerd, H., Blesing, N., Bolto, B., Cope, A., Stephens, G., Weiss, D., . . . Worboys, J. (1973). An
ion-exchange process with thermal regeneration VIII. Preliminary pilot plant results for the partial
demineralisation of brackish waters. Desalination, 12(2), 217-237.
155
Bergquist, A. M., Bertoch, M., Gildert, G., Strathmann, T. J., & Werth, C. J. (2017). Catalytic
Denitrification in a Trickle Bed Reactor: Ion Exchange Waste Brine Treatment. Journal American
Water Works Association, 109(5), E129-E143. doi:10.5942/jawwa.2017.109.0055
Bergquist, A. M., Choe, J. K., Strathmann, T. J., & Werth, C. J. (2016). Evaluation of a hybrid ion
exchange-catalyst treatment technology for nitrate removal from drinking water. Water Res, 96,
177-187. doi:10.1016/j.watres.2016.03.054
Birnhack, L., Keller, O., Tang, S. C. N., Fridman-Bishop, N., & Lahav, O. (2019). A membrane-based
recycling process for minimizing environmental effects inflicted by ion-exchange softening
applications. Separation and Purification Technology, 223, 24-30.
doi:10.1016/j.seppur.2019.04.056
Bolto, B., Eppinger, K., Ho, P., Jackson, M., Pilkington, N., & Siudak, R. (1978). An ion-exchange
process with thermal regeneration XII. Desalting of sewage effluents. Desalination, 25(1), 45-59.
Bolto, B., & Jackson, M. (1983). Thermally regenerable ion-exchange resins. I the encapsulation
of polyamine microparticles in a polyacid matrix. Reactive Polymers, Ion Exchangers, Sorbents,
1(2), 119-128.
Bolton, H. R. (1992). Use of Bipolar Membranes for Ion-Exchange Resin Regenerant Production.
Journal of Chemical Technology and Biotechnology, 54(4), 341-347. Retrieved from <Go to
ISI>://WOS:A1992JG77700006
Caltran, I., Rietveld, L. C., Shorney-Darby, H. L., & Heijman, S. G. J. (2020). Separating NOM from
salts in ion exchange brine with ceramic nanofiltration. Water Res, 179, 115894.
doi:10.1016/j.watres.2020.115894
Cang, Y., Roberts, D. J., & Clifford, D. A. (2004). Development of cultures capable of reducing
perchlorate and nitrate in high salt solutions. Water Res, 38(14-15), 3322-3330.
doi:10.1016/j.watres.2004.04.020
Cartier, S., Theoleyre, M. A., & Decloux, M. (1997). Treatment of sugar decolorizing resin
regeneration waste using nanofiltration. Desalination, 113(1), 7-17. doi:Doi 10.1016/S0011-
9164(97)00110-0

156
Chanda, M., Pillay, S. A., Sarkar, A., & Modak, J. M. (2009). A Thermally Regenerable Composite
Sorbent of Crosslinked Poly(acrylic acid) and Ethoxylated Polyethyleneimine for Water
Desalination by Sirotherm Process. Journal of Applied Polymer Science, 111(6), 2741-2750.
doi:10.1002/app.29346
Chanda, M., Pillay, S. A., Sarkar, A., & Modak, J. M. (2010). Interpenetrating Networks of Cross-
Linked Poly(acrylic acid) and Cross-linked Polyethyleneimine (80% Ethoxylated) for Desalination
of Brackish Water by Thermoreversible Sorption. Industrial & Engineering Chemistry Research,
49(16), 7136-7146. doi:10.1021/ie100342r
Chandrasekara, N. P. G. N., & Pashley, R. M. (2015). Study of a new process for the efficient
regeneration of ion exchange resins. Desalination, 357, 131-139. doi:10.1016/j.desal.2014.11.024
Chen, Y., Davis, J. R., Nguyen, C. H., Baygents, J. C., & Farrell, J. (2016). Electrochemical Ion-
Exchange Regeneration and Fluidized Bed Crystallization for Zero-Liquid-Discharge Water
Softening. Environ Sci Technol, 50(11), 5900-5907. doi:10.1021/acs.est.5b05606
Choe, J. K., Bergquist, A. M., Jeong, S., Guest, J. S., Werth, C. J., & Strathmann, T. J. (2015).
Performance and life cycle environmental benefits of recycling spent ion exchange brines by
catalytic treatment of nitrate. Water Res, 80, 267-280. doi:10.1016/j.watres.2015.05.007
Choe, J. K., Mehnert, M. H., Guest, J. S., Strathmann, T. J., & Werth, C. J. (2013). Comparative
assessment of the environmental sustainability of existing and emerging perchlorate treatment
technologies for drinking water. Environ Sci Technol, 47(9), 4644-4652. doi:10.1021/es3042862
Choe, S., Chang, Y. Y., Hwang, K. Y., & Khim, J. (2000). Kinetics of reductive denitrification by
nanoscale zero-valent iron. Chemosphere, 41(8), 1307-1311. doi:10.1016/s0045-6535(99)00506-
8
Chung, J., Nerenberg, R., & Rittmann, B. E. (2007). Evaluation for biological reduction of nitrate
and perchlorate in brine water using the hydrogen-based membrane biofilm reactor. Journal of
Environmental Engineering-Asce, 133(2), 157-164. doi:10.1061/(Asce)0733-
9372(2007)133:2(157)

157
Clifford, D., & Liu, X. S. (1993). Biological Denitrification of Spent Regenerant Brine Using a
Sequencing Batch Reactor. Water Research, 27(9), 1477-1484. doi:Doi 10.1016/0043-
1354(93)90028-G
Clifford, D. A., Ghurye, G. L., & Tripp, A. R. (2003). As removal using ion exchange with spent brine
recycling. Journal American Water Works Association, 95(6), 119-130. Retrieved from <Go to
ISI>://WOS:000183447800017
Cob, S. S., Guner, F. E. G., Hofs, B., van Spronsen, J., & Witkamp, G. J. (2014). Three strategies to
treat reverse osmosis brine and cation exchange spent regenerant to increase system recovery.
Desalination, 344, 36-47. doi:10.1016/j.desal.2014.03.009
Cornelissen, E. R., Beerendonk, E. F., Nederlof, M. N., van der Hoek, J. P., & Wessels, L. P. (2009).
Fluidized ion exchange (FIX) to control NOM fouling in ultrafiltration. Desalination, 236(1-3), 334-
341. doi:10.1016/j.desal.2007.10.084
CSIROpedia. (2014). MIEX® water purification process. Retrieved from
https://csiropedia.csiro.au/miex-water-purification-process/
de Dardel, F., & Arden, T. V. (2008). Ion Exchangers. In Ullmann's Encyclopedia of Industrial
Chemistry.
Dixit, F., Barbeau, B., Mostafavi, S. G., & Mohseni, M. (2021). PFAS and DOM removal using an
organic scavenger and PFAS-specific resin: Trade-off between regeneration and faster kinetics.
Science of The Total Environment, 754, 142107. doi:ARTN 142107
10.1016/j.scitotenv.2020.142107
Dixit, F., Dutta, R., Barbeau, B., Berube, P., & Mohseni, M. (2021). PFAS removal by ion exchange
resins: A review. Chemosphere, 272, 129777. doi:10.1016/j.chemosphere.2021.129777
Dortsiou, M., Katsounaros, I., Polatides, C., & Kyriacou, G. (2009). Electrochemical removal of
nitrate from the spent regenerant solution of the ion exchange. Desalination, 248(1-3), 923-930.
doi:10.1016/j.desal.2008.10.012

158
Duan, S., Tong, T., Zheng, S., Zhang, X., & Li, S. (2020). Achieving low-cost, highly selective nitrate
removal with standard anion exchange resin by tuning recycled brine composition. Water Res,
173, 115571. doi:10.1016/j.watres.2020.115571
Ebrahimi, S., & Roberts, D. J. (2013). Sustainable nitrate-contaminated water treatment using
multi cycle ion-exchange/bioregeneration of nitrate selective resin. J Hazard Mater, 262, 539-544.
doi:10.1016/j.jhazmat.2013.09.025
Ebrahimi, S., & Roberts, D. J. (2015). Bioregeneration of single use nitrate selective ion-exchange
resin enclosed in a membrane: Kinetics of desorption. Separation and Purification Technology,
146, 268-275. doi:10.1016/j.seppur.2015.03.038
Edzwald, J. K. (2010). Water Quality and Treatment A Handbook on Drinking Water: McGrawHill.
Fernández-Torres, M., Randall, D., Melamu, R., & Von Blottnitz, H. (2012). A comparative life cycle
assessment of eutectic freeze crystallisation and evaporative crystallisation for the treatment of
saline wastewater. Desalination, 306, 17-23.
Flodman, H. R., & Dvorak, B. I. (2012). Brine reuse in ion-exchange softening: salt discharge,
hardness leakage, and capacity tradeoffs. Water Environ Res, 84(6), 535-543.
doi:10.2175/106143012x13373550427354
Ghasemipanah, K. (2013). Treatment of ion-exchange resins regeneration wastewater using
reverse osmosis method for reuse. Desalination and Water Treatment, 51(25-27), 5179-5183.
doi:10.1080/19443994.2013.768420
Gryta, M., Karakulski, K., Tomaszewska, M., & Morawski, A. (2005). Treatment of effluents from
the regeneration of ion exchangers using the MD process. Desalination, 180(1-3), 173-180.
doi:10.1016/j.desal.2005.01.004
Gu, B., Brown, G. M., Maya, L., Lance, M. J., & Moyer, B. A. (2001). Regeneration of perchlorate
(ClO4-)-loaded anion exchange resins by a novel tetrachloroferrate (FeCl4-) displacement
technique. Environ Sci Technol, 35(16), 3363-3368. doi:10.1021/es010604i

159
Gutierrez, D. A., Hanna, K., & Stanley, B. J. (2008). Utilization of iodide as a perchlorate-laden resin
regenerating solution and isolation of perchlorate from simulated ground water samples.
Separation and Purification Technology, 61(3), 469-473. doi:10.1016/j.seppur.2008.01.010
Haddad, M., Bazinet, L., & Barbeau, B. (2019). Eco-efficient treatment of ion exchange spent brine
via electrodialysis to recover NaCl and minimize waste disposal. Sci Total Environ, 690, 400-409.
doi:10.1016/j.scitotenv.2019.06.539
He, F., & Zhao, D. (2005). Preparation and characterization of a new class of starch-stabilized
bimetallic nanoparticles for degradation of chlorinated hydrocarbons in water. Environ Sci
Technol, 39(9), 3314-3320. doi:10.1021/es048743y
He, F., Zhao, D. Y., Liu, J. C., & Roberts, C. B. (2007). Stabilization of Fe-Pd nanoparticles with
sodium carboxymethyl cellulose for enhanced transport and dechlorination of trichloroethylene
in soil and groundwater. Industrial & Engineering Chemistry Research, 46(1), 29-34.
doi:10.1021/ie0610896
Hiremath, T., Roberts, D. J., Lin, X., Clifford, D. A., Gillogly, T. E. T., & Lehman, S. G. (2006).
Biological treatment of perchlorate in spent ISEP ion-exchange brine. Environmental engineering
science, 23(6), 1009-1016. doi:DOI 10.1089/ees.2006.23.1009
Homan, N. P., Green, P. G., & Young, T. M. (2018). Evaluating Ferrous Chloride for Removal of
Chromium From Ion‐Exchange Waste Brines. Journal‐American Water Works Association,
110(4), E43-E54.
Hosea, J. M., Nelis, P. M., & Mayne, M. D. (1988). Metal Recovery by Ion Exchange--Five Crucial
Issues. Met. Finish., 86(10), 67-70.
Hu, J. Y., Chen, Y. J., Zhu, L. W., Qian, Z. H., & Chen, X. M. (2016). Production of high purity water
using membrane-free electrodeionization with improved resin layer structure. Separation and
Purification Technology, 164, 89-96. doi:10.1016/j.seppur.2016.03.027
Hu, J. Y., Chen, Y. X., Guo, L. L., & Chen, X. M. (2015). Chemical-free ion exchange and its
application for desalination. Desalination, 365, 144-150. doi:10.1016/j.desal.2015.02.033

160
Huo, X., Vanneste, J., Cath, T. Y., & Strathmann, T. J. (2020). A hybrid catalytic
hydrogenation/membrane distillation process for nitrogen resource recovery from nitrate-
contaminated waste ion exchange brine. Water Res, 175, 115688.
doi:10.1016/j.watres.2020.115688
Hutchison, J. M., & Zilles, J. L. (2018). Biocatalytic removal of perchlorate and nitrate in ion-
exchange waste brine. Environmental Science-Water Research & Technology, 4(8), 1181-1189.
doi:10.1039/c8ew00178b
Jelínek, L., Parschová, H., Matějka, Z., Paidar, M., & Bouzek, K. J. W. e. r. (2004). A combination of
ion exchange and electrochemical reduction for nitrate removal from drinking water part I:
Nitrate removal using a selective anion exchanger in the bicarbonate form with reuse of the
regenerant solution. 76(7), 2686-2690. Retrieved from
https://onlinelibrary.wiley.com/doi/abs/10.1002/j.1554-7531.2004.tb00230.x
https://onlinelibrary.wiley.com/doi/pdf/10.1002/j.1554-7531.2004.tb00230.x
Jensen, V. B., & Darby, J. L. (2016). Brine Disposal Options for Small Systems in California's Central
Valley. Journal American Water Works Association, 108(5), E276-E289.
doi:10.5942/jawwa.2016.108.0045
Kabsch-Korbutowicz, M., Wisniewski, J., Lakomska, S., & Urbanowska, A. (2011). Application of
UF, NF and ED in natural organic matter removal from ion-exchange spent regenerant brine.
Desalination, 280(1-3), 428-431. doi:10.1016/j.desal.2011.06.068
Kim, P. H. S., & Symons, J. M. (1991). Using Anion-Exchange Resins to Remove Thm Precursors.
Journal American Water Works Association, 83(12), 61-68. Retrieved from <Go to
ISI>://WOS:A1991GV11300011
Klas, S., Beliavski, M., Gluska, D., Amara, R., Katz, I., Lehrer, T., . . . Green, M. (2015). Minimizing
brine discharge in a combined biophysical system for nitrate removal from inland groundwater.
Separation and Purification Technology, 156, 496-501. doi:10.1016/j.seppur.2015.10.041
Korak, J. A., Huggins, R., & Arias-Paic, M. (2017). Regeneration of pilot-scale ion exchange columns
for hexavalent chromium removal. Water Res, 118, 141-151. doi:10.1016/j.watres.2017.03.018

161
Korak, J. A., Huggins, R. G., & Arias-Paic, M. S. (2018). Nanofiltration to Improve Process Efficiency
of Hexavalent Chromium Treatment Using Ion Exchange. Journal American Water Works
Association, 110(6), E13-E26. doi:10.1002/awwa.1051
Lehman, S. G., Badruzzaman, M., Adham, S., Roberts, D. J., & Clifford, D. A. (2008). Perchlorate
and nitrate treatment by ion exchange integrated with biological brine treatment. Water Res,
42(4-5), 969-976. doi:10.1016/j.watres.2007.09.011
Leong, J., Tan, J., Heitz, A., & Ladewig, B. P. (2016). Use of vibratory shear enhanced processing to
treat magnetic ion exchange concentrate: A techno-economic analysis. Desalination, 383, 46-52.
doi:10.1016/j.desal.2016.01.002
Levchuk, I., Rueda Marquez, J. J., & Sillanpaa, M. (2018). Removal of natural organic matter (NOM)
from water by ion exchange - A review. Chemosphere, 192, 90-104.
doi:10.1016/j.chemosphere.2017.10.101
Lewis, A. E., Nathoo, J., Thomsen, K., Kramer, H. J., Witkamp, G. J., Reddy, S. T., & Randall, D. G.
(2010). Design of a Eutectic Freeze Crystallization process for multicomponent waste water
stream. Chemical Engineering Research & Design, 88(9a), 1290-1296.
doi:10.1016/j.cherd.2010.01.023
Li, J., Koner, S., German, M., & SenGupta, A. K. (2016). Aluminum-Cycle Ion Exchange Process for
Hardness Removal: A New Approach for Sustainable Softening. Environ Sci Technol, 50(21),
11943-11950. doi:10.1021/acs.est.6b03021
Li, Q., Huang, B., Chen, X., & Shi, Y. (2015). Cost-effective bioregeneration of nitrate-laden ion
exchange brine through deliberate bicarbonate incorporation. Water Res, 75, 33-42.
doi:10.1016/j.watres.2015.02.028
Li, X., Green, P. G., Seidel, C., Gorman, C., & Darby, J. L. (2016). Chromium removal from strong
base anion exchange waste brines. Journal‐American Water Works Association, 108(4), E247-
E255.

162
Lin, X. H., Roberts, D. J., Hiremath, T., Clifford, D. A., Gillogly, T., & Lehman, S. G. (2007). Divalent
cation addition (Ca2+ or Mg2+) stabilizes biological treatment of perchlorate and nitrate in ion-
exchange spent brine. Environmental engineering science, 24(6), 725-735.
doi:10.1089/ees.2006.0110
Liu, J., Choe, J. K., Sasnow, Z., Werth, C. J., & Strathmann, T. J. (2013). Application of a Re-Pd
bimetallic catalyst for treatment of perchlorate in waste ion-exchange regenerant brine. Water
Res, 47(1), 91-101. doi:10.1016/j.watres.2012.09.031
Liu, X. S., & Clifford, D. A. (1996). Ion exchange with denitrified brine reuse. Journal American
Water Works Association, 88(11), 88-99. Retrieved from <Go to ISI>://WOS:A1996VT94400012
Liu, Z., Lompe, K. M., Mohseni, M., Berube, P. R., Sauve, S., & Barbeau, B. (2020). Biological ion
exchange as an alternative to biological activated carbon for drinking water treatment. Water
Res, 168, 115148. doi:10.1016/j.watres.2019.115148
Logan, B. E., Wu, J., & Unz, R. F. (2001). Biological perchlorate reduction in high-salinity solutions.
Water Res, 35(12), 3034-3038. doi:10.1016/s0043-1354(01)00013-6
Matošić, M., Mijatović, I., Hodžić, E. J. C., & quarterly, b. e. (2000). Nitrate removal from drinking
water using ion exchange-comparison of chloride and bicarbonate form of the resins. 42(2), 141-
146.
Maul, G. A., Kim, Y., Amini, A., Zhang, Q., & Boyer, T. H. (2014). Efficiency and life cycle
environmental impacts of ion-exchange regeneration using sodium, potassium, chloride, and
bicarbonate salts. Chemical Engineering Journal, 254, 198-209. doi:10.1016/j.cej.2014.05.086
McAdam, E. J., & Judd, S. J. (2008a). Biological treatment of ion-exchange brine regenerant for re-
use: A review. Separation and Purification Technology, 62(2), 264-272.
doi:10.1016/j.seppur.2008.01.007
McAdam, E. J., & Judd, S. J. (2008b). Immersed membrane bioreactors for nitrate removal from
drinking water: Cost and feasibility. Desalination, 231(1-3), 52-60.
doi:10.1016/j.desal.2007.11.038
163
McAdam, E. J., Pawlett, M., & Judd, S. J. (2010). Fate and impact of organics in an immersed
membrane bioreactor applied to brine denitrification and ion exchange regeneration. Water Res,
44(1), 69-76. doi:10.1016/j.watres.2009.08.048
Medina, B. B., Boyer, T., & Indarawis, K. (2018). Evaluating Options for Regenerant Brine Reuse in
Magnetic Ion Exchange Systems. Journal American Water Works Association, 110(5), E2-E10.
doi:10.1002/awwa.1046
Metcalfe, D., Rockey, C., Jefferson, B., Judd, S., & Jarvis, P. (2015). Removal of disinfection by-
product precursors by coagulation and an innovative suspended ion exchange process. Water
Res, 87, 20-28. doi:10.1016/j.watres.2015.09.003
Mezher, T., Fath, H., Abbas, Z., & Khaled, A. (2011). Techno-economic assessment and
environmental impacts of desalination technologies. Desalination, 266(1-3), 263-273.
doi:10.1016/j.desal.2010.08.035
Micari, M., Cipollina, A., Tamburini, A., Moser, M., Bertsch, V., & Micale, G. (2019). Combined
membrane and thermal desalination processes for the treatment of ion exchange resins spent
brine. Applied Energy, 254, 113699. doi:ARTN 113699
10.1016/j.apenergy.2019.113699
Micari, M., Moser, M., Cipollina, A., Fuchs, B., Ortega-Delgado, B., Tamburini, A., & Micale, G.
(2019). Techno-economic assessment of multi-effect distillation process for the treatment and
recycling of ion exchange resin spent brines. Desalination, 456, 38-52.
doi:10.1016/j.desal.2019.01.011
Moore, A. M., De Leon, C. H., & Young, T. M. (2003). Rate and extent of aqueous perchlorate
removal by iron surfaces. Environ Sci Technol, 37(14), 3189-3198. doi:10.1021/es026007t
Ness, A., & Boyer, T. H. J. J. A. W. W. A. (2017). Pilot‐Scale Evaluation of Bicarbonate‐Form
Anion Exchange for DOC Removal in Small Systems. 109(12), 13-26.
Okeke, B. C., Giblin, T., & Frankenberger, W. T., Jr. (2002). Reduction of perchlorate and nitrate
by salt tolerant bacteria. Environ Pollut, 118(3), 357-363. doi:10.1016/s0269-7491(01)00288-3
164
Olsen, C. T. (2015). Saving salt & Cutting chlorides with salt saving resin - The city of Chilton
experience. Paper presented at the WRWA 27th Annual Technical Conference, La Crosse.
Paidar, M., Bouzek, K., Jelinek, L., & Matejka, Z. (2004). A combination of ion exchange and
electrochemical reduction for nitrate removal from drinking water. Part II: electrochemical
treatment of a spent regenerant solution. Water Environ Res, 76(7), 2691-2698. Retrieved from
https://www.ncbi.nlm.nih.gov/pubmed/16042117
Pakzadeh, B., & Batista, J. R. (2011a). Chromium removal from ion-exchange waste brines with
calcium polysulfide. Water Res, 45(10), 3055-3064. doi:10.1016/j.watres.2011.03.006
Pakzadeh, B., & Batista, J. R. (2011b). Surface complexation modeling of the removal of arsenic
from ion-exchange waste brines with ferric chloride. J Hazard Mater, 188(1-3), 399-407.
doi:10.1016/j.jhazmat.2011.01.117
Panagopoulos, A., Haralambous, K. J., & Loizidou, M. (2019). Desalination brine disposal methods
and treatment technologies - A review. Sci Total Environ, 693, 133545.
doi:10.1016/j.scitotenv.2019.07.351
Patel, A., Zuo, G., Lehman, S. G., Badruzzaman, M., Clifford, D. A., & Roberts, D. J. (2008). Fluidized
bed reactor for the biological treatment of ion-exchange brine containing perchlorate and nitrate.
Water Res, 42(16), 4291-4298. doi:10.1016/j.watres.2008.07.018
Peyton, B. M., Mormile, M. R., & Petersen, J. N. (2001). Nitrate reduction with Halomonas
campisalis: kinetics of denitrification at pH 9 and 12.5% NaCl. Water Research, 35(17), 4237-4242.
Pintar, A., & Batista, J. (2006). Improvement of an integrated ion-exchange/catalytic process for
nitrate removal by introducing a two-stage denitrification step. Applied Catalysis B-
Environmental, 63(1-2), 150-159. doi:10.1016/j.apcatb.2005.10.006
Pintar, A., Batista, J., & Levec, J. (2001). Integrated ion exchange/catalytic process for efficient
removal of nitrates from drinking water. Chemical engineering science, 56(4), 1551-1559. doi:Doi
10.1016/S0009-2509(00)00382-1

165
Plummer, S., Gorman, C., Henrie, T., Shimabuku, K., Thompson, R., & Seidel, C. (2018).
Optimization of strong-base anion exchange O&M costs for hexavalent chromium treatment.
Water Res, 139, 420-433. doi:10.1016/j.watres.2018.04.011
Pramanik, B. K., Shu, L., & Jegatheesan, V. (2017). A review of the management and treatment of
brine solutions. Environmental Science-Water Research & Technology, 3(4), 625-658.
doi:10.1039/c6ew00339g
Purolite. (2014). Shallow Shell™ Technology – Ion Exchange Innovation for Improved Industrial
Water and Process Applications. Retrieved from www.Purolite.com
Rokicki, C. A., & Boyer, T. H. (2011). Bicarbonate-form anion exchange: affinity, regeneration, and
stoichiometry. Water Res, 45(3), 1329-1337. doi:10.1016/j.watres.2010.10.018
Sahu, A. K., Conneely, T., Nusslein, K., & Ergas, S. J. (2009). Hydrogenotrophic denitrification and
perchlorate reduction in ion exchange brines using membrane biofilm reactors. Biotechnol
Bioeng, 104(3), 483-491. doi:10.1002/bit.22414
Salehi, F., Razavi, S. M. A., & Elahi, M. (2011). Purifying anion exchange resin regeneration effluent
using polyamide nanofiltration membrane. Desalination, 278(1-3), 31-35.
doi:10.1016/j.desal.2011.04.067
Schaefer, C. E., Tran, D., Fang, Y. D., Choi, Y. J., Higgins, C. P., & Strathmann, T. J. (2020).
Electrochemical treatment of poly- and perfluoroalkyl substances in brines. Environmental
Science-Water Research & Technology, 6(10), 2704-2712. doi:10.1039/d0ew00377h
Schippers, D., Kooi, M., Sjoerdsma, P., & de Bruijn, F. (2004). Colour removal by ion exchange and
reuse of regenerant by means of nanofiltration. 4th World Water Congress: Innovation in Drinking
Water Treatment, 4(5-6), 57-64. doi:DOI 10.2166/ws.2004.0093
Schulz, M., Winter, J., Wray, H., Barbeau, B., & Berube, P. (2017). Biologically active ion exchange
(BIEX) for NOM removal and membrane fouling prevention. Water Science and Technology-Water
Supply, 17(4), 1178-1184. doi:10.2166/ws.2017.016

166
Seidel, C., Gorman, C., Ghosh, A., Dufour, T., Mead, C., Henderson, J., . . . McNeill, L. (2014).
Hexavalent Chromium Treatment With Strong Base Anion Exchange: Water Research Foundation.
Sharbatmaleki, M., Unz, R. F., & Batista, J. R. (2015). Potential mechanisms for bioregeneration of
perchlorate-containing ion-exchange resin. Water Res, 75, 1-10.
doi:10.1016/j.watres.2015.02.027
Shen, X. L., Li, T. J., Jiang, X. P., & Chen, X. M. (2014). Desalination of water with high conductivity
using membrane-free electrodeionization. Separation and Purification Technology, 128, 39-44.
doi:10.1016/j.seppur.2014.03.011
Siegel, S., & Clifford, D. (1988). Removal of chromium from ion exchange regenerant solution.
Available from the National Technical Information Service, Springfield VA 22161, as PB 88-158084.
Price codes: A 04 in paper copy, A 01 in microfiche. Report.
Singh, R. K., Multari, N., Nau-Hix, C., Woodard, S., Nickelsen, M., Mededovic Thagard, S., & Holsen,
T. M. (2020). Removal of Poly- and Per-Fluorinated Compounds from Ion Exchange Regenerant
Still Bottom Samples in a Plasma Reactor. Environ Sci Technol, 54(21), 13973-13980.
doi:10.1021/acs.est.0c02158
Slunjski, M., Cadee, K., & Tattersall, J. (2000). MIEX® resin water treatment process. Proceedings
of Aquatech, 26-29.
Su, W. Q., Li, T. J., Jiang, X. P., & Chen, X. M. (2014). Membrane-free electrodeionization without
electrode polarity reversal for high purity water production. Desalination, 345, 50-55.
doi:10.1016/j.desal.2014.04.018
Su, W. Q., Pan, R. Y., Xiao, Y., & Chen, X. M. (2013). Membrane-free electrodeionization for high
purity water production. Desalination, 329, 86-92. doi:10.1016/j.desal.2013.09.013
Tinos, N., & Culligan, S. (2012). Report on the evaluation of existing methods of brine treatment
and disposal practices (LIFE+ Environment project: LIFE 09 ENV/GR/000299). Athens, Greece.
167
Trögl, J., Boušková, A., Mrákota, J., Pilařová, V., Krudencová, J., Měchurová, J., . . . Stloukal, R.
(2011). Removal of nitrates from simulated ion-exchange brines with Paracoccus denitrificans
encapsulated in Lentikats Biocatalyst. Desalination, 275(1-3), 82-86.
Van der Ham, F., Witkamp, G., De Graauw, J., & Van Rosmalen, G. (1998). Eutectic freeze
crystallization: Application to process streams and waste water purification. Chemical Engineering
and Processing: Process Intensification, 37(2), 207-213.
Van der Hoek, J., & Klapwijk, A. (1989). Reduction of regeneration salt requirement and waste
disposal in an ion exchange process for nitrate removal from ground water. Waste management,
9(4), 203-210.
Vanoppen, M., Stoffels, G., Buffel, J., De Gusseme, B., & Verliefde, A. R. D. (2016). A hybrid IEX-
RO process with brine recycling for increased RO recovery without chemical addition: A pilot-scale
study. Desalination, 394, 185-194. doi:10.1016/j.desal.2016.05.003
Vaudevire, E., Koreman, E., Galjaard, G., Trommel, R., & Visser, M. (2013). Further treatment of
highly concentrated brine with dynamic vapour recompression. Desalination and Water
Treatment, 51(25-27), 4958-4962. doi:10.1080/19443994.2013.795343
Vaudevire, E., Radmanesh, F., Kolkman, A., Vughs, D., Cornelissen, E., Post, J., & van der Meer, W.
(2019). Fate and removal of trace pollutants from an anion exchange spent brine during the
recovery process of natural organic matter and salts. Water Res, 154, 34-44.
doi:10.1016/j.watres.2019.01.042
Venkatesan, A. K., Sharbatmaleki, M., & Batista, J. R. (2010). Bioregeneration of perchlorate-laden
gel-type anion-exchange resin in a fluidized bed reactor. J Hazard Mater, 177(1-3), 730-737.
doi:10.1016/j.jhazmat.2009.12.092
Verdickt, L., Closset, W., D'Haeseleer, V., & Cromphout, J. (2012). Applicability of ion exchange for
NOM removal from a sulfate-rich surface water incorporating full reuse of the brine. Water
Science and Technology-Water Supply, 12(6), 878-887. doi:10.2166/ws.2012.065

168
Wadley, S., Brouckaert, C. J., Baddock, L. A. D., & Buckley, C. A. (1995). Modeling of Nanofiltration
Applied to the Recovery of Salt from Waste Brine at a Sugar Decolorization Plant. Journal of
Membrane Science, 102, 163-175. doi:Doi 10.1016/0376-7388(94)00284-6
Waite, M. (2018). Regeneration of an ion exchange column. In: Google Patents.
Walker, K. M., & Boyer, T. H. (2011). Long-term performance of bicarbonate-form anion
exchange: removal of dissolved organic matter and bromide from the St. Johns River, FL, USA.
Water Res, 45(9), 2875-2886. doi:10.1016/j.watres.2011.03.004
Wang, C., Lippincott, L., & Meng, X. (2008). Feasibility and kinetics study on the direct bio-
regeneration of perchlorate laden anion-exchange resin. Water Res, 42(18), 4619-4628.
doi:10.1016/j.watres.2008.08.013
Xiao, Y., Roberts, D. J., Zuo, G., Badruzzaman, M., & Lehman, G. S. (2010). Characterization of
microbial populations in pilot-scale fluidized-bed reactors treating perchlorate- and nitrate-laden
brine. Water Res, 44(14), 4029-4036. doi:10.1016/j.watres.2010.05.006
Xing, Y., Chen, X., & Wang, D. (2007). Electrically regenerated ion exchange for removal and
recovery of Cr(VI) from wastewater. Environ Sci Technol, 41(4), 1439-1443.
doi:10.1021/es061499l
Xiong, Z., Zhao, D., & Pan, G. (2007). Rapid and complete destruction of perchlorate in water and
ion-exchange brine using stabilized zero-valent iron nanoparticles. Water Res, 41(15), 3497-3505.
doi:10.1016/j.watres.2007.05.049
Xiong, Z., Zhao, D. Y., & Pan, G. (2009). Rapid and controlled transformation of nitrate in water
and brine by stabilized iron nanoparticles. Journal of Nanoparticle Research, 11(4), 807-819.
doi:10.1007/s11051-008-9433-9
Yang, T., Doudrick, K., & Westerhoff, P. (2013). Photocatalytic reduction of nitrate using titanium
dioxide for regeneration of ion exchange brine. Water Res, 47(3), 1299-1307.
doi:10.1016/j.watres.2012.11.047

169
Zhang, X. Y., Xiao, X. Z., Zheng, S. K., & Wang, W. (2019). Achieving no spent brine discharge in an
anion exchange resin-based fixed-bed process for typical DOM removal. Chemical Engineering
Research & Design, 149, 121-128. doi:10.1016/j.cherd.2019.07.008
Zimmermann, K., Barbeau, B., Dezfoolian, M., Cook, C., & Mohseni, M. (2020). Biological Ion
Exchange Provides DOC Removal in Small Communities. Opflow, 46(5), 26-29.
doi:10.1002/opfl.1369
170
Chapitre 6 – Conclusions et perspectives
6.1 Conclusions Dans le cadre de cette thèse, des essais de pilote et de laboratoire ont été effectués afin de
comprendre et évaluer l’application du BIEX pour l’enlèvement de la MON. En plus, une revue de
littérature a été effectuée afin de résumer les stratégies qui peuvent alléger la gestion de la
saumure engendrée par la régénération de résine. Les conclusions principales de ces travaux sont
présentées ci-dessous.
Dans le chapitre 2, les résines en forme chlorure et bicarbonate ont été opérées en parallèle sans
régénération pour 9 mois (i.e., BIEX mode). Les résultats démontrent que l’opération du filtre
BIEX pouvait être divisée en trois phases : 1) Échange d’ions préliminaire : la MON et les anions
inorganiques (tel que sulfate) échange avec des anions préchargées (i.e., chlorure et bicarbonate);
2) Échange d’ions secondaire : la MON échange avec des anions préretenus (i.e., sulfate); 3)
Épuisement : la capacité d’échange est épuisée concernant le chlorure et le sulfate, et la MON
est enlevée par la biomasse (i.e., biosorption, biodégradation et biorégénération). Trois fractions
conceptuelles de MON ont été proposées afin de comprendre l’enlèvement de la MON dans le
filtre BIEX, i.e., la MON1 a une affinité plus base que le chlorure sur la résine, et la MON2 et la
MON3 ont respectivement une plus grande et une plus base affinité par rapport au sulfate sur la
résine (séquence d’affinité : MON3>sulfate>MON2>chlorure>MON1). Par conséquent, pendant
l’échange d’ions préliminaire, la MON2 et la MON3 ont été retenues par la résine alors que la
MON1 a relargué du filtre BIEX. Cependant, à la fin de l’échange d’ions préliminaire, la MON3 et
le sulfate échange avec la MON2, ce qui entraîne une percée de COD dans l’affluent du filtre.
Pendant l’échange d’ions secondaire, la MON 3 échange avec le sulfate préretenu jusqu’à
l’épuisement de la résine. Finalement, la MON peut seulement être enlevée par la biomasse
présente sur la résine pendant la phase de l’épuisement. La caractérisation de la MON dans
l’effluent du filtre BIEX démontre que la MON2 consiste principalement en substances humiques
et blocs de construction avec une faible densité de charge, basse masse moléculaire (<1000 Da)
et faible aromaticité.
171
Dans un deuxième temps, le chapitre 2 démontre que la performance du filtre BIEX en forme
chlorure est similaire à celui en forme bicarbonate. Pendant la durée de l’étude, le BIEX en forme
chlorure a réalisé un enlèvement de COD légèrement plus elevé par rapport au BIEX en forme
bicarbonate (médiane : 53% vs 49%), alors que le BIEX en forme bicarbonate a réalisé un
enlèvement de CODB plus haut par rapport au BIEX en forme chlorure (médiane : 50% vs 33%).
Par ailleurs, les filtres BIEX en forme chlorure et bicarbonate ont eu une efficacité similaire en
termes d’enlèvement de précurseurs de SPD. Ces résultats permettent de tirer la conclusion que
les performances du filtre BIEX en forme bicarbonate ne différencie pas significativement du BIEX
en forme chlorure en ce qui concerne l’enlèvement de la MON.
Dans le chapitre 3, les résines colonisées ont été prélevées du pilote en fonction à l’usine de
traitement pour le test en batch où les composés avec des charges et potentiels de
biodégradabilités différents ont été mise en contact avec les résines biotiques et abiotiques. Les
résultats ont démontré que les composés biodégradables (tels que caféine et ibuprofène)
pouvaient être biodégradés par la biomasse présente sur le BIEX. Cependant, la biodégradation
dépend aussi de la communauté microbienne présente sur la résine étant donné que naproxène,
un composé biodégradable qui n’est pas présenté dans la source d’eau, ne pouvait pas être
éliminé par la biodégradation sur le BIEX. En plus, les composés négativement chargés, tel que
naproxène, PFOA et PFOS peuvent être enlevés par l’échange avec la MON préretenue.
Finalement, les composés neutres et non-biodégradables (Thiaméthoxame et atrazine), ne
peuvent pas être enlevés par le BIEX. En bref, l’enlèvement de la matière organique par le BIEX
dépend non seulement du caractère des composés (par exemple, charge et biodégradabilité)
mais aussi de la communauté microbienne présente sur la résine.
Dans le chapitre 4, un pilote qui consiste en BIEX, CAG et CAB a été opéré en filtration secondaire
dans l’usine de production d’eau potable. Cette étude a pour but d’évaluer l’application du BIEX
dans l’usine de production d’eau potable. Les résultats ont démontré que le filtre BIEX avait
réalisé un enlèvement de COD plus élevé par rapport aux filtres CAG et CAB (29%-36% vs 13%-
24%) pour la durée d’étude (9 mois). D’ailleurs, le filtre BIEX a aussi réalisé un enlèvement de
précurseurs de SPD par rapport aux filtre CAG et CAB. Ces résultats ont indiqué que le BIEX est
plus performant par rapport aux filtre CAG et CAB en filtration secondaire en ce qui concerne

172
l’enlèvement de la MON. Cependant, la percée de COD entraînée par l’élution de différentes
fractions de MON peut rehausser temporairement le COD dans l’affluent du filtre. Ce problème
pourrait être résolu en mettant le filtre BIEX hors service pendant la percée de COD. Par ailleurs,
pendant l’opération en été, le filtre BIEX a relargué de l’azote ammoniacal (15%) alors que les
filtres CAG et CAB ont pu enlever de l’azote ammoniacal. Le relarguage de l’azote ammoniacal est
indésirable étant donné qu’il peut donner un goût désagréable à l’eau potable. Ce relarguage de
l’azote ammoniacal du filtre BIEX est principalement dû au petit diamètre de la colonne et la faible
vitesse de l’air pendant le rétrolavage. Dans le chapitre 2, un enlèvement de l’azote ammoniacal
a été observé dans le filtre BIEX où le diamètre de colonne est plus grand et la vitesse de l’air est
plus forte par rapport au pilote du chapitre 4. Donc, un propre rétrolavage est nécessaire pour
que l’azote ammoniacal soit éliminé dans le BIEX. Finalement, puisque la bille de résine est
généralement plus petite par rapport au charbon actif en grain (CAG), la perte de charge du filtre
BIEX est souvent plus grande que les filtres CAG et CAB. Cela indique que le contacteur du BIEX
serait plus profond que celui du CAG et CAB ou le BIEX devrait être opéré sous pression. Un
contacteur plus profond augmentera le coût capital alors que l’opération sous pression
compliquera la maintenance du filtre et le rétrolavage (dû au contacteur fermé). Le rapport
efficacité-prix du BIEX pour l’enlèvement de la MON demeure à investiguer.
La comparaison entre le chapitre 2 et le chapitre 4 permet d’évaluer la position du filtre BIEX dans
une chaîne de traitement de l’eau potable. Dans le chapitre 2, le filtre BIEX a été alimenté
directement par l’eau brute. Le filtre BIEX a réalisé un enlèvement moyen de COD d’environ 50%
pour une durée de 9 mois, ce qui suggère que le BIEX pourrait être la stratégie principale pour
l’enlèvement de la MON (i.e., un alternatif à la coagulation). Cependant, étant donné que le filtre
BIEX n’enlève pas de turbidité, des filtres MF ou UF devraient être placés avant le BIEX afin
d’enlever la turbidité et diminuer le colmatage du filtre. Par ailleurs, le filtre BIEX peut aussi être
mis en filtration secondaire en tant que processus de polissage. Cependant, l’enlèvement de COD
serait moins efficace (environ 32%) par rapport à celui alimenté par l’eau brute (50%). C’est parce
que le caractère de MON a été changé après le traitement conventionnel (plus hydrophile après
la coagulation) et le sulfate provenant de l’utilisation de l’alun peut rivaliser avec la MON sur la
173
résine. Plus d’études sont nécessaires afin de comparer le coût d’opérer le filtre BIEX aux
différentes positions dans une chaîne de traitement d’eau potable.
Dans le chapitre 5, une revue de littérature a été effectuée afin de résumer les stratégies qui
peuvent alléger la gestion de la saumure engendrée par la régénération de résines. D’ailleurs, un
nouveau schéma de conception a été proposé pour le processus d’échange d’ions. Au niveau de
l’opération de résine, on devrait choisir la résine la plus performante pour l’application destinée.
La résine SST (Shallow shell technology) et la résine non-régénérable peuvent aussi être
considérées afin de diminuer ou même éliminer la production de la saumure. L’application de
configuration « lead-lag » est encouragée parce qu’elle peut maximiser la capacité de la résine et
ainsi diminuer la fréquence de régénération. Les régénérations biologique, électrochimique et
thermale sont encore en développement et leurs applications, surtout à pleine échelle,
nécessitent encore des études. Au niveau de la gestion de la saumure, la réutilisation de la
saumure est toujours encouragée pourvue que la réutilisation n’impacte pas la performance du
cycle subséquent. Dans le cas où la réutilisation est non faisable, les technologies du traitement
de la saumure sont disponibles. Cependant, il faut noter que le traitement de la saumure
augmente le coût capital et opérationnel, et son rapport efficacité-prix devrait soigneusement
évalué par rapport à l’utilisation de la saumure fraîche. Finalement, le rejet de la saumure est
inévitable au cours de l’opération du processus d’échange d’ion, et la salinité et les substances
nocives présentes dans la saumure devraient être bien évaluées avant le rejet.
6.2 Perspectives Bien que les fractions conceptuelles de MON (i.e., MON1, MON2 et MON3) permettent d’élucider
l’échange de la MON contre la résine, les techniques de caractérisation de la MON ne pouvait pas
bien identifier les trois fractions dans cette étude. D’autre techniques de caractérisation devraient
être appliquées afin de bien distinguer ces trois fractions, tel que la mesure de densité de charge
par zetasizer. Par ailleurs, la fraction de MON dépend aussi du taux d’utilisation de la résine. Les
résines utilisées dans cette étude étaient toujours neuves. Donc, l’étude au futur devrait aussi
caractériser les fractions conceptuelles de MON avec les résines usées.
174
Dans le cadre de cette étude, les résines en forme chlorure et bicarbonate ont été évaluées pour
l’application de BIEX. Cependant, l’évaluation de la résine en forme sulfate serait également
importante. Étant donné que la résine en forme sulfate peut éviter l’enlèvement non nécessaire
d’ anions inorganiques, telles que bicarbonate, chlorure et sulfate, ceci permet d’éviter la percée
de COD pendant l’opération du BIEX. Néanmoins, puisque le sulfate a une affinité plus grande par
rapport au chlorure et bicarbonate, l’enlèvement de la MON serait moins efficace en utilisant la
résine en forme sulfate. En somme, la performance du BIEX en forme sulfate pour l’enlèvement
de la MON nécessite plus d’études.
Le filtre BIEX s’avère efficace tant comme processus principal que comme processus de polissage
pour l’enlèvement de la MON. Cependant, son impact sur les autres processus de traitement
demeure à investiguer. Par exemple, quels sont les impacts sur l’ozonation si l’eau est prétraitée
par le BIEX? Quels sont les impacts sur la désinfection si l’eau est prétraitée par un processus de
polissage de BIEX? Par ailleurs, le coût du BIEX dans une filière de traitement de l’eau potable
devait être évaluée systématiquement, parce que l’intégration du BIEX aurait des impacts sur les
processus en aval (par exemple, la réduction de la consommation de produits chimiques). En bref,
les positions du BIEX dans la filière de traitement de l’eau potable demeurent à comparer en
tenant compte de la performance et des coûts.
Bien que le BIEX soit une alternative prometteuse à la coagulation, l’adsorption et aux
membranes, une étude d’analyse du cycle de vie qui compare ces technologies est encore
manquante. Une telle étude permettrait d’évaluer les impacts environnementaux de ces
technologies et ainsi fournir un nouveau point de vue lors de la sélection du processus pour
l’enlèvement de la MON.
Le problématique des microplastiques a reçu des intérêts énormes récemment dû à l’impact
néfaste potentiel sur la faune. La résine échangeuse d’ions est elle-même un type de
microplastique (<5 mm). Ainsi, il serait important d’évaluer le relarguage involontaire de résines
pendant l’opération du processus d’échange d’ions. La résine pourrait se dégrader dû au
changement de pression dans le contacteur et ainsi relarguer dans l’effluent du filtre. D’ailleurs,
la résine pourrait aussi relarguer à l’environnement par le rejet de l’eau de rétrolavage. En bref,
175
la quantité de résines relargués et ses impacts potentiels sur l’environnement devraient être
évalués soigneusement.
La revue de littérature a permis d’identifier de nombreux champs d’études qui peuvent rendre le
processus d’échange d’ions plus vert. La régénération sans ajout de produits chimiques (i.e.,
régénération biologique, électrochimique et thermale) a démontré des résultats prometteurs au
laboratoire, mais leurs applications à l’échelle réelle nécessitent encore des études. De
nombreuses technologies sont disponibles en ce qui concerne le traitement de la saumure avant
la réutilisation. Cependant, la plupart de ces technologies sont en développement et leurs
applications à l’échelle réelle sont encore hasardeuses. En bref, les technologies qui peuvent
rendre le processus d’échange d’ions plus vert sont prometteuses mais immatures, et plus
d’efforts sont nécessaires afin de rendre l’échange d’ions plus durable en tant que technologie de
traitement de l’eau.
176
Annexe A – Biological ion exchange as an alternative to
biological activated carbon for natural organic matter
removal: impact of temperature and empty bed contact time
(EBCT)
Abstract Biofiltration is a widely used process in drinking water treatment plants to remove natural organic
matter (NOM). A novel biofiltration process using ion exchange resins as supporting media (i.e.,
biological ion exchange or BIEX) has been demonstrated to provide a superior performance
compared to conventional biological activated carbon (BAC). In order to optimize the
performance of BIEX filters, the impact of temperature and empty bed contact time (EBCT) on
NOM removal was systematically studied. In the present study, bench-scale BIEX filters were set
up in parallel with BAC filters and operated at different temperatures (i.e., 4 °C, 10 °C and 20 °C)
and EBCTs (i.e., 7.5 min, 15 min and 30 min). Higher average dissolved organic carbon (DOC)
removal was achieved in BIEX filters (73 ± 6 %) than BAC filters (22 ± 9 %) at the steady state with
an EBCT of 30 min. Higher temperatures improved NOM removal in both BAC and BIEX filters,
with the impact being greater at lower EBCTs (i.e., 7.5 min and 15 min). Higher EBCTs could also
improve NOM removal, with the impact being greater at lower temperatures (i.e., 4 °C and 10
°C). DOC removal for BIEX and BAC filters can be modeled with a first-order kinetic model (R2 =
0.93-0.99). BAC had a higher temperature activity coefficient than BIEX (1.0675 vs. 1.0429),
indicating that temperature has a greater impact on BAC filtration than BIEX filtration. Overall,
temperature and EBCT must be considered simultaneously for biofilters to efficiently remove
NOM.
Keywords: Biological ion exchange (BIEX); biological activated carbon (BAC); natural organic
matter (NOM); kinetics; temperature; Empty bed contact time (EBCT)
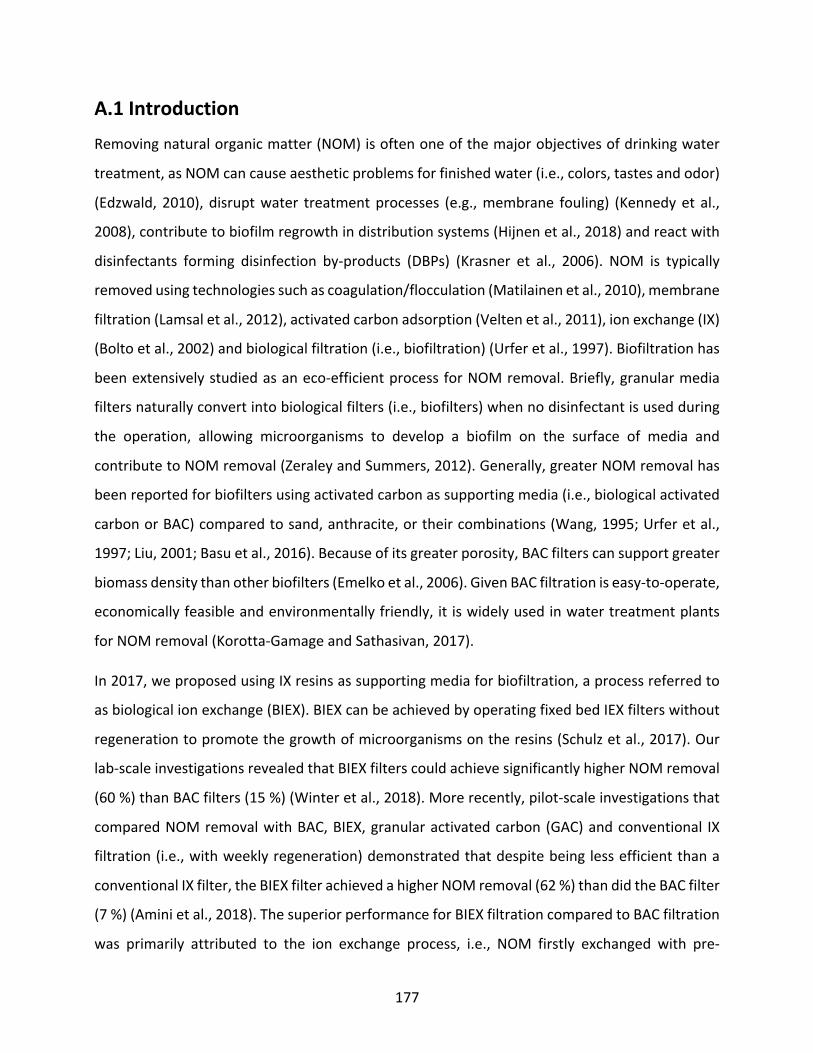
177
A.1 Introduction Removing natural organic matter (NOM) is often one of the major objectives of drinking water
treatment, as NOM can cause aesthetic problems for finished water (i.e., colors, tastes and odor)
(Edzwald, 2010), disrupt water treatment processes (e.g., membrane fouling) (Kennedy et al.,
2008), contribute to biofilm regrowth in distribution systems (Hijnen et al., 2018) and react with
disinfectants forming disinfection by-products (DBPs) (Krasner et al., 2006). NOM is typically
removed using technologies such as coagulation/flocculation (Matilainen et al., 2010), membrane
filtration (Lamsal et al., 2012), activated carbon adsorption (Velten et al., 2011), ion exchange (IX)
(Bolto et al., 2002) and biological filtration (i.e., biofiltration) (Urfer et al., 1997). Biofiltration has
been extensively studied as an eco-efficient process for NOM removal. Briefly, granular media
filters naturally convert into biological filters (i.e., biofilters) when no disinfectant is used during
the operation, allowing microorganisms to develop a biofilm on the surface of media and
contribute to NOM removal (Zeraley and Summers, 2012). Generally, greater NOM removal has
been reported for biofilters using activated carbon as supporting media (i.e., biological activated
carbon or BAC) compared to sand, anthracite, or their combinations (Wang, 1995; Urfer et al.,
1997; Liu, 2001; Basu et al., 2016). Because of its greater porosity, BAC filters can support greater
biomass density than other biofilters (Emelko et al., 2006). Given BAC filtration is easy-to-operate,
economically feasible and environmentally friendly, it is widely used in water treatment plants
for NOM removal (Korotta-Gamage and Sathasivan, 2017).
In 2017, we proposed using IX resins as supporting media for biofiltration, a process referred to
as biological ion exchange (BIEX). BIEX can be achieved by operating fixed bed IEX filters without
regeneration to promote the growth of microorganisms on the resins (Schulz et al., 2017). Our
lab-scale investigations revealed that BIEX filters could achieve significantly higher NOM removal
(60 %) than BAC filters (15 %) (Winter et al., 2018). More recently, pilot-scale investigations that
compared NOM removal with BAC, BIEX, granular activated carbon (GAC) and conventional IX
filtration (i.e., with weekly regeneration) demonstrated that despite being less efficient than a
conventional IX filter, the BIEX filter achieved a higher NOM removal (62 %) than did the BAC filter
(7 %) (Amini et al., 2018). The superior performance for BIEX filtration compared to BAC filtration
was primarily attributed to the ion exchange process, i.e., NOM firstly exchanged with pre-

178
charged chloride on the resin (i.e., primary ion exchange) and then exchanged with pre-retained
sulfate (i.e., secondary ion exchange) (Liu et al., 2020; Edgar et al., 2021). Mass balance studies
indicated that a maximum of 30 % NOM removal in BIEX filters was due to biodegradation (Amini
et al., 2018; Liu et al., 2020).
The performance of biofilters is highly impacted by water temperature given that temperature
directly impacts the rates associated with microbial metabolism as well as mass transfer in
biofilters (Seger and Rothman, 1996; Urfer, 1997; Terry and Summers, 2018; Moona et al., 2019).
Generally, greater NOM removal has been reported for biofilters operated at higher
temperatures than those operated at lower temperatures. For instance, Moll et al. (1999)
reported that biofilters achieved 42 % higher NOM removal at high temperatures (20 °C-35 °C)
compared to those operated at 5 °C. The impact of temperature was also linked to the empty bed
contact time (EBCT) in the biofilters. A longer EBCT leads to longer exposure of water to microbial
colonies and thus increases the amount of NOM to be removed (Moona et al., 2021). For instance,
Hozalski et al. (1999) observed that NOM removal at low temperature could be improved by
applying a longer EBCT, indicating that applying a longer EBCT could offset the negative impact
brought by temperature decline. In order to improve the NOM removal efficiency in biofilters, it
is of importance to understand how temperature and EBCT impact the performance of biofilters
and thereby determine the best operation strategies for biofiltration.
While the impact of temperature and EBCT on conventional biofilters with activated carbon,
anthracite or sand as supporting media has been extensively investigated, the impact of
temperature and EBCT on BIEX filters still remains unclear. Amini et al. (2018) reported on the
impact of temperature on pilot-scale BAC and BIEX filters, but their study was performed under
seasonally dynamic temperature conditions. In addition, their study did not consider the
combined effect of temperature and EBCT on NOM removal.
Considering that NOM removal is achieved through a combination of ion exchange and
biodegradation, the impact of temperature and EBCT on BIEX filters is expected to be different
from that on BAC filters. Hence, the objectives of the present study were to 1) evaluate the
performance of BIEX filters for NOM removal, and 2) evaluate the impact of temperature and

179
EBCT on BIEX performance for NOM removal. The study considered BAC filters as a baseline
against which the performance of BIEX filters could be compared. Bench-scale BIEX filters
operated at different conditions were set up in parallel with BAC filters and their performance for
removing dissolved organic matter (DOC) was monitored for 150 days. The comparison was
assessed based on the extent and rate of NOM removal while the impact of temperature was
quantified using temperature activity coefficients.
A.2 Materials and Methods
A.2.1 Feed water
Jericho Pond water (Vancouver, Canada) was collected and transported to the University of British
Columbia on a monthly basis from December 2017 to April 2018 and then stored in dark at 4 °C
until use. Jericho Pond water was selected for the present study as it contains a broad range of
NOM fractions (biopolymers, humic substances and low molecular weight acids) based on the
analysis using size exclusion chromatography coupled with organic carbon detection (LC-OCD)
(Schulz et al., 2017; Winter et al., 2018). The pond water was filtered through 1.5 μm pore size
glass fiber filters (VWR Glass Microfiber 691) immediately after collection. Prior to use as feed
water, the filtered pond water was diluted with dechlorinated tap water to achieve a targeted
total organic carbon (TOC) of approximately 4.5 mg C/L. The actual DOC concentration of the feed
water ranged from 3.2 to 4.8 mg C/L during the study period (Table A1). The feed water had a
neutral pH and low concentrations of anions (i.e., chloride and sulfate), and NOM present in the
feed water possessed a high biodegradable fraction (approximately 23 % of the feed water DOC).
Table A1 - Feed water physicochemical characteristics. Values and confidence interval
respectively correspond to average and standard deviation of measurements during the study
period.
Parameters Unit Value
pH - 7.0 ± 0.1
Turbidity NTU 0.22 ± 0.02
TOC mg C/L 4.5 ± 0.9

180
BDOC mg C/L 0.9 ± 0.1
DOC mg C/L 4.0 ± 0.8
SUVA L/(mg C∙m) 3.9 ± 0.4
Chloride mg/L 5.0 ± 3.1
Sulfate mg/L 5.7 ± 2.1
A.2.2 Filtration media
Purolite® A860, a strongly basic macroporous polyacrylic anion exchange resin, was used for all
BIEX filters. The IEX capacity of the resin was measured to be 0.68 eq/L with an initial form of
chloride (Amini et al., 2018), and the average IEX bead diameter of 0.75 mm. Wood-based
Picabiol® GAC, with an effective diameter of 1.04 mm, was extracted from an exhausted pilot-
scale GAC filter (> 5 years of operation) and used for all BAC filters.
A.2.3 Bench-scale systems
Three sets of bench-scale systems were used with each set operated at temperature of 4 °C, 10
°C or 20 °C. The systems operated at 4 °C and 10 °C were housed in temperature-controlled rooms
while the systems operated at 20 °C were in an open laboratory at ambient temperature. Each
set of systems consists of a feed water tank (19 L, Pyrex Tank), feed pumps (Masterflex), two BIEX
filters, two BAC filters and a filtrate tank. The components of the systems operated at 20 °C were
covered in aluminum foil to minimize potential algal growth whereas the systems operated at 4
°C and 10 °C were in dark rooms and therefore algal growth was not a concern. The filters had an
internal diameter of 1.25 cm and media depth of approximately 20.0 cm, corresponding to a bed
volume (BV) of 24.5 mL. Each filter had three effluent ports (Port 1, Port 2 and Port 3)
corresponding to an EBCT of 7.5 min (192 BV/day), 15 min (96 BV/day) and 30 min (48 BV/day),
respectively (Figure A1). The filters were operated at a filtration rate of 0.4 m/h (0.82 mL/min).
The filters were backwashed when the height of the water column above the surface of the media
reached 1 m. To backwash the filters, feedwater was connected to the Port 3 and the pump was
operated at maximum flow to fluidize the media and dislodge excess biomass from the media.
The systems were operated for a total period of 150 days, during which the filters operated at 20
181
°C were backwashed approximately every 6 to 8 weeks. The filters operated at 4 °C and 10 °C
never required backwash.
During the operation of the systems, the effluent typically flowed through Port 3 (with Port 1 and
2 being closed), yielding an EBCT of 30 min. Periodically (approximately once per week), the
effluent flow was diverted to either Port 1 or 2 (with other Ports being closed) for sampling. When
effluent flowed through Port 1 or 2, the effluent EBCT was 7.5 min or 15 min, respectively. The
use of Ports 1, 2 and 3 enabled different EBCT to be considered in a single bench-scale system. To
ensure that diverting the effluent flow to Port 1 or 2 did not impact the overall system EBCT, the
diversions were limited to once per week for a maximum of 2 hours. In addition, diversions to
Port 1 or 2 were never within 2 days of each other.
Figure A1 - Bench-scale biofiltration system (single filter illustrated).
A.2.4 Analytical Methods
TOC and DOC were quantified using a Phoenix 8000 TOC analyzer (Dohrmann, US). Ultraviolet
absorbance at 254 nm absorbance (UV254) was measured using a UV300 UV-vis spectrometer
(Spectronic Unicam, USA). DOC and UV254 samples were filtered through 0.45 μm pore size disk
filters (Supor®, Pall) prior to analysis. Biological DOC (BDOC) was measured according to Servais
et al. (1989) and Markarian et al. (2010). Briefly, DOC reduction was measured in water samples
subsequent to an incubation of 30 days with an inoculum of suspended bacteria from the raw
water. Anion concentrations (i.e., chloride and sulfate) were quantified using an ion
chromatography system (DIONEX ICS-1100). Samples were filtered through 0.45 μm PVDF syringe
FeedTank
Media levelPort 1, 5 cm
Port 2, 10 cm
Port 3, 20 cm
Overflow,1 m
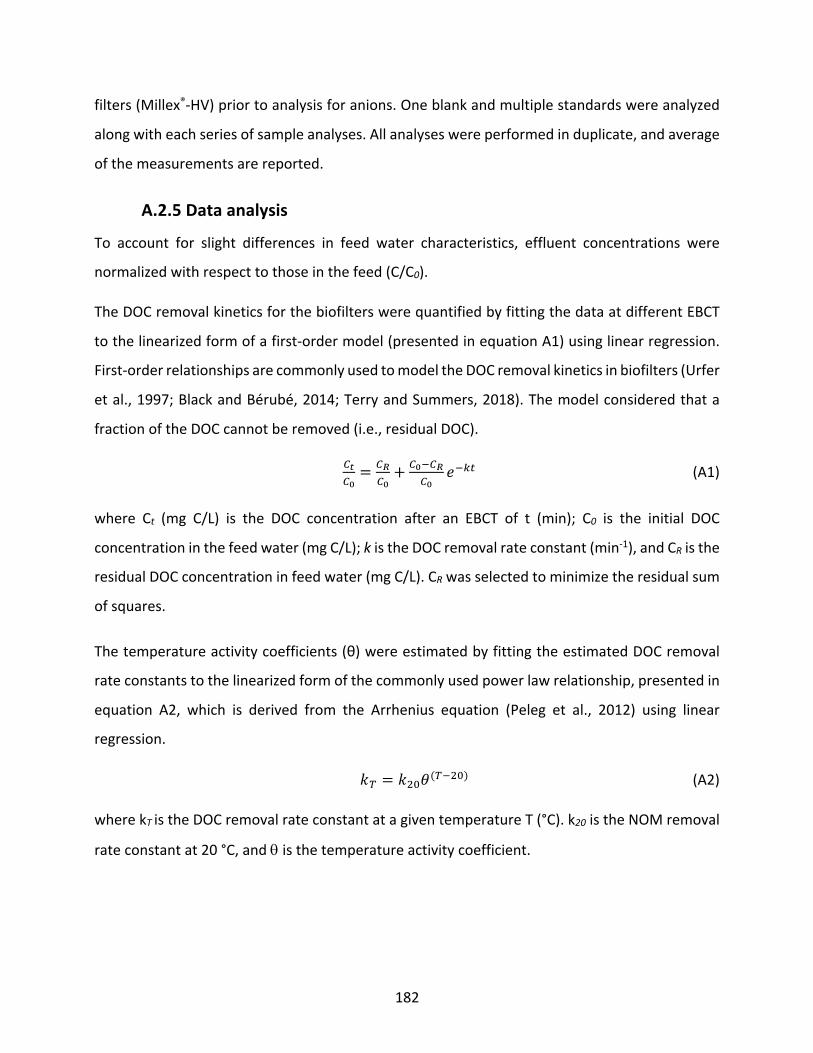
182
filters (Millex®-HV) prior to analysis for anions. One blank and multiple standards were analyzed
along with each series of sample analyses. All analyses were performed in duplicate, and average
of the measurements are reported.
A.2.5 Data analysis
To account for slight differences in feed water characteristics, effluent concentrations were
normalized with respect to those in the feed (C/C0).
The DOC removal kinetics for the biofilters were quantified by fitting the data at different EBCT
to the linearized form of a first-order model (presented in equation A1) using linear regression.
First-order relationships are commonly used to model the DOC removal kinetics in biofilters (Urfer
et al., 1997; Black and Bérubé, 2014; Terry and Summers, 2018). The model considered that a
fraction of the DOC cannot be removed (i.e., residual DOC).
%!%"= %#
%"+ %""%#
%"8"&' (A1)
where Ct (mg C/L) is the DOC concentration after an EBCT of t (min); C0 is the initial DOC
concentration in the feed water (mg C/L); k is the DOC removal rate constant (min-1), and CR is the
residual DOC concentration in feed water (mg C/L). CR was selected to minimize the residual sum
of squares.
The temperature activity coefficients (θ) were estimated by fitting the estimated DOC removal
rate constants to the linearized form of the commonly used power law relationship, presented in
equation A2, which is derived from the Arrhenius equation (Peleg et al., 2012) using linear
regression.
9( = 9$):(("$)) (A2)
where kT is the DOC removal rate constant at a given temperature T (°C). k20 is the NOM removal
rate constant at 20 °C, and q is the temperature activity coefficient.
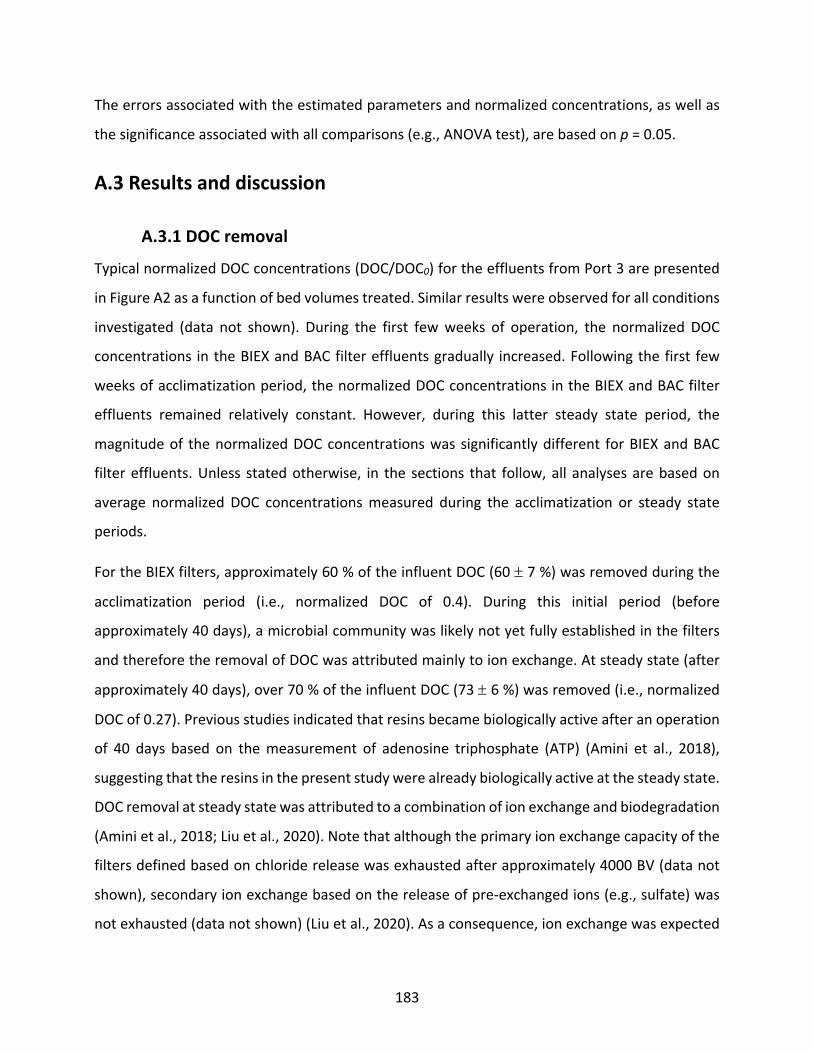
183
The errors associated with the estimated parameters and normalized concentrations, as well as
the significance associated with all comparisons (e.g., ANOVA test), are based on p = 0.05.
A.3 Results and discussion
A.3.1 DOC removal
Typical normalized DOC concentrations (DOC/DOC0) for the effluents from Port 3 are presented
in Figure A2 as a function of bed volumes treated. Similar results were observed for all conditions
investigated (data not shown). During the first few weeks of operation, the normalized DOC
concentrations in the BIEX and BAC filter effluents gradually increased. Following the first few
weeks of acclimatization period, the normalized DOC concentrations in the BIEX and BAC filter
effluents remained relatively constant. However, during this latter steady state period, the
magnitude of the normalized DOC concentrations was significantly different for BIEX and BAC
filter effluents. Unless stated otherwise, in the sections that follow, all analyses are based on
average normalized DOC concentrations measured during the acclimatization or steady state
periods.
For the BIEX filters, approximately 60 % of the influent DOC (60 ± 7 %) was removed during the
acclimatization period (i.e., normalized DOC of 0.4). During this initial period (before
approximately 40 days), a microbial community was likely not yet fully established in the filters
and therefore the removal of DOC was attributed mainly to ion exchange. At steady state (after
approximately 40 days), over 70 % of the influent DOC (73 ± 6 %) was removed (i.e., normalized
DOC of 0.27). Previous studies indicated that resins became biologically active after an operation
of 40 days based on the measurement of adenosine triphosphate (ATP) (Amini et al., 2018),
suggesting that the resins in the present study were already biologically active at the steady state.
DOC removal at steady state was attributed to a combination of ion exchange and biodegradation
(Amini et al., 2018; Liu et al., 2020). Note that although the primary ion exchange capacity of the
filters defined based on chloride release was exhausted after approximately 4000 BV (data not
shown), secondary ion exchange based on the release of pre-exchanged ions (e.g., sulfate) was
not exhausted (data not shown) (Liu et al., 2020). As a consequence, ion exchange was expected
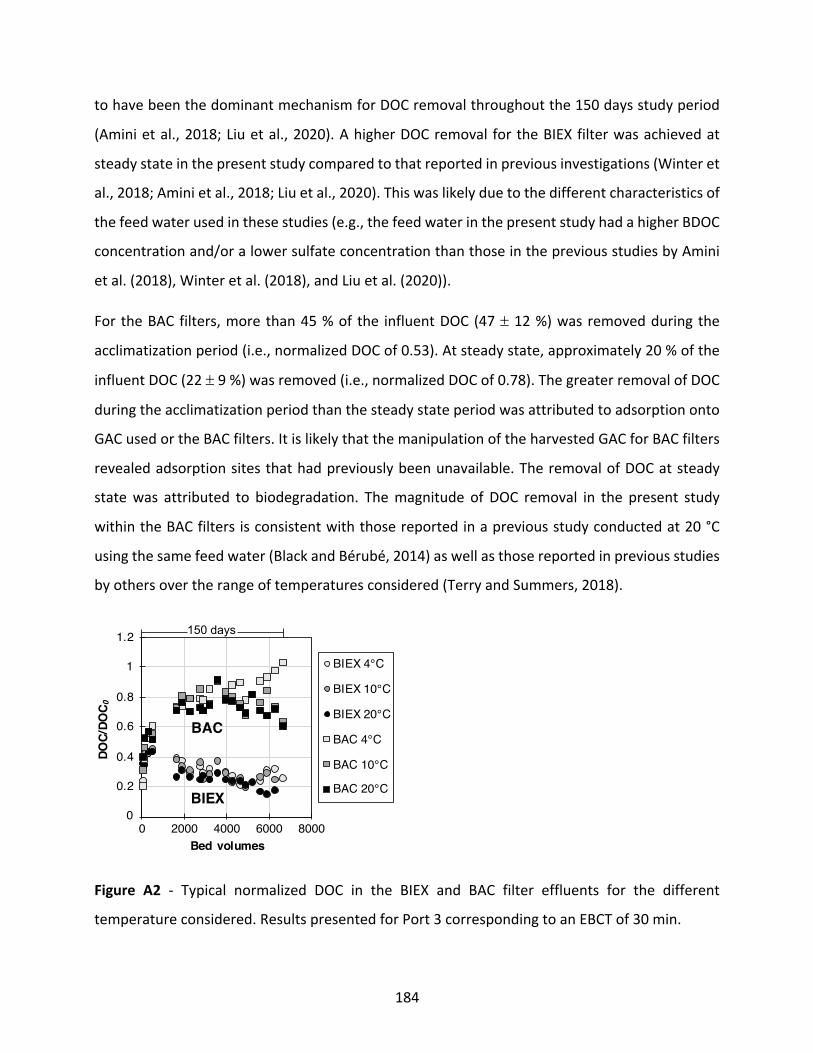
184
to have been the dominant mechanism for DOC removal throughout the 150 days study period
(Amini et al., 2018; Liu et al., 2020). A higher DOC removal for the BIEX filter was achieved at
steady state in the present study compared to that reported in previous investigations (Winter et
al., 2018; Amini et al., 2018; Liu et al., 2020). This was likely due to the different characteristics of
the feed water used in these studies (e.g., the feed water in the present study had a higher BDOC
concentration and/or a lower sulfate concentration than those in the previous studies by Amini
et al. (2018), Winter et al. (2018), and Liu et al. (2020)).
For the BAC filters, more than 45 % of the influent DOC (47 ± 12 %) was removed during the
acclimatization period (i.e., normalized DOC of 0.53). At steady state, approximately 20 % of the
influent DOC (22 ± 9 %) was removed (i.e., normalized DOC of 0.78). The greater removal of DOC
during the acclimatization period than the steady state period was attributed to adsorption onto
GAC used or the BAC filters. It is likely that the manipulation of the harvested GAC for BAC filters
revealed adsorption sites that had previously been unavailable. The removal of DOC at steady
state was attributed to biodegradation. The magnitude of DOC removal in the present study
within the BAC filters is consistent with those reported in a previous study conducted at 20 °C
using the same feed water (Black and Bérubé, 2014) as well as those reported in previous studies
by others over the range of temperatures considered (Terry and Summers, 2018).
Figure A2 - Typical normalized DOC in the BIEX and BAC filter effluents for the different
temperature considered. Results presented for Port 3 corresponding to an EBCT of 30 min.
0
0.2
0.4
0.6
0.8
1
1.2
0 2000 4000 6000 8000
DOC/DOC 0
Bed volumes
BIEX 4°C
BIEX 10°C
BIEX 20°C
BAC 4°C
BAC 10°C
BAC 20°C
BAC
BIEX
150 days

185
A.3.2 Impact of temperature and EBCT on DOC removal
The average DOC removal achieved for the different conditions investigated are presented in
Figure A3. BIEX filters consistently achieved a greater DOC removal (47 %-76 %) than did the BAC
filters (2 %-27 %). In general, an increasing temperature increased DOC removal with the
beneficial impact of temperature being greater at lower EBCTs. Similarly, an increase in EBCT
increased DOC removal with the beneficial impact of EBCT being greater at lower temperatures.
An ANOVA analysis revealed that for the BIEX filters, the increase of temperature could improve
the DOC removal in BIEX filters at an EBCT of 7.5 and 15 min (p < 0.05) whereas temperature had
little impact on the performance at an EBCT of 30 min (p > 0.05). Further, greater EBCTs can
significantly increase the DOC removal for BIEX filters operated at 4 °C and 10 °C, whereas the
DOC removal was improved to a lesser extent for BIEX filters operated at 20 °C (p < 0.05).
For the BAC filters, the increase of temperature constantly improved the DOC removal in BAC
filters for all investigated EBCTs (p < 0.05) even though the improvement on DOC removal was
more significant at low EBCTs (i.e., 7.5 min and 15 min). The increase of EBCT could improve the
DOC removal for BAC filters operated at all temperature investigated, but a more significant
improvement was observed for BAC filters operated at lower temperatures (i.e., 4 °C and 10 °C).
These results are consistent with those from previous studies where temperature was reported
to have a more significant impact on the performance of biofilters at shorter EBCT (Persson et al.,
2006; van der Aa et al., 2011). The outcomes also highlighted that the impact of temperature and
EBCT cannot be investigated separately, as the performance of biofilters for NOM removal
depends on both temperature and EBCT.

186
Figure A3 - Average DOC removal in BIEX and BAC filters during steady state (after about 40 days
of operation) for the different conditions investigated. Error bars correspond the standard error
of averages during the steady state period.
A.3.3 Impact of temperature on DOC removal kinetics
As previously discussed, the DOC removal kinetics for the BIEX and BAC filters were quantified by
fitting a first-order model (equation A1) to the normalized DOC concentrations at the different
EBCT. The model fitted to the normalized DOC vs. EBCT for the different temperature conditions
investigated is presented in Figure A4. For all conditions investigated, the first-order model could
adequately model the normalized DOC concentrations at EBCTs considered (R2 =0.93-0.99).
The normalized DOC removal rate constant and the residual normalized DOC concentration
estimated from the first-order model fitted to the data for the different conditions investigated
are listed in Table A2. Overall, the normalized DOC removal rate constants for the filters increased
as the operating temperature increased even though the increase was not consistently significant.
No consistent trend was observed between temperature and the residual normalized DOC
concentration. For the BIEX filters, the DOC removal rate constant increased from 0.12 ± 0.031
47
60
71
28
15
52
6571
814
23
62
75 76
11
19
27
0
10
20
30
40
50
60
70
80
90
BIEX7.5min
BIEX15min
BIEX30min
BAC7.5min
BAC15min
BAC30min
DO
C re
mov
al (%
)
4°C 10°C 20°C

187
min-1 to 0.24 ± 0.016 min-1 as the temperature increased from 4 °C to 20 °C. All BIEX filters had a
similar residual normalized DOC concentration (CR/C0 = 0.23-0.27). This was expected because
although temperature was expected to impact the DOC removal mechanisms in terms of kinetics,
it was not expected to impact the fraction of non-removable DOC in the feed water (i.e., CR). For
the BAC filters, the DOC removal rate constant increased from 0.02 ± 0.021 min-1 to 0.06 ± 0.003
min-1 as the temperature increased from 4 °C to 20 °C. The DOC removal rate constant at 20 °C
was similar to those reported in a previous study conducted using the same feed water (Black and
Bérubé, 2014). The DOC removal rate constants for all temperature considered were also
consistent with typical first-order DOC removal rate constant (0.02-0.18 min-1) for BAC filters
reported by others (Son et al., 2015; Terry and Summers, 2018). Similar normalized residual DOC
concentrations were observed for all the BAC filters (0.64-0.68), indicating that temperature does
not impact DOC removal mechanisms in terms of capacity.
Overall, the rate and extent of DOC removal were greater for BIEX filters than for BAC filters for
all conditions investigated. This is likely because that DOC was removed through a combination
of ion exchange and biodegradation in the BIEX filters, whereas DOC was only removed through
biodegradation in the BAC filters (Amini et al., 2018; Liu et al., 2020). Therefore, even with higher
EBCTs, BAC filters cannot remove DOC to the same extent as BIEX filters.
0
0.2
0.4
0.6
0.8
1
1.2
1.4
0 10 20 30 40
DOCC
/DO
CC0
Empty bed contact time (min)
BIEX 4°C BAC 4°CBIEX 10°C BAC 10°CBIEX 20°C BAC 20°C
BAC
BIEX
188
Figure A4 - Normalized DOC vs. EBCT at different temperatures. Note that the normalized DOC
data is the same as in Figure A3 but presented with equation A1 fitted to the data. Confidence
intervals were omitted because of overlapping with data symbols.
Table A2 - Normalized DOC removal rate constants, normalized residual DOC concentrations and
temperature activity coefficients for BIEX and BAC filters. The confidence interval as well as values
in the paratheses corresponds to the standard error of the estimated parameters.
Biofilter
type
Temperature
(°C)
Rate
constant (kT)
(min-1)
CR/C0
(-)
Temperature activity
coefficients (θ)
(Present study)
Temperature activity
coefficients (θ)
(Previous study)
Biological
ion
exchange
(BIEX)
4 0.12 ± 0.031 0.27 1.0429
(1.0429-1.0430) 1.04* 10 0.16 ± 0.011 0.28
20 0.24 ± 0.016 0.23
Biological
activated
carbon
(BAC)
4 0.02 ± 0.021 0.65 1.0675
(1.0660-1.0690) 1.04-1.06* 10 0.03 ± 0.004 0.64
20 0.06 ± 0.003 0.68
*Estimated based on the data from Amini et al. (2018) and Terry and Summers, (2018).
The temperature activity coefficients (θ), derived from the Arrhenius equation, can be used to
relate rate constants estimated at different temperatures and to report rate constants estimated
at multiple temperatures using a single rate constant at a reference temperature (e.g., 20 °C). A
temperature activity coefficient greater than 1 indicates that rate constants, and therefore a
reaction, are positively impacted by temperature. The temperature activity coefficient for the
biofilters was quantified by fitting equation 2 to the removal rate constants estimated at different
temperatures. Equation 2 fitted to the DOC removal rate constants vs. temperature for BIEX and
BAC filters is presented in Figure A5. For both BIEX and BAC filters, equation 2 could adequately
model the impact of temperature on DOC removal rate constant (R2 =0.97-0.99). The temperature

189
activity coefficients were estimated to be 1.0429 (1.0429-1.0430) for BIEX biofilters and 1.0675
(1.0660-1.0690) for BAC biofilters. For both BIEX and BAC filters, the temperature activity
coefficients were significantly greater than 1, indicating that temperature impacted DOC removal
for both filters. Also, the estimated temperature activity coefficient for the BAC filters was
significantly greater than that for the BIEX filters, indicating that temperature has a greater impact
on DOC removal in BAC filtration than in BIEX filtration. For the BIEX and BAC filters, the rate
constants at a reference temperature of 20 °C were calculated to be 0.24 ± 0.016 min-1 and 0.06
± 0.003 min-1, respectively (Table A2).
Previous studies have not reported the impact of temperature on biofilters using temperature
activity coefficients. Nonetheless, it was possible to calculate temperature activity coefficients for
some previous studies based on reported data. As presented in table 2, the temperature activity
coefficient of BIEX filters obtained in the present study (i.e., bench-scale tests under constant
temperature conditions) is similar to that calculated from Amini et al. (2018) for pilot-scale tests
conducted under seasonally dynamic temperature conditions. These results suggest that feed
water characteristics have minimal impact on the temperature activity coefficient for BIEX filters.
We hypothesize that ion exchange is less impacted by the feed water characteristics in terms of
temperature activity coefficient. However, the temperature activity coefficient of BAC filters
obtained in the present study is greater than that calculated from Amini et al. (2018), suggesting
that feed water characteristics impact the temperature activity coefficient for BAC filters. In
contrast, the temperature activity coefficient estimated in the present study for BAC filters is
similar to that calculated based on Terry and Summers, (2018) who reported results from an
extensive literature review that assessed DOC removal in biofilters. It is likely that, in addition to
temperatures, the characteristic of the DOC also impacts the temperature activity coefficient.
However, more studies are still needed to evaluate the impact of DOC characteristics for
temperature activity coefficient.
Overall, the results from the present study confirmed that the performance of BIEX filters, in
terms of DOC removal, is significantly impacted by the temperature. However, the impact is not
as great as that for BAC filters. This is likely because DOC removal in BIEX filters results from both
ion exchange, which is less significantly impacted by temperature (Amini et al., 2018), and
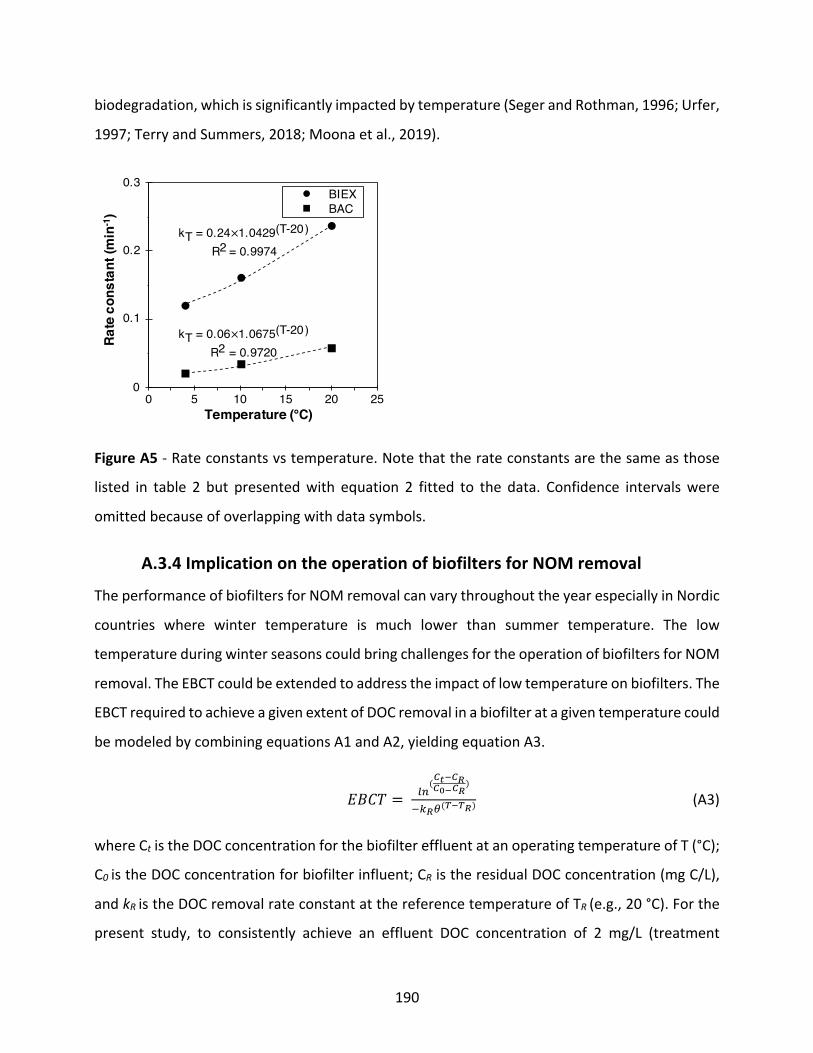
190
biodegradation, which is significantly impacted by temperature (Seger and Rothman, 1996; Urfer,
1997; Terry and Summers, 2018; Moona et al., 2019).
Figure A5 - Rate constants vs temperature. Note that the rate constants are the same as those
listed in table 2 but presented with equation 2 fitted to the data. Confidence intervals were
omitted because of overlapping with data symbols.
A.3.4 Implication on the operation of biofilters for NOM removal
The performance of biofilters for NOM removal can vary throughout the year especially in Nordic
countries where winter temperature is much lower than summer temperature. The low
temperature during winter seasons could bring challenges for the operation of biofilters for NOM
removal. The EBCT could be extended to address the impact of low temperature on biofilters. The
EBCT required to achieve a given extent of DOC removal in a biofilter at a given temperature could
be modeled by combining equations A1 and A2, yielding equation A3.
;<-= = ,-(%!&%#%"&%#)
"&#.((&(#) (A3)
where Ct is the DOC concentration for the biofilter effluent at an operating temperature of T (°C);
C0 is the DOC concentration for biofilter influent; CR is the residual DOC concentration (mg C/L),
and kR is the DOC removal rate constant at the reference temperature of TR (e.g., 20 °C). For the
present study, to consistently achieve an effluent DOC concentration of 2 mg/L (treatment
0
0.1
0.2
0.3
0 5 10 15 20 25
Rate
con
stan
t (m
in-1
)
Temperature (°C)
BIEXBAC
kT= 0.24×1.0429(T-20)
R2= 0.9974
kT= 0.06×1.0675(T-20)
R2 = 0.9720

191
objective based on USEPA, 1999) over range of temperature considered (4 °C-20 °C), the EBCT
required for BIEX filters was estimated to range from 5 min to 9 min. BAC filters could not achieve
the objective of 2 mg/L for any of the conditions investigated.
A.4 Conclusion The present study is the first to systematically study the impact of temperature and empty bed
contact time (EBCT) on biological ion exchange (BIEX) filters for natural organic matter (NOM)
removal with a benchmark of conventional biological activated carbon (BAC) filters. The key
findings are summarized as follows.
• BIEX achieved a higher average dissolved organic matter (DOC) removal (73 ± 6 %) than
did BAC (22 ± 9 %) at steady state with an EBCT of 30 min.
• Higher temperature can significantly improve the DOC removal for BIEX and BAC filters
operated at lower EBCTs (i.e., 7.5 min and 15 min).
• Higher EBCT could significantly improve DOC removal for BIEX and BAC filters operated at
lower temperatures (i.e., 4 °C and 10 °C).
• Temperature had a greater impact on BAC filters than BIEX filters for NOM removal based
on temperature activity coefficients (1.0675 vs.1.0429).
• The impact of temperature and EBCT must be considered in parallel when using drinking
water biofilters for NOM removal.
References Amini, N., Papineau, I., Storck, V., Berube, P. R., Mohseni, M., & Barbeau, B. (2018). Long-term
performance of biological ion exchange for the removal of natural organic matter and ammonia
from surface waters. Water Res, 146, 1-9. doi:10.1016/j.watres.2018.07.057
Basu, O. D., Dhawan, S., & Black, K. (2016). Applications of biofiltration in drinking water
treatment - a review. Journal of Chemical Technology and Biotechnology, 91(3), 585-595.
doi:10.1002/jctb.4860

192
Bolto, B., Dixon, D., Eldridge, R., King, S., & Linge, K. (2002). Removal of natural organic matter by
ion exchange. Water Res, 36(20), 5057-5065. doi:10.1016/s0043-1354(02)00231-2
Edgar, M., & Boyer, T. H. (2021). Removal of natural organic matter by ion exchange: Comparing
regenerated and non-regenerated columns. Water Res, 189, 116661.
doi:10.1016/j.watres.2020.116661
Edzwald, J. K. (2010). Water Quality and Treatment A Handbook on Drinking Water: McGrawHill.
Emelko, M. B., Huck, P. M., Coffey, B. M., & Smith, E. F. (2006). Effects of media, backwash, and
temperature on full‐scale biological filtration. Journal‐American Water Works Association,
98(12), 61-73.
Hijnen, W. A. M., Schurer, R., Bahlman, J. A., Ketelaars, H. A. M., Italiaander, R., van der Wal, A.,
& van der Wielen, P. (2018). Slowly biodegradable organic compounds impact the biostability of
non-chlorinated drinking water produced from surface water. Water Res, 129, 240-251.
doi:10.1016/j.watres.2017.10.068
Hozalski, R. M., Bouwer, E. J., & Goel, S. (1999). Removal of natural organic matter (NOM) from
drinking water supplies by ozone-biofiltration. Water Science and Technology, 40(9), 157-163.
doi:Doi 10.1016/S0273-1223(99)00652-6
Kennedy, M. D., Kamanyi, J., Heijman, B. G. J., & Amy, G. (2008). Colloidal organic matter fouling
of UF membranes: role of NOM composition & size. Desalination, 220(1-3), 200-213.
doi:10.1016/j.desal.2007.05.025
Korotta-Gamage, S. M., & Sathasivan, A. (2017). A review: Potential and challenges of biologically
activated carbon to remove natural organic matter in drinking water purification process.
Chemosphere, 167, 120-138. doi:10.1016/j.chemosphere.2016.09.097
Lamsal, R., Montreuil, K. R., Kent, F. C., Walsh, M. E., & Gagnon, G. A. (2012). Characterization and
removal of natural organic matter by an integrated membrane system. Desalination, 303, 12-16.
doi:10.1016/j.desal.2012.06.025

193
Laurent, P., Prevost, M., Cigana, J., Niquette, P., & Servais, P. (1999). Biodegradable organic
matter removal in biological filters: Evaluation of the CHABROL model. Water Research, 33(6),
1387-1398. doi:Doi 10.1016/S0043-1354(98)00356-X
Liu, X. B., Huck, P. M., & Slawson, R. M. (2001). Factors affecting drinking water biofiltration.
Journal American Water Works Association, 93(12), 90-101. Retrieved from <Go to
ISI>://WOS:000172605800011
Liu, Z., Lompe, K. M., Mohseni, M., Berube, P. R., Sauve, S., & Barbeau, B. (2020). Biological ion
exchange as an alternative to biological activated carbon for drinking water treatment. Water
Res, 168, 115148. doi:10.1016/j.watres.2019.115148
Markarian, A., Carriere, A., Dallaire, P. O., Servais, P., & Barbeau, B. (2010). Hybrid membrane
process: Performance evaluation of biological PAC. Journal of Water Supply Research and
Technology-Aqua, 59(4), 209-220. doi:10.2166/aqua.2010.087
Matilainen, A., Vepsalainen, M., & Sillanpaa, M. (2010). Natural organic matter removal by
coagulation during drinking water treatment: a review. Adv Colloid Interface Sci, 159(2), 189-197.
doi:10.1016/j.cis.2010.06.007
Moll, D. M., Summers, R. S., Fonseca, A. C., & Matheis, W. (1999). Impact of temperature on
drinking water biofilter performance and microbial community structure. Environmental Science
& Technology, 33(14), 2377-2382. doi:DOI 10.1021/es9900757
Peleg, M., Normand, M. D., & Corradini, M. G. (2012). The Arrhenius equation revisited. Crit Rev
Food Sci Nutr, 52(9), 830-851. doi:10.1080/10408398.2012.667460
Persson, F., Heinicke, G., Uhl, W., Hedberg, T., & Hermansson, M. (2006). Performance of direct
biofiltration of surface water for reduction of biodegradable organic matter and biofilm formation
potential. Environmental Technology, 27(9), 1037-1045. doi:10.1080/09593332708618717
Schulz, M., Winter, J., Wray, H., Barbeau, B., & Berube, P. (2017). Biologically active ion exchange
(BIEX) for NOM removal and membrane fouling prevention. Water Science and Technology-Water
Supply, 17(4), 1178-1184. doi:10.2166/ws.2017.016
194
Seger, A., & Rothman, M. (1996). Slow sand filtration with and without ozonation in Nordic
climate. In: John Wiley & Sons, New York.
Servais, P., Anzil, A., & Ventresque, C. (1989). Simple method for determination of biodegradable
dissolved organic carbon in water. Appl Environ Microbiol, 55(10), 2732-2734.
doi:10.1128/aem.55.10.2732-2734.1989
Terry, L. G., & Summers, R. S. (2018). Biodegradable organic matter and rapid-rate biofilter
performance: A review. Water Res, 128, 234-245. doi:10.1016/j.watres.2017.09.048
Urfer, D., Huck, P. M., Booth, S. D. J., & Coffey, B. M. (1997). Biological filtration for BOM and
particle removal: a critical review. Journal American Water Works Association, 89(12), 83-98.
Retrieved from <Go to ISI>://WOS:000071109600014
Van der Aa, L., Rietveld, L., & Van Dijk, J. (2011). Effects of ozonation and temperature on the
biodegradation of natural organic matter in biological granular activated carbon filters. Drinking
Water Engineering and Science, 4(1), 25-35.
Velten, S., Knappe, D. R., Traber, J., Kaiser, H. P., von Gunten, U., Boller, M., & Meylan, S. (2011).
Characterization of natural organic matter adsorption in granular activated carbon adsorbers.
Water Res, 45(13), 3951-3959. doi:10.1016/j.watres.2011.04.047
Wang, J. Z., Summers, R. S., & Miltner, R. J. (1995). Biofiltration performance: part 1, relationship
to biomass. Journal‐American Water Works Association, 87(12), 55-63.
Winter, J., Wray, H. E., Schulz, M., Vortisch, R., Barbeau, B., & Berube, P. R. (2018). The impact of
loading approach and biological activity on NOM removal by ion exchange resins. Water Res, 134,
301-310. doi:10.1016/j.watres.2018.01.052
Zearley, T. L., & Summers, R. S. (2012). Removal of trace organic micropollutants by drinking water
biological filters. Environ Sci Technol, 46(17), 9412-9419. doi:10.1021/es301428e