UNIVERSITA' DEGLI STUDI DI PADOVA
106
1 UNIVERSITA’ DEGLI STUDI DI PADOVA DIPARTIMENTO DI SCIENZE ECONOMICHE ED AZIENDALI “M. FANNO” CORSO DI LAUREA MAGISTRALE IN BUSINESS ADMINISTRATION TESI DI LAUREA CORPORATE CRISIS AND BUSINESS INSOLVENCY FORECASTING MODELS: EMPIRICAL EVIDENCE BY THE FINANCIAL STATEMENTS ANALYSIS AND THE Z-SCORE MODEL. RELATORE: CH.MO PROF. EMILIO PASSETTI LAUREANDA: ALICE BERALDIN MATRICOLA N. 1206762 ANNO ACCADEMICO 2019 – 2020
-
Upload
khangminh22 -
Category
Documents
-
view
0 -
download
0
Transcript of UNIVERSITA' DEGLI STUDI DI PADOVA
1
UNIVERSITA’ DEGLI STUDI DI PADOVA
DIPARTIMENTO DI SCIENZE ECONOMICHE ED AZIENDALI
“M. FANNO”
CORSO DI LAUREA MAGISTRALE IN
BUSINESS ADMINISTRATION
TESI DI LAUREA
CORPORATE CRISIS AND BUSINESS INSOLVENCY
FORECASTING MODELS:
EMPIRICAL EVIDENCE BY THE FINANCIAL
STATEMENTS ANALYSIS AND THE Z-SCORE MODEL.
RELATORE:
CH.MO PROF. EMILIO PASSETTI
LAUREANDA: ALICE BERALDIN
MATRICOLA N. 1206762
ANNO ACCADEMICO 2019 – 2020
2
Il candidato dichiara che il presente lavoro è originale e non è già stato sottoposto, in tutto o in
parte, per il conseguimento di un titolo accademico in altre Università italiane o straniere. Il
candidato dichiara altresì che tutti i materiali utilizzati durante la preparazione dell’elaborato
sono stati indicati nel testo e nella sezione “Riferimenti bibliografici” e che le eventuali citazioni
testuali sono individuabili attraverso l’esplicito richiamo alla pubblicazione originale.
The candidate declares that the present work is original and has not already been submitted,
totally or in part, for the purposes of attaining an academic degree in other Italian or foreign
universities. The candidate also declares that all the materials used during the preparation of
the thesis have been explicitly indicated in the text and in the section "Bibliographical
references" and that any textual citations can be identified through an explicit reference to the
original publication.
3
Contents
1. Introduction ................................................................................................. 7
2. The corporate crisis ..................................................................................... 9
2.1. Definition of corporate crisis ....................................................................................... 9
2.2. Warning signals ......................................................................................................... 13
2.3. Possible causes of corporate crisis ............................................................................. 16
2.3.1. Different approaches in causes identification ..................................................... 16
2.3.2. Types of corporate crisis..................................................................................... 19
2.4. Evolutionary stages in the corporate crisis ................................................................ 21
2.5. Solutions to the corporate crisis ................................................................................. 24
2.5.1. Recovery Plan and Turnaround .......................................................................... 24
2.5.2. Alternatives for managing the corporate crisis ................................................... 26
2.6. Guiding principles in crisis management ................................................................... 28
3. Corporate crisis prevention ....................................................................... 31
3.1. The culture of crisis ................................................................................................... 31
3.2. Business insolvency forecasting models .................................................................... 33
3.2.1. The model-based approach ................................................................................. 35
3.2.2. The non model-based approach .......................................................................... 35
3.3. The Financial Statements Analysis ............................................................................ 41
3.4. The Z-score Model ..................................................................................................... 49
3.4.1. Altman’s first configuration of the Z-score Model ............................................ 49
3.4.2. Altman’s second configuration of the Z-score Model ........................................ 51
3.4.3. Altman’s third configuration of the Z-score Model ........................................... 52
3.4.4. Bottani, Cipriani, and Serao’s configuration of the Z-score Model ................... 52
3.5. The new Italian Bankruptcy Law: the CNDCEC indexes ......................................... 53
4. Research methodology .............................................................................. 57
4.1. Predictive effectiveness of business insolvency forecasting models ......................... 57
4.2. Choice of the models to be tested .............................................................................. 57
4.3. Determination of the sample ...................................................................................... 60
5. Empirical evidence .................................................................................... 65
5.1. Empirical evidence by the Z-score Model ................................................................. 65
5.2. Financial Statements Analysis ................................................................................... 69
5.2.1. Net Financial Position ........................................................................................ 69
4
5.2.2. Current Ratio ...................................................................................................... 72
5.2.3. Acid-test Ratio ................................................................................................... 75
5.2.4. Days Receivables Outstanding and Days Payables Outstanding ....................... 78
5.2.5. Leverage ............................................................................................................. 82
5.2.6. Debt-to-Equity Ratio .......................................................................................... 85
5.2.7. Interest Coverage Ratio ...................................................................................... 88
5.2.8. Financial debts / sales revenues ......................................................................... 90
5.2.9. ROE .................................................................................................................... 93
5.2.10. ROI .................................................................................................................. 96
5.2.11. Considerations about the Financial Statements Analysis ................................ 98
6. Conclusions ............................................................................................. 101
7. Bibliography ............................................................................................ 103
Figures
Figure 1: Development path of negative phases ...................................................................... 10
Figure 2: Stages of deterioration of the company's value ........................................................ 12
Figure 3: Evolutionary stages in the corporate crisis ............................................................... 22
Figure 4: Classification of business insolvency forecasting models........................................ 34
Figure 5: Reclassified Balance Sheet (financial criterion)....................................................... 42
Figure 6: Reclassified Balance Sheet (functional criterion) .................................................... 42
Figure 7: Reclassified Income Statement (respectively Cost of Sales structure, Contribution
Margin structure, Production Value and Added Value structure) ........................................... 43
Figure 8: Combined use of first and second level crisis forecasting tools ............................... 58
Figure 9: Screen of the website of the Italian Ministry of Economic Development ............... 61
Figure 10: Screen of AIDA Bureau van Dijk Database ........................................................... 62
5
Tables
Table 1: Recovery and Turnaround .......................................................................................... 25
Table 2: Critical thresholds for indexes by sector .................................................................... 54
Table 3: Indicators for a timely detection of a possible state of crisis ..................................... 60
Table 4: Final test sample ......................................................................................................... 63
Table 5: Altman’s Z-score relating to one year before the crisis ............................................. 65
Table 6: Altman’s Z-score relating to two years before the crisis............................................ 66
Table 7: Bottani, Cipriani, and Serao’s Z-score relating to one year before the crisis ............. 66
Table 8: Net Financial Position by sector ................................................................................. 69
Table 9: Average Net Financial Position by sector .................................................................. 71
Table 10: Current Ratio by sector ............................................................................................ 72
Table 11: Average Current Ratio by sector .............................................................................. 74
Table 12: Acid-test Ratio by sector .......................................................................................... 75
Table 13: Average Acid-test Ratio by sector............................................................................ 77
Table 14: Days Receivables Outstanding and Days Payables Outstanding by sector.............. 78
Table 15: Average Days Receivables Outstanding and Average Days Payables Outstanding by
sector ......................................................................................................................................... 81
Table 16: Leverage by sector.................................................................................................... 82
Table 17: Average Leverage by sector ..................................................................................... 84
Table 18: Debt-to-Equity Ratio by sector................................................................................. 85
Table 19: Average Debt-to-Equity Ratio by sector .................................................................. 87
Table 20: Interest Coverage Ratio by sector ............................................................................ 88
Table 21: Average Interest Coverage Ratio by sector .............................................................. 90
Table 22: Financial debts / sales revenues by sector ................................................................ 90
Table 23: Average financial debts / sales revenues by sector .................................................. 92
Table 24: ROE by sector .......................................................................................................... 93
Table 25: Average ROE by sector ............................................................................................ 95
Table 26: ROI by sector............................................................................................................ 96
Table 27: Average ROI by sector ............................................................................................. 97

6
7
1. Introduction
The last decade has been characterized by the presence of a structural crisis accompanied by a
severe global recession, that, with particular reference to the Italian context, has led to the
standstill of entire economic sectors in terms of sales and wealth produced. In addition to the
economic stagnation, there have been strong transformations concerning the economic system,
such as changes in the production processes, shifts in consumer habits and tastes, a growing
globalization affecting both the productive and the financial markets. The sum of these events
has put businesses to the test, so much so that nowadays business crisis is considered an integral
part of the company’s life cycle. Corporate crisis no longer represents an extraordinary and
exceptional event; on the contrary, its growing recurrence has led to consider it as a "normal"
moment that any company can face. This new conception has stimulated a line of research
aimed at the timely forecasting of the crisis, since it is assumed that signals linked to detectable
symptoms can be captured and quantified with appropriate instruments. Identifying in time the
premonitory signs can be of great help for the management, which, aware of the critical
situation, can apply the necessary corrective measures. The importance of monitoring the
company’s conditions and preventing the state of crisis is underlined also by the recent Italian
Bankruptcy Reform, through which the Legislator has developed additional tools to the
"classic" ones, to anticipate the emergence of difficulties and to facilitate the recovery process.
Regarding the Italian context, the systematic use of business crisis forecasting tools,
accompanied by their continuous development to adapt to the changing contexts, is fundamental
as the number of companies in difficulty is growing fast in our Peninsula. To get an idea, just
look at the official website of the Italian Ministry of Economic Development
(https://www.mise.gov.it/index.php/it/impresa/imprese-in-difficolta) containing the countless
resumes of the companies for which a "table of crisis" has been opened. On average, every year
146 companies of significant size inform the Government of the decision to reduce or close
their activities in Italy, with a total of employees affected ranging from 118,000 to 180,000.
The number of companies "officially" declared in crisis at the Ministry has increased over the
years: today they are 149, belonging to the most varied sectors. For some, disputes have been
pending for even more than seven years.
Considering the economic framework just described, there is a clear need to develop and to
apply efficient crisis prevention tools endowed with good predictive effectiveness. Among the
most "famous" in literature and the most widespread in practice, there are the Z-score Model
and the Financial Statements Analysis, object of the present work. The aim is to evaluate, from
an empirical point of view, the validity of the Financial Statements Analysis and the Z-score
8
Model as crisis prevention instruments. Both tools have not been free from criticism in the past
years: the Z-score Model has been reformulated several times to adapt to new application
contexts, but its configurations date back to not very recent years and rarely have been applied
to the current Italian entrepreneurial panorama; the Financial Statements Analysis, although
still today constitutes the starting point for the formulation of a judgment on the company’s
state of health, lacks reliability for many people, due to the often altered accounting documents
and the weak ability to highlight the crisis before its degenerative phase. To have an empirical
evidence of their validity, both models will be applied to a sample of Italian companies for
which a table of crisis has been opened at the Ministry of Economic Development. If the
analysis does not demonstrate a good predictive capacity, further reformulations and
modifications will be necessary to adapt the models to the Italian reality.
The present work is organized as follows: Chapter 2 deals with the theme of corporate crisis,
analyzing its evolution stages, warning signals, and describing causes and possible solutions.
In Chapter 3 the most “famous” crisis forecasting models from the literature are presented,
divided into models belonging to the model-based approach and models belonging to the non
model-based approach. In particular, the Z-score Model and the Financial Statements Analysis
will be studied in more detail as objective of analysis for the empirical evidence. The Chapter
ends with a paragraph dedicated to the new alert system (the so-called "red flags") that the
Italian Legislator has implemented through the recent Bankruptcy Reform (decreto legislativo
n. 14/2019). Chapter 4 describes the research methodology that allows building the final test
sample to which models will be applied. Finally, Chapter 5 reports the results obtained from
the application, respectively, of the Z-score Model and the Financial Statements Analysis.
Where obtained results differ from expected results, an attempt has been made to give a possible
explanation of the limitations of the model and to propose an improvement for further
developments or reformulations in the future.
9
2. The corporate crisis
2.1. Definition of corporate crisis
In all market economies, the life of the company is characterized by the alternation of positive
and negative phases: in this sense, it is possible to state that corporate crises are permanent
components of the modern system (Guatri, 1995).
Especially in recent years, the recurrence of crisis situations has led to a "normalization" of the
crisis phenomenon, considered no longer as an exceptional and extraordinary situation, but, on
the contrary, a frequent phase in the company’s life cycle. Recent literature moved in this
direction, modifying the concept and definition of crisis: there has been a shift from the concept
of crisis management, as a sporadic moment of emergency, to the concept of crisis risk
management, thus focusing attention on the ability to interpret warning signals and to intervene
promptly with appropriate and standardized corrective tools.
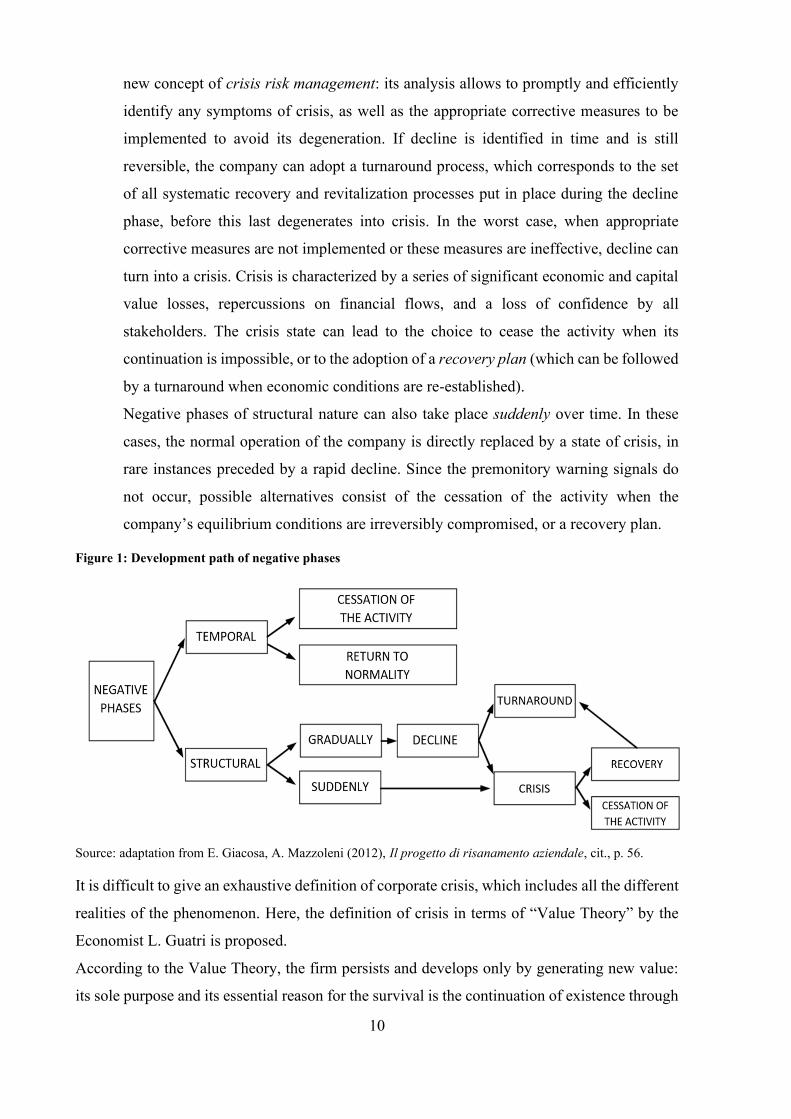
The alternation of successful and crisis phases in the life of a company can take place cyclically
(temporally) or can be structural.
• Negative phases of temporal or cyclical nature are characterized by a periodic rhythm
in the company’s life, according to which positive phases alternate with negative ones.
The company must react to these negative situations to avoid exclusion from the
competitive context. Since it is used to this alternation, it equips itself in advance with
the appropriate and necessary tools to overcome the unsuccessful periods. Following
these cyclical negative phases, the company can return to normal or, in the worst case,
ceases its activity.
• Negative phases of structural nature are the most dangerous. Usually, causes of crisis
remain hidden for a long time, especially if linked to a deep and radical change in the
business context; then they appear suddenly and in an unexpected way, requiring a
change to the business strategy.
Negative circumstances of structural nature can be distinguished by different degrees of
intensity of manifestation. They can take place gradually over time, and therefore
progressively lead to a state of crisis. In these cases, crisis is anticipated by an
intermediate phase called decline, accompanied by warning signals that appear quietly
and progressively intensify. There is not always a marked discontinuity between decline
and crisis, and for this reason the separation between the two is not easy to identify.
Decline harms the company’s equilibrium conditions: if not appropriately thwarted,
decline can degenerate into crisis. Decline is a phase of great interest, at the base of the
10
new concept of crisis risk management: its analysis allows to promptly and efficiently
identify any symptoms of crisis, as well as the appropriate corrective measures to be
implemented to avoid its degeneration. If decline is identified in time and is still
reversible, the company can adopt a turnaround process, which corresponds to the set
of all systematic recovery and revitalization processes put in place during the decline
phase, before this last degenerates into crisis. In the worst case, when appropriate
corrective measures are not implemented or these measures are ineffective, decline can
turn into a crisis. Crisis is characterized by a series of significant economic and capital
value losses, repercussions on financial flows, and a loss of confidence by all
stakeholders. The crisis state can lead to the choice to cease the activity when its
continuation is impossible, or to the adoption of a recovery plan (which can be followed
by a turnaround when economic conditions are re-established).
Negative phases of structural nature can also take place suddenly over time. In these
cases, the normal operation of the company is directly replaced by a state of crisis, in
rare instances preceded by a rapid decline. Since the premonitory warning signals do
not occur, possible alternatives consist of the cessation of the activity when the
company’s equilibrium conditions are irreversibly compromised, or a recovery plan.
Figure 1: Development path of negative phases
Source: adaptation from E. Giacosa, A. Mazzoleni (2012), Il progetto di risanamento aziendale, cit., p. 56.
It is difficult to give an exhaustive definition of corporate crisis, which includes all the different
realities of the phenomenon. Here, the definition of crisis in terms of “Value Theory” by the
Economist L. Guatri is proposed.
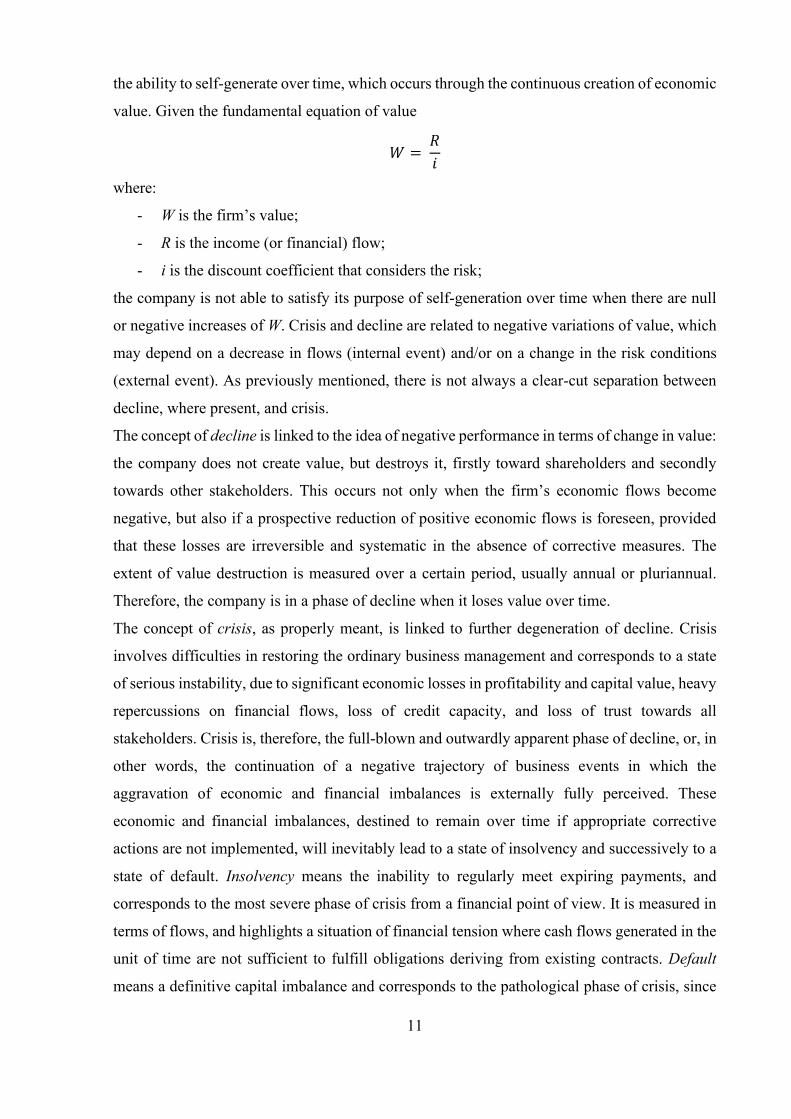
According to the Value Theory, the firm persists and develops only by generating new value:
its sole purpose and its essential reason for the survival is the continuation of existence through
11
the ability to self-generate over time, which occurs through the continuous creation of economic
value. Given the fundamental equation of value
𝑊 = 𝑅
𝑖
where:
- W is the firm’s value;
- R is the income (or financial) flow;
- i is the discount coefficient that considers the risk;
the company is not able to satisfy its purpose of self-generation over time when there are null
or negative increases of W. Crisis and decline are related to negative variations of value, which
may depend on a decrease in flows (internal event) and/or on a change in the risk conditions
(external event). As previously mentioned, there is not always a clear-cut separation between
decline, where present, and crisis.
The concept of decline is linked to the idea of negative performance in terms of change in value:
the company does not create value, but destroys it, firstly toward shareholders and secondly
towards other stakeholders. This occurs not only when the firm’s economic flows become
negative, but also if a prospective reduction of positive economic flows is foreseen, provided
that these losses are irreversible and systematic in the absence of corrective measures. The
extent of value destruction is measured over a certain period, usually annual or pluriannual.
Therefore, the company is in a phase of decline when it loses value over time.
The concept of crisis, as properly meant, is linked to further degeneration of decline. Crisis
involves difficulties in restoring the ordinary business management and corresponds to a state
of serious instability, due to significant economic losses in profitability and capital value, heavy
repercussions on financial flows, loss of credit capacity, and loss of trust towards all
stakeholders. Crisis is, therefore, the full-blown and outwardly apparent phase of decline, or, in
other words, the continuation of a negative trajectory of business events in which the
aggravation of economic and financial imbalances is externally fully perceived. These
economic and financial imbalances, destined to remain over time if appropriate corrective
actions are not implemented, will inevitably lead to a state of insolvency and successively to a
state of default. Insolvency means the inability to regularly meet expiring payments, and
corresponds to the most severe phase of crisis from a financial point of view. It is measured in
terms of flows, and highlights a situation of financial tension where cash flows generated in the
unit of time are not sufficient to fulfill obligations deriving from existing contracts. Default
means a definitive capital imbalance and corresponds to the pathological phase of crisis, since
12
crisis is irreversible at this point. It is measured in terms of stock, and highlights a situation of
corporate deficit such that the value of assets is not sufficient to guarantee debt repayments.
Insolvency and default represent the most acute and dangerous symptoms of a crisis and are
usually observable ex post, when the capacity to react and to manage the crisis is already
limited.
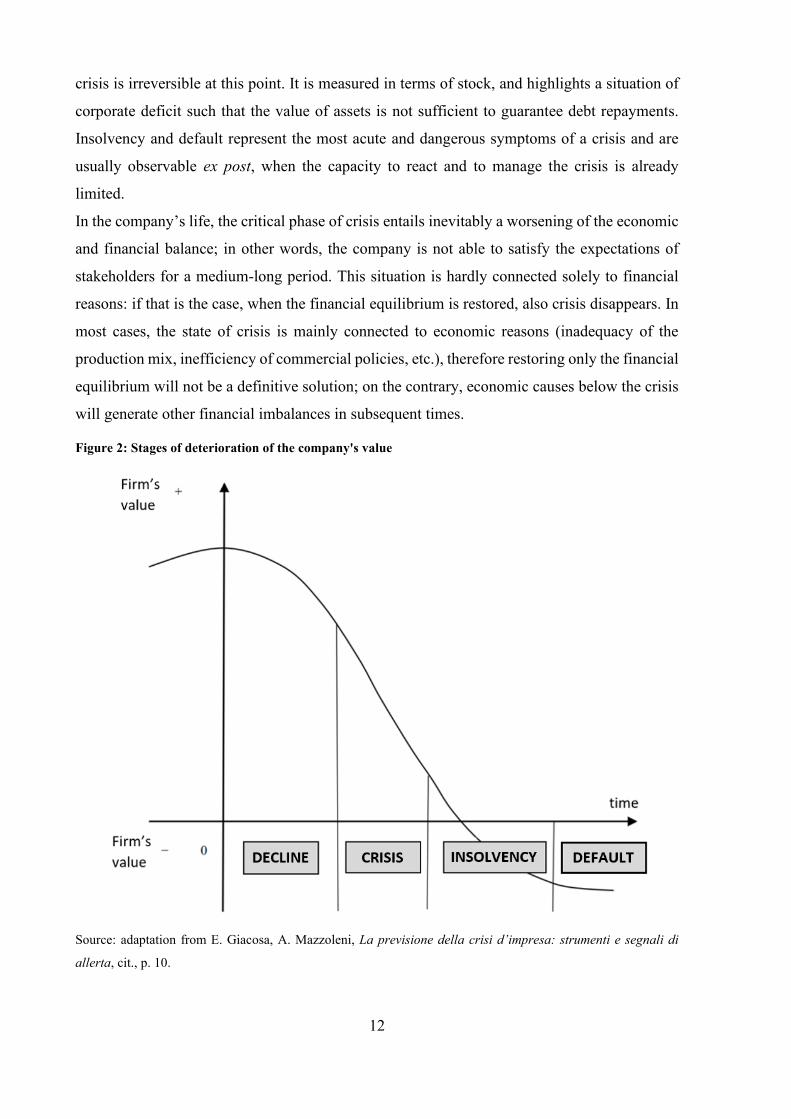
In the company’s life, the critical phase of crisis entails inevitably a worsening of the economic
and financial balance; in other words, the company is not able to satisfy the expectations of
stakeholders for a medium-long period. This situation is hardly connected solely to financial
reasons: if that is the case, when the financial equilibrium is restored, also crisis disappears. In
most cases, the state of crisis is mainly connected to economic reasons (inadequacy of the
production mix, inefficiency of commercial policies, etc.), therefore restoring only the financial
equilibrium will not be a definitive solution; on the contrary, economic causes below the crisis
will generate other financial imbalances in subsequent times.
Figure 2: Stages of deterioration of the company's value
Source: adaptation from E. Giacosa, A. Mazzoleni, La previsione della crisi d’impresa: strumenti e segnali di
allerta, cit., p. 10.
13
2.2. Warning signals
Crisis does not represent an inevitable fact in the life of a company, nor a sudden and
unpredictable event. Both decline and crisis are anticipated and accompanied by warning
signals: the former, although not exclusively, of a qualitative type, the latter of a quantitative
type and, therefore, sometimes measurable. These indicators refer to "internal" phenomena to
the company, thus leaving aside those macro-economic and sectorial events that are also
possible factors of decline and crisis. According to Guatri (1995), among the qualitative
symptoms which generally precede the decline phase, there are:
- worsening in relations with suppliers
This is certainly one of the worst. When suppliers demand short-term or cash payments, monitor
customers’ exposures regularly, or break collaborative relationships, it means that news of
deterioration of the company's conditions has widely spread.
- worsening in relations with the financial community
Generally, banks and financial markets perceive almost immediately phenomena of decline and
crisis, therefore there is a consequent worsening in conditions for obtaining credit (higher
guarantees, higher rates, limitations on certain transactions) or for obtaining capital (bonds with
high rates, convertible bonds with high exchange rates, share prices close to par value).
- tensions in relations with employees
Reduction or immobility of wages, lack of any type of stimulus, cut in resources invested in
personnel training, inevitably lead to a reduction in the personnel or to the use of working forms
with temporary suspension. Growing tensions that will arise are perceived externally as
negative symptoms.
- loss of important managers and highly qualified personnel
The loss of important people not only undermines the image and reputation of the company,
but also leads to an impoverishment of intangible resources with a consequent impact on the
consensus of stakeholders.
- lack of strategic capabilities
This occurs when adopted strategies are unclear and improvised, or change too frequently. At
the same time, the absence of shared strategic goals among human resources can cause
problems in both the short and the medium term.
Among the quantitative symptoms which generally precede the crisis phase, there are:
- loss of market share
The loss of market share is quite evident when global demand is stationary, since the loss is
accompanied by a decrease in sales. The signal is less clear when demand is gearing up: in this
14
case, the loss of market share is "hidden" by an absolute increase in sales. Once global demand
has stabilized, the lower percentage development of the company, compared to its competitors,
will lead to falling sales and approaching difficult conditions.
- loss of profitability and negative cash flows
In particular, situations in which the loss of profitability reduces cash flows, but does not make
them negative, are the most dangerous: the top management is not harassed by financial
pressures and can even postpone losses over time through questionable budgetary policies.
- decrease in sales or worsening of the production mix
Reduction in sales is always a negative sign, except in the cases where it is accompanied by an
increase in prices and margins. Equally negative signs are the shift toward products with lower
margins or when a lowering of the price is used to obtain new orders from customers: if the
expendable margins are narrow, results will become negative soon.
- absolute or relative worsening of productivity
Absolute or relative losses of productivity often occur due to a prolonged lack of investments
in new plants and machinery, the absence or ineffectiveness of R&D activities, or the decreasing
motivation of personnel.
- deterioration of the financial structure
Each sector often requires an appropriate financial structure, both in terms of debt to equity
ratio and in terms of composition of liabilities (short, medium, and long-term debt). A
significant worsening of the financial structure, if not resulting from specific reasons such as
policies for fiscal optimization or policies for the improvement of the company’s value, is a
negative signal to which companies must react promptly with adequate measures (capital
increases, debt restructuring operations).
- strong increase in debt and strong reduction in liquidity
To maintain its normal operations, it is necessary for the company a balance between internal
and external sources of financing, and a certain equilibrium among the different typologies of
external sources. The increase in debt beyond certain thresholds and the decrease in liquidity
below others are among the clearest signs of imbalances, which show a company whose
survival is based on the dependence from external sources.
- higher impairment on trade receivables
High credit losses are usually linked to an inaccurate selection of customers by the company,
dictated by the need to maintain or increase sales levels. Other times it is the evident weakness
of the company that allows customers to obtain better prices, more deferred payment terms,
heavier commitments and services. The loss of the company’s bargaining power leads to a
15
worsening in the credit exposure, which, if it concerns only the single company and not the
whole sector, will inevitably lead to a state of crisis in a short time.
As previously mentioned, the list refers to phenomena internal to the company. However, the
severity and/or the recurrence with which these signals manifest themselves is linked not only
to "internal" problems but also to the sector to which they belong. Some clarifications in this
regard are necessary. Sectors are characterized by different stages of life (new sectors,
expanding sectors, mature sectors), and warning signals occur with different intensities in all
stages. There are imbalances related to the introduction and the novelty of the sector, such as
negative cash flows, initially poor or negative profitability, great variability in prices and market
shares, but also imbalances related to the development of the sector, especially if very rapid.
Some sectors are characterized by a cyclical nature: obviously, imbalances will occur in the
negative periods of the cycle, to be then reabsorbed in the positive ones. Since this "fluctuation"
is predictable, it is unlikely that signals (if linked to the cyclical nature of the sector) are
considered as precursors of a state of decline or crisis. Therefore, only extraordinary
fluctuations in width and duration can be connected to crisis phenomena. Finally, there are
sectors in which competition is more aggressive, due to the entry of foreign competitors
operating with lower costs, to operations of merger and acquisition that increase the competitive
strength of one group over another, or due to the entry of new national competitors. In these
cases, the growth of the market share is pursued by some companies even at the cost of serious
losses for several years: these losses are considered as a long-term productive investment.
Leaving out sectorial events, the list referred to internal phenomena, given its practical utility,
can be considered as an excellent starting point for identifying the phases of decline and crisis;
however, like lists of other authors, it is not exhaustive and, since each company is different, it
cannot have a universal value. Each symptom does not contribute to the creation of value for
the company or, in the worst case, leads to its destruction, therefore the real fundamental
indicator of decline is precisely the destruction of value, detected by the already mentioned
equation W = R / i . Insufficient, null, or even negative variations in W do not allow the company
to achieve its objectives and to survive in the medium-long term. The Value Theory has been
enormously successful in this sense, requiring periodic and systematic control of the value of
the firm and of its main areas. The objective of the Theory is the systematic search of all the
causes of destruction of value and their elimination, using the operational tools of the Value
Based Planning.
16
2.3. Possible causes of corporate crisis
Identifying the symptoms of crisis is useful both for diagnosing its causes and for taking actions
in a timely and effective manner. Regarding the first aspect, the state of crisis is hardly
attributable to a single defined cause; on the contrary, there are usually several factors that
generate it (we often refer to them as “micro causes”). These factors nourish one another and
together contribute to the advancement of the crisis. Generally, the causes of a crisis must be
sought where the sources of the company's competitive advantage reside.
2.3.1. Different approaches in causes identification
The identification and the analysis of the causes are fundamental to develop a correct diagnosis
of the underlying problems and to design an efficient strategy for their resolution, with the
identification of timing, objectives, policies, and measures. This analysis can be carried out by
adopting two different, but contiguous, approaches: the subjective approach and the objective
approach.
According to the subjective approach, the causes of the crisis are attributable to the behavior of
the protagonists of corporate life (the so-called human capital), which are considered as the
only source of corporate success or failure. When a state of crisis occurs, the "bad management"
(or “poor management”) is the first to be accused: an inadequate composition of the
management, an ineffective control of the financial aspects, an inaccurate investment policy,
absence or ineffective sharing of strategic and operational choices with employees, errors in
strategic planning and in the conduct of operations, unethical decisions, an inefficient
management of resources which can be too expensive compared to the objectives to be achieved
and to the results already obtained, are all factors that can compromise a good business
performance. According to this approach, the ownership (controlling interest) is secondly
impeached, usually because of its incorrect policies such as excessive dividend distributions,
risk aversion, unwillingness to provide guarantees to creditors, incorrect management choices.
Lastly, all other human resources operating in the company: the lack of preparation, training,
and motivation, the lack of solidarity towards the lot of the company, the failure in sharing
values, and a mindset far from the company’s logic of quality, can contribute to the
development of negative circumstances for the firm. With the subjective approach, the
elimination of people at different corporate levels (in particular management and ownership)
and, therefore, of their incorrect behaviors, inefficiencies, and incapacities, would lead to the
consequent elimination of the state of crisis. However, such approach is not exhaustive and,
especially today, is not suitable for describing the complex reality of the crisis, given that some

17
events and forces could be "external" to the company and could escape the control of the
management. So, the subjective approach must be integrated with the objective approach.
According to the objective approach, the corporate crisis may also depend on factors external
to the company, uncontrollable and independent of individual behavior. Examples are the
decrease in global demand for a product or a category of products, the increase in the cost of
production factors, the effect of competition on sales prices. The corporate crisis is therefore a
phenomenon linked to the dynamism and instability of the environment. Critical factors to be
controlled must be sought-after where the sources of competitive advantage are located, and
must be selected through appropriate analyses at a macroeconomic level (especially if the
company operates in an international context), at a sectoral level, and at the company’s level.
According to this approach, there are five different typologies of corporate crisis, depending on
the causes that cause them:
• Inefficiency crisis
Inefficiency crisis occurs when one or more sectors of the business operate with returns not in
line with those of competitors. Costs are higher due to obsolete equipment, outdated
technologies, incorrect location of production plants, inability or scarcity of the workforce,
overuse of raw materials, excessive bureaucratic processes. The production area is usually the
most affected, but inefficiency crises can affect also other functional areas: for example, a
commercial inefficiency may occur due to the imbalance between marketing costs and results
obtained (it is the case of an unsuccessful commercial campaign or an excessive dispersion of
sale points that does not allow the generation of adequate results).
• Overcapacity/inflexibility crisis
Overcapacity/inflexibility crisis arises from one of the following situations:
o lasting reduction in the volume of demand for the company due to production
overcapacity at a sector level: in particular the crisis develops if, following this
decrease in demand, the company is not able to adapt its cost structure (especially
fixed costs) to the new lower revenues;
o lasting reduction in the volume of demand for the company related to the loss of
market share: in this case, crisis is more serious since it does not concern the entire
sector (as in the previous situation) but only the specific company, which must
quickly resort to a cost adjustment;
o development of revenues lower than expected, due to fixed investments pre-built for
greater dimensions.

18
A particular case of inflexibility crisis, not connected to overcapacity situations, results from
cost increases not counterbalanced by corresponding price increases (which are subject to
public scrutiny).
• Products decay crisis
Products decay crisis occurs when the reduction of positive margins between price and cost is
below the limit necessary to cover fixed or common costs and to ensure a sufficient profit. This
type of crisis manifests itself at first with imbalances, and later with economic losses. Indicators
to keep under control to avoid the crisis are the gross margin and the contribution margin, the
contraction of which may depend on factors such as the achievement of the maturity stage of
the product, or the market entry of new and more competitive foreign competitors.
• Lack of planning/innovation crisis
Regarding planning, a crisis can result from the inability to adapt the company’s management
to environmental changes. Companies, therefore, operate looking only at the short term, at the
expense of medium-long term results, and totally neglecting the preparation of the necessary
conditions to face the future. Often the lack of programming derives from the inability to
involve people in the company’s management: the absence of training programs and clear
objectives means that the personnel is not encouraged to participate in the management or that
it participates but with little commitment and with the idea of not being able to obtain
advantages. Regarding innovation, poor or inadequate innovation policies in products and
processes lead to a loss of competitiveness for the company. New ideas, which translate into
the identification of new products, new markets, new production methods, new ways of
presenting and distributing products, new tactics for increasing the customer’s loyalty, are
essential to maintain (and to increase) market shares and to be always at the forefront compared
to competitors.
• Financial/capital imbalance crisis
Financial imbalance crisis derives from high debt, high cost of capital agreed with lenders, and
consequently unsustainable financial charges. Specifically, factors that can contribute are:
o serious lack of own funds (capital) and corresponding net prevalence of debt;
o marked prevalence of short-term debt compared to other categories of debt;
o insufficiency or non-existence of liquidity reserves;
o little or no ability of the company to negotiate the conditions of the credit, given its
need to dispose of it at any cost;
o difficulty to meet deadlines, with the consequent delay of some categories of
payments (suppliers, loan reimbursements, social security contributions, wages).
19
Financial imbalance is the typical cause of a crisis and generates economic losses. Sometimes
financial imbalance is associated with a capital imbalance. Capital imbalance crisis occurs when
funds bound to the company (capital and reserves) are scarce compared to other components of
the Balance Sheet (assets and liabilities). The scarcity of own funds does not allow the
absorption of any economic losses, thus exposing the company to a greater risk of crisis and
compromising the equilibrium between assets and liabilities.
All these factors are linked by interactions and cause/effect relationships: the financial
imbalance, for example, is generated by one or more of the other crisis factors, but in turn
involves a further aggravation of these; in the same way, the lack of planning and innovation
can cause products decay and inefficiencies, which in turn develop both financial imbalance
and inflexibility. Although the objective approach is today the most widespread, analyzing the
causes of crisis does not mean identifying only its objective causes: subjective components
must always be considered, to ascertain which ones can be eliminated and which ones cannot.
Therefore, only through the joint use of approaches, it will be possible to achieve an overall
picture of the causes and contributing factors that lead to the crisis phenomenon. Whatever the
cause, crisis develops progressively within the company, but usually it gets evident when the
situation has become almost irreversible.
2.3.2. Types of corporate crisis
The causes leading to a crisis are a combination of events linked to each other, and a distinction
as the one reported in the previous paragraph is difficult. Therefore, different classifications of
types of crisis are proposed below, based on parameters such as the source of the crisis, the
manifestation of its causes, the moment in which it originates, and the object affected by the
crisis.
According to the source of the crisis, it is possible to distinguish:
• crisis with external source
When crisis has an external origin, factors that can be controlled by the management are
few. These crises usually involve one or more economic sectors, and for this reason
require a strategy of productive reconversion as solution. Among them, there are:
o economic crisis, such as the drop in demand, the increase in unemployment, the
increase in prices of raw materials, the weakness of financial markets, the
inadequacy of the banking system, unfavourable changes in sector legislation;
o ecological crisis, that is, phenomena that cause damage to the environment and that
consequently have repercussions on the business activity (the explosion of a nuclear
20
power plant or the spillage of oil into the sea);
o catastrophic crisis, which is linked to accidental damages such as an earthquake, a
tsunami, a flood, or linked to wars and terrorist attacks.
• crisis with internal source
Crises have internal origin when they are caused by strategic and organizational errors
by the management. Among factors of an internal crisis, there are:
o strategic error, when the definition of the mix of investment portfolios is not correct;
o positioning crisis, since the company made mistakes in choosing the market
segments and the niches to serve (a repositioning strategy of the production range is
necessary);
o dimensional crisis, where the surplus or the shortage of resources, or the lack of
flexibility of the structure as against changing external events, cause the company
to be undersized or oversized compared to the production needs and to the results
achieved (here the company has to adopt a restructuring strategy);
o inefficiencies crisis, when there is an imbalance between incurred costs and obtained
results, that can be solved through a reorganization strategy.
Referring to Bibeault's well-known research in Corporate Turnaround: how managers turn
losers into winners (1982), the decline and the subsequent phase of crisis would be mainly
attributable to causes of internal nature in 4 out of 5 cases. However, it should be noted that in
recent decades causes of external nature, such as macroeconomic, political, and social factors,
have accentuated their weight throughout the world as a result of the growing globalization.
According to when causes of crisis occur over time, there will be:
• crises generated by first-line factors, which are at the origin of the crisis and are
represented by lack of planning/innovation, products decay, and inefficiencies;
• crises generated by second-line factors, which come into play at a later time,
aggravating the situation. Among these, overcapacity, inflexibility, and financial
imbalance.
According to when crisis originates, it is possible to distinguish:
• birth crisis, which is due to errors made in the establishment and the design of a new
company, such as strategic mistakes related to its creation phase;
• management crisis, which is due to events occurred during the management of the
company.
21
Lastly, according to the object affected by the crisis, there are the following typologies:
• widespread crisis, when it affects entire sectors or industries;
• specific crisis, when it affects specific weak companies.
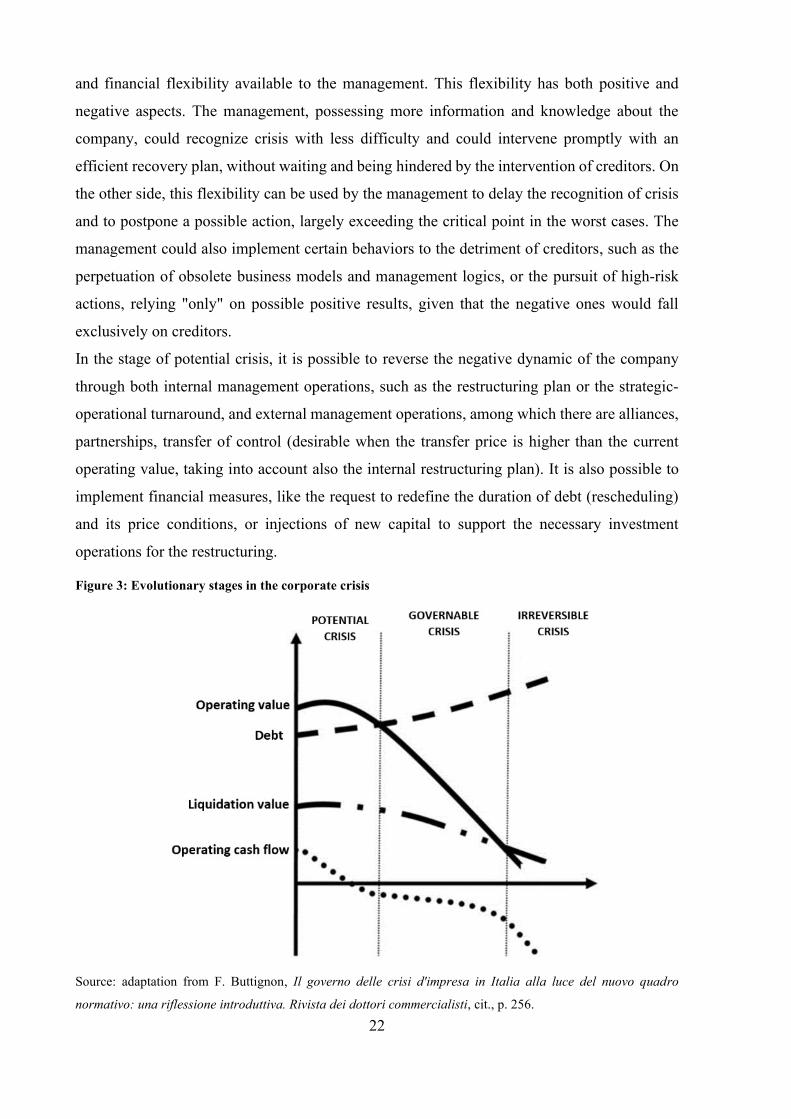
2.4. Evolutionary stages in the corporate crisis
According to Buttignon (2008), it is possible to identify three different stages in the corporate
crisis: potential crisis, governable crisis, and irreversible crisis.
• Potential crisis
Potential crisis is characterized by negative expected operating cash flows or by positive
expected operating cash flows destined inertially to decrease over time. Negative projections
regarding cash flows are due to specific market and company’s phenomena, such as slump in
demand, pressure on prices, loss of products competitiveness, obsolescence of assets, scarce
investments in R&D. Especially in this phase, it is crucial the ability of the management to
perceive and capture the first signs of a crisis, which often appear in a mild form and whose
recognition is hindered by the dominant culture of the company, conditioned by its story, its
past successes, or its consolidated methods for running the business.
In general, the corporate operating value moves in close relation with the expected evolution of
operating cash flows, accentuating its dynamic. In listed companies, this trend is particularly
evident as it is reflected directly, even if according to imperfect logics, in the stock market
prices, stimulating response actions by the management (this is one of the advantages of the
listing). On the contrary, in unlisted companies, the corporate operating value can be only
estimated and, as such, it may differ from subject to subject.
The first stage of potential crisis is characterized by a corporate operating value higher than
value of debt, but with a negative trend that could lead in a short time horizon (1 or 2 years) to
the critical point of the crisis, where the company’s operating value equals the value of debt.
When crisis reaches its critical point, the value of the share capital is zeroed and crisis becomes
"actual", with the potential transfer of control rights over corporate assets from shareholders to
creditors. In Figure 3, value of debt is exemplified growing, given the possible financial needs
induced by negative operating cash flows. However, it may be that, in some situations, debt is
constant or even decreasing (this occurs when, for example, "ancillary" assets are sold).
Characteristics of debt are also important: in general, the longer the debt is long-term, with
periodic repayments rather than a single one, and at price and repayment conditions independent
of management dynamics (case of absence of covenants), the greater the strategic-operational
22
and financial flexibility available to the management. This flexibility has both positive and
negative aspects. The management, possessing more information and knowledge about the
company, could recognize crisis with less difficulty and could intervene promptly with an
efficient recovery plan, without waiting and being hindered by the intervention of creditors. On
the other side, this flexibility can be used by the management to delay the recognition of crisis
and to postpone a possible action, largely exceeding the critical point in the worst cases. The
management could also implement certain behaviors to the detriment of creditors, such as the
perpetuation of obsolete business models and management logics, or the pursuit of high-risk
actions, relying "only" on possible positive results, given that the negative ones would fall
exclusively on creditors.
In the stage of potential crisis, it is possible to reverse the negative dynamic of the company
through both internal management operations, such as the restructuring plan or the strategic-
operational turnaround, and external management operations, among which there are alliances,
partnerships, transfer of control (desirable when the transfer price is higher than the current
operating value, taking into account also the internal restructuring plan). It is also possible to
implement financial measures, like the request to redefine the duration of debt (rescheduling)
and its price conditions, or injections of new capital to support the necessary investment
operations for the restructuring.
Figure 3: Evolutionary stages in the corporate crisis
Source: adaptation from F. Buttignon, Il governo delle crisi d'impresa in Italia alla luce del nuovo quadro
normativo: una riflessione introduttiva. Rivista dei dottori commercialisti, cit., p. 256.
23
• Governable crisis
If the potential crisis cannot be solved, because of the corporate inertia or because of the failure
of planned measures, the second stage of governable crisis is outlined.
This stage is characterized by a corporate operating value lower than debt, but higher than the
liquidation value. In Figure 3, as mentioned before, value of the debt is increasing in the light
of the growing financial needs, while the liquidation value is shown decreasing due to the
probable negative effects also on this value caused by the current crisis.
As in the stage of potential crisis, possible measures to restore the normal positive dynamics
will be the same; however, given the worsening of the situation, they will be inevitably more
radical. Apart from the restructuring plan by internal management operations, alliances, and
partnerships, there may be also the transfer of control to other parties, who take charge of the
restructuring plan with or without the presence of the current shareholders and management.
As in the potential crisis, the severity of the situation may require further capital injections
(indispensable now), the rescheduling of debt, but also its reduction (debt write-off) in exchange
for any concessions of rights on capital (shares, warrants, convertible bonds, and other forms
of options).
• Irreversible crisis
The last phase of irreversible crisis is characterized by a liquidation value higher than the
operating value, therefore the use of a strict liquidation procedure is here justified. If there are
no prospects of recovery of the operating cash flows and if the liquidation value is substantial,
it resorts to a process of disintegration of the corporate system, placing the various assets
promptly to the highest bidder.
Obviously, the liquidation value of the single asset depends on its characteristics. The more the
asset is specific (such as bound production plants, with high disposal costs and limited
possibilities of allocation to other uses), the lower the liquidation value (in certain cases even
negative if the disposal costs exceed the gross liquidation value). On the contrary, it is possible
that intangible assets, such as brands, licenses, patents, and distribution networks, present a high
market value even in the event of liquidation. Particularly interesting are those "hybrid"
situations where, despite the entry into the irreversible crisis phase by the company, there are
still sub-complexes of assets with a potential operating value higher than the liquidation value.
These assets (generally intangible assets), if combined with other corporate elements (first of
all the personnel), but disconnected from pre-existing negative factors (obsolete plants,
incompetent top management), have a substantial operating value that would be wasted with a
24
pure liquidation process. In these situations, “hybrid” solutions for managing the crisis, aimed
at splitting the company and the potentially functioning sub-complex, could be very efficient.
2.5. Solutions to the corporate crisis
2.5.1. Recovery Plan and Turnaround
As highlighted in paragraph 2.1., possible alternatives to the state of crisis consist of the
cessation of the activity, when the company’s equilibrium conditions are irreversibly
compromised, or a recovery plan, which can be followed by a turnaround process.
The two concepts of recovery and turnaround are closely interconnected and linked by a precise
temporal sequence: the turnaround refers to those interventions that are implemented during
the decline (therefore before the company enters the real crisis phase), or after the recovery
plan, when the basic economic conditions have been re-established; the recovery process takes
place after the declaration of the state of crisis, and requires emergency measures that imply
sacrifices to almost all stakeholders.
Recovery process and turnaround differ in the following aspects:
- degree of voluntariness in making choices
The recovery plan provides for choices resulting from negotiations among all stakeholders,
while the turnaround is the synthesis of the choices made between management, shareholders,
and, sometimes but not always, other stakeholders.
- depth of choices
The recovery plan provides for strong and very incisive interventions, which have an impact on
the capital, managerial, and organizational structure; on the other hand, turnaround
interventions are generally less invasive.
- timeliness in choices
Since the interventions of the recovery plan are aimed at healing a company whose short-term
survival is not certain, the negotiations, the implementation of necessary measures, and the
highlighting of the first results must be timely; on the contrary, the turnaround allows longer
times, as there is no absolute urgency.
- form
Although there is no specific legislation to refer to, the form of the recovery plan is rather
standardized. The turnaround process, on the other hand, is implemented through a plan whose
form is usually less rigid and generally on an out-of-court basis.
25
- subjects involved
The recovery phase involves several external subjects with high skills on specific issues. These
subjects, such as temporary or turnaround managers, financial advisors, legal advisors, and
industrial advisors, have as their focus the realization of the project and its timely execution,
and once the objective has been reached, they usually interrupt their collaboration. The
turnaround project is, instead, entrusted to internal managers, who focus on the long-term
development of the company, with the help of external professionals for the preparation of the
economic and financial plan.
Recovery plan and turnaround are sequential activities, where the former becomes the
prerequisite for the latter. In the event of corporate crisis, first of all it, will be necessary to
obtain the recovery, that is, to guarantee the restoration of the conditions of the economic and
financial equilibrium; subsequently, it will necessary to develop and to start the turnaround
process, to take the company beyond the objectives of simple survival, pursuing new medium-
long term objectives. The recovery phase can be divided into two sub-phases, according to their
different objectives and needs: the emergency phase and the stabilization phase. In the
emergency phase of recovery, the goal is to guarantee the survival of the company through the
search for minimum cash flows to meet non-extendable needs (productivity usually remains
negative at this stage). In the stabilization phase, the previous financial logic is substituted by
the economic logic, and the conditions for the company to return to profitability are created.
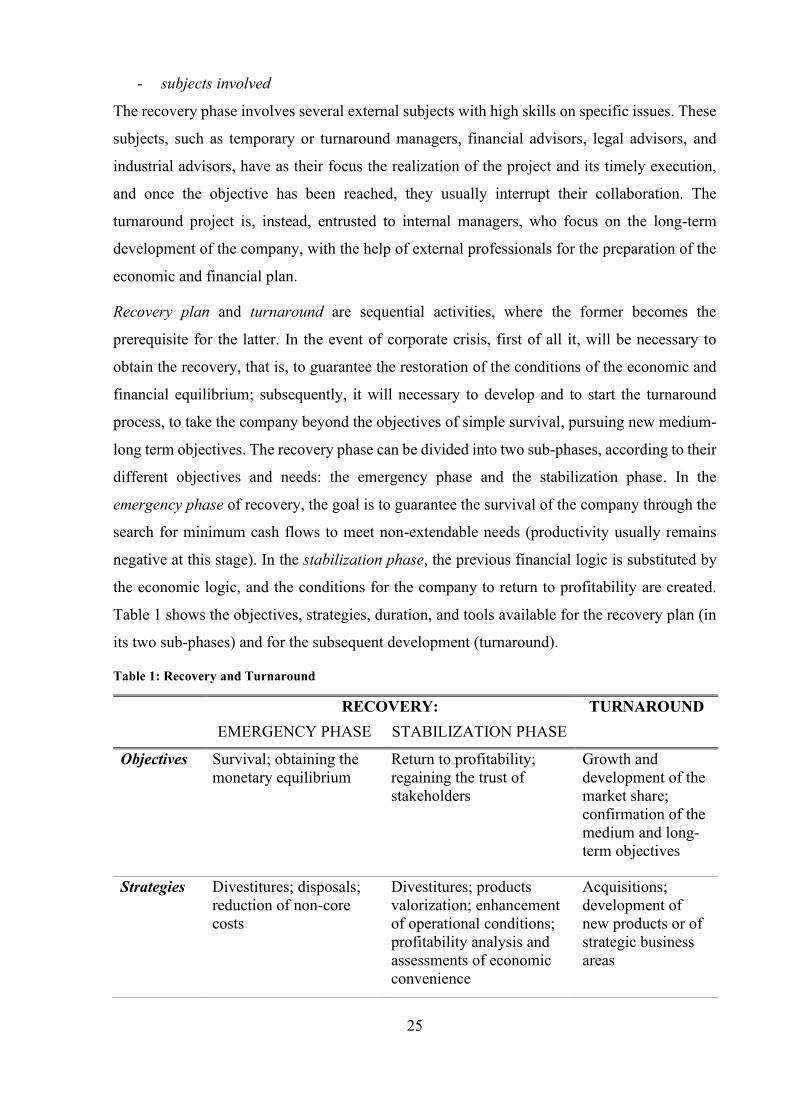
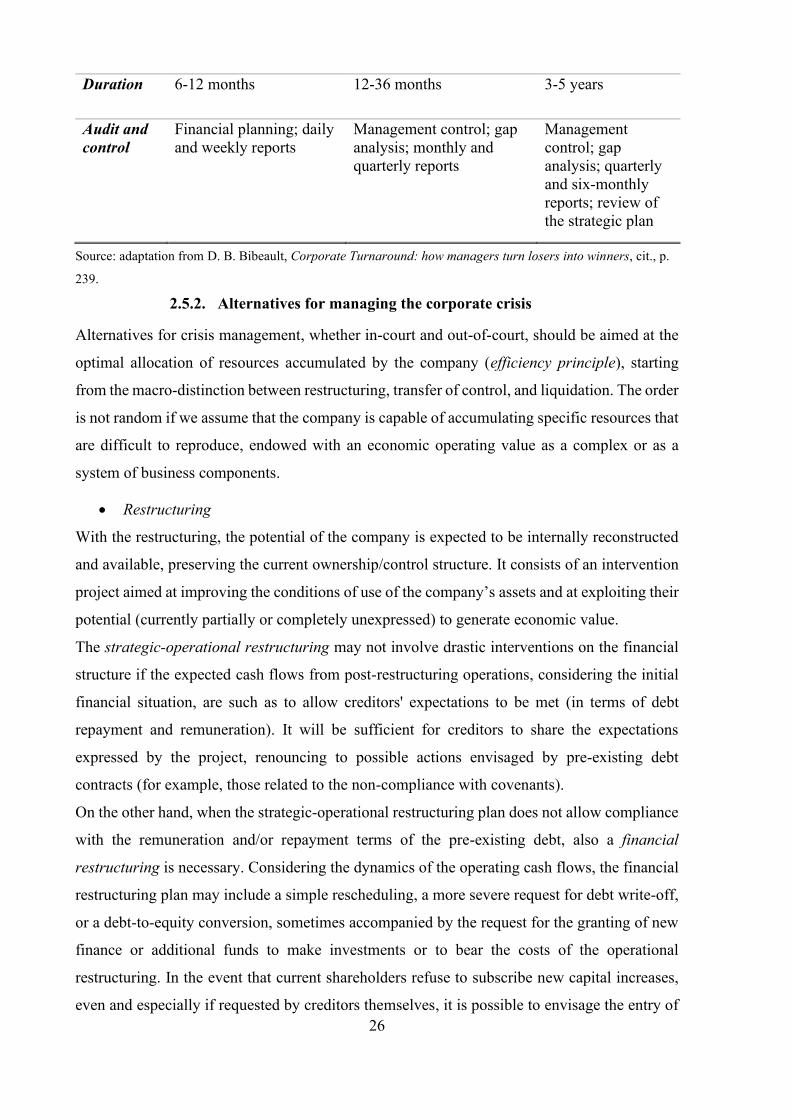
Table 1 shows the objectives, strategies, duration, and tools available for the recovery plan (in
its two sub-phases) and for the subsequent development (turnaround).
Table 1: Recovery and Turnaround
RECOVERY: TURNAROUND
EMERGENCY PHASE STABILIZATION PHASE
Objectives Survival; obtaining the
monetary equilibrium
Return to profitability;
regaining the trust of
stakeholders
Growth and
development of the
market share;
confirmation of the
medium and long-
term objectives
Strategies Divestitures; disposals;
reduction of non-core
costs
Divestitures; products
valorization; enhancement
of operational conditions;
profitability analysis and
assessments of economic
convenience
Acquisitions;
development of
new products or of
strategic business
areas
26
Duration 6-12 months 12-36 months 3-5 years
Audit and
control
Financial planning; daily
and weekly reports
Management control; gap
analysis; monthly and
quarterly reports
Management
control; gap
analysis; quarterly
and six-monthly
reports; review of
the strategic plan
Source: adaptation from D. B. Bibeault, Corporate Turnaround: how managers turn losers into winners, cit., p.
239.
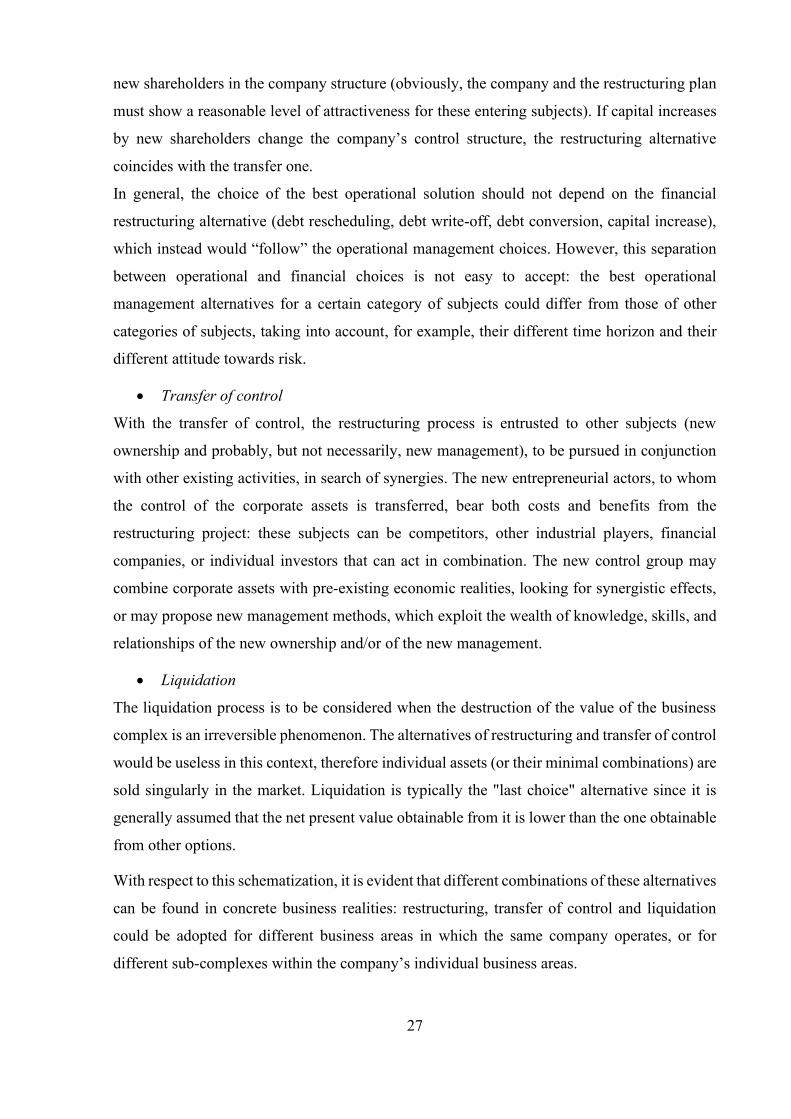
2.5.2. Alternatives for managing the corporate crisis
Alternatives for crisis management, whether in-court and out-of-court, should be aimed at the
optimal allocation of resources accumulated by the company (efficiency principle), starting
from the macro-distinction between restructuring, transfer of control, and liquidation. The order
is not random if we assume that the company is capable of accumulating specific resources that
are difficult to reproduce, endowed with an economic operating value as a complex or as a
system of business components.
• Restructuring
With the restructuring, the potential of the company is expected to be internally reconstructed
and available, preserving the current ownership/control structure. It consists of an intervention
project aimed at improving the conditions of use of the company’s assets and at exploiting their
potential (currently partially or completely unexpressed) to generate economic value.
The strategic-operational restructuring may not involve drastic interventions on the financial
structure if the expected cash flows from post-restructuring operations, considering the initial
financial situation, are such as to allow creditors' expectations to be met (in terms of debt
repayment and remuneration). It will be sufficient for creditors to share the expectations
expressed by the project, renouncing to possible actions envisaged by pre-existing debt
contracts (for example, those related to the non-compliance with covenants).
On the other hand, when the strategic-operational restructuring plan does not allow compliance
with the remuneration and/or repayment terms of the pre-existing debt, also a financial
restructuring is necessary. Considering the dynamics of the operating cash flows, the financial
restructuring plan may include a simple rescheduling, a more severe request for debt write-off,
or a debt-to-equity conversion, sometimes accompanied by the request for the granting of new
finance or additional funds to make investments or to bear the costs of the operational
restructuring. In the event that current shareholders refuse to subscribe new capital increases,
even and especially if requested by creditors themselves, it is possible to envisage the entry of
27
new shareholders in the company structure (obviously, the company and the restructuring plan
must show a reasonable level of attractiveness for these entering subjects). If capital increases
by new shareholders change the company’s control structure, the restructuring alternative
coincides with the transfer one.
In general, the choice of the best operational solution should not depend on the financial
restructuring alternative (debt rescheduling, debt write-off, debt conversion, capital increase),
which instead would “follow” the operational management choices. However, this separation
between operational and financial choices is not easy to accept: the best operational
management alternatives for a certain category of subjects could differ from those of other
categories of subjects, taking into account, for example, their different time horizon and their
different attitude towards risk.
• Transfer of control
With the transfer of control, the restructuring process is entrusted to other subjects (new
ownership and probably, but not necessarily, new management), to be pursued in conjunction
with other existing activities, in search of synergies. The new entrepreneurial actors, to whom
the control of the corporate assets is transferred, bear both costs and benefits from the
restructuring project: these subjects can be competitors, other industrial players, financial
companies, or individual investors that can act in combination. The new control group may
combine corporate assets with pre-existing economic realities, looking for synergistic effects,
or may propose new management methods, which exploit the wealth of knowledge, skills, and
relationships of the new ownership and/or of the new management.
• Liquidation
The liquidation process is to be considered when the destruction of the value of the business
complex is an irreversible phenomenon. The alternatives of restructuring and transfer of control
would be useless in this context, therefore individual assets (or their minimal combinations) are
sold singularly in the market. Liquidation is typically the "last choice" alternative since it is
generally assumed that the net present value obtainable from it is lower than the one obtainable
from other options.
With respect to this schematization, it is evident that different combinations of these alternatives
can be found in concrete business realities: restructuring, transfer of control and liquidation
could be adopted for different business areas in which the same company operates, or for
different sub-complexes within the company’s individual business areas.

28
2.6. Guiding principles in crisis management
Considering what has been said so far, this last section contains the three guiding principles for
the corporate crisis management. These principles have necessarily universal value: the
behavior of any person, internal or external to the company, should be guided at any time by
these principles in identifying and resolving the crisis.
• Efficiency
Efficiency in managing the crisis means reflecting on the best ways to use corporate assets
available to the company. The best solution is the one that provides for the allocation of assets
in their most productive configuration (in other words the allocation that generates the greatest
value), taking into account not only the value of the single assets (atomistic value), but also and
above all their combinatorial properties. This principle guides all the solutions, both out-of-
court and in-court, to allow the optimal allocation of assets among the available alternatives
(restructuring, transfer of control, and liquidation).
The efficiency calculation has the objective of maximizing the total value of assets (enterprise
value), and should be founded on:
o the net present value of expected cash flows from the company’s operations
(implementing the internal restructuring plan, with related costs and investments);
o the net present value of expected cash flows from the transfer of control of the
business complex (sale price net of sale costs);
o the net present value of expected cash flows from the liquidation process (net sale
price of assets).
Strictly speaking, the calculation should also consider the value of the exercise option of other
alternatives following the choice of a specific crisis solution. In particular:
o the net restructuring value should include the values of the transfer option and the
liquidation option that remain in existence in any subsequent phases;
o the net sale value should include the value of the following liquidation option, from
the perspective of new owners.
This principle is valid also in the presence of a total value of assets (even in their optimal
allocation) lower than debt: an agreement with creditors (the so-called “request for sacrifices”)
appears necessary to recover value through the pursuit of the best possible alternative, albeit to
the detriment of creditors. Indeed, theoretically (but also in practice) the optimal solutions are
those characterized by the highest enterprise value, regardless of the distribution of this value
among the various subjects.
29
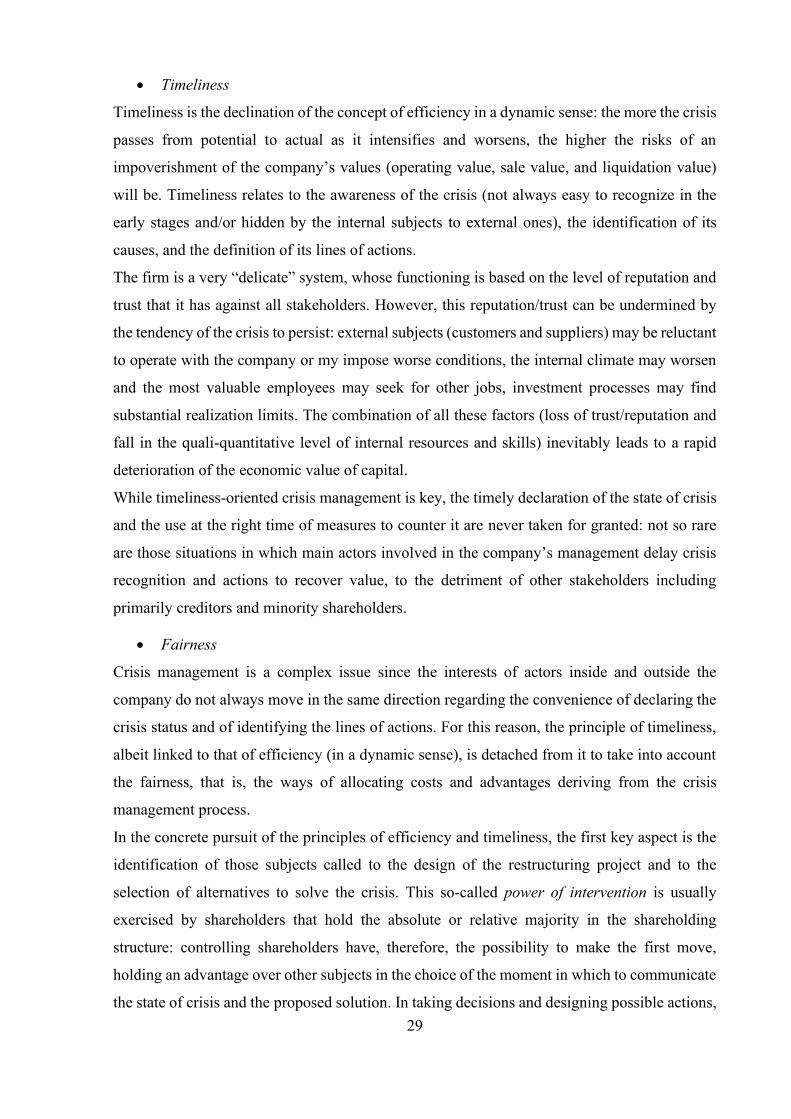
• Timeliness
Timeliness is the declination of the concept of efficiency in a dynamic sense: the more the crisis
passes from potential to actual as it intensifies and worsens, the higher the risks of an
impoverishment of the company’s values (operating value, sale value, and liquidation value)
will be. Timeliness relates to the awareness of the crisis (not always easy to recognize in the
early stages and/or hidden by the internal subjects to external ones), the identification of its
causes, and the definition of its lines of actions.
The firm is a very “delicate” system, whose functioning is based on the level of reputation and
trust that it has against all stakeholders. However, this reputation/trust can be undermined by
the tendency of the crisis to persist: external subjects (customers and suppliers) may be reluctant
to operate with the company or my impose worse conditions, the internal climate may worsen
and the most valuable employees may seek for other jobs, investment processes may find
substantial realization limits. The combination of all these factors (loss of trust/reputation and
fall in the quali-quantitative level of internal resources and skills) inevitably leads to a rapid
deterioration of the economic value of capital.
While timeliness-oriented crisis management is key, the timely declaration of the state of crisis
and the use at the right time of measures to counter it are never taken for granted: not so rare
are those situations in which main actors involved in the company’s management delay crisis
recognition and actions to recover value, to the detriment of other stakeholders including
primarily creditors and minority shareholders.
• Fairness
Crisis management is a complex issue since the interests of actors inside and outside the
company do not always move in the same direction regarding the convenience of declaring the
crisis status and of identifying the lines of actions. For this reason, the principle of timeliness,
albeit linked to that of efficiency (in a dynamic sense), is detached from it to take into account
the fairness, that is, the ways of allocating costs and advantages deriving from the crisis
management process.
In the concrete pursuit of the principles of efficiency and timeliness, the first key aspect is the
identification of those subjects called to the design of the restructuring project and to the
selection of alternatives to solve the crisis. This so-called power of intervention is usually
exercised by shareholders that hold the absolute or relative majority in the shareholding
structure: controlling shareholders have, therefore, the possibility to make the first move,
holding an advantage over other subjects in the choice of the moment in which to communicate
the state of crisis and the proposed solution. In taking decisions and designing possible actions,
30
it would be appropriate to consider and use not only the knowledge of the ownership, but also
the management’s one, as it represents a precious resource. Both stakeholders are in fact
endowed with distinctive skills and knowledges (know-how). However, it is out of the question
that subjects involved in the crisis start from positions very distant from each other regarding
information available, with consequent information asymmetries that can negatively affect the
efficient, timely and fair management of the crisis. Shareholders, for example, could be
incentivized not to communicate the state of crisis, they could pursue high-risk investments
whose negative effects would fall only on creditors, or they could renounce those investments
whose benefits would only benefit creditors. Given that in a state of crisis all stakeholders are
involved and will probably bear the consequent costs, such information asymmetries must be
minimized.
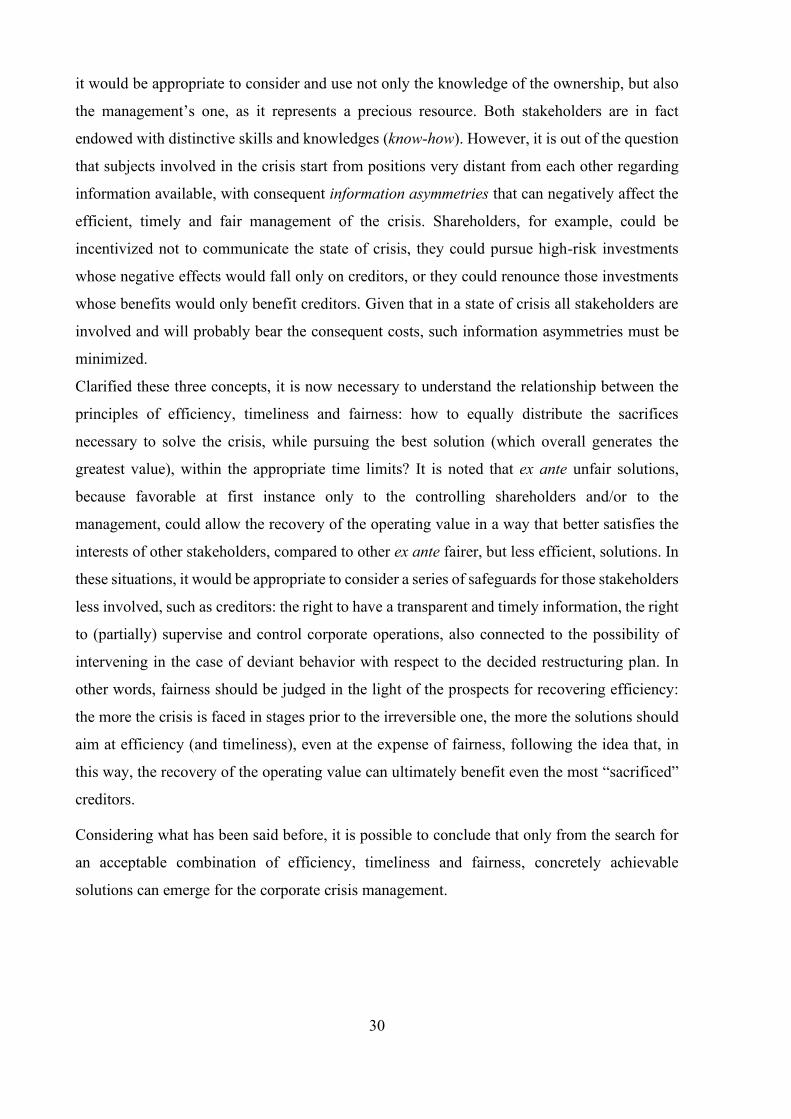
Clarified these three concepts, it is now necessary to understand the relationship between the
principles of efficiency, timeliness and fairness: how to equally distribute the sacrifices
necessary to solve the crisis, while pursuing the best solution (which overall generates the
greatest value), within the appropriate time limits? It is noted that ex ante unfair solutions,
because favorable at first instance only to the controlling shareholders and/or to the
management, could allow the recovery of the operating value in a way that better satisfies the
interests of other stakeholders, compared to other ex ante fairer, but less efficient, solutions. In
these situations, it would be appropriate to consider a series of safeguards for those stakeholders
less involved, such as creditors: the right to have a transparent and timely information, the right
to (partially) supervise and control corporate operations, also connected to the possibility of
intervening in the case of deviant behavior with respect to the decided restructuring plan. In
other words, fairness should be judged in the light of the prospects for recovering efficiency:
the more the crisis is faced in stages prior to the irreversible one, the more the solutions should
aim at efficiency (and timeliness), even at the expense of fairness, following the idea that, in
this way, the recovery of the operating value can ultimately benefit even the most “sacrificed”
creditors.
Considering what has been said before, it is possible to conclude that only from the search for
an acceptable combination of efficiency, timeliness and fairness, concretely achievable
solutions can emerge for the corporate crisis management.
31
3. Corporate crisis prevention
3.1. The culture of crisis
Preventing a corporate crisis is not an easy process. Companies are in continuous evolution,
inserted in an increasingly complex environment, and crisis can derive from a plurality of
causes, both internal and external; therefore, it becomes critical to implement a strategic control
system through which assessing threats from the environment and taking advantage of its
opportunities.
In one of his publications, S.A. Booth talks about an actual “lack of culture of the crisis”, and
the consequent difficulties from subjects involved in realizing it. Warning signals that
accompany the phases of decline and crisis are often misinterpreted, underestimated, or even
ignored by the management and the ownership, since considered transient or aimed at
disappearing without the need for intervention. Regarding the Italian entrepreneurial panorama,
dominated by small and medium-sized family businesses, the literature attributes the role of
prevention, timely identification of crisis, and analysis of collected data, to the entrepreneur-
founder. The "family" entrepreneur constitutes a bivalent attribute for his own company: if it is
true that he is the soul without which the company would not exist, on the other hand he can be
an obstacle to the detection of the crisis and its solution. The entrepreneur sees the company as
a projection of himself, and for this reason there is a real attitude of “refusal” in considering a
crisis as a possible event in his life. The psychological aspect of this identity between the
entrepreneur and the company has, as consequences, the underestimation of the problem, which
is traced back to endogenous and transitory factors (optimistic bias), and subsequently the
silence aimed at not spreading outside the news of a precarious condition of the company, since
the initiation of any procedure would be seen as an "entrepreneurial defeat" (procrastination
bias). Communicating externally the state of crisis would also mean the loss of reputation and
the consequent impairment of goodwill and related intangible assets, such as the brand. The
loss of reputation could in turn incentivize the flight of creditors (rush to the exit), who, in the
face of growing difficulties, could initiate enforcement actions to recover the outstanding
receivables. Moreover, the entrepreneur could believe that only his entrepreneurial skills, which
have made the company grow, are suitable for its recovery: the overconfidence bias could not
only induce the entrepreneur not to ask for help from external professionals, but also could
induce him to take high-risk initiatives to restore the business.
The problem, therefore, lies in these superficial and optimistic attitudes from the main actors
within the company, which do not allow a timely identification of decline and crisis. Although
32
today the business crisis is no longer considered a sporadic and occasional event, but a
widespread and looming phenomenon, the inability to perceive warning signals and
consequently the impossibility of preventing the crisis are among the most difficult
organizational problems to solve. In addition, the collection and the processing of information
are themselves complex operations, and, despite the strict “self-assessment” obligations
imposed by law, managers and owners still struggle to conduct an exhaustive analysis given the
large number of data and variables. There is a real practical difficulty in managing this
enormous amount of information, to which issues related to prospective forecasts are added.
Crisis prevention means the removal of the controllable causes that generate signals, or the
adoption of measures to control, limit, and contain the effects of the uncontrollable causes: as
can be easily deduced, crisis prevention is essential from the company’s internal point of view.
A timely and effective use of the crisis prevention system does not mean always that crisis will
not arise or that will be resolved, but it does offer a possibility in this sense. At the same time,
the research and the identification of the symptoms of decline and crisis respond to the needs
of subjects other than the company (company’s external point of view). In this case, crisis
prediction is an activity conducted equally by creditors (banks, suppliers) and by those
shareholders not involved in the management, to be able to move away from the company as
soon as possible or to limit the negative consequences to their detriment.
Concerning the "cultural" attitude that companies take towards the risk of crisis, two different
categories can be distinguished:
- companies with a culture in favor of the preventive control of decline and crisis
These companies adopt tools to prevent decline or crisis. Generally, the greater is the
experience of the management in the phases of decline and crisis, the greater is its
willingness to invest resources in their prevention.
- companies with a culture not in favor of the preventive control of decline and crisis
These companies do not adopt the necessary tools to prevent decline or crisis, as they
consider investing resources for this purpose a waste of time and money. The
management has a resigned and fatalistic attitude, and believes that such events are
temporary or have a low probability of occurring.
Booth's 1993 survey shows that little more than one out of four companies has a sufficient
culture about crisis prevention, ratio that, although improving, even today remains very low.
33
3.2. Business insolvency forecasting models
Today business crisis is no longer an unusual phenomenon far from the corporate reality, but,
on the contrary, is considered a "normal" and recurring event. Now, more than ever, there is the
need to equip companies with a system of monitoring, control, and prevention of the phases of
decline and crisis, to start a recovery process as soon as possible. Therefore, it is the approach
to the crisis phenomenon that changes, with the consciousness that companies could find
themselves in difficult situations several times in their life cycle. Recent experiences show how
the timing of the stages of the company’s deterioration changes: in the past, the transition from
the phase of decline to the phase of real crisis could take several years, while today, because of
the advent of technology and the consequent digitalization of the businesses, times have been
drastically reduced, sometimes without the occurrence of those typical warning signs. As
emerged from an analysis carried out by E. Giacosa and A. Mazzoleni regarding Italian
corporations in crisis since 2008 (Il progetto di risanamento dell’impresa in crisi, 2012), the
late identification of the state of crisis represents the main cause of failure of the current in- and
out-of-court procedures; furthermore, this late identification is the direct consequence of a
scarce and not widespread corporate culture towards crisis prevention and recovery process. It
becomes necessary to sensitize all company’s actors to the regular use of models aimed at
forecasting the insolvency.
The first scientific contributions aimed at the corporate crisis prevention were based on a look-
backward approach, where the final goal was to bring the company back to its pre-crisis state.
This purely resolutive approach considered the crisis as a stimulus for the recovery of a
structural condition of efficiency. But in the eighties, the advent of globalization, the
intensification of the trade exchanges, the increasing international competition, and the
technological improvement, "forced" the company to change, responding to new challenges and
transforming itself into a production unit open to the markets and the environment. In this new
and complex economic context, many companies started to lose market shares, underlining the
ineffectiveness of those prevention systems based on the look-backward approach. Therefore,
there was no longer the need to return to the pre-crisis situation and to recover from a crisis that
had already begun; rather, new models, based on a completely different approach (the forward-
looking approach), were needed to prevent and to foresee the disease of the company. These
forecasting models are based on the company’s historical and forecasted information, and, by
producing appropriate warning signals, they express an opinion on the capital, financial, and
economic situation of the company. An interesting aspect lies in the increasing reliability of
these models: until a few years ago, traditional forecasting models were limited to assume only
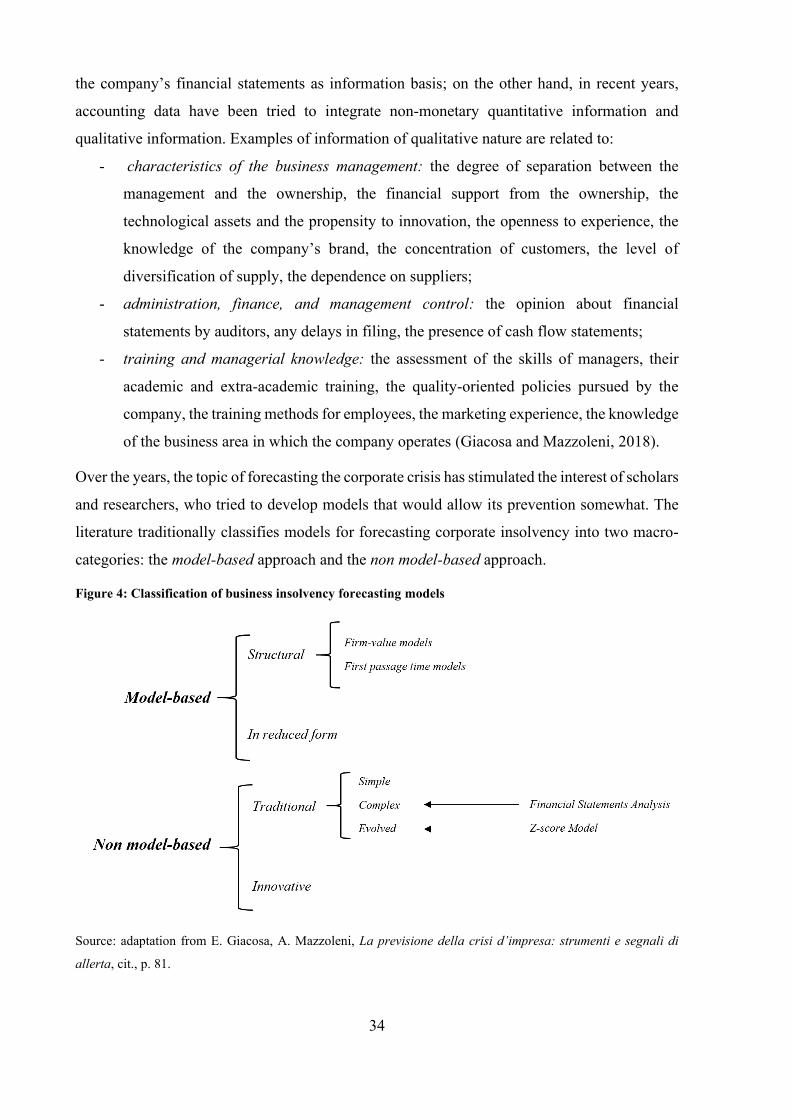
34
the company’s financial statements as information basis; on the other hand, in recent years,
accounting data have been tried to integrate non-monetary quantitative information and
qualitative information. Examples of information of qualitative nature are related to:
- characteristics of the business management: the degree of separation between the
management and the ownership, the financial support from the ownership, the
technological assets and the propensity to innovation, the openness to experience, the
knowledge of the company’s brand, the concentration of customers, the level of
diversification of supply, the dependence on suppliers;
- administration, finance, and management control: the opinion about financial
statements by auditors, any delays in filing, the presence of cash flow statements;
- training and managerial knowledge: the assessment of the skills of managers, their
academic and extra-academic training, the quality-oriented policies pursued by the
company, the training methods for employees, the marketing experience, the knowledge
of the business area in which the company operates (Giacosa and Mazzoleni, 2018).
Over the years, the topic of forecasting the corporate crisis has stimulated the interest of scholars
and researchers, who tried to develop models that would allow its prevention somewhat. The
literature traditionally classifies models for forecasting corporate insolvency into two macro-
categories: the model-based approach and the non model-based approach.
Figure 4: Classification of business insolvency forecasting models
Source: adaptation from E. Giacosa, A. Mazzoleni, La previsione della crisi d’impresa: strumenti e segnali di
allerta, cit., p. 81.
35
It should be recalled, as Professor S. Coronella points out in The forecasting models of
corporate crises: some reflections (2009), that "forecasting corporate insolvency" is a
commonly used terminology, but it would be more correct to talk about "forecasting corporate
crisis" since insolvency is nothing more than one of the two stages of degeneration of the crisis.
3.2.1. The model-based approach
The model-based approach considers two types of models: structural models and models in
reduced form. The most representative models are those of Wilcox (1971) and Scott (1981).
• Structural models estimate ex ante the probability of default of a company with a
definite capital structure, through a purely deductive approach. They are divided into
firm-value models and first passage time models.
o Firm-value models estimate the probability of default based on the evolution
over time of the capital invested in the company, and on the evaluation theory
of financial options developed by Black & Scholes.
o First passage time models estimate the probability of default based on the
probability that the value of the invested capital falls below a certain threshold
called “default boundary”.
• In models in reduced form, crisis is understood as an event completely independent of
the capital structure, and therefore traced back to market factors.
Both structural models and models in reduced form are defined "market models" since their
application requires the availability of information deriving from financial markets, and
therefore they apply only to listed companies. However, the model-based approach has not been
particularly successful and is rarely used in practice as it does not allow the symptoms of the
crisis to be predicted in advance, but only in the terminal phase of the process.
3.2.2. The non model-based approach
The non model-based approach uses historical data from financial statements, making use of an
inductive approach. The idea behind the numerous models of this category is that there are
significant differences between healthy and unhealthy companies, and that it is possible,
through their comparison, to identify quantitative and qualitative variables to work on. The
identification of these critical variables is carried out using statistical techniques. The non
model-based approach considers two types of models: traditional models and innovative
models.

36
• Traditional models are divided into simple, complex, and evolved models.
o Simple models include the summary analysis and the scoring technique.
The summary analysis consists of identifying and interpreting a series of factors
common to all companies regardless of the size, without proceeding with further
processing. The search for information takes place using different sources,
which differ for the ease of access, for the timeliness in obtaining them, and
obviously for the cost. The main sources include accounting documents,
commercial information (punctuality in payments, volume of purchases made,
duration of relationships with credit institutions), information provided by
specialized companies, and information from institutional channels (ISTAT,
court where the company has the registered office). If the company is listed,
further useful information is provided by the ratings from Moody’s, Standard &
Poor’s, and Fitch Ratings, relating to outstanding bonds, market prices of bonds,
market prices of stocks, and their performance over time. Although it is easy and
not so expensive, assessing the status of a company based solely on a summary
analysis allows reaching a modest level of reliability, in some cases even
misleading.
The scoring technique allows to assign a score, corresponding to the probability
of insolvency, based on the answers provided by the company to a questionnaire.
The company answers a series of questions such as the geographical area of
operation, the business name under which it operates, the number of banks with
which it has relationships, the incidence rate of short-term debts on the total, the
number of employees, etc. According to the answers, single percentage scores
are assigned to them: when added together, these scores correspond to the
overall probability of insolvency attributable to the specific company. However,
experience teaches that the scoring technique is not a rigorous forecasting
methodology as the final score is greatly influenced by the type and number of
questions.
o Complex models substantially include the Financial Statements Analysis. The
Financial Statements Analysis starts from the reclassification of Financial
Statements (primarily the Balance Sheet and the Income Statement) to arrive at
the formulation of an overall judgment on the state of health of the company
using accounting indicators. Results obtained are then compared with ideal,
37
indicative, or average results, to provide a company’s overview of its economic,
capital, and financial situation.
The Financial Statements Analysis, as one of the business forecasting insolvency
models used in the present work for the empirical analysis, will be further
analyzed in paragraph 3.3.
o Evolved models include the univariate analysis and the multivariate analysis,
which provide for the application of statistical methodologies to the Financial
Statements Analysis.
- Univariate analysis
The univariate analysis consists of the application of univariate statistical
techniques to the Financial Statement Analysis. Indicators are considered
individually and, according to the values assumed, it is possible to distinguish
between healthy companies and companies in difficulty. Among the main studies
concerning the univariate analysis, the one of W. Beaver is worth mentioning,
dating from the second half of the sixties. Beaver's work constituted an important
starting point for subsequent studies, even if there was no lack of criticism of the
univariate analysis method. These criticisms primarily concern the assumptions
underlying the model. The univariate analysis assumes that there is a linear
relation between the values assumed by indicators and the health status of the
company: in other words, the status of the company will improve or worsen
depending on the variation of the indicator. However, it has been observed that
some indicators do not follow a linear relation, so the company could be, for
example, in a state of difficulty when the values of the same indicator are both
very low and very high. The univariate analysis also assumes that the distribution
of indicators is a Normal distribution, but this is not true for all the indicators,
which can follow distributions different from the Normal one. Finally, the main
criticism concerns the logic underlying the model: taking the variables
individually, the univariate analysis does not consider the interdependence
among them. The company represents a multidimensional and complex system,
connected in all its parts, which cannot be analyzed by considering only one
indicator each time. This limit was solved through the multivariate analysis.
- Multivariate analysis
The multivariate analysis consists of the application of multivariate statistical
techniques to the Financial Statements Analysis. Unlike the univariate analysis,

38
with this methodology indicators are analyzed simultaneously, thus considering
their interdependence. Among the most used and widespread statistical
techniques, there are the multivariate discriminant analysis and the conditional
probability models.
The multivariate discriminant analysis classifies ex ante subjects into two or
more groups (healthy and unhealthy companies in this context), whose
distinction is maximum. The single subject (the company) is classified based on
a single factor, called “discriminatory value”. This value summarizes all the
variables considered, which are linked by a linear combination. In its simplest
form, the multivariate discriminant analysis is presented in the following form:
𝑧𝑖 = 𝛽1 𝑋𝑖1 + 𝛽2 𝑋𝑖2 + … + 𝛽𝑚 𝑋𝑖𝑚
where
- zi is the discriminatory factor (Z-score) for the i-th subject;
- i is the i-th subject (i = 1, …, n);
- j is the j-th variable (j = 1, …, m);
- xij is the value assumed by the j-th variable for the i-th subject;
- βj is the discriminatory coefficient for the j-th variable.
The score attributed to each company summarizes the information obtained from
the m common variables referred to the specific company and allows its
classification in a determined group. The belongingness to one of the two groups
occurs on the basis of a separation value called cut-off point: those with a value
below this threshold will be classified as unhealthy companies, those with a
higher value as healthy companies. In the context of multivariate discriminant
analysis, the most famous works are attributable to E. I. Altman (1983) and R.
J. Taffler (1983).
Altman’s Z-score Model, as one of the business forecasting insolvency models
used in the present work for the empirical analysis, will be analyzed in paragraph
3.4.
Conditional probability models have been introduced since the 1980s, in
response to the need to set up a methodology that does not require the fulfillment
of a series of conditions necessary for obtaining statistically correct results, but
difficult to find in the real world. Conditional probability models include Logit
Models, Probit Models, and Linear Probability Models. The Logit Models are
the most popular, both for their easier construction and for their more correct
39
representation of results. They allow to calculate the probability that a company
belongs to the group of unhealthy companies (Pi) or to the group of healthy
companies (1 - Pi), using data and variables intrinsic to the company. In its
simplest form, the Logit Models is presented in the following form:
𝑃𝑖 = 𝐸 ( 𝑌 = 1 | 𝑋𝑖 ) = 1
1 + 𝑒− ( 𝛼+ 𝛽1 𝑋𝑖1 + 𝛽2 𝑋𝑖2 + … + 𝛽𝑚 𝑋𝑖𝑚 )=
1
1 + 𝑒−𝑧
where
- Y is the binary variable, which is equal to 1 if the company is unhealty and 0
is it is healty;
- Xij is the value assumed by the j-th index (j = 1, …, m) for the i-th company
(i = 1, …, n);
- α is a constant;
- βj is the weight associated to the index Xj.
It should be noted that in Logit Models, unlike in the discriminant analysis, the
relationship between independent variables and the probability of default is no
longer linear: a company with a high probability of default is affected in a more
limited way by variations (both ameliorative and pejorative) of its indicators,
compared to a company with a lower probability of default. In addition, Logit
Models can consider as independent variables also qualitative variables, which,
once inserted in the formula, will assume the values 0 or 1 (dummy variables).
• Innovative models are extremely numerous and different from each other, both for the
type of information considered and for the level of information processing. They are
based on particularly sophisticated statistical techniques, characterized by high degrees
of complexity (artificial intelligence) and consequently by high costs. The following
models are reported because of their interesting operational use or because they are
potentially susceptible to future developments (as some are still in the embryonic stage).
o The Recursive Partitioning Algorithm Analysis is a non-parametric
computerized methodology designed by J. H. Friedman in the mid-seventies.
Once relevant data on which to base the decision to grant credit has been
acquired, the underlying logic consists of estimating costs and losses associated
with the following three alternatives: granting the credit, refusing the grant, or
postponing the grant decision after further information. In this way, the so-called
“decision tree” is obtained, since, depending on the choice, a series of
alternatives at different levels are opened, to be considered as a function of costs
40
and losses associated. Each "node" (in particular final nodes are called "leaves")
will be assigned a score on which the judgment of the choice will be based. This
model is optimal only if a high number of variables is used; however, it must be
considered that as variables increase, costs increase, and obviously also the
complexity of its use rises exponentially.
o Neural networks are non-linear dynamic systems with different degrees of
freedom, used to solve particularly difficult computational problems. This
method imitates how the human mind is believed to work, and therefore as
humans acquire knowledge and manifest their intuitions. Neural networks, like
the human mind, learn from the experience: they are instructed to recognize
incoming information, to process it using rational techniques, gradually
becoming “wiser” and making fewer errors on outgoing data. This methodology,
despite being able to distinguish a healthy company from an unhealthy one even
on the basis of qualitative information, requires a long time to develop and is
subject to rapid obsolescence.
o Genetic algorithms, designed by J. H. Holland in the mid-seventies, replicate the
mechanism of biological evolution of the species according to the Darwinian
logic. These algorithms should identify the best companies and, by analyzing
different combinations of variables of the population considered, should capture
any symptoms of potential crises.
o Fuzzy sets were designed by L. A. Zadeh in the mid-sixties. The underlying
"fuzzy" logic is in contrast with the classic Aristotelian logic, where everything
oscillates between “yes and no” or between “true and false”. According to
Zadeh, the binary logic can be applied to the artificial world of mathematics, but
not to the real world, where the boundaries are not clear-cut and it is necessary
to think in terms of “gray zones”. Fuzzy sets represent the new frontier of the
forecasting models; however, given their high complexity and high costs, only
large users as banks, financial companies, or rating companies, can afford them.
The non model-based approach is the only one to have been applied in practice with significant
results. What is observed, with the development and refinement of technology, is an increasing
complexity of all the models, correlated by a greater degree of reliability and inevitably by
higher costs. For this reason, there has not been a parallel diffusion of these models in their
most updated version. Furthermore, the level of uncertainty (physiological and congenital in
any model) is destined to increase in historical periods such as the present one, in which the

41
country is in a situation of deep crisis: variables considered are altered and this decreases the
degree of reliability of any model.
Paragraphs 3.3. and 3.4. are dedicated respectively to the Financials Statements Analysis and
the Z-score Model of Altman, as models used in the empirical analysis about the forecasting of
insolvency of defaulted companies at the Italian Ministry of Economic Development.
3.3. The Financial Statements Analysis
Among the most widespread, but also most discussed, tools for identifying the signs of a
potential crisis, there is certainly the Financial Statements Analysis. The Financial Statements
Analysis provides information regarding the company’s partial aspects or the company as a
whole, allowing the assessment of its actual condition and, therefore, the co-presence of the
capital, financial, economic and monetary equilibriums. Financial Statements are the starting
point of the analysis. Their reading allows to obtain a valid diagnostic picture of the situation
only if past trends are representative of current and future trends of the company. Consequently,
statements of at least three consecutive years, before the current one, must be used to outline
the most likely scenario for the development of the business. Only in this way a deep ratios
analysis, carried out by observing their trend over time and their comparison with external
benchmark parameters, provides a reliable opinion on the state of health of the company.
The economic and financial ratios necessary for the analysis can be obtained only after a correct
reclassification of the Financial Statements through the information reported in the Notes. The
first accounting prospectus, the Balance Sheet, is reclassified according to the financial
criterion. Assets are classified on the basis of the time presumably necessary for their return in
liquid form (decreasing liquidity criterion), showing first those assets that are already liquid or
that will turn into liquid form within the next twelve months (current assets), and then those
assets that will return to liquid form after twelve months (fixed assets). Vice versa, sources of
financing are classified according to the time presumably necessary for their repayment
(decreasing eligibility criterion), highlighting first funds maturing within twelve months (short-
term liabilities), then funds maturing after twelve months (long-term liabilities), and finally
sources whose reimbursement is not predeterminable (equity or capital).
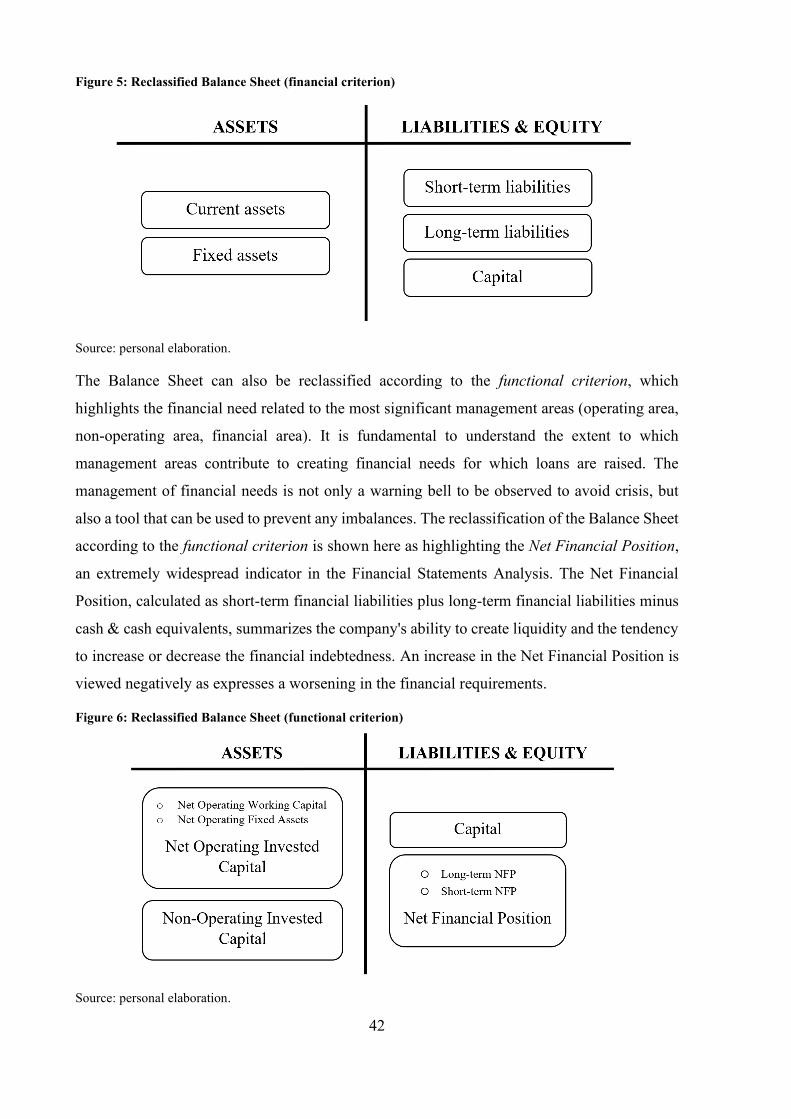
42
Figure 5: Reclassified Balance Sheet (financial criterion)
Source: personal elaboration.
The Balance Sheet can also be reclassified according to the functional criterion, which
highlights the financial need related to the most significant management areas (operating area,
non-operating area, financial area). It is fundamental to understand the extent to which
management areas contribute to creating financial needs for which loans are raised. The
management of financial needs is not only a warning bell to be observed to avoid crisis, but
also a tool that can be used to prevent any imbalances. The reclassification of the Balance Sheet
according to the functional criterion is shown here as highlighting the Net Financial Position,
an extremely widespread indicator in the Financial Statements Analysis. The Net Financial
Position, calculated as short-term financial liabilities plus long-term financial liabilities minus
cash & cash equivalents, summarizes the company's ability to create liquidity and the tendency
to increase or decrease the financial indebtedness. An increase in the Net Financial Position is
viewed negatively as expresses a worsening in the financial requirements.
Figure 6: Reclassified Balance Sheet (functional criterion)
Source: personal elaboration.
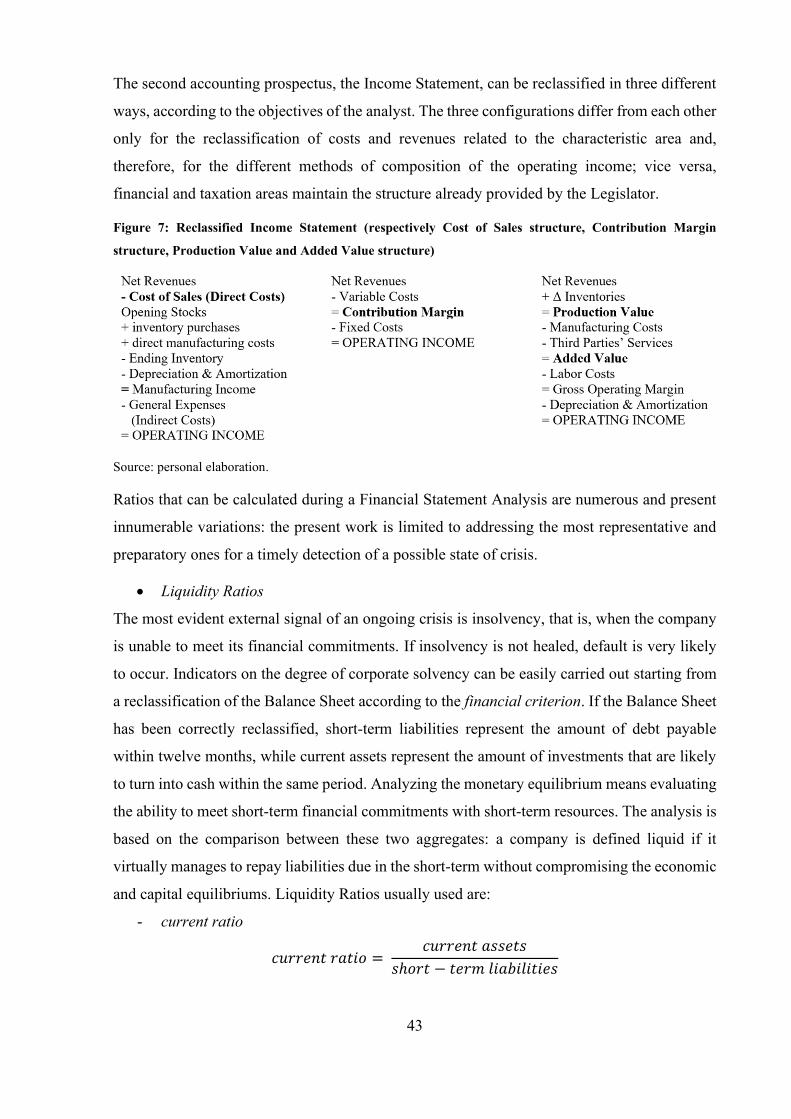
43
The second accounting prospectus, the Income Statement, can be reclassified in three different
ways, according to the objectives of the analyst. The three configurations differ from each other
only for the reclassification of costs and revenues related to the characteristic area and,
therefore, for the different methods of composition of the operating income; vice versa,
financial and taxation areas maintain the structure already provided by the Legislator.
Figure 7: Reclassified Income Statement (respectively Cost of Sales structure, Contribution Margin
structure, Production Value and Added Value structure)
Source: personal elaboration.
Ratios that can be calculated during a Financial Statement Analysis are numerous and present
innumerable variations: the present work is limited to addressing the most representative and
preparatory ones for a timely detection of a possible state of crisis.
• Liquidity Ratios
The most evident external signal of an ongoing crisis is insolvency, that is, when the company
is unable to meet its financial commitments. If insolvency is not healed, default is very likely
to occur. Indicators on the degree of corporate solvency can be easily carried out starting from
a reclassification of the Balance Sheet according to the financial criterion. If the Balance Sheet
has been correctly reclassified, short-term liabilities represent the amount of debt payable
within twelve months, while current assets represent the amount of investments that are likely
to turn into cash within the same period. Analyzing the monetary equilibrium means evaluating
the ability to meet short-term financial commitments with short-term resources. The analysis is
based on the comparison between these two aggregates: a company is defined liquid if it
virtually manages to repay liabilities due in the short-term without compromising the economic
and capital equilibriums. Liquidity Ratios usually used are:
- current ratio
𝑐𝑢𝑟𝑟𝑒𝑛𝑡 𝑟𝑎𝑡𝑖𝑜 = 𝑐𝑢𝑟𝑟𝑒𝑛𝑡 𝑎𝑠𝑠𝑒𝑡𝑠
𝑠ℎ𝑜𝑟𝑡 − 𝑡𝑒𝑟𝑚 𝑙𝑖𝑎𝑏𝑖𝑙𝑖𝑡𝑖𝑒𝑠

44
When the current ratio assumes a value lower than 1, it means that current assets are not
sufficient to fully repay debts in expiration. The full repayment of debts can only take
place by resorting to the disinvestment of fixed assets, but this would compromise the
future conditions of the economic and capital balance. Therefore, a company with a
current ratio lower than 1 could be considered illiquid. The restoration of the equilibrium
takes place through three types of intervention: debt-consolidation, which reduces the
exposure in the short-term by taking on medium/long-term debts; the sale of non-
instrumental assets, the proceeds of which cover the amount of short-term payables;
otherwise, but with longer periods, the allocation of the free cash flow to cover debt, to
the detriment of dividend policies or non-operating investments.
When the current ratio assumes a value greater than 1, the company is theoretically able
to repay the short-term debt by disinvesting all or part of its current assets. As
benchmark values, we consider 1.10 for large firms and 1.20 for smaller ones. In this
case, it is possible to state that there is no financial disequilibrium in the short period,
but, at the same time, financial equilibrium is not obvious: indeed the inventory
(classified among current assets according to the financial criterion) could convert into
liquidity after an operational process (production and sale, or only sale) which can take
longer than twelve months. For this reason, before expressing a positive opinion on the
liquidity of the company, it is useful to calculate the acid-test ratio, which does not
consider the inventory to cover the short-term debt.
- acid-test ratio (or quick ratio)
𝑎𝑐𝑖𝑑 − 𝑡𝑒𝑠𝑡 𝑟𝑎𝑡𝑖𝑜 = 𝑐𝑢𝑟𝑟𝑒𝑛𝑡 𝑎𝑠𝑠𝑒𝑡𝑠 − 𝑖𝑛𝑣𝑒𝑛𝑡𝑜𝑟𝑦
𝑠ℎ𝑜𝑟𝑡 − 𝑡𝑒𝑟𝑚 𝑙𝑖𝑎𝑏𝑖𝑙𝑖𝑡𝑖𝑒𝑠
=𝑐𝑎𝑠ℎ 𝑎𝑛𝑑 𝑐𝑎𝑠ℎ 𝑒𝑞𝑢𝑖𝑣𝑎𝑙𝑒𝑛𝑡𝑠 + 𝑠ℎ𝑜𝑟𝑡 − 𝑡𝑒𝑟𝑚 𝑙𝑜𝑎𝑛𝑠
𝑠ℎ𝑜𝑟𝑡 − 𝑡𝑒𝑟𝑚 𝑙𝑖𝑎𝑏𝑖𝑙𝑖𝑡𝑖𝑒𝑠
When the acid-test ratio assumes a value higher than 1, it is possible to state that the
company is liquid. However, this ratio is rarely greater than 1: as benchmark values, we
consider 0.83 for large firms and 0.79 for smaller ones. There could be interpretative
doubts when the current ratio has values higher than 1, while the acid-test ratio lower
than 1. In that case, it is necessary to compare the ratios and to look for solutions that
reduce the average consistency of raw material inventories and finished goods.
• Efficiency Ratios
The judgment on the monetary equilibrium passes also through the so-called Efficiency Ratios,
which assess the degree of efficiency of an investment or a source of financing involved in
45
operating activities. The higher the value, the faster the investment will convert into cash.
Efficiency Ratios usually used are:
- days receivables outstanding
𝑑𝑎𝑦𝑠 𝑟𝑒𝑐𝑒𝑖𝑣𝑎𝑏𝑙𝑒𝑠 𝑜𝑢𝑡𝑠𝑡𝑎𝑛𝑑𝑖𝑛𝑔 = 𝑎𝑣𝑒𝑟𝑎𝑔𝑒 𝑎𝑐𝑐𝑜𝑢𝑛𝑡 𝑟𝑒𝑐𝑒𝑖𝑣𝑎𝑏𝑙𝑒𝑠
𝑠𝑎𝑙𝑒𝑠 + 𝑉𝐴𝑇 ∙ 365
This ratio measures the average duration of the deferral granted to customers, that is,
the time between the moment in which the revenue is recognized and that of its
collection.
- days payables outstanding
𝑑𝑎𝑦𝑠 𝑝𝑎𝑦𝑎𝑏𝑙𝑒𝑠 𝑜𝑢𝑡𝑠𝑡𝑎𝑛𝑑𝑖𝑛𝑔 = 𝑎𝑣𝑒𝑟𝑎𝑔𝑒 𝑎𝑐𝑐𝑜𝑢𝑛𝑡 𝑝𝑎𝑦𝑎𝑏𝑙𝑒𝑠
𝑝𝑢𝑟𝑐ℎ𝑎𝑠𝑒𝑠 + 𝑉𝐴𝑇 ∙ 365
This ratio measures the average duration of the deferral granted by the suppliers, that is,
the time between the moment in which the cost is recorded and that of its payment. The
days payables outstanding must be compared with the days receivables outstanding: if
the former are greater than the latter, most likely there will be a treasury gap and the
company will have to resort to the banking credit.
- days in inventory
𝑑𝑎𝑦𝑠 𝑖𝑛 𝑖𝑛𝑣𝑒𝑛𝑡𝑜𝑟𝑦 = 𝑎𝑣𝑒𝑟𝑎𝑔𝑒 𝑖𝑛𝑣𝑒𝑛𝑡𝑜𝑟𝑦
𝑐𝑜𝑠𝑡 𝑜𝑓 𝑔𝑜𝑜𝑑𝑠 𝑠𝑜𝑙𝑑 ∙ 365
• Capital Solidity Ratios
Liquidity Ratios compare current assets with short-term liabilities, therefore verify in specular
terms whether permanent sources of financing (long-term liabilities & capital) are correctly
synchronized with fixed assets. In fact, it is normally assumed that the extinction time of sources
of financing (short-term and permanent) is homogeneous with the time required by assets
(respectively current and fixed) to convert into liquid form. However, to affirm that a company
is both liquid and solid, it is advisable to carefully evaluate the capitalization or the financial
autonomy of the company; in other words, the degree of utilization of the shareholders’ equity
to cover operating investments. Ratios usually used for the capital-financial equilibrium are:
- fixed assets coverage ratio
𝑓𝑖𝑥𝑒𝑑 𝑎𝑠𝑠𝑒𝑡𝑠 𝑐𝑜𝑣𝑒𝑟𝑎𝑔𝑒 𝑟𝑎𝑡𝑖𝑜 = 𝑠ℎ𝑎𝑟𝑒ℎ𝑜𝑙𝑑𝑒𝑟𝑠′𝑒𝑞𝑢𝑖𝑡𝑦
𝑚𝑎𝑛𝑖𝑓𝑎𝑐𝑡𝑢𝑟𝑖𝑛𝑔 𝑓𝑎𝑐𝑖𝑙𝑖𝑡𝑖𝑒𝑠
where manufacturing facilities correspond to those fixed assets involved in the operating
activity. If the ratio tends to values considerably lower than 1, a recapitalization will be
necessary.

46
- equity guarantee
𝑒𝑞𝑢𝑖𝑡𝑦 𝑔𝑎𝑟𝑎𝑛𝑡𝑒𝑒 = 𝑠ℎ𝑎𝑟𝑒ℎ𝑜𝑙𝑑𝑒𝑟𝑠′𝑒𝑞𝑢𝑖𝑡𝑦
Ʃ 𝑙𝑖𝑞𝑢𝑖𝑑𝑎𝑡𝑖𝑜𝑛 𝑙𝑜𝑠𝑠𝑒𝑠
The ratio verifies whether the net wealth of shareholders can cover the losses if the
company were put into liquidation. Abandoning the concept of going concern, it is
necessary to calculate as denominator the expected losses following a liquidation
process: if the ratio is greater than 1, the company can be considered solid as it does not
put its creditors at the risk of bearing liquidation losses.
• Leverage Ratios
The capital-financial equilibrium is assessed in the light of the Leverage Ratios. Among the
most recurring and useful, there are:
- leverage
𝑙𝑒𝑣𝑒𝑟𝑎𝑔𝑒 = 𝑡𝑜𝑡𝑎𝑙 𝑎𝑠𝑠𝑒𝑡𝑠
𝑠ℎ𝑎𝑟𝑒ℎ𝑜𝑙𝑑𝑒𝑟𝑠′𝑒𝑞𝑢𝑖𝑡𝑦
An increase in the leverage corresponds to an increase in the degree of corporate
indebtedness: sources of financing from external third parties are boosting compared to
shareholders’ internal sources of financing. If the financial leverage is equal to 1, the
company has not used third parties’ capital (it has no debts); if the leverage is between
1 and 2, it means that equity capital is greater than debt capital; if the leverage is greater
than 2, it means that the debt capital is greater than the equity capital. On average, the
company is in a state of correct equilibrium regarding the sources of financing when the
ratio assumes values between 1 and 2, otherwise, when values are greater than 2, the
company is to be considered undercapitalized (insufficient equity capital), therefore a
recapitalization process must be carried out.
- debt to equity ratio
𝑑𝑒𝑏𝑡 𝑡𝑜 𝑒𝑞𝑢𝑖𝑡𝑦 𝑟𝑎𝑡𝑖𝑜 = 𝑡𝑜𝑡𝑎𝑙 𝑙𝑖𝑎𝑏𝑖𝑙𝑖𝑡𝑖𝑒𝑠
𝑠ℎ𝑎𝑟𝑒ℎ𝑜𝑙𝑑𝑒𝑟𝑠′𝑒𝑞𝑢𝑖𝑡𝑦
Also an increase in the debt-to-equity ratio corresponds to an increase in the degree of
corporate indebtedness. Rarely companies show a debt to equity ratio lower than or
equal to one: in general the ratio is considered acceptable if it shows values not
exceeding 3, but evaluations are always necessary both on the sector to which the
company belongs (which could exert a certain influence on the degree of indebtedness)
and on debt sustainability.
47
- interest coverage ratio
𝑖𝑛𝑡𝑒𝑟𝑒𝑠𝑡 𝑐𝑜𝑣𝑒𝑟𝑎𝑔𝑒 𝑟𝑎𝑡𝑖𝑜 = 𝑛𝑒𝑡 𝑜𝑝𝑒𝑟𝑎𝑡𝑖𝑛𝑔 𝑖𝑛𝑐𝑜𝑚𝑒
𝑖𝑛𝑡𝑒𝑟𝑒𝑠𝑡 𝑒𝑥𝑝𝑒𝑛𝑐𝑒𝑠
or
𝑖𝑛𝑡𝑒𝑟𝑒𝑠𝑡 𝑐𝑜𝑣𝑒𝑟𝑎𝑔𝑒 𝑟𝑎𝑡𝑖𝑜 = 𝑔𝑟𝑜𝑠𝑠 𝑜𝑝𝑒𝑟𝑎𝑡𝑖𝑛𝑔 𝑚𝑎𝑟𝑔𝑖𝑛
𝑖𝑛𝑡𝑒𝑟𝑒𝑠𝑡 𝑒𝑥𝑝𝑒𝑛𝑐𝑒𝑠
The interest coverage ratio, in both its versions, measures the economic capacity to bear
the cost of debt. Unlike the first version (the one with net operating income), in which
the ratio is required to be at least greater than 1, in its second version (which will be
used in the empirical analysis) it is not sufficient for the numerator to be higher than the
denominator: the ratio is considered acceptable if it exceeds at least 4 or 5 times the
value of financial charges, since it must cover not only interest expenses, but also all the
other types of extra-operating costs and, at the same time, it must leave an appropriate
remuneration to the capital investors.
- financial debts / sales revenues
𝑓𝑖𝑛𝑎𝑛𝑐𝑖𝑎𝑙 𝑑𝑒𝑏𝑡𝑠
𝑠𝑎𝑙𝑒𝑠 𝑟𝑒𝑣𝑒𝑛𝑢𝑒𝑠
The ratio between financial debts and sales revenues represents a further indicator of
debt sustainability: the amount of debt assumes worrying levels for a company if it
exceeds the volume of revenues.
• Profitability Ratios
Profitability Ratios are constructed by placing an income flow in the numerator and the capital
invested for its generation in the denominator.
- ROE (Return on Equity)
𝑅𝑂𝐸 = 𝑛𝑒𝑡 𝑖𝑛𝑐𝑜𝑚𝑒
𝑠ℎ𝑎𝑟𝑒ℎ𝑜𝑙𝑑𝑒𝑟𝑠′ 𝑒𝑞𝑢𝑖𝑡𝑦
ROE expresses the return on equity: it is mainly used by actual and potential risk capital
investors to evaluate the convenience of an investment compared to another. For ROE, it is
not possible to define ex ante thresholds or acceptability values, as this ratio is significantly
influenced by the sector to which the company belongs and by the size of the company
itself. By way of example, a 10% ROE indicates good profitability for a company in the
catering sector, but very poor profitability for a company belonging to the commerce sector
(Di Nardo et al., 2018). For this reason, to express an opinion on the health of the company,
ROE must be compared with its value in the previous years, or with ROE of companies
belonging to the same sector.
48
- ROI (Return on Investments)
𝑅𝑂𝐼 = 𝑜𝑝𝑒𝑟𝑎𝑡𝑖𝑛𝑔 𝑖𝑛𝑐𝑜𝑚𝑒
𝑜𝑝𝑒𝑟𝑎𝑡𝑖𝑛𝑔 𝑖𝑛𝑣𝑒𝑠𝑡𝑒𝑑 𝑐𝑎𝑝𝑖𝑡𝑎𝑙
ROI is certainly the most used profitability indicator in the Financial Statements Analysis:
ROI expresses the return on operating activity in relation to capital invested in its
realization. The same considerations made for ROE apply to the threshold values of ROI.
Once the most significant indicators have been identified, it is possible to express an opinion
on the company’s state of health only after comparing its values over time and/or in space.
Comparison over time consists of comparing indicators obtained from the Financial Statements
of the previous years produced by the same company. This type of comparison is simpler to
carry out and does not present complex problems regarding the availability of data and the
homogeneity of the prospectuses. Comparison in space consists of comparing indicators of the
specific company with those of competitors, average values, or aggregate data, relating to the
same period. Comparison in space presents some complexities to which it is often difficult to
find a solution. Searching for the data is more complex, and also the reliability of information
collected is not taken for granted: companies could distort accounting data, showing a better
situation than the current one. Furthermore, prospectuses are often characterized by scarce
flexibility, that does not allow to reclassify external data with alternative criteria: this limits the
number of statements that can be used and consequently the calculation of indicators. Finally,
internal data and external data may be inconsistent: companies may have applied accounting
principles in a different way (where these allow), they may have referred to different legal
standards or currencies, or the non-homogeneity may refer to the terminology used or to the
methods for presenting information in the prospectuses.
The Financial Statements Analysis represents today one of the most used tools to prevent the
state of crisis, but its validity has often been discussed. Criticisms mainly relate to the reliability
of accounting prospectuses and the lack of aptitude to promptly report crises. Regarding the
first aspect, prospectuses are inevitably influenced by accounting policies, and cases in which
the company decides to distort the data to give a better representation of the situation are not
rare. About the second aspect, the Financial Statements Analysis does not have an excellent
predictive capacity since often, when it indicates a symptom of crisis, causes may already be in
the degenerative phase and therefore difficult to heal.
49
3.4. The Z-score Model
One of the most significant contributions in the multivariate discriminant analysis is Altman’s
Z-score Model. Altman was not the first to apply the multivariate discriminant analysis to the
prediction of corporate crisis, but the results he obtained and the innovativeness of his formula
made his model one of the most widespread in literature and most used in practice.
3.4.1. Altman’s first configuration of the Z-score Model
In its first configuration, dating back to 1968, Altman used a homogeneous (in terms of year,
sector, and size) sample of 66 listed American industrial corporations, of which 33 healthy and
33 bankrupted in the period 1946-1965. Altman started from a pool of 22 variables among the
most popular in the literature and classified them into five standard ratio categories: liquidity,
profitability, leverage, solvency, and activity. From the original list of 22 variables, five were
selected. These five variables are not those that, considered individually, are most correlated to
the event of default, but those that, combined in the discriminant function, do the best overall
job together in the prediction of corporate bankruptcy. Appropriately weighted by coefficients,
they provide a score that allows to ascertain the proximity of the company to a specific group
(Group 1 – Bankrupt Group or Group 2 – Nonbankrupt Group). The discriminant function is
as follows:
𝑍 = 0.012 𝑋1 + 0.014 𝑋2 + 0.033 𝑋3 + 0.006 𝑋4 + 0.999 𝑋5
where
- X1 = working capital / total assets (WC/TA)
The working capital / total assets ratio is a measure of the net liquid assets of the firm
relative to the total capitalization. Liquidity and size characteristics are explicitly
considered. Working capital is defines as the difference between current assets and
current liabilities; ordinarily, a firm experiencing consistent operating losses will have
shrinking current assets in relation to total assets (Altman, 1993, p.186).
- X2 = retained earnings / total assets (RE/TA)
Retained earnings is the account which reports the total amount of reinvested earnings
and/or losses of a firm over its entire life. It is affected by both corporate quasi-
reorganizations and stock dividends declarations. The age of a firm is implicitly
considered in this ratio: intuitively, a relatively young firm will show a low RE/TA ratio
because it has not had time to build up its cumulative profits. It could be argued that,
ceteris paribus, a young firm is somewhat discriminated against in this analysis, and its
probability to be classified in the Bankrupt Group is higher than that of an older firm.
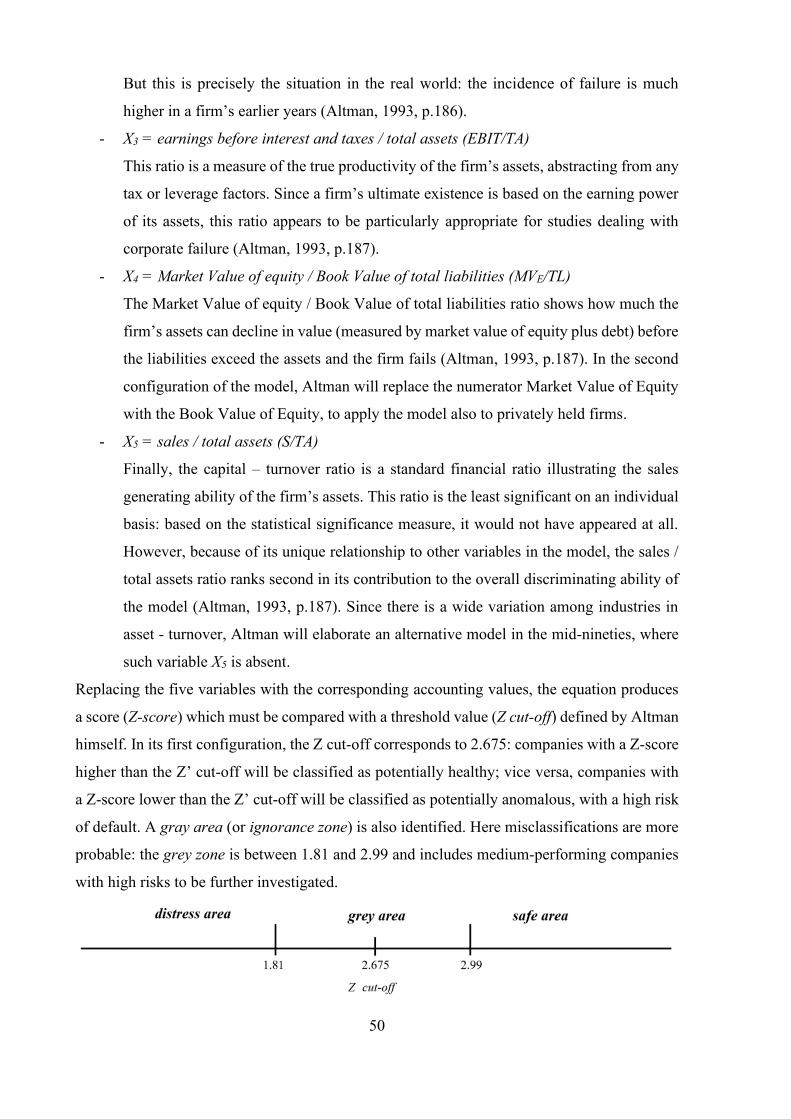
50
But this is precisely the situation in the real world: the incidence of failure is much
higher in a firm’s earlier years (Altman, 1993, p.186).
- X3 = earnings before interest and taxes / total assets (EBIT/TA)
This ratio is a measure of the true productivity of the firm’s assets, abstracting from any
tax or leverage factors. Since a firm’s ultimate existence is based on the earning power
of its assets, this ratio appears to be particularly appropriate for studies dealing with
corporate failure (Altman, 1993, p.187).
- X4 = Market Value of equity / Book Value of total liabilities (MVE/TL)
The Market Value of equity / Book Value of total liabilities ratio shows how much the
firm’s assets can decline in value (measured by market value of equity plus debt) before
the liabilities exceed the assets and the firm fails (Altman, 1993, p.187). In the second
configuration of the model, Altman will replace the numerator Market Value of Equity
with the Book Value of Equity, to apply the model also to privately held firms.
- X5 = sales / total assets (S/TA)
Finally, the capital – turnover ratio is a standard financial ratio illustrating the sales
generating ability of the firm’s assets. This ratio is the least significant on an individual
basis: based on the statistical significance measure, it would not have appeared at all.
However, because of its unique relationship to other variables in the model, the sales /
total assets ratio ranks second in its contribution to the overall discriminating ability of
the model (Altman, 1993, p.187). Since there is a wide variation among industries in
asset - turnover, Altman will elaborate an alternative model in the mid-nineties, where
such variable X5 is absent.
Replacing the five variables with the corresponding accounting values, the equation produces
a score (Z-score) which must be compared with a threshold value (Z cut-off) defined by Altman
himself. In its first configuration, the Z cut-off corresponds to 2.675: companies with a Z-score
higher than the Z’ cut-off will be classified as potentially healthy; vice versa, companies with
a Z-score lower than the Z’ cut-off will be classified as potentially anomalous, with a high risk
of default. A gray area (or ignorance zone) is also identified. Here misclassifications are more
probable: the grey zone is between 1.81 and 2.99 and includes medium-performing companies
with high risks to be further investigated.
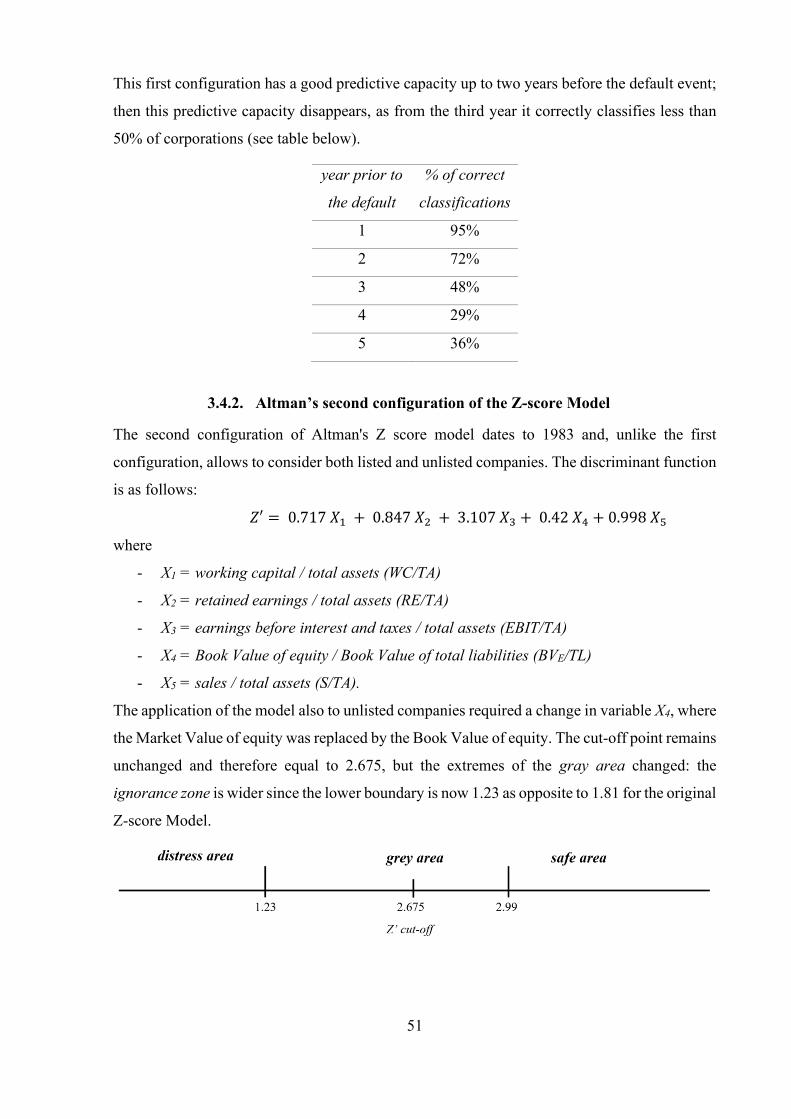
51
This first configuration has a good predictive capacity up to two years before the default event;
then this predictive capacity disappears, as from the third year it correctly classifies less than
50% of corporations (see table below).
year prior to
the default
% of correct
classifications
1 95%
2 72%
3 48%
4 29%
5 36%
3.4.2. Altman’s second configuration of the Z-score Model
The second configuration of Altman's Z score model dates to 1983 and, unlike the first
configuration, allows to consider both listed and unlisted companies. The discriminant function
is as follows:
𝑍′ = 0.717 𝑋1 + 0.847 𝑋2 + 3.107 𝑋3 + 0.42 𝑋4 + 0.998 𝑋5
where
- X1 = working capital / total assets (WC/TA)
- X2 = retained earnings / total assets (RE/TA)
- X3 = earnings before interest and taxes / total assets (EBIT/TA)
- X4 = Book Value of equity / Book Value of total liabilities (BVE/TL)
- X5 = sales / total assets (S/TA).
The application of the model also to unlisted companies required a change in variable X4, where
the Market Value of equity was replaced by the Book Value of equity. The cut-off point remains
unchanged and therefore equal to 2.675, but the extremes of the gray area changed: the
ignorance zone is wider since the lower boundary is now 1.23 as opposite to 1.81 for the original
Z-score Model.
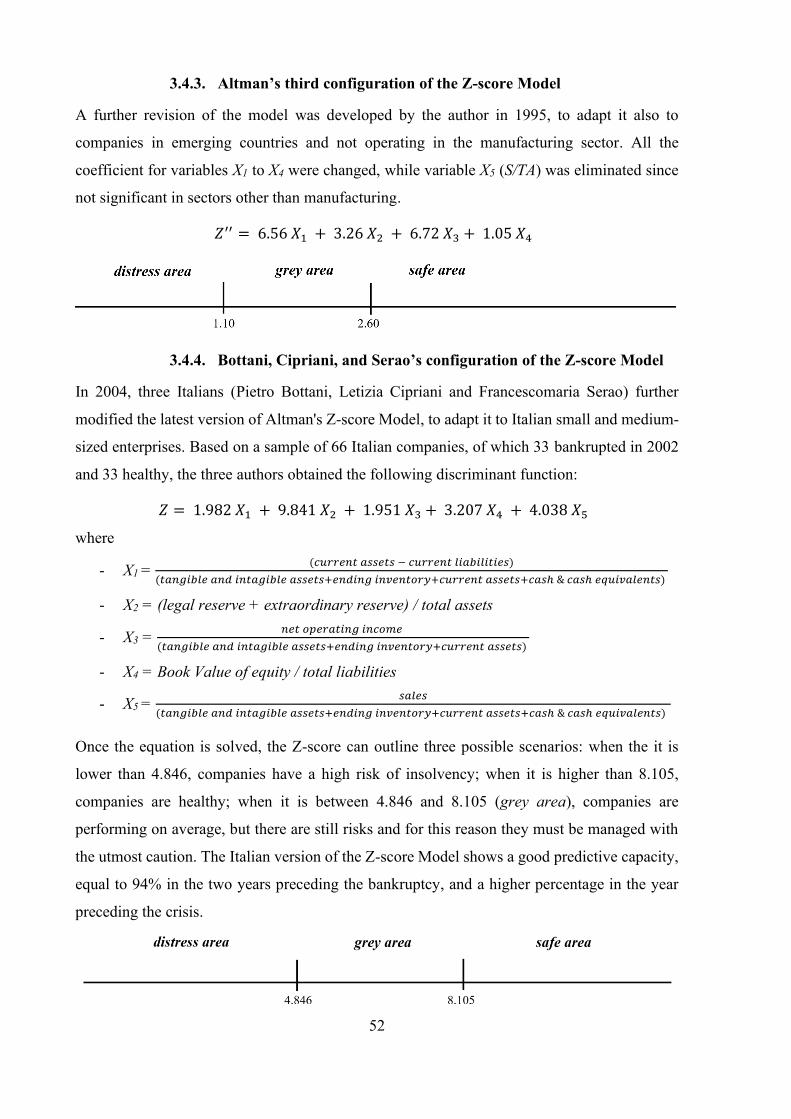
52
3.4.3. Altman’s third configuration of the Z-score Model
A further revision of the model was developed by the author in 1995, to adapt it also to
companies in emerging countries and not operating in the manufacturing sector. All the
coefficient for variables X1 to X4 were changed, while variable X5 (S/TA) was eliminated since
not significant in sectors other than manufacturing.
𝑍′′ = 6.56 𝑋1 + 3.26 𝑋2 + 6.72 𝑋3 + 1.05 𝑋4
3.4.4. Bottani, Cipriani, and Serao’s configuration of the Z-score Model
In 2004, three Italians (Pietro Bottani, Letizia Cipriani and Francescomaria Serao) further
modified the latest version of Altman's Z-score Model, to adapt it to Italian small and medium-
sized enterprises. Based on a sample of 66 Italian companies, of which 33 bankrupted in 2002
and 33 healthy, the three authors obtained the following discriminant function:
𝑍 = 1.982 𝑋1 + 9.841 𝑋2 + 1.951 𝑋3 + 3.207 𝑋4 + 4.038 𝑋5
where
- X1 = (𝑐𝑢𝑟𝑟𝑒𝑛𝑡 𝑎𝑠𝑠𝑒𝑡𝑠 − 𝑐𝑢𝑟𝑟𝑒𝑛𝑡 𝑙𝑖𝑎𝑏𝑖𝑙𝑖𝑡𝑖𝑒𝑠)
(𝑡𝑎𝑛𝑔𝑖𝑏𝑙𝑒 𝑎𝑛𝑑 𝑖𝑛𝑡𝑎𝑔𝑖𝑏𝑙𝑒 𝑎𝑠𝑠𝑒𝑡𝑠+𝑒𝑛𝑑𝑖𝑛𝑔 𝑖𝑛𝑣𝑒𝑛𝑡𝑜𝑟𝑦+𝑐𝑢𝑟𝑟𝑒𝑛𝑡 𝑎𝑠𝑠𝑒𝑡𝑠+𝑐𝑎𝑠ℎ & 𝑐𝑎𝑠ℎ 𝑒𝑞𝑢𝑖𝑣𝑎𝑙𝑒𝑛𝑡𝑠)
- X2 = (legal reserve + extraordinary reserve) / total assets
- X3 = 𝑛𝑒𝑡 𝑜𝑝𝑒𝑟𝑎𝑡𝑖𝑛𝑔 𝑖𝑛𝑐𝑜𝑚𝑒
(𝑡𝑎𝑛𝑔𝑖𝑏𝑙𝑒 𝑎𝑛𝑑 𝑖𝑛𝑡𝑎𝑔𝑖𝑏𝑙𝑒 𝑎𝑠𝑠𝑒𝑡𝑠+𝑒𝑛𝑑𝑖𝑛𝑔 𝑖𝑛𝑣𝑒𝑛𝑡𝑜𝑟𝑦+𝑐𝑢𝑟𝑟𝑒𝑛𝑡 𝑎𝑠𝑠𝑒𝑡𝑠)
- X4 = Book Value of equity / total liabilities
- X5 = 𝑠𝑎𝑙𝑒𝑠
(𝑡𝑎𝑛𝑔𝑖𝑏𝑙𝑒 𝑎𝑛𝑑 𝑖𝑛𝑡𝑎𝑔𝑖𝑏𝑙𝑒 𝑎𝑠𝑠𝑒𝑡𝑠+𝑒𝑛𝑑𝑖𝑛𝑔 𝑖𝑛𝑣𝑒𝑛𝑡𝑜𝑟𝑦+𝑐𝑢𝑟𝑟𝑒𝑛𝑡 𝑎𝑠𝑠𝑒𝑡𝑠+𝑐𝑎𝑠ℎ & 𝑐𝑎𝑠ℎ 𝑒𝑞𝑢𝑖𝑣𝑎𝑙𝑒𝑛𝑡𝑠)
Once the equation is solved, the Z-score can outline three possible scenarios: when the it is
lower than 4.846, companies have a high risk of insolvency; when it is higher than 8.105,
companies are healthy; when it is between 4.846 and 8.105 (grey area), companies are
performing on average, but there are still risks and for this reason they must be managed with
the utmost caution. The Italian version of the Z-score Model shows a good predictive capacity,
equal to 94% in the two years preceding the bankruptcy, and a higher percentage in the year
preceding the crisis.
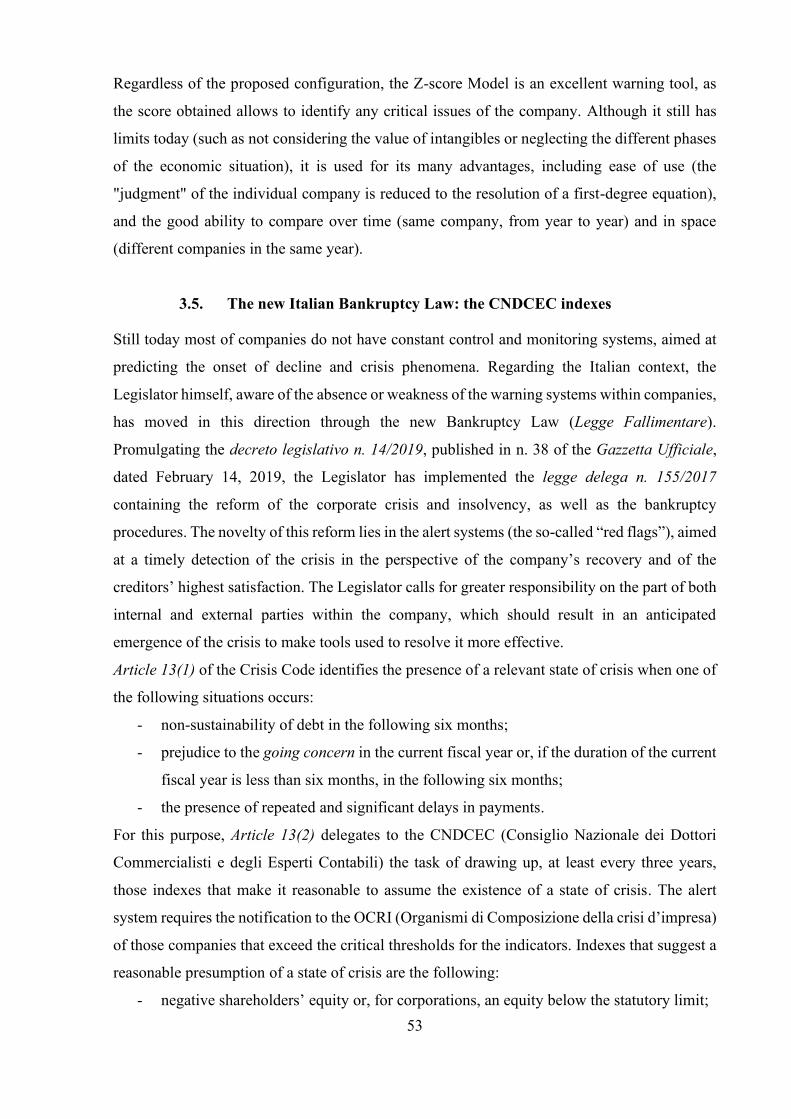
53
Regardless of the proposed configuration, the Z-score Model is an excellent warning tool, as
the score obtained allows to identify any critical issues of the company. Although it still has
limits today (such as not considering the value of intangibles or neglecting the different phases
of the economic situation), it is used for its many advantages, including ease of use (the
"judgment" of the individual company is reduced to the resolution of a first-degree equation),
and the good ability to compare over time (same company, from year to year) and in space
(different companies in the same year).
3.5. The new Italian Bankruptcy Law: the CNDCEC indexes
Still today most of companies do not have constant control and monitoring systems, aimed at
predicting the onset of decline and crisis phenomena. Regarding the Italian context, the
Legislator himself, aware of the absence or weakness of the warning systems within companies,
has moved in this direction through the new Bankruptcy Law (Legge Fallimentare).
Promulgating the decreto legislativo n. 14/2019, published in n. 38 of the Gazzetta Ufficiale,
dated February 14, 2019, the Legislator has implemented the legge delega n. 155/2017
containing the reform of the corporate crisis and insolvency, as well as the bankruptcy
procedures. The novelty of this reform lies in the alert systems (the so-called “red flags”), aimed
at a timely detection of the crisis in the perspective of the company’s recovery and of the
creditors’ highest satisfaction. The Legislator calls for greater responsibility on the part of both
internal and external parties within the company, which should result in an anticipated
emergence of the crisis to make tools used to resolve it more effective.
Article 13(1) of the Crisis Code identifies the presence of a relevant state of crisis when one of
the following situations occurs:
- non-sustainability of debt in the following six months;
- prejudice to the going concern in the current fiscal year or, if the duration of the current
fiscal year is less than six months, in the following six months;
- the presence of repeated and significant delays in payments.
For this purpose, Article 13(2) delegates to the CNDCEC (Consiglio Nazionale dei Dottori
Commercialisti e degli Esperti Contabili) the task of drawing up, at least every three years,
those indexes that make it reasonable to assume the existence of a state of crisis. The alert
system requires the notification to the OCRI (Organismi di Composizione della crisi d’impresa)
of those companies that exceed the critical thresholds for the indicators. Indexes that suggest a
reasonable presumption of a state of crisis are the following:
- negative shareholders’ equity or, for corporations, an equity below the statutory limit;

54
- a six-months Debt Service Coverage Ratio (DSCR) lower than 1;
- whenever it is not possible to calculate the DSCR or the data necessary for its calculation
are not considered reliable, the joint exceeding of the critical thresholds for the
following five ratios:
o financial charges sustainability index = 𝑖𝑛𝑡𝑒𝑟𝑒𝑠𝑡 𝑒𝑥𝑝𝑒𝑛𝑠𝑒𝑠
𝑛𝑒𝑡 𝑠𝑎𝑙𝑒𝑠
o capital adequacy index = 𝑠ℎ𝑎𝑟𝑒ℎ𝑜𝑙𝑑𝑒𝑟𝑠′𝑒𝑞𝑢𝑖𝑡𝑦
𝑡𝑜𝑡𝑎𝑙 𝑑𝑒𝑏𝑡𝑠
o index of return of assets in liquid form = 𝑐𝑎𝑠ℎ 𝑓𝑙𝑜𝑤
𝑡𝑜𝑡𝑎𝑙 𝑎𝑠𝑠𝑒𝑡𝑠 =
= 𝑝𝑟𝑜𝑓𝑖𝑡 + 𝑛𝑜𝑛 𝑚𝑜𝑛𝑒𝑡𝑎𝑦 𝑐𝑜𝑠𝑡𝑠 − 𝑛𝑜𝑛 𝑚𝑜𝑛𝑒𝑡𝑎𝑟𝑦 𝑟𝑒𝑣𝑒𝑛𝑢𝑒𝑠
𝑡𝑜𝑡𝑎𝑙 𝑎𝑠𝑠𝑒𝑡𝑠
o current ratio = 𝑐𝑢𝑟𝑟𝑒𝑛𝑡 𝑎𝑠𝑠𝑒𝑡𝑠
𝑠ℎ𝑜𝑟𝑡−𝑡𝑒𝑟𝑚 𝑙𝑖𝑎𝑏𝑖𝑙𝑖𝑡𝑖𝑒𝑠
o social security and fiscal indebtedness index =
= 𝑠𝑜𝑐𝑖𝑎𝑙 𝑠𝑒𝑐𝑢𝑟𝑖𝑡𝑦 𝑖𝑛𝑑𝑒𝑏𝑡𝑒𝑑𝑛𝑒𝑠𝑠 +𝑓𝑖𝑠𝑐𝑎𝑙 𝑖𝑛𝑑𝑒𝑏𝑡𝑒𝑑𝑛𝑒𝑠𝑠
𝑡𝑜𝑡𝑎𝑙 𝑎𝑠𝑠𝑒𝑡𝑠
The indexes system is hierarchical: if shareholders’ equity is negative or below the statutory
limit, the presence of crisis is conceivable; otherwise, the six-months DSCR is calculated. If the
DSCR is higher than 1, the state of crisis cannot be assumed, and the five indexes listed above
are considered together. For these indexes, different critical values are laid down according to
the sector considered, ad only the joint exceeding of the relative critical thresholds leads to the
notification to the OCRI as the state of crisis is conceivable.
Table 2: Critical thresholds for indexes by sector
Source: adaptation from CNDCEC (2019), Crisi d’impresa: gli indici d’allerta, cit., p. 18.
55
Beyond the useful indicators proposed by the CNDCEC, it is interesting to observe how the
Legislator's attention to a timely detection of crisis permeates the entire regulatory framework:
the objective becomes now that of "helping and healing" companies in difficulty, instead of the
previous punitive system aimed merely at "ousting the bad company" (Commissione di Studio
“Procedure concorsuali e giudiziarie”, 2019).

56
57
4. Research methodology
4.1. Predictive effectiveness of business insolvency forecasting models
After providing an overview of the main business insolvency forecasting models and the
statistical techniques behind them, it is now intended to assess their predictive effectiveness.
Models belonging to the non model-based approach are the only ones to have been applied in
practice with significant results. However, leaving aside the innovative models, which are still
in the development phase if not in the embryonic stage, the formulation of the remaining
traditional models dates back to the Anglo-Saxon economy of the 1980s, in a very different
context from the current one. Generally, the predictive effectiveness of these instruments is
closely linked to the temporal, geographical, economic, and legal context of the companies
considered (Giacosa & Mazzoleni, 2018). Some models have undergone various modifications
over the years at the hands of their inventors and/or other authors, to adapt to the changing
environmental contexts; for other models, modifications were minimal, and therefore their
signalling capacity as the years passed was no longer sufficient.
The objective of this work is to evaluate, from an empirical point of view, the validity of the
Financial Statements Analysis and the Z-score Model, considered particularly interesting
among the traditional models both in terms of their diffusion in literature and their simplicity
of use. The Financial Statements Analysis and the Z-score Model will be applied to the Italian
business environment before the Covid-19 pandemic: a reformulation of all the models to
consider the destructive effects of the pandemic on Italian and non-Italian companies is
certainly necessary but would be premature at this point in time, as the whole world is still in
the midst of the emergency phase. According to the results that will be obtained in Chapter 5,
a weak predictive effectiveness or a limited signalling capacity will require a reformulation of
the models to make them as consistent as possible with the application context.
4.2. Choice of the models to be tested
The choice of the models to be tested is based on their diffusion both in literature and in practice.
In the current context, where the expensive and complex artificial intelligence is the new
frontier of forecasting models, the Financial Statements Analysis and the Z-score Model
represent easily applicable tools, both affordable in terms of money spent and time used. The
information they need is of accounting nature and, with appropriate adjustments, available from
the Financial Statements of the single company: this makes these instruments available also for
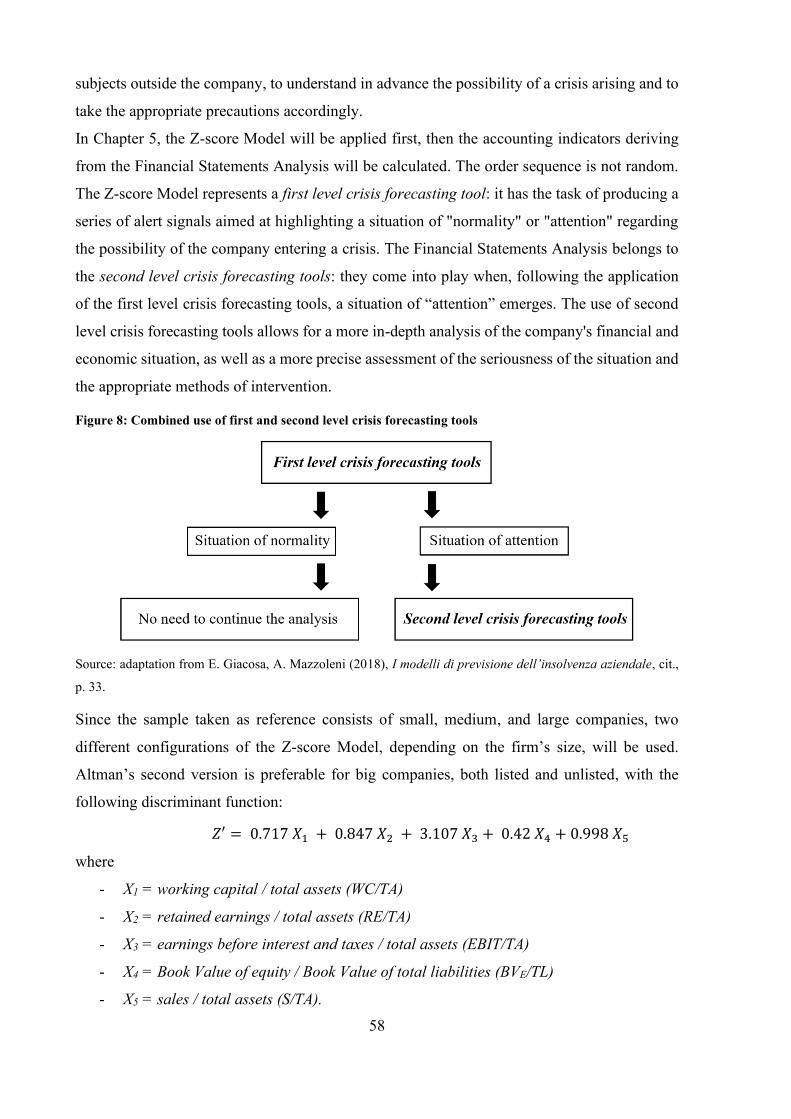
58
subjects outside the company, to understand in advance the possibility of a crisis arising and to
take the appropriate precautions accordingly.
In Chapter 5, the Z-score Model will be applied first, then the accounting indicators deriving
from the Financial Statements Analysis will be calculated. The order sequence is not random.
The Z-score Model represents a first level crisis forecasting tool: it has the task of producing a
series of alert signals aimed at highlighting a situation of "normality" or "attention" regarding
the possibility of the company entering a crisis. The Financial Statements Analysis belongs to
the second level crisis forecasting tools: they come into play when, following the application
of the first level crisis forecasting tools, a situation of “attention” emerges. The use of second
level crisis forecasting tools allows for a more in-depth analysis of the company's financial and
economic situation, as well as a more precise assessment of the seriousness of the situation and
the appropriate methods of intervention.
Figure 8: Combined use of first and second level crisis forecasting tools
Source: adaptation from E. Giacosa, A. Mazzoleni (2018), I modelli di previsione dell’insolvenza aziendale, cit.,
p. 33.
Since the sample taken as reference consists of small, medium, and large companies, two
different configurations of the Z-score Model, depending on the firm’s size, will be used.
Altman’s second version is preferable for big companies, both listed and unlisted, with the
following discriminant function:
𝑍′ = 0.717 𝑋1 + 0.847 𝑋2 + 3.107 𝑋3 + 0.42 𝑋4 + 0.998 𝑋5
where
- X1 = working capital / total assets (WC/TA)
- X2 = retained earnings / total assets (RE/TA)
- X3 = earnings before interest and taxes / total assets (EBIT/TA)
- X4 = Book Value of equity / Book Value of total liabilities (BVE/TL)
- X5 = sales / total assets (S/TA).
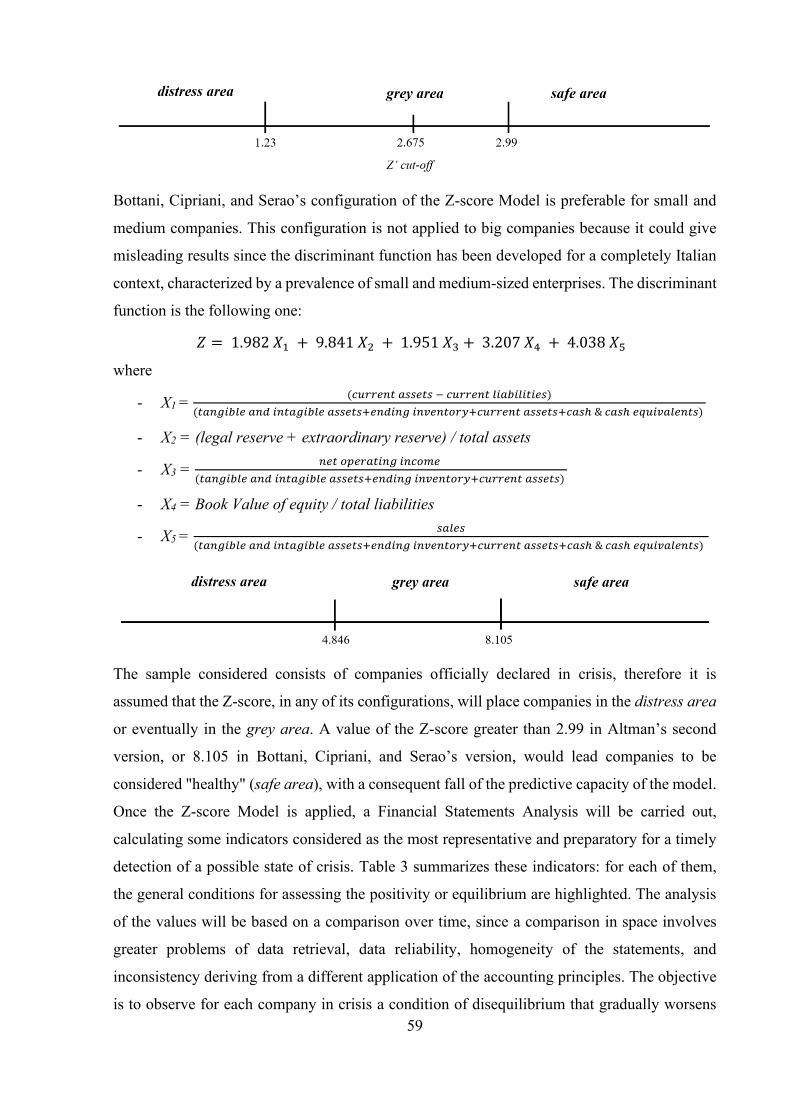
59
Bottani, Cipriani, and Serao’s configuration of the Z-score Model is preferable for small and
medium companies. This configuration is not applied to big companies because it could give
misleading results since the discriminant function has been developed for a completely Italian
context, characterized by a prevalence of small and medium-sized enterprises. The discriminant
function is the following one:
𝑍 = 1.982 𝑋1 + 9.841 𝑋2 + 1.951 𝑋3 + 3.207 𝑋4 + 4.038 𝑋5
where
- X1 = (𝑐𝑢𝑟𝑟𝑒𝑛𝑡 𝑎𝑠𝑠𝑒𝑡𝑠 − 𝑐𝑢𝑟𝑟𝑒𝑛𝑡 𝑙𝑖𝑎𝑏𝑖𝑙𝑖𝑡𝑖𝑒𝑠)
(𝑡𝑎𝑛𝑔𝑖𝑏𝑙𝑒 𝑎𝑛𝑑 𝑖𝑛𝑡𝑎𝑔𝑖𝑏𝑙𝑒 𝑎𝑠𝑠𝑒𝑡𝑠+𝑒𝑛𝑑𝑖𝑛𝑔 𝑖𝑛𝑣𝑒𝑛𝑡𝑜𝑟𝑦+𝑐𝑢𝑟𝑟𝑒𝑛𝑡 𝑎𝑠𝑠𝑒𝑡𝑠+𝑐𝑎𝑠ℎ & 𝑐𝑎𝑠ℎ 𝑒𝑞𝑢𝑖𝑣𝑎𝑙𝑒𝑛𝑡𝑠)
- X2 = (legal reserve + extraordinary reserve) / total assets
- X3 = 𝑛𝑒𝑡 𝑜𝑝𝑒𝑟𝑎𝑡𝑖𝑛𝑔 𝑖𝑛𝑐𝑜𝑚𝑒
(𝑡𝑎𝑛𝑔𝑖𝑏𝑙𝑒 𝑎𝑛𝑑 𝑖𝑛𝑡𝑎𝑔𝑖𝑏𝑙𝑒 𝑎𝑠𝑠𝑒𝑡𝑠+𝑒𝑛𝑑𝑖𝑛𝑔 𝑖𝑛𝑣𝑒𝑛𝑡𝑜𝑟𝑦+𝑐𝑢𝑟𝑟𝑒𝑛𝑡 𝑎𝑠𝑠𝑒𝑡𝑠)
- X4 = Book Value of equity / total liabilities
- X5 = 𝑠𝑎𝑙𝑒𝑠
(𝑡𝑎𝑛𝑔𝑖𝑏𝑙𝑒 𝑎𝑛𝑑 𝑖𝑛𝑡𝑎𝑔𝑖𝑏𝑙𝑒 𝑎𝑠𝑠𝑒𝑡𝑠+𝑒𝑛𝑑𝑖𝑛𝑔 𝑖𝑛𝑣𝑒𝑛𝑡𝑜𝑟𝑦+𝑐𝑢𝑟𝑟𝑒𝑛𝑡 𝑎𝑠𝑠𝑒𝑡𝑠+𝑐𝑎𝑠ℎ & 𝑐𝑎𝑠ℎ 𝑒𝑞𝑢𝑖𝑣𝑎𝑙𝑒𝑛𝑡𝑠)
The sample considered consists of companies officially declared in crisis, therefore it is
assumed that the Z-score, in any of its configurations, will place companies in the distress area
or eventually in the grey area. A value of the Z-score greater than 2.99 in Altman’s second
version, or 8.105 in Bottani, Cipriani, and Serao’s version, would lead companies to be
considered "healthy" (safe area), with a consequent fall of the predictive capacity of the model.
Once the Z-score Model is applied, a Financial Statements Analysis will be carried out,
calculating some indicators considered as the most representative and preparatory for a timely
detection of a possible state of crisis. Table 3 summarizes these indicators: for each of them,
the general conditions for assessing the positivity or equilibrium are highlighted. The analysis
of the values will be based on a comparison over time, since a comparison in space involves
greater problems of data retrieval, data reliability, homogeneity of the statements, and
inconsistency deriving from a different application of the accounting principles. The objective
is to observe for each company in crisis a condition of disequilibrium that gradually worsens
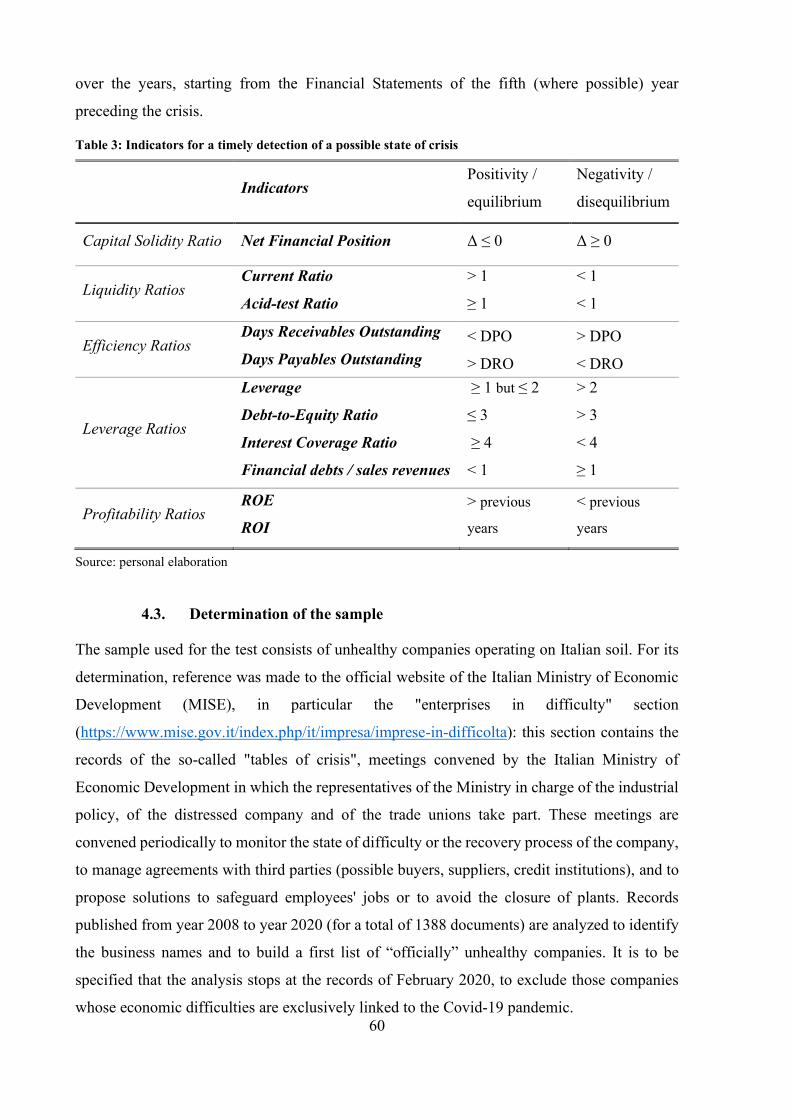
60
over the years, starting from the Financial Statements of the fifth (where possible) year
preceding the crisis.
Table 3: Indicators for a timely detection of a possible state of crisis
Indicators Positivity /
equilibrium
Negativity /
disequilibrium
Capital Solidity Ratio Net Financial Position Δ ≤ 0 Δ ≥ 0
Liquidity Ratios Current Ratio
Acid-test Ratio
> 1
≥ 1
< 1
< 1
Efficiency Ratios Days Receivables Outstanding
Days Payables Outstanding
< DPO
> DRO
> DPO
< DRO
Leverage Ratios
Leverage
Debt-to-Equity Ratio
Interest Coverage Ratio
Financial debts / sales revenues
≥ 1 but ≤ 2
≤ 3
≥ 4
< 1
> 2
> 3
< 4
≥ 1
Profitability Ratios ROE
ROI
> previous
years
< previous
years
Source: personal elaboration
4.3. Determination of the sample
The sample used for the test consists of unhealthy companies operating on Italian soil. For its
determination, reference was made to the official website of the Italian Ministry of Economic
Development (MISE), in particular the "enterprises in difficulty" section
(https://www.mise.gov.it/index.php/it/impresa/imprese-in-difficolta): this section contains the
records of the so-called "tables of crisis", meetings convened by the Italian Ministry of
Economic Development in which the representatives of the Ministry in charge of the industrial
policy, of the distressed company and of the trade unions take part. These meetings are
convened periodically to monitor the state of difficulty or the recovery process of the company,
to manage agreements with third parties (possible buyers, suppliers, credit institutions), and to
propose solutions to safeguard employees' jobs or to avoid the closure of plants. Records
published from year 2008 to year 2020 (for a total of 1388 documents) are analyzed to identify
the business names and to build a first list of “officially” unhealthy companies. It is to be
specified that the analysis stops at the records of February 2020, to exclude those companies
whose economic difficulties are exclusively linked to the Covid-19 pandemic.
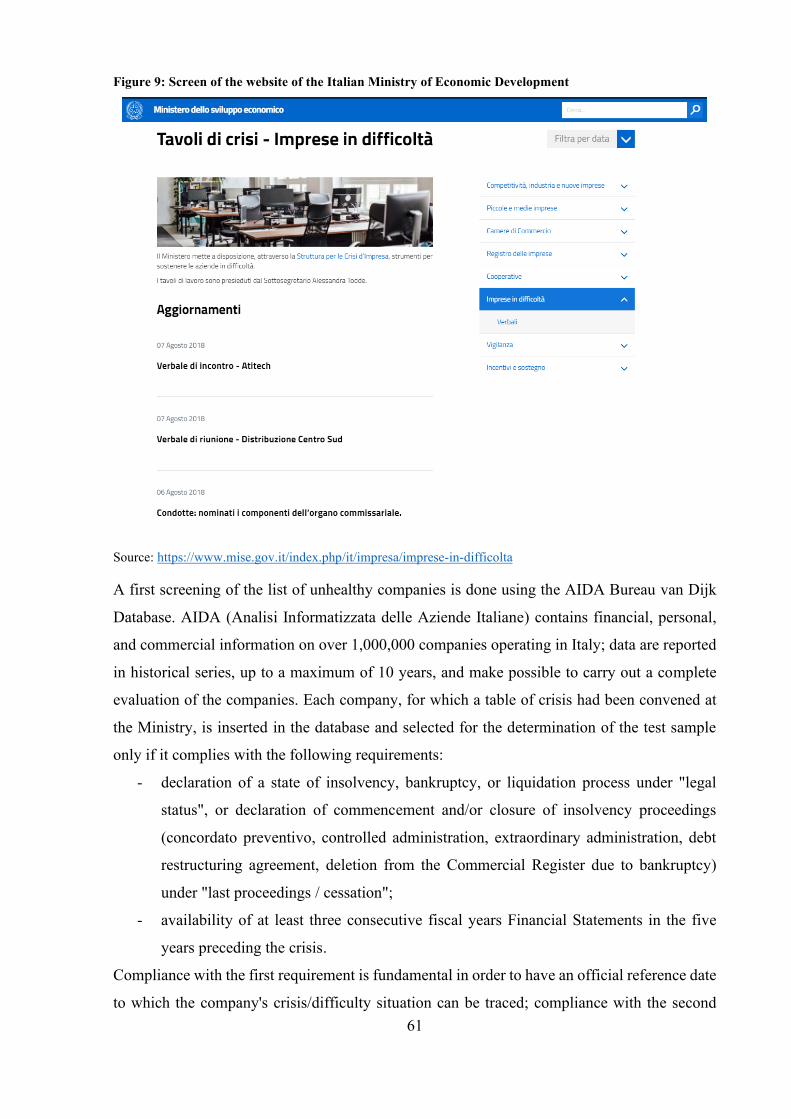
61
Figure 9: Screen of the website of the Italian Ministry of Economic Development
Source: https://www.mise.gov.it/index.php/it/impresa/imprese-in-difficolta
A first screening of the list of unhealthy companies is done using the AIDA Bureau van Dijk
Database. AIDA (Analisi Informatizzata delle Aziende Italiane) contains financial, personal,
and commercial information on over 1,000,000 companies operating in Italy; data are reported
in historical series, up to a maximum of 10 years, and make possible to carry out a complete
evaluation of the companies. Each company, for which a table of crisis had been convened at
the Ministry, is inserted in the database and selected for the determination of the test sample
only if it complies with the following requirements:
- declaration of a state of insolvency, bankruptcy, or liquidation process under "legal
status", or declaration of commencement and/or closure of insolvency proceedings
(concordato preventivo, controlled administration, extraordinary administration, debt
restructuring agreement, deletion from the Commercial Register due to bankruptcy)
under "last proceedings / cessation";
- availability of at least three consecutive fiscal years Financial Statements in the five
years preceding the crisis.
Compliance with the first requirement is fundamental in order to have an official reference date
to which the company's crisis/difficulty situation can be traced; compliance with the second
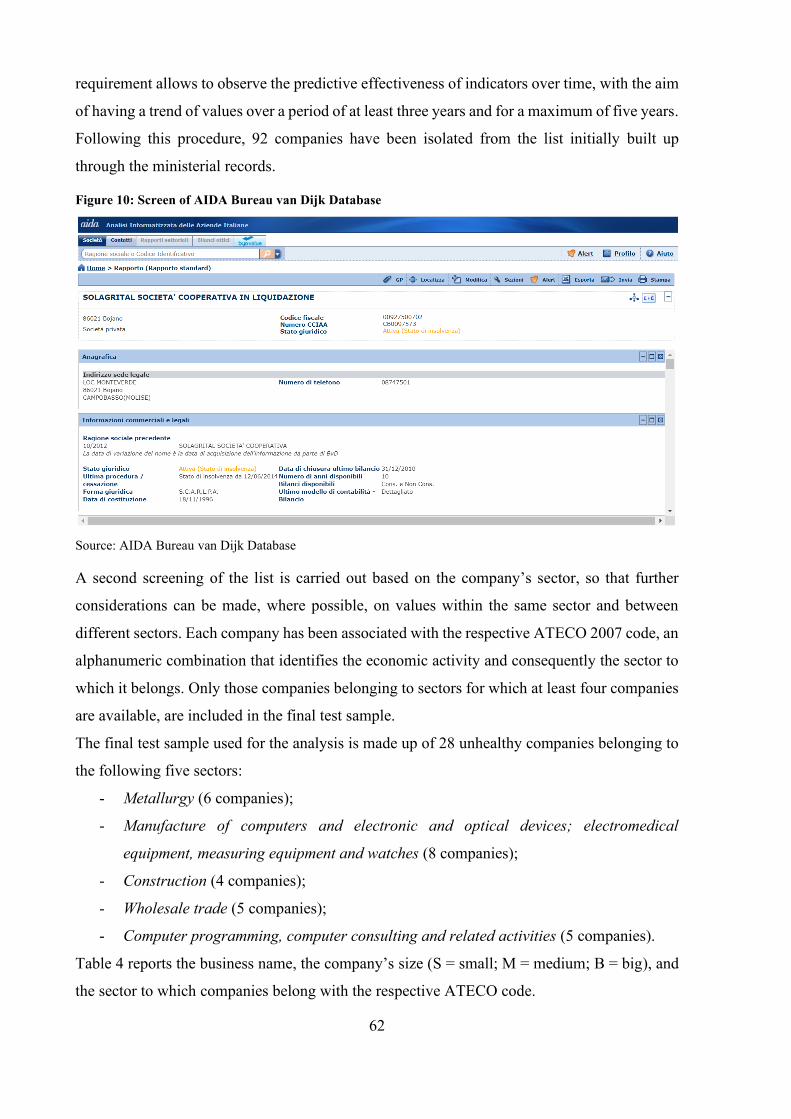
62
requirement allows to observe the predictive effectiveness of indicators over time, with the aim
of having a trend of values over a period of at least three years and for a maximum of five years.
Following this procedure, 92 companies have been isolated from the list initially built up
through the ministerial records.
Figure 10: Screen of AIDA Bureau van Dijk Database
Source: AIDA Bureau van Dijk Database
A second screening of the list is carried out based on the company’s sector, so that further
considerations can be made, where possible, on values within the same sector and between
different sectors. Each company has been associated with the respective ATECO 2007 code, an
alphanumeric combination that identifies the economic activity and consequently the sector to
which it belongs. Only those companies belonging to sectors for which at least four companies
are available, are included in the final test sample.
The final test sample used for the analysis is made up of 28 unhealthy companies belonging to
the following five sectors:
- Metallurgy (6 companies);
- Manufacture of computers and electronic and optical devices; electromedical
equipment, measuring equipment and watches (8 companies);
- Construction (4 companies);
- Wholesale trade (5 companies);
- Computer programming, computer consulting and related activities (5 companies).
Table 4 reports the business name, the company’s size (S = small; M = medium; B = big), and
the sector to which companies belong with the respective ATECO code.
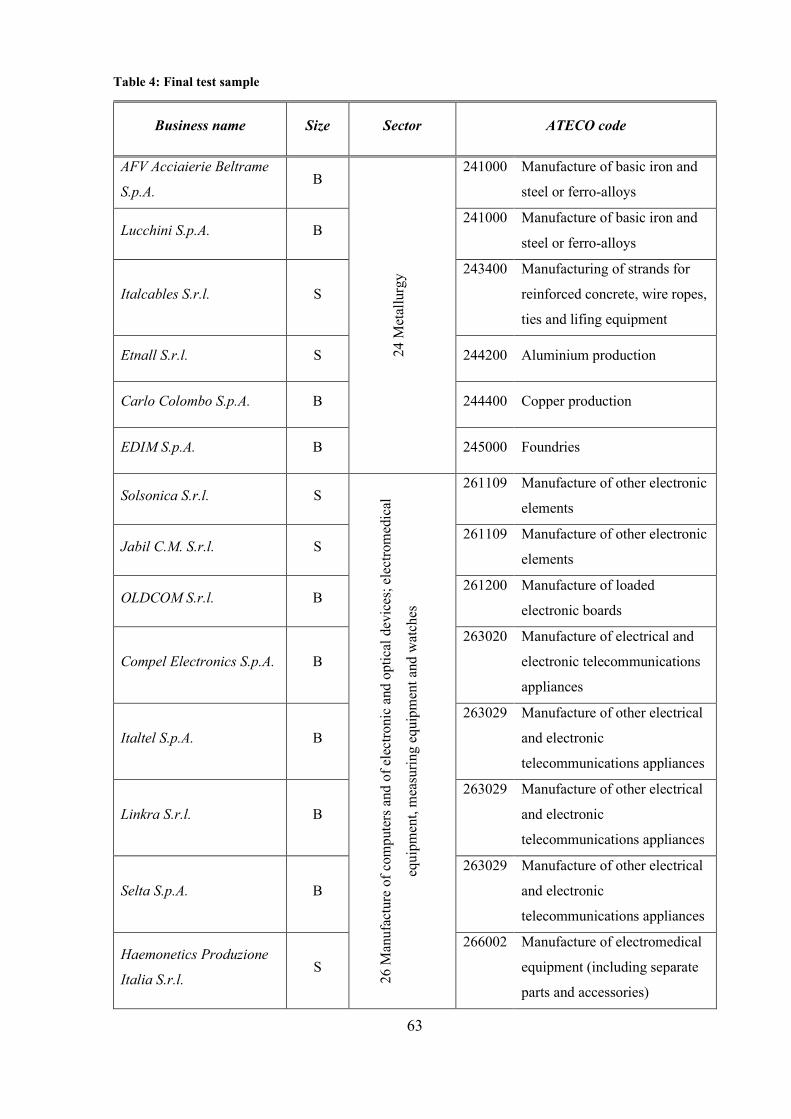
63
Table 4: Final test sample
Business name Size Sector ATECO code
AFV Acciaierie Beltrame
S.p.A. B
24 M
etal
lurg
y
241000 Manufacture of basic iron and
steel or ferro-alloys
Lucchini S.p.A. B 241000 Manufacture of basic iron and
steel or ferro-alloys
Italcables S.r.l. S
243400 Manufacturing of strands for
reinforced concrete, wire ropes,
ties and lifing equipment
Etnall S.r.l. S 244200 Aluminium production
Carlo Colombo S.p.A. B 244400 Copper production
EDIM S.p.A. B 245000 Foundries
Solsonica S.r.l. S
26 M
anu
fact
ure
of
com
pute
rs a
nd
of
elec
tronic
and o
pti
cal
dev
ices
; el
ectr
om
edic
al
equ
ipm
ent,
mea
suri
ng e
quip
men
t an
d w
atch
es
261109 Manufacture of other electronic
elements
Jabil C.M. S.r.l. S 261109 Manufacture of other electronic
elements
OLDCOM S.r.l. B 261200 Manufacture of loaded
electronic boards
Compel Electronics S.p.A. B
263020 Manufacture of electrical and
electronic telecommunications
appliances
Italtel S.p.A. B
263029 Manufacture of other electrical
and electronic
telecommunications appliances
Linkra S.r.l. B
263029 Manufacture of other electrical
and electronic
telecommunications appliances
Selta S.p.A. B
263029 Manufacture of other electrical
and electronic
telecommunications appliances
Haemonetics Produzione
Italia S.r.l. S
266002 Manufacture of electromedical
equipment (including separate
parts and accessories)
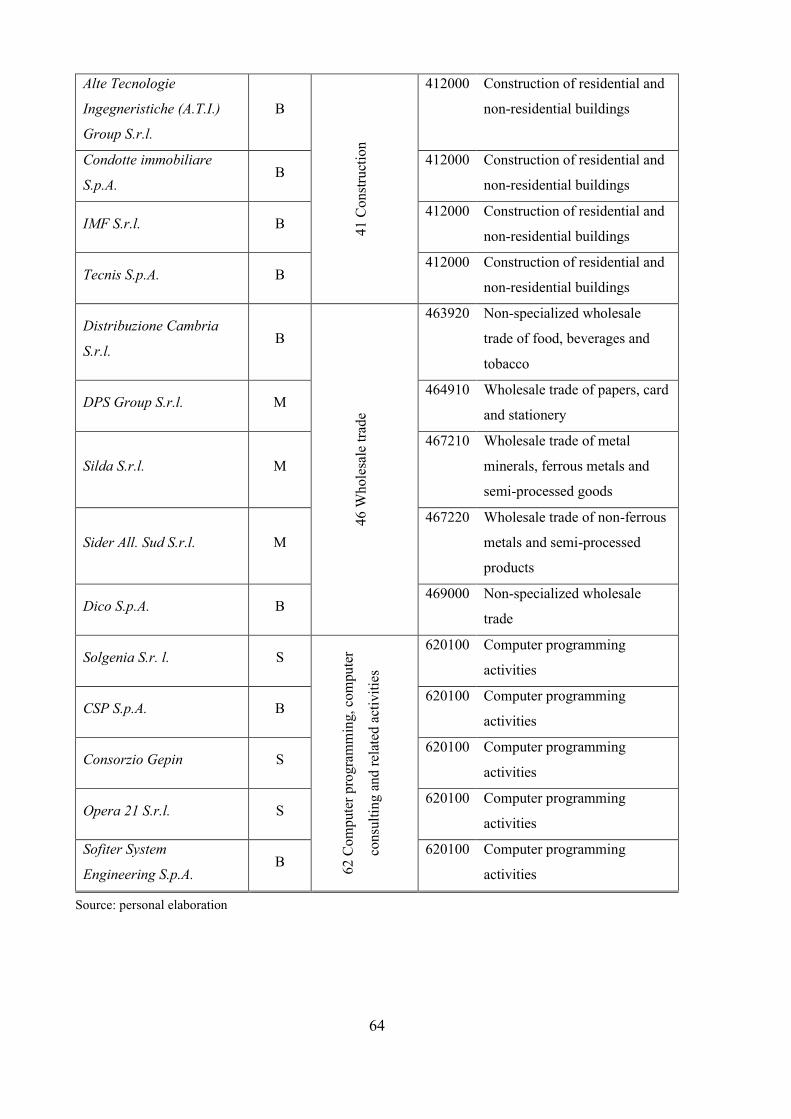
64
Alte Tecnologie
Ingegneristiche (A.T.I.)
Group S.r.l.
B
41
Co
nst
ruct
ion
412000 Construction of residential and
non-residential buildings
Condotte immobiliare
S.p.A. B
412000 Construction of residential and
non-residential buildings
IMF S.r.l. B 412000 Construction of residential and
non-residential buildings
Tecnis S.p.A. B 412000 Construction of residential and
non-residential buildings
Distribuzione Cambria
S.r.l. B
46 W
hole
sale
tra
de
463920 Non-specialized wholesale
trade of food, beverages and
tobacco
DPS Group S.r.l. M 464910 Wholesale trade of papers, card
and stationery
Silda S.r.l. M
467210 Wholesale trade of metal
minerals, ferrous metals and
semi-processed goods
Sider All. Sud S.r.l. M
467220 Wholesale trade of non-ferrous
metals and semi-processed
products
Dico S.p.A. B 469000 Non-specialized wholesale
trade
Solgenia S.r. l. S
62
Co
mp
ute
r p
rogra
mm
ing,
com
pute
r
con
sult
ing
an
d r
elat
ed a
ctiv
itie
s
620100 Computer programming
activities
CSP S.p.A. B 620100 Computer programming
activities
Consorzio Gepin S 620100 Computer programming
activities
Opera 21 S.r.l. S 620100 Computer programming
activities
Sofiter System
Engineering S.p.A. B
620100 Computer programming
activities
Source: personal elaboration
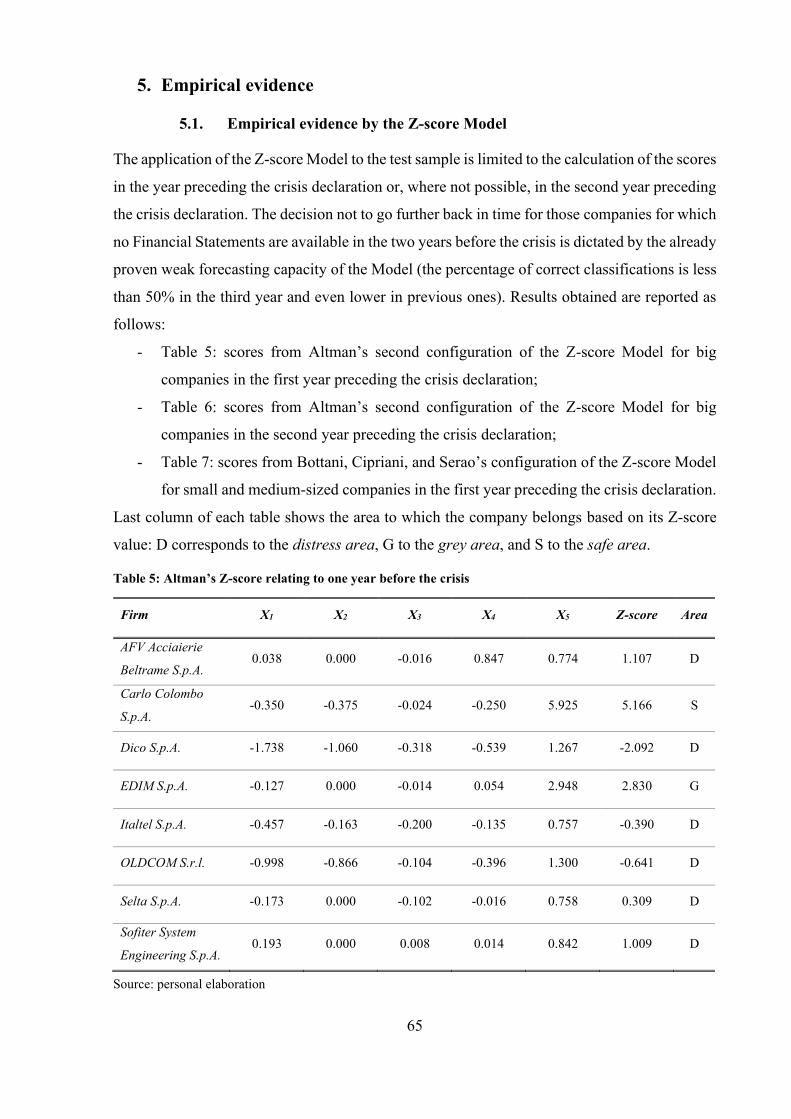
65
5. Empirical evidence
5.1. Empirical evidence by the Z-score Model
The application of the Z-score Model to the test sample is limited to the calculation of the scores
in the year preceding the crisis declaration or, where not possible, in the second year preceding
the crisis declaration. The decision not to go further back in time for those companies for which
no Financial Statements are available in the two years before the crisis is dictated by the already
proven weak forecasting capacity of the Model (the percentage of correct classifications is less
than 50% in the third year and even lower in previous ones). Results obtained are reported as
follows:
- Table 5: scores from Altman’s second configuration of the Z-score Model for big
companies in the first year preceding the crisis declaration;
- Table 6: scores from Altman’s second configuration of the Z-score Model for big
companies in the second year preceding the crisis declaration;
- Table 7: scores from Bottani, Cipriani, and Serao’s configuration of the Z-score Model
for small and medium-sized companies in the first year preceding the crisis declaration.
Last column of each table shows the area to which the company belongs based on its Z-score
value: D corresponds to the distress area, G to the grey area, and S to the safe area.
Table 5: Altman’s Z-score relating to one year before the crisis
Firm X1 X2 X3 X4 X5 Z-score Area
AFV Acciaierie
Beltrame S.p.A. 0.038 0.000 -0.016 0.847 0.774 1.107 D
Carlo Colombo
S.p.A. -0.350 -0.375 -0.024 -0.250 5.925 5.166 S
Dico S.p.A. -1.738 -1.060 -0.318 -0.539 1.267 -2.092 D
EDIM S.p.A. -0.127 0.000 -0.014 0.054 2.948 2.830 G
Italtel S.p.A. -0.457 -0.163 -0.200 -0.135 0.757 -0.390 D
OLDCOM S.r.l. -0.998 -0.866 -0.104 -0.396 1.300 -0.641 D
Selta S.p.A. -0.173 0.000 -0.102 -0.016 0.758 0.309 D
Sofiter System
Engineering S.p.A. 0.193 0.000 0.008 0.014 0.842 1.009 D
Source: personal elaboration
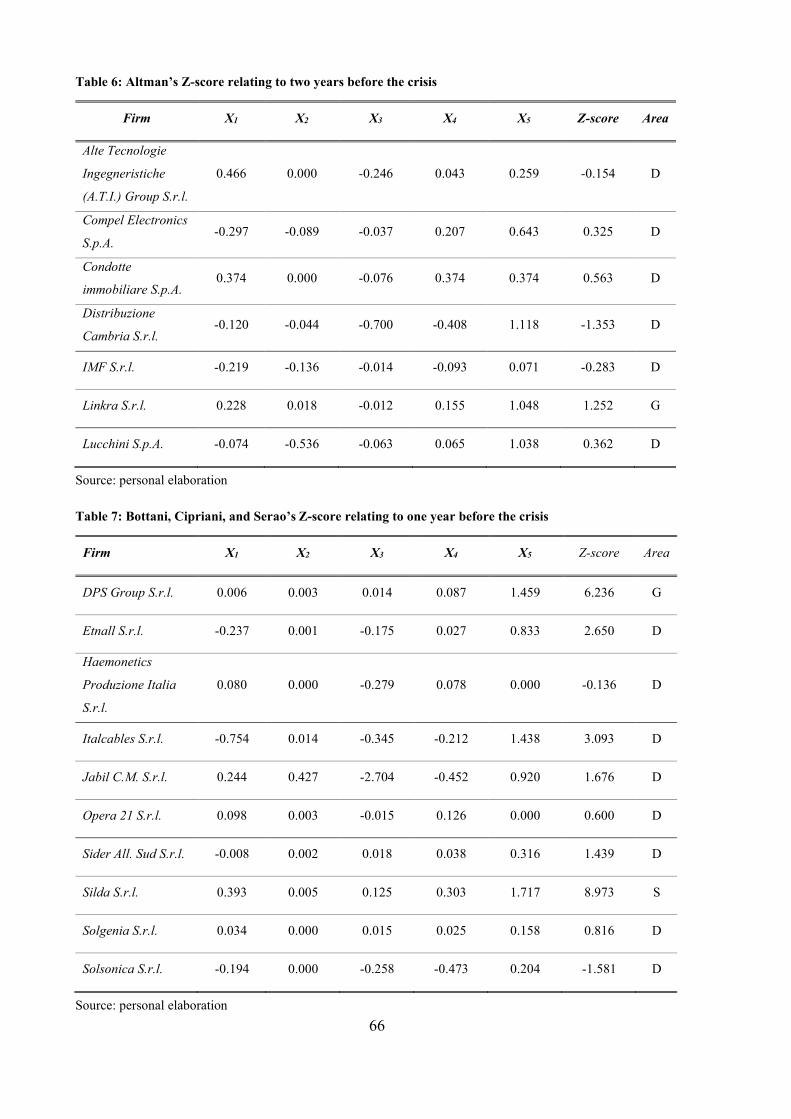
66
Table 6: Altman’s Z-score relating to two years before the crisis
Firm X1 X2 X3 X4 X5 Z-score Area
Alte Tecnologie
Ingegneristiche
(A.T.I.) Group S.r.l.
0.466 0.000 -0.246 0.043 0.259 -0.154 D
Compel Electronics
S.p.A. -0.297 -0.089 -0.037 0.207 0.643 0.325 D
Condotte
immobiliare S.p.A. 0.374 0.000 -0.076 0.374 0.374 0.563 D
Distribuzione
Cambria S.r.l. -0.120 -0.044 -0.700 -0.408 1.118 -1.353 D
IMF S.r.l. -0.219 -0.136 -0.014 -0.093 0.071 -0.283 D
Linkra S.r.l. 0.228 0.018 -0.012 0.155 1.048 1.252 G
Lucchini S.p.A. -0.074 -0.536 -0.063 0.065 1.038 0.362 D
Source: personal elaboration
Table 7: Bottani, Cipriani, and Serao’s Z-score relating to one year before the crisis
Firm X1 X2 X3 X4 X5 Z-score Area
DPS Group S.r.l. 0.006 0.003 0.014 0.087 1.459 6.236 G
Etnall S.r.l. -0.237 0.001 -0.175 0.027 0.833 2.650 D
Haemonetics
Produzione Italia
S.r.l.
0.080 0.000 -0.279 0.078 0.000 -0.136 D
Italcables S.r.l. -0.754 0.014 -0.345 -0.212 1.438 3.093 D
Jabil C.M. S.r.l. 0.244 0.427 -2.704 -0.452 0.920 1.676 D
Opera 21 S.r.l. 0.098 0.003 -0.015 0.126 0.000 0.600 D
Sider All. Sud S.r.l. -0.008 0.002 0.018 0.038 0.316 1.439 D
Silda S.r.l. 0.393 0.005 0.125 0.303 1.717 8.973 S
Solgenia S.r.l. 0.034 0.000 0.015 0.025 0.158 0.816 D
Solsonica S.r.l. -0.194 0.000 -0.258 -0.473 0.204 -1.581 D
Source: personal elaboration

67
Referring to the final test sample, the Z-scores of three companies are not reported: Consorzio
Gepin, Tecnis S.p.A. and CSP S.p.A.. Regarding Consorzio Gepin, in the second year prior to
the crisis, liabilities have null value and consequently it is not possible to calculate X4 = Book
Value of equity / total liabilities: the company was deleted from the Commercial Register two
years after the one used as reference for the Z-score calculation, but it had been presenting
Financial Statements with anomalous data for more than a couple of years, sign that the activity
had probably already ceased and that the deletion practice had already been planned but actually
completed only a few years later. On the other hand, the Z-scores of Tecnis S.p.A. and CSP
S.p.A. are not reported since Financial Statements of the two years prior to the crisis are not
available in the AIDA database. Sometimes the reason for this lack of data availability is to be
found in the fact that large groups, which have become insolvent, are unable to approve
Financial Statements for the fiscal years immediately before the insolvency, both for the timing
and for the presence of contested and therefore never approved Financial Statements (Altman,
Danovi & Falini, 2013).
The elaborations of the Z-score for Italian companies show how most of the companies are
classified within the distress area. The result is in line with expectations, since the final test
sample is entirely made up of companies in difficulty. There are few exceptions: three
companies (EDIM S.p.A., Linkra S.r.l., DPS Group S.r.l.) are classified within the gray area,
and two companies (Carlo Colombo S.p.A. and Silda S.r.l.) are classified within the safe area.
While the former do not give particular problems because, even if not considered unhealthy
companies, their placement in the grey area labels them as medium-performing companies with
high risks to be further investigated, the latter constitute an error, the so-called "false negative":
Carlo Colombo S.p.A. and Silda S.r.l. are painted as healthy companies, even if their situation
is far from rosy. This underlines how the Z-score Model is not infallible, and at the same time
how the statistical model works on average. It can produce wrong results in two different
directions: the "false positive", which labels a healthy company as fallible; and the "false
negative", which labels a company with a high probability of failure as healthy. Therefore, the
Z-score Model should be used as a starting point for an in-depth examination of the conditions
of corporate continuity, and not as a way of issuing a final judgment on its state of health.
An interesting aspect lies in the signs of the Z-scores, which are preceded by the minus in 8
cases. The negative sign underlines a very bad and serious situation where the company has a
negative working capital, a negative operating income, and/or a negative equity. If the Z-scores
are not negative, in most cases they are close to zero. The almost null value of the Z-score is
due firstly to X2, which often assumes value 0 because companies have no profit from the
68
previous year carried forward (null retained earnings) or sufficient resources to create
extraordinary reserves; and secondly to X4, corresponding to the ratio between equity and total
liabilities. In a recent publication by Altman, Danovi, and Falini (Altman, Danovi & Falini,
2013), it was doubtful whether, given the typical characteristics of Italian companies, indicator
X4 was not excessively penalizing for those subjects whose financial profile is characterized by
a low capitalization and a significant recourse to the banking debt.
Although from an internal point of view the Model constitutes a useful tool for predicting the
state of crisis that is likely to occur in the short-term, from an external point of view it could
determine the end of the company itself. This is the case of the “self-fulfilling prophecies”: a
company asks the bank for new loans but the analyst, classifying it as insolvent on the basis of
the low Z-score, refuses the request. The absence of such new resources could prevent the
company from honoring its current debts and others arising in the meantime, thus bringing the
company to the state of insolvency that the Model had predicted. The question is: what would
have happened if the Model had (erroneously) predicted a rosy future for that company? What
would have happened if the Model had classified an unhealthy company as a healthy company?
Probably the bank would have provided the required funding, the company would have fulfilled
its obligations and perhaps it would have been able to restart on a path of consolidation and
development.
Overall, it can be stated that the Z-score Model in Altman's second configuration for large
companies and in the "Italian" configuration for small and medium-sized companies, has good
predictive effectiveness: it is an excellent warning tool for Italian companies, as it correctly
classifies 23 companies out of a total of 25. At the same time, its non-infallibility and the
dangers associated with its decontextualized and uncritical use which can condemn a company
in difficulty forever, are aspects that must always be kept in mind.
Anyway, a single configuration that allows companies of all sizes to be considered
simultaneously could be a future useful development of the Model, which must be rearranged
to adapt to the current economic situation devastated by the recent Covid-19 pandemic.
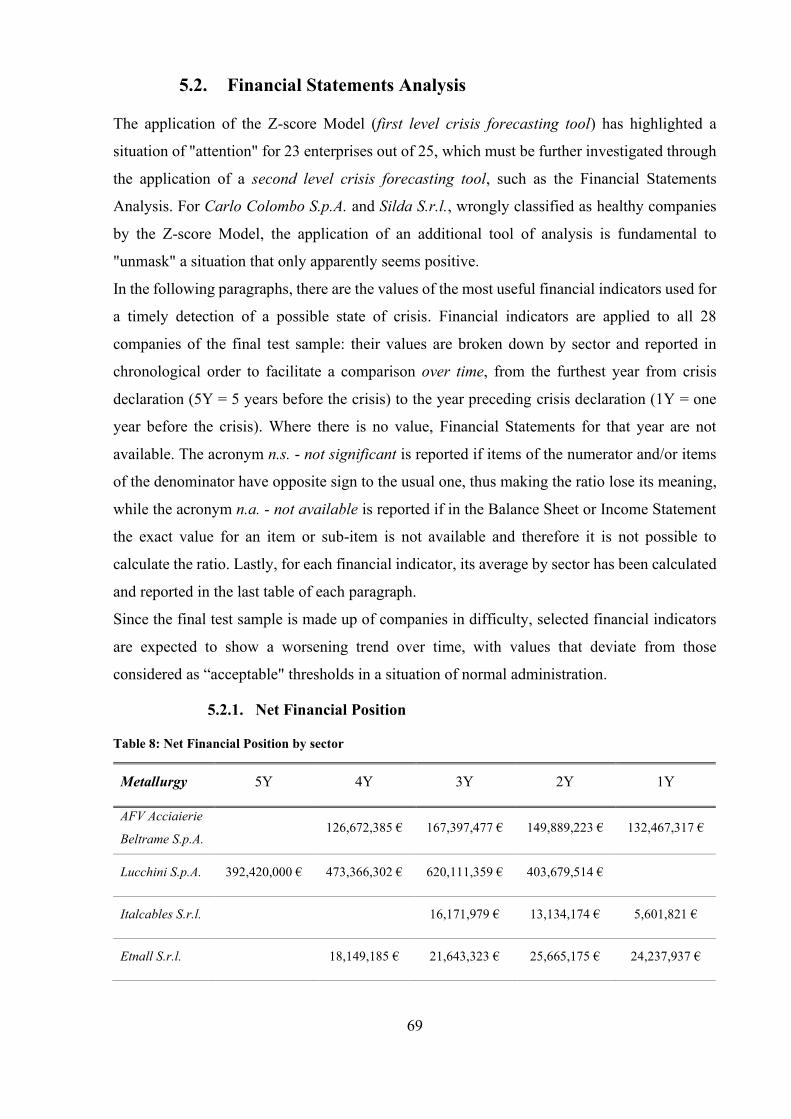
69
5.2. Financial Statements Analysis
The application of the Z-score Model (first level crisis forecasting tool) has highlighted a
situation of "attention" for 23 enterprises out of 25, which must be further investigated through
the application of a second level crisis forecasting tool, such as the Financial Statements
Analysis. For Carlo Colombo S.p.A. and Silda S.r.l., wrongly classified as healthy companies
by the Z-score Model, the application of an additional tool of analysis is fundamental to
"unmask" a situation that only apparently seems positive.
In the following paragraphs, there are the values of the most useful financial indicators used for
a timely detection of a possible state of crisis. Financial indicators are applied to all 28
companies of the final test sample: their values are broken down by sector and reported in
chronological order to facilitate a comparison over time, from the furthest year from crisis
declaration (5Y = 5 years before the crisis) to the year preceding crisis declaration (1Y = one
year before the crisis). Where there is no value, Financial Statements for that year are not
available. The acronym n.s. - not significant is reported if items of the numerator and/or items
of the denominator have opposite sign to the usual one, thus making the ratio lose its meaning,
while the acronym n.a. - not available is reported if in the Balance Sheet or Income Statement
the exact value for an item or sub-item is not available and therefore it is not possible to
calculate the ratio. Lastly, for each financial indicator, its average by sector has been calculated
and reported in the last table of each paragraph.
Since the final test sample is made up of companies in difficulty, selected financial indicators
are expected to show a worsening trend over time, with values that deviate from those
considered as “acceptable" thresholds in a situation of normal administration.
5.2.1. Net Financial Position
Table 8: Net Financial Position by sector
Metallurgy 5Y 4Y 3Y 2Y 1Y
AFV Acciaierie
Beltrame S.p.A. 126,672,385 € 167,397,477 € 149,889,223 € 132,467,317 €
Lucchini S.p.A. 392,420,000 € 473,366,302 € 620,111,359 € 403,679,514 €
Italcables S.r.l. 16,171,979 € 13,134,174 € 5,601,821 €
Etnall S.r.l. 18,149,185 € 21,643,323 € 25,665,175 € 24,237,937 €
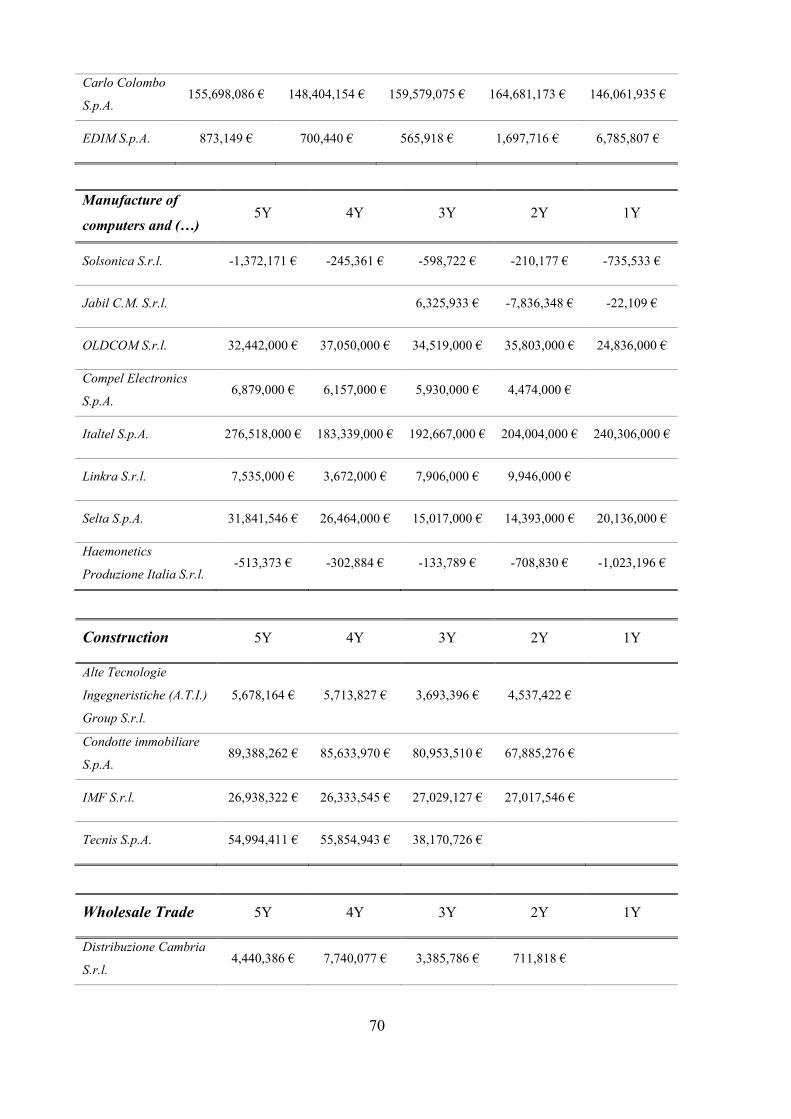
70
Carlo Colombo
S.p.A. 155,698,086 € 148,404,154 € 159,579,075 € 164,681,173 € 146,061,935 €
EDIM S.p.A. 873,149 € 700,440 € 565,918 € 1,697,716 € 6,785,807 €
Construction 5Y 4Y 3Y 2Y 1Y
Alte Tecnologie
Ingegneristiche (A.T.I.)
Group S.r.l.
5,678,164 € 5,713,827 € 3,693,396 € 4,537,422 €
Condotte immobiliare
S.p.A. 89,388,262 € 85,633,970 € 80,953,510 € 67,885,276 €
IMF S.r.l. 26,938,322 € 26,333,545 € 27,029,127 € 27,017,546 €
Tecnis S.p.A. 54,994,411 € 55,854,943 € 38,170,726 €
Wholesale Trade 5Y 4Y 3Y 2Y 1Y
Distribuzione Cambria
S.r.l. 4,440,386 € 7,740,077 € 3,385,786 € 711,818 €
Manufacture of
computers and (…) 5Y 4Y 3Y 2Y 1Y
Solsonica S.r.l. -1,372,171 € -245,361 € -598,722 € -210,177 € -735,533 €
Jabil C.M. S.r.l. 6,325,933 € -7,836,348 € -22,109 €
OLDCOM S.r.l. 32,442,000 € 37,050,000 € 34,519,000 € 35,803,000 € 24,836,000 €
Compel Electronics
S.p.A. 6,879,000 € 6,157,000 € 5,930,000 € 4,474,000 €
Italtel S.p.A. 276,518,000 € 183,339,000 € 192,667,000 € 204,004,000 € 240,306,000 €
Linkra S.r.l. 7,535,000 € 3,672,000 € 7,906,000 € 9,946,000 €
Selta S.p.A. 31,841,546 € 26,464,000 € 15,017,000 € 14,393,000 € 20,136,000 €
Haemonetics
Produzione Italia S.r.l. -513,373 € -302,884 € -133,789 € -708,830 € -1,023,196 €
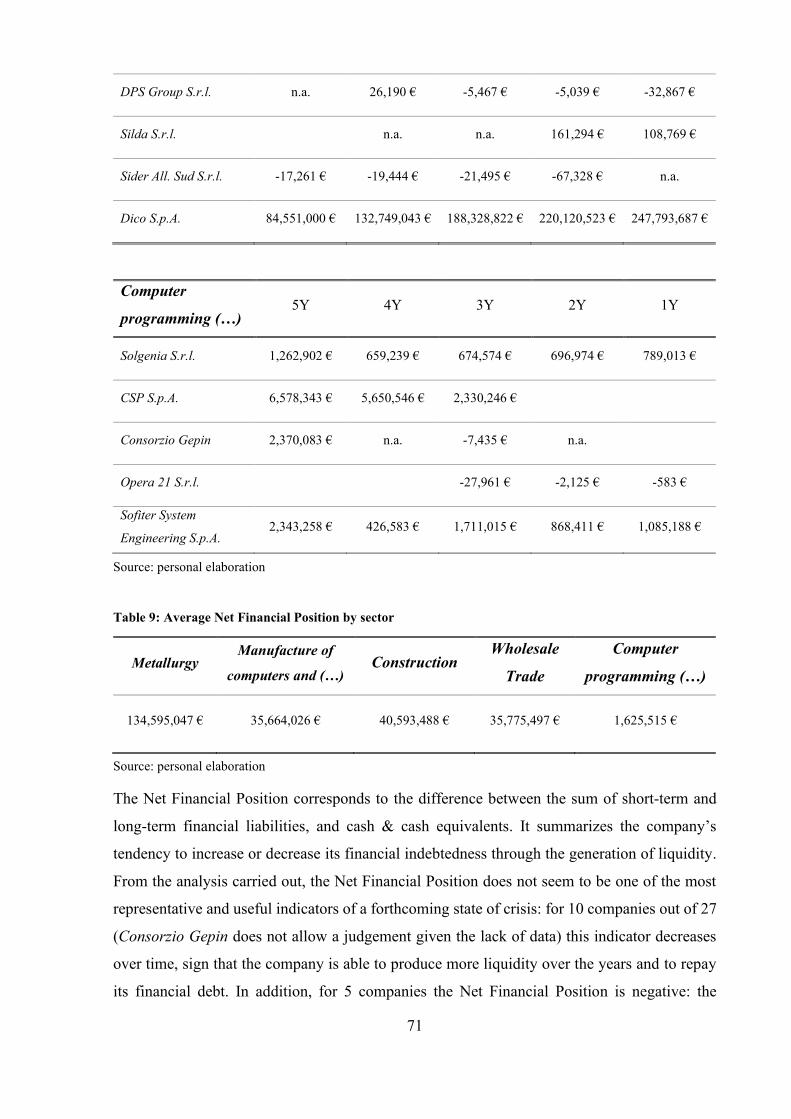
71
DPS Group S.r.l. n.a. 26,190 € -5,467 € -5,039 € -32,867 €
Silda S.r.l. n.a. n.a. 161,294 € 108,769 €
Sider All. Sud S.r.l. -17,261 € -19,444 € -21,495 € -67,328 € n.a.
Dico S.p.A. 84,551,000 € 132,749,043 € 188,328,822 € 220,120,523 € 247,793,687 €
Source: personal elaboration
Table 9: Average Net Financial Position by sector
Metallurgy Manufacture of
computers and (…) Construction
Wholesale
Trade
Computer
programming (…)
134,595,047 € 35,664,026 € 40,593,488 € 35,775,497 € 1,625,515 €
Source: personal elaboration
The Net Financial Position corresponds to the difference between the sum of short-term and
long-term financial liabilities, and cash & cash equivalents. It summarizes the company’s
tendency to increase or decrease its financial indebtedness through the generation of liquidity.
From the analysis carried out, the Net Financial Position does not seem to be one of the most
representative and useful indicators of a forthcoming state of crisis: for 10 companies out of 27
(Consorzio Gepin does not allow a judgement given the lack of data) this indicator decreases
over time, sign that the company is able to produce more liquidity over the years and to repay
its financial debt. In addition, for 5 companies the Net Financial Position is negative: the
Computer
programming (…) 5Y 4Y 3Y 2Y 1Y
Solgenia S.r.l. 1,262,902 € 659,239 € 674,574 € 696,974 € 789,013 €
CSP S.p.A. 6,578,343 € 5,650,546 € 2,330,246 €
Consorzio Gepin 2,370,083 € n.a. -7,435 € n.a.
Opera 21 S.r.l. -27,961 € -2,125 € -583 €
Sofiter System
Engineering S.p.A. 2,343,258 € 426,583 € 1,711,015 € 868,411 € 1,085,188 €
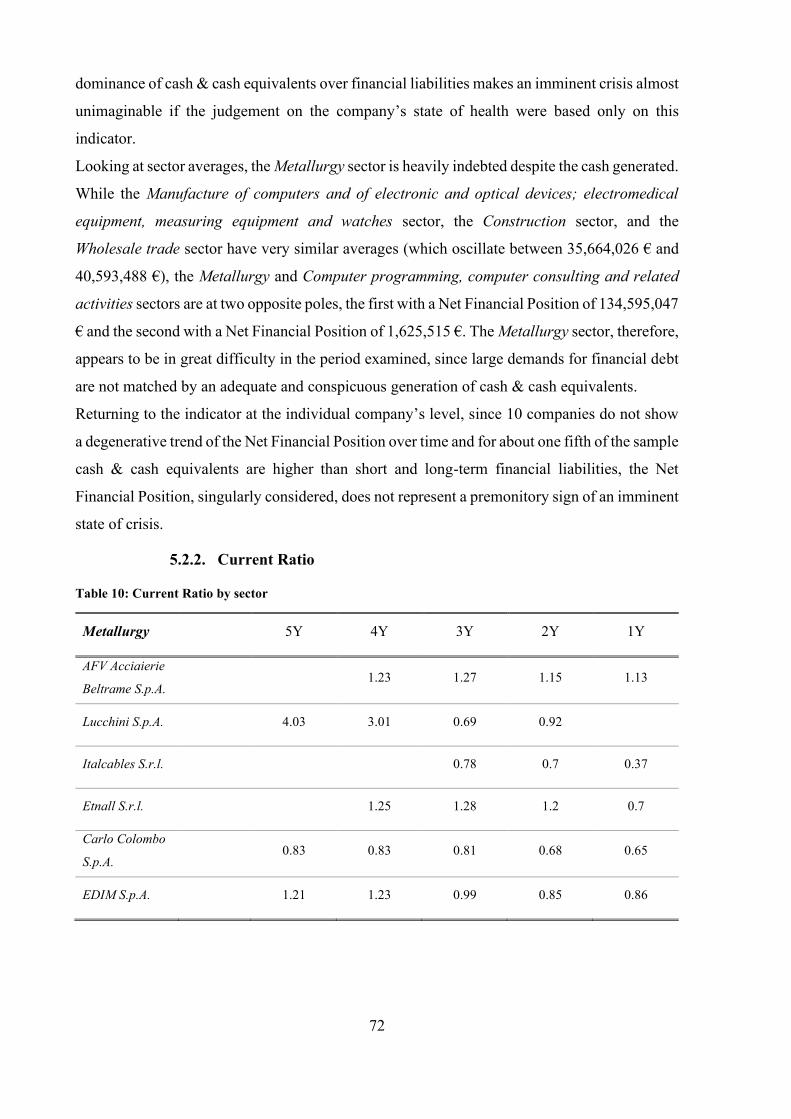
72
dominance of cash & cash equivalents over financial liabilities makes an imminent crisis almost
unimaginable if the judgement on the company’s state of health were based only on this
indicator.
Looking at sector averages, the Metallurgy sector is heavily indebted despite the cash generated.
While the Manufacture of computers and of electronic and optical devices; electromedical
equipment, measuring equipment and watches sector, the Construction sector, and the
Wholesale trade sector have very similar averages (which oscillate between 35,664,026 € and
40,593,488 €), the Metallurgy and Computer programming, computer consulting and related
activities sectors are at two opposite poles, the first with a Net Financial Position of 134,595,047
€ and the second with a Net Financial Position of 1,625,515 €. The Metallurgy sector, therefore,
appears to be in great difficulty in the period examined, since large demands for financial debt
are not matched by an adequate and conspicuous generation of cash & cash equivalents.
Returning to the indicator at the individual company’s level, since 10 companies do not show
a degenerative trend of the Net Financial Position over time and for about one fifth of the sample
cash & cash equivalents are higher than short and long-term financial liabilities, the Net
Financial Position, singularly considered, does not represent a premonitory sign of an imminent
state of crisis.
5.2.2. Current Ratio
Table 10: Current Ratio by sector
Metallurgy 5Y 4Y 3Y 2Y 1Y
AFV Acciaierie
Beltrame S.p.A. 1.23 1.27 1.15 1.13
Lucchini S.p.A. 4.03 3.01 0.69 0.92
Italcables S.r.l. 0.78 0.7 0.37
Etnall S.r.l. 1.25 1.28 1.2 0.7
Carlo Colombo
S.p.A. 0.83 0.83 0.81 0.68 0.65
EDIM S.p.A. 1.21 1.23 0.99 0.85 0.86

73
Manufacture of
computers and (…) 5Y 4Y 3Y 2Y 1Y
Solsonica S.r.l. 1.58 0.9 0.79 0.29 0.84
Jabil C.M. S.r.l. 1.13 1.69 1.32
OLDCOM S.r.l. 0.76 0.8 0.74 0.39 0.35
Compel Electronics
S.p.A. 1.05 0.99 0.63 0.47
Italtel S.p.A. 0.84 1.09 0.98 0.87 0.54
Linkra S.r.l. 1.29 1.28 1.52 1.36
Selta S.p.A. 1.27 1.12 1.24 0.99 0.79
Haemonetics
Produzione Italia S.r.l. 0.25 0.35 0.43 0.47 1.09
Construction 5Y 4Y 3Y 2Y 1Y
Alte Tecnologie
Ingegneristiche (A.T.I.)
Group S.r.l.
2.58 2.99 2.88 1.98
Condotte immobiliare
S.p.A. 1.37 1.17 1.66 1.69
IMF S.r.l. 2.33 1.72 1.6 0.8
Tecnis S.p.A. 1.3 0.95 0.96
Wholesale Trade 5Y 4Y 3Y 2Y 1Y
Distribuzione Cambria
S.r.l. 1.14 0.91 1.17 0.74
DPS Group S.r.l. 1.16 1.13 1.07 1.03 1.01
Silda S.r.l. 1.58 1.3 2.32 1.82
Sider All. Sud S.r.l. 1.02 0.96 n.a. 0.93 0.99
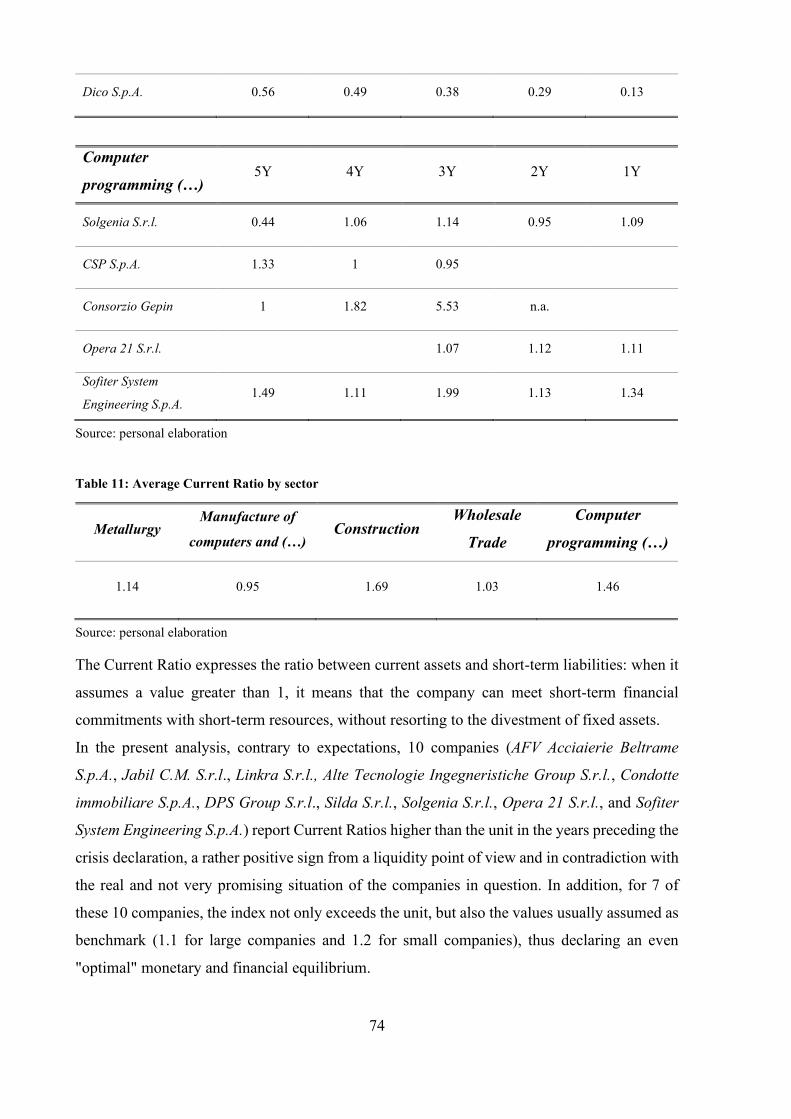
74
Dico S.p.A. 0.56 0.49 0.38 0.29 0.13
Computer
programming (…) 5Y 4Y 3Y 2Y 1Y
Solgenia S.r.l. 0.44 1.06 1.14 0.95 1.09
CSP S.p.A. 1.33 1 0.95
Consorzio Gepin 1 1.82 5.53 n.a.
Opera 21 S.r.l. 1.07 1.12 1.11
Sofiter System
Engineering S.p.A. 1.49 1.11 1.99 1.13 1.34
Source: personal elaboration
Table 11: Average Current Ratio by sector
Metallurgy Manufacture of
computers and (…) Construction
Wholesale
Trade
Computer
programming (…)
1.14 0.95 1.69 1.03 1.46
Source: personal elaboration
The Current Ratio expresses the ratio between current assets and short-term liabilities: when it
assumes a value greater than 1, it means that the company can meet short-term financial
commitments with short-term resources, without resorting to the divestment of fixed assets.
In the present analysis, contrary to expectations, 10 companies (AFV Acciaierie Beltrame
S.p.A., Jabil C.M. S.r.l., Linkra S.r.l., Alte Tecnologie Ingegneristiche Group S.r.l., Condotte
immobiliare S.p.A., DPS Group S.r.l., Silda S.r.l., Solgenia S.r.l., Opera 21 S.r.l., and Sofiter
System Engineering S.p.A.) report Current Ratios higher than the unit in the years preceding the
crisis declaration, a rather positive sign from a liquidity point of view and in contradiction with
the real and not very promising situation of the companies in question. In addition, for 7 of
these 10 companies, the index not only exceeds the unit, but also the values usually assumed as
benchmark (1.1 for large companies and 1.2 for small companies), thus declaring an even
"optimal" monetary and financial equilibrium.
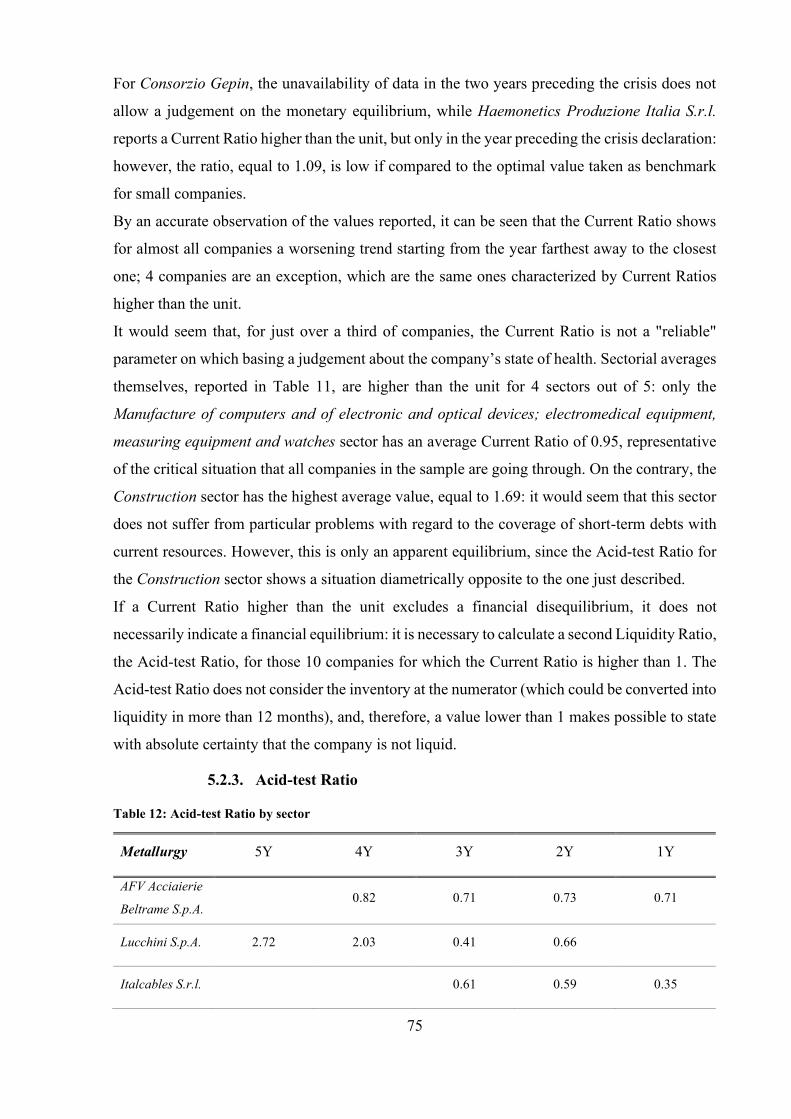
75
For Consorzio Gepin, the unavailability of data in the two years preceding the crisis does not
allow a judgement on the monetary equilibrium, while Haemonetics Produzione Italia S.r.l.
reports a Current Ratio higher than the unit, but only in the year preceding the crisis declaration:
however, the ratio, equal to 1.09, is low if compared to the optimal value taken as benchmark
for small companies.
By an accurate observation of the values reported, it can be seen that the Current Ratio shows
for almost all companies a worsening trend starting from the year farthest away to the closest
one; 4 companies are an exception, which are the same ones characterized by Current Ratios
higher than the unit.
It would seem that, for just over a third of companies, the Current Ratio is not a "reliable"
parameter on which basing a judgement about the company’s state of health. Sectorial averages
themselves, reported in Table 11, are higher than the unit for 4 sectors out of 5: only the
Manufacture of computers and of electronic and optical devices; electromedical equipment,
measuring equipment and watches sector has an average Current Ratio of 0.95, representative
of the critical situation that all companies in the sample are going through. On the contrary, the
Construction sector has the highest average value, equal to 1.69: it would seem that this sector
does not suffer from particular problems with regard to the coverage of short-term debts with
current resources. However, this is only an apparent equilibrium, since the Acid-test Ratio for
the Construction sector shows a situation diametrically opposite to the one just described.
If a Current Ratio higher than the unit excludes a financial disequilibrium, it does not
necessarily indicate a financial equilibrium: it is necessary to calculate a second Liquidity Ratio,
the Acid-test Ratio, for those 10 companies for which the Current Ratio is higher than 1. The
Acid-test Ratio does not consider the inventory at the numerator (which could be converted into
liquidity in more than 12 months), and, therefore, a value lower than 1 makes possible to state
with absolute certainty that the company is not liquid.
5.2.3. Acid-test Ratio
Table 12: Acid-test Ratio by sector
Metallurgy 5Y 4Y 3Y 2Y 1Y
AFV Acciaierie
Beltrame S.p.A. 0.82 0.71 0.73 0.71
Lucchini S.p.A. 2.72 2.03 0.41 0.66
Italcables S.r.l. 0.61 0.59 0.35
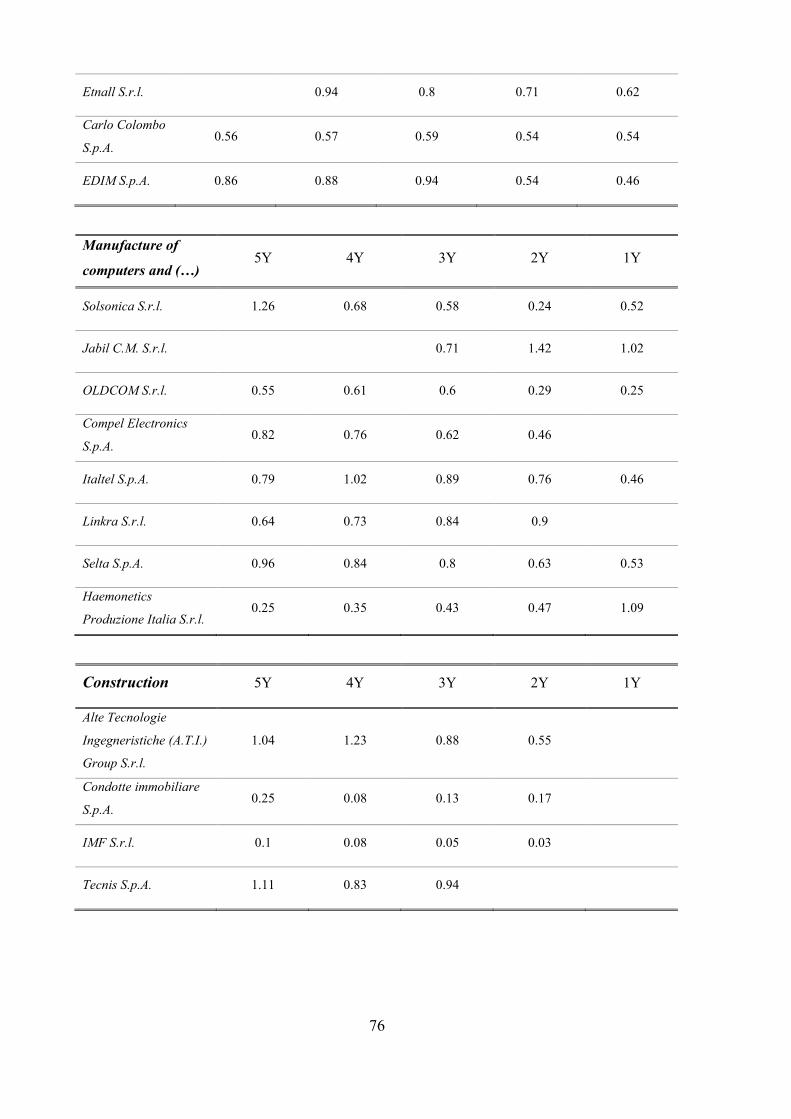
76
Etnall S.r.l. 0.94 0.8 0.71 0.62
Carlo Colombo
S.p.A. 0.56 0.57 0.59 0.54 0.54
EDIM S.p.A. 0.86 0.88 0.94 0.54 0.46
Manufacture of
computers and (…) 5Y 4Y 3Y 2Y 1Y
Solsonica S.r.l. 1.26 0.68 0.58 0.24 0.52
Jabil C.M. S.r.l. 0.71 1.42 1.02
OLDCOM S.r.l. 0.55 0.61 0.6 0.29 0.25
Compel Electronics
S.p.A. 0.82 0.76 0.62 0.46
Italtel S.p.A. 0.79 1.02 0.89 0.76 0.46
Linkra S.r.l. 0.64 0.73 0.84 0.9
Selta S.p.A. 0.96 0.84 0.8 0.63 0.53
Haemonetics
Produzione Italia S.r.l. 0.25 0.35 0.43 0.47 1.09
Construction 5Y 4Y 3Y 2Y 1Y
Alte Tecnologie
Ingegneristiche (A.T.I.)
Group S.r.l.
1.04 1.23 0.88 0.55
Condotte immobiliare
S.p.A. 0.25 0.08 0.13 0.17
IMF S.r.l. 0.1 0.08 0.05 0.03
Tecnis S.p.A. 1.11 0.83 0.94
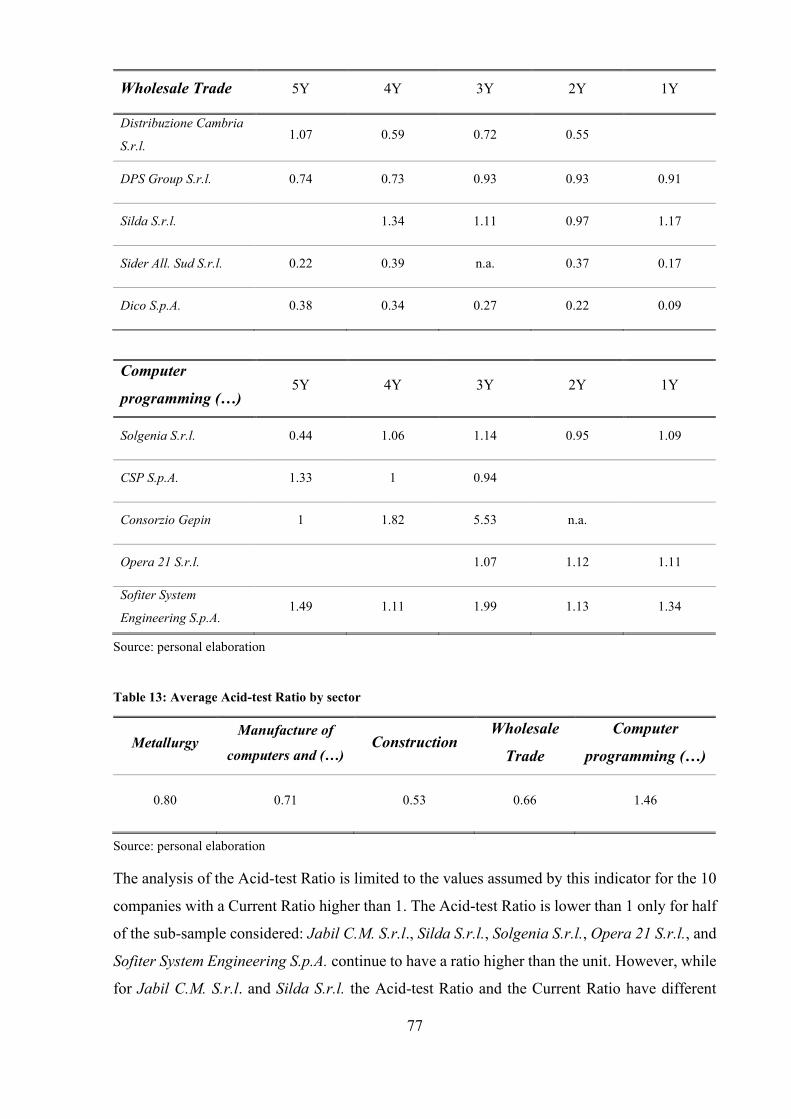
77
Computer
programming (…) 5Y 4Y 3Y 2Y 1Y
Solgenia S.r.l. 0.44 1.06 1.14 0.95 1.09
CSP S.p.A. 1.33 1 0.94
Consorzio Gepin 1 1.82 5.53 n.a.
Opera 21 S.r.l. 1.07 1.12 1.11
Sofiter System
Engineering S.p.A. 1.49 1.11 1.99 1.13 1.34
Source: personal elaboration
Table 13: Average Acid-test Ratio by sector
Metallurgy Manufacture of
computers and (…) Construction
Wholesale
Trade
Computer
programming (…)
0.80 0.71 0.53 0.66 1.46
Source: personal elaboration
The analysis of the Acid-test Ratio is limited to the values assumed by this indicator for the 10
companies with a Current Ratio higher than 1. The Acid-test Ratio is lower than 1 only for half
of the sub-sample considered: Jabil C.M. S.r.l., Silda S.r.l., Solgenia S.r.l., Opera 21 S.r.l., and
Sofiter System Engineering S.p.A. continue to have a ratio higher than the unit. However, while
for Jabil C.M. S.r.l. and Silda S.r.l. the Acid-test Ratio and the Current Ratio have different
Wholesale Trade 5Y 4Y 3Y 2Y 1Y
Distribuzione Cambria
S.r.l. 1.07 0.59 0.72 0.55
DPS Group S.r.l. 0.74 0.73 0.93 0.93 0.91
Silda S.r.l. 1.34 1.11 0.97 1.17
Sider All. Sud S.r.l. 0.22 0.39 n.a. 0.37 0.17
Dico S.p.A. 0.38 0.34 0.27 0.22 0.09
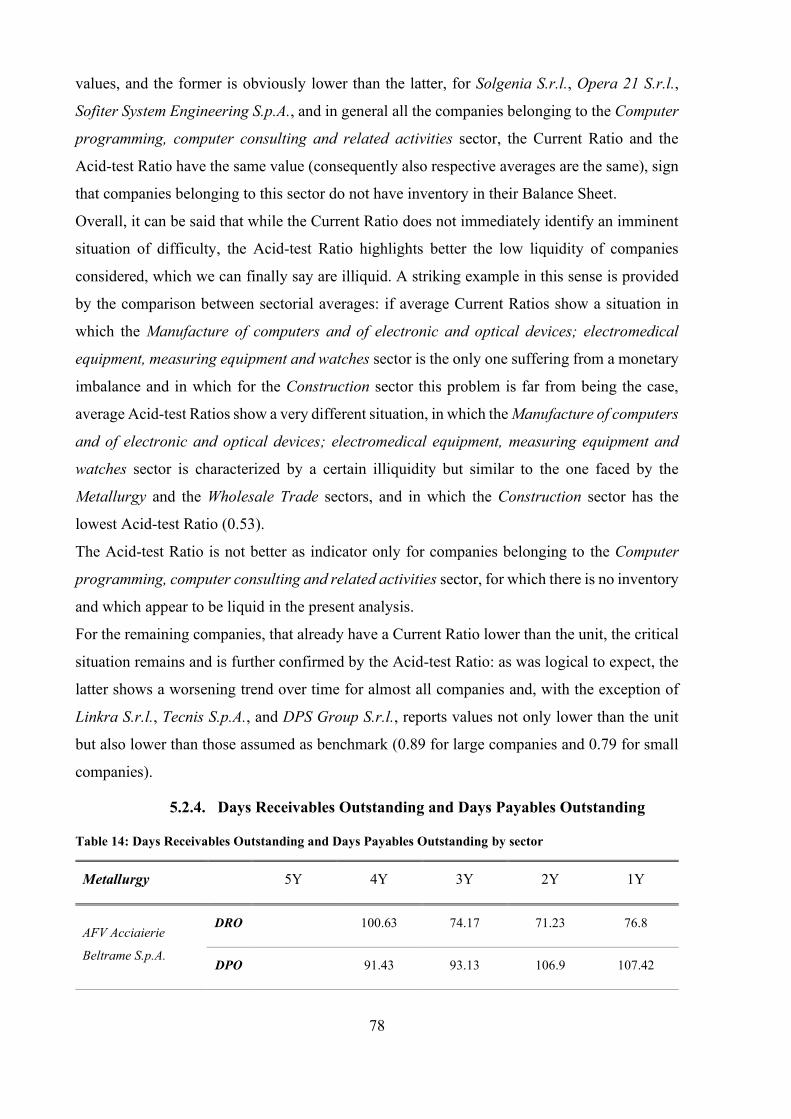
78
values, and the former is obviously lower than the latter, for Solgenia S.r.l., Opera 21 S.r.l.,
Sofiter System Engineering S.p.A., and in general all the companies belonging to the Computer
programming, computer consulting and related activities sector, the Current Ratio and the
Acid-test Ratio have the same value (consequently also respective averages are the same), sign
that companies belonging to this sector do not have inventory in their Balance Sheet.
Overall, it can be said that while the Current Ratio does not immediately identify an imminent
situation of difficulty, the Acid-test Ratio highlights better the low liquidity of companies
considered, which we can finally say are illiquid. A striking example in this sense is provided
by the comparison between sectorial averages: if average Current Ratios show a situation in
which the Manufacture of computers and of electronic and optical devices; electromedical
equipment, measuring equipment and watches sector is the only one suffering from a monetary
imbalance and in which for the Construction sector this problem is far from being the case,
average Acid-test Ratios show a very different situation, in which the Manufacture of computers
and of electronic and optical devices; electromedical equipment, measuring equipment and
watches sector is characterized by a certain illiquidity but similar to the one faced by the
Metallurgy and the Wholesale Trade sectors, and in which the Construction sector has the
lowest Acid-test Ratio (0.53).
The Acid-test Ratio is not better as indicator only for companies belonging to the Computer
programming, computer consulting and related activities sector, for which there is no inventory
and which appear to be liquid in the present analysis.
For the remaining companies, that already have a Current Ratio lower than the unit, the critical
situation remains and is further confirmed by the Acid-test Ratio: as was logical to expect, the
latter shows a worsening trend over time for almost all companies and, with the exception of
Linkra S.r.l., Tecnis S.p.A., and DPS Group S.r.l., reports values not only lower than the unit
but also lower than those assumed as benchmark (0.89 for large companies and 0.79 for small
companies).
5.2.4. Days Receivables Outstanding and Days Payables Outstanding
Table 14: Days Receivables Outstanding and Days Payables Outstanding by sector
Metallurgy 5Y 4Y 3Y 2Y 1Y
AFV Acciaierie
Beltrame S.p.A.
DRO 100.63 74.17 71.23 76.8
DPO 91.43 93.13 106.9 107.42

79
Lucchini S.p.A.
DRO n.a. 76.91 80.28 79.09
DPO 46.55 98.24 80.05 76.3
Italcables S.r.l.
DRO 103.84 116.94 83.77
DPO 93.47 146.2 236.14
Etnall S.r.l.
DRO 214.72 238.46 177.64 179.73
DPO 153.92 83.59 68.34 84.44
Carlo Colombo
S.p.A.
DRO 19.11 22.94 25.65 25.45 26
DPO 16.22 19.23 17.63 18.96 23.44
EDIM S.p.A.
DRO 73.13 79.75 191.33 38.35 40.2
DPO 74.86 101.17 198.23 58.17 72.09
Manufacture of
computers and (…) 5Y 4Y 3Y 2Y 1Y
Solsonica S.r.l.
DRO 86.07 47.77 52.19 48.64 580.15
DPO 55.55 60.67 67.4 79.51 n.s.
Jabil C.M. S.r.l.
DRO 42.2 72.45 13.53
DPO 78.3 95.94 75.95
OLDCOM S.r.l.
DRO 68.2 55.25 55.93 69.8 23.37
DPO 149.86 128.21 145.59 159.76 193.99
Compel Electronics
S.p.A.
DRO 47.13 60.78 100.74 68.54
DPO 147.27 94.78 24.89 30.73
Italtel S.p.A.
DRO 65.59 104.65 60.04 50.98 99.55
DPO 258.51 177.16 176.22 167.04 210.95
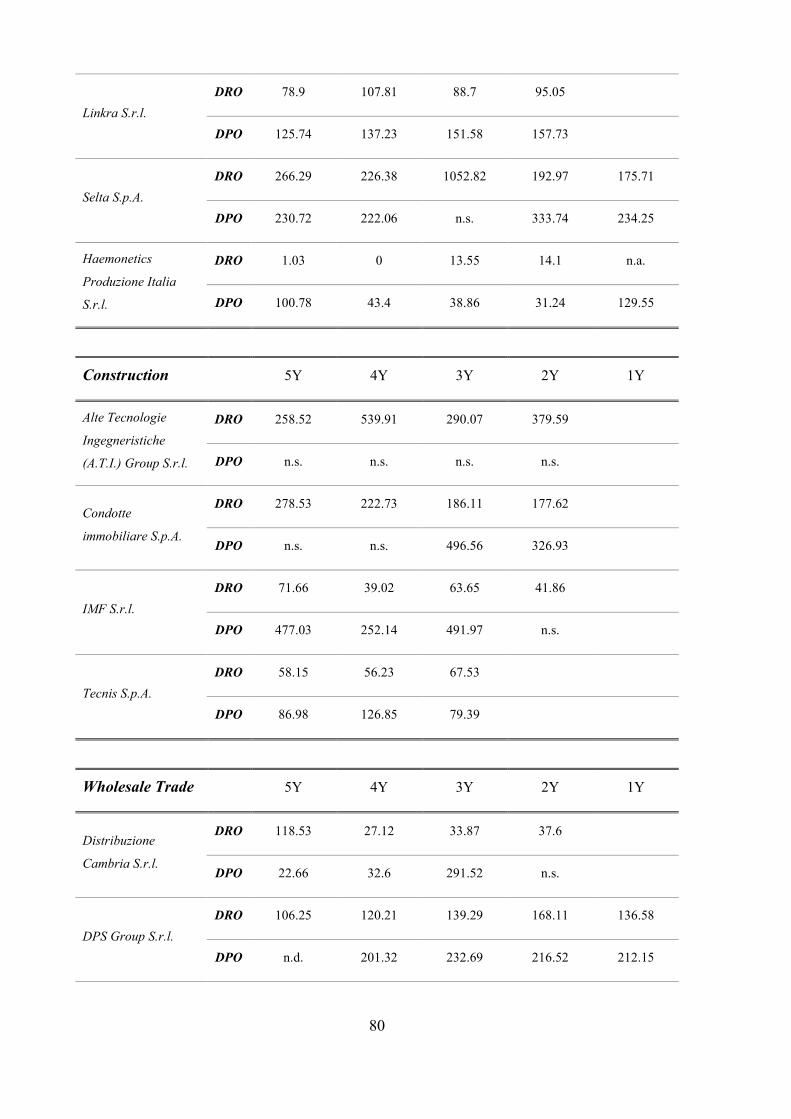
80
Linkra S.r.l.
DRO 78.9 107.81 88.7 95.05
DPO 125.74 137.23 151.58 157.73
Selta S.p.A.
DRO 266.29 226.38 1052.82 192.97 175.71
DPO 230.72 222.06 n.s. 333.74 234.25
Haemonetics
Produzione Italia
S.r.l.
DRO 1.03 0 13.55 14.1 n.a.
DPO 100.78 43.4 38.86 31.24 129.55
Construction 5Y 4Y 3Y 2Y 1Y
Alte Tecnologie
Ingegneristiche
(A.T.I.) Group S.r.l.
DRO 258.52 539.91 290.07 379.59
DPO n.s. n.s. n.s. n.s.
Condotte
immobiliare S.p.A.
DRO 278.53 222.73 186.11 177.62
DPO n.s. n.s. 496.56 326.93
IMF S.r.l.
DRO 71.66 39.02 63.65 41.86
DPO 477.03 252.14 491.97 n.s.
Tecnis S.p.A.
DRO 58.15 56.23 67.53
DPO 86.98 126.85 79.39
Wholesale Trade 5Y 4Y 3Y 2Y 1Y
Distribuzione
Cambria S.r.l.
DRO 118.53 27.12 33.87 37.6
DPO 22.66 32.6 291.52 n.s.
DPS Group S.r.l.
DRO 106.25 120.21 139.29 168.11 136.58
DPO n.d. 201.32 232.69 216.52 212.15
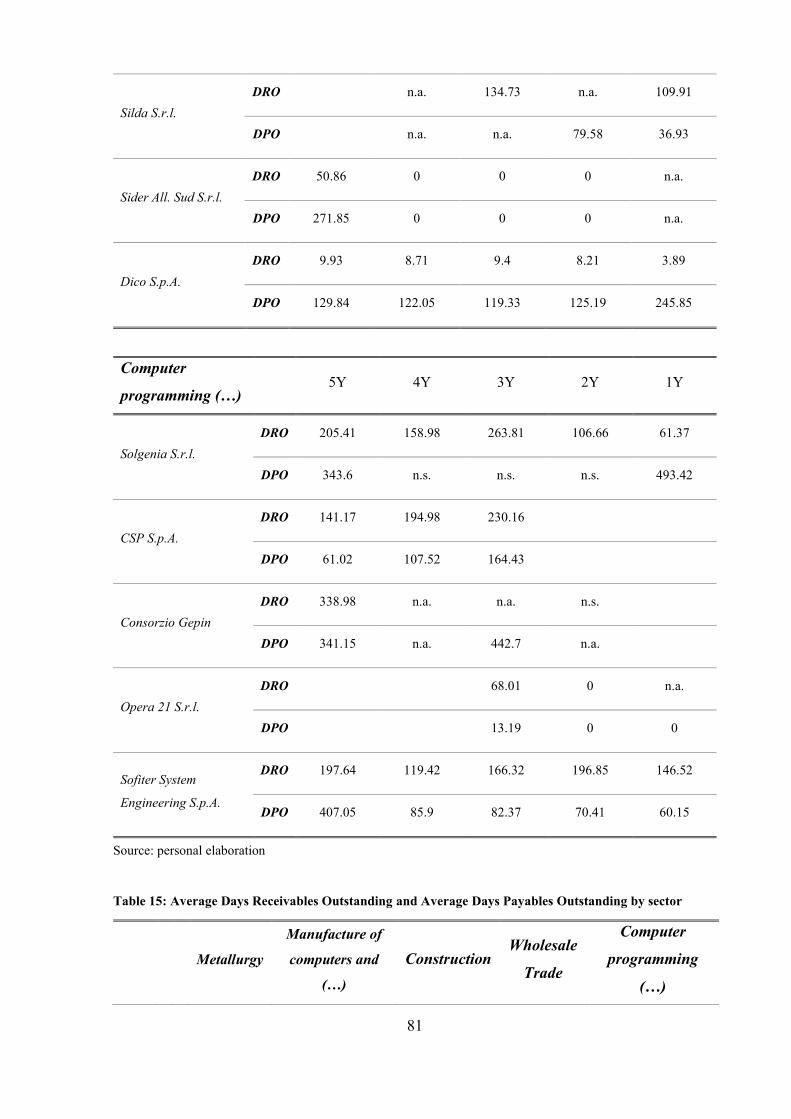
81
Silda S.r.l.
DRO n.a. 134.73 n.a. 109.91
DPO n.a. n.a. 79.58 36.93
Sider All. Sud S.r.l.
DRO 50.86 0 0 0 n.a.
DPO 271.85 0 0 0 n.a.
Dico S.p.A.
DRO 9.93 8.71 9.4 8.21 3.89
DPO 129.84 122.05 119.33 125.19 245.85
Computer
programming (…) 5Y 4Y 3Y 2Y 1Y
Solgenia S.r.l.
DRO 205.41 158.98 263.81 106.66 61.37
DPO 343.6 n.s. n.s. n.s. 493.42
CSP S.p.A.
DRO 141.17 194.98 230.16
DPO 61.02 107.52 164.43
Consorzio Gepin
DRO 338.98 n.a. n.a. n.s.
DPO 341.15 n.a. 442.7 n.a.
Opera 21 S.r.l.
DRO 68.01 0 n.a.
DPO 13.19 0 0
Sofiter System
Engineering S.p.A.
DRO 197.64 119.42 166.32 196.85 146.52
DPO 407.05 85.9 82.37 70.41 60.15
Source: personal elaboration
Table 15: Average Days Receivables Outstanding and Average Days Payables Outstanding by sector
Metallurgy
Manufacture of
computers and
(…)
Construction Wholesale
Trade
Computer
programming
(…)

82
DRO 95.33 523.36 174.49 66.29 177.27
DPO 91.86 564.40 305.51 121.19 213.40
Source: personal elaboration
The judgement of the monetary equilibrium passes also through the Efficiency Ratios, in
particular the Days Receivables Outstanding, the Days Payables Outstanding, and their
comparison over time. The calculation of these two ratios caused many difficulties for
companies such as Alte Tecnologie Ingegneristiche Group S.r.l., Silda S.r.l., Sider All. Sud
S.r.l., Solgenia S.r.l., Consorzio Gepin, and Opera 21 S.r.l., which, in several years, report
values not available (n.a.), meaningless (n.s.) or equal to zero. From the remaining sample of
22 companies, only 4 companies (Etnall S.r.l., Compel Electronics S.p.A., CSP S.p.A., Sofiter
System Engineering S.p.A.) show DROs higher than DPOs and, therefore, a concrete difficulty
in collecting and having the necessary money to repay debts (probably these companies suffer
from a treasury gap). For two companies, Lucchini S.p.A. and Carlo Colombo S.p.A., DROs
and DPOs present similar values as the time needed to repay the suppliers is the same as the
time needed to collect the credits.
Looking at the sectorial averages, the comparison between the two ratios does not appear to be
a point of reference for the preventive identification of the crisis in the present work. However,
from the analysis carried out, an interesting aspect lies in the average times necessary to collect
credit and to repay debt, very different from sector to sector, with cycles that last just over two
months (it is the case of the Wholesale trade sector) and cycles that even exceed the calendar
year (as in the Manufacture of computers and of electronic and optical devices; electromedical
equipment, measuring equipment and watches sector).
5.2.5. Leverage
Table 16: Leverage by sector
Metallurgy 5Y 4Y 3Y 2Y 1Y
AFV Acciaierie
Beltrame S.p.A. 2 2.11 2.18 2.18
Lucchini S.p.A. 2.38 2.41 9.52 16.31
Italcables S.r.l. 6.37 18.26 -3.71
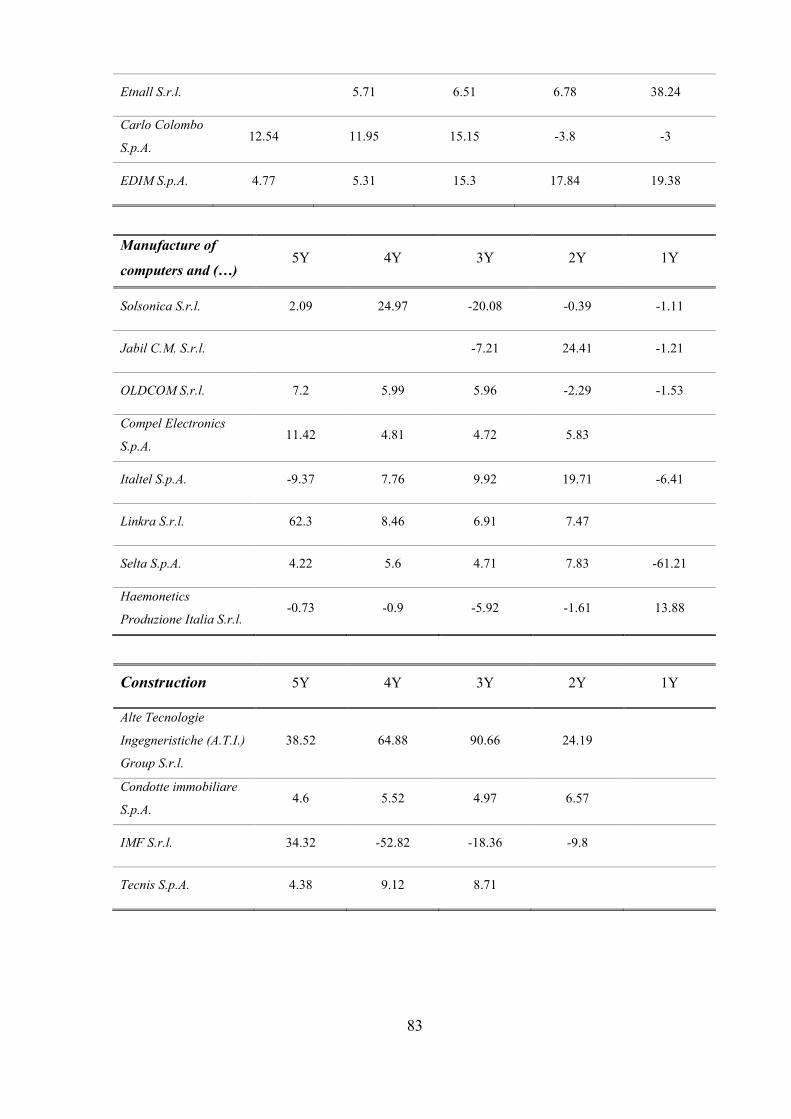
83
Etnall S.r.l. 5.71 6.51 6.78 38.24
Carlo Colombo
S.p.A. 12.54 11.95 15.15 -3.8 -3
EDIM S.p.A. 4.77 5.31 15.3 17.84 19.38
Manufacture of
computers and (…) 5Y 4Y 3Y 2Y 1Y
Solsonica S.r.l. 2.09 24.97 -20.08 -0.39 -1.11
Jabil C.M. S.r.l. -7.21 24.41 -1.21
OLDCOM S.r.l. 7.2 5.99 5.96 -2.29 -1.53
Compel Electronics
S.p.A. 11.42 4.81 4.72 5.83
Italtel S.p.A. -9.37 7.76 9.92 19.71 -6.41
Linkra S.r.l. 62.3 8.46 6.91 7.47
Selta S.p.A. 4.22 5.6 4.71 7.83 -61.21
Haemonetics
Produzione Italia S.r.l. -0.73 -0.9 -5.92 -1.61 13.88
Construction 5Y 4Y 3Y 2Y 1Y
Alte Tecnologie
Ingegneristiche (A.T.I.)
Group S.r.l.
38.52 64.88 90.66 24.19
Condotte immobiliare
S.p.A. 4.6 5.52 4.97 6.57
IMF S.r.l. 34.32 -52.82 -18.36 -9.8
Tecnis S.p.A. 4.38 9.12 8.71
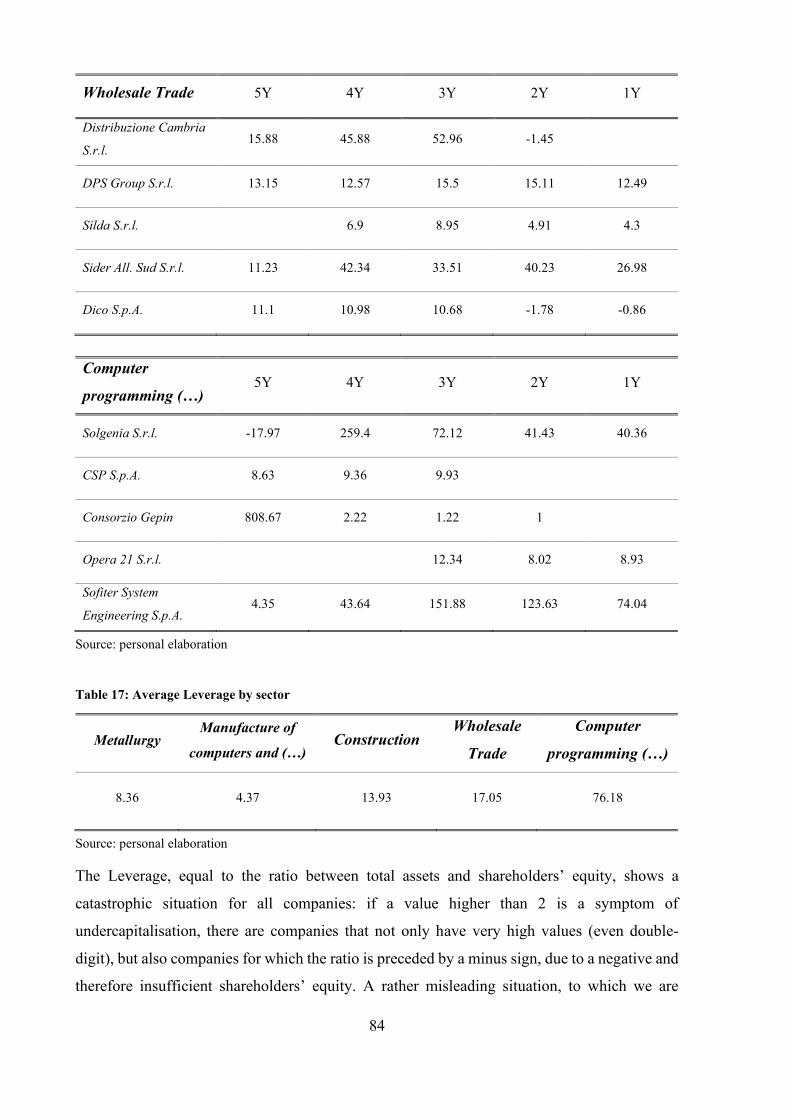
84
Wholesale Trade 5Y 4Y 3Y 2Y 1Y
Distribuzione Cambria
S.r.l. 15.88 45.88 52.96 -1.45
DPS Group S.r.l. 13.15 12.57 15.5 15.11 12.49
Silda S.r.l. 6.9 8.95 4.91 4.3
Sider All. Sud S.r.l. 11.23 42.34 33.51 40.23 26.98
Dico S.p.A. 11.1 10.98 10.68 -1.78 -0.86
Computer
programming (…) 5Y 4Y 3Y 2Y 1Y
Solgenia S.r.l. -17.97 259.4 72.12 41.43 40.36
CSP S.p.A. 8.63 9.36 9.93
Consorzio Gepin 808.67 2.22 1.22 1
Opera 21 S.r.l. 12.34 8.02 8.93
Sofiter System
Engineering S.p.A. 4.35 43.64 151.88 123.63 74.04
Source: personal elaboration
Table 17: Average Leverage by sector
Metallurgy Manufacture of
computers and (…) Construction
Wholesale
Trade
Computer
programming (…)
8.36 4.37 13.93 17.05 76.18
Source: personal elaboration
The Leverage, equal to the ratio between total assets and shareholders’ equity, shows a
catastrophic situation for all companies: if a value higher than 2 is a symptom of
undercapitalisation, there are companies that not only have very high values (even double-
digit), but also companies for which the ratio is preceded by a minus sign, due to a negative and
therefore insufficient shareholders’ equity. A rather misleading situation, to which we are
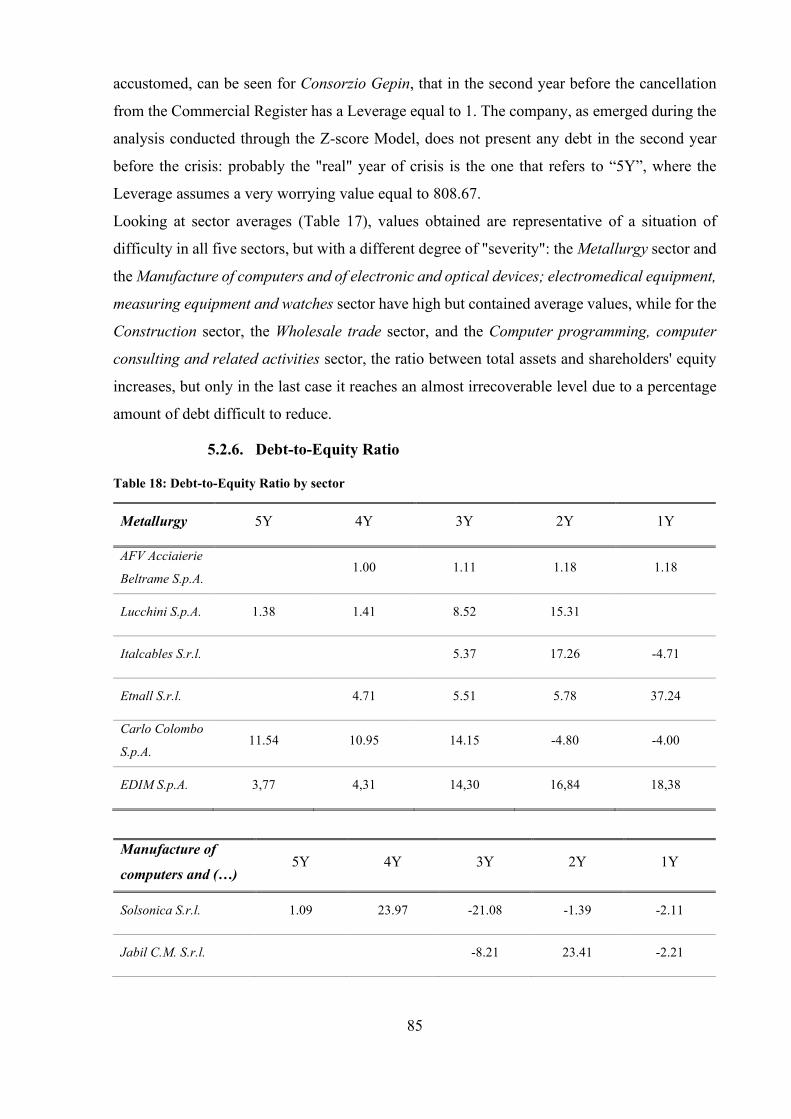
85
accustomed, can be seen for Consorzio Gepin, that in the second year before the cancellation
from the Commercial Register has a Leverage equal to 1. The company, as emerged during the
analysis conducted through the Z-score Model, does not present any debt in the second year
before the crisis: probably the "real" year of crisis is the one that refers to “5Y”, where the
Leverage assumes a very worrying value equal to 808.67.
Looking at sector averages (Table 17), values obtained are representative of a situation of
difficulty in all five sectors, but with a different degree of "severity": the Metallurgy sector and
the Manufacture of computers and of electronic and optical devices; electromedical equipment,
measuring equipment and watches sector have high but contained average values, while for the
Construction sector, the Wholesale trade sector, and the Computer programming, computer
consulting and related activities sector, the ratio between total assets and shareholders' equity
increases, but only in the last case it reaches an almost irrecoverable level due to a percentage
amount of debt difficult to reduce.
5.2.6. Debt-to-Equity Ratio
Table 18: Debt-to-Equity Ratio by sector
Metallurgy 5Y 4Y 3Y 2Y 1Y
AFV Acciaierie
Beltrame S.p.A. 1.00 1.11 1.18 1.18
Lucchini S.p.A. 1.38 1.41 8.52 15.31
Italcables S.r.l. 5.37 17.26 -4.71
Etnall S.r.l. 4.71 5.51 5.78 37.24
Carlo Colombo
S.p.A. 11.54 10.95 14.15 -4.80 -4.00
EDIM S.p.A. 3,77 4,31 14,30 16,84 18,38
Manufacture of
computers and (…) 5Y 4Y 3Y 2Y 1Y
Solsonica S.r.l. 1.09 23.97 -21.08 -1.39 -2.11
Jabil C.M. S.r.l. -8.21 23.41 -2.21
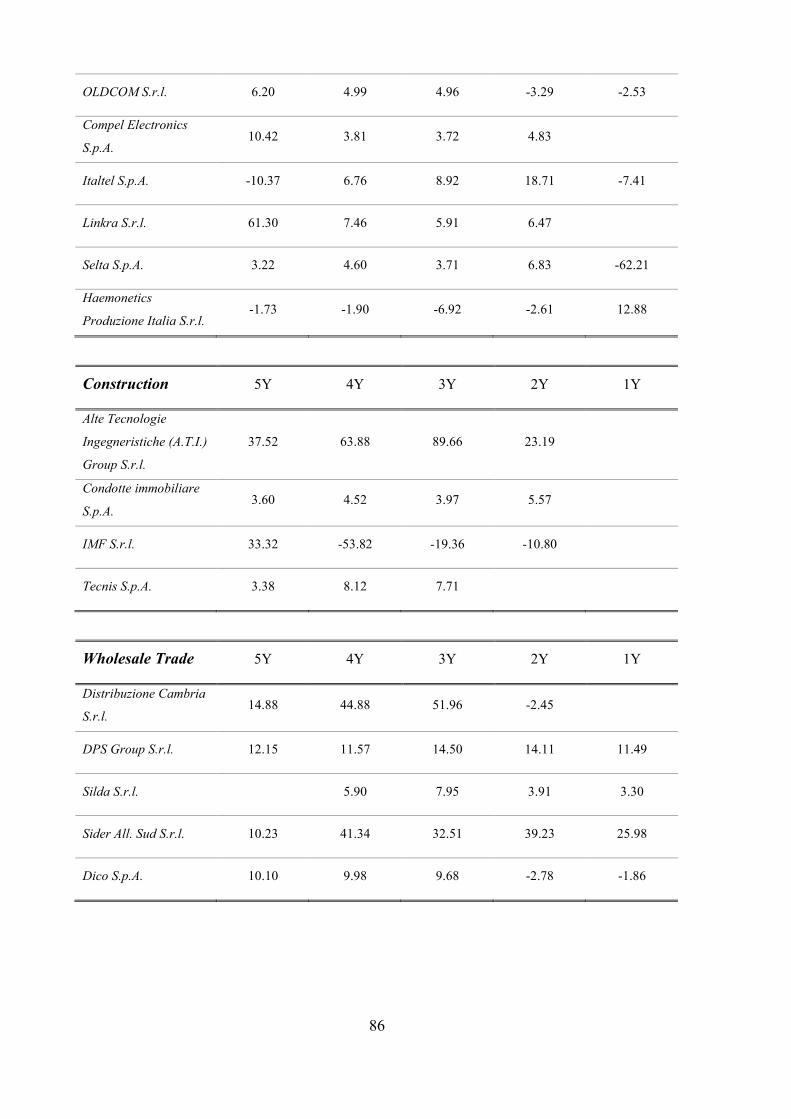
86
OLDCOM S.r.l. 6.20 4.99 4.96 -3.29 -2.53
Compel Electronics
S.p.A. 10.42 3.81 3.72 4.83
Italtel S.p.A. -10.37 6.76 8.92 18.71 -7.41
Linkra S.r.l. 61.30 7.46 5.91 6.47
Selta S.p.A. 3.22 4.60 3.71 6.83 -62.21
Haemonetics
Produzione Italia S.r.l. -1.73 -1.90 -6.92 -2.61 12.88
Construction 5Y 4Y 3Y 2Y 1Y
Alte Tecnologie
Ingegneristiche (A.T.I.)
Group S.r.l.
37.52 63.88 89.66 23.19
Condotte immobiliare
S.p.A. 3.60 4.52 3.97 5.57
IMF S.r.l. 33.32 -53.82 -19.36 -10.80
Tecnis S.p.A. 3.38 8.12 7.71
Wholesale Trade 5Y 4Y 3Y 2Y 1Y
Distribuzione Cambria
S.r.l. 14.88 44.88 51.96 -2.45
DPS Group S.r.l. 12.15 11.57 14.50 14.11 11.49
Silda S.r.l. 5.90 7.95 3.91 3.30
Sider All. Sud S.r.l. 10.23 41.34 32.51 39.23 25.98
Dico S.p.A. 10.10 9.98 9.68 -2.78 -1.86

87
Computer
programming (…) 5Y 4Y 3Y 2Y 1Y
Solgenia S.r.l. -18.97 258.40 71.12 40.43 39.36
CSP S.p.A. 7.63 8.36 8.93
Consorzio Gepin 807.67 1.22 0.22 0
Opera 21 S.r.l. 11.34 7.02 7.93
Sofiter System
Engineering S.p.A. 3.35 42.64 150.88 122.63 73.04
Source: personal elaboration
Table 19: Average Debt-to-Equity Ratio by sector
Metallurgy Manufacture of
computers and (…) Construction
Wholesale
Trade
Computer
programming (…)
7.36 3.37 12.93 16.05 75.18
Source: personal elaboration
The same considerations made for the Leverage can also be made for the Debt-to-Equity Ratio:
high or even negative values for the Leverage correspond to high or even negative values for
the Debt-to-Equity Ratio.
Rarely the Debt-to-Equity Ratio assumes values lower than 1: in general, a value no higher than
3 is considered acceptable. In the analysis carried out, two companies are an exception:
Consorzio Gepin and AFV Acciaierie Beltrame S.p.A.. As for the previous indicator, Consorzio
Gepin's Debt-to-Equity Ratio, equal to 0, should not be considered as it is not indicative of the
real crisis situation (the “real” crisis dates back to the fifth year before the crisis declaration).
AFV Acciaierie Beltrame S.p.A. is the only company with an acceptable Debt-to-Equity Ratio
(Debt-to-Equity Ratio equal to 1.18): for this company the Leverage is just above the value
taken as benchmark (Leverage equal to 2.18 versus its threshold value equal to 2), so it would
be logical to expect a rather low value for the Debt-to-Equity Ratio. Anyway, the company is
the only exception within the final test sample.
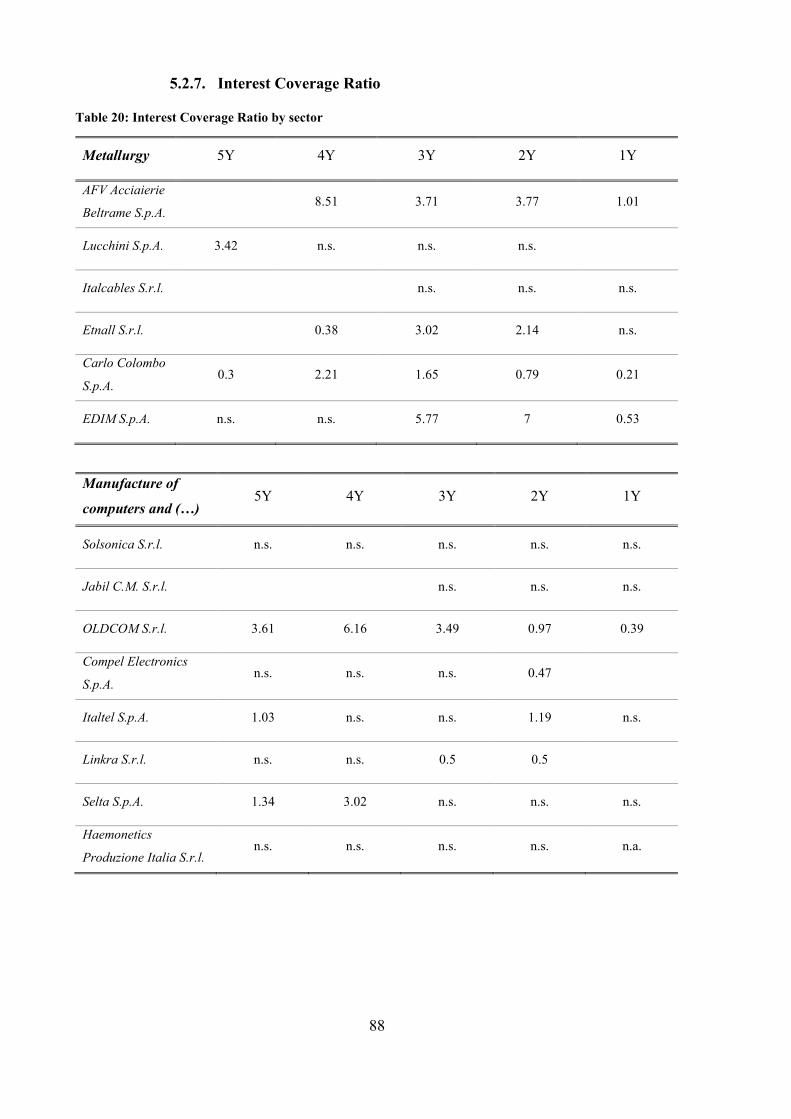
88
5.2.7. Interest Coverage Ratio
Table 20: Interest Coverage Ratio by sector
Metallurgy 5Y 4Y 3Y 2Y 1Y
AFV Acciaierie
Beltrame S.p.A. 8.51 3.71 3.77 1.01
Lucchini S.p.A. 3.42 n.s. n.s. n.s.
Italcables S.r.l. n.s. n.s. n.s.
Etnall S.r.l. 0.38 3.02 2.14 n.s.
Carlo Colombo
S.p.A. 0.3 2.21 1.65 0.79 0.21
EDIM S.p.A. n.s. n.s. 5.77 7 0.53
Manufacture of
computers and (…) 5Y 4Y 3Y 2Y 1Y
Solsonica S.r.l. n.s. n.s. n.s. n.s. n.s.
Jabil C.M. S.r.l. n.s. n.s. n.s.
OLDCOM S.r.l. 3.61 6.16 3.49 0.97 0.39
Compel Electronics
S.p.A. n.s. n.s. n.s. 0.47
Italtel S.p.A. 1.03 n.s. n.s. 1.19 n.s.
Linkra S.r.l. n.s. n.s. 0.5 0.5
Selta S.p.A. 1.34 3.02 n.s. n.s. n.s.
Haemonetics
Produzione Italia S.r.l. n.s. n.s. n.s. n.s. n.a.
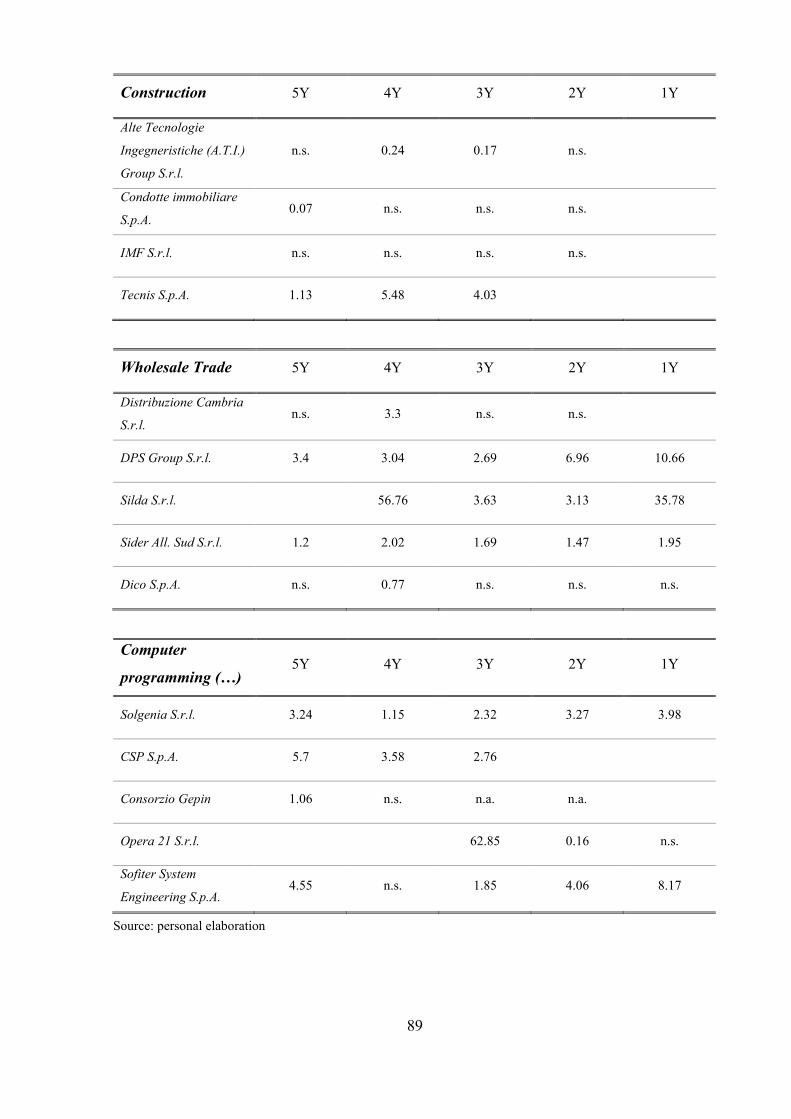
89
Construction 5Y 4Y 3Y 2Y 1Y
Alte Tecnologie
Ingegneristiche (A.T.I.)
Group S.r.l.
n.s. 0.24 0.17 n.s.
Condotte immobiliare
S.p.A. 0.07 n.s. n.s. n.s.
IMF S.r.l. n.s. n.s. n.s. n.s.
Tecnis S.p.A. 1.13 5.48 4.03
Wholesale Trade 5Y 4Y 3Y 2Y 1Y
Distribuzione Cambria
S.r.l. n.s. 3.3 n.s. n.s.
DPS Group S.r.l. 3.4 3.04 2.69 6.96 10.66
Silda S.r.l. 56.76 3.63 3.13 35.78
Sider All. Sud S.r.l. 1.2 2.02 1.69 1.47 1.95
Dico S.p.A. n.s. 0.77 n.s. n.s. n.s.
Computer
programming (…) 5Y 4Y 3Y 2Y 1Y
Solgenia S.r.l. 3.24 1.15 2.32 3.27 3.98
CSP S.p.A. 5.7 3.58 2.76
Consorzio Gepin 1.06 n.s. n.a. n.a.
Opera 21 S.r.l. 62.85 0.16 n.s.
Sofiter System
Engineering S.p.A. 4.55 n.s. 1.85 4.06 8.17
Source: personal elaboration

90
Table 21: Average Interest Coverage Ratio by sector
Metallurgy Manufacture of
computers and (…) Construction
Wholesale
Trade
Computer
programming (…)
3.00 39.43 1.27 7.18 8.81
Source: personal elaboration
Also the Interest Coverage Ratio underlines the seriousness of the situation in which companies
find themselves. In the configuration adopted, which provides for the ratio between the gross
operating margin and the interest expenses, the ratio is considered acceptable if its value is
higher than 4: only in this way the gross operating margin can repay financial charges, other
types of extra-operating costs, and leave an appropriate remuneration to the capital investors.
The analysis reveals a situation so serious that, several times, the Interest Coverage Ratio is not
significant (n.s.) because the operating income, integral part of the numerator, is negative
(aspect already highlighted by the Z-score Model).
For those companies for which it is possible to calculate a meaningful value of the ratio, the
indicator never assumes, except in four cases, a value higher than 4.
Sectorial averages for the Interest Coverage Ratio are shown in Table 21, but are not indicative
of the real condition of the sample since the lack of data or their insignificance, which affects
all the sectors, does not allow to calculate reliable averages.
5.2.8. Financial debts / sales revenues
Table 22: Financial debts / sales revenues by sector
Metallurgy 5Y 4Y 3Y 2Y 1Y
AFV Acciaierie
Beltrame S.p.A. 24.45 24.87 24.68 28.39
Lucchini S.p.A. 51.44 94.67 62.09 59.99
Italcables S.r.l. 26.02 23.28 14.96
Etnall S.r.l. 72.73 71.55 62.34 69.15
Carlo Colombo
S.p.A. 10.68 11.01 12.12 13.12 14.64
EDIM S.p.A. 21.6 15.76 3.01 0.76 7.5
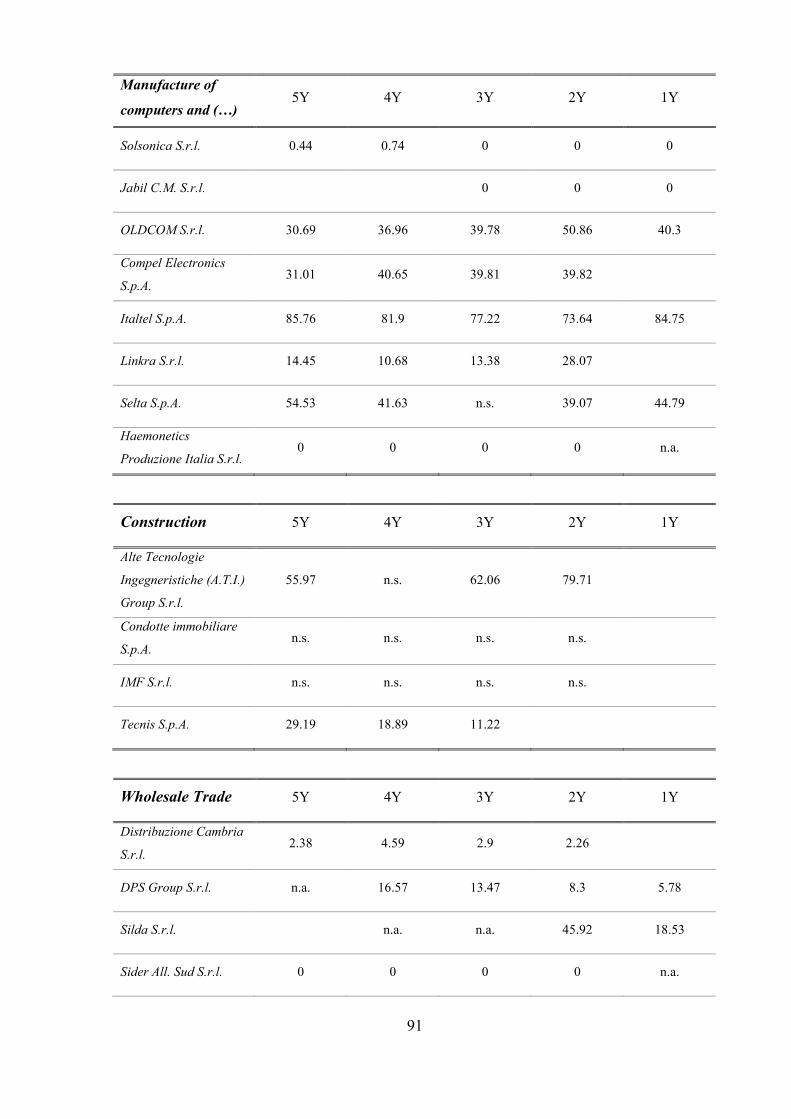
91
Manufacture of
computers and (…) 5Y 4Y 3Y 2Y 1Y
Solsonica S.r.l. 0.44 0.74 0 0 0
Jabil C.M. S.r.l. 0 0 0
OLDCOM S.r.l. 30.69 36.96 39.78 50.86 40.3
Compel Electronics
S.p.A. 31.01 40.65 39.81 39.82
Italtel S.p.A. 85.76 81.9 77.22 73.64 84.75
Linkra S.r.l. 14.45 10.68 13.38 28.07
Selta S.p.A. 54.53 41.63 n.s. 39.07 44.79
Haemonetics
Produzione Italia S.r.l. 0 0 0 0 n.a.
Construction 5Y 4Y 3Y 2Y 1Y
Alte Tecnologie
Ingegneristiche (A.T.I.)
Group S.r.l.
55.97 n.s. 62.06 79.71
Condotte immobiliare
S.p.A. n.s. n.s. n.s. n.s.
IMF S.r.l. n.s. n.s. n.s. n.s.
Tecnis S.p.A. 29.19 18.89 11.22
Wholesale Trade 5Y 4Y 3Y 2Y 1Y
Distribuzione Cambria
S.r.l. 2.38 4.59 2.9 2.26
DPS Group S.r.l. n.a. 16.57 13.47 8.3 5.78
Silda S.r.l. n.a. n.a. 45.92 18.53
Sider All. Sud S.r.l. 0 0 0 0 n.a.
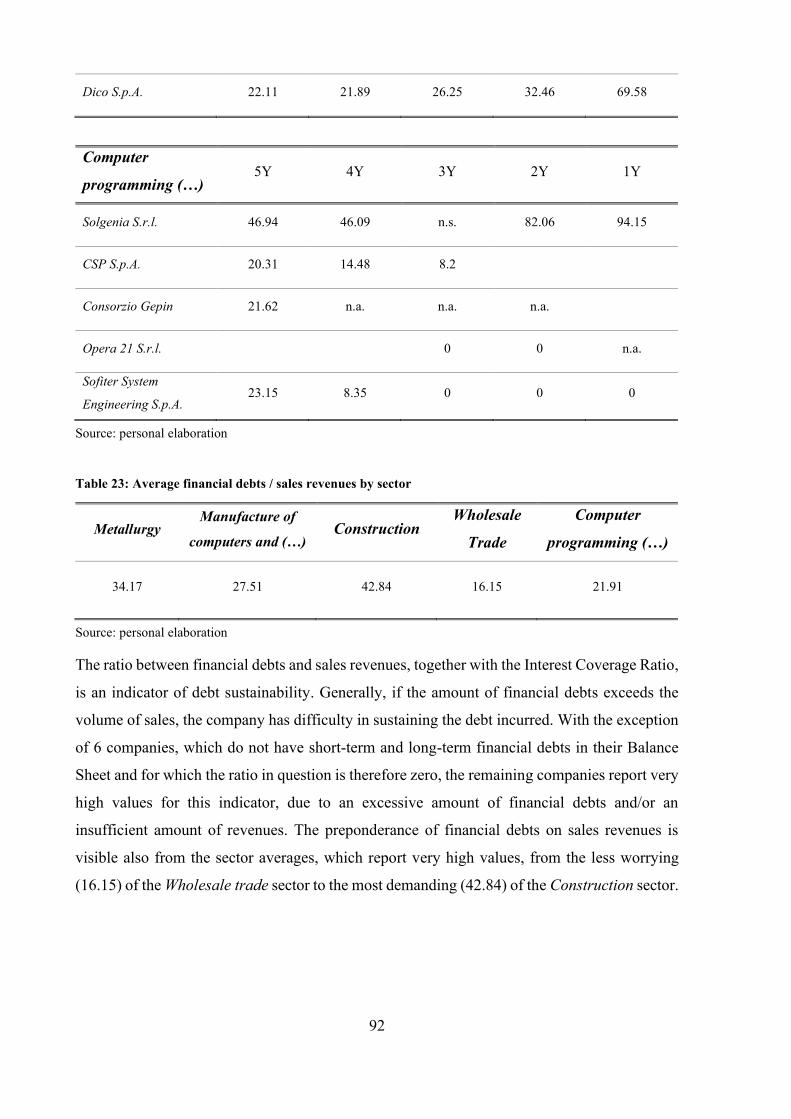
92
Dico S.p.A. 22.11 21.89 26.25 32.46 69.58
Computer
programming (…) 5Y 4Y 3Y 2Y 1Y
Solgenia S.r.l. 46.94 46.09 n.s. 82.06 94.15
CSP S.p.A. 20.31 14.48 8.2
Consorzio Gepin 21.62 n.a. n.a. n.a.
Opera 21 S.r.l. 0 0 n.a.
Sofiter System
Engineering S.p.A. 23.15 8.35 0 0 0
Source: personal elaboration
Table 23: Average financial debts / sales revenues by sector
Metallurgy Manufacture of
computers and (…) Construction
Wholesale
Trade
Computer
programming (…)
34.17 27.51 42.84 16.15 21.91
Source: personal elaboration
The ratio between financial debts and sales revenues, together with the Interest Coverage Ratio,
is an indicator of debt sustainability. Generally, if the amount of financial debts exceeds the
volume of sales, the company has difficulty in sustaining the debt incurred. With the exception
of 6 companies, which do not have short-term and long-term financial debts in their Balance
Sheet and for which the ratio in question is therefore zero, the remaining companies report very
high values for this indicator, due to an excessive amount of financial debts and/or an
insufficient amount of revenues. The preponderance of financial debts on sales revenues is
visible also from the sector averages, which report very high values, from the less worrying
(16.15) of the Wholesale trade sector to the most demanding (42.84) of the Construction sector.
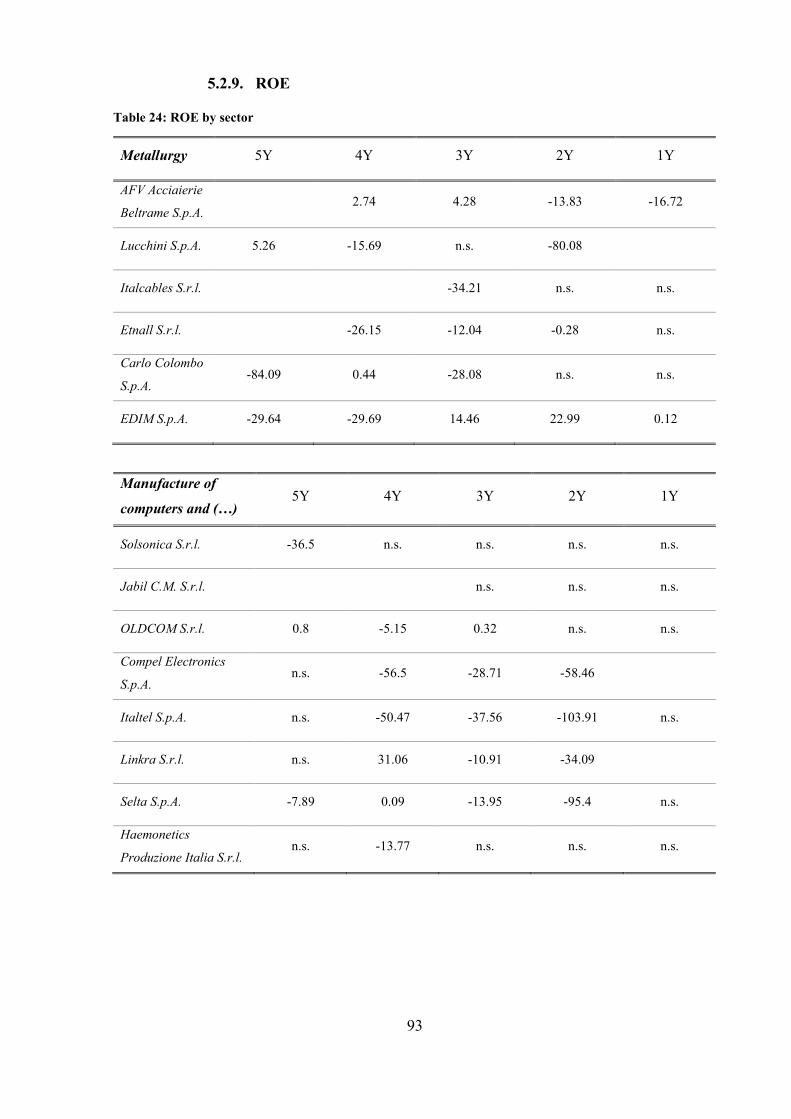
93
5.2.9. ROE
Table 24: ROE by sector
Metallurgy 5Y 4Y 3Y 2Y 1Y
AFV Acciaierie
Beltrame S.p.A. 2.74 4.28 -13.83 -16.72
Lucchini S.p.A. 5.26 -15.69 n.s. -80.08
Italcables S.r.l. -34.21 n.s. n.s.
Etnall S.r.l. -26.15 -12.04 -0.28 n.s.
Carlo Colombo
S.p.A. -84.09 0.44 -28.08 n.s. n.s.
EDIM S.p.A. -29.64 -29.69 14.46 22.99 0.12
Manufacture of
computers and (…) 5Y 4Y 3Y 2Y 1Y
Solsonica S.r.l. -36.5 n.s. n.s. n.s. n.s.
Jabil C.M. S.r.l. n.s. n.s. n.s.
OLDCOM S.r.l. 0.8 -5.15 0.32 n.s. n.s.
Compel Electronics
S.p.A. n.s. -56.5 -28.71 -58.46
Italtel S.p.A. n.s. -50.47 -37.56 -103.91 n.s.
Linkra S.r.l. n.s. 31.06 -10.91 -34.09
Selta S.p.A. -7.89 0.09 -13.95 -95.4 n.s.
Haemonetics
Produzione Italia S.r.l. n.s. -13.77 n.s. n.s. n.s.
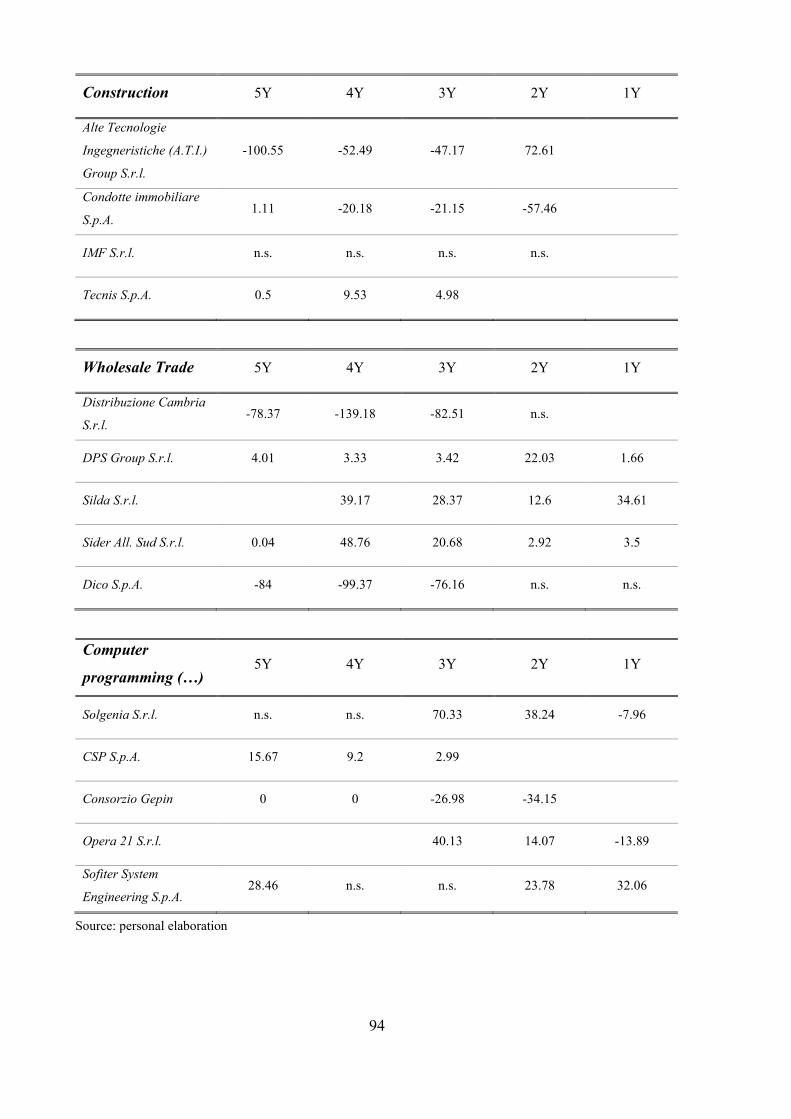
94
Construction 5Y 4Y 3Y 2Y 1Y
Alte Tecnologie
Ingegneristiche (A.T.I.)
Group S.r.l.
-100.55 -52.49 -47.17 72.61
Condotte immobiliare
S.p.A. 1.11 -20.18 -21.15 -57.46
IMF S.r.l. n.s. n.s. n.s. n.s.
Tecnis S.p.A. 0.5 9.53 4.98
Wholesale Trade 5Y 4Y 3Y 2Y 1Y
Distribuzione Cambria
S.r.l. -78.37 -139.18 -82.51 n.s.
DPS Group S.r.l. 4.01 3.33 3.42 22.03 1.66
Silda S.r.l. 39.17 28.37 12.6 34.61
Sider All. Sud S.r.l. 0.04 48.76 20.68 2.92 3.5
Dico S.p.A. -84 -99.37 -76.16 n.s. n.s.
Computer
programming (…) 5Y 4Y 3Y 2Y 1Y
Solgenia S.r.l. n.s. n.s. 70.33 38.24 -7.96
CSP S.p.A. 15.67 9.2 2.99
Consorzio Gepin 0 0 -26.98 -34.15
Opera 21 S.r.l. 40.13 14.07 -13.89
Sofiter System
Engineering S.p.A. 28.46 n.s. n.s. 23.78 32.06
Source: personal elaboration
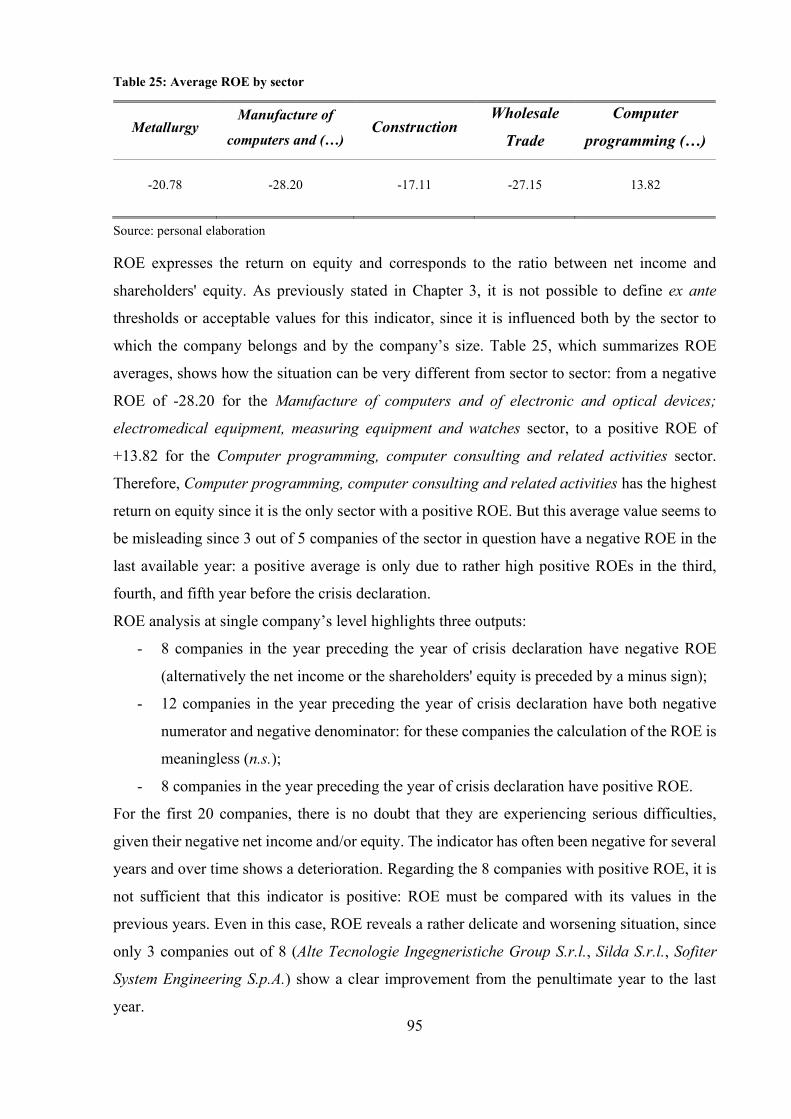
95
Table 25: Average ROE by sector
Metallurgy Manufacture of
computers and (…) Construction
Wholesale
Trade
Computer
programming (…)
-20.78 -28.20 -17.11 -27.15 13.82
Source: personal elaboration
ROE expresses the return on equity and corresponds to the ratio between net income and
shareholders' equity. As previously stated in Chapter 3, it is not possible to define ex ante
thresholds or acceptable values for this indicator, since it is influenced both by the sector to
which the company belongs and by the company’s size. Table 25, which summarizes ROE
averages, shows how the situation can be very different from sector to sector: from a negative
ROE of -28.20 for the Manufacture of computers and of electronic and optical devices;
electromedical equipment, measuring equipment and watches sector, to a positive ROE of
+13.82 for the Computer programming, computer consulting and related activities sector.
Therefore, Computer programming, computer consulting and related activities has the highest
return on equity since it is the only sector with a positive ROE. But this average value seems to
be misleading since 3 out of 5 companies of the sector in question have a negative ROE in the
last available year: a positive average is only due to rather high positive ROEs in the third,
fourth, and fifth year before the crisis declaration.
ROE analysis at single company’s level highlights three outputs:
- 8 companies in the year preceding the year of crisis declaration have negative ROE
(alternatively the net income or the shareholders' equity is preceded by a minus sign);
- 12 companies in the year preceding the year of crisis declaration have both negative
numerator and negative denominator: for these companies the calculation of the ROE is
meaningless (n.s.);
- 8 companies in the year preceding the year of crisis declaration have positive ROE.
For the first 20 companies, there is no doubt that they are experiencing serious difficulties,
given their negative net income and/or equity. The indicator has often been negative for several
years and over time shows a deterioration. Regarding the 8 companies with positive ROE, it is
not sufficient that this indicator is positive: ROE must be compared with its values in the
previous years. Even in this case, ROE reveals a rather delicate and worsening situation, since
only 3 companies out of 8 (Alte Tecnologie Ingegneristiche Group S.r.l., Silda S.r.l., Sofiter
System Engineering S.p.A.) show a clear improvement from the penultimate year to the last
year.
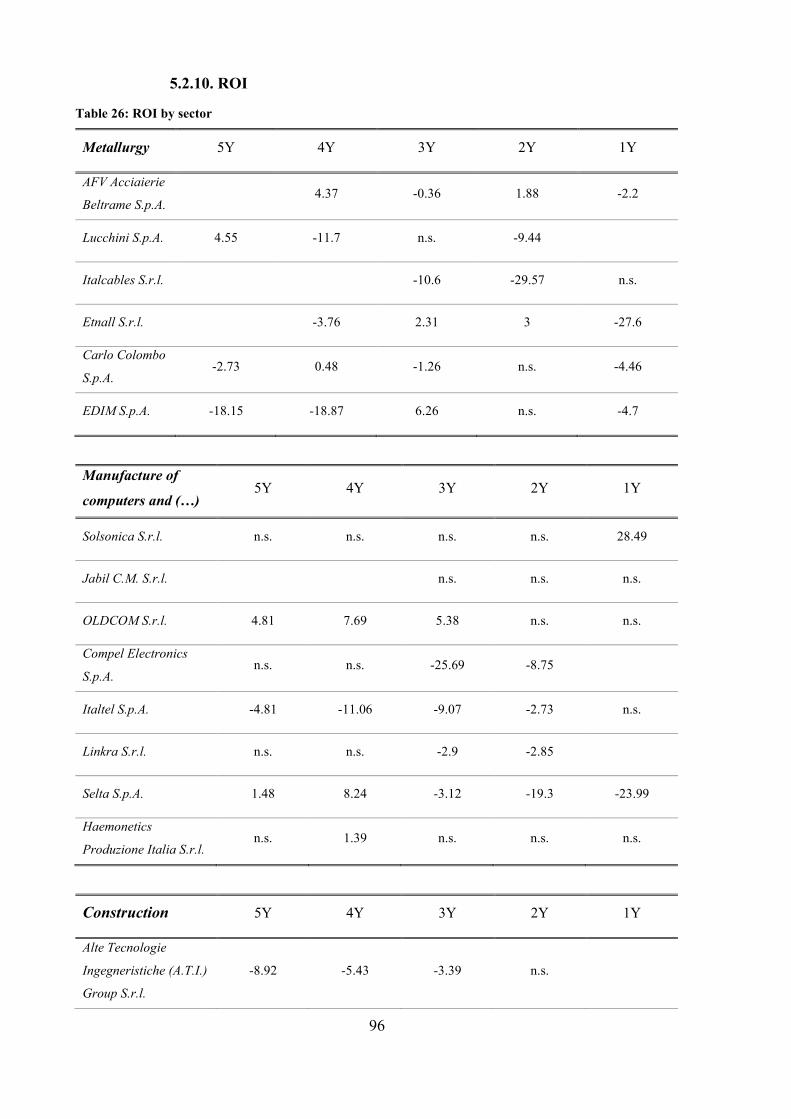
96
5.2.10. ROI
Table 26: ROI by sector
Metallurgy 5Y 4Y 3Y 2Y 1Y
AFV Acciaierie
Beltrame S.p.A. 4.37 -0.36 1.88 -2.2
Lucchini S.p.A. 4.55 -11.7 n.s. -9.44
Italcables S.r.l. -10.6 -29.57 n.s.
Etnall S.r.l. -3.76 2.31 3 -27.6
Carlo Colombo
S.p.A. -2.73 0.48 -1.26 n.s. -4.46
EDIM S.p.A. -18.15 -18.87 6.26 n.s. -4.7
Manufacture of
computers and (…) 5Y 4Y 3Y 2Y 1Y
Solsonica S.r.l. n.s. n.s. n.s. n.s. 28.49
Jabil C.M. S.r.l. n.s. n.s. n.s.
OLDCOM S.r.l. 4.81 7.69 5.38 n.s. n.s.
Compel Electronics
S.p.A. n.s. n.s. -25.69 -8.75
Italtel S.p.A. -4.81 -11.06 -9.07 -2.73 n.s.
Linkra S.r.l. n.s. n.s. -2.9 -2.85
Selta S.p.A. 1.48 8.24 -3.12 -19.3 -23.99
Haemonetics
Produzione Italia S.r.l. n.s. 1.39 n.s. n.s. n.s.
Construction 5Y 4Y 3Y 2Y 1Y
Alte Tecnologie
Ingegneristiche (A.T.I.)
Group S.r.l.
-8.92 -5.43 -3.39 n.s.
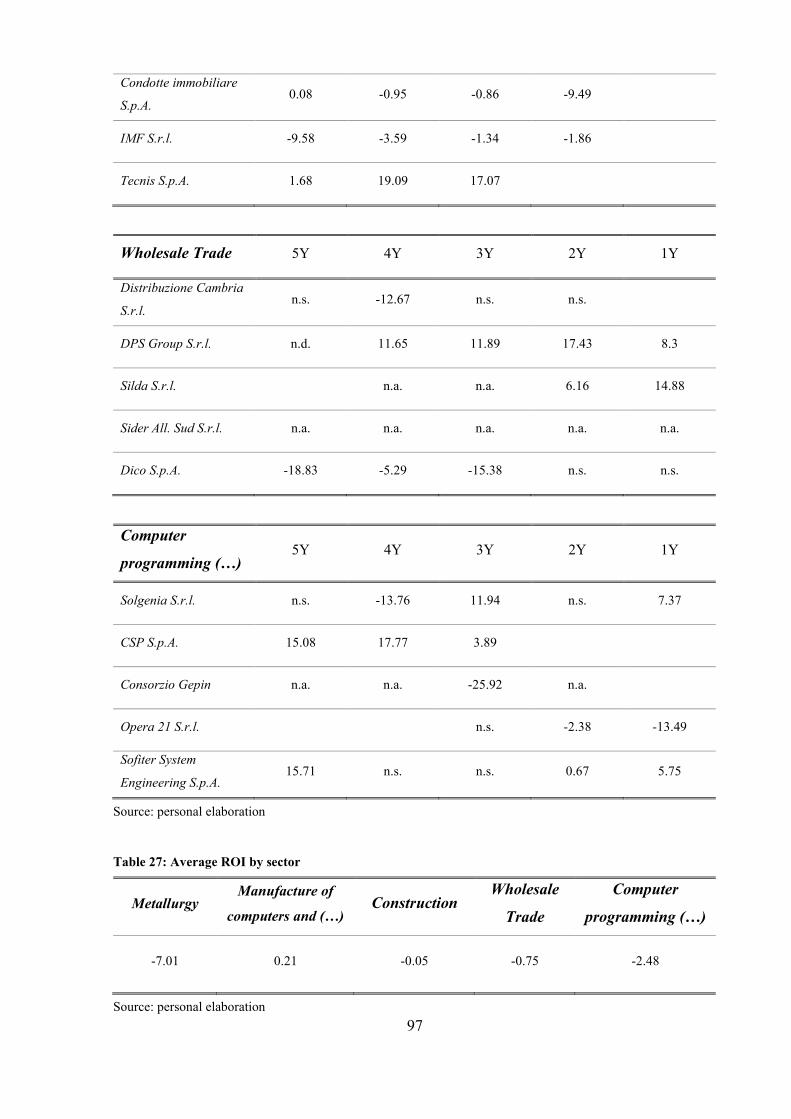
97
Condotte immobiliare
S.p.A. 0.08 -0.95 -0.86 -9.49
IMF S.r.l. -9.58 -3.59 -1.34 -1.86
Tecnis S.p.A. 1.68 19.09 17.07
Wholesale Trade 5Y 4Y 3Y 2Y 1Y
Distribuzione Cambria
S.r.l. n.s. -12.67 n.s. n.s.
DPS Group S.r.l. n.d. 11.65 11.89 17.43 8.3
Silda S.r.l. n.a. n.a. 6.16 14.88
Sider All. Sud S.r.l. n.a. n.a. n.a. n.a. n.a.
Dico S.p.A. -18.83 -5.29 -15.38 n.s. n.s.
Computer
programming (…) 5Y 4Y 3Y 2Y 1Y
Solgenia S.r.l. n.s. -13.76 11.94 n.s. 7.37
CSP S.p.A. 15.08 17.77 3.89
Consorzio Gepin n.a. n.a. -25.92 n.a.
Opera 21 S.r.l. n.s. -2.38 -13.49
Sofiter System
Engineering S.p.A. 15.71 n.s. n.s. 0.67 5.75
Source: personal elaboration
Table 27: Average ROI by sector
Metallurgy Manufacture of
computers and (…) Construction
Wholesale
Trade
Computer
programming (…)
-7.01 0.21 -0.05 -0.75 -2.48
Source: personal elaboration
98
For ROI, the most widely used indicator of profitability in the Financial Statements Analysis,
the same considerations apply as for ROE: since it is not possible to define parameters or
threshold values ex ante, the comparison is made from year to year. ROI analysis for the sample
of Italian companies shows a "structure" similar to that of ROE:
- for 11 companies the last available ROI before the crisis declaration is negative;
- for 8 companies it is not significant (n.s.);
- for 2 companies it is not available due to lack of data (n.a.);
- for 7 companies the last available ROI is positive, but only for 2 there has been an
improvement from the penultimate year to the last available year.
Looking at ROI averages, very different values for this indicator emerge from sector to sector.
Anyway, these averages are always negative (the lowest return on investments is recorded for
the Metallurgy sector, equal to -7.01), if not close to zero (+0.21 for the Manufacture of
computers and of electronic and optical devices; electromedical equipment, measuring
equipment and watches sector), making it difficult to say which sector is better than the other:
rather, it would be more appropriate to say which sector is "less worse" than the other.
5.2.11. Considerations about the Financial Statements Analysis
The application of the Financial Statements Analysis to the final test sample has confirmed the
difficult situation for some companies and has allowed it to emerge for others. Considering
values obtained, it is possible to state that the analysis of the Financial Statements has produced
the desired results, in line with the effective condition that companies of the sample are facing.
Of 10 indicators considered, only 2, namely the Net Financial Position and the comparison
between Days Receivables Outstanding and Days Payables Outstanding, do not report the
seriousness of the situation, with values and trends over time that seem to dispel the concern of
an imminent crisis. In these cases, it would be appropriate to investigate the underlying
motivations of these trends or the measures implemented to obtain the improvements that
indicators show; however, an analysis of the "history" and the policies adopted by the individual
company goes beyond the purpose of the present work. Another indicator (the Current Ratio)
initially has presented a heartening condition for a consistent part of the sample, but it is the
literature itself that tells us to place this indicator alongside the Acid-test Ratio before
expressing a judgement on the corporate liquidity. The latter has allowed to better investigate
those situations that did not arouse any suspicion on the part of the Current Ratio, confirming
the validity of the two indices whenever they are placed side by side.
99
The remaining indicators, with the exception of those few companies for which there has been
an apparent improvement over time, show a worrying declining trend from both an economic
and financial point of view, which leaves no doubt about the highly probable declaration of
crisis in the near future. This confirms the validity of the Financial Statements Analysis as a
warning tool endowed with good predictive effectiveness.
Although the analysis conducted has confirmed the signaling ability of the Financial Statements
Analysis, the second level crisis forecasting tool, as any other instrument, is not infallible.
Numerous criticisms have been levelled at it over time, first the reliability of the data. Precisely
this aspect could be the cause of the poor validity of the two indicators Net Financial Position
and comparison between DROs and DPOs: there is a natural tendency on the part of any
company to "inflate" the data in the Financial Statements when the situation becomes critical
or the first signs of a crisis are observed. No company would ever want to declare the state of
crisis to the market, so data are falsified to postpone the declaration of the state of crisis as much
as possible. The distortion of accounting prospectuses to make a situation appear different and
better than the real one makes consequently some indicators inflated and representative of an
unreliable condition.
A second limit of the Financial Statements Analysis is related to the subjectivity in the choice
of the type and number of indicators to use. This choice is purely subjective and may lead to
different results depending on the subject conducting the analysis. The list of indicators used in
the present work constitutes a "basic pool" from which to draw and start, but which can and
must be supplemented by further indicators based on the business reality, in order to highlight
other areas of intervention and further investigate those previously discovered.
Finally, the Financial Statements Analysis has often been criticized for its “late” predictive
ability, which highlights the signs of a crisis when it has already been going on for a long time
and causes are in their degenerative phase. The empirical evidence in the present work does not
seem to support this limit, given the general degenerative trend of the ratios observed from the
most distant year to the closest one. However, for some indicators, a clear and substantial
deterioration in the values is seen only from the penultimate year to the last year available, when
the room for manoeuvre is quite narrow.

100
101
6. Conclusions
The present work has demonstrated the good signalling capacity of the Z-score Model and the
Financial Statement Analysis when applied to the Italian business environment. Both models
are not infallible as pointed out several times, but overall they are representative of the severe
situation in which companies find themselves: the Z-score Model correctly classifies 23
companies out of 25, while, of the 10 indicators used in the Financial Statements Analysis, 8
present values and trends typical of companies in difficulty.
The fact that results obtained confirm the validity of the Z-score Model and the Financial
Statements Analysis as warning tools, makes possible to facilitate and to encourage the control
and the monitoring of the company's state of health, thanks to the low costs and the ease of use.
Tools here considered are not so expensive, both in terms of money and time. The starting point
for their application are the accounting prospectuses, which are easily available (at least in Italy)
for listed and unlisted companies; besides the Income Statement, the Balance Sheet, and the
Cash Flow Statement (in the case of indicators relating to the company's ability to generate
cash), no additional documents or reports internally prepared are necessary. Also skills required
for the analysis are not particularly sophisticated: the comprehension of the accounting
documents and the calculation of the indicators can be carried out by people endowed with a
minimal business culture. Moreover, the fact that these tools are available to both internal and
external parties allows monitoring the company’s state of health and highlighting any anomalies
from two different points of view, characterized by different interests, different objectives, and
different incentives to bring out as soon as possible the signals of the crisis.
Obviously, the two models do not work in 100% of cases, but, on the other hand, an infallible
tool has not yet been invented, not even with the latest and most refined artificial intelligence.
On the contrary, the Z-score Model and the Financial Statements Analysis complement one
another, as the second one (second level crisis forecasting tool) finalizes the work of the first
one (first level crisis forecasting tool), and they constitute an excellent compromise between
the quality of the analysis and the cost to conduct it, especially for those companies for which
state-of-the-art tools are prohibitive.
This empirical evidence does not deny further developments and rethinking of the instruments
in question: business insolvency forecasting models must always evolve to adapt to the
changing economic contexts, especially after this historical period during which the Covid-19
pandemic has disrupted the global economic scenario.
Unfortunately, especially in small and medium-sized Italian enterprises, still today there is a
relatively modest number of companies with a systematic system for monitoring the onset of

102
decay and imbalances. Given the recurrence of the crisis phenomena, this monitoring and
control system should be encouraged: as the Economist L. Guatri writes in Turnaround:
declino, crisi e ritorno al valore (1995) “the disease [cannot] be avoided by not measuring the
fever”, therefore, where the sophisticated artificial intelligence is not affordable, the Z-score
Model and the Financial Statements Analysis constitute valid evaluation tools that should be
used on a daily basis.
103
7. Bibliography
1. Altman, E. (1993). Corporate financial distress and bankruptcy: a complete guide to
predicting & avoiding distress and profiting from bankruptcy. New York: John Wiley
& Sons.
2. Altman, E. I. (1968). Financial ratios, discriminant analysis and the prediction of
corporate bankruptcy. The journal of finance, 23(4), 589-609.
3. Altman, E. I., Danovi, A., & Falini, A. (2013). Z-score models' application to Italian
companies subject to extraordinary administration. Journal of Applied Finance
(Formerly Financial Practice and Education), 23(1).
4. Barbera, A. (2019). Aziende in crisi: le 149 vertenze sul tavolo del Ministero. LaStampa
[online]. Available on https://www.lastampa.it/economia/2019/12/21/news/aziende-in-
crisi-le-149-vertenze-sul-tavolo-del-ministero-1.38241422 [access date 06/10/2020].
5. Bazzerla, M. (2018). Crisi aziendali e controllo di gestione: l’importanza degli strumenti
di controllo nella prevenzione della crisi. Controllo di gestione, 15(4), 23-31. Milano:
IPSOA.
6. Bibeault, D. B. (1982). Corporate Turnaround: how managers turn losers into winners.
New York: Mc Graw-Hill.
7. Bibeault, D. B. (1999). Corporate Turnaround: how managers turn losers into winners.
Washington: Beard Books.
8. Biella, M., & Mosca, A. (2019). Crisi di impresa e di insolvenza. Italia Oggi Sette
[online]. Available on www.italiaoggi.it [access date 01/09/2020].
9. Booth, S. A. (1993). Crisis Management Strategy. London and New York: Routledge.
10. Bottani, P., Cipriani, L., & Serao, F. (2004). Analisi del rischio di insolvenza di una
PMI tramite l’utilizzo del Modello dello Z-Score. Amministrazione e Finanza, 1.
11. Bottani, P., Cipriani, L., & Serao, F. (2004). Il modello di analisi Z-Score applicato alle
PMI. Amministrazione e finanza, 19(1), 50-53.
12. Brodi, E. (2018). Tempestiva emersione e gestione della crisi d’impresa. Riflessioni sul
disegno di un efficiente «sistema di allerta e composizione». Bank of Italy Occasional
Paper, (440).
104
13. Buongiorno, M. (2019). Gli indici del CNDCEC per la verifica della crisi d’impresa.
Euroconference news [online]. Available on www.ecnews.it [access date 10/09/2020].
14. Bureau van Dijk - A Moody's Analytics Company (2013). Database AIDA - Analisi
Informatizzata delle Aziende Italiane.
15. Buttignon, F. (2008). Il governo delle crisi d'impresa in Italia alla luce del nuovo quadro
normativo: una riflessione introduttiva. Rivista dei dottori commercialisti, 59(2), 243-
268.
16. Cerved Group S.p.A. (2018). Riforma legge fallimentare: quali soglie per il regime di
allerta? [online]. Available on https://know.cerved.com [access date 10/09/2020].
17. Ciabattoni, M. (2017). Study notes from Corso di metodologie e determinazioni
quantitative d’azienda. Padova: Università degli Studi di Padova, Dipartimento di
Scienze Economiche ed Aziendali.
18. CNDCEC (2019). Crisi d’impresa: gli indici d’allerta [online]. Available on
www.commercialisti.it [access date 10/09/2020].
19. Comitato Pari Opportunità ODCEC Torino (S.d.). La gestione dell’impresa in crisi.
L’analisi di Dottori Commercialisti, Managers e Imprenditori.
20. Commissione di Studio “Procedure concorsuali e giudiziarie” (2019). Gli indicatori di
allerta: osservazioni e criticità.
21. Coronella, S. (2009). I modelli di previsione delle crisi aziendali: alcune
riflessioni. Rivista italiana di Ragioneria e di Economia aziendale, 109(9-10), 503-516.
22. Danovi, A., & D’Amico, A. (2020). La previsione dell’insolvenza ex art. 13 co. 3 C.c.i.:
efficacia del test di classificazione binario e dell’analisi discriminante lineare. Impresa
Progetto - Electronic journal of management, n°1/2020.
23. Danovi, A., & Quagli, A. (2015). Gestire la crisi d'impresa: processi e strumenti di
risanamento. Milano: IPSOA.
24. Di Nardo, T., et al. (2018). Osservatorio sui bilanci delle srl. Trend 2015-2017.
Fondazione Nazionale Commercialisti.
25. Dlgs. 12 gennaio 2019, n. 14.
26. Fazzini, M. (2011). Analisi di bilancio. Milano: IPSOA.

105
27. Fotina, C. (2019). Crisi aziendali, ecco le imprese che il Conte bis dovrà salvare.
IlSole24Ore [online]. Available on https://www.ilsole24ore.com/art/crisi-aziendali-il-
nuovo-governo-universo-imprese-salvare-AC5RrTg?refresh_ce=1 [access date
06/10/2020].
28. Giacosa, E., & Mazzoleni, A. (2012). Il progetto di risanamento dell’impresa in crisi.
Torino: Giappichelli.
29. Giacosa, E., & Mazzoleni, A. (2016). La previsione della crisi d’impresa: strumenti e
segnali di allerta. Milano: Giuffrè.
30. Giacosa, E., & Mazzoleni, A. (2018). I modelli di previsione dell'insolvenza aziendale.
Efficacia predittiva, limiti e prospettive di utilizzo. Torino: Giappichelli.
31. Guatri, L. (1986). Crisi e risanamento delle imprese. Milano: Giuffrè.
32. Guatri, L. (1995). Turnaround: declino, crisi e ritorno al valore. Milano: Egea.
33. Lizza, P. (1998). La cultura della crisi. Rivista dei dottori commercialisti, (5), 835-859.
34. Mazzei, B. L. (2020). Allerta sulla crisi d’impresa: a rischio otto società su 100.
IlSole24Ore [online]. Available on https://www.ilsole24ore.com/art/allerta-crisi-d-
impresa-rischio-otto-societa-100-ACy32LGB [access date 06/10/2020].
35. Mazzoleni, A., & Giacosa, E. (2011). Il progetto di risanamento dell’impresa in crisi:
la recente esperienza italiana. Paper n°. 116. Brescia: Università degli studi di Brescia.
36. Ministero dello Sviluppo Economico – Imprese in difficoltà [online]. Available on
https://www.mise.gov.it/index.php/it/impresa/imprese-in-difficolta [access date
06/10/2020].
37. Napodano, G., et al. (2010). La crisi d’impresa. L’attestazione di ragionevolezza dei
piani di ristrutturazione ex art. 67, 3° comma, lettera d) L.F.. Quaderno n°. 27. Osnago:
3LB S.r.l.. Milano: Scuola di Alta Formazione dei Dottori Commercialisti e degli
Esperti Contabili.
38. Pasqui, M. (2020). Crisi d’impresa: come si applicano gli indici di allerta del CNDCEC.
IPSOA quotidiano [online]. Available on www.ipsoa.it [access date 10/09/2020].
39. Quagli, A., & Davoni, A. (2008). Gestione della crisi aziendale e dei processi di
risanamento. Prevenzione e diagnosi, terapie, casi aziendali. Milano: IPSOA.
106
40. Quagli, A., et al. (2012). Il piano industriale e strumenti di risanamento. Guida
metodologica e operativa. Milano: IPSOA.
41. Raccomandazione della Commissione Europea del 6 maggio 2003 relativa alla
definizione delle microimprese, piccole e medie imprese (2003). L., n. 124(36), 20.
42. Sacco, B. (2019). Il nuovo Codice della crisi d'impresa e dell'insolvenza e gli alert di
bilancio: un'opportunità per le PMI?. Quaderni di ricerca sull'artigianato, Rivista di
Economia, Cultura e Ricerca Sociale, 7(2), 181-202.
43. Sacco, B. (2019). Il nuovo Codice della crisi d'impresa e dell'insolvenza e gli alert di
bilancio: un'opportunità per le PMI?. Quaderni di ricerca sull'artigianato, 7(2), 181-
202.
44. Sanguigni, V. (2018). Conferenza sull’Analisi e descrizione delle cause della crisi e
degli squilibri aziendali: condizioni per il loro superamento. Roma, 26/03/2018. Roma:
Scuola di Alta Formazione dell’Ordine dei Dottori Commercialisti e degli Esperti
Contabili.
45. Santoni, V. (2014). La Previsione dell’insolvenza aziendale: confronto della
performance dei modelli Zscore, Logit e Random Forest su un campione di aziende
manifatturiere italiane. Tesi di dottorato in Diritto ed economia dei sistemi produttivi.
Università degli studi di Sassari.
46. Sirleo, G. (2009). La crisi d’impresa e i piani di ristrutturazione. Profili economico-
aziendali. 1° ed. Roma: ARACNE editrice S.r.l.
47. Varetto, F. (1999). Metodi di previsione delle insolvenze: un’analisi comparata. Il
Rischio Creditizio. Misura e Controllo, 178-301.
48. Vicari, P., Ferillo, A., & Valeri, A. (2009). Classificazione delle attività economiche-
Ateco 2007. Roma: Istituto Nazionale di Statistica (ISTAT).
49. Zotti, A. (2020). Study notes from Mergers & Acquisitions and Corporate
Restructuring. Business Administration Course. Padova: Università degli Studi di
Padova, Dipartimento di Scienze Economiche ed Aziendali.